Gateshead & Newcastle upon Tyne
225
Opinion Research Services | The Strand • Swansea • SA1 1AF | 01792 535300 | www.ors.org.uk | [email protected] Gateshead & Newcastle upon Tyne Strategic Housing Market Assessment 2017 Report of Findings August 2017
-
Upload
khangminh22 -
Category
Documents
-
view
0 -
download
0
Transcript of Gateshead & Newcastle upon Tyne

Opinion Research Services | The Strand • Swansea • SA1 1AF | 01792 535300 | www.ors.org.uk | [email protected]
Gateshead & Newcastle upon Tyne Strategic Housing Market Assessment 2017
Report of Findings August 2017

Opinion Research Services | Gateshead & Newcastle upon Tyne Strategic Housing Market Assessment 2017 August 2017
2
Opinion Research Services | The Strand, Swansea SA1 1AF
Jonathan Lee | Nigel Moore | Karen Lee | Trevor Baker | Scott Lawrence
enquiries: 01792 535300 · [email protected] · www.ors.org.uk
© Copyright August 2017

Opinion Research Services | Gateshead & Newcastle upon Tyne Strategic Housing Market Assessment 2017 August 2017
3
Contents Executive Summary ............................................................................................ 7
Summary of Key Findings and Conclusions 7
Introduction ................................................................................................................................................. 7
Calculating Objectively Assessed Needs ..................................................................................................... 8
Household Projections ................................................................................................................................ 9
Affordable Housing Need .......................................................................................................................... 11
Need for Older Person Housing ................................................................................................................. 12
Market Signals ........................................................................................................................................... 14
Conclusions ................................................................................................................................................ 15
Nationally Described Space Standards ...................................................................................................... 17
1. Introducing the Study .................................................................................. 19
Background to the project and wider policy context 19
Government Policy .................................................................................................................................... 19
Duty to Co-operate .................................................................................................................................... 21
Gateshead and Newcastle upon Tyne Joint Core Strategy 2010-2030 ............................................... 21
Housing White Paper .......................................................................................................................... 22
2. Defining the Housing Market Area .............................................................. 23
An evidence base to identify functional housing markets 23
Functional Housing Market Areas ............................................................................................................. 23
Planning Practice Guidance ................................................................................................................. 23
Geography of Housing Market Areas (NHPAU/CURDS) ...................................................................... 24
ONS Travel to Work Areas ................................................................................................................... 25
House Prices ........................................................................................................................................ 26
Valuation Office Agency Broad Rental Market Areas ......................................................................... 27
Administrative Boundaries and Housing Market Areas ............................................................................ 28
Key Statistics for Gateshead and Newcastle upon Tyne HMA .................................................................. 31
Migration within the UK to and from Gateshead and Newcastle upon Tyne ..................................... 31
Travel to Work Patterns ...................................................................................................................... 33
Containment within the Combined Area ............................................................................................ 34
Conclusions ................................................................................................................................................ 34
3. Demographic Projections ............................................................................ 38
The starting point for Objectively Assessed Need 38
Process for Establishing Objectively Assessed Need ................................................................................. 38
Gateshead and Newcastle upon Tyne Joint Core Strategy 2010-30 ................................................... 39
Official Population and Household Projections .................................................................................. 39
Official Population Projections ............................................................................................................ 40

Opinion Research Services | Gateshead & Newcastle upon Tyne Strategic Housing Market Assessment 2017 August 2017
4
Population and Household Projections based on Local Circumstances ............................................. 42
Reviewing the Official Population Estimates - Gateshead ........................................................................ 44
Components of Population Change .................................................................................................... 45
Estimating Population Change with Other Data ................................................................................. 48
Reviewing the Official Population Estimates – Newcastle upon Tyne ...................................................... 49
Components of Population Change .................................................................................................... 50
Estimating Population Change with Other Data ................................................................................. 53
Student Housing and the OAN .................................................................................................................. 54
Summary of Population Projection Adjustments ...................................................................................... 56
Establishing Population Projections .................................................................................................... 56
Economic Activity Projections ................................................................................................................... 59
Labour Market Participation Projections ............................................................................................ 61
Older People ........................................................................................................................................ 61
Female Participation ........................................................................................................................... 63
Young People ....................................................................................................................................... 64
Projecting Future Economic Activity for Gateshead ........................................................................... 65
Projecting Future Economic Activity for Newcastle upon Tyne .......................................................... 66
Household Population and Institutional Population ........................................................................... 67
Household Representative Rates ........................................................................................................ 69
Household Projections ........................................................................................................................ 71
Conclusions ................................................................................................................................................ 72
4. Affordable Housing Need ............................................................................ 73
Identifying households who cannot afford market housing 73
Introduction ............................................................................................................................................... 73
Planning Practice Guidance for Affordable Housing Needs ...................................................................... 74
Assessing Affordable Housing Needs ........................................................................................................ 75
Modelling Affordable Needs ..................................................................................................................... 76
Backlog of Affordable Housing Needs for Gateshead and Newcastle upon Tyne .................................... 78
Past Trends and Current Estimates of the Need for Affordable Housing ................................................. 79
Local Authority Data: Homeless Households and Temporary Accommodation ................................. 79
Census Data: Concealed Households and Overcrowding ................................................................... 80
English Housing Survey Data ............................................................................................................... 84
Housing Register Data ......................................................................................................................... 88
Households Unable to Afford their Housing Costs ............................................................................. 91
Establishing Affordable Housing Need ...................................................................................................... 93
Current Unmet Need for Affordable Housing ..................................................................................... 94
Projected Future Affordable Housing Need ........................................................................................ 98
Assessing the Overall Need for Affordable Housing ......................................................................... 104
Conclusions .............................................................................................................................................. 107
5. Objectively Assessed Need ........................................................................ 109
Analysing the evidence to establish overall housing need 109
National Context for England .................................................................................................................. 110
Opinion Research Services | Gateshead & Newcastle upon Tyne Strategic Housing Market Assessment 2017 August 2017
5
Household Growth ............................................................................................................................ 110
International Migration ..................................................................................................................... 110
Market Signals ................................................................................................................................... 111
Converting to Dwellings .................................................................................................................... 111
Establishing Objectively Assessed Need for Gateshead & Newcastle upon Tyne .................................. 112
CLG Household Projections ............................................................................................................... 112
Adjustments for Local Demography and Long-term Migration ........................................................ 113
Affordable Housing Need .................................................................................................................. 113
Need for Older Person Housing ............................................................................................................... 114
Employment Trends ................................................................................................................................ 114
Market Signals ................................................................................................................................... 117
House Prices ...................................................................................................................................... 118
Affordability ...................................................................................................................................... 121
Private Rent ....................................................................................................................................... 123
Housing Development ....................................................................................................................... 125
Overcrowding .................................................................................................................................... 127
Summary of Market Signals .............................................................................................................. 128
Housing Backlog ...................................................................................................................................... 130
Conclusions .............................................................................................................................................. 130
6. Housing needs of different groups ............................................................ 133
Considering the need for all types of housing 133
Projected Population Age Profile ............................................................................................................ 134
Household Projections ............................................................................................................................ 136
Housing Mix: Size and Tenure ................................................................................................................. 139
The Private Rented Sector ....................................................................................................................... 148
Black and Minority Ethnic Population ..................................................................................................... 154
Service Families ....................................................................................................................................... 157
People Wishing to Build their Own Homes ............................................................................................. 158
Housing for Older People ........................................................................................................................ 160
Households with Specific Needs ............................................................................................................. 165
Assessing the level of need for accessible and wheelchair housing ....................................................... 165
Current Planning Policy Context ....................................................................................................... 168
Population and health demographics ............................................................................................... 169
Wheelchair accessible homes ........................................................................................................... 176
Meeting the need for M4(2) accessible and M4(3) wheelchair user housing ........................................ 178
Older people – local context ................................................................................................................... 184
Gateshead ......................................................................................................................................... 184
Newcastle upon Tyne ........................................................................................................................ 186
Cost benefits of providing accessible and adaptable housing ................................................................ 188
7. Space Standards ........................................................................................ 192
Compliance with the 2015 Nationally Described Space Standards (NDSS) for Gross Internal Area
(GIA) 192
Opinion Research Services | Gateshead & Newcastle upon Tyne Strategic Housing Market Assessment 2017 August 2017
6
Background .............................................................................................................................................. 192
Compliance with the 2015 NDSS for GIA 192
Background: Summary ............................................................................................................................ 193
Gateshead ............................................................................................................................................... 194
Newcastle ................................................................................................................................................ 194
8. Housing Requirements .............................................................................. 205
Considering the policy response to identified housing need 205
Affordable Housing Need ........................................................................................................................ 206
Older People in Residential Institutions (Use Class C2) .......................................................................... 209
Student Housing ...................................................................................................................................... 210
Gypsies and Travellers ............................................................................................................................. 212
Appendix 1: Stakeholder Engagement with the BME Community ................. 214
Stakeholder Engagement with the BME Community .............................................................................. 214
Stakeholder Fieldwork Consultation in Gateshead and Newcastle ........................................................ 215
Table of Figures .............................................................................................. 220

Opinion Research Services | Gateshead & Newcastle upon Tyne Strategic Housing Market Assessment 2017 August 2017
7
Executive Summary Summary of Key Findings and Conclusions
Introduction
1. Opinion Research Services (ORS) was commissioned by Gateshead Council and Newcastle upon Tyne
City Council to undertake a Strategic Housing Market Assessment to establish the Objectively
Assessed Need for housing and review housing and planning policies ahead of their new Local Plans.
2. The National Planning Policy Framework (NPPF)1 requires Local Planning Authorities to “ensure that
their Local Plan meets the full, objectively assessed needs for market and affordable housing in the
housing market area” and “identify the scale and mix of housing and the range of tenures that the
local population is likely to need over the plan period which meets household and population
projections, taking account of migration and demographic change” (paragraphs 47 and 159).
3. The Gateshead and Newcastle upon Tyne Joint Core Strategy was adopted in March 2015 and this
SHMA represents a review and update of the evidence base which underwrote this document.
Figure 1: Gateshead and Newcastle upon Tyne Joint Core Strategy
Gateshead and Newcastle upon Tyne Joint Core Strategy 2010-30
Adopted 2015 following examination in 2014
Sets a joint target for 30,000 homes and 22,000 across the 2 authorities
Viability in both authorities is quite low so the affordable housing target was set at 15%
North Tyneside Local Plan has been examined separately and sets a target of 790 dwellings per annum.
4. The Joint Core Strategy includes a provision for 30,000 more homes, 22,000 more jobs and also a
need for 15% of all new homes to be affordable housing on qualifying sites.
5. However, these figures were not evenly distributed across the 20 year period. Figure 2 shows the
estimated distribution of the housing target across the 15 year period starting in 2015. This shows
an annual need for Gateshead over the period 2015-30 of 535 dwellings per annum and 1,040
dwellings per annum for Newcastle upon Tyne for the same period.
1 https://www.gov.uk/government/publications/national-planning-policy-framework--2

Opinion Research Services | Gateshead & Newcastle upon Tyne Strategic Housing Market Assessment 2017 August 2017
8
Figure 2: Gatesheand and Newcastle upon Tyne Existing Housing Targets (Source: Gatershead and Newcastle upon Tyne Joint
Core Strategy)
2015-2020 2020-2025 2025-2030 Total 2015-30
Gateshead 2,420 4,020 1,580 8,020
Newcastle upon Tyne 4,800 5,400 5,400 15,600
Total 7,220 9,420 6,980 23,620
6. In March 2014, the government produced new guidance on conducting housing needs assessments
in the form of ‘Guidance for Housing and Economic Development Needs Assessments’. Paragraphs
2-21 of this new guidance cover overall housing needs and paragraphs 22-29 cover affordable
housing needs. The new guidance includes a number of significant changes since the 2007 SHMA
Practice Guidance which underwrote much of the work leading to the Joint Core Strategy.
7. Alongside past changes to housing and planning policy, the Housing White Paper, “Fixing our broken
housing market’ was published in February 2017. One change flagged in the White Paper is a
change in definition for affordable housing to include Starter Homes at 20% discounts of market
prices. The inclusion of Starter Homes in a wider definition of affordable housing will require a
fundamental revision of who is considered to be in affordable housing need because the current
definition is based upon who can afford market housing, not owner occupied housing. Therefore, if
the Government proceed to include Starter Homes in the definition of affordable housing products,
they will also need to count many more households as being in affordable housing need than is
currently the case because all non-owning households who wish to purchase Starter Homes will
need to be included. Therefore, the affordable housing needs assessed in this study may require a
revision if and when the government applies this new definition.
Calculating Objectively Assessed Needs
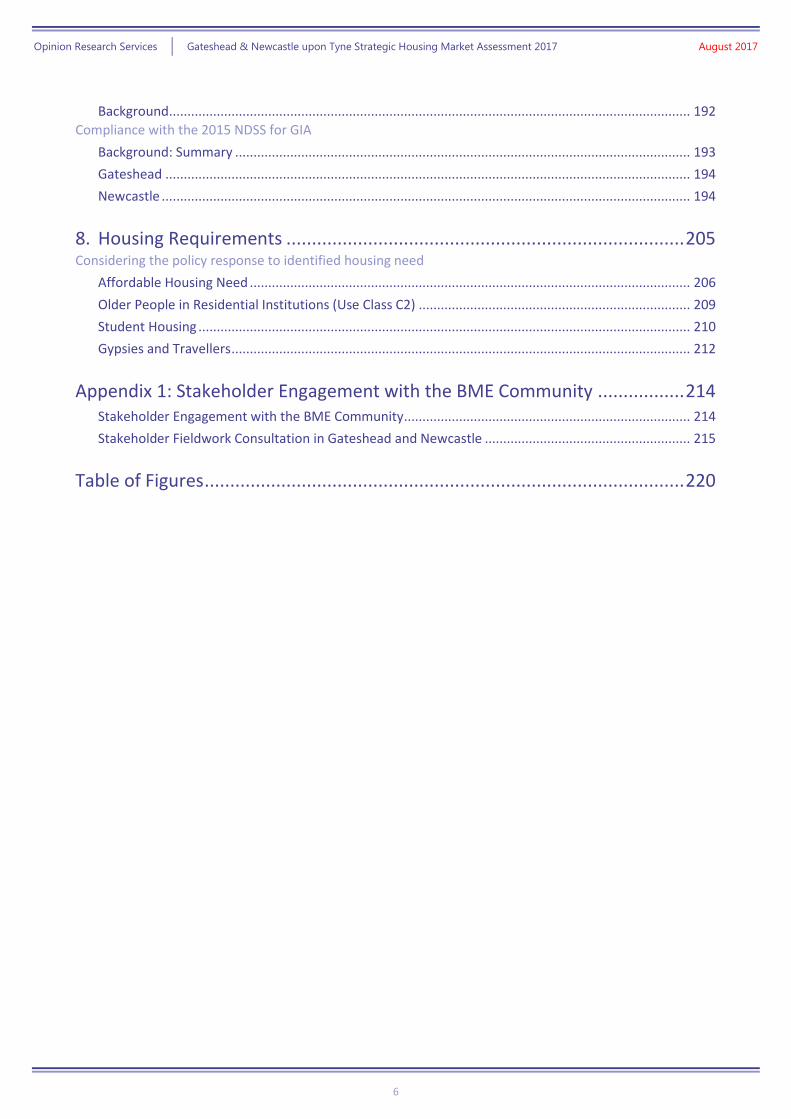
8. Figure 3 sets out the process for establishing Objectively Assessed Need (OAN). Planning Policy
Guidance (PPG)2 identifies that “household projections published by the Department for
Communities and Local Government should provide the starting point estimate of overall housing
need” (ID 2a-015) which should be adjusted to take account of local circumstances. External market
and macro-economic constraints are then applied (‘Market Signals’) in order to embed the need in
the real world. It is important to recognise that the OAN does not take account of any possible
constraints to future housing supply. Such factors will be subsequently considered by the Councils
before establishing the final Housing Requirement.
2 http://planningguidance.planningportal.gov.uk/blog/guidance/housing-and-economic-development-needs-assessments/
Opinion Research Services | Gateshead & Newcastle upon Tyne Strategic Housing Market Assessment 2017 August 2017
9
Figure 3: Process for establishing a Housing Number for the HMA (Source: ORS based on NPPF and PPG)
Household Projections
9. PPG identifies that the starting point for estimating OAN is the CLG household projections, and the
latest data is the 2014-based projection. For the 15-year period 2015-30, these projections suggest
an overall growth of 6,406 households, equivalent to an average of 427 households per year for
Gateshead and 15,047 households, equivalent to an average of 1,003 household per year for
Newcastle upon Tyne.
Opinion Research Services | Gateshead & Newcastle upon Tyne Strategic Housing Market Assessment 2017 August 2017
10
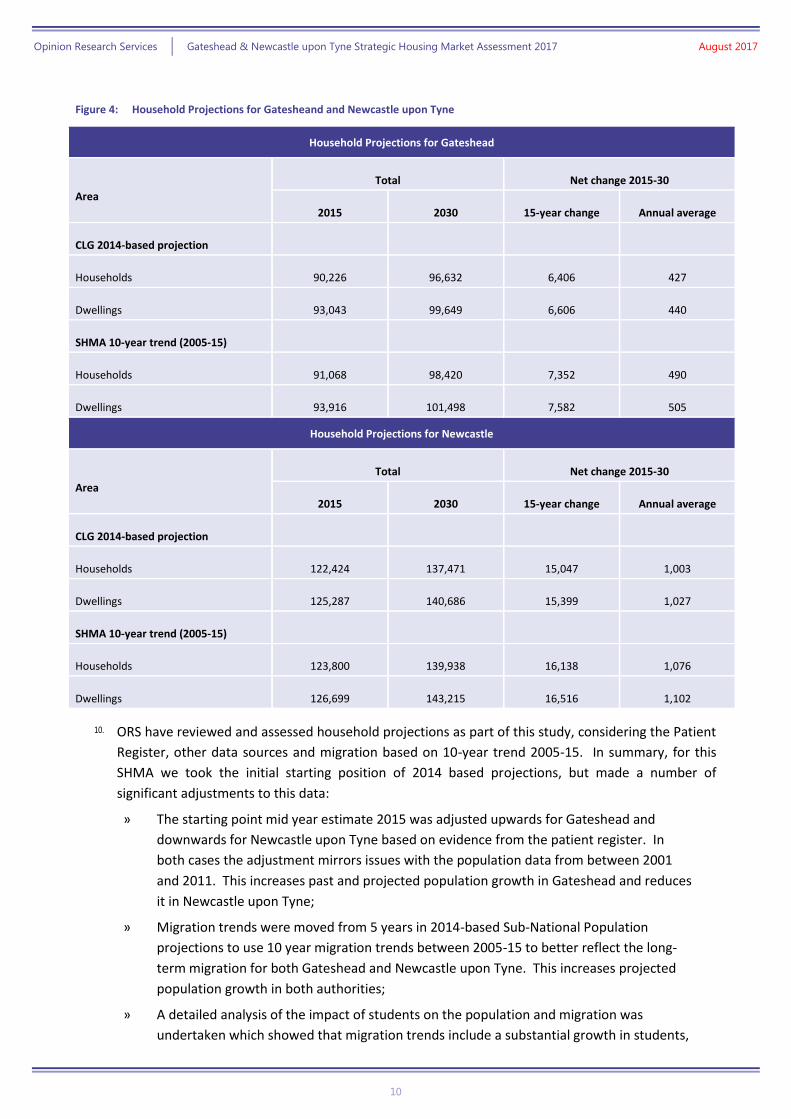
Figure 4: Household Projections for Gatesheand and Newcastle upon Tyne
Household Projections for Gateshead
Area
Total Net change 2015-30
2015 2030 15-year change Annual average
CLG 2014-based projection
Households 90,226 96,632 6,406 427
Dwellings 93,043 99,649 6,606 440
SHMA 10-year trend (2005-15)
Households 91,068 98,420 7,352 490
Dwellings 93,916 101,498 7,582 505
Household Projections for Newcastle
Area
Total Net change 2015-30
2015 2030 15-year change Annual average
CLG 2014-based projection
Households 122,424 137,471 15,047 1,003
Dwellings 125,287 140,686 15,399 1,027
SHMA 10-year trend (2005-15)
Households 123,800 139,938 16,138 1,076
Dwellings 126,699 143,215 16,516 1,102
10. ORS have reviewed and assessed household projections as part of this study, considering the Patient
Register, other data sources and migration based on 10-year trend 2005-15. In summary, for this
SHMA we took the initial starting position of 2014 based projections, but made a number of
significant adjustments to this data:
» The starting point mid year estimate 2015 was adjusted upwards for Gateshead and
downwards for Newcastle upon Tyne based on evidence from the patient register. In
both cases the adjustment mirrors issues with the population data from between 2001
and 2011. This increases past and projected population growth in Gateshead and reduces
it in Newcastle upon Tyne;
» Migration trends were moved from 5 years in 2014-based Sub-National Population
projections to use 10 year migration trends between 2005-15 to better reflect the long-
term migration for both Gateshead and Newcastle upon Tyne. This increases projected
population growth in both authorities;
» A detailed analysis of the impact of students on the population and migration was
undertaken which showed that migration trends include a substantial growth in students,
Opinion Research Services | Gateshead & Newcastle upon Tyne Strategic Housing Market Assessment 2017 August 2017
11
but there is no expectation that this will continue in to the future. Therefore the net
impact of students has been removed from the migration data. This reduces population
growth in both authorities; and
» Net migration from Newcastle upon Tyne to Gateshead grew from 2001 to 2011, for the
purposes of this study, and forecast trends, it has been assumed that the growth of
students in Newcastle led to an increase in out migration from Newcastle to Gateshead.
As previous student growth trends are expected to no longer continue it is also likely that
out migration to Gateshead will reduce. This assumption can be monitored over time.
11. On this basis, the data shows household numbers across the study area would increase over the 15-
year Plan period 2015-30 by an average of 490 per year in Gateshead and 1,076 per year in
Newcastle upon Tyne. These figures provide the most appropriate demographic projection on
which to base the Objectively Assessed Need (OAN) for housing. This difference is mainly due to a
higher projected increase in population in the SHMA projections. The figures represent an increase
on the starting point for Gateshead of 15% and for Newcastle upon Tyne of 7%. The figures for
Gateshead are slightly lower than those in the Joint Core Strategy for 2015-30, while the figures for
Newcastle upon Tyne are slightly higher. However, both figures are very close to the existing policy
positions in each authority with a rise across the two authorities of 2.1%.
Affordable Housing Need
12. The SHMA has undertaken a comprehensive analysis of the existing unmet need for affordable
housing. This analysis identified that the overall housing need by 258 households in Gateshead and
399 households in Newcastle upon Tyne to take account of concealed families and homeless
households that would not be captured by the household projections. When the unmet needs from
existing households living in unsuitable housing were also included, the analysis established there
to be 1,599 households in need of affordable housing in 2015 in Gateshead there to be 2,650
households in need of affordable housing in Newcastle upon Tyne.
13. However, as 960 of these already occupied an affordable home but need to move for reasons such
as overcrowding in Gateshead and 1,463 in Newcastle upon Tyne, therefore there is a net need from
639 households in Gateshead (1,599 less 960= 639) and 1,187 households in Newcastle upon Tyne
(2,650 less 1,463 = 1,187) who need affordable housing and do not currently occupy affordable
housing in 2015.
14. Based on the household projections, the SHMA has established the balance between the future
need for market housing and affordable housing. The analysis identifies that the number of
households in need of affordable housing will increase by 2,596 households in Gateshead and
4,749 households in Newcastle upon Tyne over the period 2015-30, alongside an increase of 4,756
households in Gateshead and 11,389 in Newcastle upon Tyne able to afford market housing.
15. Overall, there will be a need to provide additional affordable housing for 3,235 (2,596 + 639 =
3,235) households (3,277 dwellings) over the period 2015-30 in Gateshead (42.5% of the projected
household growth) and 5,936 (4,749+1,187 = 5,936) households (6,014 dwellings) in Newcastle
upon Tyne (35.9% of the projected household growth). This is equivalent to an average of 216
households per year in Gateshead and 396 households per year in Newcastle upon Tyne. Both of
these figures are the identified need for those who cannot afford market housing in each area.

Opinion Research Services | Gateshead & Newcastle upon Tyne Strategic Housing Market Assessment 2017 August 2017
12
However, planning practice guidance and case law are both clear that while all affordable housing
needs should be identified, they may not necessarily have to be provided because delivery may be
constrained by viability and the ability of market housing to support the delivery of affordable
housing. Therefore, the amount of affordable delivered may be different from the identified need.
16. These figures are significantly higher than those set out in the Gateshead and Newcastle upon Tyne
SHMA 2013, but that featured a different definition of affordable housing need and also used a
different model to assess households who require affordable housing.
17. Any losses from the current affordable stock (such as demolition or clearance, or sales through Right
to Buy) would increase the number of affordable dwellings needed by an equivalent amount.
Meanwhile any vacant affordable dwellings returned to use would count as part of the supply
necessary to meet the need for affordable housing. Both of these scenarios are important in
Gateshead and Newcastle upon Tyne with both areas having seen recent demolitions to facilitate
renewals, but also both areas having a number of hard to let properties which are currently vacant.
If these hard to let properties could be brought back in to use, then they can be counted as the
equivalent of new housing delivery in the area.
Need for Older Person Housing
18. The population aged 65 or over is projected to increase by 9,750 persons in Gateshead and 14,200 in
Newcastle upon Tyne between 2015 and 2030.
Figure 5: Population Projections for Gatesheand and Newcastle upon Tyne 2015-30 by 5-year age cohort based SHMA
population projections
Gateshead
2015 2030 Change 2015-2030
Age 65+ 38,548 48,294 9,745
Age 75+ 17,947 24,101 6,153
Age 85+ 4,744 7,110 2,366
Total – all ages 203,098 212,652 9,554
Newcastle upon Tyne
2015 2030 Change 2015-2030
Age 65+ 41,783 55,977 14,194
Age 75+ 19,777 27,572 7,796
Age 85+ 5,880 8,369 2,489
Total – all ages 292,281 322,963 30,682
19. The SHMA has identified that between 2015 and 2030, groups in institutional population is likely to
increase by 414 persons aged 75 years or over in Gateshead and 593 persons in Newcastle upon
Tyne. This increase in institutional population is a consequence of the CLG approach to establishing
Opinion Research Services | Gateshead & Newcastle upon Tyne Strategic Housing Market Assessment 2017 August 2017
13
the household population3, which assumes “that the share of the institutional population stays at
2011 levels by age, sex and relationship status for the over 75s” on the basis that “ageing population
will lead to greater level of population aged over 75 in residential care homes”.
20. However, it does not necessarily follow that all of the increase in institutional population should be
provided as additional bedspaces in residential institutions in Use Class C2; some of the specialist
older persons’ housing, including sheltered or “extra care”, may be more appropriate for their
needs, and to maintain independent living. Housing and planning policy in both authorities should
seek to support households to remain in their own homes for longer and therefore, it is possible that
additional nursing and care homes will not be required, at least to the extent of meeting the
additional demand. If that is the case then some or all of the needs of the additional older persons
will need to be factored in to the housing requirements for the area.
21. Whilst an additional 1,007 persons aged 75 or over are predicted to require communal
establishments, these are not counted as part of the OAN, but PPG, March 2014 notes that they
should be counted against the local authority housing requirement. However, an allowance is made
for the dwellings that may be vacated by many of the persons identified4. Not all would vacate
dwellings, as some will have a partner or other family remaining in the home; but further analysis of
the data (assuming no growth in the institutional population) shows that housing need based on the
household projections would be 859 dwellings higher, if the additional bedspaces were not
provided, with 348 more dwellings in Gateshead and 511 more dwellings in Newcastle upon Tyne –
so it is important to take account of these needs.
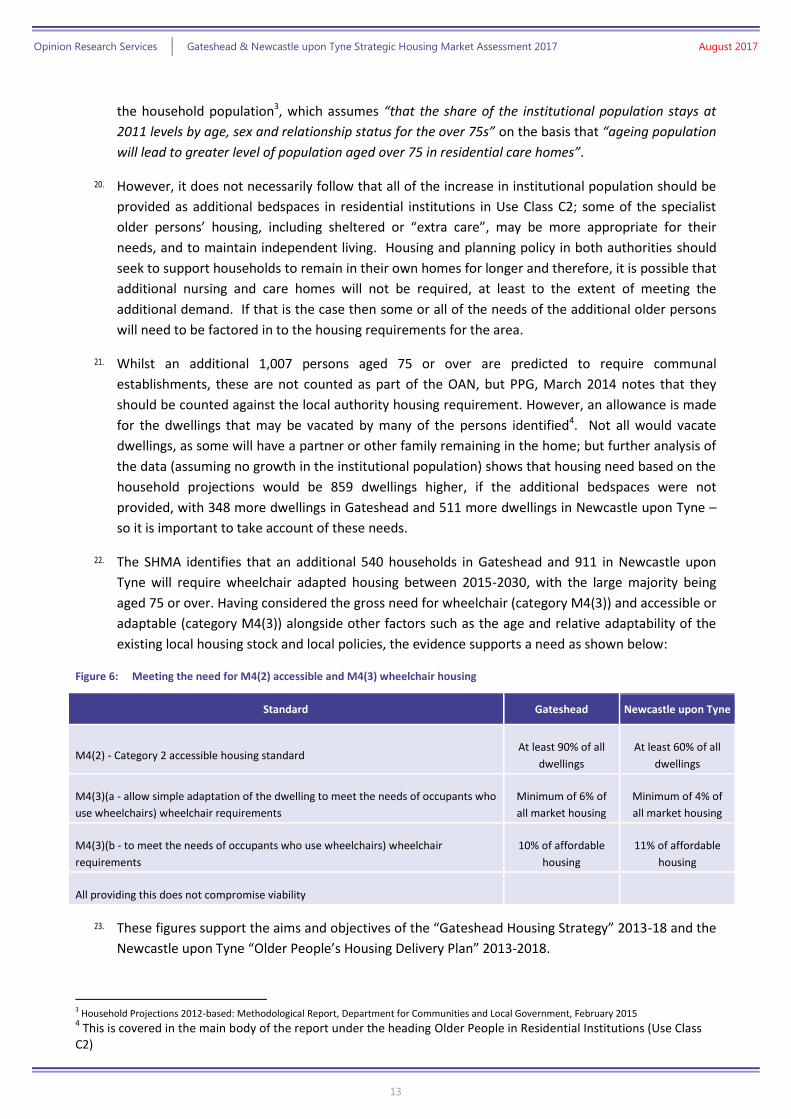
22. The SHMA identifies that an additional 540 households in Gateshead and 911 in Newcastle upon
Tyne will require wheelchair adapted housing between 2015-2030, with the large majority being
aged 75 or over. Having considered the gross need for wheelchair (category M4(3)) and accessible or
adaptable (category M4(3)) alongside other factors such as the age and relative adaptability of the
existing local housing stock and local policies, the evidence supports a need as shown below:
Figure 6: Meeting the need for M4(2) accessible and M4(3) wheelchair housing
Standard Gateshead Newcastle upon Tyne
M4(2) - Category 2 accessible housing standard At least 90% of all
dwellings
At least 60% of all
dwellings
M4(3)(a - allow simple adaptation of the dwelling to meet the needs of occupants who
use wheelchairs) wheelchair requirements
Minimum of 6% of
all market housing
Minimum of 4% of
all market housing
M4(3)(b - to meet the needs of occupants who use wheelchairs) wheelchair
requirements
10% of affordable
housing
11% of affordable
housing
All providing this does not compromise viability
23. These figures support the aims and objectives of the “Gateshead Housing Strategy” 2013-18 and the
Newcastle upon Tyne “Older People’s Housing Delivery Plan” 2013-2018.
3 Household Projections 2012-based: Methodological Report, Department for Communities and Local Government, February 2015 4 This is covered in the main body of the report under the heading Older People in Residential Institutions (Use Class
C2)

Opinion Research Services | Gateshead & Newcastle upon Tyne Strategic Housing Market Assessment 2017 August 2017
14
Market Signals
24. NPPF sets out that “Plans should take account of market signals…” (paragraph 17) and PPG identifies
that “the housing need number suggested by household projections (the starting point) should be
adjusted to reflect appropriate market signals”.
25. The SHMA has considered the Market Signals for Gateshead and Newcastle upon Tyne and
compared these to other areas which have similar demographic and economic characteristics. On
the basis of this data we can conclude:
House Prices: lower quartile prices are lower than the national average in both Gateshead and
Newcastle upon Tyne, with lower quartile prices of £92,000 and £111,000 respectively
compared to England’s £142,000 (based on 2015-16 prices). The current lower quartile price in
the comparator area Liverpool and Knowsley is lower again at £76,800; the prices in
comparator areas Sheffield and Manchester and Salford are £102,000 and £103,600
respectively; and lower quartile prices in Leeds are higher than both Gateshead and Newcastle
upon Tyne at £115,000. Prices in Gateshead and Newcastle upon Tyne have risen at a similar
rate to most of the comparator areas and the national rate over the past 5 years; however
there was a higher rate of increase in Manchester and Salford (20%) and a small reduction in
lower quartile prices in Liverpool and Knowsley (-2%);
Rents: for average private sector rents in 2015-16, both Gateshead and Newcastle upon Tyne
are lower than the national average, they are however broadly in line with private sector rents
in comparator areas. When we look at the growth in rent over the past 5 years, Newcastle
upon Tyne has a higher rate of growth than the national average (30% compared to growth of
18% in England as a whole) whereas the rate of growth in private sector rents in Gateshead was
less than 1%;
Affordability ratio (in terms of the ratio between lower quartile house prices and lower quartile
earnings) is much lower in both Gateshead and Newcastle upon Tyne than across England as a
whole (5.0 and 5.8 respectively cf. 7.0). This means for example in Gateshead that lower
quartile house prices are 5 times higher than the salary of a full-time workers whose earnings
are at the lower quartile. Affordability ratios have got marginally “worse” since 2010, with the
ratio in Gateshead increasing from 4.9 to 5.0 and the ratio in Newcastle upon Tyne increasing
from 5.5 to 5.8. This is in line with the equivalent rate for England, where the ratio increased
from 6.7 to 7.0, a change of 5%;
Rate of development (in terms of increase in dwelling stock over the last 10 years) shows that
rate of development in Gateshead has been lower than England (5.7% cf. 8.3%). The rate of
development in Newcastle upon Tyne was lower again at 3.5%. Rates of development were
higher in most of the comparator areas than both Gateshead and Newcastle upon Tyne with
the rate of change in Manchester and Salford reaching 13.6% over the last 10 years;
Overcrowding (in terms of 2011 Census occupancy rates) 6.2% of households in Gateshead are
assumed to be overcrowded based on an objective measure, which is lower than England
(8.7%). The proportion of overcrowded households in Newcastle upon Tyne was slightly higher
than England (9.1%). The proportion of overcrowded households in Newcastle upon Tyne has
increased over the last 10 years but at a lower rate than England (17% cf. 23%). Overcrowding
has also increased in Gateshead but only marginally (1%). The proportion of overcrowded

Opinion Research Services | Gateshead & Newcastle upon Tyne Strategic Housing Market Assessment 2017 August 2017
15
households and rate of increase over the last 10 years was much worse in comparator areas
Manchester and Salford and Sheffield.
26. Given this context, it is apparent that the indicators generally indicate that housing market pressures
in Gateshead and Newcastle upon Tyne are generally comparable to those in similar areas, with
some indicators being a little better and some a little worse. Overall, (and given that many of these
areas show lesser pressures than the national average - in particular the market signals relating to
price), conditions across Gateshead and Newcastle upon Tyne suggest that the level of Objectively
Assessed Need should not be higher than suggested by household projections.
Conclusions
27. We have calculated Objectively Assessed Need based on demographic projections and assessed
these against Market Signals to determine if a higher rate of housing delivery is necessary to address
housing market problems. This takes account of household growth based on CLG 2014-based
projections (the starting point); adjusts for long-term migration trends; responds to suppressed
household formation (through providing for the growth of concealed families between 2001 and
2011); and takes account of vacant and second homes.
28. Figure 7 summarises each of the stages for establishing the Full Objectively Assessed Need for
Housing.

Opinion Research Services | Gateshead & Newcastle upon Tyne Strategic Housing Market Assessment 2017 August 2017
16
Figure 7: Full Objectively Assessed Need for Housing for Gateshead and Newcastle upon Tyne 2015-30
Gateshead Newcastle upon
Tyne Total
Demographic starting point: CLG household
projections 2015-30 6,406 15,047 21,453
Baseline household projections taking account of local
circumstances 7,352 16,138 23,490
Allowance for transactional vacancies and second
homes: based on dwellings without a usually resident
household
230 378 608
Dwellings 7,582 16,516 24,098
Adjustment for suppressed household formation
rates: concealed family growth 2001-11 and homeless
households
258 + 8 = 266 399 + 9 = 408 657 + 17 = 674
Baseline housing need based on demographic
projections 7,848 16,924 24,772
Further adjustments
needed…
In response to balancing
jobs and workers: 0 0 0
In response to market signals
0 0 0
Combined impact of the identified adjustments 0 0 0
Full Objectively Assessed Need for Housing 2015-30 7,848 16,924 24,772
29. Across the two authorities CLG Household Projections suggest a growth of 21,453 households over
the 15-year period 2015-30; however, this is based on short-term migration trends. Demographic
projections based on 10-year migration trends provide a more reliable and appropriate basis for
establishing future housing need. The SHMA has identified an increase of 23,490 households over
the 15-year period 2015-30.
30. The baseline household projections should be increased by 657 households to take account of
concealed families and homeless households that would otherwise not be captured due to
suppressed household formation rates. This adjustment responds to identified un-met need for
affordable housing, and addresses suppressed household formation rates. Any new C2 provision
(residential institutions) does not count as a contribution towards the housing requirement as
population living in this type of provision is outside the OAN assessment.
31. Providing for this increase in households yields a baseline housing need of 24,772 dwellings; with
7,848 in Gateshead and 16,924 in Newcastle upon Tyne. .
32. The evidence from planned jobs and workers identifies that there will be sufficient extra workers for
the forecast increase in jobs, so there is no need to increase housing delivery to provide any

Opinion Research Services | Gateshead & Newcastle upon Tyne Strategic Housing Market Assessment 2017 August 2017
17
additional workers. On the basis of the Market Signals evidence, we would not propose an overall
uplift of the housing need identified based on the household projections.
33. Of course, it is important to remember that “establishing future need for housing is not an exact
science” (PPG ID 2a-014). Whilst the OAN must be underwritten by robust evidence that is based on
detailed analysis and informed by reasonable assumptions, the final conclusions should reflect the
overall scale of the housing needed in the housing market area without seeking to be spuriously
precise.
34. The SHMA therefore identifies the Full Objective Assessed Need for Housing in Gateshead to be
7,848 dwellings over the 15-year period 2015-30, equivalent to an average of 523 dwellings per
year. This includes the Objectively Assessed Need of Affordable Housing for 3,277 dwellings over
the same period, equivalent to an average of 218 per year.
35. The SHMA also identifies the Full Objective Assessed Need for Housing in Newcastle upon Tyne to
be 16,924 dwellings over the 15-year period 2015-30, equivalent to an average of 1,128 dwellings
per year. This includes the Objectively Assessed Need of Affordable Housing for 5,936 dwellings
over the same period, equivalent to an average of 396 per year.
36. Importantly, these OAN figures are extremely close to those set out in the Joint Core Strategy for the
period 2015-30 which show an annual need for Gateshead over the period 2015-30 of 535 dwellings
per annum and 1,040 dwellings per annum for Newcastle upon Tyne for the same period. Therefore,
it would seem to be appropriate to continue with the Joint Core Strategy housing target figures.
37. We would note that paragraph 29 of PPG proposes that:
‘An increase in the total housing figures included in the local plan should be considered
where it could help deliver the required number of affordable homes.’
38. While the guidance is clear that an uplift should be considered, it is also clear that this is not
necessarily required. In areas such as Gateshead and Newcastle upon Tyne the relatively low level of
viability for affordable housing implies that an uplift is unlikely to deliver significant additional,
amounts of affordable housing. It should also be remembered that the Housing White Paper, “Fixing
our broken housing market’ published in February 2017 indicates that up to 10% of all larger sites
should be affordable home ownership dwellings. This implies that an increase in total dwelling
delivery would first deliver more affordable home to buy, rather than those to rent which are
required to meet the identified need.
39. We would also note that the Housing White Paper proposed that there would be a future
consultation on a new standardised methodology for undertaking OAN calculations. This is
scheduled for consultation in September 2017 and to be in place by April 2018. The impact of this
methodology for Gateshead and Newcastle upon Tyne is currently unknown, and the government
have indicated that there will be flexibility in its application.
Nationally Described Space Standards
40. This report includes an assessment of the compliance with the Nationally Described Space Standards
(NDSS) in Gateshead and Newcastle. A summary is shown below:

Opinion Research Services | Gateshead & Newcastle upon Tyne Strategic Housing Market Assessment 2017 August 2017
18
Figure 8: Compliance with the 2015 Nationally Described Space Standards (NDSS) for Gross Internal Area (GIA)
Compliance with the 2015 Nationally Described Space Standards (NDSS) for Gross Internal Area (GIA)
Evidence
Gateshead An Analysis of Space Standards in Gateshead in January 2016
Newcastle upon Tyne Analysis of completions over previous two years August 2017
Conclusions
The two studies support each other in general conclusions: Evidence behind the conclusions:
A third of house types assessed failed to meet the space
standards
36% of house types in the Gateshead study failed to meet the NDSS,
the majority (64%) of 2, 3 and 4- bedroom properties in the
Newcastle upon Tyne analysis failed to meet the standard
There is some evidence that mid-sized house types, notably 3-
bedrooms are more likely to fail to meet space standards than
1 bedroom or larger house types
27% of 3-bedroom properties failed to meet the standard in the
Newcastle upon Tyne analysis compared to 56% of 1-bedroom
properties and 47% of 4-bedroom properties

Opinion Research Services | Gateshead & Newcastle upon Tyne Strategic Housing Market Assessment 2017 August 2017
19
1. Introducing the Study Background to the project and wider policy context
1.1 Opinion Research Services (ORS) was commissioned by Gateshead Council and Newcastle upon Tyne
City Council to undertake a Strategic Housing Market Assessment to establish the Objectively Assessed
Need for housing.
1.2 The National Planning Policy Framework (NPPF) sets out government's planning policies for England
and how these are expected to be applied. The Framework acts as guidance for local planning
authorities and decision-takers, both in drawing up plans and making decisions about planning
applications.
1.3 Planning Practice Guidance (PPG) on the assessment of housing and economic development needs was
published in March 2014. Previous SHMA Guidance (2007) and related documents were rescinded at
that time, so the approach taken in preparation of this report is focused on meeting the requirements
of the NPPF and PPG and therefore, many aspects of the previous SHMA required replacing.
1.4 The study methodology was also mindful of Planning Inspector Decisions and High Court Judgements,
as well as emerging good practice including the technical advice note about Objectively Assessed Need
(OAN) and Housing Targets Second Edition published by the Planning Advisory Service (PAS) in July
20155.
Government Policy 1.5 The NPPF has at its heart a presumption in favour of sustainable development, and states that Local
Plans should meet the full, objectively assessed needs for market and affordable housing in the
housing market area. Given that Regional Spatial Strategies are now revoked, the responsibility for
establishing the level of future housing provision required rests with the local planning authority.
“At the heart of the National Planning Policy Framework is a presumption in favour of sustainable
development, which should be seen as a golden thread running through both plan-making and
decision-taking.
Local planning authorities should positively seek opportunities to meet the development needs of
their area.
Local Plans should meet objectively assessed needs, with sufficient flexibility to adapt to rapid
change, unless any adverse impacts of doing so would significantly and demonstrably outweigh the
benefits, when assessed against the policies in this Framework taken as a whole.”
National Planning Policy Framework (NPPF), paragraph 14
5 Objectively Assessed Need and Housing Targets Second Version (PAS, July 2015)

Opinion Research Services | Gateshead & Newcastle upon Tyne Strategic Housing Market Assessment 2017 August 2017
20
“To boost significantly the supply of housing, local planning authorities should use their evidence
base to ensure that their Local Plan meets the full, objectively assessed needs for market and
affordable housing in the housing market area.”
National Planning Policy Framework (NPPF), paragraph 47
1.6 Given this context, the key objective is to provide the robust and strategic evidence base required to
establish the Objectively Assessed Need (OAN) for housing in the Housing Market Area (HMA) and
provide information on the appropriate mix of housing and range of tenures needed.
“Local planning authorities should have a clear understanding of housing needs in their area.
They should prepare a Strategic Housing Market Assessment to assess their full housing needs,
working with neighbouring authorities where housing market areas cross administrative boundaries.
The Strategic Housing Market Assessment should identify the scale and mix of housing and the
range of tenures that the local population is likely to need over the plan period which:
» meets household and population projections, taking account of migration and demographic
change;
» addresses the need for all types of housing, including affordable housing and the needs of
different groups in the community (such as, but not limited to, families with children, older
people, people with disabilities, service families and people wishing to build their own homes);
and
» caters for housing demand and the scale of housing supply necessary to meet this demand;”
National Planning Policy Framework (NPPF), paragraph 159
1.7 Modelling future housing need requires a consideration of the housing market from a high-level,
strategic perspective; in this way an understanding of how key drivers and long-term trends impact on
the structure of households and population over the full planning period can be delivered.
1.8 The objective of this study was to establish the OAN for housing (both market and affordable),
ensuring that this was fully compliant with the requirements of the NPPF and PPG. Using secondary
data, this study sought to:
» Identify the housing market area covering Gateshead and Newcastle upon Tyne;
» Provide evidence of the need and demand for housing based on demographic projections;
» Consider market signals about the balance between demand for and supply of dwellings;
» Establish the Objectively Assessed Need for housing;
» Identify the appropriate balance between market and affordable housing; and
» Address the needs for a range of specific household types.
1.9 It is important to recognise that the information from this document should not be considered in
isolation, but forms part of a wider evidence base to inform the development of housing and planning
policies. This document does not seek to determine rigid policy conclusions, but instead provides a
key component of the evidence base required to develop and support a sound policy framework.
Opinion Research Services | Gateshead & Newcastle upon Tyne Strategic Housing Market Assessment 2017 August 2017
21
Duty to Co-operate 1.10 The Duty to Co-operate was introduced in the 2011 Localism Act and is a legal obligation.
1.11 The NPPF sets out an expectation that public bodies will co-operate with others on issues with any
cross-boundary impact, in particular in relation to strategic priorities such as “the homes and jobs
needed in the area”.
“Public bodies have a duty to cooperate on planning issues that cross administrative boundaries,
particularly those which relate to the strategic priorities set out in paragraph 156. The Government
expects joint working on areas of common interest to be diligently undertaken for the mutual
benefit of neighbouring authorities.
Local planning authorities should work collaboratively with other bodies to ensure that strategic
priorities across local boundaries are properly coordinated and clearly reflected in individual Local
Plans. Joint working should enable local planning authorities to work together to meet development
requirements which cannot wholly be met within their own areas – for instance, because of a lack of
physical capacity or because to do so would cause significant harm to the principles and policies of
this Framework. As part of this process, they should consider producing joint planning policies on
strategic matters and informal strategies such as joint infrastructure and investment plans.”
National Planning Policy Framework (NPPF), paragraphs 178-179
1.12 How councils have complied with their legal requirements under the Duty to Co-operate will be
considered when plans are submitted for examination. One key issue is how any unmet development
and infrastructure requirements can be provided by co-operating with adjoining authorities (subject to
tests of reasonableness and sustainability). The NPPF sets out that co-operation should be “a
continuous process of engagement” from “thinking through to implementation”.
“Local planning authorities will be expected to demonstrate evidence of having effectively
cooperated to plan for issues with cross-boundary impacts when their Local Plans are submitted for
examination. This could be by way of plans or policies prepared as part of a joint committee, a
memorandum of understanding or a jointly prepared strategy which is presented as evidence of an
agreed position. Cooperation should be a continuous process of engagement from initial thinking
through to implementation, resulting in a final position where plans are in place to provide the land
and infrastructure necessary to support current and projected future levels of development.”
National Planning Policy Framework (NPPF), paragraph 181
Gateshead and Newcastle upon Tyne Joint Core Strategy 2010-2030 1.13 The Gateshead and Newcastle upon Tyne Joint Core Strategy was adopted in March 2015 and this
SHMA can be seen as a review and update of the evidence base which underwrote this document. The
Joint Core Strategy includes a provision for 30,000 more homes, 22,000 more jobs and also a need for
15% of all new homes to be affordable housing on qualifying sites.
1.14 The Joint Core Strategy was based upon evidence produced in 2013 or earlier, although relevant
evidence and guidance that was made available by or during the examination of the Core Strategy in
2014 was considered. In March 2014, the government produced new guidance on conducting housing
needs assessments in the form of ‘Guidance for Housing and Economic Development Needs
Opinion Research Services | Gateshead & Newcastle upon Tyne Strategic Housing Market Assessment 2017 August 2017
22
Assessments’. Paragraphs 2-21 of this new guidance cover overall housing needs and paragraph 22-29
covers affordable housing needs. The new guidance includes a number of significant changes since the
2007 SHMA Practice Guidance which underwrote much of the work leading to the Joint Core Strategy.
1.15 This study should also be seen in the context of the wider situation in the North East of England. At
the time of writing, North Tyneside Council have adopted their Local Plan. Northumberland County
Council has withdrawn their local Plan from examination, while Sunderland City Council has published
their Core Strategy. Durham County Council and South Tyneside Council are developing their Local
Plans for publication.
Housing White Paper 1.16 We would also note that the Housing White Paper, “Fixing our broken housing market’ was published
in February 2017. One change flagged in the White Paper is a change in definition for affordable
housing to include Starter Homes at 20% discounts of market prices and also Build to Rent with rents
to remain at 20% below market prices. Build to rent does not affect the need for affordable homes
because the rents would be similar to Affordable Rents, just on the private sector not with a registered
provider
1.17 However, the inclusion of Starter Homes in a wider definition of affordable housing will require a
fundamental revision of who is considered to be in affordable housing need because the current
definition is based upon who can afford market housing including private rent as well as owner
occupied housing. Therefore, if the Government proceed to include Starter Homes in the definition of
affordable housing products, they will also need to count many more households as being in
affordable housing need than is currently the case because all non-owning households who wish to
purchase Starter Homes will need to be included.
1.18 On this basis, this study should be seen as sitting between two points in time in terms of the modelling
of affordable housing need. Past studies, including the Gateshead and Newcastle upon Tyne SHMA
2013 have applied very strict affordability test to assess who requires affordable housing, while this
study applies the much looser definition currently in force. However, it is likely that by April 2018
many more households which are not currently counted as being in affordable housing need will be
added to the figures because of the move to include Starter Homers in the definition of affordable
housing products.

Opinion Research Services | Gateshead & Newcastle upon Tyne Strategic Housing Market Assessment 2017 August 2017
23
2. Defining the Housing Market Area
An evidence base to identify functional housing markets
2.1 The National Planning Policy Framework (NPPF) refers to Local Plans meeting the “full objectively
assessed needs for market and affordable housing in the housing market area” (paragraph 47,
emphasis added). The identification of the Housing Market Area (HMA) is therefore the first relevant
building block in the evidence for identifying objectively assessed needs for the study.
2.2 This Chapter considers the historic and current evidence about housing market areas relating to
Gateshead and Newcastle upon Tyne.
Functional Housing Market Areas 2.3 The definition of a functional housing market area is well-established as being “...the geographical area
in which a substantial majority of the employed population both live and work and where those
moving house without changing employment choose to stay” (Maclennan et al, 1998)6.
Planning Practice Guidance 2.4 Planning Practice Guidance (PPG) on the Assessment of Housing and Economic Development Needs
(March 2014) reflects this existing concept, confirming that the underlying principles for defining
housing markets are concerned with the functional areas in which people both live and work:
What is a housing market area?
A housing market area is a geographical area defined by household demand and preferences for all
types of housing, reflecting the key functional linkages between places where people live and work.
It might be the case the housing market areas overlap. The extent of the housing market areas
identified will vary, and many will in practice cut across various local planning authority
administrative boundaries. Local planning authorities should work with all the other constituent
authorities under the duty to cooperate.
Planning Practice Guidance (March 2014), ID 2a-010
2.5 Therefore, PPG requires an understanding of the housing market area and says this can be defined
using three different sources of information:
» House prices and rates of change in house prices
» Household migration and search patterns
» Contextual data (e.g. travel to work area boundaries, retail and school catchment areas)
6 Local Housing Systems Analysis: Best Practice Guide. Edinburgh: Scottish Homes

Opinion Research Services | Gateshead & Newcastle upon Tyne Strategic Housing Market Assessment 2017 August 2017
24
2.6 These sources are well-established, being consistent with those previously identified in the CLG advice
note “Identifying sub-regional housing market areas” published in 20077. We would note that retail
catchment area is predominately used for economic market area, rather than housing market areas,
while school catchment areas are used to consider more localised housing markets. Therefore they
are not included in this study.
Geography of Housing Market Areas (NHPAU/CURDS) 2.7 CLG also published a report on the ‘Geography of Housing Market Areas’ in 20108 which was
commissioned by the former National Housing and Planning Advice Unit (NHPAU) and undertaken by
the Centre for Urban and Regional Development Studies (CURDS) at Newcastle upon Tyne University.
This study explored a range of potential methods for calculating housing market areas for England and
applied these methods to the whole country to show the range of housing markets which would be
generated. The report also proposed three overlapping tiers of geography for housing markets:
» Tier 1: framework housing market areas defined by long distance commuting flows and the
long-term spatial framework within which housing markets operate;
» Tier 2: local housing market areas defined by migration patterns that determine the limits of
short term spatial house price arbitrage: i.e. households moving without changing jobs;
» Tier 3: sub-markets defined in terms of neighbourhoods or house type price premiums.
2.8 The report recognised that migration patterns and commuting flows were the most relevant
information sources for identifying the upper tier housing market areas, with house prices only
becoming relevant at a more local level and when establishing housing sub-markets. The report also
outlined that no one single approach (nor one single data source) will provide a definitive solution to
identifying local housing markets; but by using a range of available data, judgements on appropriate
geography can be made.
2.9 Advice published in the Planning Advisory Service (PAS) technical advice note about Objectively
Assessed Need (OAN) and Housing Targets (originally published in June 2014, with a second edition9 in
July 2015) also suggests that the main indicators will be migration and commuting (second edition,
paragraph 5.4).
“The PPG provides a long list of possible indicators, comprising house prices, migration and
search patterns and contextual data including travel-to-work areas, retail and school
catchments. In practice, the main indicators used are migration and commuting.”
The PAS OAN technical advice note also suggests that analysis reported in the CLG report
“Geography of Housing Market Areas” (CLG, November 2010) should provide a starting point
for drawing HMAs (Figure 9).
2.10 Figure 9 shows the local authority boundary (in black) with Gateshead and Newcastle upon Tyne
shaded blue. It compares these with the CURDS study (in green) to consider their alignment. It is
apparent that the CURDS study concluded that Gateshead and Newcastle upon Tyne are part of a
larger HMA which also covers North Tyneside and South Tyneside to the east, along with
7 Identifying sub-regional housing market areas (CLG, March 2007); paragraph 1.6 8 Geography of Housing Market Areas (CLG, November 2010) 9 http://www.pas.gov.uk/documents/332612/6549918/OANupdatedadvicenote/f1bfb748-11fc-4d93-834c-a32c0d2c984d
Opinion Research Services | Gateshead & Newcastle upon Tyne Strategic Housing Market Assessment 2017 August 2017
25
Northumberland to the north and west, and part of County Durham to the south. A separate
Sunderland HMA lies adjacent to the south east which includes the eastern part of County Durham.
Figure 9: NHPAU Study – PAS OAN technical advice note ‘Starting Point’ (Source: NHPAU/CURDS 2010)
ONS Travel to Work Areas 2.11 PPG defines housing market areas on the basis that they will reflect “the key functional linkages
between places where people live and work” (ID 2a-010). Furthermore, PPG identifies Office for
National Statistics Travel to Work Areas (TTWAs) as one of the identified data sources that should be
considered when establishing housing market areas.
Travel to work areas can provide information about commuting flows and the spatial structure of
the labour market, which will influence household price and location. They can also provide
information about the areas within which people move without changing other aspects of their lives
(e.g. work or service use).
Planning Practice Guidance (March 2014), ID 2a-011
2.12 The Office for National Statistics (ONS) defines official Travel to Work Areas for those involved in
labour market analysis and planning. These areas are also based on analysis of Census commuting
flow data, and TTWAs based on data from the 2011 Census were published in August 2015. A total of
228 TTWAs were defined for the whole of the UK based on 2011 data, a reduction from the 243
TTWAs that were previously defined based on 2001 Census data.
Opinion Research Services | Gateshead & Newcastle upon Tyne Strategic Housing Market Assessment 2017 August 2017
26
2.13 Figure 10 shows the defined TTWAs (2015), in blue, and these are based on the commuting flow data
from the 2011 Census.
Figure 10: ONS Travel To Work Areas (Source: ONS 2015)
2.14 Though smaller than the NHPAU Study HMA, once again, the TTWA including Gateshead and
Newcastle upon Tyne extends to the east to include North Tyneside and part of South Tyneside, along
with parts of Northumberland to the north and west, and part of County Durham to the south. The
remainder of South Tyneside is in a separate TTWA to the south east with Sunderland and the eastern
part of County Durham.
House Prices 2.15 As noted earlier, PPG also suggests that house prices should be considered in identifying the HMA for
an area. However, PAS OAN Technical Note suggests that migration and commuting should be
considered as being more important.
2.16 Figure 11 shows house prices across the study area and its neighbouring local authorities in quintiles,
so 20% of all properties sold fall in to each colour band. Areas in dark green have the lowest house
price and those in bright red have the highest prices.
2.17 For an area to be considered to be a HMA there would typically be a range of property types and
values across the area to allow all types of households with different levels of affordability to be able
to live in the area. The map shows large variations in house prices within each of the local authorities.
Therefore, an analysis of house prices does not help to simplify the process of identifying HMAs across
the wider North East.

Opinion Research Services | Gateshead & Newcastle upon Tyne Strategic Housing Market Assessment 2017 August 2017
27
Figure 11: House Prices 2016-17 (Source: Land Registry)
Valuation Office Agency Broad Rental Market Areas 2.18 The Broad Rental Market Area (BRMA) is the geographical area used by the Valuation Office Agency
(VOA) to determine the Local Housing Allowance rate (LHA), the allowance paid to Housing Benefit
applicants. The BRMA area is based on an area where a person could reasonably be expected to live
taking into account access to facilities and services for the purposes of health, education, recreation,
personal banking and shopping.
2.19 When determining BRMAs the Rent Officer takes account of the distance of travel, by public and
private transport, to and from these facilities and services. The boundaries of a BRMA do not have to
match the boundaries of a local authority and BRMAs will often fall across more than one local
authority area. Therefore BRMAs are areas within which it would be reasonable to expect a household
needing local housing allowance support to move to another settlement within the area in order to
find suitable housing.

Opinion Research Services | Gateshead & Newcastle upon Tyne Strategic Housing Market Assessment 2017 August 2017
28
The BRMA areas for Gateshead and Newcastle upon Tyne, and surrounding areas are shown, in red, in
Figure 12. It is evident that they again fall into one BRMA with North Tyneside, part of South Tyneside
and a large rural area in Northumberland to the west and north west. Again, the south part of South
Tyneside is in a separate BRMA with Sunderland and the eastern part of County Durham. The
remainder of County Durham is in a separate BRMA to the south, centred around Durham and Bishop
Auckland.
Figure 12: VOA Broad Rental Market Area Boundaries
Administrative Boundaries and Housing Market Areas 2.20 The NPPF recognises that housing market areas may cross administrative boundaries, and PPG
emphasises that housing market areas reflect functional linkages between places where people live
and work. The previous 2007 CLG advice note10 also established that functional housing market areas
should not be constrained by administrative boundaries, nevertheless it suggested the need for a
“best fit” approximation to local authority areas for developing evidence and policy (paragraph 9):
“The extent of sub-regional functional housing market areas identified will vary and many
will in practice cut across local authority administrative boundaries. For these reasons,
regions and local authorities will want to consider, for the purposes of developing evidence
bases and policy, using a pragmatic approach that groups local authority administrative
areas together as an approximation for functional sub-regional housing market areas.”
2.21 This “best fit” approximation has also been suggested by the PAS OAN technical advice note, which
suggests (second edition, paragraph 5.9):
10
Identifying sub-regional housing market areas (CLG, March 2007)

Opinion Research Services | Gateshead & Newcastle upon Tyne Strategic Housing Market Assessment 2017 August 2017
29
“boundaries that straddle local authority areas are usually impractical, given that planning
policy is mostly made at the local authority level, and many kinds of data are unavailable for
smaller areas.”
2.22 This means there is a need for balance in methodological approach:
» On the one hand, it is important that the process of analysis and identification of the functional
housing market areas should not be constrained by local authority boundaries. This allows the
full extent of each functional housing market to be properly understood and ensures that all of the
constituent local planning authorities can work together under the duty to cooperate, as set out in
Guidance (PPG, ID 2a-010).
On the other hand, and as suggested by the PAS OAN technical advice note (and the previous
CLG advice note), it is also necessary to identify a “best fit” for each functional housing
market area that is based on local planning authority boundaries. This “best fit” area
provides an appropriate basis for analysing evidence and drafting policy, and would normally
represent the group of authorities that would take responsibility for undertaking a Strategic
Housing Market Assessment.
2.23 In summary, therefore, the approach to defining housing market areas needs to balance robust
analysis with pragmatic administrative requirements.
2.24 Based on the range of analysis that we have considered, it is evident that the geography of housing
market areas around Gateshead and Newcastle upon Tyne is complex. There are important functional
relationships with North Tyneside, South Tyneside, Northumberland and County Durham, so it is
relevant to note that PPG recognises that “it might be the case that housing market areas overlap”
(paragraph 10). The three national mapped sources (NHPAU/CURDS Study, VOA BRMAs), used in
defining HMAs, all indicate Gateshead and Newcastle upon Tyne to be in a HMA with North Tyneside.
The NHPAU Study HMA indicates Gateshead and Newcastle upon Tyne to be in a HMA with South
Tyneside and Northumberland. The ONS Travel to Work Areas indicate Gateshead and Newcastle upon
Tyne to be in a HMA with parts of South Tyneside, Northumberland and County Durham, while the
VOA BRMAs indicate Gateshead and Newcastle upon Tyne to be in a HMA with parts of South Tyneside
and Northumberland.
2.25 Given the evidence from the three national mapped sources, it is necessary to assess whether
Gateshead and Newcastle upon Tyne can be considered as a separate lower-level HMA. Several recent
studies have concluded that local authorities surrounding Gateshead and Newcastle upon Tyne can be
considered as self-contained HMAs, based on commuting and migration patterns, but that North
Tyneside could be considered to be in an HMA with Newcastle upon Tyne. Considering Duty to
Cooperate, the studies indicate that the main partner authorities for Gateshead and Newcastle upon
Tyne are North Tyneside, South Tyneside, Northumberland and Durham. Analyses of Travel to Work
data indicates a functional economic area that includes Sunderland with and Gateshead and Newcastle
upon Tyne.
2.26 The Northumberland SHMA, 2015 (Arc4) concludes that Northumberland can be considered as a
separate HMA for Local Plan purposes, but that Duty to Cooperate lead to the need for partnership
with North Tyneside, Newcastle upon Tyne, Gateshead and Durham along with other non-Tyneside
authorities:

Opinion Research Services | Gateshead & Newcastle upon Tyne Strategic Housing Market Assessment 2017 August 2017
30
“Northumberland can be described as a largely self-contained housing market on the basis of
migration and travel to work patterns, with both suggesting that just under 70% of moves take
place within Northumberland. Additionally, 74.6% of households planning to move in the three
years 2012-2015 were planning to move within Northumberland. The SHMA also acknowledges the
relationship between Northumberland and neighbouring areas, in particular North Tyneside,
Newcastle upon Tyne, Gateshead, Durham, Carlisle and the Scottish Borders. Overall however,
Northumberland is considered to be a self-contained Market Area for the purposes of Local Plan
policy making.”
(Page 10)
2.27 The County Durham Issues and Options Stage SHMA (Part 1) 2016 (Arc4) concludes that County
Durham can be considered a separate HMA for Local Plan purposes:
“… County Durham can be described as a self-contained housing market on the basis of migration patterns and similarly travel to work patterns indicate that the majority of economically active residents live and work in County Durham. Evidence would therefore confirm that County Durham is an appropriate Housing Market Area for the purposes of Local Plan policy making.”
(Page 8)
2.28 However, the County Durham SHMA 2012 (Arc4) reports the HMA analysis in more detail and
concludes that, while on balance County Durham can be described as a separate HMA, the County
could also be considered as part of a larger functional market:
“The Department of Communities and Local Government (CLG) suggests that a housing market is
self-contained if upwards of 70% of moves (migration and travel to work) take place within a
defined area. An analysis of migration data indicates that 77.3% of households moving originated
within County Durham, suggesting that the County is a self-contained housing market area. That
said, there are areas which exhibit strong migration interactions with other localities (for instance
North and East Durham with Tyne and Wear and South Durham with Tees Valley). On balance,
County Durham can be described as a self contained delivery area in terms of migration, with some
areas exhibiting strong interactions with other areas. In terms of travel to work, County Durham is
part of a broader functional market which extends into Tyne and Wear and Tees Valley.”
(Page 7)
2.29 The North Tyneside SHMA, 2014 (Arc4) concludes that, migration within North Tyneside and Newcastle
upon Tyne City defines the two authorities as being in the same HMA:
“An analysis of 2011 Census migration data suggests that 64.7% of households who moved in the
year preceding the census originated from within North Tyneside and 48% of resident employees
live and work in North Tyneside. Former Government guidance suggested that housing markets are
self-contained if at least 70% of moves take place within the area.
On this basis, North Tyneside is not a self-contained housing market area but is part of a wider
housing market area extending into Newcastle upon Tyne and Northumberland. If moves between
North Tyneside and Newcastle upon Tyne are included, self-containment increases to 77.4%
(migration) and 73.8% (workplace); and if Northumberland moves are included self-containment
reaches 83.3% (migration) and 80.3% (workplace). The interactions between the three districts are

Opinion Research Services | Gateshead & Newcastle upon Tyne Strategic Housing Market Assessment 2017 August 2017
31
well-recognised and under the Duty to Co-operate the three authorities regularly meet to discuss
cross-boundary matters.”
(Page 8)
2.30 The South Tyneside SHMA update, 2015 (South Tyneside Council) states that:
“The vast majority of the moving households are within migration and hence the borough is
considered to contain one housing market.”
(Paragraph 3.1)
2.31 The South Tyneside SHMA, 2013 (Arc4) considers the migration and other data in detail and concludes
that South Tyneside can be seen as a separate HMA when considering migration alone, but part of a
larger HMA including Gateshead and Newcastle upon Tyne, along with Sunderland, when travel to
work is considered:
“The Department for Communities and Local Government suggests that a housing market is self-contained if upwards of 70% of moves (migration and travel to work) take place within a defined area. An analysis of migration data suggests that 77.9% of households move within the South Tyneside area and 51.2% work within the South Tyneside area. Therefore, South Tyneside is a self contained housing market area in terms of migration but part of a wider functional housing market area which extends into Sunderland, Newcastle upon Tyne and Gateshead in terms of travel to work.”
(Paragraph 3.31)
2.32 The Sunderland SHMA update, 2016 (Arc4) concludes that Sunderland Local Authority Area can be
considered an HMA for the purposes of the Local Plan, while the functional economic containing
Sunderland extends to Tyneside:
“Therefore, Sunderland exhibits a high degree of self-containment in terms of migration but it is
part of wider functional economic area which extends across Tyne and Wear and into County
Durham and Northumberland.
… Evidence would therefore suggest that the Sunderland Local Authority Area can be considered to
be an appropriate Housing Market Area for the purposes of Local Plan policy making.”
(Page 47)
Key Statistics for Gateshead and Newcastle upon Tyne HMA
Migration within the UK to and from Gateshead and Newcastle upon Tyne 2.33 PPG identifies that a “relatively high proportion of household moves” will be contained within a
housing market area, and suggests that this will be “typically 70%” or more; however this “excludes
long-distance moves” (ID 2a-011).
2.34 As the PAS OAN technical advice note confirms, “what counts as a long-distance move is a matter of
judgment” (second edition, paragraph 5.16). Data from the English Housing Survey 2013-14 household
report11 (figure 6.4) shows that over 7 in every 8 moves in the UK involved distances of less than 50
11 https://www.gov.uk/government/statistics/english-housing-survey-2013-to-2014-household-report

Opinion Research Services | Gateshead & Newcastle upon Tyne Strategic Housing Market Assessment 2017 August 2017
32
miles, with almost 5 in every 6 involving distances of less than 20 miles. It would therefore seem
appropriate for long-distance moves to include all moves of at least 50 miles, and for moves of 20
miles or more to also be considered.
2.35 The concept of excluding “long-distance moves” relates back to the early definition of a functional
housing market area that was set out at the start of this chapter. That definition focused on “those
moving house without changing employment”, and long-distance moves will generally involve a
change of job or other change of lifestyle (such as retirement). On balance, it seems unlikely that
many people would move more than 20 miles in this part of the country without a change of job; so it
would seem reasonable to consider moves of over 20 miles as being “long-distance” in the context of
this specific area.
2.36 Figure 13 shows the proportion of moves that remained within each local authority in the 12 months
prior to the Census.
2.37 The first column shows that of all moves into the local authority, the proportion of households that
were already living in the same local authority before moving. According to this measure, in each of
the three authorities of Gateshead, Newcastle upon Tyne and North Tyneside, the proportion of
moves contained within the authority did not reach the 70% recommended by PPG. The orange colour
of the cells denotes that the proportions approached, but did not reach the target figure.
2.38 The second column shows that of all moves by households who were already living in the local
authority before moving, the proportion that moved to another property within the same authority.
According to this measure, Newcastle upon Tyne (at 68.5%) is close to the recommended 70%, but
neither Gateshead nor North Tyneside alone reach the threshold.
2.39 The migration data indicates that none of the three authorities of Gateshead, Newcastle upon Tyne
and North Tyneside can be considered to be self-contained. In contrast, on both measures, the
surrounding authorities each show self-containment above 70%, as shown by the green coloured cells.
2.40 The definition for a Housing Market Area sets out that it is the area “where most of those changing
house without changing employment choose to stay”. Unfortunately, no data is available that relates
migration with changes in employment circumstances; but given that most working people will live
relatively close to their job, it is reasonable to assume that those migrants moving longer distances will
tend to also change their place of work.

Opinion Research Services | Gateshead & Newcastle upon Tyne Strategic Housing Market Assessment 2017 August 2017
33
Figure 13: Previous Area of Residence (12 months prior to Census) by Current Area of Residence (Source: 2011 Census of
Population)
Moves to the LA which originated within the LA
Moves from the LA to another property within the LA
Gateshead 64.0% 65.6%
Newcastle upon Tyne 64.3% 68.5%
North Tyneside 65.9% 66.4%
Northumberland 71.7% 71.9%
South Tyneside 76.3% 75.3%
Sunderland 77.5% 75.6%
County Durham 72.8% 74.6%
Travel to Work Patterns 2.41 Whilst housing market areas are defined predominantly in terms of the areas “where most of those
changing house without changing employment choose to stay”, it is also relevant to consider them in
the context of “...the geographical area in which a substantial majority of the employed population
both live and work”. It is therefore important to consider the extent to which the resident population
work in the area and the workplace population live in the area.
2.42 The ONS use a 75.0% target for self-containment within Travel To Work areas, but it is worth noting
that their threshold is 66.7% (for areas that have a working population in excess of 25,000 workers)
and this provides a useful framework. Figure 14 shows the proportions of residents who live and work
in each local authority.
2.43 The first column in Figure 14 shows the proportion of those who work in each local authority who are
residents of the same local authority. Of the three authorities, Gateshead and Newcastle upon Tyne
fall considerably short of the threshold with 53.4% and 47.3% respectively of workers being residents,
while North Tyneside approaches but does not meet the threshold with 61.6% of workers being also
being residents.
2.44 The second column shows the proportion of working residents of each local authority who also work in
the same authority. Of the three authorities, Gateshead approaches but does meet the threshold with
53.6%, Newcastle upon Tyne exceeds the threshold with 67.4% and North Tyneside falls considerably
short of the threshold, with 54.3% of working residents who work in the area.
2.45 The Travel to Work data indicates that none of the three authorities of Gateshead, Newcastle upon
Tyne and North Tyneside can be considered to be self-contained. In contrast, again, it can be seen that
all but one of the neighbouring local authorities exceed the threshold of 66.7% on both measures and
most exceed the target of 75.0%. The exception is South Tyneside which has only 56.1% of working
residents who work in the local authority area.
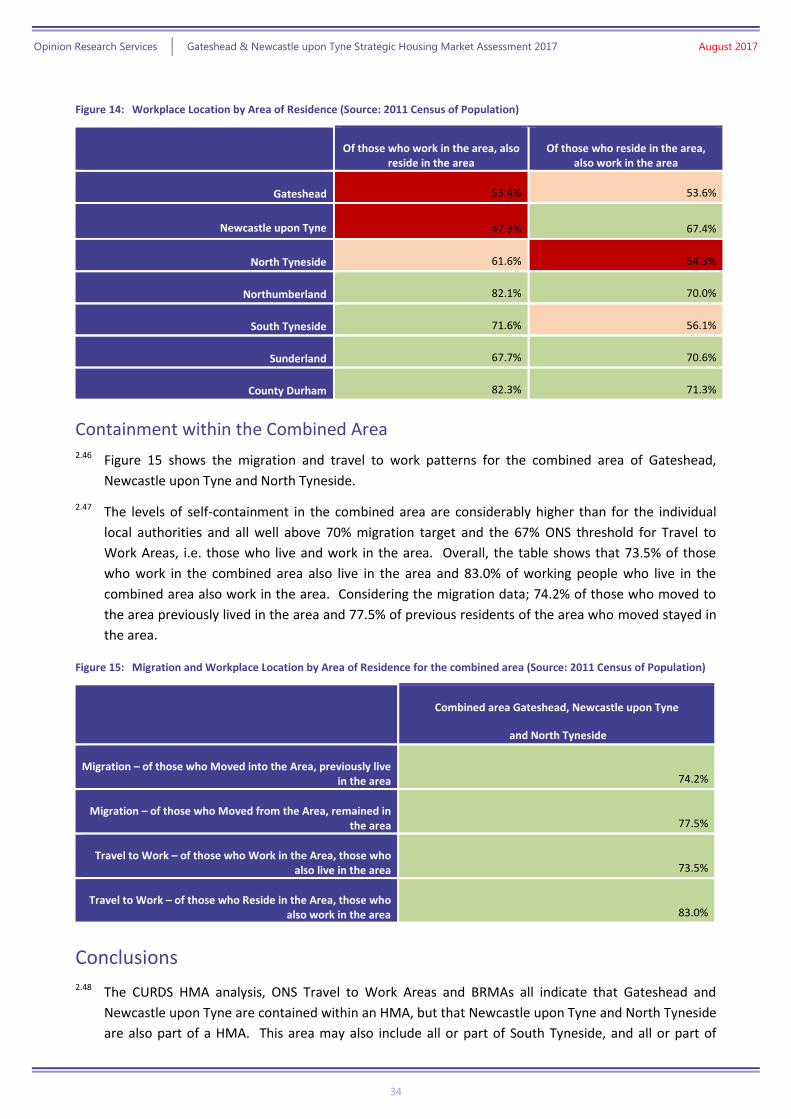
Opinion Research Services | Gateshead & Newcastle upon Tyne Strategic Housing Market Assessment 2017 August 2017
34
Figure 14: Workplace Location by Area of Residence (Source: 2011 Census of Population)
Of those who work in the area, also reside in the area
Of those who reside in the area, also work in the area
Gateshead 53.4% 53.6%
Newcastle upon Tyne 47.3% 67.4%
North Tyneside 61.6% 54.3%
Northumberland 82.1% 70.0%
South Tyneside 71.6% 56.1%
Sunderland 67.7% 70.6%
County Durham 82.3% 71.3%
Containment within the Combined Area 2.46 Figure 15 shows the migration and travel to work patterns for the combined area of Gateshead,
Newcastle upon Tyne and North Tyneside.
2.47 The levels of self-containment in the combined area are considerably higher than for the individual
local authorities and all well above 70% migration target and the 67% ONS threshold for Travel to
Work Areas, i.e. those who live and work in the area. Overall, the table shows that 73.5% of those
who work in the combined area also live in the area and 83.0% of working people who live in the
combined area also work in the area. Considering the migration data; 74.2% of those who moved to
the area previously lived in the area and 77.5% of previous residents of the area who moved stayed in
the area.
Figure 15: Migration and Workplace Location by Area of Residence for the combined area (Source: 2011 Census of Population)
Combined area Gateshead, Newcastle upon Tyne
and North Tyneside
Migration – of those who Moved into the Area, previously live in the area 74.2%
Migration – of those who Moved from the Area, remained in the area 77.5%
Travel to Work – of those who Work in the Area, those who also live in the area 73.5%
Travel to Work – of those who Reside in the Area, those who also work in the area 83.0%
Conclusions 2.48 The CURDS HMA analysis, ONS Travel to Work Areas and BRMAs all indicate that Gateshead and
Newcastle upon Tyne are contained within an HMA, but that Newcastle upon Tyne and North Tyneside
are also part of a HMA. This area may also include all or part of South Tyneside, and all or part of

Opinion Research Services | Gateshead & Newcastle upon Tyne Strategic Housing Market Assessment 2017 August 2017
35
Northumberland. The ONS Travel to Work Areas includes the northern part of Durham in the HMA.
There is no indication of a significant housing market connection to Sunderland.
2.49 The migration and commuting data demonstrate self-containment in the combined area of Gateshead
and Newcastle upon Tyne and also in the area of North Tyneside and Newcastle upon Tyne which
exceeds the migration and travel to work targets for self-containment. This implies that Gateshead,
Newcastle upon Tyne and North Tyneside fall within one HMA, despite relatively weak connections
between Gateshead and North Tyneside.
2.50 The same data for each of the neighbouring local authorities also exceeds the migration and travel to
work targets for self-containment. The most recent SHMAs carried out for neighbouring local
authorities have concluded that it is justifiable for each of Durham, Northumberland, South Tyneside
and Sunderland to be considered as separate stand-alone HMAs for Local Plan policy purposes. While
there are some indications of an economic connection between Sunderland and Tyneside, this is not
reflected in a connection between the Sunderland and Tyneside authorities HMAs. The most recent
SHMA for North Tyneside concludes that North Tyneside is contained within an HMA which also
contains Newcastle upon Tyne.
2.51 In conclusion, the three authorities of Gateshead, Newcastle upon Tyne and North Tyneside can be
considered to be contained within a single HMA centred on Newcastle upon Tyne, as shown in Figure
16, although the connections between Gateshead and North Tyneside are relatively weak.
Figure 16: Map of the HMA Area
2.52 In practical terms, OAN assessments do not necessarily have to be undertaken together. This
conclusion is supported by the fact that OANs have been produced for North Tyneside, South
Tyneside, Northumberland and Durham.
2.53 On this point though, the North Tyneside Local Plan has been through Examination in Public and was
adopted on 20th July 2017. An advisory note from the Inspector states from paragraphs 2-8 that

Opinion Research Services | Gateshead & Newcastle upon Tyne Strategic Housing Market Assessment 2017 August 2017
36
2. I am satisfied that for the purposes of this Local Plan, North Tyneside is an appropriate Housing
Market Area (HMA). However, there are notable functional interactions with neighbouring districts,
especially Newcastle upon Tyne City, to which regard must be given.
3. It is appropriate that the starting point for the FOAN is the latest 2014-based CLG household
projections which set out a base requirement of 707 dwellings per annum.
4. In accordance with the PPG1 an adjustment should be made to this base figure to reflect the PG-
10yr alternative trend scenario to take account of particular long-term migration trends in the wider
area. However, this should be tempered to reflect the establishing wider strategy to manage,
amongst other things, sustainable commuting patterns. Accordingly, I would advise that the
demographic baseline be adjusted to 727 dwellings per annum on this basis.
5. I am satisfied that no further adjustment is required to take account of employment trends having
regard to the evidence on jobs-led scenarios and sensitivities. In my view, 727 dwellings per annum
would, in itself, be sufficient to support the aspirational but realistic average annual jobs growth
anticipated in the Borough.
6. At this stage I would advise the commuting ratio assumption in the SENS3 medium jobs-led
scenario to be reasonable. I am not presently persuaded that it would suppress the economic growth
strategy of the Plan. Furthermore, it is arguable that any upward adjustments of the demographic
OAN for local trends, and affordability, would reasonably ensure an appropriate, proportionate and
deliverable level of dwelling growth that would support local economic growth.
7. Having regard to the PPG2 I would advise that the planned supply of housing should be increased
by an amount expected to improve affordability given the evidence on House Price Ratios and Rental
Affordability Ratios.
8. The parties have generally accepted the 10% LPEG figure, but my advice is that the LPEG report is
neither policy nor guidance. In my view 10% should be regarded as a maximum figure and a lower %
over the Plan period3 may well be reasonable which would point to a FOAN of no more than 790.
2.54 Therefore, North Tyneside have an adopted Local Plan which is based upon a relatively high rate of
growth. On this basis we consider that it appropriate to conduct this study on behalf of Gateshead and
Newcastle upon Tyne alone without seeking to calculate needs for North Tyneside. The North
Tyneside Core Strategy seeks to accommodate North Tyneside’s OAN in full within their borough
boundary. Therefore, they are not seeking for either Gateshead or Newcastle upon Tyne to
accommodate any of North Tyneside’s housing needs. On this basis, separate figures have been
produced for each of the Gateshead and Newcastle upon Tyne rather than a single set of figures for
the HMA which includes Gateshead, Newcastle upon Tyne and North Tyneside.
2.55 In respect of producing a OAN for Gateshead and Newcastle upon Tyne:
» The evidence points to Gateshead, Newcastle upon Tyne and North Tyneside being a
single HMA, despite the connections between Gateshead and North Tyneside being
relatively weak.
» The NPPF requires that local planning authorities should ensure that the full OAN for their
HMA is delivered, not that the whole HMA has to be covered by a single housing market
assessment. Local authorities should; “use their evidence base to ensure that their Local
Plan meets the full, objectively assessed needs for market and affordable housing in the

Opinion Research Services | Gateshead & Newcastle upon Tyne Strategic Housing Market Assessment 2017 August 2017
37
housing market area…” (paragraph 47), and; “Public bodies have a duty to cooperate on
planning issues that cross administrative boundaries.” (paragraph 178).
» The three authorities of Gateshead, Newcastle upon Tyne each have an OAN produced
within the previous 5 years and therefore all needs within a notional HMA which is co-
terminus with those three authorities can assume to have been assessed.
» The three authorities need to work closely together under Duty to Co-operate to ensure
all the assessed needs within that notional HMA are met.
» This report presents the OAN for Gateshead Council and Newcastle upon Tyne City council
areas.
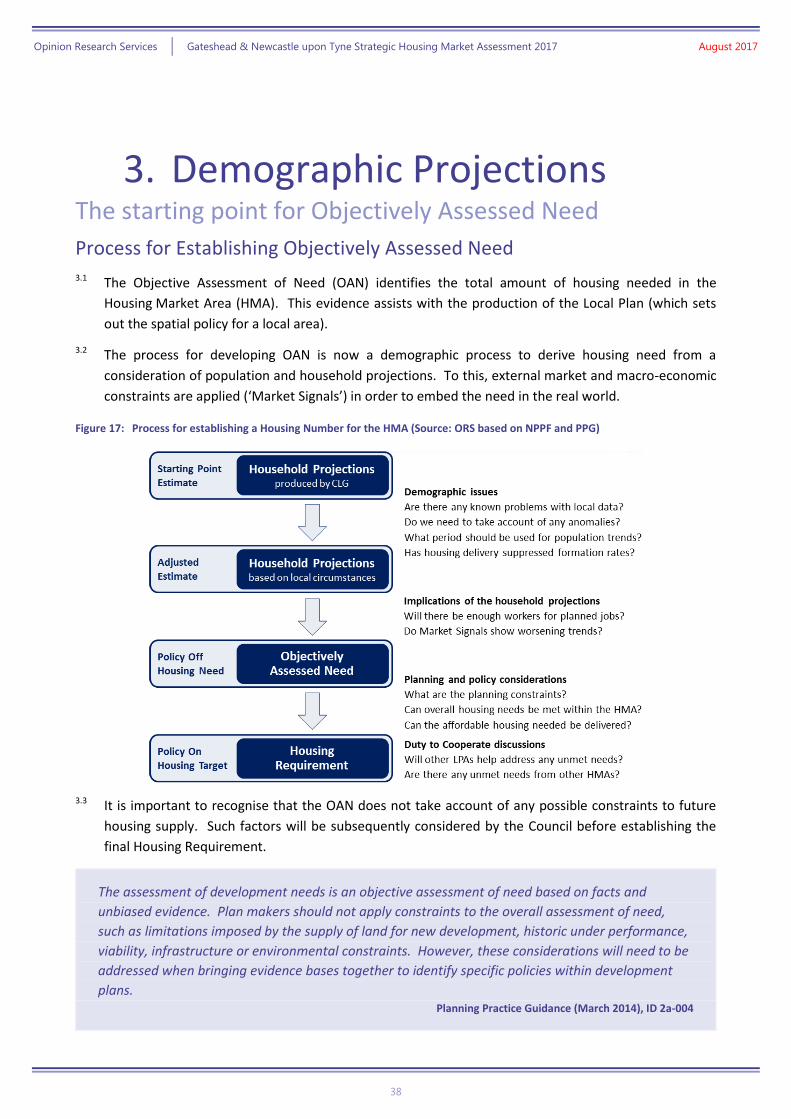
Opinion Research Services | Gateshead & Newcastle upon Tyne Strategic Housing Market Assessment 2017 August 2017
38
3. Demographic Projections The starting point for Objectively Assessed Need
Process for Establishing Objectively Assessed Need 3.1 The Objective Assessment of Need (OAN) identifies the total amount of housing needed in the
Housing Market Area (HMA). This evidence assists with the production of the Local Plan (which sets
out the spatial policy for a local area).
3.2 The process for developing OAN is now a demographic process to derive housing need from a
consideration of population and household projections. To this, external market and macro-economic
constraints are applied (‘Market Signals’) in order to embed the need in the real world.
Figure 17: Process for establishing a Housing Number for the HMA (Source: ORS based on NPPF and PPG)
3.3 It is important to recognise that the OAN does not take account of any possible constraints to future
housing supply. Such factors will be subsequently considered by the Council before establishing the
final Housing Requirement.
The assessment of development needs is an objective assessment of need based on facts and
unbiased evidence. Plan makers should not apply constraints to the overall assessment of need,
such as limitations imposed by the supply of land for new development, historic under performance,
viability, infrastructure or environmental constraints. However, these considerations will need to be
addressed when bringing evidence bases together to identify specific policies within development
plans. Planning Practice Guidance (March 2014), ID 2a-004

Opinion Research Services | Gateshead & Newcastle upon Tyne Strategic Housing Market Assessment 2017 August 2017
39
Gateshead and Newcastle upon Tyne Joint Core Strategy 2010-30 3.4 The Gateshead and Newcastle upon Tyne Joint Core Strategy 2010-30 identifies a total need for 30,000
dwellings across the two authorities. However, these figures were not evenly distributed across the 20
year period. Figure 18 shows the estimated distribution of the housing target across the 15 year
period starting in 2015. This shows an annual need for Gateshead over the period 2015-30 of 535
dwellings per annum and 1,040 dwellings per annum for Newcastle upon Tyne for the same period.
The Plan was adopted relatively recently, in March 2015, and should therefore be considered up-to-
date. Accordingly, all subsequent figures in this section should be seen in light of the existing housing
targets for the two authorities.
Figure 18: Gatesheand and Newcastle upon Tyne Existing Housing Targets (Source: gatershead and Newcastle upon Tyne Joint
Core Strategy)
2015-2020 2020-2025 2025-2030 Total 2015-30
Gateshead 2,420 4,020 1,580 8,020
Newcastle upon Tyne 4,800 5,400 5,400 15,600
Total 7,220 9,420 6,980 23,620
Official Population and Household Projections 3.5 Planning Practice Guidance places emphasis on the role of CLG Household Projections as the
appropriate starting point in determining objectively assessed need. PPG was updated in February
2015 following the publication of the 2012-based Household Projections, but has yet to be updated to
reflect the publication of the 2014-based Household Projections.
Household projections published by the Department for Communities and Local Government should
provide the starting point estimate of overall housing need.
The household projections are produced by applying projected household representative rates to the
population projections published by the Office for National Statistics.
Planning Practice Guidance (March 2014), ID 2a-015
The 2012-2037 Household Projections were published on 27 February 2015, and are the most up-to-
date estimate of future household growth.
Planning Practice Guidance (March 2015), ID 2a-016
3.6 Given this context, Figure 19 sets out the 2014-based and 2012-based household projections that CLG
has produced for Gateshead and Newcastle upon Tyne. It is clear that the projections have varied over
time, with the projected increase in households in Gateshead ranging from 400 up to 480 additional
households each year and the projected increase in households in Newcastle upon Tyne ranging from
770 up to 1,060. Each set of household projections will be influenced by a wide range of underlying
data and trend-based assumptions, and it is important to consider the range of projected growth and
not simply defer to the most recent data.

Opinion Research Services | Gateshead & Newcastle upon Tyne Strategic Housing Market Assessment 2017 August 2017
40
Figure 19: CLG Household Projections for Gateshead and Newcastle upon Tyne: annual average growth (Source: CLG Household
Projections)
2014-based 2012-based
10 years 2014-24
25 years 2014-39
10 years 2012-22
25 years 2012-37
Gateshead 440 400 480 430
Newcastle upon Tyne 1,060 970 770 770
3.7 The CLG 2014-based household projections show an increase of 400 households each year in
Gateshead over the 25-year period 2014-39, and a marginally higher rate (440 p.a.) in the initial 10-
year period. These figures project forward over the normal 25-year period and supersede the 2012-
based household projections (which projected a household growth of 430 per year from 2012-37).
3.8 In Newcastle upon Tyne the CLG 2014-based household projections show an increase of 970
households each year over the 25-year period 2014-39, and a marginally higher rate (1,060 p.a.) in the
initial 10-year period. The 2012-based household projections show a growth of 770 households per
year (from 2012-37).
3.9 The differences for each authority are due to changes in the ONS population projections (Figure 20) on
which the CLG household projections are based and changes to household representative rates
(considered later in this chapter).
3.10 Across the plan period both authorities are projected to show substantial growth in households. For
Gateshead the 2014-based household projections show an increase from 90,226 to 96,632 households
over the 15-year Plan period 2015-30 and we can establish that the “starting point estimate of overall
housing need” for the Plan period in Gateshead should therefore be based on an overall growth of
6,406 households, equivalent to an average of 427 households per year.
3.11 In Newcastle upon Tyne the 2014-based household projections show an increase from 122,424 to
137,471 households over the 15-year Plan period 2015-30. This represents an overall growth of
15,047 households over the Plan period and this can be established as the “starting point estimate of
overall housing need”, equivalent to an average of 1,003 households per year.
Official Population Projections 3.12 Figure 20 and Figure 21 show the outputs from the latest (2014-based) ONS Sub National Population
Projections together with the previous projections that have informed the various CLG household
projections (though note that CLG did not produce household projections based on the 2010-based
SNPP).
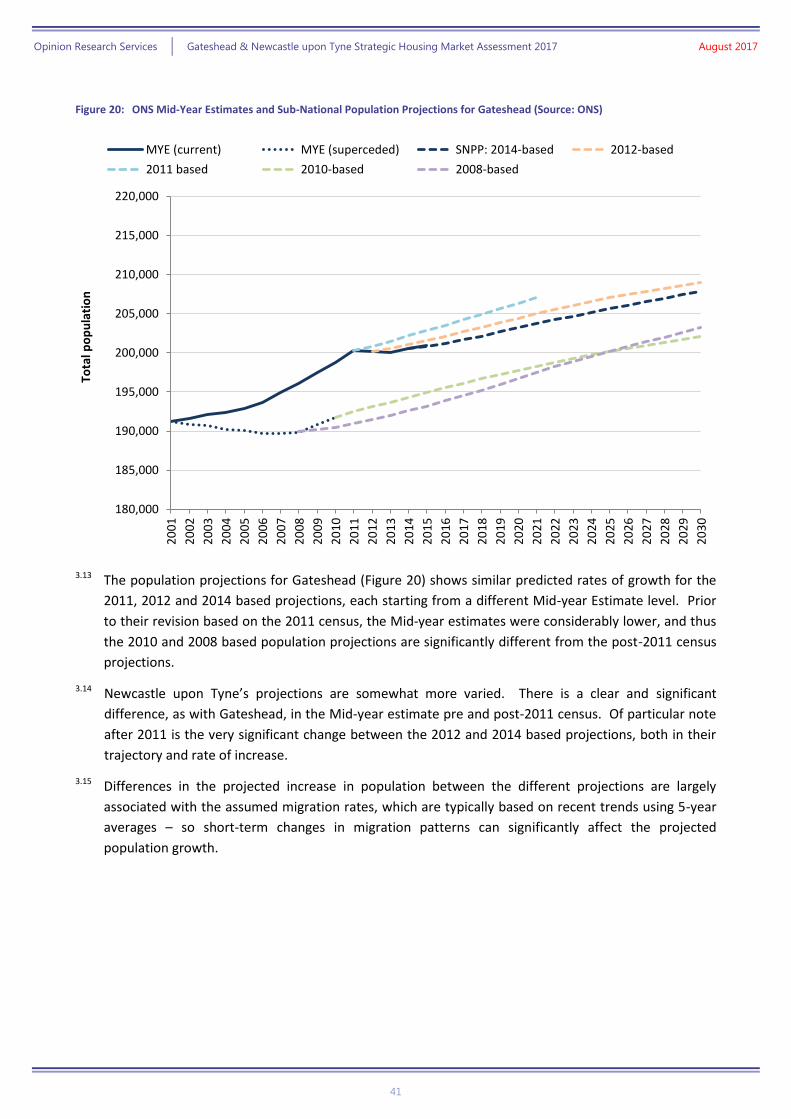
Opinion Research Services | Gateshead & Newcastle upon Tyne Strategic Housing Market Assessment 2017 August 2017
41
Figure 20: ONS Mid-Year Estimates and Sub-National Population Projections for Gateshead (Source: ONS)
3.13 The population projections for Gateshead (Figure 20) shows similar predicted rates of growth for the
2011, 2012 and 2014 based projections, each starting from a different Mid-year Estimate level. Prior
to their revision based on the 2011 census, the Mid-year estimates were considerably lower, and thus
the 2010 and 2008 based population projections are significantly different from the post-2011 census
projections.
3.14 Newcastle upon Tyne’s projections are somewhat more varied. There is a clear and significant
difference, as with Gateshead, in the Mid-year estimate pre and post-2011 census. Of particular note
after 2011 is the very significant change between the 2012 and 2014 based projections, both in their
trajectory and rate of increase.
3.15 Differences in the projected increase in population between the different projections are largely
associated with the assumed migration rates, which are typically based on recent trends using 5-year
averages – so short-term changes in migration patterns can significantly affect the projected
population growth.
180,000
185,000
190,000
195,000
200,000
205,000
210,000
215,000
220,000
20
01
20
02
20
03
20
04
20
05
20
06
20
07
20
08
20
09
20
10
20
11
20
12
20
13
20
14
20
15
20
16
20
17
20
18
20
19
20
20
20
21
20
22
20
23
20
24
20
25
20
26
20
27
20
28
20
29
20
30
Tota
l po
pu
lati
on
MYE (current) MYE (superceded) SNPP: 2014-based 2012-based
2011 based 2010-based 2008-based

Opinion Research Services | Gateshead & Newcastle upon Tyne Strategic Housing Market Assessment 2017 August 2017
42
Figure 21: ONS Mid-Year Estimates and Sub-National Population Projections for Newcastle upon Tyne (Source: ONS)
Population and Household Projections based on Local Circumstances 3.16 Whilst PPG identifies CLG household projections as the starting point for establishing housing need, it
also recognises the need to consider sensitivity testing this data and take account of local evidence.
Plan makers may consider sensitivity testing, specific to their local circumstances, based on
alternative assumptions in relation to the underlying demographic projections and household
formation rates. Account should also be taken of the most recent demographic evidence including
the latest Office of National Statistics population estimates
Any local changes would need to be clearly explained and justified on the basis of established
sources of robust evidence.
Planning Practice Guidance (March 2014), ID 2a-017
3.17 Given that the demographic projections are trend-based, one of the most critical factors is the period
over which those trends are based. The PAS OAN technical advice note considers this issue in relation
to the ONS population projections (first edition, paragraphs 5.12-5.13):
“To predict migration between local authorities within the UK, the ONS population projections
carry forward the trends of the previous five years. This choice of base period can be critical to
the projection, because for many areas migration has varied greatly over time. … The results
of a demographic projection for (say) 2011-31 will be highly sensitive to the reference period
that the projection carries forward.”
250,000
260,000
270,000
280,000
290,000
300,000
310,000
320,000
330,000
20
01
20
02
20
03
20
04
20
05
20
06
20
07
20
08
20
09
20
10
20
11
20
12
20
13
20
14
20
15
20
16
20
17
20
18
20
19
20
20
20
21
20
22
20
23
20
24
20
25
20
26
20
27
20
28
20
29
20
30
Tota
l po
pu
lati
on
MYE (current) MYE (superceded) SNPP: 2014-based 2012-based
2011 based 2010-based 2008-based

Opinion Research Services | Gateshead & Newcastle upon Tyne Strategic Housing Market Assessment 2017 August 2017
43
3.18 This issue has also been reinforced in PAS advice to Local Authorities12, where it has been emphasised
that whilst the CLG household projections provide the starting point, these official projections can be
very unstable given that they are based on migration trends covering only five years:
“For migration the base period is only five years:
• Makes the official projections very unstable
• And recent projections lock in the recession”
3.19 The second version of the PAS OAN technical advice note (July 2015)13 has also strengthened the
recommendation on the relevant period for assessing migration (second edition, paragraph 6.24):
“In assessing housing need it is generally advisable to test alternative scenarios based on a
longer reference period, probably starting with the 2001 Census (further back in history data
may be unreliable). Other things being equal, a 10-to-15 year base period should provide
more stable and more robust projections than the ONS’s five years. But sometimes other
things will not be equal, because the early years of this long period included untypical one-
off events as described earlier. If so, a shorter base period despite its disadvantages could be
preferable.”
3.20 The relevant period for assessing migration trends was considered by an article by Ludi Simpson
(Professor of Population Studies at the University of Manchester) and Neil MacDonald (previously
Chief Executive of the National Housing and Planning Advice Unit) published in Town and Country
Planning (April 2015)14.
“The argument for using a five-year period rather than a longer one is that the shorter the
period, the more quickly changes in trends are picked up. The counter-argument is that a
shorter period is more susceptible to cyclical trends, an argument that has particular force
when the five-year period in question – 2007-12 – neatly brackets the deepest and longest
economic downturn for more than a generation. … A large number of local authority areas
are affected by this issue. For 60% of authorities the net flow of migrants within the UK in
2007-12 was different by more than 50% from the period 2002-07. While this is comparing a
boom period with a recession, it serves to indicate the impact of the choice of reference
period for trend projections.”
3.21 The issue has also been referenced by Inspectors examining numerous Local Plans, for example the
following comments provided by the Cornwall Inspector in the letter setting out his preliminary
findings (June 2015)15:
“3.6 Migration. The demographic model used in the SHMNA and the more recent ONS
projection uses migration flows from the previous 5 years only. Given the significance of
migration as a component of change for Cornwall and to even-out the likely effect of the
recent recession on migration between 2008-2012 a longer period than 5 years would give a
more realistic basis for projecting this component. A period of 10-12 years was suggested at
the hearing and I consider that this would be reasonable, rather than the 17 year period
used in ID.01.CC.3.3. I also consider that the ONS’ Unattributable Population Change
12 “SHLAA, SHMA and OAN aka ‘Pobody’s Nerfect’”, PAS presentation at Urban Design London (July 2015) http://learningspace.urbandesignlondon.com/course/view.php?id=339 13 http://www.pas.gov.uk/documents/332612/6549918/OANupdatedadvicenote/f1bfb748-11fc-4d93-834c-a32c0d2c984d 14 “Making sense of the new English household projections”, Town and Country Planning (April 2015) 15 https://www.cornwall.gov.uk/media/12843214/ID05-Preliminary-Findings-June-2015-2-.pdf

Opinion Research Services | Gateshead & Newcastle upon Tyne Strategic Housing Market Assessment 2017 August 2017
44
component should be assigned to international migration for the reasons given by Edge
Analytics in ID.01.CC3.3. This approach was not disputed at the hearing.”
3.22 On balance, we consider that:
» 5-year trend migration scenarios are less reliable: they have the potential to roll-forward
short-term trends that are unduly high or low and therefore are unlikely to provide a robust
basis for long-term planning.
» 10-year trend migration scenarios are more likely to capture both highs and lows and are not
as dependent on trends that may be unlikely to be repeated. Therefore, we favour using 10-
year migration trends as the basis for our analysis.
3.23 This SHMA has, therefore, produced additional projections based on long-term migration trends as
part of the analysis. Whilst no one scenario will provide a definitive assessment of the future
population; considering demographic projections where migration is based on long-term trends
provides a more appropriate basis on which to consider future housing need.
3.24 Given the inherent uncertainties associated with the estimates of migration flows within the ONS Mid-
Year Estimates, it is important to consider changes recorded for the most recent inter-censal period
(2001-11) as the data for inter-censal periods is far more robust than other 10-year periods, especially
in areas where there are UPC issues identified. This approach was supported by the Inspector
examining the Core Strategy for Bath and North East Somerset. His report16 concluded (paragraphs
42-43):
“Given the uncertainties inherent in some of the data, particularly for flows of migrants
internationally, a 10 year period is a reasonable approach … The inter-censal period provides
a readily understandable and robust check on the reasonableness of the average of about
550 per year for migration and other change used in the ORS model. Thus I consider that the
ORS mid-trend population projection is a reasonable demographic projection.”
3.25 Nevertheless, it is also important to recognise long-term trends in migration patterns which could
suggest that future migration patterns may differ from those over the period 2001-11.
3.26 This document has therefore produced additional projections using a range of scenarios that have
been derived as part of the analysis. It is important to recognise that no one scenario will provide a
definitive assessment of the future population; but taken collectively the different scenarios can help
determine the most likely range of projections.
Reviewing the Official Population Estimates - Gateshead 3.27 Figure 22 shows the current and historic mid-year population estimates and Census estimates for
Gateshead over the period since 1981. The census data suggests that the borough’s population
decreased moderately over the period 1981-2001 but showed subsequent growth over the following
decade (2001-2011).
3.28 After the 2001 census, the ONS Mid-Year Estimates were then revised accordingly, accounting for the
disparity, illustrated in Figure 22, in the dotted line and the solid (revised current) Mid-Year estimates
around 2001.
16 Report on the Examination into Bath and North East Somerset Council’s Core Strategy (June 2014)

Opinion Research Services | Gateshead & Newcastle upon Tyne Strategic Housing Market Assessment 2017 August 2017
45
3.29 ONS Mid-Year Estimates for the period since 2001 originally showed a moderate decrease in
population between 2001-2008, followed by a period of slight growth between 2008 and 2010.
However, the 2011 Census suggested that there were many more people living in Gateshead than had
previously been estimated. The ONS therefore revised upwards the previous estimates to reflect the
new Census data, with higher levels of growth assumed for the period 2001-2011 in particular. Since
2011, the population estimates have been relatively flat.
Figure 22: Official population estimates for Gateshead for the period 1981-2015 (Source: UK Census of Population 1981, 1991,
2001 and 2011; ONS Mid-Year Estimates, including data since superseded)
Components of Population Change 3.30 Changes in the population can be broadly classified into two categories: natural change in the
population (in terms of births and deaths) and changes due to migration, both in terms of international
migration and also moves within the UK. In addition to these changes, the ONS Mid-Year Estimates
include adjustments for other changes, the largest of which is often “Unattributable Population
Change”. This is an accountancy adjustment that enables the final population estimate to be
constrained to external data sources which are normally more reliable, such as the Census.
180,000
185,000
190,000
195,000
200,000
205,000
210,000
215,000
220,000
1981 1986 1991 1996 2001 2006 2011 2015
Tota
l po
pu
lati
on
Census MYE (current) MYE (superseded)

Opinion Research Services | Gateshead & Newcastle upon Tyne Strategic Housing Market Assessment 2017 August 2017
46
Figure 23: Components of population change (Source: ONS Mid-Year Population Estimates, revised)
3.31 It is evident from Figure 23 that natural change remained relatively consistent over the period 1992-
2004, averaging 214 fewer persons each year. More recently, rates (2005-2015) have consistently
showed a gain, averaging 224 persons annually; with a higher number of births and fewer deaths
recorded. Migration and other changes vary much more – ranging from a net loss of 1300 persons
recorded for 1997-98 up to a single annual net gain of 1178 persons recorded for 2010-2011. Overall,
this is an annual average gain of 482 persons each year over the period 1991-2015 due to migration
and other changes based on official ONS Mid-Year Population Estimates. Also note that the period in
between 2001 and 2011 showed a sustained increase averaging 917 persons a year, with 837 of these
attributable to migration.
3.32 Whilst it is relatively straightforward to measure natural population change, it is much more difficult to
measure migration. Furthermore, the number of migrants can vary substantially from year to year;
and relatively small changes in gross flows can have a significant impact on overall net migration, and
it is recognised that the impact of international migration has been particularly difficult to measure;
and although current estimates have been improved, some historic data can be unreliable.
Unattributable Population Change
3.33 Given that the ONS consider the population estimates in 2001 and 2011 to be more robust than the
component of change data from year-to-year, an “accountancy” adjustment is factored into the
components of change to correct this data and ensure that it reconciles with the population estimates
for the two Census years. Therefore, in addition to the known population flows, an element of
“Unattributable Population Change” (UPC) is included in these figures.
3.34 Figure 24 presents the underlying data from the components of annual population change over the
period 1991 to 2015 including UPC.
-2000
-1500
-1000
-500
0
500
1000
1500
20001
99
1-9
2
19
92
-93
19
93
-94
19
94
-95
19
95
-96
19
96
-97
19
97
-98
19
98
-99
19
99
-00
20
00
-01
20
01
-02
20
02
-03
20
03
-04
20
04
-05
20
05
-06
20
06
-07
20
07
-08
20
08
-09
20
09
-10
20
10
-11
20
11
-12
20
12
-13
20
13
-14
20
14
-15
Ne
t p
op
ula
tio
n c
han
ge
Natural change Migration and other changes Total change
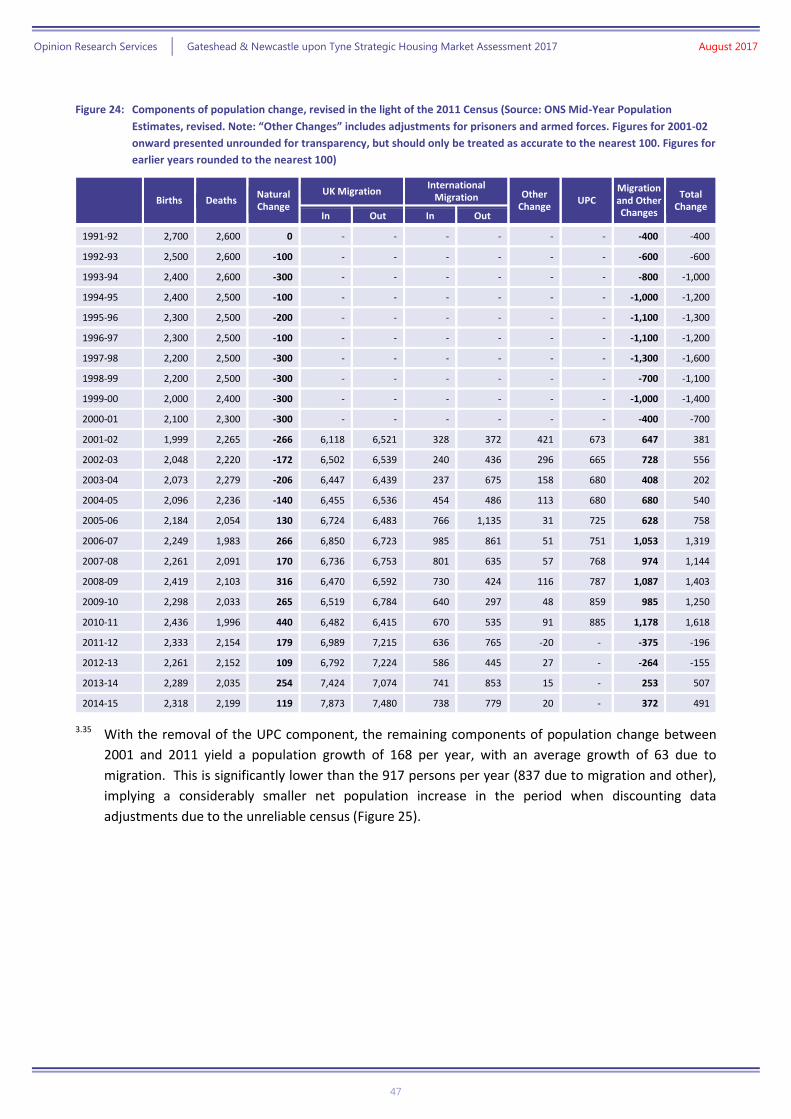
Opinion Research Services | Gateshead & Newcastle upon Tyne Strategic Housing Market Assessment 2017 August 2017
47
Figure 24: Components of population change, revised in the light of the 2011 Census (Source: ONS Mid-Year Population
Estimates, revised. Note: “Other Changes” includes adjustments for prisoners and armed forces. Figures for 2001-02
onward presented unrounded for transparency, but should only be treated as accurate to the nearest 100. Figures for
earlier years rounded to the nearest 100)
Births Deaths Natural Change
UK Migration International
Migration Other Change UPC
Migration and Other Changes
Total Change
In Out In Out
1991-92 2,700 2,600 0 - - - - - - -400 -400
1992-93 2,500 2,600 -100 - - - - - - -600 -600
1993-94 2,400 2,600 -300 - - - - - - -800 -1,000
1994-95 2,400 2,500 -100 - - - - - - -1,000 -1,200
1995-96 2,300 2,500 -200 - - - - - - -1,100 -1,300
1996-97 2,300 2,500 -100 - - - - - - -1,100 -1,200
1997-98 2,200 2,500 -300 - - - - - - -1,300 -1,600
1998-99 2,200 2,500 -300 - - - - - - -700 -1,100
1999-00 2,000 2,400 -300 - - - - - - -1,000 -1,400
2000-01 2,100 2,300 -300 - - - - - - -400 -700
2001-02 1,999 2,265 -266 6,118 6,521 328 372 421 673 647 381
2002-03 2,048 2,220 -172 6,502 6,539 240 436 296 665 728 556
2003-04 2,073 2,279 -206 6,447 6,439 237 675 158 680 408 202
2004-05 2,096 2,236 -140 6,455 6,536 454 486 113 680 680 540
2005-06 2,184 2,054 130 6,724 6,483 766 1,135 31 725 628 758
2006-07 2,249 1,983 266 6,850 6,723 985 861 51 751 1,053 1,319
2007-08 2,261 2,091 170 6,736 6,753 801 635 57 768 974 1,144
2008-09 2,419 2,103 316 6,470 6,592 730 424 116 787 1,087 1,403
2009-10 2,298 2,033 265 6,519 6,784 640 297 48 859 985 1,250
2010-11 2,436 1,996 440 6,482 6,415 670 535 91 885 1,178 1,618
2011-12 2,333 2,154 179 6,989 7,215 636 765 -20 - -375 -196
2012-13 2,261 2,152 109 6,792 7,224 586 445 27 - -264 -155
2013-14 2,289 2,035 254 7,424 7,074 741 853 15 - 253 507
2014-15 2,318 2,199 119 7,873 7,480 738 779 20 - 372 491
3.35 With the removal of the UPC component, the remaining components of population change between
2001 and 2011 yield a population growth of 168 per year, with an average growth of 63 due to
migration. This is significantly lower than the 917 persons per year (837 due to migration and other),
implying a considerably smaller net population increase in the period when discounting data
adjustments due to the unreliable census (Figure 25).

Opinion Research Services | Gateshead & Newcastle upon Tyne Strategic Housing Market Assessment 2017 August 2017
48
Figure 25: Components of population change without the inclusion of UPC (Source: ONS Mid-Year Population Estimates,
revised)
3.36 It is evident that the UPC adjustment was typically an increase of around 650-900 persons each year (a
total of 7,473 persons over the 10-year period) which was needed to reconcile the component of
change data with the Census population estimates for 2001 and 2011.
3.37 The ONS “Report on Unattributable Population Change” (ONS, January 2014)17 notes (page 3):
“The UPC is likely to be due to a combination of sampling variability, or other issues, in the
following:
– International migration estimates
– Census estimates, both 2001 and 2011
– Internal migration estimates (at subnational level only)”
3.38 The large correction to Mid-Year estimates that the 2001 census engendered, along with the increase
of almost 7,500 unattributable persons between 2001 and 2011, to then return to a flat state after
2011, implies that OND estimates of population change in Gateshead may not have been accurate in
the past and may be continuing to display problems now.
Estimating Population Change with Other Data 3.39 Since the census data has proven to be unreliable, we have examined other data to try to accurately
determine the population. Highly correlated with the degree of population increase is a similar
increase in the number of people on the patient register. The number of people on the patient
register does not necessarily equal the true population of an area, as many non-residents can be
included for a variety of reasons.
3.40 Figure 26 below shows the correlation between the patient register and MYE for every local authority
in England between 2011 and 2015. This shows that the patient register in Gateshead has been
growing much more strongly than the rate of change in the MYE in the period 2011-15. This is
17 http://www.ons.gov.uk/ons/about-ons/get-involved/consultations-and-user-surveys/consultations/consultation-on-the-2012-based-subnational-population-projections-for-england/snpp-consult-upc.pdf
-600
-400
-200
0
200
400
600
800
20
01
-02
20
02
-03
20
03
-04
20
04
-05
20
05
-06
20
06
-07
20
07
-08
20
08
-09
20
09
-10
20
10
-11
20
11
-12
20
12
-13
20
13
-14
20
14
-15
Ne
t p
op
ula
tio
n c
han
ge
Natural change Migration and other changes Total change
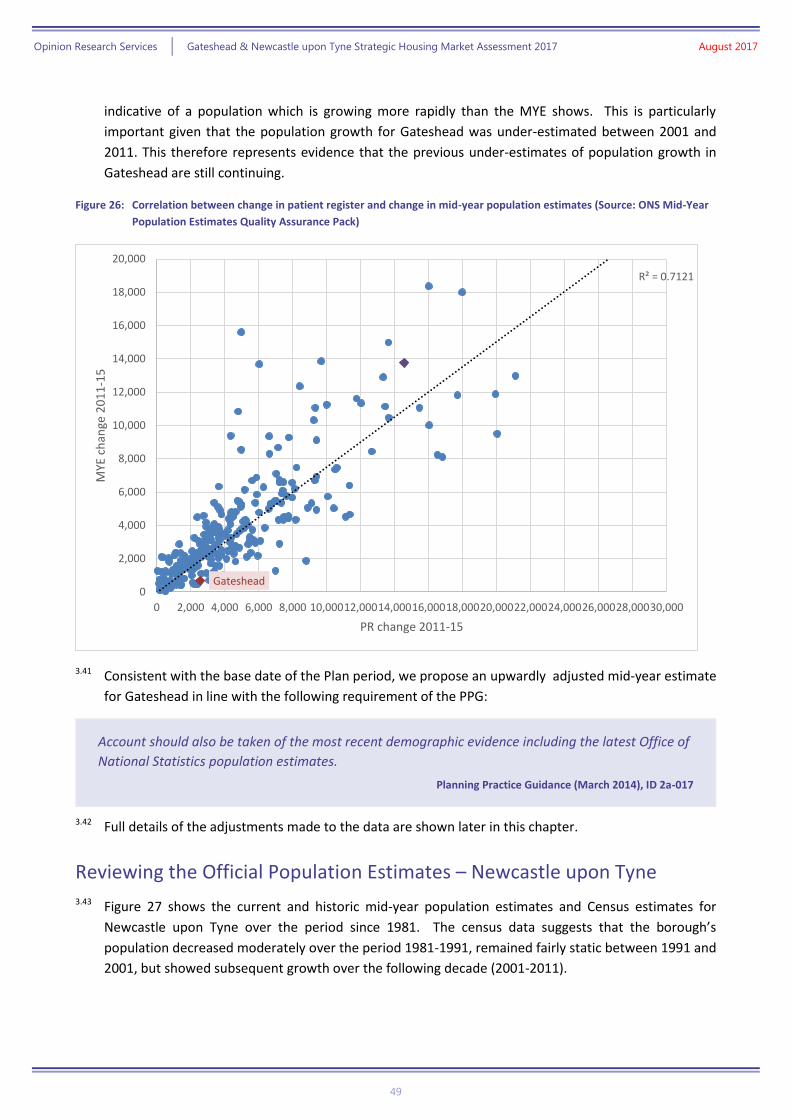
Opinion Research Services | Gateshead & Newcastle upon Tyne Strategic Housing Market Assessment 2017 August 2017
49
indicative of a population which is growing more rapidly than the MYE shows. This is particularly
important given that the population growth for Gateshead was under-estimated between 2001 and
2011. This therefore represents evidence that the previous under-estimates of population growth in
Gateshead are still continuing.
Figure 26: Correlation between change in patient register and change in mid-year population estimates (Source: ONS Mid-Year
Population Estimates Quality Assurance Pack)
3.41 Consistent with the base date of the Plan period, we propose an upwardly adjusted mid-year estimate
for Gateshead in line with the following requirement of the PPG:
Account should also be taken of the most recent demographic evidence including the latest Office of
National Statistics population estimates.
Planning Practice Guidance (March 2014), ID 2a-017
3.42 Full details of the adjustments made to the data are shown later in this chapter.
Reviewing the Official Population Estimates – Newcastle upon Tyne 3.43 Figure 27 shows the current and historic mid-year population estimates and Census estimates for
Newcastle upon Tyne over the period since 1981. The census data suggests that the borough’s
population decreased moderately over the period 1981-1991, remained fairly static between 1991 and
2001, but showed subsequent growth over the following decade (2001-2011).
Gateshead
R² = 0.7121
0
2,000
4,000
6,000
8,000
10,000
12,000
14,000
16,000
18,000
20,000
0 2,000 4,000 6,000 8,000 10,00012,00014,00016,00018,00020,00022,00024,00026,00028,00030,000
MYE
ch
ange
20
11
-15
PR change 2011-15

Opinion Research Services | Gateshead & Newcastle upon Tyne Strategic Housing Market Assessment 2017 August 2017
50
3.44 The census data from 2001 was called into question by the ONS18. Their report found (paragraphs 3
and 4):
“Newcastle upon Tyne -upon-Tyne was selected for detailed analysis as part of the local
authority population studies, as it was identified as an area where there was a significant risk of
an under-estimate of the population by the 2001 Census.”
“After consideration of all the evidence, the population of Newcastle upon Tyne -upon-Tyne in
2001 was re-estimated, and it was concluded that the Census had under-estimated the
population by 5,305.”
3.45 ONS Mid-Year Estimates were then revised accordingly. The Mid-Year Estimates have been
consistently somewhat higher than the pre-2011 census estimates since 1981, implying a systematic
issue with the census’ reliability in the Newcastle upon Tyne area.
3.46 ONS Mid-Year Estimates for the period since 2001 (dotted line in Figure 27) showed a rapid and
accelerating increase in population between 2001 and 2010. However, the 2011 Census suggested
that there were fewer people living in the borough than had previously been estimated. The ONS
therefore revised downwards the previous estimates to reflect the new Census data, with lower levels
of growth assumed for the period 2007-2010 in particular.
Figure 27: Official population estimates for the period 1981-2015 (Source: UK Census of Population 1981, 1991, 2001 and 2011;
ONS Mid-Year Estimates, including data since superseded)
Components of Population Change 3.47 Changes in the population can be broadly classified into two categories: natural change in the
population (in terms of births and deaths) and changes due to migration, both in terms of international
migration and also moves within the UK. In addition to these changes, the ONS Mid-Year Estimates
include adjustments for other changes, the largest of which is often “Unattributable Population
Change”. This is an accountancy adjustment that enables the final population estimate to be
constrained to external data sources which are normally more reliable, such as the Census.
18
2004 Local Authority studies - Analysis of data and evidence for Newcastle upon Tyne – ONS 2004
250,000
255,000
260,000
265,000
270,000
275,000
280,000
285,000
290,000
295,000
300,000
1981 1986 1991 1996 2001 2006 2011 2015
Tota
l po
pu
lati
on
Census MYE (current) MYE (superseded)

Opinion Research Services | Gateshead & Newcastle upon Tyne Strategic Housing Market Assessment 2017 August 2017
51
Figure 28: Components of population change (Source: ONS Mid-Year Population Estimates, revised)
3.48 It is evident from Figure 23 that natural change remained relatively consistent over the period 1991-
2005, averaging a decline of 53 persons each year. More recently rates (2005-2015) have increased,
consistently exceeding 300 persons annually, with an average increase of 800, (with many years
exceeding 1,000); as a higher number of births and fewer deaths have been recorded. Migration and
other changes vary much more – ranging from a net loss of 3500 persons recorded for 1997-98 up to a
single annual net gain of 3,900 persons recorded for 1992-1993; with an annual average gain of
433 persons each year over the period 1991-2015 due to migration and other changes based on
official ONS Mid-Year Population Estimates.
3.49 Whilst it is relatively straightforward to measure natural population change, it is much more difficult to
measure migration. Furthermore, the number of migrants can vary substantially from year to year;
and relatively small changes in gross flows can have a significant impact on overall net migration, and
it is recognised that the impact of international migration has been particularly difficult to measure;
and although current estimates have been improved, some historic data can be unreliable.
Unattributable Population Change
3.50 Given that the ONS consider the population estimates in 2001 and 2011 to be more robust than the
component of change data from year-to-year, an “accountancy” adjustment is factored into the
components of change to correct this data and ensure that it reconciles with the population estimates
for the two Census years. Therefore, in addition to the known population flows, an element of
“Unattributable Population Change” (UPC) is included in these figures.
3.51 Figure 29 presents the underlying data from the components of annual population change over the
period 1991 to 2015 including UPC.
-5000
-4000
-3000
-2000
-1000
0
1000
2000
3000
4000
50001
99
1-9
2
19
92
-93
19
93
-94
19
94
-95
19
95
-96
19
96
-97
19
97
-98
19
98
-99
19
99
-00
20
00
-01
20
01
-02
20
02
-03
20
03
-04
20
04
-05
20
05
-06
20
06
-07
20
07
-08
20
08
-09
20
09
-10
20
10
-11
20
11
-12
20
12
-13
20
13
-14
20
14
-15
Ne
t p
op
ula
tio
n c
han
ge
Natural change Migration and other changes Total change

Opinion Research Services | Gateshead & Newcastle upon Tyne Strategic Housing Market Assessment 2017 August 2017
52
Figure 29: Components of population change, revised in the light of the 2011 Census (Source: ONS Mid-Year Population
Estimates, revised. Note: “Other Changes” includes adjustments for prisoners and armed forces. Figures for 2001-02
onward presented unrounded for transparency, but should only be treated as accurate to the nearest 100. Figures for
earlier years rounded to the nearest 100)
Births Deaths Natural Change
UK Migration International
Migration Other Change UPC
Migration and Other Changes
Total Change
In Out In Out
1991-92 3,700 3,500 200 - - - - - - 3,500 3,700
1992-93 3,600 3,500 100 - - - - - - 3,900 4,000
1993-94 3,400 3,500 -100 - - - - - - -1,500 -1,600
1994-95 3,500 3,500 0 - - - - - - 100 100
1995-96 3,200 3,300 -100 - - - - - - -300 -400
1996-97 3,300 3,300 0 - - - - - - -2,800 -2,700
1997-98 3,100 3,300 -200 - - - - - - -3,500 -3,700
1998-99 2,900 3,200 -300 - - - - - - -3,200 -3,500
1999-00 2,900 3,100 -200 - - - - - - -3,200 -3,400
2000-01 2,800 3,000 -200 - - - - - - -1,200 -1,400
2001-02 2,941 3,009 -68 16,055 16,659 2,994 2,051 1,313 -824 828 760
2002-03 2,945 2,981 -36 16,197 16,324 2,376 2,463 913 -802 -103 -139
2003-04 2,894 2,866 28 16,864 16,299 3,116 3,311 435 -811 -6 22
2004-05 2,917 2,783 134 17,086 17,217 5,089 1,816 230 -782 2,590 2,724
2005-06 3,145 2,808 337 17,197 17,618 5,918 4,555 156 -785 313 650
2006-07 3,182 2,617 565 16,911 18,652 6,368 3,261 166 -778 754 1,319
2007-08 3,321 2,702 619 16,945 19,152 5,181 3,076 302 -747 -547 72
2008-09 3,357 2,635 722 17,472 19,117 5,405 2,238 287 -758 1,051 1,773
2009-10 3,496 2,504 992 17,324 18,943 6,249 1,749 129 -743 2,267 3,259
2010-11 3,487 2,461 1,026 17,260 18,738 5,930 2,565 251 -753 1,385 2,411
2011-12 3,380 2,375 1,005 19,450 18,951 4,624 2,814 36 - 2,345 3,350
2012-13 3,427 2,351 1,076 18,892 18,945 5,407 2,052 1 - 3,303 4,379
2013-14 3,383 2,340 1,043 20,003 20,139 5,612 3,511 6 - 1,971 3,014
2014-15 3,287 2,676 611 19,326 19,811 6,137 3,217 2 - 2,437 3,048
3.52 With the removal of the UPC component, the remaining components of population change between
2001 and 2011 yield a population of 2,460 per year, with an average of 1,884 due to migration. This is
significantly higher than the 1,903 persons per year (1,327 due to migration and other), implying a
considerably larger net population increase in the period when discounting data adjustments due to
the unreliable census (Figure 30).
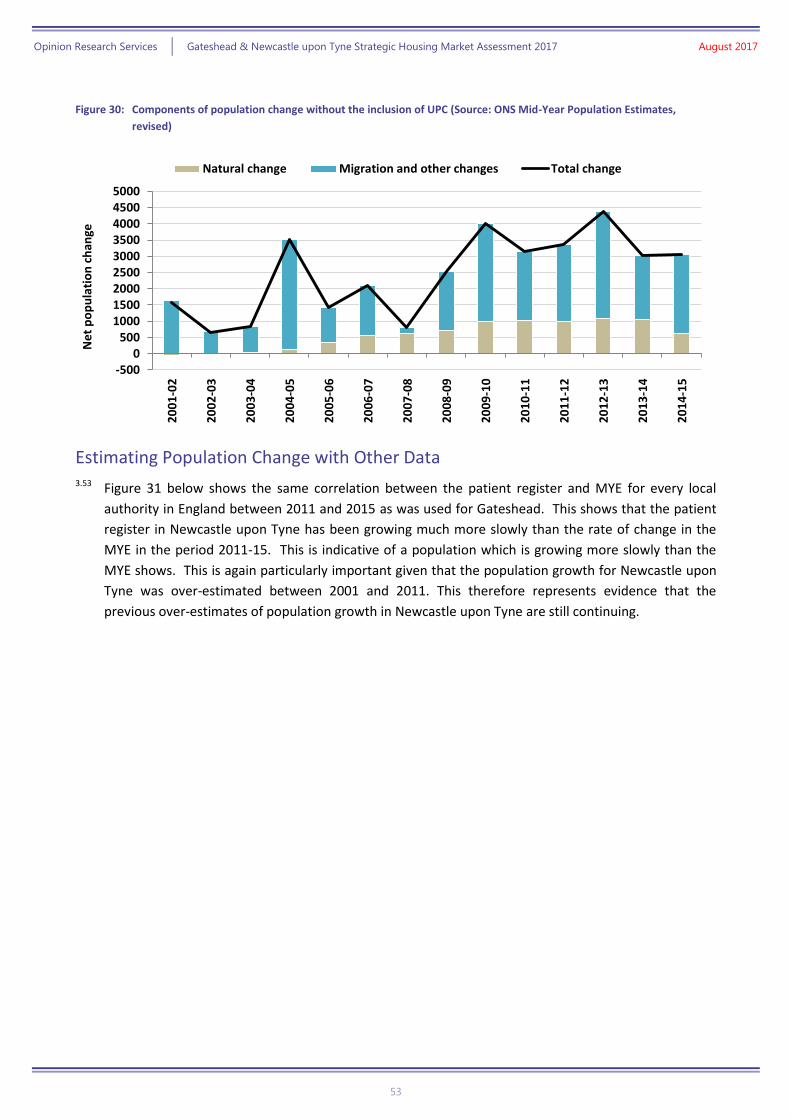
Opinion Research Services | Gateshead & Newcastle upon Tyne Strategic Housing Market Assessment 2017 August 2017
53
Figure 30: Components of population change without the inclusion of UPC (Source: ONS Mid-Year Population Estimates,
revised)
Estimating Population Change with Other Data 3.53 Figure 31 below shows the same correlation between the patient register and MYE for every local
authority in England between 2011 and 2015 as was used for Gateshead. This shows that the patient
register in Newcastle upon Tyne has been growing much more slowly than the rate of change in the
MYE in the period 2011-15. This is indicative of a population which is growing more slowly than the
MYE shows. This is again particularly important given that the population growth for Newcastle upon
Tyne was over-estimated between 2001 and 2011. This therefore represents evidence that the
previous over-estimates of population growth in Newcastle upon Tyne are still continuing.
-5000
500100015002000250030003500400045005000
20
01
-02
20
02
-03
20
03
-04
20
04
-05
20
05
-06
20
06
-07
20
07
-08
20
08
-09
20
09
-10
20
10
-11
20
11
-12
20
12
-13
20
13
-14
20
14
-15
Ne
t p
op
ula
tio
n c
han
ge
Natural change Migration and other changes Total change

Opinion Research Services | Gateshead & Newcastle upon Tyne Strategic Housing Market Assessment 2017 August 2017
54
Figure 31: Correlation between change in patient register and change in mid-year population estimates (Source: ONS Mid-Year
Population Estimates Quality Assurance Pack)
3.54 We again therefore propose an adjusted mid-year estimate in line with the following requirement of
the PPG:
Student Housing and the OAN 3.55 PPG was updated in March 2015 to include specific reference to identifying the needs of students:
Local planning authorities should plan for sufficient student accommodation whether it consists of
communal halls of residence or self-contained dwellings, and whether or not it is on campus.
Student housing provided by private landlords is often a lower-cost form of housing. Encouraging
more dedicated student accommodation may provide low cost housing that takes pressure off the
private rented sector and increases the overall housing stock. Plan makers are encouraged to
consider options which would support both the needs of the student population as well as local
residents before imposing caps or restrictions on students living outside of university-provided
accommodation. Plan makers should engage with universities and other higher educational
establishments to better understand their student accommodation requirements.
Planning Practice Guidance 2014, paragraph 21
3.56 The key Higher Education Providers (HEP) in the Gateshead and Newcastle upon Tyne area are the
University of Newcastle upon Tyne and the University of Northumbria. In 2005, the universities had a
total of 34,200 students, but this had risen to 42,600 by 2015 as shown in Figure 32.
Newcastle upon Tyne
R² = 0.7121
0
2,000
4,000
6,000
8,000
10,000
12,000
14,000
16,000
18,000
20,000
0 2,000 4,000 6,000 8,000 10,00012,00014,00016,00018,00020,00022,00024,00026,00028,00030,000
MYE
ch
ange
20
11
-15
PR change 2011-15

Opinion Research Services | Gateshead & Newcastle upon Tyne Strategic Housing Market Assessment 2017 August 2017
55
Figure 32: Student Growth in Newcastle upon Tyne (Source: Council Records)
Year University of Newcastle University of
Northumberland Total
2000/01 12,969 12.302 25,271
2001/02 13,365 13,554 26,919
2002/03 14,328 14,667 28,995
2003/04 14,825 15,723 30,548
2004/05 16,056 16,170 32,226
2005/06 17.629 16,564 34,193
2006/07 18,741 17,162 35,903
2007/08 18,761 17,317 36,078
2008/09 19,953 17,428 37,381
2009/10 20,841 19,012 39,853
2010/11 21,083 19,551 40,634
2011/12 21,000 19,112 40,112
2012/13 21,144 19,160 40,304
2013/14 21,541 20,358 41,899
2014/15 42,565
3.57 The issue of student growth was addressed in the Joint Core Strategy19 and the key assumption made
is that student numbers in the City, particularly numbers of international students, have reached a
plateau. In establishing the OAN for an HMA, students typically would be included in the trend-based
analysis; therefore the needs of student households are counted as part of the overall OAN.
3.58 In practice student numbers in Newcastle upon Tyne have grown very rapidly over the period 2005-15
and hence would contribute heavily towards ONS’s projections of population. However, the
universities now expect little, if any, student growth in the future. Therefore, the trend based
projections would anticipate a growth in student numbers which is not expected to be replicated in
the future. Therefore, we have calculated the effect of students on the OAN through their impact on
migration and removed this migration growth from the demographic projections. Therefore the
demographic projections assume that no further growth in student number s occurs.
3.59 We would also note that the number of persons migrating between Newcastle upon Tyne and
Gateshead grew by 283 net from the 2001 Census to the 2011 Census. Therefore a net 283 more
persons left Newcastle upon Tyne to move to Gateshead. A possible explanation for this change is the
growth in student numbers in Newcastle upon Tyne which effectively displaced people who would
have otherwise remained in Newcastle upon Tyne and saw them move to Gateshead.
3.60 This effect is very difficult to check because of the issues with MYE mean by implication that there
must be issues with recent migration data for the two authorities. Therefore, any migration changes
between the two authorities cannot be checked accurately against recent migration data. On this
basis we have made an adjustment to the migration flows for each local authority to reduce net out-
migration from Newcastle upon Tyne to Gateshead in light of the expectation that student growth in
Newcastle upon Tyne will stop.
19 Gateshead and Newcastle upon Tyne Core Strategy and Urban Core Plan Student Household statement 11th June 2014

Opinion Research Services | Gateshead & Newcastle upon Tyne Strategic Housing Market Assessment 2017 August 2017
56
Summary of Population Projection Adjustments 3.61 In summary, for this SHMA we took the initial starting position of SNPP 2014 based, but made a
number of significant adjustments to this data:
» The starting point MYE 2015 was adjusted upwards for Gateshead and downwards for
Newcastle upon Tyne based on evidence from the patient register. In both cases the
adjustment mirrors issues with the population data from between 2001 and 2011. This
increases past and projected population growth in Gateshead and reduces it in Newcastle
upon Tyne;
» Migration trends were moved from 5 years in SNPP 2014 based to use 10 year migration
trends between 2005-15 to better reflect the long-term migration for both Gateshead and
Newcastle upon Tyne. This increase projected population growth in both authorities;
» A detailed analysis of the impact of students on the population and migration was
undertaken which showed that migration trends include a substantial growth in students,
but there is no expectation that this will continue in to the future. Therefore the net
impact of students has been removed from the migration data. This reduces population
growth in both authorities; and
» Net migration from Newcastle upon Tyne to Gateshead grew from 2001 to 2011, with a
contributing factor likely to be the impact of students on the housing market in Newcastle
upon Tyne. We have therefore reduced net out-migration from Newcastle upon Tyne to
Gateshead in the population projections. This increases population growth in Newcastle
upon Tyne and reduces it in Gateshead.
3.62 Figure 33 shows the impact of each change on the population projections for both Gateshead and
Newcastle upon Tyne. Each change represents a significant step, but should be seen as part of a wider
move to achieve robust projections for both authorities. It is noteworthy that both sets of final
population projections are higher than the starting point set out in 2014 based SNPP.
Figure 33: Summary of Effects of Adjustments on Population Projections for Gateshead and Newcastle upon Tyne for 2015-30
Year Gateshead Newcastle upon Tyne
Starting point 2014 based SNPP 2015-30 6,983 24,125
updated to 2005-15 on 2015 13,700 38,745
PR adjustment to starting (2015) population 16,451 36,414
Remove growth in Student numbers for future trend 13,799 26,438
Adjusting migration flows for Newcastle upon Tyne to reflect the impact of students
9,554 30,683
Establishing Population Projections 3.63 Figure 34 compares the 2014-based sub-national population projections (SNPP) (based on short-term
migration trends) with the SHMA projections based on longer-term migration trends, the Patient
Register and the MYE, over the 15-year period 2015-30 for Gateshead. The SNPP projections suggest
that the population will increase by 6,983 during this period, whilst the SHMA projections suggest a
growth of 9,554 persons over the same time.

Opinion Research Services | Gateshead & Newcastle upon Tyne Strategic Housing Market Assessment 2017 August 2017
57
Figure 34: Gateshead population projection based on 10 year migration trends and other adjustments
Figure 35: Gateshead population projections 2015-30 by gender and 5-year age cohort based on 2014-based SNPP and SHMA
projection with 10-year migration trend and other adjustments (Note: All figures presented unrounded for
transparency)
2014-based SNPP Adjusted Estimates with 10 year trend 2005-15 projection
2015 2030 2015 2030
M F Total M F Total M F Total M F Total
Aged 0-4 5,891 5,579 11,470 5,611 5,245 10,856 6,288 5,887 12,175 5,815 5,447 11,261
Aged 5-9 5,822 5,681 11,503 5,642 5,352 10,994 5,736 5,671 11,407 5,838 5,560 11,398
Aged 10-14 5,139 5,043 10,182 5,659 5,385 11,044 5,215 5,016 10,231 5,815 5,558 11,373
Aged 15-19 6,233 5,494 11,727 6,410 5,758 12,168 5,941 5,667 11,608 6,742 6,061 12,803
Aged 20-24 6,072 5,730 11,802 6,224 5,538 11,763 6,048 6,207 12,255 6,296 5,719 12,015
Aged 25-29 6,735 7,043 13,778 6,492 6,056 12,548 6,991 7,281 14,271 6,698 6,269 12,967
Aged 30-34 6,855 7,029 13,883 7,272 6,488 13,760 7,082 7,007 14,089 7,371 6,746 14,117
Aged 35-39 6,317 6,108 12,424 7,429 6,801 14,230 6,171 6,032 12,203 7,585 7,125 14,709
Aged 40-44 6,282 6,488 12,769 6,695 6,687 13,382 6,246 6,655 12,901 6,906 6,924 13,829
Aged 45-49 6,925 7,289 14,214 6,155 6,524 12,679 7,046 7,285 14,331 6,360 6,600 12,959
Aged 50-54 7,195 7,468 14,663 5,659 5,823 11,482 7,345 7,561 14,906 5,667 5,863 11,531
Aged 55-59 6,503 6,540 13,043 5,830 6,149 11,979 6,333 6,481 12,815 5,841 6,322 12,162
Aged 60-64 5,459 5,639 11,098 6,330 6,733 13,063 5,626 5,731 11,357 6,454 6,778 13,232
Aged 65-69 5,716 6,034 11,750 6,286 6,714 12,999 5,933 6,060 11,993 6,423 6,822 13,244
Aged 70-74 4,042 4,633 8,675 5,385 5,685 11,070 3,985 4,623 8,609 5,283 5,666 10,949
Aged 75-79 3,533 4,135 7,668 4,135 4,615 8,750 3,519 4,130 7,649 4,246 4,692 8,938
Aged 80-84 2,364 3,185 5,548 3,617 4,250 7,866 2,388 3,166 5,554 3,763 4,289 8,052
Aged 85+ 1,659 2,937 4,596 3,019 4,125 7,145 1,696 3,049 4,745 2,985 4,125 7,110
Total 98,742 102,054 200,796 103,850 103,929 207,779 99,590 103,508 203,098 106,086 106,566 212,652
3.64 Figure 36 shows the equivalent figures for Newcastle upon Tyne over the 15-year period 2015-30. The
SNPP projections suggest that the population will increase by 24,125 during this period, whilst the
SHMA projections suggest a growth of 30,683 persons over the same time.
190000
195000
200000
205000
210000
215000
2200002
00
1
20
02
20
03
20
04
20
05
20
06
20
07
20
08
20
09
20
10
20
11
20
12
20
13
20
14
20
15
20
16
20
17
20
18
20
19
20
20
20
21
20
22
20
23
20
24
20
25
20
26
20
27
20
28
20
29
20
30
Tota
l po
pu
lati
on
ONS MYE SNPP 2014 SHMA Estimate SHMA Projection
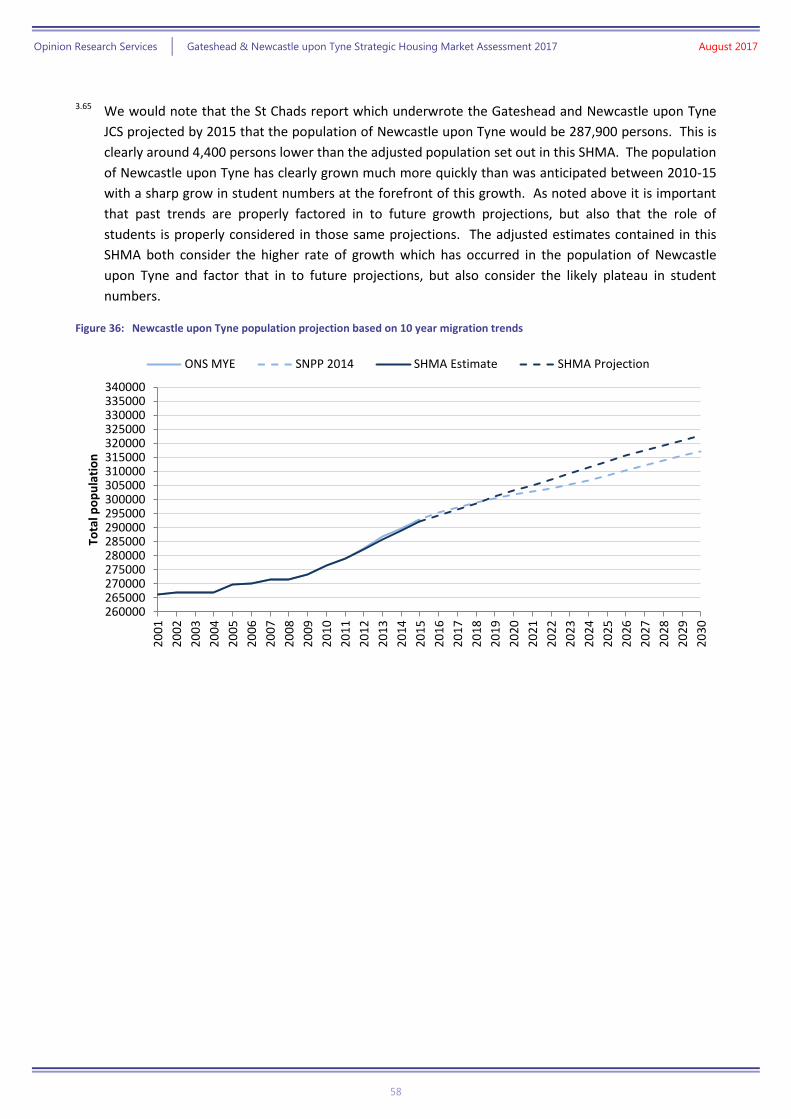
Opinion Research Services | Gateshead & Newcastle upon Tyne Strategic Housing Market Assessment 2017 August 2017
58
3.65 We would note that the St Chads report which underwrote the Gateshead and Newcastle upon Tyne
JCS projected by 2015 that the population of Newcastle upon Tyne would be 287,900 persons. This is
clearly around 4,400 persons lower than the adjusted population set out in this SHMA. The population
of Newcastle upon Tyne has clearly grown much more quickly than was anticipated between 2010-15
with a sharp grow in student numbers at the forefront of this growth. As noted above it is important
that past trends are properly factored in to future growth projections, but also that the role of
students is properly considered in those same projections. The adjusted estimates contained in this
SHMA both consider the higher rate of growth which has occurred in the population of Newcastle
upon Tyne and factor that in to future projections, but also consider the likely plateau in student
numbers.
Figure 36: Newcastle upon Tyne population projection based on 10 year migration trends
260000265000270000275000280000285000290000295000300000305000310000315000320000325000330000335000340000
20
01
20
02
20
03
20
04
20
05
20
06
20
07
20
08
20
09
20
10
20
11
20
12
20
13
20
14
20
15
20
16
20
17
20
18
20
19
20
20
20
21
20
22
20
23
20
24
20
25
20
26
20
27
20
28
20
29
20
30
Tota
l po
pu
lati
on
ONS MYE SNPP 2014 SHMA Estimate SHMA Projection
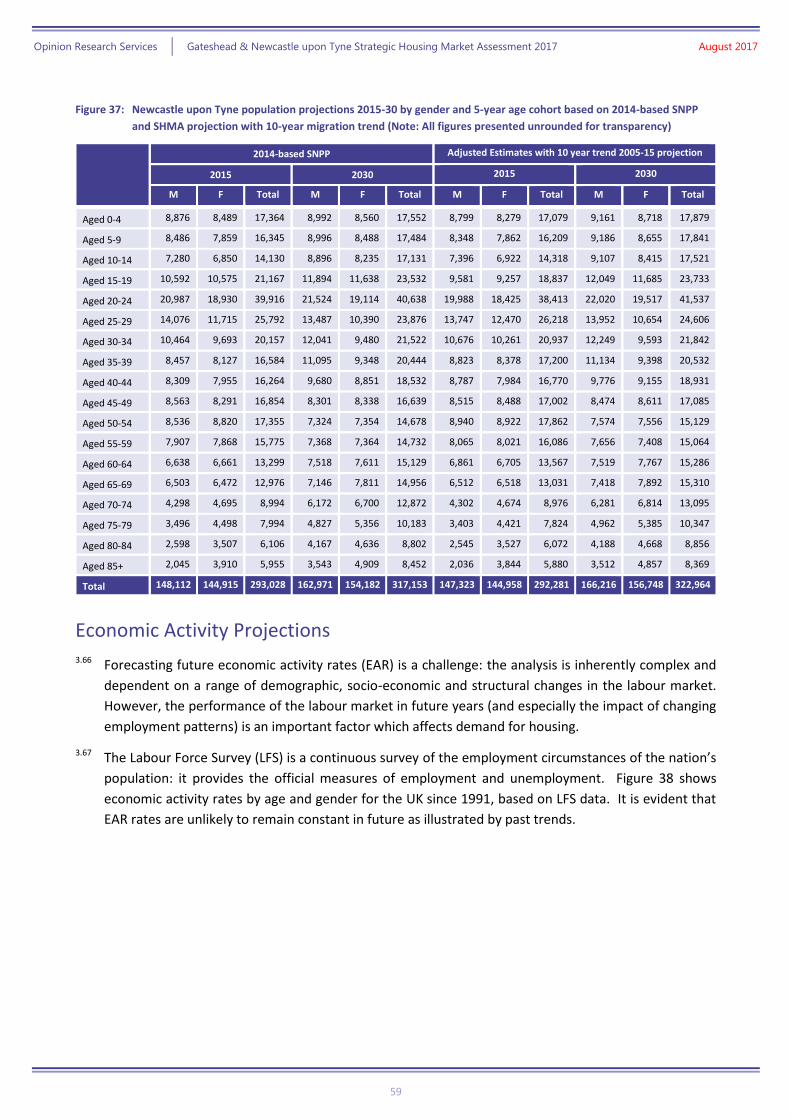
Opinion Research Services | Gateshead & Newcastle upon Tyne Strategic Housing Market Assessment 2017 August 2017
59
Figure 37: Newcastle upon Tyne population projections 2015-30 by gender and 5-year age cohort based on 2014-based SNPP
and SHMA projection with 10-year migration trend (Note: All figures presented unrounded for transparency)
2014-based SNPP Adjusted Estimates with 10 year trend 2005-15 projection
2015 2030 2015 2030
M F Total M F Total M F Total M F Total
Aged 0-4 8,876 8,489 17,364 8,992 8,560 17,552 8,799 8,279 17,079 9,161 8,718 17,879
Aged 5-9 8,486 7,859 16,345 8,996 8,488 17,484 8,348 7,862 16,209 9,186 8,655 17,841
Aged 10-14 7,280 6,850 14,130 8,896 8,235 17,131 7,396 6,922 14,318 9,107 8,415 17,521
Aged 15-19 10,592 10,575 21,167 11,894 11,638 23,532 9,581 9,257 18,837 12,049 11,685 23,733
Aged 20-24 20,987 18,930 39,916 21,524 19,114 40,638 19,988 18,425 38,413 22,020 19,517 41,537
Aged 25-29 14,076 11,715 25,792 13,487 10,390 23,876 13,747 12,470 26,218 13,952 10,654 24,606
Aged 30-34 10,464 9,693 20,157 12,041 9,480 21,522 10,676 10,261 20,937 12,249 9,593 21,842
Aged 35-39 8,457 8,127 16,584 11,095 9,348 20,444 8,823 8,378 17,200 11,134 9,398 20,532
Aged 40-44 8,309 7,955 16,264 9,680 8,851 18,532 8,787 7,984 16,770 9,776 9,155 18,931
Aged 45-49 8,563 8,291 16,854 8,301 8,338 16,639 8,515 8,488 17,002 8,474 8,611 17,085
Aged 50-54 8,536 8,820 17,355 7,324 7,354 14,678 8,940 8,922 17,862 7,574 7,556 15,129
Aged 55-59 7,907 7,868 15,775 7,368 7,364 14,732 8,065 8,021 16,086 7,656 7,408 15,064
Aged 60-64 6,638 6,661 13,299 7,518 7,611 15,129 6,861 6,705 13,567 7,519 7,767 15,286
Aged 65-69 6,503 6,472 12,976 7,146 7,811 14,956 6,512 6,518 13,031 7,418 7,892 15,310
Aged 70-74 4,298 4,695 8,994 6,172 6,700 12,872 4,302 4,674 8,976 6,281 6,814 13,095
Aged 75-79 3,496 4,498 7,994 4,827 5,356 10,183 3,403 4,421 7,824 4,962 5,385 10,347
Aged 80-84 2,598 3,507 6,106 4,167 4,636 8,802 2,545 3,527 6,072 4,188 4,668 8,856
Aged 85+ 2,045 3,910 5,955 3,543 4,909 8,452 2,036 3,844 5,880 3,512 4,857 8,369
Total 148,112 144,915 293,028 162,971 154,182 317,153 147,323 144,958 292,281 166,216 156,748 322,964
Economic Activity Projections 3.66 Forecasting future economic activity rates (EAR) is a challenge: the analysis is inherently complex and
dependent on a range of demographic, socio-economic and structural changes in the labour market.
However, the performance of the labour market in future years (and especially the impact of changing
employment patterns) is an important factor which affects demand for housing.
3.67 The Labour Force Survey (LFS) is a continuous survey of the employment circumstances of the nation’s
population: it provides the official measures of employment and unemployment. Figure 38 shows
economic activity rates by age and gender for the UK since 1991, based on LFS data. It is evident that
EAR rates are unlikely to remain constant in future as illustrated by past trends.

Opinion Research Services | Gateshead & Newcastle upon Tyne Strategic Housing Market Assessment 2017 August 2017
60
Figure 38: Economic Activity Rate long-term UK trends (Source: Labour Market Statistics based on Labour Force Survey)
3.68 There are a number of notable trends evident:
» Economic activity rates for people aged under 25 have steadily declined, primarily as a
consequence of the increased numbers remaining in full-time education;
» Economic activity rates for women in all groups aged 25+ have tended to increase, in
particular those aged 50-64 where the rate has increased by almost a third (from 49% to
65%); and
» Economic activity rates for men and women aged 50+ have tended to increase, in particular
over the period since 2001.
45
50
55
60
65
70
75
80
1991 1996 2001 2006 2011 2016
Male 16-24 Female 16-24
65
70
75
80
85
90
95
100
1991 1996 2001 2006 2011 2016
Male 25-34 Female 25-34
65
70
75
80
85
90
95
100
1991 1996 2001 2006 2011 2016
Male 35-49 Female 35-49
45
50
55
60
65
70
75
80
1991 1996 2001 2006 2011 2016
Male 50-64 Female 50-64
0
5
10
15
20
25
30
35
1991 1996 2001 2006 2011 2016
Male 65+ Female 65+

Opinion Research Services | Gateshead & Newcastle upon Tyne Strategic Housing Market Assessment 2017 August 2017
61
3.69 These changes in participation identified by the Labour Force Survey have been confirmed by Census
data, which also shows that national trends are typically reflected at a local level.
3.70 The most recent economic activity rate projections produced by ONS were published in January 2006
and covered the period to 202020; however these figures suggested substantially lower changes in
activity rates than actually experienced over the last decade. However, the performance of the labour
market is important for national government, particularly in terms of forecasting the long term
sustainability of tax revenues. As part of their scrutiny of Government finances, the Office for Budget
Responsibility (OBR) provide an independent and authoritative analysis of the UK’s public finances for
Government, which includes detailed analysis of past and future labour market trends21.
Labour Market Participation Projections 3.71 The labour market participation projections produced by the OBR are based on historic profiles of
different cohorts of the overall population – subsets that are grouped by year of birth and gender.
Their analysis is not based on simplistic trends but is designed to capture dynamics that are specific to
particular ages and those that cut across generations:
“We project each cohort into the future using age-specific labour market entry and exit rates
as they age across time. These exit and entry rates are generally held constant, although we
adjust entry rates for younger cohorts (discussed further below), and exit rates for people
approaching the State Pension age (SPA), since the SPA rises over our projection period.”
3.72 Their analysis concludes:
» Older people; economic activity rates of older people will increase in future years, mainly
from a combination of factors including changes to State Pension age, less generous final
salary pensions and increasing healthy longevity;
» Female participation; in addition to changes to state pension age, economic activity rates for
women will also increase due to cohort change: more women born in the 1980s will work
compared to those born in the 1970s across all comparable ages, and the rates for women
born in the 1970s will be higher than for those born in the 1960s and so on; and
» Young people; economic activity rates of younger people will stop declining, although young
people will continue to stay longer in education and the lower participation rates recently
observed are not assumed to increase in future.
Older People 3.73 Recent increases in State Pension age (SPA) are expected to prompt a labour market response as
people retiring at an older age will exit the labour market later. Recent research from the Institute for
Fiscal Studies (IFS) and University College London22 concluded that:
“Future increases in the state pension age will lead to a substantial increase in employment”.
3.74 However, the issue is complex: most people do not retire at the SPA precisely, and other factors
influence retirement decisions:
20 Projections of the UK labour force, 2006 to 2020 by Vassilis Madouros; published in ONS Labour Market Trends, January 2006 21 OBR Fiscal Sustainability Report, July 2014: http://cdn.budgetresponsibility.org.uk/41298-OBR-accessible.pdf 22 http://www.ifs.org.uk/pr/spa_pr_0313.pdf
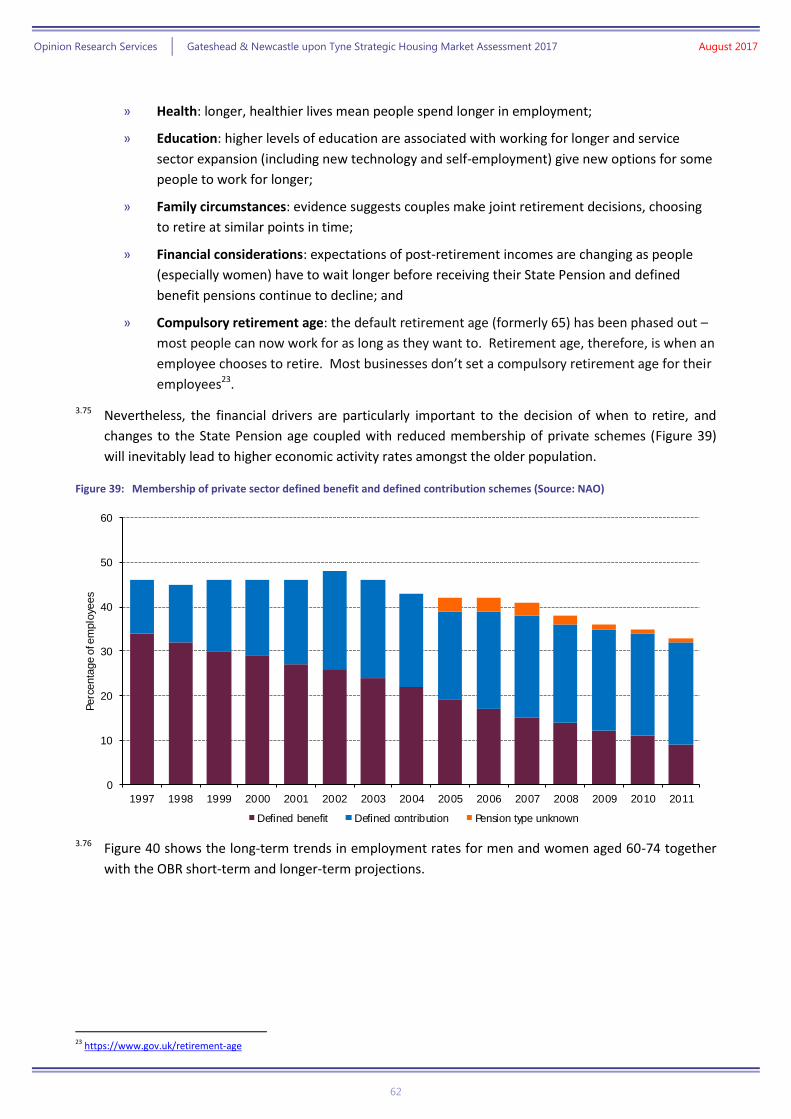
Opinion Research Services | Gateshead & Newcastle upon Tyne Strategic Housing Market Assessment 2017 August 2017
62
» Health: longer, healthier lives mean people spend longer in employment;
» Education: higher levels of education are associated with working for longer and service
sector expansion (including new technology and self-employment) give new options for some
people to work for longer;
» Family circumstances: evidence suggests couples make joint retirement decisions, choosing
to retire at similar points in time;
» Financial considerations: expectations of post-retirement incomes are changing as people
(especially women) have to wait longer before receiving their State Pension and defined
benefit pensions continue to decline; and
» Compulsory retirement age: the default retirement age (formerly 65) has been phased out –
most people can now work for as long as they want to. Retirement age, therefore, is when an
employee chooses to retire. Most businesses don’t set a compulsory retirement age for their
employees23.
3.75 Nevertheless, the financial drivers are particularly important to the decision of when to retire, and
changes to the State Pension age coupled with reduced membership of private schemes (Figure 39)
will inevitably lead to higher economic activity rates amongst the older population.
Figure 39: Membership of private sector defined benefit and defined contribution schemes (Source: NAO)
3.76 Figure 40 shows the long-term trends in employment rates for men and women aged 60-74 together
with the OBR short-term and longer-term projections.
23 https://www.gov.uk/retirement-age
0
10
20
30
40
50
60
1997 1998 1999 2000 2001 2002 2003 2004 2005 2006 2007 2008 2009 2010 2011
Perc
enta
ge o
f em
plo
yees
Defined benefit Defined contribution Pension type unknown
Source: NAO
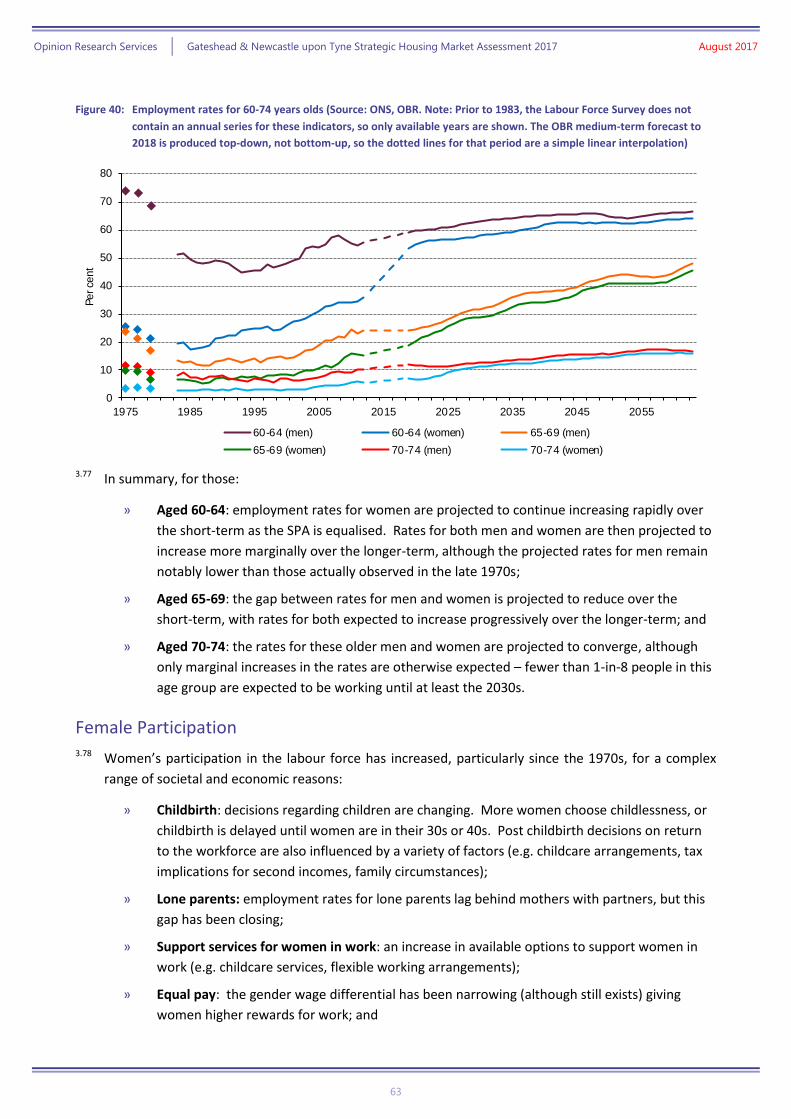
Opinion Research Services | Gateshead & Newcastle upon Tyne Strategic Housing Market Assessment 2017 August 2017
63
Figure 40: Employment rates for 60-74 years olds (Source: ONS, OBR. Note: Prior to 1983, the Labour Force Survey does not
contain an annual series for these indicators, so only available years are shown. The OBR medium-term forecast to
2018 is produced top-down, not bottom-up, so the dotted lines for that period are a simple linear interpolation)
3.77 In summary, for those:
» Aged 60-64: employment rates for women are projected to continue increasing rapidly over
the short-term as the SPA is equalised. Rates for both men and women are then projected to
increase more marginally over the longer-term, although the projected rates for men remain
notably lower than those actually observed in the late 1970s;
» Aged 65-69: the gap between rates for men and women is projected to reduce over the
short-term, with rates for both expected to increase progressively over the longer-term; and
» Aged 70-74: the rates for these older men and women are projected to converge, although
only marginal increases in the rates are otherwise expected – fewer than 1-in-8 people in this
age group are expected to be working until at least the 2030s.
Female Participation 3.78 Women’s participation in the labour force has increased, particularly since the 1970s, for a complex
range of societal and economic reasons:
» Childbirth: decisions regarding children are changing. More women choose childlessness, or
childbirth is delayed until women are in their 30s or 40s. Post childbirth decisions on return
to the workforce are also influenced by a variety of factors (e.g. childcare arrangements, tax
implications for second incomes, family circumstances);
» Lone parents: employment rates for lone parents lag behind mothers with partners, but this
gap has been closing;
» Support services for women in work: an increase in available options to support women in
work (e.g. childcare services, flexible working arrangements);
» Equal pay: the gender wage differential has been narrowing (although still exists) giving
women higher rewards for work; and
0
10
20
30
40
50
60
70
80
1975 1985 1995 2005 2015 2025 2035 2045 2055
Per ce
nt
60-64 (men) 60-64 (women) 65-69 (men)
65-69 (women) 70-74 (men) 70-74 (women)
Prior to 1983, the Labour Fource Survey does not containt an annual series for these indicators, so only available years are shown.
Our medium-term forecast is producted top-down, not bottom-up, so the dotted lines for that period are a simple linear interpolation.
Source: ONS, OBR
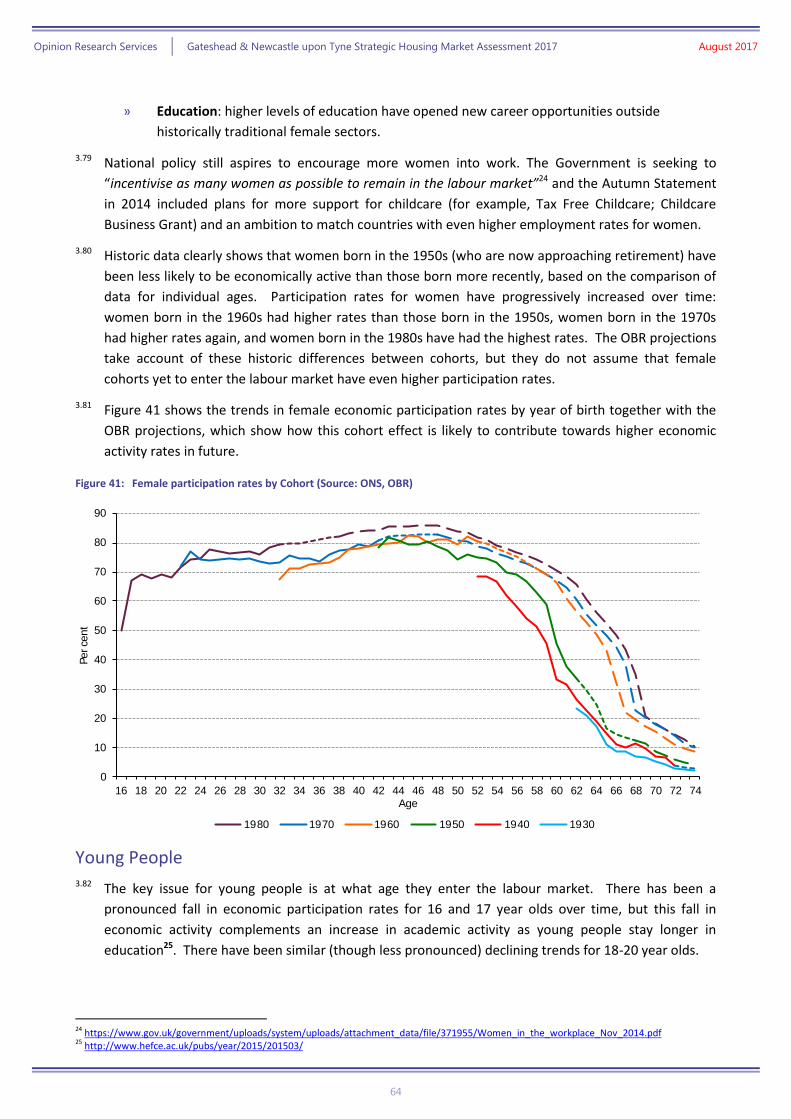
Opinion Research Services | Gateshead & Newcastle upon Tyne Strategic Housing Market Assessment 2017 August 2017
64
» Education: higher levels of education have opened new career opportunities outside
historically traditional female sectors.
3.79 National policy still aspires to encourage more women into work. The Government is seeking to
“incentivise as many women as possible to remain in the labour market”24 and the Autumn Statement
in 2014 included plans for more support for childcare (for example, Tax Free Childcare; Childcare
Business Grant) and an ambition to match countries with even higher employment rates for women.
3.80 Historic data clearly shows that women born in the 1950s (who are now approaching retirement) have
been less likely to be economically active than those born more recently, based on the comparison of
data for individual ages. Participation rates for women have progressively increased over time:
women born in the 1960s had higher rates than those born in the 1950s, women born in the 1970s
had higher rates again, and women born in the 1980s have had the highest rates. The OBR projections
take account of these historic differences between cohorts, but they do not assume that female
cohorts yet to enter the labour market have even higher participation rates.
3.81 Figure 41 shows the trends in female economic participation rates by year of birth together with the
OBR projections, which show how this cohort effect is likely to contribute towards higher economic
activity rates in future.
Figure 41: Female participation rates by Cohort (Source: ONS, OBR)
Young People 3.82 The key issue for young people is at what age they enter the labour market. There has been a
pronounced fall in economic participation rates for 16 and 17 year olds over time, but this fall in
economic activity complements an increase in academic activity as young people stay longer in
education25. There have been similar (though less pronounced) declining trends for 18-20 year olds.
24 https://www.gov.uk/government/uploads/system/uploads/attachment_data/file/371955/Women_in_the_workplace_Nov_2014.pdf 25 http://www.hefce.ac.uk/pubs/year/2015/201503/
0
10
20
30
40
50
60
70
80
90
16 18 20 22 24 26 28 30 32 34 36 38 40 42 44 46 48 50 52 54 56 58 60 62 64 66 68 70 72 74
Per ce
nt
Age
1980 1970 1960 1950 1940 1930Source: ONS, OBR
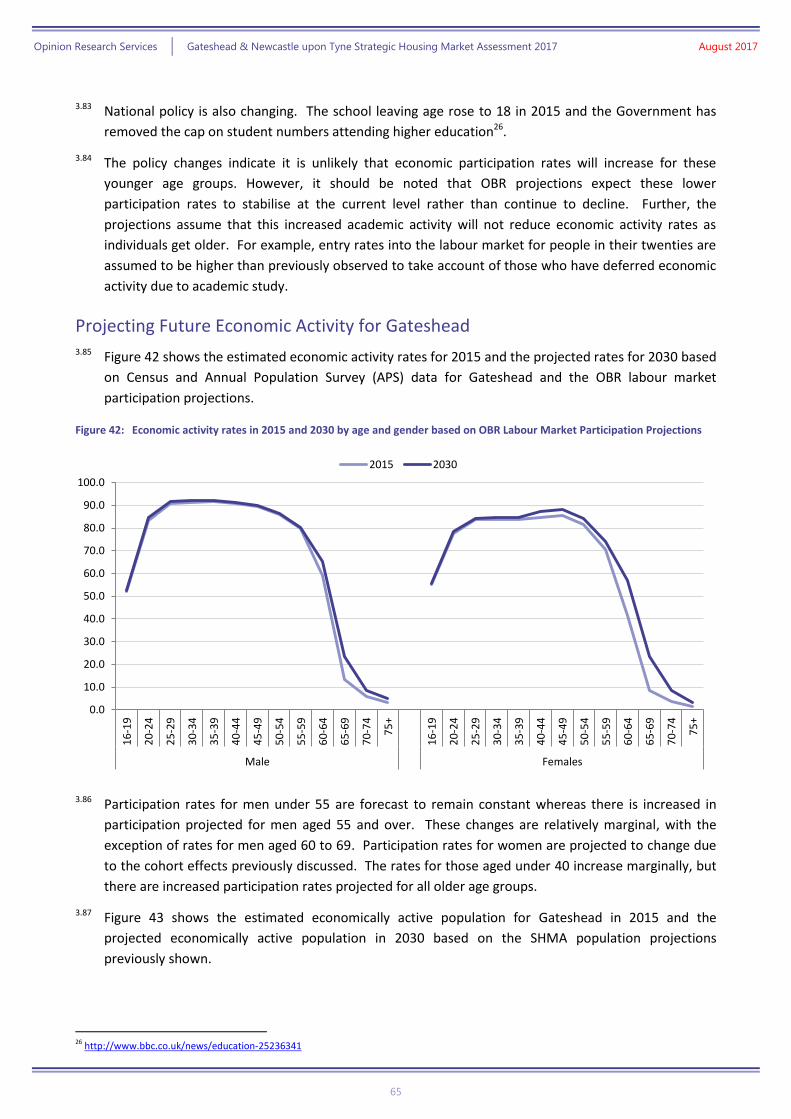
Opinion Research Services | Gateshead & Newcastle upon Tyne Strategic Housing Market Assessment 2017 August 2017
65
3.83 National policy is also changing. The school leaving age rose to 18 in 2015 and the Government has
removed the cap on student numbers attending higher education26.
3.84 The policy changes indicate it is unlikely that economic participation rates will increase for these
younger age groups. However, it should be noted that OBR projections expect these lower
participation rates to stabilise at the current level rather than continue to decline. Further, the
projections assume that this increased academic activity will not reduce economic activity rates as
individuals get older. For example, entry rates into the labour market for people in their twenties are
assumed to be higher than previously observed to take account of those who have deferred economic
activity due to academic study.
Projecting Future Economic Activity for Gateshead 3.85 Figure 42 shows the estimated economic activity rates for 2015 and the projected rates for 2030 based
on Census and Annual Population Survey (APS) data for Gateshead and the OBR labour market
participation projections.
Figure 42: Economic activity rates in 2015 and 2030 by age and gender based on OBR Labour Market Participation Projections
3.86 Participation rates for men under 55 are forecast to remain constant whereas there is increased in
participation projected for men aged 55 and over. These changes are relatively marginal, with the
exception of rates for men aged 60 to 69. Participation rates for women are projected to change due
to the cohort effects previously discussed. The rates for those aged under 40 increase marginally, but
there are increased participation rates projected for all older age groups.
3.87 Figure 43 shows the estimated economically active population for Gateshead in 2015 and the
projected economically active population in 2030 based on the SHMA population projections
previously shown.
26 http://www.bbc.co.uk/news/education-25236341
0.0
10.0
20.0
30.0
40.0
50.0
60.0
70.0
80.0
90.0
100.0
16
-19
20
-24
25
-29
30
-34
35
-39
40
-44
45
-49
50
-54
55
-59
60
-64
65
-69
70
-74
75
+
16
-19
20
-24
25
-29
30
-34
35
-39
40
-44
45
-49
50
-54
55
-59
60
-64
65
-69
70
-74
75
+
Male Females
2015 2030

Opinion Research Services | Gateshead & Newcastle upon Tyne Strategic Housing Market Assessment 2017 August 2017
66
Figure 43: Projected economically active population 2015-30 (Note: All figures presented unrounded for transparency)
Age 2015 2030
M F Total M F Total
Aged 16-19 2,455 2,523 4,978 2,881 2,730 5,611
Aged 20-24 5,036 4,822 9,858 5,325 4,478 9,803
Aged 25-29 6,354 6,098 12,452 6,142 5,276 11,418
Aged 30-34 6,463 5,886 12,348 6,780 5,717 12,497
Aged 35-39 5,667 5,062 10,729 6,981 6,044 13,025
Aged 40-44 5,671 5,643 11,314 6,291 6,049 12,341
Aged 45-49 6,295 6,226 12,521 5,713 5,814 11,527
Aged 50-54 6,322 6,179 12,501 4,897 4,949 9,846
Aged 55-59 5,060 4,585 9,645 4,696 4,682 9,377
Aged 60-64 3,314 2,374 5,688 4,227 3,863 8,089
Aged 65-69 789 514 1,303 1,511 1,606 3,117
Aged 70-74 229 172 401 442 485 926
Aged 75+ 260 169 429 545 427 972
Total 53,916 50,251 104,168 56,429 52,119 108,549
Total Change 2015-2030
- - - +2,513 +1,868 +4,381
3.88 The economically active population is likely to increase by 4,381 people over the 15-year period 2015-
30 given the population projections based on 10-year migration trends 2005-15.
Projecting Future Economic Activity for Newcastle upon Tyne 3.89 Figure 42 shows the estimated economic activity rates for 2015 and the projected rates for 2030 based
on Census and Annual Population Survey (APS) data for Newcastle upon Tyne and the OBR labour
market participation projections.
Figure 44: Economic activity rates in 2015 and 2030 by age and gender based on OBR Labour Market Participation Projections
0.0
10.0
20.0
30.0
40.0
50.0
60.0
70.0
80.0
90.0
100.0
16
-19
20
-24
25
-29
30
-34
35
-39
40
-44
45
-49
50
-54
55
-59
60
-64
65
-69
70
-74
75
+
16
-19
20
-24
25
-29
30
-34
35
-39
40
-44
45
-49
50
-54
55
-59
60
-64
65
-69
70
-74
75
+
Male Females
2015 2030

Opinion Research Services | Gateshead & Newcastle upon Tyne Strategic Housing Market Assessment 2017 August 2017
67
3.90 Participation rates for men under 55 are forecast to remain constant whereas there is increased in
participation projected for men aged 55 and over. These changes are relatively marginal, with the
exception of rates for men aged 60 to 69. Participation rates for women are projected to change due
to the cohort effects previously discussed. The rates for those aged under 40 increase marginally, but
there are increased participation rates projected for all older age groups.
3.91 Figure 43 shows the estimated economically active population for Newcastle upon Tyne in 2015 and
the projected economically active population in 2030 based on the SHMA population projections
previously shown.
Figure 45: Projected economically active population 2015-30 (Note: All figures presented unrounded for transparency)
Age 2015 2030
M F Total M F Total
Aged 16-19 3,520 3,559 7,079 4,472 4,582 9,054
Aged 20-24 10,778 10,726 21,504 12,675 11,580 24,255
Aged 25-29 11,382 9,469 20,850 11,762 8,156 19,917
Aged 30-34 9,211 7,903 17,113 10,707 7,491 18,198
Aged 35-39 7,701 6,348 14,049 9,754 7,252 17,006
Aged 40-44 7,566 6,332 13,898 8,464 7,582 16,046
Aged 45-49 7,413 6,819 14,232 7,428 7,224 14,652
Aged 50-54 7,261 6,850 14,111 6,186 6,058 12,244
Aged 55-59 5,971 5,435 11,405 5,717 5,291 11,008
Aged 60-64 3,582 2,357 5,939 4,501 4,068 8,569
Aged 65-69 1,262 861 2,124 2,142 2,170 4,313
Aged 70-74 416 328 744 764 796 1,560
Aged 75+ 445 497 942 895 864 1,759
Total 76,508 67,482 143,989 85,468 73,113 158,581
Total Change 2015-2030
- - - +8,960 +5,631 +14,592
3.92 The economically active population is likely to increase by 14,592 people over the 15-year period
2015-30 given the population projections based on 10-year migration trends 2005-15.
Household Population and Institutional Population 3.93 Prior to considering household projections, it is necessary to identify the household population and
separate out the population assumed to be living in Communal Establishments (institutional
population). Of particular importance are persons aged over 75 years living in nursing and care homes
which would be classed as institution population and not counted in the household projections. We
would note that older persons living in accommodation such as Extra-care and sheltered housing are
typically not classified as being in institutional housing and instead are counted in the household
projections.
3.94 The methodology used by the SHMA is consistent with the CLG approach27:
27 Household Projections 2012-based: Methodological Report, Department for Communities and Local Government, February 2015

Opinion Research Services | Gateshead & Newcastle upon Tyne Strategic Housing Market Assessment 2017 August 2017
68
“For the household projections, the assumption is made that the institutional population
stays constant at 2011 levels by age, sex and marital status for the under 75s and that the
share of the institutional population stays at 2011 levels by age, sex and relationship status
for the over 75s. The rationale here is that ageing population will lead to greater level of
population aged over 75 in residential care homes that would not be picked up if levels were
held fixed but holding the ratio fixed will.” (page 12)
3.95 Figure 46 shows the breakdown between the household population and the population living in all
Communal Establishments for both of the scenarios. We would note the figures for communal
housing count all population including, for example, students in bedspaces, the prison population,
those in boarding schools and anyone in specialist accommodation because of health problems. In this
case they are all assumed to be held constant with the exception of the population aged 75 years and
over. They show a rise of 414 persons aged 75 years or over in Gateshead and 593 persons in
Newcastle upon Tyne in the institutional population.
Figure 46: Gateshead population projections 2015-30 by gender and 5-year age cohort (Note: Communal Establishment
population held constant for population aged under 75 (light blue cells), and held proportionately constant for each
relationship status for population aged 75 or over (orange cells); Totals may not sum due to rounding)
Age 2015 2030
HH CE Total HH CE Total
Aged 0-4 12,166 9 12,175 11,252 9 11,261
Aged 5-9 11,405 2 11,407 11,396 2 11,398
Aged 10-14 10,220 11 10,231 11,362 11 11,373
Aged 15-19 10,849 759 11,608 12,044 759 12,803
Aged 20-24 12,160 95 12,255 11,920 95 12,015
Aged 25-29 14,246 25 14,271 12,942 25 12,967
Aged 30-34 14,072 17 14,089 14,100 17 14,117
Aged 35-39 12,169 34 12,203 14,675 34 14,709
Aged 40-44 12,851 50 12,901 13,779 50 13,829
Aged 45-49 14,277 54 14,331 12,906 53 12,959
Aged 50-54 14,845 61 14,906 11,470 61 11,531
Aged 55-59 12,756 59 12,815 12,103 59 12,162
Aged 60-64 11,286 71 11,357 13,161 71 13,232
Aged 65-69 11,943 50 11,993 13,194 50 13,244
Aged 70-74 8,509 100 8,609 10,849 100 10,949
Aged 75-79 7,460 189 7,649 8,711 227 8,938
Aged 80-84 5,272 282 5,554 7,667 386 8,052
Aged 85+ 4,047 697 4,745 6,142 969 7,110
Total 200,534 2,564 203,098 209,675 2,977 212,652

Opinion Research Services | Gateshead & Newcastle upon Tyne Strategic Housing Market Assessment 2017 August 2017
69
Figure 47: Newcastle upon Tyne population projections 2015-30 by gender and 5-year age cohort (Note: Communal
Establishment population held constant for population aged under 75 (light blue cells), and held proportionately
constant for each relationship status for population aged 75 or over (orange cells); Totals may not sum due to
rounding)
Age 2015 2030
HH CE Total HH CE Total
Aged 0-4 17,046 33 17,079 17,846 33 17,879
Aged 5-9 16,197 12 16,209 17,829 12 17,841
Aged 10-14 14,289 29 14,318 17,492 29 17,521
Aged 15-19 15,138 3,699 18,837 20,034 3,699 23,733
Aged 20-24 36,167 2,246 38,413 39,290 2,247 41,537
Aged 25-29 25,839 379 26,218 24,227 379 24,606
Aged 30-34 20,803 134 20,937 21,708 134 21,842
Aged 35-39 17,096 104 17,200 20,428 104 20,532
Aged 40-44 16,702 68 16,770 18,863 68 18,931
Aged 45-49 16,925 77 17,002 17,008 77 17,085
Aged 50-54 17,770 92 17,862 15,036 93 15,129
Aged 55-59 16,010 76 16,086 14,988 76 15,064
Aged 60-64 13,477 90 13,567 15,197 89 15,286
Aged 65-69 12,908 123 13,031 15,187 123 15,310
Aged 70-74 8,853 123 8,976 12,972 123 13,095
Aged 75-79 7,548 276 7,824 9,972 375 10,347
Aged 80-84 5,680 392 6,072 8,314 542 8,856
Aged 85+ 4,830 1,051 5,880 6,974 1,395 8,369
Total 283,278 9,004 292,281 313,366 9,598 322,964
3.96 It is important to recognise the growth of population aged 75 or over living in communal
establishments when considering the needs for older person housing, which is considered further in
both Chapter 6 and Chapter 7 of this SHMA Update.
Household Representative Rates 3.97 Household Representative Rates (HRRs) are a demographic tool used to convert population into
households and are based on those members of the population who can be classed as “household
representatives” or “heads of household”. The HRRs used are key to the establishment of the number
of households and, further, the number of households is key to the number of homes needed in
future.
3.98 The proportion of people in any age cohort who will be household representatives vary between
people of different ages, and the rates also vary over time. HRRs are published as part of the
household projections produced by CLG. The 2011 Census identified that the CLG 2008-based
household projections had significantly overestimated the number of households. Nevertheless, this
had been anticipated and the methodology report published to accompany the 2008-based
projections acknowledged (page 10):

Opinion Research Services | Gateshead & Newcastle upon Tyne Strategic Housing Market Assessment 2017 August 2017
70
“Labour Force Survey (LFS) data suggests that there have been some steep falls in
household representative rates for some age groups since the 2001 Census … this can only be
truly assessed once the 2011 Census results are available.”
3.99 The CLG 2012 based household projections technical document confirmed the findings (page 24):
“At the present time the results from the Census 2011 show that the 2008-based projections
were overestimating the rate of household formation and support the evidence from the
Labour Force Survey that household representative rates for some (particularly younger) age
groups have fallen markedly since the 2001 Census.”
3.100 Prior to the publication of CLG 2012-based household projections, Inspectors had been keen to avoid
perpetuating any possible “recessionary impact” associated with the lower formation rates suggested
by the interim data. The 2012-based household projections published in February 2015 incorporated
far more data from the 2011 Census which has now been incorporated into the 2014-based household
projections, which provide data for the 25-year period 2014-39 based on long-term demographic
trends. The household representative projections use a combination of two fitted trends through the
available Census points (1971, 1981, 1991, 2001 and 2011).
3.101 Ludi Simpson (Professor of Population Studies at the University of Manchester and the originator and
designer of the PopGroup demographic modelling software) considered the CLG household
projections in an article published in Town and Country Planning (December 2014):
“Although it is sometimes claimed that the current household projections are based on the
experience of changes between 2001 and 2011, this is true only of the allocation of
households to household types in the second stage of the projections. The total numbers of
households in England and in each local authority are projected on the basis of 40 years of
trends in household formation, from 1971 to 2011.”
3.102 It is possible to understand the impact of the new household representative rates through applying
the 2012-based rates and the 2008-based and interim 2011-based rates to the same population. Using
the household population data in the 2012-based projections for the 10-year period 2011-2021 (the
only years where household representative rates are available from all three projections), the 2012-
based rates show an annual average growth of 218,600 households across England. This compares to
241,600 households using the 2008-based rates and 204,600 households using the interim 2011-based
rates. Therefore, the 2012-based rates yield household growth that is 7% higher than the interim
2011-based rates and only 10% lower than the 2008-based rates. At a local level, a third of local
authorities have 2012-based rates that are closer to 2008-based rates than the interim 2011-based
rates.
3.103 The 2014-based household projections supersede the 2012-based projections (which in turn
superseded both the 2008-based projections and the interim 2011-based projections). The changes
since 2008 were anticipated and these reflect real demographic trends, and therefore we should not
adjust these further; although the extent to which housing supply may have affected the historic rate
is one of the reasons that we also consider market signals when determining the OAN for housing.

Opinion Research Services | Gateshead & Newcastle upon Tyne Strategic Housing Market Assessment 2017 August 2017
71
Household Projections 3.104 Through applying the CLG 2014-based household representative rates to the household population,
we established the projected number of additional households. The projected increase in households
for Gateshead is summarised in Figure 48 and for Newcastle upon Tyne is summarised in Figure 49.
3.105 Figure 48 and Figure 49 also provides an estimate of dwelling numbers, which takes account of
vacancies and second homes. The Gateshead and Newcastle upon Tyne JCS used a vacancy rate of 3%
for both authorities, but for this SHMA we have used a rate of 3.03% for Gateshead and 2.29% for
Newcastle upon Tyne, derived from CLG Live Tables LT615 and LT100 to reflect more up to date
information.
3.106 We would note that the St Chads report which underwrote the Gateshead and Newcastle upon Tyne
JCS projected by 2015 that the number of households in Newcastle upon Tyne would be 121,000. This
is clearly around 2,800 lower than the adjusted population set out in this SHMA. As discussed earlier,
the population of Newcastle upon Tyne has clearly grown much more quickly than was anticipated
between 2010-15 with a sharp grow in student numbers at the forefront of this growth. The evidence
points to a much more rapid growth over the period 2010-15 than was anticipated, but the anticipated
plateau in student numbers should see this growth stabilise at a lower level.
Figure 48: Projected households and dwellings over the 15-year period 2015-30 for Gateshead
Area Total Net change 2015-30
2015 2030 15-year change Annual average
CLG 2014-based projection
Households 90,226 96,632 6,406 427
Dwellings 93,043 99,649 6,606 440
SHMA 10-year trend (2005-15)
Households 91,068 98,420 7,352 490
Dwellings 93,916 101,498 7,582 505
Figure 49: Projected households and dwellings over the 15-year period 2015-30 for Newcastle upon Tyne
Area Total Net change 2015-30
2015 2030 15-year change Annual average
CLG 2014-based projection
Households 122,424 137,471 15,047 1,003
Dwellings 125,287 140,686 15,399 1,027
SHMA 10-year trend (2005-15)
Households 123,800 139,938 16,138 1,076
Dwellings 126,699 143,215 16,516 1,102
3.107 Whilst the CLG 2014-based household projection identifies an increase of 427 households per year for
Gateshead (which represents a need for 440 dwellings per annum), the increase based on the SHMA
10-year trend is a higher 490 extra households annually (505 dpa). For Newcastle upon Tyne the CLG
2014-based household projection identifies an increase of 1,003 households per year (which
represents a need for 1,027 dwellings per annum), the increase based on the SHMA 10-year trend is a
higher 1,076 extra households annually (1,102 dpa).
3.108 This difference is mainly due to a higher projected increase in population in the SHMA projections.
The figures represent an increase on the starting point for Gateshead of 15% and for Newcastle upon

Opinion Research Services | Gateshead & Newcastle upon Tyne Strategic Housing Market Assessment 2017 August 2017
72
Tyne of 7%. The figures for Gateshead are slightly lower than those in the Joint Core Strategy for
2015-30, while the figures for Newcastle upon Tyne are slightly higher. However, both figures are very
close to the existing policy positions in each authority with a rise across the two authorities of 2.1%.
Conclusions 3.109 PPG identifies that the starting point for estimating housing need is the CLG household projections,
and the latest data is the 2014-based projection. For the 15-year period 2015-30, these projections
suggest an overall growth of 6,406 households, equivalent to an average of 427 households per year
for Gateshead and 15,047 households, equivalent to an average of 1,003 household per year for
Newcastle upon Tyne (Figure 48 and Figure 49) .
3.110 ORS have reviewed and assessed household projections as part of this study, considering the Patient
Register, other data sources and migration based on 10-year trend 2005-15. On this basis, the official
population data show household numbers across the study area would increase over the 15-year Plan
period 2015-30 by an average of 490 per year in Gateshead and 1,076 per year in Newcastle upon
Tyne (Figure 48 and Figure 49). These figures provide the most appropriate demographic projection
on which to base the Objectively Assessed Need (OAN) for housing.

Opinion Research Services | Gateshead & Newcastle upon Tyne Strategic Housing Market Assessment 2017 August 2017
73
4. Affordable Housing Need Identifying households who cannot afford market housing
Introduction 4.1 Before calculating the affordable housing needs for Gateshead and Newcastle upon Tyne initial we
would like to cover the link between affordable housing and the OAN because we consider this to be a
central issue and the main source of the problems experienced by many Councils around affordable
housing need.
4.2 Paragraph 47 of the National Planning Policy Framework identifies that local planning authorities
should meet “the full, objectively assessed needs for market and affordable housing”. Furthermore,
paragraph 159 of the Framework identifies that they should “prepare a Strategic Housing Market
Assessment to assess their full housing needs” which identifies “the need for all types of housing,
including affordable housing”.
4.3 There have been a number of Judicial Reviews of Planning Inspector decisions which have helped to
clarify the relationship between the Full Objectively Assessed Need for housing and the need for
Affordable Housing:
Satnam Millennium v Warrington BC Judgement
Mr Justice Stewart surmised that “The NPPF requires full affordable housing needs to be identified
as part of the OAN” before concluding that “The assessed need for affordable housing was 477 dpa”
and “This assessed need was never expressed or included as part of the OAN” leading to the
judgement that there had not been compliance with Policy.
Oadby and Wigston v Bloor Homes Judgement
Mr Justice Hickinbottom concluded that “on the basis of the SHMA, the Council was working to a
purportedly policy off housing requirement figure of 80-100 dpa – but the SHMA itself assessed …
the full affordable housing need alone at a net 160 dpa” and therefore this was inevitably a “policy
on” figure.
Borough Council of Kings Lynn and West Norfolk v Elm Park Holdings Ltd Judgement
Mr Justice Dove stated “At the second stage described by the second sub-bullet point in paragraph
159, the needs for types and tenures of housing should be addressed. That includes the assessment
of the need for affordable housing … The Framework makes clear these needs should be addressed
in determining the FOAN”.
4.4 On this basis, it is clear that NPPF considers that the full, objectively assessed needs for housing will
include the need for affordable housing and this is now supported by a sequence of High Court
Judgements. Our view is that affordable housing need must be a component of the full, objectively
assessed needs for housing. This view is consistent with the Framework and the High Court
Judgements identified above, and forms the core of the analysis set out below.
Opinion Research Services | Gateshead & Newcastle upon Tyne Strategic Housing Market Assessment 2017 August 2017
74
Planning Practice Guidance for Affordable Housing Needs 4.5 In March 2014 the Government issued (PPG)28 on the Assessment of Housing and Economic
Development Needs (March 2014). This includes advice on how calculate affordable housing needs at
ID 2a-022 to 029. ID2a-022 summarises the key steps required to calculated affordable housing needs:
How should affordable housing need be calculated?
Plan makers working with relevant colleagues within their local authority (e.g. housing, health and
social care departments) will need to estimate the number of households and projected households
who lack their own housing or live in unsuitable housing and who cannot afford to meet their
housing needs in the market.
This calculation involves adding together the current unmet housing need and the projected future
housing need and then subtracting this from the current supply of affordable housing stock.
Planning Practice Guidance (March 2014), ID 2a-022
4.6 The PPG approach largely reflects that in chapter 5 the 2007 CLG SHMA Practice Guidance:
“The first part of this chapter explains how to estimate the number of current and future
households in housing need. It then looks at the available stock and requirements of existing
affordable housing tenants for different sizes of properties. In so doing, the approach
outlines how to develop an evidence base that can inform decisions about a range of policy
responses to housing need, including: setting targets for affordable housing, changing
allocations policies and using the private rented sector.” (page 40, SHMA Practice Guidance
Version 229)
4.7 The 2007 CLG SHMA Practice Guidance was in turn based on the approach set out in “Local Housing
Needs Assessment: A Guide to Good Practice”, published by the Department for the Environment,
Transport and the Regions (DETR) in 200030. This presented “a basic needs assessment model which all
local authorities should try to follow, so far as is practicable” (pages 21-22):
Table 2a: Outline of basic model
B: BACKLOG OF EXISTING NEED
(times a quota)
plus
N: NEWLY ARISING NEED
minus
S: SUPPLY OF AFFORDABLE UNITS
equals
NET SHORTFALL (SURPLUS)
affordable units per year
4.8 Given this context, it is evident that the key elements of the PPG approach reflect a long-established
approach for assessing affordable housing need (PPG ID 2a-022 cf. DETR 2000 Table 2a):
28 http://planningguidance.planningportal.gov.uk/blog/guidance/housing-and-economic-development-needs-assessments/ 29 “Strategic Housing Market Assessments Practice Guidance Version 2”, CLG 2007 (now rescinded) 30 “Local Housing Needs Assessment: A Guide to Good Practice”, DETR 2000 (now rescinded)

Opinion Research Services | Gateshead & Newcastle upon Tyne Strategic Housing Market Assessment 2017 August 2017
75
» “This calculation involves adding together the current unmet housing need and the projected
future housing need” B: BACKLOG OF EXISTING NEED plus N: NEWLY ARISING NEED
» “and then subtracting this from the current supply of affordable housing stock”
minus S: SUPPLY OF AFFORDABLE UNITS equals NET SHORTFALL (SURPLUS)
Assessing Affordable Housing Needs 4.9 The standard approach to modelling affordable housing needs that was originally set out in the 2000
DETR Guide to Good Practice and which is reflected by PPG at ID 2a-022 to 029 comprises:
» A backlog of current unmet need for affordable housing, which includes:
- Established households (who already live in market or affordable housing that is unsuitable for
their needs); together with
- Suppressed households (such as concealed families or homeless households) who need their
own home, but are unable to afford market housing; plus the
» Projected future housing need for affordable housing (i.e. newly arising need), which is based
on a proportion of future household growth; less the
» Supply of affordable housing.
4.10 Any established households in affordable housing will vacate their existing dwelling if they move – so
no additional dwellings are needed and these needs will not add to the overall OAN. Nevertheless,
these households moves will impact on the overall mix of housing needed.
4.11 By definition, the full OAN will include all projected household growth for the area – so any proportion
of the growth where households need affordable housing will not add to the overall OAN.
4.12 The only households that would add to the overall OAN based on household projections would be
suppressed households (such as concealed families or homeless households) that are not captured by
the household projections. The needs of these households must be counted as part of the affordable
housing OAN, and therefore they must also be included within the overall OAN.
4.13 Given this context, all households that need affordable housing will already be included within the
household projections that inform the overall OAN (and will therefore not increase the overall OAN);
except for suppressed households counted within the current unmet need for affordable housing.
4.14 The Planning Advisory Service Good Plan Making Guide31 clearly identifies that SHMAs must take
account of any unmet need for housing that still exists at the start of the new plan period, which it
describes as ‘backlog’. This includes “for example, the needs of the homeless and other households
living in unacceptable accommodation”:
“Having an up-to-date, robust Strategic Housing Market Assessment should re-set the clock,
and therefore carrying forward under-provision from a previous plan period would be
‘double counting’. Make sure however that the Strategic Housing Market Assessment takes
account of ‘backlog’ which is unmet need for housing that still exists at the start of the new
plan period (for example, the needs of the homeless and other households living in
unacceptable accommodation). The Strategic Housing Market Assessment should show all
31 http://www.pas.gov.uk/documents/332612/6363137/Pages+from+FINAL+PAS+Good+Plan+Making+-6.pdf

Opinion Research Services | Gateshead & Newcastle upon Tyne Strategic Housing Market Assessment 2017 August 2017
76
those in need. It is therefore vitally important to have a properly done Strategic Housing
Market Assessment that has the right scope.” (page 49)
4.15 Therefore, the PAS Good Plan Making Guide confirms that the only households included within the
affordable housing OAN that are not included within the household projections that inform the overall
OAN have to be counted separately when establishing the overall OAN. On this basis, all households
counted within the affordable housing OAN must also be counted within the overall OAN: affordable
housing need will not add to the overall OAN.
Modelling Affordable Needs 4.16 In relation to assessing future need, PPG identifies that needs should be assessed based on a “gross
annual estimate” (ID 2a-025, emphasis added); however in establishing “the total need for affordable
housing”, PPG identifies that the figure should be based on “the total net need” (ID 2a-029, emphasis
added). The PPG suggests that this should be based on a calculation to “subtract total available
[affordable housing] stock from total gross need” (ID 2a-029) – but not all households included within
the total gross need will be allocated affordable housing, so it is important to consider this when
deriving net need.
4.17 From a real-life perspective, any household that needs an affordable dwelling will also need a
dwelling; but equally important, any household that does not need a dwelling will not need an
affordable dwelling. Understanding this very simple concept is central to producing a robust needs
assessment.
4.18 The basic approach to assessing affordable housing need set out at PPG ID 2a-022 to 029 covers five
key groups of households: two relate to assessing current need (ID 2a-024) and three relate to
assessing future need (ID 2a-025). The table below describes each of these groups and differentiates
between their gross need and net need. It also sets out the impact that each group has on the
assessment of affordable housing need and the full OAN.
Group Description Impact on
needs assessment
Current needs of homeless and concealed households
These households should have a dwelling at the start of the Plan period, but they don’t and they are unable to afford market housing.
The needs of these households should be counted as affordable housing need and also within the full OAN.
Current needs of existing households
These households have a dwelling at the start of the Plan period, but it isn’t suitable for their needs (for example, due to overcrowding) and they are unable to afford market housing.
The needs of these households should be counted as affordable housing need, but as they already occupy a dwelling their need will not add to the full OAN.
Future needs of new households unable to afford: Newly forming households
These new households are projected to form based on past trends, but they are unable to afford market housing. This will represent the gross need.
The net need offsets those existing households previously assessed to need affordable housing that are projected to dissolve (either as existing households combine or following death of all household members).
Such households no longer need a dwelling, so they should also be discounted from the affordable housing need. It is important that this need is discounted regardless of whether or not the dissolving household previously occupied
The overall number of newly forming households and household dissolutions should be consistent with the household projections on which the full OAN is based.
This will ensure that the affordable housing need is consistent with the full OAN.
Whilst it is necessary to identify the gross need, it should only be the net need that is counted when establishing the need
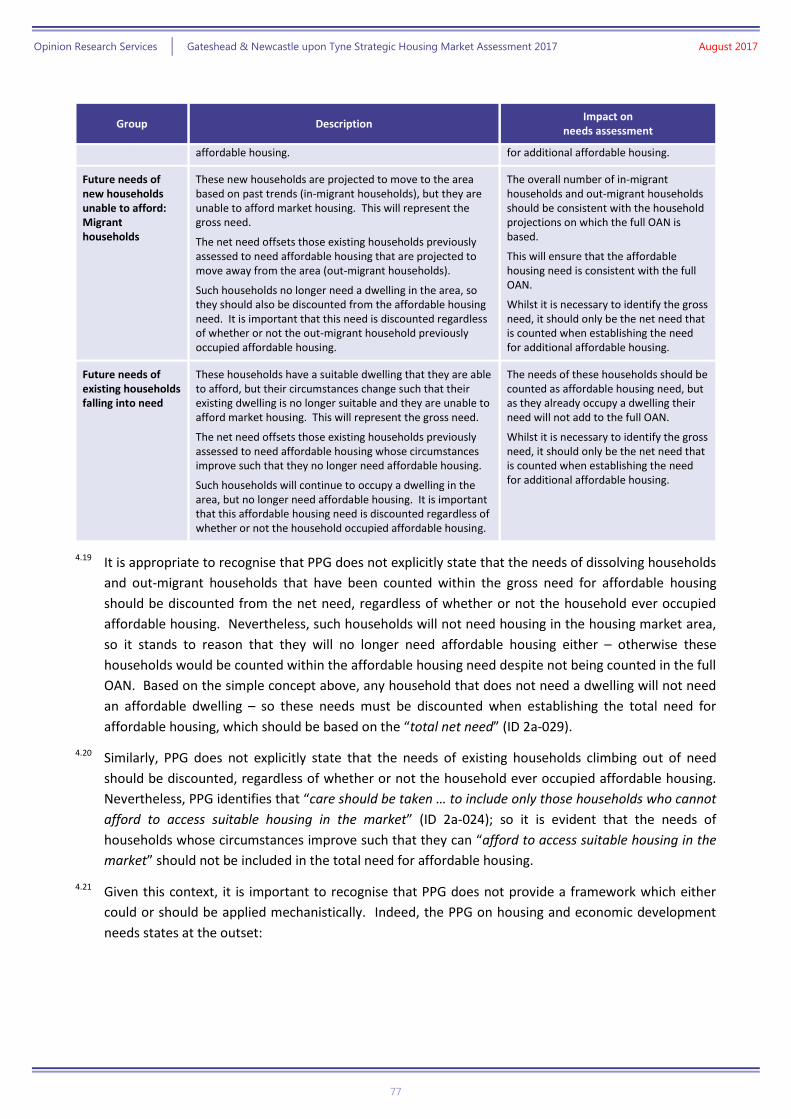
Opinion Research Services | Gateshead & Newcastle upon Tyne Strategic Housing Market Assessment 2017 August 2017
77
Group Description Impact on
needs assessment
affordable housing. for additional affordable housing.
Future needs of new households unable to afford: Migrant households
These new households are projected to move to the area based on past trends (in-migrant households), but they are unable to afford market housing. This will represent the gross need.
The net need offsets those existing households previously assessed to need affordable housing that are projected to move away from the area (out-migrant households).
Such households no longer need a dwelling in the area, so they should also be discounted from the affordable housing need. It is important that this need is discounted regardless of whether or not the out-migrant household previously occupied affordable housing.
The overall number of in-migrant households and out-migrant households should be consistent with the household projections on which the full OAN is based.
This will ensure that the affordable housing need is consistent with the full OAN.
Whilst it is necessary to identify the gross need, it should only be the net need that is counted when establishing the need for additional affordable housing.
Future needs of existing households falling into need
These households have a suitable dwelling that they are able to afford, but their circumstances change such that their existing dwelling is no longer suitable and they are unable to afford market housing. This will represent the gross need.
The net need offsets those existing households previously assessed to need affordable housing whose circumstances improve such that they no longer need affordable housing.
Such households will continue to occupy a dwelling in the area, but no longer need affordable housing. It is important that this affordable housing need is discounted regardless of whether or not the household occupied affordable housing.
The needs of these households should be counted as affordable housing need, but as they already occupy a dwelling their need will not add to the full OAN.
Whilst it is necessary to identify the gross need, it should only be the net need that is counted when establishing the need for additional affordable housing.
4.19 It is appropriate to recognise that PPG does not explicitly state that the needs of dissolving households
and out-migrant households that have been counted within the gross need for affordable housing
should be discounted from the net need, regardless of whether or not the household ever occupied
affordable housing. Nevertheless, such households will not need housing in the housing market area,
so it stands to reason that they will no longer need affordable housing either – otherwise these
households would be counted within the affordable housing need despite not being counted in the full
OAN. Based on the simple concept above, any household that does not need a dwelling will not need
an affordable dwelling – so these needs must be discounted when establishing the total need for
affordable housing, which should be based on the “total net need” (ID 2a-029).
4.20 Similarly, PPG does not explicitly state that the needs of existing households climbing out of need
should be discounted, regardless of whether or not the household ever occupied affordable housing.
Nevertheless, PPG identifies that “care should be taken … to include only those households who cannot
afford to access suitable housing in the market” (ID 2a-024); so it is evident that the needs of
households whose circumstances improve such that they can “afford to access suitable housing in the
market” should not be included in the total need for affordable housing.
4.21 Given this context, it is important to recognise that PPG does not provide a framework which either
could or should be applied mechanistically. Indeed, the PPG on housing and economic development
needs states at the outset:

Opinion Research Services | Gateshead & Newcastle upon Tyne Strategic Housing Market Assessment 2017 August 2017
78
Can local planning authorities use a different methodology?
There is no one methodological approach or use of a particular dataset(s) that will provide a
definitive assessment of development need. But the use of this standard methodology set out in this
guidance is strongly recommended because it will ensure that the assessment findings are
transparently prepared. Local planning authorities may consider departing from the methodology,
but they should explain why their particular local circumstances have led them to adopt a different
approach where this is the case. The assessment should be thorough but proportionate, building
where possible on existing information sources outlined within the guidance.
Planning Practice Guidance (March 2014), ID 2a-005
4.22 There are a number of areas where PPG does not provide specific guidance; such as the need to
consider commuting patterns when considering how employment trends are taken into account, and
the need to consider vacancies and second homes when establishing housing need based on
household projections. In this regard, in the Borough Council of Kings Lynn and West Norfolk v Elm
Park Holdings Ltd Judgement Mr Justice Dove stated:
41. The PPG does not provide any specific guidance on this point related to vacancies and
second homes. That is to my mind unsurprising, as it could not begin to address every
conceivable point which might arise in this exercise. However, I have no doubt that the
inclusion of vacancies and second homes is an adjustment based on statistical data of a kind
similar to those which are contemplated in the PPG. The absence of this issue from the PPG
does not therefore dissuade me from the view which I have reached.
4.23 Whilst PPG does not provide any specific guidance about the treatment of households that no longer
need housing in the housing market area that have been counted in the gross need for affordable
housing, it is still appropriate to discount their needs from the affordable housing need.
Backlog of Affordable Housing Needs for Gateshead and Newcastle upon Tyne 4.24 Demographic projections provide the basis for identifying the Objectively Assessed Need for all types
of housing, including both market housing and affordable housing.
4.25 PPG notes that affordable housing need is based on households “who lack their own housing or live in
unsuitable housing and who cannot afford to meet their housing needs in the market” (paragraph 22)
and identifies a number of different types of household which may be included:
What types of households are considered in housing need?
The types of households to be considered in housing need are:
» Homeless households or insecure tenure (e.g. housing that is too expensive compared to
disposable income)
» Households where there is a mismatch between the housing needed and the actual dwelling
(e.g. overcrowded households)

Opinion Research Services | Gateshead & Newcastle upon Tyne Strategic Housing Market Assessment 2017 August 2017
79
» Households containing people with social or physical impairment or other specific needs living in
unsuitable dwellings (e.g. accessed via steps) which cannot be made suitable in-situ
» Households that lack basic facilities (e.g. a bathroom or kitchen) and those subject to major
disrepair or that are unfit for habitation
» Households containing people with particular social needs (e.g. escaping harassment) which
cannot be resolved except through a move
Planning Practice Guidance (March 2014), ID 2a-023
4.26 PPG also suggests a number of data sources for assessing past trends and recording current estimates
for establishing the need for affordable housing (paragraph 24):
» Local authorities will hold data on the number of homeless households, those in
temporary accommodation and extent of overcrowding.
» The Census also provides data on concealed households and overcrowding which can be
compared with trends contained in the English Housing Survey.
» Housing registers and local authority and registered social landlord transfer lists will also
provide relevant information.
4.27 The following section considers each of these sources in turn, alongside other relevant statistics and
information that is available.
Past Trends and Current Estimates of the Need for Affordable Housing
Local Authority Data: Homeless Households and Temporary Accommodation 4.28 Local authorities hold data on the number of homeless households and those in temporary
accommodation. In both Gateshead and Newcastle upon Tyne, the annual number of households
accepted as being homeless and in priority need has seen a downward trend over the period 2005 to
2015. The current annual rate represents 2.2 presentations per 1,000 households in Gateshead and
1.3, presentations per 1,000 households in Newcastle upon Tyne which is lower than the equivalent
rate for England (2.4 per 1,000).
4.29 There has also been a reduction in households living in temporary accommodation from Quarter 1
2005 to Quarter 1 2015 and fewer households accepted as homeless without temporary
accommodation provided. Of the households in temporary accommodation in Quarter 1 2015, 11
were accommodated in bed & breakfast accommodation or hostels and a further 45 were in private
sector leased stock or other. This time period represents the start date for this assessment.
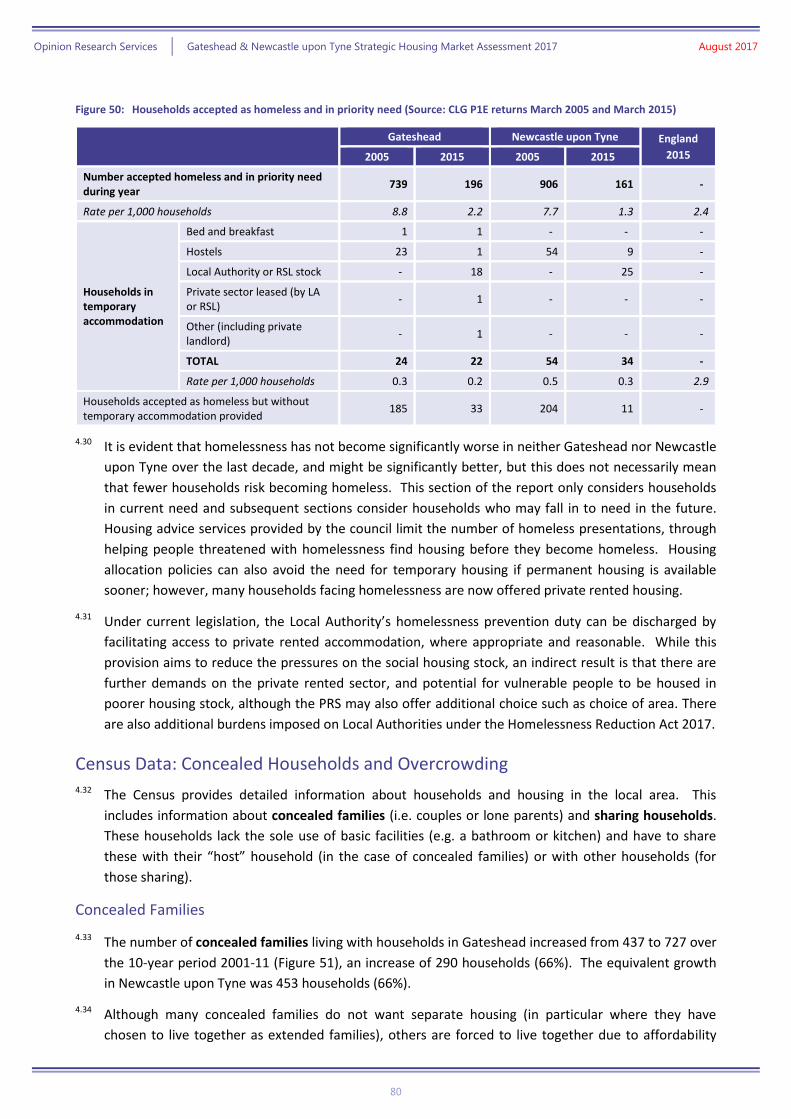
Opinion Research Services | Gateshead & Newcastle upon Tyne Strategic Housing Market Assessment 2017 August 2017
80
Figure 50: Households accepted as homeless and in priority need (Source: CLG P1E returns March 2005 and March 2015)
Gateshead Newcastle upon Tyne England
2015 2005 2015 2005 2015
Number accepted homeless and in priority need during year
739 196 906 161 -
Rate per 1,000 households 8.8 2.2 7.7 1.3 2.4
Households in temporary accommodation
Bed and breakfast 1 1 - - -
Hostels 23 1 54 9 -
Local Authority or RSL stock - 18 - 25 -
Private sector leased (by LA or RSL)
- 1 - - -
Other (including private landlord)
- 1 - - -
TOTAL 24 22 54 34 -
Rate per 1,000 households 0.3 0.2 0.5 0.3 2.9
Households accepted as homeless but without temporary accommodation provided
185 33 204 11 -
4.30 It is evident that homelessness has not become significantly worse in neither Gateshead nor Newcastle
upon Tyne over the last decade, and might be significantly better, but this does not necessarily mean
that fewer households risk becoming homeless. This section of the report only considers households
in current need and subsequent sections consider households who may fall in to need in the future.
Housing advice services provided by the council limit the number of homeless presentations, through
helping people threatened with homelessness find housing before they become homeless. Housing
allocation policies can also avoid the need for temporary housing if permanent housing is available
sooner; however, many households facing homelessness are now offered private rented housing.
4.31 Under current legislation, the Local Authority’s homelessness prevention duty can be discharged by
facilitating access to private rented accommodation, where appropriate and reasonable. While this
provision aims to reduce the pressures on the social housing stock, an indirect result is that there are
further demands on the private rented sector, and potential for vulnerable people to be housed in
poorer housing stock, although the PRS may also offer additional choice such as choice of area. There
are also additional burdens imposed on Local Authorities under the Homelessness Reduction Act 2017.
Census Data: Concealed Households and Overcrowding 4.32 The Census provides detailed information about households and housing in the local area. This
includes information about concealed families (i.e. couples or lone parents) and sharing households.
These households lack the sole use of basic facilities (e.g. a bathroom or kitchen) and have to share
these with their “host” household (in the case of concealed families) or with other households (for
those sharing).
Concealed Families
4.33 The number of concealed families living with households in Gateshead increased from 437 to 727 over
the 10-year period 2001-11 (Figure 51), an increase of 290 households (66%). The equivalent growth
in Newcastle upon Tyne was 453 households (66%).
4.34 Although many concealed families do not want separate housing (in particular where they have
chosen to live together as extended families), others are forced to live together due to affordability

Opinion Research Services | Gateshead & Newcastle upon Tyne Strategic Housing Market Assessment 2017 August 2017
81
difficulties or other constraints – and these concealed families will not be counted as part of the CLG
household projections. Concealed families with older family representatives will often be living with
another family in order to receive help or support due to poor health. Concealed families with
younger family representatives are more likely to demonstrate un-met need for housing. When we
consider the growth of families over the period 2001-11, 77% of the growth in Gateshead and 84% of
the growth in Newcastle upon Tyne had family representatives aged under 55, with substantial growth
amongst those aged under 35 in particular (in line with national trends).
Figure 51: Concealed families by age of family representative (Source: Census 2001 and 2011)
Gateshead Newcastle upon Tyne
2001 2011 Net
change 2001-11
2001 2011 Net
change 2001-11
Aged under 25 87 239 +152 129 295 +166
Aged 25 to 34 167 201 +34 218 369 +151
Aged 35 to 44 62 64 +2 87 97 +11
Aged 45 to 54 23 58 +35 48 99 +51
Sub-total aged under 55 339 562 +223 481 860 +379
Aged 55 to 64 36 53 +17 70 102 +32
Aged 65 to 74 47 79 +32 106 112 +6
Aged 75 or over 15 33 +18 28 64 +36
Sub-total aged 55 or over 98 165 +67 204 278 +74
All Concealed Families 437 727 +290 685 1,138 +453
Sharing Households
4.35 The number of sharing households increased from 146 to 155 in Newcastle upon Tyne over the 10-
year period 2001-11 (Figure 52), but fell in Gateshead. Sharing households fall in to a very specific
category of households who share facilities, but have their own accommodation within a property.
Figure 52: Shared Dwellings and Sharing Households (Source: Census 2001 and 2011)
Gateshead Newcastle upon Tyne
2001 2011 Net
change 2001 2011
Net change
Number of shared dwellings 37 7 -30 60 50 -10
Number of household spaces in shared dwellings 124 20 -104 155 183 +28
All Sharing Households 118 17 -101 146 155 +9
Household spaces in shared dwellings with no usual residents
6 3 -3 9 28 +19
4.36 Figure 53 shows that the number of multi-adult households living in the area increased from 2,105 to
3,205 households over the same period in Gateshead, an increase of 1,100 with a 3,775 increase in
Newcastle upon Tyne. These people also have to share basic facilities, but are considered to be a
single household as they also share a living room, sitting room or dining area. This includes Houses in
Multiple Occupation (HMOs) with shared facilities, as well as single people living together as a group
and individuals with lodgers.

Opinion Research Services | Gateshead & Newcastle upon Tyne Strategic Housing Market Assessment 2017 August 2017
82
Figure 53: Multi-adult Households (Source: Census 2001 and 2011)
Gateshead Newcastle upon Tyne
2001 2011 Net
change 2001-11
2001 2011 Net
change 2001-11
Owned 1,153 1,433 +280 2,301 2,203 -98
Private rented 283 1,107 +824 4,093 8,004 +3,911
Social rented 669 665 -4 1383 1345 -38
All Households 2,105 3,205 +1,100 7,777 11,552 +3,775
4.37 The growth in multi-adult households was focused particularly in the private rented sector, with an
increase in single persons choosing to live with friends together with others living in HMOs. This
growth accounts for 75% of the growth in Gateshead and more than 100% of the growth in Newcastle
upon Tyne
4.38 Nevertheless, shared facilities is a characteristic of HMOs and many people living in this type of
housing will only be able to afford shared accommodation (either with or without housing benefit
support). Extending the Local Housing Allowance (LHA) Shared Accommodation Rate (SAR) allowance
to cover all single persons up to 35 years of age has meant that many more young people will only be
able to afford shared housing, and this has further increased demand for housing such as HMOs.
4.39 There is therefore likely to be a continued (and possibly growing) role for HMOs in housing under 35’s,
with more of the existing housing stock possibly being converted. Given this context, it would not be
appropriate to consider households to need affordable housing only on the basis of them currently
sharing facilities (although there may be other reasons why they would be considered as an affordable
housing need).
Overcrowding
4.40 The 2011 Census also provides detailed information about occupancy which provides a measure of
whether a household’s accommodation is overcrowded or under occupied:
“There are two measures of occupancy rating, one based on the number of rooms in a
household's accommodation, and one based on the number of bedrooms. The ages of the
household members and their relationships to each other are used to derive the number of
rooms/bedrooms they require, based on a standard formula. The number of
rooms/bedrooms required is subtracted from the number of rooms/bedrooms in the
household's accommodation to obtain the occupancy rating. An occupancy rating of -1
implies that a household has one fewer room/bedroom than required, whereas +1 implies
that they have one more room/bedroom than the standard requirement.”
4.41 When considering the number of rooms required, the ONS use the following approach to calculate the
room requirement:
» A one person household is assumed to require three rooms (two common rooms and a
bedroom); and
» Where there are two or more residents it is assumed that they require a minimum of two
common rooms plus one bedroom for:
– each couple (as determined by the relationship question)

Opinion Research Services | Gateshead & Newcastle upon Tyne Strategic Housing Market Assessment 2017 August 2017
83
– each lone parent
– any other person aged 16 or over
– each pair aged 10 to 15 of the same sex
– each pair formed from any other person aged 10 to 15 with a child aged under 10 of the
same sex
– each pair of children aged under 10 remaining
– each remaining person (either aged 10 to 15 or under 10).
4.42 For Gateshead, overcrowding increased from 5,145 to 5,488 households (an increase of 343) over the
10-year period 2001-11 (Figure 54). This represents a percentage growth of 1%, which is much lower
than comparator areas; Leeds (17%), Liverpool and Knowsley (18%), Manchester and Salford (52%)
and Sheffield (50%). It is also lower than the national increase for England (23%).
4.43 When considered by tenure, overcrowding has reduced by 205 households in the owner occupied
sector and reduced by 288 households in the social rented sector; however the number of households
overcrowded in the private rented sector has increased from 545 to 1,381, a growth of 836
households over the 10-year period. The percentage of overcrowded households in the private rented
sector has also increased from 8.5% to 11.6% (a percentage increase of 35%).
4.44 For Newcastle upon Tyne, overcrowding increased from 8,625 to 10,642 households (an increase of
2,017) over the 10-year period 2001-11 (Figure 54), but this has not resulted in any significant increase
in complaints or notices being served in relation to overcrowded households. This represents a
percentage growth of 17%, which is similar to the comparator areas of Leeds (17%) and Liverpool and
Knowsley (18%). However, the percentage growth for Newcastle upon Tyne is lower than comparator
areas Manchester and Salford (52%) and Sheffield (50%) and is also lower than the national increase
for England (23%).
4.45 When considered by tenure, overcrowding has reduced by 159 households in the owner occupied
sector and reduced by 165 households in the social rented sector; however the number of households
overcrowded in the private rented sector has increased from 1,962 to 4,303, a growth of 2,341
households over the 10-year period. The percentage of overcrowded households in the private rented
sector has also increased from 13.3% to 18.0% (a percentage increase of 35%).
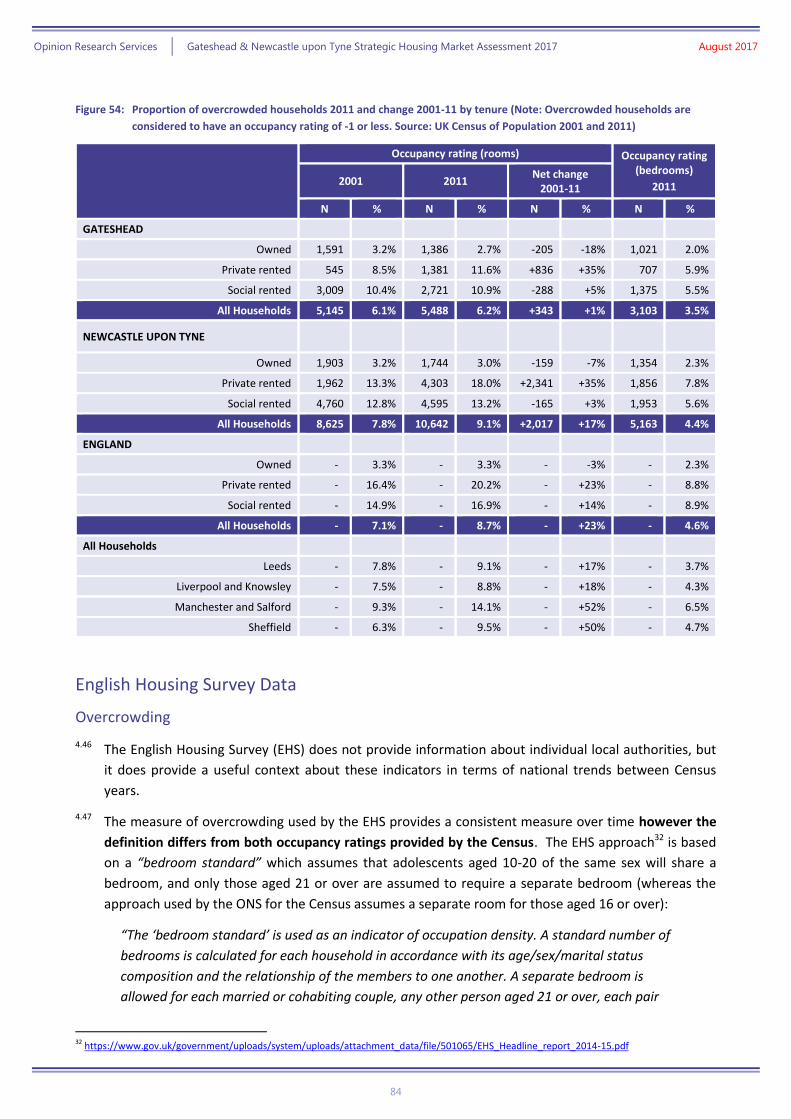
Opinion Research Services | Gateshead & Newcastle upon Tyne Strategic Housing Market Assessment 2017 August 2017
84
Figure 54: Proportion of overcrowded households 2011 and change 2001-11 by tenure (Note: Overcrowded households are
considered to have an occupancy rating of -1 or less. Source: UK Census of Population 2001 and 2011)
Occupancy rating (rooms) Occupancy rating (bedrooms)
2011 2001 2011 Net change
2001-11
N % N % N % N %
GATESHEAD
Owned 1,591 3.2% 1,386 2.7% -205 -18% 1,021 2.0%
Private rented 545 8.5% 1,381 11.6% +836 +35% 707 5.9%
Social rented 3,009 10.4% 2,721 10.9% -288 +5% 1,375 5.5%
All Households 5,145 6.1% 5,488 6.2% +343 +1% 3,103 3.5%
NEWCASTLE UPON TYNE
Owned 1,903 3.2% 1,744 3.0% -159 -7% 1,354 2.3%
Private rented 1,962 13.3% 4,303 18.0% +2,341 +35% 1,856 7.8%
Social rented 4,760 12.8% 4,595 13.2% -165 +3% 1,953 5.6%
All Households 8,625 7.8% 10,642 9.1% +2,017 +17% 5,163 4.4%
ENGLAND
Owned - 3.3% - 3.3% - -3% - 2.3%
Private rented - 16.4% - 20.2% - +23% - 8.8%
Social rented - 14.9% - 16.9% - +14% - 8.9%
All Households - 7.1% - 8.7% - +23% - 4.6%
All Households
Leeds - 7.8% - 9.1% - +17% - 3.7%
Liverpool and Knowsley - 7.5% - 8.8% - +18% - 4.3%
Manchester and Salford - 9.3% - 14.1% - +52% - 6.5%
Sheffield - 6.3% - 9.5% - +50% - 4.7%
English Housing Survey Data
Overcrowding
4.46 The English Housing Survey (EHS) does not provide information about individual local authorities, but
it does provide a useful context about these indicators in terms of national trends between Census
years.
4.47 The measure of overcrowding used by the EHS provides a consistent measure over time however the
definition differs from both occupancy ratings provided by the Census. The EHS approach32 is based
on a “bedroom standard” which assumes that adolescents aged 10-20 of the same sex will share a
bedroom, and only those aged 21 or over are assumed to require a separate bedroom (whereas the
approach used by the ONS for the Census assumes a separate room for those aged 16 or over):
“The ‘bedroom standard’ is used as an indicator of occupation density. A standard number of
bedrooms is calculated for each household in accordance with its age/sex/marital status
composition and the relationship of the members to one another. A separate bedroom is
allowed for each married or cohabiting couple, any other person aged 21 or over, each pair
32 https://www.gov.uk/government/uploads/system/uploads/attachment_data/file/501065/EHS_Headline_report_2014-15.pdf

Opinion Research Services | Gateshead & Newcastle upon Tyne Strategic Housing Market Assessment 2017 August 2017
85
of adolescents aged 10-20 of the same sex, and each pair of children under 10. Any unpaired
person aged 10-20 is notionally paired, if possible, with a child under 10 of the same sex, or,
if that is not possible, he or she is counted as requiring a separate bedroom, as is any
unpaired child under 10.
“Households are said to be overcrowded if they have fewer bedrooms available than the
notional number needed. Households are said to be under-occupying if they have two or
more bedrooms more than the notional needed.”
4.48 Nationally, overcrowding rates increased for households in both social and private rented housing until
2011, although the proportion of overcrowded households has declined in both sectors since 2011.
Overcrowding rates for owner occupiers have remained relatively stable since 1995. The national
picture is likely to be reflected in the local circumstances for Gateshead and Newcastle upon Tyne.
Figure 55: Trend in overcrowding rates by tenure, England (Note: Based on three-year moving average, up to and including the
labelled date. Source: Survey of English Housing 1995-96 to 2007-08; English Housing Survey 2008-09 onwards)
4.49 Whilst the EHS definition of overcrowding is more stringent than the Census, the measurement closer
reflects the definition of statutory overcrowding that was set out by Part X of the Housing Act 1985
and is consistent with statutory Guidance33 that was issued by CLG in 2012 to which authorities must
have regard when exercising their functions under Part 6 of the 1996 Housing Act (as amended).
4.50 This Guidance, “Allocation of accommodation: Guidance for local housing authorities in England”,
recommends that authorities should use the bedroom standard when assessing whether or not
households are overcrowded for the purposes of assessing housing need:
4.8 The Secretary of State takes the view that the bedroom standard is an appropriate measure
of overcrowding for allocation purposes, and recommends that all housing authorities should
adopt this as a minimum. The bedroom standard allocates a separate bedroom to each:
– married or cohabiting couple
– adult aged 21 years or more
33 https://www.gov.uk/government/uploads/system/uploads/attachment_data/file/5918/2171391.pdf
0.0%
1.0%
2.0%
3.0%
4.0%
5.0%
6.0%
7.0%
8.0%
Owner occupiers Social renters Private renters All households
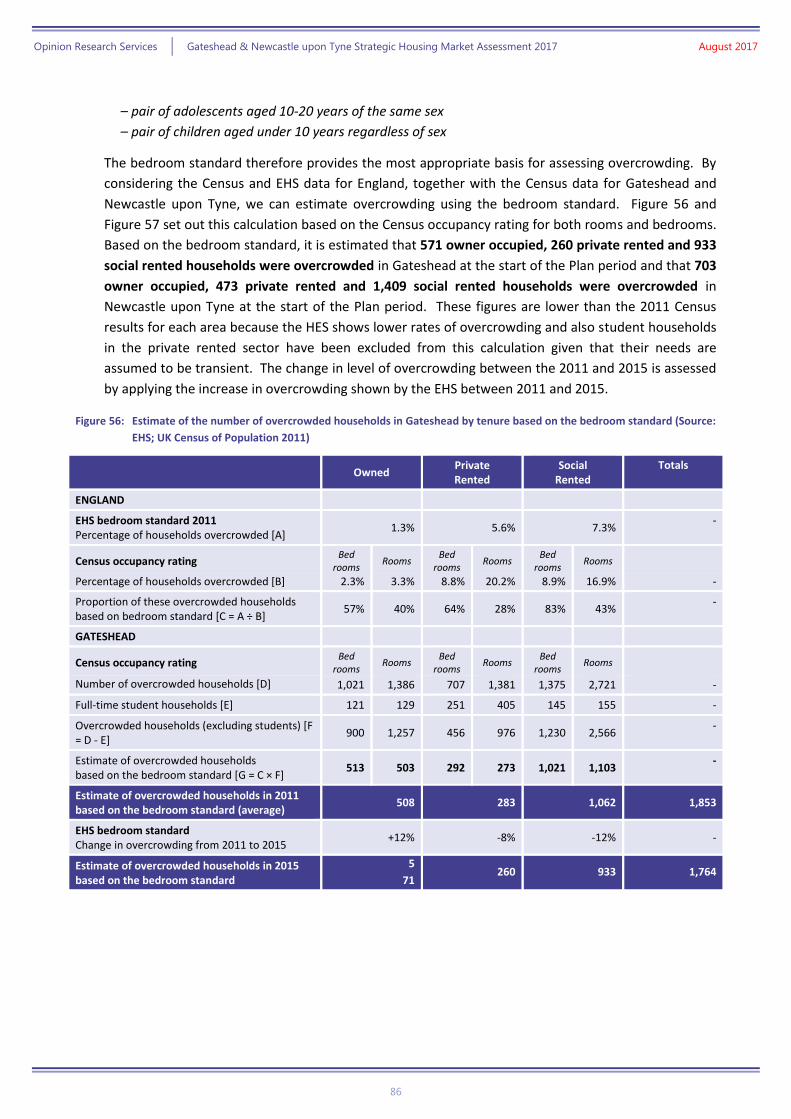
Opinion Research Services | Gateshead & Newcastle upon Tyne Strategic Housing Market Assessment 2017 August 2017
86
– pair of adolescents aged 10-20 years of the same sex
– pair of children aged under 10 years regardless of sex
The bedroom standard therefore provides the most appropriate basis for assessing overcrowding. By
considering the Census and EHS data for England, together with the Census data for Gateshead and
Newcastle upon Tyne, we can estimate overcrowding using the bedroom standard. Figure 56 and
Figure 57 set out this calculation based on the Census occupancy rating for both rooms and bedrooms.
Based on the bedroom standard, it is estimated that 571 owner occupied, 260 private rented and 933
social rented households were overcrowded in Gateshead at the start of the Plan period and that 703
owner occupied, 473 private rented and 1,409 social rented households were overcrowded in
Newcastle upon Tyne at the start of the Plan period. These figures are lower than the 2011 Census
results for each area because the HES shows lower rates of overcrowding and also student households
in the private rented sector have been excluded from this calculation given that their needs are
assumed to be transient. The change in level of overcrowding between the 2011 and 2015 is assessed
by applying the increase in overcrowding shown by the EHS between 2011 and 2015.
Figure 56: Estimate of the number of overcrowded households in Gateshead by tenure based on the bedroom standard (Source:
EHS; UK Census of Population 2011)
Owned Private Rented
Social Rented
Totals
ENGLAND
EHS bedroom standard 2011 Percentage of households overcrowded [A]
1.3% 5.6% 7.3% -
Census occupancy rating Bed
rooms Rooms
Bed rooms
Rooms Bed
rooms Rooms
Percentage of households overcrowded [B] 2.3% 3.3% 8.8% 20.2% 8.9% 16.9% -
Proportion of these overcrowded households based on bedroom standard [C = A ÷ B]
57% 40% 64% 28% 83% 43% -
GATESHEAD
Census occupancy rating Bed
rooms Rooms
Bed rooms
Rooms Bed
rooms Rooms
Number of overcrowded households [D] 1,021 1,386 707 1,381 1,375 2,721 -
Full-time student households [E] 121 129 251 405 145 155 -
Overcrowded households (excluding students) [F = D - E]
900 1,257 456 976 1,230 2,566 -
Estimate of overcrowded households based on the bedroom standard [G = C × F]
513 503 292 273 1,021 1,103 -
Estimate of overcrowded households in 2011 based on the bedroom standard (average)
508 283 1,062 1,853
EHS bedroom standard Change in overcrowding from 2011 to 2015
+12% -8% -12% -
Estimate of overcrowded households in 2015 based on the bedroom standard
5
71 260 933 1,764
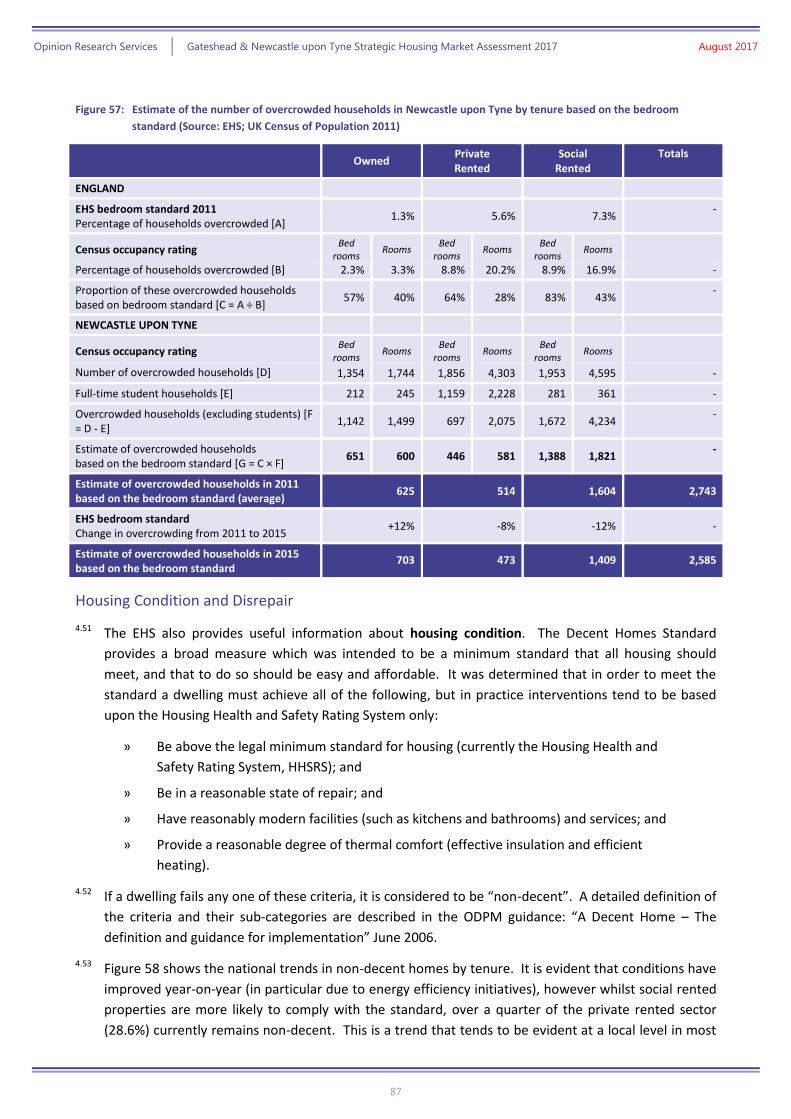
Opinion Research Services | Gateshead & Newcastle upon Tyne Strategic Housing Market Assessment 2017 August 2017
87
Figure 57: Estimate of the number of overcrowded households in Newcastle upon Tyne by tenure based on the bedroom
standard (Source: EHS; UK Census of Population 2011)
Owned Private Rented
Social Rented
Totals
ENGLAND
EHS bedroom standard 2011 Percentage of households overcrowded [A]
1.3% 5.6% 7.3% -
Census occupancy rating Bed
rooms Rooms
Bed rooms
Rooms Bed
rooms Rooms
Percentage of households overcrowded [B] 2.3% 3.3% 8.8% 20.2% 8.9% 16.9% -
Proportion of these overcrowded households based on bedroom standard [C = A ÷ B]
57% 40% 64% 28% 83% 43% -
NEWCASTLE UPON TYNE
Census occupancy rating Bed
rooms Rooms
Bed rooms
Rooms Bed
rooms Rooms
Number of overcrowded households [D] 1,354 1,744 1,856 4,303 1,953 4,595 -
Full-time student households [E] 212 245 1,159 2,228 281 361 -
Overcrowded households (excluding students) [F = D - E]
1,142 1,499 697 2,075 1,672 4,234 -
Estimate of overcrowded households based on the bedroom standard [G = C × F]
651 600 446 581 1,388 1,821 -
Estimate of overcrowded households in 2011 based on the bedroom standard (average)
625 514 1,604 2,743
EHS bedroom standard Change in overcrowding from 2011 to 2015
+12% -8% -12% -
Estimate of overcrowded households in 2015 based on the bedroom standard
703 473 1,409 2,585
Housing Condition and Disrepair
4.51 The EHS also provides useful information about housing condition. The Decent Homes Standard
provides a broad measure which was intended to be a minimum standard that all housing should
meet, and that to do so should be easy and affordable. It was determined that in order to meet the
standard a dwelling must achieve all of the following, but in practice interventions tend to be based
upon the Housing Health and Safety Rating System only:
» Be above the legal minimum standard for housing (currently the Housing Health and
Safety Rating System, HHSRS); and
» Be in a reasonable state of repair; and
» Have reasonably modern facilities (such as kitchens and bathrooms) and services; and
» Provide a reasonable degree of thermal comfort (effective insulation and efficient
heating).
4.52 If a dwelling fails any one of these criteria, it is considered to be “non-decent”. A detailed definition of
the criteria and their sub-categories are described in the ODPM guidance: “A Decent Home – The
definition and guidance for implementation” June 2006.
4.53 Figure 58 shows the national trends in non-decent homes by tenure. It is evident that conditions have
improved year-on-year (in particular due to energy efficiency initiatives), however whilst social rented
properties are more likely to comply with the standard, over a quarter of the private rented sector
(28.6%) currently remains non-decent. This is a trend that tends to be evident at a local level in most

Opinion Research Services | Gateshead & Newcastle upon Tyne Strategic Housing Market Assessment 2017 August 2017
88
areas where there are concentrations of private rented housing34, and there remains a need to
improve the quality of housing provided for households living in the private rented sector.
Figure 58: Trend in non-decent homes by tenure, England (Source: English House Condition Survey 2006 to 2007; English
Housing Survey 2008 onwards)
Housing Register Data 4.54 The local authority housing register and transfer lists are managed through a Choice Based Lettings
scheme. Households apply for a move via the scheme and ‘bid’ for homes along with applicants from
various sources, including homeless households, housing register and transfer applicants.
4.55 Figure 59 shows the trend in households on the housing register over the period since 2001. Whilst
the overall number of households on the housing register has varied over the period, as at April 2015
there were 8,000 applicants in 2015 in Gateshead at the base date of this SHMA and 5,700 in
Newcastle upon Tyne. Fluctuations in the numbers on the registers between 2012 and 2015 are
shown in Figure 60 and Figure 61. It should be noted that many people on the register are already in
council housing and are seeking transfers, while others have been on the register for many years
without bidding on any properties, so the figures are likely to be an over-estimate of the true level of
current need.
4.56 Figure 59 also shows the number recorded in a reasonable preference category since 2007.
Reasonable preference categories are defined in the Housing Act 1996, which requires “reasonable
preference” for housing to be given to people who are:
» Legally homeless;
» Living in unsatisfactory housing (as defined by the Housing Act 2004);
» Need to move on medical/welfare grounds; or
34
This was shown in a stock condition report produced for the Gateshead in 2013. ‘Dwelling level housing stock modelling and database for Gateshead Council, BRE, May 2013.
0%
5%
10%
15%
20%
25%
30%
35%
40%
45%
50%
2006 2007 2008 2009 2010 2011 2012 2013 2014
Owner occupied Social rented Private rented All dwellings

Opinion Research Services | Gateshead & Newcastle upon Tyne Strategic Housing Market Assessment 2017 August 2017
89
» Need to move to a particular area to avoid hardship.
4.57 However, the number in a reasonable preference category has been falling in Gateshead, but did rise
until 2014 in Newcastle upon Tyne.
Figure 59: Number of households on the local authority housing register 2001-16 (Note: Solid line shows total number of
households; dotted line shows number of households in a reasonable preference category. Source: LAHS and HSSA
returns to CLG)
4.58 Figure 60 and Figure 61 provide further detailed information for 2012-2015.
Figure 60: Number of households on the local authority housing register at 1st
April (Source: LAHS returns to CLG)
GATESHEAD 2012 2013 2014 2015
Total households on the housing waiting list 11,854 7,394 10,160 7,984
Total households in a reasonable preference category 1,353 621 620 328
People currently living in temporary accommodation who have been accepted as being homeless (or threatened with homelessness)
42 87 108 48
Other people who are homeless within the meaning given in Part VII of the Housing Act (1996), regardless of whether there is a statutory duty to house them
244 233 280 96
People occupying insanitary or overcrowded housing or otherwise living in unsatisfactory housing conditions
327 137 132 82
People who need to move on medical or welfare grounds, including grounds relating to a disability
369 211 165 128
People who need to move to a particular locality in the district of the authority, where failure to meet that need would cause hardship (to themselves or to others)
0 0 0 0
0
2,000
4,000
6,000
8,000
10,000
12,000
14,000
16,000
18,000
20,000
2001 2002 2003 2004 2005 2006 2007 2008 2009 2010 2011 2012 2013 2014 2015 2016
Gateshead Newcastle upon Tyne

Opinion Research Services | Gateshead & Newcastle upon Tyne Strategic Housing Market Assessment 2017 August 2017
90
Figure 61: Number of households on the local authority housing register at 1st April (Source: LAHS returns to CLG)
NEWCASTLE UPON TYNE 2012 2013 2014 2015
Total households on the housing waiting list 9,334 2,935 6,111 5,700
Total households in a reasonable preference category 205 278 924 780
People currently living in temporary accommodation who have been accepted as being homeless (or threatened with homelessness)
18 0 0 17
Other people who are homeless within the meaning given in Part VII of the Housing Act (1996), regardless of whether there is a statutory duty to house them
0 62 64 14
People occupying insanitary or overcrowded housing or otherwise living in unsatisfactory housing conditions
3 26 95 90
People who need to move on medical or welfare grounds, including grounds relating to a disability
126 107 324 335
People who need to move to a particular locality in the district of the authority, where failure to meet that need would cause hardship (to themselves or to others)
0 3 4 9
4.59 The number of people recorded as “occupying insanitary or overcrowded housing or otherwise living in
unsatisfactory housing conditions” was 82 in Gateshead and 90 in Newcastle upon Tyne in 2015. We
previously estimated that there were around 1,764 overcrowded households in Gateshead and 2,585
in Newcastle upon Tyne, based on the bedroom standard (Figure 56). Therefore, there are likely to be
many households who are not registered for affordable housing despite being overcrowded. This will
partly reflect their affordability (for example, most owner occupiers would not qualify for rented
affordable housing due to the equity in their current home) whilst others may only be temporarily
overcrowded and will have sufficient space available once a concealed family is able to leave and
establish an independent household.
4.60 When considering the types of household to be considered in housing need, the PPG also identified
“households containing people with social or physical impairment or other specific needs living in
unsuitable dwellings (e.g. accessed via steps) which cannot be made suitable in-situ” and “households
containing people with particular social needs (e.g. escaping harassment) which cannot be resolved
except through a move”. It is only through the housing register that we are able to establish current
estimates of need for these types of household, and not all would necessarily be counted within a
reasonable preference category. The housing register does not capture the need of households who
are currently living in the private sectors and who are not looking for social housing, but by the fact
that that they are not looking at social housing suggests that these households can meet their own
needs in the private sector, either through adaptation, buying or renting. However, the housing
register also doesn’t capture needs from those currently in the private sector who are receiving LHA,
because the benefits they are receiving are allowing them to afford their own housing costs.
4.61 In 2015 there were 128 people in Gateshead and 335 in Newcastle upon Tyne registered “who need to
move on medical or welfare grounds, including grounds relating to a disability” with 0 in Gateshead
and 9 in Newcastle upon Tyne registered “who need to move to a particular locality in the district of
the authority, where failure to meet that need would cause hardship (to themselves or to others)”.
However, some of these households are seeking to move within the social housing sector and hence
will also be included in the supply of dwelling vacated.

Opinion Research Services | Gateshead & Newcastle upon Tyne Strategic Housing Market Assessment 2017 August 2017
91
Households Unable to Afford their Housing Costs 4.62 The PPG emphasises in a number of paragraphs that affordable housing need should only include
those households that are unable to afford their housing costs:
Plan makers … will need to estimate the number of households and projected households who lack
their own housing or live in unsuitable housing and who cannot afford to meet their housing needs
in the market (ID 2a-022, emphasis added)
Plan makers should establish unmet (gross) need for affordable housing by assessing past trends
and recording current estimates of … those that cannot afford their own homes. Care should be
taken to avoid double-counting … and to include only those households who cannot afford to access
suitable housing in the market (ID 2a-024, emphasis added)
Projections of affordable housing need will need to take into account new household formation, the
proportion of newly forming households unable to buy or rent in the market area (ID 2a-025,
emphasis added)
Planning Practice Guidance (March 2014), ID 2a-022-025
4.63 Housing benefit data from the Department for Work and Pensions (DWP) provides reliable, consistent
and detailed information about the number of families that are unable to afford their housing costs in
each local authority area. Data was published annually from 2001-02 to 2006-07 which identified the
total number of claimants in receipt of housing benefit, and more detailed information has been
available since 2008-09 which includes more detailed information about claimants and the tenure of
their home.
Housing Benefit Claimants in Gateshead
4.64 Figure 62 shows the trend in the number of housing benefit claimants in Gateshead. Based on the
Census 2011 tenure this represents over 40% of households in the private rented sector and around
70% in the social rented sector.

Opinion Research Services | Gateshead & Newcastle upon Tyne Strategic Housing Market Assessment 2017 August 2017
92
Figure 62: Number of claimants in receipt of housing benefit in Gateshead by tenure (Source: DWP. Note: No breakdown by
tenure is available for the period 2001-07 and data for 2007-08 was not published)
4.65 Considering the information on tenure, it is evident that the number of claimants in social rented
housing reduced from 16,500 to 16,300 over the period 2008-09 to 2014-15 – a reduction of 200
families (1%). Over the same period the number of claimants in private rented housing increased from
3,800 to 5,200 families – an increase of 1,500 families (39%).
Housing Benefit Claimants in Newcastle upon Tyne
4.66 Figure 62 shows the trend in the number of housing benefit claimants in Newcastle upon Tyne. Based
on the Census 2011 tenure this represents around 25% of households in the private rented sector and
over 70% in the social rented sector.
16.5 17.0 17.2 17.4 17.3 16.6 16.3 15.9
3.8 4.5 4.6 4.9 5.2 5.2 5.2 5.0
20.9 21.2 20.8 19.9 19.2
20.1 20.3 21.5 21.8 22.3 22.5 21.8 21.5 20.9
-1.0
4.0
9.0
14.0
19.0
24.0
Tho
usa
nd
s
Total claimants Social rented Private rented

Opinion Research Services | Gateshead & Newcastle upon Tyne Strategic Housing Market Assessment 2017 August 2017
93
Figure 63: Number of claimants in receipt of housing benefit in Newcastle upon Tyne by tenure (Source: DWP. Note: No
breakdown by tenure is available for the period 2001-07 and data for 2007-08 was not published)
4.67 Considering the information on tenure, it is evident that the number of claimants in social rented
housing reduced from 24,900 to 24,800 over the period 2008-09 to 2014-15 – a reduction of 100
families (0.3%). Over the same period the number of claimants in private rented housing increased
from 4,700 to 7,100 families – an increase of around 2,300 families (8%).
4.68 The information published by DWP provides the detailed information needed for understanding the
number of households unable to afford their housing costs. Of course, there will be other households
occupying affordable housing who do not need housing benefit to pay discounted social or affordable
rents but who would not be able to afford market rents. Similarly there will be others who are not
claiming housing benefit support as they have stayed living with parents or other family or friends and
not formed independent households. However, providing that appropriate adjustments are made to
take account of these exceptions, the DWP data provides the most reliable basis for establishing the
number of households unable to afford their housing costs and estimating affordable housing need.
Establishing Affordable Housing Need 4.69 In establishing the Objectively Assessed Need for affordable housing, it is necessary to draw together
the full range of information that has already been considered in this report.
4.70 PPG sets out the framework for this calculation, considering both the current unmet housing need and
the projected future housing need in the context of the existing affordable housing stock:
How should affordable housing need be calculated?
This calculation involves adding together the current unmet housing need and the projected future
housing need and then subtracting this from the current supply of affordable housing stock.
Planning Practice Guidance (March 2014), ID 2a-022
24.9 25.4 25.6 25.7 25.8 25.0 24.8 23.9
4.7 5.7 6.3 6.7 7.2 7.3 7.1 6.8
30.9 30.7 29.5 29.5
28.1 28.4 29.6
31.1 31.9 32.4 33.0 32.2 31.9 30.8
-1.0
4.0
9.0
14.0
19.0
24.0
29.0
34.0
Tho
usa
nd
s
Total claimants Social rented Private rented

Opinion Research Services | Gateshead & Newcastle upon Tyne Strategic Housing Market Assessment 2017 August 2017
94
Current Unmet Need for Affordable Housing 4.71 In terms of establishing the current unmet need for affordable housing, the PPG draws attention again
to those types of households considered to be in housing need; whilst also emphasising the need to
avoid double-counting and including only those households unable to afford their own housing.
How should the current unmet gross need for affordable housing be calculated?
Plan makers should establish unmet (gross) need for affordable housing by assessing past trends
and recording current estimates of:
» the number of homeless households;
» the number of those in priority need who are currently housed in temporary accommodation;
» the number of households in overcrowded housing;
» the number of concealed households;
» the number of existing affordable housing tenants in need (i.e. householders currently housed in
unsuitable dwellings);
» the number of households from other tenures in need and those that cannot afford their own
homes.
Care should be taken to avoid double-counting, which may be brought about with the same
households being identified on more than one transfer list, and to include only those households
who cannot afford to access suitable housing in the market.
Planning Practice Guidance (March 2014), ID 2a-024
4.72 Earlier sections of this chapter set out the past trends and current estimates for relevant households
based on the data sources identified by PPG (using the start of the Plan period in 2015 as a reference
point where possible). Although this evidence does not provide the basis upon which to establish
whether or not households can afford to access suitable housing, we believe that it is reasonable to
assume that certain households will be unable to afford housing, otherwise they would have found a
more suitable home.
Establishing the Current Unmet Need for Affordable Housing
4.73 Households assumed to be unable to afford housing include:
» All households that are currently homeless;
» All those currently housed in temporary accommodation; and
» People in a reasonable preference category on the housing register, where their needs have not already been counted.
4.74 Given this context, our analysis counts the needs of all of these households when establishing the
Objectively Assessed Need for affordable housing at a base date of 2015.
4.75 Only a small share of households currently living in overcrowded housing (based on the bedroom
standard) are registered in a reasonable preference category, which will partly reflect their
affordability. It is likely that most owner occupiers would not qualify for rented affordable housing
(due to the equity in their current home); but it is reasonable to assume that households living in
overcrowded rented housing are unlikely to be able to afford housing, otherwise they would have
found a more suitable home.

Opinion Research Services | Gateshead & Newcastle upon Tyne Strategic Housing Market Assessment 2017 August 2017
95
4.76 Our analysis counts the needs of all households living in overcrowded rented housing when
establishing the OAN for affordable housing (which could marginally overstate the affordable housing
need) but it does not count the needs of owner occupiers living in overcrowded housing (which can
be offset against any previous over-counting). Student households living in private rented housing are
also excluded from the households in current need, given that their needs are assumed to be transient
and do not count towards the need for affordable housing in Gateshead and Newcastle upon Tyne.
The need for student housing is dealt with as part of a separate assessment rather than as part of the
SHMA, so overcrowding in student households is not considered here.
4.77 The analysis does not count people occupying insanitary housing or otherwise living in unsatisfactory
housing conditions as a need for additional affordable housing. These dwellings would be unsuitable
for any household, and enabling one household to move out would simply allow another to move in –
so this would not reduce the overall number of households in housing need. This housing need should
be resolved by improving the existing housing stock, and the Council has a range of statutory
enforcement powers to improve housing conditions through the Decent Homes Standard in the
Housing Act 2004.
4.78 When considering concealed families, it is important to recognise that some will not want separate
housing. For example, concealed families with older family representatives may be living with another
family, perhaps for cultural reasons or in order to receive help or support due to poor health.
However, those with younger family representatives are more likely to be experiencing affordability
difficulties or other constraints (although not all will want to live independently).
4.79 Concealed families in a reasonable preference category on the housing register will be counted
regardless of age, but our analysis also considers the additional growth of concealed families with
family representatives aged under 55 (even those not registered on the housing register) and
assumes that all such households are unlikely to be able to afford housing (otherwise they would have
found a more suitable home).
4.80 The long term increase in concealed households aged under 55 is used in place of the total number of
concealed households aged under 55 as this increase in need is a likely consequence of housing
affordability problems. PPG identifies that this among other indicators “demonstrate un-met need for
housing” and that “longer term increase in the number of such households may be a signal to consider
increasing planned housing numbers” (ID 2a-019).
4.81 Therefore the needs of these households are counted when establishing the OAN for affordable
housing and they also add to the OAN for overall housing, as concealed families are not counted by
the CLG household projections.
4.82 Figure 64 sets out the assessment of current affordable housing need for Gateshead

Opinion Research Services | Gateshead & Newcastle upon Tyne Strategic Housing Market Assessment 2017 August 2017
96
Figure 64: Assessing current unmet gross need for affordable housing for Gateshead (Source: ORS Housing Model; Note: totals
may not sum due to rounding)
GATESHEAD Affordable Housing Increase in
Overall Housing Need Gross Need Supply
Homeless households in priority need (see Figure 50)
Currently in temporary accommodation in communal establishments (Bed and breakfast or Hostels)
2 2
Currently in temporary accommodation in market housing (Private sector leased or Private landlord)
2
Currently in temporary accommodation in affordable housing (Local Authority or RSL stock)
18 18
Households accepted as homeless but without temporary accommodation provided
33 33
Concealed households (see Figure 51)
Growth in concealed families with family representatives aged under 55 223 223
Overcrowding based on the bedroom standard (see Figure 56)
Households living in overcrowded private rented housing 260
Households living in overcrowded social rented housing 933 933
Other households living in unsuitable housing that cannot afford their own home (see Figure 60)
People who need to move on medical or welfare grounds, including grounds relating to a disability
128 9
People who need to move to a particular locality in the district of the authority, where failure to meet that need would cause hardship (to themselves or to others)
0 0
TOTAL 1,599 960 258
4.83 Based on a detailed analysis of the past trends and current estimates of households considered to be
in housing need, our analysis has concluded that 1,599 households are in affordable housing need in
Gateshead and unable to afford their own housing. This assessment is based on the criteria set out in
the PPG and avoids double-counting (as far as possible).
4.84 Of these households, 960 currently occupy affordable housing that does not meet the households’
current needs, mainly due to overcrowding. Providing suitable housing for these households will
enable them to vacate their existing affordable housing, which can subsequently be allocated to
another household in need of affordable housing. There is, therefore, a net need from 639
households (1,599 less 960 = 639) who currently need affordable housing and do not currently
occupy affordable housing in Gateshead (although a higher number of new homes may be needed to
resolve all of the identified overcrowding).
4.85 This number includes 258 households that would not be counted by the household projections. There
is, therefore, a need to increase the housing need based on demographic projections to accommodate
these additional households.
4.86 Providing the net additional affordable housing needed will release back into the market (mainly in the
private rented sector) the dwellings occupied by a total of 381 households (1,599 less 960+258) that
are currently in affordable housing need who are unable to afford their own housing.
4.87 Figure 65 sets out the assessment of current affordable housing need for Newcastle upon Tyne.

Opinion Research Services | Gateshead & Newcastle upon Tyne Strategic Housing Market Assessment 2017 August 2017
97
Figure 65: Assessing current unmet gross need for affordable housing for Newcastle upon Tyne (Source: ORS Housing Model;
Note: totals may not sum due to rounding)
NEWCASTLE UPON TYNE Affordable Housing Increase in
Overall Housing Need Gross Need Supply
Homeless households in priority need (see Figure 50)
Currently in temporary accommodation in communal establishments (Bed and breakfast or Hostels)
9 9
Currently in temporary accommodation in market housing (Private sector leased or Private landlord)
0
Currently in temporary accommodation in affordable housing (Local Authority or RSL stock)
25 25
Households accepted as homeless but without temporary accommodation provided
11 11
Concealed households (see Figure 51)
Growth in concealed families with family representatives aged under 55 379 379
Overcrowding based on the bedroom standard (see Figure 56)
Households living in overcrowded private rented housing 473
Households living in overcrowded social rented housing 1,409 1,409
Other households living in unsuitable housing that cannot afford their own home (see Figure 60)
People who need to move on medical or welfare grounds, including grounds relating to a disability
335 28
People who need to move to a particular locality in the district of the authority, where failure to meet that need would cause hardship (to themselves or to others)
9 1
TOTAL 2,650 1,463 399
4.88 Based on a detailed analysis of the past trends and current estimates of households considered to be
in housing need, our analysis has concluded that 2,650 households are in affordable housing need in
Newcastle upon Tyne and unable to afford their own housing. This assessment is based on the
criteria set out in the PPG and avoids double-counting (as far as possible).
4.89 Of these households, 1,463 currently occupy affordable housing that does not meet the households’
current needs, mainly due to overcrowding. Providing suitable housing for these households will
enable them to vacate their existing affordable housing, which can subsequently be allocated to
another household in need of affordable housing. There is, therefore, a net need from 1,187
households (2,650 less 1,463 = 1,187) who currently need affordable housing and do not currently
occupy affordable housing in Newcastle upon Tyne (although a higher number of new homes may be
needed to resolve all of the identified overcrowding).
4.90 This number includes 399 households that would not be counted by the household projections. There
is, therefore, a need to increase the housing need based on demographic projections to accommodate
these additional households.
4.91 Providing the net additional affordable housing needed will release back into the market (mainly in the
private rented sector) the dwellings occupied by a total of 788 households (2,650 less 1,463+399) that
are currently in affordable housing need who are unable to afford their own housing.

Opinion Research Services | Gateshead & Newcastle upon Tyne Strategic Housing Market Assessment 2017 August 2017
98
Projected Future Affordable Housing Need 4.92 In terms of establishing future projections of affordable housing need, the PPG draws attention to new
household formation (in particular the proportion of newly forming households unable to buy or rent
in the market area) as well as the number of existing households falling into need.
How should the number of newly arising households likely to be in housing need be calculated?
Projections of affordable housing need will need to take into account new household formation, the
proportion of newly forming households unable to buy or rent in the market area, and an estimation
of the number of existing households falling into need. This process should identify the minimum
household income required to access lower quartile (entry level) market housing (plan makers
should use current cost in this process, but may wish to factor in changes in house prices and
wages). It should then assess what proportion of newly-forming households will be unable to access
market housing.
Planning Practice Guidance (March 2014), ID 2a-025
4.93 The ORS Housing Mix Model considers the need for market and affordable housing on a longer-term
basis that is consistent with household projections and Objectively Assessed Need. The Model
provides robust and credible evidence about the required mix of housing over the full planning period,
and recognises how key housing market trends and drivers will impact on the appropriate housing mix.
4.94 The Model uses a wide range of secondary data sources to build on existing household projections and
profile how the housing stock will need to change in order to accommodate the projected future
population. A range of assumptions can be varied to enable effective sensitivity testing to be
undertaken. In particular, the Model has been designed to help understand the key issues and provide
insight into how different assumptions will impact on the required mix of housing over future planning
periods.
4.95 The Housing Mix Model considers the future number and type of households based on the household
projections alongside the existing dwelling stock. Whilst the Model considers the current unmet need
for affordable housing (including the needs of homeless households, those in temporary
accommodation, overcrowded households, concealed households, and established households in
unsuitable dwellings or that cannot afford their own homes), it also provides a robust framework for
projecting the future need for affordable housing.
Households Unable to Afford their Housing Costs
4.96 PPG identifies that “projections of affordable housing need will need to take into account new
household formation, the proportion of newly forming households unable to buy or rent in the market
area, and an estimation of the number of existing households falling into need” (ID 2a-025); however,
the Model recognises that the proportion of households unable to buy or rent in the market area
will not be the same for all types of household, and that this will also differ between age cohorts.
Therefore, the appropriate proportion is determined separately for each household type and age
group.
4.97 The affordability percentages in Figure 66 are calculated using the most recent data published in2016
by DWP about housing benefit claimants alongside detailed information from the 2011 Census. There
are several assumptions underpinning the Model:
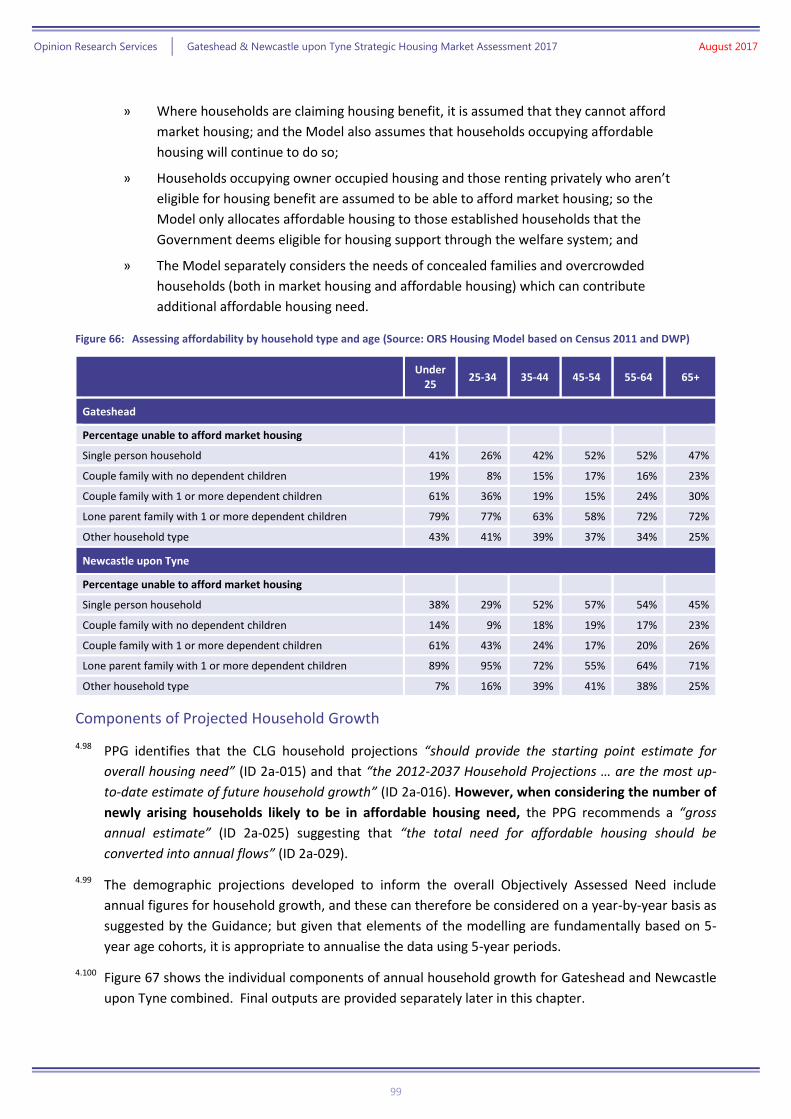
Opinion Research Services | Gateshead & Newcastle upon Tyne Strategic Housing Market Assessment 2017 August 2017
99
» Where households are claiming housing benefit, it is assumed that they cannot afford
market housing; and the Model also assumes that households occupying affordable
housing will continue to do so;
» Households occupying owner occupied housing and those renting privately who aren’t
eligible for housing benefit are assumed to be able to afford market housing; so the
Model only allocates affordable housing to those established households that the
Government deems eligible for housing support through the welfare system; and
» The Model separately considers the needs of concealed families and overcrowded
households (both in market housing and affordable housing) which can contribute
additional affordable housing need.
Figure 66: Assessing affordability by household type and age (Source: ORS Housing Model based on Census 2011 and DWP)
Under
25 25-34 35-44 45-54 55-64 65+
Gateshead
Percentage unable to afford market housing
Single person household 41% 26% 42% 52% 52% 47%
Couple family with no dependent children 19% 8% 15% 17% 16% 23%
Couple family with 1 or more dependent children 61% 36% 19% 15% 24% 30%
Lone parent family with 1 or more dependent children 79% 77% 63% 58% 72% 72%
Other household type 43% 41% 39% 37% 34% 25%
Newcastle upon Tyne
Percentage unable to afford market housing
Single person household 38% 29% 52% 57% 54% 45%
Couple family with no dependent children 14% 9% 18% 19% 17% 23%
Couple family with 1 or more dependent children 61% 43% 24% 17% 20% 26%
Lone parent family with 1 or more dependent children 89% 95% 72% 55% 64% 71%
Other household type 7% 16% 39% 41% 38% 25%
Components of Projected Household Growth
4.98 PPG identifies that the CLG household projections “should provide the starting point estimate for
overall housing need” (ID 2a-015) and that “the 2012-2037 Household Projections … are the most up-
to-date estimate of future household growth” (ID 2a-016). However, when considering the number of
newly arising households likely to be in affordable housing need, the PPG recommends a “gross
annual estimate” (ID 2a-025) suggesting that “the total need for affordable housing should be
converted into annual flows” (ID 2a-029).
4.99 The demographic projections developed to inform the overall Objectively Assessed Need include
annual figures for household growth, and these can therefore be considered on a year-by-year basis as
suggested by the Guidance; but given that elements of the modelling are fundamentally based on 5-
year age cohorts, it is appropriate to annualise the data using 5-year periods.
4.100 Figure 67 shows the individual components of annual household growth for Gateshead and Newcastle
upon Tyne combined. Final outputs are provided separately later in this chapter.

Opinion Research Services | Gateshead & Newcastle upon Tyne Strategic Housing Market Assessment 2017 August 2017
100
Figure 67: Components of average annual household growth by 5-year projection period in Gateshead and Newcastle upon
Tyne combined (Source: ORS Housing Model)
Annual average based on 5-year period Annual average
2015-30 2015-20 2020-25 2025-30
New household formation 6,366 6,386 6,605 6,452
Household dissolution following death 3,385 3,358 3,428 3,390
Net household growth within Gateshead and Newcastle upon Tyne
+2,981 +3,028 +3,177 +3,062
Household migration in 10,295 10,577 10,739 10,537
Household migration out 11,724 12,042 12,333 12,033
Net household migration -1,431 -1,465 -1,592 -1,496
Total household growth +1,550 +1,563 +1,585 +1,566
4.101 Over the initial 5-year period (2015-20) the model shows that:
» There are projected to be 6,366 new household formations each year; but this is offset
against 3,385 household dissolutions following death – so there is an average net
household growth of 2,981 households locally in Gateshead and Newcastle upon Tyne
» There are also projected to be 10,295 households migrating to Gateshead and Newcastle
upon Tyne offset against 11,724 households migrating away from the area – which yields
an reduction of 1,431 households attributable to net migration;
» The total household growth is therefore projected to be 1,550 (2,981 less 1,431)
households each year over the initial 5-year period of the projection.
4.102 During the course of the full 15-year projection period, annual net household growth is projected to
increase (from a gain of 1,550 households in 2015-20 to a gain of 1,585 households in 2025-30). This
coincides with a larger number of household dissolutions in later years (consistent with a larger
number of deaths), but new household formation is projected to marginally increase over the full
period.
4.103 Over the 15-year Plan period 2015-30, total household growth averages 1,566 households each year.
Change in Household Numbers by Age Cohort
4.104 To establish the proportion of newly forming households unable to buy or rent in the market area, it
is necessary to consider the characteristics of the 6,366 new households projected to form in
Gateshead and Newcastle upon Tyne each year over the period 2015-20 (Figure 67) alongside the
detailed information about household affordability (Figure 66).
4.105 Figure 68 shows the age structure of each of the components of household change. Note that this
analysis is based on changes within each age cohort, so comparisons are based on households born in
the same year and relate to their age at the end of the period. Therefore all new households are
properly counted, rather than only counting the increase in the number of households in each age
group.

Opinion Research Services | Gateshead & Newcastle upon Tyne Strategic Housing Market Assessment 2017 August 2017
101
Figure 68: Annual change in household numbers in each age cohort by age of HRP in Gateshead and Newcastle upon Tyne
combined (Source: ORS Housing Model)
4.106 Together with information on household type, this provides a framework for the Model to establish
the proportion of households who are unable to afford their housing costs.
4.107 The Model identifies that 31% of all newly forming households are unable to afford their housing
costs, which represents 1,974 households each year (Figure 69). The Model shows that a similar
proportion of households migrating to the area are unable to afford (32%), which represents 3,312
households moving in to the area. Some of these households will be moving to social rented housing,
but many others will be renting housing in the private rented sector with housing benefit support.
Together, there are 5,286 new households each year who are unable to afford their housing costs.
Figure 69: Affordability of new households over the initial 5-year period 2015-20 in Gateshead and Newcastle upon Tyne
combined (Source: ORS Housing Model)
All households
(annual average)
Households able to afford housing costs
Households unable to afford
housing costs
% unable to afford
housing costs
Newly forming households 6,366 4,392 1,974 31%
Households migrating in to the area 10,295 6,981 3,312 32%
All new households 16,659 11,373 5,286 32%
4.108 Having established the need for affordable housing and the dwellings likely to be vacated, the PPG
suggests that the total net need can be calculated by subtracting “total available stock from total gross
need” (ID 2a-029), but this over-simplifies what is a very complex system and typically results in an
overstatement of affordable housing needs.
4.109 It is essential to recognise that some households who are unable to buy or rent in the market area
when they first form may become able to afford their housing costs at a later date – for example:
» Two newly formed single person households may both be unable to afford housing, but
together they might create a couple household that can afford suitable housing;
» Similarly, not all households that are unable to afford housing are allocated affordable
housing, but remain part of the need until their circumstance improve;
-6,000
-4,000
-2,000
0
2,000
4,000
6,000
8,000
Under 25 25-34 35-44 45-54 55-64 65-74 75-84 85+
An
nu
al c
han
ge (
ho
use
ho
lds)
Age of HRP
New household formation Household dissolution following deathHousehold migration in Household migration out

Opinion Research Services | Gateshead & Newcastle upon Tyne Strategic Housing Market Assessment 2017 August 2017
102
» Some will choose to move to another housing market area and will therefore no longer
require affordable housing.
4.110 In these cases, and others, the gross need will need adjusting.
4.111 The Model recognises these complexities, and through considering the need for affordable housing as
part of a whole market analysis, it maintains consistency with the household projections and avoids
any double counting.
4.112 Considering those components of household change which reduce the number of households resident
in the area, the Model identifies 3,385 households are likely to dissolve following the death of all
household members. Many of these households will own their homes outright; however 37% are
unable to afford market housing: most living in social rented housing.
4.113 When considering households moving away from Gateshead and Newcastle upon Tyne, the Model
identifies that an average of 11,724 households will leave the area each year including 3,756 who are
unable to afford their housing costs. Some will be leaving social rented housing, which will become
available for another household needing affordable housing. Whilst others will not vacate a social
rented property, those unable to afford their housing costs will have been counted in the estimate of
current need for affordable housing or at the time they were a new household (either newly forming
or migrating in to the area). Whilst some of these households might prefer to stay in the area if
housing costs were less expensive or if more affordable housing was available, given that these
households are likely to move from the HMA it is appropriate that their needs are discounted to
ensure consistency with the household projections used to establish overall housing need.
4.114 Figure 70 summarises the total household growth. This includes the 5,286 new households on average
each year who are unable to afford their housing costs, but offsets this against the 5,012 households
who will either vacate existing affordable housing or who will no longer constitute a need for
affordable housing in Gateshead and Newcastle upon Tyne (as they have moved to live elsewhere).
Figure 70: Components of average annual household growth 2015-20 in Gateshead and Newcastle upon Tyne combined
(Source: ORS Housing Model)
All households
(annual average)
Households able to afford housing costs
Households unable to afford
housing costs
% unable to afford
housing costs
Newly forming households 6,366 4,392 1,974 31%
Households migrating in to the area 10,295 6,981 3,312 32%
All new households 16,659 11,373 5,286 32%
Household dissolutions following death 3,385 2,129 1,256 37%
Households migrating out of the area 11,724 7,969 3,756 32%
All households no longer present 15,109 10,098 5,012 33%
Average annual household growth 2015-20
1,550 1,276 274 18%
4.115 Overall, the Model projects that household growth will yield a net increase of 274 households on
average each year (over the period 2015-20) who are unable to afford their housing, which represents
18% of the 1,550 overall annual household growth for this period.

Opinion Research Services | Gateshead & Newcastle upon Tyne Strategic Housing Market Assessment 2017 August 2017
103
Projecting Future Needs of Existing Households
4.116 PPG also identifies that in addition to the needs of new households, it is also important to estimate
“the number of existing households falling into need” (ID 2a-025). Whilst established households that
continue to live in Gateshead and Newcastle upon Tyne will not contribute to household growth,
changes in household circumstances (such as separating from a partner or the birth of a child) can lead
to households who were previously able to afford housing falling into need. The needs of these
households are counted by the Model, and it is estimated that an average of 1,218 established
households fall into need each year in Gateshead and Newcastle upon Tyne.
4.117 Finally, whilst the PPG recognises that established households’ circumstances can deteriorate such
that they fall into need, it is also important to recognise that established households’ circumstances
can improve. For example:
» When two people living as single person households join together to form a couple,
pooling their resources may enable them to jointly afford their housing costs (even if
neither could afford separately). Figure 66 showed that for those aged 25 to 34 in
Gateshead, the proportions were 26% and 8% respectively.
» Households also tend to be more likely to afford housing as they get older, so young
households forming in the early years of the projection may be able to afford later in the
projection period. Figure 66 showed that 36% of couple families with dependent children
aged 25 to 34 could not afford housing in Gateshead, compared to 19% of such
households aged 35 to 44.
4.118 Given this context, it is clear that we must also recognise these improved circumstances which can
reduce the need for affordable housing over time, as households that were previously counted no
longer need financial support. The Model identifies that the circumstances of 1,030 households
improve each year such that they become able to afford their housing costs despite previously being
unable to afford.
4.119 Therefore, considering the overall changing needs of existing households, there is an average net
increase of 188 households (1,218 less 1,030 = 188) needing affordable housing each year.
Projecting Future Affordable Housing Need (average annual estimate)
4.120 Figure 71 provides a comprehensive summary of all of the components of household change that
contribute to the projected level of affordable housing need. More detail on each is provided earlier in
this Chapter.

Opinion Research Services | Gateshead & Newcastle upon Tyne Strategic Housing Market Assessment 2017 August 2017
104
Figure 71: Components of average annual household growth 2015-20 in Gateshead and Newcastle upon Tyne combined
(Source: ORS Housing Model)
All households
(annual average)
Households able to afford housing costs
Households unable to afford
housing costs
% unable to afford
housing costs
Newly forming households 6,366 4,392 1,974 31%
Households migrating in to the area 10,295 6,981 3,312 32%
All new households 16,659 11,373 5,286 32%
Household dissolutions following death 3,385 2,129 1,256 37%
Households migrating out of the area 11,724 7,969 3,756 32%
All households no longer present 15,109 10,098 5,012 33%
Average annual household growth 2015-20
1,550 1,276 274 18%
Existing households falling into need - -1,218 1,218 100%
Existing households climbing out of need - 1,030 -1,030 0%
Change in existing households - -188 188 -
Average annual future need for market and affordable housing 2015-20
1,550 1,088 462 30%
4.121 Overall, there is a projected need from 5,286 new households who are unable to afford their housing
costs (1,947 newly forming households and 3,312 households migrating to the area); however, 5,012
households will either vacate existing affordable housing or will no longer need affordable housing in
Gateshead and Newcastle upon Tyne (as they have moved to live elsewhere) thereby reducing the
new need to a net total of 274 households. While the Core Strategy and Urban Core Plan for
Gateshead and Newcastle upon Tyne 2010-2030 policy CS1135 is intended to attract in migration by
working families, this cannot be taken into account as it is an aspirational, “policy-on” factor, rather
than the “policy-off” assessment of the OAN.
4.122 Considering the needs of existing households, there are 1,218 households expected to fall into need
each year, but this is offset against 1,030 households whose circumstances are projected to improve.
There is, therefore, an average net increase of 188 existing households that need affordable housing
each year.
4.123 Based on the needs of new households and existing households, there is a projected increase of 462
households each year on average for the initial period 2015-20 who will need affordable housing (274
plus 188).
Assessing the Overall Need for Affordable Housing 4.124 Using the approach outlined above for the initial 5-year period of the projection, the Model considers
the need for affordable housing over the full 15-year projection period 2015-30. Figure 72 brings
together the information on assessing the unmet need for affordable housing in 2015 and the future
affordable housing need arising over the 15-year period 2015-30 for each of Gateshead and Newcastle
upon Tyne.
35
Policy CS11 requires “60% of new private housing across the plan area being suitable for and attractive to families, with a minimum target of 16,000 new homes to have three or more bedrooms”.
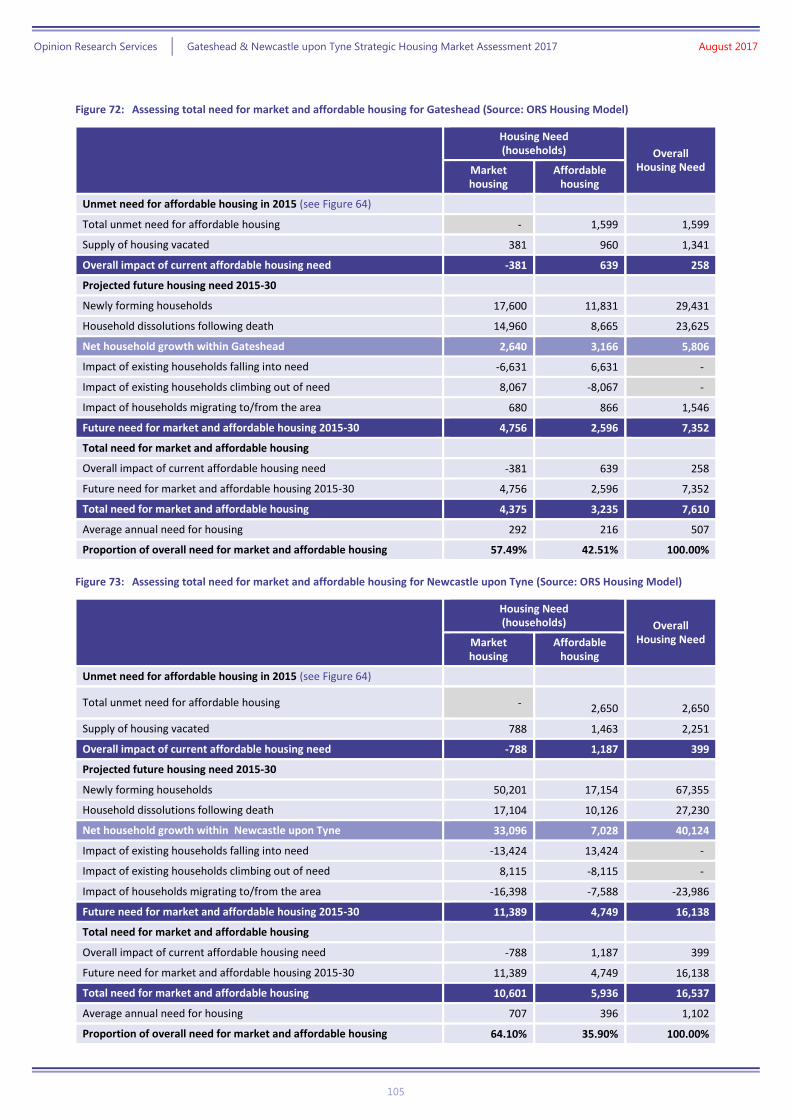
Opinion Research Services | Gateshead & Newcastle upon Tyne Strategic Housing Market Assessment 2017 August 2017
105
Figure 72: Assessing total need for market and affordable housing for Gateshead (Source: ORS Housing Model)
Housing Need (households) Overall
Housing Need Market housing
Affordable housing
Unmet need for affordable housing in 2015 (see Figure 64)
Total unmet need for affordable housing - 1,599 1,599
Supply of housing vacated 381 960 1,341
Overall impact of current affordable housing need -381 639 258
Projected future housing need 2015-30
Newly forming households 17,600 11,831 29,431
Household dissolutions following death 14,960 8,665 23,625
Net household growth within Gateshead 2,640 3,166 5,806
Impact of existing households falling into need -6,631 6,631 -
Impact of existing households climbing out of need 8,067 -8,067 -
Impact of households migrating to/from the area 680 866 1,546
Future need for market and affordable housing 2015-30 4,756 2,596 7,352
Total need for market and affordable housing
Overall impact of current affordable housing need -381 639 258
Future need for market and affordable housing 2015-30 4,756 2,596 7,352
Total need for market and affordable housing 4,375 3,235 7,610
Average annual need for housing 292 216 507
Proportion of overall need for market and affordable housing 57.49% 42.51% 100.00%
Figure 73: Assessing total need for market and affordable housing for Newcastle upon Tyne (Source: ORS Housing Model)
Housing Need (households) Overall
Housing Need Market housing
Affordable housing
Unmet need for affordable housing in 2015 (see Figure 64)
Total unmet need for affordable housing - 2,650 2,650
Supply of housing vacated 788 1,463 2,251
Overall impact of current affordable housing need -788 1,187 399
Projected future housing need 2015-30
Newly forming households 50,201 17,154 67,355
Household dissolutions following death 17,104 10,126 27,230
Net household growth within Newcastle upon Tyne 33,096 7,028 40,124
Impact of existing households falling into need -13,424 13,424 -
Impact of existing households climbing out of need 8,115 -8,115 -
Impact of households migrating to/from the area -16,398 -7,588 -23,986
Future need for market and affordable housing 2015-30 11,389 4,749 16,138
Total need for market and affordable housing
Overall impact of current affordable housing need -788 1,187 399
Future need for market and affordable housing 2015-30 11,389 4,749 16,138
Total need for market and affordable housing 10,601 5,936 16,537
Average annual need for housing 707 396 1,102
Proportion of overall need for market and affordable housing 64.10% 35.90% 100.00%

Opinion Research Services | Gateshead & Newcastle upon Tyne Strategic Housing Market Assessment 2017 August 2017
106
4.125 Figure 64 estimated there to be 1,599 households in need of affordable housing in 2015 in Gateshead
there to be 2,650 households in need of affordable housing in Newcastle upon Tyne. However, as
960 of these already occupied an affordable home in Gateshead and 1,463 in Newcastle upon Tyne,
our previous conclusion was therefore a net need from 639 households in Gateshead (1,599 less 960=
639) and 1,187 households in Newcastle upon Tyne (2,650 less 1,463 = 1,187) who need affordable
housing and do not currently occupy affordable housing.
4.126 The 15-year projection period 2015-30 then adopts the approach that was previously outlined for the
initial 5-year period of the projection. The Model identifies that the number of households in need of
affordable housing will increase by 2,596 households in Gateshead and 4,749 households in
Newcastle upon Tyne over the period 2015-30, alongside an increase of 4,756 households in
Gateshead and 11,389 in Newcastle upon Tyne able to afford market housing.
4.127 Overall, there will be a need to provide additional affordable housing for 3,235 households (3,277
dwellings) over the period 2015-30 in Gateshead (42.5% of the projected household growth) and
5,936 (6,014 dwellings) households in Newcastle upon Tyne (35.9% of the projected household
growth). This is equivalent to an average of 216 households per year in Gateshead and 396
households per year in Newcastle upon Tyne.
4.128 Any losses from the current affordable stock (such as demolition or clearance, or sales through Right
to Buy) would increase the number of affordable dwellings needed by an equivalent amount. The
Gateshead and Newcastle upon Tyne JCS includes provision for a small number of demolitions and
government policy sees an increasing role for Right to Buy sales, so losses can be expected from these
sources. Meanwhile any vacant affordable dwellings returned to use would count as part of the supply
necessary to meet the need for affordable housing.
Previous Assessments of Affordable Housing Need
4.129 The previous SHMA in Gateshead and Newcastle upon Tyne in 2013 came to different conclusions
regarding the affordable housing need figure. In summary there is no simple one point explanation of
why the Gateshead and Newcastle upon Tyne SHMA 2013 found a different figure for affordable
housing, but we would note that guidance was revised in 2014 so the current study is using a different
definition of affordable housing need and a different model to assess those in need of affordable
housing.
Future Policy on Housing Benefit in the Private Rented Sector
4.130 The Model recognises the importance of housing benefit and the role of the private rented sector.
The Model assumes that the level of housing benefit support provided to households living in the
private rented sector will remain constant; however, this is a national policy decision which is not in
the control of the Council.
4.131 It is important to note that private rented housing (with or without housing benefit) does not meet the
definitions of affordable housing. However, many tenants that rent from a private landlord can only
afford their housing costs as they receive housing benefit. These households aren’t counted towards
the need for affordable housing (as housing benefit enables them to afford their housing costs), but if
housing benefit support was no longer provided (or if there wasn’t sufficient private rented housing
available at a price they could afford) then this would increase the need for affordable housing.

Opinion Research Services | Gateshead & Newcastle upon Tyne Strategic Housing Market Assessment 2017 August 2017
107
4.132 The model adopts a neutral position in relation to this housing benefit support, insofar as it assumes
that the number of claimants in receipt of housing benefit in the private rented sector will remain
constant. The model does not count any dwellings in the private rented sector as affordable housing
supply; however it does assume that housing benefit will continue to help some households to afford
their housing costs, and as a consequence these households will not need affordable housing.
4.133 To sensitivity test this position, Figure 74 shows the impact of reducing (or increasing) the number of
households receiving housing benefit to enable them to live in the private rented sector.
4.134 If no households were to receive housing benefit support in the private rented sector households in
around 11,100 dwellings would need affordable housing compared to the ‘no change’ scenario. In this
scenario, it is also important to recognise that the private rented housing currently occupied by
households in receipt of housing benefit would be released back to the market, which is likely to have
significant consequences on the housing market that are difficult to predict.
Figure 74: Theoretical impact of reducing or increasing Housing Benefit support for households living in private rented housing:
Balance between households able to afford market housing and households needing affordable housing 2016-34 and
associated number of affordable dwellings
Conclusions 4.135 Based on the household projections previously established, we have established the balance between
the need for market housing and the need for affordable housing. This analysis has identified a need
to increase the overall housing need by 258 households in Gateshead and 399 households in
Newcastle upon Tyne to take account of concealed families and homeless households that would not
be captured by the household projections. These additional households increase the projected
household growth from 7,352 to 7,610 households in Gateshead (523 dwellings per annum) and
from 16,138 households to 16,537 households in Newcastle upon Tyne (1,128 dwellings per annum)
over the 15-year Plan period 2015-30; equivalent to an average of 507 households (523 dwellings)
per year in Gateshead and 1,102 households (1,128 dwellings) per year in Newcastle upon Tyne.
4.136 The housing mix analysis identified a need to provide affordable housing for 3,235 additional
households (3,277 dwellings) in Gateshead and 5,936 households (6,014 dwellings) in Newcastle
84%
73%
62%
51%
40%
28%
17%
16%
27%
38%
49%
60%
72%
83%
3,800 dwellings
6,600 dwellings
9,400 dwellings
12,200 dwellings
15,000 dwellings
17,800 dwellings
20,500 dwellings
0% 20% 40% 60% 80% 100%
50% increase
25% increase
No change
25% reduction
50% reduction
75% reduction
100% reduction
Households able to afford market housing Households needing affordable housing

Opinion Research Services | Gateshead & Newcastle upon Tyne Strategic Housing Market Assessment 2017 August 2017
108
upon Tyne over the 15-year period 2015-30 (an average of 216 households per year in Gateshead and
396 households per year in Newcastle upon Tyne). This would provide for the current unmet needs
for affordable housing in addition to the projected future growth in affordable housing need, but
assumes that the level of housing benefit support provided to households living in the private rented
sector remains constant.
4.137 Providing sufficient affordable housing for all households that would otherwise be living in the private
rented sector with housing benefit support would increase the need to around 11,100 affordable
homes over the period 2015-30; but it is important to recognise that, in this scenario, the private
rented housing currently occupied by households in receipt of housing benefit would be released back
to the market and this is likely to have significant consequences which would be difficult to predict.
4.138 Any losses from the current affordable stock (such as demolition or clearance, or sales through Right
to Buy) would increase the number of affordable dwellings needed by an equivalent amount.
Meanwhile any vacant affordable dwellings returned to use would count as part of the supply
necessary to meet the need for affordable housing. Both of these scenarios are important in
Gateshead and Newcastle upon Tyne with both areas having seen recent and projected future
demolitions to facilitate renewals, but also both areas having a number of hard to let properties which
are currently vacant. If these hard to let properties could be brought back in to use, then they can be
counted as the equivalent of new housing delivery in the area.

Opinion Research Services | Gateshead & Newcastle upon Tyne Strategic Housing Market Assessment 2017 August 2017
109
5. Objectively Assessed Need Analysing the evidence to establish overall housing need
5.1 The primary objective of this study is to establish the Objectively Assessed Need (OAN) for housing.
The OAN identifies the future quantity of housing that is likely to be needed (both market and
affordable) in the Housing Market Area over future plan periods. It is important to recognise that the
OAN does not take account of any possible constraints to future housing supply. Such factors will be
subsequently considered before establishing the final Housing Requirement.
The assessment of development needs is an objective assessment of need based on facts and
unbiased evidence. Plan makers should not apply constraints to the overall assessment of need,
such as limitations imposed by the supply of land for new development, historic under performance,
viability, infrastructure or environmental constraints. However, these considerations will need to be
addressed when bringing evidence bases together to identify specific policies within development
plans.
Planning Practice Guidance (PPG), paragraph 4
5.2 Figure 75 sets out the process for establishing OAN. It starts with a demographic process to derive
housing need from a consideration of population and household projections, as set out in chapter 3 of
the SHMA. To this, external market and macro-economic constraints are applied (‘market signals’), in
order to embed the need in the real world.
Figure 75: Process for establishing a Housing Number for the HMA (Source: ORS based on NPPF and PPG)

Opinion Research Services | Gateshead & Newcastle upon Tyne Strategic Housing Market Assessment 2017 August 2017
110
National Context for England 5.3 The NPPF requires Local Planning Authorities to “ensure that their Local Plan meets the full, objectively
assessed needs for market and affordable housing in the housing market area” and “identify the scale
and mix of housing and the range of tenures that the local population is likely to need over the plan
period which meets household and population projections, taking account of migration and
demographic change” (paragraphs 47 and 159).
5.4 PPG further identifies that “household projections published by the Department for Communities and
Local Government should provide the starting point estimate of overall housing need” (ID 2a-015 to
016).
Household Growth 5.5 The 2014-based CLG household projections show that the number of households in England will
increase from 22.7 million to 28.0 million over the 25-year period 2014 to 2039. This represents a
growth of 5.3 million households over 25 years, equivalent to an annual average of 210,300
households each year, and this provides the starting point estimate of overall housing need for
England. This Include 1,430 households per annum across Gateshead and Newcastle upon Tyne,
5.6 It should be noted that the annual average of 210,300 households is already much higher than current
housing delivery: provisional data for England published by CLG for the period April 2015 to March
2016 identifies that construction started on 139,700 dwellings and 139,700 dwellings were also
completed during the year. Therefore, to build sufficient homes to meet annual household growth
would require housebuilding to increase by over 50% – so providing for household growth in itself
would require a significant step-change in the number of homes currently being built.
International Migration 5.7 The 2014-based CLG household projections are based on the ONS 2014-based sub-national population
projections. Any internal migration with England cancels itself out as an in migrant to one local
authority is an out migrant to another local authority. However, the projections identify an average
net gain of 182,400 persons each year due to international migration, and a net loss of 6,200 persons
each year from England to other parts of the UK. Therefore, the 2014-based projections are based on
net migration averaging 176,100 persons each year.
5.8 However, these estimates for future international migration may be too low. Oxford University
research (March 2015) showed net international migration to be 565,000 persons over the 3-year
period 2011-14, an average of 188,300 per annum; and net migration to England averaged 211,200
persons annually between the Census in 2001 and 2011. Both figures suggest that the 2014-based
SNPP may underestimate international migration, which would have knock-on implications for
projected population growth.
5.9 As previously noted, longer-term projections typically benefit from longer-term trends and therefore
ORS normally consider migration based on trends for the 10-year period 2001-11. On this basis, our
trends are based on a period when net migration to England averaged 211,200 persons each year:
35,100 persons higher than assumed by the 2014-based SNPP, which represents an additional 15,400
households each year based on CLG average household sizes. Therefore, the approach taken for

Opinion Research Services | Gateshead & Newcastle upon Tyne Strategic Housing Market Assessment 2017 August 2017
111
establishing migration based on longer-term trends would increase household growth for England
from 210,300 households to 225,700 households each year on average.
Market Signals 5.10 The NPPF also sets out that “Plans should take account of market signals, such as land prices and
housing affordability” (ID 2a-017) and PPG identifies that “the housing need number suggested by
household projections (the starting point) should be adjusted to reflect appropriate market signals”.
5.11 The market signals identified include land prices, house prices, rents, affordability and the rate of
development; but there is no formula that can be used to consolidate the implications of this data.
Nevertheless, the likely consequence of housing affordability problems is an increase in overcrowding,
concealed and sharing households, homelessness and the numbers in temporary accommodation.
PPG identifies that these indicators “demonstrate un-met need for housing” and that “longer term
increase in the number of such households may be a signal to consider increasing planned housing
numbers” (ID 2a-019).
5.12 The Census identified that the number of concealed families living in England increased from 161,000
families to 276,000 families over the decade 2001 to 2011, which represents a growth of 115,000
families over 10 years. Although many concealed families do not want separate housing (in particular
where they have chosen to live together as extended families), others are forced to live together due
to affordability difficulties or other constraints – and these concealed families will not be counted as
part of the CLG household projections.
5.13 Concealed families with older family representatives will often be living with another family in order to
receive help or support due to poor health. Concealed families with younger family representatives
are more likely to demonstrate un-met need for housing. When we consider the growth of 115,000
families over the period 2001-11, over three quarters (87,100) have family representatives aged under
55, with substantial growth amongst those aged 25-34 in particular. This is a clear signal of the need
to increase the planned housing numbers in order to address the increase in concealed families over
the last decade and also factor in their impact on current and future average household sizes.
5.14 Addressing the increase in concealed families would increase projected household growth by 87,100
over the 25-year period, an average of 3,500 households each year over the period 2014-39 (or higher
if the need is addressed over a shorter period). Therefore, adjusting for longer-term migration trends
and taking account of the market signals uplift for concealed families yields an average household
growth for England of 229,200 each year.
Converting to Dwellings 5.15 Finally, in converting from households to dwellings we need to allow for a vacancy and second home
rate as not all dwellings will be occupied. At the time of the 2011 Census this figure was 4.3% of all
household spaces in England: we have applied this to future household growth, and on this basis the
growth of 229,200 households would require the provision of 239,500 dwellings each year across
England. This is the average number of dwellings needed every year over the 25-year period 2014-39
and represents a 1.0% increase in the dwelling stock each year.
5.16 This takes account of household growth based on CLG 2014-based projections (the starting point);
adjusts for long-term migration trends which assume a higher rate of net migration to England;

Opinion Research Services | Gateshead & Newcastle upon Tyne Strategic Housing Market Assessment 2017 August 2017
112
responds to market signals through providing for the growth of concealed families; and takes account
of vacant and second homes.
5.17 Whilst the uplift for market signals represents less than 2% of the projected household growth across
England, the household growth itself is much higher than current rates of housing delivery. The
identified housing need of 239,500 dwellings requires current housebuilding rates to increase by
71% (based on dwelling starts in 2015-16).
5.18 Development industry campaigners (such as Homes for Britain36) are supporting a position which
requires 245,000 homes to be built in England every year, a figure derived from the Barker Review
(2004)37. It is evident that objectively assessed need based on household projections which take
account of longer-term migration trends together with a market signals adjustment for concealed
families is consistent with this target, so any further increase in housing numbers at a local level (such
as adjustments which might be needed to deliver more affordable housing or provide extra workers)
must be considered in this context.
Establishing Objectively Assessed Need for Gateshead & Newcastle upon Tyne 5.19 The earlier part of this Chapter sets out the context for national change in households, and the
underlying complexities and features around this. We now move on to the positions for Gateshead
and Newcastle upon Tyne. Our approach for this section follows the format of the earlier section,
albeit with specific references to Gateshead and Newcastle upon Tyne. Essentially, therefore, this
section is concerned with:
» CLG 2014-based household projections (the starting point);
» Migration adjustments, based on 10-year 2005-15 longer-term migration trends;
» Market signals, including an uplift for concealed families;
» Converting from household growth to a requirement for dwellings, taking account of
vacancies and second homes.
5.20 In addition, we consider employment trends and the relationship between the jobs forecast and
projected number of workers.
CLG Household Projections 5.21 The “starting point” estimate for OAN is the CLG household projections, and the latest published data
is the 2014-based projections for period 2014-39. For the 15-year period 2015-30, these projections
suggest an overall growth of 6,406 households, equivalent to an average of 427 households per year
for Gateshead and 15,047 households, equivalent to an average of 1,003 household per year for
Newcastle upon Tyne.
5.22 However, the notes accompanying the CLG Household Projections explicitly state that:
The 2014-based household projections are linked to the Office for National Statistics 2014-
based sub-national population projections. They are not an assessment of housing need or
36 http://www.homesforbritain.org.uk 37 http://webarchive.nationalarchives.gov.uk/+/http:/www.hmtreasury.gov.uk/barker_review_of_housing_supply_recommendations.htm

Opinion Research Services | Gateshead & Newcastle upon Tyne Strategic Housing Market Assessment 2017 August 2017
113
do not take account of future policies, they are an indication of the likely increase in
households given the continuation of recent demographic trends.
Adjustments for Local Demography and Long-term Migration 5.23 ORS have reviewed and assessed household projections as part of this study, considering the Patient
Register, other data sources and migration based on 10-year trend 2005-15. In summary, for this
SHMA we took the initial starting position of 2014 based projections, but made a number of significant
adjustments to this data:
» The starting point mid year estimate 2015 was adjusted upwards for Gateshead and
downwards for Newcastle upon Tyne based on evidence from the patient register. In
both cases the adjustment mirrors issues with the population data from between 2001
and 2011.
» Migration trends were moved from 5 years in SNPP 2014 based to use 10 year migration
trends between 2005-15 to better reflect the long-term migration for both Gateshead and
Newcastle upon Tyne.
» A detailed analysis of the impact of students on the population and migration was
undertaken which showed that migration trends include a substantial growth in students,
but there is no expectation that this will continue in to the future. Therefore the net
impact of students has been removed from the migration data.
» Net migration from Newcastle upon Tyne to Gateshead grew from 2001 to 2011, for the
purposes of this study, and forecast trends, it has been assumed that the growth of
students in Newcastle led to an increase in out migration from Newcastle to Gateshead.
As previous student growth trends are expected to no longer continue it is also likely that
out migration to Gateshead will reduce. This assumption can be monitored over time.
5.24 On this basis, the data shows household numbers across the study area would increase over the 15-
year Plan period 2015-30 by an average of 490 per year in Gateshead and 1,076 per year in Newcastle
upon Tyne. These figures provide the most appropriate demographic projection on which to base the
Objectively Assessed Need (OAN) for housing.
Affordable Housing Need 5.25 The SHMA has undertaken a comprehensive analysis of the existing unmet need for affordable
housing. This analysis identified that the overall housing need should be increased by 258 households
in Gateshead and 399 households in Newcastle upon Tyne to take account of concealed families and
homeless households that would not be captured by the household projections. When the unmet
needs from existing households living in unsuitable housing were also included, the analysis
established there to be 1,599 households in need of affordable housing in 2015 in Gateshead there
to be 2,650 households in need of affordable housing in Newcastle upon Tyne.
5.26 However, as 960 of these already occupied an affordable home in Gateshead and 1,463 in Newcastle
upon Tyne, therefore there is a net need from 639 households in Gateshead (1,599 less 960= 639) and
1,187 households in Newcastle upon Tyne (2,650 less 1,463 = 1,187) who need affordable housing and
do not currently occupy affordable housing in 2015.
Opinion Research Services | Gateshead & Newcastle upon Tyne Strategic Housing Market Assessment 2017 August 2017
114
5.27 Based on the household projections, the SHMA has established the balance between the future need
for market housing and affordable housing. The analysis identifies that the number of households in
need of affordable housing will increase by 2,596 households in Gateshead and 4,749 households in
Newcastle upon Tyne over the period 2015-30, alongside an increase of 4,756 households in
Gateshead and 11,389 in Newcastle upon Tyne able to afford market housing.
5.28 Overall, there will be a need to provide additional affordable housing for 3,235 households (2,596 new
households + 639 households in current need) over the period 2015-30 in Gateshead (42.5% of the
projected household growth) and 5,936 households (4,749 new households + 1,187 households in
current need) in Newcastle upon Tyne (35.9% of the projected household growth). This is equivalent
to an average of 216 households per year in Gateshead and 396 households per year in Newcastle
upon Tyne.
5.29 These figures are significantly higher than those set out in the Gateshead and Newcastle upon Tyne
SHMA 2013, but that featured a different definition of affordable housing need and also used a
different model to assess households who require affordable housing.
5.30 Any losses from the current affordable stock (such as demolition or clearance, or sales through Right
to Buy) would increase the number of affordable dwellings needed by an equivalent amount.
Meanwhile any vacant affordable dwellings returned to use would count as part of the supply
necessary to meet the need for affordable housing. Both of these scenarios are important in
Gateshead and Newcastle upon Tyne with both areas having seen recent demolitions to facilitate
renewals, but also both areas having a number of hard to let properties which are currently vacant. If
these hard to let properties could be brought back in to use, then they can be counted as the
equivalent of new housing delivery in the area.
Need for Older Person Housing 5.31 The SHMA has identified that the institutional population is likely to increase by 414 persons aged 75
years or over in Gateshead and 593 persons in Newcastle upon Tyne. over the period 2015-30. This
increase in institutional population is a consequence of the CLG approach to establishing the
household population38, which assumes “that the share of the institutional population stays at 2011
levels by age, sex and relationship status for the over 75s” on the basis that “ageing population will
lead to greater level of population aged over 75 in residential care homes”.
5.32 However, it does not necessarily follow that all of the increase in institutional population should be
provided as additional bedspaces in residential institutions in Use Class C2; some of the specialist older
person housing may be more appropriate for their needs. Housing and planning policy in both
authorities seeks to keep households in their own homes for longer and therefore, it is likely that
additional nursing and care homes will not be provided. If that is the case then the needs of the
additional older persons will need to be factored in to the housing requirements for the area.
Employment Trends 5.33 While demographic trends are key to the assessment of OAN, it is also important to consider current
Employment Trends and how the projected growth of the economically active population fits with the
future changes in job numbers.
38 Household Projections 2012-based: Methodological Report, Department for Communities and Local Government, February 2015

Opinion Research Services | Gateshead & Newcastle upon Tyne Strategic Housing Market Assessment 2017 August 2017
115
“Plan makers should make an assessment of the likely change in job numbers based on past trends
and/or economic forecasts as appropriate and also having regard to the growth of the working age
population in the housing market area.
Where the supply of working age population that is economically active (labour force supply) is less
than the projected job growth, this could result in unsustainable commuting patterns (depending on
public transport accessibility or other sustainable options such as walking or cycling) and could
reduce the resilience of local businesses. In such circumstances, plan makers will need to consider
how the location of new housing or infrastructure development could help address these problems.”
Planning Practice Guidance 2014, paragraph 18
5.34 As noted in Figure 43, the economically active population of Gateshead is likely to increase by 4,381
persons over the 15-year period 2015-30. Meanwhile the economically active population of Newcastle
upon Tyne is likely to increase by 14,592 over the same time period. Therefore, between the two
authorities the economically active population is projected to grow by around 19,000 persons. This
equates to around 1,267 persons per annum.
5.35 The current Gateshead and Newcastle upon Tyne Joint Core Strategy sets a jobs growth target for the
two authorities of 22,000 additional jobs over the 20 year period 2010-30, or an average of 1,100
additional jobs per annum (based on a projection by Cambridge Econometrics). Figure 76 shows the
reported level of jobs in Gateshead and Newcastle upon Tyne combined for the period 2005-16. The
data is taken form the Annual Population Survey (APS) and is a sample survey with a margin of error.
This is shown by the bars on the number of jobs each year.
5.36 The chart shows that estimated jobs numbers go up and down from year to year, but this is as likely to
be an effect of sample variation as it is to reflect real changes in jobs. Therefore, it is best to look at
changes over a period of time using several points of data. On this basis the best estimate for the area
is that the number of jobs has probably grown by between 10,000 and 15,000 over the 11 year period,
or 900-1,350 per annum. Therefore, jobs growth recorded through the APS has been broadly
consistent with the Joint Core Strategy and also the projected growth in future economically active
persons in this study.

Opinion Research Services | Gateshead & Newcastle upon Tyne Strategic Housing Market Assessment 2017 August 2017
116
Figure 76: Number of jobs for Gateshead and Newcastle upon Tyne for 2005-2016 (Source: APS Workplace Jobs)
5.37 We would note that the estimates for economically active persons in this study do not consider a
range of important factors in balancing jobs and workers. These include:
» Falls in recorded unemployment;
» Falls in hidden unemployment as workers not registered as unemployed return to work;
» The impact of double jobbing – some workers hold more than one job; and
» The impact of commuting – if job growth exceeds the number of workers in Gateshead and
Newcastle upon Tyne then as an area which has traditional seen net in-commuting then this
could be expected to fill some jobs.
5.38 We would note at this point that the balance between jobs and workers is the only point where the
HMA becomes important in considering OAN. The draft North Tyneside Local Plan sets out a jobs
target which will be accommodated through growth in the local workforce in North Tyneside, but that
no additional out-commuting will occur. This means that Newcastle upon Tyne and Gateshead cannot
assume that any of their jobs growth will be met through out-commuting from North Tyneside.
5.39 Overall the effects of these changes are that more than 1,250 additional workers per annum will be
available to fill jobs in Gateshead and Newcastle upon Tyne. Therefore, unless the Councils wish to
significantly increase their jobs target there is no evidence that there will be a lack of workers to fill
any additional jobs which are created.

Opinion Research Services | Gateshead & Newcastle upon Tyne Strategic Housing Market Assessment 2017 August 2017
117
Market Signals 5.40 While demographic trends are key to the assessment of OAN, it is also important to consider current
Market Signals and how these may affect housing needs. PPG identifies a range of housing market
signals that should be considered when determining the future housing number. Key to this is how
market signals should be taken into account:
The housing need number suggested by household projections (the starting point) should be
adjusted to reflect appropriate market signals, as well as other market indicators of the balance
between the demand for and supply of dwellings (ID 2a-019)
A worsening trend in any of these indicators will require upward adjustment to planned housing
numbers compared to ones based solely on household projections (ID 2a-020)
Planning Practice Guidance (March 2014), ID 2a-019/020
5.41 The Market Signals include:
» Land and house prices;
» Rents and affordability;
» Rate of development; and
» Overcrowding.
5.42 Furthermore, there are other issues that should be considered, for example the macro-economic
climate (PAS OAN technical advice note, para 5.22). There are also wider market trends and drivers to
consider. A full range of market signals are reviewed and their implications are considered especially
where these may indicate undersupply relative to demand and the need to deviate from household
projections.
5.43 PPG and the PAS OAN technical advice note emphasise the importance of considering indicators in the
context of longer-term trends and looking at rates of change as well as absolute levels – for example,
house prices in the housing market may be higher or lower than the national average, however the
more important consideration is whether or not they are becoming more (or less) expensive at a rate
that differs from the national rates or rates in similar areas.
Appropriate comparisons of indicators should be made. This includes comparison with
longer term trends (both in absolute levels and rates of change) in the housing market area;
similar demographic and economic areas; and nationally.
Planning Practice Guidance (March 2014), ID 2a-020
5.44 To identify areas with similar demographic and economic characteristics to Gateshead and Newcastle
upon Tyne, we have analysed a range of comparative data. The data identified that Leeds, Liverpool
with Knowsley, Manchester with Salford and Sheffield have demographic and economic characteristics
that are similar to Gateshead and Newcastle upon Tyne; therefore, in considering market signals, we
have considered these areas as appropriate comparators and compared them against Gateshead and
Newcastle upon Tyne.

Opinion Research Services | Gateshead & Newcastle upon Tyne Strategic Housing Market Assessment 2017 August 2017
118
House Prices 5.45 House prices in the UK have been relatively volatile in the past 10 years. Prices increased by 8.7% in
the 12 months to June 201639; prices rose fastest in the East of England (14.3%), London (12.6%), and
the South East (12.3%).
5.46 The average UK house price was £214,000 in June 2016 compared to the peak of the previous high of
£190,000 in the three months August to October 2007, which was overtaken in 2014. Average house
price trends 2006 - 2016 as demonstrated by the House Price Index (HPI) show the price divergence
between London and the rest of the UK.
Figure 77: Annual house price rates of change, UK all
dwellings 2004-2016 (Source: Regulated
Mortgage Survey. Note: Not seasonally adjusted)
Figure 78: UK and London House Price Index 2008-2016
(Source: ONS)
5.47 The Bank of England has overall responsibility for UK monetary policy: it has become concerned about
the risks posed by house prices, high levels of borrowing and any housing ‘bubble’ to national
economic recovery. In his speech at the Mansion House in June 2014, the Governor of the Bank said:
“The underlying dynamic of the housing market reflects a chronic shortage of housing
supply, which the Bank of England can’t tackle directly.
To be clear, the Bank does not target asset price inflation in general or house prices in
particular.
It is indebtedness that concerns us.
This is partly because over-extended borrowers could threaten the resilience of the core of
the financial system since credit to households represents the lion’s share of UK banks’
domestic lending.
It is also because rapid growth in or high levels of mortgage debt can affect the stability of
the economy as a whole.”
5.48 These concerns remain. The Financial Policy Committee (FPC) Financial Stability Report July 201640
states:
39 https://www.ons.gov.uk/economy/inflationandpriceindices/bulletins/housepriceindex/june2016
0
50
100
150
200
UK London

Opinion Research Services | Gateshead & Newcastle upon Tyne Strategic Housing Market Assessment 2017 August 2017
119
“The FPC is alert to risks arising from household indebtedness. Survey evidence on the
housing market has been difficult to interpret in recent months because of the impact of the
pre-announced increase in stamp duty, which boosted activity in March and has dampened
activity in April and May. Nevertheless, in advance of the referendum, there was evidence
that uncertainty about the outcome was contributing to a slowdown in housing activity. For
example, the May RICS survey of chartered surveyors reported a sharp decline in new buyer
enquiries … to their lowest level since 2008. In the period since the referendum, the average
share price of the largest home construction firms has declined by 25%, compared with a 2%
rise in the FTSE All-Share index”
5.49 The FPC also states concern about the effects of rapid growth in the buy-to-let sector:
“The stock of buy-to-let lending grew by 12.3% in the year to 2016 Q1. Activity fell off
sharply in April, such that buy-to-let mortgage lending for house purchase was 85% lower
than in March.”
5.50 The risk centres on the possibility of buy-to-let investments “amplifying cycles in the housing market as
a whole” which “could put upward pressure on household indebtedness in an upswing and have an
impact on consumption and broader economic activity in a downturn.”
5.51 The RICS UK Residential Market Survey41 is updated monthly. While there are many uncertainties
following the June 2016 referendum, the July 2016 Survey gives an early indication of the direction of
prices in the short to medium term, and reports an increase in optimism among respondents:
“the net balance of those expecting prices to increase over the year ahead rising from zero to
+23%. Even so, this still represents a significant softening compared to six months ago, when
+66% more surveyors anticipated rising prices. For the second month running, the regional
breakdown shows London and East Anglia are the only areas in which prices are expected to
fall over the year ahead.”
5.52 Overall respondents to the Survey expect prices to rise over the medium term, with higher rises in
London compared to the UK:
“London exhibits amongst the strongest projections over the medium term (three-month average), with respondents pencilling in around 4% growth, per annum, over the next five years. On the same basis, prices are expected to rise by close to 3% nationally.”
5.53 The Survey suggests that, currently, an “acute shortage of property for sale” could be underpinning
prices.
Local House Prices
5.54 House price trends (2001-2016) are shown in Figure 79 based on lower quartile house prices. Of
course, the value of money has also changed during this period, therefore Figure 80 shows data
adjusted to take account of the impact of inflation. Therefore, the values in Figure 80 reflect real
changes which have occurred since 2001 when removing the impact of background inflation.
40 http://www.bankofengland.co.uk/publications/Pages/fsr/2016/jul.aspx
41 http://www.rics.org/uk/knowledge/market-analysis/rics-residential-market-survey/

Opinion Research Services | Gateshead & Newcastle upon Tyne Strategic Housing Market Assessment 2017 August 2017
120
Figure 79: House Price Trends: Lower Quartile Prices (Source: ONS. Note: HMA figures derived using population weighted
average of Local Authority data)
Figure 80: Real House Price Trends: Lower Quartile Prices adjusted to 2015 values using CPI (Source: ONS; Bank of England.
Note: HMA figures derived using population weighted average of Local Authority data)
5.55 It is evident that real house prices across Gateshead and Newcastle upon Tyne increased substantially
in the period 2004-2007. Nevertheless, values reduced by the start of 2009 and have largely fallen
until around 2014 when they started to increase again.
£0
£20,000
£40,000
£60,000
£80,000
£100,000
£120,000
£140,000
£160,000
2001 2002 2003 2004 2005 2006 2007 2008 2009 2010 2011 2012 2013 2014 2015 2016
Gateshead Newcastle upon Tyne Leeds
Liverpool & Knowsley Manchester & Salford Sheffield
ENGLAND
£0
£20,000
£40,000
£60,000
£80,000
£100,000
£120,000
£140,000
£160,000
£180,000
2001 2002 2003 2004 2005 2006 2007 2008 2009 2010 2011 2012 2013 2014 2015 2016
Gateshead Newcastle upon Tyne Leeds
Liverpool & Knowsley Manchester & Salford Sheffield
ENGLAND

Opinion Research Services | Gateshead & Newcastle upon Tyne Strategic Housing Market Assessment 2017 August 2017
121
5.56 Figure 81 shows how real house prices in Gateshead, Newcastle upon Tyne and the comparator areas
have varied when compared with the English average. This shows that real house prices in Gateshead
and Newcastle upon Tyne have stayed at a relatively consistent rate relative to the English average
over the period since 2009.
Figure 81: Real House Price Trends relative to England: Lower Quartile Prices adjusted to 2015 values using CPI (Source: ONS;
Bank of England. Note: HMA figures derived using population weighted average of Local Authority data)
Affordability 5.57 Figure 82 below shows the ratio of lower quartile house price to lower quartile earnings in Gateshead,
Newcastle upon Tyne and the comparator areas between 2001 and 2015. The ratio is calculated by
taking all house prices and, starting with the cheapest up to the most expensive, taking the properties
which are at the 25th percentile to represent the entry point for the house market. The same process
is followed with income, so the 25th percentile for earnings are taken the amount of money a first time
buyer is likely to have available to them to support a mortgage. This long term trend for Gateshead
and Newcastle upon Tyne is similar to comparator authorities; while worsening in the period 2003-07
(when there was an increase in real house prices), the multiplier has been relatively stable over the
period 2008-15.
-£80,000
-£60,000
-£40,000
-£20,000
£0
2001 2002 2003 2004 2005 2006 2007 2008 2009 2010 2011 2012 2013 2014 2015 2016
Gateshead Newcastle upon Tyne Leeds
Liverpool & Knowsley Manchester & Salford Sheffield
ENGLAND

Opinion Research Services | Gateshead & Newcastle upon Tyne Strategic Housing Market Assessment 2017 August 2017
122
Figure 82: Ratio of Lower Quartile House Price to Lower Quartile Earnings (Source: DCLG. Note: Ratios prior to 2013 are
calculated using a different source of house price data, HMA figures derived using population weighted average of
Local Authority data)
5.58 Of course, it is important to remember that affordability can be influenced by both supply side issues
(e.g. lower housing delivery levels) and demand side issues (e.g. availability of mortgage finance).
5.59 It is generally recognised that the availability and affordability of mortgage finance in the early part of
the last decade contributed to house price growth during this period. Borrowers were readily able to
access mortgages with high Loan-to-value (LTV) rates (including rates of 100% or more) based on high
income multipliers; with the associated interest rates being relatively low compared to previous years.
Standard variable rate mortgages were typically around 8% in the late 1990s (having previously been
much higher); but rates approached 5% by 2003 (when the Bank of England base rate was at 3.5%).
0.0
1.0
2.0
3.0
4.0
5.0
6.0
7.0
8.0
2001 2002 2003 2004 2005 2006 2007 2008 2009 2010 2011 2012 2013 2014 2015
Gateshead Newcastle upon Tyne Leeds
Liverpool & Knowsley Manchester & Salford Sheffield
ENGLAND

Opinion Research Services | Gateshead & Newcastle upon Tyne Strategic Housing Market Assessment 2017 August 2017
123
Private Rent 5.60 Private Rented Housing has become a significant part of the national housing offer; further, many
households with housing need are now meeting those needs in the sector.
5.61 The English Housing Survey confirmed that more households in England rent from private landlords
than councils or housing associations (4.3m cf. 3.9m in 2014-15). Given very limited new build private
rent supply, sector growth is driven by conversion of existing owner occupied stock to private rent,
either as individual homes or as Houses in Multiple Occupation (HMO).
5.62 The Institute of Mortgage Lenders Association (IMLA) forecasts suggest that the sector will continue to
increase in size in coming years. More than a third of all households could rent privately within two
decades – twice as many as today.
Figure 83: UK household tenure projections to 2032 (Source: DCLG/IMLA)
Private Rented Sector in Gateshead and Newcastle upon Tyne
5.63 Whilst the dominant form of housing tenure in both Gateshead and Newcastle upon Tyne continues to
be owner occupation, the owner occupied sector in Newcastle upon Tyne has declined relatively by 3.4
percentage points between 2001 and 2011. In the same period, the private rented sector has grown
by 7.1 percentage points in Newcastle upon Tyne and 5.8 percentage points in Gateshead. Affordable
housing is declining relative to other tenures and in gross stock numbers in both local authority areas.

Opinion Research Services | Gateshead & Newcastle upon Tyne Strategic Housing Market Assessment 2017 August 2017
124
Figure 84: Household Tenure by Area (Source: UK Census of Population 2001 and 2011. Note: Private Rent includes tied housing
and living rent free)
5.64 The rate of increase in the PRS is revealing: over the period 2001-11, the PRS sector has grown by 87%
in Gateshead and 62% in Newcastle upon Tyne.
5.65 It is important to recognise that the private rented sector in Gateshead and Newcastle upon Tyne is
growing via the conversion of other tenures rather than new build. PRS does not contribute
significantly to new housing supply; there is, however, considerable current interest in attracting
investment to boost new build PRS supply, particularly from Government42.
Private Sector Rents
5.66 Median rents have increased across most property sizes in both Gateshead and Newcastle upon Tyne
in the private rented sector over the period since 2013/14, however, average rents are below those
nationally across England. The upward trend would indicate that the sector still has growth potential
both nationally and locally.
42 Review of the Barriers to Institutional Investment in Private Rented Homes; Montague Review
58.6
49.9
58.6
50.9
42.6
58.7
64.1
13.4
20.4
19.4
21.6
26.7
16.5
18.2
28.0
29.7
22.0
27.6
30.6
24.8
17.7
0% 10% 20% 30% 40% 50% 60% 70%
Gateshead
Newcastle upon Tyne
Leeds
Liverpool & Knowsley
Manchester & Salford
Sheffield
England
Percentage of Households 2011
Owned Private Rent Social Rent
0.5
-3.4
-3.6
-4.0
-4.4
-1.4
-4.6
5.8
7.1
6.9
8.4
7.0
6.2
-6.3
-3.7
-3.3
-4.5
-5.9
-5.5
-1.6
-10% -6% -2% 2% 6% 10%
Net Change 2001-11

Opinion Research Services | Gateshead & Newcastle upon Tyne Strategic Housing Market Assessment 2017 August 2017
125
Figure 85: Median Monthly Rent Values (Source: Valuation Office Agency 2013-2016, Note: HMA figures derived using
population weighted average of Local Authority data)
April 2013-
March 2014
April 2014-
March 2015
April 2015-
March 2016
Gateshead
1 bedroom £395 £420 £425
2 bedroom £475 £475 £475
3 bedrooms £560 £550 £563
4 or more bedrooms £750 £750 £763
Newcastle upon Tyne
1 bedroom £450 £450 £460
2 bedroom £525 £550 £550
3 bedrooms £600 £625 £650
4 or more bedrooms £795 £950 £900
Leeds
1 bedroom £500 £495 £495
2 bedroom £600 £598 £600
3 bedrooms £775 £750 £780
4 or more bedrooms £1,625 £1,664 £1,092
Liverpool and Knowsley
1 bedroom £432 £447 £446
2 bedroom £524 £521 £521
3 bedrooms £555 £553 £559
4 or more bedrooms £788 £821 £792
Manchester and Salford
1 bedroom £535 £572 £566
2 bedroom £618 £676 £650
3 bedrooms £684 £746 £757
4 or more bedrooms £1,055 £1,142 £1,134
Sheffield
1 bedroom £475 £475 £495
2 bedroom £510 £525 £550
3 bedrooms £550 £575 £595
4 or more bedrooms £875 £900 £895
England
1 bedroom £500 £525 £550
2 bedroom £575 £595 £600
3 bedrooms £650 £675 £695
4 or more bedrooms £1,100 £1,175 £1,250
Housing Development 5.67 Census data shows that the number of unshared dwellings in Gateshead increased by 5,010 over the
10-year period 2001-11. The equivalent growth in Newcastle upon Tyne was 4,110 over the same time
period.

Opinion Research Services | Gateshead & Newcastle upon Tyne Strategic Housing Market Assessment 2017 August 2017
126
5.68 Figure 86 and Figure 87 compare the data from the Census against the data published by CLG and data
from the two councils. The CLG data suggests an annual average of 450 additional dwellings in
Gateshead over the period 2001-02 to 2015-16 and 420 additional dwelling per annum in Newcastle
upon Tyne over the period 2005-06 to 2015-16. Earlier data for Newcastle upon Tyne was not
recorded.
5.69 Based on the Councils’ own data, in the five years since 2011-12, net delivery in Gateshead has
averaged 310 additional dwellings per year and 360 per annum in Newcastle upon Tyne. However,
CLG data is lower for Gateshead, but higher for Newcastle upon Tyne.
Figure 86: Annual Housing Completions for Gateshead (Source: Gateshead BC AMR Data; CLG Live Tables; Census 2001 and
2011)
Figure 87: Annual Housing Completions for Newcastle upon Tyne (Source: Newcastle upon Tyne AMR Data; CLG Live Tables;
Census 2001 and 2011)
0
100
200
300
400
500
600
700
800
900
Dw
elli
ng
com
ple
tio
ns
Gateshead Data CLG Census (annual average)
-200
-100
0
100
200
300
400
500
600
700
800
900
Dw
elli
ng
com
ple
tio
ns
Newcastle Upon Tyne Data CLG Census (annual average)

Opinion Research Services | Gateshead & Newcastle upon Tyne Strategic Housing Market Assessment 2017 August 2017
127
5.70 In September 2016, The Financial Times reported that the official figures that the government uses for
policymaking undercount construction. They reported that data drawn from local authorities'
assessments for council tax purposes suggests that the official figures miss about 20 per cent of new
construction. Data that records the number of energy performance certificates issued to newly-built
homes suggests as many as a quarter of them may be missing from the official figures. Therefore,
nationally reported completions should be treated with caution.
Overcrowding 5.71 Overcrowding was considered in detail when establishing the need for affordable housing, and based
on the bedroom standard we estimated that in 2015, 1,764 households were overcrowded in
Gateshead (Figure 56), including 571 owner occupiers, 260 households renting privately and 933
households in the social rented sector; and that 2,585 households were overcrowded in Newcastle
upon Tyne, including 703 owner occupiers, 473 households renting privately and 1,409 households in
the social rented sector.
5.72 PPG also identifies a series of other factors to monitor alongside overcrowding, including concealed
and sharing households, homelessness and the numbers in temporary housing:
Indicators on overcrowding, concealed and sharing households, homelessness and the numbers in
temporary accommodation demonstrate un-met need for housing. Longer term increase in the
number of such households may be a signal to consider increasing planned housing numbers.
Planning Practice Guidance (March 2014), ID 2a-019
5.73 These were also considered when establishing the need for affordable housing, and the overall
housing number was increased to take account of the needs of homeless households and concealed
families with younger family representatives who would not have been counted as part of the
household projections. This adjustment has already been incorporated as a response to the identified
un-met need for housing, and can be considered as part of the response to market signals.

Opinion Research Services | Gateshead & Newcastle upon Tyne Strategic Housing Market Assessment 2017 August 2017
128
Summary of Market Signals 5.74 In terms of headline outputs, the market signals when compared to relevant comparator areas show:
Figure 88: Summary of Market Signals: Indicators Relating to Price (Note: Affordability Ratios prior to 2013 are calculated using
a different source of house price data, HMA figures derived using population weighted average of Local Authority
data)
Gateshead Newcastle upon Tyne
Leeds Liverpool & Knowsley
Manchester & Salford
Sheffield England
INDICATORS RELATING TO PRICE
House prices
Lower quartile house price
2015-16 price
£92,000 £111,000 £115,000 £76,800 £103,600 £102,000 £142,000
Relative to England
-35% -22% -19% -46% -27% -28% -
2010-11 price
£84,000 £100,000 £104,500 £78,500 £86,600 £90,000 £125,000
5-year change
+10% +11% +10% -2% +20% +13% +14%
Affordability
Lower quartile house price to earnings
2015 ratio 5.0 5.8 5.8 4.3 5.0 5.3 7.0
Relative to England
-28% -18% -17% -39% -29% -24% -
2010 ratio 4.9 5.5 5.7 3.9 4.8 5.3 6.7
5-year change
+4% +5% +1% +9% +5% +<1% +5%
Rents
Average monthly rent
2015-16 cost £517 £606 £671 £498 £671 £579 £820
Relative to England
-37% -26% -18% -39% -18% -29% -
2010-11 cost £515 £467 £614 £498 £515 £477 £694
5-year change
+<1% +30% +9% -<1% +30% +21% +18%
INDICATORS RELATING TO QUANTITY
Rate of development
Increase in stock
2001-11 change
5.7% 3.5% 7.1% 6.8% 13.6% 5.4% 8.3%
Relative to England
-31% -58% -15% -19% +63% -35% -
Overcrowding
Overcrowded households
2011 proportion
6.2% 9.1% 9.1% 8.8% 14.1% 9.5% 8.7%
Relative to England
-30% +4% +4% +1% +61% +9% -
2001 proportion
6.1% 7.8% 7.8% 7.5% 9.3% 6.3% 7.1%
10-year change
+1% +17% +17% +18% +52% +50% +23%
5.75 As acknowledged earlier in this section, there is no single formula that can be used to consolidate the
implications of this information; and furthermore the housing market signals will have been

Opinion Research Services | Gateshead & Newcastle upon Tyne Strategic Housing Market Assessment 2017 August 2017
129
predominantly influenced by relatively recent housing market trends. Nevertheless, on the basis of
this data we can conclude:
» House Prices: lower quartile prices are lower than the national average in both Gateshead
and Newcastle upon Tyne, with lower quartile prices of £92,000 and £111,000
respectively compared to England’s £142,000 (based on 2015-16 prices). The current
lower quartile price in the comparator area Liverpool and Knowsley is lower again at
£76,800; the prices in comparator areas Sheffield and Manchester and Salford are
£102,000 and £103,600 respectively; and lower quartile prices in Leeds are higher than
both Gateshead and Newcastle upon Tyne at £115,000. Prices in Gateshead and
Newcastle upon Tyne have risen at a similar rate to most of the comparator areas and the
national rate over the past 5 years; however there was a higher rate of increase in
Manchester and Salford (20%) and a small reduction in lower quartile prices in Liverpool
and Knowsley (-2%);
» Rents: for average private sector rents in 2015-16, both Gateshead and Newcastle upon
Tyne are lower than the national average, they are however broadly in line with private
sector rents in comparator areas. When we look at the growth in rent over the past 5
years, Newcastle upon Tyne has a higher rate of growth than the national average (30%
compared to growth of 18% in England as a whole) whereas the rate of growth in private
sector rents in Gateshead was less than 1%;
» Affordability (in terms of the ratio between lower quartile house prices and lower
quartile earnings) is much lower in both Gateshead and Newcastle upon Tyne than across
England as a whole (5.0 and 5.8 respectively cf. 7.0). This means for example in
Gateshead that lower quartile house prices are 5 times higher than the salary of a full-
time workers whose earnings are at the lower quartile. Affordability ratios have got
marginally “worse” since 2010, with the ratio in Gateshead increasing from 4.9 to 5.0 and
the ratio in Newcastle upon Tyne increasing from 5.5 to 5.8. This is in line with the
equivalent rate for England, where the ratio increased from 6.7 to 7.0, a change of 5%;
» Rate of development (in terms of increase in dwelling stock over the last 10 years) shows
that rate of development in Gateshead has been lower than England (5.7% cf. 8.3%). The
rate of development in Newcastle upon Tyne was lower again at 3.5%. Rates of
development were higher in most of the comparator areas than both Gateshead and
Newcastle upon Tyne with the rate of change in Manchester and Salford reaching 13.6%
over the last 10 years;
» Overcrowding (in terms of Census occupancy rates) shows that 6.2% of households in
Gateshead are overcrowded based on the objective measure of the Census proportion,
which is lower than England (8.7%). The proportion of overcrowded households in
Newcastle upon Tyne was slightly higher than England (9.1%). The proportion of
overcrowded households in Newcastle upon Tyne has increased over the last 10 years but
at a lower rate than England (17% cf. 23%). Overcrowding has also increased in
Gateshead but only marginally (1%). The proportion of overcrowded households and rate
of increase between 2001 and 2011 was much worse in comparator areas Manchester
and Salford and Sheffield.
5.76 Given this context, it is apparent that the indicators generally indicate that housing market pressure in
Gateshead and Newcastle upon Tyne are generally comparable to those in similar areas, with some

Opinion Research Services | Gateshead & Newcastle upon Tyne Strategic Housing Market Assessment 2017 August 2017
130
being a little better and some a little worse. Overall, (and given that many of these areas show lesser
pressures than the national average - in particular the market signals relating to price), conditions
across Gateshead and Newcastle upon Tyne suggest that the level of Objectively Assessed Need
should not be higher than suggested by household projections.
5.77 However, the analysis of overcrowding for the SHMA Update has already identified that the overall
housing need should be increased by 373 households in Gateshead and 586 households in Newcastle
upon Tyne to take account of concealed families and homeless households that would not be
captured by the household projections.
This specific adjustment should be incorporated as a response to market signals to take account of
the identified un-met need for housing, representing an uplift of 2.6% on the household projections,
which in turn are already 13.9% higher than the CLG starting point. Given the market signals
context, it is probably not appropriate to increase this uplift.
Housing Backlog 5.78 The Planning Advisory Service Good Plan Making Guide43 identifies that the SHMA should “re-set the
clock” and provide a new baseline assessment of all housing need. However, the SHMA must take
account of ‘backlog’: any unmet need for housing that exists at the start of the plan period.
“Having an up-to-date, robust Strategic Housing Market Assessment should re-set the clock,
and therefore carrying forward under-provision from a previous plan period would be
‘double counting’. Make sure however that the Strategic Housing Market Assessment takes
account of ‘backlog’ which is unmet need for housing that still exists at the start of the new
plan period (for example, the needs of the homeless and other households living in
unacceptable accommodation). The Strategic Housing Market Assessment should show all
those in need. It is therefore vitally important to have a properly done Strategic Housing
Market Assessment that has the right scope.” (page 49)
5.79 This SHMA has fully considered the unmet needs of homeless and other households living in
unacceptable accommodation (such as concealed families and sharing households) that existed in
2015. Furthermore, given that the SHMA also identifies all new housing need from the baseline date
of 2015, all needs arising over the 15-year period 2015-30 have been identified and there will be no
additional unmet need for housing to be counted for a new Plan with this base date.
Conclusions 5.80 We have calculated Objectively Assessed Need based on demographic projections and assessed these
against Market Signals to determine if a higher rate of housing delivery is necessary to address housing
market problems. This takes account of household growth based on CLG 2014-based projections (the
starting point); adjusts for long-term migration trends; responds to suppressed household formation
(through providing for the growth of concealed families); and takes account of vacant and second
homes.
5.81 The “starting point” estimate for OAN is the CLG household projections, and the latest published data
is the 2014-based projections for period 2014-39. Across the two authorities CLG Household
43 http://www.pas.gov.uk/documents/332612/6363137/Pages+from+FINAL+PAS+Good+Plan+Making+-6.pdf
Opinion Research Services | Gateshead & Newcastle upon Tyne Strategic Housing Market Assessment 2017 August 2017
131
Projections suggest a growth of 21,453 households over the 15-year period 2015-30; however, this is
based on short-term migration trends.
5.82 However, a comprehensive review of the local demographic evidence identifies some significant
discrepancies with the official population data for the area which affect the official population
projections, including issues with previous mid-year population estimates, migration flows and also the
impact of students on future projections. Consistent with PPG, the SHMA therefore takes full account
of these “factors affecting local demography” through developing independent household and
population projections based on 10-year migration trends. These scenarios show that household
numbers across the study area would increase by an average of 498 per year in Gateshead and 1,044
per year in Newcastle upon Tyne (based on trends for the period 2005-15) over the 15-year period
2015-30. These figures are the equivalent of 515 dwellings per annum in Gateshead and 1,068
dwelling per annum in Newcastle upon Tyne.
5.83 The baseline household projections should be increased by 657 households to take account of
concealed families and homeless households that would otherwise not be captured due to suppressed
household formation rates. This adjustment responds to identified un-met need for affordable
housing, and addresses suppressed household formation rates. Any new C2 provision does not count
as a contribution towards the housing requirement as this element of the population living in this type
of provision are outside the OAN assessment.
5.84 Providing for this increase in households and allowing for transaction vacancies and second homes
yields a baseline housing need of 24,772 dwellings; with 7,848 in Gateshead and 16,924 in Newcastle
upon Tyne.
5.85 While demographic projections form the starting point for Objectively Assessed Need calculations, it is
necessary to consider whether a higher rate of housing delivery may be needed to help address
housing market problems. Further adjustments may be needed in response to balancing jobs and
workers, market signals or any backlog of housing provision.
5.86 The evidence from planned jobs and workers identifies that there will be sufficient extra workers for
the forecast increase in jobs, so there is no need to increase housing delivery to provide any additional
workers. This does not taken account of the Core Strategy Policy CS11 aim of attracting working age
families as that policy is aspirational.
5.87 No uplift is proposed and this is an appropriate response to the market signal indicators. The overall
housing need has already been increased by 674 dwellings to take account of concealed families and
homeless households not captured by the household projections.
5.88 Figure 89 summarises each of the stages for establishing the Full Objectively Assessed Need for
Housing.

Opinion Research Services | Gateshead & Newcastle upon Tyne Strategic Housing Market Assessment 2017 August 2017
132
Figure 89: Full Objectively Assessed Need for Housing for Gateshead and Newcastle upon Tyne 2015-30
Gateshead Newcastle upon
Tyne Total
Demographic starting point: CLG household
projections 2015-30 6,406 15,047 21,453
Baseline household projections taking account of local
circumstances 7,352 16,138 23,490
Allowance for transactional vacancies and second
homes: based on dwellings without a usually resident
household
230 378 608
Dwellings 7,582 16,516 24,098
Adjustment for suppressed household formation
rates: concealed family growth 2001-11 and homeless
households (Figure 64 and Figure 65)
258 + 8 = 266 399 + 9 = 408 657 + 17 = 674
Baseline housing need based on demographic
projections 7,848 16,924 24,772
Further adjustments
needed…
In response to balancing
jobs and workers: 0 0 0
In response to market signals
0 0 0
Combined impact of the identified adjustments 0 0 0
Full Objectively Assessed Need for Housing 2015-30 7,848 16,924 24,772
5.89 Of course, it is important to remember that “establishing future need for housing is not an exact
science” (PPG ID 2a-014). Whilst the OAN must be underwritten by robust evidence that is based on
detailed analysis and informed by reasonable assumptions, the final conclusions should reflect the
overall scale of the housing needed in the housing market area without seeking to be spuriously
precise.
5.90 The SHMA therefore identifies the Full Objective Assessed Need for Housing in Gateshead to be 7,848
dwellings over the 15-year period 2015-30, equivalent to an average of 523 dwellings per year. This
includes the Objectively Assessed Need of Affordable Housing for 3,277 dwellings over the same
period, equivalent to an average of 218 per year.
5.91 The SHMA also identifies the Full Objective Assessed Need for Housing in Newcastle upon Tyne to be
16,924 dwellings over the 15-year period 2015-30, equivalent to an average of 1,128 dwellings per
year. This includes the Objectively Assessed Need of Affordable Housing for 6,014 dwellings over the
same period, equivalent to an average of 401 per year.
5.92 Importantly, these OAN figures are extremely close to those set out in the Joint Core Strategy for the
period 2015-30. Therefore, it would seem to be appropriate to continue with the Joint Core Strategy
housing target figures.

Opinion Research Services | Gateshead & Newcastle upon Tyne Strategic Housing Market Assessment 2017 August 2017
133
6. Housing needs of different groups
Considering the need for all types of housing
6.1 The National Planning Policy Framework states that Local Plans should meet the “full, objectively
assessed needs for market and affordable housing in the housing market area” (paragraph 47) and
identifies that local planning authorities should seek to “deliver a wide choice of high quality homes,
widen opportunities for home ownership and create sustainable, inclusive and mixed communities” and
plan for the “needs of different groups”:
To deliver a wide choice of high quality homes, widen opportunities for home ownership and create
sustainable, inclusive and mixed communities, local planning authorities should:
» plan for a mix of housing based on current and future demographic trends, market trends and
the needs of different groups in the community (such as, but not limited to, families with
children, older people, people with disabilities, service families and people wishing to build their
own homes);
» identify the size, type, tenure and range of housing that is required in particular locations,
reflecting local demand; and
» where they have identified that affordable housing is needed, set policies for meeting this need
on site, unless off-site provision or a financial contribution of broadly equivalent value can be
robustly justified (for example to improve or make more effective use of the existing housing
stock) and the agreed approach contributes to the objective of creating mixed and balanced
communities. Such policies should be sufficiently flexible to take account of changing market
conditions over time.
National Planning Policy Framework (NPPF), paragraph 50
6.2 On this basis, Planning Practice Guidance (PPG) sets out that:
Once an overall housing figure has been identified, plan makers will need to break this down by
tenure, household type (singles, couples and families) and household size. Plan makers should
therefore examine current and future trends of:
» the proportion of the population of different age profile;
» the types of household (e.g. singles, couples, families by age group, numbers of children and
dependents);
» the current housing stock size of dwellings (e.g. one, two+ bedrooms);
» the tenure composition of housing.

Opinion Research Services | Gateshead & Newcastle upon Tyne Strategic Housing Market Assessment 2017 August 2017
134
This information should be drawn together to understand how age profile and household mix relate
to each other, and how this may change in the future. When considering future need for different
types of housing, plan makers will need to consider whether they plan to attract a different age
profile e.g. increasing the number of working age people.
Planning Practice Guidance (March 2015), ID 2a-021
Projected Population Age Profile 6.3 Population projections based on long-term migration trends and which take account of local
demographic factors were considered in Chapter 3. These projections show that the population is
likely to increase from 203,100 persons to 212,700 persons over the 24-year period 2015-30; a 15-year
increase of around 9,600 persons. The equivalent growth for Newcastle upon Tyne is 30,700 persons.
Figure 90 and Figure 91 show the projected change in population by 5-year age band for the 15-year
Plan period 2015-30 based on the detailed data previously presented in Figure 35 for Gateshead and
Figure 37 for Newcastle upon Tyne.
6.4 The number of persons in most age groups is projected to increase, built for Gateshead the dominant
area for growth is in the population aged over 60 years. There is also projected to be strong growth
for Newcastle upon Tyne in the over 70 years category, but Newcastle upon Tyne does also have a
younger population than Gateshead and this is reflected in the projected growth in children in the
area. This is particularly important when establishing the types of housing required and the need for
housing specifically for older people. The large student population in Newcastle upon Tyne (42,565 in
2014/15) is also included in the figures and is reflected in the large number of 20-24 year olds.

Opinion Research Services | Gateshead & Newcastle upon Tyne Strategic Housing Market Assessment 2017 August 2017
135
Figure 90: Gateshead population projections 2015-30 by 5-year age cohort based SHMA population projections
0
2000
4000
6000
8000
10000
12000
14000
16000A
ged
0-4
Age
d 5
-9
Age
d 1
0-1
4
Age
d 1
5-1
9
Age
d 2
0-2
4
Age
d 2
5-2
9
Age
d 3
0-3
4
Age
d 3
5-3
9
Age
d 4
0-4
4
Age
d 4
5-4
9
Age
d 5
0-5
4
Age
d 5
5-5
9
Age
d 6
0-6
4
Age
d 6
5-6
9
Age
d 7
0-7
4
Age
d 7
5-7
9
Age
d 8
0-8
4
Age
d 8
5+
Tota
l po
pu
lati
on
2015 2030
-2,000
-1,000
0
1,000
2,000
3,000
4,000
5,000
6,000
Ne
t ch
ange
20
15
-30

Opinion Research Services | Gateshead & Newcastle upon Tyne Strategic Housing Market Assessment 2017 August 2017
136
Figure 91: Newcastle upon Tyne population projections 2015-30 by 5-year age cohort based SHMA population projections
Household Projections 6.5 Household projections are produced from the demographic analysis in the Housing Mix model in 5
year tranches. By considering the changes over time, it is possible to identify key trends which may
have implications for future housing need.
6.6 Figure 92 summarises the total number of households in 2015 and 2030 in terms of the age of
household representatives, together with the change in the number of households in each category
over the 15-years.
6.7 The trend-based household projections identified a growth of around 7,400 households for Gateshead
and 16,100 households for Newcastle upon Tyne. Nevertheless, the SHMA recommended that a
higher number of dwellings should be provided in order to respond to vacancies and second homes,
and suppressed household formation (Figure 89).
0
5,000
10,000
15,000
20,000
25,000
30,000
35,000
40,000
45,000A
ged
0-4
Age
d 5
-9
Age
d 1
0-1
4
Age
d 1
5-1
9
Age
d 2
0-2
4
Age
d 2
5-2
9
Age
d 3
0-3
4
Age
d 3
5-3
9
Age
d 4
0-4
4
Age
d 4
5-4
9
Age
d 5
0-5
4
Age
d 5
5-5
9
Age
d 6
0-6
4
Age
d 6
5-6
9
Age
d 7
0-7
4
Age
d 7
5-7
9
Age
d 8
0-8
4
Age
d 8
5+
Tota
l po
pu
lati
on
2015 2030
-3,000
-2,000
-1,000
0
1,000
2,000
3,000
4,000
5,000
6,000
7,000
Ne
t ch
ange
20
15
-30

Opinion Research Services | Gateshead & Newcastle upon Tyne Strategic Housing Market Assessment 2017 August 2017
137
Figure 92: Total projected households for 2015 and 2030 and summary of 15-year change by age of household representative
for Gateshead (Note: Figures may not sum due to rounding)
Age of Household Representative
TOTAL 15-24 25-34 35-44 45-54 55-64 65-74 75-84 85+
TOTAL HOUSEHOLDS
2015 3,700 14,100 14,700 17,200 14,900 13,300 9,700 3,500 91,100
2030 3,900 14,000 17,300 14,400 15,700 15,900 12,100 5,200 98,400
TOTAL CHANGE 2015-2030
+200 -200 +2,600 -2,800 +800 +2,700 +2,400 +1,700 +7,400
Figure 93: Total projected households for 2015 and 2030 and summary of 15-year change by age of household representative
for Newcastle upon Tyne (Note: Figures may not sum due to rounding)
Age of Household Representative
TOTAL 15-24 25-34 35-44 45-54 55-64 65-74 75-84 85+
TOTAL HOUSEHOLDS
2015 10,200 22,900 20,100 21,600 19,100 15,100 10,400 4,400 123,800
2030 11,700 23,300 24,700 20,100 20,000 19,700 14,200 6,200 139,900
TOTAL CHANGE 2015-2030
+1,600 +400 +4,600 -1,400 900 +4,600 +3,800 +1,800 +16,100
6.8 Considering this growth in terms of the age of household representatives, it is evident that a key
change is the increase in older people household types. Increase in households aged 65+ represents
92% of the household growth in Gateshead and 63% in Newcastle upon Tyne.
6.9 However, it is important to note that many of these older households will already be established and
living in existing homes; they will simply get older during the Plan period.
6.10 Further, it is therefore also important to consider household growth in relation to younger age cohorts
as this is more likely to lead to a need for new homes.
6.11 Whilst the increase in overall households is largest amongst those aged 65+, it is from amongst
younger aged households (i.e. those in their 20’s and 30’s) where the need for new homes will come.
However, the total number of new households is likely to be more than double the overall household
growth; so it is also important to recognise that many new households will buy or rent existing
housing, and not all new housing will be occupied by new households.
Projected Household Types
6.12 When considering future need for different types of housing, it is important to recognise that
households of different ages are likely to have different housing needs. Similarly, households of
different types (singles, couples and families) within each age group will also have different housing
needs.
Figure 94 and Figure 95 show the household numbers for 2015 and 2030 based on the trend-based
projections by household type and age; together with the net change for each group. This is based on
the number in each age category rather than the number in each age cohort, as it is assumed that the
housing needs are more likely to be influenced by the actual age rather than the year of birth.
6.13 In summary:

Opinion Research Services | Gateshead & Newcastle upon Tyne Strategic Housing Market Assessment 2017 August 2017
138
» Single person households represent a far large component of the growth in Newcastle upon
Tyne than in Gateshead;
» Lone parents are projected to grow in both boroughs;
» Couples without dependent children represent a much more important part of the growth in
Gateshead than in Newcastle upon Tyne;
» Couple families with dependent children represent only a small part of the growth in
Gateshead, but a higher share in Newcastle upon Tyne; and
» “Other” households represent over a quarter of the growth in both areas.
Figure 94: Total projected households for 2015 and 2030 and summary of 15-year change by household type and age of
household representative for Gateshead (Note: Figures may not sum due to rounding)
Household Type Age of Household Representative
TOTAL 15-24 25-34 35-44 45-54 55-64 65-74 75-84 85+
Total Households 2015
Single person 1,700 4,100 3,700 3,700 4,000 4,200 6,000 2,500 29,800
Couple without children 300 2,800 1,600 6,800 9,100 7,700 2,200 700 31,300
Couple with child(ren) 300 3,600 6,300 4,400 700 100 0 0 15,500
Lone parent 1,200 3,000 2,600 900 100 0 0 0 7,900
Other households 200 600 500 1,300 900 1,200 1,500 300 6,600
TOTAL 3,700 14,100 14,700 17,200 14,900 13,300 9,700 3,500 91,100
Total Households 2030
Single person 1,900 4,200 4,800 2,800 3,700 3,500 6,200 3,300 30,400
Couple without children 100 2,700 1,300 5,100 10,000 10,300 3,100 1,300 34,000
Couple with child(ren) 200 2,800 7,200 4,300 900 300 0 0 15,700
Lone parent 1,400 3,500 3,500 900 200 100 100 100 9,700
Other households 200 800 500 1,300 800 1,800 2,600 500 8,600
TOTAL 3,900 14,000 17,300 14,400 15,700 15,900 12,100 5,200 98,400
Total Change 2015-2030
Single person +300 +100 +1,100 -900 -300 -700 +200 +800 +600
Couple without children -200 -100 -300 -1,700 +900 +2,700 +1,000 +600 +2,700
Couple with child(ren) -100 -800 +900 -100 +200 +100 0 0 +200
Lone parent +300 +400 +900 0 +100 0 0 0 +1,800
Other households 0 +200 0 -100 -100 +600 +1,100 +200 +2,000
TOTAL CHANGE +200 -200 +2,600 -2,800 +800 +2,700 +2,400 +1,700 +7,400

Opinion Research Services | Gateshead & Newcastle upon Tyne Strategic Housing Market Assessment 2017 August 2017
139
Figure 95: Total projected households for 2015 and 2030 and summary of 15-year change by household type and age of
household representative for Newcastle upon Tyne (Note: Figures may not sum due to rounding)
Household Type Age of Household Representative
TOTAL 15-24 25-34 35-44 45-54 55-64 65-74 75-84 85+
Total Households 2015
Single person 1,300 7,500 5,000 6,000 7,000 6,500 6,800 3,100 43,400
Couple without children 1,100 5,400 2,200 6,100 9,100 7,300 2,100 900 34,200
Couple with child(ren) 300 3,400 8,600 6,500 1,600 200 0 0 20,700
Lone parent 1,000 3,400 3,600 1,800 400 100 100 0 10,300
Other households 6,500 3,300 800 1,100 900 1,000 1,300 300 15,200
TOTAL 10,200 22,900 20,100 21,600 19,100 15,100 10,400 4,400 123,800
Total Households 2030
Single person 400 8,000 6,300 5,500 7,600 8,300 8,600 4,300 49,000
Couple without children 1,200 5,500 2,200 4,200 8,700 9,800 3,100 1,500 36,300
Couple with child(ren) 200 1,900 10,400 7,600 2,600 500 0 100 23,200
Lone parent 600 3,300 5,100 2,300 500 200 200 100 12,300
Other households 9,400 4,600 700 600 600 1,000 2,200 200 19,200
TOTAL 11,700 23,300 24,700 20,100 20,000 19,700 14,200 6,200 139,900
Total Change 2015-2030
Single person -900 +500 +1,300 -500 +500 +1,800 +1,800 +1,200 +5,700
Couple without children 0 +200 0 -1,900 -400 +2,500 +1,000 +600 +2,000
Couple with child(ren) -100 -1,500 +1,800 +1,000 +1,000 +200 0 0 +2,400
Lone parent -300 -100 +1,500 +500 +200 +100 +100 0 +2,000
Other households +2,900 +1,300 0 -500 -400 0 +800 0 +4,100
TOTAL CHANGE +1,600 +400 +4,600 -1,400 +900 +4,600 +3,800 +1,800 +16,100
Housing Mix: Size and Tenure 6.14 When considering future need for different types of housing, the model assumes that the housing mix
needed by households of each household type and age will reflect current patterns. For example, a
growth in single person households aged 65-74 will lead to an increase in the need for the type of
housing currently occupied by single person households of this age. On this basis, where such
households continue to live in family housing despite no longer having a family living with them, this
need for family housing will still be counted.
6.15 Figure 96 and Figure 97 identifies the need for market housing and affordable housing of different
types (in terms of flats and houses) and sizes (in terms of number of bedrooms). Whilst there is
projected to be an increase of 5,700 extra single person households in Newcastle upon Tyne, only
2,807 extra dwellings have one bedroom (631 market homes and 2,175 affordable homes). This
reflects that many single person households will continue to occupy family housing in which they
already live.
6.16 The number of flats with more than 2 bedrooms is too small to be reported separately and is included
within “2+ bedrooms”.
6.17 The housing mix figures are based upon current rates of occupation of market housing by different household sizes. Homes which could have been capable of providing a home for families have in the past been lost to the increasing student and HMO market. To ensure the provision of family housing, Gateshead and Newcastle Core Strategy 2010-2030 (adopted 2015) sets out in Policy CS11 “Providing a Range and Choice of Housing” a requirement for: “60% of new private housing across the plan area

Opinion Research Services | Gateshead & Newcastle upon Tyne Strategic Housing Market Assessment 2017 August 2017
140
being suitable for and attractive to families, with a minimum target of 16,000 new homes to have three or more bedrooms.” This objective represents the Councils attempt take positive action to retain and attract working families in view of the economic growth aspirations and is to be carried through the plan period to 2030. The Core Strategy has been tested via Examination in Public and is part of the overall adopted long term spatial strategy and strategic policy for both areas. While the OAN figures in Figure 94 and Figure 95 necessarily objectively reflect the current situation, policy CS11 reflects the need to ensure thriving communities and economic development.
Figure 96: Housing mix of OAN for market and affordable housing in Gateshead (Source: ORS Housing Model. Note: Figures may
not sum exactly due to arithmetic rounding)
GATESHEAD Market Housing
Affordable Housing
TOTAL
Flat 1 bedroom 139 746 885
2+ bedrooms 122 252 373
House
2 bedrooms 2,394 889 3,283
3 bedrooms 1,887 970 2,857
4 bedrooms 85 333 418
5+ bedrooms -56 88 32
TOTAL 4,571 3,277 7,848
Figure 97: Housing mix of OAN for market and affordable housing in Newcastle upon Tyne (Source: ORS Housing Model. Note:
Figures may not sum exactly due to arithmetic rounding)
NEWCASTLE UPON TYNE Market Housing
Affordable Housing
TOTAL
Flat 1 bedroom 631 2,175 2,807
2+ bedrooms 2,746 901 3,647
House
2 bedrooms 1,568 854 2,422
3 bedrooms 5,022 1,474 6,496
4 bedrooms 934 472 1,406
5+ bedrooms 9 137 146
TOTAL 10,910 6,014 16,924
Affordable Housing Tenure
6.18 Within the overall need of affordable homes identified by the model, it is possible to consider the mix
of different affordable housing products that would be appropriate based on the mix of households
needing affordable housing.
6.19 The following two Figures set out the weekly rents for different property sizes in Gateshead and
Newcastle upon Tyne. This includes:
» Median private rent;
» Local Housing Allowance (LHA) maximum (previously based on the 30th percentile private
rent, however more recent increases are based on Consumer Price index (CPI) and rates were
frozen in the July 2015 Budget; and
» Affordable rent, based on 80% of the median private rent;
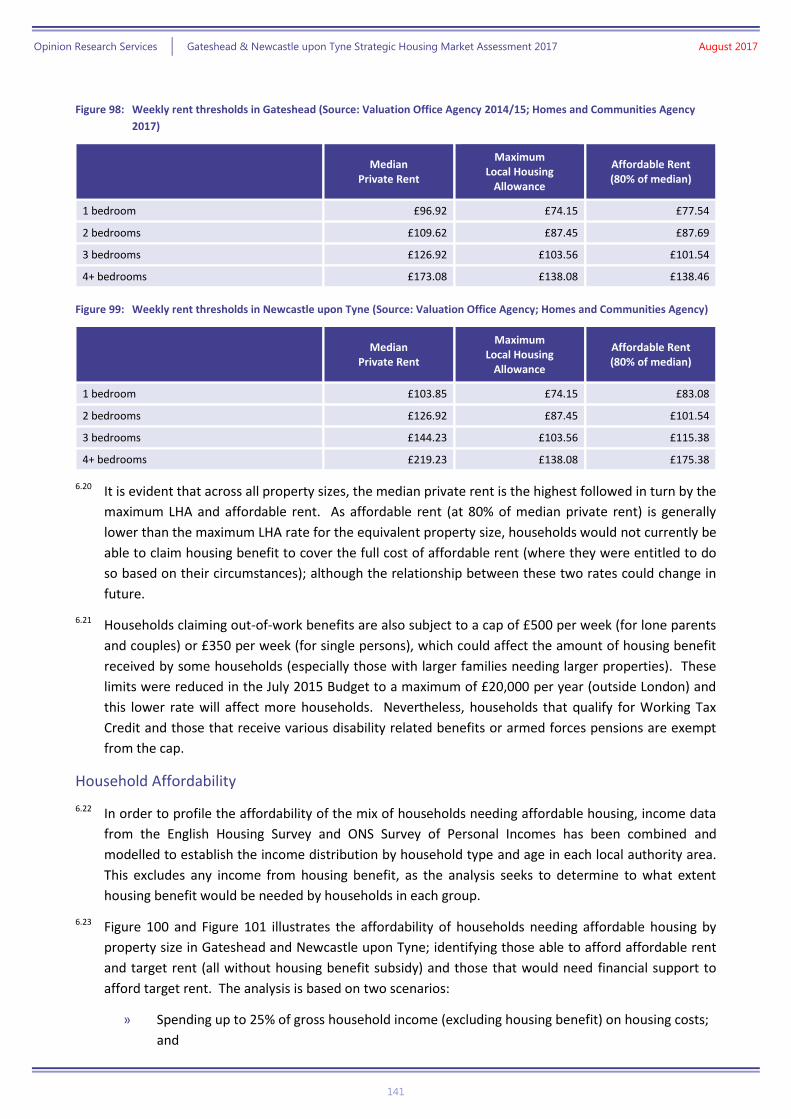
Opinion Research Services | Gateshead & Newcastle upon Tyne Strategic Housing Market Assessment 2017 August 2017
141
Figure 98: Weekly rent thresholds in Gateshead (Source: Valuation Office Agency 2014/15; Homes and Communities Agency
2017)
Median
Private Rent
Maximum Local Housing
Allowance
Affordable Rent (80% of median)
1 bedroom £96.92 £74.15 £77.54
2 bedrooms £109.62 £87.45 £87.69
3 bedrooms £126.92 £103.56 £101.54
4+ bedrooms £173.08 £138.08 £138.46
Figure 99: Weekly rent thresholds in Newcastle upon Tyne (Source: Valuation Office Agency; Homes and Communities Agency)
Median
Private Rent
Maximum Local Housing
Allowance
Affordable Rent (80% of median)
1 bedroom £103.85 £74.15 £83.08
2 bedrooms £126.92 £87.45 £101.54
3 bedrooms £144.23 £103.56 £115.38
4+ bedrooms £219.23 £138.08 £175.38
6.20 It is evident that across all property sizes, the median private rent is the highest followed in turn by the
maximum LHA and affordable rent. As affordable rent (at 80% of median private rent) is generally
lower than the maximum LHA rate for the equivalent property size, households would not currently be
able to claim housing benefit to cover the full cost of affordable rent (where they were entitled to do
so based on their circumstances); although the relationship between these two rates could change in
future.
6.21 Households claiming out-of-work benefits are also subject to a cap of £500 per week (for lone parents
and couples) or £350 per week (for single persons), which could affect the amount of housing benefit
received by some households (especially those with larger families needing larger properties). These
limits were reduced in the July 2015 Budget to a maximum of £20,000 per year (outside London) and
this lower rate will affect more households. Nevertheless, households that qualify for Working Tax
Credit and those that receive various disability related benefits or armed forces pensions are exempt
from the cap.
Household Affordability
6.22 In order to profile the affordability of the mix of households needing affordable housing, income data
from the English Housing Survey and ONS Survey of Personal Incomes has been combined and
modelled to establish the income distribution by household type and age in each local authority area.
This excludes any income from housing benefit, as the analysis seeks to determine to what extent
housing benefit would be needed by households in each group.
6.23 Figure 100 and Figure 101 illustrates the affordability of households needing affordable housing by
property size in Gateshead and Newcastle upon Tyne; identifying those able to afford affordable rent
and target rent (all without housing benefit subsidy) and those that would need financial support to
afford target rent. The analysis is based on two scenarios:
» Spending up to 25% of gross household income (excluding housing benefit) on housing costs;
and

Opinion Research Services | Gateshead & Newcastle upon Tyne Strategic Housing Market Assessment 2017 August 2017
142
» Spending up to 35% of gross household income (excluding housing benefit) on housing costs.
6.24 The two scenarios represent an upper and lower limit. The lower limit figure of 25% originated in the
Strategic Housing Market Assessments Practice Guidance Version 2 (CLG August 2007, withdrawn
March 2014)44, which states:
“A household can be considered able to afford market house renting in cases where the rent
payable was up to 25 per cent of their gross household income.” (page 42)
6.25 The upper limit of 35% is used following the guidance of the Housing and Economic Development
Needs Assessments PPG (CLG March 2015)45 which sets out the types of households to be considered
in housing need, the first of these is:
“homeless households or insecure tenure (eg housing that is too expensive compared to
disposable income)” (Paragraph: 023 Reference ID: 2a-023-20140306)
6.26 The change in PPG means that we can now expect some households to pay more than 25% of gross
income. Most of these households will be in need of support, either by being provided social housing
or by being in receipt of Housing Benefit. For those households, particularly those with no state
supported income, such as Housing Benefit, it seems unreasonable for them to pay more than half
their disposable income. For many households paying more than half of disposable income would be
too expensive compared to disposable income when taken together with other household expenditure
and would therefore lead to those households falling into housing need. This is particularly relevant to
households on low incomes but not in receipt of Housing Benefit.
6.27 The English Housing Survey (EHS) 2015-1646 for England presents the percentage of total gross
household income spent on housing costs47:
» For the total income from all income earners in the household, irrespective of whether
they contribute to the housing cost, and excluding HB, private renting households spent
on average 41% of their gross income on rent, while social renting households spent 37%
of their gross income on rent.
» For the total income from the Household Reference Person and partner, and excluding
HB, private renting households spent on average 48% of their gross income on rent, while
social renting households spent 40% of their gross income on rent.
6.28 The EHS demonstrates that irrespective of whether or not it is desirable, many households pay more
than 35% of gross income on their housing costs, including in social rented properties.
6.29 This leads to our judgement that 35% is a reasonable upper limit at which households on lower
incomes could afford rent without falling into housing need. While we have reached this conclusion by
following the guidance and a logical process, it is a judgement and other percentages could be justified
depending on housing costs and incomes in a local area.
44
https://www.gov.uk/government/publications/strategic-housing-market-assessments-practice-guidance 45
https://www.gov.uk/guidance/housing-and-economic-development-needs-assessments 46 https://www.gov.uk/government/statistics/english-housing-survey-2015-to-2016-headline-report 47
“Annex Table 1.13: Mortgage/rent as a proportion of household income (including and excluding housing benefit), by tenure, 2010-11 to 2015-16”
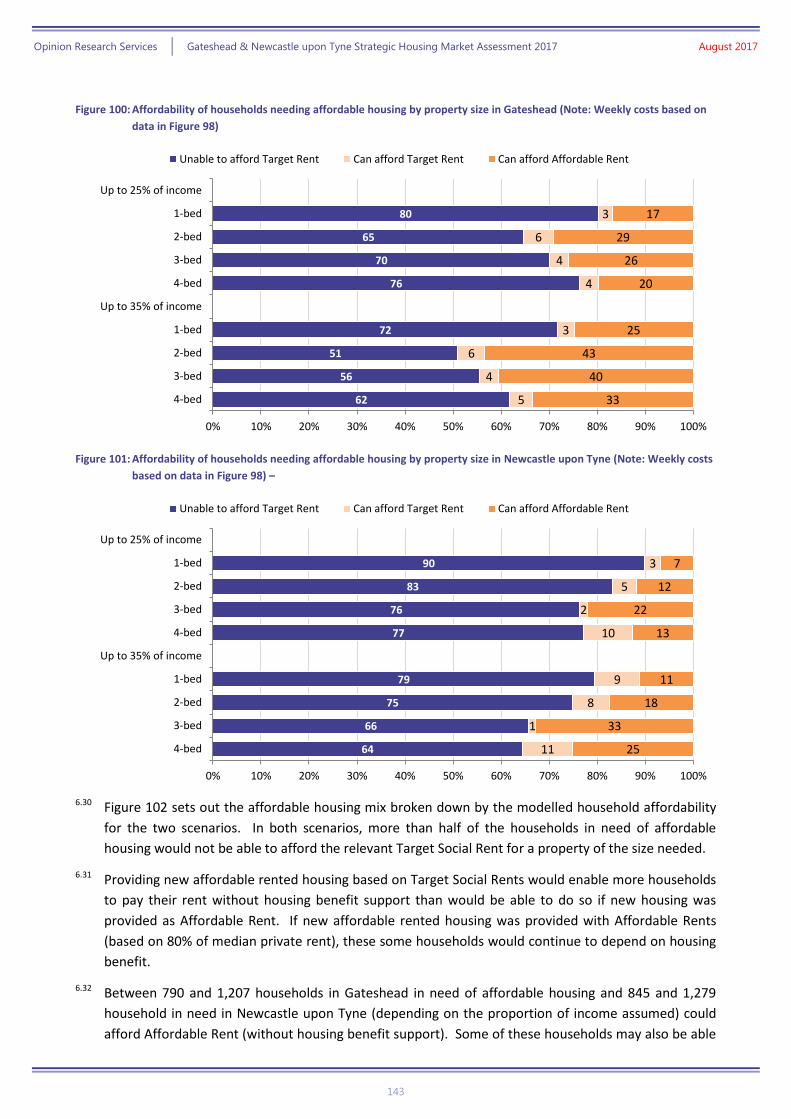
Opinion Research Services | Gateshead & Newcastle upon Tyne Strategic Housing Market Assessment 2017 August 2017
143
Figure 100: Affordability of households needing affordable housing by property size in Gateshead (Note: Weekly costs based on
data in Figure 98)
Figure 101: Affordability of households needing affordable housing by property size in Newcastle upon Tyne (Note: Weekly costs
based on data in Figure 98) –
6.30 Figure 102 sets out the affordable housing mix broken down by the modelled household affordability
for the two scenarios. In both scenarios, more than half of the households in need of affordable
housing would not be able to afford the relevant Target Social Rent for a property of the size needed.
6.31 Providing new affordable rented housing based on Target Social Rents would enable more households
to pay their rent without housing benefit support than would be able to do so if new housing was
provided as Affordable Rent. If new affordable rented housing was provided with Affordable Rents
(based on 80% of median private rent), these some households would continue to depend on housing
benefit.
6.32 Between 790 and 1,207 households in Gateshead in need of affordable housing and 845 and 1,279
household in need in Newcastle upon Tyne (depending on the proportion of income assumed) could
afford Affordable Rent (without housing benefit support). Some of these households may also be able
80
65
70
76
72
51
56
62
3
6
4
4
3
6
4
5
17
29
26
20
25
43
40
33
0% 10% 20% 30% 40% 50% 60% 70% 80% 90% 100%
Up to 25% of income
1-bed
2-bed
3-bed
4-bed
Up to 35% of income
1-bed
2-bed
3-bed
4-bed
Unable to afford Target Rent Can afford Target Rent Can afford Affordable Rent
90
83
76
77
79
75
66
64
3
5
2
10
9
8
1
11
7
12
22
13
11
18
33
25
0% 10% 20% 30% 40% 50% 60% 70% 80% 90% 100%
Up to 25% of income
1-bed
2-bed
3-bed
4-bed
Up to 35% of income
1-bed
2-bed
3-bed
4-bed
Unable to afford Target Rent Can afford Target Rent Can afford Affordable Rent
Opinion Research Services | Gateshead & Newcastle upon Tyne Strategic Housing Market Assessment 2017 August 2017
144
to afford shared equity or other forms of low cost home ownership, if this can be delivered based on a
model where the weekly costs are similar to Affordable Rent.
6.33 It is for the local authorities to set their own policies, but the policy implications of Figure 102 are that,
depending on which level of affordability is used (25% or 35% of income):
» between 1,900 and 2,350 households in Gateshead would benefit from affordable
housing based on Target Rents, with the additional benefit of lowering the cost of Housing
Benefit;
» between 4,300 and 5,000 households in Newcastle upon Tyne would benefit from
affordable housing based on Target Rents, with the additional benefit of lowering the cost
of Housing Benefit;
» the market for low cost home ownership in Gateshead includes between 800 and 1,200
households who can afford Affordable rent without Housing Benefit;
» the market for low cost home ownership in Newcastle upon Tyne includes between 850
and 1,300 households who can afford Affordable rent without Housing Benefit.

Opinion Research Services | Gateshead & Newcastle upon Tyne Strategic Housing Market Assessment 2017 August 2017
145
Figure 102: Affordable housing mix by household affordability (Source: ORS Housing Model. Note: Figures may not sum due to
rounding)
GATESHEAD Unable to afford
Target Rent Can afford
Target Rent Can afford
Affordable Rent TOTAL
25% OF INCOME
Flat 1 bedroom 586 24 136 746
2+ bedrooms 165 15 72 252
House
2 bedrooms 583 52 254 889
3 bedrooms 684 39 247 970
4+ bedrooms 323 17 81 421
TOTAL 2,342 146 790 3,277
35% OF INCOME
Flat 1 bedroom 521 26 199 746
2+ bedrooms 132 14 106 252
House
2 bedrooms 466 48 375 889
3 bedrooms 544 38 388 970
4+ bedrooms 262 20 139 421
TOTAL 1,926 144 1,207 3,277
NEWCASTLE UPON TYNE Unable to afford
Target Rent Can afford
Target Rent Can afford
Affordable Rent TOTAL
25% OF INCOME
Flat 1 bedroom 1,923 77 174 2,175
2+ bedrooms 734 45 123 901
House
2 bedrooms 696 42 116 854
3 bedrooms 1,100 24 350 1,474
4+ bedrooms 465 62 82 609
TOTAL 4,918 250 845 6,014
35% OF INCOME
Flat 1 bedroom 1,693 209 273 2,175
2+ bedrooms 659 68 174 901
House
2 bedrooms 624 64 165 854
3 bedrooms 945 21 508 1,474
4+ bedrooms 387 64 158 609
TOTAL 4,308 426 1,279 6,014
Low Cost Home Ownership
6.34 In addition to affordable housing for rent, a range of Low Cost Home Ownership (LCHO) products have
also been developed to assist households into homeownership. Figure 103 sets out the weekly costs
associated with shared ownership properties of different sizes, taking account of the differential full
market prices. This illustration is based on a shared ownership model currently promoted in the HMA:
» 40% equity share purchased by the occupier;
» 5% of the equity purchased is available as a deposit;
» Mortgage costs base based on a 25-year repayment mortgage at 6.0% interest;

Opinion Research Services | Gateshead & Newcastle upon Tyne Strategic Housing Market Assessment 2017 August 2017
146
» Rent based on 2.75% of the retained equity paid each year; and
» Service charge of £10 per week.
6.35 Based on this model, it is evident that in Gateshead, the weekly costs are lower than the equivalent
median private rent and the maximum LHA with the exception of 4+ bedroom properties, where the
weekly costs are higher than the maximum LHA rate.
6.36 In Newcastle upon Tyne, the weekly costs for 1 bedroom and 2 bedroom properties are lower than
the equivalent median private rent and the maximum LHA, while 3 bedroom and 4+ bedroom
properties weekly costs are lower than the equivalent median private rent, but higher than the
maximum LHA rate.
Figure 103: Shared ownership costs (Note: Mortgage costs based on a 25-year repayment mortgage at 6.0% interest. Rent based
on 2.75% of the retained equity annually. Service charge assumed to be £10 per week)
Property
Value
40% Equity Share
5% Deposit
Weekly Costs
Mortgage Rent Service Charge
TOTAL
GATESHEAD
1 bedroom £64,950 £25,980 £1,299 £37.03 £20.55 £10.00 £67.58
2 bedrooms £77,000 £30,800 £1,540 £43.90 £24.37 £10.00 £78.26
3 bedrooms £105,000 £42,000 £2,100 £59.86 £33.23 £10.00 £103.09
4+ bedrooms £215,000 £86,000 £4,300 £122.57 £68.03 £10.00 £200.60
NEWCASTLE UPON TYNE
1 bedroom £67,500 £27,000 £1,350 £38.48 £21.36 £10.00 £69.84
2 bedrooms £87,000 £34,800 £1,740 £49.60 £27.53 £10.00 £87.13
3 bedrooms £110,000 £44,000 £2,200 £62.71 £34.81 £10.00 £107.52
4+ bedrooms £193,000 £77,200 £3,860 £110.03 £61.07 £10.00 £181.10
6.37 Figure 104 shows the sensitivity of weekly costs to the equity share purchased and presents this
relative to the equivalent local rents. It would appear that the model currently promoted (based on
40% equity share) remains appropriate for the area, given that higher equity shares tend to yield
weekly costs that are higher than private rent. However, 25% equity share may be more appropriate
for 4+ bedroom properties in Gateshead, based on the total weekly cost for shared ownership being
above both the LHA and the, higher, median market rent for equity shares of 30% or more.
6.38 There may also be a role for LCHO products at higher equity shares targeted at households able to
afford private rent but unable to afford home ownership. This would help “widen opportunities for
home ownership” (NPPF paragraph 50), but would be in addition to the need to deliver 3,600
affordable homes in the HMA over the 18-year Plan period.

Opinion Research Services | Gateshead & Newcastle upon Tyne Strategic Housing Market Assessment 2017 August 2017
147
Figure 104: Total weekly costs for shared ownership based on different equity shares (Note: Mortgage costs based on a 25-year
repayment mortgage at 6.0% interest. Rent based on 2.75% of the retained equity annually. Service charge assumed
to be £10 per week. Cells highlighted in brown are above the LHA rate but below median private rent, cells in red are
above the equivalent median private rent. No cells are lower than the equivalent maximum LHA)
Total Weekly Cost £
Property Value
Equity Share
25% 30% 35% 40% 45% 50%
GATESHEAD
1 bedroom 64,950 58.83 61.75 64.66 67.58 70.50 73.41
2 bedrooms 77,000 67.89 71.35 74.81 78.26 81.72 85.18
3 bedrooms 105,000 88.94 93.66 98.37 103.09 107.80 112.51
4+ bedrooms 215,000 171.65 181.30 190.95 200.60 210.26 219.91
NEWCASTLE UPON TYNE
1 bedroom 67,500 60.75 63.78 66.81 69.84 72.87 75.90
2 bedrooms 87,000 75.41 79.32 83.22 87.13 91.03 94.94
3 bedrooms 110,000 92.70 97.64 102.58 107.52 112.46 117.39
4+ bedrooms 193,000 155.11 163.77 172.44 181.10 189.76 198.43
Starter Home Initiative
6.39 The NPPF identifies that local authorities should seek to “widen opportunities for home ownership”
(paragraph 50). Given this context, the Housing and Planning Act 2015 furthers this policy of
encouraging home ownership through promoting Starter Homes to provide properties that are more
affordable for first time buyers. The Act includes clauses stating that local authorities will have a
general duty to promote the supply of Starter Homes through planning.
6.40 The Act defines a Starter Home as a new dwelling, only available for purchase by qualifying first-time
buyers, which is to be sold at a discount of at least 20% of the market value and for less than the price
cap (of £250,000 outside Greater London), and is subject to restrictions on sale or letting for the initial
5-year period of occupancy. Figure 105 sets out the weekly costs based on the same property values
considered when analysing low cost home ownership housing options.
Figure 105: Starter Home Initiative (Note: Mortgage costs based on a 25-year repayment mortgage at 6.0% interest)
Property
Value 80% Equity
Share 10% Deposit
Weekly Costs
Mortgage Service Charge TOTAL
GATESHEAD
1 bedroom £64,950 £51,960 £5,196 £70.16 £6.85 £77.01
2 bedrooms £77,000 £61,600 £6,160 £83.17 £8.12 £91.30
3 bedrooms £105,000 £84,000 £8,400 £113.42 £11.08 £124.49
4+ bedrooms £215,000 £172,000 £17,200 £232.24 £22.68 £254.91
NEWCASTLE UPON TYNE
1 bedroom £67,500 £54,000 £5,400 £72.91 £7.12 £80.03
2 bedrooms £87,000 £69,600 £6,960 £93.97 £9.18 £103.15
3 bedrooms £110,000 £88,000 £8,800 £118.82 £11.60 £130.42
4+ bedrooms £193,000 £154,400 £15,440 £208.47 £20.36 £228.83
Opinion Research Services | Gateshead & Newcastle upon Tyne Strategic Housing Market Assessment 2017 August 2017
148
6.41 It is evident that the weekly costs associated with Starter Homes are notably higher than low cost
home ownership, but lower than median private sector rents other than for 4+ bedroom properties.
The initiative could widen opportunities for homeownership for those households able to afford
market rents but unable to afford to buy housing in the HMA.
Summary of Housing Costs
6.42 Figure 106 and Figure 107 summarises the weekly costs for the range of different housing options
discussed above for each property size.
Figure 106: Comparison of weekly housing costs by property size for Gateshead
Starter Home Initiative (80%
equity)
Shared ownership (40%
equity)
Median Private Rent
Maximum Local Housing
Allowance
Affordable Rent (80% median)
1 bedroom £77.01 £67.58 £96.92 £74.15 £77.54
2 bedrooms £91.30 £78.26 £109.62 £87.45 £87.69
3 bedrooms £124.49 £103.09 £126.92 £103.56 £101.54
4+ bedrooms £254.91 £200.60 £173.08 £138.08 £138.46
Figure 107: Comparison of weekly housing costs by property size for Newcastle upon Tyne
Starter Home Initiative (80%
equity)
Shared ownership (40%
equity)
Median Private Rent
Maximum Local Housing
Allowance
Affordable Rent (80% median)
1 bedroom £80.03 £69.84 £103.85 £74.15 £83.08
2 bedrooms £103.15 £87.13 £126.92 £87.45 £101.54
3 bedrooms £130.42 £107.52 £144.23 £103.56 £115.38
4+ bedrooms £228.83 £181.10 £219.23 £138.08 £175.38
The Private Rented Sector 6.43 The English Housing Survey (EHS) 2014-1548 identified that 19% (4.3 million) of households were
renting from a private landlord, much higher than the rate of 12% a decade earlier in 2004-05. The
EHS also shows that households aged 25-34 were more likely to be renting privately (46%) than buying
a home, up from 24% in 2004-05. Owner occupation in this age group dropped from 57% to 37% over
the same 10 year period.
6.44 Growth in the Sector seems likely to continue, driven by a combination of demand and supply factors:
» Increasing demand from more households;
» Recent reductions in incomes (in real terms);
» Affordability of owner occupation reducing;
» Changing Bank lending practices: the number of Buy-to-Let (BTL) mortgages granted in 2014
(c.30,000 monthly average) is higher than those granted to First-time Buyers (c.25,000); and
» Pensions reform: pension drawdowns invested in BTL property.
48 https://www.gov.uk/government/uploads/system/uploads/attachment_data/file/501065/EHS_Headline_report_2014-15.pdf
Opinion Research Services | Gateshead & Newcastle upon Tyne Strategic Housing Market Assessment 2017 August 2017
149
6.45 The growth of the Sector has been acknowledged as both a growing and long term option for meeting
the nation’s housing need. CLG (with the Intermediary Mortgage Lenders Association forecast) that
the private rented sector will increase in size to 35% nationally by 203249. On this basis, the number of
households renting privately could double again over the next twenty years.
6.46 Given this context, PPG recognises the importance of understanding the likely future role of the
private rented sector:
The private rented sector
Tenure data from the Office of National Statistics can be used to understand the future need for
private rented sector housing. However, this will be based on past trends. Market signals in the
demand for private rented sector housing could be indicated from a change in rents.
Planning Practice Guidance (March 2014), ID 2a-021
6.47 Policy by both Government and Local Authorities is focused on improving management and
maintenance in the sector (via licensing or self-regulation schemes) and expanding supply50 (including
the Build to Rent investment scheme51). The Government published “Improving the Private Rented
Sector and Tackling Bad Practice: A guide for local authorities” in March 201552, and the Foreword by
the Minister stated:
“The private rented sector is an important and growing part of our housing market, housing
4.4 million households in England. The quality of housing in the sector has improved
dramatically over the last decade. It is now the second largest tenure and this growth is
forecast to continue growing. I am proud of this growth as it shows increasing choice,
improving standards whilst helping to keep rents affordable. The Government supports a
bigger and better private rented sector and wants to see this growth continue.”
6.48 The policy to support low-income households in the private rented sector with housing benefit is long-
standing and housing benefit is explicitly factored into the long-term forecasts for public spending.
However, there have been a number of legislative changes affecting the calculation and payment of
housing benefit in the private rented sector, and these are set out below:
Figure 108: Summary of legislative changes affecting private tenants’ LHA (Source: HM Treasury, DWP)
Effective from Change
April 2011 Introduction of absolute caps on the maximum rates that can be paid for each size of property
Ending of the 5 bedroom rate – LHA restricted to 4 bedroom rate
Stopping claimants being able to keep up to a £15 ‘excess’ above their actual rent if it is below the LHA
Increasing deductions for non-dependants living with HB claimants
Increasing the Government’s contribution to Discretionary Housing Payments
Amending size criteria to allow an extra bedroom for disabled claimants with a non-resident carer
October 2011 Setting maximum LHA at the 30th percentile of local rents instead of the median
January 2012 Increasing age qualification for Shared Accommodation Rate from 25 to 35 years old
April 2013 Increasing LHA rates over time by the Consumer Price Index instead of referencing market rents –
49 http://news.rla.org.uk/rpi-rent-revolution/ 50 https://www.gov.uk/government/publications/private-rented-homes-review-of-the-barriers-to-institutional-investment 51 https://www.gov.uk/government/publications/build-to-rent-round-2-initial-due-diligence 52 https://www.gov.uk/government/uploads/system/uploads/attachment_data/file/412921/Improving_private_rented_sector.pdf
Opinion Research Services | Gateshead & Newcastle upon Tyne Strategic Housing Market Assessment 2017 August 2017
150
Effective from Change
increase by 1% from April 2014 except in high rent areas
Reducing LHA by 10% for those claiming JSA for over a year – not implemented
Council Tax Benefit replaced by localised Council Tax Reduction schemes
Parts of the Social Fund abolished, including Community Care grants and Crisis Loans
Universal Credit implementation begins (with a pathfinder) to complete by 2017
Ending of the spare room subsidy (‘bedroom tax’)
June 2013 End of Disability Living Allowance (DLA), Personal Independence Payment (PIP) begins for new claims
July 2013 Benefit cap implementation
Universal Credit pathfinder expands
October 2013 Temporary Accommodation to have housing costs met in line with Local Housing Allowance rates
Reassessment of existing Disability Living Allowance migration to Personal Independence Payment begins
Universal Credit roll-out begins
Incapacity benefit abolished; all claimants move to Employment Support Allowance (ESA) by late 2017
Expansion of PIP/DLA reassessment for existing claimants
April 2014 Removal of access to Housing Benefit for EEA Jobseekers
LHA uprating limited to 1 per cent
Help to work scheme introduced for those unemployed 2 years +
April 2016 State Pensions Age increases begin
Four year freeze to certain working age benefits (pensioner benefits, DLA, PIP not frozen)
Four-year freeze to local housing allowance rates
Lowering the benefit cap to £23,000 in London and £20,000 elsewhere
Universal credit claims will be limited to two children from April 2017 (with some exceptions)
Removing entitlement to housing support for those aged 21 or under (with some exemptions)
6.49 It is therefore important for local authorities to consider the role of the private rented sector at a local
level and recognise the way in which private rented housing will continue to provide housing options
for households unable to afford their housing costs in future. Nevertheless, local authorities need to
understand the range of different households in their areas that currently rent from private landlords
and consider their policy responses accordingly.
Private Rented Sector in Gateshead
6.50 Considering the trends of tenure mix for Gateshead, it is evident that there have been some significant
changes in the balance between owner occupiers and tenants renting their home.
» From 1981-1991: the number of owner occupiers climbed (increasing from 31K to 44K
households, a gain of thirteen thousand). This was partly as a consequence of the Right to
Buy, which led to a decline in the number of social tenants (reducing from 40K to 33K
households, a loss of 7K); there was also a reduction in the number of private tenants (from
8K to 6K).
» From 1991-2001: the number of owner occupiers continued to climb albeit at a slower pace
(increasing from 44K to 49K households, a gain of five thousand). The number of social
tenants reduced further (from 33K to 29K households); whereas the number of private
tenants remained constant (at 6K).

Opinion Research Services | Gateshead & Newcastle upon Tyne Strategic Housing Market Assessment 2017 August 2017
151
» From 2001-2011: the number of owner occupiers increased further (from 49K to 52K
households, a gain of three thousand) whilst the number of private tenants increased
substantially (from 6K to12K households, a gain of six thousand). The number of social
tenants reduced even further (from 29K to 25K households, a reduction of four thousand).
6.51 It is evident that the overall balance between owners and renters has changed in 2011 from the
position in 1981, with 39% owning in 1981 and 59% owning in 2011. The balance between social rent
and private rent has also changed significantly: with 17% of tenants rented privately in 1981 (17% out
of 61%) whereas almost two-thirds rented privately in 2011 (32% out of 41%).
Figure 109: Number of Households by Tenure 1981-2011
(Source: UK Census of Population)
Figure 110: Percentage of Households by Tenure 1981-2011
(Source: UK Census of Population)
Figure 111: Households by Tenure 1981-2011 (Source: UK Census of Population)
Tenure Total Households
1981 1991 2001 2011
Owner occupied 30,500 43,600 49,000 52,300
Private rent 8,000 5,900 6,400 11,900
Social rent 40,400 33,300 28,900 24,900
TOTAL 78,900 82,800 84,300 89,200
Owner occupied 38.7% 52.7% 58.1% 58.6%
Private rent 10.1% 7.1% 7.6% 13.4%
Social rent 51.2% 40.2% 34.3% 28.0%
6.52 Based on the range of information available about tenants currently renting privately in Gateshead, it
is helpful to consider the mix of different types of household living in the area. Based on our estimate
for the 2015 position:
» 220 properties are rented by households that are students, although this is only 2% of the
sector;
» 4,700 properties are rented by households in receipt of housing benefit, two-fifths (40%) of
the sector;
» A further 6,900 households are renting privately through choice, due to their current
personal, family, employment or other circumstances.
0
10
20
30
40
50
60
Owner Occupied Private Rent Social Rent
Tho
usa
nd
s
1981 1991 2001 2011
39%
53%
58% 59%
10% 7% 8%
13%
51%
40%
34%
28%
0%
10%
20%
30%
40%
50%
60%
70%
1981 1991 2001 2011
Owner Occupied Private Rent Social Rent
Opinion Research Services | Gateshead & Newcastle upon Tyne Strategic Housing Market Assessment 2017 August 2017
152
Figure 112: Mix of household types living in the private rented sector (Source: ORS Housing Model and Council Tax Base)
Private Rented Sector in Newcastle upon Tyne
6.53 Considering the trends of tenure mix for Newcastle upon Tyne, it is evident that there have been some
significant changes in the balance between owner occupiers and tenants renting their home.
» From 1981-1991: the number of owner occupiers climbed (increasing from 41K to 56K
households, a gain of fifteen thousand). This was partly as a consequence of the Right to Buy,
which led to a decline in the number of social tenants (reducing from 51K to 44K households,
a loss of 7K) ; there was also a reduction in the number of private tenants (from 13K to 12K).
» From 1991-2001: the number of owner occupiers continued to climb albeit at a slower pace
(increasing from around 56K to 59K households, a gain of four thousand); however this was
alongside a growth of private tenants (increasing from 12K to 15K households, a gain of three
thousand). The number of social tenants reduced further (from 44K to 37K households).
» From 2001-2011: the number of owner occupiers reduced (falling from 59K to 58K
households, a loss of a one thousand) whilst the number of private tenants increased
substantially (from 15K to 24K households, a gain of nine thousand). The number of social
tenants reduced even further (from 37K to 35K households, a reduction of two thousand).
6.54 It is evident that the overall balance between owners and renters has changed in 2011 from the
position in 1981, with 39% owning in 1981 and 50% owning in 2011. The balance between social rent
and private rent has also changed significantly: two-in-ten tenants rented privately in 1981 (20% out of
61%) whereas over two-fifths rented privately in 2011 (41% out of 50%).
Student households
220
Households on housing benefit
4,700 Households choosing
private rent
6,900

Opinion Research Services | Gateshead & Newcastle upon Tyne Strategic Housing Market Assessment 2017 August 2017
153
Figure 113: Number of Households by Tenure 1981-2011
(Source: UK Census of Population)
Figure 114: Percentage of Households by Tenure 1981-2011
(Source: UK Census of Population)
Figure 115: Households by Tenure 1981-2011 (Source: UK Census of Population)
Tenure Total Households
1981 1991 2001 2011
Owner occupied 40,900 55,700 59,300 58,400
Private rent 13,000 11,500 14,700 23,900
Social rent 51,200 44,400 37,200 34,900
TOTAL 105,200 111,600 111,200 117,200
Owner occupied 38.9% 49.9% 53.3% 49.9%
Private rent 12.4% 10.3% 13.2% 20.4%
Social rent 48.7% 39.8% 33.4% 29.7%
6.55 Based on the range of information available about tenants currently renting privately in Newcastle
upon Tyne, it is helpful to consider the mix of different types of household living in the area. Based on
our estimate for the 2015 position:
» 5,200 properties are rented by households that are students, over two-fifths (21%) of the
sector;
» 6,200 properties are rented by households in receipt of housing benefit, a quarter (25%) of
the sector;
» A further 13,600 households are renting privately; however if the proportion of owner
occupiers had not changed between 2001 and 2015, 3,200 of these households would have
owned their home. This represents over one in ten (13%) of all households renting privately;
and;
» 10,400 households are therefore renting privately through choice, due to their current
personal, family, employment or other circumstances.
6.56 It is important to recognise that the 3,200 households identified as “would be” owner occupiers are
able to rent market housing without financial support through housing benefit even if they cannot
afford to buy. These households do not meet the criteria to be included within the need for affordable
housing as they can afford private rented housing, possibly with housing benefit, and for this reason
0
10
20
30
40
50
60
70
Owner Occupied Private Rent Social Rent
Tho
usa
nd
s
1981 1991 2001 2011
39%
50% 53%
50%
12% 10%
13%
20%
49%
40%
33%
30%
0%
10%
20%
30%
40%
50%
60%
1981 1991 2001 2011
Owner Occupied Private Rent Social Rent

Opinion Research Services | Gateshead & Newcastle upon Tyne Strategic Housing Market Assessment 2017 August 2017
154
they are not included in the need for affordable housing. As previously noted, the NPPF seeks to
“widen opportunities for home ownership” (paragraph 50) and national schemes such as Help-to-Buy
and the Starter Home Initiative aim to help people onto the housing ladder.
Figure 116: Mix of household types living in the private rented sector (Source: ORS Housing Model and Council Tax Base)
Black and Minority Ethnic Population 6.57 The 2011 Census classified ethnic groups on the basis of eighteen categories which are standardised
across all UK government sources (Figure 117).
6.58 These eighteen categories can be grouped together into five aggregate groups – these being White,
Mixed, Black, Asian and Other – and some information sources do not provide any details beyond
these broad groupings.
Figure 117: Ethnic Group Classification (Source: UK Census of Population 2011)
White Mixed/multiple
ethnic group
Asian/Asian
British
Black/African/
Caribbean/
Black British
Other ethnic
group
English/Welsh/Scottish/
British/Northern Irish/British
White and
Black Caribbean Indian African Arab
Irish
White and
Black African Pakistani
Caribbean
Any Other Ethnic
Group
Gypsy or Irish Traveller White and Asian Bangladeshi
Other Black background Other White background Other Mixed background
Chinese
Other Asian
background
6.59 Gateshead and Newcastle upon Tyne have a diverse population with many different ethnic groups
represented, but mostly in small numbers.
Student households
5,200
Households on housing benefit
6,200
Households choosing private rent
10,400
"Would be" owner occupiers
3,200

Opinion Research Services | Gateshead & Newcastle upon Tyne Strategic Housing Market Assessment 2017 August 2017
155
Figure 118: Ethnic Group Profile of All Usual Residents in Gateshead and Newcastle upon Tyne (Source: Census 2011)
Gateshead Newcastle upon Tyne
White: English/Welsh/Scottish/Northern Irish/British 94.1% 81.9%
White: Irish 0.3% 0.7%
White: Gypsy or Irish Traveller 0.0% 0.1%
White: Other White 1.9% 2.9%
Mixed/multiple ethnic groups: White and Black Caribbean 0.2% 0.3%
Mixed/multiple ethnic groups: White and Black African 0.1% 0.3%
Mixed/multiple ethnic groups: White and Asian 0.3% 0.6%
Mixed/multiple ethnic groups: Other Mixed 0.2% 0.4%
Asian/Asian British: Indian 0.5% 1.8%
Asian/Asian British: Pakistani 0.3% 2.3%
Asian/Asian British: Bangladeshi 0.1% 1.7%
Asian/Asian British: Chinese 0.5% 2.2%
Asian/Asian British: Other Asian 0.5% 1.8%
Black/African/Caribbean/Black British: African 0.5% 1.7%
Black/African/Caribbean/Black British: Caribbean 0.0% 0.1%
Black/African/Caribbean/Black British: Other Black 0.0% 0.1%
Other ethnic group: Arab 0.1% 0.9%
Other ethnic group: Any other ethnic group 0.4% 0.5%
6.60 Even when ethnicity is considered by Head of Household only, the diversity of the local community is
still evident.

Opinion Research Services | Gateshead & Newcastle upon Tyne Strategic Housing Market Assessment 2017 August 2017
156
Figure 119: Ethnic Group Profile of Household Reference Persons in Gateshead and Newcastle upon Tyne (Source: Census 2011)
Gateshead Newcastle upon Tyne
White: English/Welsh/Scottish/Northern Irish/British 92.1% 75.9%
White: Irish 0.3% 0.4%
White: Gypsy or Irish Traveller 0.1% 0.1%
White: Other White 2.9% 3.2%
Mixed/multiple ethnic group: White and Black Caribbean 0.2% 0.3%
Mixed/multiple ethnic group: White and Black African 0.1% 0.4%
Mixed/multiple ethnic group: White and Asian 0.2% 0.4%
Mixed/multiple ethnic group: Other Mixed 0.2% 0.3%
Asian/Asian British: Indian 0.6% 2.0%
Asian/Asian British: Pakistani 0.5% 4.3%
Asian/Asian British: Bangladeshi 0.2% 3.6%
Asian/Asian British: Chinese 0.4% 1.2%
Asian/Asian British: Other Asian 0.6% 2.3%
Black/African/Caribbean/Black British: African 0.8% 2.9%
Black/African/Caribbean/Black British: Caribbean 0.1% 0.1%
Black/African/Caribbean/Black British: Other Black 0.1% 0.1%
Other ethnic group: Arab 0.2% 1.8%
Other ethnic group: Any other ethnic group 0.6% 0.8%
6.61 A detailed stakeholder engagement with the BME community can be found in Stakeholder
Engagement with the BME Community. The engagement process considered a wide range of housing
issues. The points presented here are based on perceptions which were expressed in the Engagement
process and which relate directly to the SHMA as a market assessment:
» In Gateshead there is greater diversity in wards such as Bensham than in other areas. In
Newcastle upon Tyne wards such as Benwell and Elswick have greater diversity than
others; however wards such as Byker and Walker are increasing in diversity.
» In the past there had been greater numbers of migration from the Indian sub-continent
but now there is greater diversity, possibly because of people coming to live in the areas
from Eastern Europe, the Middle East and Africa. People coming from South America may
be an emerging trend.
» In Gateshead there is an established orthodox Jewish community numbering several
thousand living in the Saltwell ward and Bensham area of Lobley Hill and Bensham ward.
» The Gateshead Jewish Community Housing Needs Survey (2017) found that the Jewish
community in Gateshead typically lives in large households which are concentrated in a
small area of the borough. Many are either currently overcrowded or anticipate being so
in the future; there is a shortage of suitable properties for them to purchase.
» The view of many stakeholders was that the majority of BME and minority communities
owned their properties and/or they aspire to homeownership. Although the younger

Opinion Research Services | Gateshead & Newcastle upon Tyne Strategic Housing Market Assessment 2017 August 2017
157
generations aspire to owner occupation, affordability is a key issue, unless they have
parental financial support.
» Some communities prefer social rented accommodation because it may provide routes to
owner occupation through Right to Buy (RTB) or Right to Acquire (RTA).
» Although the majority of stakeholders are keen to see more intermediate housing
products such as shared ownership, the younger generation may have a lack of trust in
intermediate housing models.
» There is some evidence of a current demand and future need for 4+ bedroom family
houses that are affordable either to rent or buy; this is especially the case in wards where
there is greater diversity and families are larger. It would be necessary to work with
individual communities to assess more precisely where the demand is. Alongside the
demand for larger family homes is a preference to be close to facilities that are culturally
appropriate.
» The Chinese Community has a current and future need for 3+ family sized properties in
the social sector and options for older people to purchase small apartments in specific
culturally sensitive complexes with the option of sheltered housing support.
» Traditionally, many older BME people would have lived within the family unit; however
this tradition is changing in some communities. Although numbers are small at present
there will be the need for smaller units which are appropriate for older people to rent and
buy. Such schemes need to consider social, cultural and health requirements.
Service Families 6.62 Paragraph 50 of the NPPF identifies that local planning authorities should plan for the needs of
different groups in the community, including service families.
6.63 The Government made a commitment towards housing members of the armed forces in the Armed
Forces Covenant (2011) and “Laying the Foundations: A Housing Strategy for England 2011” (HM
Government). Subsequently, in June 2012, the Government revised Guidance regarding priority for
access to social housing for former members of the armed forces above that offered to other people in
housing need. Whereas Local authorities had been expected to give seriously injured service
personnel “additional preference” (higher priority) for the allocation of social housing since 2009, this
“additional preference” should now be given to applications from certain serving and ex-members of
the armed forces who come within the reasonable preference categories defined in sub-section 166A
(3) of the “Housing Act 1996” who have urgent housing needs.
6.64 “The Allocation of Housing (Qualification Criteria for Armed Forces Personnel) (England) Regulations
2012” and the “Housing Act 1996 (Additional Preference for Former Armed Forces Personnel) (England)
Regulations 2012” both strengthened the position of some armed forces personnel in seeking to
access social housing. There are a number of housing schemes that are available to the Service and Ex-
Service community under the HomeBuy umbrella. HomeBuy enables social tenants, Ministry of
Defence Personnel and other first time buyers to buy a share of a home and get a first step on the
housing ladder in England. In addition, the MOD Referral Scheme with Housing Associations in c.180
locations aims to provide low-cost, rented accommodation for people coming out of the Services.

Opinion Research Services | Gateshead & Newcastle upon Tyne Strategic Housing Market Assessment 2017 August 2017
158
6.65 Mandatory Disabled Facilities Grants (DFGs) are available from local authorities, subject to a means
test, for essential adaptations to give disabled people better mobility at home and access to essential
facilities. “The Nation’s Commitment: Cross Government Support to our Armed Forces, their Families
and Veterans” (July 2008) made it clear that injured service personnel who bought a home through
what was then the Key Worker Living Scheme might be eligible for a DFG to carry out necessary
adaptation work.
6.66 Considering service families in Gateshead and Newcastle upon Tyne, Figure 120 shows the number of
residents employed in the Armed Forces. There were a total of 242 service personnel living in
Gateshead and 510 service personnel living in Newcastle upon Tyne at the time of the 2011 Census,
the majority of these living in households.
Figure 120: Gateshead and Newcastle upon Tyne residents employed in the Armed Forces (Source: 2011 Census)
Gateshead Newcastle upon Tyne
Usual residents employed in the Armed Forces
Living in a household 242 489
Living in a communal establishment 0 21
TOTAL 242 510
Percentage of population aged 16+ 0.1% 0.2%
6.67 This represents only 0.1% and 0.2% of the population respectively in Gateshead and Newcastle upon
Tyne aged 16 or over, therefore service families are relatively small in number in these areas. The
needs of these families are already included within the overall level of housing need identified for
Gateshead and Newcastle upon Tyne.
People Wishing to Build their Own Homes 6.68 Paragraph 50 of the NPPF identifies that local planning authorities should plan for people wishing to
build their own homes, and PPG states:
People wishing to build their own homes
The Government wants to enable more people to build their own home and wants to make this form
of housing a mainstream housing option. There is strong industry evidence of significant demand
for such housing, as supported by successive surveys. Local planning authorities should, therefore,
plan to meet the strong latent demand for such housing.
Planning Practice Guidance (March 2014), ID 2a-021
6.69 Over half of the population (53%) say that they would consider building their own home53 (either
directly or using the services of architects and contractors); but it’s likely that this figure conflates
aspiration with effective market demand. Self-build currently represents only around 10% of housing
completions in the UK, compared to rates of around 40% in France and 70 to 80% elsewhere in
Europe.
6.70 The attractiveness of self-build is primarily reduced costs; however the Joseph Rowntree Foundation
report “The current state of the self-build housing market” (2001) showed how the sector in the UK
53 Building Societies Association Survey of 2,051 UK consumers 2011

Opinion Research Services | Gateshead & Newcastle upon Tyne Strategic Housing Market Assessment 2017 August 2017
159
had moved away from those unable to afford mainstream housing towards those who want an
individual property or a particular location.
6.71 “Laying the Foundations – a Housing Strategy for England” (HM Government, 2011)54 redefined self-
build as ‘Custom Build’ and aimed to double the size of this market, creating up to 100,000 additional
homes over the decade. “Build-it-yourself? Understanding the changing landscape of the UK self-build
market” (University of York, 2013) subsequently set out the main challenges to self-build projects and
made a number of recommendations for establishing self-build as a significant contributor to housing
supply. The previous Government also established a network of 11 Right to Build ‘Vanguards’ to test
how the ‘Right to Build’ could work in practice in a range of different circumstances.
6.72 In the Budget 2014, the Government announced an intention to consult on creating a new ‘Right to
Build’, giving ‘Custom Builders’ a right to a plot from councils. The Self-Build and Custom
Housebuilding Act55 2015 places a duty on local planning authorities to:
» Keep a register (and publicise this) of eligible prospective ‘custom’ and self-build individuals,
community groups and developers;
» Plan to bring forward sufficient serviced plots of land, probably with some form of planning
permission, to meet the need on the register and offer these plots to those on the register at
market value; and
» Allow developers working with a housing association to include self-build and custom-build as
contributing to their affordable housing contribution.
6.73 The 2015 Act was amended by the Housing and Planning Act 201656 which placed a duty on local
planning authorities to authorities to provide serviced sites which have planning permission that
allows for self or custom build:
An authority to which this section applies must give suitable development permission in
respect of enough serviced plots of land to meet the demand for self-build and custom
housebuilding in the authority’s area arising in each base period. (Section 2(a)(2))
6.74 Limited Government funding57 is currently available via the HCA Custom Build Homes Fund
programme (short-term project finance to help unlock group custom build or self-build schemes). The
Government announced further measures in 2014 (Custom Build Serviced Plots Loan Fund) to
encourage people to build their own homes, and to help make available 10,000 ‘shovel ready’ sites
with planning permission. Given this context, it is important to recognise that self-build could either
be market housing or low cost home ownership affordable housing products. Nevertheless, it is likely
that the majority will be market homes.
6.75 In May 2012 a Self-Build Portal58 run by the National Custom and Self Build Association (NCaSBA) was
launched. Figure 121 shows the current registrations from groups and individuals looking for land in
Gateshead and Newcastle upon Tyne on the ‘Need-a-Plot’ section of the portal. Whilst there is clearly
some interest in self-build across the area, this represents only a very limited number of people and an
exceptionally small proportion of the overall housing need identified each year.
54 https://www.gov.uk/government/publications/laying-the-foundations-a-housing-strategy-for-england--2 55 http://services.parliament.uk/bills/2014-15/selfbuildandcustomhousebuilding.html 56
http://services.parliament.uk/bills/2015-16/housingandplanning.html 57 https://www.gov.uk/government/uploads/system/uploads/attachment_data/file/364100/custom_build_homes_fund_prospectus_120712.pdf 58 http://www.selfbuildportal.org.uk/

Opinion Research Services | Gateshead & Newcastle upon Tyne Strategic Housing Market Assessment 2017 August 2017
160
Figure 121: Group and Individual Registrations currently looking for land in and around Gateshead and Newcastle upon Tyne on
the ‘Need-a-Plot’ Portal (Source: NCaSBA, February 2017 and Google Maps)
6.76 Both Councils have established their Self and Custom Build Register, albeit the number of registrations
are currently low, including:
» 40 individual registrations and 2 group registrations all seeking plots in Gateshead;
» 36 individual registrations and 3 group registrations all seeking plots in Newcastle upon Tyne.
6.77 The register will be monitored to inform any policy implications arising and consideration will be given
to determine the extent to which any schemes can contribute to Custom Build
Housing for Older People 6.78 Britain’s population is ageing, and people can expect to live longer healthier lives than previous
generations. The older population is forecast to grow to 21.6m by 203759 for the over 60s, and from
1.4m (2012) to 3.6m by 2033 for the over 85s. Given this context, PPG recognises the importance of
providing housing for older people:
59 http://www.ons.gov.uk/ons/rel/npp/national-population-projections/2012-based-projections/stb-2012-based-npp-principal-and-key-variants.html#tab-Changing-Age-Structure
Opinion Research Services | Gateshead & Newcastle upon Tyne Strategic Housing Market Assessment 2017 August 2017
161
Housing for older people
The need to provide housing for older people is critical given the projected increase in the number of
households aged 65 and over … Plan makers will need to consider the size, location and quality of
dwellings needed in the future for older people in order to allow them to live independently and
safely in their own home for as long as possible, or to move to more suitable accommodation if they
so wish. Supporting independent living can help to reduce the costs to health and social services,
and providing more options for older people to move could also free up houses that are under
occupied.
The future need for specialist accommodation for older people broken down by tenure and type
(e.g. sheltered, enhanced sheltered, extra care, registered care) should be assessed and can be
obtained from a number of online tool kits provided by the sector. The assessment should set out
the level of need for residential institutions (Use Class C2). Many older people may not want or need
specialist accommodation or care and may wish to stay or move to general housing that is already
suitable, such as bungalows, or homes which can be adapted to meet a change in their needs.
Planning Practice Guidance (March 2015), ID 2a-021
6.79 The SHMA Update population projections identified that the population in Gateshead was likely to
increase over the period 2015 to 2030 from 203,100 persons to 212,650 persons over the 15-year
period, an increase of 9,550 persons. The population in older age groups is projected to increase
substantially during this period, with over 100% of the overall net population growth (9,750 persons)
projected to be aged 65 or over and 65% projected to be 75+. The large proportion of older people is
partly a result of projected falls in the size of some younger cohorts alongside the growth in the
number of older persons.
6.80 In Newcastle upon Tyne, the SHMA Update population projections identified that the population was
likely to increase over the period 2015 to 2030 from 292,280 persons to 322,960 persons over the 15-
year period, an increase of 30,680 persons. The population in older age groups is projected to increase
substantially during this period, with approaching half (47%) of the overall net population growth
(14,200 persons) projected to be aged 65 or over and 25% projected to be 75+.
6.81 This is particularly important when establishing the types of housing required and the need for housing
specifically for older people. Whilst most of these older people will already live in the area and many
will not move from their current homes; those that do move home are likely to be looking for suitable
housing.
6.82 The Housing Learning and Improvement Network (LIN) published “More Choice, Greater Voice: a
toolkit for producing a strategy for accommodation with care for older people”60 in February 2008; and
subsequently published the “Strategic Housing for Older People (SHOP)”61 resource pack in December
2011. Both the toolkit and the resource pack provide standardised rates for estimating the demand
for a range of specialist older person housing products, based on the population aged 75 or over. The
figures represent national rates and should be treated with caution for any local authority.
60 http://www.housinglin.org.uk/_library/Resources/Housing/Support_materials/Reports/MCGVdocument.pdf 61 http://www.housinglin.org.uk/_library/Resources/Housing/SHOP/SHOPResourcePack.pdf

Opinion Research Services | Gateshead & Newcastle upon Tyne Strategic Housing Market Assessment 2017 August 2017
162
Figure 122: Benchmark Figures for Specialist Older Person Housing
Form of Provision More Choice, Greater Voice toolkit SHOP resource pack
Owned Rented TOTAL Owned Rented TOTAL
Demand per 1,000 persons aged 75+
Leasehold Schemes for the Elderly (LSE) 75 - 75 120 - 120
Conventional Sheltered Housing - 50 50 - 60 60
Sheltered ‘plus’ or ‘Enhanced’ Sheltered 10 10 20 10 10 20
Extra care 12.5 12.5 25 30 15 45
Dementia - 10 10 - 6 6
TOTAL 97.5 82.5 180 160 91 251
6.83 These rates provide a useful framework for understanding the potential demand for different forms of
older person housing, but neither publication provides any detail about the derivation of the figures.
6.84 The More Choice, Greater Voice toolkit recognises that the suggested framework simply:
“…represents an attempt to quantify matters with explicit numerical ratios and targets. It is
contentious, but deliberately so, in challenging those who must develop local strategies to
draw all the strands together in a way that quantifies their intentions.” (page 44)
6.85 Similarly, the SHOP resource pack acknowledges that the framework simply provides a baseline, which
extrapolates “…crude estimates of future demand from existing data” (page 36). There is no single
correct answer when estimating the need for older person housing, and it is therefore appropriate to
establish a local framework which takes account of local data.
6.86 PPG also identifies that “assessments should set out the level of need for residential institutions (Use
Class C2)” (ID 2a-021). The demographic projections have projected that the institutional population is
likely to increase by around 414 persons in Gateshead and 593persons in Newcastle upon Tyne over
the period 2015-30 (Figure 46). This increase in institutional population is a consequence of the CLG
approach to establishing the household population62, which assumes “that the share of the
institutional population stays at 2011 levels by age, sex and relationship status for the over 75s” on the
basis that “ageing population will lead to greater level of population aged over 75 in residential care
homes”. However, older people are living longer, healthier lives, and the Government’s policy toward
Health and Adult Social Care is underpinned by a principle of sustaining people at home for as long as
possible – so despite the ageing population, current policy means that the number of care homes and
nursing homes may actually decline, as people are supported to continue living in their own homes for
longer. The effects of this cannot currently be predicted.
6.87 Given this context, it does not necessarily follow that all of the increase in institutional population
should be provided as additional bedspaces in residential institutions in Use Class C2; some of the
specialist older person housing may be more appropriate for their needs. Nevertheless, whilst
specialist older person housing would generally be included within the overall OAN, if fewer older
people are expected to live in communal establishments than is currently projected, the housing
needs of any additional older people in the household population would need to be counted in
addition to the assessed OAN.
6.88 Based on the growth in population aged 75+ identified in the population projection, the table below
identifies the potential additional requirement for new specialist housing (using the Housing LIN Older
62 Household Projections 2012-based: Methodological Report, Department for Communities and Local Government, February 2015
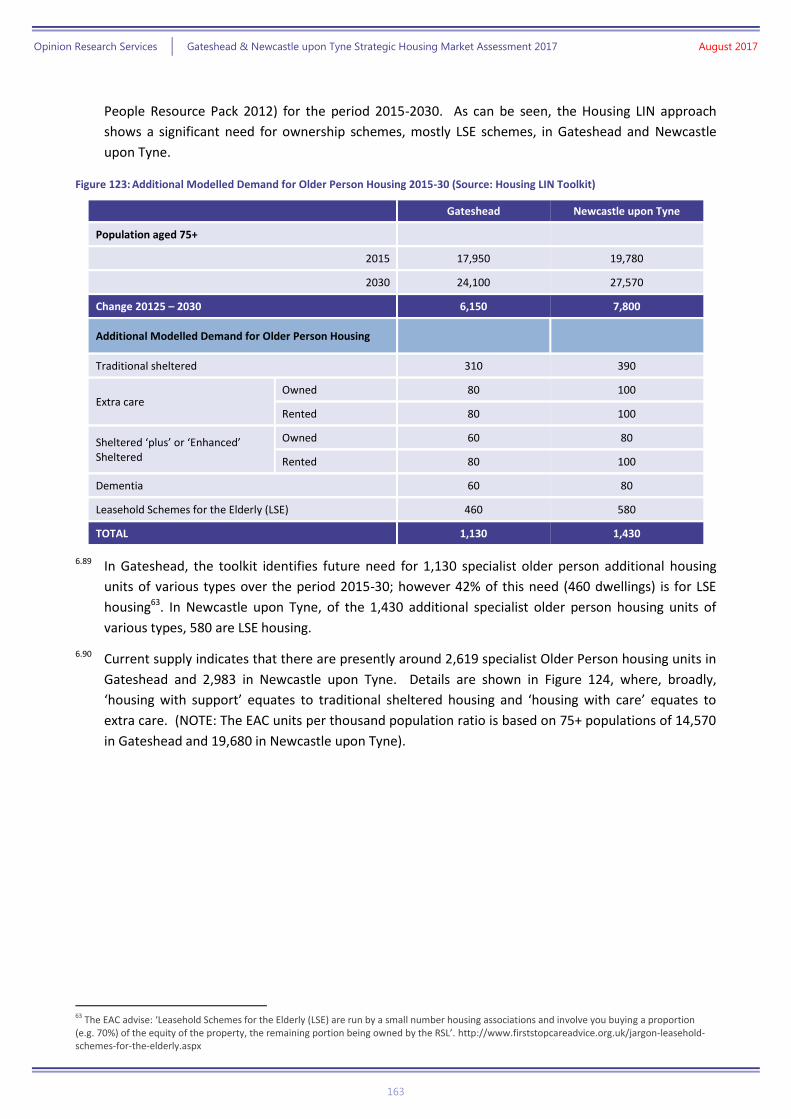
Opinion Research Services | Gateshead & Newcastle upon Tyne Strategic Housing Market Assessment 2017 August 2017
163
People Resource Pack 2012) for the period 2015-2030. As can be seen, the Housing LIN approach
shows a significant need for ownership schemes, mostly LSE schemes, in Gateshead and Newcastle
upon Tyne.
Figure 123: Additional Modelled Demand for Older Person Housing 2015-30 (Source: Housing LIN Toolkit)
Gateshead Newcastle upon Tyne
Population aged 75+
2015 17,950 19,780
2030 24,100 27,570
Change 20125 – 2030 6,150 7,800
Additional Modelled Demand for Older Person Housing
Traditional sheltered 310 390
Extra care Owned 80 100
Rented 80 100
Sheltered ‘plus’ or ‘Enhanced’ Sheltered
Owned 60 80
Rented 80 100
Dementia 60 80
Leasehold Schemes for the Elderly (LSE) 460 580
TOTAL 1,130 1,430
6.89 In Gateshead, the toolkit identifies future need for 1,130 specialist older person additional housing
units of various types over the period 2015-30; however 42% of this need (460 dwellings) is for LSE
housing63. In Newcastle upon Tyne, of the 1,430 additional specialist older person housing units of
various types, 580 are LSE housing.
6.90 Current supply indicates that there are presently around 2,619 specialist Older Person housing units in
Gateshead and 2,983 in Newcastle upon Tyne. Details are shown in Figure 124, where, broadly,
‘housing with support’ equates to traditional sheltered housing and ‘housing with care’ equates to
extra care. (NOTE: The EAC units per thousand population ratio is based on 75+ populations of 14,570
in Gateshead and 19,680 in Newcastle upon Tyne).
63 The EAC advise: ‘Leasehold Schemes for the Elderly (LSE) are run by a small number housing associations and involve you buying a proportion (e.g. 70%) of the equity of the property, the remaining portion being owned by the RSL’. http://www.firststopcareadvice.org.uk/jargon-leasehold-schemes-for-the-elderly.aspx

Opinion Research Services | Gateshead & Newcastle upon Tyne Strategic Housing Market Assessment 2017 August 2017
164
Figure 124: Specialist Housing Provision for Older People (Source: EAC 201564
. Figures may not sum due to rounding)
Gateshead
Newcastle upon Tyne
Units
Units per thousand
population aged 75+
Units
Units per thousand
population aged 75+
Housing with support
Rent 2,201 2,453
Sale 174 336
Total 2,375 163.0 2,789 141.7
Housing with care
Rent 222 141
Sale 22 53
Total 244 16.7 194 9.9
TOTAL 2,619 179.7 2,983 151.6
6.91 While the Housing LIN model identifies future need, this is on the basis of existing types of provision
(sheltered, extra care etc). It is unclear, at the present time, if Older People will aspire to these types of
specialist housing in the future; indeed, demand for some types are already experiencing low demand,
and other, newer types of provision may appear to meet changing aspirations in the market. Further,
the policy aim of supporting people at home for longer could mean, for example, that floating support
services and assistive technologies to older people, in their own homes, could sustain people there
longer.
6.92 Housing LIN have an overall rate of specialist provision per 1000 population of 180. The combined rate
of current specialist provision for Gateshead and Newcastle upon Tyne (based on the total EAC
population data: 34,250) would equate to 164 properties per 1000 persons aged over 75. Against the
2015 population, (37,730) current provision would equate to 148 properties per 1000 population.
6.93 Of course, it is important that the delivery of specific schemes for specialist older person housing are
considered in partnership with other agencies, in particular those responsible for older person support
needs. It will also be important to consider other factors and constraints in the market:
» Demographics: the changing health, longevity and aspirations of Older People mean people
will live increasingly healthy longer lives and their future housing needs may be different from
current needs;
» New supply: development viability of schemes, and the availability of revenue funding for
care and support services, need to be carefully considered before commissioning any new
scheme. It will also be important for the Council and its partners to determine the most
appropriate types of specialist older person housing to be provided in the area;
» Existing supply: while there is considerable existing specialist supply, this may be either
inappropriate for future households or may already be approaching the end of its life.
64 http://www.housingcare.org/downloads/eac%20stats%20on%20housing%20for%20older%20people%20March%202015.pdf The EAC ‘acknowledges both the rented and private sectors contain a wide range of housing types intended for older people. The social sector has traditionally distinguished these as Category 1, 2 etc., but the private sector tends to refer to them all simply as “retirement housing”. This report looks only at schemes that fall within the following definition: “a group of dwellings intended for older people and served by a resident or non-resident warden/scheme manager with specific responsibility for the group”. It is important to note that a considerable proportion of housing intended for older people falls outside this definition, and is therefore excluded. Extra care, assisted living, and other forms of 'housing with care' are included.

Opinion Research Services | Gateshead & Newcastle upon Tyne Strategic Housing Market Assessment 2017 August 2017
165
Nevertheless, other forms of specialist older person housing may be more appropriate than
conventional sheltered housing to rent when considering future needs;
» Other agencies: any procurement of existing supply needs to be undertaken with other
agencies who also plan for the future needs of Older People, particularly local authority
Supporting People Teams and the Health Service; and
» National strategy and its implications for Older People: national strategy emphasises Older
People being able to remain in their own homes for as long as possible rather than specialist
provision, so future need may, again, be overstated.
Households with Specific Needs
Assessing the level of need for accessible and wheelchair housing 6.94 This section assesses the level of need for wheelchair and accessible housing, including dealing with
the accessibility and wheelchair housing standards. It accesses the data sources listed in the “Building
regulations: guide to available disability data” (CLG, March 2015)65.
6.95 Paragraph 50 of the NPPF identifies that local planning authorities should plan for households with
specific needs, and PPG states:
Households with specific needs
There is no one source of information about disabled people who require adaptations in the home,
either now or in the future.
The Census provides information on the number of people with long-term limiting illness and plan
makers can access information from the Department of Work and Pensions on the numbers of
Disability Living Allowance/Attendance Allowance benefit claimants. Whilst these data can provide
a good indication of the number of disabled people, not all of the people included within these
counts will require adaptations in the home.
Applications for Disabled Facilities Grant will provide an indication of levels of expressed need,
although this could underestimate total need. If necessary, plan makers can engage with partners
to better understand their housing requirements. Planning Practice Guidance (March 2015), ID 2a-021
6.96 Personal Independence Payments started to replace the Disability Living Allowance from April 2013,
and these are awarded to people aged under 65 years who incur extra costs due to disability (although
there is no upper age limit once awarded, providing that applicants continue to satisfy either the care
or mobility conditions). Attendance Allowance contributes to the cost of personal care for people who
are physically or mentally disabled and who are aged 65 or over. Nevertheless, PPG recognises that
neither of these sources provides information about the need for adapted homes as “not all of the
people included within these counts will require adaptations in the home”.
6.97 Disabled Facilities Grants (DFG) are normally provided by Councils and housing associations to adapt
properties for individuals with health and/or mobility needs who are owner occupiers, or renting from
65
https://www.gov.uk/government/publications/building-regulations-guide-to-available-disability-data

Opinion Research Services | Gateshead & Newcastle upon Tyne Strategic Housing Market Assessment 2017 August 2017
166
a private landlord, housing association or council. Grants cover a range of works, ranging from major
building works, major adaptations to the property and minor adaptations, such as:
» Structural works such as a downstairs bathroom or extension;
» Improving access to rooms and facilities, for example Providing a hoist system or through
floor lift, widening doors, installing ramps, and stair lifts;
» Providing a heating system suitable for needs;
» Adapting heating or lighting controls to make them easier to use;
» Stair rails and grab rails.
6.98 Figures from the English Housing Survey (Figure 135) demonstrate that, while the existing stock is
considerably larger than projected new build, adapting existing stock through DFGs is part of the
solution, but adapting existing stock alone cannot provide sufficient adapted properties to meet the
need.
6.99 Figure 125 Shows spending on DFGs in the two authorities for the previous five years. This spending
was in response to 1,631 applications and 1,565 completions in Gateshead and 1,932 applications in
Newcastle upon Tyne, with 1,116 completions in the previous three years in Newcastle upon Tyne.
The majority of applications for DFG which do not lead to the requested works being completed are
either abandoned due to the applicant moving or planning to move, or are unsuccessful as the
applicant does not qualify for financial assistance.
Figure 125: Gateshead and and Newcastle upon Tyne Spending on DFGs in owned and rented private, and housing association
properties properties (Source: Gateshead and Newcastle upon Tyne Councils)
2012 2013 2014 2015 2016
Gateshead £1,563,851 £1,427,930 £1,286,789 £1,510,606 £1,222,728
2011-2012 2012-2013 2013-2014 2014-2015 2015-2016
Newcastle upon Tyne £1,496,987 £1,251,668 £1,569,920 £1,964,268 £1,623,635
6.100 Based on data from both authorities, the mean average cost per completion on housing associations,
owner occupied and private rented properties in Gateshead was £4,480. Based on completions in the
two years 2014-2015 and 2015-2016, the mean average per completion in Newcastle upon Tyne was
£4,485. Detailed figures from Newcastle upon Tyne city Council demonstrate the range of adaptations
funded by DFG, covering all parts of a property.

Opinion Research Services | Gateshead & Newcastle upon Tyne Strategic Housing Market Assessment 2017 August 2017
167
Figure 126: Newcastle upon Tyne Spending on DFGs by type for owner occupied, private rented and registered providers
(Source: Newcastle upon Tyne City Council)
Gateshead
Completed Adaptations 2014/15 2015/16 2016/17 Total
Level access shower 96 121 49 388
Curved track stair lift 44 34 29 174
Straight track stair lift 107 93 43 344
Heavy duty stairlift 3 5 2 10
Ramp (including semi-permanent
ramps) 34 23 19 108
Ceiling Track Hoist 19 26 9 72
Access alterations 29 25 8
Bathroom adaptation 14 11 6 60
Automated WC 13 5 3 30
Through floor lift / vertical lift 7 5 1 16
Kitchen adaptation 2 2 7
Garage conversion 1 2
Step Lift 3 1 6
Extension 3 2 0 8
Other 2 5 5 14
Total 377 358 174 1,239
Newcastle upon Tyne
Completed Adaptations 2014/15 2015/16 2016/17 Total
Level access shower 199 135 91 425
Curved track stair lift 58 44 82 184
Straight track stair lift 70 42 70 182
Ramp 55 26 26 107
Ceiling Track Hoist 34 23 12 69
Access alterations 22 19 16 57
Bathroom adaptation 22 11 10 43
Clos-o-mat 9 5 4 18
Through floor lift 6 3 2 11
Kitchen adaptation 4 2 2 8
Garage conversion 2 3 1 6
Step Lift 3 0 0 3
Extension 2 1 0 3
Total 486 314 316 1,116
6.101 The adaptations were carried out across private and housing associations properties in approximately
the following proportions:
» 65% in owner-occupied properties
» 7% in private rented properties

Opinion Research Services | Gateshead & Newcastle upon Tyne Strategic Housing Market Assessment 2017 August 2017
168
» 28% in properties rented from a registered provider
6.102 On top of the spend on DFGs, major adaptations expenditure on Gateshead Council-owned properties
is shown below. This spending funded 2,082 major adaptations.
Figure 127: Gateshead Spending on major adaptations in Council owned properties (Source: Gateshead Council)
2012 2013 2014 2015 2016
Gateshead £586,411 £1,133,551 £1,554,905 £1,352,089 £1,090,267
6.103 The mean average cost per major adaptation in Council owned properties in Gateshead was £2,746,
while in Newcastle upon Tyne the mean cost was £4,922.32 in 2016/17.
Current Planning Policy Context 6.104 As previously noted, the Government’s reform of Health and Adult Social Care is underpinned by a
principle of sustaining people at home for as long as possible. This was reflected in the recent changes
to building regulations relating to adaptations and wheelchair accessible homes that were published in
the Building Regulations 2010 Approved Document Part M: Access to and use of buildings (2015
edition incorporating 2016 amendments – for use in England)66. Three standards are covered:
» M4(1) Category 1: Visitable dwellings (Mandatory)
» M4(2) Category 2: Accessible and adapted dwellings (Optional, similar to the Lifetime
Homes standard)
» M4(3) Category 3: Wheelchair user dwellings (Optional, equivalent to the wheelchair
accessible standard)
6.105 Part M states that: “Where no condition is imposed, dwellings only need to meet requirements M4(1)”
(Paragraph 0.3).
6.106 M4(2) Category 2: Accessible and adapted dwellings states that reasonable provision should be made
for people to gain access to and use the facilities of the dwelling and that:
“The provision made must be sufficient to-
(a) meet the needs of occupants with differing needs, including some older or disabled
people, and;
(b) to allow adaptation of the dwelling to meet the changing needs of occupants over time.”
(Page 10)
6.107 M4(3) Category 3: Wheelchair user dwellings also states that reasonable provision should be made for
people to gain access to and use the facilities of the dwelling and that:
““The provision made must be sufficient to-
(a) allow simple adaptation of the dwelling to meet the needs of occupants who use
wheelchairs, or;
(b) to meet the needs of occupants who use wheelchairs.” (Page 23)
66
https://www.gov.uk/government/publications/access-to-and-use-of-buildings-approved-document-m

Opinion Research Services | Gateshead & Newcastle upon Tyne Strategic Housing Market Assessment 2017 August 2017
169
6.108 Local authorities should identify the proportion of dwellings in new developments that should comply
with the requirements for Category 2 and Category 3 as part of the Local Plan, based on the likely
future need for housing for older and disabled people (including wheelchair user dwellings) and taking
account of the overall impact on viability. Planning Practice Guidance for Housing optional technical
standards states:
Based on their housing needs assessment and other available datasets it will be for local planning
authorities to set out how they intend to approach demonstrating the need for Requirement M4(2)
(accessible and adaptable dwellings), and / or M4(3) (wheelchair user dwellings), of the Building
Regulations.
To assist local planning authorities in appraising this data the Government has produced a
summary data sheet. This sets out in one place useful data and sources of further information which
planning authorities can draw from to inform their assessments. It will reduce the time needed for
undertaking the assessment and thereby avoid replicating some elements of the work.
Planning Practice Guidance (March 2015), ID 56-007
Population and health demographics 6.109 The SHMA Update population projections identified that the population in Gateshead was likely to
increase over the period 2015 to 2030 from 203,100 persons to 212,650 persons over the 15-year
period, an increase of 9,550 persons. The population in older age groups is projected to increase
substantially during this period, with over 100% of the overall net population growth (9,750 persons)
projected to be aged 65 or over and 65% projected to be 75+. The large proportion of older people is
partly a result of projected falls in the size of some younger cohorts alongside the growth in the
number of older persons.
6.110 The indicators from the Public Health England (PHE) health profiles in Figure 128 show Gateshead to
be generally comparable to the North East overall, but with higher levels of deprivation and public
health problems than England as a whole. In particular, the under 75 mortality rate from
cardiovascular conditions and excess winter deaths are notably higher than for England and for the
North East, while the percentage of physically active adults is low. Life expectancy is around 1.7 years
lower than for England.
6.111 In Newcastle upon Tyne, the SHMA Update population projections identified that the population was
likely to increase over the period 2015 to 2030 from 292,280 persons to 322,960 persons over the 15-
year period, an increase of 30,680 persons. The population in older age groups is projected to increase
substantially during this period, with approaching half (47%) of the overall net population growth
(14,200 persons) projected to be aged 65 or over and 25% projected to be 75+.
6.112 The indicators from the PHE health profiles in Figure 128 show Newcastle upon Tyne to have higher
levels of deprivation and public health problems than England as a whole and, in general, the North
East region. In particular, the percentage of children in low income families, obese children, hip
fractures, smoking related deaths and under 75 mortality rate from cardiovascular conditions are
notably higher than for England and for the North East. Life expectancy is around 1.6 years lower than
for England.

Opinion Research Services | Gateshead & Newcastle upon Tyne Strategic Housing Market Assessment 2017 August 2017
170
6.113 The Public Health England (PHE) health profiles for Gateshead and Newcastle upon Tyne provide 30
public health indicators. Some key indicators demonstrate the health profile compared to England and
the North East region:
Figure 128: Public Health England health profiles indicators 2017 (Source: PHI)
Indicator Gateshead Newcastle
upon Tyne
North East England
Deprivation score (IMD 2015) 25.9 28.3 - 21.8
Children in low income families (under 16s) 22.60% 29.40% 24.90% 20.10%
Obese children (Year 6) 23.20% 24.8% 22.40% 19.80%
Percentage of physically active adults (2015) 46.3% 55.7% 52.9% 57.0%
Excess weight in adults (2013-15) 69.4% 63.2% 68.6% 64.8%
Hip fractures in people aged 65 and over per
100,000 population (2015/16) 666 734 679 589
Life expectancy at birth (Male) 77.7 77.8 77.9 79.5
Life expectancy at birth (Female) 81.4 81.5 81.6 83.1
Smoking related deaths per 100,000
population (2013-15) 385.9 394.2 369 283.5
Under 75 mortality rate: cardiovascular per
100,000 population (2013-15) 93.1 95.3 85.1 74.6
Excess winter deaths index – 3 years, all ages
(Aug 2012 - Jul 2015) 22.1 17.4 19.3 19.6
6.114 The population projections are particularly important when establishing the types of housing required
and the need for housing specifically for older people. Whilst most of these older people will already
live in the area and many will not move from their current homes; those that do move home are likely
to be looking for suitable housing.
6.115 While younger people are more likely to move, new housing needs to be built for households growing
older and therefore a proportion to be built to accessibility and wheelchair standards. Most newly
forming households will be younger people, some of which will move into new housing, but perhaps
the largest group moving to new housing will be families of working age. Family households’
representatives aged 50 in 2015, will reach retirement age by 2030. This is one reason why we can
expect that a proportion of newly built dwellings between 2015 and 2030 will need to be accessible,
with a smaller proportion needed to be to wheelchair standard.
6.116 There will be a large growth in older households. While most of the older households will not move,
there will be a large number of older households who need accessible housing or wheelchair housing
where they currently live, or to move to such housing because their current home is not viable to
adapt to their needs. This again leads to a need for a two-pronged approach; to deal with the existing
stock through DFGs, and to provide new general needs housing for older people to move to. Older
households moving to new, accessible or wheelchair housing will free up their previous housing.
6.117 The need for accessible and wheelchair housing is not constrained to older households. Each point
made here in relation to older households applies equally to any household of any age that
experiences disability or other reason why accessible or wheelchair housing becomes a necessity, such
as disability through progressive conditions, through accident, or through having a disabled child.

Opinion Research Services | Gateshead & Newcastle upon Tyne Strategic Housing Market Assessment 2017 August 2017
171
6.118 A notable proportion of households on the Housing Needs Registers for the two authorities show have
a recognised need to move on welfare grounds or because of disability. Whilst Gateshead and
Newcastle upon Tyne are partners in Tyne and Wear Homes they do not share the same policy; the
bands used are similar but cannot be compared directly.
6.119 As of March 2017 there were 6,724 households on the Tyne and Wear Housing register for Gateshead,
while the average number of households in 2016-17 registered as needing to move on welfare
grounds or because of disability in Gateshead was 706. The Gateshead figures include all households
assessed as having an Urgent or Substantial need.
6.120 As of April 2017, there were 6,434 households registered on the Tyne and Wear Housing register for
Newcastle upon Tyne, while 535 households through 2016-2017 were registered as needing to move
on welfare grounds or because of disability. The Newcastle upon Tyne figures are cases that have a
medical or welfare banding assessed as having a need under Bands A, B or C. Applicants who are
adequately housed would fall into Band D. For any disabled applicants falling under Band D, there
would be no verification of the disability.
Figure 129: On Housing Register with a recognised need to move on welfare grounds or disability (Source: Gateshead and
Newcastle upon Tyne City Councils)
Gateshead
(Monthly
average)
Newcastle
upon Tyne
2016-2017 706 535
2015-2016 855 400
2014-2015 1,255 289
2013-2014 1,506 337
2012-2013 1,424 268
6.121 The largest decrease in numbers in Gateshead over time has been in the Urgent Need (Single Award)
and Substantial (Single Award) categories.
6.122 The Continuous Recording of Lettings and Sales in Social Housing (CORE) database 2014-2015 shows
that 5% of lettings to Social Rented general needs housing in Gateshead are to a household assigned
as having a reasonable preference on medical or welfare grounds and 4.9% in Newcastle. The
proportions of allocations to households assigned as having a reasonable preference on medical or
welfare grounds are lower in Affordable Rented general needs properties; 1.6% in Gateshead and
2.9% in Newcastle.
6.123 Lettings to a household assigned as having a reasonable preference on medical or welfare grounds, to
wheelchair standard properties in Social Rented general needs housing, stood at 7.7% of lettings in
Gateshead and 4.3% in Newcastle. As might be expected, the proportions of lettings to a household
assigned as having a reasonable preference on medical or welfare grounds to Social Rented
wheelchair standard properties is higher, at 15.4% of all Social Rented wheelchair standard housing in
Gateshead and 33.7% in Newcastle.
6.124 The picture for Affordable Rented properties is less clear, though there is evidence of demand such as
the 11.6% of Affordable Rented general needs properties in Newcastle upon Tyne that were let to
households requiring wheelchair standard properties. The proportions of lets to wheelchair standard
housing will reflect the level of supply of wheelchair standard properties as well as the demand;
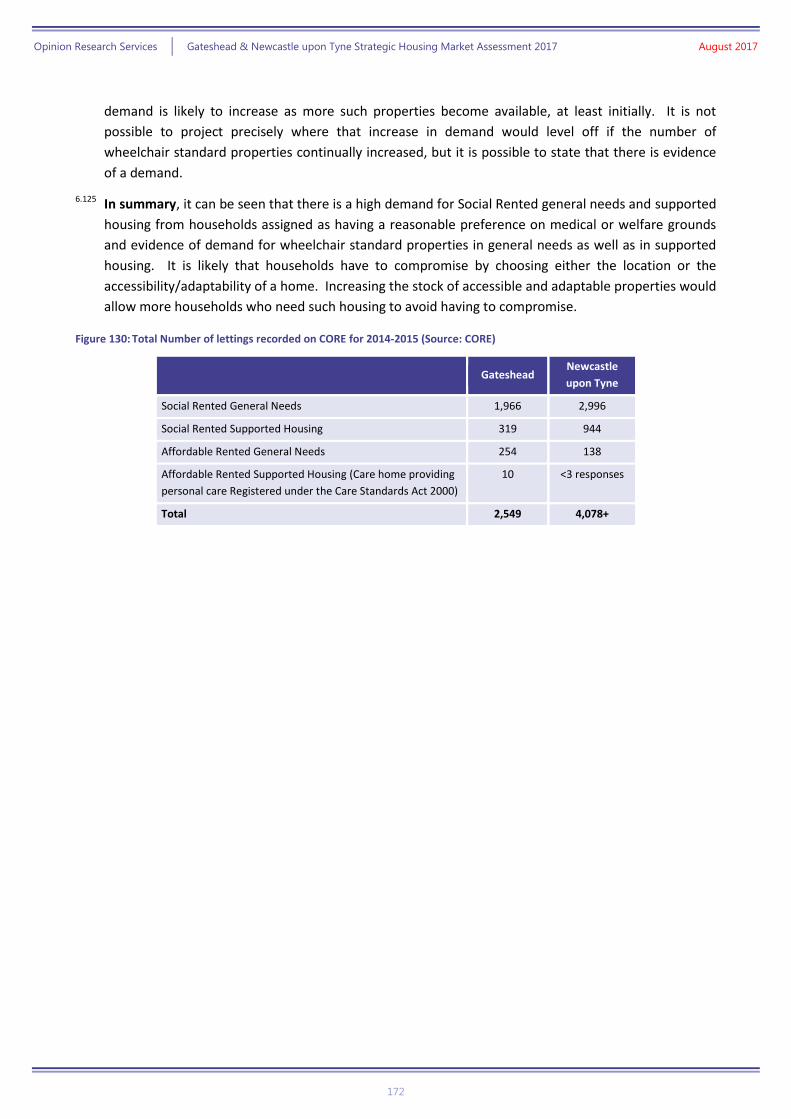
Opinion Research Services | Gateshead & Newcastle upon Tyne Strategic Housing Market Assessment 2017 August 2017
172
demand is likely to increase as more such properties become available, at least initially. It is not
possible to project precisely where that increase in demand would level off if the number of
wheelchair standard properties continually increased, but it is possible to state that there is evidence
of a demand.
6.125 In summary, it can be seen that there is a high demand for Social Rented general needs and supported
housing from households assigned as having a reasonable preference on medical or welfare grounds
and evidence of demand for wheelchair standard properties in general needs as well as in supported
housing. It is likely that households have to compromise by choosing either the location or the
accessibility/adaptability of a home. Increasing the stock of accessible and adaptable properties would
allow more households who need such housing to avoid having to compromise.
Figure 130: Total Number of lettings recorded on CORE for 2014-2015 (Source: CORE)
Gateshead Newcastle
upon Tyne
Social Rented General Needs 1,966 2,996
Social Rented Supported Housing 319 944
Affordable Rented General Needs 254 138
Affordable Rented Supported Housing (Care home providing
personal care Registered under the Care Standards Act 2000)
10 <3 responses
Total 2,549 4,078+

Opinion Research Services | Gateshead & Newcastle upon Tyne Strategic Housing Market Assessment 2017 August 2017
173
Figure 131: Number of lettings recorded on CORE for 2014-2015 (Source: CORE)
Gateshead Newcastle upon Tyne
Lettings to households with a reasonable preference on
medical welfare Lettings
Lettings
Social Rented General Needs 98 5.0% 148 4.9%
Social Rented Supported Housing 20 6.3% 36 3.8%
Affordable Rented General Needs 4 1.6% 4 2.9%
Affordable Rented Supported Housing (Care home providing
personal care Registered under the Care Standards Act 2000)
2 20.0% <3 responses Not available
Total 124 4.9% 188+ 4.6%
Lettings to wheelchair standard properties Lettings
Percent of all
lettings in
category
Lettings
Percent of all
lettings in
category
Social Rented General Needs 152 7.7% 128 4.3%
Social Rented Supported Housing 49 15.4% 318 33.7%
Affordable Rented General Needs 4 1.6% 16 11.6%
Affordable Rented Supported Housing (Care home providing
personal care Registered under the Care Standards Act 2000)
6 60% <3 responses Not Available
Total 211 8.3% 462+ 11.3%
Lettings to mobility standard properties (fitted with
equipment and adaptations) Lettings
Percent of all
lettings in
category
Lettings
Percent of all
lettings in
category
Social Rented General Needs Not available Not available Not available Not available
Social Rented Supported Housing 129 40.4% 241 25.5%
Affordable Rented General Needs Not available Not available Not available Not available
Affordable Rented Supported Housing (Care home providing
personal care Registered under the Care Standards Act 2000)
4 40% <3 responses Not Available
Total 133 40.4% 241+ 25.5%
6.126 The Census 2011 contains information on residents with Long Term Limiting Illness (LTLI). Figure 132 shows the proportion of residents in the main housing tenures who identified as having LTLI with day-to-day activities limited a lot and demonstrates a need for M4(2) accessible and possibly M4(3) wheelchair housing. Key points shown by the figures are.
6.127 The proportions of residents with day-to-day activities limited a lot are similar for each age and tenure group for the two authorities. Here they are compared to England and the North East:
» In Gateshead and Newcastle, based on the Census LTLI figures:
o 31% of all people aged 65 or over in each of the two authorities has an LTLI which limits their
day-to-day activities a lot.
Opinion Research Services | Gateshead & Newcastle upon Tyne Strategic Housing Market Assessment 2017 August 2017
174
o This includes around a quarter of residents of owner occupied properties aged 65 or over
(25% and 24% respectively), 44% of social rented tenants and 37% of PRS tenants67.
» Across the North East: 30% of all people aged 65 or over have a LTLI which limits their day-to-day
activities a lot, including 25% of residents of owner occupied properties, 45% of social rented
tenants and 36% of PRS tenants.
» In England: 25% of all people aged 65 or over have a LTLI which limits their day-to-day activities a
lot, including 21% of residents of owner occupied properties, 41% of social rented tenants and 32%
of PRS tenants.
6.128 The figures for people aged 65 or over in Gateshead and Newcastle upon Tyne are similar to the North East as a whole, but differ from England. Gateshead and Newcastle upon Tyne have higher proportions overall of people aged 65 or over with a LTLI which limits their day-to-day activities a lot (31% compared to 25% for England), which is reflected in higher proportions for each tenure group: 25% of occupants of owner occupied properties compared to 21% for England; 44% of social rented tenants compared to 41% for England, and; 37% of PRS tenants compared to 32% for England.
6.129 In Gateshead and Newcastle, high proportions of residents who have LTLI with day-to-day activities limited a lot are also apparent in working age groups; 15% of those aged 50 to 64. This includes 9% (Gateshead) and 8% (Newcastle) in owner occupied properties, 32% in social rented properties, and 20% (Gateshead) and 21% (Newcastle) in PRS properties. Of those aged 16 to 49, the overall figures are 5% (Gateshead) and 4% (Newcastle), with 12% (Gateshead) and 11% (Newcastle) among social rented tenants.
6.130 The figures across the North East as a whole are similar to Gateshead and Newcastle: 15% of all those aged 50 to 64 have a LTLI which limits their day-to-day activities a lot, including 33% of social rented tenants; 5% of those aged 16 to 49, including 11% of social rented tenants.
6.131 Some of the rates in Gateshead and Newcastle upon Tyne are higher than for England as a whole, where: 10% overall of those aged 50 to 64 have LTLI with day-to-day activities limited a lot, including 29% of social rented tenants; 4% of those aged 16 to 49, with 10% among social rented tenants.
67
Note: The bases for these proportions are: Gateshead 197,726 residents; Newcastle upon Tyne 271,212 residents. These bases reflect the number of residents counted within the LTLI question and differ from the Census overall populations. The LTLI-question bases are the appropriate denominators in this case, but slightly different proportions would be shown if the total recorded Census populations were used.

Opinion Research Services | Gateshead & Newcastle upon Tyne Strategic Housing Market Assessment 2017 August 2017
175
Figure 132: Gateshead and and Newcastle upon Tyne; resident population with LTLI ‘Day-to-day activities limited a lot’ by tenure
(Source: Census 2011)
All categories: Tenure
Owned (with/without
mortgage, including
shared ownership)
Rented: Social rented
Rented: Private
rented or living rent
free
Gateshead
All categories: Age 11% 8% 20% 7%
Age 0 to 15 2% 1% 3% 1%
Age 16 to 49 5% 3% 12% 4%
Age 50 to 64 15% 9% 32% 20%
Age 65 and over 31% 25% 44% 37%
Newcastle upon Tyne
All categories: Age 9% 7% 18% 4%
Age 0 to 15 2% 1% 3% 2%
Age 16 to 49 4% 2% 11% 2%
Age 50 to 64 15% 8% 32% 21%
Age 65 and over 31% 24% 44% 37%
6.132 The evidence base for the Newcastle upon Tyne City Council “Older People’s Housing Delivery Plan
2013-2018”68 projects the occurrence of LTLI forward using POPPI data, stating that the number of
people aged 65 and predicted to have a limiting long-term illness will increase from around 21,560 in
2012, to 23,050 in 2016 and to 24,385 by 2020, an overall increase of 2,830 people aged 65 or over.
Source: POPPI (using ONS 2011-based interim sub-national population projections).
6.133 It is useful here to summarise the contextual evidence of the need for Category 2 accessible and
adapted properties in Gateshead and Newcastle upon Tyne:
» Spending of between £1.2 and £1.95 million a year in each of the two authorities on DFGs;
» A total of around 2,350 adaptations completed across the two authorities through DFGs in
the previous three years;
» Since 2012, 2,082 major adaptations to Gateshead Council-owned. The mean cost of
major adaptations being £2,750 in Gateshead and £4,922 in Newcastle upon Tyne;
» In 2014/15, 124 lettings, (4.9% of all lettings) recorded on CORE in Gateshead and 188
lettings (4.6% of all lettings) in Newcastle upon Tyne are to households with a reasonable
preference on medical or welfare grounds;
» Census 2011 figures showing that 11% of all residents across tenures in Gateshead have a
LTLI which limits their day to day activities ‘a lot’, 9% in Newcastle upon Tyne, rising to
15% of those aged 50 to 64 and 31% aged over 65 in both authorities.
6.134 Further contextual evidence of the cost benefits of providing accessible and adapted housing is given
in Cost benefits of providing accessible and adaptable housing below.
6.135 Considering the increase in households, in Gateshead 90% (6,800 out of 7,400 households) are likely to
have household representatives aged 65 or over, while in Newcastle upon Tyne 60% (10,200 out of
68 https://www.newcastle.gov.uk/housing/housing-policy-plans-and-performance/older-peoples-delivery-plan

Opinion Research Services | Gateshead & Newcastle upon Tyne Strategic Housing Market Assessment 2017 August 2017
176
16,100 households) are likely to have household representatives aged 65 or over. Given this context,
the evidence supports the need for at least 90% of all dwellings in Gateshead and 60% of all
dwellings in Newcastle upon Tyne to meet Category 2 requirements, providing that this does not
compromise viability.
Wheelchair accessible homes 6.136 The CLG guide to available disability data69 (referenced by PPG above) shows that currently around 1-
in-30 households in England (3.3%) have at least one wheelchair user, although the rate is notably
higher for households living in affordable housing (7.1%). The rates are also higher for older
households, and given that the number of older person households is likely to increase over the period
to 2030, the proportion of households needing wheelchair user housing in future is also likely to be
higher. Figure 133 identifies the proportion of households with a wheelchair user currently living in
market housing and affordable housing by age of household representative.
Figure 133: Percentage of households with a wheelchair user by type of housing and age of household representative
(Source: English Housing Survey 2013-14)
Housing Type Age of Household Representative
15-24 25-34 35-44 45-54 55-64 65-74 75-84 85+
Housing type
Market housing < 0.1% 0.4% 1.0% 1.6% 3.0% 4.0% 6.1% 9.3%
Affordable housing 0.3% 2.0% 2.9% 6.0% 6.0% 10.3% 12.7% 19.9%
6.137 Figure 134 identifies the net change in the number of households with a wheelchair user in Gateshead
and Newcastle, over the 15-year Plan period 2015-30. It is evident that the number of households
likely to need wheelchair adapted housing in Gateshead is likely to increase by 540 over the period,
equivalent to around 7.3% of the overall OAN. In Newcastle upon Tyne, the number of households
likely to need wheelchair adapted housing is likely to increase 911 over the period, equivalent to
around 5.6% of the overall OAN.
69 https://www.gov.uk/government/publications/building-regulations-guide-to-available-disability-data

Opinion Research Services | Gateshead & Newcastle upon Tyne Strategic Housing Market Assessment 2017 August 2017
177
Figure 134: Households needing Wheelchair Adapted Housing (Source: ORS Housing Model. Note: Figures may not sum due to
arithmetic rounding)
Modelled Need for Wheelchair Adapted
Housing
Households aged under 75 Households aged 75+ Overall change 2015-30
% of OAN 2015 2030
Net change 2015-30
2015 2030 Net
change 2015-30
GATESHEAD
Housing type
Market housing 1,002 1,085 83 599 815 216 299 6.3%
Affordable housing 1,261 1,323 63 678 857 179 241 9.3%
All households 2,262 2,408 145 1,277 1,671 394 540 7.3%
NEWCASTLE UPON TYNE
Housing type
Market housing 1,192 1,342 150 671 930 258 408 3.6%
Affordable housing 1,758 1,974 215 782 1070 287 503 10.6%
All households 2,951 3,315 365 1,454 2,000 546 911 5.6%
6.138 In Gateshead this comprises 299 households in market housing (6.3% of the market housing OAN) and
241 households in affordable housing (9.3% of the affordable housing OAN). The evidence therefore
supports the need for a proportion of both market and affordable housing to be wheelchair accessible,
and the Council should plan for a minimum of 6% of all market housing and 10% of affordable
housing to meet Category 3 requirements.
6.139 It is evident that the majority of the identified growth in Gateshead (394 households, equivalent to
73%) are households aged 75 or over. It is likely that many of these households would also be
identified as needing specialist housing for older persons. The earlier analysis identified a need for up
to 1,130 specialist older person housing units for households aged 75 or over, whilst the above
analysis identifies a need for a total of around 1,671 wheelchair adapted dwellings for households in
the same age group.
6.140 In Newcastle upon Tyne the change in the number of households with a wheelchair user comprises
408 households in market housing (3.6% of the market housing OAN) and 503 households in
affordable housing (10.6% of the affordable housing OAN). The evidence therefore supports the need
for a proportion of both market and affordable housing to be wheelchair accessible, and the Council
should plan for a minimum of 4% of all market housing and 11% of affordable housing to meet
Category 3 requirements.
6.141 It is evident that the majority of the identified growth in Newcastle upon Tyne (258 households,
equivalent to 63%) are households aged 75 or over. It is likely that many of these households would
also be identified as needing specialist housing for older persons. The earlier analysis identified a need
for up to 1,430 specialist older person housing units for households aged 75 or over, whilst the above
analysis identifies a need for a total of around 2,000 wheelchair adapted dwellings for households in
the same age group.
6.142 Whilst not all households aged 75 or over needing wheelchair adapted housing will live in specialist
older person housing, at any point in time it is likely that around two-fifths of households aged 75 or
over living in specialist housing will need wheelchair adapted homes. However, it is important to
Opinion Research Services | Gateshead & Newcastle upon Tyne Strategic Housing Market Assessment 2017 August 2017
178
recognise that as individual household circumstances change, it is likely that some households will
start using a wheelchair whilst living in specialist housing if their health deteriorates. On this basis, a
higher proportion of specialist older person housing units will need to be wheelchair adapted. The
evidence supports the need for a target for all specialist housing for older people to meet Category 3
requirements.
6.143 When developing appropriate policies, it is important to note that Planning Practice Guidance for
Housing optional technical standards states:
Local Plan policies for wheelchair accessible homes should be applied only to those dwellings where
the local authority is responsible for allocating or nominating a person to live in that dwelling.
Planning Practice Guidance (March 2015), ID 56-009
6.144 On this basis, it is appropriate for the local authority to set a target requiring the provision of
wheelchair accessible housing that meets Category 3 (b - to meet the needs of occupants who use
wheelchairs) requirements in relation to affordable housing. Furthermore, as there is clearly evidence
to support the need to provide market housing that is wheelchair accessible, it would be appropriate
for the local authority to set a target requiring that a proportion of market housing is readily adaptable
to wheelchair accessible housing that meets Category 3 (a - allow simple adaptation of the dwelling to
meet the needs of occupants who use wheelchairs) requirements.
Meeting the need for M4(2) accessible and M4(3) wheelchair user housing 6.145 The two authorities follow different approaches to providing wheelchair user housing, which it is
important to note before summarising the evidence from this assessment.
6.146 Gateshead has a policy aim to have M4(3)(a) adaptable housing in market housing developments. In
affordable housing, the aim is to have M4(3)(b) accessible housing where a nomination is identified,
defaulting to M4(3)(a) adaptable housing where no nomination is identified.
6.147 In Newcastle upon Tyne, all affordable housing is built to be adaptable. Once the needs of a resident
are clarified, the property is adapted post build. In this way, affordable housing allocations help to
ensure that the needs of wheelchair residents are met within M4(3) standard, usually through a
bespoke adaptation at the point of allocation.
6.148 Our assessment of need is that the evidence supports a need for:
» at least 90% of all dwellings in Gateshead to meet M4(2) - Category 2 accessible housing standard
» at least 60% of all dwellings in Newcastle upon Tyne to meet M4(2) - Category 2 accessible and
adaptable housing standard.
» A minimum of 6% of all market housing to meet M4(3)(a - allow simple adaptation of the dwelling
to meet the needs of occupants who use wheelchairs) wheelchair requirements in Gateshead;
» 10% of affordable housing to meet M4(3)(b - to meet the needs of occupants who use wheelchairs)
wheelchair requirements in Gateshead.
» A minimum of 4% of all market housing to meet M4(3)(a - allow simple adaptation of the dwelling
to meet the needs of occupants who use wheelchairs) in Newcastle upon Tyne;

Opinion Research Services | Gateshead & Newcastle upon Tyne Strategic Housing Market Assessment 2017 August 2017
179
» 11% of affordable housing to meet M4(3) (b - to meet the needs of occupants who use wheelchairs)
wheelchair requirements in Newcastle upon Tyne.
6.149 All providing that this does not compromise viability.
6.150 It is important to understand what these percentages mean and how they might be delivered. It is not
viable to proportion them further between existing stock and new build dwellings because of
imperfect data. Notably, it is not known with any accuracy what proportion of existing stock meets
either standard, particularly the M4(2) accessible standard. Nor are there any robust figures on the
proportion of existing stock that it would be possible and financially viable to adapt to either standard.
Evidence from the English Housing Survey (EHS) suggests that large proportions of existing stock may
be unsuitable for adaptation.
6.151 The EHS “Adaptations and Accessibility Report, 2014-15” (CLG, July 2016) and annex figures70
demonstrate the state of existing stock in England and viability of that stock reaching the lowest
accessibility standard; M4(1) – Visitable. Annex Figure 2.3 is reproduced below.
Figure 135: Level of work required to create full visitability (Source: EHS 2014-15 Annex Figure 2.3)
70
https://www.gov.uk/government/statistics/english-housing-survey-2014-to-2015-adaptations-and-accessibility-of-homes-report
Opinion Research Services | Gateshead & Newcastle upon Tyne Strategic Housing Market Assessment 2017 August 2017
180
6.152 It is noticeable that the proportion of homes which are not feasible to make fully visitable fluctuates
over time. Nationally, 55% of pre-1919 homes cannot feasibly be made fully Visitable. That
proportion fell to 22% of homes built between 1919 and 1944, to 17%-18% between 1945 and 1980,
then increased again so that 23% of homes built between 1981 and 1990, and almost 25% built since
1990 cannot feasibly be made fully visitable.
6.153 In total, 27.7% of the national housing stock cannot feasibly be made fully Visitable. A further 15.3%
could only be made fully Visitable with major work, including 18% of homes built between 1981 and
1990, and almost 17% of homes built since 1990.
6.154 The stock profile of dwellings in Gateshead and Newcastle upon Tyne are shown below.
6.155 In Gateshead in 2017, just over a quarter of privately owned dwellings were pre-1919, and just over a
fifth post-1980. A small majority of privately owned dwellings (52%) were built between 1919 and
1980, the period when the EHS shows that the majority of homes could be made visitable, usually with
‘moderate works’. As might be expected from national policy through the last century, 96% of Council
owned stock was built between 1919 and 1980.
6.156 In Newcastle upon Tyne, in 2010, just under a quarter of dwellings were pre-1919 and 13% post-1980,
meaning that 63% were built between 1919 and 1980, the period when the EHS shows that the
majority of homes could be made visitable, usually with ‘moderate works’. Within the City, a total of
70% were built between 1919 and 1980, including 96% of Your Homes Newcastle upon Tyne (YHN)
properties and 64% of private properties.
6.157 It is likely that a large proportion of the stock of existing properties in both Gateshead and Newcastle
upon Tyne could be made Visitable.

Opinion Research Services | Gateshead & Newcastle upon Tyne Strategic Housing Market Assessment 2017 August 2017
181
Figure 136: Gateshead; Stock age profile, excluding private Registered Social Housing providers (Source: Gateshead Council, CLG)
Private
Dwelling age Gateshead
(2007 Stock Condition
Survey)
England 2007
(2007 Stock Condition
Survey)
Gateshead 2017 England 2015
(English Housing
Survey 2015-16)71
Pre-1919 27.8% 24.4% 26.1% 23.7%
1919-1944 18.5% 19.7% 17.3% 17.3%
1945-1964 22.4% 17.7% 21.1% 17.1%
1965-1980 14.8% 20.5% 13.9% 18.5%
Post-1980 16.4% 17.6% 21.6% 23.4%
All ages 100.0% 100.0% 100% 100%
Council stock
Dwelling age Number 2017 Percent 2017
Pre-1919 7 0.04%
1919-1944 5463 28%
1945-1964 8045 41%
1965-1980 5187 27%
Post-1980 703 4%
Total 19,405 100%
Figure 137: Newcastle upon Tyne; Stock age profile, private, non-social stock (Source: Newcastle upon Tyne City Council, CLG)
Private
Dwelling age Newcastle
(2010 Stock Condition
Survey)
England 2007
(2010 Stock Condition
Survey)
Pre-1919 23.2% 24.6%
1919-1944 28.4% 17.0%
1945-1964 16.6% 16.9%
1965-1980 18.3% 20.1%
1981-1990 4.9% 8.9%
Post-1990 8.6% 12.5%
All ages 100.0% 100.0%
71
https://www.gov.uk/government/statistics/english-housing-survey-2015-to-2016-headline-report

Opinion Research Services | Gateshead & Newcastle upon Tyne Strategic Housing Market Assessment 2017 August 2017
182
Figure 138: Newcastle upon Tyne City; Stock age profile, excluding private Registered Social Housing providers (Source:
Newcastle upon Tyne Council, CLG)
City
Dwelling age Newcastle
Building Use Class
Order
YHN
Building Use Class
Order
Non YHN Properties
Building Use Class
Order
Pre-1919 21.97% 4.26% 26.83%
1919-1944 26.76% 30.43% 25.75%
1945-1964 21.68% 43.04% 15.83%
1965-1980 22.01% 22.23% 21.95%
Post-1980 7.58% 0.03% 9.65%
All ages 100.0%
Dwelling age Newcastle
Building Use Class
Order
YHN
Building Use Class
Order
Non YHN Properties
Building Use Class
Order
Pre-1919 25,230 1,053 24,177
1919-1944 30,728 7,523 23,205
1945-1964 24,903 10,641 14,262
1965-1980 25,278 5,496 19,782
Post-1980 8,702 8 8,694
Unclassified 10,459 496 9,963
All ages 125,300 25,217 100,083
6.158 The age profile of housing stock in both Gateshead and Newcastle upon Tyne has changed over recent
years following a programme of demolition and replacement. The Compliance Statement for the Core
Strategy; “Planning for the future: Core strategy and Urban Core Plan for Gateshead and Newcastle
upon Tyne Compliance statement72” (February 2014) sets out some key elements and effects of the
demolition programmes in Gateshead and Newcastle upon Tyne. Policy CS9 Existing Communities
states:
“Existing communities will be sustainable places of quality and choice. This will be achieved
by:
1. Maintaining a range of housing types and sizes throughout the plan area,
2. Maintaining and improving facilities, services and the local environment,
3. Bringing empty properties back into use, demolition of housing which is no
longer viable or in demand, supporting programmes of improvement and renewal
and the replacement of housing,
4. Preventing the loss of family homes through sub‐division, change of use or
redevelopment,
And
5. Preventing an over concentration of shared accommodation.”
72
http://www.gateshead.gov.uk/DocumentLibrary/Building/PlanningPolicy/Core-Strategy-Documents/EL09-Compliance-Statement.pdf

Opinion Research Services | Gateshead & Newcastle upon Tyne Strategic Housing Market Assessment 2017 August 2017
183
6.159 The initial period in Newcastle upon Tyne occurred between 2010/11 and 2012/13, with a larger
number of demolitions than completions leading to a net loss of stock at the peak in 2012/13. Since
2013/14 the number of demolitions in Newcastle upon Tyne has fallen from being from around 200 to
600 properties a year to a level measured in tens of properties a year and this situation is anticipated
to continue at a constant lower level until 2029/30. (Figure 31 of the Compliance Statement.)
6.160 The demolitions programme in Gateshead involves a larger number of properties and the initial
intense period ran from 2010/11 to 2015/16, with net losses of stock due to greater numbers of
demolitions than completions in 2013/14 and 2014/15. By 2015/16 there was a considerable net gain.
Since 2016/17 the number of demolitions has fallen from being around 150 to 750 properties a year to
a level measured in tens of properties a year and this situation is anticipated to continue at a constant
lower level until 2029/30. (Figure 32 of the Compliance Statement.)
6.161 The demolition and rebuild programme offers an opportunity to remodel some of the stock to provide
accessible and adapted homes.
6.162 From this assessment of the lower M4(1) visitable standard, it is clear that:
» a large proportion of the existing dwelling stock could not be adapted to reach M4(2) or
M4(3) standard;
» dwellings built since 1981 are less likely to be viable to adapt than those built between
1919 and 1980.
6.163 This evidence leads to the conclusion that, while the existing stock is considerably larger than
projected new build, adapting existing stock through DFGs is part of the solution, but adapting
existing stock alone cannot provide sufficient adapted properties to meet the need.
6.164 On top of the physical limitations of the existing stock, there are other factors which affect the delivery
of M4(2) - accessible housing in existing dwellings:
» While younger people are more likely to move, new housing needs to be built for households
growing older and therefore a proportion to be built to accessibility and wheelchair standards.
» There will be a large number of older households who need accessible housing or wheelchair user
housing where they currently live, or to move to such housing because their current home is not
viable to adapt to their needs.
» The need for accessible and wheelchair user housing is not constrained to older households.
6.165 In conclusion, M4(2) – Category 2 accessible and M4(3) – Category 3 wheelchair user housing needs to
be delivered through a programme of new housing built to the standard alongside adaptations,
currently predominantly through DFGs. In aiming for the proportions of M4(2) Category 2 and M4(3)
Category 3 housing set out at the beginning of this section, it would be appropriate to apply those
percentages to all new developments, subject to viability. The demolition and rebuild programme
may offer some opportunity to provide accessible and adapted housing. This is because adapting the
existing housing stock alone is unlikely to provide sufficient future accessible and wheelchair user
housing.
6.166 Regarding M4(3) - wheelchair user housing, a final factor which must be taken into account is our
assessment that all specialist housing for older people should be to Category 2 wheelchair standard.
Providing this would lead to a lower proportion of wheelchair user housing required in the general

Opinion Research Services | Gateshead & Newcastle upon Tyne Strategic Housing Market Assessment 2017 August 2017
184
needs stock. However, the situation requires monitoring because of the number of younger
wheelchair users; Figure 134 shows a larger number of households who require wheelchair user
housing aged below 75 than households of age 75 and above in 2015 and projected to 2030.
Older people – local context
Gateshead 6.167 Gateshead housing Strategy 2013-1873 is structured around THREE linked objectives:
» Support – to help residents access and sustain a home which promotes their wellbeing. Preventing
Homelessness is a key element of this objective.
» Standards – to improve the quality, condition and management of housing so that all residents
benefit from safe, healthy and well-managed homes.
» Supply – to ensure use of existing stock and supply of new housing best meets current and future
needs and aspirations.
6.168 The housing strategy Action Plan includes several aims related to improving accessible and wheelchair
housing:
6.169 Under the support objective, Gateshead Council aim to:
» Identify clear commissioning priorities for independent living
» Develop a framework for Independent Supported Living service providers
» Carry out market appraisal of residential care homes sector
» Develop forward plan of new specialist housing provision to reduce long-term care and support
costs (with the outcome: New accommodation which supports people to live independently)
6.170 Under the standards objective, Gateshead Council aim to:
» Deliver the falls prevention initiative (with the outcome: Reduced hospital admissions due to falls)
6.171 Under the supply objective, Gateshead Council aim to:
» Develop a register of existing specialist and adapted accommodation in the borough (with the
outcome: Better understanding of local provision)
» Develop a specialist housing design guide to ensure we build the right homes for people with
specialist needs (with the outcome: New homes built meet the specific needs of disabled people)
6.172 Gateshead older people’s housing survey February 2017 was posted out to all members of the
Gateshead Older People’s Assembly and received 170 responses from households. The survey aimed
to help the Council gain a greater understanding of the housing issues affecting local communities and
inform future housing plans. Specifically, Gateshead aim to keep people living in standard housing
wherever possible in preference to residential of care homes; the survey was intended to help identify
what is needed to facilitate that.
73
http://www.gateshead.gov.uk/Housing/Strategy/strategic.aspx

Opinion Research Services | Gateshead & Newcastle upon Tyne Strategic Housing Market Assessment 2017 August 2017
185
6.173 Some key results are directly relevant to the issues of accessible or adaptable housing and wheelchair
housing:
» More than four fifths (82%) of existing older households had no plans to move from their current
homes, with 23% of those having already moved to a home which they considered suitable for them
as they get older. Most of these were in general needs housing.
» Irrespective of whether they currently plan to move, just over half of households (52%) said it was
likely that they would be prepared to move at some point to maintain independence. There was
considerable interest in housing designed with older people in mind. Half of households (50%) said
they would be likely to choose to live in housing designed for older people, such as sheltered
housing or retirement housing, to maintain their independence. However, around a quarter (26%)
felt they would be unlikely to choose to live in specialist housing.
» If their health deteriorated and they needed care and support, 36% of households would be most
likely to consider moving to supported accommodation for older people with care on site, but 34%
would be most likely to consider professional care provided in their home and 27% would be most
likely to consider care or support provided at home by family or friends.
» There is a clear preference for bungalows, with almost four fifths (77%) of responding older
households saying that if they were to move again, they would prefer to live in a bungalow,
compared to 13% for an apartment and 10% for a house.
» Key drivers for moving focus on health, the quality of property being offered and its location: a
household member’s health deteriorating; property design and size; proximity to amenities, family
or friends; tenure and costs.
» Maintaining independence is a key issue for those planning to move. Yet other studies have shown
that a fall or sudden health problem is the main reason for unplanned moves (especially to
residential care).
6.174 Important conclusions from the survey relating to accessible or adaptable housing and wheelchair
housing are:
» The survey evidence shows that there are many older person households who will be looking to
move to suitable homes within the general housing stock.
» Assistance to help people plan ahead, and explore potential housing options in advance, may
smooth transitions
» Providing homes which allow for support in the home could be more attractive to older people
considering a move.
» Adaptations remain as necessary as ever. Just over a fifth (22%) of households occupy homes which
are not currently suitable but which could be adapted.
6.175 In summary, the evidence of need for accessible and wheelchair housing supports the aims and
objectives of the Gateshead Housing Strategy 2013-18. The Gateshead Older Persons Housing Survey
2017 provides direct local evidence which supports the need for more accessible or adaptable, and
wheelchair properties.
Opinion Research Services | Gateshead & Newcastle upon Tyne Strategic Housing Market Assessment 2017 August 2017
186
Newcastle upon Tyne 6.176 The Newcastle upon Tyne City Council “Older People’s Housing Delivery Plan 2013-2018”74 states that:
“Newcastle’s population is ageing and currently there are insufficient accommodation
options to meet the growth and diversity in this section of the housing market. The most
notable feature of the population projections is the number of people aged 85+ and with this
a likely increase in the number of people requiring care and support services. Newcastle
upon Tyne experiences higher numbers of people suffering from dementia when compared
to the national average and this is increasing with numbers aged over 65 expected to rise
from 3,200 to 4,400 by 2030. These trends will require a change in how we deliver services
to focus more on prevention and early intervention.” (Paragraph 2.5)
6.177 In response to this challenge, Newcastle upon Tyne City Council intends to:
“[provide] a broader choice of housing options, including housing based models of care such
as assisted living/ extra care, and preventative and early intervention services supported by
improved information and advice.” (Paragraph 2.6)
6.178 To achieve this, the Older People’s Delivery Plan has the aims of:
» helping older people to live independently for as long as possible in their own homes;
» increasing the number of units and diversity of specialist housing;
» making sure older people have the advice and information they need.
6.179 The provision of accessible and wheelchair housing is an important part of meeting these aims.
6.180 The views and expectations of older people in Newcastle upon Tyne were researched in the “Older
People’s Supported and Specialist Housing Impact Assessment” (PFA, October 2011) which used a
large scale household survey of older people living in the city, surveys of sheltered housing stock and
residents, analysis of data on people leaving short term supported and emergency housing, audit of
the needs of older people in short stay supported accommodation in the city, consultation with older
people across the 3 geographical sub areas of the city (E, W and N) and interviews with a range of
stakeholders.
6.181 The findings and recommendations were presented under five themes:
» Changing the culture
» Older people in the housing market – reshaping the housing stock for older people
» Information, advice and access
» Developing preventative services and capacity
» Lifetime neighbourhood communities
6.182 The report also includes an impact assessment of commissioning for adult social services.
6.183 Some key results are directly relevant to the issues of accessible or adaptable housing and wheelchair
housing:
74 https://www.newcastle.gov.uk/housing/housing-policy-plans-and-performance/older-peoples-delivery-plan
Opinion Research Services | Gateshead & Newcastle upon Tyne Strategic Housing Market Assessment 2017 August 2017
187
» Around 4,000 residents in older person households (12.1% of households) said that they
used a wheelchair, though 77.5% of wheelchairs are only used outdoors with 22.5% used
both indoors and outdoors.
» While 27.8% live in dwellings with the appropriate number of bedrooms for the
household size and characteristics, 71.1% are under occupying. On the basis that an older
person household is under-occupying if it has two or more spare bedrooms, there are
around 10,148 such households. Most of these households are owner occupiers (78.2%).
» Around three quarters of existing older person households (72.8%) had no plans to move
from their current homes, with around 3000 (8.8%) of older person households planning
to move in the next 5 years or around.
» Reasons to move varied between tenures. Owner occupiers stated the need for a smaller
property (59.3%) and housing suitable for an older/disabled person (31.6%). Of private
renters, 46.1% needed housing suitable for an older/disabled person, 35.2% wanted to
move close to family/friends for social reasons. Of social renters, nearly half need
housing suitable for an older/disabled person (46.2%), 44.4% wanted a larger property or
one that is better in some way and 39.2% wanted to move closer to family/friends to
give/receive support. Smaller gardens were also a predominant reason to move for owner
occupiers and private renters.
» Irrespective of whether they currently plan to move, just over half of households (52%)
said it was likely that they would be prepared to move at some point to maintain
independence. There was considerable interest in housing designed with older people in
mind. Half of households (50%) said they would be likely to choose to live in housing
designed for older people, such as sheltered housing or retirement housing, to maintain
their independence. However, around a quarter (26%) felt they would be unlikely to
choose to live in specialist housing.
» Key drivers for moving and choice of home focus on health, the quality of property being
offered and its location; property design and size; proximity to amenities, family or
friends; tenure and costs, and being in a flat area.
6.184 Of the 28 recommendations, the following are directly relevant to the issues of older persons housing:
» Develop Extra Care Schemes for sale and rent.
» Change of use of sheltered housing to Extra Care.
» Enable private developers and RSL’s to build Retirement Homes for sale (flats and
bungalows with or without access to care and support services).
» Demolish or change the use of low demand sheltered schemes.
» Use the evaluation of the pilot Under-Occupation Scheme to develop an under-
occupation scheme. (CLG has made funding available to Council’s to develop schemes to
encourage older people under occupying properties to down size. Your Homes Newcastle
had piloted a project aimed at its older residents and the findings from this should be
used to inform a more generic scheme.)
» Methods to deal with homelessness among older people, including among others:
identifying preferred options for long term residents of short term housing; support to
address the barriers to access ordinary housing; help to access sheltered housing and to

Opinion Research Services | Gateshead & Newcastle upon Tyne Strategic Housing Market Assessment 2017 August 2017
188
develop better pathways into sheltered housing; access to specialist or adapted care
provision which can accommodate clients with a history of homelessness and/or chronic
alcohol dependence, and; exploring the needs of older people currently in social or
private rented homes at risk of losing their homes.
» Look at a future model for delivering DFGs that makes use of the independent sector for
delivery.
» Model reductions in the use of residential care in favour of housing based models (extra
care).
Cost benefits of providing accessible and adaptable housing 6.185 A number of studies over many years have provided evidence that provision of accessible and
adaptable housing will result in cost savings for health and social care which outweigh the cost of
provision of the housing. Here we list three examples.
6.186 The Office of Disability Issues and University of Bristol study: “Better outcomes, lower costs -
Implications for health and social care budgets of investment in housing adaptations, improvements
and equipment: a review of the evidence”75 (DWP, 2007) identified four types of cost savings:
» Saving by reducing or removing completely an existing outlay such as saving the cost of residential
care and reducing the cost of home care:
“For a seriously disabled wheelchair user, the cost of residential care is £700-£800 a week -
£400,000 in 10 years. The provision of adaptation and equipment that enables someone to
move out of a residential placement produces direct savings, normally within the first year.
Home modifications can also help to prevent or defer entry into residential care for older
people. One year’s delay will save £26,000 per person, less the cost of the adaptation
(average £6,000).”
» Saving through prevention of an outlay that would otherwise occur, such as preventing hip
fractures and other health costs for disabled people and carers, and preventing admission to
residential care.
» Saving through prevention of waste, such as delays in adaptations leading to additional care costs;
such delays may not have occurred in an accessible property.
» Saving through achieving better outcomes for the same expenditure.
6.187 Habinteg HA response to the “DCLG Consultation Housing Standards Review, Technical Consultation:
September - November 2014” provides evidence that building a new Category 2 standard home can be
cost effective compared to adapting a standard home. The response on the Habinteg website states
that76:
“The costs of inaccessible housing are wide-ranging and significant. They include: the costs
of residential care that could otherwise be avoided; levels of social care that could be
reduced or removed; impacts on independent living, employment and social life; falls and
other accidents which can be life-changing or fatal; mental health impacts; impacts on
75
http://webarchive.nationalarchives.gov.uk/20110202100004/http://www.officefordisability.gov.uk/common/publications-index.php?cssChange=textonly?cssChange=textonly?cssChange=textonly?cssChange=textonly 76
https://www.habinteg.org.uk/toolkit-the-costs-and-benefits-of-accessible-housing

Opinion Research Services | Gateshead & Newcastle upon Tyne Strategic Housing Market Assessment 2017 August 2017
189
general health; avoidable hospital admissions; increased stays in hospital due to lack of
accessible housing to return to (‘bed-blocking’), etc. Department of Health data (found here
on www.gov.uk) shows just one night in hospital costs the NHS around £273, whilst one’
week’s residential care averages £550 (Laing and Buisson, 2009, cited in Alzheimer’s Society
briefing, January 2011). So the estimated £521 cost of building a 3-bedroom home to
Category 2 standard would be met by just one week in residential care.”
6.188 The Leonard Cheshire Disability report “No place like home: 5 Million reasons to make housing
disabled-friendly” (2014) discusses providing Lifetime Homes, but the same principles apply to the
current standards for accessible and adaptable properties77. The report shows some of the savings for
the NHS, including a potential saving larger than the additional cost of building all homes in one year
to Lifetime Homes standard:
» Around 86,000 people fracture their hip every year. 95% of these fractures are the result of a fall,
often in the home.68
» The cost to the NHS of just one hip-fracture – perhaps caused by someone falling down the stairs - is
estimated as £28,000. In comparison, it costs only £1,100 extra to build new homes to Lifetime
Homes Standards.
» If an increased stock of disabled-friendly homes reduced the total number of falls by only 10% it
would save the NHS around £170 million a year. That is nearly half as much again than it would
have cost to build every new home in England to Lifetime Homes standard in 2013/14 – around £115
million.71
» Over the past year people spent over 40,000 unnecessary days in hospital beds despite being well
enough to go home because their homes were not suitably adapted.72 These wasted bed days alone
cost the NHS more than £11.2m every year.73
Other Supported Housing Needs
6.189 Whilst it is important for SHMAs to consider the support needs of disabled people in terms of the
housing requirement, it is necessary for this to be within the context of their support needs more
generally. Figure 139 sets out the growth in vulnerable and older people needs for each client group
over the 10-year period 2011-21 based on estimates from the Homes and Communities Agency
Vulnerable and Older People Needs Estimation Toolkit.
6.190 Rather than a single model, the HCA recognises the full range of need78:
“The HCA recognises that vulnerability covers a wide range and levels of need and that not
all vulnerable people need supported housing - for many, remaining in their own or their
family home with support may be the best solution. Some people may require on-going
support and care in permanent supported housing accommodation, whereas for others the
need for support may be for a limited period requiring tailored services that may be only for
a few months or perhaps up to two years in order to support residents into more
independent living, a settled lifestyle, education, training and employment.”
77
https://www.leonardcheshire.org/about-us/publications/latest-publications-download/no-place-home-5-million-reasons-make-housing 78
http://webarchive.nationalarchives.gov.uk/20170131085320/https://udc.homesandcommunities.co.uk/ourwork/vulnerable-and-older-people

Opinion Research Services | Gateshead & Newcastle upon Tyne Strategic Housing Market Assessment 2017 August 2017
190
6.191 For older people:
“This includes all housing which is specially designed or designated for older people; for
example, sheltered housing, extra care housing, registered care homes, retirement housing
or clusters of bungalows solely let to older people.”
Figure 139: Estimates of Vulnerable and Older People Needs in Gateshead 2011-21 (Source: Homes and Communities Agency
Vulnerable and Older People Needs Estimation Toolkit)
GATESHEAD 2011 2021 Change 2011-21
People aged under 18 in need
Teenage parents 437 406 -31
Young people aged 16-17 17 16 -1
People aged 18-64 in need
Alcohol misuse 677 673 -4
Learning disabilities 335 334 -1
Mental health problems 626 626 0
Offenders 373 373 0
Moderate physical or sensory disability 235 238 +3
Serious physical or sensory disability 70 71 +1
Refugees 22 22 0
Rough sleepers 7 7 0
Single homeless with support needs 477 477 0
People aged 65+ in need
Frail elderly 814 931 +117
Older people with mental health needs 1,346 1,538 +192
Older people with support needs 4,426 5,059 +633
Opinion Research Services | Gateshead & Newcastle upon Tyne Strategic Housing Market Assessment 2017 August 2017
191
Figure 140: Estimates of Vulnerable and Older People Needs in Newcastle upon Tyne 2011-21 (Source: Homes and Communities
Agency Vulnerable and Older People Needs Estimation Toolkit)
NEWCASTLE UPON TYNE 2011 2021 Change 2011-21
People aged under 18 in need
Teenage parents 539 520 -19
Young people aged 16-17 28 26 -2
People aged 18-64 in need
Alcohol misuse 1,131 1,191 +60
Learning disabilities 510 531 +21
Mental health problems 987 1,028 +41
Offenders 588 613 +25
Moderate physical or sensory disability 317 328 +11
Serious physical or sensory disability 89 92 +3
Refugees 34 36 +2
Rough sleepers 11 12 +1
Single homeless with support needs 753 785 +32
People aged 65+ in need
Frail elderly 895 1,061 +166
Older people with mental health needs 1,478 1,753 +275
Older people with support needs 4,862 5,765 +903
6.192 The modelling of supported housing needs is complex and it is essential that housing options are
established within the context of the strategy for wider support. It therefore isn’t appropriate for the
SHMA to determine these figures in isolation. Nevertheless, the numbers of people involved are
relatively low; so the overall need for various types of specialist housing is likely to represent a very
small proportion of the overall housing need for 12,586 dwellings in Gateshead and 26,050 dwellings
in Newcastle upon Tyne over the 24-year Plan period 2015-39.
6.193 There are also issues regarding new build viability; economies of scale are not strong (schemes tend to
be bespoke or involve low volumes) and competition for land (especially in desirable areas) drives up
values and costs. Further, the role of housing benefit in viability becomes more pronounced, and the
impact of Welfare reform will need to be taken into account. Consequently, some form of subsidy will
be required either from planning gain, land subsidy or capital contribution. On this basis, the
proposed delivery level may be lower than the identified need due to viability constraints. It will
therefore be important for housing and planning officers to continue liaising with their colleagues from
social care to ensure that appropriate housing is provided for the needs of Gateshead and Newcastle
upon Tyne ’s residents.

Opinion Research Services | Gateshead & Newcastle upon Tyne Strategic Housing Market Assessment 2017 August 2017
192
7. Space Standards Compliance with the 2015 Nationally Described Space Standards (NDSS) for Gross Internal Area (GIA)
Background 7.1 The CLG published the PPG Housing: optional technical standards in March 2015 covering:
» Accessibility and wheelchair housing standards
» Water efficiency standards
» Internal space standards
7.2 Accessibility and wheelchair housing standards are discussed above. This section deals with the
internal space standards.
7.3 The standards are optional and local authorities are required to gather evidence of the need to apply
them in their area before setting them in the Local Plan79:
“Local planning authorities have the option to set additional technical requirements
exceeding the minimum standards required by Building Regulations in respect of access and
water, and an optional nationally described space standard. Local planning authorities will
need to gather evidence to determine whether there is a need for additional standards in
their area, and justify setting appropriate policies in their Local Plans.”
(Paragraph: 002 Reference ID: 56-002-20160519)
Compliance with the 2015 NDSS for GIA 7.4 Internal space standards required in a Local Plan must be in accordance with the specified standards:
“Where a local planning authority (or qualifying body) wishes to require an internal space
standard, they should only do so by reference in their Local Plan to the nationally described
space standard.”
(Paragraph: 018 Reference ID: 56-018-20150327)
7.5 The nationally described standards are contained in the Housing: optional technical standards, which:
“Sets out requirements for the Gross Internal (floor) Area of new dwellings at a defined level
of occupancy as well as floor areas and dimensions for key parts of the home, notably
bedrooms, storage and floor to ceiling height.”
(Housing: optional technical standards, Paragraph 1)
7.6 The Gross Internal Area (GIA), measured in square metres, is defined in the Standards as being “the
total floor space measured between the internal faces of perimeter walls that enclose the dwelling”
and includes all internal spaces such as cupboards and other elements such as partitions.
79
https://www.gov.uk/guidance/housing-optional-technical-standards

Opinion Research Services | Gateshead & Newcastle upon Tyne Strategic Housing Market Assessment 2017 August 2017
193
7.7 The NPPF was published in March 2012, predating the PPG Housing: optional technical standards.
However, paragraph 174 sets out a requirement for standards in Local Plans to be evidenced and to
take account of the cumulative impact of those standards:
“Local planning authorities should set out their policy on local standards in the Local Plan,
including requirements for affordable housing. They should assess the likely cumulative
impacts on development in their area of all existing and proposed local standards,
supplementary planning documents and policies that support the development plan, when
added to nationally required standards. In order to be appropriate, the cumulative impact of
these standards and policies should not put implementation of the plan at serious risk, and
should facilitate development throughout the economic cycle. Evidence supporting the
assessment should be proportionate, using only appropriate available evidence.”
(NPPF Paragraph 174)
7.8 In September 2011, RIBA published research in “The Case for Space: The size of England’s new
homes”80, which showed that:
“the family homes being sold by the UK’s eight largest private housebuilders was on average
8m² – the size of a single bedroom – smaller than the minimum standards drawn up for
London”.
(Quoted from Space Standards for Homes, 2015)
7.9 Following lobbying by RIBA and the publication of the Housing: optional technical standards PPG, RIBA
revisited the evidence for space standards on new developments, published as Space Standards for
Homes, 201581. This research focussed on 3-bedroom homes as an exemplar using a sample of 100
sites regionally spread across England built by the top 10 volume housebuilders by turnover. The main
conclusions which are relevant here were:
» Outside London, the average new three bedroom home is 4m² smaller than the new
standard, which is the equivalent size of a bathroom.
» Homes in London are bigger than in the rest of the Country. The average 3 bedroom
home in London is now 25m² bigger than in Yorkshire, “the equivalent of a double
bedroom and a family living room”.
Background: Summary 7.10 Considering the documents reviewed briefly above, we can conclude that:
» The PPG Housing: optional technical standards in March 2015 lays out internal space standards for
individual properties based on defined Gross Internal (floor) Areas. The space standards are called
the Nationally Described Space standards.
» Applying the standards is optional for local authorities and evidence is required of the local need for
the standards to embed the standards in local plans. Viability should be considered.
» RIBA argue that the lack of statutory space standards has led to smaller homes being developed.
80
https://www.architecture.com/knowledge-and-resources/resources-landing-page/space-standards-for-homes 81
https://www.architecture.com/knowledge-and-resources/resources-landing-page/space-standards-for-homes

Opinion Research Services | Gateshead & Newcastle upon Tyne Strategic Housing Market Assessment 2017 August 2017
194
» Based on RIBA evidence, spaces standards of homes delivered in London appear to be higher than
outside the Capital and, while causation cannot be assumed, it is notable that the London Mayor
has adopted the national standard in the MALP.
Gateshead 7.11 Gateshead Council commissioned an evidence base of space standards from Newcastle upon Tyne
University, which was published as An Analysis of Space Standards in Gateshead in January 2016.
7.12 The study considered four case study sites based on size and “housing styles” and being relatively new
developments. The study was conducted through:
» Postal surveys to residents (79 valid responses);
» Electronic surveys to developers (2 valid responses);
» Analysis of existing data and documents (with a focus on lifetime and wheelchair
standards);
» Analysis of residential planning applications (Granted and Refused) between 2012 -
2015 (44 applications provided valid data using the measurements on the plans).
7.13 While the Gateshead report is an in-depth study, there are a small number of key results which are
relevant here (direct quotations are in italics, paraphrases in plain text):
» Of the 36 house types surveyed, 23 house types meet or exceeded the overall gross
internal space standards. (36% fail to meet the standards.)
» In terms of units being delivered on site, the figures for house types account for 415
units. Of these, 208 (50%) are considered the meet the overall gross internal space
standards.
» Only four house types meet or exceed both the overall and bedroom standard. Three of
these are 4- or 5-bedroom properties, while the fourth is a 3-bedroom property.
» three of the house types surveyed did not meet any of the standards.
» 47% of household survey respondents felt that some or all of their rooms needed to
be bigger.
» There is some evidence from the case studies that smaller house types are less likely than
larger house types to meet space standards.
Newcastle 7.14 This section explores the level to which actual development delivered in Newcastle upon Tyne over the
past two years has met the GIA standards for the geographic area of the City where the development
took place, the number of bedrooms and the number of storeys.
7.15 From planning records, a sample of 207 cases of new build house types within development were
taken and the internal area compared to the Standard GIA. The sampling took into account small,
medium and large development sites across viability areas in the city. The sample included the full
range of property sizes and storeys covered by the Standards. Conversions were excluded from the
analysis because of the complexity of dealing with listed buildings in central areas and where
dilapidation or under occupation of listed buildings could put the building at risk.

Opinion Research Services | Gateshead & Newcastle upon Tyne Strategic Housing Market Assessment 2017 August 2017
195
7.16 The figures presented below are the result of an analysis based on total completions. Individual
dwellings were considered based on their attributes such as having 2, 3, 4 or more bedrooms or 1, 2,
or 3 storeys. Dwellings with more than 3 storeys have been excluded from the analysis as there is no
NDS standard provided for them.
Meeting the Standards across Viability Areas
7.17 Newcastle upon Tyne City Council work to six viability areas across the City:
» High (Urban Core)
» High
» High-Mid
» Mid
» Low-Mid
» Low
7.18 The number of completed dwelling achieving the space standards is shown in Figure 139, which shows
the total of 1,544 cases. The largest number of completed dwellings are in the High-Mid viability
areas; 515 completions, of which 223 met the NDSS followed by Low-Mid viability; 384 completions, of
which 165 met the NDSS. In Mid and Low viability areas 55 and 128 completions respectively achieved
the standard.
Figure 141: Number of Dwellings which meet or fall below the NDSS by Viability Area Classification (Source: Newcastle upon
Tyne City Council Planning Portal)
7.19 Figure 142 shows the proportion in each viability area classification that meet or fall below the
standard: 41% of completed new build properties meet the NDSS.
7.20 Considering the separate viability areas, the highest proportions of house types achieving or exceeding
the NDSS are in the High (Urban Core), High-Mid and Low-Mid viability areas (43% each), followed by
Low viability (40%) and High viability (36%). The proportions meeting the NDSS will be affected by
other factors, such as the predominant property sizes developed in each of the viability areas.
0
100
200
300
400
500
600
700
800
900
1000
High (UrbanCore)
High High-Mid Mid Low-Mid Low All
Meets
Falls below

Opinion Research Services | Gateshead & Newcastle upon Tyne Strategic Housing Market Assessment 2017 August 2017
196
Figure 142: Proportion of dwellings which meet or fall below NDSS by Viability Area (Source: Newcastle upon Tyne City Council
Planning Portal)
7.21 The study reviewed sites across Newcastle and representative of this city as a whole. To consider
where recent completions have occurred, the number and the proportions meeting or exceeding the
standard by Ward are shown below.
7.22 The highest number of completions were in Castle (412), Byker (246), Fawdon (177) Walkergate (135)
and Lemington (103). Nine Wards had fewer than 10 completions recorded. High numbers of
completions are to be expected in Castle, where Newcastle Great Park is delivering new homes within
a strategic housing site.
0%
10%
20%
30%
40%
50%
60%
70%
80%
High(UrbanCore)
High High-Mid Mid Low-Mid Low All
Meets
Falls below

Opinion Research Services | Gateshead & Newcastle upon Tyne Strategic Housing Market Assessment 2017 August 2017
197
Figure 143: Number of dwellings which meet or fall below the NDSS by Wards (Source: Newcastle upon Tyne City Council
Planning Portal)
Ward Meets NDSS Falls below
NDSS Ward total
Benwell And Scotswood 17 18 35
Byker 105 141 246
Castle 211 201 412
Dene 11 48 59
Denton 10 9 19
East Gosforth 1 0 1
Elswick 1 0 1
Fawdon 45 132 177
Fenham 14 43 57
Kenton 27 4 31
Lemington 11 92 103
Newburn 6 0 6
North Heaton 0 1 1
Ouseburn 0 30 30
Parklands 0 1 1
South Heaton 1 1 2
South Jesmond 1 8 9
Walker 1 40 41
Walkergate 64 71 135
West Gosforth 3 0 3
Westerhope 34 46 80
Westgate 19 20 39
Wingrove 3 3 6
Woolsington 41 9 50
Total 626 918 1,544
7.23 Excluding wards with less than 30 properties, the highest proportions meeting the NDSS standard are
seen in Woolsington (82% of 50 properties), Castle (51% of 412 properties), Westgate (49% of 39
properties), Walkergate (47% of 135 properties) and Byker (43% of 246 properties) wards, which are
geographically spread across the City. The lowest proportion meeting the NDSS is seen in Lemington
(11% of 103 properties). There may be additional factors playing into this distribution which are less
significant in the other analyses, such as investment in certain areas of Newcastle upon Tyne.

Opinion Research Services | Gateshead & Newcastle upon Tyne Strategic Housing Market Assessment 2017 August 2017
198
Figure 144: Proportion of dwellings which meet or fall below the NDSS by Wards (Source: Newcastle upon Tyne City Council
Planning Portal)
Meeting the Standards by Property Size
7.24 While all the 6 or more bedroom properties meet NDSS, this is based on only five cases. However, all
of the 47 5-bedroom properties in the sample meet the standard. The majority (56%) of 1-bedroom
properties met the standard followed by 47% of 4-bedroom, 41% of 2-bedroom. The lowest
proportion meeting the standard was 27% of 3-bedroom properties.
0% 20% 40% 60% 80% 100%
Benwell And Scotswood
Byker
Castle
Dene
Denton
East Gosforth
Elswick
Fawdon
Fenham
Kenton
Lemington
Newburn
North Heaton
Ouseburn
Parklands
South Heaton
South Jesmond
Walker
Walkergate
West Gosforth
Westerhope
Westgate
Wingrove
Woolsington
Falls below
Meets
Opinion Research Services | Gateshead & Newcastle upon Tyne Strategic Housing Market Assessment 2017 August 2017
199
Figure 145: Proportion of dwellings which meet or fall below the NDSS by Number of Bedrooms (Source: Newcastle upon Tyne
City Council Planning Portal)
Figure 146: Number of dwellings which meet or fall below the NDSS by Number of Bedrooms (Source: Newcastle upon Tyne City
Council Planning Portal)
Property Size (number of bedrooms)
Meets NDSS Falls below
NDSS Total for
property size
One 89 71 160
Two 162 232 394
Three 157 426 583
Four 166 189 355
Five 47 0 47
Six 2 0 2
Seven 2 0 2
Eight N/A N/A 0
Nine 1 0 1
Total 626 918 1,544
7.25 The highest proportion of dwellings which meet the Standard is seen in single storey properties (55%)
compared to around 44% of 3-storey and 32% of 2-storey properties.
7.26 Included in the sample were 14 properties with either 4 or 5 storeys. These are not in the analysis as
properties with more than three storeys are not covered by the Standard.
0%
10%
20%
30%
40%
50%
60%
70%
80%
90%
100%
One Two Three Four Five Six Seven Eight Nine
Meets
Falls below

Opinion Research Services | Gateshead & Newcastle upon Tyne Strategic Housing Market Assessment 2017 August 2017
200
Figure 147: Proportion of properties which meet or fall below the NDSS by Number of Storeys (Source: Newcastle upon Tyne City
Council Planning Portal)
Figure 148: Number of properties which meet or fall below the NDSS by Number of Storeys (Source: Newcastle upon Tyne City
Council Planning Portal)
Property Size (number of storeys)
Meets NDSS Falls below
NDSS Total for
property size
One 188 153 341
Two 283 588 871
Three 141 177 318
Total 612 918 1,530
Level of deviation from the standards
7.27 So far we have considered the absolutes; whether dwellings on new developments meet, exceed, or
fall below the standards. Here the analysis turns to the level of deviation from the standards.
7.28 For this analysis, outliers were identified and removed. The criteria used was generous; any housing
type which exceeded or fell below the NDSS by more than 50% of the square metreage set as the
standard for that housing type, as defined by number of bedrooms and storeys, was considered an
outlier and removed. Outliers were not removed for the analysis of absolutes as it is assumed that
square metreage of 50% or more above the standard can be taken to mean the property exceeds the
standard and, similarly that square metreage of 50% or more below the standard can be taken to
mean the property falls below the standard, though it is not clear how far those properties deviate
from the NDSS. Data is also included for the sample before removing the outliers with a brief
discussion of the difference.
7.29 Once outliers are removed, the greatest differences from the standards are seen in the High viability
area, where, on average, properties fall below the standards by -13.50m2, followed by Mid viability
where, on average, properties fall below the NDSS by -5.11m2. The average for the Low viability areas
is also noticeably lower than the standards at -3.11m2.
0%
10%
20%
30%
40%
50%
60%
70%
80%
90%
100%
One Two Three
Meets
Falls below

Opinion Research Services | Gateshead & Newcastle upon Tyne Strategic Housing Market Assessment 2017 August 2017
201
7.30 It should be noted that the sample from the High viability areas included 13 cases, of which three were
recorded as being 261%, 154% and 59% above the standard and removed as outliers. The only other
case of such a high recorded deviation from the standard was of 191% in the High-Mid viability area.
No other outliers deviated from the NDSS by more than 80%, and typically they deviated by 50% to
65%. The sample for the High viability areas was considerably lower than for the other viability
classification areas, which each included samples of between 192 and 484 cases.
7.31 The Mid-High viability areas are the only viability areas where the average for individual properties
exceeds the standard; by +0.76m2.
7.32 Overall across Newcastle upon Tyne, the average newly developed property size fell below the NDSS
by -1.34m2.
7.33 Comparing the data with and without removing the outliers, it can be seen that the overall figure for
Newcastle upon Tyne is not affected significantly by the outliers: -1.34m2 with the outliers removed
compared to -1.35m2 including the outliers. The greatest difference is in the High viability areas where
the data including the outliers shows properties as being on average +30.69m2 above the NDSS
compared to -13.50m2 below once the outliers are removed. This difference is explained by the
magnitude of deviation in two of the outliers removed from the High viability sample and the size of
that sample. Other viability area classifications show smaller differences between the data sets.

Opinion Research Services | Gateshead & Newcastle upon Tyne Strategic Housing Market Assessment 2017 August 2017
202
Figure 149: Average variation from NDSS GIA Standard by Viability Area with outliers removed (Source: Newcastle upon Tyne
City Council Planning Portal)
Viability Area Average difference from Standards
(square metre)
Low -3.11
Low-Mid -0.54
Mid -5.11
High-Mid +0.76
High -13.50
High (Urban Core) -1.67
Average Difference from NDSS for Newcastle -1.34
Figure 150: Average variation from NDSS GIA Standard by Viability Area without outliers removed (Source: Newcastle upon Tyne
City Council Planning Portal)
Viability Area Average difference from Standards
(square metre)
Low -2.84
Low-Mid -0.54
Mid -5.05
High-Mid +1.77
High +30.69
High (Urban Core) -1.65
Average Difference from NDSS for Newcastle -1.35
7.34 The variation from the NDSS by number of bedrooms is shown below for the sample with the outliers
removed. The sample for 5+ bedroom properties is too small to be considered here.
7.35 The largest percentage differences from the standards are seen in 3-bedroom properties, which on
average fall below the standard by -5%. This compares to 2-bedroom properties meeting the standard
when compared by percentage difference (-0.03% below the NDSS on average), while 1-bedroom and
4-bedroom properties are coming in above the standard by 1.3% and 1.7% respectively.
7.36 It is the 2-bed and 3-bed mid-sized properties which tend to fall below the standards. Three bed
properties have the greatest average difference in square metreage, at -5.0m2. The difference for 3-
bed properties is broadly similar to that quoted by RIBA for areas outside London of “4m² smaller than
the new standard, which is the equivalent size of a bathroom”.
Figure 151: Average variation from NDSS GIA Standard by Number of Bedrooms with outliers removed (Source: Newcastle upon
Tyne City Council Planning Portal)
Number of bedrooms Average difference from Standards
(square metre)
Average percent difference from
Standards
1 bedroom 1.19 +1.3%
2 bedrooms -2.48 -0.03%
3 bedrooms -4.82 -5.0%
4 bedrooms 1.97 +1.7%

Opinion Research Services | Gateshead & Newcastle upon Tyne Strategic Housing Market Assessment 2017 August 2017
203
Summary
7.37 Overall across Newcastle upon Tyne, 41% of new properties meet the NDSS.
7.38 There appears to be little correlation between Viability Area status and delivery of properties which
meet the NDSS. The highest proportion of cases which meet or exceed the standard are in the high to
middle viability classifications: High, High-Mid and Low-Mid are all at 43% meeting the standard.
Lower proportions are seen in High viability (36%) and Mid viability (28%) areas.
7.39 The average square metre difference of individual properties, after outliers are removed, shows that
the High-Mid viability areas are alone in having properties meeting the standards on average (by
0.76m2).
7.40 Analysis by ward suggests that there is no clear geographic block of wards where the standard is
generally met or exceeded; the highest proportions are seen in wards across the City.
7.41 Among recent completions, 3-bedroom properties are notably less likely to meet the NDSS. In 3-
bedroom properties, 27% met the NDSS compared to at least 40% in each of the other sizes of
property by number of bedrooms. On average 3-bedroom properties deviate from the standard by -
4.82m2, or about 5% below the standard, compared to -0.03% on average in 2-bedroom properties,
with the other two property sizes meeting the standard on average.
Conclusions
7.42 The two studies support each other in some general conclusions:
» A third of house types assessed failed to meet the space standards (36% of house types
in the Gateshead study failed to meet the NDSS, the majority (64%) of 2, 3 and 4-
bedroom properties in the Newcastle upon Tyne analysis failed to meet the standard).
» There is some evidence that mid-sized house types, notably 3-bedrooms are more likely
to fail to meet space standards than 1 bedroom or larger house types (27% of 3-
bedroom properties failed to meet the standard in the Newcastle upon Tyne analysis
compared to 56% of 1-bedroom properties and 47% of 4-bedroom properties).
Opinion Research Services | Gateshead & Newcastle upon Tyne Strategic Housing Market Assessment 2017 August 2017
204
Published Space Standards
Figure 152: Minimum gross internal floor areas and storage (m2) Table and notes reproduced from Housing: optional technical
standards, March 2015
* Notes (added 19 May 2016):
1. Built-in storage areas are included within the overall GIAs and include an allowance of 0.5m2 for
fixed services or equipment such as a hot water cylinder, boiler or heat exchanger.
2. GIAs for one storey dwellings include enough space for one bathroom and one additional WC (or
shower room) in dwellings with 5 or more bedspaces. GIAs for two and three storey dwellings include
enough space for one bathroom and one additional WC (or shower room). Additional sanitary facilities
may be included without increasing the GIA provided that all aspects of the space standard have been
met.
3. Where a 1b1p has a shower room instead of a bathroom, the floor area may be reduced from 39m2
to 37m2, as shown bracketed.
4. Furnished layouts are not required to demonstrate compliance.
Opinion Research Services | Gateshead & Newcastle upon Tyne Strategic Housing Market Assessment 2017 August 2017
205
8. Housing Requirements Considering the policy response to identified housing need
8.1 The SHMA has established the Full Objectively Assessed Need for Housing in Gateshead to be 7,848
dwellings over the 15-year period 2015-30, with the equivalent figure for Newcastle upon Tyne being
16,924. These figures are consistent with the current Gateshead and Newcastle upon Tyne JCS 2010-
30 and therefore affirm that the Core Strategy and Urban Core Plan housing requirement continues to
meet identified housing needs and provides an appropriate basis for housing policy.
8.2 This is confirmed by Planning Practice Guidance for housing and economic land availability
assessments, which states that “housing requirement figures in up-to-date adopted Local Plans should
be used as the starting point for calculating the five year supply” (ID 2a-030). This point was further
emphasised in a letter from the Housing Minister to the Planning Inspectorate in December 2014:
“Many councils have now completed Strategic Housing Market Assessments either for their
own area or jointly with their neighbours. The publication of a locally agreed assessment
provides important new evidence and where appropriate will prompt councils to consider
revising their housing requirements in their Local Plans. We would expect councils to actively
consider this new evidence over time and, where over a reasonable period they do not,
Inspectors could justifiably question the approach to housing land supply.
“However, the outcome of a Strategic Housing Market Assessment is untested and should
not automatically be seen as a proxy for a final housing requirement in Local Plans. It does
not immediately or in itself invalidate housing numbers in existing Local Plans.
“Councils will need to consider Strategic Housing Market Assessment evidence carefully and
take adequate time to consider whether there are environmental and policy constraints,
such as Green Belt, which will impact on their overall final housing requirement. They also
need to consider whether there are opportunities to co-operate with neighbouring planning
authorities to meet needs across housing market areas. Only after these considerations are
complete will the council’s approach be tested at examination by an Inspector. Clearly each
council will need to work through this process to take account of particular local
circumstances in responding to Strategic Housing Market Assessments.”
8.3 The Local Plan period is 2010-2030. This SHMA considers the housing requirements from 2015 to
2030. In establishing the OAN, the SHMA has taken full account of all unmet need for housing that is
likely to exist as at 2015; therefore any under-delivery against current housing targets need not be
counted again equally, any over-delivery will have been taken into account and will have reduced the
OAN. However, whilst the OAN identified by the SHMA will be a key part of the evidence base, the
Local Plans will be the mechanism through which the SHMA evidence will be assessed against
environmental and policy constraints to identify a sustainable and deliverable plan requirement.
8.4 The Local Plan will also consider the spatial distribution of housing across the functional housing
market area.

Opinion Research Services | Gateshead & Newcastle upon Tyne Strategic Housing Market Assessment 2017 August 2017
206
Affordable Housing Need 8.5 The SHMA has identified a substantial need for additional affordable housing: a total of 3,235
dwellings across Gateshead and 5,936 dwellings across Newcastle upon Tyne over the 15-year period
2015-30. Given the level of affordable housing need identified, it will be important to maximise the
amount of affordable housing that can be delivered through market housing led developments. Key to
this is the economic viability of such developments, as this will inevitably determine (and limit) the
amount of affordable housing that individual schemes are able to deliver.
8.6 As part of their strategic planning and housing enabling functions, the Councils will need to consider
the most appropriate affordable housing target in order to optimise affordable housing provision
without compromising overall housing delivery. This target should provide certainty to market
housing developers about the level of affordable housing that will be required on schemes, and the
Council should ensure that this target is achieved wherever possible in order to increase the effective
rate of affordable housing delivery.
8.7 PPG identifies that the Council should also consider “an increase in the total housing figure” where this
could “help deliver the required number of affordable homes”; although this would not be an
adjustment to the OAN, but a policy response to be considered in the Local Plan:
The total affordable housing need should then be considered in the context of its likely delivery as a
proportion of mixed market and affordable housing developments, given the probable percentage of
affordable housing to be delivered by market housing led developments. An increase in the total
housing figures included in the local plan should be considered where it could help deliver the
required number of affordable homes.
Planning Practice Guidance (March 2014), ID 2a-029
8.8 It will therefore be important for the Council to consider the need for any further uplift once the
affordable housing target has been established. However, as confirmed by the Inspector examining
the Cornwall Local Plan in his preliminary findings82 (paragraphs 3.20-21):
“National guidance requires consideration of an uplift; it does not automatically require a
mechanistic increase in the overall housing requirement to achieve all affordable housing
needs based on the proportions required from market sites. The realism of achieving the
intended benefit of additional affordable housing from any such uplift is relevant at this
stage, otherwise any increase may not achieve its purpose.
Any uplift on the demographic starting point … would deliver some additional affordable
housing and can be taken into account in judging whether any further uplift is justified.”
8.9 Given that the identified OAN already incorporates an uplift from the baseline household projections in
response to take account of suppressed household formation, with no uplift required in response to market
signals, this will contribute to increasing the supply of affordable homes through market housing led
developments. The Councils will need to consider whether there is sufficient justification for any further
increase in the total housing figures included in their Local Plans (beyond the identified OAN) as part of
their policy response to meeting the identified need for affordable housing; although it will be important to
82 https://www.cornwall.gov.uk/media/12843214/ID05-Preliminary-Findings-June-2015-2-.pdf

Opinion Research Services | Gateshead & Newcastle upon Tyne Strategic Housing Market Assessment 2017 August 2017
207
consider the implications of providing a higher level of market housing than identified by the OAN, in
particular the consequences on the balance between jobs and workers.
8.10 The contribution towards affordable housing delivery that can be achieved through market housing led
developments shouldn’t be considered in isolation. The Government has launched a series of new
initiatives in the past 5 years to attempt to boost the supply of homes, including affordable homes. The key
Homes and Communities Agency (HCA) investment programmes include:
» Affordable Homes Programme: the flagship HCA investment programme(s) for new
affordable homes – the 2015-18 programme intends to support the building of 43,821
new affordable homes across 2,697 schemes in England
» Affordable Homes Guarantees Programme: guaranteeing up to £10bn of housing
providers’ debt in order to bring schemes forward
» Care and Support Specialised Housing Fund: funding used to accelerate the development
of the specialised housing market such as Older People and those with disabilities
» Community Right to Build: (Outside London) including some provision for affordable
homes
» Empty Homes programme
» Estate Regeneration Programme: often creating mixed tenure communities
» Get Britain Building: aiming to unlock locally-backed stalled sites holding planning
permission and including affordable homes
8.11 However, there are currently a number of constraints that are affecting the delivery of new affordable
housing; although there is also a range of other initiatives that may help increase delivery in future.
Constraints affecting the delivery of new affordable housing
Other initiatives potentially increasing the delivery of new affordable housing
Welfare reform
Most stakeholders (including private landlords, house builders, local authorities and RPs) are concerned at the impact of benefit reform and the risk to their revenue. Credit rating agency have also signalled concerns.
Registered Providers
Many RPs have become more risk averse in their approach to developing new homes. The move to Affordable Rent as opposed to Social Rent housing and the resultant reduction in grant rates has made delivery and viability issues more pronounced. Grant level reductions in the AHP 2015-18 have, arguably, increased risk perceptions further.
Stock rationalisation by Registered Providers
The new regulatory framework for RPs continues the emphasis on economic regulation. This could, potentially, reduce current supply of affordable housing. Already, sector trends indicate many associations are identifying under-performing stock with a view to rationalisation.
Extension of Right to Buy (RTB) to Registered Providers
The Government pledge to introduce an RTB for RP tenants mean many associations will need to assess the risk to their Business Plans and this might reduce appetite for new development.
Councils building more new homes
Many Councils are now trying to bring new rental schemes forward following reform of the HRA system.
New ‘for profit’ providers
Over 30 ‘for profit’ providers to deliver AHP homes have so far registered with the HCA, mainly in order to deliver non-grant affordable housing. There is arguably potential for increased supply of affordable homes for rent by ‘for profit’ providers.
Co-operative Housing
Given current delivery constraints, co-operative housing has been identified as a further alternative supply for households unable to access ownership or affordable housing. The Confederation of Co-operative Housing, working with RPs, is currently trying to bring schemes forward. The HCA has held back funding for Co-operative Housing in the previous AHP.

Opinion Research Services | Gateshead & Newcastle upon Tyne Strategic Housing Market Assessment 2017 August 2017
208
8.12 Recent Government pronouncements (including the Housing White Paper 2017) indicate a more
positive view of the role of the private rented sector. Whilst private rented housing (with or without
housing benefit) does not meet the definitions of affordable housing, it offers a flexible form of tenure
and meets a wide range of housing needs. The sector also has an important role to play given that
many tenants that rent from a private landlord can only afford their housing costs as they receive
housing benefit. If there isn’t sufficient private rented housing available at a price these households
can afford, the need for affordable housing would be even higher.
8.13 A Government task force was established in 2013 to encourage and support build-to-let investment83.
The HCA also has several investment programmes to help bring schemes forward. These include a £1
billion Build to Rent Fund, which will provide equity finance for purpose-built private rented housing,
alongside a £10 billion debt guarantee scheme to support the provision of these new homes. New
supply of private rented housing therefore seems likely from various sources, despite current volumes
being relatively low:
» Registered Providers are potential key players in the delivery of new PRS supply and
recently several have begun to enter the market in significant scale84, particularly in
response to the Build to Rent Fund, although other institutional funding is also being
sought. Overall, although interest is high, it remains unclear as to the scale of
development which may be delivered.
» Local Authorities can also enable new PRS supply to come forward by investing local
authority land, providing financial support (such as loan guarantees), and joint ventures
with housing associations, developers or private investors under the Localism Act. Whilst
LA initiatives may contribute to new build PRS, these will take time to deliver significant
numbers of units.
» Local Enterprise Partnerships are another potential source of new build PRS homes85.
The Growing Places Fund provides £500 million to enable the development of local funds
to promote economic growth and address infrastructure constraints in order to enable
the delivery of jobs and houses. Any funding for housing, however, has to compete with
other priorities e.g. skills and infrastructure. However, LEPs could potentially enable new
PRS housing delivery and some attempts have been made in this regard to increase
supply.
» Insurance companies and pension funds have been expanding into property lending in
recent years; especially schemes in London. Nearly a quarter of new UK commercial
property finance came from non-bank lenders in 2013.
8.14 National Government policy is also focused on improving the quality of both management and stock in
the private rented sector, and local councils also have a range of enforcement powers. This is
particularly important given the number of low income households that rent from a private landlord.
8.15 Given the substantial need for affordable housing identified for Gateshead and Newcastle upon Tyne,
the Councils will need to consider the most appropriate affordable housing target as part of their
83
https://www.gov.uk/government/publications/2010-to-2015-government-policy-rented-housing-sector/2010-to-2015-government-policy-rented-housing-sector#appendix-9-private-rented-sector 84
http://www.insidehousing.co.uk/business/development/transactions/lq-to-launch-prs-subsidiary/7009701.article 85
https://www.gov.uk/government/publications/growing-places-fund-prospectus

Opinion Research Services | Gateshead & Newcastle upon Tyne Strategic Housing Market Assessment 2017 August 2017
209
strategic planning and housing enabling functions. However, it will also be important for the Council
to consider all of the options available to help deliver more affordable homes in the area.
Older People in Residential Institutions (Use Class C2) 8.16 The identified OAN does not include the projected increase of institutional population, which
represented a growth of 1,007 persons over the 15-year Plan period 2015-30, with 414 in Gateshead
and 593 in Newcastle upon Tyne. This increase in institutional population is a consequence of the CLG
approach to establishing the household population, which assumes “that the share of the institutional
population stays at 2011 levels by age, sex and relationship status for the over 75s” on the basis that
“ageing population will lead to greater level of population aged over 75 in residential care homes”.
8.17 Whilst these additional 1,007 persons aged over 75 living in communal establishments are not counted
as part of the OAN, an allowance is made for the dwellings that would be vacated by many of these
people. Not all would vacate dwellings, as some will have a partner or other family remaining in the
home; but further analysis of the data (assuming no growth in the institutional population) shows that
housing need based on the household projections would be 859 dwellings higher if the additional
bedspaces were not provided, with 348 more dwelling in Gateshead and 511 more dwellings in
Newcastle upon Tyne – so it is important to take account of these needs.
8.18 When considering housing supply, PPG states the following in relation to housing for older people:
How should local planning authorities deal with housing for older people?
Older people have a wide range of different housing needs, ranging from suitable and appropriately
located market housing through to residential institutions (Use Class C2). Local planning authorities
should count housing provided for older people, including residential institutions in Use Class C2,
against their housing requirement. The approach taken, which may include site allocations, should
be clearly set out in the Local Plan.
Planning Practice Guidance (March 2014), ID 3-037
8.19 On this basis, given that housing provided for older people in Use Class C2 should be counted against
the housing requirement, it is important that this need is also factored in when establishing the
housing requirement. Furthermore, as older people are living longer, healthier lives, and the
Government’s reform of Health and Adult Social Care is underpinned by a principle of sustaining
people at home for as long as possible, it does not necessarily follow that all of the increase in
institutional population should be provided as additional bedspaces in residential institutions in Use
Class C2; specialist older person housing such as Extra Care may be more appropriate for the needs of
some of these older people.
8.20 Therefore, when establishing housing requirement, it is necessary to take account of those dwellings
that were assumed to be vacated by people moving into care. This would allow the supply of
bedspaces in residential institutions in Use Class C2 to be counted against the housing requirement;
providing that this was calculated on the basis of the number of dwellings likely to be vacated in the
housing market.
8.21 Based on the SHMA analysis, an increase of 1,007 persons in the institutional population living in care
would have released 859 dwellings over the 15-year Plan period 2015-30. Recent market analysis by

Opinion Research Services | Gateshead & Newcastle upon Tyne Strategic Housing Market Assessment 2017 August 2017
210
Knight Frank86suggests care home occupancy rates at around 88%, which would imply that 1,145
additional bedspaces would be needed to accommodate an increase of 1,007 persons. On this basis,
providing 1,145 care home bedspaces would release 859 dwellings in the housing market – a ratio of
1.33 bedspaces per dwelling.
8.22 Given this context, it may be appropriate to include the 859 dwellings assumed to be vacated by
people moving into care as part of the housing requirement in addition to the OAN. Bedspaces in care
homes would then be able to be counted towards the housing requirement, on the basis of 1 dwelling
being counted for every 1.33 bedspaces provided.
8.23 Alternatively, the Council may choose to establish a separate target for bedspaces in Use Class C2 and
monitor the associated supply of bedspaces provided. However, if this approach is preferred, it will be
necessary to consider the extent to which some older persons assumed to need residential care (and
therefore not counted as part of the OAN) may be diverted to Extra Care housing, and therefore
should be counted as part of the housing requirement.
Student Housing 8.24 PPG was updated in March 2015 to include specific reference to identifying the needs of students:
Local planning authorities should plan for sufficient student accommodation whether it consists of
communal halls of residence or self-contained dwellings, and whether or not it is on campus.
Student housing provided by private landlords is often a lower-cost form of housing. Encouraging
more dedicated student accommodation may provide low cost housing that takes pressure off the
private rented sector and increases the overall housing stock. Plan makers are encouraged to
consider options which would support both the needs of the student population as well as local
residents before imposing caps or restrictions on students living outside of university-provided
accommodation. Plan makers should engage with universities and other higher educational
establishments to better understand their student accommodation requirements.
Planning Practice Guidance 2014, paragraph 21
8.25 As noted in Chapter 3, the demographics projections assume that no further growth in student
numbers occurs from 2015 onwards. Any additional growth to student numbers which might occur
will need to be factored in to the housing requirements of the area.
8.26 The average household size for a student household in the 2011 Census in Gateshead and Newcastle
upon Tyne was around 3.1 students per household. The household projections assume that the
number of students living in communal establishments (including university halls of residence and
student housing provided by private sector providers) remains constant over the period 2015-39.
However, if more student bedspaces are to be provided then this will reduce the need for other forms
of housing.
8.27 In terms of the supply of student accommodation, Planning Practice Guidance for Housing and
Economic Land Availability Assessment Paragraph provides the following statement:
How should local planning authorities deal with student housing?
8686
] http://content.knightfrank.com/research/548/documents/en/2015-3267.pdf

Opinion Research Services | Gateshead & Newcastle upon Tyne Strategic Housing Market Assessment 2017 August 2017
211
All student accommodation, whether it consists of communal halls of residence or self-contained
dwellings, and whether or not it is on campus, can be included towards the housing requirement,
based on the amount of accommodation it releases in the housing market. Notwithstanding, local
authorities should take steps to avoid double-counting.
PPG Paragraph 38
8.28 Therefore planning authorities are required to assess the need for future student accommodation as
part of the Objectively Assessed Needs (OAN) in their area, and can then count any student
accommodation forthcoming as part of their land supply calculations.
8.29 The link between student needs and land supply was further clarified in a Judicial Review in 2015,
Exeter City Council v. Secretary of State for Communities and Local Government. In his decision, Justice
Hickinbottom stated that:
43. … Paragraph 3.38 does not allow – let alone require – all new student accommodation simply to be included towards the housing requirement, as Mr Whale suggests: rather, it allows an authority to reflect the release of accommodation units onto the general housing market as a result of new student accommodation (although, of course, in the unlikely event that the provision of student accommodation releases unit for unit to the general market, then the whole of the accommodation may effectively go to satisfy the requirement). That is clear from the words used; but also from the reference to communal student accommodation, which is not included in the housing requirement figure and (Mr Whale accepts) was in this case properly not included within the housing supply figure either…
44. Far from the Inspector’s approach to student accommodation and housing supply in this case being wrong in law, in my view it was eminently correct. She was correct not to accede to the Council’s submission that all student accommodation supplied should or could be set off against the housing requirement. She was correct not to be persuaded by the Developers’ contention that she could not under any circumstances take into account student accommodation. She was correct to look at the facts of this case and determine whether, on the evidence before her, there was any basis for taking any of the new student accommodation into account. Given the evidence that a substantial number of additional general market dwellings had been occupied by students, she was clearly entitled to find that there was not. She properly accepted (in paragraph 47) that, although there was currently no evidence to show that the provision of student accommodation has released housing into the general market in Exeter, the situation may in the future change if (e.g.) the delivery of student accommodation significantly exceeded the increase in student population.
8.30 Therefore, for a local planning authority to be able to count student accommodation as part of the
land supply calculation, they must assess the impact of students on their housing requirement, and,
also, demonstrate the impact of new student accommodation on the wider housing market. It is
clearly advantageous for students to live in purpose built accommodation, rather than in dwellings
which could be occupied by non-student families. However, for a local authority to be able to count
student accommodation as part of their land supply they must have assessed the needs of their
student population thoroughly. In the case of Gateshead and Newcastle upon Tyne student bedspaces
can be counted as part of the housing land supply on the basis of around 3.1-4. bedspaces equalling
one dwelling. Evidence from the SHMA 2013, examined in 2014 for the Cores Strategy supports the
ratio of 4 bedspaces equalling one dwelling. The need for student housing is dealt with as part of a
separate assessment rather than as part of the SHMA, so overcrowding in student households is not
considered here

Opinion Research Services | Gateshead & Newcastle upon Tyne Strategic Housing Market Assessment 2017 August 2017
212
Gypsies and Travellers 8.31 ORS carried out a separate Gypsy and Traveller Accommodation Needs Assessment (GTAA) on behalf
of Gateshead and Newcastle upon Tyne, which is reported separately. The relationship between the
figures from the GTAA and the OAN is explained here.
8.32 Planning Policy for Traveller Sites (PPTS) came into force in March 2012 and was updated in August
2015. This document sets out the Government’s policy for Gypsies and Travellers and represents the
only policy for a particular household group which is not directly covered by the NPPF. However, at
paragraph 1 PPTS notes that:
This document sets out the Government’s planning policy for traveller sites. It should be read in
conjunction with the National Planning Policy Framework.
Planning Policy for Traveller Sites, paragraph 1
8.33 An April 2015 High Court Judgement, ‘Wenman v SSCLG and Waverley Borough Council’, has clarified
the relationship between Gypsy and Traveller and Travelling Showpeople Needs Assessments and
OAN. At paragraphs 42 and 43, the Judgement notes:
“42. However, under the PPTS, there is specific provision for local planning authorities to
assess the need for gypsy pitches, and to provide sites to meet that need, which includes the
requirement to “identify, and update annually, a supply of specific deliverable sites sufficient
to provide five years’ worth of sites against their local set targets” (paragraph 9(a)). These
provisions have a direct parallel in paragraph 47 NPPF which requires local planning
authorities to use their evidence base to ensure that the policies in their Local Plan meet the
full objectively assessed needs for housing in their area, and requires, inter alia, that they
“identify and update annually a supply of specific deliverable sites sufficient to provide five
years’ worth of housing”.
“43. The rationale behind the specific requirement for a five year supply figure under
paragraph 9 PPTS must have been to ensure that attention was given to meeting the special
needs of travellers. Housing provision for this sub-group was not just to be subsumed within
the general housing supply figures for the area. Therefore it seems to me most unlikely that
the housing needs and supply figures for travellers assessed under the PPTS are to be
included in the housing needs and supply figures under paragraph 47 NPPF, as this would
amount to double counting.”
8.34 The position proposed by the Judgement is correct in that Gypsy and Traveller and Travelling
Showpeople households will form part of the household projections, concealed households and
market signals which underwrite the OAN calculation. The needs of these households are counted as
part of the overall OAN; therefore any needs identified as part of a Gypsy and Traveller and Travelling
Showpeople Needs Assessment are a component of, and not additional to, the OAN figure identified
by the SHMA.
8.35 We would also note that a change introduced by the Housing and Planning Act 2016 is the removal of
the 2 sections in the 2004 Housing Act that placed a statutory requirement on Councils to conduct a
specific assessment of need for Travellers. However PPTS still sets out that local planning authorities

Opinion Research Services | Gateshead & Newcastle upon Tyne Strategic Housing Market Assessment 2017 August 2017
213
should make their own assessment of need for the purposes of planning Traveller sites, but that this
only relates to households who meet the new planning definition of travelling.
8.36 The Housing and Planning Act also introduces a new duty (under Section 8 of the 1985 Housing Act
that covers the requirement for a periodical review of housing needs) for local authorities to consider
the needs of people residing in or resorting to their district with respect to the provision of sites on
which caravans can be stationed, or places on inland waterways where houseboats can be moored.
Draft Guidance related to this section of the Act has been published setting out how the government
want local housing authorities to undertake this assessment and it is essentially the same as the GTAA
assessment process - referring specifically for example to concealed or doubled-up households and
unauthorised encampments.
8.37 The implication of the policy changes is that the housing needs of any Gypsy and Traveller households
who do not meet the new ‘planning’ definition of a Traveller will form a subset of any wider need
arising from households residing in caravans. In practice there is no evidence of any need in Newcastle
upon Tyne, but there is evidence of a small need in Gateshead of at least 5 pitches from households
that do not meet the planning definition and up to an additional 2 from unknown households. This
represent an important need because Romany, Irish and Scottish Travellers can claim a right to be
provided with culturally appropriate housing (caravans) based on their protected ethnic status
contained in the Equalities Act 2010. It should also be noted that a separate 5 year land supply for this
group is not required and meeting the needs of this group is a housing, not a planning, function for a
local authority. There is no known demand for additional moorings as there are sufficient to meet
current needs.

Opinion Research Services | Gateshead & Newcastle upon Tyne Strategic Housing Market Assessment 2017 August 2017
214
Appendix 1: Stakeholder Engagement with the BME Community
Stakeholder Engagement with the BME Community 8.38 The BME and Minority Communities project was undertaken as part of the Councils’ SHMA.
Stakeholder engagement fieldwork was undertaken with a number of local community groups who
may, as part of their service, engage with clients from BME and minority communities; in addition to
this specific BME and religious organisations were contacted in both Gateshead and Newcastle. The
following organisations/communities were involved in the BME and minority communities Project
Fieldwork:
» The Angelou Centre
» Changing Lives Supported Accommodation - Newcastle upon Tyne
» West End Refugee Service
» North East Refugee Service
» YHN
» Newcastle upon Tyne College
» South Mountain Chinese Group
» West End Women and Girls
» Sure start Benwell
» Recovery Support Team
» Newcastle upon Tyne cab
» Families Matter, Sure Start Children’s Centre
» First Step
» Advocacy North
» Gateshead Visible Minority Ethnic Support Group
» Jewish Community
» Gateshead Muslim Society
» Advocacy centre north
8.39 The stakeholder fieldwork engagement was separated into the following strands:
Gateshead:
Opinion Research Services | Gateshead & Newcastle upon Tyne Strategic Housing Market Assessment 2017 August 2017
215
» Fieldwork telephone interviews with 4 stakeholders;
» In addition to this those interviewed for Newcastle upon Tyne were also asked about their
engagement in Gateshead;
» Two focus workshops with the Muslim Society were held on 11th April 2017 (Men’s Group)
and 27th April 2017 (Ladies Group).
Newcastle:
» Fieldwork telephone interviews with 14 stakeholders.
Stakeholder Fieldwork Consultation in Gateshead and Newcastle 8.40 PPG: Housing and economic development needs assessments revision says that local planning
authorities need to work with87:
Local communities, partner organisations, Local Enterprise Partnerships, businesses and
business representative organisations, universities and higher education establishments,
house builders (including those specialising in older people’s housing), parish and town
councils, designated neighbourhood forums preparing neighbourhood plans and housing
associations should be involved from the earliest stages of plan preparation, which includes
the preparation of the evidence base in relation to development needs.
PPG Paragraph 007 revision date: 20 03 2015
8.41 As a result, this project included engagement with stakeholders in both Gateshead and Newcastle
upon Tyne using telephone interviews to a structured Topic Guide. In addition to this two workshops
were undertaken with the Muslim Society in Gateshead. This fieldwork sought views on various
aspects of the current housing market and future housing needs of different BME and minority
communities, and these views informed the outputs of the study.
8.42 The views expressed in this Project Report represent a balanced summary of the responses given by
stakeholders. In some cases they reflect the views of the individual concerned, rather than the official
policy of their employer/organisation. In this Report, the abbreviation ‘RPs’ refers to Registered
Providers of affordable housing. In most cases the RPs are housing associations.
8.43 It is important to note that any qualitative interviews and focus groups provide individuals’ and
groups’ perceptions. The picture they give provides useful knowledge about attitudes and
preferences, both positive and negative. They can also provide important signals as to what is
happening on the ground in communities.
8.44 The main points relating directly to the SHMA have been extracted separately from the consultation
and are contained within the main body of the text.
Stakeholder Views - Current and future accommodation need
87
http://planningguidance.planningportal.gov.uk/blog/guidance/housing-and-economic-development-needs-assessments/the-approach-to-assessing-need/ - paragraph_007

Opinion Research Services | Gateshead & Newcastle upon Tyne Strategic Housing Market Assessment 2017 August 2017
216
Overview
8.45 It was generally believed by stakeholders that both Gateshead and Newcastle upon Tyne has changed
in terms of ethnic composition over the last 10-20 years. This is supported by the Census figures
below, indicating there has been increasing diversity in the main ethnic groups between 1991 and
2011. The broad groupings used here are designed to allow comparison across the three Censuses,
each of which has different definitions of ethnic groups.
8.46 In Gateshead whilst the percentage of the White population categorisation (including Irish and Other
White) has reduced from 99.4% in 1991 to 96.3% in 2011, the largest increase between 1991 and 2011
was from the Indian sub-continent. There has also been a comparatively large increase in each of the
other broad groups between 2001 and 2011.
8.47 Similarly in Newcastle upon Tyne the percentage of the White population has reduced from 99.7% in
1991 to 85.6% in 2011 with the largest increase between 1991 and 2011 also from the Indian sub-
continent.
8.48 These figures point to an increase in diversity, and the stakeholder interviews suggest this is due to
people coming to live in the areas from Eastern Europe, the Middle East and Africa, including a
perception of an increasing number of people from South America as an emerging trend.
Figure 153: Ethnic Group Profile of All Usual Residents in Gateshead and Newcastle upon Tyne (Source: Census 1991, 2001, 2011)
Gateshead Newcastle upon Tyne
1991 2001 2011 1991 2001 2011
White, Including Irish and Other White 99.4% 98.4% 96.3% 96.7% 93.1% 85.6%
Black & Multiple ethnic Black 0.1% 0.2% 0.8% 0.4% 0.8% 2.5%
Asian & Multiple ethnic Asian 0.4% 0.9% 1.7% 2.5% 4.8% 8.2%
Chinese 0.2% 0.2% 0.5% 0.5% 0.7% 2.2%
Other & Multiple ethnic other 0.2% 0.3% 0.7% 0.8% 0.7% 1.8%
8.49 The majority of the BME population own or part own their accommodation in Gateshead. Those
people who are Black/African are more likely to rent from the Council/RPs, Asian/Asian British are
more likely to rent privately/live rent free.
8.50 In Newcastle upon Tyne the majority of the BME population are more likely to rent privately/live rent
free than own or part own their homes; Asian/Asian British have greater numbers owning or part
owning their homes than other BME communities.
8.51 In Newcastle upon Tyne stakeholders highlighted that the West End is an area populated by
Bangladeshi and Pakistani communities and in recent years there had been an increase in the number
of Black/African and Arabic speaking communities; there is a large Muslim population in parts of
Elswick, Benwell and Fenham. There is said to be a larger Chinese Community in Newcastle upon Tyne
than in Gateshead. In Newcastle upon Tyne the district called Chinatown, located to the west of the
city centre (Grainger Town), is long established but is mainly commercial rather than residential. There
is a long-established Chinese population living elsewhere in the City, for example around Sandyford.
Wards such as Elswick and Byker, where there is now a significant community of Congolese and
Angolan heritage, are becoming increasingly diverse.

Opinion Research Services | Gateshead & Newcastle upon Tyne Strategic Housing Market Assessment 2017 August 2017
217
8.52 In Gateshead there is an established orthodox Jewish community numbering several thousand living in
the Saltwell ward and Bensham area of Lobley Hill and Bensham ward. Both wards have a large and
diverse BME population.
8.53 Stakeholders gave the following views with regard to specific communities, which would need
consideration alongside readily available evidence:
» Homelessness within the Jewish Community is very rare as there are strong community
networks that can provide support.
» In Gateshead the majority of Jewish people live in Lobley Hill and Bensham, Saltwell and
Bridges wards. It is said these areas are preferred because of the sense of community and the
proximity to cultural facilities such as specific schools and kosher shops. The Gateshead Kolel
founded in 1929 and the tertiary education makes Gateshead an attractive place to live for
the Jewish Community across Europe.
» The type of accommodation needed both now and in the future is likely to be for affordable
larger family housing of 4+ bedrooms, with outside space and parking. Finding such housing is
a challenge because there are few larger houses available in the preferred areas and at a price
that can be afforded.
» Currently, many in the Jewish Community aspire to owner occupation in wards where the
existing community are established. Orthodox Jewish communities need to live within a short
distance of a synagogue to enable them to obey the laws of the Sabbath, which prohibit
driving or riding in a car or any other vehicle from sundown on Friday until sundown on
Saturday.
Gateshead Jewish Community Housing Needs Survey
8.54 Prior to this SHMA, between December 2016 and January 2017 the Board of Adler Housing conducted
a housing needs survey of the Gateshead Jewish Community. Of 535 Questionnaires issued, 110 full or
partially completed forms were returned.
8.55 The key findings of the survey are:
» The average household size from survey respondents was 5.9 persons per household, which is
far higher than the average household size across Gateshead as a whole.
» The majority of respondents presently reside in terraced homes (60%) or flats (23.6%).
» A large proportion of respondents are owner occupiers (54.5%) or in private rental (37.3%)
but very few reside in Council (1.8%) or Housing Association (3.6%) homes.
» Nearly 40% of respondents consider their home to not be suitable for their household’s needs
and nearly 20% of respondents consider the condition of their present home to be
inadequate.
» Over 37% of Respondents are expecting to move home within Gateshead within 5 years –
most of who state this is in order to achieve more space.
» Over 50% of respondents envisage needing more rooms in the next 5-10 years. Less than 12%
expect to downsize within that period.
» A majority of respondents (70%) aspire to Owner Occupation.
Opinion Research Services | Gateshead & Newcastle upon Tyne Strategic Housing Market Assessment 2017 August 2017
218
» 36% of respondents state they have made efforts in the last 12 months to purchase a home to
suit their needs. The predominant challenges facing home seekers is ‘difficulty in finding a
suitable property’.
» Responses also reflect a smaller but growing future need for more accessible housing or
appropriate adaptations to support mobility.
8.56 Therefore, in summary the survey found that the Jewish community in Gateshead typically lives in
large households which are concentrated in a small area of the borough. Many are either currently
overcrowded or anticipate being so in the future, but there is a shortage of suitable properties for
them to purchase.
The Chinese Community
8.57 Stakeholders said there is a larger Chinese Community in Newcastle upon Tyne than in Gateshead. In
Newcastle upon Tyne there is a district locally termed “Chinatown” located to the west of the city
(Grainger Town). Stakeholders said that the Chinese community is more likely to live across
geographically dispersed areas of Newcastle upon Tyne but may well prefer to live in the Chinatown
area and around Sandyford. In Gateshead no preferred residential areas were mentioned.
8.58 In summary:
Stakeholders Views were that there is less likelihood of the Chinese Community choosing
Private Rented Sector (PRS) as this is less affordable than social housing without opportunities
to buy.
The Muslim Community
8.59 Two workshops/focus groups were held with the Muslim Society: (Men’s Group) on 11th April 2017
and (Ladies Group) on 27th April 2017. A total of 12 attended the workshops and a further 11
completed the Household Formation form.
8.60 The points below are an analysis of the forms completed, the views expressed in the workshops and
also issues raised by other stakeholders undertaking telephone interviews.
8.61 The majority of Muslim’s in the 2011 Census Gateshead lived in the Saltwell and Bridges wards. The
aspiration is to live in Bensham because the Muslim Community are more likely to live in areas where
there are cultural facilities e.g. mosques and halal shops.
8.62 In summary:
Stakeholders Views were that the future housing needs for the Muslim Community
are for 4+ bedroom houses with gardens and parking on secure estates.
Asylum Seekers and Refugees
8.63 Newcastle upon Tyne is recognised as a “City of Sanctuary”. Asylum seekers are usually housed under
arrangements funded by the Home Office and who operate a number of regional contracts. The
contract for the North East of England is currently with G4S who have subcontracted the work to a
private housing provider called Jomast.
8.64 Between October 2015 and June 2016, 2,646 people were resettled under the Syrian Vulnerable
Persons Resettlement Scheme (VPRS) in 188 local authorities. Local authorities resettling the highest
Opinion Research Services | Gateshead & Newcastle upon Tyne Strategic Housing Market Assessment 2017 August 2017
219
numbers were Coventry (125), Gateshead (107) and Edinburgh (83); Newcastle upon Tyne resettled 72
(Home Office Data). Gateshead has committed to receive 110 Syrian refugees per year from 2015/16
to 2019/20, under the Syrian Refugee Resettlement Programme.
Accessibility of Housing Options
8.65 Some stakeholders expressed a view that there are barriers to accessing housing and housing support
for BME and minority communities. Barriers are said to include language constraints;; access to IT;
lack of education of applicant; lack of housing and/or credit history; having a poor housing history with
the councils such as rent arrears; the need for a deposit and one month’s rent to access the PRS; and
Universal Credit. It is not clear whether ‘lack of education’ refers to general education, specifically lack
of literacy in English, or knowledge about the housing system.
Partnerships and Networking
8.66 The following partnerships and forums where housing issues relating to BME and minority
communities can be discussed in Gateshead and Newcastle upon Tyne were listed:
» The Diversity Forum
» Newcastle upon Tyne CVS
» The Benefits, Employment, Action Team (BEAT)
» North East Refugee Forum
» HealthWorks Newcastle upon Tyne (Parents-voice)
» Bensham Community Group
» Gateshead Strategic Partnership Steering Group
» Newcastle upon Tyne Gateshead Clinical Commissioning Group
» Gateshead Carers
» North East Equality Partnership
» Syrian Resettlement Programme
Conclusion
8.67 The BME surveys indicated a number of potential priorities for the Councils to consider alongside of
available local evidence. Of relevance to the SHMA report of housing need there was a perception that
there is a lack of new build larger affordable houses (4+bedrooms) in both Gateshead and Newcastle.

Opinion Research Services | Gateshead & Newcastle upon Tyne Strategic Housing Market Assessment 2017 August 2017
220
Table of Figures
Figure 1: Gateshead and Newcastle upon Tyne Joint Core Strategy ...................................................................................................7
Figure 2: Gatesheand and Newcastle upon Tyne Existing Housing Targets (Source: Gatershead and Newcastle upon
Tyne Joint Core Strategy) ......................................................................................................................................................8
Figure 3: Process for establishing a Housing Number for the HMA (Source: ORS based on NPPF and PPG) .......................................9
Figure 4: Household Projections for Gatesheand and Newcastle upon Tyne ....................................................................................10
Figure 5: Population Projections for Gatesheand and Newcastle upon Tyne 2015-30 by 5-year age cohort based SHMA
population projections ........................................................................................................................................................12
Figure 6: Meeting the need for M4(2) accessible and M4(3) wheelchair housing ............................................................................13
Figure 7: Full Objectively Assessed Need for Housing for Gateshead and Newcastle upon Tyne 2015-30 .......................................16
Figure 8: Compliance with the 2015 Nationally Described Space Standards (NDSS) for Gross Internal Area (GIA) ..........................18
Figure 9: NHPAU Study – PAS OAN technical advice note ‘Starting Point’ (Source: NHPAU/CURDS 2010) .......................................25
Figure 10: ONS Travel To Work Areas (Source: ONS 2015) ..................................................................................................................26
Figure 11: House Prices 2016-17 (Source: Land Registry) ....................................................................................................................27
Figure 12: VOA Broad Rental Market Area Boundaries .......................................................................................................................28
Figure 13: Previous Area of Residence (12 months prior to Census) by Current Area of Residence (Source: 2011 Census
of Population) .....................................................................................................................................................................33
Figure 14: Workplace Location by Area of Residence (Source: 2011 Census of Population) ...............................................................34
Figure 15: Migration and Workplace Location by Area of Residence for the combined area (Source: 2011 Census of
Population) .........................................................................................................................................................................34
Figure 16: Map of the HMA Area .........................................................................................................................................................35
Figure 17: Process for establishing a Housing Number for the HMA (Source: ORS based on NPPF and PPG) .....................................38
Figure 18: Gatesheand and Newcastle upon Tyne Existing Housing Targets (Source: gatershead and Newcastle upon
Tyne Joint Core Strategy) ....................................................................................................................................................39
Figure 19: CLG Household Projections for Gateshead and Newcastle upon Tyne: annual average growth (Source: CLG
Household Projections) .......................................................................................................................................................40
Figure 20: ONS Mid-Year Estimates and Sub-National Population Projections for Gateshead (Source: ONS) ....................................41
Figure 21: ONS Mid-Year Estimates and Sub-National Population Projections for Newcastle upon Tyne (Source: ONS) ...................42
Figure 22: Official population estimates for Gateshead for the period 1981-2015 (Source: UK Census of Population
1981, 1991, 2001 and 2011; ONS Mid-Year Estimates, including data since superseded) .................................................45
Figure 23: Components of population change (Source: ONS Mid-Year Population Estimates, revised) .............................................46
Figure 24: Components of population change, revised in the light of the 2011 Census (Source: ONS Mid-Year
Population Estimates, revised. Note: “Other Changes” includes adjustments for prisoners and armed forces.
Figures for 2001-02 onward presented unrounded for transparency, but should only be treated as accurate
to the nearest 100. Figures for earlier years rounded to the nearest 100) ........................................................................47
Figure 25: Components of population change without the inclusion of UPC (Source: ONS Mid-Year Population
Estimates, revised) ..............................................................................................................................................................48
Figure 26: Correlation between change in patient register and change in mid-year population estimates (Source: ONS
Mid-Year Population Estimates Quality Assurance Pack) ...................................................................................................49
Figure 27: Official population estimates for the period 1981-2015 (Source: UK Census of Population 1981, 1991, 2001
and 2011; ONS Mid-Year Estimates, including data since superseded) ..............................................................................50
Figure 28: Components of population change (Source: ONS Mid-Year Population Estimates, revised) .............................................51

Opinion Research Services | Gateshead & Newcastle upon Tyne Strategic Housing Market Assessment 2017 August 2017
221
Figure 29: Components of population change, revised in the light of the 2011 Census (Source: ONS Mid-Year
Population Estimates, revised. Note: “Other Changes” includes adjustments for prisoners and armed forces.
Figures for 2001-02 onward presented unrounded for transparency, but should only be treated as accurate
to the nearest 100. Figures for earlier years rounded to the nearest 100) ........................................................................52
Figure 30: Components of population change without the inclusion of UPC (Source: ONS Mid-Year Population
Estimates, revised) ..............................................................................................................................................................53
Figure 31: Correlation between change in patient register and change in mid-year population estimates (Source: ONS
Mid-Year Population Estimates Quality Assurance Pack) ...................................................................................................54
Figure 32: Student Growth in Newcastle upon Tyne (Source: Council Records) .................................................................................55
Figure 33: Summary of Effects of Adjustments on Population Projections for Gateshead and Newcastle upon Tyne for
2015-30 ...............................................................................................................................................................................56
Figure 34: Gateshead population projection based on 10 year migration trends and other adjustments ...........................................57
Figure 35: Gateshead population projections 2015-30 by gender and 5-year age cohort based on 2014-based SNPP and
SHMA projection with 10-year migration trend and other adjustments (Note: All figures presented
unrounded for transparency) .............................................................................................................................................57
Figure 36: Newcastle upon Tyne population projection based on 10 year migration trends ..............................................................58
Figure 37: Newcastle upon Tyne population projections 2015-30 by gender and 5-year age cohort based on 2014-
based SNPP and SHMA projection with 10-year migration trend (Note: All figures presented unrounded for
transparency) ......................................................................................................................................................................59
Figure 38: Economic Activity Rate long-term UK trends (Source: Labour Market Statistics based on Labour Force
Survey) ................................................................................................................................................................................60
Figure 39: Membership of private sector defined benefit and defined contribution schemes (Source: NAO) ...................................62
Figure 40: Employment rates for 60-74 years olds (Source: ONS, OBR. Note: Prior to 1983, the Labour Force Survey
does not contain an annual series for these indicators, so only available years are shown. The OBR medium-
term forecast to 2018 is produced top-down, not bottom-up, so the dotted lines for that period are a simple
linear interpolation) ............................................................................................................................................................63
Figure 41: Female participation rates by Cohort (Source: ONS, OBR) .................................................................................................64
Figure 42: Economic activity rates in 2015 and 2030 by age and gender based on OBR Labour Market Participation
Projections ..........................................................................................................................................................................65
Figure 43: Projected economically active population 2015-30 (Note: All figures presented unrounded for transparency) ...............66
Figure 44: Economic activity rates in 2015 and 2030 by age and gender based on OBR Labour Market Participation
Projections ..........................................................................................................................................................................66
Figure 45: Projected economically active population 2015-30 (Note: All figures presented unrounded for transparency) ...............67
Figure 46: Gateshead population projections 2015-30 by gender and 5-year age cohort (Note: Communal
Establishment population held constant for population aged under 75 (light blue cells), and held
proportionately constant for each relationship status for population aged 75 or over (orange cells); Totals
may not sum due to rounding) ...........................................................................................................................................68
Figure 47: Newcastle upon Tyne population projections 2015-30 by gender and 5-year age cohort (Note: Communal
Establishment population held constant for population aged under 75 (light blue cells), and held
proportionately constant for each relationship status for population aged 75 or over (orange cells); Totals
may not sum due to rounding) ...........................................................................................................................................69
Figure 48: Projected households and dwellings over the 15-year period 2015-30 for Gateshead ......................................................71
Figure 49: Projected households and dwellings over the 15-year period 2015-30 for Newcastle upon Tyne.....................................71
Figure 50: Households accepted as homeless and in priority need (Source: CLG P1E returns March 2005 and March
2015) ...................................................................................................................................................................................80
Figure 51: Concealed families by age of family representative (Source: Census 2001 and 2011) .......................................................81
Figure 52: Shared Dwellings and Sharing Households (Source: Census 2001 and 2011) .....................................................................81
Figure 53: Multi-adult Households (Source: Census 2001 and 2011) ..................................................................................................82

Opinion Research Services | Gateshead & Newcastle upon Tyne Strategic Housing Market Assessment 2017 August 2017
222
Figure 54: Proportion of overcrowded households 2011 and change 2001-11 by tenure (Note: Overcrowded
households are considered to have an occupancy rating of -1 or less. Source: UK Census of Population 2001
and 2011) ............................................................................................................................................................................84
Figure 55: Trend in overcrowding rates by tenure, England (Note: Based on three-year moving average, up to and
including the labelled date. Source: Survey of English Housing 1995-96 to 2007-08; English Housing Survey
2008-09 onwards) ...............................................................................................................................................................85
Figure 56: Estimate of the number of overcrowded households in Gateshead by tenure based on the bedroom
standard (Source: EHS; UK Census of Population 2011) .....................................................................................................86
Figure 57: Estimate of the number of overcrowded households in Newcastle upon Tyne by tenure based on the
bedroom standard (Source: EHS; UK Census of Population 2011) .....................................................................................87
Figure 58: Trend in non-decent homes by tenure, England (Source: English House Condition Survey 2006 to 2007;
English Housing Survey 2008 onwards) ..............................................................................................................................88
Figure 59: Number of households on the local authority housing register 2001-16 (Note: Solid line shows total number
of households; dotted line shows number of households in a reasonable preference category. Source: LAHS
and HSSA returns to CLG) ...................................................................................................................................................89
Figure 60: Number of households on the local authority housing register at 1st
April (Source: LAHS returns to CLG) .......................89
Figure 61: Number of households on the local authority housing register at 1st April (Source: LAHS returns to CLG) ......................90
Figure 62: Number of claimants in receipt of housing benefit in Gateshead by tenure (Source: DWP. Note: No
breakdown by tenure is available for the period 2001-07 and data for 2007-08 was not published) ................................92
Figure 63: Number of claimants in receipt of housing benefit in Newcastle upon Tyne by tenure (Source: DWP. Note:
No breakdown by tenure is available for the period 2001-07 and data for 2007-08 was not published) ..........................93
Figure 64: Assessing current unmet gross need for affordable housing for Gateshead (Source: ORS Housing Model;
Note: totals may not sum due to rounding) .......................................................................................................................96
Figure 65: Assessing current unmet gross need for affordable housing for Newcastle upon Tyne (Source: ORS Housing
Model; Note: totals may not sum due to rounding) ...........................................................................................................97
Figure 66: Assessing affordability by household type and age (Source: ORS Housing Model based on Census 2011 and
DWP) ...................................................................................................................................................................................99
Figure 67: Components of average annual household growth by 5-year projection period in Gateshead and Newcastle
upon Tyne combined (Source: ORS Housing Model) ........................................................................................................100
Figure 68: Annual change in household numbers in each age cohort by age of HRP in Gateshead and Newcastle upon
Tyne combined (Source: ORS Housing Model) .................................................................................................................101
Figure 69: Affordability of new households over the initial 5-year period 2015-20 in Gateshead and Newcastle upon
Tyne combined (Source: ORS Housing Model) .................................................................................................................101
Figure 70: Components of average annual household growth 2015-20 in Gateshead and Newcastle upon Tyne
combined (Source: ORS Housing Model) ..........................................................................................................................102
Figure 71: Components of average annual household growth 2015-20 in Gateshead and Newcastle upon Tyne
combined (Source: ORS Housing Model) ..........................................................................................................................104
Figure 72: Assessing total need for market and affordable housing for Gateshead (Source: ORS Housing Model) ..........................105
Figure 73: Assessing total need for market and affordable housing for Newcastle upon Tyne (Source: ORS Housing
Model) ..............................................................................................................................................................................105
Figure 74: Theoretical impact of reducing or increasing Housing Benefit support for households living in private rented
housing: Balance between households able to afford market housing and households needing affordable
housing 2016-34 and associated number of affordable dwellings ...................................................................................107
Figure 75: Process for establishing a Housing Number for the HMA (Source: ORS based on NPPF and PPG) ...................................109
Figure 76: Number of jobs for Gateshead and Newcastle upon Tyne for 2005-2016 (Source: APS Workplace Jobs) .......................116
Figure 77: Annual house price rates of change, UK all dwellings 2004-2016 (Source: Regulated Mortgage Survey. Note:
Not seasonally adjusted) ...................................................................................................................................................118
Figure 78: UK and London House Price Index 2008-2016 (Source: ONS) ...........................................................................................118

Opinion Research Services | Gateshead & Newcastle upon Tyne Strategic Housing Market Assessment 2017 August 2017
223
Figure 79: House Price Trends: Lower Quartile Prices (Source: ONS. Note: HMA figures derived using population
weighted average of Local Authority data) .......................................................................................................................120
Figure 80: Real House Price Trends: Lower Quartile Prices adjusted to 2015 values using CPI (Source: ONS; Bank of
England. Note: HMA figures derived using population weighted average of Local Authority data) .................................120
Figure 81: Real House Price Trends relative to England: Lower Quartile Prices adjusted to 2015 values using CPI
(Source: ONS; Bank of England. Note: HMA figures derived using population weighted average of Local
Authority data)..................................................................................................................................................................121
Figure 82: Ratio of Lower Quartile House Price to Lower Quartile Earnings (Source: DCLG. Note: Ratios prior to 2013
are calculated using a different source of house price data, HMA figures derived using population weighted
average of Local Authority data) .......................................................................................................................................122
Figure 83: UK household tenure projections to 2032 (Source: DCLG/IMLA) .....................................................................................123
Figure 84: Household Tenure by Area (Source: UK Census of Population 2001 and 2011. Note: Private Rent includes
tied housing and living rent free) ......................................................................................................................................124
Figure 85: Median Monthly Rent Values (Source: Valuation Office Agency 2013-2016, Note: HMA figures derived using
population weighted average of Local Authority data) ....................................................................................................125
Figure 86: Annual Housing Completions for Gateshead (Source: Gateshead BC AMR Data; CLG Live Tables; Census 2001
and 2011) ..........................................................................................................................................................................126
Figure 87: Annual Housing Completions for Newcastle upon Tyne (Source: Newcastle upon Tyne AMR Data; CLG Live
Tables; Census 2001 and 2011).........................................................................................................................................126
Figure 88: Summary of Market Signals: Indicators Relating to Price (Note: Affordability Ratios prior to 2013 are
calculated using a different source of house price data, HMA figures derived using population weighted
average of Local Authority data) .......................................................................................................................................128
Figure 89: Full Objectively Assessed Need for Housing for Gateshead and Newcastle upon Tyne 2015-30 .....................................132
Figure 90: Gateshead population projections 2015-30 by 5-year age cohort based SHMA population projections .........................135
Figure 91: Newcastle upon Tyne population projections 2015-30 by 5-year age cohort based SHMA population
projections ........................................................................................................................................................................136
Figure 92: Total projected households for 2015 and 2030 and summary of 15-year change by age of household
representative for Gateshead (Note: Figures may not sum due to rounding) ..................................................................137
Figure 93: Total projected households for 2015 and 2030 and summary of 15-year change by age of household
representative for Newcastle upon Tyne (Note: Figures may not sum due to rounding) ................................................137
Figure 94: Total projected households for 2015 and 2030 and summary of 15-year change by household type and age
of household representative for Gateshead (Note: Figures may not sum due to rounding) ............................................138
Figure 95: Total projected households for 2015 and 2030 and summary of 15-year change by household type and age
of household representative for Newcastle upon Tyne (Note: Figures may not sum due to rounding) ..........................139
Figure 96: Housing mix of OAN for market and affordable housing in Gateshead (Source: ORS Housing Model. Note:
Figures may not sum exactly due to arithmetic rounding) ...............................................................................................140
Figure 97: Housing mix of OAN for market and affordable housing in Newcastle upon Tyne (Source: ORS Housing
Model. Note: Figures may not sum exactly due to arithmetic rounding) .........................................................................140
Figure 98: Weekly rent thresholds in Gateshead (Source: Valuation Office Agency 2014/15; Homes and Communities
Agency 2017) ....................................................................................................................................................................141
Figure 99: Weekly rent thresholds in Newcastle upon Tyne (Source: Valuation Office Agency; Homes and Communities
Agency) .............................................................................................................................................................................141
Figure 100: Affordability of households needing affordable housing by property size in Gateshead (Note: Weekly costs
based on data in Figure 98) ..............................................................................................................................................143
Figure 101: Affordability of households needing affordable housing by property size in Newcastle upon Tyne (Note:
Weekly costs based on data in Figure 98) – ......................................................................................................................143
Figure 102: Affordable housing mix by household affordability (Source: ORS Housing Model. Note: Figures may not sum
due to rounding) ...............................................................................................................................................................145

Opinion Research Services | Gateshead & Newcastle upon Tyne Strategic Housing Market Assessment 2017 August 2017
224
Figure 103: Shared ownership costs (Note: Mortgage costs based on a 25-year repayment mortgage at 6.0% interest.
Rent based on 2.75% of the retained equity annually. Service charge assumed to be £10 per week) .............................146
Figure 104: Total weekly costs for shared ownership based on different equity shares (Note: Mortgage costs based on a
25-year repayment mortgage at 6.0% interest. Rent based on 2.75% of the retained equity annually. Service
charge assumed to be £10 per week. Cells highlighted in brown are above the LHA rate but below median
private rent, cells in red are above the equivalent median private rent. No cells are lower than the
equivalent maximum LHA) ................................................................................................................................................147
Figure 105: Starter Home Initiative (Note: Mortgage costs based on a 25-year repayment mortgage at 6.0% interest) ...................147
Figure 106: Comparison of weekly housing costs by property size for Gateshead ..............................................................................148
Figure 107: Comparison of weekly housing costs by property size for Newcastle upon Tyne ............................................................148
Figure 108: Summary of legislative changes affecting private tenants’ LHA (Source: HM Treasury, DWP) ........................................149
Figure 109: Number of Households by Tenure 1981-2011 (Source: UK Census of Population) ..........................................................151
Figure 110: Percentage of Households by Tenure 1981-2011 (Source: UK Census of Population) .....................................................151
Figure 111: Households by Tenure 1981-2011 (Source: UK Census of Population).............................................................................151
Figure 112: Mix of household types living in the private rented sector (Source: ORS Housing Model and Council Tax
Base) .................................................................................................................................................................................152
Figure 113: Number of Households by Tenure 1981-2011 (Source: UK Census of Population) ..........................................................153
Figure 114: Percentage of Households by Tenure 1981-2011 (Source: UK Census of Population) .....................................................153
Figure 115: Households by Tenure 1981-2011 (Source: UK Census of Population).............................................................................153
Figure 116: Mix of household types living in the private rented sector (Source: ORS Housing Model and Council Tax
Base) .................................................................................................................................................................................154
Figure 117: Ethnic Group Classification (Source: UK Census of Population 2011) ...............................................................................154
Figure 118: Ethnic Group Profile of All Usual Residents in Gateshead and Newcastle upon Tyne (Source: Census 2011)..................155
Figure 119: Ethnic Group Profile of Household Reference Persons in Gateshead and Newcastle upon Tyne (Source:
Census 2011) .....................................................................................................................................................................156
Figure 120: Gateshead and Newcastle upon Tyne residents employed in the Armed Forces (Source: 2011 Census) ........................158
Figure 121: Group and Individual Registrations currently looking for land in and around Gateshead and Newcastle upon
Tyne on the ‘Need-a-Plot’ Portal (Source: NCaSBA, February 2017 and Google Maps) ...................................................160
Figure 122: Benchmark Figures for Specialist Older Person Housing ..................................................................................................162
Figure 123: Additional Modelled Demand for Older Person Housing 2015-30 (Source: Housing LIN Toolkit) ....................................163
Figure 124: Specialist Housing Provision for Older People (Source: EAC 2015. Figures may not sum due to rounding) .....................164
Figure 125: Gateshead and and Newcastle upon Tyne Spending on DFGs in owned and rented private, and housing
association properties properties (Source: Gateshead and Newcastle upon Tyne Councils) ...........................................166
Figure 126: Newcastle upon Tyne Spending on DFGs by type for owner occupied, private rented and registered
providers (Source: Newcastle upon Tyne City Council) ...................................................................................................167
Figure 127: Gateshead Spending on major adaptations in Council owned properties (Source: Gateshead Council) .........................168
Figure 128: Public Health England health profiles indicators 2017 (Source: PHI) ................................................................................170
Figure 129: On Housing Register with a recognised need to move on welfare grounds or disability (Source: Gateshead
and Newcastle upon Tyne City Councils) ..........................................................................................................................171
Figure 130: Total Number of lettings recorded on CORE for 2014-2015 (Source: CORE) ....................................................................172
Figure 131: Number of lettings recorded on CORE for 2014-2015 (Source: CORE) .............................................................................173
Figure 132: Gateshead and and Newcastle upon Tyne; resident population with LTLI ‘Day-to-day activities limited a lot’
by tenure (Source: Census 2011) ......................................................................................................................................175
Figure 133: Percentage of households with a wheelchair user by type of housing and age of household representative
(Source: English Housing Survey 2013-14) ........................................................................................................................176

Opinion Research Services | Gateshead & Newcastle upon Tyne Strategic Housing Market Assessment 2017 August 2017
225
Figure 134: Households needing Wheelchair Adapted Housing (Source: ORS Housing Model. Note: Figures may not sum
due to arithmetic rounding)..............................................................................................................................................177
Figure 135: Level of work required to create full visitability (Source: EHS 2014-15 Annex Figure 2.3) ...............................................179
Figure 136: Gateshead; Stock age profile, excluding private Registered Social Housing providers (Source: Gateshead
Council, CLG) .....................................................................................................................................................................181
Figure 137: Newcastle upon Tyne; Stock age profile, private, non-social stock (Source: Newcastle upon Tyne City
Council, CLG) .....................................................................................................................................................................181
Figure 138: Newcastle upon Tyne City; Stock age profile, excluding private Registered Social Housing providers (Source:
Newcastle upon Tyne Council, CLG) .................................................................................................................................182
Figure 139: Estimates of Vulnerable and Older People Needs in Gateshead 2011-21 (Source: Homes and Communities
Agency Vulnerable and Older People Needs Estimation Toolkit) .....................................................................................190
Figure 140: Estimates of Vulnerable and Older People Needs in Newcastle upon Tyne 2011-21 (Source: Homes and
Communities Agency Vulnerable and Older People Needs Estimation Toolkit) ...............................................................191
Figure 141: Number of Dwellings which meet or fall below the NDSS by Viability Area Classification (Source: Newcastle
upon Tyne City Council Planning Portal) ...........................................................................................................................195
Figure 142: Proportion of dwellings which meet or fall below NDSS by Viability Area (Source: Newcastle upon Tyne City
Council Planning Portal) ....................................................................................................................................................196
Figure 143: Number of dwellings which meet or fall below the NDSS by Wards (Source: Newcastle upon Tyne City
Council Planning Portal) ....................................................................................................................................................197
Figure 144: Proportion of dwellings which meet or fall below the NDSS by Wards (Source: Newcastle upon Tyne City
Council Planning Portal) ....................................................................................................................................................198
Figure 145: Proportion of dwellings which meet or fall below the NDSS by Number of Bedrooms (Source: Newcastle
upon Tyne City Council Planning Portal) ...........................................................................................................................199
Figure 146: Number of dwellings which meet or fall below the NDSS by Number of Bedrooms (Source: Newcastle upon
Tyne City Council Planning Portal) ....................................................................................................................................199
Figure 147: Proportion of properties which meet or fall below the NDSS by Number of Storeys (Source: Newcastle upon
Tyne City Council Planning Portal) ....................................................................................................................................200
Figure 148: Number of properties which meet or fall below the NDSS by Number of Storeys (Source: Newcastle upon
Tyne City Council Planning Portal) ....................................................................................................................................200
Figure 149: Average variation from NDSS GIA Standard by Viability Area with outliers removed (Source: Newcastle upon
Tyne City Council Planning Portal) ....................................................................................................................................202
Figure 150: Average variation from NDSS GIA Standard by Viability Area without outliers removed (Source: Newcastle
upon Tyne City Council Planning Portal) ...........................................................................................................................202
Figure 151: Average variation from NDSS GIA Standard by Number of Bedrooms with outliers removed (Source:
Newcastle upon Tyne City Council Planning Portal) .........................................................................................................202
Figure 152: Minimum gross internal floor areas and storage (m2) Table and notes reproduced from Housing: optional
technical standards, March 2015 ......................................................................................................................................204
Figure 153: Ethnic Group Profile of All Usual Residents in Gateshead and Newcastle upon Tyne (Source: Census 1991,
2001, 2011) .......................................................................................................................................................................216