Gastrointestinal Microbiota Dysbiosis Associated with SARS ...
Upload
independentCategory
view
5download
0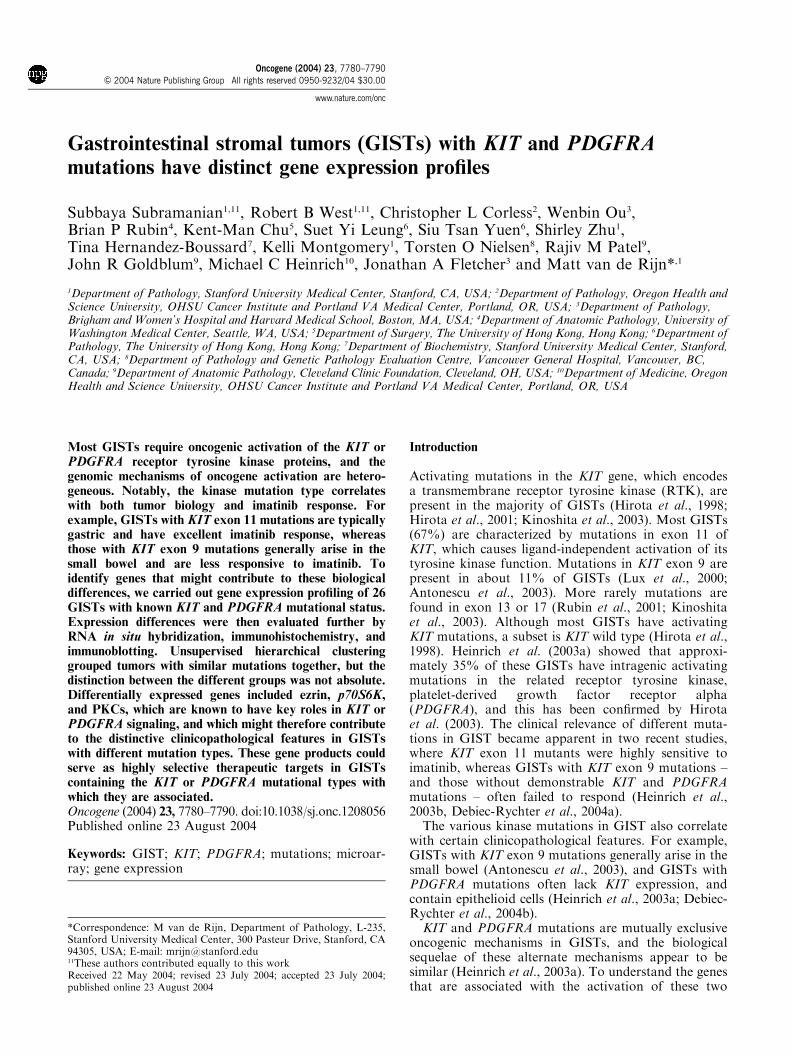
Gastrointestinal stromal tumors (GISTs) with KIT and PDGFRAmutations have distinct gene expression profiles
Subbaya Subramanian1,11, Robert B West1,11, Christopher L Corless2, Wenbin Ou3,Brian P Rubin4, Kent-Man Chu5, Suet Yi Leung6, Siu Tsan Yuen6, Shirley Zhu1,Tina Hernandez-Boussard7, Kelli Montgomery1, Torsten O Nielsen8, Rajiv M Patel9,John R Goldblum9, Michael C Heinrich10, Jonathan A Fletcher3 and Matt van de Rijn*,1
1Department of Pathology, Stanford University Medical Center, Stanford, CA, USA; 2Department of Pathology, Oregon Health andScience University, OHSU Cancer Institute and Portland VA Medical Center, Portland, OR, USA; 3Department of Pathology,Brigham and Women’s Hospital and Harvard Medical School, Boston, MA, USA; 4Department of Anatomic Pathology, University ofWashington Medical Center, Seattle, WA, USA; 5Department of Surgery, The University of Hong Kong, Hong Kong; 6Department ofPathology, The University of Hong Kong, Hong Kong; 7Department of Biochemistry, Stanford University Medical Center, Stanford,CA, USA; 8Department of Pathology and Genetic Pathology Evaluation Centre, Vancouver General Hospital, Vancouver, BC,Canada; 9Department of Anatomic Pathology, Cleveland Clinic Foundation, Cleveland, OH, USA; 10Department of Medicine, OregonHealth and Science University, OHSU Cancer Institute and Portland VA Medical Center, Portland, OR, USA
Most GISTs require oncogenic activation of the KIT orPDGFRA receptor tyrosine kinase proteins, and thegenomic mechanisms of oncogene activation are hetero-geneous. Notably, the kinase mutation type correlateswith both tumor biology and imatinib response. Forexample, GISTs with KIT exon 11 mutations are typicallygastric and have excellent imatinib response, whereasthose with KIT exon 9 mutations generally arise in thesmall bowel and are less responsive to imatinib. Toidentify genes that might contribute to these biologicaldifferences, we carried out gene expression profiling of 26GISTs with known KIT and PDGFRA mutational status.Expression differences were then evaluated further byRNA in situ hybridization, immunohistochemistry, andimmunoblotting. Unsupervised hierarchical clusteringgrouped tumors with similar mutations together, but thedistinction between the different groups was not absolute.Differentially expressed genes included ezrin, p70S6K,and PKCs, which are known to have key roles in KIT orPDGFRA signaling, and which might therefore contributeto the distinctive clinicopathological features in GISTswith different mutation types. These gene products couldserve as highly selective therapeutic targets in GISTscontaining the KIT or PDGFRA mutational types withwhich they are associated.Oncogene (2004) 23, 7780–7790. doi:10.1038/sj.onc.1208056Published online 23 August 2004
Keywords: GIST; KIT; PDGFRA; mutations; microar-ray; gene expression
Introduction
Activating mutations in the KIT gene, which encodesa transmembrane receptor tyrosine kinase (RTK), arepresent in the majority of GISTs (Hirota et al., 1998;Hirota et al., 2001; Kinoshita et al., 2003). Most GISTs(67%) are characterized by mutations in exon 11 ofKIT, which causes ligand-independent activation of itstyrosine kinase function. Mutations in KIT exon 9 arepresent in about 11% of GISTs (Lux et al., 2000;Antonescu et al., 2003). More rarely mutations arefound in exon 13 or 17 (Rubin et al., 2001; Kinoshitaet al., 2003). Although most GISTs have activatingKIT mutations, a subset is KIT wild type (Hirota et al.,1998). Heinrich et al. (2003a) showed that approxi-mately 35% of these GISTs have intragenic activatingmutations in the related receptor tyrosine kinase,platelet-derived growth factor receptor alpha(PDGFRA), and this has been confirmed by Hirotaet al. (2003). The clinical relevance of different muta-tions in GIST became apparent in two recent studies,where KIT exon 11 mutants were highly sensitive toimatinib, whereas GISTs with KIT exon 9 mutations –and those without demonstrable KIT and PDGFRAmutations – often failed to respond (Heinrich et al.,2003b, Debiec-Rychter et al., 2004a).
The various kinase mutations in GIST also correlatewith certain clinicopathological features. For example,GISTs with KIT exon 9 mutations generally arise in thesmall bowel (Antonescu et al., 2003), and GISTs withPDGFRA mutations often lack KIT expression, andcontain epithelioid cells (Heinrich et al., 2003a; Debiec-Rychter et al., 2004b).
KIT and PDGFRA mutations are mutually exclusiveoncogenic mechanisms in GISTs, and the biologicalsequelae of these alternate mechanisms appear to besimilar (Heinrich et al., 2003a). To understand the genesthat are associated with the activation of these two
Received 22 May 2004; revised 23 July 2004; accepted 23 July 2004;published online 23 August 2004
*Correspondence: M van de Rijn, Department of Pathology, L-235,Stanford University Medical Center, 300 Pasteur Drive, Stanford, CA94305, USA; E-mail: [email protected] authors contributed equally to this work
Oncogene (2004) 23, 7780–7790& 2004 Nature Publishing Group All rights reserved 0950-9232/04 $30.00
www.nature.com/onc

kinases in GIST tumorigenesis, we have examined the geneexpression profiles of 26 tumors with known mutationsin KIT (exons 9, 11, or 17) and PDGFRA (exon 12 or 18)genes using 42000 spot cDNA microarrays. We confirmedthe differences in expression profile by using Westernblots on a separate set of GISTs. In addition, we usedimmunohistochemistry (IHC) and in situ hybridization(ISH) on a tissue microarray with a different group of 127GISTs representing various KIT and PDGFRA mutantsand KIT and PDGFRA wild-type GISTs.
Results
Gene expression profiling, unsupervised hierarchicalclustering
As summarized in Table 1, the 26 GIST cases included aspectrum of mutations in KIT and PDGFRA, as well asthree cases that were wild type for all examined exons inboth these genes. Clinical information and IHC stainingprofiles of the cases are shown in Table 1. Gene selectionfor cDNA gene array analysis was based on signal-to-noise ratio and the degree of variation in expressionacross the samples (see Materials and methods) andyielded 1875 genes (Figure 1a). By using unsupervisedhierarchical clustering most tumors were groupedtogether according to mutation type (Figure 1b). Three
of four GISTs with a mutation in KIT exon 9 clusteredtogether with one wild-type case as branch 1 (Figure 1b).All GIST cases with a mutation within PDGFRAclustered on branch 2, together with two wild-type casesand two cases with mutations in KIT exon 11. Finally,eight of 10 GISTs with a mutation in KIT exon 11clustered on branch 3, together with two cases withmutations in KIT exons 9 and 17, respectively. Thus, byusing an unsupervised clustering method we could see ageneral separation of GIST cases based on their kinasemutation status.
Inspection of the clustered gene array data showedthat the KIT gene was relatively highly expressed inmost of the KIT exons 11 and 9 mutant GISTs, but wasexpressed at lower levels in most of the PDGFRAmutant GISTs. Expression of the PDGFRA gene wasseen predominantly in the PDGFRA mutant GIST cases(Figure 1b). However, four GISTs with KIT exon 11mutations also showed relatively high expression ofPDGFRA. These findings are similar to those previouslyreported using IHC and in situ hybridization (ISH) onan independent set of 127 GIST cases with knownmutational status (West et al., 2004). None of the KITexon 9 mutants showed expression of PDGFRA(Figure 1b). The wild-type GISTs that clustered alongwith PDGFRA mutant GISTs showed expression ofPDGFRA, while the wild-type GIST that clustered alongwith KIT exon 9 mutants did not. CD34 was highly
Table 1 Clinical data for all the 26 GIST tumors used in the gene expression study
Case no. KIT/PDGFRA mutation Sex Age Size(cm)
Location KITIHC
CD34IHC
DesminIHC
S100IHC
SMAIHC
STT3816 PDGFRA exon 18 point mutation D842V F 53 2 Stomach +++ ND — ND NDSTT3819 PDGFRA exon 12 del/ins SPDGHE566–571R M 35 17 Stomach + ++ — ND NDSTT1148 PDGFRA exon 18 point mutation D842V M 42 17 Stomach Focal — ND — NDSTT3814 PDGFRA exon 18 del DIMH842–845 F 61 5.5 Stomach ++ ++ ND — NDSX411 PDGFRA exon 18 point mutation D842V M 72 2.5 Stomach Focal weak — — — —SX479 PDGFRA exon 18 point mutation Y839C F 82 5 Duodenum +++ +++ — — FocalSX255 PDGFRA exon 18 point mutation D842V M 34 3 Stomach Focal weak +++ — — —STT794 PDGFRA exon 18 deletion DIMH842–845 F 49 18 Stomach — Focal ND — NDST03-213 KIT exon 11 V559A M 41 5 Stomach + + ND — NDSTT111 KIT exon 11 deletion WK557–558 F 69 5.5 Stomach ND ND ND ND NDSTT623 KIT exon 11 deletion EVQWK554–558 M 73 7 Stomach ND +++ ND — NDSTT3813 KIT exon 11 point mutation V559D M 81 31 Stomach +++ ND — ND NDSTT2000 KIT exon 11 deletion WK557–558 M 70 5.5 Stomach ND ND ND ND NDSX271 KIT exon11 insertion QLPYDHKWEFPRNR575–588
after588M 83 5 Stomach +++ +++ — — —
SX242 KIT exon 11 deletion V560 M 72 5 Stomach +++ +++ — — —SX288 KIT exon 11 deletion V560 F 49 14.5 Stomach +++ +++ — — —SX322 KIT exon 11deletion WK557–558S M 67 7 Stomach +++ +++ — — —SX396 KIT exon 11 deletion K558NQ F 53 10.5 Stomach +++ +++ — — —ST00-663 KIT exon 9 insertion AY502–503 M 62 5 Small bowel + Focal ND — FocalST00-333 KIT exon 9 insertion AY502–503 F 33 18 Omental + — ND — FocalSX387 KIT exon 9 insertion AY502–503 F 62 4.5 Duodenum +++ — — — —STT94 KIT exon 9 insertion AY502–503 M 31 9 NA ND ND ND ND NDSTT2534 KIT wild-type exon 9,11,13,17; PDGFRA wild-type
exon 12, 14, 18F 8 NA Ileum Focal — Focal ND Focal
STT2001 KIT wild-type exon 9,11,13,17; PDGFRA wild-typeexons 12, 18
M 46 14 Stomach Focal ND ND ND ND
SX474 KIT wild-type exon 9,11,13,17; PDGFRA wild-typeexons 12, 14, 18
M 67 17 Jejunum +++ — — — —
SX510 KIT exon17 point mutation N822K M 29 5.5 Stomach +++ +++ — — —
Strong IHC staining was given a score of ‘+++’ and weak staining were either scored as ‘+ or ++’, with ‘�’ indicating no staining. ‘ND’ and‘NA’ denotes not done and not available, respectively
GISTs with KIT and PDGFRA mutationsS Subramanian et al
7781
Oncogene
expressed in most of the KIT exon 11 mutants andpresent at much lower levels in KIT exon 9 andPDGFRA mutants (Figure 1b).
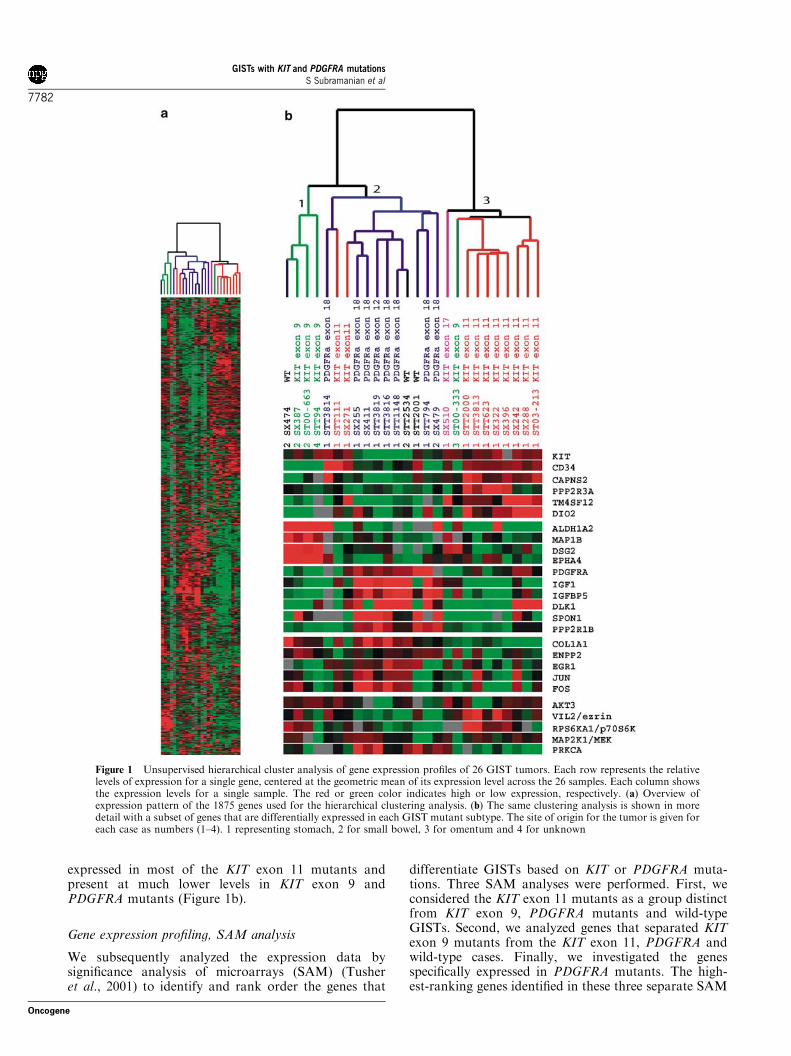
Gene expression profiling, SAM analysis
We subsequently analyzed the expression data bysignificance analysis of microarrays (SAM) (Tusheret al., 2001) to identify and rank order the genes that
differentiate GISTs based on KIT or PDGFRA muta-tions. Three SAM analyses were performed. First, weconsidered the KIT exon 11 mutants as a group distinctfrom KIT exon 9, PDGFRA mutants and wild-typeGISTs. Second, we analyzed genes that separated KITexon 9 mutants from the KIT exon 11, PDGFRA andwild-type cases. Finally, we investigated the genesspecifically expressed in PDGFRA mutants. The high-est-ranking genes identified in these three separate SAM
Figure 1 Unsupervised hierarchical cluster analysis of gene expression profiles of 26 GIST tumors. Each row represents the relativelevels of expression for a single gene, centered at the geometric mean of its expression level across the 26 samples. Each column showsthe expression levels for a single sample. The red or green color indicates high or low expression, respectively. (a) Overview ofexpression pattern of the 1875 genes used for the hierarchical clustering analysis. (b) The same clustering analysis is shown in moredetail with a subset of genes that are differentially expressed in each GIST mutant subtype. The site of origin for the tumor is given foreach case as numbers (1–4). 1 representing stomach, 2 for small bowel, 3 for omentum and 4 for unknown
GISTs with KIT and PDGFRA mutationsS Subramanian et al
7782
Oncogene
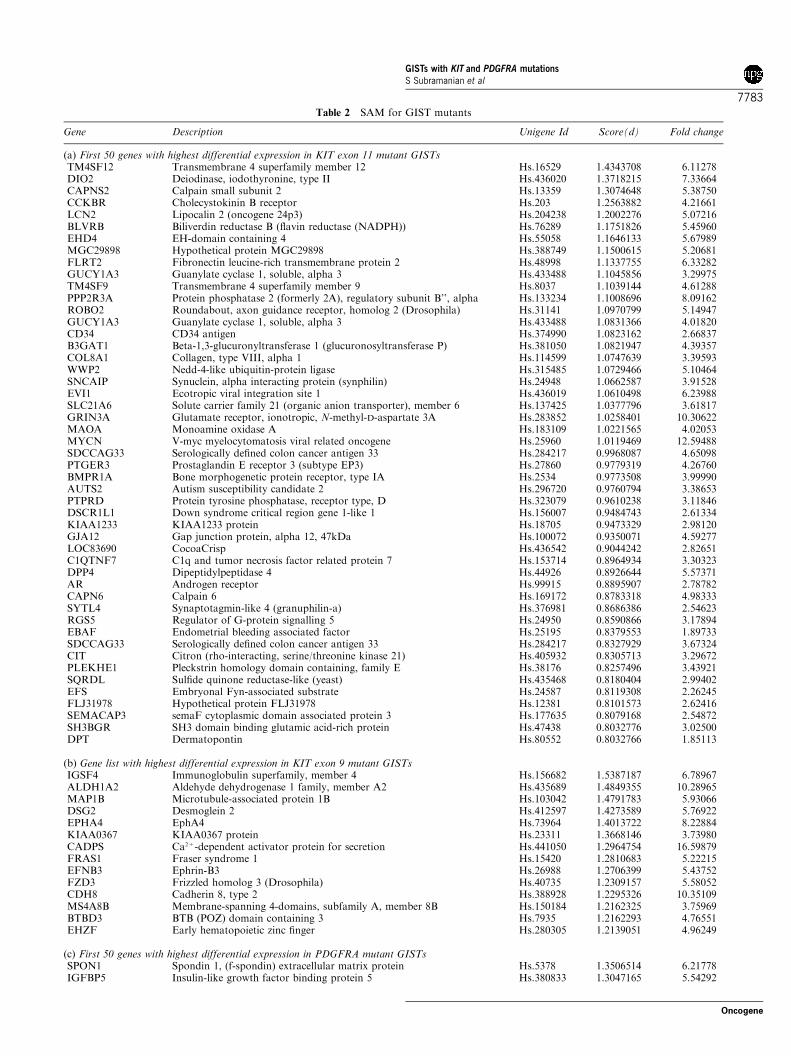
Table 2 SAM for GIST mutants
Gene Description Unigene Id Score(d) Fold change
(a) First 50 genes with highest differential expression in KIT exon 11 mutant GISTsTM4SF12 Transmembrane 4 superfamily member 12 Hs.16529 1.4343708 6.11278DIO2 Deiodinase, iodothyronine, type II Hs.436020 1.3718215 7.33664CAPNS2 Calpain small subunit 2 Hs.13359 1.3074648 5.38750CCKBR Cholecystokinin B receptor Hs.203 1.2563882 4.21661LCN2 Lipocalin 2 (oncogene 24p3) Hs.204238 1.2002276 5.07216BLVRB Biliverdin reductase B (flavin reductase (NADPH)) Hs.76289 1.1751826 5.45960EHD4 EH-domain containing 4 Hs.55058 1.1646133 5.67989MGC29898 Hypothetical protein MGC29898 Hs.388749 1.1500615 5.20681FLRT2 Fibronectin leucine-rich transmembrane protein 2 Hs.48998 1.1337755 6.33282GUCY1A3 Guanylate cyclase 1, soluble, alpha 3 Hs.433488 1.1045856 3.29975TM4SF9 Transmembrane 4 superfamily member 9 Hs.8037 1.1039144 4.61288PPP2R3A Protein phosphatase 2 (formerly 2A), regulatory subunit B’’, alpha Hs.133234 1.1008696 8.09162ROBO2 Roundabout, axon guidance receptor, homolog 2 (Drosophila) Hs.31141 1.0970799 5.14947GUCY1A3 Guanylate cyclase 1, soluble, alpha 3 Hs.433488 1.0831366 4.01820CD34 CD34 antigen Hs.374990 1.0823162 2.66837B3GAT1 Beta-1,3-glucuronyltransferase 1 (glucuronosyltransferase P) Hs.381050 1.0821947 4.39357COL8A1 Collagen, type VIII, alpha 1 Hs.114599 1.0747639 3.39593WWP2 Nedd-4-like ubiquitin-protein ligase Hs.315485 1.0729466 5.10464SNCAIP Synuclein, alpha interacting protein (synphilin) Hs.24948 1.0662587 3.91528EVI1 Ecotropic viral integration site 1 Hs.436019 1.0610498 6.23988SLC21A6 Solute carrier family 21 (organic anion transporter), member 6 Hs.137425 1.0377796 3.61817GRIN3A Glutamate receptor, ionotropic, N-methyl-D-aspartate 3A Hs.283852 1.0258401 10.30622MAOA Monoamine oxidase A Hs.183109 1.0221565 4.02053MYCN V-myc myelocytomatosis viral related oncogene Hs.25960 1.0119469 12.59488SDCCAG33 Serologically defined colon cancer antigen 33 Hs.284217 0.9968087 4.65098PTGER3 Prostaglandin E receptor 3 (subtype EP3) Hs.27860 0.9779319 4.26760BMPR1A Bone morphogenetic protein receptor, type IA Hs.2534 0.9773508 3.99990AUTS2 Autism susceptibility candidate 2 Hs.296720 0.9760794 3.38653PTPRD Protein tyrosine phosphatase, receptor type, D Hs.323079 0.9610238 3.11846DSCR1L1 Down syndrome critical region gene 1-like 1 Hs.156007 0.9484743 2.61334KIAA1233 KIAA1233 protein Hs.18705 0.9473329 2.98120GJA12 Gap junction protein, alpha 12, 47kDa Hs.100072 0.9350071 4.59277LOC83690 CocoaCrisp Hs.436542 0.9044242 2.82651C1QTNF7 C1q and tumor necrosis factor related protein 7 Hs.153714 0.8964934 3.30323DPP4 Dipeptidylpeptidase 4 Hs.44926 0.8926644 5.57371AR Androgen receptor Hs.99915 0.8895907 2.78782CAPN6 Calpain 6 Hs.169172 0.8783318 4.98333SYTL4 Synaptotagmin-like 4 (granuphilin-a) Hs.376981 0.8686386 2.54623RGS5 Regulator of G-protein signalling 5 Hs.24950 0.8590866 3.17894EBAF Endometrial bleeding associated factor Hs.25195 0.8379553 1.89733SDCCAG33 Serologically defined colon cancer antigen 33 Hs.284217 0.8327929 3.67324CIT Citron (rho-interacting, serine/threonine kinase 21) Hs.405932 0.8305713 3.29672PLEKHE1 Pleckstrin homology domain containing, family E Hs.38176 0.8257496 3.43921SQRDL Sulfide quinone reductase-like (yeast) Hs.435468 0.8180404 2.99402EFS Embryonal Fyn-associated substrate Hs.24587 0.8119308 2.26245FLJ31978 Hypothetical protein FLJ31978 Hs.12381 0.8101573 2.62416SEMACAP3 semaF cytoplasmic domain associated protein 3 Hs.177635 0.8079168 2.54872SH3BGR SH3 domain binding glutamic acid-rich protein Hs.47438 0.8032776 3.02500DPT Dermatopontin Hs.80552 0.8032766 1.85113
(b) Gene list with highest differential expression in KIT exon 9 mutant GISTsIGSF4 Immunoglobulin superfamily, member 4 Hs.156682 1.5387187 6.78967ALDH1A2 Aldehyde dehydrogenase 1 family, member A2 Hs.435689 1.4849355 10.28965MAP1B Microtubule-associated protein 1B Hs.103042 1.4791783 5.93066DSG2 Desmoglein 2 Hs.412597 1.4273589 5.76922EPHA4 EphA4 Hs.73964 1.4013722 8.22884KIAA0367 KIAA0367 protein Hs.23311 1.3668146 3.73980CADPS Ca2+-dependent activator protein for secretion Hs.441050 1.2964754 16.59879FRAS1 Fraser syndrome 1 Hs.15420 1.2810683 5.22215EFNB3 Ephrin-B3 Hs.26988 1.2706399 5.43752FZD3 Frizzled homolog 3 (Drosophila) Hs.40735 1.2309157 5.58052CDH8 Cadherin 8, type 2 Hs.388928 1.2295326 10.35109MS4A8B Membrane-spanning 4-domains, subfamily A, member 8B Hs.150184 1.2162325 3.75969BTBD3 BTB (POZ) domain containing 3 Hs.7935 1.2162293 4.76551EHZF Early hematopoietic zinc finger Hs.280305 1.2139051 4.96249
(c) First 50 genes with highest differential expression in PDGFRA mutant GISTsSPON1 Spondin 1, (f-spondin) extracellular matrix protein Hs.5378 1.3506514 6.21778IGFBP5 Insulin-like growth factor binding protein 5 Hs.380833 1.3047165 5.54292
GISTs with KIT and PDGFRA mutationsS Subramanian et al
7783
Oncogene

analyses are shown in Tables 2a–c respectively. Thecomplete SAM list of genes for each GIST mutant groupis given in the supplemental data at http://microarray-pubs.stanford.edu/tma_portal/GISTmutations/.
Confirmation of gene array findings
We used a tissue microarray (TMA) of 127 GISTs withknown KIT and PDGFRA mutational status to confirmthe expression profiles for genes selected from SAManalysis using antibodies and ISH probes. We testedMAP1B by ISH and found that positive signals weremore common among KIT exon 9 mutant cases (71.4%)than among KIT exon 11 and wild-type GISTs (22.4 and46.2%, respectively) (Figure 2). None of the PDGFRA
mutant GISTs was positive for MAP1B. These findingsare comparable with the gene array data. A detailedtable (Supplementary Table 1) that shows the site oforigin and mutation type of the 127 GIST cases on theTMA is shown at the accompanying website.
From our gene expression data we selected DLK1 as acandidate marker for PDGFRA GIST mutants. TheDLK1 ISH probe was predominantly positive inPDGFRA mutants (57.1%), but in contrast to the genearray findings, 42.9% of KIT exon 9 mutants were alsopositive for this probe, while fewer exon 11 cases(17.3%) reacted (Figure 2). Interestingly, the DLK1gene is located on the chromosome 14q. This part of thechromosome is often lost in GIST (Breiner et al., 2000;Gunawan et al., 2004). This raises the possibility that
Table 2 (continued )
Gene Description Unigene Id Score(d) Fold change
IGF1 Insulin-like growth factor 1 (somatomedin C) Hs.308053 1.2779636 3.76439ANGPTL1 Angiopoietin-like 1 Hs.304398 1.2254871 4.33414LUM Lumican Hs.406475 1.177386 4.36662DLK1 Delta-like 1 homolog (Drosophila) Hs.169228 1.1542304 1.47196KIAA0534 KIAA0534 protein Hs.407474 1.1386462 4.35136DKFZP434B044 Hypothetical protein DKFZp434B044 Hs.262958 1.119748 3.99764CLDN11 Claudin 11 (oligodendrocyte transmembrane protein) Hs.31595 1.0881825 4.64470PDK4 Pyruvate dehydrogenase kinase, isoenzyme 4 Hs.8364 1.0838902 3.44589HNRPU Heterogeneous nuclear ribonucleoprotein U Hs.166463 1.0807383 1.56912PPP2R1B Protein phosphatase 2, regulatory subunit A (PR 65), beta isoform Hs.431156 1.0601872 4.15235SPOCK Sparc/osteonectin, cwcv and kazal-like domains proteoglycan Hs.93029 1.0459539 3.97131PRSS2 Protease, serine, 2 (trypsin 2) Hs.511525 1.0366911 5.40492SORL1 Sortilin-related receptor, L(DLR class) A repeats-containing Hs.438159 1.0286613 4.03677APOD Apolipoprotein D Hs.75736 1.0268499 7.86234TYROBP TYRO protein tyrosine kinase binding protein Hs.9963 1.0154491 3.83288FLJ20366 Hypothetical protein FLJ20366 Hs.354793 0.9904725 3.71460SULF1 Sulfatase 1 Hs.409602 0.986583 3.07600ECM1 Extracellular matrix protein 1 Hs.81071 0.9745068 2.14016MAPT Microtubule-associated protein tau Hs.101174 0.9720159 6.59511SCUBE2 Signal peptide, CUB domain, EGF-like 2 Hs.435861 0.9648591 2.42009VWF Von Willebrand factor Hs.440848 0.9633689 3.89962IGJ Immunoglobulin J polypeptide, Hs.381568 0.9522969 3.26008RARRES2 Retinoic acid receptor responder (tazarotene induced) 2 Hs.37682 0.9506683 3.05749EGLN3 Egl nine homolog 3 (C. elegans) Hs.443906 0.9455161 6.36850C1QA Complement component 1, q subcomponent, alpha polypeptide Hs.9641 0.9451115 2.92682IGLV Immunoglobulin lambda variable group Hs.512116 0.9351256 3.52688IL15RA Interleukin 15 receptor, alpha Hs.12503 0.9346573 3.52773MX1 Myxovirus (influenza virus) resistance 1 Hs.436836 0.8888529 4.02704SEMA5A Sema domain, seven thrombospondin repeats (type 1 and type 1-like) Hs.27621 0.8863345 2.65311LR8 LR8 protein Hs.190161 0.8843536 3.89467EPB41L3 Erythrocyte membrane protein band 4.1-like 3 Hs.103839 0.8784795 2.59129CH25H Cholesterol 25-hydroxylase Hs.47357 0.8775504 4.22944TLE3 Transducin-like enhancer of split 3 (E(sp1) homolog, Drosophila) Hs.287362 0.8687078 2.92431ISL1 ISL1 transcription factor, LIM/homeodomain (islet-1) Hs.505 0.8657636 2.47976GPC5 Glypican 5 Hs.450919 0.8629431 4.71517AGT Angiotensinogen Hs.19383 0.8609486 3.79877FBLN1 Fibulin 1 Hs.445240 0.860423 2.46420JDP2 Jun dimerization protein 2 Hs.154095 0.8602472 3.07592CCL2 Chemokine (C–C motif) ligand 2 Hs.303649 0.8582911 3.41990SNK Serum-inducible kinase Hs.398157 0.8553821 2.68625WNT9A Wingless-type MMTV integration site family, member 9A Hs.149504 0.8548781 2.55467APM2 Adipose specific 2 Hs.511763 0.8518084 5.85456PSMF1 Proteasome (prosome, macropain) inhibitor subunit 1 (PI31) Hs.437495 0.8514397 2.61767KIAA0534 KIAA0534 protein Hs.407474 0.850514 4.75186ISLR Immunoglobulin superfamily containing leucine-rich repeat Hs.102171 0.8503522 2.77383NCF1 Neutrophil cytosolic factor 1 Hs.458275 0.8468407 3.26218STOM Stomatin Hs.439776 0.8408588 3.05601
Input parameters for SAM analysis: imputation engine is 10 nearest neighbor imputer; data type is two class-unpaired data; data are in log scale;number of permutations is 100; RNG seed is 1234567; delta fold changes are 0.31488 (KIT exon 11), 0.36226 (KIT exon 9) and 0.25929 (PDGFRA)
GISTs with KIT and PDGFRA mutationsS Subramanian et al
7784
Oncogene
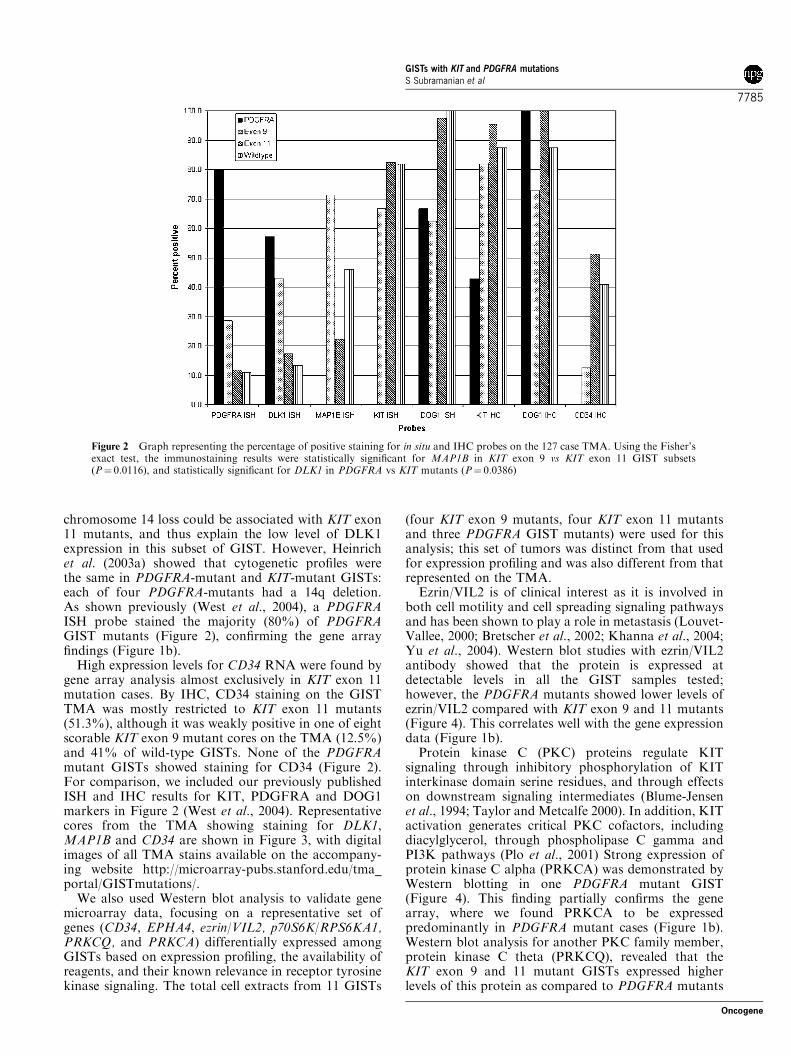
chromosome 14 loss could be associated with KIT exon11 mutants, and thus explain the low level of DLK1expression in this subset of GIST. However, Heinrichet al. (2003a) showed that cytogenetic profiles werethe same in PDGFRA-mutant and KIT-mutant GISTs:each of four PDGFRA-mutants had a 14q deletion.As shown previously (West et al., 2004), a PDGFRAISH probe stained the majority (80%) of PDGFRAGIST mutants (Figure 2), confirming the gene arrayfindings (Figure 1b).
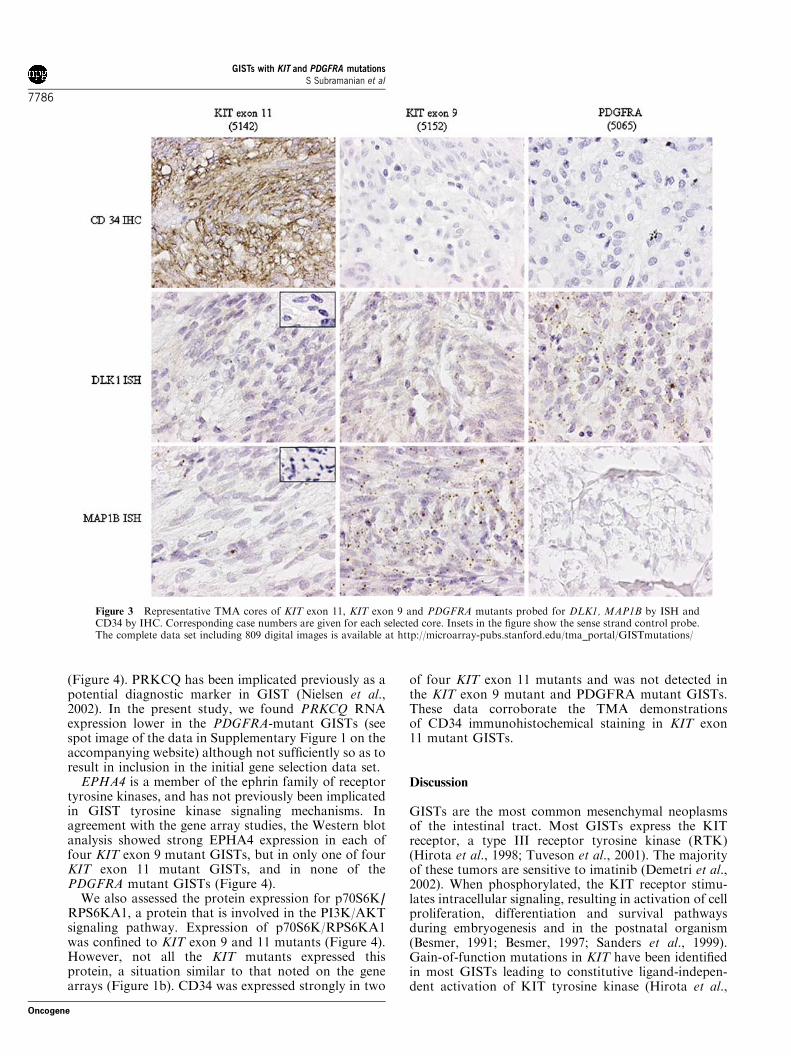
High expression levels for CD34 RNA were found bygene array analysis almost exclusively in KIT exon 11mutation cases. By IHC, CD34 staining on the GISTTMA was mostly restricted to KIT exon 11 mutants(51.3%), although it was weakly positive in one of eightscorable KIT exon 9 mutant cores on the TMA (12.5%)and 41% of wild-type GISTs. None of the PDGFRAmutant GISTs showed staining for CD34 (Figure 2).For comparison, we included our previously publishedISH and IHC results for KIT, PDGFRA and DOG1markers in Figure 2 (West et al., 2004). Representativecores from the TMA showing staining for DLK1,MAP1B and CD34 are shown in Figure 3, with digitalimages of all TMA stains available on the accompany-ing website http://microarray-pubs.stanford.edu/tma_portal/GISTmutations/.
We also used Western blot analysis to validate genemicroarray data, focusing on a representative set ofgenes (CD34, EPHA4, ezrin/VIL2, p70S6K/RPS6KA1,PRKCQ, and PRKCA) differentially expressed amongGISTs based on expression profiling, the availability ofreagents, and their known relevance in receptor tyrosinekinase signaling. The total cell extracts from 11 GISTs
(four KIT exon 9 mutants, four KIT exon 11 mutantsand three PDGFRA GIST mutants) were used for thisanalysis; this set of tumors was distinct from that usedfor expression profiling and was also different from thatrepresented on the TMA.
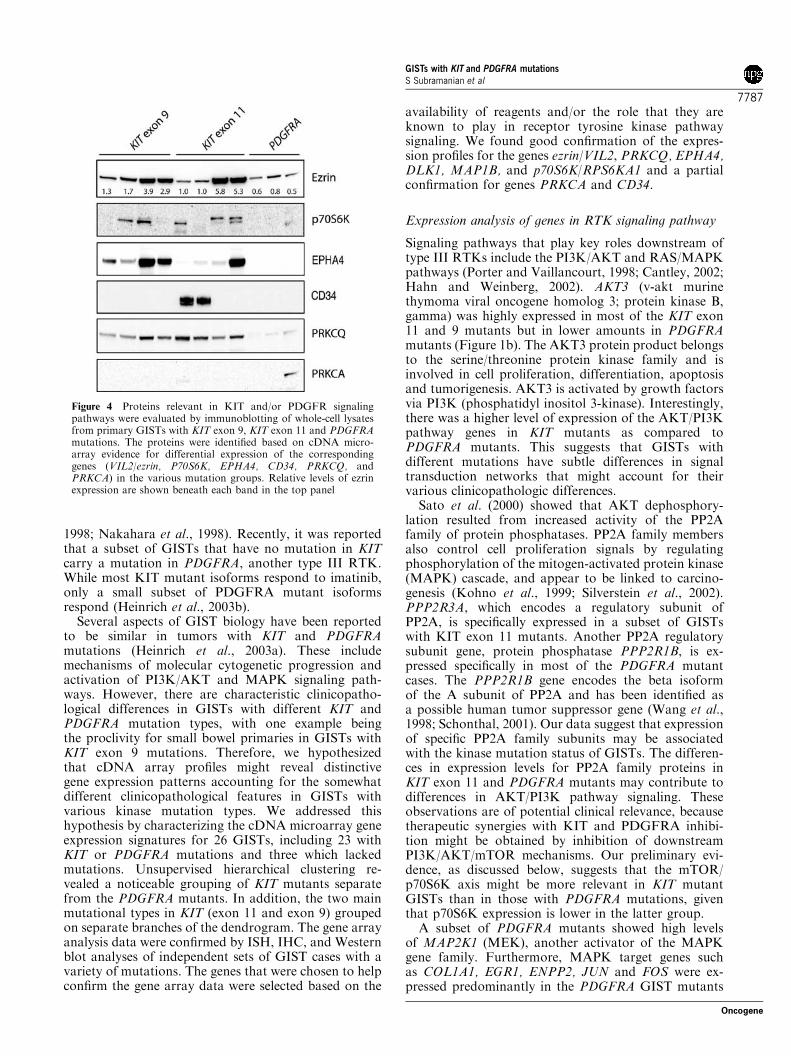
Ezrin/VIL2 is of clinical interest as it is involved inboth cell motility and cell spreading signaling pathwaysand has been shown to play a role in metastasis (Louvet-Vallee, 2000; Bretscher et al., 2002; Khanna et al., 2004;Yu et al., 2004). Western blot studies with ezrin/VIL2antibody showed that the protein is expressed atdetectable levels in all the GIST samples tested;however, the PDGFRA mutants showed lower levels ofezrin/VIL2 compared with KIT exon 9 and 11 mutants(Figure 4). This correlates well with the gene expressiondata (Figure 1b).
Protein kinase C (PKC) proteins regulate KITsignaling through inhibitory phosphorylation of KITinterkinase domain serine residues, and through effectson downstream signaling intermediates (Blume-Jensenet al., 1994; Taylor and Metcalfe 2000). In addition, KITactivation generates critical PKC cofactors, includingdiacylglycerol, through phospholipase C gamma andPI3K pathways (Plo et al., 2001) Strong expression ofprotein kinase C alpha (PRKCA) was demonstrated byWestern blotting in one PDGFRA mutant GIST(Figure 4). This finding partially confirms the genearray, where we found PRKCA to be expressedpredominantly in PDGFRA mutant cases (Figure 1b).Western blot analysis for another PKC family member,protein kinase C theta (PRKCQ), revealed that theKIT exon 9 and 11 mutant GISTs expressed higherlevels of this protein as compared to PDGFRA mutants
Figure 2 Graph representing the percentage of positive staining for in situ and IHC probes on the 127 case TMA. Using the Fisher’sexact test, the immunostaining results were statistically significant for MAP1B in KIT exon 9 vs KIT exon 11 GIST subsets(P¼ 0.0116), and statistically significant for DLK1 in PDGFRA vs KIT mutants (P¼ 0.0386)
GISTs with KIT and PDGFRA mutationsS Subramanian et al
7785
Oncogene
(Figure 4). PRKCQ has been implicated previously as apotential diagnostic marker in GIST (Nielsen et al.,2002). In the present study, we found PRKCQ RNAexpression lower in the PDGFRA-mutant GISTs (seespot image of the data in Supplementary Figure 1 on theaccompanying website) although not sufficiently so as toresult in inclusion in the initial gene selection data set.
EPHA4 is a member of the ephrin family of receptortyrosine kinases, and has not previously been implicatedin GIST tyrosine kinase signaling mechanisms. Inagreement with the gene array studies, the Western blotanalysis showed strong EPHA4 expression in each offour KIT exon 9 mutant GISTs, but in only one of fourKIT exon 11 mutant GISTs, and in none of thePDGFRA mutant GISTs (Figure 4).
We also assessed the protein expression for p70S6K/RPS6KA1, a protein that is involved in the PI3K/AKTsignaling pathway. Expression of p70S6K/RPS6KA1was confined to KIT exon 9 and 11 mutants (Figure 4).However, not all the KIT mutants expressed thisprotein, a situation similar to that noted on the genearrays (Figure 1b). CD34 was expressed strongly in two
of four KIT exon 11 mutants and was not detected inthe KIT exon 9 mutant and PDGFRA mutant GISTs.These data corroborate the TMA demonstrationsof CD34 immunohistochemical staining in KIT exon11 mutant GISTs.
Discussion
GISTs are the most common mesenchymal neoplasmsof the intestinal tract. Most GISTs express the KITreceptor, a type III receptor tyrosine kinase (RTK)(Hirota et al., 1998; Tuveson et al., 2001). The majorityof these tumors are sensitive to imatinib (Demetri et al.,2002). When phosphorylated, the KIT receptor stimu-lates intracellular signaling, resulting in activation of cellproliferation, differentiation and survival pathwaysduring embryogenesis and in the postnatal organism(Besmer, 1991; Besmer, 1997; Sanders et al., 1999).Gain-of-function mutations in KIT have been identifiedin most GISTs leading to constitutive ligand-indepen-dent activation of KIT tyrosine kinase (Hirota et al.,
Figure 3 Representative TMA cores of KIT exon 11, KIT exon 9 and PDGFRA mutants probed for DLK1, MAP1B by ISH andCD34 by IHC. Corresponding case numbers are given for each selected core. Insets in the figure show the sense strand control probe.The complete data set including 809 digital images is available at http://microarray-pubs.stanford.edu/tma_portal/GISTmutations/
GISTs with KIT and PDGFRA mutationsS Subramanian et al
7786
Oncogene
1998; Nakahara et al., 1998). Recently, it was reportedthat a subset of GISTs that have no mutation in KITcarry a mutation in PDGFRA, another type III RTK.While most KIT mutant isoforms respond to imatinib,only a small subset of PDGFRA mutant isoformsrespond (Heinrich et al., 2003b).
Several aspects of GIST biology have been reportedto be similar in tumors with KIT and PDGFRAmutations (Heinrich et al., 2003a). These includemechanisms of molecular cytogenetic progression andactivation of PI3K/AKT and MAPK signaling path-ways. However, there are characteristic clinicopatho-logical differences in GISTs with different KIT andPDGFRA mutation types, with one example beingthe proclivity for small bowel primaries in GISTs withKIT exon 9 mutations. Therefore, we hypothesizedthat cDNA array profiles might reveal distinctivegene expression patterns accounting for the somewhatdifferent clinicopathological features in GISTs withvarious kinase mutation types. We addressed thishypothesis by characterizing the cDNA microarray geneexpression signatures for 26 GISTs, including 23 withKIT or PDGFRA mutations and three which lackedmutations. Unsupervised hierarchical clustering re-vealed a noticeable grouping of KIT mutants separatefrom the PDGFRA mutants. In addition, the two mainmutational types in KIT (exon 11 and exon 9) groupedon separate branches of the dendrogram. The gene arrayanalysis data were confirmed by ISH, IHC, and Westernblot analyses of independent sets of GIST cases with avariety of mutations. The genes that were chosen to helpconfirm the gene array data were selected based on the
availability of reagents and/or the role that they areknown to play in receptor tyrosine kinase pathwaysignaling. We found good confirmation of the expres-sion profiles for the genes ezrin/VIL2, PRKCQ, EPHA4,DLK1, MAP1B, and p70S6K/RPS6KA1 and a partialconfirmation for genes PRKCA and CD34.
Expression analysis of genes in RTK signaling pathway
Signaling pathways that play key roles downstream oftype III RTKs include the PI3K/AKT and RAS/MAPKpathways (Porter and Vaillancourt, 1998; Cantley, 2002;Hahn and Weinberg, 2002). AKT3 (v-akt murinethymoma viral oncogene homolog 3; protein kinase B,gamma) was highly expressed in most of the KIT exon11 and 9 mutants but in lower amounts in PDGFRAmutants (Figure 1b). The AKT3 protein product belongsto the serine/threonine protein kinase family and isinvolved in cell proliferation, differentiation, apoptosisand tumorigenesis. AKT3 is activated by growth factorsvia PI3K (phosphatidyl inositol 3-kinase). Interestingly,there was a higher level of expression of the AKT/PI3Kpathway genes in KIT mutants as compared toPDGFRA mutants. This suggests that GISTs withdifferent mutations have subtle differences in signaltransduction networks that might account for theirvarious clinicopathologic differences.
Sato et al. (2000) showed that AKT dephosphory-lation resulted from increased activity of the PP2Afamily of protein phosphatases. PP2A family membersalso control cell proliferation signals by regulatingphosphorylation of the mitogen-activated protein kinase(MAPK) cascade, and appear to be linked to carcino-genesis (Kohno et al., 1999; Silverstein et al., 2002).PPP2R3A, which encodes a regulatory subunit ofPP2A, is specifically expressed in a subset of GISTswith KIT exon 11 mutants. Another PP2A regulatorysubunit gene, protein phosphatase PPP2R1B, is ex-pressed specifically in most of the PDGFRA mutantcases. The PPP2R1B gene encodes the beta isoformof the A subunit of PP2A and has been identified asa possible human tumor suppressor gene (Wang et al.,1998; Schonthal, 2001). Our data suggest that expressionof specific PP2A family subunits may be associatedwith the kinase mutation status of GISTs. The differen-ces in expression levels for PP2A family proteins inKIT exon 11 and PDGFRA mutants may contribute todifferences in AKT/PI3K pathway signaling. Theseobservations are of potential clinical relevance, becausetherapeutic synergies with KIT and PDGFRA inhibi-tion might be obtained by inhibition of downstreamPI3K/AKT/mTOR mechanisms. Our preliminary evi-dence, as discussed below, suggests that the mTOR/p70S6K axis might be more relevant in KIT mutantGISTs than in those with PDGFRA mutations, giventhat p70S6K expression is lower in the latter group.
A subset of PDGFRA mutants showed high levelsof MAP2K1 (MEK), another activator of the MAPKgene family. Furthermore, MAPK target genes suchas COL1A1, EGR1, ENPP2, JUN and FOS were ex-pressed predominantly in the PDGFRA GIST mutants
Figure 4 Proteins relevant in KIT and/or PDGFR signalingpathways were evaluated by immunoblotting of whole-cell lysatesfrom primary GISTs with KIT exon 9, KIT exon 11 and PDGFRAmutations. The proteins were identified based on cDNA micro-array evidence for differential expression of the correspondinggenes (VIL2/ezrin, P70S6K, EPHA4, CD34, PRKCQ, andPRKCA) in the various mutation groups. Relative levels of ezrinexpression are shown beneath each band in the top panel
GISTs with KIT and PDGFRA mutationsS Subramanian et al
7787
Oncogene
(Figure 1b). However, variable levels of MEK werealso found in tumors with mutation in KIT and MEKexpression alone cannot explain the high levels ofMAPK target genes seen in PDGFRA mutant GISTs.At the protein level, Western blot studies have shownno differences in p42/44 MAPK in primary GISTs withPDGFRA mutations and with different KIT mutations(Heinrich et al., 2003a; Duensing et al., 2004).
PDGFRA mutants were associated with a largenumber of genes that are involved in T-cell receptorsignaling (see complete SAM gene list for PDGFRAmutants in the accompanying website). Histologicexamination of the PDGFRA cases showed a trendtowards a higher rate of pleomorphism and many casesdid indeed contain lymphocytes, either diffusely or inaggregates. However, the significance of the elevatedlevels of T-cell genes in our PDGFRA cases remains tobe determined.
Gene expression and Western blot data confirmed thedifferential expression of ezrin/VIL2 between the KITand PDGFRA mutants, with high levels of expressionfound in KIT exon 11 and a subset of KIT exon 9mutants. Ezrin presents a functional link between theplasma membrane and the cortical actin cytoskeletonof the cell and also participates in essential signaltransduction pathways including cell survival, motility,invasion and adherence. (Louvet-Vallee, 2000; Bretscheret al., 2002; Khanna et al., 2004). Ezrin is a crucialregulator of metastasis in rhabdomyosarcoma and highlevels of expression are significantly correlated withclinical stage (Yu et al., 2004). A recent study showedthat ezrin was highly expressed in malignant GISTs ascompared to benign cases (Koon et al., 2004). Furtherstudies will be needed to determine whether ezrin hasa similar predictive role in KIT and PDGFRA mutantGISTs. In a further comparison of genes highlyexpressed, COL8A1 and CENP-F are two genes presentin both data sets.
By both Western blot and gene array analysis,p70S6K/RPS6KA1 was found in most KIT exon 11and 9 mutants, but not in PDGFRA mutants. p70S6K/RPS6KA1 belongs to the RSK family of genes that isimplicated in activation of the mitogen-activated kinase(MAPK) cascade, and stimulation of cell proliferationand differentiation (Frodin and Gammeltoft, 1999). TheRSKs are known to phosphorylate the transcriptionfactor CREB, and activated CREB promotes cellsurvival (Frodin and Gammeltoft, 1999). In addition,p70S6K plays a key role in the PI3K/AKT pathway,downstream of mTOR (Brazil et al., 2002; Cantley,2002). As shown above, the PI3K/AKT pathwayappears to be more highly expressed in KIT exon 11and 9 mutants than in PDGFRA mutants. This suggeststhat p70S6K/RPS6KA1 may be a better target fortherapeutic intervention in KIT mutant rather thanPDGFRA mutant GISTs.
During submission of this manuscript, a paper waspublished that indicated that there are differences ingene expression related to location within the GI tract(Antonescu et al., 2004). This may reflect some of thedifferences that we see between our KIT exon 9 and KIT
exon 11 mutants, as several exon 9 cases arise from thesmall bowel, and all KIT exon 11 mutants from thestomach. However, almost all the PDGFRA mutantsand all the KIT exon 11 mutants used for gene arraysoriginate from the stomach. We find significant differ-ences in gene expression between these two groups andthese differences thus appear to be caused by genotyperather than by location of the tumors. The heatmapin Figure 1a shows that there are significant numbersof genes that are differentially expressed between KITexon 11 and PDGFRA mutants, more than those seenbetween KIT exon 11 and KIT exon 9 mutants.
Conclusion
Distinct gene expression profiles can distinguish mostGISTs with mutations in different kinases and alsoamong those with different types of mutations in theKIT gene. Nevertheless, our data show no absolutedistinction between KIT and PDGFRA mutant path-ways, and previous studies (Heinrich et al., 2003a) haveshown that both KIT and PDGFRA mutant GISTsfeature functional activation of the PI3K/AKT andMAPK pathways. Although gene expression studies inlarger numbers of GISTs might reveal additionalcorrelates with kinase mutation type, it is likely that aconsiderable overlap of expressed genes – as seen in thisstudy – reflects the close biologic relationships betweenGISTs, irrespective of their kinase oncogene mechan-isms. Nevertheless, genes such as ezrin, p70S6K andPRKCQ are differentially expressed in KIT vs PDGFRAmutant GISTs. These findings suggest that varioussignaling proteins might be more effective therapeutictargets in some GISTs than in others, depending ontheir kinase mutation type.
Materials and methods
Gene expression profiling on microarrays
In total, 26 fresh frozen GIST tumor tissue samples were usedfor gene array analysis. The institutional review board atStanford University approved the study. The mutation statusof each case was determined by denaturing HPLC and directsequencing as described previously (Corless et al., 2002). Themicroarrays used in the study contain a total of about 42 000cDNAs representing about 28 000 genes or ESTs printed onpolylysine coated glass slides by the Stanford FunctionalGenomics Facility (http://www.microarray.org/). Preparationand details of microarray construction were described pre-viously (Perou et al., 2000). Briefly, tissue was homogenizedin Trizol reagent (Invitrogen, Carlsbad, CA, USA) and totalRNA was extracted. Preparation of Cy-3-dUTP labeled cDNAfrom reference RNA and Cy-5-dUTP labeled cDNA tumorspecimen total RNA, microarray hybridization and washingof arrays was performed as described by Perou et al. (2000).Microarrays were scanned on a GenePix 4000 microarrayscanner (Axon Instruments, Foster City, CA, USA) andfluorescence ratios (tumor/reference) were calculated usingGenePix software. The raw data and the image filesare available from the Stanford Microarray Database
GISTs with KIT and PDGFRA mutationsS Subramanian et al
7788
Oncogene

(http://smd.stanford.edu/ and accompanying website http://microarray-pubs.stanford.edu/tma_portal/GISTmutations/).Control and empty spots on the arrays were not included forthe analysis, as well as those spots flagged as bad spots due totechnical errors. Only cDNA spots with a ratio of signal overbackground of at least 1.8 in either the Cy3 or Cy5 channelwere included; genes with 80% good data were included andthose genes were filtered based on those where expressionlevels differed by at least four-fold in at least three arrays.Using these criteria, 1875 genes passed the filtering criteria andwere used for further analysis. Unsupervised hierarchicalclustering analysis (Eisen et al., 1998) and significance analysisof microarrays (SAM) (Tusher et al., 2001) were thenperformed as described previously (Nielsen et al., 2002).
ISH and IHC
A tissue microarray containing 127 cases of GISTs with knownmutation status was constructed as described previously (Westet al., 2004). There was one core for each tumor, and all of theGISTs on this TMA were analyzed for mutations in exons 9,11, 13 and 17 of the KIT gene using a combination ofdenaturing HPLC and direct sequencing, as previouslydescribed (Corless et al., 2002; Heinrich et al., 2003a). KITwild-type tumors included on the array were also screened formutations in exons 12 and 18 of the PDGFRA gene. ISH ofTMA sections was performed as previously described (Westet al., 2004). The primer sequences used for the amplificationof probes are for DLK1, MAP1B, and PDGFRA are given inSupplementary Table 2 (http://microarray-pubs.stanford.edu/tma_portal/GISTmutations/).We performed IHC with CD34 antibody (Becton Dickinson,
Franklin Lakes, NJ, USA) as previously described (Linn et al.,2003; West et al., 2004). The IHC data for DOG1 and KIT,and the ISH data for PDGFRA in Figure 2 were previouslypublished (West et al., 2004).
Scoring of IHC and ISH
For IHC scoring of the TMA, a score of ‘�2’ was given forabsent or insignificant staining defined as less than 5% tumorcells with staining. Data fields for unscorable cores were leftempty. A score of ‘1’ was given for hybridization signal ingreater than 5% of tumor cells or less than 50% of tumor cells.
A score of ‘2’ was given for hybridization signal in greater than50% tumor cells. Nontumor cells and cells of unknown originwere not scored. Cores scored as ‘1’ or ‘2’ were scored aspositive in Figure 2. For ISH, only a prominent dot-like stainwas counted towards the scoring. A score of ‘�2’ was given forabsent or insignificant staining defined as less than 1 dot-likestain per observed nucleus. Data fields for unscorable coreswere left empty. A score of ‘1’ was given for greater than 1 dot-like stain per tumor cell. A score of ‘2’ was given for multipledot-like stains the tumor cells. Cores scored as ‘1’ or ‘2’ werescored as positive in Figure 2. All stained cores were reviewedby two observers (MvdR, RW). To aid in the analysis ofnumerous tissue cores stained by ISH, digital images werecollected using the BLISS instrument (Bacuslabs, LombardIL; USA http://bacuslabs.com). Scoring results were com-bined using Deconvoluter and represented in Treeview (Liuet al., 2002). All 809 digital images taken for IHC and ISHexperiments are available at the accompanying website (http://microarray-pubs.stanford.edu/tma_portal/GISTmutations/).Digital images for PDGFRA, KIT (CD117), DOG1 ISH andKIT (CD117), DOG1 immunostaining were previously pub-lished (West et al., 2004) and are also available at http://microarray-pubs.stanford.edu/tma_portal/dog1/.
Western blotting
Whole-cell lysates from tumor specimens were prepared byusing lysis buffer (1% NP-40, 50mM Tris-HCl pH 8.0, 100mM
sodium fluoride, 30mM sodium pyrophosphate, 2mM sodiummolybdate, 5mM EDTA, 2mM sodium orthovanadate) con-taining protease inhibitors (10 mg/ml aprotinin, 10 ug/mlleupeptin, 1mM phenylmethylsulfonyl fluoride). Protein con-centrations were determined with Bio-Rad protein assay (Bio-Rad Laboratories Hercules, CA, USA). Electrophoresis andWestern blotting were performed as described previously(Rubin et al., 2001). The hybridization signals were detectedby chemiluminescence (ECL, Amersham Pharmacia Biotech)and were captured and quantitated using a FUJI LAS1000-plus chemiluminescence imaging system.
AcknowledgementsSS was supported by a fellowship from the Laboratory ofSurgical Pathology, Department of Pathology, StanfordUniversity Medical Center. This work was supported byNIH Grant CA85129.
References
Antonescu CR, Sommer G, Sarran L, Tschernyavsky SJ,Riedel E, Woodruff JM, Robson M, Maki R, Brennan MF,Ladanyi M, DeMatteo RP and Besmer P. (2003). Clin.Cancer Res., 9, 3329–3337.
Antonescu CR, Viale A, Sarran L, Tschernyavsky SJ, GonenM, Segal NH, Maki RG, Socci ND, DeMatteo RP andBesmer P. (2004). Clin. Cancer Res., 10, 3282–3290.
Besmer P. (1991). Curr. Opin. Cell Biol., 3, 939–946.Besmer P. (1997). Mol. Cell Biol. 2nd edn Marcel Dekker: NewYork, pp. 369–404.
Blume-Jensen P, Ronnstrand L, Gout I, Waterfield MD andHeldin CH. (1994). J. Biol. Chem., 269, 21793–21802.
Brazil DP, Park J and Hemmings BA. (2002). Cell, 111,293–303.
Breiner JA, Meis-Kindblom J, Kindblom LG, McComb E, LiuJ, Nelson M and Bridge JA. (2000). Cancer Genet.Cytogenet., 120, 111–116.
Bretscher A, Edwards K and Fehon RG. (2002). Nat. Rev.Mol. Cell. Biol., 3, 586–599.
Cantley LC. (2002). Science, 296, 1655–1657.Corless CL, McGreevey L, Haley A, Town A and HeinrichMC. (2002). Am. J. Pathol., 160, 1567–1572.
Debiec-Rychter M, Dumez H, Judson I, Wasag B, Verweij J,Brown M, Dimitrijevic S, Sciot R, Stul M, Vranck H, ScurrM, Hagemeijer A, van Glabbeke M, van Oosterom AT andEORTC Soft Tissue and Bone Sarcoma Group. (2004a).Eur. J. Cancer, 40, 689–695.
Debiec-Rychter M, Wasag B, Stul M, De Wever I, VanOosterom A, Hagemeijer A and Sciot R. (2004b). J. Pathol.,202, 430–438.
Demetri GD, von Mehren M, Blanke CD, Van den AbbeeleAD, Eisenberg B, Roberts PJ, Heinrich MC, Tuveson DA,Singer S, Janicek M, Fletcher JA, Silverman SG, SilbermanSL, Capdeville R, Kiese B, Peng B, Dimitrijevic S, Druker
GISTs with KIT and PDGFRA mutationsS Subramanian et al
7789
Oncogene
BJ, Corless C Fletcher CD and Joensuu H. (2002). N. Engl.J. Med., 347, 472–480.
Duensing A, Medeiros F, McConarty B, Joseph NE,Panigrahy D, Singer S, Fletcher CD, Demetri GD andFletcher JA. (2004). Oncogene, 23, 3999–4006.
Eisen MB, Spellman PT, Brown PO and Botstein D. (1998).Proc. Natl. Acad. Sci., USA., 95, 14863–14868.
Frodin M and Gammeltoft S. (1999). Mol. Cell. Endocrinol.,151, 65–77.
Gunawan B, Schulten HJ, von Heydebreck A, Schmidt B,Enders C, Hoer J, Langer C, Schuler P, Schindler CG,Kuhlgatz J and Fuzesi L. (2004). J. Pathol., 202, 421–429.
Hahn WC and Weinberg RA. (2002). Nat. Rev. Cancer, 2,331–341.
Heinrich MC, Corless CL, Demetri GD, Blanke CD, vonMehren M, Joensuu H, McGreevey LS, Chen CJ, Van denAbbeele AD, Druker BJ, Kiese B, Eisenberg B, Roberts PJ,Singer S, Fletcher CD, Silberman S, Dimitrijevic S andFletcher JA. (2003b). J. Clin. Oncol., 21, 4342–4349.
Heinrich MC, Corless CL, Duensing A, McGreevey L, ChenCJ, Joseph N, Singer S, Griffith DJ, Haley A, Town A,Demetri GD, Fletcher CD and Fletcher JA. (2003a).Science, 299, 708–710.
Hirota S, Isozaki K, Moriyama Y, Hashimoto K, Nishida T,Ishiguro S, Kawano K, Hanada M, Kurata A, Takeda M,Muhammad Tunio G, Matsuzawa Y, Kanakura Y, Shino-mura Y and Kitamura Y. (1998). Science, 279, 577–580.
Hirota S, Nishida T, Isozaki K, Taniguchi M, NakamuraJ, Okazaki T and Kitamura Y. (2001). J. Pathol., 193,
505–510.Hirota S, Ohashi A, Nishida T, Isozaki K, Kinoshita K,Shinomura Y and Kitamura Y. (2003). Gastroenterology,125, 660–667.
Khanna C, Wan X, Bose S, Cassaday R, Olomu O, MendozaA, Yeung C, Gorlick R, Hewitt SM and Helman LJ. (2004).Nat. Med., 10, 182–186.
Kinoshita K, Isozaki K, Hirota S, Nishida T, Chen H,Nakahara M, Nagasawa Y, Ohashi A, Shinomura Y,Kitamura Y and Matsuzawa Y. (2003). J. Gastroenterol.Hepatol., 18, 147–151.
Kohno T, Takakura S, Yamada T, Okamoto A, Tanaka T andYokota J. (1999). Cancer Res., 59, 4170–4174.
Koon N, Schneider-Stock R, Sarlomo-Rikala M, Lasota J,Smolkin M, Petroni G, Zaika A, Boltze C, Meyer F,Andersson L, Knuutila S, Miettinen M and El-Rifai W.(2004). Gut., 53, 235–240.
Linn SC, West RB, Pollack JR, Zhu S, Hernandez-BoussardT, Nielsen TO, Rubin BP, Patel R, Goldblum JR, SiegmundD, Botstein D, Brown PO, Gilks CB and van de Rijn M.(2003). Am. J. Pathol., 163, 2383–2395.
Liu CL, Prapong W, Natkunam Y, Alizadeh A, MontgomeryK, Gilks CB and van de Rijn M. (2002). Am. J. Pathol., 161,1557–1565.
Louvet-Vallee S. (2000). Biol. Cell., 92, 305–316.Lux ML, Rubin BP, Biase TL, Chen CJ, Maclure T, DemetriG, Xiao S, Singer S, Fletcher CD and Fletcher JA. (2000).Am. J. Pathol., 156, 791–795.
Nakahara M, Isozaki K, Hirota S, Miyagawa J, Hase-SawadaN, Taniguchi M, Nishida T, Kanayama S, Kitamura Y,Shinomura Y and Matsuzawa Y. (1998). Gastroenterology,115, 1090–1095.
Nielsen TO, West RB, Linn SC, Alter O, Knowling MA,O’Connell JX, Zhu S, Fero M, Sherlock G, Pollack JR,Brown PO, Botstein D and van de Rijn M. (2002). Lancet,359, 1301–1307.
Perou CM, Sorlie T, Eisen MB, van de Rijn M, Jeffrey SS,Rees CA, Pollack JR, Ross DT, Johnsen H, Akslen LA,Fluge O, Pergamenschikov A, Williams C, Zhu SX, LonningPE, Borresen-Dale AL, Brown PO and Botstein D. (2000).Nature, 406, 747–752.
Plo I, Lautier D, Casteran N, Dubreuil P, Arock M andLaurent G. (2001). Oncogene, 20, 6752–6763.
Porter AC and Vaillancourt RR. (1998). Oncogene, 17,
1343–1352.Rubin BP, Singer S, Tsao C, Duensing A, Lux ML, Ruiz R,Hibbard MK, Chen CJ, Xiao S, Tuveson DA, DemetriGD, Fletcher CD and Fletcher JA. (2001). Cancer Res., 61,
8118–8121.Sanders KM, Ordog T, Koh SD, Torihashi S and Ward SM.(1999). Neurogastroenterol. Motil., 11, 311–338.
Sato S, Fujita N and Tsuruo T. (2000). Proc. Natl. Acad. Sci.USA, 97, 10832–10837.
Schonthal AH. (2001). Cancer Lett., 170, 1–13.Silverstein AM, Barrow CA, Davis AJ and Mumby MC.(2002). Proc. Natl. Acad. Sci. USA, 99, 4221–4226.
Taylor ML and Metcalfe DD. (2000). Hematol. Oncol. Clin.N Am., 14, 517–535.
Tusher VG, Tibshirani R and Chu G. (2001). Proc. Natl. Acad.Sci. USA, 98, 5116–5121.
Tuveson DA, Willis NA, Jacks T, Griffin JD, Singer S,Fletcher CD, Fletcher JA and Demetri GD. (2001).Oncogene, 20, 5054–5058.
Wang SS, Esplin ED, Li JL, Huang L, Gazdar A, Minna J andEvans GA. (1998). Science, 282, 284–287.
West RB, Corless CL, Rubin BP, Chen X, Subramanian S,Montgomery K, Zhu S, Ball CA, Nielsen TO, Patel R,Goldblum JR, Browm PO, Heinrich MC and van de Rijn M.(2004). Am. J. Pathol., 165, 107–113.
Yu Y, Khan J, Khanna C, Helman L, Meltzer PS and MerlinoG. (2004). Nat. Med., 10, 175–181.
Supplementary Information accompanies the paper on Oncogene website (http://www.nature.com/onc)
GISTs with KIT and PDGFRA mutationsS Subramanian et al
7790
Oncogene
Copyright © 2022 FDOKUMEN