GASB 34 notes - City of San Bruno
146
-
Upload
khangminh22 -
Category
Documents
-
view
4 -
download
0
Transcript of GASB 34 notes - City of San Bruno


CITY OF SAN BRUNO, CALIFORNIA
TABLE OF CONTENTS
FOR THE YEAR ENDED JUNE 30, 2011
Page
INTRODUCTORY SECTION:
Letter of Transmittal ............................................................................................................................................ i
List of Principal Officers ................................................................................................................................. viii
Organizational Chart .......................................................................................................................................... ix
FINANCIAL SECTION:
Independent Auditor’s Report ......................................................................................................................... 1
Management’s Discussion and Analysis ......................................................................................................... 3
Basic Financial Statements:
Government-Wide Financial Statements:
Statement of Net Assets ....................................................................................................................... 16
Statement of Activities ......................................................................................................................... 17
Fund Financial Statements:
Governmental Funds:
Balance Sheet ............................................................................................................................................ 21
Reconciliation of the Governmental Funds Balance Sheet to Statement of Net Assets ............................ 23
Reconciliation of Fund Basis Balance Sheet to Statement of Net Assets…… .......................................... 24
Statement of Revenues, Expenditures and Changes in Fund Balances ..................................................... 25
Reconciliation of the Governmental Funds Statement of Revenues, Expenditures,
and Changes in Fund Balances to the Government-wide Statements of Activities………….. ........... 27
Reconciliation of the Fund Basis Statements to Government-wide Statement of Activities ..................... 28
Proprietary Funds:
Statement of Net Assets ............................................................................................................................. 29
Statement of Revenues, Expenses, and Changes in Net Assets ................................................................ 31
Statement of Cash Flows ........................................................................................................................... 33
Fiduciary Funds:
Statement of Assets and Liabilities ............................................................................................................ 35
Notes to Basic Financial Statements.............................................................................................................. 38
Required Supplementary Information:
Schedule of Revenues, Expenditures and Changes in Fund Balances - Budget and Actual:
General Fund ........................................................................................................................................ 73
Redevelopment Special Revenue Fund………………………. ........................................................... 74
Measure A…………………..………. ................................................................................................. 75
Notes to Required Supplementary Information ................................................................................... 76

CITY OF SAN BRUNO, CALIFORNIA
TABLE OF CONTENTS
FOR THE YEAR ENDED JUNE 30, 2011
Page
Combining and Individual Fund Statements and Schedules:
Schedule of Revenues, Expenditures and Changes in Fund – Budget to Actual
Major Fund – Redevelopment Capital Projects Fund .......................................................................... 78
Major Fund – Redevelopment Debt Service Fund .............................................................................. 79
Major Fund – Street Improvements Capital Projects Fund ................................................................. 80
Combining Balance Sheet – Nonmajor Governmental Funds .................................................................... 81
Combining Statement of Revenues, Expenditures and Changes
in Fund Balances – Nonmajor Governmental Funds ........................................................................... 85
Schedule of Revenues, Expenditures, and Changes in Fund Balances - Budget and Actual:
In-lieu ................................................................................................................................................... 89
Agency on Aging ................................................................................................................................. 90
Federal and State Special Revenue Fund ............................................................................................. 91
Gas Tax ................................................................................................................................................ 92
Library .................................................................................................................................................. 93
Police Asset Seizure ............................................................................................................................. 94
Safety Augmentation ............................................................................................................................ 95
Police .................................................................................................................................................... 96
SB322 Recycling/Litter Clean-up ........................................................................................................ 97
Restricted Donations ............................................................................................................................ 98
Streets ................................................................................................................................................... 99
Traffic Safety ..................................................................................................................................... 100
Emergency Disaster Fund .................................................................................................................. 101
Capital Projects Fund – General ........................................................................................................ 102
Debt Service Fund – General ............................................................................................................. 103
Combining Statement of Fund Net Assets – Internal Service Funds ....................................................... 105
Combining Statement of Revenues, Expenses, and Changes in
Fund Net Assets – Internal Service Funds ......................................................................................... 107
Combining Statement of Cash Flows – Internal Service Funds ............................................................... 109
Combining Statement of Assets and Liabilities – Fiduciary Funds ......................................................... 111
Combining Statement of Changes in Assets and Liabilities – Fiduciary Funds ...................................... 112
STATISTICAL SECTION:
Net Assets by Component ....................................................................................................................... 115
Changes in Net Assets ............................................................................................................................ 116
Fund Balances, Governmental Funds ...................................................................................................... 118
Changes in Fund Balances, Governmental Funds ................................................................................... 119
Assessed Value and Actual Value of Taxable Property .......................................................................... 120
Direct and Overlapping Tax Rates ........................................................................................................... 121
Principal Property Taxpayers ................................................................................................................... 122
Schedule of Top 40 Retail Businesses .................................................................................................... 123
Property Tax Levies and Collection ........................................................................................................ 124

CITY OF SAN BRUNO, CALIFORNIA
TABLE OF CONTENTS
FOR THE YEAR ENDED JUNE 30, 2011
Page
Ratios of Outstanding Debt by Type ....................................................................................................... 125
Overlapping Debt ..................................................................................................................................... 126
Legal Debt Margin Information .............................................................................................................. 127
Pledged Revenue Coverage ..................................................................................................................... 128
Demographic and Economic Statistics .................................................................................................... 129
Principal Employers ................................................................................................................................ 130
Full-time Equivalent City Employees by Function/Program .................................................................. 131
Capital Asset Statistics by Function/Program ......................................................................................... 132

CITY OF SAN BRUNO
FINANCE DEPARTMENT
567 El Camino Real, San Bruno, CA 94066-4299
Voice: (650) 616-7080 Fax: (650) 876-0256 http://sanbruno.ca.gov
December 22, 2011 Honorable Mayor and Members of the City Council City of San Bruno San Bruno, CA 94066 Dear Mayor and Members of the City Council: The Comprehensive Annual Financial Report (CAFR) for the City of San Bruno (the City) for the fiscal year ended June 30, 2011 is hereby submitted. The financial statements have been prepared by the City’s Finance Department in accordance with generally accepted accounting principles for local governments as prescribed by the Governmental Accounting Standards Board (GASB). The accuracy of the data and completeness of the presentation including all disclosures rests with the City. The City believes the data is accurate in all material respects and is presented in a manner fairly setting forth the City’s financial position, results of operations, and cash flows of the various funds and account groups. Further, the City believes that all disclosures have been included that are necessary for a reader to understand the City’s financial condition. The CAFR is presented in three sections: the Introductory Section, the Financial Section, and the Statistical Section. Each of these sections is made up of a number of elements.
1. Introductory Section – This section includes this transmittal letter that highlights significant aspects of the City’s financial operations during the year and the financial condition of the City as of June 30, 2011. This section also includes a list of principal officials and an organization chart.
2. Financial Section – This section includes the independent auditors’ report, Management’s Discussion and Analysis (MD&A) of the fiscal year, the basic financial statement and notes that explain the City’s financial position and operating results, and supplementary statements, schedules, and notes that provide additional detailed information relative to the basic financial statements. This transmittal letter, read in conjunction with the MD&A, assists readers in assessing the City’s financial condition.
3. Statistical Section – This section includes pertinent financial and non-financial statistical data that presents various economic, social, and demographic trends and other information about the City for the past ten years.

Honorable Mayor and members of the City Council - Comprehensive Annual Financial Report, Fiscal
Year Ended June 30, 2011
December 22, 2011
Page ii of ix
REPORTING ENTITY
The CAFR for the year ended June 30, 2011 covers the activities, organizational
elements, and functions that the City’s elected officials have the ability to control. The City’s CAFR presents financial information on actions by which the City Council has the ability to impose its will and on the component unit that provides a financial benefit or creates a financial burden. A component unit is reported either as blended because of this imposition of will and general oversight or one that is discrete and operates somewhat separately from the City.
Imposition of its will is derived from the City’s power and influence, including but is not limited to:
1. Ability to modify or approve budgets, 2. Appointment of a voting majority of other governing authorities, 3. Identification of management, 4. Ability to significantly influence operations, and 5. Ability to modify, veto, or overrule decisions.
The City’s blended component unit includes the operations of the San Bruno Redevelopment Agency. Component Unit Financial Statements and an accompanying Independent Auditors’ Report for the San Bruno Redevelopment Agency were prepared for the year ended June 30, 2011.
CITY AND ECONOMIC BACKGROUND
The City of San Bruno is located in the San Francisco Bay Area, in the northern area of San Mateo County. It is located twelve miles south of San Francisco and adjacent to the San Francisco International Airport. Strategically located along Highway 101 and Interstate 280, the City enjoys easy access to the vast cultural, educational, and recreational opportunities of the San Francisco Bay Area.
The City’s general economic outlook is closely tied to the Bay Area region and the country as a whole. Although there has been a modest improvement in the economy that has resulted in gains in sales tax, business tax, and transient occupancy tax revenues, property tax revenues remain flat as sales activity and valuations for the housing market continue to be weak. As a result, the City continues the structural changes implemented in previous years, including the elimination of staff positions and consolidation of operating departments, implementation of shared service delivery with other agencies, and strengthening of budget management policies and practices to contain and control costs. In addition, proposed state takeaways continue to threaten the City’s finances with the Governor’s proposed legislation (subject to the California Supreme Court stay in August and expected ruling in January) to eliminate redevelopment agencies as a method to assist the State in addressing its ongoing structural budget deficit problem.

Honorable Mayor and members of the City Council - Comprehensive Annual Financial Report, Fiscal
Year Ended June 30, 2011
December 22, 2011
Page iii of ix
SIGNIFICANT INITIATIVES
The event that most significantly affected all aspects of the City's operation in 2010-11 has been the response to, and the aftermath from, the devastating September 9, 2010 Pacific Gas and Electric Company (PG&E) natural gas transmission pipeline explosion and the resulting fire in the San Bruno community. The incident caused the death of eight persons, injured over 60 more, destroyed 38 homes, damaged dozens more, and physically decimated a once quiet and peaceful neighborhood. Despite the devastation that this incident created, the community has emerged with the strength and determination to rebuild, recover, and restore its identity and purpose. The City’s response during the past year included the following activities:
Quickly established emergency management functions and directed the emergency response for the deadly September 9th pipeline explosion and resulting fire in the Glenview neighborhood through activation of all sections of the City's Emergency Operations Center (EOC) according to the National Incident Management System (NIMS) protocols.
Through the Public Safety Incident Command, coordinated and directed the work of a small army of mutual aid first responders who arrived the night of September 9th and in the days immediately following to fight the fire, evacuated residents, conducted search, rescue and recovery operations, provided security, and assisted residents to access their properties.
Within hours of the initial explosion and fire, established an overnight shelter/evacuation and resource center, and 24-hour telephone hotline for residents affected by the neighborhood evacuation.
Established and continues to provide one-to-one liaison services to Glenview area residents through a team of 15 City staff persons, who in addition to their normal duties, are assigned to assist the 55 families whose homes were demolished or seriously damaged.
Coordinated and hosted five Town Hall meetings and two social gatherings to maintain communications and coordination with Glenview fire victims and the community at large.
Implemented a streamlined and expedited planning and building permit review process and waived building and planning permit fees to assist families to meet their objectives to rebuild homes destroyed by the Glenview fire.
Actively participated in and monitored the National Transportation and Safety Board (NTSB) investigation into the cause of the pipeline explosion and the California Public Utilities Commission (CPUC) investigation and rule-making proceedings.

Honorable Mayor and members of the City Council - Comprehensive Annual Financial Report, Fiscal
Year Ended June 30, 2011
December 22, 2011
Page iv of ix
Notwithstanding, the City continued work in a number of important initiatives that are significant in maintaining the community’s quality of life and economic vitality. They include:
Completed the draft Downtown and Transit Corridors Plan that describes the design and type of development that should be encouraged in the downtown and in the San Bruno Avenue and EI Camino corridors.
Initiated preparation of the Environmental Impact Report on the Transit Corridors Plan.
Implemented first direct sales campaign and special marketing programs designed to bring subscribers back to San Bruno Cable.
Completed American with Disabilities Act (ADA) improvements at the Library, including upgrading the public restroom and installing a wheelchair lift to the mezzanine level.
Completed construction of the Crossing/San Bruno retail project and opened Jack's Restaurant, a casual fine dining establishment with private dining/banquet space.
Broke ground for construction of the San Bruno Caltrain Grade Separation project in October and initiated the two-year construction process with regular oversight and coordination between the City and CalTrain.
In coordination with the Chamber of Commerce, provided a full year of the weekly Farmer's Market bringing farm fresh produce to downtown San Bruno during the late spring and summer months.
Conducted continued Emergency Preparedness training and debrief of Glenview Fire emergency operations with staff from all departments.
Continued analysis and conducted subcommittee review of the process towards consolidation of Fire Departments among the Cities of San Bruno, Millbrae, Burlingame, and the Town of Hillsborough.
Resurfaced the San Bruno Park Swimming Pool to help extend its life.
Continued a shared Police Chief relationship with the City of Millbrae and completed analysis of the potential to consolidate Police Departments between the two cities.
Completed open space vegetation and tree maintenance in several key areas of the community to address hazard conditions.
Completed recruitment and selection of a new City Attorney and welcomed him to City service.

Honorable Mayor and members of the City Council - Comprehensive Annual Financial Report, Fiscal
Year Ended June 30, 2011
December 22, 2011
Page v of ix
Welcomed a delegation of 29 representatives from Sister City Narita, Japan and hosted a weeklong celebration of the 20th anniversary of the San Bruno - Narita Sister City relationship.
Established agreements between the City and the San Bruno Redevelopment Agency for completion of redevelopment projects in an effort to protect redevelopment revenues in the face of the Governor's proposal to eliminate redevelopment as a State budget strategy.
Continued delivery of a vibrant and diverse program of activities for older adults delivered through the San Bruno Senior Center.
Completed traffic calming improvements at the intersection of DeSoto and Santa Lucia.
Initiated San Bruno Cable's Business Services providing broadband and telephone services to businesses in San Bruno
FINANCIAL INFORMATION
Accounting and Budgetary Control
The City’s accounting records are maintained on a modified accrual basis of accounting for all governmental fund types and agency funds. Under this basis, revenues are recognized when susceptible to accrual, i.e., both measurable and available and expenditures are recorded when paid, and recognized when the liability is expected to be liquidated with expendable, available resources. The full accrual basis of accounting is used for the City’s proprietary fund types that recognize revenues when earned and expenses when incurred. In developing the City’s accounting system, consideration was given to the adequacy of the internal accounting controls. Such controls are designed to provide reasonable, although not absolute assurance regarding the safeguarding of assets against loss from unauthorized use or disposition and the reliability of financial records used for preparing financial statements and maintaining accountability of assets. The concept of reasonable assurance recognizes that the costs of a control should not exceed the benefits likely to be derived and that the evaluation of costs and benefits requires estimates and judgments by management. The City’s internal accounting controls adequately safeguard assets and reasonably assure the proper accounting of financial transactions. The City’s budgets (General Fund, Special Operating Funds, Enterprise Funds, Internal Service Funds, and Capital Improvement Program) are detailed operating plans that identify estimated costs and results in relation to estimated revenues. The budgets represent processes through which policy decisions are made, implemented, and controlled.
Honorable Mayor and members of the City Council - Comprehensive Annual Financial Report, Fiscal
Year Ended June 30, 2011
December 22, 2011
Page vi of ix
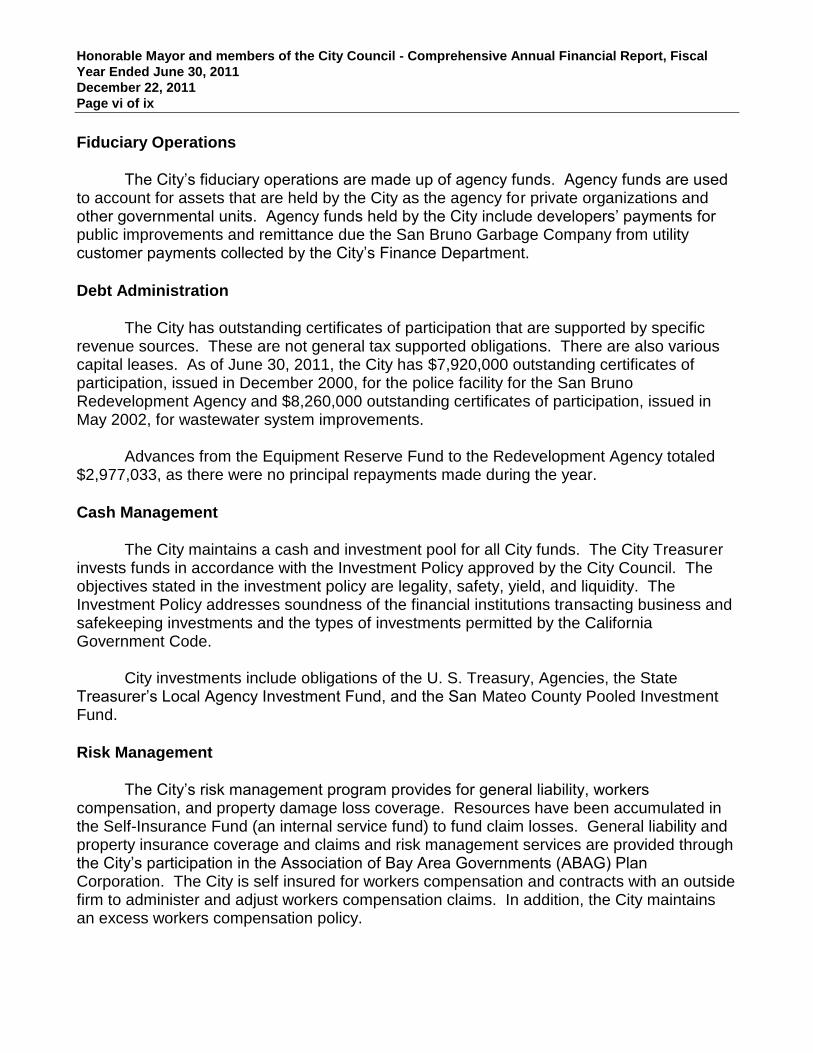
Fiduciary Operations
The City’s fiduciary operations are made up of agency funds. Agency funds are used
to account for assets that are held by the City as the agency for private organizations and other governmental units. Agency funds held by the City include developers’ payments for public improvements and remittance due the San Bruno Garbage Company from utility customer payments collected by the City’s Finance Department.
Debt Administration
The City has outstanding certificates of participation that are supported by specific
revenue sources. These are not general tax supported obligations. There are also various capital leases. As of June 30, 2011, the City has $7,920,000 outstanding certificates of participation, issued in December 2000, for the police facility for the San Bruno Redevelopment Agency and $8,260,000 outstanding certificates of participation, issued in May 2002, for wastewater system improvements.
Advances from the Equipment Reserve Fund to the Redevelopment Agency totaled
$2,977,033, as there were no principal repayments made during the year.
Cash Management
The City maintains a cash and investment pool for all City funds. The City Treasurer invests funds in accordance with the Investment Policy approved by the City Council. The objectives stated in the investment policy are legality, safety, yield, and liquidity. The Investment Policy addresses soundness of the financial institutions transacting business and safekeeping investments and the types of investments permitted by the California Government Code. City investments include obligations of the U. S. Treasury, Agencies, the State Treasurer’s Local Agency Investment Fund, and the San Mateo County Pooled Investment Fund.
Risk Management
The City’s risk management program provides for general liability, workers compensation, and property damage loss coverage. Resources have been accumulated in the Self-Insurance Fund (an internal service fund) to fund claim losses. General liability and property insurance coverage and claims and risk management services are provided through the City’s participation in the Association of Bay Area Governments (ABAG) Plan Corporation. The City is self insured for workers compensation and contracts with an outside firm to administer and adjust workers compensation claims. In addition, the City maintains an excess workers compensation policy.

Honorable Mayor and members of the City Council - Comprehensive Annual Financial Report, Fiscal
Year Ended June 30, 2011
December 22, 2011
Page vii of ix
INDEPENDENT AUDIT
The City’s Municipal Code requires an annual audit of the financial records by an independent audit firm selected by the City Council. The general-purpose financial statements for the year ended June 30, 2011 have been audited by Vavrinek, Trine, Day & Co., LLP. The firm’s opinion is included in the financial section of this report.
ACKNOWLEDGEMENTS
This audit report was prepared in conformance with the requirements for a Comprehensive Annual Finance Report. Enhancing the City’s overall financial reporting, in this instance going beyond basic audited financial statements, is an acknowledged objective for the Finance Department. I would like to express my appreciation for the collective team effort of the Finance staff that was necessary for the preparation of the Comprehensive Annual Financial Report (CAFR). Staff’s diligent work resulted in the City’s receipt of its first Government Finance Officers Association (GFOA) Award of Excellence in Financial Reporting for its CAFR for the fiscal year ending June 30, 2010. I would like to thank the City Council for their interest and policy oversight on the various fiscal issues addressed during the year. In addition, the City Manager and the City’s Department Heads should be acknowledged for their continued attention to planning and conducting the City financial operations in a responsible and progressive manner. Finally, I thank Vavrinek, Trine, Day & Co., LLP for their work in conducting the audit. Respectfully submitted,
Kim Juran Assistant Finance Director

Honorable Mayor and members of the City Council - Comprehensive Annual Financial Report, Fiscal
Year Ended June 30, 2011
December 22, 2011
Page viii of ix
CITY OF SAN BRUNO CITY COUNCIL
Jim Ruane, Mayor
Rico E. Medina, Vice Mayor
Ken Ibarra
Irene O’Connell
Michael Salazar
CITY MANAGER
Connie Jackson

Honorable Mayor and members of the City Council - Comprehensive Annual Financial Report, Fiscal
Year Ended June 30, 2011
December 22, 2011
Page ix of ix

1
INDEPENDENT AUDITOR’S REPORT
To the Honorable Mayor and Members of the City Council
of the City of San Bruno
San Bruno, California
We have audited the accompanying financial statements of the governmental activities, the business type
activities, each major fund, and the aggregate remaining fund information of the City of San Bruno, as of and
for the year ended June 30, 2011, which collectively comprise the City of San Bruno’s basic financial
statements as listed in the table of contents. These financial statements are the responsibility of the City of San
Bruno’s management. Our responsibility is to express opinions on these financial statements based on our
audit.
We conducted our audit in accordance with auditing standards generally accepted in the United States of
America and the standards applicable to financial audits contained in Government Auditing Standards, issued
by the Comptroller General of the United States. Those standards require that we plan and perform the audit to
obtain reasonable assurance about whether the financial statements are free of material misstatement. An audit
includes examining, on a test basis, evidence supporting the amounts and disclosures in the financial
statements. An audit also includes assessing the accounting principles used and significant estimates made by
management, as well as evaluating the overall financial statement presentation. We believe that our audit
provides a reasonable basis for our opinions.
In our opinion based on our audit, the financial statements referred to above present fairly, in all material
respects, the respective financial position of the governmental activities, the business-type activities, each major
fund, and the aggregate remaining fund information of the City of San Bruno as of June 30, 2011, and the
respective changes in financial position and cash flows, where applicable, thereof for the year then ended in
conformity with accounting principles generally accepted in the United States of America.
The financial statements as of June 30, 2010, were audited by other auditors whose report, dated December 15,
2010, expressed an unqualified opinion on those statements. The comparative data for the fiscal year ended
June 30, 2010, presented as additional analytical data, is derived from the audited financial statements for the
year ended June 30, 2010.
As described in Note 1 to the financial statements, City of San Bruno adopted the provisions of GASB
Statement No. 54, Fund Balance Reporting and Governmental Fund Type Definitions, in the fiscal year ended
June 30, 2011.

2
In accordance with Government Auditing Standards, we have also issued a report dated December 22, 2011, on
our consideration of the City of San Bruno’s internal control over financial reporting and our tests of its
compliance with certain provisions of laws, regulations, contracts, and grants. The purpose of that report is to
describe the scope of our testing of internal control over financial reporting and compliance and the results of
that testing, and not to provide an opinion on the internal control over financial reporting or on compliance. The
report is an integral part of an audit preformed in accordance with Government Auditing Standards and should
be read in conjunction with this report in considering the results of our audit.
Management’s Discussion and Analysis and the Required Supplementary Information are not a required part of
the basic financial statements but are supplementary information required by accounting principles generally
accepted in the United States of America. We have applied certain limited procedures, which consisted
principally on inquires of management regarding the methods of measurement and presentation of the required
supplementary information. However, we did not audit the information and express no opinion on it.
Our audit was conducted for the purpose of forming opinions on the financial statements that collectively
comprise the basic financial statements. The supplementary information listed in the Table of Contents is
presented for purposes of additional analysis and is not a required part of the basic statements of the City of San
Bruno. This information has been subjected to the auditing procedures applied in the audit of the basic
financial statements and, in our opinion, is fairly stated in all material respects in relation to the basic financial
statements taken as whole.
The introductory section and statistical section have not been subjected to the auditing procedures applied in the
audit of the basic financial statements and, accordingly, we express no opinion on them.
Palo Alto, California
December 22, 2011

CITY OF SAN BRUNO, CALIFORNIA
MANAGEMENT’S DISCUSSION AND ANALYSIS
FOR THE YEAR ENDED JUNE 30, 2011
3
The Management’s Discussion and Analysis (MD&A) provides an overview of the City of San Bruno’s
activities and financial performance for the fiscal year ended June 30, 2011. To obtain a complete picture of
the City’s financial condition, this document should be read in conjunction with the accompanying Transmittal
Letter and Basic Financial Statements.
Financial Highlights
The City’s government-wide net assets increased by $4.58 million during 2010-11, bringing the total
net assets to $105.24 million. The 2010-11 increase in net assets marks the eighth straight year that the
City has seen positive growth of net assets. Of government-wide net assets, $67.69 million is invested
in capital assets, $16.1 million is restricted for specific use, and the balance of $21.4 million is
unrestricted for the City’s operations and capital investments.
The City’s General Fund fund balance increased by $1.57 million bringing the total to $9.82 million.
This increase is primarily the result of one-time revenues including excess ERAF tax received from the
County and an improvement in the City’s operations and capital improvements.
The City’s Governmental activities expenses were $48.6 million, representing a modest 3.2% increase
over 2009-10. This was offset by charges for services of $7.2 million and Operating and Capital
Contributions and Grants of $11.3 million for a net cost to general revenues (taxes and investment
income) of $30.0 million. General governmental activities revenues totaled $32.6 million for a gain
(revenues greater than expenses) of $2.4 million.
The September 9, 2010 Pacific Gas and Electric gas transmission pipeline explosion and resulting fire
in San Bruno required the City to make expenditures outside of the City Council adopted operating
budget. To ensure that all expenditures related to the incident were segregated, a new Emergency
Disaster Fund was created and all expenses were charged to this fund. The City continues to seek
reimbursement for its costs and as of June 30, 2011 had an outstanding receivable of $1.7 million
related to expenses not yet reimbursed, but anticipated to be fully recovered.
Business-type activities expenses of $28.8 million were offset by charges for services totaling $30.8
million. Combined with non-program revenues totaling $.2 million, Net Assets increased by $2.2
million.
Overview of Financial Statements
This discussion and analysis is intended to serve as an introduction to the City of San Bruno’s basic financial
statements. The City of San Bruno’s basic financial statements comprise three components: 1) government-
wide financial statements, 2) fund financial statements, and 3) notes to the financial statements. This report
also contains other supplementary information in addition to the basic financial statements themselves.
Government-wide financial statements present the financial picture of the City from the economic resources
measurement focus using the accrual basis of accounting similar to a private-sector business.
The statement of net assets presents information on all of the City of San Bruno’s assets and liabilities, with the
difference between the two reported as net assets. Over time, increases or decreases in net assets may serve as a
useful indicator of whether the financial position of the City of San Bruno is improving or deteriorating.
The statement of activities presents information showing how the City’s net assets changed during the most
recent fiscal year. All changes in net assets are reported as soon as the underlying event giving rise to the
change occurs, regardless of the timing of the related cash flows. Thus, revenues and expenses are reported in
this statement for some items that will only result in cash flows in future fiscal periods (e.g., uncollected taxes
and earned but unused vacation leave).

CITY OF SAN BRUNO, CALIFORNIA
MANAGEMENT’S DISCUSSION AND ANALYSIS
FOR THE YEAR ENDED JUNE 30, 2011
4
Both of the government-wide financial statements distinguish functions of the City of San Bruno that are
principally supported by taxes and intergovernmental revenues (governmental activities) from other functions
that are intended to recover all or a significant portion of their costs through user fees and charges (business-
type activities). The governmental activities of the City of San Bruno consist of general government, public
safety, public works, highways and streets, parks and recreation, library and community development. The
business-type activities of the City of San Bruno include Water, Stormwater, Wastewater and Cable Television.
The government-wide financial statements include not only the City of San Bruno itself (known as the primary
government), but also the Redevelopment Agency of San Bruno, a legally separate entity, whose operations are
totally integrated with the legislative, legal, administrative, finance and public works engineering and
maintenance functions of the City of San Bruno, and therefore has been included as an integral part of the
primary government.
The government-wide financial statements can be found on pages 16 and 17 of this report.
Fund financial statements. A fund is a grouping of related accounts that is used to maintain control over
resources that have been segregated for specific activities or objectives. The City of San Bruno, like other state
and local governments, uses fund accounting to ensure and demonstrate compliance with finance-related legal
requirements. All of the funds of the City of San Bruno can be divided into three categories: governmental
funds, proprietary funds and fiduciary funds.
Governmental funds. Governmental funds are used to account for essentially the same functions reported as
governmental activities in the government-wide financial statements. However, unlike the government-wide
financial statements, governmental fund financial statements focus on near-term inflows and outflows of
spendable resources, as well as on balances of spendable resources available at the end of the fiscal year. Such
information may be useful in evaluating the City’s near-term financing requirements.
Because the focus of governmental funds is narrower than that of the government-wide financial statements, it
is useful to compare the information presented for governmental funds with similar information presented for
governmental activities in the government-wide financial statements. By doing so, readers may better
understand the long-term impact of the City’s near-term financing decisions. Both the governmental fund
balance sheet and the governmental fund statement of revenues, expenditures and changes in fund balances
provide a reconciliation to facilitate this comparison between governmental funds and governmental activities.
The City of San Bruno maintains nineteen individual governmental funds. Information is presented separately
in the governmental fund balance sheet and in the governmental fund statement of revenues, expenditures and
changes in fund balances for the General Fund, Redevelopment Agency, Measure A Transportation Tax and
the Street Improvement Capital Projects Fund, all of which are considered to be major funds. Data from the
other thirteen governmental funds are combined into a single, aggregated presentation. Individual fund data for
each of these non-major governmental funds is provided in the form of combining statements elsewhere in this
report.
The City of San Bruno adopts an annual appropriated budget for its general fund and most governmental funds.
A budgetary comparison statement has been provided for all major and non-major funds (where budgets are
adopted) in Governmental Activities to demonstrate compliance with this budget.
The basic governmental fund financial statements can be found on page 20 of this report.

CITY OF SAN BRUNO, CALIFORNIA
MANAGEMENT’S DISCUSSION AND ANALYSIS
FOR THE YEAR ENDED JUNE 30, 2011
5
Proprietary funds. The City of San Bruno maintains two different types of proprietary funds. Enterprise funds
are used to report the same functions presented as business-type activities in the government-wide financial
statements. The City uses enterprise funds to account for Water, Stormwater, Wastewater and Cable
Television.
Internal service funds are an accounting device used to accumulate and allocate costs internally among the
City’s various functions. The City uses internal service funds to account for its central garage, self-insurance,
general equipment reserve, technology development, and facilities maintenance activities. Because these
services predominately benefit governmental rather than business-type functions, it has been included within
governmental activities in the government-wide financial statements.
Proprietary funds provide the same type of information as the government-wide financial statements, only in
more detail. The proprietary fund financial statements provide separate information for all of the City’s
proprietary funds as they are all considered to be major funds by the City. Conversely, the internal service fund
is combined into a single, aggregated presentation in the proprietary financial statements. More detailed
information for the internal service funds is provided in the form of combining statements elsewhere in the
report.
The basic proprietary fund financial statements can be found on page 28 of this report.
Fiduciary funds. Agency Funds are fiduciary funds that account for assets held by the City in a purely
custodial capacity. The reporting entity includes two agency funds, the Project Development Fund and the San
Bruno Garbage Company Fund. Since agency funds are custodial in nature, (i.e. assets equal liabilities) they
do not involve the measurement of results of operations. For this reason, Fiduciary funds are not reflected in
the government-wide financial statements.
The basic fiduciary fund financial statements can be found on page 34 of this report.
Notes to the Basic Financial Statements. The notes provide additional information that is essential to a full
understanding of the data provided in the government-wide and fund financial statements. The notes to the
basic financial statements can be found on page 37 of this report.
Other information. In addition to the basic financial statements and accompanying notes, this report also
presents certain required supplementary information concerning the City’s progress in funding its obligation to
provide pension benefits to its employees. Required supplementary information can be found on page 72 of this
report.
The combining statements referred to earlier in connection with non-major governmental funds and internal
service and fiduciary funds are presented immediately following the required supplementary information on
pensions. Combining and individual fund statements and schedules can be found on page 77 of this report.

CITY OF SAN BRUNO, CALIFORNIA
MANAGEMENT’S DISCUSSION AND ANALYSIS
FOR THE YEAR ENDED JUNE 30, 2011
6
Government-wide Financial Analysis
As noted earlier, net assets may serve over time as a useful indicator of the City’s financial position. In the case
of the City, assets exceeded liabilities by $105.2 million at the close of fiscal year 2010-11. By far the largest
portion of the City’s net assets (64.3%) reflects its investment in capital assets (e.g., land, infrastructure,
buildings, machinery, equipment, and vehicles) and, if applicable, less any related debt used to acquire those
assets that are still outstanding. The City uses these capital assets to provide services to its citizens;
consequently, these assets are not available for future spending. Although the City’s investment in its capital
assets is reported net of related debt, it should be noted that the resources needed to repay this debt must be
provided from other sources, since the capital assets themselves cannot be used to liquidate these liabilities.
2011 2010 2011 2010 2011 2010
Current and other assets: 38,135,639$ 32,148,397$ 19,945,656$ 18,493,552$ 58,081,295$ 50,641,949$ Noncurrent assets: 45,832,978 47,582,870 53,058,473 53,731,241 98,891,451 101,314,111
Total assets 83,968,617 79,731,267 73,004,129 72,224,793 156,972,746 151,956,060
Current liabilities: 8,047,309 7,058,046 5,639,977 3,345,608 13,687,286 10,403,654Noncurrent liabilities: 17,440,678 16,583,733 20,608,443 24,310,604 38,049,121 40,894,337
Total liabilities 25,487,987 23,641,779 26,248,420 27,656,212 51,736,407 51,297,991
Net Assets:Invested in capital assets, net of related debt 36,981,386 38,157,248 30,706,799 29,617,094 67,688,185 67,774,342Restricted 16,116,900 11,757,369 - - 16,116,900 11,757,369Unrestricted 5,382,344 6,174,871 16,048,910 14,951,487 21,431,254 21,126,358
Total net assets 58,480,630$ 56,089,488$ 46,755,709$ 44,568,581$ 105,236,339$ 100,658,069$
Totals
Governmental
Activities
Business-Type
Activities
City of San Bruno's Net Assets
An additional portion of the City’s net assets ($16.1 million or 15.3 percent of Net Assets) represents resources
that are subject to external restrictions on how they may be used. The remaining balance in unrestricted net
assets of $21.4 million will be used to meet the City’s ongoing obligations to citizens and creditors as funded
through current revenues.
At the end of fiscal year 2010-11, the City reported a positive balance in governmental net assets and positive
balances in the other two categories of net assets for the government as a whole in both governmental and
business-type activities. An increase in sales tax and transient occupancy tax revenue along with excess ERAF
tax contributed for the increase in the governmental activities, while rate increases in the water and wastewater
enterprises for recovery of future capital expenditures were primary contributors to the increase in net assets
for business activities by $2.2 million.

CITY OF SAN BRUNO, CALIFORNIA
MANAGEMENT’S DISCUSSION AND ANALYSIS
FOR THE YEAR ENDED JUNE 30, 2011
7
2011 2010 2011 2010 2011 2010
Revenues
Change for services 7.2$ 7.6$ 30.8$ 29.2$ 14.8$ 38.4$
Operating contributions and grants 11.2 5.7 - - 11.2 5.7
Capital contributions and grants 0.1 0.8 - - 0.1 0.8
Property taxes 5.0 6.6 - - 5.0 6.6
Incremental property taxes 8.9 9.3 - - 8.9 9.3
Transient occupancy taxes 1.8 1.3 - - 1.8 1.3
Franchise taxes 1.9 1.8 - - 1.9 1.8
Sales taxes 6.5 5.4 - - 6.5 5.4
Cardroom taxes 1.5 1.5 - - 1.5 1.5
Other taxes 1.7 1.5 - - 1.7 1.5
State motor vehicle in-lieu tax,
including subvention 3.4 3.4 - - 3.4 3.4
Use of money and property 1.9 2.2 0.1 0.1 2.0 2.3
Total Revenue 51.1 47.1 30.9 29.3 58.8 78.0
Expenses
General government 11.0 5.8 - - 11.0 5.8
Public safety 19.3 19.6 - - 19.3 19.6
Public works 0.9 0.9 - - 0.9 0.9
Highways and streets 3.4 4.8 - - 3.4 4.8
Parks and recreation 4.2 4.4 - - 4.2 4.4
Library 1.7 1.7 - - 1.7 1.7
Community development 7.5 9.2 - - 7.5 9.2
Interest expense 0.6 0.7 - - 0.6 0.7
Water - - 7.4 6.9 7.4 6.9
Stormwater - - 0.4 0.4 0.4 0.4
Wastewater - - 9.4 7.9 9.4 7.9
Cable Television - - 11.6 11.5 11.6 11.5
Total expenses 48.6 47.1 28.8 26.7 77.4 73.8
Increase (Decrease) in Net assets,
before transfers 2.5 - 2.1 2.6 4.6 2.6
Transfers (0.1) (0.1) 0.1 0.1 - -
Increase (Decrease) in Net Assets 2.4 (0.1) 2.2 2.7 4.6 2.6
Beginning Net Assets 56.1 56.2 44.6 41.9 100.7 98.1
Ending Net Assets 58.5$ 56.1$ 46.8$ 44.6$ 105.3$ 100.7$
Activities
Governmental Business-Type
Activities Totals
Changes in Net Assets
For the years ending June 30,
($ in millions)

CITY OF SAN BRUNO, CALIFORNIA
MANAGEMENT’S DISCUSSION AND ANALYSIS
FOR THE YEAR ENDED JUNE 30, 2011
8
Governmental Activities The cost of all Governmental activities this year was $48.6 million. However, as shown in the Statement of
Activities, the amount that our taxpayers ultimately financed for these activities through City property taxes
was only $30.0 million because some of the cost was paid by those who directly benefited from the programs
($7.2 million) or by other governments and organizations that subsidized certain programs with grants and
contributions ($11.2 million) for operations and ($.08 million) for capital. The City paid for the remaining
“public benefit” portion of governmental activities with $32.6 million in other general revenues (some of which
could only be used for certain programs), net of transfers.
Available net assets are those amounts not subject to restriction in the current period, typically classified as
fund balance. These amounts are converted to net assets by adding long-term assets and subtracting long-term
liabilities. A graphic illustration of this conversion is as follows:
Nonspendable , 2.8%
Restricted, 68.9%
Assigned, 0.5%
Unassigned, 27.8%
Fund Balance

CITY OF SAN BRUNO, CALIFORNIA
MANAGEMENT’S DISCUSSION AND ANALYSIS
FOR THE YEAR ENDED JUNE 30, 2011
9
Investments in Capital Assets, Net of Related
Debt, 63%
Restricted , 28%
Unrestricted, 9%
Net Assets

CITY OF SAN BRUNO, CALIFORNIA
MANAGEMENT’S DISCUSSION AND ANALYSIS
FOR THE YEAR ENDED JUNE 30, 2011
10
Total resources available during the year to finance governmental operations were $51.0 million. This
consisted of $18.5 million in program revenues, $32.4 million in general revenues net of transfers. Total
governmental activities operating expenses during the year were $48.6 million. Thus, net assets at July 1 2010
of $56.1 million were increased by $2.4 million to $58.5 million by June 30, 2011.
The City’s programs include: general government, public safety, public works, highway and streets, parks and
recreation, library, and community development. Each program’s net cost (total cost less revenues generated
by the activities) is presented below. The net cost shows the financial burden that was placed on the City’s
taxpayers by each of these functions.
2011 2010 2011 2010 2011 2010
Governmental activities:
General government 10,884,365$ 4,899,646$ 10,962,945$ 5,757,945$ (78,580)$ (858,299)$
Public safety 2,141,690 1,989,354 19,335,496 19,593,501 (17,193,806) (17,604,147)
Public works 305,619 119,108 888,426 862,049 (582,807) (742,941)
Highways and streets 2,460,360 3,930,740 3,394,204 4,864,060 (933,844) (933,320)
Parks and recreation 1,659,335 1,868,831 4,219,718 4,393,495 (2,560,383) (2,524,664)
Library 152,719 227,481 1,680,862 1,757,550 (1,528,143) (1,530,069)
Community development 922,255 1,084,270 7,510,992 9,180,082 (6,588,737) (8,095,812)
Interest expense - - 612,570 672,458 (612,570) (672,458)
Total governmental activities 18,526,343$ 14,119,430$ 48,605,213$ 47,081,140$ (30,078,870)$ (32,961,710)$
Operating Revenues Operating Expenses in Net Assets
and Change
Net (Expense)

CITY OF SAN BRUNO, CALIFORNIA
MANAGEMENT’S DISCUSSION AND ANALYSIS
FOR THE YEAR ENDED JUNE 30, 2011
11
Operating resources (program revenues) and operating expenses can be depicted graphically as follows:
General government, $10,884,365 , 59%
Public safety, $2,141,690 , 11%
Public works, $305,619 , 2%
Highways and streets, $2,460,360 , 13%
Parks and recreation, $1,659,335 , 9%
Library, $152,719 , 1%
Community development, $922,255 , 5%
Operating Revenues
General government, $10,962,945 , 23%
Public safety, $19,335,496 , 40%
Public works, $888,426 , 2%
Highways and streets, $3,394,204 , 7%
Parks and recreation, $4,219,718 , 9%
Library, $1,680,862 , 3%
Community development,
$7,510,992 , 15%
Interest expense, $612,570 , 1%
Operating Expenses

CITY OF SAN BRUNO, CALIFORNIA
MANAGEMENT’S DISCUSSION AND ANALYSIS
FOR THE YEAR ENDED JUNE 30, 2011
12
Business-type activities
The City’s business-type activities include: Water, Stormwater, Wastewater and Cable Television. Total
resources available during the year to finance business-type activities were $73 million consisting of net assets
at July 1, 2010, of $44.6 million and program revenues, investment income, and transfers of $31 million. Total
business-type activities expenses during the year were $28.8 million; thus, net assets were increased by $2.2
million to $46.8 million.
Operating revenues and expenses can be depicted graphically as follows:
Water, $9,491,102 , 31%
Stormwater, $593,179 , 2%
Wastewater, $10,128,799 , 33%
Cable Television, $10,570,028 , 34%
Operating Revenues
Water, $7,378,711 , 26%
Stormwater, $438,864 , 1%
Wastewater, $9,439,266 , 33%
Cable Television, $11,549,760 , 40%
Operating Expenses

CITY OF SAN BRUNO, CALIFORNIA
MANAGEMENT’S DISCUSSION AND ANALYSIS
FOR THE YEAR ENDED JUNE 30, 2011
13
Each program’s net cost (total cost less revenues generated by the activities) is presented below. The net cost
shows the financial burden that was placed on the City’s taxpayers by each of these functions.
2011 2010 2011 2010 2011 2010
Business-type activities:
Water 9,491,102$ 8,836,515$ 7,378,711$ 6,919,121$ 2,112,391$ 1,917,394$
Stormwater 593,179 574,796 438,864 386,608 154,315 188,188
Wastewater 10,128,799 9,566,099 9,439,266 7,987,591 689,533 1,578,508
Cable Television 10,570,028 10,254,204 11,549,760 11,452,012 (979,732) (1,197,808)
Total business-type activities 30,783,108$ 29,231,614$ 28,806,601$ 26,745,332$ 1,976,507$ 2,486,282$
Net (Expense)
and Change
Operating Revenues Operating Expenses in Net Assets
Cash Management
To obtain flexibility in cash management, the City employs a pooled cash system (Reference Note 2 in the
notes to the basic financial statements). Under the pooled cash concept, the City invests the cash of all funds
with maturities planned to coincide with cash needs. Idle cash is invested in certain eligible securities as
constrained by law and further limited by the City's Investment Policy. The goals of the City's Investment
Policy are safety, liquidity, and yield in that order of priority.
Capital Assets
The capital assets of the City are those assets used in the performance of the City’s functions including
infrastructure assets. At June 30, 2011, net capital assets of the governmental activities totaled $45.3 million.
Depreciation on capital assets is recognized in the government-wide financial statements. During the 2010-11
fiscal year, capital assets for governmental activities decreased by $1.75 million due to depreciation in excess
of additions. For the business-type activities, capital assets decreased by $0.7 million to $52.8 million due to
depreciation expense in excess of additions.
2011 2010 2011 2010 2011 2010
Land 561,197$ 561,197$ 576,842$ 576,842$ 1,138,039$ 1,138,039$
Construction in Progress 3,012,003 2,058,731 2,968,887 4,290,864 5,980,890 6,349,595
Infrastucture 30,347,921 32,160,949 - - 30,347,921 32,160,949
Sewer Plant - - 16,263,033 17,136,954 16,263,033 17,136,954
Buildings & Structures 8,546,074 8,940,976 27,816,961 26,672,160 36,363,035 35,613,136
Machinery & Equipment 2,799,783 3,295,017 5,204,005 4,814,784 8,003,788 8,109,801
Total 45,266,978$ 47,016,870$ 52,829,728$ 53,491,604$ 98,096,706$ 100,508,474$
Activities Activities Totals
Governmental Business-Type
Debt Administration
Debt, considered a liability of governmental activities, increased by $2.55 million a result of a OPEB liability
increase of $3.0 million as well as the retirement of debt related to the 2000 Certificates of Participation and
Capital Lease obligations amounted to $225,000 and $349,031 respectively. Compensated absences decreased
by $68,519.

CITY OF SAN BRUNO, CALIFORNIA
MANAGEMENT’S DISCUSSION AND ANALYSIS
FOR THE YEAR ENDED JUNE 30, 2011
14
ECONOMIC FACTORS AND NEXT YEAR’S BUDGETS AND RATES
In considering the City Budget for fiscal year 2011-2012, the City Council and management used the following
criteria:
The key assumptions in our revenue forecast were:
The adopted 2011-12 General Fund budget includes a .4.6% increase in total revenue, amounting to
$1,413,586 more than in the 2010-11 adopted budget.
Transient Occupancy Tax revenues are projected to be 16.8% higher than the 2010-11 amended budget
and sales tax is anticipated to increase 14% over the 2010-11 amended budget.
Water and wastewater rates will increase as part of the third year of a three-year rate increase adopted
by the City Council in 2009-10.
The adopted budget for all City funds for the new fiscal year of 2011-12 was $90.9 million and is summarized
as follows:
FY 2011-12
General fund 31,859,247$
Special revenue funds 7,244,078
Enterprise funds 25,906,725
Internal service funds 3,922,285
Capital projects 18,227,767
Total operations and projects 87,160,102
Debt service 3,716,230
Total budget 90,876,332$

CITY OF SAN BRUNO, CALIFORNIA
MANAGEMENT’S DISCUSSION AND ANALYSIS
FOR THE YEAR ENDED JUNE 30, 2011
15
Budgeted Expenditures:
The adopted general fund budget includes an increase of $838,959 or approximately 2.7%, which is
primarily due to an increase in the City’s retirement costs.
The capital improvement program for 2011-12 totals $18,227,767. This amount includes significant
funding for street rehabilitation and infrastructure improvements for the city’s utility operations. The
breakdown is as follows:
FY 2011-12
Parks & Facilities 2,050,899$
Redevelopment Agency -
Street Improvements 7,882,987
Water Enterprise 4,069,338
Wastewater Enterprise 3,064,390
Strormwater Enterprise 302,760
Cable Television 618,526
Technology 238,867
Total 18,227,767$
A total of $3,716,230 is set-aside to meet debt service obligations of the City. Of this amount, $378,501 is
budgeted in the general fund (non-departmental), $1,867,795 is budgeted in the wastewater fund, $817,796 is
budgeted in the cable fund, and $652,138 is budgeted in redevelopment operations.
CONTACTING THE CITY’S FINANCIAL MANAGEMENT
This financial report is designed to provide our citizens, taxpayers, customers, investors and creditors with a
general overview of the City’s finances and to show the City’s accountability for the money it receives.
Questions about this report should be directed to the Finance Department at 567 El Camino Real, San Bruno,
CA 94066. This report as well as other financial reports can be viewed on the City of San Bruno’s website at
www.sanbruno.ca.gov.

16
BASIC FINANCIAL STATEMENTS

CITY OF SAN BRUNO, CALIFORNIA
STATEMENT OF NET ASSETS
JUNE 30, 2011 (With comparative totals for June 30, 2010)
The accompanying notes are an integral part of these financial statements.
16
Governmental Business-Type
Activities Activities 2011 2010
ASSETS
Current assets:
Cash and investments 32,942,353$ 14,864,352$ 47,806,705$ 41,536,082$ Cash and investments with fiscal agent 1,191,184 1,053,962 2,245,146 2,539,716 Receivables (net) 5,102,757 2,926,687 8,029,444 6,566,151 Internal balances (1,100,655) 1,100,655 - -
Total current assets 38,135,639 19,945,656 58,081,295 50,641,949 Noncurrent assets:
Land held for resale 566,000 - 566,000 566,000 Deferred charges, net - 228,745 228,745 239,637 Capital assets not being depreciated:
Land 561,197 576,842 1,138,039 1,138,039 Construction in progress 3,012,003 2,968,887 5,980,890 6,349,596
Capital assets net of accumulated depreciation:
Infrastructure 30,347,921 - 30,347,921 32,160,949 Buildings and improvements 8,546,074 44,079,994 52,626,068 52,750,088 Machinery and equipment 2,799,783 5,204,005 8,003,788 8,109,802 Total capital assets (net) 45,266,978 52,829,728 98,096,706 100,508,474 Total noncurrent assets 45,832,978 53,058,473 98,891,451 101,314,111
Total assets 83,968,617 73,004,129 156,972,746 151,956,060
LIABILITIES
Current liabilities:
Accounts payable and accrued liabilities 6,034,855 2,276,539 8,311,394 8,864,466 Interest payable 170,682 382,978 553,660 614,173 Unearned revenue 153,148 841,488 994,636 925,015
Due within one year 1,688,624 2,138,972 3,827,596 3,648,154 Total current liabilities 8,047,309 5,639,977 13,687,286 14,051,808
Noncurrent liabilities:
Due in more than one year 17,440,678 20,608,443 38,049,121 37,246,183
Total liabilities 25,487,987 26,248,420 51,736,407 51,297,991
NET ASSETS
Invested in capital assets, net of related debt 36,981,386 30,706,799 67,688,185 67,774,342 Restricted for:
Capital Projects 669,175 - 669,175 164,960 Debt service 806,999 - 806,999 806,652 Special Revenue 14,640,726 - 14,640,726 10,785,757
Unrestricted 5,382,344 16,048,910 21,431,254 21,126,358
Total net assets 58,480,630$ 46,755,709$ 105,236,339$ 100,658,069$
Total liabilities and net assets 83,968,617$ 73,004,129$ 156,972,746$ 151,956,060$
Totals

CITY OF SAN BRUNO, CALIFORNIA
STATEMENT OF ACTIVITIES
FOR THE YEAR ENDED JUNE 30, 2011
(With comparative totals for the year ended June 30, 2010)
The accompanying notes are an integral part of these financial statements.
17
Operating Capital
Charges for Grants and Grants and
Functions/Programs Expenses Services Contributions Contributions
Primary government:
Governmental activities:
General government 10,962,945$ 3,397,195$ 7,487,170$ -$
Public safety 19,335,496 1,538,616 603,074 -
Public works 888,426 149,299 76,658 79,662
Highways and streets 3,394,204 19,243 2,441,217 (100)
Parks and recreation 4,219,718 1,089,866 569,469 -
Library 1,680,862 105,247 47,472 -
Community development 7,510,992 922,255 - -
Interest expense 612,570 - - -
Total governmental activities 48,605,213 7,221,721 11,225,060 79,562
Business-type activities:Water 7,378,711 9,491,102 - - Stormwater 438,864 593,179 - - Wastewater 9,439,266 10,128,799 - - Cable Television 11,549,760 10,570,028 - -
Total business-type activities 28,806,601 30,783,108 - -
Total primary government 77,411,814$ 38,004,829$ 11,225,060$ 79,562$
General revenues:Taxes:
Property taxes, levied for general purposesProperty taxes, tax increment for redevelopment purposesTransient occupancy taxFranchise taxSales tax, including subventionCardroom taxesOther taxes
Intergovernmental, unrestricted:State motor vehicle in-lieu tax, including subvention
Use of money and property
Total general revenuesTransfers
Total general revenues and transfers
Change in net assets
Net assets - Beginning
Net assets - Ending
Program Revenues

18
Governmental Business-Type
Activities Activities 2011 2010
(78,580)$ -$ (78,580)$ (858,299)$ (17,193,806) - (17,193,806) (17,604,147)
(582,807) - (582,807) (742,941) (933,844) - (933,844) (933,320)
(2,560,383) - (2,560,383) (2,524,664) (1,528,143) - (1,528,143) (1,530,069) (6,588,737) - (6,588,737) (8,095,812)
(612,570) - (612,570) (672,458) - - -
(30,078,870) - (30,078,870) (32,961,710)
- 2,112,391 2,112,391 1,917,394 - 154,315 154,315 188,188 - 689,533 689,533 1,578,508 - (979,732) (979,732) (1,197,808)
- 1,976,507 1,976,507 2,486,282
(30,078,870) 1,976,507 (28,102,363) (30,475,428)
5,035,244 - 5,035,244 6,561,286 8,900,038 - 8,900,038 9,308,063 1,763,680 - 1,763,680 1,344,364 1,916,659 - 1,916,659 1,804,390 6,498,220 - 6,498,220 5,366,248 1,531,232 - 1,531,232 1,496,516 1,632,802 - 1,632,802 1,487,538
3,374,101 - 3,374,101 3,350,849 1,909,612 119,045 2,028,657 2,366,089
32,561,588 119,045 32,680,633 33,085,343 (91,576) 91,576 - -
32,470,012 210,621 32,680,633 33,085,343
2,391,142 2,187,128 4,578,270 2,609,915
56,089,488 44,568,581 100,658,069 98,048,154
58,480,630$ 46,755,709$ 105,236,339$ 100,658,069$
Totals
Net (Expense) Revenue and
Changes in Net Assets

19
FUND FINANCIAL STATEMENTS

20
This page intentionally left blank.

CITY OF SAN BRUNO, CALIFORNIA
BALANCE SHEET
JUNE 30, 2011
(With comparative totals for June 30, 2010)
The accompanying notes are an integral part of these financial statements.
21
Special Capital Debt
General Revenue Projects Service
ASSETS
Cash and investments 4,581,918$ 8,300,625$ 113,336$ 156,934$
Cash and investments with fiscal agent/trustee - 450,000 - 650,065
Receivables:Taxes 965,263 - - -
Interest 85,514 - - -
Intergovernmental subventions - - - -
Intergovernmental grants - - - -
Loans 638,512 90,000 - -
Other 805,837 - - -
Due from other funds 5,164,993 - - -
Land held for resale - 566,000 - -
Total assets 12,242,037$ 9,406,625$ 113,336$ 806,999$
LIABILITIES AND FUND BALANCES
Liabilities:
Accounts payable and accrued liabilities 2,270,025$ 3,075,553$ 22,000$ -$
Due to other funds - - - -
Deferred revenue 153,148 - - -
Vacation and compensated absence obligation - 24,289
Advances from other funds - 1,060,300 1,916,733 -
Total liabilities 2,423,173 4,160,142 1,938,733 -
Fund balances:
Nonspendable 638,512 90,000 - -
Restricted - 5,156,483 - 806,999
Assigned 127,407 - - -
Unassigned 9,052,945 - (1,825,397) -
Total fund balances 9,818,864 5,246,483 (1,825,397) 806,999
Total liabilities and fund balances 12,242,037$ 9,406,625$ 113,336$ 806,999$
Redevelopment Agency
Major Funds

22
Other
Measure A Street Improvement Governmental
Transportation Tax Capital Projects Funds 2011 2010
325,037$ 1,291,423$ 10,785,731$ 25,555,004$ 21,671,792$ - - - 1,100,065 1,309,956
- - 30,889 996,152 826,098 - - 3,569 89,083 66,997 - - 11,859 11,859 21,987 - 171,000 79,414 250,414 45,012 - 462,966 - 1,191,478 1,535,037 - - 1,757,934 2,563,771 1,267,656 - - - 5,164,993 2,493,223 - - - 566,000 566,000
325,037$ 1,925,389$ 12,669,396$ 37,488,819$ 29,803,758$
-$ 59,990$ 383,209$ 5,810,777$ 6,697,593$ - - 2,587,808 2,587,808 45,252 - - - 153,148 58,278
- - 24,289 23,360 - - - 2,977,033 2,977,033
- 59,990 2,971,017 11,553,055 9,801,516
- - - 728,512 738,702 325,037 1,865,399 9,716,735 17,870,653 13,486,013
- - - 127,407 152,533 - - (18,356) 7,209,192 5,624,994
325,037 1,865,399 9,698,379 25,935,764 20,002,242
325,037$ 1,925,389$ 12,669,396$ 37,488,819$ 29,803,758$
Major Funds

CITY OF SAN BRUNO, CALIFORNIA
RECONCILIATION OF THE GOVERNMENTAL FUNDS BALANCE SHEET TO THE
STATEMENT OF NET ASSETS
JUNE 30, 2011
The accompanying notes are an integral part of these financial statements.
23
Total fund balances - total governmental funds 25,935,764$
Amounts reported for governmental activities in the Statement of Net Assets
are different because:
Capital assets used in governmental activities are not
current financial resources and therefore are not reported in
the governmental funds balance sheet. 45,266,978
Internal services funds are used by management to charge the costs of
certain activities, such as insurance, to individual funds. The assets and
liabilities of the internal service funds are:
Current assets and advances 10,455,501$
Accounts payable and accrued liabilities (224,078)
Net amount allocated to business-type activities (3,677,840) 6,553,583
Long-term liabilities are not due and payable in the current period
and therefore they are not reported in the government's fund balance sheets.
Includes internal service funds noncurrent liabilities
Leases payable (365,592)
Accrued interest payable (170,682)
Liability for claims (1,576,264)
Certificates of Participation (7,920,000)
Compensated absences (2,260,457)
Net OPEB obligation (6,982,700)
Net assets of governmental activities 58,480,630$

CITY OF SAN BRUNO, CALIFORNIA
RECONCILIATION OF THE FUND BASIS BALANCE SHEET TO THE STATEMENT OF
NET ASSETS
JUNE 30, 2011
The accompanying notes are an integral part of these financial statements.
24
Governmental
Funds Internal
Balance Service Eliminations Changes Statement of
Sheet Balances Reclassifications in GAAP Net Assets
ASSETS
Current assets:
Cash and investments 25,555,004$ 7,387,349$ -$ -$ 32,942,353$
Cash and investments with fiscal agent/trustee 1,100,065 91,119 - - 1,191,184
Receivables (net) 5,102,757 - - - 5,102,757
Due from other funds 5,164,993 - (5,164,993) - -
Internal balances - - 2,577,185 (3,677,840) (1,100,655)
Total current assets 36,922,819 7,478,468 (2,587,808) (3,677,840) 38,135,639
Noncurrent assets:
Advances to other funds - 2,977,033 (2,977,033) - -
Land held for resale 566,000 - - - 566,000
Capital assets not being depreciated:
Land - - - 561,197 561,197
Construction in progress - - - 3,012,003 3,012,003
Capital assets net of accumulated depreciation:
Infrastructure - - - 30,347,921 30,347,921
Buildings and improvements - - - 8,546,074 8,546,074
Machinery and equipment - - - 2,799,783 2,799,783
Total noncurrent assets 566,000 2,977,033 (2,977,033) 45,266,978 45,832,978
Total assets 37,488,819$ 10,455,501$ (5,564,841)$ 41,589,138$ 83,968,617$
LIABILITIES
Current liabilities:
Accounts payable and accrued liabilities 5,810,777$ 224,078$ -$ -$ 6,034,855$
Due to other funds 2,587,808 - (2,587,808) - -
Interest payable - - - 170,682 170,682
Deferred revenue 153,148 - - - 153,148
Due within one year - - - 605,592 605,592
Compensated absences 24,289 55,277 - 1,003,466 1,083,032
Total current liabilities 8,576,022 279,355 (2,587,808) 1,779,740 8,047,309
Noncurrent liabilities:
Advances from other funds 2,977,033 - (2,977,033) - -
Compensated absences - 40,089 - 1,161,625 1,201,714
Due after one year - - - 7,680,000 7,680,000
Liability for claims - 1,576,264 - - 1,576,264
Net OPEB obligation - - - 6,982,700 6,982,700
Total noncurrent liabilities 2,977,033 1,616,353 (2,977,033) 15,824,325 17,440,678
Total liabilities 11,553,055 1,895,708 (5,564,841) 17,604,065 25,487,987
NET ASSETS
Invested in capital assets, net of related debt - - - 36,981,386 36,981,386
Restricted for:
Capital Projects 669,175 669,175
Debt service 806,999 - - - 806,999
Special revenue 14,640,726 - - - 14,640,726
Unrestricted (deficit) 9,818,864 8,559,793 - (12,996,313) 5,382,344
Total net assets 25,935,764 8,559,793 - 23,985,073 58,480,630
Total liabilities and net assets 37,488,819$ 10,455,501$ (5,564,841)$ 41,589,138$ 83,968,617$

CITY OF SAN BRUNO, CALIFORNIA
STATEMENT OF REVENUES, EXPENDITURES AND CHANGES IN FUND BALANCES
FOR THE YEAR ENDED JUNE 30, 2011
(With comparative totals for June 30, 2010)
The accompanying notes are an integral part of these financial statements.
25
Special Capital Debt
General Revenue Projects Service
REVENUES:
Taxes 17,016,483$ 8,900,038$ -$ -$
Licenses and permits 2,097,713 - - -
Intergovernmental 3,374,101 - - -
Charges for services 4,178,851 - - -
Fines and forfeitures 734,722 - - -
Use of money and property 1,750,450 60,288 955 268 Other revenues 3,592,457 - - -
Total revenues 32,744,777 8,960,326 955 268
EXPENDITURES:
Current:
General government 3,918,992 - - -
Public safety 18,537,862 - - -
Public works 768,453 - - -
Highways and streets 1,065,816 - - -
Parks and recreation 3,956,830 - - -
Library 1,649,755 - - -
Community development 1,087,080 6,163,216 30,070 -
Capital outlay - - - -
Debt service:Principal - - - 225,000 Interest and fiscal charges - 200,000 - 422,411
Total expenditures 30,984,788 6,363,216 30,070 647,411
REVENUES OVER (UNDER)
EXPENDITURES 1,759,989 2,597,110 (29,115) (647,143)
OTHER FINANCING SOURCES (USES):
Transfers in 467,586 - 684,064 647,490 Transfers out (653,584) (1,331,554) (684,064) -
Total other financing sources (uses) (185,998) (1,331,554) - 647,490
Net change in fund balances 1,573,991 1,265,556 (29,115) 347
FUND BALANCES:
Beginning of year 8,244,873 3,980,927 (1,796,282) 806,652
End of year 9,818,864$ 5,246,483$ (1,825,397)$ 806,999$
Redevelopment Agency

26
Other
Measure A Street Improvement Governmental
Transportation Tax Capital Projects Funds 2011 2010
717,285$ -$ 1,071,708$ 27,705,514$ 27,863,575$ - - 84,464 2,182,177 2,036,968 - - 728,832 4,102,933 4,663,260 - - 70,585 4,249,436 3,319,982 - - 4,311 739,033 763,221
3,985 21,254 72,412 1,909,612 1,938,960 - (100) 6,606,870 10,199,227 6,151,677
721,270 21,154 8,639,182 51,087,932 46,737,643
- - 3,814,641 7,733,633 3,432,652 - - 92,797 18,630,659 19,791,985 - - 58,710 827,163 795,138 - 762,500 614,305 2,442,621 3,924,441 - - 149,984 4,106,814 4,319,160 - - 19,619 1,669,374 1,752,924 - - 231 7,280,597 8,978,350 - - 699,463 699,463 1,071,479
- - 349,031 574,031 548,218 - - 29,471 651,882 677,465
- 762,500 5,828,252 44,616,237 45,291,812
721,270 (741,346) 2,810,930 6,471,695 1,445,831
- 1,229,185 667,720 3,696,045 5,418,156 (637,010) - (928,006) (4,234,218) (5,168,156)
(637,010) 1,229,185 (260,286) (538,173) 250,000
84,260 487,839 2,550,644 5,933,522 1,695,831
240,777 1,377,560 7,147,735 20,002,242 18,306,411
325,037$ 1,865,399$ 9,698,379$ 25,935,764$ 20,002,242$
Totals

CITY OF SAN BRUNO, CALIFORNIA
RECONCILIATION OF THE GOVERNMENTAL FUNDS STATEMENT OF REVENUES,
EXPENDITURES, AND CHANGES IN FUND BALANCES TO THE GOVERNMENT-WIDE
STATEMENTS OF ACTIVITIES
FOR THE YEAR ENDED JUNE 30, 2011
The accompanying notes are an integral part of these financial statements.
27
Net change in fund balances- total governmental funds 5,933,522$
Amounts reported for governmental activities in the Statement of Activities
are different because:
Governmental funds report capital outlays as expenditures while
governmental activities report depreciation expense to allocate those
expenditures over the life of the assets:
Capital asset purchases capitalized 1,375,972
Depreciation expense (3,125,864)
Net decrease from capital outlay expenses (1,749,892)
Certain employee benefit obligations are recorded on a pay-as-you-go basis
in the governmental funds, but are accrued as liabilities in the Statement of Net Assets:
Net OPEB obligation (3,043,300)
Repayment of debt principal is an expenditure in the governmental funds, but
the repayment reduces long-term liabilities in the Statement of Net Assets:
Capital lease obligation principal payments 349,031
Certificate of participation principal payments 225,000
Total principal payments 574,031
Some expenses reported in the Statement of Activities do not require the
use of current financial resources and therefore are not reported as
expenditures in governmental funds:
Interest payable 39,312
Accrued compensated absences 43,466
Total 82,778
Internal services funds are used by management to charge the costs of
certain activities, such as insurance, to individual funds.
The net revenue (expense) of the internal service funds $594,004
attributed to governmental activities 594,004
Change in net assets of governmental activities 2,391,143$
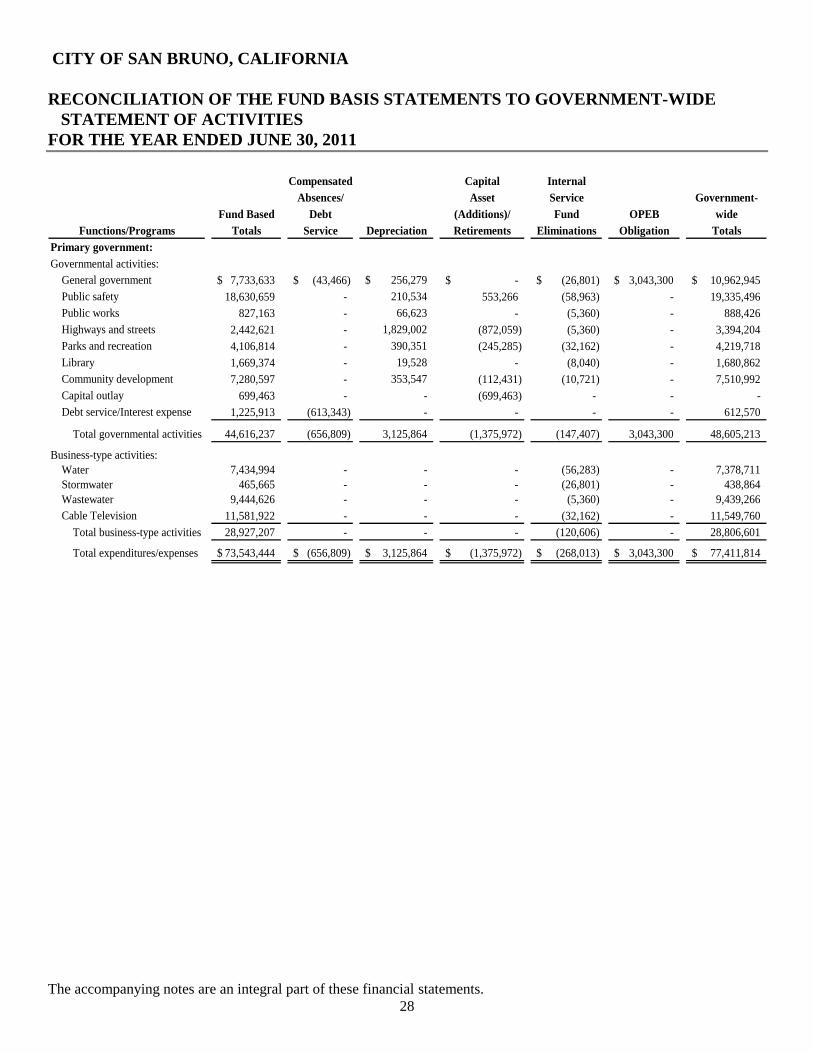
CITY OF SAN BRUNO, CALIFORNIA
RECONCILIATION OF THE FUND BASIS STATEMENTS TO GOVERNMENT-WIDE
STATEMENT OF ACTIVITIES
FOR THE YEAR ENDED JUNE 30, 2011
The accompanying notes are an integral part of these financial statements.
28
Compensated Capital Internal
Absences/ Asset Service Government-
Fund Based Debt (Additions)/ Fund OPEB wide
Functions/Programs Totals Service Depreciation Retirements Eliminations Obligation Totals
Primary government:
Governmental activities:
General government 7,733,633$ (43,466)$ 256,279$ -$ (26,801)$ 3,043,300$ 10,962,945$
Public safety 18,630,659 - 210,534 553,266 (58,963) - 19,335,496
Public works 827,163 - 66,623 - (5,360) - 888,426
Highways and streets 2,442,621 - 1,829,002 (872,059) (5,360) - 3,394,204
Parks and recreation 4,106,814 - 390,351 (245,285) (32,162) - 4,219,718
Library 1,669,374 - 19,528 - (8,040) - 1,680,862
Community development 7,280,597 - 353,547 (112,431) (10,721) - 7,510,992
Capital outlay 699,463 - - (699,463) - - -
Debt service/Interest expense 1,225,913 (613,343) - - - - 612,570
Total governmental activities 44,616,237 (656,809) 3,125,864 (1,375,972) (147,407) 3,043,300 48,605,213
Business-type activities:
Water 7,434,994 - - - (56,283) - 7,378,711
Stormwater 465,665 - - - (26,801) - 438,864
Wastewater 9,444,626 - - - (5,360) - 9,439,266
Cable Television 11,581,922 - - - (32,162) - 11,549,760
Total business-type activities 28,927,207 - - - (120,606) - 28,806,601
Total expenditures/expenses 73,543,444$ (656,809)$ 3,125,864$ (1,375,972)$ (268,013)$ 3,043,300$ 77,411,814$

CITY OF SAN BRUNO, CALIFORNIA
PROPRIETARY FUNDS
STATEMENT OF NET ASSETS
JUNE 30, 2011
(With comparative totals for June 30, 2010)
The accompanying notes are an integral part of these financial statements.
29
Water Stormwater Wastewater
ASSETS
Current assets:Cash and investments 9,057,181$ 1,307,119$ 4,500,052$ Cash and investments with fiscal agent/trustee - - 1,053,962 Accounts receivable 914,794 - 991,204
Total current assets 9,971,975 1,307,119 6,545,218
Noncurrent assets:Advance to City of San Bruno Redevelopment Agency - - - Deferred charges, net - - 228,745
Property, plant and equipment (net) 14,353,948 1,055,199 31,528,061
Total noncurrent assets 14,353,948 1,055,199 31,756,806
Total assets 24,325,923$ 2,362,318$ 38,302,024$
LIABILITIES AND NET ASSETS
Current liabilities:Accounts payable and accrued liabilities 725,441$ (14)$ 1,091,148$ Due to other funds - - - Interest payable - - 380,328 Unearned revenue - - - Compensated absences - current 61,957 - 31,784 Long term debt - due within one year - - 1,155,536
Total current liabilities 787,398 (14) 2,658,796
Noncurrent liabilities:Compensated absences - noncurrent 54,440 5,849 65,880 Long term debt - due in more than one year - - 19,350,550 Liability for claims - non-current - - - Other long-term liabilities - - 160,000
Total noncurrent liabilities 54,440 5,849 19,576,430
Total liabilities 841,838 5,835 22,235,226
Net AssetsInvested in capital assets, net of related debt 14,353,948 1,055,199 11,021,975 Unrestricted (deficit) 9,130,137 1,301,284 5,044,823
Total net assets 23,484,085 2,356,483 16,066,798 Total liabilities and net assets 24,325,923$ 2,362,318$ 38,302,024$
Reconciliation to government-wide statement of net assets:Adjustment to reflect the consolidation of internal service
fund activities related to enterprise funds 1,714,397$ 150,315$ 817,460$ Net assets of business-type activities 25,198,482$ 2,506,798$ 16,884,258$
Business Type Activities - Enterprise Funds

30
Cable
Television 2011 2010 2011 2010
-$ 14,864,352$ 13,443,994$ 7,387,349$ 6,420,296$ - 1,053,962 1,138,641 91,119 91,119
1,020,689 2,926,687 2,801,654 - 1,710 1,020,689 18,845,001 17,384,289 7,478,468 6,513,125
- - - 2,977,033 2,977,033 - 228,745 239,637 - -
5,892,520 52,829,728 53,491,604 - - 5,892,520 53,058,473 53,731,241 2,977,033 2,977,033
6,913,209$ 71,903,474$ 71,115,530$ 10,455,501$ 9,490,158$
459,964$ 2,276,539$ 2,074,692$ 224,078$ 68,821$ 2,577,185 2,577,185 2,447,971 - -
2,650 382,978 404,179 - - 841,488 841,488 866,737 - - 147,104 240,845 248,007 55,277 99,422 742,591 1,898,127 1,751,582 - -
4,770,982 8,217,162 7,793,168 279,355 168,243
97,472 223,641 188,087 40,089 45,286 874,252 20,224,802 22,122,928 - -
- - - 1,576,264 1,431,446 - 160,000 - - -
971,724 20,608,443 22,311,015 1,616,353 1,476,732
5,742,706 28,825,605 30,104,183 1,895,708 1,644,975
4,275,677 30,706,799 29,617,094 - - (3,105,174) 12,371,070 11,394,253 8,559,793 7,845,183 1,170,503 43,077,869 41,011,347 8,559,793 7,845,183 6,913,209$ 71,903,474$ 71,115,530$ 10,455,501$ 9,490,158$
995,668$ 3,677,840$ 3,557,234$ 2,166,171$ 46,755,709$ 44,568,581$
Totals
Governmental Activities -
Internal Service Funds
Totals
Business Type Activities - Enterprise Funds

CITY OF SAN BRUNO, CALIFORNIA
PROPRIETARY FUNDS
STATEMENT OF REVENUES, EXPENSES, AND CHANGES IN NET ASSETS
FOR THE YEAR ENDED JUNE 30, 2011
(With comparative totals for the year ended June 30, 2010)
The accompanying notes are an integral part of these financial statements.
31
Water Stormwater Wastewater
OPERATING REVENUES:
Charges for services:
Water sales 9,316,650$ -$ -$
Sewer service charges - - 10,075,426
Cable television charges - - -
Other service charges 94,283 557,228 21,639
Other operating revenue 80,169 35,951 31,734
Insurance cost allocation - - -
Total operating revenues 9,491,102 593,179 10,128,799
OPERATING EXPENSES:
Water supply 4,043,290 - -
Distribution 2,440,951 349,014 -
Customer accounting 228,649 - -
Treatment - - 7,287,694
Cable operations - - -
Central garage - - -
Insurance expenses - 76,260 -
Equipment replacement - - -
Technology support - - -
Facilities maintenance - - -
Depreciation and amortization 722,104 40,391 1,428,926
Total operating expenses 7,434,994 465,665 8,716,620
OPERATING INCOME (LOSS) 2,056,108 127,514 1,412,179
NONOPERATING REVENUES (EXPENSES):
Investment income 71,445 10,202 37,383
Interest and debt service expenses - - (728,006)
Total non-operating revenues (expenses), net 71,445 10,202 (690,623)
NET INCOME (LOSS) BEFORE OPERATING TRANSFERS 2,127,553 137,716 721,556
Transfers in (out) (10,000) - 10,000
CHANGE IN NET ASSETS 2,117,553 137,716 731,556
NET ASSETS:
Beginning of year, as originally reported 21,366,532 2,218,767 15,335,242
Prior period adjustment - - -
Beginning of year, as adjusted 21,366,532 2,218,767 15,335,242
End of year 23,484,085$ 2,356,483$ 16,066,798$
Reconciliation to government-wide statement of activities:
Adjustment to reflect the consolidation of internal service fund activities
related to enterprise funds 56,283$ 26,801$ 5,360$
Change in net assets of business-type activities - End of year 2,173,836$ 164,517$ 736,916$
Business Type Activities - Enterprise Funds

32
Cable
Television 2011 2010 2011 2010
-$ 9,316,650$ 8,604,616$ -$ -$
- 10,075,426 9,491,630 - -
10,558,970 10,558,970 10,094,264 - -
11,058 684,208 850,522 2,215,964 2,757,474
- 147,854 190,582 - -
- - - 1,578,036 1,578,156
10,570,028 30,783,108 29,231,614 3,794,000 4,335,630
- 4,043,290 4,029,980 - -
- 2,789,965 2,578,142 - -
- 228,649 31,791 - -
- 7,287,694 5,845,007 - -
9,710,219 9,710,219 9,829,246 - -
- - - 594,564 678,168
- 76,260 78,396 1,374,661 1,251,307
- - - 264,958 177,236
- - - 448,124 480,194
- - - 843,680 1,051,067
1,762,549 3,953,970 3,591,788 - -
11,472,768 28,090,047 25,984,350 3,525,987 3,637,972
(902,740) 2,693,061 3,247,264 268,013 697,658
15 119,045 123,648 - -
(109,154) (837,160) (887,674) - -
(109,139) (718,115) (764,026) - -
(1,011,879) 1,974,946 2,483,238 268,013 697,658
91,576 91,576 93,482 446,597 (343,482)
(920,303) 2,066,522 2,576,720 714,610 354,176
2,090,806 41,011,347 39,760,264 7,845,183 7,491,007
- (1,325,637) - -
2,090,806 41,011,347 38,434,627 7,845,183 7,491,007
1,170,503$ 43,077,869$ 41,011,347$ 8,559,793$ 7,845,183$
32,162$ 120,606$ 126,692$
(888,141)$ 2,187,128$ 2,703,412$
Governmental Activities -
Internal Service Funds
TotalsTotals
Business Type Activities - Enterprise Funds

CITY OF SAN BRUNO, CALIFORNIA
PROPRIETARY FUNDS
STATEMENT OF CASH FLOWS
FOR THE YEAR ENDED JUNE 30, 2011 (With comparative totals for the year ended June 30, 2010)
The accompanying notes are an integral part of these financial statements.
33
Water Stormwater Wastewater
CASH FLOWS FROM OPERATING ACTIVITIES:
Cash received from interfund services provided -$ -$ -$
Cash receipts from customers 9,425,410 593,179 10,100,234
Cash payments to suppliers for goods and services (4,709,025) (237,682) (5,646,078)
Cash payments to employees for services (1,841,780) (241,589) (1,304,816)
Net cash provided by operating activities 2,874,605 113,908 3,149,340
CASH FLOWS FROM NONCAPITAL FINANCING ACTIVITIES:
Transfers received from other funds - - -
Transfers paid to other funds (10,000) - 10,000
Net cash provided by noncapital financing activities (10,000) - 10,000
CASH FLOWS FROM CAPITAL AND RELATED FINANCING ACTIVITIES:
Acquisition and construction of capital assets (1,777,899) (45,940) (1,162,955)
Proceeds from issuance of debt - - -
Acquisition of capacity rights - - -
Principal payments on long-term debt - - (1,121,572)
Interest paid on long-term debt - - (747,389)
Net cash (used) by capital and related financing activities (1,777,899) (45,940) (3,031,916)
CASH FLOWS FROM INVESTING ACTIVITIES:
Investment income received 71,445 10,202 37,383
Net increase (decrease) in cash and cash equivalents 1,158,151 78,170 164,807
CASH AND CASH EQUIVALENTS:
Beginning of year 7,899,030 1,228,949 5,389,207
End of year 9,057,181$ 1,307,119$ 5,554,014$
Reconciliation of Cash and Cash Equivalents to Statement of Net Assets
Cash and investments 9,057,181$ 1,307,119$ 4,500,052$
Cash and investments held by trustees - - 1,053,962
Total Cash and Cash Equivalents, End of Year 9,057,181$ 1,307,119$ 5,554,014$
Reconciliation of income (loss) from operations to net
cash used by operating activities:
Operating income (loss) 2,056,108$ 127,514$ 1,412,179$
Adjustments to reconcile operating loss
to net cash used in operating activities:
Depreciation and amortization 722,104 40,391 1,428,926
(Increase) decrease in current assets:
Accounts receivable (65,692) - (28,565)
Prepaid items - - 10,892
Increase (decrease) in liabilities:
Accounts payable and accrued liabilities 135,970 (53,776) 176,421
Unearned revenue - - -
Compensated absences 26,115 (221) (10,513)
Other long-term liabilities 160,000
Increase (decrease) in claims liability - noncurrent - - -
Net cash provided by operating activities 2,874,605$ 113,908$ 3,149,340$
Business Type Activities - Enterprise Funds

34
Cable
Television 2011 2010 2011 2010
-$ -$ -$ 3,795,710$ 4,333,920$
10,514,003 30,632,826 29,257,366 - -
(7,542,401) (18,135,186) (18,075,857) (3,275,254) (4,141,557)
(2,211,575) (5,599,760) (3,961,820) - -
760,027 6,897,880 7,219,689 520,456 192,363
129,214 129,214 665,448 628,173 250,000
91,576 91,576 - (181,576) (343,482)
220,790 220,790 665,448 446,597 (93,482)
(305,300) (3,292,094) (22,903,958) - -
- - 1,609,267 - -
- - 17,782,606 - -
(630,009) (1,751,581) (1,590,076) - -
(110,972) (858,361) (901,884) - -
(1,046,281) (5,902,036) (6,004,045) - -
15 119,045 123,648 - -
(65,449) 1,335,679 2,004,740 967,053 98,881
65,449 14,582,635 12,577,895 6,511,415 6,412,534
-$ 15,918,314$ 14,582,635$ 7,478,468$ 6,511,415$
-$ 14,864,352$ 13,443,994$ 7,387,349$ 6,420,296$
- 1,053,962 1,138,641 91,119 91,119
-$ 15,918,314$ 14,582,635$ 7,478,468$ 6,511,415$
(902,740)$ 2,693,061$ 3,247,264$ 268,013$ 697,658$
1,762,549 3,953,970 3,591,788 - -
(30,776) (125,033) (59,170) 1,710 (1,710)
- 10,892 - - -
(56,768) 201,847 297,663 155,257 (103,003)
(25,249) (25,249) 84,922 - -
13,011 28,392 57,222 (49,342) 11,254
- 160,000 -
- - - 144,818 (411,836)
760,027$ 6,897,880$ 7,219,689$ 520,456$ 192,363$
Internal Service Funds
Governmental Activities -
TotalsTotals

CITY OF SAN BRUNO, CALIFORNIA
FIDUCIARY FUNDS
STATEMENT OF ASSETS AND LIABILITIES
FOR THE YEAR ENDED JUNE 30, 2011 (With comparative totals for the year ended June 30, 2010)
The accompanying notes are an integral part of these financial statements.
35
2011 2010
ASSETS
Cash and investments 404,972$ 712,390$
Accounts receivable 500,644 470,863
Total assets 905,616$ 1,183,253$
LIABILITIES
Accounts payable 844,131$ 904,208$
Other liabilities 61,485 279,045
Total liabilities 905,616$ 1,183,253$
Agency Funds

36
NOTES TO BASIC FINANCIAL STATEMENTS

CITY OF SAN BRUNO, CALIFORNIA
INDEX TO NOTES TO BASIC FINANCIAL STATEMENTS
FOR THE YEAR ENDED JUNE 30, 2011
37
Page
Note 1 - Summary of Significant Accounting Policies ................................................................................. 38
Financial Reporting Entity ......................................................................................................................... 38
Basis of Presentation .................................................................................................................................. 38
Measurement Focus ................................................................................................................................... 43
Basis of Accounting ................................................................................................................................... 43
Assets, Liabilities, and Equity .................................................................................................................... 44
Revenues, Expenditures and Expenses....................................................................................................... 48
Budgetary Policies ...................................................................................................................................... 50
Note 2 – Cash and Investments ...................................................................................................................... 51
Note 3 – Accounts Receivable ........................................................................................................................ 53
Note 4 – Capital Assets ................................................................................................................................... 54
Note 5 – Accounts Payable and Accrued Liabilities .................................................................................... 58
Note 6 – Long-Term Liabilities ...................................................................................................................... 58
Note 7 – City of South San Francisco Sewer Plant Agreement .................................................................. 62
Note 8 – Deficit Net Assets/Fund Balances ................................................................................................... 64
Note 9 – Excess Expenditures Over Appropriations ................................................................................... 64
Note 10 – Interfund Transactions .................................................................................................................. 65
Note 11 – Risk Management .......................................................................................................................... 67
Note 12 – Public Employees’ Retirement System ........................................................................................ 68
Plan Description ......................................................................................................................................... 68
Funding Policy ............................................................................................................................................ 68
Annual Pension Cost .................................................................................................................................. 68
Note 13 – Post-Employment Healthcare Plan .............................................................................................. 69
Note 14 – Contingencies .................................................................................................................................. 71
Note 15 – Litigation ......................................................................................................................................... 71

CITY OF SAN BRUNO, CALIFORNIA
NOTES TO BASIC FINANCIAL STATEMENTS
FOR THE YEAR ENDED JUNE 30, 2011
38
NOTE 1 - SUMMARY OF SIGNIFICANT ACCOUNTING POLICIES
Financial Reporting Entity
The financial reporting entity consists of (a) the primary government, the City of San Bruno (City), (b)
organizations for which the primary government is financially accountable, and (c) other organizations for
which the primary government is not accountable, but for which the nature and significance of their relationship
with the primary government are such that exclusion would cause the reporting entity’s financial statements to
be misleading or incomplete.
Component units are legally separate organizations for which the elected officials of the primary government
are financially accountable. In addition, component units can be other organizations for which the primary
government is accountable and their exclusion would cause the reporting entity’s financial statements to be
misleading or incomplete.
The City Council acts as the governing body and is able to impose its will on the following organization,
establishing financial accountability. As a result, this organization is considered a component unit of the City
and is included within the financial statements of the City using the blended method.
Redevelopment Agency of the City of San Bruno
The Redevelopment Agency of the City of San Bruno (Agency) was established July 6, 1999 pursuant to the
State of California Health and Safety Code, Section 33000, entitled "Community Redevelopment Law" and on
the same date, the City Council became the governing board. The Agency was formed for the purpose of
preparing and carrying out plans for improvement, rehabilitation, and redevelopment of blighted areas within
the territorial limits of the City of San Bruno. City staff provides management assistance to the Agency. All
funds of the Agency have been included in the governmental activities section in the fund financial statements.
The Agency provides services entirely for the benefit of the City of San Bruno, California and the governing
body consists solely of members of the City Council; therefore the Agency is treated as a blended component
unit. Separate financial statements for the Agency may be obtained at the City of San Bruno’s Finance
Department.
Basis of Presentation
Government-Wide Financial Statements
The statement of net assets and statement of activities display information about the reporting government as a
whole. They include all funds of the reporting entity except for fiduciary funds and internal service funds. The
statements distinguish between governmental and business-type activities. Governmental activities generally
are financed through taxes, intergovernmental revenues, and other nonexchange revenues. Business-type
activities are financed in whole or in part by fees charged to external parties for goods or services.

CITY OF SAN BRUNO, CALIFORNIA
NOTES TO BASIC FINANCIAL STATEMENTS
FOR THE YEAR ENDED JUNE 30, 2011
39
Fund Financial Statements
Fund financial statements of the reporting entity are organized into funds each of which is considered to be a
separate accounting entity. Each fund is accounted for by providing a separate set of self-balancing accounts,
which constitute its assets, liabilities, fund equity, revenues, and expenditures/expenses. Funds are organized
into three major categories: governmental, proprietary, and fiduciary. An emphasis is placed on major funds
within the governmental and proprietary categories. A fund is considered major if it is the primary operating
fund of the City or meets the following criteria:
a. Total assets, liabilities, revenues, or expenditures/expenses of that individual governmental or
enterprise fund are at least 10 percent of the corresponding total for all funds of that category or type;
and,
b. Total assets, liabilities, revenues, or expenditures/expenses of the individual governmental fund or
enterprise fund are at least 5 percent of the corresponding total for all governmental and enterprise
funds combined. However, some funds that have previously met the major fund threshold but fail to do
so in the current year continue to be shown as major funds for consistency.
The funds of the financial reporting entity are described below:
Governmental Activities
General Fund
The General Fund is used to account for resources traditionally associated with the City which are not required
legally or by sound financial management to be accounted for in another fund. The General Fund supports the
City’s general operating expenditures, fixed charges, and capital costs that are not paid through other funds.
Special Revenue Funds
The Special Revenue Funds are used to account for specific revenues that are legally or otherwise restricted to
expenditures for particular purposes.
Capital Project Funds
The Capital Projects Funds are used to account for the acquisition and construction of major capital facilities
other than those financed by proprietary funds.
Debt Service Funds
The Debt Service Funds account for the accumulation of financial resources for the payment of interest and
principal on the general long-term debt of the City other than those serviced by proprietary funds.

CITY OF SAN BRUNO, CALIFORNIA
NOTES TO BASIC FINANCIAL STATEMENTS
FOR THE YEAR ENDED JUNE 30, 2011
40
Business-type Activities
Proprietary Funds
Enterprise Funds
The Enterprise Funds are used to account for operations that are financed and operated in a manner similar to
private business enterprises – where the intent of the City Council is that the costs of providing goods or
services to the general public on a continuing basis be financed or recovered primarily through user charges or
where the City Council has decided that periodic determination of net income is appropriate for accountability
purposes.
Internal Service Funds
The Internal Service Funds are used to account for financing of goods or services provided by one department
or agency to other departments or agencies of the City, or to other governments, on a cost-reimbursement basis.
The internal services funds are used to account for equipment servicing other funds, central garage, insurance
programs, facilities maintenance and technology development. These funds are eliminated as part of the
reconciliation process and treated as governmental activities, since these are the primary funds served. The
percentage contribution by function to these funds was as follows:
Governmental activities:
General government 9%
Public safety 22%
Public works 2%
Highways and streets 2%
Parks and recreation 12%
Library 3%
Community development 4%
Business-type activities:
Water 21%
Stormwater 2%
Wastewater 10%
Cable 13%
Fiduciary Funds
Agency Funds
Agency Funds account for assets held by the City in a purely custodial capacity. The reporting entity includes
two agency funds, which are Project Development and San Bruno Garbage Company. Since agency funds are
custodial in nature, (i.e. assets equal liabilities), they do not involve the measurement of results of operations.

CITY OF SAN BRUNO, CALIFORNIA
NOTES TO BASIC FINANCIAL STATEMENTS
FOR THE YEAR ENDED JUNE 30, 2011
41
Major and Non-Major Funds
The funds are further classified as major or non-major as follows:
Fund Type Brief Description
Major:
General
Primary operating fund of the City: accounts for all activities except
those legally or administratively required to be accounted for in other
funds.
Special Revenue Funds:
Redevelopment Agency
Measure A Transportation Tax
Capital Projects Funds:
Accounts for tax increment revenues received for the operations and
general redevelopment and low/moderate housing activities in the
redevelopment project areas.
Accounts for funds received to be used for local transportation
purposes.
Redevelopment Agency
Street Improvement
Debt Service Funds:
Redevelopment Agency
Accounts for the administration and management of the Agency’s
capital projects.
Accounts for funds expended for street improvements.
Accounts for the Agency’s issuance and administration of the 2000
Certificates of Participation.

CITY OF SAN BRUNO, CALIFORNIA
NOTES TO BASIC FINANCIAL STATEMENTS
FOR THE YEAR ENDED JUNE 30, 2011
42
Non-Major:
Special Revenue Funds:
In-lieu
Agency on Aging
Accounts for funds received to substitute for standard fees utilized for
particular purposes.
Accounts for funds received for senior services.
Gas Tax
Federal/State Grants
Library
Police Asset Seizure
Safety Augmentation
Police
SB322 Recycling/Litter
Clean-up
Restricted Donations
Traffic Safety
Emergency Disaster Fund
Debt Service Funds:
General
Capital Projects Funds:
General
Accounts for funds received and expended for street maintenance
purposes as defined in Sections 2103, 2105, 2106, 2107 and 2107.5 of
the Streets and Highway Code.
Accounts for activities for the City’s grants.
Accounts for funds received for Library programs and operations.
Accounts for asset seizure funds to be used on Police programs.
Accounts for state augmentation funds to be used for safety programs.
Accounts for Police revenues to be used on special law enforcement
programs.
Accounts for SB322 funds to be used on recycling and litter clean-up
programs.
Accounts for donations received for specific purposes.
Accounts for traffic safety funds.
Accounts for funds to be used for disaster relief efforts.
Accounts for funds related to City Hall capital lease obligation.
Accounts for funds expended on general City projects.

CITY OF SAN BRUNO, CALIFORNIA
NOTES TO BASIC FINANCIAL STATEMENTS
FOR THE YEAR ENDED JUNE 30, 2011
43
Measurement Focus
Measurement focus is a term used to describe “which” transactions are recorded within the various financial
statements.
On the government-wide Statement of Net Assets and the Statement of Activities, both governmental and
business-like activities are presented using the economic resources measurement focus as defined in item b
below.
In the fund financial statements, the “current financial resources” measurement focus or the “economic
resources” measurement focus is used as appropriate:
a. All governmental funds utilize a “current financial resources” measurement focus. Only current
financial assets and liabilities are generally included on their balance sheets. Their operating
statements present sources and uses of available spendable financial resources during a given
period. These funds use fund balance as their measure of available spendable financial resources at
the end of the period.
b. The enterprise and internal service funds utilize an “economic resources” measurement focus. The
accounting objectives of this measurement focus are the determination of net income, financial
position, and cash flows. All assets and liabilities (whether current or noncurrent) associated with
their activities are reported. Enterprise and internal service fund equity is classified as net assets.
c. Agency funds are not involved in the measurement of results of operations; therefore, measurement
focus is not applicable to them.
Basis of Accounting
In the government-wide Statement of Net Assets and Statement of Activities both governmental and
business-type activities are presented using the accrual basis of accounting. Under the accrual basis of
accounting, revenues are recognized when earned and expenses are recorded when the liability is incurred or
economic asset used. Revenues, expenses, gains, losses, assets, and liabilities resulting from exchange and
exchange-like transactions are recognized when the exchange takes place.
In the fund financial statements, governmental funds are presented on the modified accrual basis of
accounting. Under this modified accrual basis of accounting, revenues are recognized when “measurable
and available.” Measurable means knowing or being able to reasonably estimate the amount. Available
means collectible within the current period, considered to be 60 days, or soon enough thereafter to pay
current liabilities. Major revenue sources meeting this criterion are property taxes, sales taxes, grants and
interest. Expenditures (including capital outlay) are recorded when the related fund liability is incurred.
CITY OF SAN BRUNO, CALIFORNIA
NOTES TO BASIC FINANCIAL STATEMENTS
FOR THE YEAR ENDED JUNE 30, 2011
44
Amounts reported as program revenues include 1) charges to customers or applicants for goods, services, or
privileges provided, 2) operating grants and contributions, and 3) capital grants and contributions. Internally
dedicated resources are reported as general revenues rather than program revenues. Likewise, general
revenues include all taxes.
The enterprise, internal service and agency funds utilize the accrual basis of accounting. Under the accrual
basis of accounting, revenues are recognized when earned and expenses are recorded when the liability is
incurred or economic asset used. Operating revenues in the proprietary fund are those revenues that are
generated from the primary operations of the fund. All other revenues are reported as non-operating
revenues. Operating expenses are those expenses that are essential to the primary operations of the fund. All
other expenses are reported as non-operating expenses.
Private sector standards of accounting and financial reporting issued prior to December 1, 1989, generally
are followed in both the government-wide and proprietary fund financial statements to the extent that those
standards do not conflict with or contradict guidance of the Governmental Accounting Standards Board.
Governments also have the option of following subsequent private-sector guidance for their business-type
activities and enterprise funds, subject to the same limitation. The City has elected not to follow subsequent
private-sector guidance.
Assets, Liabilities, and Equity
Cash Deposits and Investments
The City’s cash and cash equivalents are considered to be cash on hand, demand deposits, and short-term
investments with original maturities of three months or less from the date of acquisition.
The City pools cash and investments from all funds for the purpose of increasing income through investment
activities. Highly liquid money market investments with maturities of one year or less at time of purchase
are stated at amortized cost. All other investments are stated at fair value in accordance with GASB
Statement No. 31, Accounting and Financial Reporting for Certain Investments and for External Investment
Pools. Market value is used as fair value for those securities for which market quotations are readily
available.
The City indirectly participates in an investment pool managed by the State of California titled Local
Agency Investment Fund (LAIF) which has invested a portion of the pool funds in Structured Notes and
Asset-Backed Securities. LAIF's investments are subject to credit risk with the full faith and credit of the
State of California collateralizing these investments. In addition, these Structured Notes and Asset-Backed
Securities are subject to market risk as to changes in interest rates.

CITY OF SAN BRUNO, CALIFORNIA
NOTES TO BASIC FINANCIAL STATEMENTS
FOR THE YEAR ENDED JUNE 30, 2011
45
Interfund Receivables and Payables
During the course of operations, numerous transactions occur between individual funds that may result in
amounts owed between funds. Those related to goods and services type transactions are classified as “due
to and from other funds.” Short-term interfund loans are reported as “interfund receivables and payables.”
Long-term interfund loans (noncurrent portion) are reported as “advances from and to other funds.”
Interfund receivables and payables between funds within governmental activities are eliminated in the
Statement of Net Assets. See Note 10 for details of interfund transactions, including receivables and
payables at year-end.
Receivables
In the government-wide statements, receivables consist of all revenues earned at year-end and not yet
received. Allowances of uncollectible accounts receivable are based upon historical trends and the periodic
aging of accounts receivable. Major receivable balances for the governmental activities include property
taxes, sales and use taxes, transient taxes, franchise taxes, intergovernmental subventions, interest earnings,
ambulance fees, and expense reimbursements.
Business-type activities report property taxes, service charges, and expense reimbursements as its major
receivables. See Note 3 for additional disclosures. In the fund financial statements, material receivables in
governmental funds include revenue accruals such as property tax, sales tax, transient tax, franchise tax, and
intergovernmental subventions since they are usually both measurable and available. Non-exchange
transactions collectible but not available are deferred in the fund financial statements in accordance with the
modified accrual basis, but not deferred in the government-wide financial statements in accordance with the
accrual basis. Interest and investment earnings are recorded when earned only if paid within 60 days since
they would be considered both measurable and available.
Proprietary fund material receivables consist of all revenues earned at year-end and not yet received.
Intergovernmental accounts receivable comprise the majority of proprietary fund receivables. The City’s
experience is that all accounts receivable are collectible; therefore an allowance for doubtful accounts is
unnecessary.
Inventories
The cost of other consumable materials and supplies on hand are immaterial to the financial statements, and
the City has therefore chosen to report these items as expenditures/expenses at the time of purchase.

CITY OF SAN BRUNO, CALIFORNIA
NOTES TO BASIC FINANCIAL STATEMENTS
FOR THE YEAR ENDED JUNE 30, 2011
46
Capital Assets
The City's assets are capitalized at historical cost or estimated historical cost. Policy has set the
capitalization threshold for reporting capital assets at $10,000 if actual is unavailable, except for donated
Capital Assets which are recorded at their estimated fair value at the date of donation. Gifts or contributions
of capital assets are recorded at fair market value on the date donated. Public domain (infrastructure) general
fixed assets include roads, bridges, curbs and gutters, streets, sidewalks, drainage systems, and lighting
systems and are capitalized at $100,000.
The accounting treatment of property, plant and equipment (Capital Assets) depends on whether the assets
are used in governmental fund operations or proprietary fund operations and whether they are reported in the
government-wide or fund financial statements.
Government-Wide Statements
Prior to July 1, 2003, governmental funds’ infrastructure assets were not capitalized. These assets (back to
July 1, 1980) have been valued at estimated historical cost.
Depreciation of all exhaustible Capital Assets is recorded as an allocated expense in the Statement of
Activities, with accumulated depreciation reflected in the Statement of Net Assets. Depreciation is provided
over the assets’ estimated useful lives using the straight-line method of depreciation. The range of estimated
useful lives by type of asset is as follows:
Infrastructure 10 – 50 years
Government buildings and structures 10 – 40 years
Equipment and furnishings 5 – 10 years
Water 5 – 40 years
Stormwater
Wastewater
Cable Television
5 – 40 years
5 – 40 years
5 – 40 years
Fund Financial Statements
In the fund financial statements, Capital Assets used in governmental fund operations are accounted for as
capital outlay expenditures of the governmental fund upon acquisition. Capital Assets used in proprietary
fund operations are accounted for the same way as in the government-wide statements.

CITY OF SAN BRUNO, CALIFORNIA
NOTES TO BASIC FINANCIAL STATEMENTS
FOR THE YEAR ENDED JUNE 30, 2011
47
Long-Term Debt
The accounting treatment of long-term debt depends on whether the assets are used in governmental fund
operations or proprietary fund operations and whether they are reported in the government-wide or fund
financial statements.
All long-term debt to be repaid from governmental and business-type resources is reported as liabilities in
the government-wide statements. The long-term debt consists of capital leases, certificates of participation,
compensated absences and a liability for claims.
Long-term debt for governmental funds is not reported as liabilities in the fund financial statements. The
debt proceeds are reported as revenue and payment of principal and interest reported as expenditures. The
accounting for proprietary funds is the same in the fund statements as it is in the government-wide
statements.
Compensated Absences
The City’s policies regarding vacation time and compensatory time permit employees to accumulate earned
but unused leave. The current portion of this debt is estimated based on historical trend and funded in the
individual fund generating the liability with the long-term portion shown as a long-term liability.
Equity Classification
Government-Wide Statements
Equity is classified as net assets and displayed in three components:
a. Invested in capital assets, net of related debt – consists of capital assets, including restricted capital
assets, net of accumulated depreciation and reduced by the outstanding balances of any bonds,
mortgages, notes, or other borrowings that are attributable to the acquisition, construction, or
improvement of those assets.
b. Restricted net assets – consists of net assets with constraints placed on the use either by 1) external
groups, such as creditors, grantors, contributors, or laws or regulations of other governments; or 2)
law through constitutional provisions or enabling legislation.
c. Unrestricted net assets – all other net assets that do not meet the definition of “restricted” or
“invested in capital assets, net of related debt.”

CITY OF SAN BRUNO, CALIFORNIA
NOTES TO BASIC FINANCIAL STATEMENTS
FOR THE YEAR ENDED JUNE 30, 2011
48
Fund Financial Statements
Governmental fund equity is classified as fund balance. Fund balance is further classified as follows:
Nonspendable – amounts that cannot be spent either because they are in nonspendable form or because they
are legally or contractually required to be maintained intact.
Restricted – amounts that can be spent only for specific purposes because of constitutional provisions or
enabling legislation or because of constraints that are externally imposed by creditors, grantors, contributors,
or the laws or regulations of other governments.
Committed – amounts that can be used only for specific purposes determined by a formal action of the
governing board. The governing board is the highest level of decision-making authority for the City.
Commitments may be established, modified, or rescinded only through resolutions or other action as
approved by the city council.
Assigned – amounts that do not meet the criteria to be classified as restricted or committed but that are
intended to be used for specific purposes. Under the City’s adopted policy, only the city council or city
manager may assign amounts for specific purposes.
Unassigned – all other spendable amounts.
Spending Order Policy
When an expenditure is incurred for purposes for which both restricted and unrestricted fund balance is
available, the City considers restricted funds to have been spent first. When an expenditure is incurred for
which committed, assigned, or unassigned fund balances are available, the City considers amounts to have
been spent first out of committed funds, then assigned funds, and finally unassigned funds, as needed, unless
the city council has provided otherwise in its commitment or assignment actions.
Revenues, Expenditures, and Expenses
Property Tax
Under California law, property taxes are assessed and collected by the counties up to 1% of assessed value,
plus other increases approved by the voters. The property taxes go into a pool, and are then allocated to the
cities based on complex formulas. Accordingly, the City accrues only those taxes which are receivable from
the county within sixty days after year end.
Lien Date March 1
Levy Date July 1
Delinquent Date December 10 and April 10
Property taxes attach annually as an enforceable lien as of March 1. Taxes are levied on July 1, are payable
in two installments, and are delinquent at December 10 and April 10. All general property taxes are then
allocated by the San Mateo County Controller’s Office to the various taxing entities in accordance with
Proposition 13. Property tax revenues are recognized when levied to the extent that they are measurable and
that they will be received in 60 days. Since the County utilizes the Teeter system of allocation, all property
tax revenue is allocated to the City and accounted for as revenue in the fiscal year that it is levied.
CITY OF SAN BRUNO, CALIFORNIA
NOTES TO BASIC FINANCIAL STATEMENTS
FOR THE YEAR ENDED JUNE 30, 2011
49
Expenditures/Expenses
In the government-wide financial statements, expenses are classified by function for both governmental and
business-type activities.
In the fund financial statements, expenditures are classified as follows:
Governmental funds – by character
Current (further classified by function)
Capital outlay
Debt service
In the fund financial statements, governmental funds report expenditures of financial resources.
Interfund Transfers
Resources are reallocated between funds by reporting them as interfund transfers. For the purposes of the
Statement of Activities, all interfund transfers between individual governmental funds have been eliminated
with internal balances (between governmental and business-type activities due to internal service fund
eliminations) remaining on the statement of net assets.
Prior Year Data
Selected information regarding the prior year has been included in the accompanying financial statements.
This information has been included for comparison purposes and does not represent a complete presentation
in accordance with generally accepted accounting principles. Accordingly, such information should be read
in conjunction with the City’s prior year financial statements, from which this selected data was derived.
Certain minor reclassifications of prior year data may have been made in order to enhance their
comparability with current year figures.
Use of Estimates
The preparation of financial statements in conformity with accounting principles generally accepted in the
United States requires management to make estimates and assumptions that affect the reported amounts of
assets, liabilities, revenues and expenditures/expenses during the reporting period. Actual results could
differ from those estimates.

CITY OF SAN BRUNO, CALIFORNIA
NOTES TO BASIC FINANCIAL STATEMENTS
FOR THE YEAR ENDED JUNE 30, 2011
50
Budgetary Policies
The City follows these procedures in establishing the budgetary data reflected in the financial statements:
1. Public meetings are conducted to obtain public comments. The City Council annually adopts the
budget for the ensuing fiscal year prior to July 1st.
2. Legally adopted budgets and formal budgetary integration is employed as a management control
device during the year for all Governmental, Proprietary and Fiduciary Fund Types.
3. Budgets for the General, Major Redevelopment Special Revenue, and Capital Project Funds are
adopted on a basis consistent with accounting principles generally accepted in the United States of
America (GAAP).
4. Under Article XIII B of the California Constitution (the GANN Spending Limitation Initiative), the
City is restricted as to the amount of annual appropriations from the proceeds of taxes, and if
proceeds of taxes exceed allowed appropriations, the excess must either be refunded to the State
Controller, returned to the taxpayers through revised tax rates or revised fees schedules, or an
excess in one year may be offset against a deficit in the following year. For the fiscal year ended
June 30, 2011, based on the calculations by City Management, proceeds of taxes did not exceed the
appropriations limit.
5. Budgeted revenue and expenditure amounts represent the original budget modified by adjustments
authorized during the year.
6. Appropriations, except for those encumbered under purchase orders, lapse at the end of the fiscal
year. Encumbered amounts are then carried over for the coming year.
7. Budgeted appropriations for the various governmental funds become effective each July 1. The City
Council may amend the budget during the fiscal year. The legal level of budgetary control has been
established at the fund level.
8. Budgets are adopted on a basis consistent with generally accepted accounting principles (GAAP) for
all governmental funds except for the Federal and State Grants, Police Asset Seizure and Streets
Special Revenue Fund, which is not budgeted.

CITY OF SAN BRUNO, CALIFORNIA
NOTES TO BASIC FINANCIAL STATEMENTS
FOR THE YEAR ENDED JUNE 30, 2011
51
NOTE 2 - CASH AND INVESTMENTS
At June 30, 2011, the City’s pooled cash and investments, classified by maturity, consisted of the following
stated at fair market value: Fair
Less than 1 1 to 2 2 to 3 Deposits Market Value
Cash equivalents and investment pooled
Cash - First National Bank -$ -$ -$ 1,876,363$ 1,876,363$
Cash - Bank of America - - - 91,119 91,119
Cash - Wells Fargo - - - 450,000 450,000
Petty cash - - - 3,632 3,632
Cash held by South San Francisco - - - (1,596) (1,596)
Total pooled cash - - - 2,419,518 2,419,518
Interest obligations
Federal Home Loan Banks 2,027,040 1,002,250 3,011,460 - 6,040,750
Federal Home Loan Mortgage Corporation - - 1,003,280 - 1,003,280
Federal Natl. Mortgage Assoc. - - 998,270 - 998,270
Federal Natl. Mortgage Corporation - - 1,001,080 - 1,001,080
Black Rock Institutional Funds T-Funds 1,055,558 - - - 1,055,558
Fiscal agent investments - Money Market Accounts 4,700,095 - - - 4,700,095
Morgan Stanley - FDIC Guaranteed Note 1,002,300 - - - 1,002,300
County of San Mateo Investment Pool 16,066,138 - - - 16,066,138
State of California Local Agency Investment Fund 16,169,834 - - - 16,169,834
Total pooled investments-interest obligations 41,020,965 1,002,250 6,014,090 - 48,037,305
Total cash equivalents and investment pooled 41,020,965$ 1,002,250$ 6,014,090$ 2,419,518$ 50,456,823$
Amounts reported in:
Governmental activities 34,133,537$
Business-type activities 15,918,314
Fiduciary activities - Agency funds 404,972
Total 50,456,823$
Maturity (in years)
Interest rate risk: In accordance with its investment policy, the City manages its exposures to declines in fair
values by limiting the weighted average maturity of its investment portfolio to less than 2 years.
Concentration of credit risk: The City’s investment policy does not allow for an investment in any one
issuer that is in excess of five percent of the government’s total investments. The investments made by the
City Treasurer are limited to those allowable under State statutes as incorporated into the City’s Investment
Policy, which is accepted annually by the City Council.
Custodial credit risk – deposit: For deposits, there is the risk that in the event of a bank failure, the City’s
deposits may not be returned to it. The City currently has no deposit policy for custodial credit risk. The City
is not exposed to significant custodial risk.
Custodial credit risk – investments: For investments, there is the risk that, in the event of the failure of the
counterparty, the City will not be able to recover the value of its investments or collateral securities that are
in the possession of an outside counterparty. For the investments maintained by the City, no security was
uninsured or unregistered or held by a brokerage firm which is also the counterparty for the security.

CITY OF SAN BRUNO, CALIFORNIA
NOTES TO BASIC FINANCIAL STATEMENTS
FOR THE YEAR ENDED JUNE 30, 2011
52
Credit risk: As of June 30, 2011, the City’s investments in money market accounts were rated AAA by
Standard & Poor’s and Fitch Ratings, and Aaa by Moody’s Investors Service. The County of San Mateo
Investment Pool and State of California Local Agency Investment Fund are not rated.
Amount
AAA rated:
Available for Operations:
U.S. Government Agency Obligations 9,043,380$
Corporate Note 1,002,300
Restricted:
Money Market Funds 5,755,653
Not Rated:
County of San Mateo Investment Pool 16,066,138
California Local Agency Investment Funds 16,169,834
Exempt from credit rate disclosure::
Demand Deposits 2,419,518
Total Cash and Investments 50,456,823$
Investment Types
Investment policy: Investments are reported at fair value. California statutes authorize cities to invest idle or
surplus funds in a variety of credit instruments as provided for in the California Government Code, Section
53600, Chapter 4 – Financial Affairs. The table below identifies the investment types that are authorized for
the City by the California Government Code (or the City’s investment policy, where more restrictive) that
address interest rate risk, credit risk, and concentration of credit risk.
During the year ended June 30, 2011, the City’s permissible investments included the following instruments:
Maximum Maximum
Maximum Percentage of Investment in
Authorized Investment Type Maturity Portfolio One Issuer
U.S. Treasury obligations 5 years None None
U.S. Agency securities 5 years None None
Non-negotiable certificates of deposit 1 years None None
LAIF N/A None None
Local government investment pools N/A None None
Collateralized negotiable investments 5 years None 50%

CITY OF SAN BRUNO, CALIFORNIA
NOTES TO BASIC FINANCIAL STATEMENTS
FOR THE YEAR ENDED JUNE 30, 2011
53
During the year ended June 30, 2011, the City’s permissible investments for fiscal agents included the
following instruments:
Minimum Maximum
Maximum Credit Investment in
Authorized Investment Type Maturity Quality One Issuer
U.S. Treasury obligations None None None
U.S. Agency securities None None None
Non-negotiable certificates of deposit 1 years None None
LAIF N/A None None
Bankers acceptances 1 year P1/A1 None
Local government securities None Highest None
Commercial paper None P1 None
Investment agreements None None None
Certificates of deposits, savings account, and
Deposit accounts None None None
Money market accounts None Aaa, Aa1 None
The City complied with the provisions of California Government Code (or the City’s investment policy,
where more restrictive) pertaining to the types of investments held, institutions in which deposits were made
and security requirements. The City will continue to monitor compliance with applicable statutes pertaining
to public deposits and investments.
NOTE 3 - ACCOUNTS RECEIVABLE
Accounts receivable consisted of the following at June 30, 2011:
Governmental Business-type Fiduciary
Activities Activities Activities Total
Taxes 996,152$ -$ -$ 996,152$
Interest 89,083 - - 89,083
Intergovernmental subventions 11,859 - - 11,859
Intergovernmental grants 250,414 - - 250,414
Service charges - 2,926,687 500,644 3,427,331
Loans 1,191,478 - - 1,191,478
Expense Reimbursements 2,563,771 - - 2,563,771
5,102,757$ 2,926,687$ 500,644$ 8,530,088$

CITY OF SAN BRUNO, CALIFORNIA
NOTES TO BASIC FINANCIAL STATEMENTS
FOR THE YEAR ENDED JUNE 30, 2011
54
NOTE 4 - CAPITAL ASSETS
2011 2010 2011 2010 2011 2010
Nondepreciable:
Land 561,197$ 561,197$ 576,842$ 576,842$ 1,138,039$ 1,138,039$
Construction in progress 3,012,003 2,058,731 2,968,887 4,290,864 5,980,890 6,349,595
Depreciable property:
Infrastructure, net 30,347,921 32,160,949 - - 30,347,921 32,160,949
Sewer Plant - - 16,263,033 17,136,954 16,263,033 17,136,954
Building and improvements, net 8,546,074 8,940,976 27,816,961 26,672,160 36,363,035 35,613,136
Machinery and equipment, net 2,799,783 3,295,017 5,204,005 4,814,784 8,003,788 8,109,801
Total 45,266,978$ 47,016,870$ 52,829,728$ 53,491,604$ 98,096,706$ 100,508,474$
Activities Activities Total
Governmental Business-type

CITY OF SAN BRUNO, CALIFORNIA
NOTES TO BASIC FINANCIAL STATEMENTS
FOR THE YEAR ENDED JUNE 30, 2011
55
Capital asset activity for the year ended June 30, 2011 for governmental activities was as follows:
Balance Balance 1-Jul-10 Additions Deletions 30-Jun-11
GOVERNMENTAL ACTIVITIES:
Cost of property
Non-depreciable propertyLand: 561,197$ -$ -$ 561,197$ Construction in progress 2,058,731 953,272 - 3,012,003
Depreciable property:Infrastructure 67,982,013 - - 67,982,013 Buildings and improvements 13,736,901 - - 13,736,901 Machinery and equipment 8,819,430 422,700 - 9,242,130
Total cost 93,158,272 1,375,972 - 94,534,244
Accumulated depreciationInfrastructure (35,821,064) (1,813,028) - (37,634,092) Buildings and improvements (4,795,926) (394,902) - (5,190,828) Machinery and equipment (5,524,412) (917,934) - (6,442,346)
Total accumulated depreciation (46,141,402) (3,125,864) - (49,267,266)
Net Book Value
Non-depreciable propertyLand: 561,197 - - 561,197 Construction in progress 2,058,731 953,272 - 3,012,003
Depreciable property:Infrastructure 32,160,949 (1,813,028) - 30,347,921 Buildings and improvements 8,940,975 (394,902) - 8,546,073 Machinery and equipment 3,295,018 (495,234) - 2,799,784
Net book value 47,016,870$ (1,749,892)$ -$ 45,266,978$
Depreciation expense for governmental activities for the year ended June 30, 2011 was as follows:
General government 256,279$ Public Safety 210,534 Public works 66,623 Highway and streets 1,829,002 Parks and recreation 390,351 Library 19,528 Community development 353,547
Total depreciation expense 3,125,864$

CITY OF SAN BRUNO, CALIFORNIA
NOTES TO BASIC FINANCIAL STATEMENTS
FOR THE YEAR ENDED JUNE 30, 2011
56
Capital asset activity for the year ended June 30, 2011 for business-type activities was as follows:
Balance Balance 1-Jul-10 Additions Deletions 30-Jun-11
BUSINESS-TYPE ACTIVITIES:
Cost of property
WaterLand 76,842$ -$ -$ 76,842$ Construction in progress 1,084,517 621,436 (177,765) 1,528,188 Buildings and Improvements 17,037,532 1,235,693 - 18,273,225 Machinery and equipment 3,103,721 98,535 - 3,202,256
Total cost 21,302,612 1,955,664 (177,765) 23,080,511
StormwaterConstruction in progress 225,446 45,940 - 271,386 Buildings and Improvements 685,610 - 685,610 Machinery and equipment 490,903 - - 490,903
Total cost 1,401,959 45,940 - 1,447,899
WastewaterConstruction in progress 1,347,004 244,084 (421,775) 1,169,313 Sewer plant 23,225,137 55,086 - 23,280,223 Buildings and Improvements 15,784,405 1,092,968 16,877,373 Machinery and equipment 423,711 181,700 - 605,411
Total cost 40,780,257 1,573,838 (421,775) 41,932,320
Cable TelevisionLand 500,000 - - 500,000 Construction in progress 1,633,897 - (1,633,897) - Buildings and Improvements 3,030,888 - - 3,030,888 Machinery and equipment 12,387,627 1,939,197 - 14,326,824
Total cost 17,552,412 1,939,197 (1,633,897) 17,857,712 Total cost of property 81,037,240$ 5,514,639$ (2,233,437)$ 84,318,442$
Total Cost By Category
Non-depreciable propertyLand: 576,842$ -$ -$ 576,842$ Construction in progress 4,290,864 911,460 (2,233,437) 2,968,887
Depreciable property:Sewer plant 23,225,137 55,086 - 23,280,223 Buildings and improvements 36,538,435 2,328,661 - 38,867,096 Machinery and equipment 16,405,962 2,219,432 - 18,625,394
Total cost 81,037,240$ 5,514,639$ (2,233,437)$ 84,318,442$

CITY OF SAN BRUNO, CALIFORNIA
NOTES TO BASIC FINANCIAL STATEMENTS
FOR THE YEAR ENDED JUNE 30, 2011
57
Accumulated Depreciation for business-type activities was as follows:
Balance Balance 1-Jul-10 Additions Deletions 30-Jun-11
Accumulated Depreciation
WaterBuildings and Improvements (5,601,627)$ (553,800)$ -$ (6,155,427)$ Machinery and equipment (2,402,832) (168,304) - (2,571,136)
Total (8,004,459) (722,104) - (8,726,563)
StormwaterBuildings and Improvements (3,336) (20,410) - (23,746)
Machinery and equipment (348,973) (19,981) - (368,954)
Total (352,309) (40,391) - (392,700)
Wastewater
Sewer plant (6,088,183) (929,005) - (7,017,188)
Buildings and Improvements (2,543,416) (464,708) - (3,008,124)
Machinery and equipment (354,626) (24,321) - (378,947)
Total (8,986,225) (1,418,034) - (10,404,259)
Cable Television
Buildings and Improvements (1,717,897) (144,944) - (1,862,841)
Machinery and equipment (8,484,746) (1,617,605) - (10,102,351)
Total (10,202,643) (1,762,549) - (11,965,192)
Total accumulated depreciation (27,545,636)$ (3,943,078)$ -$ (31,488,714)$
Total Accumulated Depreciation By Category
Depreciable property:
Sewer plant (6,088,183)$ (929,005)$ -$ (7,017,188)$
Buildings and improvements (9,866,276) (1,183,862) - (11,050,138)
Machinery and equipment (11,591,177) (1,830,211) - (13,421,388)
Total accumulated depreciation (27,545,636)$ (3,943,078)$ -$ (31,488,714)$
Net Book Value
Non-depreciable property
Land: 576,842$ -$ -$ 576,842$
Construction in progress 4,290,864 911,460 (2,233,437) 2,968,887
Depreciable property:
Sewer plant 17,136,954 (873,919) - 16,263,035
Buildings and improvements 26,672,159 1,144,799 - 27,816,958
Machinery and equipment 4,814,785 389,221 - 5,204,006
Total net book value 53,491,604$ 1,571,561$ (2,233,437)$ 52,829,728$

CITY OF SAN BRUNO, CALIFORNIA
NOTES TO BASIC FINANCIAL STATEMENTS
FOR THE YEAR ENDED JUNE 30, 2011
58
Depreciation and amortization expense for business-type activities for the year ended June 30, 2011 was as
follows:
Water 722,104$
Stormwater 40,391
Wastewater 489,029
Cable Television 1,762,549
Total depreciation expense 3,014,073
Wastewater - amortization 929,005
Total depreciation and amortization 3,943,078$
NOTE 5 - ACCOUNTS PAYABLE AND ACCRUED LIABILITIES
Accounts payable and accrued liabilities consisted of the following at June 30, 2011:
Governmental Business-type Fiduciary
Activities Activities Activities Total
Accounts payable 4,590,410$ 1,302,582$ 844,131$ 6,737,123$
Deposits 387,823 100,284 35,773 523,880
Accrued payroll 1,056,622 - - 1,056,622
Other accrued liabilities - 873,673 25,712 899,385
Total 6,034,855$ 2,276,539$ 905,616$ 9,217,010$
These amounts resulted in the following concentrations in payables:
Vendors 83% Deposits 4% Employees 9%
NOTE 6 - LONG-TERM LIABILITIES
The following is a summary of changes in long-term liabilities for governmental activities for the year ended
June 30, 2011:
Balance Balance Due within
July 01, 2010 Additions Retirements June 30, 2011 one year
Governmental activities
2000 Certificates of participation 8,145,000$ -$ (225,000)$ 7,920,000$ 240,000$
Capital lease obligations 714,623 - (349,031) 365,592 365,592
Compensated absences 2,353,265 - (68,519) 2,284,746 1,083,032
Liability for claims 1,431,445 144,819 - 1,576,264 -
Other post employment benefits 3,939,400 3,043,300 - 6,982,700 -
Total governmental activities 16,583,733$ 3,188,119$ (642,550)$ 19,129,302$ 1,688,624$

CITY OF SAN BRUNO, CALIFORNIA
NOTES TO BASIC FINANCIAL STATEMENTS
FOR THE YEAR ENDED JUNE 30, 2011
59
Governmental activities:
2000 Certificates of Participation
During December 2000 the City issued $9,600,000 in Series 2000 Certificates of Participation for the
construction of a police facility. Principal payments are due annually on February 1 and interest payments are
due semi-annually on February 1 and August 1. Interest rates range from 5.25% to 7.00%.
The Agency has agreed under a separate agreement to reimburse the City for all costs associated with the
construction of the San Bruno/BART Police Station including all debt service costs.
Capital Lease Obligation
During August 2005 the City entered into a $2,253,665 capital lease with GE Capital Public Finance, Inc. to
retire a lease for energy conservation improvements and finance City Hall remodeling and improvements.
Principal and interest payments are due semi-annually on June 1 and December 1 with an interest rate of 4.69%.
Compensated Absences
Compensated absences at June 30, 2011, amounted to $2,284,746 and $464,486 for the governmental activities
and business-type activities respectively. The City utilizes a methodology based upon actual vacation and sick
leave usage in the fund in which the related compensation is paid. All governmental balances are liquidated
through the General Fund. There is no fixed payment schedule for compensated absences.
Claims Payable
With the implementation of Governmental Accounting Standards Board Statement No. 10, “Accounting for
Financial Reporting for Risk Financing and Related Insurance Issues” the Self-insurance Internal Service Fund
reflects the financial effect of risk financing activities of $1,576,264 (see Note 11 for further discussion).
Claims are paid in the form of internal charges based upon departmental claims activity.

CITY OF SAN BRUNO, CALIFORNIA
NOTES TO BASIC FINANCIAL STATEMENTS
FOR THE YEAR ENDED JUNE 30, 2011
60
The annual debt service requirements to maturity for all Governmental Activity amounts, except compensated
absences and claims payable, at June 30, 2011, were as follows:
Year Ending
June 30,
Principal Interest Principal Interest Principal Interest
2012 240,000$ 409,638$ 365,592$ 12,909$ 605,592$ 422,547$
2013 250,000 398,358 - - 250,000 398,358
2014 260,000 386,357 - - 260,000 386,357
2015 275,000 373,617 - - 275,000 373,617
2016 285,000 359,868 - - 285,000 359,868
2017-2021 1,670,000 1,566,413 - - 1,670,000 1,566,413
2022-2026 2,155,000 1,081,500 - - 2,155,000 1,081,500
2027-2031 2,785,000 453,600 - - 2,785,000 453,600
Total 7,920,000$ 5,029,351$ 365,592$ 12,909$ 8,285,592$ 5,042,260$
Due with in one year 240,000$ 409,638$ 365,592$ 12,909$ 605,592$ 422,547$
Due after one year 7,680,000 4,619,713 - - 7,680,000 4,619,713
Total 7,920,000$ 5,029,351$ 365,592$ 12,909$ 8,285,592$ 5,042,260$
Governmental Activities
Totals
2000
Certificates of
Participation
Capital
Lease
Obligations
The following is a summary of changes in long-term debt for business-type activities for the year ended June
30, 2011:
Balance Balance Due within
July 01, 2010 Additions Retirements June 30, 2011 one year
Business-type activities:
2002 Certificates of participation 8,475,000$ -$ (215,000)$ 8,260,000$ 225,000$
Capital lease obligations 2,246,853 - (630,010) 1,616,843 742,591
Compensated absences 436,095 - 28,391 464,486 240,845
Due to City of South San Francisco
1993 Loan 734,015 - (175,449) 558,566 180,713
1999 Loan 6,433,306 - (422,287) 6,011,019 433,264
2007 Loan 5,985,338 - (308,837) 5,676,501 316,559
Other long-term liabilities - 160,000 - 160,000 -
Total business-type activities 24,310,607$ 160,000$ (1,723,192)$ 22,747,415$ 2,138,972$
During May 2002 the City issued $9,800,000 in Series 2002 Certificates of Participation for the construction of
various improvements to the City’s Wastewater System. Principal and interest payments are due annually on
January 1 and July 1. Interest rates range from 2.25% to 5.00%.

CITY OF SAN BRUNO, CALIFORNIA
NOTES TO BASIC FINANCIAL STATEMENTS
FOR THE YEAR ENDED JUNE 30, 2011
61
Capital Lease Obligations
At June 30, 2011, Business-type Capital Lease Obligations consisted of the following:
Balance Balance Due within
July 01, 2010 Additions Retirements June 30, 2011 one year
Business-type activities:
Cable TV set-top boxes 775,365$ -$ (377,818)$ 397,547$ 397,547$
Commercial services 1,471,488 - (252,192) 1,219,296 345,044
Total business-type activities 2,246,853$ -$ (630,010)$ 1,616,843$ 742,591$
Cable TV Set-top boxes
On December 1, 2008 the City entered into a $1,800,000 capital lease with GE Capital Public Finance, Inc. to
purchase set-top boxes for the Cable TV enterprise operation. Principal and interest payments are due semi-
annually on June 1 and December 1 with an interest rate of 5.15%.
Commercial Services Project
On August 25, 2009, the City entered into a $1,609,267 capital lease with Key Government Finance, Inc. to
purchase servers, routers, switches, and related equipment for the Commercial Data and Voice Project.
Principal and interest payments are due on the 25th of each month with an interest rate of 4.756%.

CITY OF SAN BRUNO, CALIFORNIA
NOTES TO BASIC FINANCIAL STATEMENTS
FOR THE YEAR ENDED JUNE 30, 2011
62
The annual debt service requirements to maturity for all Business-type Activity amounts, except compensated
absences and claims payable, at June 30, 2011, were as follows:
Year Ending
June 30,
Principal Interest Principal Interest Principal Interest Principal Interest
2012 225,000$ 397,303$ 742,590$ 75,206$ 930,536$ 314,956$ 1,898,126$ 787,465$
2013 235,000 388,215 407,040 38,355 955,136 290,356 1,597,176 716,926
2014 245,000 378,493 430,267 15,128 980,389 265,102 1,655,656 658,723
2015 255,000 368,051 36,946 171 808,844 239,178 1,100,790 607,400
2016 265,000 356,803 - - 829,533 218,489 1,094,533 575,291
2017-2021 1,510,000 1,586,470 - - 4,477,012 763,098 5,987,012 2,349,568
2022-2026 1,910,000 1,171,390 - - 3,264,636 206,818 5,174,636 1,378,208
2027-2031 2,455,000 623,819 - - - - 2,455,000 623,819
2032-2033 1,160,000 60,219 - - - - 1,160,000 60,219
Total 8,260,000$ 5,330,762$ 1,616,843$ 128,860$ 12,246,086$ 2,297,997$ 22,122,929$ 7,757,619$
Due with in one year 225,000$ 397,303$ 742,590$ 75,206$ 930,536$ 314,956$ 1,898,126$ 787,465$
Due after one year 8,035,000 4,933,459 874,253 53,654 11,315,550 1,983,041 20,224,803 6,970,154
Total 8,260,000$ 5,330,762$ 1,616,843$ 128,860$ 12,246,086$ 2,297,997$ 22,122,929$ 7,757,619$
Certificates of Due to
Participation South San Francisco Totals
Business-type Activities
Capital Lease
Obligations
2002
NOTE 7 - CITY OF SOUTH SAN FRANCISCO SEWER PLANT AGREEMENT
The City entered into a joint-ownership agreement with the City of South San Francisco (SSF) to operate a
water quality control plant and appurtenant facilities to service both communities. The agreement was entered
into in January 1947 and has numerous subsequent amendments that detail various aspects in sharing the capital
investment (including related debt service) and operating expenses related to the joint sewage plant. Operating
costs of the enterprise are shared in accordance with a formula and division of operation and maintenance cost
set forth in an agreement dated April 3, 1972. The most recent arrangement indicates that the City shares in
25.82% of the plant capacity. There are no separately issued financial statements for this agreement.
The City’s share of operating expenses for 2010-11 was $3,107,883 and is included in treatment expenses in the
Statement of Revenues, Expenses and Changes in Net Assets in the Fund Financial Statements. The City also
shares in the cost of on-going capital improvements, which are capitalized and depreciated over a 25-year
period. During 2010-11, the City paid $1,330,198 to SSF for these improvements.

CITY OF SAN BRUNO, CALIFORNIA
NOTES TO BASIC FINANCIAL STATEMENTS
FOR THE YEAR ENDED JUNE 30, 2011
63
To finance the expansion of the water quality control plant, the State Water Resources Control Board issued
loans directly to SSF totaling $81,253,444 ($8.8 million in October 1994, $50.5 million in August 2003 and
$21.8 million in April 2007). Loan proceeds were disbursed as the projects progressed and debt service
payments commenced one year after project completion. As a result of the joint ownership agreement, the City
is obligated to SSF for its portion of the loans and are classified as Due to SSF as shown in Note 6. The City’s
portion that was financed through this agreement totaled $19,170,177 depreciable and payable over a 25 year
period.
Balance Balance 1-Jul-10 Additions Deletions 30-Jun-11
Capital investmentsFinanced 19,170,177$ -$ -$ 19,170,177$ Contributed 4,054,960 55,086 - 4,110,046
Total capital investments 23,225,137 55,086 - 23,280,223
Accumulated DepreciationFinanced (5,452,136) (766,807) - (6,218,943) Contributed (636,047) (162,198) - (798,245)
Total accumulated depreciation (6,088,183) (929,005) - (7,017,188)
Net Book Value
Financed 13,718,041 (766,807) - 12,951,234
Contributed 3,418,913 (107,112) - 3,311,801
Total net book value 17,136,954$ (873,919)$ -$ 16,263,035$
The City’s share of the loan obligations is summarized as follows:
SSF
SSF City's Loan Balance City's City's Original Loan Share June 30, 2011 Share Share %
1993 Capital Project State Water Resource Loan 8,842,852$ 2,918,141$ 1,692,622$ 558,566$ 33%
1999 Capital Project State Water Resource Loan 50,553,782 9,104,859 33,375,570 6,011,019 18%
2007 Capital Project State Water Resource Loan 21,856,810 7,147,177 17,359,331 5,676,501 33%
81,253,444$ 19,170,177$ 52,427,523$ 12,246,086$

CITY OF SAN BRUNO, CALIFORNIA
NOTES TO BASIC FINANCIAL STATEMENTS
FOR THE YEAR ENDED JUNE 30, 2011
64
NOTE 8 - DEFICIT NET ASSETS/FUND BALANCES
Deficit net assets balances consisted of the following:
Governmental Activities
Major Funds:
Redevelopment Agency Capital Projects Fund ($1,825,397) to be funded through future property tax increment.
Nonmajor Funds:
Federal/State Grants Special Revenue Fund ($18,356) will be funded through future revenue on cost-
reimbursement grants.
Business-type Activities
Cable Television Enterprise Fund had an unrestricted net assets deficit in the amount of ($3,105,174) to be
eliminated through future service charges.
NOTE 9 - EXCESS EXPENDITURES OVER APPROPRIATIONS
The following non-major governmental funds had an excess of expenditures over appropriations:
Non-major Funds:
Agency on Aging Special Revenue Fund ($43,595), which was covered by current year revenues.
Police Asset Seizure Special Revenue Fund ($3,646), which was covered by current year revenues.
Police Special Revenue Fund ($5,225), which was covered by current year revenues.
Restricted Donations Special Revenue Fund ($424,002), which was covered by current year revenues.
Traffic Safety Special Revenue Fund ($74,414), which was covered by current year revenues.
Federal and State Special Revenue Fund ($9,512), which was covered by current year revenues.

CITY OF SAN BRUNO, CALIFORNIA
NOTES TO BASIC FINANCIAL STATEMENTS
FOR THE YEAR ENDED JUNE 30, 2011
65
NOTE 10 - INTERFUND TRANSACTIONS
Due to/from other funds
Due to and due from other funds consisted of the following as of June 30, 2011:
Due from Due to
other funds other funds
Major Funds
Governmental Activities
General Fund 5,164,993$ -$
Business-type Activities
Cable Television - 2,577,185
Nonmajor Funds:
Governmental Activities
Special Revenue Funds
Emergency Disaster Fund - 2,548,903
Agency on Aging - 30,061
Federal/State Grants - 8,844
Total 5,164,993$ 5,164,993$
Due to and from balances are a result of uncollected amounts or unreimbursed costs to be received or paid
within 90 days of year end.
Advances to/from other funds
The General Equipment Reserve Internal Service Fund has advanced the Redevelopment Agency Special
Revenue Fund and Redevelopment Agency Capital Projects Fund for the financing of Redevelopment
operations, which will be repaid through future tax increment revenues.
Advances To Advances From
Other Funds Other Funds
Major Funds
Governmental Activities
Special Revenue -$ 1,060,300$
Capital Projects - 1,916,733
Nonmajor Funds:
Governmental Activities
Internal Service Fund
General Equipment Revolving 2,977,033 -
Total 2,977,033$ 2,977,033$

CITY OF SAN BRUNO, CALIFORNIA
NOTES TO BASIC FINANCIAL STATEMENTS
FOR THE YEAR ENDED JUNE 30, 2011
66
Transfers In/Out other funds
Transfers consisted of the following at June 30, 2011:
Transfer From Transfer To Amount
General Fund Street Improvement Capital Projects 75,000$ d
Non-Major Governmental Funds 148,000 d
Internal service funds 430,584 b
653,584
RDA Special Revenue RDA Capital Projects 684,064 d
RDA Debt Service 647,490 c
1,331,554
RDA Capital Projects Street Improvement Capital Projects 389,500 d
Non-Major Governmental Funds 294,564 d
684,064
Measure A Transportation Tax Street Improvement Capital Projects 637,010 d
Non-Major Governmental Funds General Fund 467,586 a
Street Improvement Capital Projects 127,675 d
Non-Major Governmental Funds 135,156 d
Internal service funds 197,589 b
928,006
Water Fund Wastewater Fund 10,000 d
Internal Service Fund Non-Major Governmental Funds 90,000 d
Cable TV Fund 91,576 d
181,576
Total funds transferred 4,425,794$
Interfund transfers were principally used for the following purposes:
(a) Reimburse Program Expenditure
(b) Reimburse Equipment Replacement Expenditure
(c) Reimburse Debt Service Expenditure
(d) Capital Project Funding

CITY OF SAN BRUNO, CALIFORNIA
NOTES TO BASIC FINANCIAL STATEMENTS
FOR THE YEAR ENDED JUNE 30, 2011
67
Transfers In/Out other funds
Transfers reflect amounts recorded in Special Revenue and Internal Service Funds for specific operating
activities, shared capital projects or debt service and costs amongst funds, outlined as follows:
Redevelopment Agency transfers consisted of amounts to General and Streets Capital for El Camino Real Phase
1 Median and Pedestrian Improvement, Street Median and Grand Boulevard Improvements, Transit Corridor
Pedestrian Connection, Caltrain Grade Separation project and creation of accessible pedestrian ramps at several
locations citywide. In addition to funding capital projects, approximately $647,000 was transferred to a debt
service fund for financing the police facility near Tanforan.
Transfers out from General Fund Reserves and One-Time Revenue Fund were used to support capital projects
such as the Diesel Storage Tank Replacement, Wildland Fire Hazard Mitigation Plan, Groundwater Monitoring
for Underground Storage Tank, and Bart Closeout.
The Library Special Revenue Fund transfer out to the General Fund was to support library service expenditures.
Revenues deposited in this fund come from the California State Library for resource sharing and inter-library
loan cooperation. Funds were also used to update Library facilities and installation of a wheelchair lift.
Measure A Transportation, Gas Tax and Traffic Congestion Relief Fund transfers paid for maintaining and
repairing City travel ways, which provided a safe and aesthetically pleasing appearance for residents and
businesses. Several major projects that received funding from the Streets Special Revenue Fund were
Fleetwood Drive and Neighborhood Traffic Calming Programs, Sidewalk Repair Program, Cycle 1 Federal Aid
Street Rehabilitation and American Reinvestment and Recovery Act (ARRA) Paving Project.
Other Special Revenue Funds supported General Fund public safety operations and the Senior Center nutrition
and transportation programs. A transfer from the Water Fund was made to Wastewater Capital for the shared
Renewable Energy Study for Utility Facilities project. Lastly, General Equipment Reserve and Technology
Equipment reserve transfers were made to fund the swimming pool for resurfacing and phone system
replacement projects, respectively.
NOTE 11 - RISK MANAGEMENT
The City participates in the Association of Bay Area Government Plan Corporation (ABAG Plan), a non-profit
benefit corporation established to provide liability insurance coverage, claims, risk management, and legal
defense to its participating members. The ABAG Plan provides $5,000,000 of general liability and automobile
coverage, $20,000,000 excess liability coverage per occurrence, $25,000,000 of catastrophic liability coverage,
and is responsible for paying the claims in excess of the City’s $100,000 self-insurance retention. ABAG Plan
also provides for property coverage up to $1 billion per occurrence subject to lower categorical sub-limits in
excess of the City’s self-insurance retention of $5,000 for property and vehicle loss.
The retained earnings/net assets of the self-insurance funds, which are categorized as Governmental Activities,
represent amounts set aside for possible additional losses after providing for actuarially determined liabilities
for claims including claims adjustment expenses.

CITY OF SAN BRUNO, CALIFORNIA
NOTES TO BASIC FINANCIAL STATEMENTS
FOR THE YEAR ENDED JUNE 30, 2011
68
No claim settlement exceeded either this self-insured amount or the insurance coverage for any of the past three
years.
Current Year Claim Payments
Beginning of Claims and Charnges for Current and End of
Fiscal Year the Year in Estimates Prior Years the Year
2008-2009 1,345,147$ 1,388,318$ (890,183)$ 1,843,282$
2009-2010 1,843,282 649,227 (1,061,063) 1,431,446
2010-2011 1,431,446 491,671 (346,853) 1,576,264
NOTE 12 - PUBLIC EMPLOYEES’ RETIREMENT SYSTEM
Plan Description
All permanent City employees are eligible to participate in pension plans offered by California Public
Employees’ Retirement System (CALPERS). The miscellaneous employees of the City are part of an agent
multiple-employer defined benefit pension plan. The safety employees are part of a cost-sharing multiple-
employer defined benefit plan. CALPERS acts as a common investment and administrative agent for its
participating member employers. CalPERS provides retirement and disability benefits, annual cost-of-living
adjustments, and death benefits to plan members and beneficiaries. The City’s employees participate in the
separate Safety (police and fire) and Miscellaneous (all other) Employee Plans. Benefit provisions under both
Plans are established by State statute and City resolution. Benefits are based on years of credited services,
equal to one year of full time employment. Copies of CALPERS’ annual financial report may be obtained from
their executive office 400 P Street, Sacramento, CA, 95814.
Funding Policy
Participants are required to contribute 8% (9% for safety employees) of their annual covered salary. The City
makes the contributions required of some City employees on their behalf and for their account. The City is
required to contribute at an actuarially determined rate; the current rate is 14.708% for miscellaneous
employees, and 30.968% for safety employees, of annual covered payroll. The contribution requirements of
plan members and the City are established and may be amended by CALPERS.
Annual Pension Cost
The City’s annual pension cost of $4,415,256 for CALPERS was equal to the City’s required and actual
contribution. The required contribution was determined as part of the June 30, 2009 actuarial valuation using
the entry age normal actuarial cost method. The actuarial assumptions included (a) 7.75% of investment rate of
return (net of administrative expenses) and (b) 3.25% to 14.45% projected annual salary increases that vary by
age, duration of service and type of employment. Both (a) and (b) included an inflation component of 3%.

CITY OF SAN BRUNO, CALIFORNIA
NOTES TO BASIC FINANCIAL STATEMENTS
FOR THE YEAR ENDED JUNE 30, 2011
69
The actuarial value of CALPERS assets was determined using techniques that smooth the effects of short-term
volatility in the market value of investments over a four-year period (smooth market value). CALPERS has
increased the future rate the City pays to reflect an unfunded condition in the plan. CALPERS unfunded
actuarial accrued liability is being amortized as a percentage of projected payroll on a closed period basis over
30 years.
Percentage of Net Pension
Fiscal Year Safety Miscellaneous APC Contributed Obligation
June 30, 2009 2,923,174$ 1,542,127$ 100% -$
June 30, 2010 3,011,105 1,407,892 100% -
June 30, 2011 2,896,889 1,518,367 100% -
Annual Pension Cost (APC)
THREE-YEAR TREND INFORMATION FOR PERS
Funded Status
The information below is the most recent information available from CALPERS for the miscellaneous group.
Actuarial Value Annual
Actuarial Accrued of Assets Unfunded Covered UL as a %
Valuation Date Liability AVA Liability (UL) Funded Ratio Payroll of Payroll
June 30, 2007 66,778,802$ 58,767,880$ 8,010,922$ 88.00% 11,019,013$ 72.70%
June 30, 2008 73,892,565 63,208,726 10,683,839 85.54% 11,779,042 90.70%
June 30, 2009 81,938,381 66,592,530 15,345,851 81.27% 12,051,504 127.34%
As of the actuarial date of June 30, 2003, the City’s public safety plan became part of a CALPERS Risk Pool
for employers with less than 100 active plan members. As part of a cost-sharing multiple employer defined
benefit plan, disclosure of the schedule of funding progress is not required.
NOTE 13 - POST-EMPLOYMENT HEALTHCARE PLAN
Plan Description: The City of San Bruno contracts with the Teamsters Local #856 Health and Welfare Trust
Fund to provide health benefits to both active and retired employees. The City provides no direct financial
contribution towards retiree health benefits; however, due to the fact that retirees and active employees are
insured in the same pool it indirectly subsidizes their premiums through payments for current employees. At
this time, the City has not established a trust for the purpose of holding assets accumulated for plan benefits.
Eligibility: Employees (and their dependents) are eligible for retiree health benefits if they retire from the City
on or after age 55 with at least 10 years of service (with 12 continuous months prior to date of retirement) and
are eligible for a PERS pension. Membership of the plan consisted of the following at June 30, 2011, the date
of the latest actuarial valuation:
Retirees and beneficiaries receiving benefits 108
Other participants fully eligible for benefits 36
Other participants not yet fully eligible for benefits 198
Total 342

CITY OF SAN BRUNO, CALIFORNIA
NOTES TO BASIC FINANCIAL STATEMENTS
FOR THE YEAR ENDED JUNE 30, 2011
70
City’s Funding Policy: The Teamsters Local #856 Health and Welfare Trust Fund determine the contribution
requirements of the City. The contribution required to be made under City Council and labor agreement
requirements is based on a pay-as-you-go basis (i.e., as medical insurance premiums become due). For fiscal
year 2010-11, the City’s estimated benefit payment was $811,700 to the plan; this amount is different than the
City’s actual contribution to the Teamsters Local #856 Health and Welfare Fund since this is the calculated
benefit cost for the City’s retirees and includes the cost of implicit subsidies where applicable.
Annual OPEB Cost and Net OPEB Obligation: The City’s annual other postemployment benefit (OPEB) cost
(expense) is calculated based on the annual required contribution of the employer (ARC), an amount actuarially
determined in accordance with the parameters of GASB Statement No. 45. The ARC represents a level of
funding that, if paid on an ongoing basis, is projected to cover normal cost each year and amortize any
unfunded actuarial liabilities (or funding excess) over a period not to exceed thirty years.
The following table shows the components of the City’s annual OPEB cost for the year, the amount actually
contributed to the plan, and changes in the City’s net OPEB obligation for these benefits:
Annual required contribution 3,920,800$
Interest on net OPEB obligation 157,600
Adjustment to annual required contribution (223,400)
Annual OPEB cost (expense) 3,855,000
Contributions made (including premium paid) (811,700)
Increase in net OPEB obligation 3,043,300
Net OPEB obligation, beginning of year 3,939,400
Net OPEB obligation, end of year 6,982,700$
The City’s annual OPEB cost, the percentage of annual OPEB cost contributed to the plan, and the net OPEB
obligation for 2011and the two preceding years were as follows:
Fiscal Year
Ended
Annual OPEB
Cost
Percentage of
Annual OPEB
Cost
Contributed
Net OPEB
Obligation
6/30/2009 2,780,700$ 26.60% 2,040,700$
6/30/2010 2,744,300 30.80% 3,939,400
6/30/2011 3,855,000 21.06% 6,982,700
Funded Status and Funding Progress: The funded status of the plan as of June 30, 2011, was as follows:
Actuarial accrued liability (AAL) 41,558,300$
Actuarial value of plan assets -
Unfunded actuarial accrued liability (UAAL) 41,558,300
Funded Ratio (actuarial value of plan Assets/AAL) 0%
Covered payroll (active plan members) 21,169,200
UAAL as a percentage of covered payroll 196%

CITY OF SAN BRUNO, CALIFORNIA
NOTES TO BASIC FINANCIAL STATEMENTS
FOR THE YEAR ENDED JUNE 30, 2011
71
Actuarial valuations of an ongoing plan involve estimates of the value of reported amounts and assumptions
about the probability of occurrence of events far into the future. Examples include assumptions about future
employment, mortality, and the healthcare cost trend. Amounts determined regarding the funded status of the
plan and the annual required contributions of the employer are subject to continual revision as actual results are
compared with past expectations and new estimates are made about the future. The schedule of funding
progress, presented as required supplementary information following the notes to the financial statements,
presents multi-year trend information about whether the actuarial value of plan assets is increasing or
decreasing over time relative to the actuarial accrued liabilities for the benefits.
Actuarial Methods and Assumptions. Projections of benefits for financial reporting purposes are based on the
substantive plan (the plan as understood by the employer and the plan members) and include the types of
benefits provided at the time of each valuation and the historical pattern of sharing of benefit costs between
employer and plan members to that point. The actuarial methods and assumptions used include techniques that
are designed to reduce the effects of short-term volatility in actuarial accrued liabilities and the actuarial assets,
consistent with the long-term perspective of the calculations. The actuarial assumptions included (a) 4% of
investment rate of return (net of administrative expenses) and (b) 7.0% to 5% health care trend.
The actuarial cost method used for determining the benefit obligations is the Projected Unit Cost Method. The
actuarial assumptions included a 4 percent investment rate of return, which is the expected long-term rate of
return on the City’s pooled investments (per GASB 43/45 guidelines for this assumption), and a healthcare cost
trend rate of 5 percent for all benefit costs. The UAAL is being amortized using a level dollar method on a
closed basis over 30 years.
NOTE 14 - CONTINGENCIES
The City participates in a number of Federal, State and County programs that are fully or partially funded by
grants received from other governmental units. Expenditures financed by grants are subject to audit by the
appropriate grantor government. If expenditures are disallowed due to noncompliance with grantor program
regulations, the City may be required to reimburse the grantor government. As of June 30, 2011, some amounts
of grant expenditures have not been audited, but the City believes that disallowed expenditures, if any, based on
subsequent audits will not have a material effect on any individual governmental funds or the overall financial
condition of the City.
NOTE 15 - LITIGATION
The City is a defendant in a number of lawsuits which have arisen in the normal course of business. While
substantial damages are alleged in some of these actions, their outcome cannot be predicted with certainty. In
the opinion of the City Attorney, these actions, when finally adjudicated, do not appear to have a materially
adverse effect on the financial condition of the City.

72
REQUIRED SUPPLEMENTARY INFORMATION

CITY OF SAN BRUNO, CALIFORNIA
SCHEDULE OF REVENUES, EXPENDITURES AND CHANGES IN FUND
BALANCES – BUDGET AND ACTUAL
GENERAL FUND
FOR THE YEAR ENDED JUNE 30, 2011
See accompanying notes to the required supplementary information.
73
Variance w/
Original Amended Amended
Budget Budget Actual Favorable/(Unfavorable)
REVENUES:
Taxes 16,354,971$ 16,354,971$ 17,016,483$ 661,512$
Licenses and permits 1,923,000 1,923,000 2,097,713 174,713
Intergovernmental 3,300,000 3,300,000 3,374,101 74,101
Charges for services 2,885,302 2,906,402 4,178,851 1,272,449
Fines and forfeitures 580,100 580,100 734,722 154,622
Use of money and property 2,089,176 2,110,811 1,750,450 (360,361)
Other revenues 3,489,442 3,489,442 3,592,457 103,015
Total revenues 30,621,991 30,664,726 32,744,777 2,080,051
EXPENDITURES:
Current:
General government 3,932,098 3,952,098 3,918,992 33,106
Public safety 18,824,191 18,881,991 18,537,862 344,129
Public works 656,405 656,405 768,453 (112,048)
Highways and streets 1,107,543 1,107,543 1,065,816 41,727
Parks and recreation 3,849,764 3,849,764 3,956,830 (107,066)
Library 1,641,075 1,663,075 1,649,755 13,320
Community development 1,064,371 1,064,371 1,087,080 (22,709)
Total expenditures 31,075,447 31,175,247 30,984,788 190,459
REVENUES OVER (UNDER)
EXPENDITURES (453,456) (510,521) 1,759,989 2,270,510
OTHER FINANCING SOURCES (USES):
Transfers in 701,000 723,000 467,586 (255,414)
Transfers out (430,587) (653,587) (653,584) 3
Total other financing sources (uses) 270,413 69,413 (185,998) (255,411)
Net change in fund balances (183,043) (441,108) 1,573,991 2,015,099
FUND BALANCES:
Beginning of year 8,244,873 8,244,873 8,244,873 -
End of year 8,061,830$ 7,803,765$ 9,818,864$ 2,015,099$
General Fund

CITY OF SAN BRUNO, CALIFORNIA
SCHEDULE OF REVENUES, EXPENDITURES AND CHANGES IN FUND
BALANCES – BUDGET AND ACTUAL
REDEVELOPMENT SPECIAL REVENUE FUND
FOR THE YEAR ENDED JUNE 30, 2011
See accompanying notes to the required supplementary information.
74
Variance with
Original Amended Amended
Budget Budget Actual Favorable/(Unfavorable)
REVENUES:
Taxes 8,759,599$ 8,759,599$ 8,900,038$ 140,439$
Use of money and property - - 60,288 60,288
Total revenues 8,759,599 8,759,599 8,960,326 200,727
EXPENDITURES:
Current:
Community development 6,510,157 6,510,157 6,163,216 346,941
Debt service:
Interest and fiscal charges 200,000 200,000 200,000 -
Total expenditures 6,710,157 6,710,157 6,363,216 346,941
REVENUES OVER (UNDER)
EXPENDITURES 2,049,442 2,049,442 2,597,110 547,668
OTHER FINANCING SOURCES (USES):
Transfers out (647,488) (1,331,554) (1,331,554) -
Net change in fund balances 1,401,954 717,888 1,265,556 547,668
FUND BALANCES:
Beginning of year 3,980,927 3,980,927 3,980,927 -
End of year 5,382,881$ 4,698,815$ 5,246,483$ 547,668$
Redevelopment Agency
Special Revenue

CITY OF SAN BRUNO, CALIFORNIA
SCHEDULE OF REVENUES, EXPENDITURES AND CHANGES IN FUND
BALANCES – BUDGET AND ACTUAL
MEASURE A
FOR THE YEAR ENDED JUNE 30, 2011
See accompanying notes to the required supplementary information.
75
Variance with
Original Amended Amended
Budget Budget Actual Favorable/(Unfavorable)
REVENUES:
Taxes 700,000$ 700,000$ 717,285$ 17,285$
Use of money and property - - 3,985 3,985
Total revenues 700,000 700,000 721,270 21,270
OTHER FINANCING SOURCES (USES):
Transfers out - (637,010) (637,010) -
Net change in fund balances 700,000 62,990 84,260 21,270
FUND BALANCES:
Beginning of year 240,777 240,777 240,777 -
End of year 940,777$ 303,767$ 325,037$ 21,270$
Measure A Transportation Tax

CITY OF SAN BRUNO, CALIFORNIA
NOTES TO REQUIRED SUPPLEMENTARY INFORMATION
FOR THE YEAR ENDED JUNE 30, 2011
76
NOTE 1 - BUDGETARY INFORMATION
The City adopts a budget annually to be effective July 1. Budgeted expenditures are adopted through the
passage of a resolution. This resolution constitutes the maximum authorized expenditures for the one year
period and cannot legally be exceeded except by subsequent amendments of the budget by the City Council.
An operating budget is adopted every year for the General, Special Revenue, Enterprise Funds, and Capital
Improvement Program Budget. Public hearings are conducted on the proposed budgets to review all
appropriations and sources of financing. Capital projects are budgeted by the City over the term of the
individual projects.
Expenditures are controlled at the fund level for all budgeted departments within the City. This is the level at
which expenditures may not legally exceed appropriations. Budgeted amounts for the Combined Statement of
Revenues, Expenditures and Other Financing Sources (Uses) – Budget and Actual include budget amendments
approved by the Agency Board.
The budgets are adopted on a basis substantially consistent with generally accepted accounting principles
(GAAP).
Any amendments or transfers of appropriations between object group levels within the same department must
be authorized by the City Manager. Any amendments to the total level of appropriations for a fund or transfers
between funds must be approved by the City Council. Supplemental appropriations financed by unanticipated
revenues during the year must be approved by the City Council.
Formal budgetary integration is employed as a management control device. Encumbrance accounting, under
which purchase orders, contracts and other commitments for the expenditure of monies are recorded in order to
reserve that portion of the applicable appropriation, is employed as an extension of formal budgetary
integration. Encumbrances outstanding at year-end are reported as reservations of fund balances and do not
constitute GAAP basis expenditures or liabilities because the commitments will be honored during the
subsequent year. The commitments will be re-appropriated and honored in the subsequent year.

77
COMBINING AND INDIVIDUAL FUND STATEMENTS
AND SCHEDULES

CITY OF SAN BRUNO, CALIFORNIA
SCHEDULE OF REVENUES, EXPENDITURES AND CHANGES IN FUND –
BUDGET TO ACTUAL
MAJOR FUND – REDEVELOPMENT CAPITAL PROJECTS FUND
FOR THE YEAR ENDED JUNE 30, 2011
78
Variance w/FinalFavorable
Original Final Actual (Unfavorable)REVENUES:
Investment income -$ -$ 955$ 955$
EXPENDITURES:
Current:
Community development - - 30,070 (30,070)
REVENUES OVER (UNDER)
EXPENDITURES - - (29,115) (29,115)
OTHER FINANCING SOURCES (USES):
Transfers in - 684,064 684,064 - Transfers out - (684,064) (684,064) -
Total other financing sources (uses) - - - -
Net change in fund balances - - (29,115) (29,115)
FUND BALANCES:
Beginning of year (1,796,282) (1,796,282) (1,796,282) -
End of year (1,796,282)$ (1,796,282)$ (1,825,397)$ (29,115)$
Budgeted Amounts

CITY OF SAN BRUNO, CALIFORNIA
SCHEDULE OF REVENUES, EXPENDITURES AND CHANGES IN FUND –
BUDGET TO ACTUAL
MAJOR FUND – REDEVELOPMENT DEBT SERVICE FUND
FOR THE YEAR ENDED JUNE 30, 2011
79
Variance w/FinalFavorable
Original Final Actual (Unfavorable)REVENUES:
Investment income -$ -$ 268$ 268$
EXPENDITURES:
Debt service:Principal 225,000 225,000 225,000 - Interest 422,488 422,488 422,411 77
Total expenditures 647,488 647,488 647,411 77
REVENUES OVER (UNDER)
EXPENDITURES (647,488) (647,488) (647,143) 345
OTHER FINANCING SOURCES (USES):
Transfers in 647,488 647,488 647,490 2
Net change in fund balances - - 347 347
FUND BALANCES:
Beginning of year 806,652 806,652 806,652 -
End of year 806,652$ 806,652$ 806,999$ 347$
Budgeted Amounts

CITY OF SAN BRUNO, CALIFORNIA
SCHEDULE OF REVENUES, EXPENDITURES AND CHANGES IN FUND –
BUDGET TO ACTUAL
MAJOR FUND – STREET IMPROVEMENTS CAPITAL PROJECTS FUND
FOR THE YEAR ENDED JUNE 30, 2011
80
Variance w/Final
Favorable
Original Final Actual (Unfavorable)
REVENUES:
Investment income -$ -$ 21,254$ 21,254$
Other revenues - - (100) (100)
Total revenues - - 21,154 21,154
EXPENDITURES:
Current:
Highways and streets 3,185,843 5,121,882 762,500 4,359,382
REVENUES OVER (UNDER)
EXPENDITURES (3,185,843) (5,121,882) (741,346) 4,380,536
OTHER FINANCING SOURCES (USES):
Transfers in - 1,491,685 1,229,185 (262,500)
Net change in fund balances (3,185,843) (3,630,197) 487,839 4,118,036
FUND BALANCES:
Beginning of year 1,377,560 1,377,560 1,377,560 -
End of year (1,808,283)$ (2,252,637)$ 1,865,399$ 4,118,036$
Budgeted Amounts

CITY OF SAN BRUNO, CALIFORNIA
COMBINING BALANCE SHEET
NONMAJOR GOVERNMENTAL FUNDS
AS OF JUNE 30, 2011
81
Library
Agency on Federal/State SpecialIn-Lieu Aging Grants Gas Tax Revenue
ASSETS
Cash and investments 4,506,866$ -$ -$ 709,086$ 449,210$
Receivables:Taxes - - - 30,889 -
Interest - - - - -
Intergovernmental subventions - - - - -
Intergovernmental grants - 54,609 - - -
Other - - - - -
Total assets 4,506,866$ 54,609$ -$ 739,975$ 449,210$
LIABILITIES AND FUND BALANCES
Liabilities:Accounts payable and accrued liabilities -$ -$ 9,512$ -$ -$
Due to other funds - 30,061 8,844 - -
Total liabilities - 30,061 18,356 - -
Fund Balances:Restricted 4,506,866 24,548 739,975 449,210 Unassigned - - (18,356) - -
Total fund balances (deficits) 4,506,866 24,548 (18,356) 739,975 449,210
Total liabilities and fund balances 4,506,866$ 54,609$ -$ 739,975$ 449,210$
Special Revenue Funds

82
Police Police SB 322Asset Safety Special Recycling/Litter
Seizure Augmentation Revenue Clean-up
74,161$ -$ -$ 153,860$
- - - - - - - - - - - 11,859 - - 11,355 - - - - -
74,161$ -$ 11,355$ 165,719$
3,510$ -$ -$ 4,240$
- - - -
3,510 - - 4,240
70,651 11,355 161,479
- - - -
70,651 - 11,355 161,479
74,161$ -$ 11,355$ 165,719$
Special Revenue Funds

CITY OF SAN BRUNO, CALIFORNIA
COMBINING BALANCE SHEET
NONMAJOR GOVERNMENTAL FUNDS, CONTINUED
AS OF JUNE 30, 2011
83
Restricted Emergency Donations Streets Traffic Safety Disaster Fund
ASSETS
Cash and investments 767,593$ 304,940$ 48,170$ 3,007,542$
Receivables:Taxes - - - -
Interest - - - 3,569 Intergovernmental subventions - - - - Intergovernmental grants - - 13,450 -
Other 13,896 - - 1,714,377
Total assets 781,489$ 304,940$ 61,620$ 4,725,488$
LIABILITIES AND FUND BALANCES
Liabilities:Accounts payable and accrued liabilities 2,217$ -$ -$ 198,939$
Due to other funds - - - 2,548,903
Total liabilities 2,217 - - 2,747,842
Fund Balances:Restricted 779,272 304,940 61,620 1,977,646 Unassigned - - - -
Total fund balances (deficits) 779,272 304,940 61,620 1,977,646
Total liabilities and fund balances 781,489$ 304,940$ 61,620$ 4,725,488$
Special Revenue Funds

84
Special Revenue Capital Projects Funds Debt Service
Total General General 2011 2010
10,021,428$ 764,303$ -$ 10,785,731$ 7,131,089$
30,889 - - 30,889 127,072 3,569 - - 3,569 -
11,859 - - 11,859 21,987 79,414 - - 79,414 45,012
1,728,273 29,661 - 1,757,934 57
11,875,432$ 793,964$ -$ 12,669,396$ 7,325,217$
218,418$ 164,791$ -$ 383,209$ 132,230$ 2,587,808 - - 2,587,808 45,252
2,806,226 164,791 - 2,971,017 177,482
9,087,562 629,173 9,716,735 7,170,097 (18,356) - - (18,356) (22,362)
9,069,206 629,173 - 9,698,379 7,147,735
11,875,432$ 793,964$ -$ 12,669,396$ 7,325,217$
TotalsNon-major funds

CITY OF SAN BRUNO, CALIFORNIA
COMBINING STATEMENT OF REVENUES, EXPENDITURES AND CHANGES IN
FUND BALANCES
NONMAJOR GOVERNMENTAL FUNDS
FOR THE YEAR ENDED JUNE 30, 2011
85
Library Police
Agency on Federal/State Special Asset
In-Lieu Aging Grants Gas Tax Revenue Seizure
REVENUES:
Taxes -$ -$ -$ 1,071,708$ -$ -$
Licenses and permits - - - - - -
Intergovernmental - 148,501 210,090 - 31,887 -
Charges for services - 70,585 - - - -
Fines and forfeitures - - - - - 4,311
Investment income (loss) 35,699 205 265 4,708 4,333 596
Other revenues 306,622 - - - - - Total revenues 342,321 219,291 210,355 1,076,416 36,220 4,907
EXPENDITURES:
Current:
General government - - - - - -
Public safety - - 9,512 - - 3,646
Public works - - - - - -
Highways and streets - - - 614,305 - -
Parks and recreation - 133,595 - - - -
Library - - - - - -
Community development - - - - - -
Capital outlay - - - - - -
Debt service:
Principal - - - - - -
Interest and fiscal charges - - - - - -
Total expenditures - 133,595 9,512 614,305 - 3,646
REVENUES OVER (UNDER)
EXPENDITURES 342,321 85,696 200,843 462,111 36,220 1,261
OTHER FINANCING SOURCES (USES):
Transfers in - - - - -
Transfers out - (70,585) (197,589) (217,949) (234,887) -
Total other financing
sources and uses - (70,585) (197,589) (217,949) (234,887) -
REVENUES AND OTHER FINANCING
SOURCES OVER (UNDER)
EXPENDITURES AND OTHER
FINANCING (USES) 342,321 15,111 3,254 244,162 (198,667) 1,261
FUND BALANCES:
Beginning of year 4,164,545 9,437 (21,610) 495,813 647,877 69,390 End of year 4,506,866$ 24,548$ (18,356)$ 739,975$ 449,210$ 70,651$
Special Revenue Funds

86
Police SB 322
Safety Special Recycling/Litter
Augmentation Revenue Clean-up
-$ -$ -$
- - -
88,526 98,270 76,658
- - -
- - -
103 13 1,230
- 5,038 - 88,629 103,321 77,888
- - -
- 5,225 -
- - 58,710
- - -
- - -
- - -
- - -
- - -
- - -
- - -
- 5,225 58,710
88,629 98,096 19,178
- - -
(87,877) (89,963) -
(87,877) (89,963) -
752 8,133 19,178
(752) 3,222 142,301 -$ 11,355$ 161,479$

CITY OF SAN BRUNO, CALIFORNIA
COMBINING STATEMENT OF REVENUES, EXPENDITURES AND CHANGES IN
FUND BALANCES
NONMAJOR GOVERNMENTAL FUNDS, CONTINUED
FOR THE YEAR ENDED JUNE 30, 2011
87
Restricted Emergency
Donations Streets Traffic Safety Disaster Fund
REVENUES:
Taxes -$ -$ -$ -$
Licenses and permits 84,464 - - -
Intergovernmental - - 74,900 -
Charges for services - - - -
Fines and forfeitures - - - -
Investment income (loss) 6,489 2,474 362 11,111
Other revenues 500,885 - - 5,336,161
Total revenues 591,838 2,474 75,262 5,347,272
EXPENDITURES:
Current:
General government 437,763 - - 3,369,626
Public safety - - 74,414 -
Public works - - - -
Highways and streets - - - -
Parks and recreation 16,389 - - -
Library 19,619 - - -
Community development 231 - - -
Capital outlay - - - -
Debt service:
Principal - - - -
Interest and fiscal charges - - - -
Total expenditures 474,002 - 74,414 3,369,626
REVENUES OVER (UNDER)
EXPENDITURES 117,836 2,474 848 1,977,646
OTHER FINANCING SOURCES (USES):
Transfers in - - - -
Transfers out (29,156) - - -
Total other financing
sources and uses (29,156) - - -
REVENUES AND OTHER FINANCING
SOURCES OVER (UNDER)
EXPENDITURES AND OTHER
FINANCING (USES) 88,680 2,474 848 1,977,646
FUND BALANCES:
Beginning of year 690,592 302,466 60,772 - End of year 779,272$ 304,940$ 61,620$ 1,977,646$
Special Revenue Funds

88
Special Revenue Capital Projects Funds Debt Service
Total General General 2011 2010
1,071,708$ -$ -$ 1,071,708$ 1,142,924$
84,464 - - 84,464 77,642
728,832 - - 728,832 522,026
70,585 - 70,585 -
4,311 - - 4,311 4,541
67,588 4,824 - 72,412 61,057
6,148,706 79,662 378,502 6,606,870 1,418,812 8,176,194 84,486 378,502 8,639,182 3,227,002
3,807,389 7,252 - 3,814,641 8,622
92,797 - - 92,797 61,366
58,710 - - 58,710 71,659
614,305 - - 614,305 969,064
149,984 - - 149,984 141,316
19,619 - - 19,619 12,487
231 - - 231 -
- 699,463 - 699,463 1,071,479
- - 349,031 349,031 333,219
- - 29,471 29,471 45,282 4,743,035 706,715 378,502 5,828,252 2,714,494
3,433,159 (622,229) - 2,810,930 512,508
- 667,720 - 667,720 1,105,942
(928,006) - - (928,006) (1,340,182)
(928,006) 667,720 - (260,286) (234,240)
2,505,153 45,491 - 2,550,644 278,268
6,564,053 583,682 - 7,147,735 6,869,467 9,069,206$ 629,173$ -$ 9,698,379$ 7,147,735$
TotalsNon-major funds

CITY OF SAN BRUNO, CALIFORNIA
SCHEDULE OF REVENUES, EXPENDITURES, AND CHANGES IN FUND
BALANCES – BUDGET TO ACTUAL
IN-LIEU SPECIAL REVENUE FUND
FOR THE YEAR ENDED JUNE 30, 2011
89
Variance w/FinalFinal Favorable
Budget Actual (Unfavorable)REVENUES:
Investment income 35,000$ 35,699$ 699$
Other revenues 229,000 306,622 77,622
Total revenues 264,000 342,321 78,321
EXPENDITURES:
Community development - - -
REVENUES OVER (UNDER)
EXPENDITURES 264,000 342,321 78,321
OTHER FINANCING SOURCES (USES):
Transfers out - - -
Net change in fund balances 264,000 342,321 78,321 FUND BALANCES:
Beginning of year 4,164,545 4,164,545 -
End of year 4,428,545$ 4,506,866$ 78,321$

CITY OF SAN BRUNO, CALIFORNIA
SCHEDULE OF REVENUES, EXPENDITURES, AND CHANGES IN FUND
BALANCE – BUDGET TO ACTUAL
AGENCY ON AGING SPECIAL REVENUE FUND
FOR THE YEAR ENDED JUNE 30, 2011
90
Variance w/FinalFinal Favorable
Budget Actual (Unfavorable)REVENUES:
Intergovernmental 90,000$ 148,501$ 58,501$ Charges for services - 70,585 70,585 Investment income - 205 205
Total revenues 90,000 219,291 129,291
EXPENDITURES:
Parks and recreation 90,000 133,595 (43,595)
REVENUES OVER (UNDER)
EXPENDITURES - 85,696 85,696
OTHER FINANCING SOURCES (USES):
Transfers out - (70,585) (70,585)
Net change in fund balances - 15,111 15,111
FUND BALANCES:
Beginning of year 9,437 9,437 - End of year 9,437$ 24,548$ 15,111$

CITY OF SAN BRUNO, CALIFORNIA
SCHEDULE OF REVENUES, EXPENDITURES, AND CHANGES IN FUND
BALANCE – BUDGET TO ACTUAL
FEDERAL AND STATE SPECIAL REVENUE FUND
FOR THE YEAR ENDED JUNE 30, 2011
91
Variance w/Final
Final Favorable
Budget Actual (Unfavorable)
REVENUES:
Intergovernmental 460,089$ 210,090$ (249,999)$
Use of money and property - 265 265
Other revenues 29,644 - (29,644)
Total revenues 489,733 210,355 (279,378)
EXPENDITURES:
Public safety - 9,512 (9,512)
REVENUES OVER (UNDER)
EXPENDITURES 489,733 200,843 (288,890)
OTHER FINANCING SOURCES (USES):
Transfers out (460,089) (197,589) 262,500
Net change in fund balances 29,644 3,254 (26,390)
FUND BALANCES:
Beginning of year (21,610) (21,610) -
End of year 8,034$ (18,356)$ (26,390)$

CITY OF SAN BRUNO, CALIFORNIA
SCHEDULE OF REVENUES, EXPENDITURES, AND CHANGES IN FUND
BALANCE – BUDGET TO ACTUAL
GAS TAX SPECIAL REVENUE FUND
FOR THE YEAR ENDED JUNE 30, 2011
92
Variance w/FinalFinal Favorable
Budget Actual (Unfavorable)REVENUES:
Taxes 1,148,543$ 1,071,708$ (76,835)$ Investment income - 4,708 4,708
Total revenues 1,148,543 1,076,416 (72,127)
EXPENDITURES:
Current:
Highways and streets 753,706 614,305 139,401
REVENUES OVER (UNDER)
EXPENDITURES 394,837 462,111 67,274
OTHER FINANCING SOURCES (USES):
Transfers out (127,675) (217,949) (90,274)
Net change in fund balances 267,162 244,162 (23,000)
FUND BALANCES:
Beginning of year 495,813 495,813 -
End of year 762,975$ 739,975$ (23,000)$
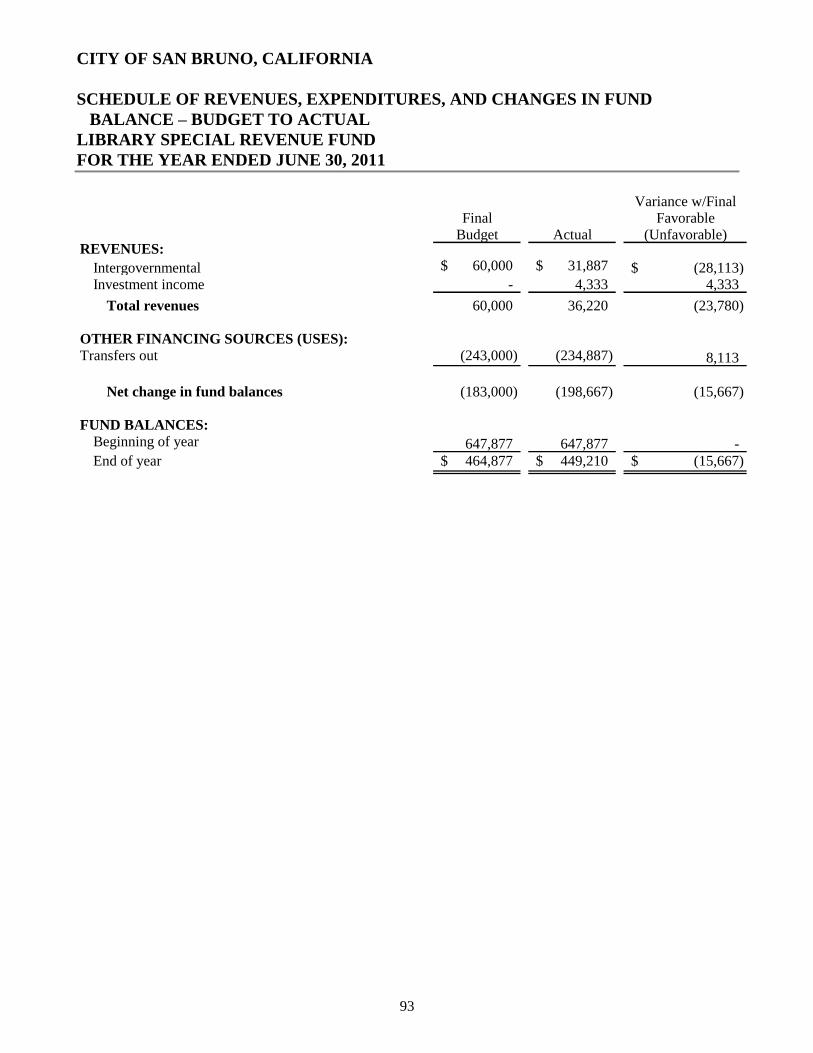
CITY OF SAN BRUNO, CALIFORNIA
SCHEDULE OF REVENUES, EXPENDITURES, AND CHANGES IN FUND
BALANCE – BUDGET TO ACTUAL
LIBRARY SPECIAL REVENUE FUND
FOR THE YEAR ENDED JUNE 30, 2011
93
Variance w/FinalFinal Favorable
Budget Actual (Unfavorable)REVENUES:
Intergovernmental 60,000$ 31,887$ (28,113)$ Investment income - 4,333 4,333
Total revenues 60,000 36,220 (23,780)
OTHER FINANCING SOURCES (USES):
Transfers out (243,000) (234,887) 8,113
Net change in fund balances (183,000) (198,667) (15,667)
FUND BALANCES:
Beginning of year 647,877 647,877 -
End of year 464,877$ 449,210$ (15,667)$

CITY OF SAN BRUNO, CALIFORNIA
SCHEDULE OF REVENUES, EXPENDITURES, AND CHANGES IN FUND
BALANCE – BUDGET TO ACTUAL
POLICE ASSET SEIZURE SPECIAL REVENUE FUND
FOR THE YEAR ENDED JUNE 30, 2011
94
Variance w/FinalFavorable
Final Actual (Unfavorable)REVENUES:
Fines and forfeitures -$ 4,311$ 4,311$ Investment income - 596 596
Total revenues - 4,907 4,907
EXPENDITURES:
Public safety - 3,646 (3,646)
REVENUES OVER (UNDER)
EXPENDITURES - 1,261 1,261
FUND BALANCES:
Beginning of year 65,049 69,390 4,341
End of year 65,049$ 70,651$ 5,602$

CITY OF SAN BRUNO, CALIFORNIA
SCHEDULE OF REVENUES, EXPENDITURES, AND CHANGES IN FUND
BALANCE – BUDGET TO ACTUAL
SAFETY AUGMENTATION SPECIAL REVENUE FUND
FOR THE YEAR ENDED JUNE 30, 2011
95
Variance w/FinalFinal Favorable
Budget Actual (Unfavorable)REVENUES:
Intergovernmental -$ 88,526$ 88,526$ Investment income - 103 103
Total revenues - 88,629 88,629
OTHER FINANCING SOURCES (USES):
Transfers out (86,000) (87,877) (1,877)
Net change in fund balances (86,000) 752 86,752
FUND BALANCES:
Beginning of year (752) (752) -
End of year (86,752)$ -$ 86,752$

CITY OF SAN BRUNO, CALIFORNIA
SCHEDULE OF REVENUES, EXPENDITURES, AND CHANGES IN FUND
BALANCE – BUDGET TO ACTUAL
POLICE SPECIAL REVENUE FUND
FOR THE YEAR ENDED JUNE 30, 2011
96
Variance w/FinalFinal Favorable
Budget Actual (Unfavorable)REVENUES:
Intergovernmental 100,000$ 98,270$ (1,730)$ Investment income - 13 13
Other revenues - 5,038 5,038
Total revenues 100,000 103,321 3,321
EXPENDITURES:
Current:
Public safety - 5,225 (5,225)
REVENUES OVER (UNDER)
EXPENDITURES 100,000 98,096 (1,904)
OTHER FINANCING SOURCES (USES):
Transfers out (100,000) (89,963) 10,037
Net change in fund balances - 8,133 8,133
FUND BALANCES:
Beginning of year 3,222 3,222 -
End of year 3,222$ 11,355$ 8,133$

CITY OF SAN BRUNO, CALIFORNIA
SCHEDULE OF REVENUES, EXPENDITURES, AND CHANGES IN FUND
BALANCE – BUDGET TO ACTUAL
SB 322 RECYCLING/LITTER CLEAN-UP SPECIAL REVENUE FUND
FOR THE YEAR ENDED JUNE 30, 2011
97
Variance w/FinalFinal Favorable
Budget Actual (Unfavorable)REVENUES:
Intergovernmental 71,862$ 76,658$ 4,796$ Investment income - 1,230 1,230
Total revenues 71,862 77,888 6,026
EXPENDITURES:
Public works 110,299 58,710 51,589
Net change in fund balances (38,437) 19,178 57,615
FUND BALANCES:
Beginning of year 142,301 142,301 -
End of year 103,864$ 161,479$ 57,615$

CITY OF SAN BRUNO, CALIFORNIA
SCHEDULE OF REVENUES, EXPENDITURES, AND CHANGES IN FUND
BALANCE – BUDGET TO ACTUAL
RESTRICTED DONATIONS SPECIAL REVENUE FUND
FOR THE YEAR ENDED JUNE 30, 2011
98
Variance w/FinalFinal Favorable
Budget Actual (Unfavorable)REVENUES:
Licenses and permits -$ 84,464$ 84,464$ Investment income - 6,489 6,489 Other revenues - 500,885 500,885
Total revenues - 591,838 591,838
EXPENDITURES:
Current:
General government - 437,763 (437,763)
Parks and recreation 50,000 16,389 33,611
Library - 19,619 (19,619) Community enhancements - 231 (231)
Total expenditures 50,000 474,002 (424,002)
REVENUES OVER (UNDER)
EXPENDITURES (50,000) 117,836 167,836
OTHER FINANCING SOURCES (USES):
Transfers out (29,156) (29,156) -
Net change in fund balances (79,156) 88,680 167,836
FUND BALANCES:
Beginning of year 690,592 690,592 -
End of year 611,436$ 779,272$ 167,836$

CITY OF SAN BRUNO, CALIFORNIA
SCHEDULE OF REVENUES, EXPENDITURES, AND CHANGES IN FUND
BALANCE – BUDGET TO ACTUAL
STREETS SPECIAL REVENUE FUND
FOR THE YEAR ENDED JUNE 30, 2011
99
Variance w/FinalFavorable
Final Actual (Unfavorable)REVENUES:
Investment income -$ 2,474$ 2,474$
FUND BALANCES:
Beginning of year 302,466 302,466 -
End of year 302,466$ 304,940$ 2,474$

CITY OF SAN BRUNO, CALIFORNIA
SCHEDULE OF REVENUES, EXPENDITURES, AND CHANGES IN FUND
BALANCE – BUDGET TO ACTUAL
TRAFFIC SAFETY REVENUE FUND
FOR THE YEAR ENDED JUNE 30, 2011
100
Variance w/FinalFinal Favorable
Budget Actual (Unfavorable)REVENUES:
Intergovernmental -$ 74,900$ 74,900$ Investment income - 362 362
Total revenues - 75,262 75,262
EXPENDITURES:
Current:
Public safety - 74,414 (74,414)
Net change in fund balances - 848 848
FUND BALANCES:
Beginning of year 60,772 60,772 -
End of year 60,772$ 61,620$ 848$

CITY OF SAN BRUNO, CALIFORNIA
SCHEDULE OF REVENUES, EXPENDITURES, AND CHANGES IN FUND
BALANCE – BUDGET TO ACTUAL
EMERGENCY DISASTER FUND
FOR THE YEAR ENDED JUNE 30, 2011
101
Variance w/FinalFinal Favorable
Budget Actual (Unfavorable)REVENUES:
Investment income -$ 11,111$ 11,111$ Other revenues 2,336,160 5,336,161 3,000,001
Total revenues 2,336,160 5,347,272 3,011,112
EXPENDITURES:
General government 3,369,625 3,369,626 (1)
REVENUES OVER (UNDER)
EXPENDITURES (1,033,465) 1,977,646 3,011,111
FUND BALANCES:
Beginning of year - - -
End of year (1,033,465)$ 1,977,646$ 3,011,111$

CITY OF SAN BRUNO, CALIFORNIA
SCHEDULE OF REVENUES, EXPENDITURES, AND CHANGES IN FUND
BALANCE – BUDGET TO ACTUAL
CAPITAL PROJECTS FUND - GENERAL
FOR THE YEAR ENDED JUNE 30, 2011
102
Variance w/FinalFinal Favorable
Budget Actual (Unfavorable)REVENUES:
Investment income -$ 4,824$ 4,824$ Other revenues 29,644 79,662 50,018
Total revenues 29,644 84,486 54,842
EXPENDITURES:
Current:
General government 235,058 7,252 227,806 Capital outlay 2,429,291 699,463 1,729,828
Total expenditures 2,664,349 706,715 1,957,634
REVENUES OVER (UNDER)
EXPENDITURES (2,634,705) (622,229) 2,012,476
OTHER FINANCING SOURCES (USES):
Transfers in 667,720 667,720 -
Net change in fund balances (1,966,985) 45,491 2,012,476
FUND BALANCES:
Beginning of year 583,682 583,682 -
End of year (1,383,303)$ 629,173$ 2,012,476$

CITY OF SAN BRUNO, CALIFORNIA
SCHEDULE OF REVENUES, EXPENDITURES, AND CHANGES IN FUND
BALANCE – BUDGET TO ACTUAL
DEBT SERVICE FUND - GENERAL
FOR THE YEAR ENDED JUNE 30, 2011
103
Variance w/FinalFinal Favorable
Budget Actual (Unfavorable)REVENUES:
Other revenues 378,501$ 378,502$ 1$
EXPENDITURES:
Debt service:Principal 349,030 349,031 (1) Interest 29,471 29,471 -
Total expenditures 378,501 378,502 (1)
Net change in fund balances - - -
FUND BALANCES:
Beginning of year - - -
End of year -$ -$ -$

104
This page intentionally left blank.
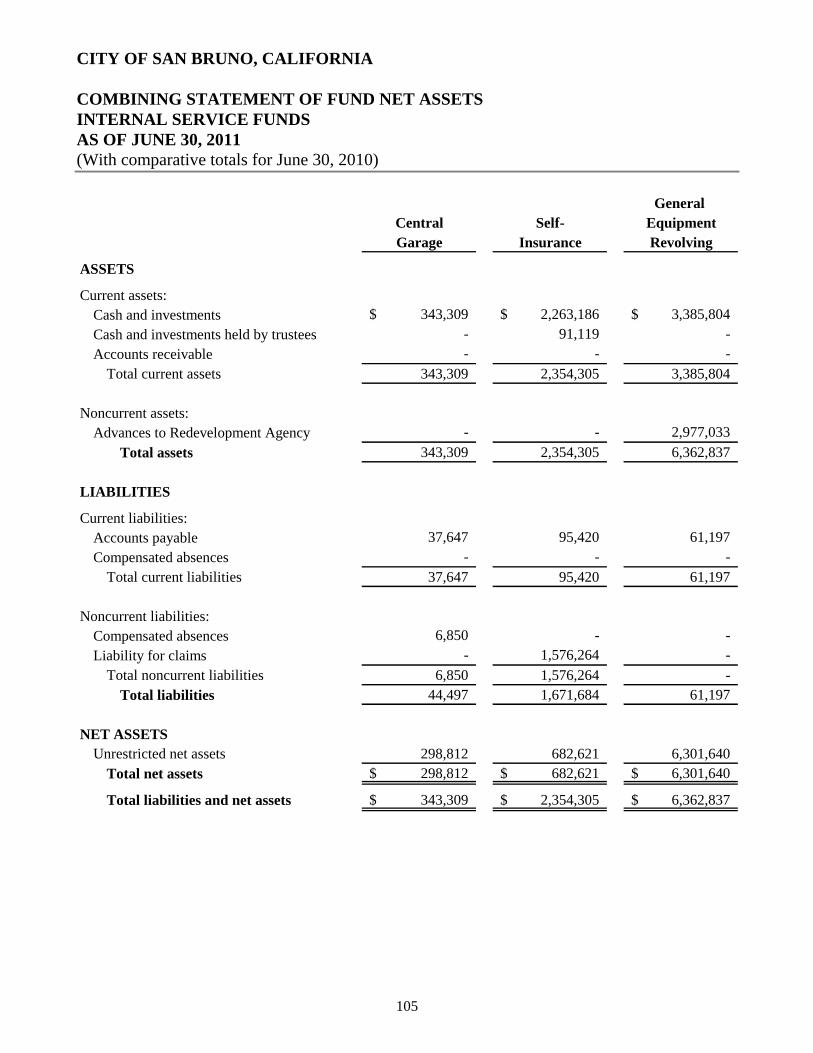
CITY OF SAN BRUNO, CALIFORNIA
COMBINING STATEMENT OF FUND NET ASSETS
INTERNAL SERVICE FUNDS
AS OF JUNE 30, 2011
(With comparative totals for June 30, 2010)
105
General
Central Self- Equipment
Garage Insurance Revolving
ASSETS
Current assets:
Cash and investments 343,309$ 2,263,186$ 3,385,804$
Cash and investments held by trustees - 91,119 -
Accounts receivable - - -
Total current assets 343,309 2,354,305 3,385,804
Noncurrent assets:
Advances to Redevelopment Agency - - 2,977,033
Total assets 343,309 2,354,305 6,362,837
LIABILITIES
Current liabilities:
Accounts payable 37,647 95,420 61,197
Compensated absences - - -
Total current liabilities 37,647 95,420 61,197
Noncurrent liabilities:
Compensated absences 6,850 - -
Liability for claims - 1,576,264 -
Total noncurrent liabilities 6,850 1,576,264 -
Total liabilities 44,497 1,671,684 61,197
NET ASSETS
Unrestricted net assets 298,812 682,621 6,301,640
Total net assets 298,812$ 682,621$ 6,301,640$
Total liabilities and net assets 343,309$ 2,354,305$ 6,362,837$

106
Technology Facilities
Development Maintenance 2011 2010
491,547$ 903,503$ 7,387,349$ 6,420,296$
- - 91,119 91,119
- - - 1,710
491,547 903,503 7,478,468 6,513,125
- - 2,977,033 2,977,033
491,547 903,503 10,455,501 9,490,158
8,271 21,543 224,078 68,821
- 55,277 55,277 99,422
8,271 76,820 279,355 168,243
33,239 - 40,089 45,286
- - 1,576,264 1,431,446
33,239 - 1,616,353 1,476,732
41,510 76,820 1,895,708 1,644,975
450,037 826,683 8,559,793 7,845,183
450,037$ 826,683$ 8,559,793$ 7,845,183$
491,547$ 903,503$ 10,455,501$ 9,490,158$
Totals
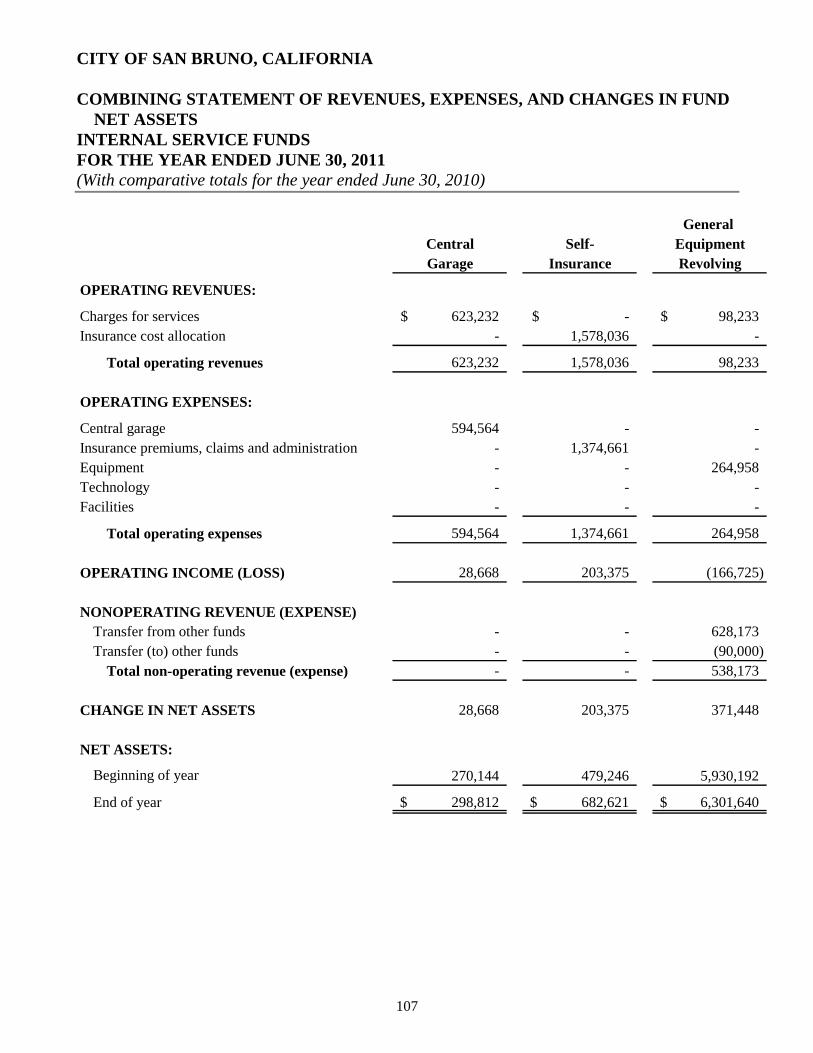
CITY OF SAN BRUNO, CALIFORNIA
COMBINING STATEMENT OF REVENUES, EXPENSES, AND CHANGES IN FUND
NET ASSETS
INTERNAL SERVICE FUNDS
FOR THE YEAR ENDED JUNE 30, 2011
(With comparative totals for the year ended June 30, 2010)
107
General
Central Self- Equipment
Garage Insurance Revolving
OPERATING REVENUES:
Charges for services 623,232$ -$ 98,233$
Insurance cost allocation - 1,578,036 -
Total operating revenues 623,232 1,578,036 98,233
OPERATING EXPENSES:
Central garage 594,564 - -
Insurance premiums, claims and administration - 1,374,661 -
Equipment - - 264,958
Technology - - -
Facilities - - -
Total operating expenses 594,564 1,374,661 264,958
OPERATING INCOME (LOSS) 28,668 203,375 (166,725)
NONOPERATING REVENUE (EXPENSE)
Transfer from other funds - - 628,173
Transfer (to) other funds - - (90,000)
Total non-operating revenue (expense) - - 538,173
CHANGE IN NET ASSETS 28,668 203,375 371,448
NET ASSETS:
Beginning of year 270,144 479,246 5,930,192
End of year 298,812$ 682,621$ 6,301,640$

108
Technology Facilities
Development Maintenance 2011 2010
488,419$ 1,006,080$ 2,215,964$ 2,757,474$
- - 1,578,036 1,578,156
488,419 1,006,080 3,794,000 4,335,630
- - 594,564 678,168
- - 1,374,661 1,251,307
- - 264,958 177,236
448,124 - 448,124 480,194
- 843,680 843,680 1,051,067
448,124 843,680 3,525,987 3,637,972
40,295 162,400 268,013 697,658
- - 628,173 -
(91,576) - (181,576) (343,482)
(91,576) - 446,597 (343,482)
(51,281) 162,400 714,610 354,176
501,318 664,283 7,845,183 7,491,007
450,037$ 826,683$ 8,559,793$ 7,845,183$
Totals

CITY OF SAN BRUNO, CALIFORNIA
COMBINING STATEMENT OF CASH FLOWS
INTERNAL SERVICE FUNDS
FOR THE YEAR ENDED JUNE 30, 2011
(With comparative totals for the year ended June 30, 2010)
109
General
Central Self- Equipment
Garage Insurance Revolving
CASH FLOWS FROM OPERATING ACTIVITIES:
Cash received from other funds for services 623,232$ 1,578,036$ 98,233$
Cash payments to suppliers for goods and services (604,412) (1,308,841) (203,761)
Cash payments for loss claims - 144,818 -
Net cash provided (used) by operating activities 18,820 414,013 (105,528)
CASH FLOWS FROM NONCAPITAL
FINANCING ACTIVITIES:
Advance repayments from other funds - - -
Transfers received from other funds - - 628,173
Transfers paid to other funds - - (90,000)
Net cash provided by noncapital financing activities - - 538,173
Net increase in cash and cash equivalents 18,820 414,013 432,645
CASH AND CASH EQUIVALENTS:
Beginning of year 324,489 1,940,292 2,953,159
End of year 343,309$ 2,354,305$ 3,385,804$
Reconciliation of income (loss) from operations to net
cash provided (used) by operating activities:
Income (loss) from operations 28,668$ 203,375$ (166,725)$
Adjustments to reconcile income (loss) from operations
to net cash provided (used) by operating activities:
(Increase) decrease in current assets:
Accounts receivable - - -
Increase (decrease) in liabilities:
Accounts payable and accrued liabilities 23,769 65,820 61,197
Compensated absences (33,617) - -
Increase (decrease) in claims liability - noncurrent - 144,818 -
Net cash provided (used) by operating activities 18,820$ 414,013$ (105,528)$
Presentation in Statement of Net Assets:
Cash and investments 343,309$ 2,263,186$ 3,385,804$
Cash and investments held by trustees - 91,119 -
Total Cash and Cash Equivalents, End of Year 343,309$ 2,354,305$ 3,385,804$

110
Technology Facilities
Development Maintenance 2011 2010
490,129$ 1,006,080$ 3,795,710$ 4,333,920$
(442,956) (860,102) (3,420,072) (3,729,721)
- - 144,818 (411,836)
47,173 145,978 520,456 192,363
- - - 250,000
- - 628,173 -
(91,576) - (181,576) (343,482)
(91,576) - 446,597 (93,482)
(44,403) 145,978 967,053 98,881
535,950 757,525 6,511,415 6,412,534
491,547$ 903,503$ 7,478,468$ 6,511,415$
40,295$ 162,400$ 268,013$ 697,658$
1,710 - 1,710 (1,710)
3,340 1,131 155,257 (103,003)
1,828 (17,553) (49,342) 11,254
- - 144,818 (411,836)
47,173$ 145,978$ 520,456$ 192,363$
491,547$ 903,503$ 7,387,349$ 6,420,296$
- - 91,119 91,119
491,547$ 903,503$ 7,478,468$ 6,511,415$
Totals

CITY OF SAN BRUNO, CALIFORNIA
COMBINING STATEMENT OF ASSETS AND LIABILITIES
FIDUCIARY FUNDS
JUNE 30, 2011
(With comparative totals for the year ended June 30, 2010)
111
San Bruno
Project Garbage
Development Company 2011 2010
ASSETS
Cash and investments 63,706$ 341,266$ 404,972$ 712,390$
Accounts receivable - 500,644 500,644 470,863
Total assets 63,706$ 841,910$ 905,616$ 1,183,253$
LIABILITIES
Accounts payable 7,435$ 836,696$ 844,131$ 904,208$
Other liabilities 56,271 5,214 61,485 279,045
Total liabilities 63,706$ 841,910$ 905,616$ 1,183,253$
Totals

CITY OF SAN BRUNO, CALIFORNIA
COMBINING STATEMENT OF ASSETS AND LIABILITIES
FIDUCIARY FUNDS
JUNE 30, 2011
(With comparative totals for the year ended June 30, 2010)
112
Balance Balance
July 1, 2010 Additions Deductions June 30, 2011
PROJECT DEVELOPMENT
ASSETS
Cash and investments 386,592$ 179,876$ (502,762)$ 63,706$
Total assets 386,592$ 179,876$ (502,762)$ 63,706$
LIABILITIES
Accounts payable 109,454$ 312,623$ (414,642)$ 7,435$
Other liabilities 277,138 233,016 (453,883) 56,271
Total liabilities 386,592$ 545,639$ (868,525)$ 63,706$
SAN BRUNO GARBAGE COMPANY
ASSETS
Cash and investments 325,798$ 6,491,484$ (6,476,016)$ 341,266$
Accounts receivable 470,863 6,555,157 (6,525,376) 500,644
Total assets 796,661$ 13,046,641$ (13,001,392)$ 841,910$
LIABILITIES
Accounts payable 794,754$ 12,276,593$ (12,234,651)$ 836,696$
Other liabilities 1,907 3,431 (124) 5,214
Total liabilities 796,661$ 12,280,024$ (12,234,775)$ 841,910$
TOTAL OF ALL AGENCY FUNDS
ASSETS
Cash and investments 712,390$ 6,671,360$ (6,978,778)$ 404,972$
Accounts receivable 470,863 6,555,157 (6,525,376) 500,644
Total assets 1,183,253$ 13,226,517$ (13,504,154)$ 905,616$
LIABILITIES
Accounts payable 904,208$ 12,589,216$ (12,649,293)$ 844,131$
Other liabilities 279,045 236,447 (454,007) 61,485
Total liabilities 1,183,253$ 12,825,663$ (13,103,300)$ 905,616$

113
STATISTICAL SECTION

114
Contents Page(s)
Financial Trends
115-119
Revenue Capacity
120-123
Debt Capacity
124-128
Demographic and Economic Information
129-130
Operating Information
131-132
These schedules contain service and infrastructure data to help the reader
understand how the information in the City's financial report relates to the services
the City provides and the activities it performs.
Sources: Unless otherwise noted, the information in these schedules is derived from the comprehensive
annual financial reports for the relevant year. The City implemented GASB 34 in 2002-03; schedules
presenting government-wide information include information beginning in that year.
STATISTICAL SECTION
This part of the City of San Bruno's comprehensive annual financial report presents detailed information as a
context for understanding what the information in the financial statements, footnotes, and required
supplementary information says about the City's overall financial health.
These schedules contain trend information to help the reader understand how the
City's financial performance and well-being have changed over time.
These schedules contain information to help the reader assess the City's property
tax.
These schedules contain information to help the reader assess the affordability of
the City's current levels of outstanding debt and the City's ability to issue additional
debt in the future.
These schedules offer demographic and economic indicators to help the reader
understand the environment within which the City's financial activities take place.

CITY OF SAN BRUNO, CALIFORNIA
NET ASSETS BY COMPONENT
LAST TEN FISCAL YEARS
(Fiscal years ended June 30,)
115
2005 * 2006 2007 2008
Governmental activitiesInvested in capital assets, net of related debt 11,767,003$ 13,980,909$ 36,889,081$ 37,073,294$ Restricted 3,295,653 2,790,614 763,192 797,313 Unrestricted 5,146,203 10,409,480 17,200,880 18,670,800
Total governmental activities net assets 20,208,859$ 27,181,003$ 54,853,153$ 56,541,407$
Business-type activitiesInvested in capital assets, net of related debt 19,803,889$ 18,694,375$ 26,319,885$ 22,821,582$ Unrestricted 18,714,365 19,953,475 12,200,816 19,943,521
Total business-type activities net assets 38,518,254$ 38,647,850$ 38,520,701$ 42,765,103$
Primary governmentInvested in capital assets, net of related debt 31,570,892$ 32,675,284$ 63,208,966$ 59,894,876$ Restricted 3,295,653 290,614 763,192 797,313 Unrestricted 23,860,568 30,362,955 29,401,696 38,614,321
Total primary government net assets 58,727,113$ 63,328,853$ 93,373,854$ 99,306,510$
2009 2010 2011
Governmental activities
Invested in capital assets, net of related debt 38,094,423$ 38,157,248$ 36,981,386$ Restricted 805,664 11,757,369 16,116,900 Unrestricted 17,282,898 6,174,871 5,382,344
Total governmental activities net assets 56,182,985$ 56,089,488$ 58,480,630$
Business-type activities
Invested in capital assets, net of related debt 29,548,513$ 29,617,094$ 30,706,799$ Unrestricted 13,642,293 14,951,487 16,048,910
Total business-type activities net assets 43,190,806$ 44,568,581$ 46,755,709$
Primary government
Invested in capital assets, net of related debt 67,642,936$ 67,774,342$ 67,688,185$ Restricted 805,664 11,757,369 16,116,900 Unrestricted 30,925,191 21,126,358 21,431,254
Total primary government net assets 99,373,791$ 100,658,069$ 105,236,339$
*Data not available prior to 2005

CITY OF SAN BRUNO, CALIFORNIA
CHANGES IN NET ASSETS
LAST TEN FISCAL YEARS
(Fiscal years ended June 30,)
116
2005 * 2006 2007 2008 2009 2010 2011
Expenses
Governmental activities:
General government 4,133,776$ 4,056,039$ 3,086,818$ 680,412$ 5,879,731$ 5,757,945$ 10,962,945$
Public safety 15,156,170 16,143,674 17,005,014 21,497,158 19,625,779 19,593,501 19,335,496
Public works 491,059 679,486 1,017,450 1,766,933 1,256,060 862,049 888,426
Highways and streets 3,077,663 2,699,804 4,330,591 5,993,182 5,391,549 4,864,060 3,394,204
Parks and recreation 3,601,010 3,585,800 4,226,636 4,805,202 4,760,291 4,393,495 4,219,718
Library 1,561,654 1,665,597 1,627,219 2,076,155 1,890,435 1,757,550 1,680,862
Community development 3,804,765 3,858,037 3,027,355 5,727,039 7,030,845 9,180,082 7,510,992
Interest expense 516,465 557,964 575,021 553,486 665,517 672,458 612,570
Total governmental activities expenses 32,342,562 33,246,401 34,896,104 43,099,567 46,500,207 47,081,140 48,605,213
Business-type activities:
Water 5,952,302 6,893,587 6,868,405 5,857,761 7,341,657 6,919,121 7,378,711
Stormwater 294,261 467,043 502,802 (171,906) 687,278 386,608 438,864
Wastewater 5,868,174 6,084,873 6,904,217 7,859,491 8,054,907 7,987,591 9,439,266
Cable Television 7,977,905 8,055,100 9,489,656 9,324,247 10,700,667 11,452,012 11,549,760
Total business-type activities expenses 20,092,642 21,500,603 23,765,080 22,869,593 26,784,509 26,745,332 28,806,601
Total primary government expenses 52,435,204$ 54,747,004$ 58,661,184$ 65,969,160$ 73,284,716$ 73,826,472$ 77,411,814$
Program revenues
Governmental activities:
Charges for services:
General government 2,680,758$ 3,030,230$ 2,913,631$ 5,102,298$ 2,100,780$ 3,831,697$ 3,397,195$
Public safety 834,458 1,042,823 1,405,736 1,507,685 1,545,769 1,514,350 1,538,616
Public works - - 52,157 781,614 49,186 39,104 149,299
Highways and streets 1,710,424 2,091,813 754,080 977,667 18,700 18,700 19,243
Parks and recreation 1,380,947 681,356 751,985 794,097 915,378 988,075 1,089,866
Library 65,336 63,243 63,638 144,703 76,934 104,188 105,247
Community development 1,419,414 2,572,835 1,163,310 2,622,644 1,905,157 1,084,270 922,255
Operating grants and contributions 905,721 757,952 3,924,875 3,537,503 6,987,198 5,715,274 11,225,060
Capital grants and contributions 5,099,422 2,822,419 328,114 2,628,237 - 823,772 79,562
Total governmental activities program revenues 14,096,480 13,062,671 11,357,526 18,096,448 13,599,102 14,119,430 18,526,343
Business-type activities:
Charges for services:
Water 6,332,229 6,682,238 7,089,683 8,258,200 8,174,920 8,836,515 9,491,102
Stormwater 546,589 549,708 614,832 531,455 618,552 574,796 593,179
Wastewater 5,918,246 6,079,454 6,261,689 8,413,781 9,061,789 9,566,099 10,128,799
Cable Television 7,288,915 7,867,702 9,162,788 9,036,944 9,833,713 10,254,204 10,570,028
Total business-type activities program revenues 20,085,979 21,179,102 23,128,992 26,240,380 27,688,974 29,231,614 30,783,108
Total primary government program revenues 34,182,459$ 34,241,773$ 34,486,518$ 44,336,828$ 41,288,076$ 43,351,044$ 49,309,451$
Net (Expense)/Revenue
Governmental activities (18,246,082)$ (20,183,730)$ (23,538,578)$ (25,003,119)$ (32,901,105)$ (32,961,710)$ (30,078,870)$
Business-type activities (6,663) (321,501) (636,088) 3,370,787 904,465 2,486,282 1,976,507
Total primary government net expense (18,252,745)$ (20,505,231)$ (24,174,666)$ (21,632,332)$ (31,996,640)$ (30,475,428)$ (28,102,363)$
*Data not available prior to 2005

CITY OF SAN BRUNO, CALIFORNIA
CHANGES IN NET ASSETS
LAST TEN FISCAL YEARS, CONTINUED
(Fiscal years ended June 30,)
117
2005* 2006 2007 2008 2009 2010 2011
General Revenues and Other Changes in Net Assets
Governmental activities:
Taxes:
Property taxes, levied for general purposes 4,398,198$ 4,944,621$ 5,315,026$ 5,792,092$ 5,609,011$ 6,561,286$ 5,035,244$
Property taxes, tax increment for
redevelopment purposes 1,404,122 2,625,615 3,839,579 4,435,080 9,163,133 9,308,063 8,900,038
Transient occupancy tax 932,289 1,139,693 1,276,830 1,478,040 1,339,877 1,344,364 1,763,680
Franchise tax 995,474 1,450,533 1,531,909 1,608,176 1,798,855 1,804,390 1,916,659
Sales tax, including subvention 6,234,499 6,816,036 6,862,845 6,637,010 6,402,912 5,366,248 6,498,220
Cardroom taxes 3,028,003 2,819,988 2,735,107 1,491,812 1,540,728 1,496,516 1,531,232
Other taxes - - 316,762 - 1,523,129 1,487,538 1,632,802
Intergovernmental:
State motor vehicle in-lieu tax,
including subvention 2,876,477 2,824,642 3,166,460 3,365,156 3,544,320 3,350,849 3,374,101
Use of money and property 364,665 499,665 1,218,377 2,184,450 1,433,300 2,242,441 1,909,612
Miscellaneous 2,386,324 3,409,259 2,425,997 - - - -
Transfers - 175,164 - (300,443) 187,418 (93,482) (91,576)
Total governmental activities 22,620,051 26,705,216 28,688,892 26,691,373 32,542,683 32,868,213 32,470,012
Business-type activities
Use of money and property 438,775 513,954 508,939 573,172 (291,344) 123,648 119,045
Transfers 214,752 (62,857) - 300,443 (187,418) 93,482 91,576
Total business-type activities 653,527 451,097 508,939 873,615 (478,762) 217,130 210,621
Total primary government 23,273,578$ 27,156,313$ 29,197,831$ 27,564,988$ 32,063,921$ 33,085,343$ 32,680,633$
Changes in Net Assets
Governmental activities 4,373,969$ 6,521,486$ 5,150,314$ 1,688,254$ (358,422)$ (93,497)$ 2,391,142$
Business-type activities 646,864 129,596 (127,149) 4,244,402 425,703 2,703,412 2,187,128
Total primary government 5,020,833$ 6,651,082$ 5,023,165$ 5,932,656$ 67,281$ 2,609,915$ 4,578,270$
*Data not available prior to 2005

CITY OF SAN BRUNO, CALIFORNIA
FUND BALANCES, GOVERNMENTAL FUNDS
LAST TEN FISCAL YEARS
(Fiscal years ended June 30,)
118
2005* 2006 2007 2008 2009 2010 2011
General FundNonspendable -$ -$ -$ -$ -$ 648,702$ 638,512$ Restricted 3,353,515 3,934,669 662,200 826,709 1,060,558 - -
Assigned - - - - - 152,533 127,407
Unassigned 3,245,215 4,462,312 8,041,350 8,670,499 6,652,186 7,443,638 9,052,945
Total general fund 6,598,730$ 8,396,981$ 8,703,550$ 9,497,208$ 7,712,744$ 8,244,873$ 9,818,864$
All Other Governmental FundsNonspendable -$ -$ -$ 90,000$ 90,000$ 90,000$ 90,000$ Restricted 1,030,184 1,119,897 4,947,910 7,797,724 11,490,283 13,486,013 17,870,653
Unassigned (2,041,041) (836,728) - - (986,616) (1,818,644) (1,843,753)
Total all other governmental funds (1,010,857)$ 283,169$ 4,947,910$ 7,887,724$ 10,593,667$ 11,757,369$ 16,116,900$
*Data not available prior to 2005

CITY OF SAN BRUNO, CALIFORNIA
CHANGES IN FUND BALANCES, GOVERNMENTAL FUNDS
LAST TEN FISCAL YEARS
(Fiscal years ended June 30,)
119
Revenues: 2002 2003 2004 2005 2006 2007 2008 2009 2010 2011Taxes 13,600,471$ 16,810,824$ 18,278,498$ 21,801,314$ 18,835,537$ 21,137,455$ 23,236,735$ 27,788,860$ 27,863,575$ 27,705,514$ Licenses and permits 3,405,934 4,866,084 1,835,250 1,637,527 5,283,072 4,813,087 4,379,092 3,644,640 2,036,968 2,182,177 Intergovernmental 6,279,693 4,410,098 3,960,354 4,538,435 4,726,434 4,976,381 5,555,835 4,024,517 4,663,260 4,102,933 Charges for services 1,827,108 3,800,633 3,936,291 5,302,228 4,998,704 3,458,641 3,534,085 2,812,413 3,319,982 4,249,436 Fines and forfeitures 477,585 428,284 555,133 500,717 570,691 563,836 578,406 649,186 763,221 739,033 Use of money and property 1,719,668 306,424 908,139 364,665 1,583,178 1,149,534 2,287,478 1,433,302 1,938,960 1,909,612 Other revenues 1,511,745 1,882,845 614,131 1,660,831 2,210,719 4,048,911 5,976,311 5,601,449 6,151,677 10,199,227
Total revenues 28,822,204 32,505,192 30,087,796 35,805,717 38,208,335 40,147,845 45,547,942 45,954,367 46,737,643 51,087,932
Expenditures:General government 5,277,572 2,891,821 3,587,063 3,830,993 3,750,350 3,449,991 1,114,968 3,831,772 3,432,652 7,733,633 Public safety 13,843,611 13,550,445 13,237,345 14,996,475 16,168,590 16,848,691 20,849,179 19,606,624 19,791,984 18,630,659 Public works 1,135,506 2,929,116 1,943,991 491,059 679,486 1,017,450 1,501,639 1,228,246 795,138 827,163 Highways and streets 3,377,048 2,236,444 1,207,594 5,552,960 4,969,695 2,956,134 4,816,250 4,101,578 3,924,442 2,442,621 Parks and recreation 3,775,558 4,202,653 3,791,251 3,562,029 3,886,525 4,136,082 4,822,377 4,627,648 4,319,160 4,106,814 Library 1,612,191 1,610,702 1,731,081 1,559,864 1,663,807 1,625,429 2,028,271 1,903,867 1,752,924 1,669,374 5,011,732 3,565,513 3,005,093 3,474,765 3,543,200 3,561,656 4,899,902 7,998,339 8,978,350 7,280,597 Capital outlay 7,525,731 3,984,770 1,661,709 773,579 827,974 799,524 906,765 696,590 1,071,479 699,463 Debt service:
Principal 75,000 447,867 474,153 501,323 812,828 479,955 503,713 523,124 548,219 574,031 Interest 622,025 845,104 569,776 516,934 563,591 548,987 526,204 702,518 677,464 651,882
Total expenditures 42,255,974 36,264,435 31,209,056 35,259,981 36,866,046 35,423,899 41,969,268 45,220,306 45,291,812 44,616,237
Reconciliation of Governmental Revenues
Less Expenditures to Fund Equity:Revenues over (under) expenditures (13,433,770) (3,759,243) (1,121,260) 545,736 1,342,289 4,723,946 3,578,674 734,061 1,445,831 6,471,695 Proceed from Loan/Bond 1,360,674 - - - - - - - - - Other financing sources (Transfer In) 775,000 355,758 337,000 - 4,299,624 2,963,422 3,504,587 5,418,156 3,696,045 Other financing sources (Transfer Out) (4,058,624) (2,812,004) (3,317,169) (5,168,156) (4,234,218) Other financing sources (uses):
Operating transfers from (to) Enterprise Funds: Water 465,251 - - 77,500 - - - - - Stormwater 219,117 190,400 - 25,000 - - - - - Wastewater 350,660 - - 72,664 - - - - - Cable Television 144,600 606,749 25,000 - - - - - - - Operating transfers from (to) Internal Service Funds 230,601 249,834 211,398 150,000 - - - - - Proceeds from sale of fixed assets 14,330 - 3,065 - 6,363 3,380 - - - Proceeds of debt issued (refunds) - - - 1,229,298 - - - - - Total other financing sources (uses) 1,179,628 1,042,080 274,834 214,463 1,554,462 6,363 3,380 - - -
Net change in fund balances (10,893,468)$ (3,492,163)$ (1,202,184)$ 423,199$ 2,896,751$ 4,971,309$ 3,733,472$ 921,479$ 1,695,831$ 5,933,522$
Debt service as a percentage of noncapital expenditures 2% 4% 4% 3% 4% 3% 3% 3% 3% 3%

CITY OF SAN BRUNO, CALIFORNIA
ASSESSED VALUE AND ACTUAL VALUE OF TAXABLE PROPERTY
LAST TEN FISCAL YEARS
(In thousands of dollars)
120
Total
Real Personal Direct
Property Property Tax
City of San Bruno: Secured Unsecured Total (a) Rate (b)
FY 01-02 3,295,218$ 191,857$ 3,487,075$ 1.0000
FY 02-03 3,485,019 190,806 3,675,825 1.0000
FY 03-04 3,903,221 200,346 4,103,567 1.0000
FY 04-05 3,643,634 85,243 3,728,877 1.0000
FY 05-06 3,966,877 73,588 4,040,465 1.0000
FY 06-07 4,539,673 132,802 4,672,475 1.0000
FY 07-08 4,936,181 136,883 5,073,064 1.0000
FY 08-09 5,275,742 151,461 5,427,203 1.0000
FY 09-10 4,987,270 158,207 5,145,477 1.0000
FY 10-11 4,917,181 149,425 5,066,606 1.0000
All above are Full Value (100%)
(a) The State Constitution requires property to be assessed at one hundred percent of the most recent
purchase price, plus an increment of no more than two percent annually, plus any local over-rides.
These values are considered to be full market values.
(b) California Cities do not set their own direct tax rate. The State Constitution establishes the rate at 1% and
allocates a portion of that amount, by an annual calculation, to ALL the taxing entities within a tax rate area.

CITY OF SAN BRUNO, CALIFORNIA
DIRECT AND OVERLAPPING TAX RATES
FOR THE LAST TEN FISCAL YEARS
(Rate per $100 of assessed value)
121
Total
Total School Special Tax
Basic Rate Direct Districts Districts Rate
FY 01-02 1.0000 1.0000 0.1634 0.0000 1.1634
FY 02-03 1.0000 1.0000 0.1634 0.0000 1.1634
FY 03-04 1.0000 1.0000 0.1634 0.0000 1.1634
FY 04-05 1.0000 1.0000 0.0597 0.0000 1.0597
FY 05-06 1.0000 1.0000 0.0574 0.0000 1.0574
FY 06-07 1.0000 1.0000 0.0664 0.0000 1.0664
FY 07-08 1.0000 1.0000 0.0596 0.0000 1.0596
FY 08-09 1.0000 1.0000 0.0710 0.0000 1.0710
FY 09-10 1.0000 1.0000 0.0804 0.0000 1.0804
FY 10-11 1.0000 1.0000 0.0834 0.0000 1.0834
Source: California Municipal Statistics
Direct Rates

CITY OF SAN BRUNO, CALIFORNIA
PRINCIPAL PROPERTY TAXPAYERS
CURRENT YEAR AND EIGHT YEARS AGO
122
% of % of
Property Owner Primary Land Use Assessed Valuation Rank Total Property OwnerPrimary Land
Use
Assessed Valuation
(in thousands of
dollars)
Rank Total
ASN Tanforan Crossing I LLC Apartments 154,742,167$ 1 20.24% The Gap Inc. Office Building 286,269$ 1 43.94%
Tanforan Park Shopping Center Shopping Center 123,259,216 2 16.13% Bayhill Associates Office Building 125,010 2 19.19%
The Gap Inc. Office Building 122,969,315 3 16.09% Aimco San Bruno Apt. Apartments 45,406 3 6.97%
Bayhill Four Associates Office Building 103,000,000 4 13.48% San Bruno Seventeen et al Office Building 36,843 4 5.66%
SNK SB Crossing LLC Apartments 74,416,906 5 9.74% RB Lake Amir Office Et AL Office Building 29,361 5 4.51%CREA-San Bruno LLC Office Building 43,500,000 6 5.69% Crystal Springs Associates Apartments 29,072 6 4.46%Landmark Towne Center LLC Shopping Center 40,673,508 7 5.32% Tanforan Shopping Center Shopping Center 27,991 7 4.30%
Aimco San Bruno Apartments Partners LP Apartments 35,800,308 8 4.68% JC Penny Co. Inc. Shopping Center 24,469 8 3.76%FW CA Bay Hill Shopping Center Shopping Center 34,427,813 9 4.50% Martin/Regis San Bruno Assoc.Apartments 23,705 9 3.64%Crystal Springs Associates Apartments 31,587,382 10 4.13% Lowes HIW Inc. Lessee Shopping Center 23,359 10 3.59%
Source(s): Financial Statements and California Municipal Statistics, Inc.
2010-11 2002-2003

CITY OF SAN BRUNO, CALIFORNIA
SCHEDULE OF TOP 40 RETAIL BUSINESSES
FOR THE YEAR ENDED JUNE 30, 2011
(Listed in alphabetical order)
123
Name Address
All Shores 135 El Camino Real
Apex System, Inc. 1111 Bayhill Dr., Ste 240
Bayhill 4-7 LLC 950 Elm Ave.
Best Buy Store #1896 1250 El Camino Real
Biocodex Inc. 1250 Bayhill Dr., Ste 200
BJ's Restaurant 1150 El Camino Real Ste 270
Century Theaters Inc.#494 1188 El Camino Real
Cisco Ironport Systems, Inc. 950 Elm Ave.
Cox Digital Solutions 1000 Cherry Ave. Ste 200
CVS/Pharmacy #9807 10 Bayhill Shopping CTR
Davita RX, LLC#1685 1178 Cherry Ave.
Grace Honda 345 El Camino Real
Inquira, Inc. 900 Cherry Ave. Fl 6
J.C. Penney Corp., Inc#1959-6 1122 El Camino Real
James J. Boyle & Co. 1097 Sneath Ln.
Lash Group, Inc. 999 Bayhill Dr.#330
Lohika Systems Inc. 1111 Bayhill Dr. Ste 210
Lowe's HIW, Inc #1019 1340 El Camino Real
Lucky #748 1322 El Camino Real
Lunardi's Market 2801 San Bruno Ave.
Marshall's #492 1268 El Camino Real
Melody Toyota 750 El Camino Real
Mollie Stone's Market 22 Bayhill Shopping CTR
Nomis Solutions Inc. 1111 Bayhill Dr. Ste 230
On Assignment Lab Support & Healthcare 1111 Bayhill Dr. Ste 200
Pacific Bell 1101 San Mateo Ave.
PT Gaming LLC 659 Huntington Ave.
Ramada Limited 500 El Camino Real
Recology San Bruno 101 Tanforan Ave.Sears Auto Center#6909 1178 El Camino Real
Sears, Roebuck & Co.#1478 1178 El Camino Real
Shelter Creek Condo. Owners Association 701 Shelter Creek Ln.
SNK SB Crossing LLC(Acappella Apts.) 1001 National Ave.
Target Store T1054 1150 El Camino Real
The Permanente Medical Group 801 Traeger Ave.
The Permanente Medical Group 901 El Camino Real
Vantagepoint Venture Partners 1001 Bayhill Dr. Ste 300
Vince's Shell Fish Co, Inc. 1063 Montgomery Ave.
Walgreens #2939 333 El Camino Real
You Tube Inc. 901 Cherry Ave.
Source : City of San Bruno

CITY OF SAN BRUNO, CALIFORNIA
PROPERTY TAX LEVIES AND COLLECTION
FOR THE LAST TEN YEARS
124
Fiscal
Year Taxes Levied Collections
Ended for the Percentage in Subsequent Percentage
June 30, Fiscal Year Amount of Levy Years Amount of Levy
2002 3,534,432$ 3,534,432$ 100% -$ 3,534,432$ 100%
2003 3,662,064 3,662,064 100% - 3,662,064 100%
2004 3,823,744 3,823,744 100% - 3,823,744 100%
2005 3,679,828 3,679,828 100% - 3,679,828 100%
2006 3,983,245 3,983,245 100% - 3,983,245 100%
2007 4,365,665 4,365,665 100% - 4,365,665 100%
2008 4,987,275 4,987,275 100% - 4,987,275 100%
2009 4,848,334 4,848,334 100% - 4,848,334 100%
2010 4,668,992 4,668,992 100% - 4,668,992 100%
2011 4,596,877 4,596,877 100% - 4,596,877 100%
Source: City financial records
Note: Amounts reported and collected under the Teeter Plan in which all taxes are distributed to the City in the year of the levy with the
County of San Mateo retaining any interest or penalties on uncollected balances.
Collected within the
Fiscal Year of the Levy Total Collections to Date
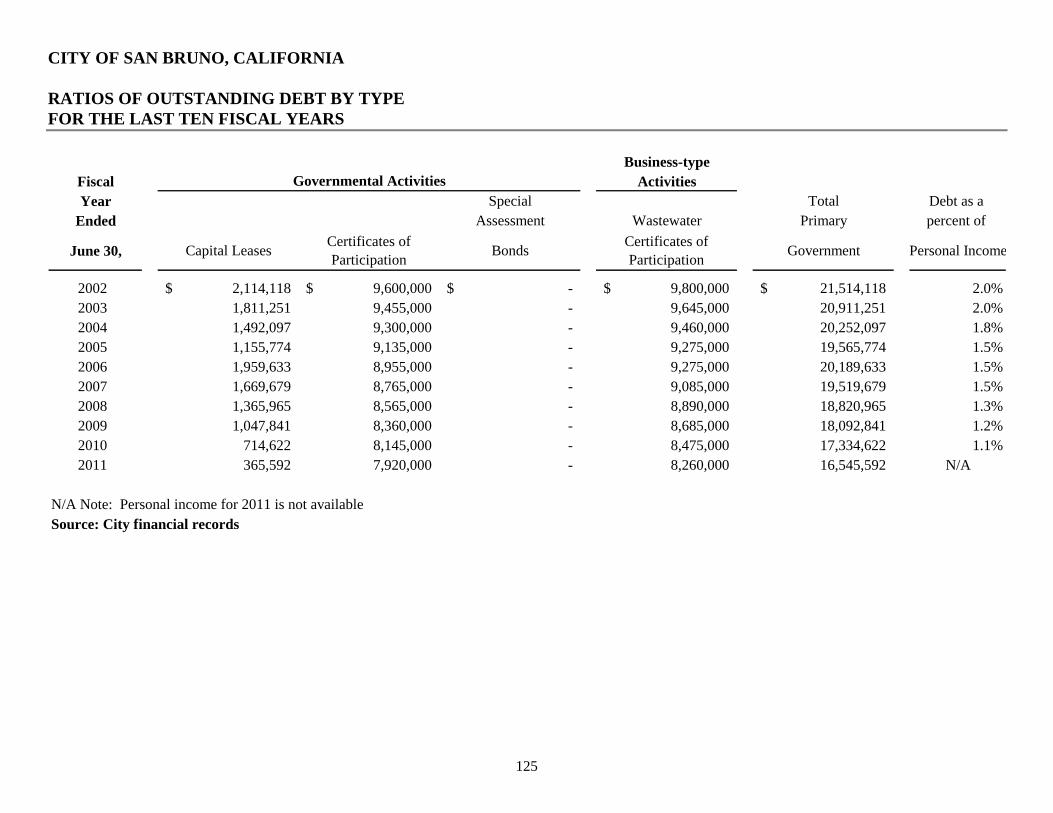
CITY OF SAN BRUNO, CALIFORNIA
RATIOS OF OUTSTANDING DEBT BY TYPE
FOR THE LAST TEN FISCAL YEARS
125
Business-type
Fiscal Activities
Year Special Total Debt as a
Ended Assessment Wastewater Primary percent of
June 30, Capital LeasesCertificates of
ParticipationBonds
Certificates of
ParticipationGovernment Personal Income
2002 2,114,118$ 9,600,000$ -$ 9,800,000$ 21,514,118$ 2.0%
2003 1,811,251 9,455,000 - 9,645,000 20,911,251 2.0%
2004 1,492,097 9,300,000 - 9,460,000 20,252,097 1.8%
2005 1,155,774 9,135,000 - 9,275,000 19,565,774 1.5%
2006 1,959,633 8,955,000 - 9,275,000 20,189,633 1.5%
2007 1,669,679 8,765,000 - 9,085,000 19,519,679 1.5%
2008 1,365,965 8,565,000 - 8,890,000 18,820,965 1.3%
2009 1,047,841 8,360,000 - 8,685,000 18,092,841 1.2%
2010 714,622 8,145,000 - 8,475,000 17,334,622 1.1%
2011 365,592 7,920,000 - 8,260,000 16,545,592 N/A
N/A Note: Personal income for 2011 is not available
Source: City financial records
Governmental Activities

CITY OF SAN BRUNO, CALIFORNIA
OVERLAPPING DEBT
JUNE 30, 2011
126
2010-11 Assessed Valuation: 4,221,111,371
Net Debt
Overlapping Tax and Assessment Debt: Outstanding % Applicable (1)
Debt
San Mateo Community College District 613,779,994$ 3.306% 20,291,567$
South San Francisco Unified School District 67,015,682 1.816 1,217,005
San Mateo Union High School District 300,047,257 9.154 27,466,326
San Bruno Park School District 16,973,567 84.805 14,393,924
Millbrae School District Maintenance Assessment District 29,999,527 2.179 653,690
Total overlapping tax and assessment debt 64,022,512
Direct and Overlapping General Fund Debt:
San Mateo County General Fund Obligations 337,584,816 3.306 11,160,554
San Mateo County Board of Education Certificates of Participation 12,420,000 3.306 410,605
San Mateo County Flood Control District Certificates of Participation 23,015,000 6.278 1,444,882
South San Francisco Unified School District Certificates of Participation 1,522,975 1.816 27,657
San Mateo Union High School District Certificates of Participation 65,946,236 9.154 6,036,718
City of San Bruno 1915 Act Bonds 7,920,000 100.000 7,920,000
Total direct and overlapping general fund debt 27,000,416
Total Direct Debt 7,920,000
Total Overlapping Debt 83,102,928
Combined Total Debt (2) 91,022,928$
Ratios to Assessed Valuation:
Combined Direct Debt 0.19%
Total Overlapping Tax and Assessment Debt 1.25%
Combined Total Debt 2.16%
State School Building Aid Repayable as of 6/30/11 -$
(1) Percentage of overlapping agency's assessed valuation located within boundaries of the city.
Source: California Municipal Statistics
(2) Excludes tax and revenue anticipation notes, enterprise revenue, mortgage revenue, and tax allocation bonds and non-bonded
capital lease obligations.

CITY OF SAN BRUNO, CALIFORNIA
LEGAL DEBT MARGIN INFORMATION
LAST TEN FISCAL YEARS
(Dollars in thousands)
127
2002 2003 2004 2005 2006 2007 2008 2009 2010 2011
Debt limit 494,283$ 522,753$ 585,483$ 546,545$ 595,032$ 680,951$ 740,427$ 791,361$ 748,091$ 737,577$
Total net debt applicable to limit 21,514 20,911 20,252 19,566 20,190 19,520 18,821 18,093 17,335 16,546
Legal debt margin 472,769$ 501,842$ 565,231$ 526,979$ 574,842$ 661,431$ 721,606$ 773,268$ 730,756$ 721,031$
Total net debt applicable to the limit
as a percentage of debt limit 4.55% 4.17% 3.58% 3.71% 3.51% 2.95% 2.61% 2.34% 2.37% 2.29%

CITY OF SAN BRUNO, CALIFORNIA
PLEDGED REVENUE COVERAGE
FOR THE LAST TEN FISCAL YEARS
128
Fiscal
Year Less: Net
Ended Operating Available
June 30,Sewer Revenues &
TransfersExpenses Revenue Principal Interest Coverage
2002 5,267,665$ 3,681,836$ 1,585,829$ -$ -$ N/A
2003 5,324,186 4,567,164 757,022 - 469,618 1.61
2004 5,455,496 4,760,646 694,850 155,000 443,767 1.16
2005 5,943,670 5,150,495 793,175 185,000 439,605 1.27
2006 6,079,454 4,206,352 1,873,102 185,000 435,165 3.02
2007 6,261,689 5,804,944 456,745 190,000 430,035 0.74
2008 8,413,781 7,063,137 1,350,644 195,000 424,185 2.18
2009 9,061,790 7,275,670 1,786,120 205,000 417,420 2.87
2010 9,566,100 7,235,637 2,330,463 210,000 409,860 3.76
2011 10,138,799 8,716,620 1,422,179 215,000 401,690 2.31
Source: City financial records
Business-type Activities
Wastewater Certificates of Participation
Debt Service

CITY OF SAN BRUNO, CALIFORNIA
DEMOGRAPHIC AND ECONOMIC STATISTICS
FOR THE LAST TEN FISCAL YEARS
129
Per
Total Capita
Personal Personal Median School Unemployment
Year Population Income Income Age Enrollment Rate
2002 40,350 1,063,626,000$ 26,360$ 36.3 3,906 4.5%
2003 40,350 1,063,626,000 26,360 36.3 3,906 4.5%
2004 41,500 1,156,065,500 27,857 36.3 3,906 4.5%
2005 39,752 1,313,962,608 33,054 36.3 3,806 4.5%
2006 39,986 1,321,537,300 33,050 36.3 3,857 3.8%
2007 40,017 1,322,721,918 33,054 36.7 3,793 3.9%
2008 43,286 1,430,602,300 33,050 39.0 3,796 4.8%
2009 43,798 1,490,883,920 34,040 38.3 3,805 8.9%
2010 44,294 1,537,533,328 34,712 36.3 3,789 9.2%
2011 41,842 N/A N/A 39.4 3,697 8.7%
Source:
Population is provided by the State Department of Finance
Personal income and per capita personal income is provided by U.S. Census, American Comm.Survery 3-year
Estimates and is adjusted for inflation
Median Age is provided by U.S. Census Bureau, American Comm.Survey 3-year Estimates
School Enrollment is provided by Caupuchino High & San Bruno Park
The unemployment rate is provided by the State of California Employment Development Department for
San Mateo County
N/A Note: The recent fiscal year personal income and per capita income figures are not available until the next fiscal year
San Mateo County

CITY OF SAN BRUNO, CALIFORNIA
PRINCIPAL EMPLOYERS
CURRENT YEAR AND LAST YEAR
130
Percentage Percentage
of Top 11 of Top 11Employer Employees Rank Employment Employees Rank Employment
Cisco Ironport Systems, Inc. 262 1 12.22% 373 1 17.40%You Tube, Inc. 481 2 22.43% 400 2 18.66%Target Store T1054 292 3 13.62% 286 3 13.34%SNK SB Crossing LLC 6 4 0.28% N/A 0.00%Davita RX, LLC 52 5 2.43% 32 7 1.49%Sears, Roebuck & Co. 293 6 13.67% 287 4 13.39%Lowe's HIW, Inc. 150 7 7.00% 156 5 7.28%Vantagepoint Capital Partners 57 8 2.66% 62 6 2.89%Lash Group, Inc. 323 9 15.07% 309 8 14.41%Inquira, Inc. 160 10 7.46% 75 10 3.50%Melody Toyota 68 11 3.17% 67 9 3.13%JC Penny Corp. Inc. N/A 237 11 11.00%
Total 2,144 2,284
Source: City of San Bruno Business License records
2010-11 2009-10
* Data for 2002 is not available

CITY OF SAN BRUNO, CALIFORNIA
FULL-TIME EQUIVALENT CITY EMPLOYEES BY FUNCTION/PROGRAM
LAST TEN FISCAL YEARS
(Fiscal year ended June 30)
131
Function/Program 2005-06* 2006-07 2007-08 2008-09 2009-10 2010-11
General FundCity Council 5.00 5.00 5.00 5.00 5.00 5.00
City Clerk 1.50 1.75 1.75 1.75 1.75 1.75
City Treasurer 1.00 1.00 1.00 1.00 1.00 1.00
Legal Services 1.25 1.25 1.25 1.25 1.25 1.25
City Manager 2.00 2.00 2.00 2.00 2.00 2.00
Human Resources 2.00 2.75 2.75 2.75 1.75 1.75
Finance Administration 5.00 5.00 5.00 5.00 5.00 5.00
Revenue Services 6.00 6.00 6.00 6.00 6.00 6.00
Police 66.00 66.00 63.00 66.00 61.00 61.50
Fire 36.00 35.00 33.00 33.50 33.50 33.50
Public WorksAdmin. & Engineering 7.75 8.75 7.75 7.75 7.75 6.75
Streets Maintenance 5.60 5.60 5.60 5.60 5.10 5.05
Community DevelopmentPlanning 3.45 3.45 2.60 2.50 2.00 2.00
Building 6.10 6.10 5.30 5.00 4.00 4.00
Parks & Recreation ServicesRecreation 4.05 4.20 3.35 4.35 3.85 4.05
Parks Maintenance 18.75 18.75 15.95 17.00 15.50 14.35
Senior Services 2.45 2.30 2.15 2.15 2.15 2.25
Library Services 10.50 10.50 9.50 10.00 9.00 8.75
Subtotal 184.40 185.40 172.95 178.60 167.60 165.95
Special Revenues
Solid Waste 0.30 0.30 0.30 0.30 0.25 0.35RDA Operations 2.80 2.75 1.80 3.60 3.60 3.60RDA Low/Mod Housing 1.65 1.70 1.25 1.90 1.90 1.90
Subtotal 4.75 4.75 3.35 5.80 5.75 5.85
Internal ServicesCentral Garage 3.35 3.95 3.85 3.95 3.95 3.35Buildings and Facilities 5.75 7.00 5.50 7.00 7.00 6.10Technology Support 3.00 3.00 3.00 3.00 3.00 3.00Self-Insurance 1.00 1.00 1.00 1.00 0.75 0.50
Subtotal 13.10 14.95 13.35 14.95 14.70 12.95
Enterprise FundsWater Enterprise 15.90 17.90 15.90 16.90 16.90 17.30Stormwater Enterprise 2.55 2.95 2.95 2.95 2.95 3.65Wastewater Enterprise 14.60 14.60 12.10 14.60 14.10 14.55Cable Enterprise 18.50 19.50 19.00 19.50 19.50 20.00
Subtotal 51.55 54.95 49.95 53.95 53.45 55.50
Total Positions (all funds) 253.80 260.05 239.60 253.30 241.50 240.25Source: City of San Bruno
*Data prior to 2005 not available

CITY OF SAN BRUNO, CALIFORNIA
CAPITAL ASSET STATISTICS BY FUNCTION/PROGRAM
LAST FIVE FISCAL YEARS
(Fiscal year ended June 30)
132
Function/Program 2007 2008 2009 2010 2011
Engineering /Public Work
Pavement (720,575) (698,246) (698,027) (696,010) (732,678) Traffic Signal 17
Traffic Signal (42,547) (42,218) (43,404) (54,334) (54,334)
Streetlights 1,448
Streetlights (76,300) (241,541) (241,541) (241,541) (241,542)
Housing & Redevelopment
Roadway in centerline miles 145
Sidewalk (411,070) (402,009) (415,587) (415,488) (423,538)
Roadway in centerline miles 131
Curb & Gutter (120,158) (117,235) (117,235) (117,235) (117,235)
Finance and Parks
Park Facilities 24
Park Facilities (35,915) (35,847) (35,847) (35,847) (35,847)
Walkway Paths and Trails Subsystem 2
Walkway Paths and Trails Subsystem (20,944) (20,507) (20,507) (20,507) (20,507)
Buildings 24
Structures (389,213) (367,380) (377,093) (386,312) (394,902)
Source: City records and Infrastructure Valuations performed by AMS Consulting, LLC
Note(s): Amounts are additions (reductions) only to show the reader valuation adjustments by program
associated with the department. N/A = Not applicable, first year of valuation.