Gas permeation in thin films of “high free-volume” glassy perfluoropolymers: Part I. Physical...
14
Gas permeation in thin films of “high free-volume” glassy perfluoropolymers: Part II. CO 2 plasticization and sorption Rajkiran R. Tiwari a , Zachary P. Smith a , Haiqing Lin b, c , B.D. Freeman a , D.R. Paul a, * a Department of Chemical Engineering, University of Texas at Austin, Austin, TX, USA b Membrane Technology and Research Inc., Newark, CA, USA c Department of Chemical and Biological Engineering, University at Buffalo, The State University of New York, Buffalo, NY, USA article info Article history: Received 23 September 2014 Received in revised form 29 November 2014 Accepted 4 December 2014 Available online 15 December 2014 Keywords: CO 2 plasticization and sorption Perfluoropolymers Membranes abstract Carbon dioxide (CO 2 ) plasticization and sorption effects in both thick and thin films of “high free-vol- ume” glassy perfluoropolymers were studied by monitoring CO 2 permeability and by observing changes in the film thickness and refractive index with ellipsometry measurements. The film thickness, aging time, thermal history and CO 2 exposure protocols have significant effect on the absolute CO 2 perme- ability and plasticization behavior of both thick and thin films. The extent of CO 2 plasticization increases as film thickness decreases and as the aging time is increased. The as-cast films showed higher plasti- cization compared to films which were annealed above T g ; however, the CO 2 permeability of both the as- cast and annealed films continuously decreased during the depressurization step unlike other glassy polymers. In general, the various CO 2 exposure protocols revealed lower CO 2 plasticization for per- fluoropolymers compared to other reported glassy polymers. The extent of CO 2 sorption obtained from the ellipsometry measurements was found to decrease with the decrease in the excess volume and increase in the aging time for perfluoropolymers; in addition, the structural differences among the various glassy polymers resulting in different polymeregas interactions also affects the overall sorption characteristics. The lower plasticization in perfluoropolymers compared to Matrimid was also confirmed from the smaller percent increase observed for the experimental diffusion coefficient compared to the theoretically predicted diffusion coefficient from the dual sorption-mobility model. The Langmuir sorption parameter, C 0 H , and solubility at infinite dilution, S 0 , obtained from fitting dual sorption-mobility model to sorption data, showed an excellent linear correlation with (T g -35) C. The CO 2 diffusivity and permeability data obtained for thin films of various glassy polymers also showed a strong correlation with free volume. The somewhat unusual behavior of thin films of AF 2400 in comparison to other glassy polymers studied to date is believed to be related to the low cohesive energy density expected of per- fluorinated structures and its high free volume resulting from the bulky dioxole comonomer. © 2015 Published by Elsevier Ltd. 1. Introduction The recent activity in recovery of natural gas from shale for- mations has rejuvenated the natural gas industry and has provided further incentives for development of polymeric membranes with significant chemical resistance towards carbon dioxide, one of the major constituents in natural gas separation processes [1,2]. The global consumption of natural gas is projected to increase from 113 trillion cubic feet in 2010 to 185 trillion cubic feet in 2040 [3]. Although amine absorption is commonly used to separate CO 2 from natural gas; polymeric membranes can be an economical alterna- tive due to their higher energy efficiency, lower space requirements and low environmental impact. However, carbon dioxide is known to alter the gas permeability due to plasticization effects in almost all polymers of interest for membrane applications, and this effect seems to be more severe as the film thickness reaches the practical membrane thickness of less than 1 mm [4]. Although designing new polymers with high permeability and selectivity characteristics is desirable for gas separation applications, it is equally important to consider their feasibility with regard to CO 2 plasticization response for natural gas and other gas separation application purposes. DOI of original article: http://dx.doi.org/10.1016/j.polymer.2014.09.022. * Corresponding author. E-mail address: [email protected] (D.R. Paul). Contents lists available at ScienceDirect Polymer journal homepage: www.elsevier.com/locate/polymer http://dx.doi.org/10.1016/j.polymer.2014.12.008 0032-3861/© 2015 Published by Elsevier Ltd. Polymer 61 (2015) 1e14
Transcript of Gas permeation in thin films of “high free-volume” glassy perfluoropolymers: Part I. Physical...

lable at ScienceDirect
Polymer 61 (2015) 1e14
Contents lists avai
Polymer
journal homepage: www.elsevier .com/locate/polymer
Gas permeation in thin films of “high free-volume” glassyperfluoropolymers: Part II. CO2 plasticization and sorption
Rajkiran R. Tiwari a, Zachary P. Smith a, Haiqing Lin b, c, B.D. Freeman a, D.R. Paul a, *
a Department of Chemical Engineering, University of Texas at Austin, Austin, TX, USAb Membrane Technology and Research Inc., Newark, CA, USAc Department of Chemical and Biological Engineering, University at Buffalo, The State University of New York, Buffalo, NY, USA
a r t i c l e i n f o
Article history:Received 23 September 2014Received in revised form29 November 2014Accepted 4 December 2014Available online 15 December 2014
Keywords:CO2 plasticization and sorptionPerfluoropolymersMembranes
DOI of original article: http://dx.doi.org/10.1016/j.* Corresponding author.
E-mail address: [email protected] (D.R. Paul).
http://dx.doi.org/10.1016/j.polymer.2014.12.0080032-3861/© 2015 Published by Elsevier Ltd.
a b s t r a c t
Carbon dioxide (CO2) plasticization and sorption effects in both thick and thin films of “high free-vol-ume” glassy perfluoropolymers were studied by monitoring CO2 permeability and by observing changesin the film thickness and refractive index with ellipsometry measurements. The film thickness, agingtime, thermal history and CO2 exposure protocols have significant effect on the absolute CO2 perme-ability and plasticization behavior of both thick and thin films. The extent of CO2 plasticization increasesas film thickness decreases and as the aging time is increased. The as-cast films showed higher plasti-cization compared to films which were annealed above Tg; however, the CO2 permeability of both the as-cast and annealed films continuously decreased during the depressurization step unlike other glassypolymers. In general, the various CO2 exposure protocols revealed lower CO2 plasticization for per-fluoropolymers compared to other reported glassy polymers. The extent of CO2 sorption obtained fromthe ellipsometry measurements was found to decrease with the decrease in the excess volume andincrease in the aging time for perfluoropolymers; in addition, the structural differences among thevarious glassy polymers resulting in different polymeregas interactions also affects the overall sorptioncharacteristics. The lower plasticization in perfluoropolymers compared to Matrimid was also confirmedfrom the smaller percent increase observed for the experimental diffusion coefficient compared to thetheoretically predicted diffusion coefficient from the dual sorption-mobility model. The Langmuirsorption parameter, C0
H , and solubility at infinite dilution, S0, obtained from fitting dual sorption-mobilitymodel to sorption data, showed an excellent linear correlation with (Tg-35) �C. The CO2 diffusivity andpermeability data obtained for thin films of various glassy polymers also showed a strong correlationwith free volume. The somewhat unusual behavior of thin films of AF 2400 in comparison to other glassypolymers studied to date is believed to be related to the low cohesive energy density expected of per-fluorinated structures and its high free volume resulting from the bulky dioxole comonomer.
© 2015 Published by Elsevier Ltd.
1. Introduction
The recent activity in recovery of natural gas from shale for-mations has rejuvenated the natural gas industry and has providedfurther incentives for development of polymeric membranes withsignificant chemical resistance towards carbon dioxide, one of themajor constituents in natural gas separation processes [1,2]. Theglobal consumption of natural gas is projected to increase from 113
polymer.2014.09.022.
trillion cubic feet in 2010 to 185 trillion cubic feet in 2040 [3].Although amine absorption is commonly used to separate CO2 fromnatural gas; polymeric membranes can be an economical alterna-tive due to their higher energy efficiency, lower space requirementsand low environmental impact. However, carbon dioxide is knownto alter the gas permeability due to plasticization effects in almostall polymers of interest for membrane applications, and this effectseems to be more severe as the film thickness reaches the practicalmembrane thickness of less than 1 mm [4]. Although designing newpolymers with high permeability and selectivity characteristics isdesirable for gas separation applications, it is equally important toconsider their feasibility with regard to CO2 plasticization responsefor natural gas and other gas separation application purposes.

R.R. Tiwari et al. / Polymer 61 (2015) 1e142
In Part 1 of this series, we showed that the amorphous per-fluoropolymers have high gas permeability and show rather stableaging performance over long times which is necessary for mem-brane applications. The CO2/CH4 selectivity of ~5 for AF 2400makesit a potential candidate for natural gas separations. Althoughamorphous perfluoropolymers have been used for oxygen enrich-ment of air and CO2 separation in some cases, they have not beenextensively studied in thin film form [5]. Recently, Horn and Pauldemonstrated that thin films undergo significantly greater CO2plasticization effects than thick films; the observed responses areaffected by the aging time and CO2 exposure protocol used [6e8].The response of thin films to plasticization is complex and seems tobe strongly dependent on the particular polymer. Since amorphousperfluoropolymers and other fluorine containing polymers are ofsome interest for CO2 removal from the natural gas, it is importantto understand their CO2 plasticization behavior when in thin filmform. Although the gas permeability [9e18], sorption[9,11,12,15e17,19e23], CO2 plasticization [24,25] and fractional freevolume (FFV) [10,26e30] for various amorphous per-fluoropolymers have been reported, detailed studies on thesecharacteristics of such materials in thin film form have not beenpreviously reported. To further improve our understanding aboutCO2 solubility and diffusivity, we have also studied CO2 sorption inthin films of amorphous perfluoropolymers and other glassypolymers with moderate free volume. This paper explores thecombined effects of CO2 exposure and sorption effects on thepermeability, plasticization behavior, solubility and diffusivity ofvarious glassy polymers. In addition, the dual-mode sorptionmodelwas fitted to obtain Langmuir and Henry solubility parameters. TheLangmuir solubility parameter and diffusivity show a strongdependence on the Tg and FFV, respectively. The effect of filmthermal history, aging time and film thickness on the permeabilityand solubility are also reported.
2. Background
Gas transport through non-porous polymers is defined by asolution-diffusion mechanism where the gas molecules firstdissolve in and then diffuse through the polymer [31,32]. The gaspermeability coefficient, P, is related to the diffusion coefficient, D,which is a kinetic factor, and the solubility coefficient, S, which isthermodynamic in nature and governed by the polymeregas in-teractions, by P¼DS [33]. Knowing any two of these coefficientsallows the third to be calculated. Often permeability is measured inthe steady-state regime of a transient gas permeation experimentwhere the diffusion coefficient, D, can be obtained from the tran-sient regime before steady-state (q), referred to as the time-lagmethod, using D¼ l2/6q where l is the membrane thickness [34].Alternatively, P and S can be determined independently fromsteady-state permeation and equilibrium sorption measurements,and then D is obtained from the ratio of P and S. The time-lagmethod is more commonly used for thick laboratory films. In thecase of thin films, the diffusion time scale is such that it is notpossible to accurately determine the diffusion coefficient by thetime-lag method [8]. Furthermore, conventional methods forsorption measurements including gravimetric and pressure decaytechniques cannot be used for very thin films due to the difficultiesof providing enough sample mass for accurate measurement[35e42]. Recently, there have been a few reports on the physicalaging and gas sorption studies performed via recording changes inthe film thickness and its refractive index using ellipsometry[8,42e54]. In particular, Horn and Paul have successfully utilizedellipsometry and systematically studied CO2 sorption in thin filmsas a function of film thickness, aging time and various CO2 exposureprotocols [8].
Ellipsometry is a simple yet powerful tool that measureschanges in the polarization state of linearly polarized lightreflecting off a planar surface and provides data in terms of ellip-sometric parameters 4 (Fresnel reflection) and d (phase change) asa function of wavelength (l). These parameters are then fitted to anappropriate model to obtain thickness and optical parameters. Thefilm thickness and refractive index are decoupled in ellipsometrywhich results in higher accuracy in measurement of these param-eters. More details on ellipsometery and the Cauchy model can befound elsewhere [55e59]. The effect of wavelength, l, on refractiveindex can be described by the Cauchy equation:
nðlÞ ¼ Aþ B.l2 þ C
.l4 (1)
where A, B and C are constants fitted from optical data. TheClausius-Mosotti equation can be used for mixtures of polymer andCO2 to determine the mass concentration of CO2 in the polymerusing Equations (2)e(4):
<n> 2 � 1<n> 2 þ 2
¼ rCO2qCO2
þ rpqp (2)
where rp is the density of the swollen polymer, <n> is an aver-aged refractive index determined within a selected wavelengthrange, q is the specific refraction determined from the bulk valuesof refractive index and density of polymer. Measurement ofsample thickness during these CO2 exposure studies can be usedto relate the density of the swollen polymer film to that of thepure polymer; the following mass balance provides the detailedrelation:
rp ¼ r0h0h
(3)
where r0 is the pure polymer density, h0 is the initial film thickness,and h is the film thickness of the swollen polymer film. The filmarea is constant during swelling due to adhesion of the film to thewafer surface, effectively forcing polymer swelling to occur only inthe thickness direction (i.e., perpendicular to the plane defined bythe wafer surface to which the polymer film is adhered). InsertingEquation (3) into Equation (2) yields:
rCO2¼ 1
qCO2
�<n> 2 � 1<n> 2 þ 2
� r0qph0h
�(4)
The virial equation of state is used to calculate the density of CO2while the refractive index of CO2 is determined from literaturevalues as mentioned previously [8,44,60]. The mass concentrationof CO2 was also converted into a molar CO2 concentration ðCCO2
Þreported as cm3 (STP)/cm3 (polymer). The apparent molar volume,i.e., the average volume occupied by the gas in the swollen polymerfilm on a molar basis, is given by:
fvCO2¼ 22400
�Dh=h0CCO2
�T ;P
(5)
3. Experimental
3.1. Materials and film formation
Table 1 describes four different amorphous perfluoropolymersused in this study along with other polymers considered here forcomparison. The amorphous perfluoropolymers are hereafterreferred to as AF 2400, AF 1600, AD 80 and AD 60. More detailsabout these materials, solution preparation techniques, film casting
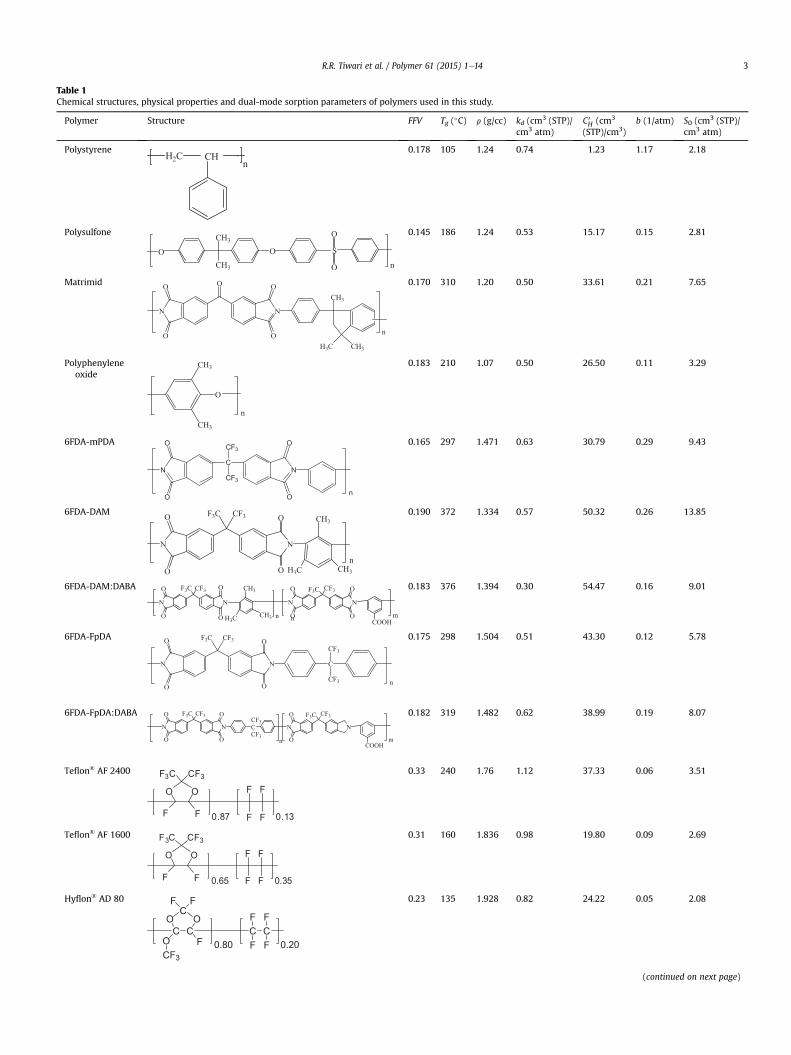
Table 1Chemical structures, physical properties and dual-mode sorption parameters of polymers used in this study.
Polymer Structure FFV Tg (�C) r (g/cc) kd (cm3 (STP)/cm3 atm)
C0H (cm3
(STP)/cm3)b (1/atm) S0 (cm3 (STP)/
cm3 atm)
PolystyreneCHH2C n
0.178 105 1.24 0.74 1.23 1.17 2.18
Polysulfone
O
CH3
CH3
O S
O
O n
0.145 186 1.24 0.53 15.17 0.15 2.81
Matrimid
N
O
O
O
N
O
O
CH3
n
H3C CH3
0.170 310 1.20 0.50 33.61 0.21 7.65
Polyphenyleneoxide
CH3
CH3
O
n
0.183 210 1.07 0.50 26.50 0.11 3.29
6FDA-mPDA O
O
CF3
N
O
O n
0.165 297 1.471 0.63 30.79 0.29 9.43
6FDA-DAM
N
O
O
N
O
O
F3C CF3 CH3
H3C CH3n
0.190 372 1.334 0.57 50.32 0.26 13.85
6FDA-DAM:DABA CF
COOH3
O
O O
O
n
0.183 376 1.394 0.30 54.47 0.16 9.01
6FDA-FpDA
O
N
O
O
F3C CF
C
CF
CF
n
0.175 298 1.504 0.51 43.30 0.12 5.78
6FDA-FpDA:DABA F C CF F3C CF3
N
COOHmn
0.182 319 1.482 0.62 38.99 0.19 8.07
Teflon® AF 2400
O O
F3C CF3
F F
F
F
F
F0.87 0.13
0.33 240 1.76 1.12 37.33 0.06 3.51
Teflon® AF 1600
O O
F3C CF3
F F
F
F
F
F0.65 0.35
0.31 160 1.836 0.98 19.80 0.09 2.69
Hyflon® AD 80
C CO OC
F F
OC
F
F
FCF
F0.80 0.20CF3
0.23 135 1.928 0.82 24.22 0.05 2.08
(continued on next page)
R.R. Tiwari et al. / Polymer 61 (2015) 1e14 3

Table 1 (continued )
Polymer Structure FFV Tg (�C) r (g/cc) kd (cm3 (STP)/cm3 atm)
C0H (cm3
(STP)/cm3)b (1/atm) S0 (cm3 (STP)/
cm3 atm)
Hyflon® AD 60
C CO OC
F F
OC
F
F
FCF
F0.60 0.40CF3
0.23 130 1.945 0.79 18.63 0.06 1.97
PTMSP CH
3
3H C
n
0.29 e 0.75 1.51 63.43 0.10 7.96
PIM-1
CNn
0.26 e 1.08 1.51 59.94 0.21 14.1
R.R. Tiwari et al. / Polymer 61 (2015) 1e144
procedures, and film masking for permeability measurement aregiven in the first paper in this series [4]. Films for sorption studieswere obtained by spin casting polymer solutions onto 1 cm � 1 cmsilicon wafers precut from a 10 cm diameter silicon wafer using aDisco 321Wafer Dicing Saw, CA, USA. The films were then annealedon a hot plate to remove residual solvent followed by thicknessmeasurement using a variable angle spectroscopic ellipsometer(VASE), model M2000D, manufactured by J. A. Woollam Co.,Lincoln, NE, USA. Thin films were then floated off the silicon wafersurface using deionized water and subsequently lifted with arectangular thin wire frame. In some cases, wafers were pre-cleaned before spin coating using an oxygen plasma treatment(March Plasma CS170IF RIE etching system). This plasma treatmentprocess could remove organic contamination and increase the hy-drophilicity of the SiO2 surface, which facilitated film removal fromthe wafer surface.
Prior to sorption measurements, films were annealed at 15 �Cabove Tg for 20 min in the freestanding state and then, imme-diately quenched to room temperature. This removes any residualorientation or stresses in the film that might arise from thecasting process. It is important to note here, that the films forsorption studies were annealed on the silicon wafer and, thus,experience constraints from the substrate. Because of this, thesefilms may undergo slightly different physical aging as comparedto the films annealed in the freestanding state. We have observedonly slight differences in the aging rates of the films annealed onthe silicon substrate and in the freestanding state; therefore, atleast a reasonable comparison of the permeability and CO2 sol-ubility can be made for the same aging time based on the pre-vious studies in our laboratory [8]. More details about the filmmasking procedure for permeability measurements and strate-gies to avoid pin-hole defects in thin films have been provided ina previous paper in this series [4]. The films considered in thisstudy do not have a PDMS layer, which was used in some pre-vious studies to help minimize the impact of pin-hole defects onpermeation measurements [6,7,61,62]. For the highly perme-ability materials considered in this study, even a relatively thinlayer of PDMS would provide a significant mass transfer resis-tance relative to that of the thin polymer film under study, so wedecided to make measurements only on samples that were notovercoated with PDMS. Even so, the experimental uncertaintiesfor permeability and sorption measurements reported hereinwere less than ±10%.
3.2. CO2 permeability measurements and CO2 exposure protocols
Gas permeability coefficients of the films were measured at35 �C and 2 atm upstream gas pressure (unless stated otherwise)using a standard constant-volume, variable-pressure method [63].In cases where the flux is sufficiently high to quickly exceed thepressure limit of the downstream transducer, measurements werecarried out with a constant-pressure, variable-volume methodusing a soap bubble flowmeter. When using the constant-pressure,variable-volume method the following expression was used tocalculate permeability:
P ¼ 1p2 � p1
273TA
patm76
dVdt
(6)
where p2 is the upstream pressure, p1 is the downstream pressure,which is atmospheric pressure, patm, A is the upstream-sidemembrane area available for gas transport, T is the absolutetemperature in K, and dV/dt is the volumetric displacement rate(cm3/s) of the soap film in the bubble flowmeter [63]. For accuratemeasurement of dV/dt, two different soap bubble flowmeters of10 ml and 100 ml capacity were used based on the flux. The at-mospheric pressure, temperature and humidity were monitoredby a Treaceable® hygrometer (Fisher Scientific, PA, USA). The filmswere aged at 35 �C at all times even when not in the permeationcell.
Recently, research in our laboratory has revealed that thin filmsshow higher extents of plasticization in the presence of CO2compared to thick films, and the CO2 exposure protocol cansignificantly affect the response to plasticization and aging[6,7,64e66]. For CO2 exposure protocol studies, films were aged at35 �C for different aging times or for at least 100 h either afterannealing above Tg or after spin casting for the as-cast films. Threedifferent CO2 exposure protocols were used here and are describedin the corresponding results and discussion section.
3.3. In-situ spectroscopic ellipsometry set-up, cell design,calibration procedure and optical model
The CO2 sorption isotherms and the constant pressure, longtime CO2 sorption experiments were carried out in a speciallydesigned high pressure stainless steel cell having two fused silicawindows (Technical Glass Products, OH, USA) fixed normal to the
R.R. Tiwari et al. / Polymer 61 (2015) 1e14 5
incident light of the ellipsometer. The in-situ measurements wererecorded with the ellipsometer at a fixed incident angle of 70� tothe vertical over the wavelength range of 450 nme1000 nm. Allexperiments were performed in a cell equilibrated at 35 �C. De-tails about cell design, temperature and gas pressure control arereported in previous papers [8,44e46]. A well-sealed cell is animportant part of this study to maintain uniform CO2 pressureand to avoid any inaccuracy in sorption measurements. To do so,care was taken to properly seal two fused silica windows withBuna-90 and Teflon O-rings purchased from Austin Seal Com-pany, TX, USA. A thin layer of high vacuum grease (Dow CorningCorporation, MI, USA) was also applied to the Buna O-rings tobetter seal the silica windows and sample holder. During frequentusage the vacuum grease and CO2 can lead to the contaminationof the cell and silica windows; hence, the inside of the cell andfused silica windows were often washed with acetone to removecontamination. This also minimizes the delta offset parametersand improves data fitting as mentioned later. Another significantcontribution to delta offsets while using fused silica windowsarises from the birefringence that can be either natural birefrin-gence due to the ordered silica crystal structure or stress-inducedbirefringence related to the manufacturing process or externalfactors such as high pressure of CO2 inside the cell [67]. The usualcalibration process to account for these effects is to first apply an“out-of-plane” correction using the calibration tool of WVASE32software included with an ellipsometer. The “in-plane” windowcorrection which causes offsets in the delta parameter is thenobtained separately during model fitting. To determine theinherent versus external birefringence contribution we conduct-ed ellipsometer measurements on a calibration wafer of knownSiO2 layer thickness with and without CO2 gas in the cell.Without CO2, the ellipsometric data can be fitted easily without adelta offset correction while a delta offset correction was requiredin the presence of CO2 whose magnitude increased withincreasing CO2 pressure in the cell. It was concluded that theinherent internal stresses are much less significant than thestresses arising from the CO2 pressure against the fused silicawindows.
The experimental data were fit to a four-layer optical modelconsisting of: (1) a silicon substrate layer (1 mm), (2) a silicondioxide (SiO2) layer (~2 nm), (3) a polymer/CO2 layer, and (4) thetop CO2 “ambient layer” [8,44]. The thickness of the native SiO2layer was initially obtained on an as-received wafer prior to spincoating. For this measurement, a two-layer model (i.e., Si and SiO2)was used, and the refractive index of SiO2 was set to 1.46 [55,68].The refractive index for the topmost “ambient” CO2 layer wasobtained by interpolating literature data, which was assumed tobe constant over the wavelength range considered at a giventemperature and pressure [8,60]. The Cauchy dispersion was usedto model the polymer/CO2 layer because the polymer film istransparent over the measured wavelength range of400e1000 nm. A four-layer optical model was fit to the experi-mental data over a wavelength range of 400e1000 nm and, thepolymer optical constants and thickness were estimated such thatthe regression analysis provides a reasonable mean square error(MSE). The “in-plane” and out-of-plane” corrections were alsoapplied to the model to account for the window effects. Theappropriate wavelength range was then selected (which is mostlyfound to be 450e750 nm for perfluoropolymers) based on anexact fit of the experimental data to a four-layer optical model. Theregression was performed again to obtain the best fit until theWVASE32 software provided the lowest MSE, which signaled thebest agreement between theory and experiment. More details onthe wavelength selection procedure have been provided in ourprevious papers [8,69].
3.4. CO2 sorption isotherm experiments
Prior to CO2 sorption measurements, the cell was thermallyequilibrated at 35 �C for 1 h and the ellipsometer was calibratedincluding “out-of-plane” window effects during the calibrationprocess. A silicon calibration wafer of known SiO2 thickness wasused for this purpose. The ellipsometer measurement was carriedout on the 1 cm� 1 cm calibrationwafer kept inside the cell and theexperimental datawas fit using a four-layer optical model including“in-plane” window effects to determine the SiO2 thickness of thecalibration wafer [8]. This was done to ensure that the calibrationprocess and both window effects were applied correctly. The cali-bration wafer was then replaced with a silicon wafer containing aspin-cast polymer film and kept in the cell for 15min to reach 35 �C.After 15min, the vacuum linewas opened for 5min to remove air inthe cell; the vacuum line was then closed and ellipsometry mea-surements were performed on the sample wafer under vacuum todetermine the thin film thickness and to estimate the initial valuesof the delta offset parameters. The sample was then exposed to CO2at 1 atm for 3 min prior to ellipsometry measurement. The pressurewas increased step-wise every 3 min up to a maximum pressure of32 atm and ellipsometry measurements were taken at each pres-sure prior to each increment step. The CO2 refractive index valuesobtained as a function of CO2 pressure were incorporated in thefour-layer model, and the experimental data were fitted to get thefilm thickness and Cauchy parameters A, B, and C as describedpreviously [8,44]. The CO2 sorption was then calculated usingEquations (1)e(4).
3.5. CO2 sorption at constant pressure experiments
Here, cell calibration was carried out in a similar manner asdescribed in the previous section. Then, the sample wafer con-taining the polymer film was kept in the cell and thermally equil-ibrated at 35 �C for 15 min followed by evacuating air from the cellfor 5 min, finally the film thickness and refractive index were ob-tained under vacuum. The cell was then slowly pressurized to32 atm of CO2, and the vacuum line was then opened for 15 s topurge any remaining air. Then, the vacuum valve was closed, and adynamic scan was started immediately. Data were recorded every10 s for the initial hour followed by scans every minute for the next100 h. The datawere analyzed using the four-layer model describedearlier using the “point-by-point” analysis mode of the WVASE32software. The film thickness and refractive index were obtained tocalculate the CO2 sorption reported as a function of CO2 exposuretime. Such experiments are useful to understand the time depen-dent effects of CO2 sorption in glassy polymers.
4. Results and discussion
4.1. Effect of CO2 exposure protocols on CO2 permeability andresponse to plasticization
4.1.1. Protocol 1In this protocol filmswere aged for different aging times or for at
least 100 h at 35 �C and then exposed to CO2 pressure in stepwiseincrements from 2 atm to 32 atm. Prior to CO2 exposure, all filmswere tested for O2 and N2 permeability and selectivity to confirmdefect-free films. Upon CO2 exposure, films were held at eachpressure for 3 min and permeability measurements were recordedevery 3 min before incrementing to the next, higher CO2 pressure.
Fig. 1 compares the absolute and relative CO2 permeability as afunction of CO2 pressure for both annealed and as-cast thin films ofAF 2400. The annealed film has a higher absolute permeability thanthe as-cast film due to the additional free volume created during

Fig. 2. Effect of film thickness on the CO2 permeability and plasticization pressure forfilms of AF 2400. Films were exposed for 3 min at each intermediate pressure prior topermeability measurement. All films were annealed above Tg and aged for 100 h at35 �C prior to CO2 exposure.
Fig. 1. CO2 permeability hysteresis for as-cast and annealed films of AF 2400 subjectedto the following steps: (1) Pressurization from 2 atm to 32 atm, spending 3 min at eachintermediate pressure, (2) Hold at 32 atm for 2 h, (3) Depressurization from 32 atm to2 atm, spending 3 min at each intermediate pressure and (4) Hold at 2 atm for 30 min.Both as-cast and annealed films were aged for 100 h at 35 �C prior to CO2 exposure.
R.R. Tiwari et al. / Polymer 61 (2015) 1e146
annealing [4]. Both the annealed and as-cast films show some plas-ticization effects as evident from the increase in the CO2 permeabilityas the CO2 pressure increases. For annealed films, the relative CO2permeability decreases slightly at lower CO2 exposure pressures asexpected from the dual sorption-mobility model used to describepermeation in glassy polymers; this decrease in permeability is fol-lowed by an increase in the CO2 permeability at higher CO2 pressuresdue to plasticization. The as-cast film shows a much higher relativedrop in the CO2 permeability at low pressures compared to theannealed film, and above 24 atm, the as-cast film exceeds the relativechange in the permeability of the annealedfilm. Further, the pressurewas held constant at 32 atm for 2 h followed by depressurization instepwise increments and held constant at 2 atm for 30 min. Thepermeability during the CO2 hold at 32 atm decreased for both theannealed and as-cast films, and this trend continued even during thedepressurization step and the constant pressure hold at 2 atm. Mostof the glassy polymers show exactly opposite effects, i.e., thedepressurization curve lies above the pressurization curve andpressure holds at 32 atm of CO2 lead to increases in permeability, nota decrease as seen here, with time [6e8,64e66].
Fig. 2 compares the effect of film thickness on the absolute andrelative CO2 permeability of annealed films of AF 2400. All films
were aged for 100 h at 35 �C prior to CO2 exposure. Before plasti-cization, i.e., at an initial CO2 pressure of 2 atm, the absolute CO2permeability increases with increasing film thickness. Increasingthe CO2 pressure above 2 atm initially leads to a decrease in the CO2permeability for all films, as expected, followed by an increase inthe permeability at the higher pressure due to plasticization by CO2.Comparison of the relative permeability shows that the relativedrop in the permeability is greater for thick films due to the highersorption capacity and, the minimum in CO2 permeability, an indi-cation of onset of plasticization, shifts towards lower CO2 pressureas the film thickness decreases. Thin films undergo greater plasti-cization effects compared to the thick films as observed for otherglassy polymers [6,7]. Fig. 3 shows the effect of aging time on theabsolute and relative CO2 permeability of thin films with similarthicknesses. The CO2 permeability at an initial CO2 exposure pres-sure of 2 atm decreases with aging time; however; above 10 atm,the CO2 permeability of a film aged for 100 h surpasses the CO2permeability for films aged for 1 h and 24 h. The onset of plastici-zation also shifts towards lower CO2 pressures for films aged for100 h while the onset of plasticization and relative change in thepermeability is quite similar among films aged up to 24 h.
Fig. 4 compares thin films of the various amorphous per-fluoropolymers reflecting the effects of comonomer content and

Fig. 3. Effect of aging time at 35 �C on the CO2 permeability and plasticization behaviorof thin film of AF 2400. Films were exposed for 3 min at each intermediate pressureprior to permeability measurement. All films were annealed above Tg and aged for100 h at 35 �C prior to CO2 exposure.
Fig. 4. Effect of copolymer type and content on (a) CO2 permeability and (b) relativeCO2 permeability of thin films of various amorphous perfluoropolymers. Films wereexposed for 3 min at each intermediate pressure prior to permeability measurement.All films were annealed above Tg and aged for 100 h at 35 �C prior to CO2 exposure.
R.R. Tiwari et al. / Polymer 61 (2015) 1e14 7
type on the absolute and relative CO2 permeability and plasticiza-tion behavior. The permeability at a CO2 pressure of 2 atm for AF2400, AD 80 and AD 60 is 3500 Ba, 400 Ba, 360 Ba, respectively; theCO2 permeability for AF 2400 is higher by an order of magnitudethan for the AD grades. As seen in Fig. 4, the CO2 permeability of theAF 2400 thin film initially decreases with the increase in the CO2pressures and reaches a minimum at 4 atm, followed by an increasein the CO2 permeability at higher pressures. On the other hand, theAD grades showamuch larger relative drop in the CO2 permeabilityupon initial CO2 exposure and a minimum in CO2 permeability at8 atm, followed by a continuous increase in the CO2 permeability athigher pressures as a result of plasticization. On the relative scale,the perfluoropolymers with lower comonomer content alwaysundergo higher plasticization than those with higher comonomercontent. It is clear that the AD grade (TDD copolymer) undergoesmore significant plasticization than the AF grade (BDD copolymer)reflecting the effects of the different dioxole groups.
4.1.2. Protocol 2In this protocol, films aged for 100 h at 35 �C were exposed to
increasing CO2 pressure starting from 8 atm up to 32 atm, in in-crements of 8 atm every 2 h and the CO2 permeability was moni-tored at 15 min intervals. Fig. 5(a) shows the absolute permeability
of a thin film of AF 2400 as a function of CO2 exposure pressure andtime. For most polymers, including Matrimid, a higher CO2 expo-sure pressure usually results in a more significant increase in CO2permeability due to plasticization [6,7,64]. Interestingly, for AF2400 there is no increase in the CO2 permeability as the CO2pressure is increased; rather the CO2 permeability continuouslydecreases with increased CO2 pressure and exposure time. Fig. 5(b)compares the relative change in CO2 permeability at each pressureincrements for AF 2400 and Matrimid, with exposure time. Therelative CO2 permeability for Matrimid keeps increasing withexposure time at each pressure increment step and a maximum of2.5 fold increase in the CO2 permeability is observed at 32 atm. Onthe other hand, the relative CO2 permeability for AF 2400 shows anopposite trend and keeps decreasing with time during constantpressure exposure although the extent of decrease in the relativepermeability decreases as the CO2 pressure increases.
4.1.3. Protocol 3Here, films were aged for 100 h at 35 �C to avoid much of the
aging effects seen during the early stages of this process. Filmswerethen exposed to a CO2 pressure of 32 atm for 100 h and the CO2permeability was monitored as a function of exposure time. Fig. 6compares the absolute and relative CO2 permeability for both

Fig. 6. Effect of long term CO2 exposure on the CO2 permeability of films of AF 2400and Matrimid. All films were annealed above Tg and aged for 100 h at 35 �C prior toCO2 exposure.
Fig. 5. Effect of CO2 exposure time and pressure on the CO2 permeability of thin filmsof AF 2400 and Matrimid. All films were annealed above Tg and aged for 100 h at 35 �Cprior to CO2 exposure. Permeability during each constant pressure step was normal-ized with initial permeability at that pressure increment.
R.R. Tiwari et al. / Polymer 61 (2015) 1e148
thick and thin films of AF 2400. The CO2 permeability of the thickfilm is higher than that of the thin film while the permeabilitydecreases for both films as the CO2 exposure time increases.However, on a relative scale this decrease in permeability issignificantly greater for the thin film than the thick film. At 100 h ofexposure time, the permeability of the thin film decreased to 50% ofits original value compared to only a 4% decrease for the thick film.Generally, both thick and thin films show an initial increase in theCO2 permeability as a result of polymer swelling and plasticizationand later as aging overcomes the plasticization effect, the CO2permeability starts to decrease with the exposure time as seen forthe thin film of Matrimid (see Fig. 6(b)). This “turnover” inpermeability versus time during high pressure CO2 exposure is theresult of opposing effects of physical aging and CO2 plasticization.Here, we do not see any “turnover” effect of the CO2 permeability inthe thin film of AF 2400; rather, the CO2 permeability keepsdecreasing with the aging time from the very beginning of the CO2exposure further confirming that aging is much more dominantthan plasticization of AF 2400.
High pressures (or concentrations) of CO2 are known toplasticize most polymers; this is accompanied by an increase infree volume that results in an increase in film thickness and adecrease in refractive index. Fig. 7 shows the change in swelling,observed by ellipsometry, with CO2 exposure time for thin films
of AF 2400 and Matrimid at a constant CO2 pressure of 32 atm.The AF 2400 thin film immediately dilates by about 6.4% of theinitial film thickness followed by a slight increase in the swellingfor up to ~0.2 h of exposure time and later swelling starts todecrease significantly as the excess free volume created from theinitial CO2 exposure is overcome by the stronger aging effect. Incontrast, the thin Matrimid film undergoes significant plastici-zation as seen from the continuous increase in the percentswelling with the CO2 exposure time at 32 atm of CO2. Althoughthe CO2 permeability measurements have shown that eventuallyaging overcomes plasticization effects in Matrimid [7]; the agingeffect might not be significant enough to show appreciablechange in the film thickness of Matrimid as compared toAF 2400.
4.2. CO2 sorption: effect of film thickness and comonomer type andcontent
The details about the methods of CO2 sorption measurement byellipsometry were described earlier and in previous papers[8,44e46]. The film thickness and refractive index from theellipsometry measurements were used to obtain the CO2 concen-tration in the amorphous perfluoropolymers using Equations(1)e(4). Ellipsometry is a very sensitive technique and can detectsmall changes in film thickness and refractive index. The right shift

Fig. 8. Effect of CO2 pressure on the shift in psi (4) and delta (d) parameters resultingfrom changing the CO2 pressure from 1 atm to 32 atm for an AF 2400 thin film. Theseshifts represent up to 6% increase in film thickness and a change in CO2 concentrationof ~60 cc (STP)/cc (polymer).
Fig. 9. Effect of (a) film thickness and aging time and (b) comonomer type and contenton the CO2 sorption in thin films of amorphous perfluoropolymers.
Fig. 7. Effect of CO2 exposure time on the percent swelling of (a) AF 2400 and (b)Matrimid thin films exposed to 32 atm of CO2. The percent swelling was determined byellipsometry. Films were annealed above Tg and aged for 100 h at 35 �C prior to CO2
exposure.
R.R. Tiwari et al. / Polymer 61 (2015) 1e14 9
in the 4 and d parameters with the increase in the CO2 pressurefrom 1 atm to 32 atm shown in Fig. 8 represents up to a 6% increasein the film thickness and a CO2 concentration of ~60 cm3 (STP)/cm3
of AF 2400 at 32 atm of CO2.Fig. 9(a) compares the effect of film thickness and aging time on
the CO2 sorption in AF 2400. The difference in the CO2 sorption forthe thick and thin films aged for 100 h is not evident up to 16 atm;however, at higher pressure of 32 atm, the CO2 sorption for the thinfilm is ~14% lower than that for the thick film. Similar effects ofthickness on the CO2 sorption have been also reported earlier byHorn and Paul [8]. In their study, the CO2 sorption in a thinMatrimid film (300 nm, aged for 24 h) is 33% lower than the CO2sorption in a thick film (~30 mm) at 32 atm of CO2 pressure; inter-estingly, the thickness effect on CO2 sorption was more prominentcompared to the aging effect for Matrimid and PPO while PS andPSF showed an opposite behavior [8]. For thin films, CO2 sorptiondecreases with increased aging times which is especially apparentat higher pressures; for example, at a CO2 pressure of 32 atm, thinfilms aged from 1 h to 500 h shows ~11% decrease in the CO2sorption capacity owing to some loss of free volume with aging.Fig. 9(b) compares the CO2 sorption isotherms in thin films ofvarious perfluoropolymers studied in this work. The CO2 sorptionwithin the AF grade increases as the Tg and FFV increases; however,
there is less change among the AD grades owing to the smallerdifference in Tg and FFV of AD 80 and AD 60, respectively, inaddition to the different comonomer structures compared to AFgrades.
R.R. Tiwari et al. / Polymer 61 (2015) 1e1410
Similar CO2 sorption measurements were made on awide rangeof other polymers, see Table 1, to understand the relationshipsbetween the sorption capacity of thin films of these polymers andtheir glass transition temperatures. Table 1 provides parametersobtained by non-linear regression of the CO2 sorption data for thethin films of various glassy polymers with the dual-mode sorptionmodel
C ¼ kdpþ C0Hbp
1þ bp(7)
where kd is the Henry's law parameter, C0H is the Langmuir sorption
capacity related to the additional sorption owing to the non-equilibrium volume, and b is the Langmuir affinity parameter. Asreported in Table 1, among the perfluoropolymers, the C0
H valuesdecrease with the decrease in the free volume and a more signifi-cant decrease in C
0H is observed among the AF grades than the AD
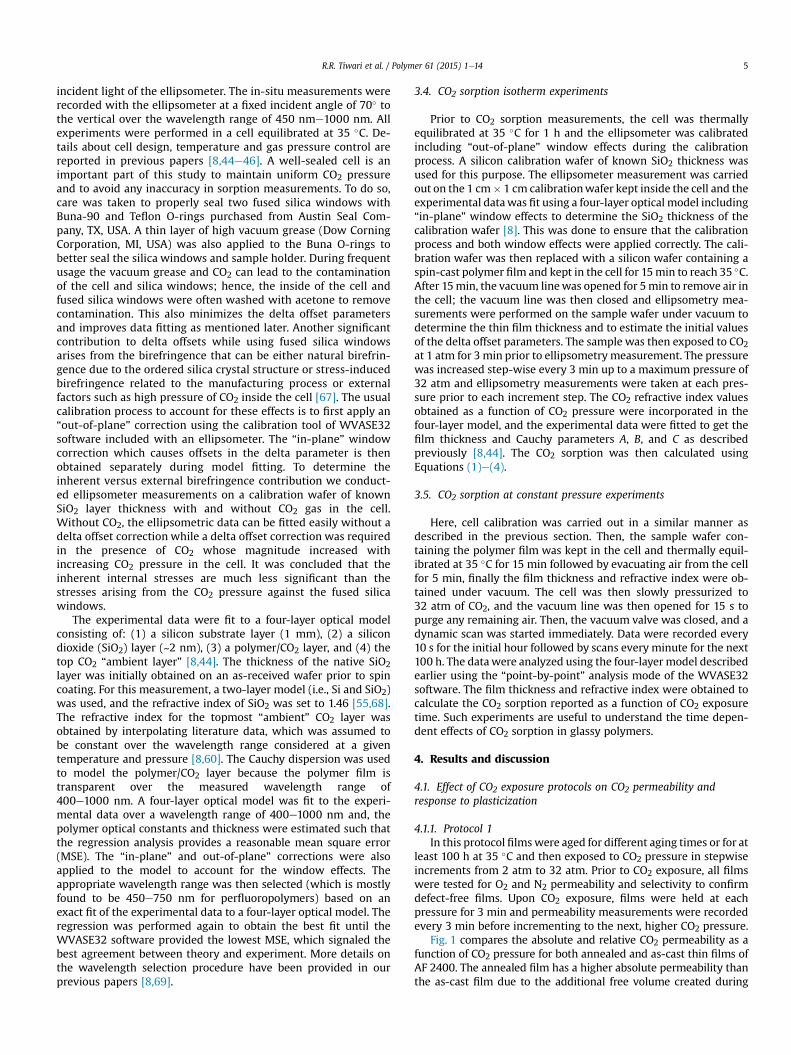
grades. The kd and b parameters, which are influenced by the pol-ymeregas interaction, also differ among the AF and AD grades butnot much within the same grade. Fig. 10 compares the Langmuirsorption capacity parameter, C0
H , for various glassy polymers as afunction of (Tg-35) �C, all measurements were made at 35 �C. Thereis a strong linear correlation between C0
H and (Tg-35) �C; C0H
Fig. 10. Correlation of (a) the Langmuir sorption parameter ðC0HÞ and (b) the solubility
at infinite dilution (S0) with (Tg-35) (�C) for amorphous perfluoropolymers and otherglassy polymers having thickness of ~400 nm or less, except for PTMSP which has filmthickness ~700 nm.
becomes negligible as Tg approaches 35 �C, due to the corre-sponding decrease in the excess volume of the glassy polymers asthe rubbery state is approached as Tg / 35 �C [70]. The solubility atinfinite dilution as p / 0, i.e., log10S0 also follows a linear trendwith (Tg-35) �C. It is important to note here that polymers such asPIM-1 and PTMSP do not show a Tg up to 400 �C.
Fig. 11(a) compares the percent swelling as a function of CO2concentration for thin films of perfluoropolymers and other glassypolymers aged for 100 h at 35 �C. For clarity AF 1600 and AD 80 dataare excluded from the plot. The percent swelling increases withincreased CO2 concentration in the polymer, but in a highly non-linear fashion [8,43,71e73]. The shape of this response indicatesthat at low sorption amounts the CO2 molecules can be accom-modated with little dilation of the polymer. This early stagebehavior is greater for the higher Tg polymers and is evidentlyrelated to the extent of the non-equilibrium volume of the glass.However, eventually at higher amounts of sorption of CO2, allpolymers show a similar high rate of change of dilation withincreased sorption. As seen in Fig. 11(b), the percent swelling forthin films of AF 2400 is significantly affected by the aging time aswell, i.e., at a fixed CO2 concentration, the films aged for longer timeshows higher swelling than the films aged for a short period.
An average diffusion coefficient, D¼ P/S, can be obtained fromthe CO2 permeability and the solubility data obtained from
Fig. 11. Effect of sorbed CO2 on the percent swelling of (a) thin films of various glassypolymers aged for 100 h and (b) thin films of AF 2400 aged for different times.
R.R. Tiwari et al. / Polymer 61 (2015) 1e14 11
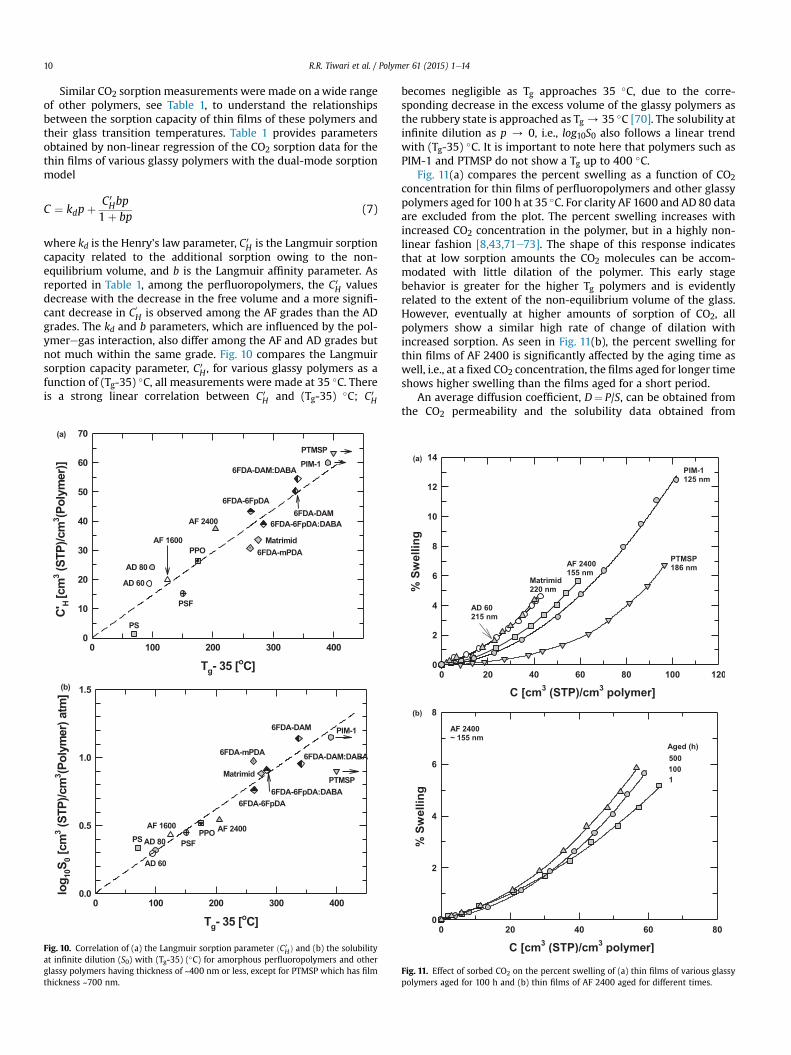
ellipsometry measurements. Although both permeability andsorption studies were carried out on samples maintained atsimilar conditions, such as aging time, temperature and CO2pressures, the differences in the film thickness and substrate effect(free-standing versus wafer supported films) for the permeabilityand sorption studies might affect the diffusion coefficient resultsto some extent; however, errors from such differences should notbe great as confirmed from the small differences in the aging ratesof the free-standing and supported films of similar thicknesses. Asseen in Fig. 12(a), at low CO2 pressures, the diffusion coefficientdecreases with increased aging time, as expected. However, above10 atm, the diffusion coefficient for the film aged for 100 h sur-passes that of the film aged for 1 h. As seen in Fig. 12(b), thediffusion coefficient for AD grades decreases at lower CO2 pressuredue to CO2 sorption in the free-volume elements followed by anincrease in the diffusivity at higher pressure due to the plastici-zation; the diffusion coefficient is higher for AF 2400 than for theAD grades. Within AD grades, the diffusion coefficient for AD 60 isslightly higher than that of AD 80 due to the higher CO2 plastici-zation of AD 60. Comparison of the relative diffusion coefficients ofthe perfluoropolymers and Matrimid shows a 5-fold increase inthe CO2 diffusivity of the Matrimid compared to a maximum of 2.5times increase in diffusion coefficient of AF 2400 at 32 atm of CO2
pressure; this further confirms the higher plasticization resistanceof perfluoropolymers than Matrimid. The dashed lines in Fig. 12represents the diffusion coefficients expected from the dualsorption-mobility model in the absence of plasticization and wereobtained from the following equations:
S ¼ Cp¼ kd þ
C0Hb
1þ bp(8)
Fig. 12. Effect of CO2 exposure pressure on the diffusivity of (a) AF 2400 aged for differentperfluoropolymers and Matrimid. Relative change in diffusivity for Matrimid was calculatediffusion coefficient expected from the dual sorption-mobility model in the absence of plas
P ¼�kd þ
FC0Hb
�DD (9)
1þ bp
where kd, C0H and b are the dual sorption-mobility model parame-
ters obtained via non-linear regression of sorption data in Fig. 9.The partial immobilization factor, F, is defined as the ratio of the
Langmuir mode diffusion coefficient, DH, to the Henry's law modediffusion coefficient, DD. Values of DD and DH were calculated fromthe slope and intercept of the experimental permeability versus1/(1þ bp) plot [74,75]. The diffusion coefficient at each pressure wasthen calculated from the permeability and solubility obtained fromEquations (8)e(9). For AD grades, DD was calculated from theexperimentally determined permeability at an upstream pressureof 2 atm of CO2, and the theoretical diffusivity was then obtainedfrom the theoretically determined permeability and solubility [8].The value of F is approximately 0.1, which is consistent with valuesreported for several other polymers [8,76]. However, those mea-surements were performed on thick films of low and moderate freevolume polymers, mostly below the CO2 plasticization pressure, sopenetrant diffusion coefficients are not anticipated to change muchin either the Henry's Law or Langmuir sorption modes [74e76].
The immobilization factor, F, in this study was significantly in-fluence by CO2 plasticization. For example, the value of F for a thinfilm of AF 2400 aged for 1 h increased from 0.05 to 0.18 followingCO2 plasticization. This increase is ascribed to the larger increase inDH than DD upon CO2 plasticization. At low CO2 pressures, thetheoretical CO2 diffusivity is in close agreement with the diffusivityobtained from experimentally determined permeability and solu-bility data; however, at higher pressures, the theoretical diffusivitydepart significantly which is likely due to CO2 plasticization [8]. At32 atm, the percent difference between the calculated and
time, (b) thin films of various perfluoropolymers and (c) relative diffusivity of variousd from the diffusivity data reported in Ref. [8]. The dashed lines show changes in theticization.

R.R. Tiwari et al. / Polymer 61 (2015) 1e1412
experimental diffusion coefficients are 46%, 8% and 36% for AF2400, AD 80 and AD 60, respectively, compared to 146% forMatrimid which confirms much lower plasticization in per-fluoropolymers than Matrimid [8]. Interestingly, at 32 atm, thepercent difference in the calculated and experimental diffusioncoefficient for Matrimid decreases from 182% to 146% for films agedfor 1 h and 100 h, respectively, while AF 2400 shows an increasefrom 13% to 46% for films aged for 100 h. This opposite trend, i.e., anincrease in the percent difference diffusion coefficient observed forAF 2400 and decrease for Matrimid with the aging time, indicatesthat the diffusion of plasticizing gases such as CO2 is dependent oncertain polymer characteristics such as aging and thermal history.
4.3. Constant pressure CO2 sorption results
Fig. 13 shows the CO2 concentration, apparent molar volumeand diffusion coefficient obtained from the long time permeabilityand sorption measurements by ellipsometry for thin films of AF2400 exposed to a constant CO2 pressure of 32 atm for 100 h at35 �C. Prior to the measurement, films were aged for 100 h at 35 �C.Upon CO2 exposure to 32 atm, the CO2 concentration in the filmincreases to ~64 cm3 (STP)/cm3 which is close to the maximumamount of CO2 sorbed in AF 2400 using protocol 1. However, unlikeMatrimid, the CO2 concentration in AF 2400 continues to decreasewith exposure time, with a ~6% decrease observed in the first hourof CO2 exposure. The apparent molar volume of CO2 in the filmwascalculated from the ratio of swelling and molar concentration ofCO2 sorbed in the AF 2400 film (see Equation (5)). Fig. 13(b) showsthat the apparent molar volume increases with the CO2 exposuretime up to 30 min followed by a decrease at longer exposure times.The maximum in apparent molar volume (i.e, the “turnover” inFig. 13(b)) reflects the competition between plasticization andphysical aging. At short times, plasticization of the film causes an
Fig. 13. Effect of long term exposure to CO2 at constant pressure on (a) CO2 sorption, (b) COwas annealed above Tg and aged for 100 h at 35 �C prior to measurements.
increase in apparent molar volume. However, at somewhat latertimes, plasticization-induced swelling of the sample slows andshould eventually stop; physical aging should continue to causesteady consolidation (i.e., densification) of the sample, leading to areduction in the apparent molar volume. Similar observations of amaximum in apparent molar volume were observed for Matrimid.However, in that case, CO2 uptake and swelling continuouslyincreased with exposure time, whereas both the percent swellingand the CO2 sorption decrease with exposure time for AF 2400 [8].As seen in Fig. 13(c), the diffusion coefficients decrease continu-ously with increase in exposure time, and this trend correlates wellwith the permeability and sorption results. The diffusion coeffi-cient, D, which is directly related to the change in FFV caused byphysical aging, decreases by 50% after 100 h of CO2 exposure timecompared to ~44% increase observed for Matrimid [8]. Fig.14 showsthe CO2 permeability and diffusivity data (obtained at 2 atm of CO2pressure) as a function of FFV for thin films of various glassypolymers. All films were aged for 100 h at 35 �C prior to perme-ability and sorption measurements. As seen in Fig. 14, bothpermeability and diffusivity show a strong correlation with the FFVexcept for PIM-1 and PTMSP. The results for the latter might be dueto combined effects of low permeability and high solubility in thesematerials compared to AF 2400 for similar aging times; in additionto thermal history, structural differences and polymeregas in-teractions must contribute to these differences as well. Interest-ingly, for PIM-1 and AD grades with similar FFV, the diffusivity forAD grades is an order of magnitude higher than for PIM-1 in thesethin films.
5. Conclusions
The permeability, sorption and plasticization behavior wasstudied for amorphous perfluoropolymers having different
2 apparent molar volume and (c) diffusion coefficient of thin films of AF 2400. The film

Fig. 14. Permeability and diffusion coefficient of CO2 as a function of FFV for thin filmsof various glassy polymers with thickness of ~400 nm or less. Data report values ob-tained at 2 atm of upstream CO2 pressure.
R.R. Tiwari et al. / Polymer 61 (2015) 1e14 13
comonomer contents and type in both thick and thin films. Ingeneral, AF grades with 2,2-bis(trifluoromethyl)-4,5-difluoro-1,3-dioxole (BDD) comonomer and with their higher FFV showedhigher CO2 permeability and higher plasticization resistancecompared to the AD grades based on 2,2,4-trifluoro-5-(tri-fluoromethoxy)-1,3-dioxole (TTD) comonomer. The as-cast filmsseem somewhat more prone to CO2 plasticization than the filmsannealed above Tg; interestingly, the rate of relaxation (or physicalaging) of both as-cast and annealed films result in a significantdecrease in the permeability during the depressurization stepwhich is unlike other glassy polymers. The CO2 permeability andonset of plasticization also decreased with aging time and as thefilm thickness was decreased as generally observed for other glassypolymers. Different exposure protocols were used to assess theeffects of CO2 but all showed significantly higher plasticizationresistance by the AF 2400 grade.
Ellipsometry was used to obtain CO2 sorption isotherms of thinfilms of perfluoropolymers and other glassy polymers as well. TheCO2 sorption in thin films is lower than in thick films while the CO2sorption decreases with increased aging time for thin films. Theeffect of Tg and FFV along with the structural differences amongthese polymers, resulting in different polymeregas interactions,also affects the overall sorption characteristics. In general, theLangmuir sorption capacity, C0
H , and solubility at infinite dilution
showed a strong correlation with the Tg of the polymer. The esti-mated diffusivity from the sorption and permeability data increaseswith increases in the CO2 exposure pressure. The diffusivity for AF2400 was higher than that for the AD grades. The smaller percentincrease in the experimental diffusion coefficient than the theo-retical prediction revealed much lower plasticization in the per-fluoropolymers compared to the Matrimid, which relates to thedifferent polymer structures and their interactions with the plas-ticizing gas in addition to aging and thermal history effects.
Long term, constant pressure CO2 experiments showed that thesorption capacity of the AF 2400 continuously decreases with timeunlike the continuous increase in the sorption-induced swellingand CO2 uptake as observed for the Matrimid and other glassypolymers [6,8]. This corresponds well with the permeability datawhere a significant drop was observed in the CO2 permeability dueto the dominant aging effect in AF 2400. In this and previous paperswe have been able to show that the high free volume glassy poly-mers and in particular amorphous perfluoropolymers show sig-nificant initial aging followed by much more stable performanceduring long term usage. The permeability and solubility data fromsystematic ellipsometry measurements has enhanced knowledgeof gas transport, diffusivity and sorption in thin films of variousglassy polymers. The somewhat unusual behavior of thin films ofAF 2400 compared to other glassy polymers studied to date isbelieved to be related to its low cohesive energy density (CED)expected of perfluorinated structures and its high free volumeresulting from the bulky dioxole co-monomer.
Acknowledgments
The authors sincerely thank Prof. Keith Johnston for providingthe high-pressure ellipsometry cell for aging and sorption studies.The authors would also like to acknowledge the utilization ofexcellent characterization facilities at the Center for Nano- andMolecular Technology at UT Austin.
References
[1] Energy in brief. U.S. Energy Information Administration; 2014.[2] Datta AK, Sen PK. J Memb Sci 2006;283:291e300.[3] International energy outlook 2013. Washington, D.C: U.S. Energy Information
Administration; 2013.[4] Tiwari RR, Smith ZP, Lin H, Freeman BD, Paul DR. Polymer 2014;55:5788e800.[5] Lin H, Zhou M, Ly J, Vu J, Wijmans JG, Merkel TC, et al. Ind Eng Chem Res
2013;52:10820e34.[6] Horn NR, Paul DR. Polymer 2011;52:5587e94.[7] Horn NR, Paul DR. Polymer 2011;52:1619e27.[8] Horn NR, Paul DR. Macromolecules 2012;45:2820e34.[9] Alentiev AY, Shantarovich VP, Merkel TC, Bondar VI, Freeman BD,
Yampol'skii YP. Macromolecules 2002;35:9513e22.[10] Alentiev AY, Yampol'skii YP, Shantarovich VP, Nemser SM, Plate NA. J Memb
Sci 1997;126:123e32.[11] Merkel TC, Bondar V, Nagai K, Freeman BD, Yampol'skii YP. Macromolecules
1999;32:8427e40.[12] Merkel TC, He Z, Pinnau I, Freeman BD, Meakin P, Hill AJ. Macromolecules
2003;36:8406e14.[13] Nemser SM, Roman IA. Perfluorodioxole Membranes Organization. 5051114
USA. US Patent; 1991.[14] Pinnau I, Toy LG. J Memb Sci 1996;109:125e33.[15] Prabhakar RS, De Angelis MG, Sarti GC, Freeman BD, Coughlin MC. Macro-
molecules 2005;38:7043e55.[16] Prabhakar RS, Freeman BD, Roman I. Macromolecules 2004;37:7688e97.[17] Prabhakar RS, Merkel TC, Freeman BD, Imizu T, Higuchi A. Macromolecules
2005;38:1899e910.[18] Okamoto Y, Zhang H, Mikes F, Koike Y, He Z, Merkel TC. J Memb Sci 2014;471:
412e9.[19] Bondar VI, Freeman BD, Yampol’skii YP. Macromolecules 1999;32:6163e71.[20] De Angelis MG, Merkel TC, Bondar VI, Freeman BD, Doghieri F, Sarti GC.
Macromolecules 2002;35:1276e88.[21] Merkel TC, Bondar V, Nagai K, Freeman BD. Macromolecules 1999;32:370e4.[22] Merkel TC, Freeman BD, Spontak RJ, He Z, Pinnau I, Meakin P, et al. Chem
Mater 2002;15:109e23.

R.R. Tiwari et al. / Polymer 61 (2015) 1e1414
[23] Merkel TC, He Z, Pinnau I, Freeman BD, Meakin P, Hill AJ. Macromolecules2003;36:6844e55.
[24] Zhou J, Tran MM, Haldeman AT, Jin J, Wagener EH, Husson SM. J Memb Sci2014;450:478e86.
[25] Zhou J, Haldeman AT, Wagener EH, Husson SM. J Memb Sci 2014;454:398e406.
[26] Dlubek G, Pionteck J, Ratzke K, Kruse J, Faupel F. Macromolecules 2008;41:6125e33.
[27] Dlubek G, Pionteck J, Sniegocka M, Hassan EM, Krause-Rehberg R. J Polym SciPart B Polym Phys 2007;45:2519e34.
[28] Dlubek G, Pionteck J, Yu Y, Thr€anert S, Elsayed M, Badawi E, et al. MacromolChem Phys 2008;209:1920e30.
[29] Jansen JC, Macchione M, Tocci E, De Lorenzo L, Yampol’skii YP, Sanfirova O,et al. Macromolecules 2009;42:7589e604.
[30] Rudel M, Kruse J, Ratzke K, Faupel F, Yampol'skii YP, Shantarovich VP, et al.Macromolecules 2008;41:788e95.
[31] Paul DR. Sep Purif Methods 1976;5:33e50.[32] Wijmans JG, Baker RW. J Memb Sci 1995;107:1e21.[33] Matteucci ST, Yampol’skii YP, Freeman BD, Pinnau I. Transport of gases and
vapors in glassy and rubbery polymers. In: Yampolskii YP, Pinnau I,Freeman BD, editors. Materials science of membranes for gas and vaporseparation. Chichester: John Wiley & Sons; 2006. p. 1e47.
[34] Koros WJ, Zimmerman CM. Transport and barrier properties. In: Brady RFJ,editor. Comprehensive desk reference of polymer characterization and anal-ysis. Washington, DC: Oxford University Press; 2003. p. 680e99.
[35] Berens AR. Polym Eng Sci 1980;20:95e101.[36] Chung T-S, Chan SS, Wang R, Lu Z, He C. J Memb Sci 2003;211:91e9.[37] Koros WJ, Paul DR, Fujii M, Hopfenberg HB, Stannett V. J Appl Polym Sci
1977;21:2899e904.[38] Koros WJ, Paul DR, Rocha AA. J Polym Sci Polym Phys Ed 1976;14:687e702.[39] Scholes CA, Chen GQ, Stevens GW, Kentish SE. J Memb Sci 2010;346:208e14.[40] Scholes CA, Tao WX, Stevens GW, Kentish SE. J Appl Polym Sci 2010;117:
2284e9.[41] Bos A, Punt IGM, Wessling M, Strathmann H. J Memb Sci 1999;155:67e78.[42] Visser T, Wessling M. Macromolecules 2007;40:4992e5000.[43] Simons K, Nijmeijer K, Sala JG, van der Werf H, Benes NE, Dingemans TJ, et al.
Polymer 2010;51:3907e17.[44] Sirard SM, Green PF, Johnston KP. J Phys Chem B 2001;105:766e72.[45] Wind JD, Sirard SM, Paul DR, Green PF, Johnston KP, Koros WJ. Macromole-
cules 2003;36:6442e8.[46] Wind JD, Sirard SM, Paul DR, Green PF, Johnston KP, Koros WJ. Macromole-
cules 2003;36:6433e41.
[47] Rowe BW, Freeman BD, Paul DR. Macromolecules 2007;40:2806e13.[48] Ogieglo W, van der Werf H, Tempelman K, Wormeester H, Wessling M,
Nijmeijer A, et al. J Memb Sci 2013;431:233e43.[49] Baker EA, Rittigstein P, Torkelson JM, Roth CB. J Polym Sci Part B Polym Phys
2009;47:2509e19.[50] Gray LAG, Yoon SW, Pahner WA, Davidheiser JE, Roth CB. Macromolecules
2012;45:1701e9.[51] Pye JE, Roth CB. Macromolecules 2013;46:9455e63.[52] Rauscher PM, Pye JE, Baglay RR, Roth CB. Macromolecules 2013;46:9806e17.[53] Huang Y, Paul DR. Macromolecules 2006;39:1554e9.[54] Kim JH, Koros WJ, Paul DR. Polymer 2006;47:3104e11.[55] Huang Y, Paul DR. J Membr Sci 2004;244:167e78.[56] Guide to using WVASE32. J.A. Woollam Co., Inc; 2001.[57] Woollam JA, Johs B, Herzinger CM, Hilfiker J, Synowicki R, Bungay CL. Crit Rev
Opt Sci Technol 1999:3e28. CR72.[58] Styrkas D, Doran SJ, Gilchrist V, Keddie JL, Lu JR, Murphy E, et al. Application of
ellipsometry to polymers at interfaces and in thin films. In: Richards RW,Peace SK, editors. Polymer surfaces and interfaces III. Chichester: Wiley; 1999.
[59] De Feijer JA, Benjamins J, Veer FA. Biopolymers 1978;17:1759e822.[60] Michels A, Hamers J. Phys (The Hague) 1937;4:995e1006.[61] Rowe BW, Freeman BD, Paul DR. Polymer 2009;50:5565e75.[62] Rowe BW, Freeman BD, Paul DR. Polymer 2010;51:3784e92.[63] Lin H, Freeman BD. Permeation and diffusion. In: Czichos H, Saito T, Smith L,
editors. Springer handbook of materials measurement methods. New York:Springer; 2006. p. 371e87.
[64] Cui L, Qiu W, Paul DR, Koros WJ. Polymer 2011;52:5528e37.[65] Cui L, Qiu W, Paul DR, Koros WJ. Polymer 2011;52:3374e80.[66] Xia J, Chung TS, Li P, Horn NR, Paul DR. Polymer 2012;53:2099e108.[67] Stagg BJ, Charalampopoulos TT. J Phys D Appl Phys 1993;26:2028e35.[68] Palik ED. Handbook of optical constants of solids II. London: Academic Press;
1991.[69] Huang Y, Wang X, Paul DR. J Membr Sci 2006;277:219e29.[70] Koros WJ, Paul DR, Huvard GS. Polymer 1979;20:956e60.[71] Punsalana D, Koros WJ. Polymer 2005;46:10214e20.[72] Kamiya Y, Hirose T, Naito Y, Mizoguchi T. J Polym Sci Part B Polym Phys
1988;26:159e77.[73] Pope DS, WJ K. J Polym Sci Part B Polym Phys 1996;34:1861e8.[74] McHattie JS, Koros WJ, Paul DR. Polymer 1991;32:2618e25.[75] McHattie JS, Koros WJ, Paul DR. Polymer 1991;32:840e50.[76] Aitken CL, Koros WJ, Paul DR. Macromolecules 1992;25:3651e8.