Mining Educational Data : A Perspective Review on Data Mining Suites
Upload
khangminh22Category
view
1download
0
International Journal of Scientific & Engineering Research Volume 11, Issue 6, June-2020 245 ISSN 2229-5518
IJSER © 2020
http://www.ijser.org
Galena Mining And Water Quality Of Amata, Southeastern Nigeria
ONUGHA, AUGUSTINE CHIMEEBERE
DEPARTMENT OF GEOGRAPHY AND ENVIRONMENTAL STUDIES
IGNATIUS AJURU UNIVERSITY OF EDUCATION
PORT HARCOURT, RIVERS STATE NIGERIA
Corresponding Email: [email protected]; Phone No: +2347032533729
ABSTRACT The study investigated galena mining and water quality of Amata community in Ishiagu clan of Ivo Local
Government Area, Ebonyi State southeastern Nigeria. The study adopted the completely randomized block
design (CRBD) due to the similarity of the experimental points (i.e. sampling frames) where the water
samples (i.e. surface and groundwater) are taken. Instruments like: multiparameter water quality meter,
water analyzer, Atomic Absorption Spectrometer (AAS), one liter plastic containers and GPS were used to
collect, determine and analyze chemically if galena mining in any way impacts on the water quality in
Amata community. The results revealed relatively low concentrations of temperature, alkalinity, TDS, EC,
Ca, Mg3, SO4, and Cl far below the WHO and NAFDAC tolerance limits for declaring water suitable for
consumption. However, the pH ranging from 4.52–6.59, salinity of above 0.1% permissible limit, turbidity
above 5.00mg/l, including DO and K+ of above 5.00 mg/l, and PO43 levels ranging from 13.79-41.23 far
above the 10.00 mg/l WHO and NAFDAC tolerance limit, makes the waters in Amata community
moderately acidic, salty, muddy, unclean, contaminated and unfit for human consumption, certain plant
growth, and sustaining some aquatic organisms. The study suggested the treatment of effluents prior to their
discharge land and water bodies in order to forestall the contamination of the water quality of Amata.
Keywords: Galena, mining, water quality, Amata, southeastern, Nigeria
Introduction
The alteration, interference or demystification of natural or nature resources and systems
especially through irrational, senseless or unsustainable extraction of solid minerals deposited in
space, could trigger issues like degradation of the environment (i.e. stratosphere, land and aquatic)
quality. In specific locations across the community (like Amata), district (like Ishiagu), province
(like Ivo), state (like Ebonyi), region (like southeast), country (like Nigeria), and globe certain
economically important mineral like galena deposits that is available underneath and unearthed or
mined using diverse techniques, processes, technology, strategies, and materials comes with its
attendant cost, effluents or wastes, influences, and impacts (social, health, pollution, etc.). These
impacts could accentuate hazards, diseases and infections as enunciated by Chellan and Sadler
IJSER
International Journal of Scientific & Engineering Research Volume 11, Issue 6, June-2020 246 ISSN 2229-5518
IJSER © 2020
http://www.ijser.org
(2015); Hajeb, Sloth, Shakibazadeh, Mahyudin and Afsah-Hejri (2014) to potentially cause harm
to humans, animals, and plants in that environment.
Galena is a lead sulfide mineral with a chemical composition of PbS (i.e. an equal number
of lead and sulfide ions). Galena is a jealous and easily identified mineral that comes with its own
water, any stain changes its distinct silver colour. It is also a bright metallic luster mineral found
in igneous and metamorphic rocks in medium- to low-temperature hydrothermal veins, while in
sedimentary rocks it occurs as veins, breccia cements, and isolated grains (Lead Fact Sheet, 2016).
Similarly, if rocks containing galena are exposed to heat, then lead is recovered from under the
ashes when the fire goes out. Galena is one mineral that can easily melt or smelt under low-
temperature, leading to the liberation of byproducts like lead ore, zinc ore, and silver ore (Young,
Taylor & Anderson, 2008). Specifically, galena is regularly mined for its 1–2% silver content,
which is a byproduct with revenue that far outweighs that derived from lead and zinc ore (Obarezi
& Nwosu, 2013). Hence, some mines could generate more income from the silver content of their
galena more than that from the lead and zinc content.
Olubambi, Ndlovu, Potgieter and Borode (2008) states that galena is a major mineral of
the zinc-lead mines (i.e. mining sites) in Ishiagu, Ivo province (i.e. local government area). This
makes the mineral to have a high specific gravity (7.4 to 7.6) that is instantly noticed when picking
up even small pieces. Furthermore, the silver ore within the galena cause disruptions like: changing
the crystal structure to have curved appearance, staining the silver colour to dull gray, and also its
content of minor quantities of antimony, arsenic, bismuth, cadmium, copper, and zinc, which
sometimes determines the variability of the prospecting, mining or extraction of this mineral
(Obarezi & Nwosu, 2013). Also, the few percent silver contained in the galena is 364 times more
valuable than an equal weight of lead. This accounts for the reason underlying mining companies
(like Palladium Mining Limited), and artisanal miners (like artisans, children, youth, adults, etc.)
interest and excitement in methodologically or operationally moving to an area or locality (like
Amata community) with deposits of the argentiferous galena (i.e. galena with silver content).
Succinctly, the galena mine establishment in Amata is about 45m or 130ft deep gotten from
a vein (i.e. an igneous outcrop). In addition, the mining of galena at Amata was hitherto perceived
to provide inhabitants with income outweighing that from farming, this explains the proliferation
of organized and artisan mining sites considered as a lucrative venture around this vicinity.
Deductively, specific stages, activities, method (like open pit, opencast, underground, etc.), and
IJSER
International Journal of Scientific & Engineering Research Volume 11, Issue 6, June-2020 247 ISSN 2229-5518
IJSER © 2020
http://www.ijser.org
exploration technique (like drilling rig) adopted or utilized during the extraction of the galena
results in the production of majorly lead (Pb), moderately zinc (Zn), and minor silver (Ag). These
products as heavy metals contains toxins, contaminants or impurities that endangers the water
quality (surface and underground) thereby, making it unsafe for drinking and industrial usage
including upsetting the area’s hydrology (Ishaya, Mamman & Abubakar, 2018).
The stages (i.e. life cycle and closure) in galena mining can affect the quality of water
resources (both surface and groundwater). Regrettably, the rising business and artisanal miners in
Africa has resulted in insightful and irreversible cycle of environmental destruction that continues
to worsen the issue of water quality pollution (Oelofse & Turton, 2008). These hazardous issues
must be addressed within the context of the instituted environmental regulations operational within
the jurisdiction of the area (Oden, 2012). In view of this, Nuwer (2015) stated that attempts at
limiting the devastation to the aquatic environment would help to sustain the existence and
productivity of the inherent biodiversity and ecosystem. Hence, value for water quality underlies
properly assessing and curbing the associated hazards encountered in the process of mining galena.
Odika, Anike, Onwuemesi, Odika and Ejeckam (2020) assert that embarking on rigorous
scrutiny of the stages, activities, methods, processes and techniques adopted in galena mining is
extremely important. Otherwise, the ensuing jettisoning of proper environmental regulations and
enforcement for the conduct of mining activities intensifies unethical practices, alongside chemical
contamination of water and soil systems leading to disease prevalence, loss of lives and property
from this profitable venture in mining sites (e. active, abandoned and concluded). Notwithstanding,
the extent of regulations instituted during interactions (like mining activities) on the surface or
physical environment, it inevitably produces effluents that would pollute underground systems and
vice versa. In view of this, Dami, Ayuba and Amukali (2013) stated that engaging in standardized
treatment prior to the discharge of effluents from mining sites even into water bodies is a proficient
risk assessment that could forestall the far-reaching effects of toxic chemicals derivable ground
water pollution due to mining activities. This is the crux of the matter articulated in this study.
Statement of the Problem
The mining of solid minerals (like galena) which date back to the1960s (NGSA, 2010),
gives rise to chemicals like lead, zinc, and silver with effluents or discharges likely to affect
environmental resources especially underground and river water which represent the main source
of domestic, commercial, and industrial water for both rural and urban population. Thus, certain
IJSER
International Journal of Scientific & Engineering Research Volume 11, Issue 6, June-2020 248 ISSN 2229-5518
IJSER © 2020
http://www.ijser.org
anthropogenic activities (like mining of lead, etc.) engaged in order to stimulate the economy,
provide employment, and industrialized the society generates residues, effluents (like wastewater),
and other byproducts with elements that increases the level of pollution, hazards or impurities. For
instance, Ishaya et al. (2018) stated that certain harmful impurities are released into the
environment whilst processing a metal like lead into finished products such as lead-acid batteries
used as standby power supplies for computer networks, communication facilities, and other critical
systems used in energy storage systems associated with power generation and hybrid vehicles.
Furthermore, inappropriate planning and disregard for regulations erupts substantial level
of environmental degradation especially on the water quality around galena mining sites (like
Amata community). Equally, the ensuing devastating impacts of heavy metals on humans and the
water quality has overtime triggered anxieties on the health and safety of humans who supposedly
have benefited socially, economically, and developmentally from the extraction of a solid mineral
like galena. This, raises fears on the adequacy of the existing surface and groundwater supplies to
remain suitable for human use and biodiversity sustenance in this area, thereby culminating to the
contemplation of measures to tackle the imminent infection or poison from drinking such water.
However, the inability to adopt modern, viable and functional mining regulations has led
to the rise of professional mining firms, and artisans or unprofessional miners (like children, youth,
women or unaccredited persons/group) mining and discharging their effluents indiscriminately
without prior standard treatment processes. This has increased the pollution of the water and other
environmental resources prompting the consideration of a crude and impracticable approach like
the cessation of mining. Previous studies focused largely on the trace metal status of streams
receiving acid mine drainage (Aroh, Ubong, Eze & Abam, 2006), characterization of toxicity
distribution of selected heavy metals in stream sediments (Ameh, Idakwo, Ameh & Lekdukum,
2017), and effects of barite mining on water quality (Ishaya et al., 2018). This prompted an
investigation on galena mining and water quality of Amata, southeastern Nigeria.
The Study Area
The study was conducted in Amata community in Ishiagu district in Ivo Local Government Area
(LGA) of Ebonyi State (i.e. southeast geopolitical zone), Nigeria. Amata lies between latitudes
5.56–6.12ºN and longitudes 7.33–7.37ºE. According to Odika et al. (2020), normal temperature in
this area ranges from 20o to 38oC, and from 16o to 28oC during the dry and rainy seasons
respectively. The relief shows visible presence of undulating hills and hillocks rising up to 93m
IJSER
International Journal of Scientific & Engineering Research Volume 11, Issue 6, June-2020 249 ISSN 2229-5518
IJSER © 2020
http://www.ijser.org
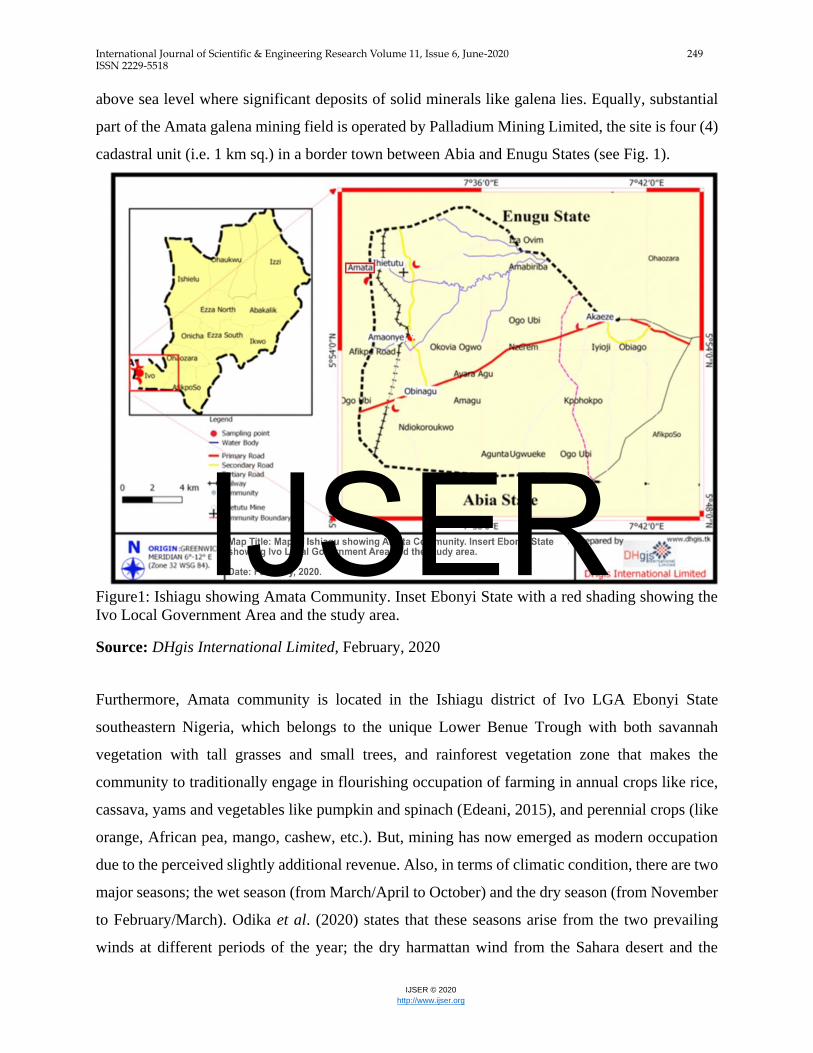
above sea level where significant deposits of solid minerals like galena lies. Equally, substantial
part of the Amata galena mining field is operated by Palladium Mining Limited, the site is four (4)
cadastral unit (i.e. 1 km sq.) in a border town between Abia and Enugu States (see Fig. 1).
Figure1: Ishiagu showing Amata Community. Inset Ebonyi State with a red shading showing the
Ivo Local Government Area and the study area.
Source: DHgis International Limited, February, 2020
Furthermore, Amata community is located in the Ishiagu district of Ivo LGA Ebonyi State
southeastern Nigeria, which belongs to the unique Lower Benue Trough with both savannah
vegetation with tall grasses and small trees, and rainforest vegetation zone that makes the
community to traditionally engage in flourishing occupation of farming in annual crops like rice,
cassava, yams and vegetables like pumpkin and spinach (Edeani, 2015), and perennial crops (like
orange, African pea, mango, cashew, etc.). But, mining has now emerged as modern occupation
due to the perceived slightly additional revenue. Also, in terms of climatic condition, there are two
major seasons; the wet season (from March/April to October) and the dry season (from November
to February/March). Odika et al. (2020) states that these seasons arise from the two prevailing
winds at different periods of the year; the dry harmattan wind from the Sahara desert and the
IJSER
International Journal of Scientific & Engineering Research Volume 11, Issue 6, June-2020 250 ISSN 2229-5518
IJSER © 2020
http://www.ijser.org
marine wind from the Atlantic Ocean. Similarly, the Amata mining site operated by Palladium
Nigeria Limited uses the open pit (i.e. pit-lake) method of about 45m or 130ft deep, which are
abandoned at the close or expiration of galena mining.
MATERIAL AND METHODS
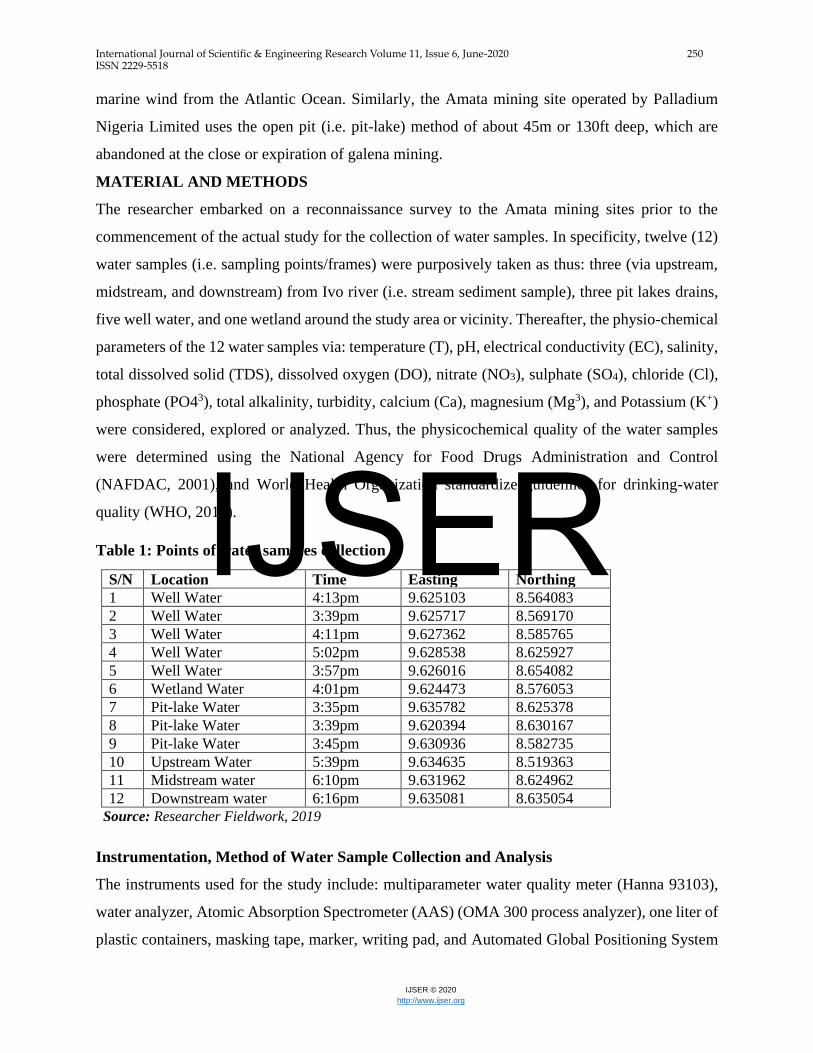
The researcher embarked on a reconnaissance survey to the Amata mining sites prior to the
commencement of the actual study for the collection of water samples. In specificity, twelve (12)
water samples (i.e. sampling points/frames) were purposively taken as thus: three (via upstream,
midstream, and downstream) from Ivo river (i.e. stream sediment sample), three pit lakes drains,
five well water, and one wetland around the study area or vicinity. Thereafter, the physio-chemical
parameters of the 12 water samples via: temperature (T), pH, electrical conductivity (EC), salinity,
total dissolved solid (TDS), dissolved oxygen (DO), nitrate (NO3), sulphate (SO4), chloride (Cl),
phosphate (PO43), total alkalinity, turbidity, calcium (Ca), magnesium (Mg3), and Potassium (K+)
were considered, explored or analyzed. Thus, the physicochemical quality of the water samples
were determined using the National Agency for Food Drugs Administration and Control
(NAFDAC, 2001), and World Health Organization standardize guidelines for drinking-water
quality (WHO, 2011).
Table 1: Points of water samples collection
S/N Location Time Easting Northing
1 Well Water 4:13pm 9.625103 8.564083
2 Well Water 3:39pm 9.625717 8.569170
3 Well Water 4:11pm 9.627362 8.585765
4 Well Water 5:02pm 9.628538 8.625927
5 Well Water 3:57pm 9.626016 8.654082
6 Wetland Water 4:01pm 9.624473 8.576053
7 Pit-lake Water 3:35pm 9.635782 8.625378
8 Pit-lake Water 3:39pm 9.620394 8.630167
9 Pit-lake Water 3:45pm 9.630936 8.582735
10 Upstream Water 5:39pm 9.634635 8.519363
11 Midstream water 6:10pm 9.631962 8.624962
12 Downstream water 6:16pm 9.635081 8.635054
Source: Researcher Fieldwork, 2019
Instrumentation, Method of Water Sample Collection and Analysis
The instruments used for the study include: multiparameter water quality meter (Hanna 93103),
water analyzer, Atomic Absorption Spectrometer (AAS) (OMA 300 process analyzer), one liter of
plastic containers, masking tape, marker, writing pad, and Automated Global Positioning System
IJSER
International Journal of Scientific & Engineering Research Volume 11, Issue 6, June-2020 251 ISSN 2229-5518
IJSER © 2020
http://www.ijser.org
(GPS for taking the coordinates of sampled points). The nitric acid washed-plastic plastic bottles
were flushed with the water prior to collection of the twelve water samples in November, 2019, in
order to reduce contamination. The phases of measurement were: firstly, parameters like EC, TDS,
salinity, pH and temperature (taken at 10am in the morning) were determined and recorded in the
field (i.e. in-situ) using the multiparameter water quality meter (Hanna 93103). Next, nitric acid
(0.2%) was added as a preservative for the collected water samples which were marked and labeled
with the masking tape for the water source, sampling location and date of collection before being
transported to the laboratory for analysis of the other parameters within four (4) days.
Thirdly, dissolved oxygen, salinity and turbidity were determined by water analyzer with the help
of indicator Systronic-371, alkalinity was measured with the water analyzer using Phenolphthalein
indicator. Fourth and finally, nitrate, phosphate, and calcium were measured by the Atomic
Absorption Spectrometer (AAS). Also, the complete randomized block design (CRBD) was
adopted due to the likeness of the experimental points where the surface and groundwater samples
were taken. Similarly, the quality assurance and control of data were performed according to the
specified method (Ishaya et. al., 2013).
RESULTS
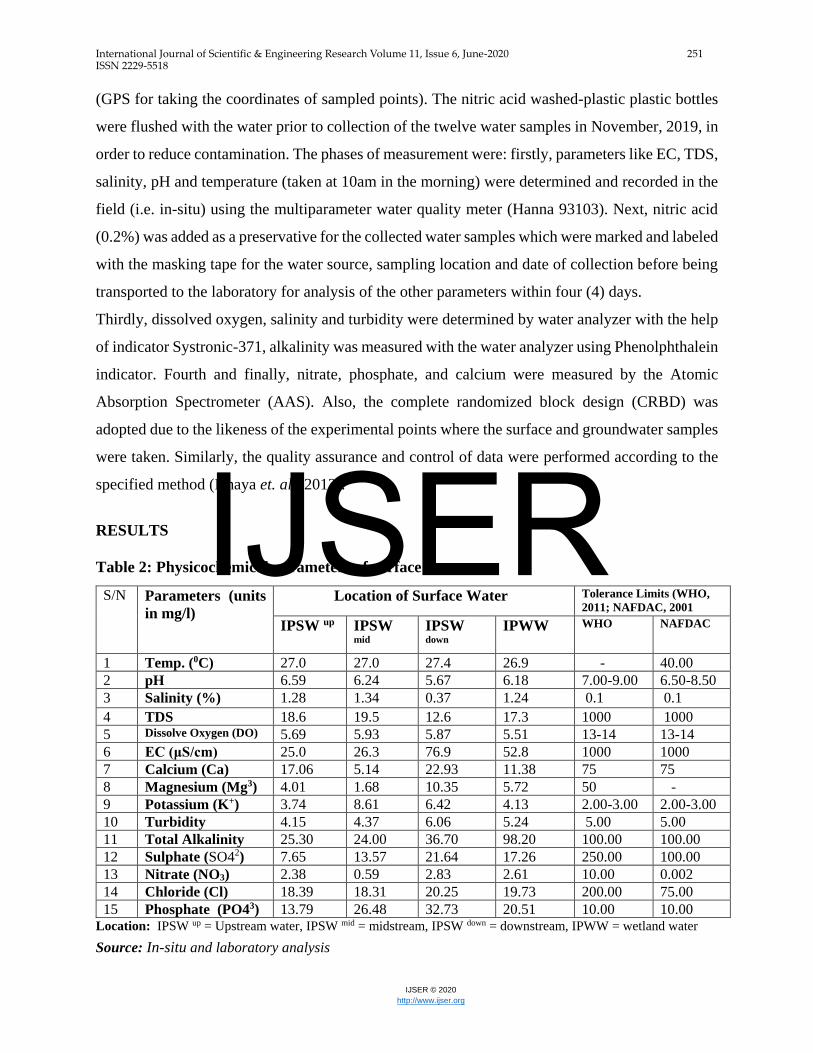
Table 2: Physicochemical parameters of surface water
S/N Parameters (units
in mg/l)
Location of Surface Water Tolerance Limits (WHO,
2011; NAFDAC, 2001
IPSW up IPSW mid
IPSW down
IPWW WHO NAFDAC
1 Temp. (0C) 27.0 27.0 27.4 26.9 - 40.00
2 pH 6.59 6.24 5.67 6.18 7.00-9.00 6.50-8.50
3 Salinity (%) 1.28 1.34 0.37 1.24 0.1 0.1
4 TDS 18.6 19.5 12.6 17.3 1000 1000
5 Dissolve Oxygen (DO) 5.69 5.93 5.87 5.51 13-14 13-14
6 EC (μS/cm) 25.0 26.3 76.9 52.8 1000 1000
7 Calcium (Ca) 17.06 5.14 22.93 11.38 75 75
8 Magnesium (Mg3) 4.01 1.68 10.35 5.72 50 -
9 Potassium (K+) 3.74 8.61 6.42 4.13 2.00-3.00 2.00-3.00
10 Turbidity 4.15 4.37 6.06 5.24 5.00 5.00
11 Total Alkalinity 25.30 24.00 36.70 98.20 100.00 100.00
12 Sulphate (SO42) 7.65 13.57 21.64 17.26 250.00 100.00
13 Nitrate (NO3) 2.38 0.59 2.83 2.61 10.00 0.002
14 Chloride (Cl) 18.39 18.31 20.25 19.73 200.00 75.00
15 Phosphate (PO43) 13.79 26.48 32.73 20.51 10.00 10.00 Location: IPSW up = Upstream water, IPSW mid = midstream, IPSW down = downstream, IPWW = wetland water
Source: In-situ and laboratory analysis
IJSER
International Journal of Scientific & Engineering Research Volume 11, Issue 6, June-2020 252 ISSN 2229-5518
IJSER © 2020
http://www.ijser.org
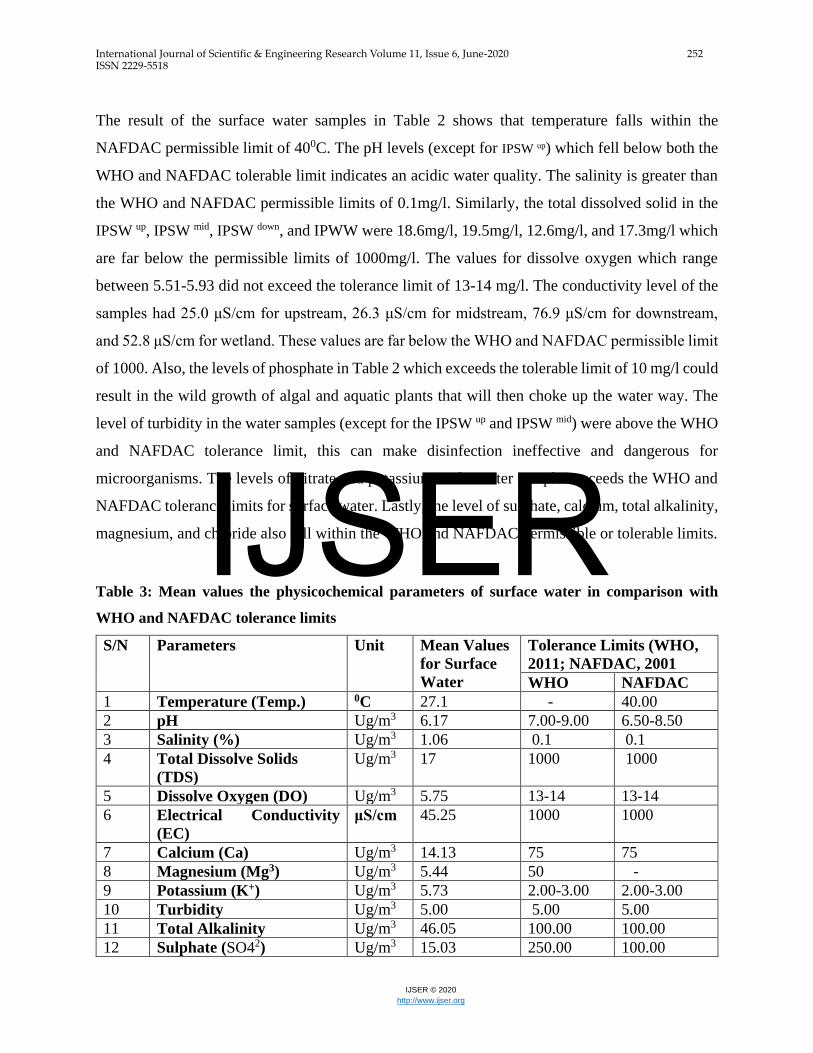
The result of the surface water samples in Table 2 shows that temperature falls within the
NAFDAC permissible limit of 400C. The pH levels (except for IPSW up) which fell below both the
WHO and NAFDAC tolerable limit indicates an acidic water quality. The salinity is greater than
the WHO and NAFDAC permissible limits of 0.1mg/l. Similarly, the total dissolved solid in the
IPSW up, IPSW mid, IPSW down, and IPWW were 18.6mg/l, 19.5mg/l, 12.6mg/l, and 17.3mg/l which
are far below the permissible limits of 1000mg/l. The values for dissolve oxygen which range
between 5.51-5.93 did not exceed the tolerance limit of 13-14 mg/l. The conductivity level of the
samples had 25.0 μS/cm for upstream, 26.3 μS/cm for midstream, 76.9 μS/cm for downstream,
and 52.8 μS/cm for wetland. These values are far below the WHO and NAFDAC permissible limit
of 1000. Also, the levels of phosphate in Table 2 which exceeds the tolerable limit of 10 mg/l could
result in the wild growth of algal and aquatic plants that will then choke up the water way. The
level of turbidity in the water samples (except for the IPSW up and IPSW mid) were above the WHO
and NAFDAC tolerance limit, this can make disinfection ineffective and dangerous for
microorganisms. The levels of nitrate and potassium in the water samples exceeds the WHO and
NAFDAC tolerance limits for surface water. Lastly, the level of sulphate, calcium, total alkalinity,
magnesium, and chloride also fell within the WHO and NAFDAC permissible or tolerable limits.
Table 3: Mean values the physicochemical parameters of surface water in comparison with
WHO and NAFDAC tolerance limits
S/N Parameters Unit Mean Values
for Surface
Water
Tolerance Limits (WHO,
2011; NAFDAC, 2001 WHO NAFDAC
1 Temperature (Temp.) 0C 27.1 - 40.00
2 pH Ug/m3 6.17 7.00-9.00 6.50-8.50
3 Salinity (%) Ug/m3 1.06 0.1 0.1
4 Total Dissolve Solids
(TDS)
Ug/m3 17 1000 1000
5 Dissolve Oxygen (DO) Ug/m3 5.75 13-14 13-14
6 Electrical Conductivity
(EC)
μS/cm 45.25 1000 1000
7 Calcium (Ca) Ug/m3 14.13 75 75
8 Magnesium (Mg3) Ug/m3 5.44 50 -
9 Potassium (K+) Ug/m3 5.73 2.00-3.00 2.00-3.00
10 Turbidity Ug/m3 5.00 5.00 5.00
11 Total Alkalinity Ug/m3 46.05 100.00 100.00
12 Sulphate (SO42) Ug/m3 15.03 250.00 100.00
IJSER
International Journal of Scientific & Engineering Research Volume 11, Issue 6, June-2020 253 ISSN 2229-5518
IJSER © 2020
http://www.ijser.org
13 Nitrate (NO3) Ug/m3 2.10 10.00 0.002
14 Chloride (Cl) Ug/m3 19.17 200.00 75.00
15 Phosphate (PO43) Ug/m3 23.38 10.00 10.00
Source: Researcher’s computation, 2019
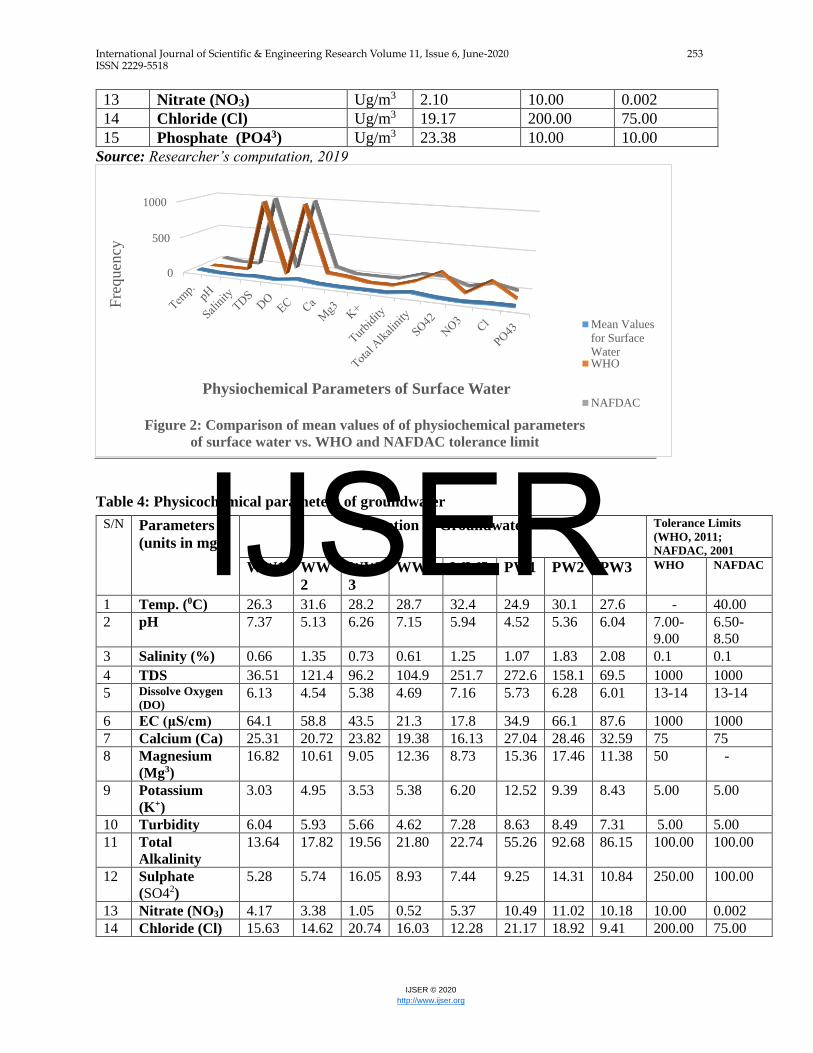
Table 4: Physicochemical parameters of groundwater
S/N Parameters
(units in mg/l)
Location of Groundwater Tolerance Limits
(WHO, 2011;
NAFDAC, 2001
WW1 WW
2
WW
3
WW4 WW5 PW1 PW2 PW3 WHO NAFDAC
1 Temp. (0C) 26.3 31.6 28.2 28.7 32.4 24.9 30.1 27.6 - 40.00
2 pH 7.37 5.13 6.26 7.15 5.94 4.52 5.36 6.04 7.00-
9.00
6.50-
8.50
3 Salinity (%) 0.66 1.35 0.73 0.61 1.25 1.07 1.83 2.08 0.1 0.1
4 TDS 36.51 121.4 96.2 104.9 251.7 272.6 158.1 69.5 1000 1000
5 Dissolve Oxygen
(DO) 6.13 4.54 5.38 4.69 7.16 5.73 6.28 6.01 13-14 13-14
6 EC (μS/cm) 64.1 58.8 43.5 21.3 17.8 34.9 66.1 87.6 1000 1000
7 Calcium (Ca) 25.31 20.72 23.82 19.38 16.13 27.04 28.46 32.59 75 75
8 Magnesium
(Mg3)
16.82 10.61 9.05 12.36 8.73 15.36 17.46 11.38 50 -
9 Potassium
(K+)
3.03 4.95 3.53 5.38 6.20 12.52 9.39 8.43 5.00 5.00
10 Turbidity 6.04 5.93 5.66 4.62 7.28 8.63 8.49 7.31 5.00 5.00
11 Total
Alkalinity
13.64 17.82 19.56 21.80 22.74 55.26 92.68 86.15 100.00 100.00
12 Sulphate
(SO42)
5.28 5.74 16.05 8.93 7.44 9.25 14.31 10.84 250.00 100.00
13 Nitrate (NO3) 4.17 3.38 1.05 0.52 5.37 10.49 11.02 10.18 10.00 0.002
14 Chloride (Cl) 15.63 14.62 20.74 16.03 12.28 21.17 18.92 9.41 200.00 75.00
0
500
1000
Fre
quen
cy
Physiochemical Parameters of Surface Water
Figure 2: Comparison of mean values of of physiochemical parameters
of surface water vs. WHO and NAFDAC tolerance limit
Mean Values
for Surface
WaterWHO
NAFDAC
IJSER
International Journal of Scientific & Engineering Research Volume 11, Issue 6, June-2020 254 ISSN 2229-5518
IJSER © 2020
http://www.ijser.org
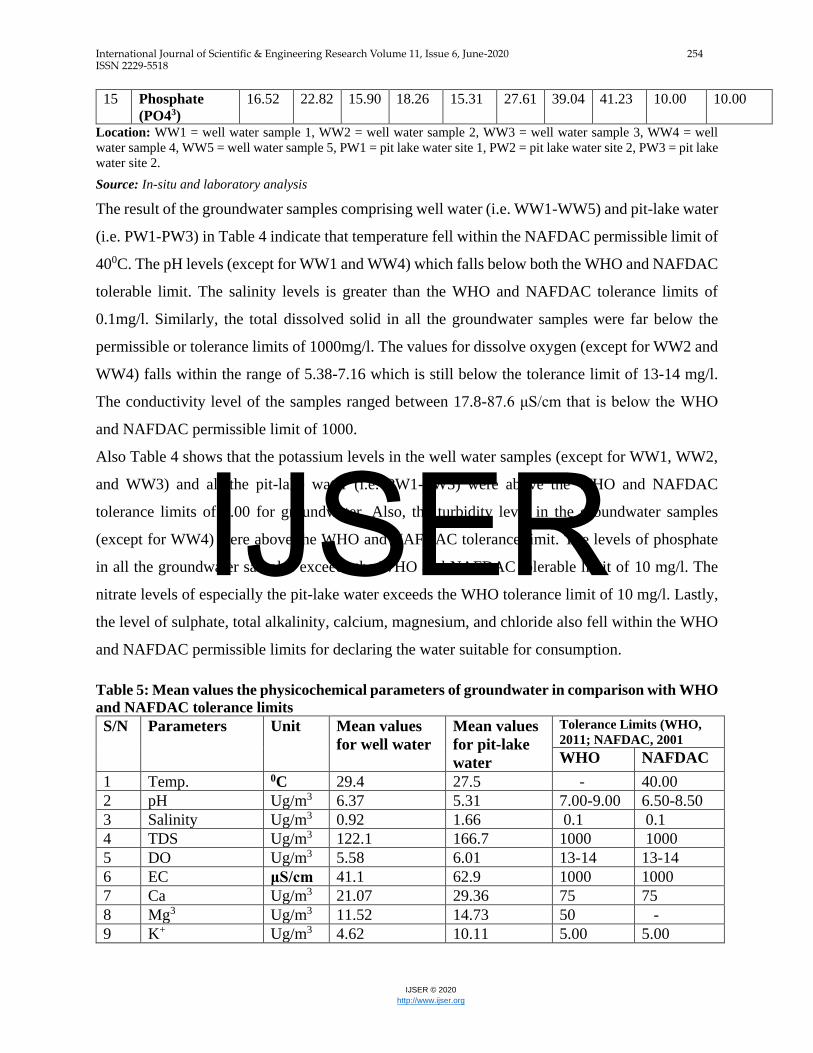
15 Phosphate
(PO43)
16.52 22.82 15.90 18.26 15.31 27.61 39.04 41.23 10.00 10.00
Location: WW1 = well water sample 1, WW2 = well water sample 2, WW3 = well water sample 3, WW4 = well
water sample 4, WW5 = well water sample 5, PW1 = pit lake water site 1, PW2 = pit lake water site 2, PW3 = pit lake
water site 2.
Source: In-situ and laboratory analysis
The result of the groundwater samples comprising well water (i.e. WW1-WW5) and pit-lake water
(i.e. PW1-PW3) in Table 4 indicate that temperature fell within the NAFDAC permissible limit of
400C. The pH levels (except for WW1 and WW4) which falls below both the WHO and NAFDAC
tolerable limit. The salinity levels is greater than the WHO and NAFDAC tolerance limits of
0.1mg/l. Similarly, the total dissolved solid in all the groundwater samples were far below the
permissible or tolerance limits of 1000mg/l. The values for dissolve oxygen (except for WW2 and
WW4) falls within the range of 5.38-7.16 which is still below the tolerance limit of 13-14 mg/l.
The conductivity level of the samples ranged between 17.8-87.6 μS/cm that is below the WHO
and NAFDAC permissible limit of 1000.
Also Table 4 shows that the potassium levels in the well water samples (except for WW1, WW2,
and WW3) and all the pit-lake water (i.e. PW1-PW3) were above the WHO and NAFDAC
tolerance limits of 5.00 for groundwater. Also, the turbidity level in the groundwater samples
(except for WW4) were above the WHO and NAFDAC tolerance limit. The levels of phosphate
in all the groundwater samples exceeds the WHO and NAFDAC tolerable limit of 10 mg/l. The
nitrate levels of especially the pit-lake water exceeds the WHO tolerance limit of 10 mg/l. Lastly,
the level of sulphate, total alkalinity, calcium, magnesium, and chloride also fell within the WHO
and NAFDAC permissible limits for declaring the water suitable for consumption.
Table 5: Mean values the physicochemical parameters of groundwater in comparison with WHO
and NAFDAC tolerance limits
S/N Parameters Unit Mean values
for well water
Mean values
for pit-lake
water
Tolerance Limits (WHO,
2011; NAFDAC, 2001 WHO NAFDAC
1 Temp. 0C 29.4 27.5 - 40.00
2 pH Ug/m3 6.37 5.31 7.00-9.00 6.50-8.50
3 Salinity Ug/m3 0.92 1.66 0.1 0.1
4 TDS Ug/m3 122.1 166.7 1000 1000
5 DO Ug/m3 5.58 6.01 13-14 13-14
6 EC μS/cm 41.1 62.9 1000 1000
7 Ca Ug/m3 21.07 29.36 75 75
8 Mg3 Ug/m3 11.52 14.73 50 -
9 K+ Ug/m3 4.62 10.11 5.00 5.00
IJSER
International Journal of Scientific & Engineering Research Volume 11, Issue 6, June-2020 255 ISSN 2229-5518
IJSER © 2020
http://www.ijser.org
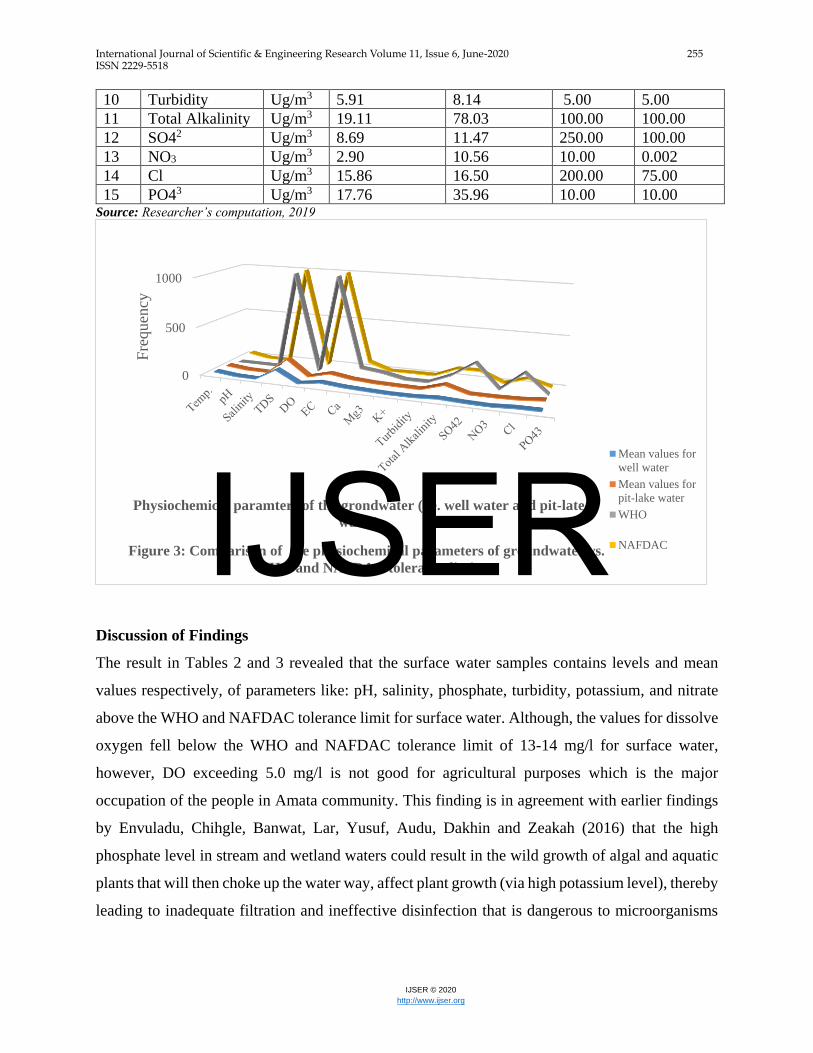
10 Turbidity Ug/m3 5.91 8.14 5.00 5.00
11 Total Alkalinity Ug/m3 19.11 78.03 100.00 100.00
12 SO42 Ug/m3 8.69 11.47 250.00 100.00
13 NO3 Ug/m3 2.90 10.56 10.00 0.002
14 Cl Ug/m3 15.86 16.50 200.00 75.00
15 PO43 Ug/m3 17.76 35.96 10.00 10.00 Source: Researcher’s computation, 2019
Discussion of Findings
The result in Tables 2 and 3 revealed that the surface water samples contains levels and mean
values respectively, of parameters like: pH, salinity, phosphate, turbidity, potassium, and nitrate
above the WHO and NAFDAC tolerance limit for surface water. Although, the values for dissolve
oxygen fell below the WHO and NAFDAC tolerance limit of 13-14 mg/l for surface water,
however, DO exceeding 5.0 mg/l is not good for agricultural purposes which is the major
occupation of the people in Amata community. This finding is in agreement with earlier findings
by Envuladu, Chihgle, Banwat, Lar, Yusuf, Audu, Dakhin and Zeakah (2016) that the high
phosphate level in stream and wetland waters could result in the wild growth of algal and aquatic
plants that will then choke up the water way, affect plant growth (via high potassium level), thereby
leading to inadequate filtration and ineffective disinfection that is dangerous to microorganisms
0
500
1000
Fre
quen
cy
Physiochemical paramters of the grondwater (i.e. well water and pit-late
water)
Figure 3: Comparison of the physiochemical parameters of groundwater vs.
WHO and NAFDAC tolerance limit
Mean values for
well water
Mean values for
pit-lake water
WHO
NAFDACIJSER
International Journal of Scientific & Engineering Research Volume 11, Issue 6, June-2020 256 ISSN 2229-5518
IJSER © 2020
http://www.ijser.org
(due high turbidity level), whilst the high nitrate level poses great threat to both pregnant women
and infants under six months.
The result of the groundwater samples in Tables 4 and 5 indicate that the levels and mean values
respectively, of parameters like temperature, conductivity, sulphate, calcium, magnesium,
alkalinity and chloride fell within the WHO and NAFDAC tolerance or permissible limits for
groundwater suitable for consumption. However, the levels and mean values of pH, salinity,
phosphate, turbidity, potassium, and nitrate levels above the WHO and NAFDAC tolerance limit
for groundwater. Alongside, the level for dissolve oxygen surpassing 5.00 mg/l (but still within
the WHO and NAFDAC tolerance limit of 13-14 mg/l) makes the groundwater samples in Amata
community moderately acidic, salty, muddy, very toxic, and unsuitable for agriculture, drinking,
and other uses. This finding is consistent with Envuladu et al. (2016) who stated that the pH value
lower than 7.0 to 9.0 including DO and turbidity level higher than 5.00 mg/L makes groundwater
which supplies water to streams and wetlands acidic, unfit for agricultural purposes, irrigation,
manufacturing and other uses, thereby, adversely affecting the life of fresh water fish and bottom
dwelling invertebrates. Also, Kumar and Puri (2012) reiterate high level of phosphate and
potassium in groundwater above 10 mg/l and 5.00 mg/L respectively can lead to the wild growth
of algal and aquatic plants which block or obstruct the water way and then affect plant growth.
Whilst Amoo and Akinbode (2007) stated that nitrate level beyond 10 mg/l makes such
groundwater dangerous for pregnant women whose infants are susceptible to blue baby syndrome
(i.e. blood losing its ability to carry sufficient oxygen).
Conclusion
The study concludes that both the organization and artisanal mining of galena in Amata
community, southeastern, Nigeria led to the discharge, seepage, and absorption of chemicals and
noxious waste into the surface water, groundwater, and pit-lake drains around the vicinity. This
made the water quality to be very acidic, salty, muddy, toxic, unclean, and improper or unsafe for
agriculture, certain plant growth, sustenance of specific aquatic organisms, drinking, and other
uses including dangerous to human (especially infants) health and life in such a rural and agrarian
environment. This aligns with Mejia (2015) report that the unregulated, unprofessional, and
artisanal gold mining in Zamfara State in northern Nigeria resulted in high lead concentration of
IJSER
International Journal of Scientific & Engineering Research Volume 11, Issue 6, June-2020 257 ISSN 2229-5518
IJSER © 2020
http://www.ijser.org
1270mg/l in the local river leading to the poisoning and death of more than 300 persons (mainly
artisans comprising children, youth and women) in 2010.
Hence, it was thus suggested: the adoption of sensible and sustainable environmental regulations
like prior treatment of effluents before their actual discharge into land and water bodies. The design
and execution of regulatory frameworks to accommodate both commercial and artisanal miners.
Steadily building miners capacity towards jettisoning the crude, inefficient, and unethical act of
curbing or stoppage of mining; for properly regulated and professional mining practices that could
reduce the hitherto pollution of the water quality/systems and promote the development of Amata.
Acknowledgement
The effort of Philip Emmanuel in digitizing the map is greatly acknowledged. Also, appreciation
goes to Dr. Clinton Ezekwe for promoting the conduct of this research. Whilst, Uyi Hanson of the
Institute of Pollution Studies (IPS) Rivers State University (RSU) Port Harcourt which provided
the AAS used for the chemical analysis is highly appreciated.
REFERENCES
Ameh, E. G.; Idakwo, S.; Ameh, O. C. & Lekdukum, O. M. (2017). Integrated characterization of
toxicity distribution of selected heavy metals in stream sediments around Itakpe iron ore
mines, North Central Nigeria. Earth Science Research, 6(1), 109-116.
Amoo, I. A. & Akinbode, A. M. (2007). Physiochemical analysis of well water in Minna and its
environs. J. Chem Soc. Nigeria, 32(2), 122-127.
Aroh, K. N.; Ubong, I. U.; Eze, C. L. & Abam, T. K. S. (2006). Trace metal status of streams
receiving acid mine drainage (AMD) from Ishiagu lead/zinc (Pb/Zn) mine, Ebonyi State,
Southeast Nigeria. African Journal of Environmental Pollution and Health, 5(1), 1-8.
Chellan, P. & Sadler, P. J. (2015). The elements of life and medicines. Philosophical transactions.
Series A, Mathematical, physical, and engineering sciences, 373(2037), 20140182.
https://doi.org/10.1098/rsta.2014.0182
Dami, A.; Ayuba, H. K. & Amukali, O. (2013). Ground water pollution in Okpai and Beneku,
Ndokwa east local government area, Delta State, Nigeria. E3 Journal of Environmental
Research and Management, 4(1), 0171-0179.
Edeani, C. F. (2015). Geochemistry of surface waters in Ishiagu, Ebonyi State, Nigeria. IJISET -
International Journal of Innovative Science, Engineering & Technology, 2(7), 90-95.
Envuladu, R. A.; Chihgle, M. P.; Banwat, M. R.; Lar, I. A.; Yusuf, O. R.; Audu, S.; Dakhin, A. &
Zeakah, A. I. (2016). The quality of drinking water in Jos metropolis, North Central
Nigeria. Jos Journal of Medicine, 6(1), 17-21.
IJSER
International Journal of Scientific & Engineering Research Volume 11, Issue 6, June-2020 258 ISSN 2229-5518
IJSER © 2020
http://www.ijser.org
Hajeb, P.; Sloth, J. J.; Shakibazadeh, S.; Mahyudin, N. A. & Afsah-Hejri, L. (2014). Toxic
elements in food: Occurrence, binding, and reduction approaches. Comprehensive Reviews
in Food Science and Food Safety, 13(4). https://doi.org/10.1111/1541-4337.12068
Ishaya, S.; Mamman, A. M. & Abubakar, O. I. (2018). Effects of barite mining on water quality
in Azara-Awe Local Government Area of Nasarawa State, Nigeria. Ghana Journal of
Geography, 10(2), 36-49.
Kumar, M. & Puri, A. (2012). A review of permissible limits of drinking water. Indian J Occup
Environ Med., 16(1), 40-44.
Lead Fact Sheet (2016). General information and history. Stanford: Stanford University, General
Health and Safety Programme, last accessed July 2016.
Mejia, L. T. (2015). Lead contamination: Environmental geochemistry of gold mining villages in
Northwest Nigeria. Geosciences Thesis, Department of Geosciences, Georgia State
University. Retrievedfromhttp://scholarworks.gus.edu/geosciences_theses.
NAFDAC (National Agency for Food Drugs Administration and Control) (2001). Consumer
Bulletin October-December. Lagos: NAFDAC Publication
Nigerian Geological Survey Agency (NGSA, 2010). Lead-zinc exploration opportunities in
Nigeria.esr.ccsenet.org.
Nuwer, R. (2015). The biosphere: Diversity of life. Aspen Global Change Institute. Basalt, CO.
Retrieved 2015-07-19.
Obarezi, J. E. & Nwosu, J. I. (2013). Structural controls of Pb-Zn mineralization of Enyigba
district, Abakaliki, Southeastern Nigeria. Journal of Geology and Mining Research, 5(11),
250-261.
Oden, M. I. (2012). Barite veins in the Benue Trough: Field characteristics, the quality issue and
some tectonic implications. Environmental. National and Resources, 2(2), 21-32.
Odika, P. O.; Anike, O. L.; Onwuemesi, A. G.; Odika, N. F. & Ejeckam, R. B. (2020). Assessment
of environmental Geochemistry of lead-zinc mining at Ishiagu Area, Lower Benue Trough,
Southeastern Nigeria. Earth Science Research, 9(1), 31-44.
Oelofse, S. & Turton, A. (2008). Mine water pollution - acid mine decant, effluent and treatment:
A consideration of key emerging issues that may Impact the state of the environment.
www.elsevier.com/locate/chemosphere.
Olubambi, P. A.; Ndlovu, S.; Potgieter, J. H. & Borode, J. O. (2008). Mineralogical
characterization of Ishiagu (Nigeria) complex sulphide ore. International Journal of
Mineral Processing, 87(3-4), 83-89.
IJSER
International Journal of Scientific & Engineering Research Volume 11, Issue 6, June-2020 259 ISSN 2229-5518
IJSER © 2020
http://www.ijser.org
World Health Organization (WHO, 2011). WHO guidelines for drinking-water quality. 4thed.
WHO Press, World Health Organization, 20 Avenue Appia, 1211 Geneva 27, Switzerland.
Retrieved from
https://www.unicef.org/cholera/Chapter_4_prevention/01_WHO_Guidelines_for_drinkin
g_water_quality.pdf
Young, C. A.; Taylor, P. R. & Anderson, C. G. (2008). Hydrometallurgy. Proceedings of the Sixth
International Symposium. SME. ISBN 9780873352666.
IJSER
Copyright © 2022 FDOKUMEN