• Smart Structure Applications • Emerging Themes • Smart ...
Upload
khangminh22Category
view
1download
0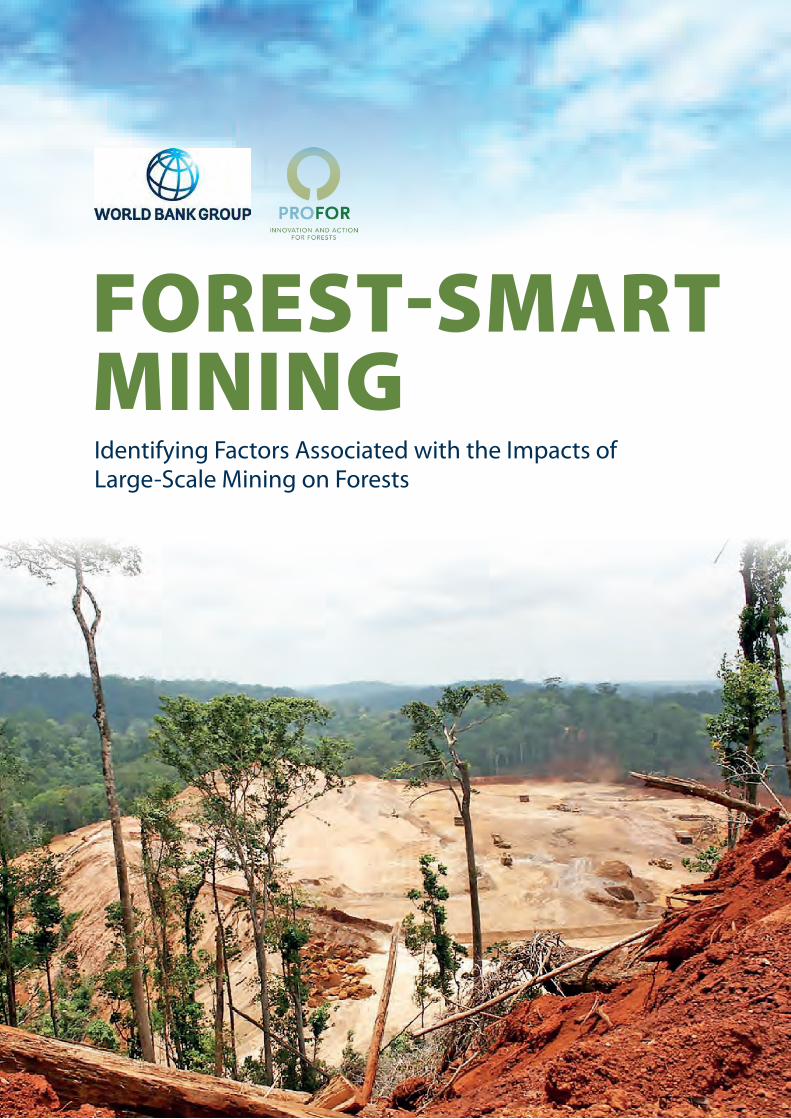
FOREST-SMART MINING Identifying Factors Associated with the Impacts of Large-Scale Mining on Forests

Credit: Jeremy Holden/FFI.

Suggested Citation: Forest-Smart Mining: Large-Scale Mining on Forests (LSM), World Bank, 2019
Disclaimer:
This work is a product of the staff of The World Bank with external contributions. All omissions and inaccuracies in this document are the responsibility of the authors. The findings, interpretations, and views expressed in this guide do not necessarily represent those of the institutions involved, nor do they necessarily reflect the views of PROFOR, The World Bank, its Board of Executive Directors, or the governments they represent.
The World Bank does not guarantee the accuracy of the data included in this work. The boundaries, colors, denominations, and other information shown on any map in this work do not imply any judgment on the part of The World Bank concerning the legal status of any territory or the endorsement or acceptance of such boundaries.
© 2019 International Bank for Reconstruction and Development / The World Bank
1818 H Street NW
Washington DC 20433
Telephone: 202-473-1000
Internet: www.worldbank.org
Rights and Permissions
The material in this work is subject to copyright. Because The World Bank encourages dissemination of its knowledge, this work may be reproduced, in whole or in part, for noncommercial purposes as long as full attribution to this work is given.
This document has been prepared by Fauna & Flora International (FFI) for the public interest purposes of sharing good practice so as to ensure positive forest outcomes in the future. The information contained in this document has been obtained from public sources, as well as from the companies concerned in some instances. Whilst FFI has sought to ensure high standards of accuracy, including by giving each of the companies concerned the opportunity to review and comment on a draft, no representation or warranty is given as to the accuracy of the document and neither FFI nor any of its employees accepts any responsibility or liability to any person in relation to the contents. Without limitation, nothing in this document is intended or should be construed as a recommendation to deal or refrain from dealing in any securities of any of the companies mentioned.
Third-party content
The World Bank does not necessarily own each component of the content contained within the work. The World Bank therefore does not warrant that the use of any third-party-owned individual component or part contained in the work will not infringe on the rights of those third parties. The risk of claims resulting from such infringement rests solely with you. If you wish to re-use a component of the work, it is your responsibility to determine whether permission is needed for that re-use and to obtain permission from the copyright owner. Examples of components can include, but are not limited to, tables, figures, or images.
All FFI, Levin Sources and SGAB material displayed is subject to copyright, trademark and other intellectual property rights which are vested in FFI, Levin Sources and SGAB or our licensors. This includes photographs in this report. The material within this report may be printed, downloaded or copied for your own personal non-commercial or educational use. It must be fully acknowledged. Prior written permission must be obtained for any other use.
Financing for this study was provided by the Program on Forests (PROFOR).
Design: Michael Bunnya Kalanzi (MeBK)
Cover photo: Pippa Howard/FFI
iFOREST-SMART MINING
FOREST-SMART MINING Identifying Factors Associated with the Impacts of Large-Scale Mining (LSM) on Forests, World Bank, 2019
Thomas Maddox, Pippa Howard, Jonathan Knox, Nicky Jenner:Fauna & Flora International
April, 2019
ii FOREST-SMART MINING
TABLE OF CONTENTS
Acknowledgements ...................................................................................................................................................... iv
Abbreviations and Acronyms ....................................................................................................................................... x
Executive Summary ..................................................................................................................................................... xii
Introduction and Terms of Reference ..................................................................................................................... xvii
1. Background ............................................................................................................................................................. 2
1.1. Large-Scale Mining: An Introduction .......................................................................................................................................................2
1.2. Forests: An introduction ...................................................................................................................................................................................5
1.3. Mining in Forests and Forest-Smart Mining ........................................................................................................................................8
1.4. Policy and Regulatory Landscape for Forest-Smart Mining ...................................................................................................10
2. Current, Past, and Future Status of LSM in Forests ........................................................................................ 17
2.1. Overview of LSM in Forests Today ..........................................................................................................................................................17
2.2. Changes in Mining in Forests over Time .............................................................................................................................................42
3. Case Studies .......................................................................................................................................................... 48
3.1. Methodology .......................................................................................................................................................................................................48
3.2. Overview of Case Studies Analyzed ......................................................................................................................................................50
3.3. Overview of All Forest Health Scores and Rankings ....................................................................................................................54
3.4. Company Summaries .....................................................................................................................................................................................58
3.5. Australia ...................................................................................................................................................................................................................63
3.6. Brazil ..........................................................................................................................................................................................................................70
3.7. Ecuador ....................................................................................................................................................................................................................78
3.8. Finland......................................................................................................................................................................................................................83
3.9. Ghana .......................................................................................................................................................................................................................88
3.10. Guinea ......................................................................................................................................................................................................................97
3.11. India ........................................................................................................................................................................................................................ 107
3.12. Indonesia ............................................................................................................................................................................................................. 112
3.13. Liberia .................................................................................................................................................................................................................... 121
3.14. Madagascar ........................................................................................................................................................................................................ 127
3.15. The Philippines ................................................................................................................................................................................................ 135
3.16. Suriname.............................................................................................................................................................................................................. 140
3.17. Sweden ................................................................................................................................................................................................................. 145
3.18. Zambia .................................................................................................................................................................................................................. 150
3.19. Case Studies Included in the Forest Index Only.......................................................................................................................... 155
iiiFOREST-SMART MINING
4. Discussion and Conclusion ..............................................................................................................................167
4.1. Urgent Need to Improve Approaches to LSM in Forests....................................................................................................... 167
4.2. Companies Implement Some Forest-Smart Policies but Fail to Address Key Areas ............................................. 169
4.3. Government Oversight Has a Key Role in Promoting Forest-Smart Approaches .................................................. 174
4.4. Empowered Civil Society Stakeholders Can Promote Forest-Smart Approaches ................................................. 175
4.5. Various Existing Frameworks Could Promote Forest-Smart Mining ............................................................................... 176
4.6. Conclusion .......................................................................................................................................................................................................... 177
5. Recommendations.............................................................................................................................................180
5.1. Enabling the Uptake of Forest-Smart Mining Principles ........................................................................................................ 180
5.2. A Call to Action ................................................................................................................................................................................................ 182
References....................................................................................................................................................................187
Appendix A. Additional Mining Resources ............................................................................................................195
A.1. Mining Exploration Patterns .................................................................................................................................................................... 195
A.2. Impacts of Mining .......................................................................................................................................................................................... 196
Appendix B. Policy and Regulatory Frameworks: Additional Resources .........................................................197
B.1. Global Frameworks ....................................................................................................................................................................................... 197
B.2. National and Regional Frameworks .................................................................................................................................................... 205
B.3. Industry Frameworks ................................................................................................................................................................................... 206
Appendix C. Current, Past and Future Status of LSM in Forests: Additional Resources ................................213
C.1. Key Commodities Mined in Forests .................................................................................................................................................... 213
C.2. Using Kriging Analysis to Explore Future Mining Hotspots ................................................................................................. 213
Appendix D. Case Studies: Additional Resources .................................................................................................218
D.1. Global Analysis MFA Data Set ................................................................................................................................................................. 218
D.2. Area of Interest ................................................................................................................................................................................................. 219
D.3. Composite Forest Health Index ............................................................................................................................................................. 219
D.4. Country Case Study Template ................................................................................................................................................................ 222
D.5. LSM Case Study Template ......................................................................................................................................................................... 223
D.6. Site Case Study Template .......................................................................................................................................................................... 223
iv FOREST-SMART MINING
ACKNOWLEDGEMENTS
The Forest Smart Mining Research Project was developed as a collaboration between the World Bank’s Energy and Extractives Global Practices, the Environment and Natural Resource Global Practice, Fauna & Flora International (FFI), Levin Sources, Swedish Geological AB and Fairfields Sustainability Consulting.
The primary authors of this report are: Thomas Maddox, Pippa Howard, Jonathan Knox and Nicky Jenner (Fauna & Flora International).
The following individuals also contributed to the research and writing of this report:
Fauna & Flora International: Twyla Holland, João Guimarães, David Marsh, Anna Lyons, Helen Nyul
Levin Sources: Andrew Cooke, Theodora Panayides, Estelle Levin-Nally, Blanca Racionero Gómez, Jonathan R. Stacey, Victoria Gronwald
Swedish Geological AB: Håkan Tarras-Wahlberg, Paul De Devries, Conrad Ocker
Many people gave their time to this work, including mining companies, governments, civil society organizations, multilateral and bilateral organizations, and other individuals. Our sincerest thanks go to all of them.
The team would like to acknowledge the contribution of the Levin Sources, Swedish Geological AB and Fauna & Flora International staff and teams who contributed to the research and writing of this report, and to Kirsten Hund and Erik Winter Reed who drove the project from within the World Bank. Kirsten continues to be a huge advocate for mainstreaming the findings of the report, by integrating Forest-Smart Mining as one of the building blocks of Climate-Smart Mining and the new World Bank Climate-Smart Mining Facility.

vFOREST-SMART MINING
Credit: Salajean

vi FOREST-SMART MINING
FiguresFigure 1.1 Total Gross Production Value of the 15 Most Valuable Commodities, 2014 .............................................................3
Figure 1.2 Mine Life Cycle ................................................................................................................................................................................................3
Figure 1.3 Variations In Commodity Metals Price Index, 2003–2017 ....................................................................................................4
Figure 1.4 Drivers of Tropical and Subtropical Deforestation ...................................................................................................................7
Figure 2.1 Operational Large-Scale Mines Located in Forest Landscapes ......................................................................................18
Figure 2.2 MFAs as a Percentage of Global MFA Count by Region ......................................................................................................19
Figure 2.3 Percentage of Global Forest Cover within the Potential Area of Interest of MFAs .............................................20
Figure 2.4 Numbers of MFAs in Operation and Development in the Top 20 Countries ........................................................20
Figure 2.5 Importance of Mining Breakdown for Top 5 Ranked Countries ....................................................................................22
Figure 2.6 Map of MFA Locations by Primary Commodity Mined .......................................................................................................24
Figure 2.7 Mining in Forests for the Top 10 Commodities by Production Value .........................................................................25
Figure 2.8 Extent to Which Different Minerals Are Mined in Forests ..................................................................................................25
Figure 2.9 Percentage of Mineral Production and Mining in Forests in Top Producer Countries ....................................26
Figure 2.10 MFAs by Mine Type ....................................................................................................................................................................................28
Figure 2.11 Operational MFAs by National Income Status ..........................................................................................................................29
Figure 2.12 MFAs in Development by National Income Status ................................................................................................................29
Figure 2.13 MFAs in World Bank Client Countries .............................................................................................................................................31
Figure 2.14 MFAs by World Bank Lending Category as a Percentage of Total Mine Count ....................................................32
Figure 2.15 MFAs by World Bank Lending Category as a Percentage of Global MFAs ...............................................................32
Figure 2.16 Percentage of MFAs by Biome Subformation ...........................................................................................................................33
Figure 2.17 Percentage of Biome MFAs per Commodity and Number of Operational Biome MFAs ...............................34
Figure 2.18 Percentage of PAs Overlapping with MFAs by Country ......................................................................................................35
Figure 2.19 Percentage of PAs within 50 Kilometers of an MFA by Country ....................................................................................36
Figure 2.20 Percentage of Key Biodiversity Areas Overlapping with MFAs by Country ............................................................36
Figure 2.21 Percentage of KBAs within 50 Kilometers of an MFA by Country .................................................................................37
Figure 2.22 Comparison of MFAs near Protected Areas by Country .....................................................................................................37
Figure 2.23 Comparison of MFAs near KBAs by Country ..............................................................................................................................38
Figure 2.24 MFAs inside / within 50 Kilometers of Protected Areas ......................................................................................................39
Figure 2.25 MFAs inside/within 50 Kilometers of KBAs ..................................................................................................................................40
Figure 2.26 Forest Mining by Major Mining Companies ..............................................................................................................................41
Figure 2.27 Cumulative Number of Mines Opening in Forests, 1800–2014 .....................................................................................42
Figure 2.28 Cumulative Number of Mines Opening in Forests, 1975–2014 .....................................................................................42
Figure 2.29 Number of Mines Opened, 19th–21st Centuries ....................................................................................................................43
Figure 2.30 Comparison of Cumulative Forest Mine Opening Dates across Geographical Regions ................................43
Figure 2.31 Opening Dates for Forest Mines in Different Regions .........................................................................................................44
Figure 2.32 Comparison of Global MFA Commissioning Dates and Key Global Events ...........................................................45
Figure 2.33 Exploration Hotspots across the Globe, 2007–2016 .............................................................................................................47
Figure 3.1 Mining Status in Focal Case Study Countries ............................................................................................................................52

viiFOREST-SMART MINING
Figure 3.2 Forest Status in Focal Case Study Countries ..............................................................................................................................52
Figure 3.3 Locations of LSM Forest Mining Case Studies ..........................................................................................................................55
Figure 3.4 Relationship between Forests and Large-Scale Mining in Australia ...........................................................................63
Figure 3.5 Map of Jarrahdale and AOI, Including Forest Cover and Protected Areas ..............................................................65
Figure 3.6 Regional Deforestation, 2001–2014 ................................................................................................................................................66
Figure 3.7 Map of Weipa and AOI, Including Forest Cover and Protected Areas........................................................................67
Figure 3.8 Regional Deforestation, 2001–2014 ................................................................................................................................................68
Figure 3.9 Relationship between Forests and Large-Scale Mining in Brazil ..................................................................................71
Figure 3.10 Map of Germano and AOI, Including Forest Cover and Protected Areas ................................................................73
Figure 3.11 Regional Deforestation, 2001–2014 ................................................................................................................................................74
Figure 3.12 Map of Itabira and AOI, Including Forest Cover and Protected Areas .......................................................................76
Figure 3.13 Regional Deforestation, 2001–2014 ................................................................................................................................................77
Figure 3.14 Relationship between Forests and Large-Scale Mining in Ecuador ............................................................................78
Figure 3.15 Map of Fruta del Norte and AOI, Including Forest Cover and Protected Areas ...................................................81
Figure 3.16 Regional Deforestation, 2001–2014 ................................................................................................................................................82
Figure 3.17 Relationship between Forests and Large-Scale Mining in Finland ..............................................................................83
Figure 3.18 Map of Sakatti and AOI, Including Forest Cover and Protected Areas ......................................................................85
Figure 3.19 Regional Deforestation, 2001–2014 ................................................................................................................................................86
Figure 3.20 Relationship between Forests and Large-Scale Mining in Ghana ...............................................................................88
Figure 3.21 Map of Ahafo and AOI, Including Forest Cover and Protected Areas ........................................................................91
Figure 3.22 Regional Deforestation, 2001–2014 ................................................................................................................................................92
Figure 3.23 Map of Akyem and AOI, Including Forest Cover and Protected Areas ......................................................................94
Figure 3.24 Regional Deforestation, 2001–2014 ................................................................................................................................................95
Figure 3.25 Relationship between Forests and Large-Scale Mining in Guinea ..............................................................................97
Figure 3.26 Map of Boké Mine Region and AOI, Including Forest Cover and Protected Areas ............................................99
Figure 3.27 Regional Deforestation, 2001–2014 ............................................................................................................................................. 101
Figure 3.28 Map of Nimba North and AOI, Including Forest Cover and Protected Areas..................................................... 104
Figure 3.29 Regional Deforestation, 2001–2014 ............................................................................................................................................. 105
Figure 3.30 Relationship between Forests and Large-Scale Mining in India ................................................................................ 107
Figure 3.31 Regional Map of Bunder site and AOI, Including Forest Cover and Protected Areas .................................... 109
Figure 3.32 Regional Deforestation, 2001–2014 ............................................................................................................................................. 110
Figure 3.33 Relationship between Forests and Large-Scale Mining in Indonesia ..................................................................... 112
Figure 3.34 Map of Batu Hijau and AOI, Including Forest Cover and Protected Areas ........................................................... 115
Figure 3.35 Regional Deforestation, 2001–2014 ............................................................................................................................................. 116
Figure 3.36 Map of Grasberg and AOI, Including Forest Cover and Protected Areas .............................................................. 117
Figure 3.37 Regional Deforestation, 2001–2014 ............................................................................................................................................. 119
Figure 3.38 Relationship between Forests and Large-Scale Mining in Liberia ............................................................................ 121
Figure 3.39 Map of Tokadeh and AOI, Including Forest Cover and Protected Areas ............................................................... 124
viii FOREST-SMART MINING
Figure 3.40 Regional Deforestation, 2001–2014 ............................................................................................................................................. 125
Figure 3.41 Relationship between Forests and Large-Scale Mining in Madagascar ................................................................ 127
Figure 3.42 Map of Ambatovy and AOI, Including Forest Cover and Protected Areas ........................................................... 129
Figure 3.43 Regional Deforestation, 2001–2014 ............................................................................................................................................. 130
Figure 3.44 Map of QMM and Case study AOI, Including Forest Cover and Protected Areas ............................................ 132
Figure 3.45 Regional Deforestation, 2001–2014 ............................................................................................................................................. 133
Figure 3.46 Relationship between Forests and Large-Scale Mining in the Philippines ......................................................... 135
Figure 3.47 Map of Mount Tapian and AOI, Including Forest Cover and Protected Areas ................................................... 137
Figure 3.48 Regional Deforestation, 2001–2014 ............................................................................................................................................. 138
Figure 3.49 Relationship between Forests and Large-Scale Mining in Suriname...................................................................... 140
Figure 3.50 Map of Merian and AOI, Including Forest Cover and Protected Areas ................................................................... 142
Figure 3.51 Regional Deforestation, 2001–2014 ............................................................................................................................................. 143
Figure 3.52 Relationship between Forests and Large-Scale Mining in Sweden ......................................................................... 145
Figure 3.53 Map of Mertainen and AOI, Including Forest Cover and Protected Areas ........................................................... 157
Figure 3.54 Regional Deforestation, 2001–2014 ............................................................................................................................................. 158
Figure 3.55 Relationship between Forests and Large-Scale Mining in Zambia .......................................................................... 150
Figure 3.56 Map of Kalumbila and AOI, Including Forest Cover and Protected Areas ............................................................ 152
Figure 3.57 Regional Deforestation, 2001–2014 ............................................................................................................................................. 153
Figure 3.58 Iron Quadrangle AOI and Regional Deforestation, 2001–2014 .................................................................................. 155
Figure 3.59 Sudbury AOI and Regional Deforestation, 2001–2014..................................................................................................... 157
Figure 3.60 Kolwezi AOI and Regional Deforestation, 2001–2014 ...................................................................................................... 158
Figure 3.61 Madneuli AOI and Regional Deforestation, 2001–2014 .................................................................................................. 160
Figure 3.62 Kela AOI and Regional Deforestation, 2001–2014 .............................................................................................................. 161
Figure 3.63 Nimba Range Mineral Province AOI and Regional Deforestation, 2001–2014 ................................................. 163
Figure 3.64 Kansanshi AOI and Regional Deforestation, 2001–2014 ................................................................................................. 164
Figure 3.65 Lumwana AOI and Regional Deforestation, 2001–2014 ................................................................................................. 166
Figure 4.1 Extent of Sites’ Forest Smartness .................................................................................................................................................... 173
Figure 4.2 Need for Contextually Based Responsibility for Achieving Forest-Smart (FS) Outcomes .......................... 179
Figure A.1 Number of Exploration Discoveries, 1950–2016 .................................................................................................................. 195
Figure C.1 Modeled LSM Risk in Forested Areas ........................................................................................................................................... 217
ixFOREST-SMART MINING
TablesTable 2.1 Relative Proportion of Mining in Each Region ...........................................................................................................................17
Table 2.2 Importance of Mining in Forests in the Top 20 Countries by Mine Count ...............................................................21
Table 2.3 Mining in Forests for the Top 10 Commodities by Production Value ..........................................................................23
Table 2.4 MFAs in or near Protected or Key Biodiversity Areas ..............................................................................................................34
Table 2.5 Protected Areas with MFA Presence by IUCN Category .......................................................................................................34
Table 3.1 Summary of the Variables Used to Calculate the AOI Forest Health Scores ............................................................49
Table 3.2 Summary of Companies Included in the Study ........................................................................................................................50
Table 3.3 Mining and Forest Variables for the Countries Covered in the 21 Desktop and Visit Case Studies ...........51
Table 3.4 Summary of Case Study Sites ...............................................................................................................................................................53
Table 3.5 Final Forest Health Scores and Ranks for the AOIs of Each Mine Site ..........................................................................56
Table A.1 Potential Environmental and Social Impacts of Mining .................................................................................................... 196
Table B.1 SDGs and Targets of Relevance to Forest-Smart Mining................................................................................................... 198
Table B.2 IUCN 2016 World Conservation Congress Motions Relevant to Mining and Forests ..................................... 203
Table C.1 Extent to Which Different Minerals Are Mined in Forests by Country ...................................................................... 214
Table D.1 Mine Status .................................................................................................................................................................................................... 219
x FOREST-SMART MINING x FOREST-SMART MINING
ABBREVIATIONS AND ACRONYMS$A Australian dollars
AML ArcelorMittal Liberia
AMV Africa Mining Vision
AOI area of interest
ASI Aluminium Stewardship Initiative
ASM artisanal and small-scale mining
BBOP Business and Biodiversity Offsets Programme
BCP Biodiversity Conservation Programme (of AML)
CBD Convention on Biological Diversity
CBG Compagnie des Bauxites de Guinée
CDP Carbon Disclosure Project
CSBI Cross-Sector Biodiversity Initiative
DJSI Dow Jones Sustainability Index
DRC Democratic Republic of Congo
DSO direct shipping ore
EGA Emirates Global Aluminium
EIA environmental impact assessment
EPA environmental protection agency
ESG environment, social, and governance
ESIA environmental and social impact assessment
ESS environmental and social safeguards
FAO Food and Agriculture Organization (of the UN)
FCPF Forest Carbon Partnership Facility
FdN Fruta del Norte
FPIC free, prior and informed consent
FQM First Quantum Minerals
FSC Forest Stewardship Council
GAC Guinea Alumina Corporation
GDP gross domestic product
GHG greenhouse gas
GMA game management area (Zambia)
GRI Global Reporting Initiative
GVP gross value of production
IBRD International Bank for Reconstruction and Development (of the World Bank Group)
ICCM International Council on Mining and Metals
IDA International Development Association (of the World Bank Group)
IFC International Finance Corporation
IRMA Initiative for Responsible Mining Assurance
JV joint venture
KBA Key Biodiversity Area
LOM life of mine
LSM large-scale mining
MFA large-scale mine in forested area
MFI multilateral financial institution
xiFOREST-SMART MINING xiFOREST-SMART MINING
MH mitigation hierarchy
MLNR Ministry of Land and Natural Resources (Ghana)
MMC Marcopper Mining Corporation
MMDA Mines and Minerals Development Act (of the Laws of Zambia)
MMG Ministry of Mines and Geology (Guinea)
MRV monitoring, reporting, and verification
NBSAP National Biodiversity Strategies and Action Plans
NDC Nationally Determined Contribution
NEEI non-energy extractive industry
NNL no net loss
NPI net positive impact
OECD Organisation for Economic Co-operation and Development
PA protected area
PEFC Programme for the Endorsement of Forest Certification
PPCP public-private community partnership
PROFOR Program on Forests
PS Performance Standard (of the IFC)
REDD+ Reducing Emissions from Deforestation and Degradation and associated co-benefits
RMD Raw Materials Database
RPPN private natural heritage reserve (of the Vale company)
SDG Sustainable Development Goal
SEA strategic environmental assessment
SMFG Société des Mines de Fer de Guinée
SuRe Standard for Sustainable and Resilient Infrastructure
UN United Nations
UNFCCC United Nations Framework Convention on Climate Change
UNFCR United Nations Framework Classification for Resources
WLNP West Lunga National Park (Zambia)
WWF World Wide Fund for Nature
All dollars are U.S. dollars unless otherwise indicated.

xii FOREST-SMART MINING xii FOREST-SMART MINING
The Mining Sector
• Minerals play a vital role in society, both in everyday life and in technologies required for a greener economic future.
• While circular economic approaches are developing fast, continued rising demand and the limitations of recycling mean mining for new raw materials is set to remain an important part of mineral production for the foreseeable future. As an industry, mining plays an important role in more than 80 countries worldwide and, when managed well, contributes to many of the global development goals.
• However, when managed poorly, the sector can lead to various negative social, environmental, and economic impacts potentially occurring across the mining life cycle.
• Change in the mining sector tends to be slow, with activity largely driven by long-term commodity price cycles and projects being conducted at increasingly larger scales. But when projects do occur, they can play a key role in the future development of an area.
The Forest Sector
• Forests cover about a third of the planet’s surface and hold vast environmental and social value.
• According to formal economic calculations, forests contribute some 1–2 percent of global gross domestic product (GDP) and formally and informally employ in excess of 50 million people.
• In addition, they provide a wealth of uncosted and uncalculatable values. Holding 80 percent of global biodiversity, forests generate ecosystem services from fuel, food, and fiber to climate resilience and flood protection.
• As a result, over a billion people rely on the services generated by forests, including some 300–700 million indigenous people.
• So far, the world has lost about half of its forests. Rates of loss have declined in recent years as higher-income countries start to reforest, but net global forest cover
continues to fall due to continued deforestation in lower-income countries.
• The cause of forest loss and degradation is economic activity. Commercial and subsistence agriculture are the main drivers, but mining plays an important albeit less understood role.
Mining in Forests
• With the extent of mining set to increase together with the relative value of the remaining forests, understanding and better managing mining in forests is key.
• The direct impacts of mining on forests are already fairly well understood and include the impacts of the pit, the impacts of physical and chemical waste disposal, the impacts of social displacement, and the impacts of the footprint of associated infrastructure.
• The indirect impacts on forests are far less well understood. They include the knock-on effects of the movement of people (both from the mine site and into the mining area), of mining transport routes on access to new areas and bushmeat trade, and of cumulative impacts of multiple industries.
• As a result, a range of ecological impacts can occur from mining that in turn can have a range of social impacts on people living in the vicinity of the mining project.
• The World Bank recognizes the important role of forests in human development and the need to support “forest smart” development over business as usual, defining forest smart as “a development approach that recognizes forest’s significance for sustaining growth across many sectors.” What this would look like for mining has not yet been explored in detail.
• Forest-smart economic approaches are therefore more than just the minimization of harm. Being forest smart requires a more dynamic, integrated understanding of the relationship between all economic activities, the ecology of the forests, and the people that depend upon them, and the identification of approaches that both minimize negative impacts and promote positive
EXECUTIVE SUMMARY
xiiiFOREST-SMART MINING xiiiFOREST-SMART MINING
forest outcomes.
• Forest-smart mining therefore requires understanding of forest ecology and forest communities, including the ecosystem services they rely on. It requires a full understanding of all the direct, indirect, and cumulative impacts of the mine on both forest cover and biodiversity as well as on the services they generate, and it requires a comprehensive large-scale plan to ensure forest composition, structure, and function are maintained or even promoted.
• Developing a forest-smart approach to mining is of particular importance in lower- and middle-income countries. Not only are they where the extent of mining in forests has increased the most in recent years (see below), but they also are where forests have the highest environmental values and people with the highest reliance on forest-based services.
Policy and Regulatory Frameworks for Mining in Forests
• There are no specific guidelines for forest-smart mining, but a number of existing policy and regulatory frameworks can be used to support the development of forest-smart mining approaches.
• At a global level, the Sustainable Development Goals (SDGs) and the United Nations Framework Convention on Climate Change (UNFCCC) represent the key frameworks that can support the principles of forest-smart mining, with the New York Declaration on Forests and Action Agenda particularly highlighting the role of forests in delivering both of these.
• Within the UNFCCC, the framework for Reducing Emissions from Deforestation and Degradation and associated co-benefits (REDD+) represents one of the clearest mechanisms for supporting forest-smart mining, although it has largely been focused on the agriculture and forestry sectors.
• At the national level, most countries have laws guiding how mining projects should take impacts into account through environmental and social impact assessments (ESIAs), although implementation and enforcement varies substantially. Such processes are typically governed by separate and often-conflicting mining departments, which promote the extraction of resources, and environmental departments, which are mandated to protect environmental resources. However, many have gone through varying stages of development, typically focused initially on the promotion of sector development and later on addressing unintended consequences.
• Various voluntary frameworks also exist at the
industry level. The mitigation hierarchy has gained widespread acceptance as the best-practice approach to managing impacts and is promoted by a variety of industry bodies, such as the International Council on Mining and Metals (ICMM) and the Cross-Sector Biodiversity Initiative (CSBI). Voluntary standards are also gaining momentum, with standards in development for aluminum and steel value chains as well as the mining process in general. Financial safeguards are also becoming increasingly influential, led by the International Finance Corporation (IFC) Performance Standards.
Report Terms of Reference
• This report sets out to explore what forest-smart mining might look like and the extent to which examples already exist on the ground.
• The report focuses on large-scale mining (LSM) for the minerals of highest economic value (with the exception of coal).
• It focuses on a range of LSM projects occurring in forests across a variety of geographies, ecologies, and economies, analyzing for each the condition of the forest around the mine site and the potential factors associated with better or worse forest outcomes.
• A sister report analyzes the same issues from the perspective of small-scale and artisanal mining.
Current Status of Mining in Forests
• An analysis based on Hanson’s 2015 forest cover data, the Food and Agriculture Organization (FAO) definition of forests, and the Raw Materials 2015 database finds 1,539 large-scale mines operational in forests today, representing 44 percent of all operational mines. A further 1,826 are in development or currently nonoperational. Most are open-pit mines.
• Using an assumed area of interest of up to 50 kilometers radius, this means around 10 percent of all forests are potentially influenced by operational large-scale mining projects. This rises to nearly a third of all forests if the mines in development or currently nonoperational are also considered.
• Mining in forests occurs across the globe, but it accounts for over half of all mining in North America and South Asia. Most forest mining occurs in the largest countries (China, the Russian Federation, Brazil, Canada, and the United States), but when accounting for area, economic importance, and forest cover, the key countries for current forest mining are Brazil, the Democratic Republic of Congo (DRC), Zambia, Ghana, and Zimbabwe.
xiv FOREST-SMART MINING xiv FOREST-SMART MINING
• Over half of all existing forest mining occurs in lower- or middle-income countries, although most mines in development are in high-income countries. Seventy-four percent of all forest mines are in World Bank client countries. Of these, International Development Association (IDA) countries show a lower number of forest mines but a higher proportion of forest mines as a total of their mining industry, with 62 percent of all IDA country mines in forests.
• The top three minerals mined in forests are gold, iron ore, and copper, with gold in particular often mined in more valuable “biome” forests. However, the significant industries with the highest reliance on forest mines are bauxite, titanium, and nickel (all with over 60 percent of mines in forests).
• Much forest mining occurs in evergreen needleleaf forests from high latitudes, but 7 percent of all forest mine operations are based in tropical rain forest biomes, the forest where biodiversity and carbon values are highest.
• Few mines exist inside protected areas or Key Biodiversity Areas (KBAs), but a large number are within 50 kilometers of a protected area (77 percent) or a KBA (52 percent).
• Key companies with operations in forests include Vale, Alcoa, First Quantum Minerals, ArcelorMittal, and RUSAL. Vale has the highest proportion of forest mines, accounting for 92 percent of its portfolio and 6 percent of all forest mines. Most of the companies are privately owned, but the state-owned companies of Russia, India, and Albania, in particular, hold significant portfolios of forest mines.
• Analysis of future trends for forest mining is restricted by data availability on geological deposits, but analysis of past trends shows a marked increase in forest mining over time, most recently in Sub-Saharan Africa and Asia.
Case Studies
• The case studies represent examples of mining projects located in forests with a surrounding area of interest defined by a 50-kilometer radius and river basin geography. Twelve variables of forest “health” were assessed across each area of interest, to build an index of forest health.
• Twenty-nine case studies were analyzed for the Forest Health Index. Of these, 21 were studied in depth to explore potential explanatory factors for variation in forest health based on company corporate policy, on-site management practices, and contextual political and legislative environments.
• For each site, historical deforestation rates were also measured.
• Case studies are presented by country, with key findings summarized in the main report and additional data included in a separate appendix.
Key Findings
• There is urgency to improve approaches to mining in forests.
o Forest mining is an economically significant sector that is set to expand in economically, socially, and environmentally sensitive areas.
o While examples of forest-smart approaches exist, there are no clear examples of wholly forest-smart LSM operations.
o Direct impacts of mining on forests can be important at a local level, but they are probably less important at a global scale.
o Indirect impacts of mining on forests are important at the local and global scales, but responsibilities are unclear.
o Social impacts are a significant component of forest mining.
• Companies operating large-scale mines in a forested area (MFAs) implement some forest-smart policies but fail to address key areas.
o Relevant corporate policies vary widely, yet there is no clear relationship with forest health.
o There are various examples of forest-smart approaches to managing direct impacts, although there is room for improvement.
o There are very few examples of forest-smart approaches to managing secondary and cumulative impacts.
o There are few examples of landscape-level, integrated approaches to managing or monitoring mining impacts on forests.
• Government oversight of MFAs has a key role in promoting forest-smart approaches.
o Government capacity and resources has a major influence on forest-smart approaches.
o Poor coordination between relevant government departments is a major inhibitor of forest-smart approaches.

xvFOREST-SMART MINING xvFOREST-SMART MINING
• Civil society stakeholders in MFAs can promote forest-smart approaches if empowered.
o Lack of tenure rights for local communities can undermine forest-smart approaches.
o Active involvement of external civil society groups can promote forest-smart approaches.
• Various existing frameworks could promote forest-smart mining.
o EIA frameworks could better support forest-smart mining if strengthened.
o The SDGs represent a good general framework for supporting forest-smart mining.
o The Paris Agreement together with REDD+ represents a clearer framework for implementing forest-smart mining, but it is largely underused.
o Corporate foundations represent a potentially influential framework for action that is largely underused.
o Financial institutions have an important role to play in promoting forest-smart mining approaches.
• Synthesis: Achieving forest-smart mining requires better coordination of MFA stakeholders and better use of available frameworks applied at a landscape scale within a holistic approach toward smart development. This includes requiring companies to recognize the existing capacity of government and to fill in areas of responsibility where existing capacity is lacking.
Recommendations
• General
o The mitigation hierarchy must be the basis for all action, prioritizing “avoidance,” and no net loss or a net gain should be written into project objectives.
o Forest-smart mining must go beyond the mitigation of negative impacts and drive positive outcomes for forests.
o Forest-smart approaches need to be integrated into regulation governing mining, forests, water, climate, land use planning, and conservation, and integrated land use planning is paramount.
o Promote and facilitate secure tenure and rights over forests among local community stakeholders to support long-term forest stewardship and sustainable use.
o Local context must inform the design and application of forest-smart approaches.
o Community stakeholders have an important role to play in promoting forest-smart outcomes and must be empowered to do so.
o Collaboration and cooperation between project proponents and governing authorities are essential. Where governance is weak, companies should adopt forest-smart mining approaches need to be adopted by companies in the absence of regulation as “the right thing to do.”
o Transboundary cooperation is essential to ensure impacts to forest integrity, function, and ecosystem services do not have transboundary impacts.
o Forest-smart mining needs all actors to come together: partnership approaches, cross-sectoral alliances, and multidisciplinary collaboration will be essential.
o The full range of forest values need to be understood and recognized by all.
o LSM forest-smart approaches and strategies may need to incorporate artisanal and small-scale mining.
o Civil society, governments, and companies should promote all of the above recommendations through actions as watchdogs, subject experts, and third-party facilitators
• Governments
o Undertake or facilitate strategic environmental assessment and landscape-level land use planning, particularly for infrastructure corridors, including the “no go” option when evaluating alternatives.
o Establish and consistently apply and enforce legal and regulatory frameworks that ensure due diligence on mining companies to undertake comprehensive ESIAs prior to mine license approval and to hold companies to account for noncompliance.
o Require cumulative impact assessments by all new proponents in any landscape where at least one mine already exists and with consideration of activities across all other sectors.
o Promote and enable effective interministerial coordination, address power imbalances, and reconcile conflicts in policy and legislation at all
xvi FOREST-SMART MINING xvi FOREST-SMART MINING
levels to support forest-smart mining.
o Ensure an enabling legal and regulatory environment for the inclusion of local communities and stakeholders in the consultation and decision-making process.
o Provide the legal and regulatory mechanisms to support
* The adoption and transfer of liabilities and responsibilities for mitigation of social and environmental legacy issues;
* The clarification and recognition of customary tenure and rights over forests; and
* The application of REDD+ and good practice biodiversity offsetting
o Build capacity and resources, including in relevant “non-mining” parts of government, to implement and enforce recommended actions (above) at national and subnational levels.
• Companies
o Commit to a net gain or no net loss objective in the forest ecosystem.
o Spply the mitigation hierarchy and adopt a forest-smart approach throughout the full mining life cycle, from exploration through closure.
o Undertake a thorough social and environmental impact assessment applying free, prior and informed consent (FPIC) with full consultation and inclusion of the guiding and managing authorities and regulators.
o Specifically consider indirect impacts on the landscape, and to design, implement, and monitor responses to manage them.
o Consider cumulative impacts and commit to a transparent and meaningful collaboration with other companies operating within the landscape to address and monitor them.
o Understand and take into account customary tenure and rights when identifying potential impacts of mining activity and opportunities for forest-smart approaches.
o Demonstrate corporate-level commitment to forest-smart mining and to allocate and sustain appropriate levels of resources and capacity to implement forest-smart activities.
o Take an integrated approach to managing social and environmental impacts in forests to identify and avoid unintended adverse impacts and trade-offs and promote positive forest-smart outcomes.
o Ensure a bonded commitment to mine closure, rehabilitation, and ecological restoration.
o Apply or align with international best-practice standards to ensure application of environmental and social safeguards.
o Consider opportunities to support the creation, strengthening, or expansion of protected area networks to promote forest conservation
• Financial institutions
o Play a proactive role in promoting forest-smart mining and development.
o Support and incentivize the application of approaches outlined above for companies and governments, particularly with regard to capacity building at the government level.
o Catalyze, facilitate, and incentivize landscape-level assessment, strategic environment assessment, and cumulative impact assessment in priority forest landscapes.
o Apply conditionalities on loans and within their environmental and social safeguards that require no net loss or a net gain outcomes for forests.
o Encourage clients to take a landscape approach and ensure that it is applied in practice for mining projects.
o Require the early application of the mitigation hierarchy and evidence thereof for all projects financed in forest ecosystems.
o Ensure the application of FPIC and full consideration of customary tenure and rights in all mining projects and across all aspects.
xviiFOREST-SMART MINING xviiFOREST-SMART MINING
The mining sector plays a massive role in modern society. First, not only are the metals and minerals it produces essential to almost every aspect of everyday life, but they also play an increasingly important role in the development of future technology required for a transformation toward greener, sustainable economies. Mining is not the only source of raw minerals: recycling is becoming an increasingly important part of the supply chain; steel has long been recycled extensively and now other commodities such as lead or aluminum are also extensively reused or recycled, and some companies are even taking steps to end reliance on mined minerals altogether—for example, Apple (Apple 2017). However, recycling cannot yet meet a global demand that continues to rise and it is estimated that at least 50 percent of mineral commodity needs will have to be met by mining for the foreseeable future (Nassar 2018). Second, mining plays a huge economic role. The sector accounts for up to about a quarter of global GDP, indirectly accounts for up to 15 percent of employment, and plays a dominant role in the economies of more than 80 countries, particularly those in the lower- to middle-income bracket (ICMM 2016b). If managed well, mining thus has the potential to contribute positively to multiple global development goals (Columbia Center on Sustainable Investment et al. 2016).
However, national endowments of natural resources do not automatically lead to better development outcomes. On the contrary, many resource-rich nations exhibit lower social and produced capital rates of economic growth and stability, and higher rates of conflict, political authoritarianism, and social and environmental impacts (NRGI 2015). The impacts at and near mine sites are the best understood, including land clearance, displacement of people, and the generation of huge volumes of waste (eLAW 2010). To supply the 9 million tonnes of refined metals that are produced today, the waste material generated from the mining process alone is equivalent to roughly 9 tonnes per year for every person on the planet (Franks 2015). However, the less visible, indirect impacts of mining can be even more pervasive, occurring far from the mine site, including the impacts of associated infrastructure and the influx of people that are often
associated with large-scale mining projects (Sonter et al. 2017).
The impact of economic production in forest landscapes is an area of particular concern. Forests lie at the intersection of numerous development challenges. They support 80 percent of global biodiversity, which is responsible in turn for generating ecosystem services from climate and water regulatory services to food, fibers, and fuel that support over 1.6 billion people. Most of the people living near forests, and most of those with the highest dependencies on forests, are poor (UNDP 2014). Yet every year, a net 7 million hectares of forest are lost from the most sensitive areas (FAO 2016). The importance of forests has been recognized by a range of international actors, including the World Bank, which is guided by its 2002 Forest Strategy and Forest Action Plan 2016–20 (World Bank 2016c). The biggest drivers of forest loss are economic activities, so the strategy includes the vision that economic sectors do “not erode forest capital and generate instead positive forest outcomes.” A key focus area of this plan is the development of forest-smart interventions across a range of economic sectors, avoiding or minimizing harmful impacts and enabling growth that does not come at the expense of forest natural assets.
Agriculture is the primary economic driver of forest loss, accounting for at least half of all deforestation globally, and thus it is the focus of most forest- or climate-related responses. However, the impacts of mining and associated infrastructure development can also play a significant role, particularly in early-stage deforestation (Hosonuma et al. 2012). Thousands of official and unofficial exploration and/or mining projects are located in forested landscapes, and with demand continuing to rise, mining in forests is set to increase. This is particularly true in lower- or middle-income countries where mining is economically significant and where forests may play a particularly crucial role in development. However, these are also the places where the factors that lead to the complex economic, social, and environmental issues associated with resource abundance tend to be most prevalent, where the poverty and vulnerability of people
INTRODUCTION AND TERMS OF REFERENCE
xviii FOREST-SMART MINING xviii FOREST-SMART MINING
are highest, and where biodiversity and ecological function are richest.
With this in mind, it is essential that existing and future mining activity in forests be “forest smart.” But what is forest-smart mining? The World Bank Program on Forests (PROFOR) defines forest smart as “a development approach that recognizes forests” significance for sustaining growth across many sectors, including agriculture, energy, infrastructure, and water. It is sustainable and inclusive in nature, emphasizing that forests are part of a broader landscape and that changes in forest cover affect other land uses as well as the people living in that landscape. It transforms how sectors operate by identifying opportunities for mutual benefit and creating practical solutions that can be implemented at scale (PROFOR 2016).
The negative impacts of mining on forests can be particularly visible. Large-scale mining projects can be directly responsible for clear-cutting thousands of hectares of forest, while an influx of hundreds or thousands of artisanal or small-scale miners can lead to extensive riparian deforestation and river pollution. Partly because of the highly visible nature of these impacts, there are already various frameworks and guidelines for mitigation in place. The Natural Resource Charter, for instance, provides guidelines to governments looking to avoid the complex economic, social, and environmental issues that can arise with resource abundance, including the establishment of strong environmental governance (NRGI 2014). The UN Framework Classification for Resources (UNFCR) seeks to promote an integrated global framework for resource exploitation in line with global development goals. Other examples focus on the role of business, such as the ICCM good practice principles (ICMM 2017) and the IFC Performance Standards on environmental and social sustainability (IFC 2012a).
However, does the application of good practice at the political, financial, and corporate levels and minimization of forest impacts at the project level alone constitute forest-smart mining? Forest “smart” suggests something more than minimizing harm. It suggests a more dynamic, integrated understanding of the relationship between forests and economic activity and the identification of synergies that help to drive positive forest outcomes. Forest-smart mining therefore requires an understanding of the ecology of the forest landscape and all the associated impacts and dependencies. It requires an understanding of all the actors across the landscape and the interactions between them. It requires not only the avoidance or minimization of negative impacts but also the active pursuit of opportunities for generating positive impacts. A forest-smart mine must be more than a mine that contributes to the economy while causing
less damage than its neighbors—it must be a mine that actively understands and plays a positive role in the landscape, not only contributing economically but also actively enhancing the forest values society depends on.
The Terms of Reference for this project were to conduct an analysis of how to promote forest-smart mining in forest landscapes. The overall objective is “to enable client countries and the World Bank Group to make better-informed decisions about minimizing trade-offs and maximizing benefits from ‘forest-smart mining,’” to be achieved by “generating knowledge on the extractives-forest nexus and guidance on how to translate this into forest-smart mining.” The analysis is based on a set of in-depth case studies that investigate the key challenges countries face when trying to balance mineral extraction and sustainable forest management, each looking at the key issues, the opportunities for change, and the tools and policies needed to find forest-based solutions to the problems at stake.
The project was divided into two, coordinated studies, one focusing on large-scale mining (LSM) and the other on artisanal and small-scale mining (ASM). This report focuses on large-scale mining, with the stated outcome being “the identification of good and bad practices and/or enabling conditions related to promoting forest-smart LSM based on a series of case studies.” The sister report focusing on the same outcome from an ASM perspective is available separately.
The LSM report is divided into the following sections:
• Chapter 1: Background. This section introduces the LSM sector and forests and summarizes what is currently understood about the relationship between the two, including an overview of the relevant policy and regulatory landscape.
• Chapter 2: Current status of LSM in forests. Using global data sets on LSM sites and forest cover, this section analyzes the extent to which LSM is happening in forests today, the key countries where it is particularly important, and which minerals are most associated with forest mining. It also looks at how mining in forests has changed over time and the extent to which this can be projected into the future.
• Chapter 3: Case studies. This section presents the summaries of 21 analyses of large-scale mining in forest across 14 countries and involving 15 companies. For each site, an index of forest health based on 12 variables was calculated across an area of interest of roughly 8,000 square kilometers around the mine site. The various political, corporate, social, and environmental factors that might explain the

xixFOREST-SMART MINING xixFOREST-SMART MINING
level of forest health were then assessed and the responses of mines and other landscape actors compared.
• Chapter 4: Discussion and conclusions. This section highlights the key messages coming out of the case studies and where they apply.
• Chapter 5: Recommendations. Based upon the messages of chapter 4, chapter 5 outlines some recommendations for promoting forest-smart mining.
• References
• Appendixes
Credit: Bannafarsai
2 FOREST-SMART MINING
1. BACKGROUND1.1. Large-Scale Mining: An Introduction
1.1.1. Key LSM Commodities
The mining sector is diverse in terms of mine size and technical capabilities. It can range from labor-intensive ASM using rudimentary, unmechanized mining methods, to LSM, which is a formal and regulated activity that involves the use of modern industrial-scale technologies to extract and process valuable ore from the ground. This report focuses on LSM.
LSM involves numerous commodities and many individual mine sites. The latest available data from the Raw Materials Database (2014) indicates a total of 5,629 operating mines. These can be categorized into three main subsectors: (i) metals and precious minerals mining; (ii) coal mining; and (iii) industrial minerals mining and quarrying. Most mines are for metals and precious minerals. Coal mining actually has a larger economic worth, with a global turnover equivalent to all metals and precious minerals mining combined, but it is not included in this report. Neither is industrial minerals mining. Industrial minerals mining and quarrying is vital for society and domestic economies, but it has lower global economic importance as the value to bulk ratio is often small, and therefore the potential for export is small.
By combining total production data from the Raw Materials Database (RMD) with relevant commodity pricing data for 2014, the relative value of the main commodities mined can be explored. In 2014, the total gross value of production (GVP) of the commodities included in the RMD was about $1.4 trillion. A relatively small number of commodities dominate production value, with the contribution of the top 5 and top
10 commodities accounting for 79 percent and 93 percent, respectively (Figure 1.1). After coal, the five most important commodities are iron ore, gold, copper, manganese, and chromite. The top five commodities in terms of value of production are the same ones that dominate in terms of expenditures made in mineral prospecting activities. Schodde (2017) estimates that $199 billion was spent on exploration during 2007–2016, with gold, copper, coal, and iron ore accounting for 72 percent.
However, distribution of minerals is far from even, with production in the LSM sector to a large extent sourced from a smaller number of so-called world-class or Tier 1 deposits. Such large deposits may, furthermore, often be situated in rather close proximity to each other. For example, in 2014 about 49 percent of the iron ore production and some 30 percent of the copper production of the world each came from 10 large mines, respectively (ICSG 2014; Intelligence Mine, n.d.). Furthermore, of the 10 copper mines, six were in Chile; of the 10 iron ore mines, seven were in Australia. The latter illustrates the importance of geology, and that a relatively small number of mineralized provinces are much more important as sources for commodities than other areas. For further details on recent patterns in mining exploration, see appendix A.

3FOREST-SMART MINING
Figure 1.1 Total Gross Production Value of the 15 Most Valuable Commodities, 2014
Sources: Raw Materials Database; Reichl, Schatz, and Zsak 2016; InfoMine website.
1.1.2. The LSM Life Cycle and Its Role In Economic Development
An LSM project, when implemented in a well-functioning jurisdiction, will typically undergo several stages, starting with exploration and finishing with closure and subsequent relinquishment of the mineral and/or land titles (Figure 1.2). The complete life cycle of a mine varies, but it is typically long (some 20 years) and can even be very long (more than 100 years is not uncommon).
Figure 1.2 Mine Life Cycle
Source: Minerals Council of Australia 2017.
4 FOREST-SMART MINING
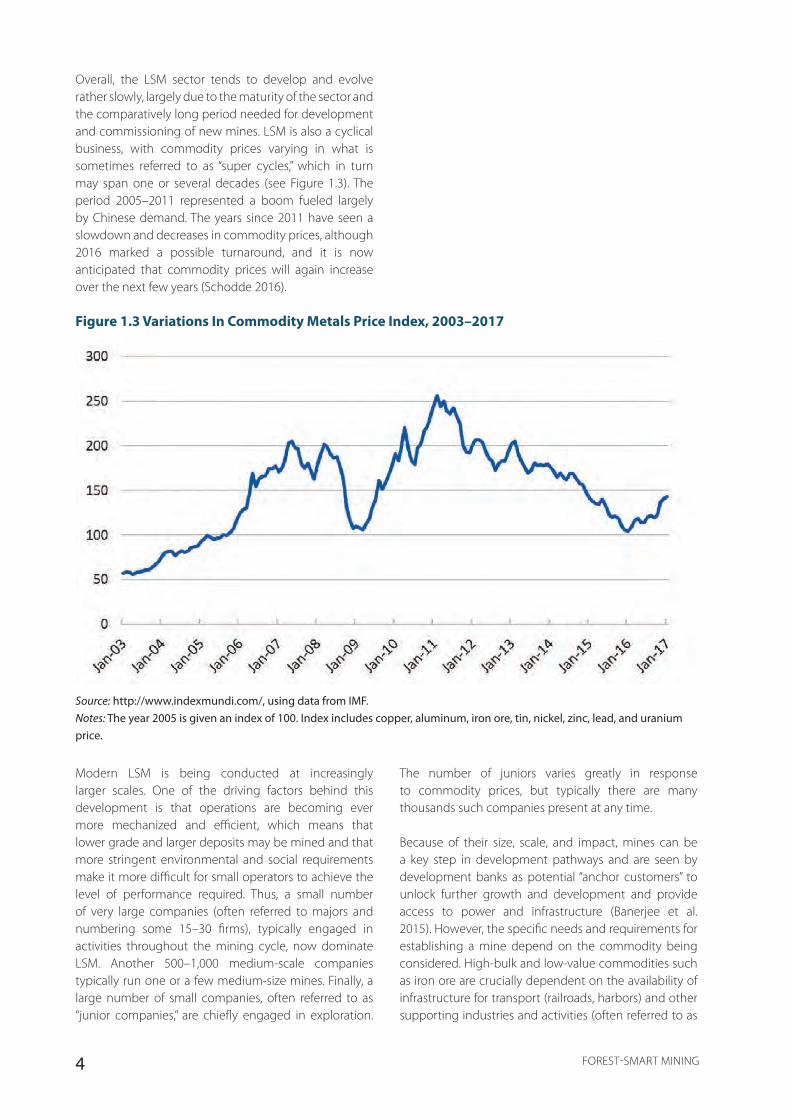
Overall, the LSM sector tends to develop and evolve rather slowly, largely due to the maturity of the sector and the comparatively long period needed for development and commissioning of new mines. LSM is also a cyclical business, with commodity prices varying in what is sometimes referred to as “super cycles,” which in turn may span one or several decades (see Figure 1.3). The period 2005–2011 represented a boom fueled largely by Chinese demand. The years since 2011 have seen a slowdown and decreases in commodity prices, although 2016 marked a possible turnaround, and it is now anticipated that commodity prices will again increase over the next few years (Schodde 2016).
Source: http://www.indexmundi.com/, using data from IMF.Notes: The year 2005 is given an index of 100. Index includes copper, aluminum, iron ore, tin, nickel, zinc, lead, and uranium price.
Figure 1.3 Variations In Commodity Metals Price Index, 2003–2017
Modern LSM is being conducted at increasingly larger scales. One of the driving factors behind this development is that operations are becoming ever more mechanized and efficient, which means that lower grade and larger deposits may be mined and that more stringent environmental and social requirements make it more difficult for small operators to achieve the level of performance required. Thus, a small number of very large companies (often referred to majors and numbering some 15–30 firms), typically engaged in activities throughout the mining cycle, now dominate LSM. Another 500–1,000 medium-scale companies typically run one or a few medium-size mines. Finally, a large number of small companies, often referred to as “junior companies,” are chiefly engaged in exploration.
The number of juniors varies greatly in response to commodity prices, but typically there are many thousands such companies present at any time.
Because of their size, scale, and impact, mines can be a key step in development pathways and are seen by development banks as potential “anchor customers” to unlock further growth and development and provide access to power and infrastructure (Banerjee et al. 2015). However, the specific needs and requirements for establishing a mine depend on the commodity being considered. High-bulk and low-value commodities such as iron ore are crucially dependent on the availability of infrastructure for transport (railroads, harbors) and other supporting industries and activities (often referred to as
5FOREST-SMART MINING
“linkages”). Conversely, mines for low-bulk commodities (for example, gold and diamonds) may be initiated with a comparatively lesser need for associated linkages and infrastructure.
1.1.3. The Relationship between LSM and ASM
While this report focuses on LSM, the links with artisanal and small-scale mining are strong in some countries and it is important to recognize the relationship between the two. Further investigation of the potential for forest-smart ASM is addressed in the sister report to this one.
LSM targets a wide range of mineral resources and geologies where they occur in commercial concentrations, including those of relatively low value where economies of scale make the exploitation profitable (such as for coal, iron ore, and so on). In contrast, ASM tends to focus on high-value easily accessible resources in small or large deposits, including the so-called conflict minerals (tungsten, tantalum, tin, and gold, or “3TG”), high-value metals, and precious stones.
ASM and LSM activities frequently and increasingly occur together, causing cumulative impacts, particularly in less developed countries. In many cases, the two are inextricably linked: LSM often paves the way for ASM by exposing deposits and beginning exploration, and many of the impacts of LSM come through associated ASM activities (and vice versa). LSM and ASM can interact directly or indirectly. Direct interactions include when ASM and LSM operations compete for access to resources, and when ASM activities impact the effectiveness of LSM social or environmental impact mitigation strategies. Direct physical competition for minerals between LSM and ASM is rare, not least because of the physical dangers to ASM miners working alongside LSM operations and machinery. However, ASM activities may readily occur at the margins or in parts of an LSM concession, where the concentrations of target minerals are too low to justify the cost of LSM operations, or during the exploration or closure phases of an LSM concession, when access may be less actively restricted. Competition by ASM during the exploration phase of an LSM concession can pose a particular challenge for LSM operators: if ASM operations are allowed to proliferate before LSM operations begin, social and political factors may make it impossible for LSM to proceed as planned, especially in a context of poverty and resource nationalism. Competition by ASM at the deposit periphery or during the closure phase may be less economically damaging, but it can pose significant reputational, social, and environmental risks. Indirect interactions include social, economic, administrative, or political processes that favor one form of mining over
another, such as when ASM interests negatively influence LSM licensing, or preferential treatment of LSM results in the suppression of ASM.
Where ASM operates in the same landscape as LSM, even if outside LSM concessions and therefore without direct competition for resources, ASM can undermine the social and environmental mitigation commitments of LSM. Examples would include where ASM impacts LSM’s ability to maintain air or water quality, or where ASM damages vegetation that the LSM project has undertaken to protect as a part of a compensation or offsets program. ASM activities may also physically interfere with LSM project infrastructure, such as transport routes, mine roads, pipelines, construction camps, or accommodation blocks. This may be a particular challenge where the infrastructure lies outside the mining concession and is not subject to formal company legal ownership. Companies typically attempt to resolve such issues via their corporate social responsibility or external affairs departments, with little support from government.
1.2. Forests: An introduction
1.2.1. What Is a Forest?
Definitions of forests vary greatly according to whether they are seen in ecological, economic, political, or cultural terms, with over 1,500 definitions documented (Chao 2012). This report uses the FAO definition of a forest because it is the one for which data are most readily available. The FAO defines a forest as any land spanning more than 0.5 hectares with trees higher than 5 meters and a canopy cover of more than 10 percent. The definition is driven both by the presence of trees and the absence of other land uses and therefore includes areas of mangrove, bamboo, palm, rubber wood, cork, and even Christmas tree plantations, but it excludes other tree-based agricultural production systems, such as oil palm, fruit trees, and most agroforestry (FAO 2015). While the FAO definition is the dominant definition of forest, it does have its limitations, particularly drawing criticism for its inclusion of plantation forests (Jones 2017). Furthermore, the FAO definition is informed primarily by economic timber production as opposed to ecosystem services, landscape management, socioeconomics, or any of the other potential objectives for forest management (Chazdon et al. 2016).
1.2.2. The Value of Forests to Society
Forests and the services they provide are crucial to human development and well-being and are expected to play a role in the delivery of all 17 Sustainable Development Goals (CIFOR 2016; United Nations 2014).
6 FOREST-SMART MINING
To begin with, forests are an important source of cash income, particularly in developing countries where forests are the second-largest source of income. In Africa, an estimated 11 percent of the population is lifted above the poverty line due to income from forest resources (Angelsen et al. 2014). Income from the formal forest sector, which is dominated by timber production but also includes fuelwood and non-timber products, totals about $600 billion a year, or just under 1 percent of the global economy (FAO 2014). Other forms of formal income from forests include payments for ecosystem services, including from REDD+, but these still represent a fairly small fraction of income. In 2016, the value of carbon credits from forestry and land use projects was just $67 million (Ecosystem Marketplace 2017). Outside the formal economy, an estimated $33 billion a year is generated from fuelwood and charcoal and $88 billion from non-timber products, including plant products, animal products, and medicines, although these are likely to be substantial underestimates (FAO 2014).
The primary service forests provide with recognized economic value is timber production. Timber contributes about $600 billion per year to the global economy, or about 1 percent of gross domestic product, supporting the employment of about 50 million people (World Bank 2016c). Other services may also have economic value locally but are more likely to go unrecognized because they occur in the informal economy. These include the provision of a variety of non-timber forest products such as fuel, food, building materials, or medicines. But forests are also an important source of noncash income, which can represent half of total income in developing countries. This includes income from food, animal feed, building materials, fuel, and medicine (Angelsen et al. 2014).
Forests also therefore represent an important source of employment. The formal forest sector employs over 13 million people, with a further 40 million employed in the informal sector and another 840 million using forests to collect fuelwood (FAO 2014). This can be compared to the 3.7 million employed in the formal mining sector (Miningfacts.org 2012).
Forests also provide services that are much harder to quantify economically but may hold immense value. These include a range of supporting or regulating services, such as water provision, watershed management, flood control, carbon sequestration, soil fertility, and climate change resilience. For example, forests are an important safety net for rural communities in times of economic stress. Even if people do not rely primarily on services from forests, the option to fall back on them in times of crop failure, commodity price crashes, or weather shocks
can be important in certain circumstances (Wunder et al. 2014; Noack et al. 2015; Angelsen and Dokken 2015).
The biodiversity of forests represent an underlying value that is particularly difficult to quantify economically. Forests are extremely biodiverse, with tropical forests alone estimated to hold half of all known species (Secretariat of the Convention on Biological Diversity 2001). Evidence for the extent to which biodiversity is linked to the ecosystem services biological systems provide is growing and the link between biodiversity and resilience is widely accepted (Thompson et al. 2009; Oehri et al. 2017).
As a result, a large number of people depend on the products, services, and employment forests generate, particularly in developing countries. However, quantifying this is challenging. Most attempts to quantify reliance are based on the numbers of people living in and around forests. The most recent estimate suggests about 1.3 billion people, or a fifth of the global population, live in or near forests and obtain direct or indirect benefits, including some 300–350 million indigenous people who depend almost entirely on forests (Chao 2012). However, this estimate is disputed and the FAO has suggested the number could be closer to 750 million (FAO 2014).
1.2.3. How Much Forest Is There and How and Why Is It Changing?
Forests cover a major portion of the planet. In 2015, forest area (defined by the FAO as land designated as forest, not necessarily land with trees on it) covered just under 4 billion hectares, or approximately a third (30.6 percent) of the global land area. Ninety-three percent of this is defined as natural forest and the remaining 7 percent is planted forests. Most of the world’s forests are in high-income countries, followed by upper-middle-, lower-middle-, and low-income countries. Most natural forest is in Europe (although 81 percent of the continent’s forest area accounts to the Russian Federation), followed by South and then America (CIFOR 2016; United Nations 2014).
The FAO measures changes in forest status over time through indicators of total area and composition, levels of sustainable forest management, ecological integrity and biodiversity, and economic and social benefits. Together, these give a picture of falling forest cover and quality, particularly in the tropics, with potentially severe implications for the people that rely on them. Total forest area has been falling for many decades, with forest composition changing from natural to planted forest and degradation increasing, but rates of change vary over time, geography, and economic status. Net
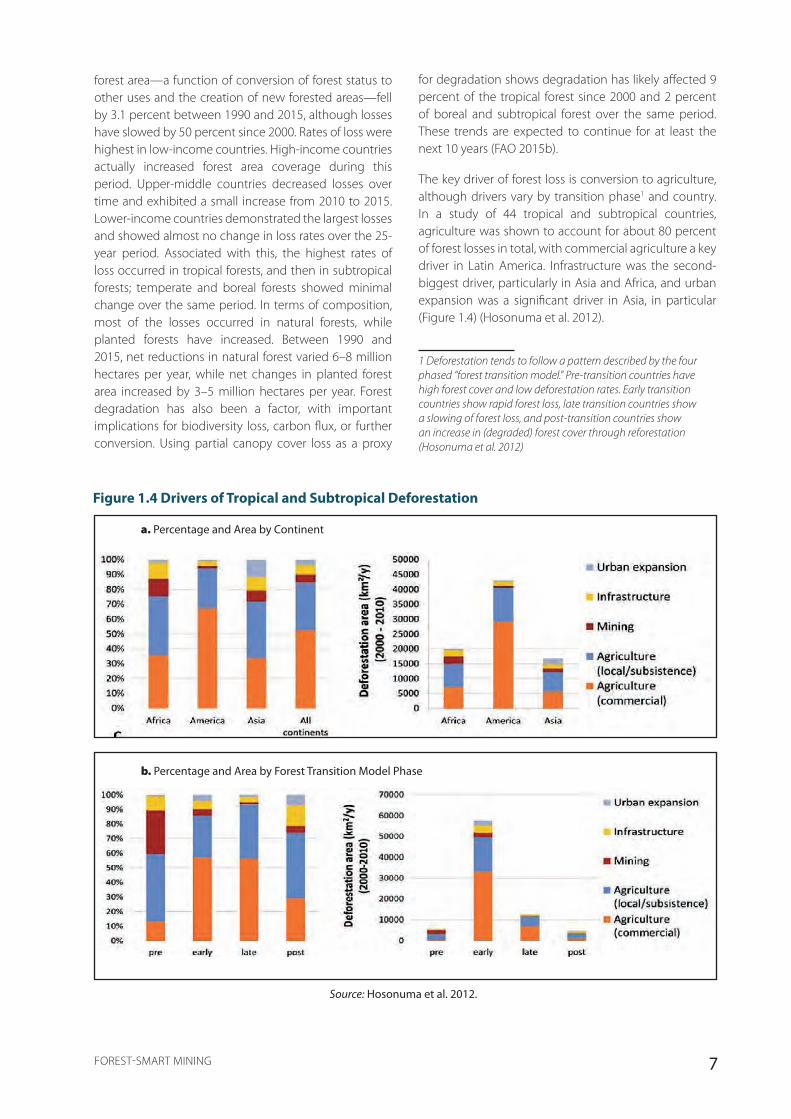
7FOREST-SMART MINING
forest area—a function of conversion of forest status to other uses and the creation of new forested areas—fell by 3.1 percent between 1990 and 2015, although losses have slowed by 50 percent since 2000. Rates of loss were highest in low-income countries. High-income countries actually increased forest area coverage during this period. Upper-middle countries decreased losses over time and exhibited a small increase from 2010 to 2015. Lower-income countries demonstrated the largest losses and showed almost no change in loss rates over the 25-year period. Associated with this, the highest rates of loss occurred in tropical forests, and then in subtropical forests; temperate and boreal forests showed minimal change over the same period. In terms of composition, most of the losses occurred in natural forests, while planted forests have increased. Between 1990 and 2015, net reductions in natural forest varied 6–8 million hectares per year, while net changes in planted forest area increased by 3–5 million hectares per year. Forest degradation has also been a factor, with important implications for biodiversity loss, carbon flux, or further conversion. Using partial canopy cover loss as a proxy
for degradation shows degradation has likely affected 9 percent of the tropical forest since 2000 and 2 percent of boreal and subtropical forest over the same period. These trends are expected to continue for at least the next 10 years (FAO 2015b).
The key driver of forest loss is conversion to agriculture, although drivers vary by transition phase1 and country. In a study of 44 tropical and subtropical countries, agriculture was shown to account for about 80 percent of forest losses in total, with commercial agriculture a key driver in Latin America. Infrastructure was the second-biggest driver, particularly in Asia and Africa, and urban expansion was a significant driver in Asia, in particular (Figure 1.4) (Hosonuma et al. 2012).
1 Deforestation tends to follow a pattern described by the four phased “forest transition model.” Pre-transition countries have high forest cover and low deforestation rates. Early transition countries show rapid forest loss, late transition countries show a slowing of forest loss, and post-transition countries show an increase in (degraded) forest cover through reforestation (Hosonuma et al. 2012)
Figure 1.4 Drivers of Tropical and Subtropical Deforestation
a. Percentage and Area by Continent
b. Percentage and Area by Forest Transition Model Phase
Source: Hosonuma et al. 2012.

8 FOREST-SMART MINING
1.3. Mining in Forests and Forest-Smart Mining
1.3.1. Impacts of Large-Scale Mining on Forests
Globally, mining represents the fourth-largest driver of forest loss (Figure 1.4). The impacts of mining occur particularly during the pre-transition phase (although this is partly due to the influence of some resource-rich, high forest cover countries such as the Democratic Republic of Congo and Guyana), and impacts are higher in Africa and Asia than in Latin America (Hosonuma et al. 2012). However, these data refer to the direct impacts of mining on forest cover; they do not necessarily pick up indirect impacts, or impacts on forest ecology.
The mechanisms through which mining can impact forests are varied and dependent on mine type and context. They can broadly be classed into direct, indirect, and cumulative impacts.
The clearest direct impacts are those caused by forest clearance to make room for the mine footprint itself (including waste deposits, processing plants, and so on) and associated infrastructure, such as roads and railway lines (Funi and Paese 2012). This can result in considerable loss of forest cover, constituent biodiversity, and associated ecosystem services, and ultimately it impacts on the livelihoods of local communities dependent on these resources. The level of direct impacts will depend on the scale of the operation and the mineral commodity being mined, with the affected area ranging from less than 1 square kilometer to several thousand square kilometers (Edwards et al. 2014). High-volume, low-value bulk minerals such as iron ore, in particular, require larger and different infrastructure than do low-volume, high-value minerals such as diamonds and gold.
A second direct impact might include the displacement of forest-dwelling people. The large areas of land needed for the project site as well as for ancillary services—including land for worker accommodations, offices, and roads, pipelines, railway lines, electricity transmission corridors, water supply dams, and so on—can lead to the need to resettle hundreds if not thousands of people. Being displaced and/or resettled can be very traumatic for people, disrupting their sense of place, their livelihoods, their social networks and community connectedness as well as their access to forest-based services. Resettlement is a major cause of human rights risks for companies. However, where projects are genuinely committed to a shared value proposition, the emotional distress from physical and economic displacement can be minimized and many livelihood benefits can be created when resettlement processes are effectively implemented (Vanclay et al. 2015).
However, the immediate, relatively local direct environmental and social impacts of mining within the mine footprint may be dwarfed by the potentially far more wide-ranging indirect impacts of mining infrastructure and socioeconomic change.
The impacts of associated infrastructure can be far greater than just the direct clearance of forest. The expansion of roads and railways, often along predefined “growth corridors,” represents one of the biggest threats to natural habitats and wildlife populations and increases access to some of the world’s most biodiverse ecosystems (Blake et al. 2007; Laurance et al. 2008). Mining roads can encourage major movements of populations into hitherto sparsely populated regions with concurrent increased pressures from land clearing and bushmeat hunting for local consumption, a phenomenon dubbed the “Pandora’s Box Effect” (Laurance, Goosem, and Laurance 2009; Wilkie and Carpenter 1999; Brashares 2004). In the Brazilian Amazon, for example, 95 percent of all deforestation and fires occur within 50 kilometers of highways or roads. In Suriname, most illegal gold mining operations are located near roads, whereas in tropical Africa, hunting intensity is so elevated near roads that it strongly affects the large-scale distribution of forest elephants, buffalo, duikers, primates, and other exploited species. Roads can also increase trade in bushmeat and wildlife products; for example, on average, eight killed mammals were transported per hour along a single highway in Sulawesi, Indonesia (Laurance, Goosem, and Laurance 2009). Dust, heavy metals, nutrients, ozone, and organic molecules are often elevated within 10–200 meters of road surfaces. Lead pollution from car exhausts can be especially problematic, particularly in developing nations that still allow leaded gasoline (Isac, Kruger, and Pascoletti 2014; Laurance, Goosem, and Laurance 2009). Effects of chemical pollutants and nutrient runoff are likely to be especially serious for streams and wetlands near roads, with major pulses of waterborne pollutants and nutrients entering aquatic ecosystems with heavy rains at the onset of the wet season. Such contaminants can have wide-ranging effects: for example, many aquatic invertebrates and vertebrates are sensitive to water pollution; waterborne nutrients can promote harmful eutrophication; and heavy metals are often biomagnified in aquatic food chains (Laurance, Goosem, and Laurance 2009).
Indirect impacts also include those related to induced in-migration of people into mining areas seeking employment and economic opportunities, resulting in forest loss, increased hunting, poaching, and land conversion to agriculture and urban use; and increased access for logging of timber and removal of non-timber forest products (Durán, Rauch, and Gaston 2013). As roads cut into previously inaccessible forests, they pave
9FOREST-SMART MINING
the way for an influx of both commercial bushmeat hunters to supply major urban centers and foreign labor, and wildlife traders, who supply the international trade in pets, ivory, or medicinal products, resulting in major extinction threats to many large mammals and traded species (Wilkie and Carpenter 1999; van Vliet et al. 2014; Stiles 2011; Maisels et al. 2013; Luiselli et al. 2016; Price and Gittleman 2007).
For a full overview of potential direct and indirect impacts across the mine life cycle, see Table A.2 in appendix A.
1.3.2. Ecological Ramifications of Mining-Related Forest Impacts
The impacts of mining on forests are not only restricted to changes in total forest cover. Because they are complex ecological systems, forests can respond in a variety of way to different impacts.
For example, edge effects are diverse physical and biotic changes associated with the often-abrupt verges of forest clearing, roads, and linear clearings, and are particularly important in tropical rain forests. Various edge-related changes in forest structure, microclimate, and forest dynamics have been observed near linear clearings in the Amazon, the Caribbean, and tropical Australia. Forests within 50–100 meters of edges experience greater diurnal fluctuations in light, temperature, and humidity, being typically drier and hotter than forest interiors, with elevated tree mortality, numerous canopy gaps, and a proliferation of disturbance-adapted vines, weeds, and pioneer species. Such changes can alter the community composition and abundance of many different faunal groups (Laurance, Goosem, and Laurance 2009).
Clearing for roads and highways using a cut-and-fill approach can also have knock-on effects. Unless frequent culverts are installed, filled areas impede drainage, especially in tropical regions that receive heavy wet season rainfall. This can lead to extensive flooding on the upstream side of the road, killing large patches of inundated vegetation. On the downstream side of road fills, water flow can be impeded, causing small streams to fail and desiccation stress to vegetation, especially during the dry season. Roadcuts and local sand- and gravel-quarrying operations can also be major sources of erosion and stream sedimentation (35–500 tonnes hectares per year), further impacting aquatic ecosystems and biota and increasing the likelihood of landslides (Laurance 2015; Laurance, Goosem, and Laurance 2009). Finally, roads can alter natural disturbance regimes: in fire-maintained tropical woodlands and savannas, for example, roads can create artificial firebreaks, leading to a proliferation of mesic vegetation at the expense of fire-adapted species (Forman et al. 2003; Barber et al. 2014).
Some species suffer heavy mortality near roads from vehicle road kill, elevated predation, or human hunting. If such effects are strong enough, the road could become a population sink, contributing to local extinctions of species. Species that are rare, such as apex predators and large-bodied mammals and birds, and that require large home ranges or have low reproductive rates are generally most vulnerable to elevated mortality. Paradoxically, although narrow forest roads facilitate road-crossing movements by animals, they also lead to greater road kill. Road-related mortality can occur over varying spatial scales. Mortality from road kill and predation are generally limited to the road surface or adjoining road verges (Coffin 2007).
Forest species are especially vulnerable to mining-related impacts such as linear infrastructure and forest clearing because they include many ecological specialists that avoid even narrow (less than 30 meters wide) clearings and forest edges, as well as other species that are susceptible to road kill, predation, or hunting by humans near roads. In addition, roads have a major role in opening up forested tropical regions to destructive colonization and exploitation. In broad terms, roads can be thought of as the enemies of rain forests. Although essential in many cases for human activities and economic development, poorly planned or excessive road expansion can result in irreparable damage to or destruction of forests. Roads that penetrate into remote frontier regions often lead to forest encroachment and destruction. Paved highways are particularly damaging because they tend to spawn networks of secondary roads that can increase the spatial scale of their impact (Laurance, Goosem, and Laurance 2009).
Linear clearings can also facilitate species invasions in the tropics—for example, fire ants (Wasmannia auropunctuta), exotic earthworms, and non-forest vertebrates; fungal dieback, caused by Phytophthora spp.; and myriad weed species. Repeated spraying, burning, or mowing of vegetation in linear clearings favors exotic and disturbance-adapted species at the expense of native species. Road-borne invaders affect not only native biota in the tropics. In Ecuador, for example, levels of human enteric pathogens were two to eight times higher in villages near roads than in more remote areas. Likewise, increased incidences of dengue fever, malaria, and HIV have been reported in people living near roads in India, Brazil, and Uganda, respectively. By facilitating invasions of novel and potentially lethal pathogens, roads penetrating into remote frontier areas also pose a threat to indigenous groups attempting to live with limited or no contact with outsiders (Laurance 2015).
10 FOREST-SMART MINING
1.3.3. The Importance and Definition of a “Forest Smart” Approach to Mining
The importance and growth of mining and the importance and loss of forests mean that we need to ensure future mining in forest landscapes is “forest smart.” PROFOR defines forest smart as “a development approach that recognizes forests’ significance for sustaining growth across many sectors, including agriculture, energy, infrastructure, and water. It is sustainable and inclusive in nature, emphasizing that forests are part of a broader landscape and that changes in forest cover affect other land uses as well as the people living in that landscape. It transforms how sectors operate by identifying opportunities for mutual benefit and creating practical solutions that can be implemented at scale” (PROFOR 2016).
Mining best practice, where relevant to forest, generally refers to the avoidance and/or minimization of direct negative impacts and the creation and/or maximization of positive impacts on forest cover or select forest species. A forest-smart approach to mining needs to go beyond this. A forest-smart approach to mining needs to consider the following:
• The full range of impacts that mining can have on forests, not only direct but also indirect and cumulative impacts
• The full range of environmental consequences of these impacts, not only changes in forest cover or key species, but also wider ecological composition, structure and function—and including recognition of the whole gamut of biodiversity and of the ecosystem services that flow from this, from timber and medicine to greenhouse gas emissions and flood defenses to cultural and spiritual values
• The full range of people impacted by the environmental changes, particularly lower-income communities with higher reliance on forest services
To achieve this, a forest-smart approach needs to be carried out at the appropriate landscape level that includes the following:
• The full range of habitat types present in the landscape and the way each part interlinks with the forest
• The full range of sectors operating in the landscape, not only other large-scale or small-scale mining concerns but also other industries
• The full range of time scales over which interactions can occur
1.4. Policy and Regulatory Landscape for Forest-Smart Mining
A variety of frameworks already exist at the global, national, and industry levels that could be used to promote forest-smart mining. The key frameworks are explored below, but they are covered in more detail in appendix B.
1.4.1. Global Policy Frameworks
Of the global frameworks, the Sustainable Development Goals, the UN Convention on Biological Diversity, and the UNFCCC Paris Climate Agreement represent the key agreements. Adopted by 193 member states, the 17 social and environmental SDGs provide the best picture of the integrated development pathway the global population desires (United Nations 2015). The mining sector has a potential impact on all 17 SDGs, either positively or negatively, with specific impacts identified for 71 of the 169 targets (Columbia Center on Sustainable Development et al. 2016).
The legally binding Convention on Biological Diversity, signed by 196 parties, each of whom have set national strategies and action plans, best illustrates what the global population wants in terms of biodiversity, including forests (CBD 2010b). The focus of the convention until 2020 is set by the 20 Aichi Biodiversity Targets, which include a commitment to halve forest loss rates and to restore 15 percent of degraded ecosystems, potentially representing both a risk and an opportunity to mining companies in terms of legislation or in terms of helping countries meet international commitments (CBD 2010a). The Aichi Targets are also captured within the SDGs (CBD 2015).
The UNFCCC Paris Agreement focuses specifically on climate change targets, committing to keeping global average temperature to 2°C above preindustrial levels and to increase the ability of countries to adapt to the adverse impacts of climate change (UNFCCC 2015). As of June 2017, 148 countries of the 197 Parties to the Convention have ratified the agreement (UNFCCC 2017). The protection and enhancement of forests as a means of contributing to the aims is recognized in Article 5. Specifically, it calls for action to conserve and enhance sinks and reservoirs of greenhouse gases, including forests, and encourages action to implement and support “policy approaches and positive incentives for activities relating to reducing emissions from deforestation and forest degradation, and the role of conservation, sustainable management of forests and enhancement of forest carbon stocks in developing countries” (UNFCCC 2015).

11FOREST-SMART MINING
A key mechanism within the UNFCCC is REDD+ (Reducing Emissions from Deforestation and Degradation, the “+” referring to sustainable management of forests, conservation of forest carbon stocks and enhancement of forest carbon stocks). REDD+ has been a major policy instrument under the UNFCCC since 2005, focused on developing countries, although arguably it has yet to fulfill the potential first promised. The basic mechanism is the provision of compensation to countries and local forest users in return for reducing emissions from deforestation. Alongside emissions reduction, REDD+ activity can bring socioeconomic benefits and biodiversity protection. A frequent positive impact of REDD+ is in the clarity of land tenure for forest users and surrounding communities, which can bring many corollary socioeconomic benefits. Critics of REDD+ point to the technical issues and the manner and equity of the compensation provided. A major complaint is that REDD+ can provide cheap offset payments to allow unsustainable “business as usual” for damaging activities.
The potential impacts, direct and indirect, of large-scale and small-scale mining on forests already discussed mean REDD+ is potentially a highly relevant policy tool for forest-smart mining. However, the complexities of identifying and addressing these impacts is often caught up in cross-sectoral policy issues across forestry, agriculture, community development, and financial and broader economic issues, and previous efforts have had mixed responses. REDD+ programs at the national and project levels do frequently note the impacts of small- and large-scale mining on emissions and on deforestation in general, but activities initiated in response tend to focus on the agriculture and forestry sectors, where emissions tend to be higher. However, mining companies are increasingly looking at offsetting the environmental (and social) impacts of their activities, such as broader sponsorship of biodiversity offsets in line with the increasingly accepted mitigation hierarchy, albeit with mixed results (Phalan et al. 2017; Pilgrim et al. 2013). REDD+ carbon credits as gained through a range of accreditation bodies are particularly attractive for this purpose, but they can be an easy option for a “greenwash” (Lang 2011). Operations can also be associated with the specific development of a related REDD+ activity associated with a given mining site. For countries with a significant mining industry and a well-developed REDD+ policy framework, REDD+ has the potential to be an important tool in promoting forest-smart mining (Hirons 2013). There is already evidence in some countries that the introduction of REDD policies are reducing the impacts of large-scale mining on forests, despite that not being a stated objective (Laing 2015). Studies have assessed the viability of using REDD to mitigate mining forest impacts, concluding that there is clear potential,
but it is associated with various complex challenges around tenure, further alienation of communities, the legitimization of business as usual, cross-sectoral coordination, leakage, and corruption (Hund, Schure, and van der Goes 2017; Schure 2015). To fully realize the benefits of REDD to drive a more forest-smart mining sector, action needs to occur at a coordinated national level; isolated activities by individual companies are not expected to be effective (Schure 2015). To this end, initial steps have been taken to design REDD+ standards specifically for the extractives industry (Hund, Schure, and van der Goes 2017). However, on a global basis, REDD+ is a widely underused tool in the drive toward forest-smart mining (see Box 1.1).
Other global frameworks of relevance include the following:
• UN Global Compact – The world’s largest corporate sustainability initiative with over 12,000 participants (8,000 of which are companies) across 170 countries signing up to 10 social and environmental principles guided by the SDGs, including 186 mining companies (UN Global Compact 2017).
• 2011 Bonn Challenge – A global initiative to bring 150 million hectares of the world’s deforested and degraded land into restoration by 2020, and 350 million hectares by 2030 (IUCN and Bonn Challenge 2017).
• 2014 UN Climate Summit New York Declaration on Forests – A non-legal binding political declaration endorsed by 190 governments, companies, and civil society groups to conserve, restore, and sustainably manage forests, including a target to cut natural forest loss in half by 2020 and strive to end it by 2030 and to restore 150 million hectares of degraded land by 2020 with an additional 200 million hectares by 2030 (UNDP 2014). No mining companies were signatories at the time of writing this report; however, financiers who invest or lend to the mining sector are signatories as are national governments of countries where mining is an important sector.
• International Union for Conservation of Nature (IUCN) – The IUCN is a membership union of government and civil society organizations that holds a World Conservation Congress every four years during which a series of motions (recommendations and resolutions) are passed by the membership. In 2016, 11 of the 112 motions passed had direct relevance to forest-smart mining, including calls to strengthen protected area networks; identifying and ensuring protection of forest genetic diversity, to maintain intact forest landscapes; to make the value of

12 FOREST-SMART MINING
forests clearer to people; to ensure the application of the mitigation hierarchy for projects considering biodiversity offsets; and to strengthen business reporting to include more clearly their impacts and dependencies on biodiversity both directly and indirectly. The relevant motions are summarized in appendix B (Table B.2).
Box 1.1 REDD+ and Mining in the Democratic Republic of Congo
The Democratic Republic of Congo ranks 176th out of 188 countries on the Human Development Index (UNDP 2016), making it one of the least developed countries in the world. The DRC was among the first to become involved in the REDD+ program in 2005, under the United Nations Framework Convention on Climate Change, and is a pioneer in developing REDD+ policies. This includes policies addressing their rapidly growing mining sector operating within the country’s approximately 152.6 million hectares of forest cover (Hund, Schure, and van der Goes 2017).
Mining is a large driver of deforestation in Africa, and the mining sector is expected to grow within the Congo Basin in the coming decades. The DRC’s Readiness Preparation Program, created in 2010, found a high opportunity cost was associated with replacing or reducing mining activities, but put forward methods to mitigate mining impacts on forests. The importance of these mitigation methods was emphasized when a 2014 assessment found that 24 percent of the DRC’s intact forest is covered by mining permits, demonstrating a real danger to forest conservation (Hund, Schure, and van der Goes 2017). Another study found a 21 percent increase in mining exploitation permits overlapping with REDD+ projects in the DRC over the past two years, showing the conversion from exploration to exploitation permits occurring (Open Mai-Ndombe 2016)
The development of the REDD+ Standards in 2014 for the mining sector in the DRC was part of a World Bank initiative funded by the Norwegian government, and these REDD+ Standards were included in the
DRC’s Economic Governance Matrix (Hund, Schure, and van der Goes 2017). The Economic Governance Matrix provides reforms the DRC’s government will implement with periodical review, with progress in these reforms a condition for financial assistance by the World Bank (Schure 2015). The standards are founded on the basic principles of REDD+ and draw from international standards such as the IFC Performance Standards to address gaps in national legislature and demonstrate how the extractives industry can help to achieve national REDD+ objectives, with a no net loss of forest as the goal (Hund, Schure, and van der Goes 2017).
In 2014, the DRC adopted their national REDD+ Strategy Framework, which includes mitigating the potential impact from future infrastructure for LSM and ASM mines in the Congo Basin. This REDD+ strategy has stated its expectation that extractive activities will increase in the forest due to the numerous exploration permits already granted (Schure 2015), and it has given specifications on possible effective mitigation measures and financial compensation that could be injected back into the REDD+ program to fund more REDD+ activities. These measures include the clarification of legal status of land rights, imposed reforestation after extraction, and an enforced benefit-sharing mechanism (Hund, Schure, and van der Goes 2017). The process of developing the REDD+ Standards that focus on extractives activity in the DRC could be applied to other countries with significant natural reserves in forested areas looking to develop their own REDD+ strategies. Lessons on monitoring REDD+ projects could also be gained from the DRC, where a registry for tracking financing to their national REDD+ program is being implemented (Maniatis et al. 2017).
1.4.2. National and Regional Policy Frameworks
Mining companies and investors in mineral projects can choose between numerous countries when determining where and how to operate and invest. Thus, countries interested in developing their mining
sector by being open for major foreign investments need to achieve a balance between enabling measures that promote exploration and those that attract investments with restrictive measures that limit and control the possible negative impacts that mining may bring (Baldwin and Cave 1999). Further, such measures must also be associated with measures that ensure

13FOREST-SMART MINING
meaningful stakeholder engagement processes, which can contribute to mining achieving a wider social acceptance and support (Tarras-Wahlberg et al. 2017). The national institutional and regulatory frameworks for mining that aim to achieve the abovementioned differ significantly between countries. However, some general patterns may nevertheless be discerned as described below, and a single example of a regional approach is presented in Box 1.2.
Natural resources may be either state or privately owned. The most common situation is that less valuable minerals are owned by landholders, whereas precious minerals and metals and forests are owned and/or controlled by the state. The state then issues rights and/or concessions for exploration and/or extraction. State control allows for rights for exploration and mining to be provided over privately held land even in the case where the owner opposes such an activity. Further, state ownership allows the proceeds from extraction (taxes, royalties) to be readily distributed across a nation. The state must then ensure that such projects are on balance in the best interest of the nation, and this necessarily will involve a complex process of evaluation impacts and benefits. Some common law countries retain extensive private ownership of minerals, as is the case on non-federal land in the United States (Campbell 1956).
Environmental issues in mining are usually controlled by the authorities in two interlinked processes. First, companies apply for the rights to explore and/or mine, and then they apply for an environmental permit. For the permit, an environmental (and social) impact assessment (EIA/ESIA) process is the main regulatory tool used. However, various issues limit their effectiveness: for one, only the direct footprint of a mining operation and its ancillary infrastructure are generally assessed, ignoring the secondary impacts on forest invasions, hunting, land speculation, and secondary road expansion (Laurance, Goosem, and Laurance 2009; Gough, Innes, and Allen 2008). Evidence suggests that even when ecological damage is anticipated and a corresponding loss of livelihoods occurs, local communities tend to enter into negotiations that focus on employment opportunities, economic compensation, small local business promotion, and the implementation of social development projects (Arellano-Yanguas 2013). On top of this, the integrity of the ESIA process in presenting the risks associated with loss of ecological health are often not well presented or transparent, and the health and welfare impacts associated with the development are inadequately addresses. A core issue associated with environmental assessment practice relates to inadequate compliance with, and poor timing in the application of the mitigation hierarchy (MH) (see Box 1.3). While there has been considerable uptake of the
MH as a framework for alleviating environmental harm from development projects (for example, in policy and legislation, major mining and oil and gas industries, major multilateral finance institutions), MH application on the ground continues to be inconsistent, patchy, and with inadequate attention to impact avoidance. Moreover, the extent to which the MH is being internalized and applied across sectors (beyond mining and oil and gas), notably infrastructure, agriculture, and forestry, has received more limited attention. Sectoral bias (due in part to the perception of nonapplicability) and the absence of integrated land use plans has also limited the extent to which the application of the MH has been considered and applied across multiple sectors operating within a given landscape (P. Howard, pers. expertise). Obtaining a within-mine EIA framework of international standard is thus an immediate key challenge.
Box 1.2 African Mining Vision
The Africa Mining Vision (AMV)a was adopted by African Union heads of state in 2009. The AMV is a holistic initiative for mining sector development. It strives to assist countries in better integrating mining into development policies at the local, national, and even regional levels. An explicit aim of the AMV is to suggest ways to address mining projects’ tendency to become enclaves, and to overall contribute to a situation where African countries can move from being exporters of raw materials to being more involved in associated manufacturing activities and knowledge-based services.
The AMV has a specific section on environmental and social impacts, including recommendations around impact assessments, the promotion of the ICMM, and encouragement to governments to address the impacts of ASM.
However, nearly 10 years after the AMV was launched, there are questions about the speed of implementation and whether the vision is achieving its goals, with only one country having fully adopted the framework. Various criticisms have focused on the environment and social section, pointing out the lack of guidelines on how to achieve its recommendations and also its underlying conflicts with national commitments on greenhouse gas emissions and the SDGs (Oxfam International 2017).
a. http://www.africaminingvision.org.

14 FOREST-SMART MINING
1.4.3. Industry-Level Frameworks
Much of the change happening around the mining-forest interface is actually being driven by the business sector, both by the mining sector itself and by those financing it. Such initiatives are increasingly being used by mining companies to help demonstrate that they are operating responsibly and by their financial backers to reduce investment risk; civil society actors may also use some schemes to hold mineral companies to account (Mori Junior, Franks, and Ali 2015).
Industry initiatives such as the International Council for Mining and Metals and the Cross-Sector Biodiversity Initiative have been established, which have an important role in defining best practice and driving improvements
in social and environmental performance in the mining sector, providing a common space for companies to share challenges and experience and to promote continuous improvement. Through these initiatives, principles have been set and practical guidance and tools have been produced to support good practice biodiversity and ecosystem service management (Gullison et al. 2015)—resources that are commonly referred to by the finance sector, among others.
Another approach has been the establishment of voluntary mining initiatives (principles, standards, certification schemes, guidelines, and so on). Some focus on different elements of responsible mining (for example, stakeholder relations, respect for indigenous
Box 1.3 The Mitigation Hierarchy and Biodiversity Offsets
The mitigation hierarchy is a set of four prioritized steps to alleviate environmental harm as far as possible through avoidance, minimization (or reduction), restoration of detrimental impacts to biodiversity, and finally offsetting any residual impacts that may remain. Biodiversity offsetting is only considered appropriate to address residual impacts after all efforts to avoid, minimize, and restore detrimental impacts have been applied.
This approach favors early awareness and action to proactively and efficiently achieve “no net loss” or a “net gain” to biodiversity. The mitigation hierarchy is now widely accepted as an approach for biodiversity conservation for sustainable development. To comply with IFC Performance Standard 6 and the performance standards of several other multilateral finance institutions, a project proponent must develop and verify the implementation of a mitigation hierarchy that complies with the standard.
1. Avoidance
Includes activities that change or stop actions before they take place, to prevent their expected negative impacts on biodiversity and decrease the overall potential impact of an operation (Hime 2012; BBOP 2012). For example, adjusting the location, scope, or timing of a development could avoid negative impacts to a vulnerable species or sensitive forest ecosystem. Avoidance not only makes good business sense—for example, by reducing later steps in the mitigation hierarchy—but is imperative for protecting the integrity of valuable and threatened biodiversity and ecosystem services.
2. Minimization
Measures that are taken to reduce the duration, intensity, extent, and/or likelihood of impacts that cannot be completely avoided (BBOP 2012). An example of a minimization measure would be improvement to the quality treatment of water outflows from mining areas, thereby reducing impacts on aquatic systems (Temple et al. 2012).
3. Restoration
Involves altering an area in such a way as to reestablish an ecosystem’s composition, structure, and function, usually bringing it back to its original (pre-disturbance) state or to a healthy state close to the original (BBOP 2012). This is a holistic process aiming to return an ecosystem to a former natural condition and to restore ecological function. Restoration is preferred to rehabilitation, which implies putting the landscape to a new or altered use to preserve a particular human purpose.
4. Biodiversity offsets
These are measurable conservation outcomes resulting from actions designed to compensate for significant residual adverse biodiversity impacts arising from project development and persisting after appropriate avoidance, minimization, and restoration measures have been taken (BBOP 2009). Biodiversity offsets are effectively a “last resort.” A biodiversity offset should be designed and implemented to achieve measurable conservation outcomes that can reasonably be expected to result in no net loss and preferably a net gain of biodiversity. A net gain is required in critical habitats—habitats with high biodiversity value, as defined by IFC (2012b).
15FOREST-SMART MINING
peoples, implementation of the UN Guiding Principles on Business and Human Rights, use of cyanide, management of water, application of the mitigation hierarchy, and so on); others specialize in particular mining sectors, such as gold (for example, the Conflict-Free Gold Standard), coal (for example, the Bettercoal Code), bauxite (for example, the Aluminium Stewardship Initiative Standards), steel (Responsible Steel), or tin (for example, the ITRI Tin Supply Chain Initiative). Some have been developed for particular groups, such as small-scale or artisanal miners (for example, the Alliance for Responsible Mining, Better Gold Initiative, Fairmined Standard for Gold and Associated Precious Metals). Others rank companies by performance, such as the Responsible Mining Index (RMF 2017). However, there is concern that initiatives are numerous but not comprehensive. The need for greater coherence, interoperability, cross-recognition, and consolidation of the array of minerals-based standards in particular has been highlighted (WEF 2016; Mori Junior and Ali 2016). Moreover, with the many recently established and emerging schemes, questions have been asked about the effectiveness of voluntary schemes in driving positive change (Mori Junior, Sturman, and Imbrogiano 2017; McCarthy and Morling 2015; Changing Markets Foundation 2018). Further details on three examples—the Initiative for Responsible Mining Assurance (IRMA), Aluminium Stewardship Initiative (ASI), and Standard for Sustainable and Resilient Infrastructure (SuRe)—as well as the way they impact ASM are covered in appendix B.3.
A third influence area has been the impact of financial sector environmental and social safeguards (ESS) (Chatham House 2015). Access to capital is an important driver for responsible mining (WEF 2016). Most of the major multilateral financial institutions (MFIs) have now developed ESS that set out their procedures for screening the environmental and social risk of the interventions they support and determining the level of assessment and mitigation or management that should be applied.2 Many, though not all, bilateral agencies have adopted safeguards systems, in some cases to comply with national legislation. IFC Performance Standard (PS) 1 (“Assessment and management of environmental and social risks and impacts”) and PS6 (“Biodiversity conservation and sustainable management of living natural resources”) are widely considered international best practice, with influence extending beyond IFC’s direct clients, including the following:
2 Including but not limited to the European Bank for Reconstruction and Development, European Investment Bank, African Development Bank, Asian Development Bank, Inter-American Development Bank, World Bank Group, and International Finance Corporation.
• Equator Principles – A risk management framework based on the IFC Performance Standards, as part of the lending approval process intended to “provide a minimum standard for due diligence to support responsible risk decision-making” (Chatham House 2015). As of June 2017, 90 Equator Principles financial institutions in 37 countries had officially adopted the Equator Principles (Equator Principles Association, n.d.).
• The evolution of performance standards and safeguards among other MFIs, both through their alignment with PS6 (World Bank 2016c) and/or deviation from PS6 (for example, in relation to core principles, scope, objectives, approach, preferred methods, and so on).
• The increasing adoption of no net loss objectives in national policy. Some government ministries have sought to align with PS6—for example, Liberia has established permitting conditions for mining projects (Johnson 2015).
• Voluntary standards for the mining industry commonly refer to or explicitly incorporate elements of the IFC Performance Standards, including PS6.
• Some companies have revised their internal policies to align with PS6 and/or are voluntarily applying PS6 as best practice.
In this way, the IFC Performance Standards and their future evolution have an important role to play in driving improvements in environmental performance in the LSM sector. It is worth recognizing, however, that such widespread influence also means that any potentially adverse effects resulting from the application of PS6 could be magnified, particularly where the understanding and interpretation of PS6 differs from its original intent and/or where PS6 is being adopted in part or isolation from the other standards. Further analysis of the ways other MFIs approach ESS and the extent to which they are harmonized is covered in appendix B.3. One of the key factors influencing the role of the finance sector and their respective ESS in supporting forest-smart mining will be implementation on the ground. Data deficiencies and capacity constraints have been cited as barriers to effective implementation and compliance monitoring, particularly when dealing with complex socio-ecological aspects, and will be a relevant concern in remote and unstudied forest ecosystems.
16 FOREST-SMART MINING
Inconsistencies in the interpretation and application of the ESS by practitioners and experts have also been highlighted (Howard and Jenner 2016), and in some cases the approaches and methodologies used to apply ESS risk undermining the integrity and viability of species and ecosystems affected by mining developments. The extent to which the finance sector can influence forest-smart approaches to mining will further be affected by the extent to which financial institutions are effective in applying their ESS and ensuring compliance. Failure to do so can result in or allow for poor planning, inadequate ESIAs, and high-impact mining projects. The timing and duration of their engagement with a project also has a bearing on environmental outcomes. Early engagement in the project cycle offers the best opportunity to influence the ESIA and prioritization of impact avoidance and minimization.
Finally, other industry initiatives of note include the following:
• The Global Reporting Initiative (GRI) aims to ensure that sustainability is part of business strategy and encourages companies to consider sustainability along their supply chains (Chatham House 2015). The GRI framework requires reporting on significant direct and indirect impacts for biodiversity with reference to species affected, extent of areas impacted, duration of impacts, and reversibility or irreversibility of impacts (GSSB 2016). Considerations relating to habitat conversion, reduction in species, and changes in ecological processes are explicit, but organizations are not required to report on all these aspects. Reporting requirements thus provide more limited insight into ecologically relevant aspects including, for example, functionally important species or habitats (for example, keystone species, ecosystem engineers) and processes (for example, connectivity).
• The Carbon Disclosure Project (CDP) is a global organization that asks companies, cities, states, and regions for data on environmental performance through a standardized reporting system. Critical environmental risks, opportunities, and impacts are analyzed and this information is made available to help investors, businesses, and policy makers in decision making, risk management, and identifying opportunities. The CDP’s forests program collects information relating to the four agricultural commodities responsible for most deforestation—timber, palm oil, cattle, and soy—and will soon be expanded to mining. The CDP’s latest publication, reflecting input from 187 companies, reports that $906 billion in annual corporate turnover is at risk because of deforestation (CDP 2016).
• Individual company commitments to integrating biodiversity and ecosystem services considerations into mining businesses vary widely. Compared to other sectors, relatively high numbers of mining companies have set “no net loss” or “net gain” goals, most including biodiversity (Rainey et al. 2015). However, the detail and quality of these goals varies considerably and so too has progress toward real outcomes on the ground (Rainey et al. 2015). One of the highest profile corporate commitments in recent years has been the number of companies signing up to zero (net) deforestation commitments, although these have been primarily those with agricultural commodity supply chains. According to recent analyses, 62 percent of companies (447 out of 718) with supply chains dependent on the commodities responsible for most deforestation (palm oil, timber and pulp, soy, and cattle) have made a total of 760 commitments to reducing deforestation impacts in their commodity supply chains (Donofrio, Rothrock, and Leonard 2017). Some of the largest companies are leveraging considerable influence by integrating deforestation considerations into decision making on spending of multimillion-dollar procurement budgets. Progress in fulfilling zero net deforestation commitments varies considerably: from no action at all to those making tangible steps forward, including, for example, putting in place robust policies for sustainable sourcing of forest risk commodities, improving traceability of their commodities, and procuring certified sustainable commodities (Bregman et al. 2016). The mining sector could learn lessons from these efforts in order to improve data collection and transparency in mineral supply chains and monitor the sector’s forest impacts (Chatham House 2015). To date, the mining sector has yet to make such corporate-level commitments to reducing or halting deforestation.
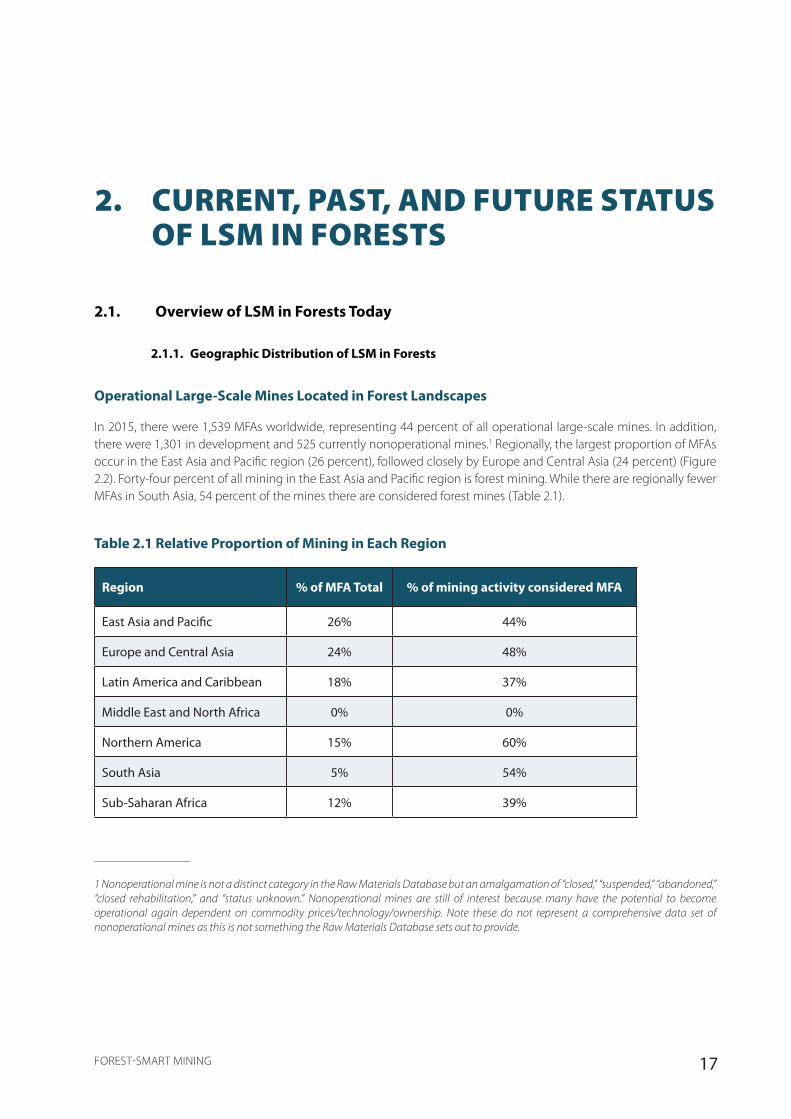
17FOREST-SMART MINING
2. CURRENT, PAST, AND FUTURE STATUS OF LSM IN FORESTS
2.1. Overview of LSM in Forests Today
2.1.1. Geographic Distribution of LSM in Forests
Operational Large-Scale Mines Located in Forest Landscapes
In 2015, there were 1,539 MFAs worldwide, representing 44 percent of all operational large-scale mines. In addition, there were 1,301 in development and 525 currently nonoperational mines.1 Regionally, the largest proportion of MFAs occur in the East Asia and Pacific region (26 percent), followed closely by Europe and Central Asia (24 percent) (Figure 2.2). Forty-four percent of all mining in the East Asia and Pacific region is forest mining. While there are regionally fewer MFAs in South Asia, 54 percent of the mines there are considered forest mines (Table 2.1).
Table 2.1 Relative Proportion of Mining in Each Region
Region % of MFA Total % of mining activity considered MFA
East Asia and Pacific 26% 44%
Europe and Central Asia 24% 48%
Latin America and Caribbean 18% 37%
Middle East and North Africa 0% 0%
Northern America 15% 60%
South Asia 5% 54%
Sub-Saharan Africa 12% 39%
________________
1 Nonoperational mine is not a distinct category in the Raw Materials Database but an amalgamation of “closed,” “suspended,” “abandoned,” “closed rehabilitation,” and “status unknown.” Nonoperational mines are still of interest because many have the potential to become operational again dependent on commodity prices/technology/ownership. Note these do not represent a comprehensive data set of nonoperational mines as this is not something the Raw Materials Database sets out to provide.
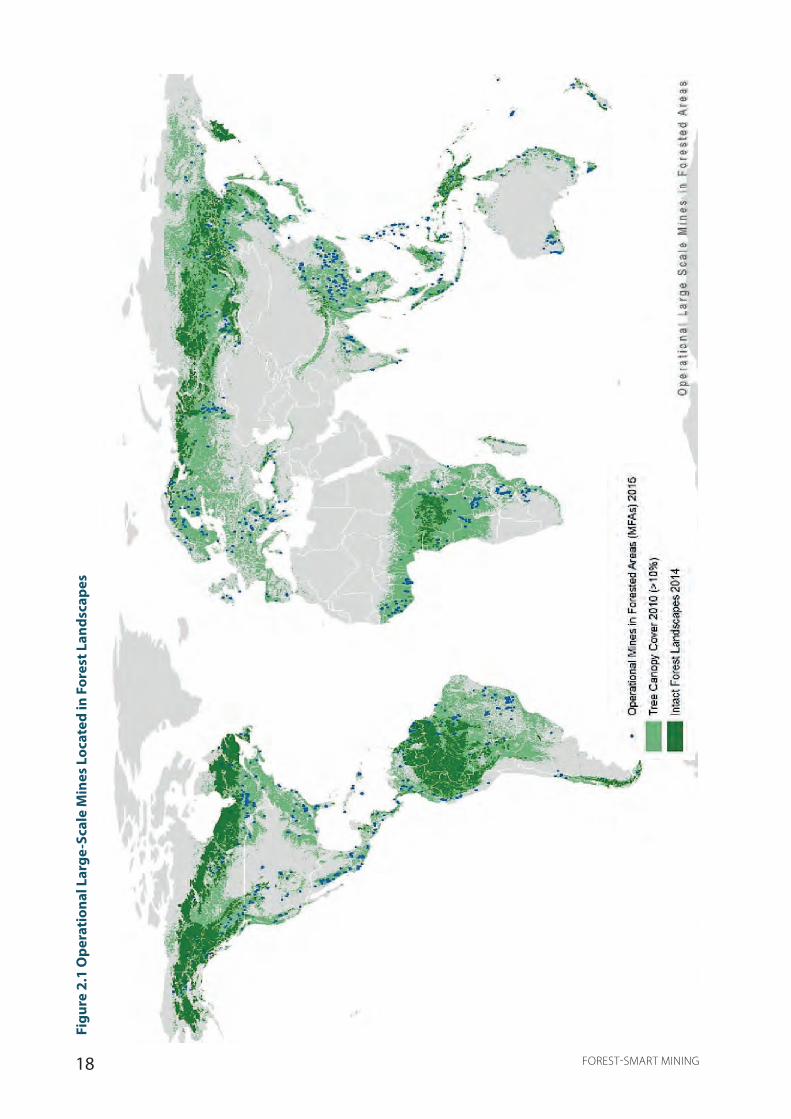
18 FOREST-SMART MINING
Figu
re 2
.1 O
pera
tion
al L
arge
-Sca
le M
ines
Loc
ated
in F
ores
t Lan
dsca
pes
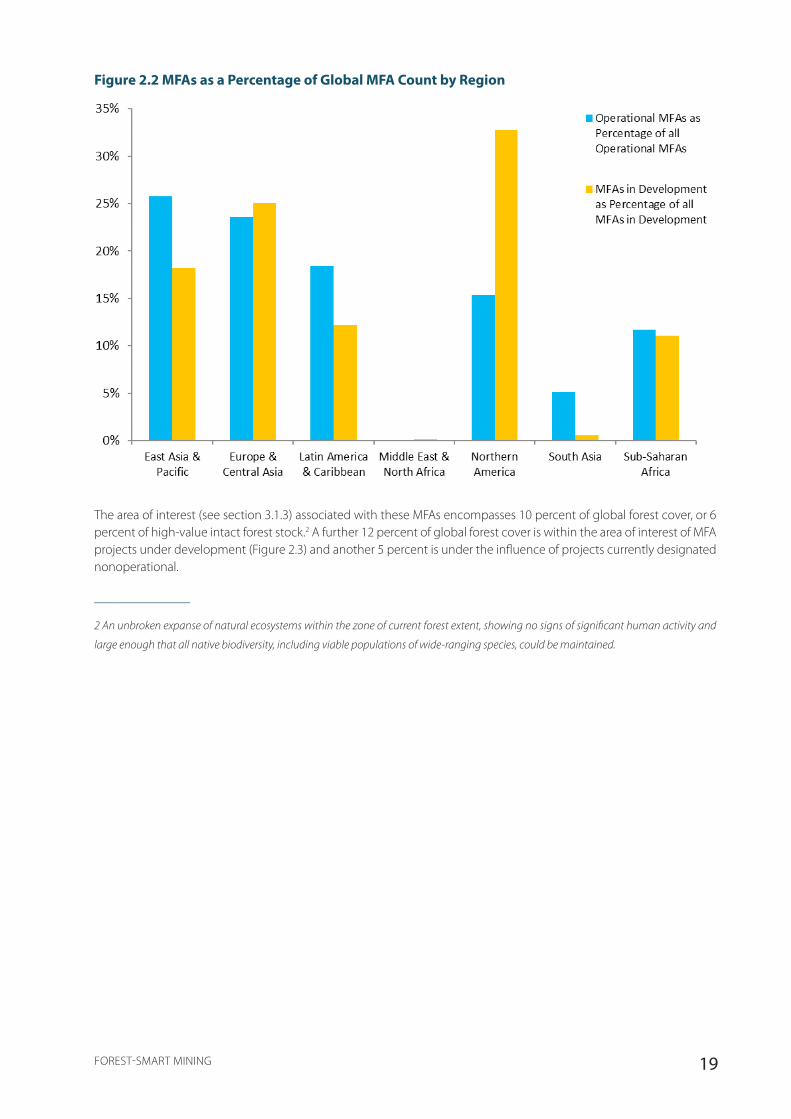
19FOREST-SMART MINING
Figure 2.2 MFAs as a Percentage of Global MFA Count by Region
The area of interest (see section 3.1.3) associated with these MFAs encompasses 10 percent of global forest cover, or 6 percent of high-value intact forest stock.2 A further 12 percent of global forest cover is within the area of interest of MFA projects under development (Figure 2.3) and another 5 percent is under the influence of projects currently designated nonoperational.
________________
2 An unbroken expanse of natural ecosystems within the zone of current forest extent, showing no signs of significant human activity and
large enough that all native biodiversity, including viable populations of wide-ranging species, could be maintained.
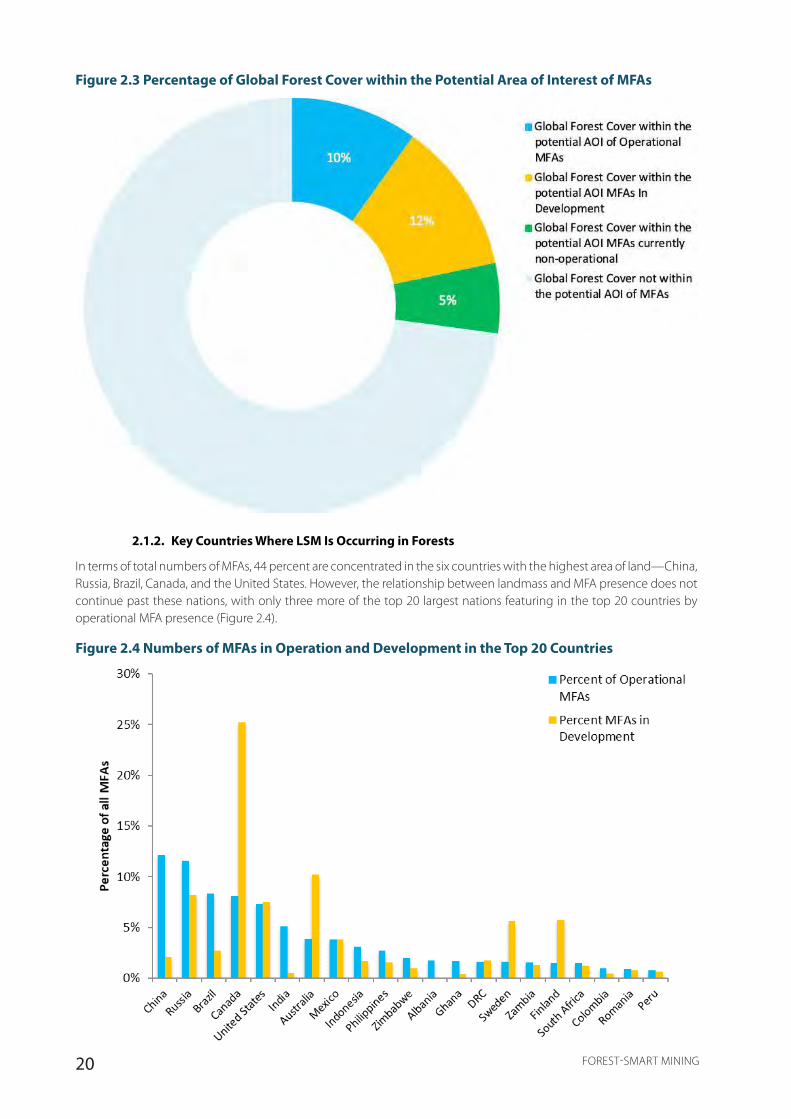
20 FOREST-SMART MINING
Figure 2.3 Percentage of Global Forest Cover within the Potential Area of Interest of MFAs
2.1.2. Key Countries Where LSM Is Occurring in Forests
In terms of total numbers of MFAs, 44 percent are concentrated in the six countries with the highest area of land—China, Russia, Brazil, Canada, and the United States. However, the relationship between landmass and MFA presence does not continue past these nations, with only three more of the top 20 largest nations featuring in the top 20 countries by operational MFA presence (Figure 2.4).
Figure 2.4 Numbers of MFAs in Operation and Development in the Top 20 Countries
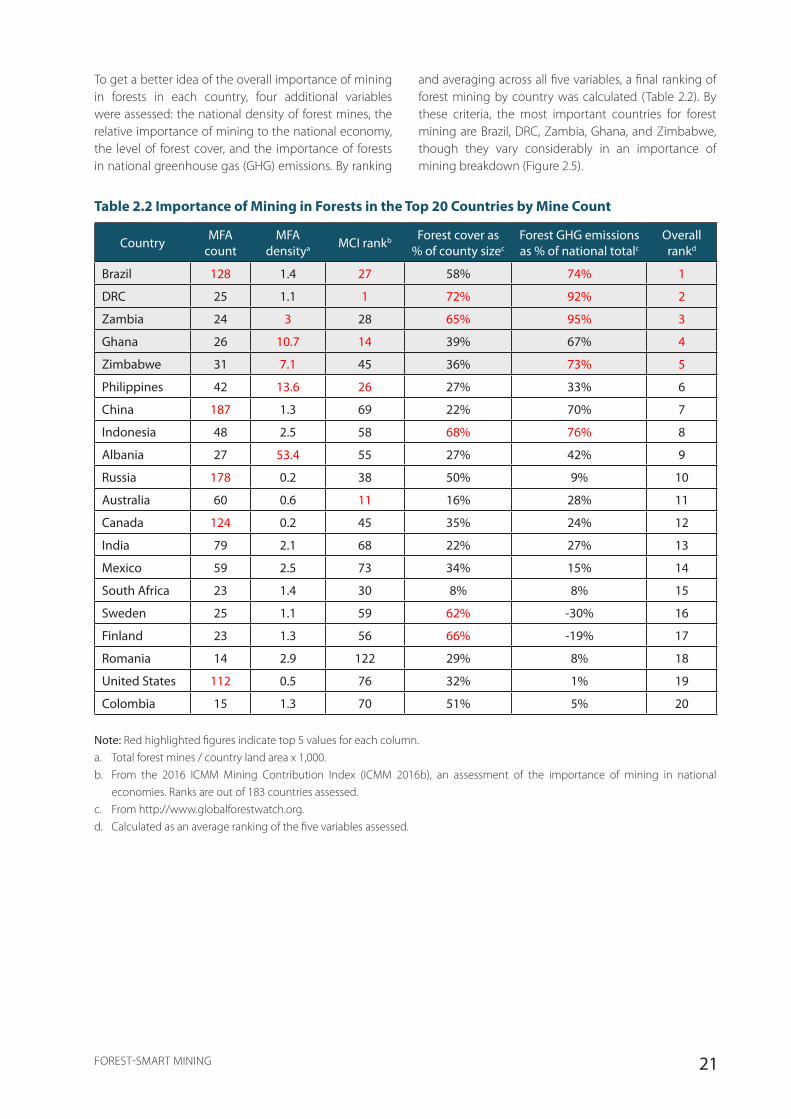
21FOREST-SMART MINING
Table 2.2 Importance of Mining in Forests in the Top 20 Countries by Mine Count
Country MFA count
MFA densitya MCI rankb Forest cover as
% of county sizecForest GHG emissions as % of national totalc
Overall rankd
Brazil 128 1.4 27 58% 74% 1
DRC 25 1.1 1 72% 92% 2
Zambia 24 3 28 65% 95% 3
Ghana 26 10.7 14 39% 67% 4
Zimbabwe 31 7.1 45 36% 73% 5
Philippines 42 13.6 26 27% 33% 6
China 187 1.3 69 22% 70% 7
Indonesia 48 2.5 58 68% 76% 8
Albania 27 53.4 55 27% 42% 9
Russia 178 0.2 38 50% 9% 10
Australia 60 0.6 11 16% 28% 11
Canada 124 0.2 45 35% 24% 12
India 79 2.1 68 22% 27% 13
Mexico 59 2.5 73 34% 15% 14
South Africa 23 1.4 30 8% 8% 15
Sweden 25 1.1 59 62% -30% 16
Finland 23 1.3 56 66% -19% 17
Romania 14 2.9 122 29% 8% 18
United States 112 0.5 76 32% 1% 19
Colombia 15 1.3 70 51% 5% 20
Note: Red highlighted figures indicate top 5 values for each column.a. Total forest mines / country land area x 1,000.b. From the 2016 ICMM Mining Contribution Index (ICMM 2016b), an assessment of the importance of mining in national
economies. Ranks are out of 183 countries assessed.c. From http://www.globalforestwatch.org.d. Calculated as an average ranking of the five variables assessed.
To get a better idea of the overall importance of mining in forests in each country, four additional variables were assessed: the national density of forest mines, the relative importance of mining to the national economy, the level of forest cover, and the importance of forests in national greenhouse gas (GHG) emissions. By ranking
and averaging across all five variables, a final ranking of forest mining by country was calculated (Table 2.2). By these criteria, the most important countries for forest mining are Brazil, DRC, Zambia, Ghana, and Zimbabwe, though they vary considerably in an importance of mining breakdown (Figure 2.5).
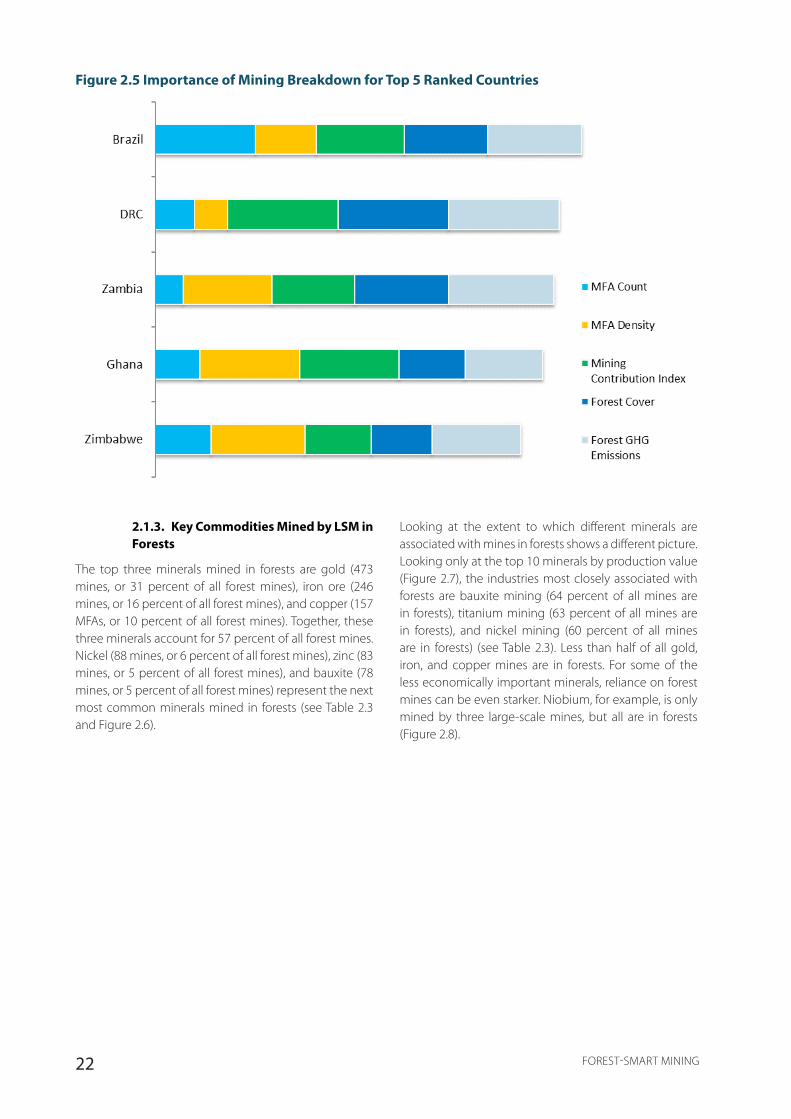
22 FOREST-SMART MINING
Figure 2.5 Importance of Mining Breakdown for Top 5 Ranked Countries
2.1.3. Key Commodities Mined by LSM in Forests
The top three minerals mined in forests are gold (473 mines, or 31 percent of all forest mines), iron ore (246 mines, or 16 percent of all forest mines), and copper (157 MFAs, or 10 percent of all forest mines). Together, these three minerals account for 57 percent of all forest mines. Nickel (88 mines, or 6 percent of all forest mines), zinc (83 mines, or 5 percent of all forest mines), and bauxite (78 mines, or 5 percent of all forest mines) represent the next most common minerals mined in forests (see Table 2.3 and Figure 2.6).
Looking at the extent to which different minerals are associated with mines in forests shows a different picture. Looking only at the top 10 minerals by production value (Figure 2.7), the industries most closely associated with forests are bauxite mining (64 percent of all mines are in forests), titanium mining (63 percent of all mines are in forests), and nickel mining (60 percent of all mines are in forests) (see Table 2.3). Less than half of all gold, iron, and copper mines are in forests. For some of the less economically important minerals, reliance on forest mines can be even starker. Niobium, for example, is only mined by three large-scale mines, but all are in forests (Figure 2.8).

23FOREST-SMART MINING
Table 2.3 Mining in Forests for the Top 10 Commodities by Production Value
Commodity % total global production value
Total mines
Total MFAs
% all MFAs
% mines in forests
1 Iron 11 506 246 16 49
2 Gold 9 1,010 473 31 47
3 Copper 9 399 157 10 39
4 Manganese 8 106 52 3 49
5 Chromite 5 98 30 2 31
6 Nickel 3 146 88 6 60
7 Zinc 2 187 83 5 44
8 Titanium 2 30 19 1 63
9 Bauxite 1 122 78 5 64
10 Silver 1 113 31 2 27
Looking at these minerals by country shows where reliance on forest mining is particularly strong. For the full table of values, including the breakdown of the “other countries” category, please see appendix C (Table C.1). Focusing on bauxite, the particular reliance on forest mines occurs in Brazil and “other countries” (particularly Hungary and Jamaica) where reliance on forest bauxite mines is disproportionately high compared to the contribution to world production. For titanium, the countries with the heaviest reliance on forest mines compared to production are the United States and the
rest of the world (particularly Serbia, Russia, Albania, and Kenya), although Australia and Sierra Leone also have a disproportionate reliance on forest mines compared to production. For nickel, the countries relying particularly on forest mines include Canada, New Caledonia, Australia, and Brazil. For other minerals, notable reliance on forest mining can be seen for silver in Mexico, zinc in Canada, iron ore in Russia and India, gold in Canada and Russia, manganese in India and Mexico, and copper in Zambia and the DRC (Figure 2.9 and Table C.1).
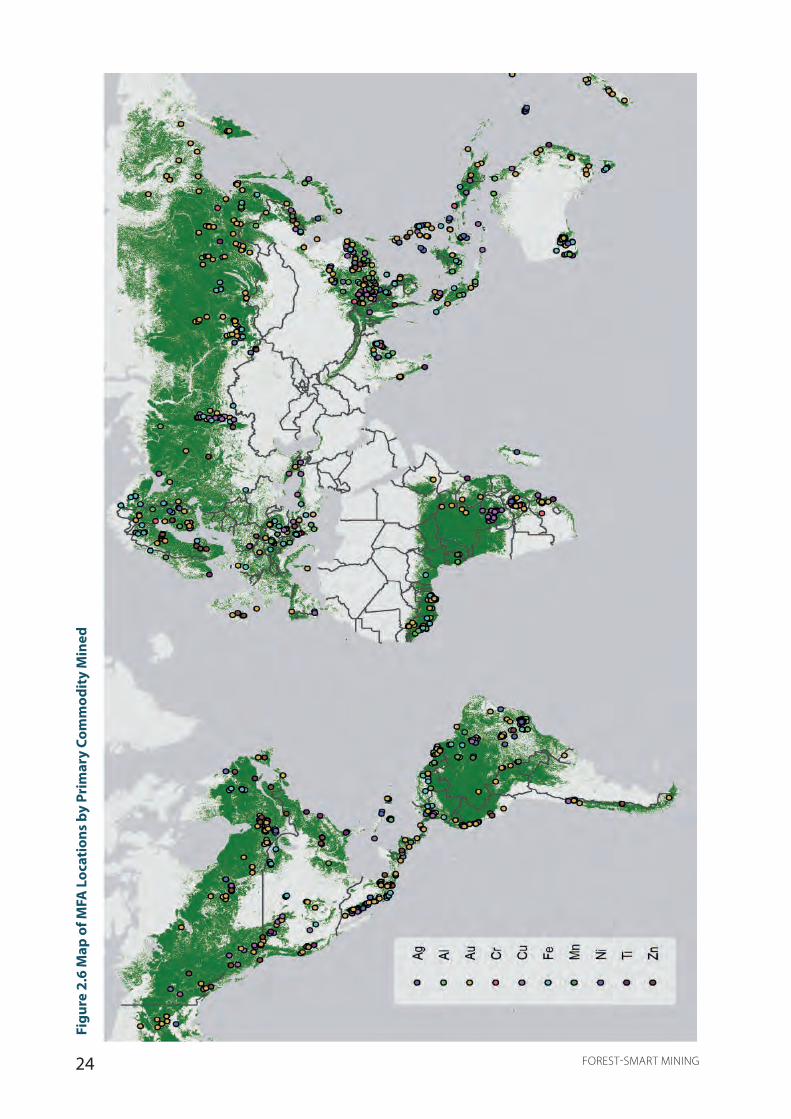
24 FOREST-SMART MINING
Figu
re 2
.6 M
ap o
f MFA
Loc
atio
ns b
y Pr
imar
y Co
mm
odit
y M
ined
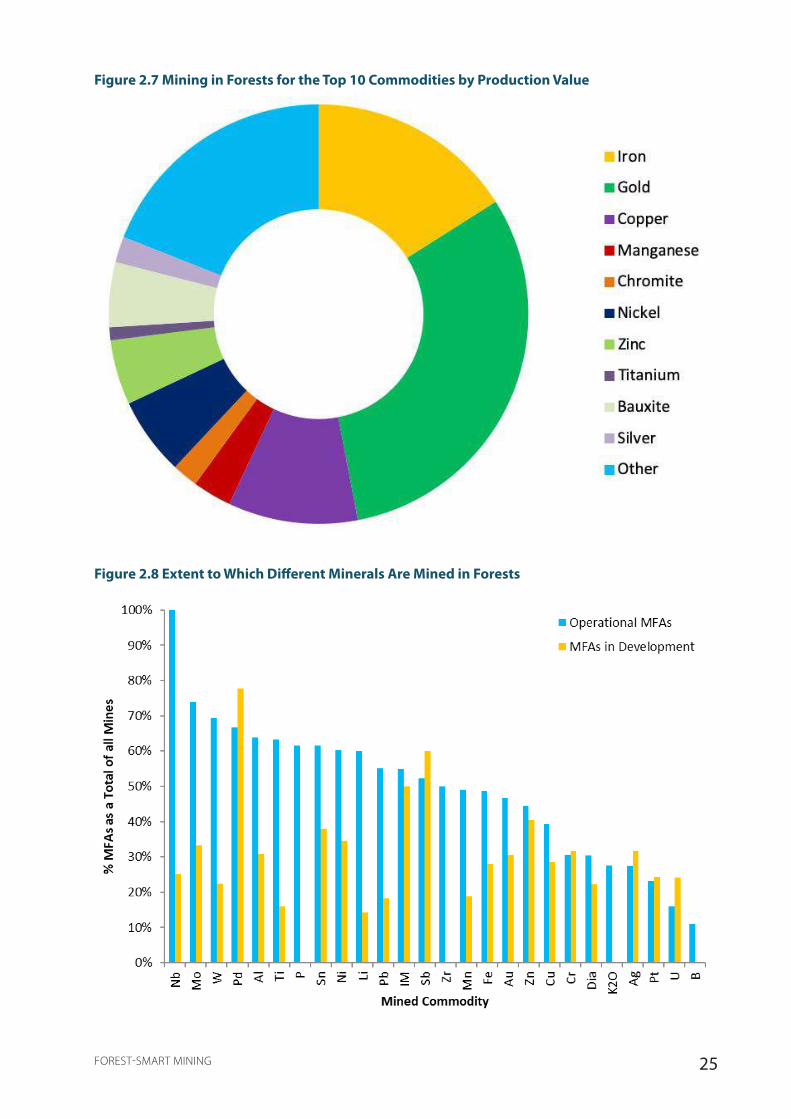
25FOREST-SMART MINING
Photograph: M. Salinas
Figure 2.7 Mining in Forests for the Top 10 Commodities by Production Value
Figure 2.8 Extent to Which Different Minerals Are Mined in Forests

26 FOREST-SMART MINING
Figure 2.9 Percentage of Mineral Production and Mining in Forests in Top Producer Countries
Bauxite
Nickel

27FOREST-SMART MINING
Gold
Titanium
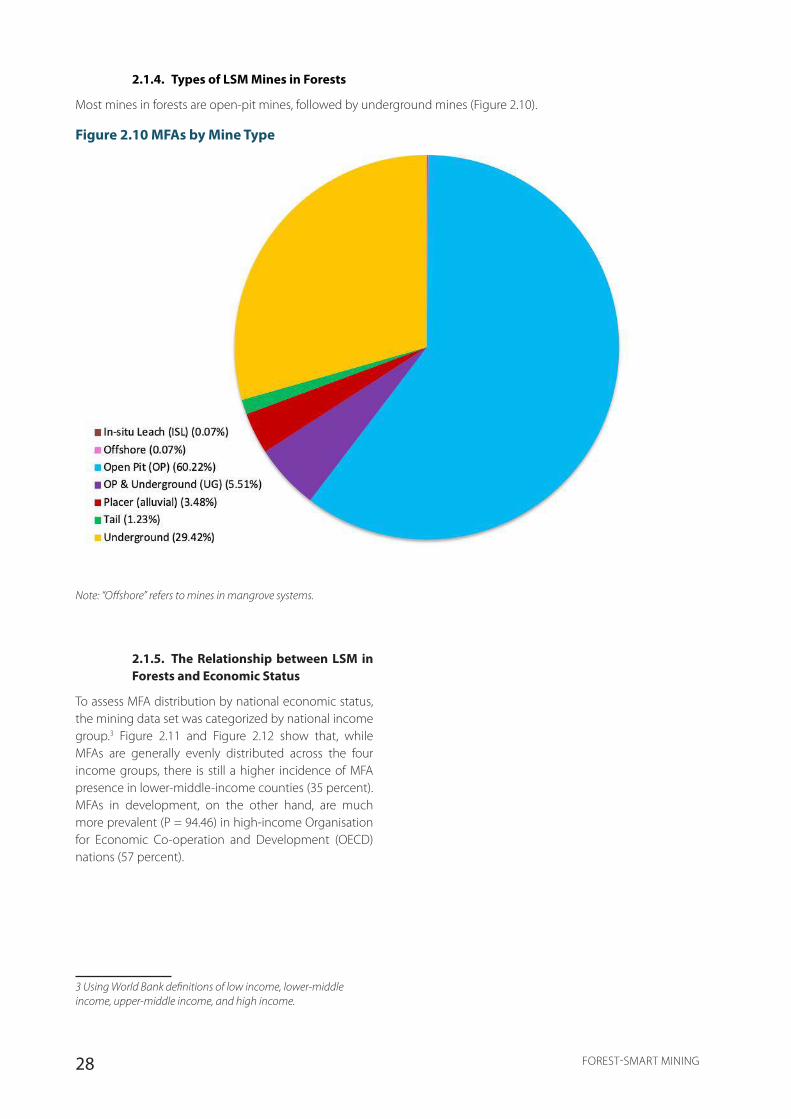
28 FOREST-SMART MINING
2.1.4. Types of LSM Mines in Forests
Most mines in forests are open-pit mines, followed by underground mines (Figure 2.10).
Figure 2.10 MFAs by Mine Type
Note: “Offshore” refers to mines in mangrove systems.
2.1.5. The Relationship between LSM in Forests and Economic Status
To assess MFA distribution by national economic status, the mining data set was categorized by national income group.3 Figure 2.11 and Figure 2.12 show that, while MFAs are generally evenly distributed across the four income groups, there is still a higher incidence of MFA presence in lower-middle-income counties (35 percent). MFAs in development, on the other hand, are much more prevalent (P = 94.46) in high-income Organisation for Economic Co-operation and Development (OECD) nations (57 percent).
3 Using World Bank definitions of low income, lower-middle income, upper-middle income, and high income.

29FOREST-SMART MINING
Figure 2.11 Operational MFAs by National Income Status
Figure 2.12 MFAs in Development by National Income Status
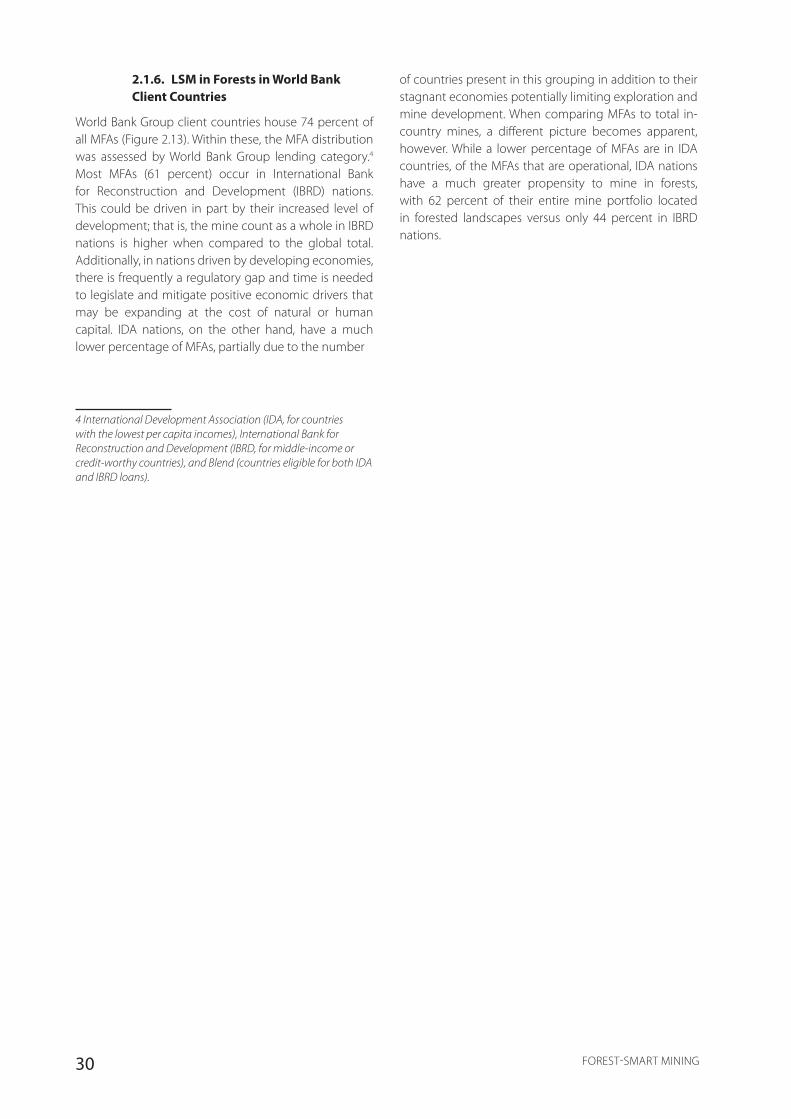
30 FOREST-SMART MINING
2.1.6. LSM in Forests in World Bank Client Countries
World Bank Group client countries house 74 percent of all MFAs (Figure 2.13). Within these, the MFA distribution was assessed by World Bank Group lending category.4 Most MFAs (61 percent) occur in International Bank for Reconstruction and Development (IBRD) nations. This could be driven in part by their increased level of development; that is, the mine count as a whole in IBRD nations is higher when compared to the global total. Additionally, in nations driven by developing economies, there is frequently a regulatory gap and time is needed to legislate and mitigate positive economic drivers that may be expanding at the cost of natural or human capital. IDA nations, on the other hand, have a much lower percentage of MFAs, partially due to the number
4 International Development Association (IDA, for countries with the lowest per capita incomes), International Bank for Reconstruction and Development (IBRD, for middle-income or credit-worthy countries), and Blend (countries eligible for both IDA and IBRD loans).
of countries present in this grouping in addition to their stagnant economies potentially limiting exploration and mine development. When comparing MFAs to total in-country mines, a different picture becomes apparent, however. While a lower percentage of MFAs are in IDA countries, of the MFAs that are operational, IDA nations have a much greater propensity to mine in forests, with 62 percent of their entire mine portfolio located in forested landscapes versus only 44 percent in IBRD nations.
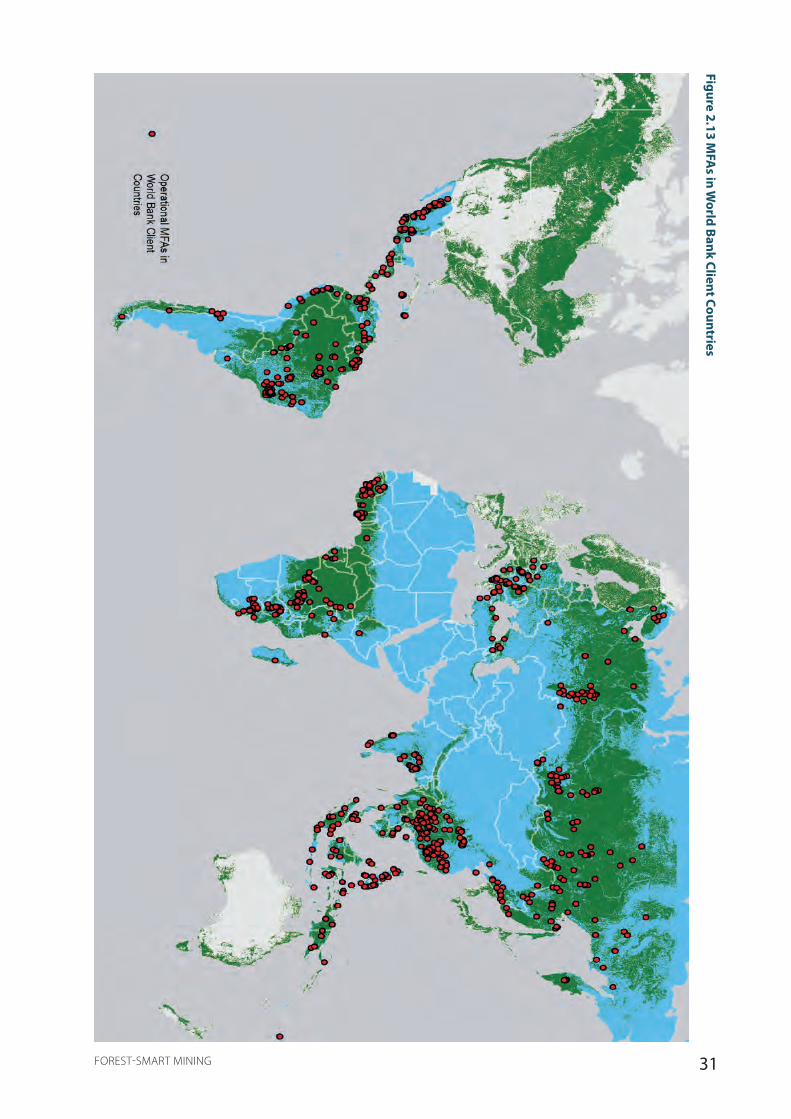
31FOREST-SMART MINING
Figure 2.13 MFA
s in World Bank Client Countries
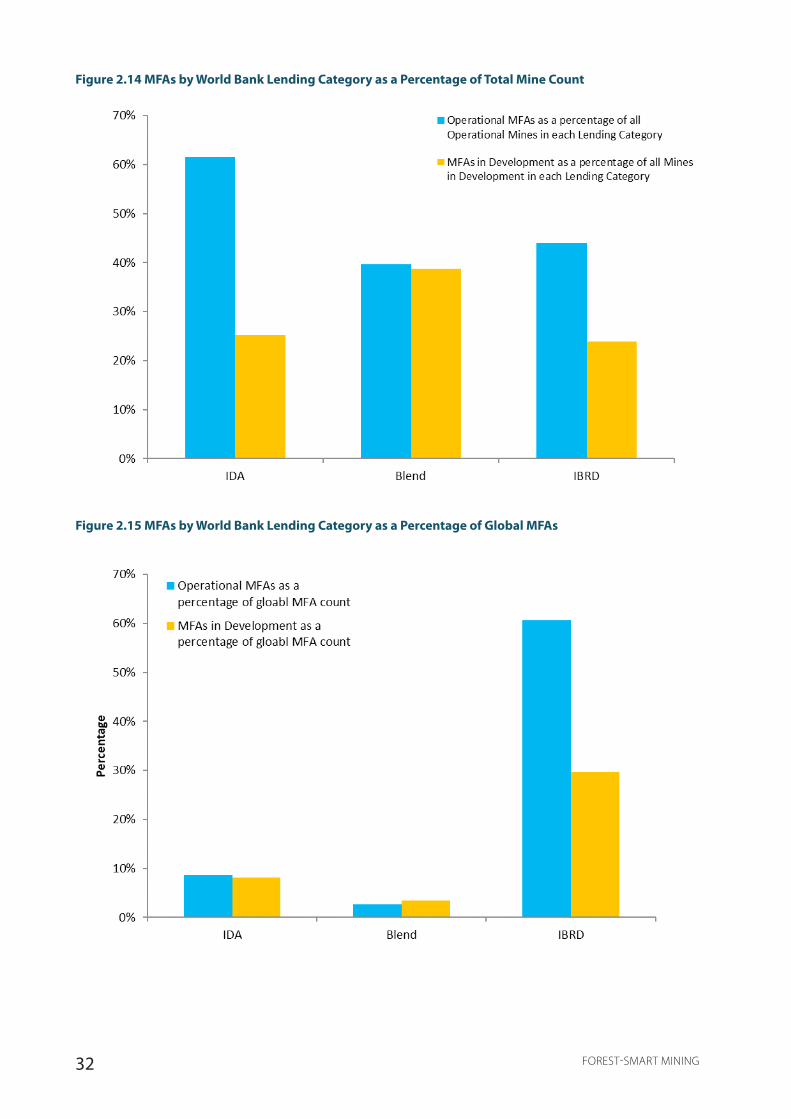
32 FOREST-SMART MINING
Figure 2.14 MFAs by World Bank Lending Category as a Percentage of Total Mine Count
Figure 2.15 MFAs by World Bank Lending Category as a Percentage of Global MFAs
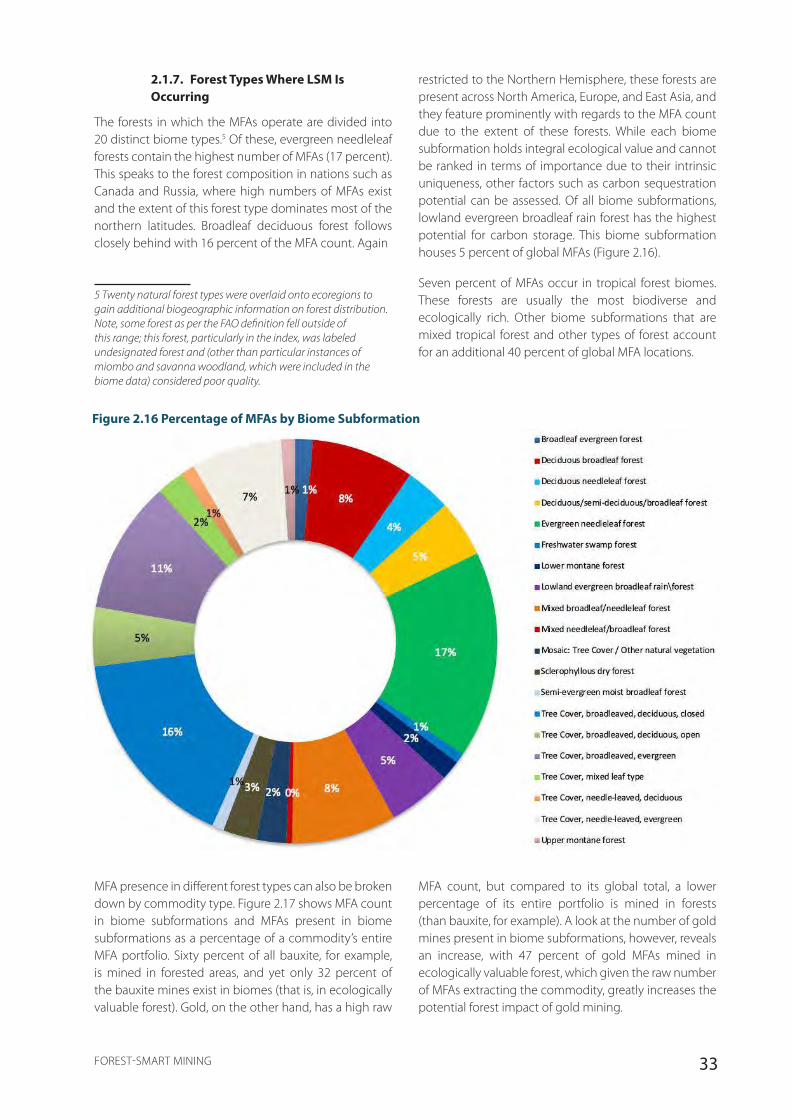
33FOREST-SMART MINING
2.1.7. Forest Types Where LSM Is Occurring
The forests in which the MFAs operate are divided into 20 distinct biome types.5 Of these, evergreen needleleaf forests contain the highest number of MFAs (17 percent). This speaks to the forest composition in nations such as Canada and Russia, where high numbers of MFAs exist and the extent of this forest type dominates most of the northern latitudes. Broadleaf deciduous forest follows closely behind with 16 percent of the MFA count. Again
5 Twenty natural forest types were overlaid onto ecoregions to gain additional biogeographic information on forest distribution. Note, some forest as per the FAO definition fell outside of this range; this forest, particularly in the index, was labeled undesignated forest and (other than particular instances of miombo and savanna woodland, which were included in the biome data) considered poor quality.
restricted to the Northern Hemisphere, these forests are present across North America, Europe, and East Asia, and they feature prominently with regards to the MFA count due to the extent of these forests. While each biome subformation holds integral ecological value and cannot be ranked in terms of importance due to their intrinsic uniqueness, other factors such as carbon sequestration potential can be assessed. Of all biome subformations, lowland evergreen broadleaf rain forest has the highest potential for carbon storage. This biome subformation houses 5 percent of global MFAs (Figure 2.16).
Seven percent of MFAs occur in tropical forest biomes. These forests are usually the most biodiverse and ecologically rich. Other biome subformations that are mixed tropical forest and other types of forest account for an additional 40 percent of global MFA locations.
Figure 2.16 Percentage of MFAs by Biome Subformation
MFA presence in different forest types can also be broken down by commodity type. Figure 2.17 shows MFA count in biome subformations and MFAs present in biome subformations as a percentage of a commodity’s entire MFA portfolio. Sixty percent of all bauxite, for example, is mined in forested areas, and yet only 32 percent of the bauxite mines exist in biomes (that is, in ecologically valuable forest). Gold, on the other hand, has a high raw
MFA count, but compared to its global total, a lower percentage of its entire portfolio is mined in forests (than bauxite, for example). A look at the number of gold mines present in biome subformations, however, reveals an increase, with 47 percent of gold MFAs mined in ecologically valuable forest, which given the raw number of MFAs extracting the commodity, greatly increases the potential forest impact of gold mining.
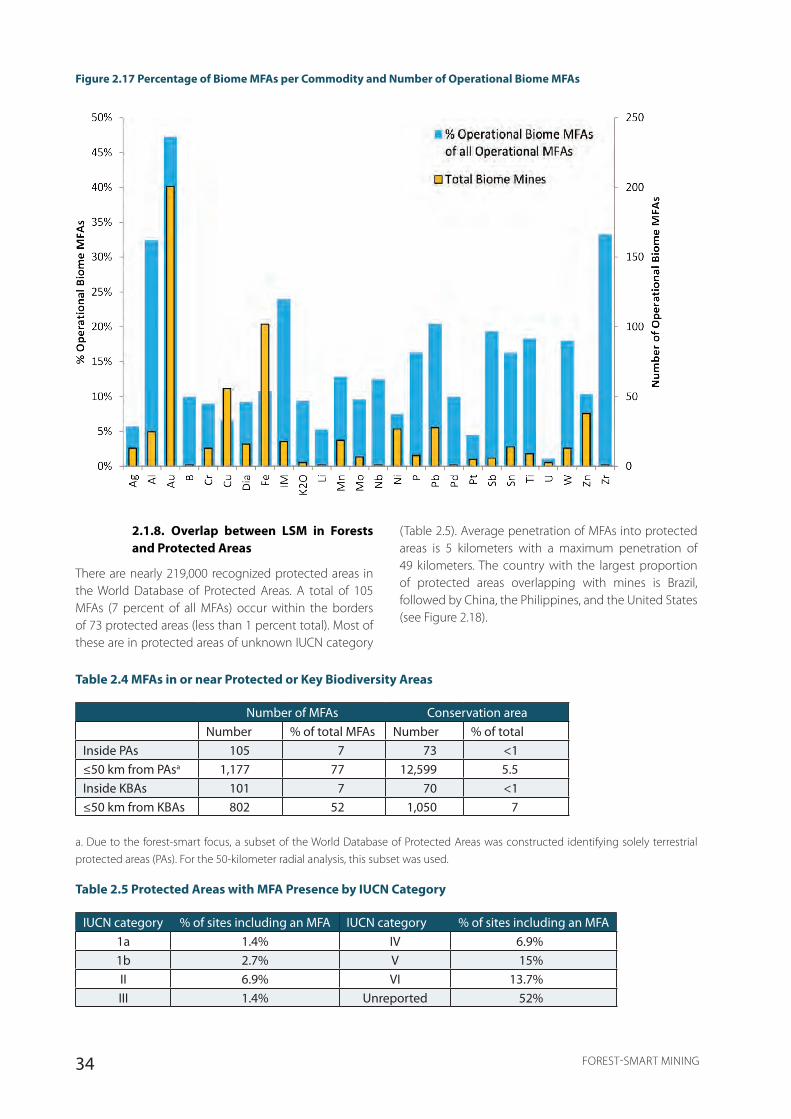
34 FOREST-SMART MINING
2.1.8. Overlap between LSM in Forests and Protected Areas
There are nearly 219,000 recognized protected areas in the World Database of Protected Areas. A total of 105 MFAs (7 percent of all MFAs) occur within the borders of 73 protected areas (less than 1 percent total). Most of these are in protected areas of unknown IUCN category
Figure 2.17 Percentage of Biome MFAs per Commodity and Number of Operational Biome MFAs
(Table 2.5). Average penetration of MFAs into protected areas is 5 kilometers with a maximum penetration of 49 kilometers. The country with the largest proportion of protected areas overlapping with mines is Brazil, followed by China, the Philippines, and the United States (see Figure 2.18).
Table 2.4 MFAs in or near Protected or Key Biodiversity Areas
Number of MFAs Conservation areaNumber % of total MFAs Number % of total
Inside PAs 105 7 73 <1≤50 km from PAsa 1,177 77 12,599 5.5Inside KBAs 101 7 70 <1≤50 km from KBAs 802 52 1,050 7
a. Due to the forest-smart focus, a subset of the World Database of Protected Areas was constructed identifying solely terrestrial protected areas (PAs). For the 50-kilometer radial analysis, this subset was used.
Table 2.5 Protected Areas with MFA Presence by IUCN Category
IUCN category % of sites including an MFA IUCN category % of sites including an MFA1a 1.4% IV 6.9%1b 2.7% V 15%II 6.9% VI 13.7%III 1.4% Unreported 52%
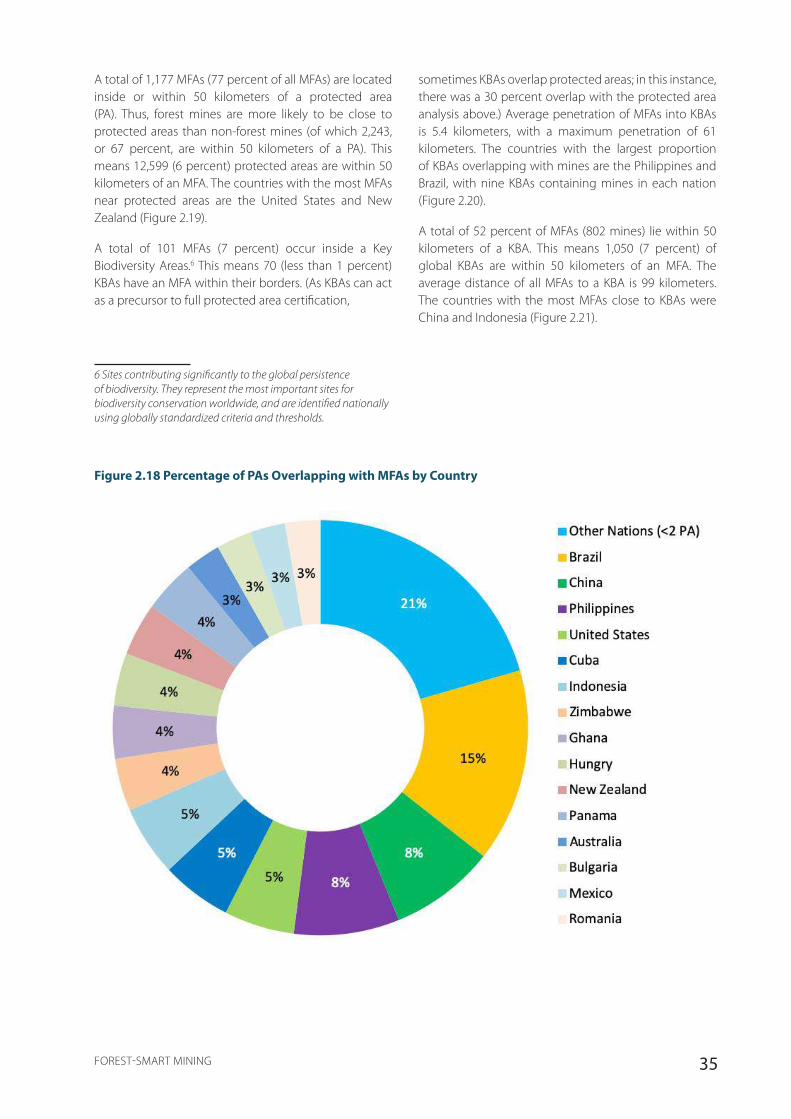
35FOREST-SMART MINING
A total of 1,177 MFAs (77 percent of all MFAs) are located inside or within 50 kilometers of a protected area (PA). Thus, forest mines are more likely to be close to protected areas than non-forest mines (of which 2,243, or 67 percent, are within 50 kilometers of a PA). This means 12,599 (6 percent) protected areas are within 50 kilometers of an MFA. The countries with the most MFAs near protected areas are the United States and New Zealand (Figure 2.19).
A total of 101 MFAs (7 percent) occur inside a Key Biodiversity Areas.6 This means 70 (less than 1 percent) KBAs have an MFA within their borders. (As KBAs can act as a precursor to full protected area certification,
6 Sites contributing significantly to the global persistence of biodiversity. They represent the most important sites for biodiversity conservation worldwide, and are identified nationally using globally standardized criteria and thresholds.
sometimes KBAs overlap protected areas; in this instance, there was a 30 percent overlap with the protected area analysis above.) Average penetration of MFAs into KBAs is 5.4 kilometers, with a maximum penetration of 61 kilometers. The countries with the largest proportion of KBAs overlapping with mines are the Philippines and Brazil, with nine KBAs containing mines in each nation (Figure 2.20).
A total of 52 percent of MFAs (802 mines) lie within 50 kilometers of a KBA. This means 1,050 (7 percent) of global KBAs are within 50 kilometers of an MFA. The average distance of all MFAs to a KBA is 99 kilometers. The countries with the most MFAs close to KBAs were China and Indonesia (Figure 2.21).
Figure 2.18 Percentage of PAs Overlapping with MFAs by Country
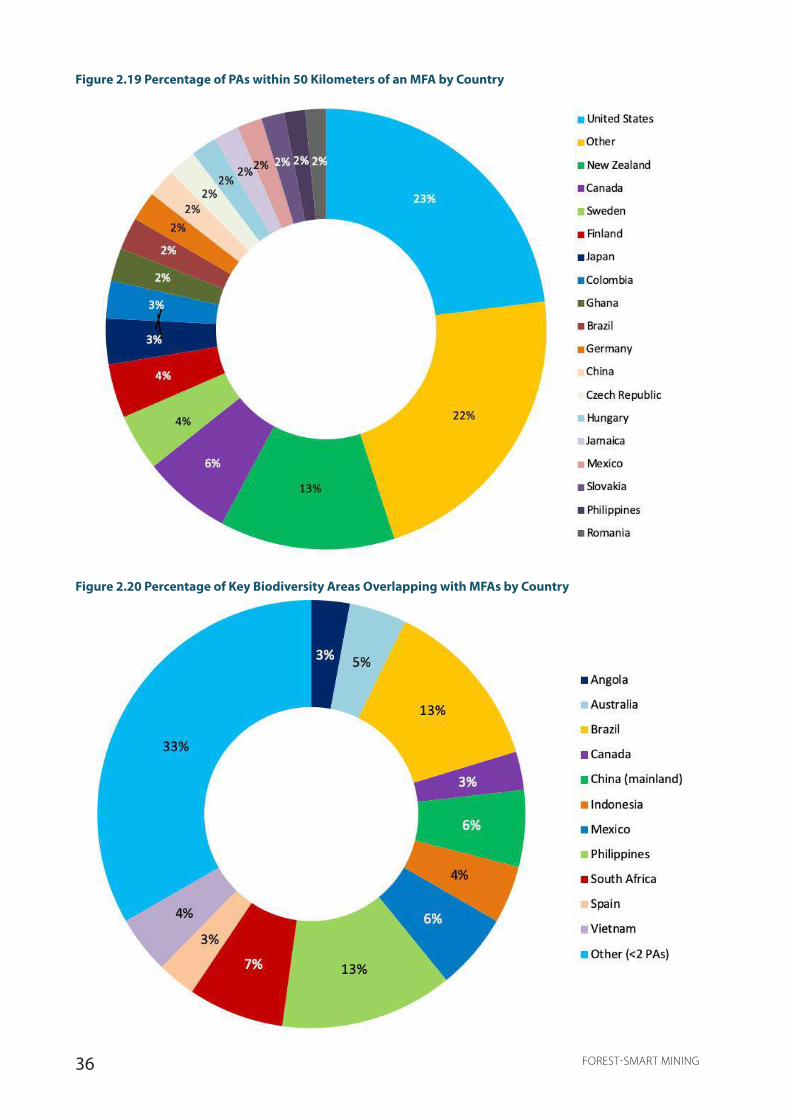
36 FOREST-SMART MINING
Figure 2.19 Percentage of PAs within 50 Kilometers of an MFA by Country
Figure 2.20 Percentage of Key Biodiversity Areas Overlapping with MFAs by Country
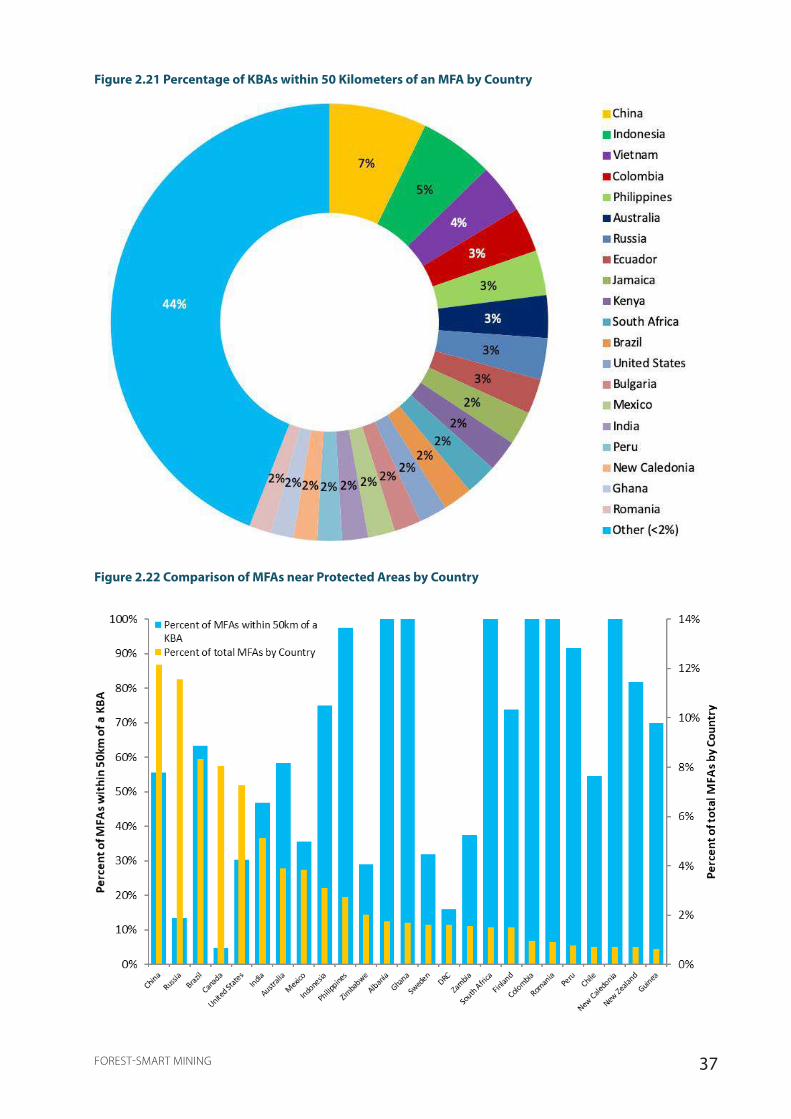
37FOREST-SMART MINING
Figure 2.21 Percentage of KBAs within 50 Kilometers of an MFA by Country
Figure 2.22 Comparison of MFAs near Protected Areas by Country
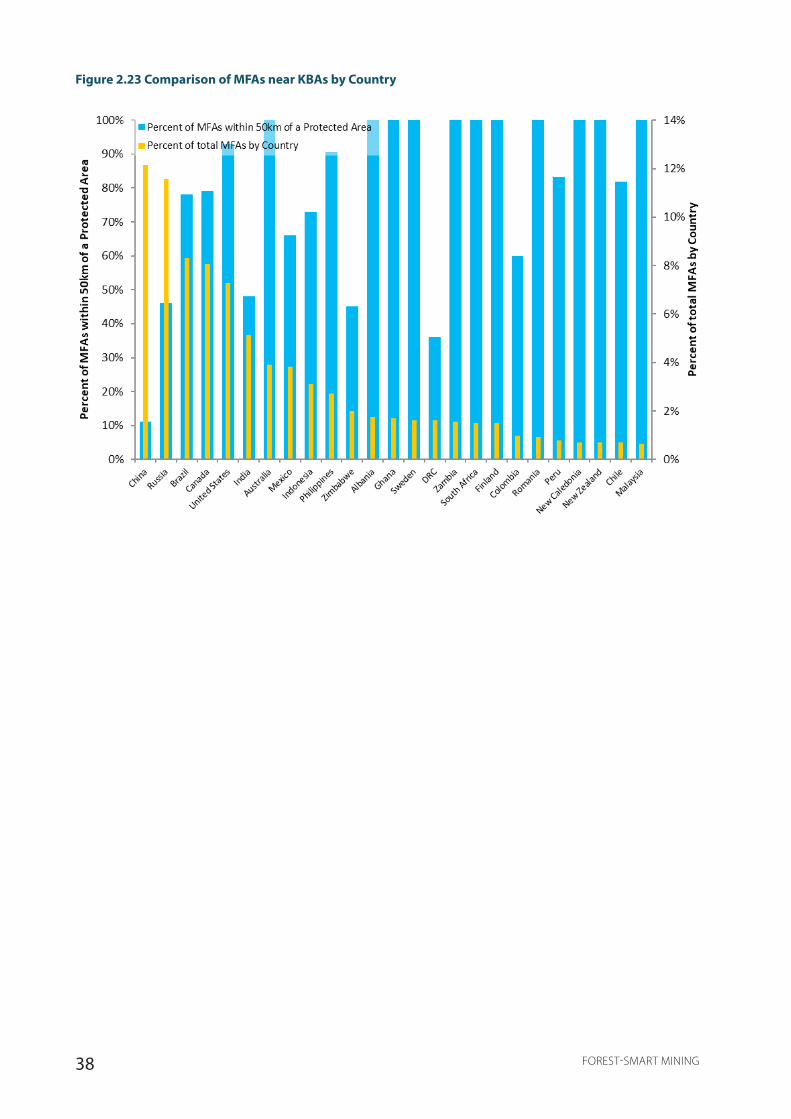
38 FOREST-SMART MINING
Figure 2.23 Comparison of MFAs near KBAs by Country
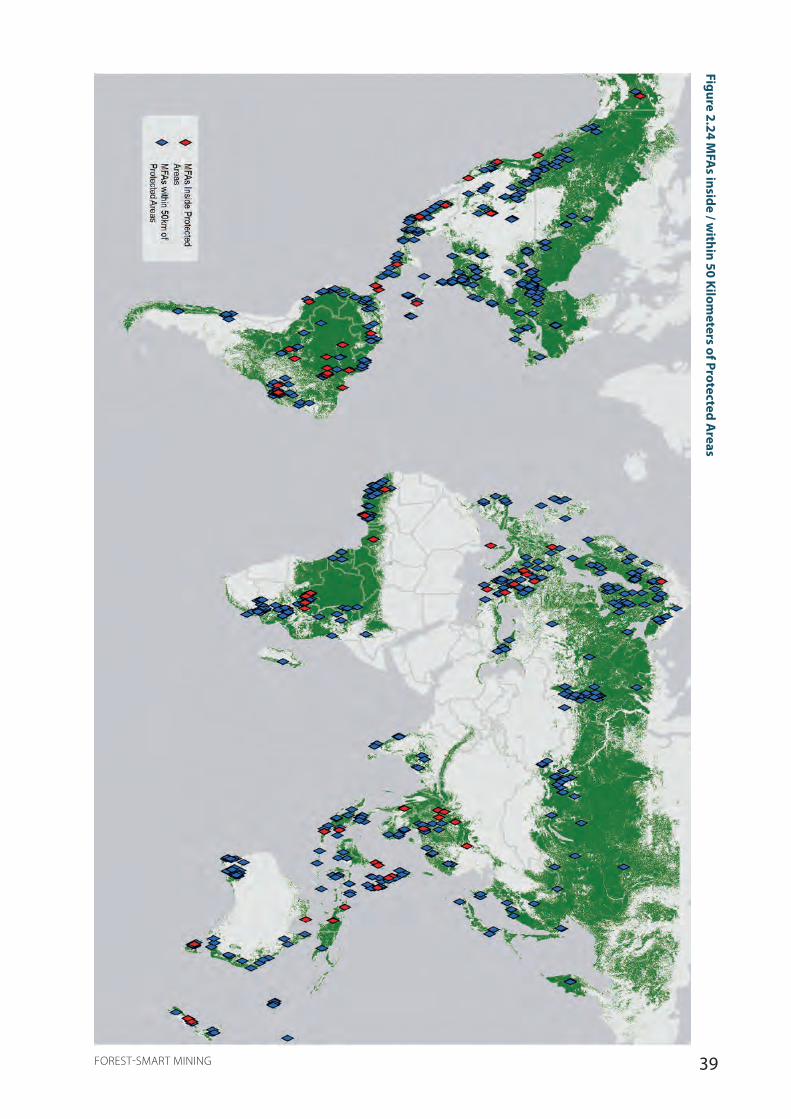
39FOREST-SMART MINING
Figure 2.24 MFA
s inside / within 50 Kilom
eters of Protected Areas
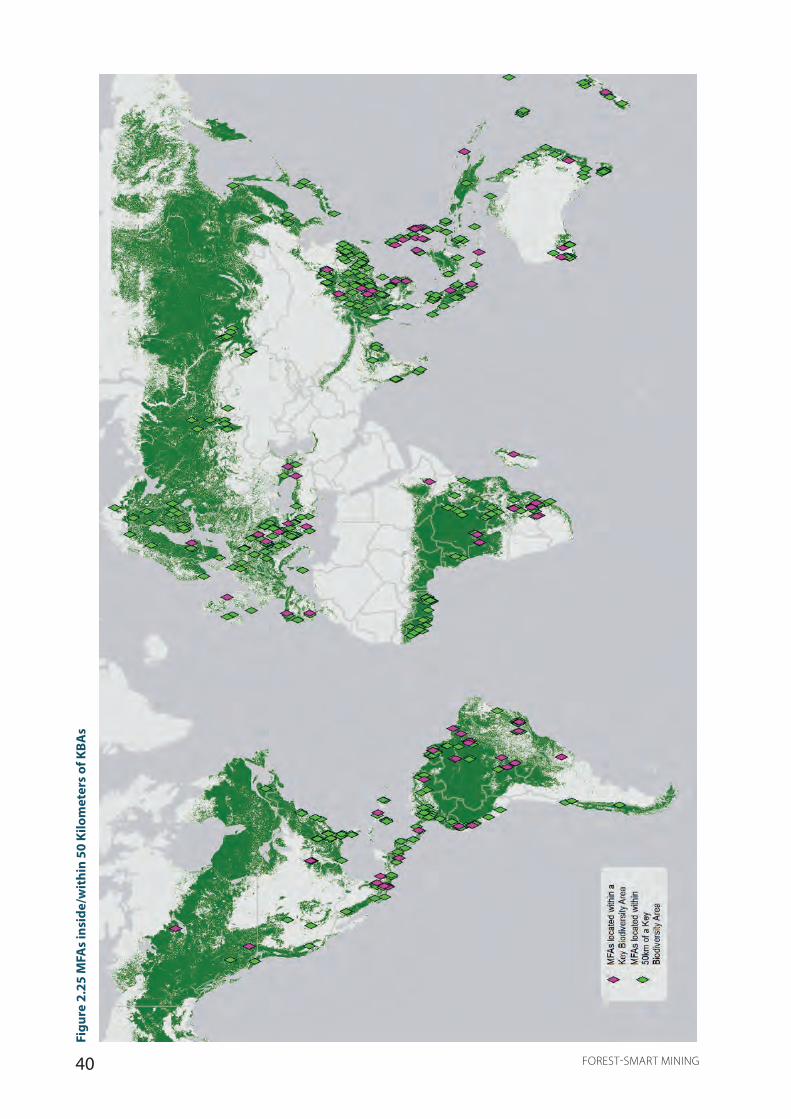
40 FOREST-SMART MINING
Figu
re 2
.25
MFA
s in
side
/wit
hin
50 K
ilom
eter
s of
KBA
s

41FOREST-SMART MINING
2.1.9. Key Companies Associated with LSM in Forests
Figure 2.26 summarizes the top 60 companies by operational MFA count. Vale stands out as the key company associated with forest mining; 92 percent of its portfolio is in forests, representing 6 percent of all forest mines. The quantity of MFAs within Vale’s portfolio is equal to the total number of MFAs across South
Asia. The top 150 mining companies operating MFAs account for 73 percent of the global MFA count. These include several state-owned companies: Russia, India and Albania all hold significant forest mine assets with 50 percent or more of their holdings in forests. Of those, most occur in the evergreen needleleaf and closed deciduous broadleaf biome subformations.
Figure 2.26 Forest Mining by Major Mining Companies

42 FOREST-SMART MINING
2.2. Changes in Mining in Forests over Time
Figure 2.27 Cumulative Number of Mines Opening in Forests, 1800–2014
Figure 2.28 Cumulative Number of Mines Opening in Forests, 1975–2014
with particular growth since 2000 (Figure 2.27–Figure 2.29). While there was a steady increase in MFA count in the years prior to 2005, with an average number of 4.56 mines commissioned per year, there was a significant spike in MFA commissioning between 2005 and 2013 (the data set end point), with 423 percent more MFAs opened per year.
2.2.1. Increases in LSM in Forests over Time
Trends in the number of forest mines were investigated by using opening/commissioning dates from the Raw Materials Database.7 The results show only eight mines in forests were recorded before 1870. After this date, the total number of mines in forests increased steadily,
7 Many opening dates had to be manually researched since they were absent from the main data set. Note, data were often not available for mines in China or Russia, so these countries were omitted from the data set.

43FOREST-SMART MINING
Figure 2.29 Number of Mines Opened, 19th–21st Centuries
Looking at regional variation shows forest mine development rising earlier in North America but now being caught by Latin America. Growth in Europe, North America, and South Asia appears to have tailed off recently but growth in Sub-Saharan Africa, the East Asia and Pacific region, and Latin America have been particularly high in recent decades (Figure 2.30, Figure 2.31).
Figure 2.30 Comparison of Cumulative Forest Mine Opening Dates across Geographical Regions
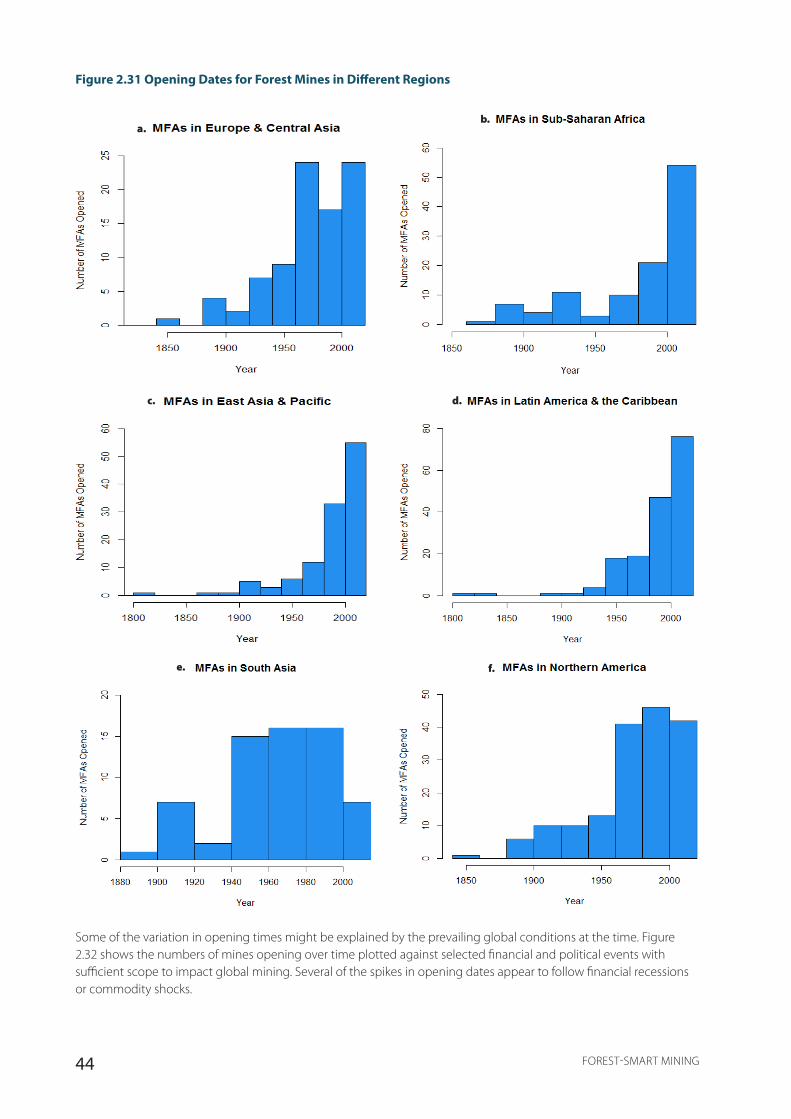
44 FOREST-SMART MINING
Figure 2.31 Opening Dates for Forest Mines in Different Regions
Some of the variation in opening times might be explained by the prevailing global conditions at the time. Figure 2.32 shows the numbers of mines opening over time plotted against selected financial and political events with sufficient scope to impact global mining. Several of the spikes in opening dates appear to follow financial recessions or commodity shocks.
a.
d. c.
b.
f. e.

45FOREST-SMART MINING
Figure 2.32 Comparison of Global MFA Commissioning Dates and Key Global Events

46 FOREST-SMART MINING
2.2.2. Projections for LSM in Forests in the Future
To predict future exploration trends is difficult, but combining the lessons learned from the recent super cycle with current trends allows for some general remarks to be made. It is widely thought new ore deposits will be discovered under deeper cover or within remote and logistically challenging areas with higher country risk (Schodde 2014). Thus, although challenging from a political and infrastructural perspective, regions like Central and West Africa, Brazil, and Papua New Guinea
offer significant greenfield exploration potential as these areas are typically underlain by highly prospective geology, where it may still possible to find Tier 1 and 2 ore deposits at relatively shallow depths. Therefore, it is anticipated that the exploration hotspots that emerged between 2007 and 2016 will continue to attract exploration investment in the future (Figure 2.33). An alternative approach to predicting future mining in forests, based on existing mining in forests and kriging analysis, is presented in appendix C.2.
Credit: Bannafarsai

47FOREST-SMART MINING
Figure 2.33 Exploration Hotspots across the G
lobe, 2007–2016
Source: MinEx Consulting ©
March 2017, in Schodde 2017.
48 FOREST-SMART MINING
3. CASE STUDIES
in Brazil (including the desktop studies of Germano and Itabira) and the Nimba Range Mineral Province between Liberia and Guinea (including the desktop study sites of Nimba and Tokadeh).
3.1.2. Case Study Analysis
Analysis was carried out at the country, company, and site levels, using the data templates provided in appendix D.4. Data collected included the following:
• Countries: National mining context, national forest context, key institutions
• Companies: Size, structure, financing, key corporate policies of relevance
• Sites: Mine site details, surrounding forest and protected area details, forest health score and historical deforestation trends (see below), key areas of forest impact and response
Sources of data included published literature, company websites and reports, interviews with company staff or government representatives where feasible, and site visits.
This report includes summaries of each of the case studies only.
3.1.3. Forest Health Index
Area of Interest
For every case study a Forest Health Index score was calculated for the area of interest (AOI) surrounding the mine site. The AOI describes the geographical area over which the mine might reasonably be considered to be having a potential influence. This influence might include negative impacts, but it might also include positive impacts. It says nothing about whether the mine operator should be held responsible for this influence;
This chapter outlines the methods used to select and analyze case studies, giving an overview of the countries, companies, and sites included and a summary of the forest health scores and ranking. It then presents a summary of the analysis, initially of companies since the same companies operated in numerous sites, then by country and site. Each summary is followed by the key takeaways identified for forest-smart mining.
3.1. Methodology
3.1.1. Case Study Selection
To investigate current practices for LSM in forests, 29 case study sites were selected. The selection was largely made from the data set of forest mines pulled from the Raw Materials Database, although some were developments too new to be included therein. The choice of sites was based largely on the analysis of key mining countries from chapter 2, but cases were also selected to deliberately bring a variety of environmental, political, geological, and economic variables. Access to data was also an important factor; thus, no mines in Russia or China were selected.
The case studies were divided into three types:
• Fourteen sites were analyzed on a desktop basis, using publicly available data and additional data from interviews with company or government personnel where possible. The templates for the desktop case studies are available in appendix D.4.
• Seven sites were assessed in the same way as the desktop studies but were also visited in person, allowing more in-depth interviews with key personnel.
• Eight sites were analyzed spatially only, generating scores for the Forest Health Index (see below), but they were not analyzed in any further depth. These included reanalysis of six desktop sites at the mineral province level:1 the Iron Quadrangle Mineral Province
_______________ 1 A mineral province within the context of this study is a vast tract of land identifiable by its unique geology that can act as a single entity geologically, ecologically, and even, to some degree, sociologically.
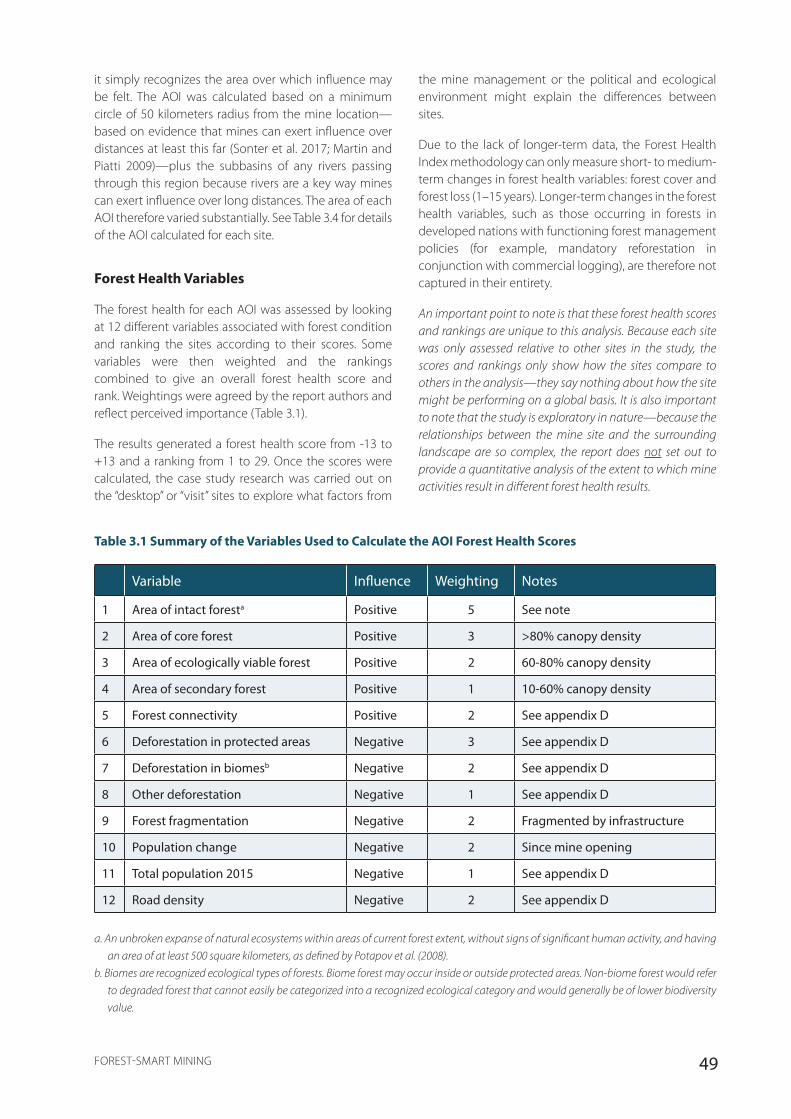
49FOREST-SMART MINING
it simply recognizes the area over which influence may be felt. The AOI was calculated based on a minimum circle of 50 kilometers radius from the mine location—based on evidence that mines can exert influence over distances at least this far (Sonter et al. 2017; Martin and Piatti 2009)—plus the subbasins of any rivers passing through this region because rivers are a key way mines can exert influence over long distances. The area of each AOI therefore varied substantially. See Table 3.4 for details of the AOI calculated for each site.
Forest Health Variables
The forest health for each AOI was assessed by looking at 12 different variables associated with forest condition and ranking the sites according to their scores. Some variables were then weighted and the rankings combined to give an overall forest health score and rank. Weightings were agreed by the report authors and reflect perceived importance (Table 3.1).
The results generated a forest health score from -13 to +13 and a ranking from 1 to 29. Once the scores were calculated, the case study research was carried out on the “desktop” or “visit” sites to explore what factors from
the mine management or the political and ecological environment might explain the differences between sites.
Due to the lack of longer-term data, the Forest Health Index methodology can only measure short- to medium-term changes in forest health variables: forest cover and forest loss (1–15 years). Longer-term changes in the forest health variables, such as those occurring in forests in developed nations with functioning forest management policies (for example, mandatory reforestation in conjunction with commercial logging), are therefore not captured in their entirety.
An important point to note is that these forest health scores and rankings are unique to this analysis. Because each site was only assessed relative to other sites in the study, the scores and rankings only show how the sites compare to others in the analysis—they say nothing about how the site might be performing on a global basis. It is also important to note that the study is exploratory in nature—because the relationships between the mine site and the surrounding landscape are so complex, the report does not set out to provide a quantitative analysis of the extent to which mine activities result in different forest health results.
Table 3.1 Summary of the Variables Used to Calculate the AOI Forest Health Scores
Variable Influence Weighting Notes
1 Area of intact foresta Positive 5 See note
2 Area of core forest Positive 3 >80% canopy density
3 Area of ecologically viable forest Positive 2 60-80% canopy density
4 Area of secondary forest Positive 1 10-60% canopy density
5 Forest connectivity Positive 2 See appendix D
6 Deforestation in protected areas Negative 3 See appendix D
7 Deforestation in biomesb Negative 2 See appendix D
8 Other deforestation Negative 1 See appendix D
9 Forest fragmentation Negative 2 Fragmented by infrastructure
10 Population change Negative 2 Since mine opening
11 Total population 2015 Negative 1 See appendix D
12 Road density Negative 2 See appendix D
a. An unbroken expanse of natural ecosystems within areas of current forest extent, without signs of significant human activity, and having
an area of at least 500 square kilometers, as defined by Potapov et al. (2008).
b. Biomes are recognized ecological types of forests. Biome forest may occur inside or outside protected areas. Non-biome forest would refer
to degraded forest that cannot easily be categorized into a recognized ecological category and would generally be of lower biodiversity
value.

50 FOREST-SMART MINING
3.1.4. Historical Deforestation Rates
In addition to the regional forest health calculations, historical data were collected on deforestation rates in protected areas, biomes, and “undesignated” areas. These were used to plot deforestation across the region where the mine is present to understand the landscape-level
pressures present during the various commissioning stages. The results cannot be used to demonstrate a direct relationship between mine activities and deforestation, but they can be useful for providing historical context and detecting potential relationships.
3.2. Overview of Case Studies Analyzed
3.2.1. Case Study Companies
The companies responsible for the main case studies (desktop analysis and visits) are listed in Table 3.2.
Table 3.2 Summary of Companies Included in the Study
Name CommoditiesMarket cap. ($,
bn)
Main listing
ICMMa
memberDJSIb listed
Global Compact signatory
Sites
Alcoa Corp Bauxite 8.95 New York N Y Y Jarrahdale, Boké (CBG)
Ambatovy Nickel, cobalt - Joint venture N N N Ambatovy
Anglo American PGM 24.8 London Y Y Y Sakatti
Arcelor Mittal Iron ore 37.9 New York N N Y Tokadeh
BHP Iron ore 87.1 London Y Y Y Nimba
Emirates Global Aluminium
Bauxite 15 Not listed N N N Boké (GAC)
First Quantum Minerals Copper 13.3 Toronto N N N Kalumbila
Freeport-McMoRan Copper 19.7 New York Y N N Grasberg
Lundin Gold Gold 0.46 Toronto/ Stockholm N N N Fruta del
Norte
LKAB Iron ore NA State owned N N N Mertainen
Newmont Gold 20 New York Y Y YAhafo, Akyem, Batu Hijau, Nimba, Merian
Rio TintoBauxite, diamonds, mineral sands
68 Australia Y Y YWeipa, Bunder, Boké (CBG), QMM
RUSAL Bauxite 7.9 Moscow N N N Boké (Dian-Dian)
Vale Iron ore 44.5 New York, Brazil Y Y Y Itabira,
Germano
Note: PGM = platinum group metals; N = no; Y = yes.a. International Council on Mining and Metals.b. Dow Jones Sustainability Index.
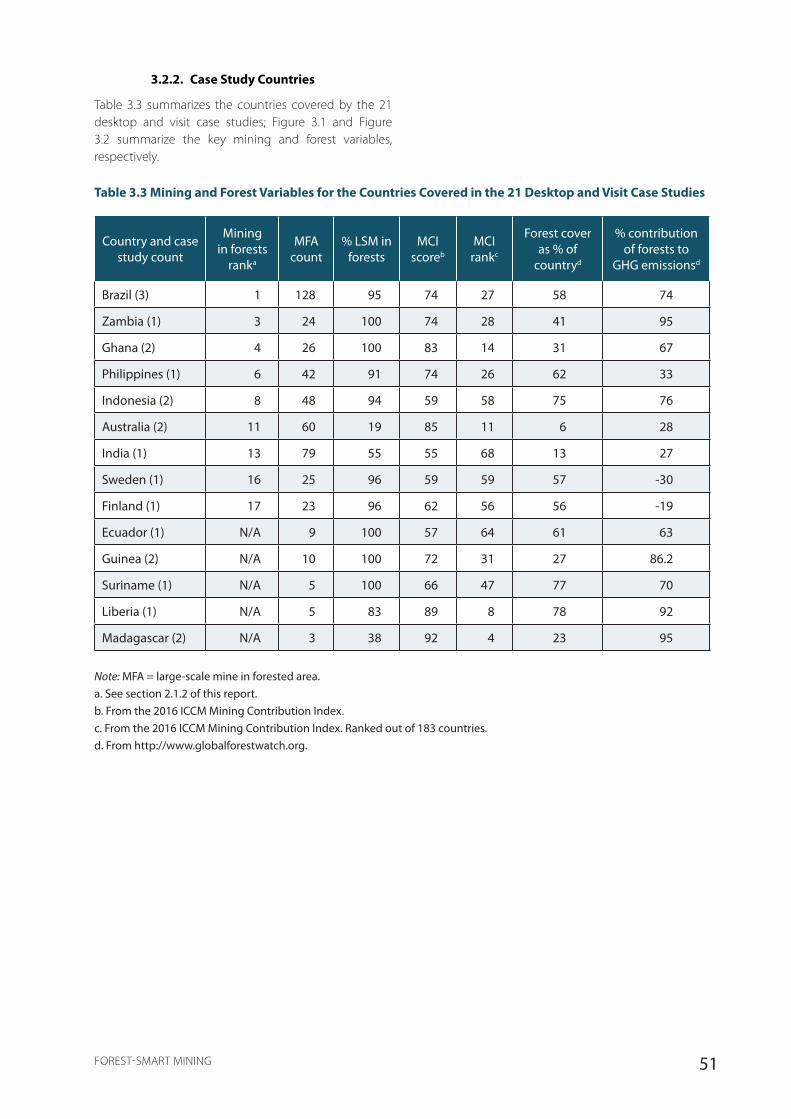
51FOREST-SMART MINING
3.2.2. Case Study Countries
Table 3.3 summarizes the countries covered by the 21 desktop and visit case studies; Figure 3.1 and Figure 3.2 summarize the key mining and forest variables, respectively.
Table 3.3 Mining and Forest Variables for the Countries Covered in the 21 Desktop and Visit Case Studies
Country and case study count
Mining in forests
ranka
MFA count
% LSM in forests
MCI scoreb
MCI rankc
Forest cover as % of
countryd
% contribution of forests to
GHG emissionsd
Brazil (3) 1 128 95 74 27 58 74
Zambia (1) 3 24 100 74 28 41 95
Ghana (2) 4 26 100 83 14 31 67
Philippines (1) 6 42 91 74 26 62 33
Indonesia (2) 8 48 94 59 58 75 76
Australia (2) 11 60 19 85 11 6 28
India (1) 13 79 55 55 68 13 27
Sweden (1) 16 25 96 59 59 57 -30
Finland (1) 17 23 96 62 56 56 -19
Ecuador (1) N/A 9 100 57 64 61 63
Guinea (2) N/A 10 100 72 31 27 86.2
Suriname (1) N/A 5 100 66 47 77 70
Liberia (1) N/A 5 83 89 8 78 92
Madagascar (2) N/A 3 38 92 4 23 95
Note: MFA = large-scale mine in forested area.a. See section 2.1.2 of this report.b. From the 2016 ICCM Mining Contribution Index.c. From the 2016 ICCM Mining Contribution Index. Ranked out of 183 countries.d. From http://www.globalforestwatch.org.
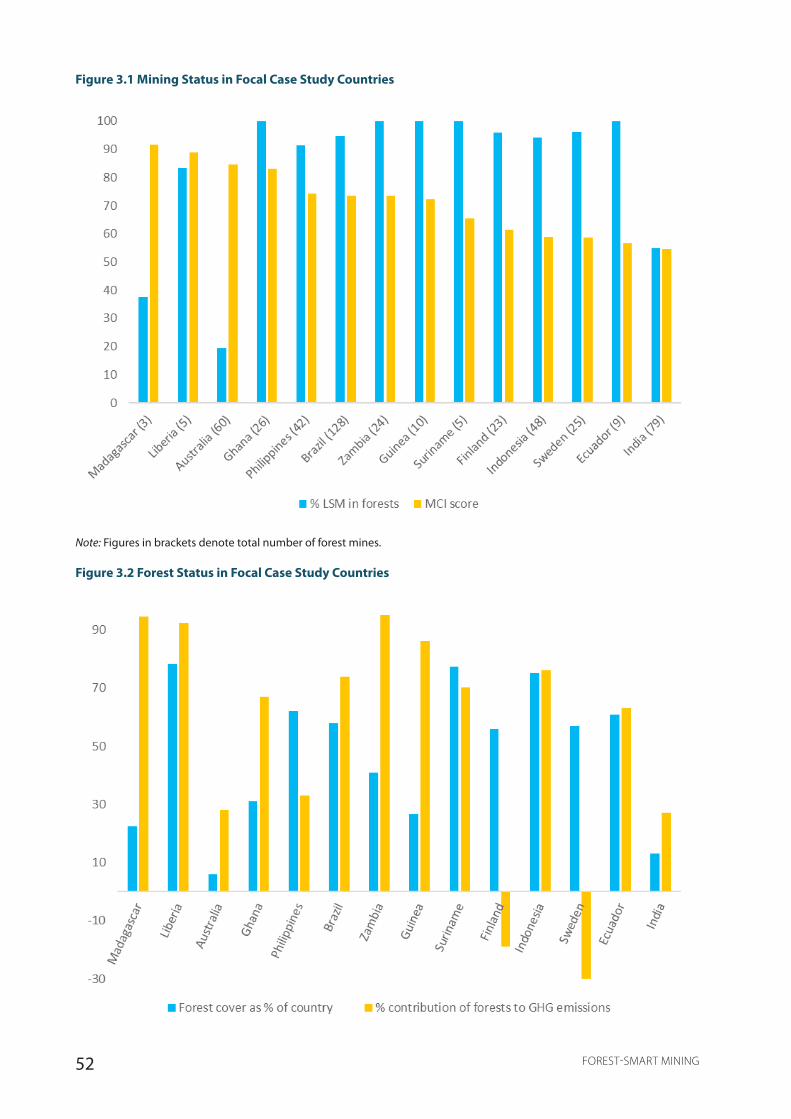
52 FOREST-SMART MINING
Figure 3.1 Mining Status in Focal Case Study Countries
Note: Figures in brackets denote total number of forest mines.
Figure 3.2 Forest Status in Focal Case Study Countries
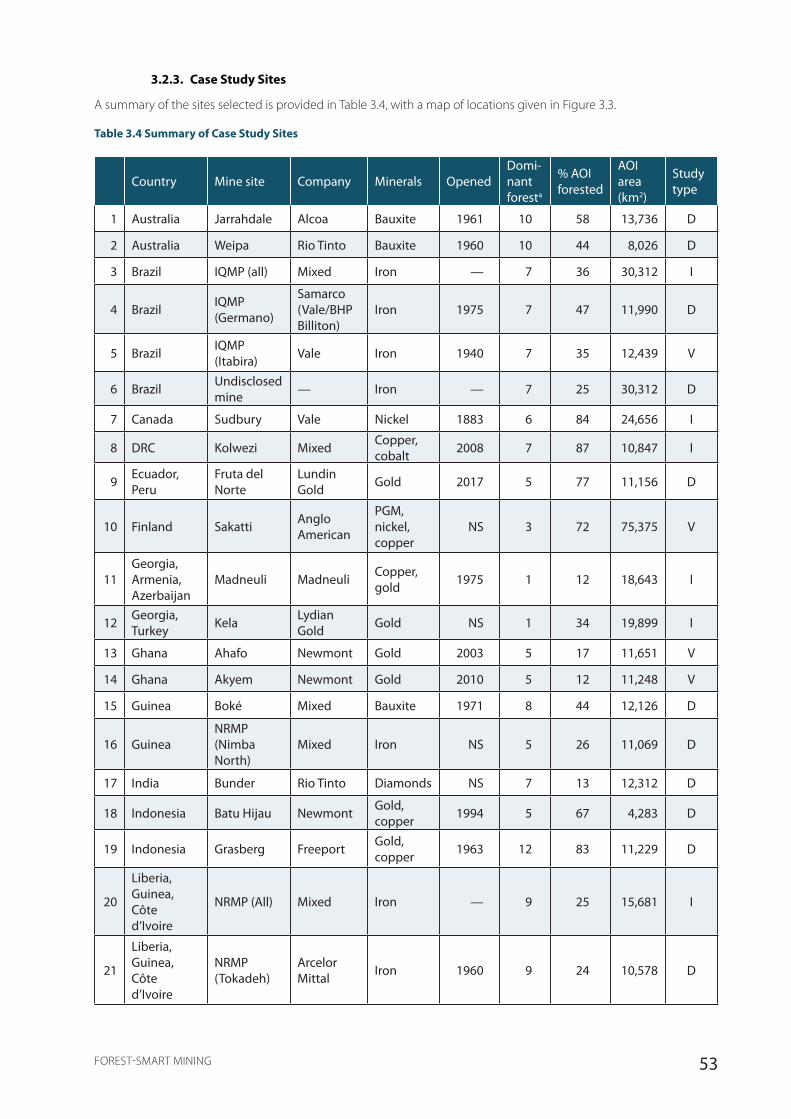
53FOREST-SMART MINING
3.2.3. Case Study Sites
A summary of the sites selected is provided in Table 3.4, with a map of locations given in Figure 3.3.
Table 3.4 Summary of Case Study Sites
Country Mine site Company Minerals OpenedDomi-nant foresta
% AOI forested
AOI area (km2)
Study type
1 Australia Jarrahdale Alcoa Bauxite 1961 10 58 13,736 D
2 Australia Weipa Rio Tinto Bauxite 1960 10 44 8,026 D
3 Brazil IQMP (all) Mixed Iron — 7 36 30,312 I
4 Brazil IQMP (Germano)
Samarco (Vale/BHP Billiton)
Iron 1975 7 47 11,990 D
5 Brazil IQMP (Itabira) Vale Iron 1940 7 35 12,439 V
6 Brazil Undisclosed mine — Iron — 7 25 30,312 D
7 Canada Sudbury Vale Nickel 1883 6 84 24,656 I
8 DRC Kolwezi Mixed Copper, cobalt 2008 7 87 10,847 I
9 Ecuador, Peru
Fruta del Norte
Lundin Gold Gold 2017 5 77 11,156 D
10 Finland Sakatti Anglo American
PGM, nickel, copper
NS 3 72 75,375 V
11Georgia, Armenia, Azerbaijan
Madneuli Madneuli Copper, gold 1975 1 12 18,643 I
12 Georgia, Turkey Kela Lydian
Gold Gold NS 1 34 19,899 I
13 Ghana Ahafo Newmont Gold 2003 5 17 11,651 V
14 Ghana Akyem Newmont Gold 2010 5 12 11,248 V
15 Guinea Boké Mixed Bauxite 1971 8 44 12,126 D
16 GuineaNRMP (Nimba North)
Mixed Iron NS 5 26 11,069 D
17 India Bunder Rio Tinto Diamonds NS 7 13 12,312 D
18 Indonesia Batu Hijau Newmont Gold, copper 1994 5 67 4,283 D
19 Indonesia Grasberg Freeport Gold, copper 1963 12 83 11,229 D
20
Liberia, Guinea, Côte d’Ivoire
NRMP (All) Mixed Iron — 9 25 15,681 I
21
Liberia, Guinea, Côte d’Ivoire
NRMP (Tokadeh)
Arcelor Mittal Iron 1960 9 24 10,578 D

54 FOREST-SMART MINING
Country Mine site Company Minerals OpenedDomi-nant foresta
% AOI forested
AOI area (km2)
Study type
22 Madagascar Ambatovy Ambatovy Nickel, cobalt 2006 11 62 12,669 V
23 Madagascar QMM Rio Tinto Mineral sands 2006 11 58 6,330 D
24 Philippines Mt. Tapian Marcopper Copper, gold 1969 9 32 1,020 D
25Suriname, French Guiana
Merian Newmont Gold 2014 4 94 11,356 D
26 Sweden Mertainen LKAB Iron 2011 3 58 74,598 D
27 Zambia KalumbilaFirst Quantum Minerals
Copper 2012 2 99 11,625 V
28 Zambia, DRC Kansanshi
First Quantum Minerals
Copper 2005 7 98 10,743 I
29 Zambia, DRC Lumwana Equinox
Minerals Copper 1999 7 97 10,626 I
Note: DRC = Democratic Republic of Congo; IQMP = Iron Quadrangle Mineral Province; NRMP = Nimba Range Mineral Province; — = not available; NS = not started; D = desktop; V = visit; I = index only.a. For explanation of forest type codes, see definitions below.
Code Forest type Code Forest type
1 Deciduous broadleaf forest 7 Tree Cover, broadleaved, deciduous, closed
2 Deciduous/semi-deciduous/broadleaf forest 8 Tree Cover, broadleaved, deciduous, open
3 Evergreen needleleaf forest 9 Tree Cover, broadleaved, evergreen
4 Freshwater swamp forest 10 Sclerophyllous dry forest
5 Lowland evergreen broadleaf rainforest 11 Sparse trees/parkland
6 Mixed broadleaf/needleleaf forest 12 Upper montane forest
3.3. Overview of All Forest Health Scores and Rankings
Table 3.5 shows the ranks and individual forest health scores for each of the case studies. The results show that Mertainen (Sweden), Fruta del Norte (Ecuador), and Merian (Suriname) are the AOIs with the highest forest health, driven largely by the extent of intact forest remaining. The Nimba Range Mineral Province between
Guinea, Liberia, and Côte d’Ivoire is the AOI with the lowest forest health, driven largely by high road densities and the absence of good quality forest. Of the individual mines in this region, the Tokadeh (Liberia) mine had slightly better forest health than the Nimba North AOI on the Guinean side.
Table 3.5 Final Forest Health Scores and Ranks for the AOIs of Each Mine Site (see page 56)
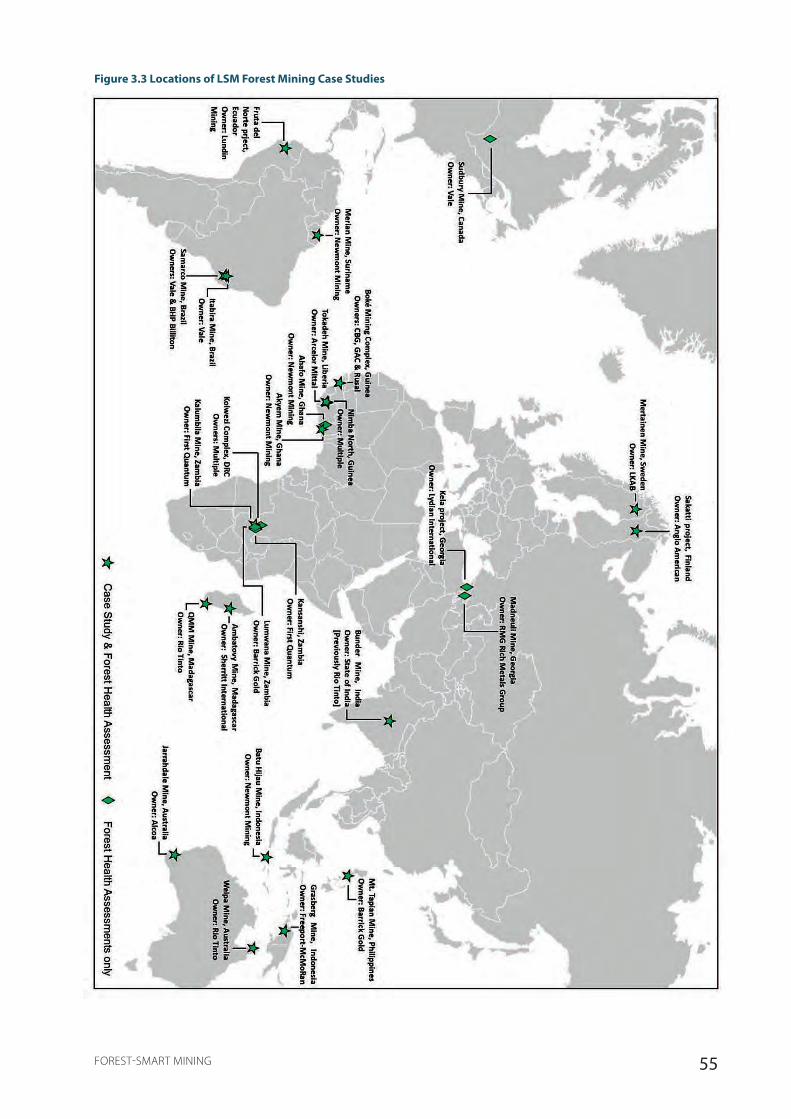
55FOREST-SMART MINING
Figure 3.3 Locations of LSM Forest Mining Case Studies
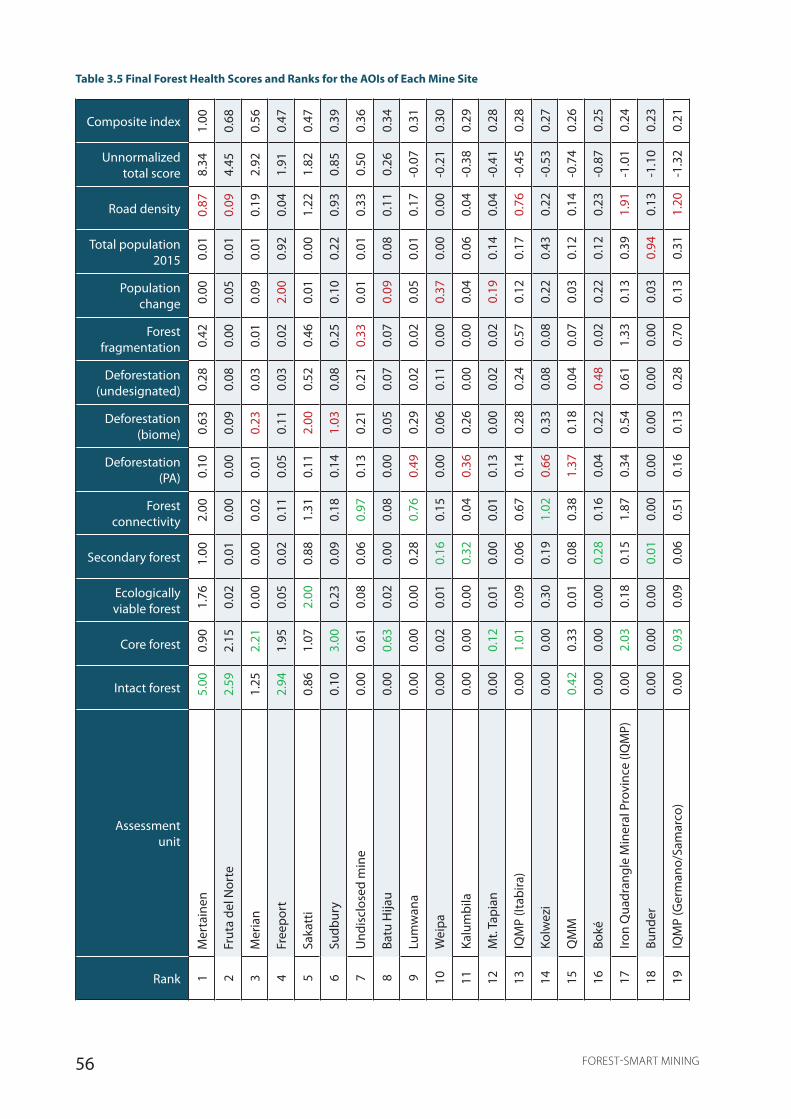
56 FOREST-SMART MINING
Rank
Assessment unit
Intact forest
Core forest
Ecologically viable forest
Secondary forest
Forest connectivity
Deforestation (PA)
Deforestation (biome)
Deforestation (undesignated)
Forest fragmentation
Population change
Total population 2015
Road density
Unnormalized total score
Composite index
1M
erta
inen
5.00
0.90
1.76
1.00
2.00
0.10
0.63
0.28
0.42
0.00
0.01
0.87
8.34
1.00
2Fr
uta
del N
orte
2.59
2.15
0.02
0.01
0.00
0.00
0.09
0.08
0.00
0.05
0.01
0.09
4.45
0.68
3M
eria
n1.
252.
210.
000.
000.
020.
010.
230.
030.
010.
090.
010.
192.
920.
56
4Fr
eepo
rt2.
941.
950.
050.
020.
110.
050.
110.
030.
022.
000.
920.
041.
910.
47
5Sa
katt
i0.
861.
072.
000.
881.
310.
112.
000.
520.
460.
010.
001.
221.
820.
47
6Su
dbur
y0.
103.
000.
230.
090.
180.
141.
030.
080.
250.
100.
220.
930.
850.
39
7U
ndis
clos
ed m
ine
0.00
0.61
0.08
0.06
0.97
0.13
0.21
0.21
0.33
0.01
0.01
0.33
0.50
0.36
8Ba
tu H
ijau
0.00
0.63
0.02
0.00
0.08
0.00
0.05
0.07
0.07
0.09
0.08
0.11
0.26
0.34
9Lu
mw
ana
0.00
0.00
0.00
0.28
0.76
0.49
0.29
0.02
0.02
0.05
0.01
0.17
-0.0
70.
31
10W
eipa
0.00
0.02
0.01
0.16
0.15
0.00
0.06
0.11
0.00
0.37
0.00
0.00
-0.2
10.
30
11Ka
lum
bila
0.00
0.00
0.00
0.32
0.04
0.36
0.26
0.00
0.00
0.04
0.06
0.04
-0.3
80.
29
12M
t. Ta
pian
0.00
0.12
0.01
0.00
0.01
0.13
0.00
0.02
0.02
0.19
0.14
0.04
-0.4
10.
28
13IQ
MP
(Itab
ira)
0.00
1.01
0.09
0.06
0.67
0.14
0.28
0.24
0.57
0.12
0.17
0.76
-0.4
50.
28
14Ko
lwez
i0.
000.
000.
300.
191.
020.
660.
330.
080.
080.
220.
430.
22-0
.53
0.27
15Q
MM
0.42
0.33
0.01
0.08
0.38
1.37
0.18
0.04
0.07
0.03
0.12
0.14
-0.7
40.
26
16Bo
ké0.
000.
000.
000.
280.
160.
040.
220.
480.
020.
220.
120.
23-0
.87
0.25
17Iro
n Q
uadr
angl
e M
iner
al P
rovi
nce
(IQM
P)0.
002.
030.
180.
151.
870.
340.
540.
611.
330.
130.
391.
91-1
.01
0.24
18Bu
nder
0.00
0.00
0.00
0.01
0.00
0.00
0.00
0.00
0.00
0.03
0.94
0.13
-1.1
00.
23
19IQ
MP
(Ger
man
o/Sa
mar
co)
0.00
0.93
0.09
0.06
0.51
0.16
0.13
0.28
0.70
0.13
0.31
1.20
-1.3
20.
21
Table 3.5 Final Forest Health Scores and Ranks for the AOIs of Each Mine Site
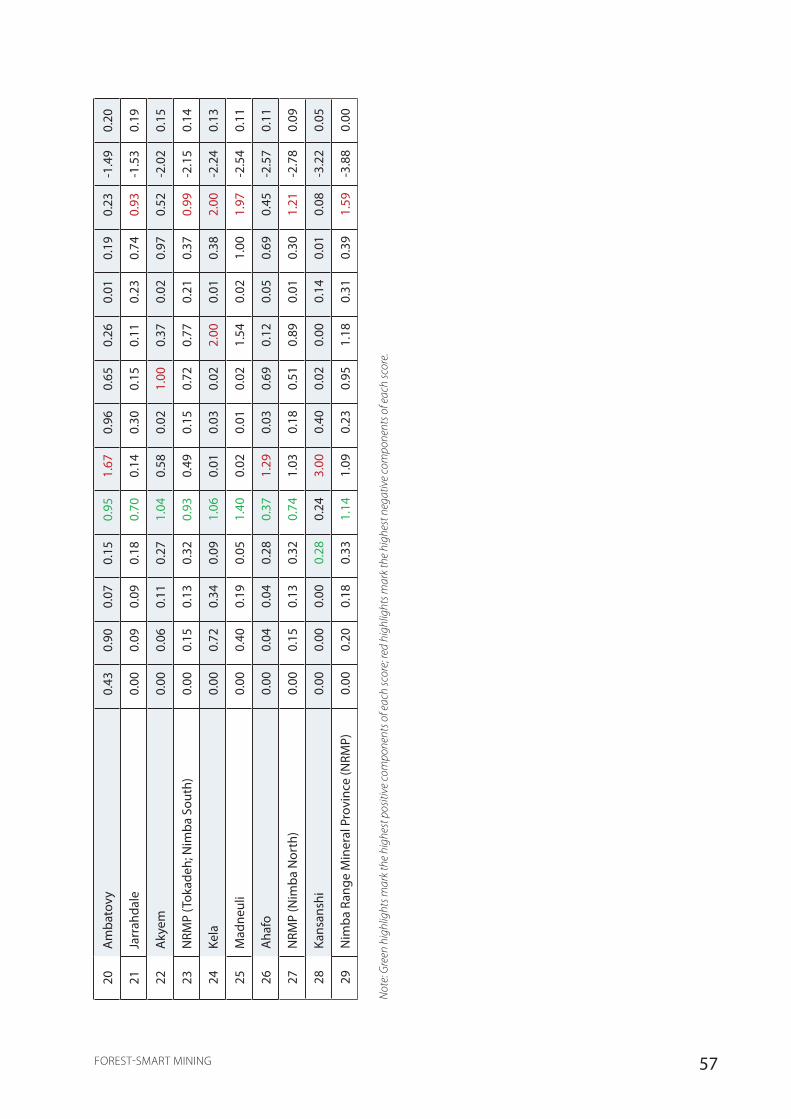
57FOREST-SMART MINING
20A
mba
tovy
0.43
0.90
0.07
0.15
0.95
1.67
0.96
0.65
0.26
0.01
0.19
0.23
-1.4
90.
20
21Ja
rrah
dale
0.00
0.09
0.09
0.18
0.70
0.14
0.30
0.15
0.11
0.23
0.74
0.93
-1.5
30.
19
22A
kyem
0.00
0.06
0.11
0.27
1.04
0.58
0.02
1.00
0.37
0.02
0.97
0.52
-2.0
20.
15
23N
RMP
(Tok
adeh
; Nim
ba S
outh
)0.
000.
150.
130.
320.
930.
490.
150.
720.
770.
210.
370.
99-2
.15
0.14
24Ke
la0.
000.
720.
340.
091.
060.
010.
030.
022.
000.
010.
382.
00-2
.24
0.13
25M
adne
uli
0.00
0.40
0.19
0.05
1.40
0.02
0.01
0.02
1.54
0.02
1.00
1.97
-2.5
40.
11
26A
hafo
0.00
0.04
0.04
0.28
0.37
1.29
0.03
0.69
0.12
0.05
0.69
0.45
-2.5
70.
11
27N
RMP
(Nim
ba N
orth
)0.
000.
150.
130.
320.
741.
030.
180.
510.
890.
010.
301.
21-2
.78
0.09
28Ka
nsan
shi
0.00
0.00
0.00
0.28
0.24
3.00
0.40
0.02
0.00
0.14
0.01
0.08
-3.2
20.
05
29N
imba
Ran
ge M
iner
al P
rovi
nce
(NRM
P)0.
000.
200.
180.
331.
141.
090.
230.
951.
180.
310.
391.
59-3
.88
0.00
Not
e: G
reen
hig
hlig
hts m
ark
the
high
est p
ositi
ve c
ompo
nent
s of e
ach
scor
e; re
d hi
ghlig
hts m
ark
the
high
est n
egat
ive
com
pone
nts o
f eac
h sc
ore.
58 FOREST-SMART MINING
3.4. Company Summaries
Since several of the companies analyzed operated in more than one country they are introduced separately.
3.4.1. Alcoa
Alcoa Inc. was one of the first aluminum companies, established in 1888. In 2016, it split into two new entities: Alcoa Corporation, which is engaged in the mining and manufacture of raw aluminum, and Arconic, which processes aluminum and other metals. Alcoa Corporation is the world’s sixth-largest producer of aluminum, with a market capital value of about $9 billion. The company is listed on the New York Stock Exchange; its top institutional investors include Vanguard and Capital World.
Alcoa is listed on the Dow Jones Sustainability Index, where it was a sector leader in its first year as an independent company. Alcoa has a foundation that has spent approximately $6 million on programs related to climate change, biodiversity, and communities and has pioneered new reforestation techniques. They are members of the Aluminium Stewardship Initiative, signatories to the Global Compact, and report to the Carbon Disclosure Project. They are not members of ICMM.
http://www.alcoa.com/sustainability/en/default.asp http://www.alcoa.com/sustainability/en/pdf/2017-Sustainability-Report.pdf http://investors.alcoa.com/~/media/Files/A/Alcoa-IR/documents/annual-reports-and-proxy-information/annual-report-2017.pdf
3.4.2. Ambatovy
Ambatovy is an $8 billion nickel and cobalt mining and processing joint venture (JV) made up of two companies: Ambatovy Minerals SA (AMSA), which owns the mine and mineral pipeline, and Dynatec Madagascar SA (DMSA), which owns the processing operation and tailings facility. Two of the owners of the Ambatovy JV (Sumitomo Corp., with 60.5 percent, and Sherritt International Corp, with 12 percent) are listed companies. The third owner, KORES (27.5 percent), is a South Korean state-owned corporation. The Ambatovy JV has a single operation, the Ambatovy nickel and cobalt mining, pipeline, and processing operation, located in Madagascar.
Ambatovy publishes an annual sustainability report and social and environmental performances are referred to in its purpose, mission, vision, and values. Ambatovy is committed to application of the IFC Performance Standards on Environmental and Social Sustainability and to the Business and Biodiversity Offsets Programme
(BBOP) voluntary biodiversity offsets standard. These include a commitment to no net loss or preferably a net gain of biodiversity. The Ambatovy JV endeavors to apply ICMM standards and to contribute to achievement of the United Nation SDGs.
http://www.ambatovy.com/docs/wp-content/uploads/SustainabilityReportEn2016.pdf http://www.ambatovy.com/docs/?p=110 https://www.sherritt.com/English/operations/metals/Ambatovy-Joint-Venture/default.aspx http://www.ambatovy.com/docs/?p=166
3.4.3. Anglo American
Established in 1917, Anglo American PLC is a globally diversified mining business with a diverse portfolio of world-class assets spanning diamonds (through De Beers), copper, platinum and other precious metals, iron ore, coal, nickel, and manganese across 11 countries (Australia, Botswana, South Africa, Namibia, Canada, Zimbabwe, Chile, Brazil, Canada, Peru, and Finland). Mine sites are in a diversity of ecosystems, including forests. Anglo American has strong corporate commitments for mitigating its impacts on biodiversity. Following a company restructure in 2016, further improvements were made to the company strategy, policies, standards, and practices relating to biodiversity in order to achieve positive outcomes for biodiversity across the group. Anglo American is engaged in a number of international and regional collaborations to advance practices on biodiversity management.
http://www.angloamerican.com/~/media/Files/A/Anglo-American-PLC-V2/documents/annual-reporting-2016/focus-the-portfolio.pdf
http://www.angloamerican.com/~/media/Files/A/Anglo-American-PLC-V2/documents/annual-updates-2018/aa-sustainability-report-2017.pdf
http://www.angloamerican.com/~/media/Files/A/Anglo-American-PLC-V2/documents/approach-and-policies/our-blueprint-for-the-future-of-sustainable-mining.pdf
3.4.4. ArcelorMittal
ArcelorMittal is the world’s largest steel producer with operations in more than 60 countries. Created through the merger of Arcelor and Mittal Steel in 2006, today it has close to 200,000 employees worldwide. The company’s corporate philosophy is “to produce safe, sustainable steel—that reflects our strong commitment

59FOREST-SMART MINING
https://www.bhp.com/our-approach/our-company/about-us https://www.bhp.com/community/case-studies/bhp-billitons-approach-to-redd https://www.bhp.com/environment/our-approach
3.4.6. Emirates Global Aluminium
Emirates Global Aluminium (EGA) was formed through the merger of state-owned Dubai Aluminium (DUBAL) and Abu Dhabi’s Emirates Aluminium (Emal) in 2013. When the merger occurred, the company’s enterprise value was put at $15 billion and EGA acquired a 100 percent share of Guinea Alumina Corporation (GAC). EGA is owned equally by Mubadala Investment Company of Abu Dhabi and Investment Corporation of Dubai and currently operates in Abu Dhabi, Dubai, the United Arab Emirates, and Guinea. The company is not currently publicly traded, though plans for an initial public offering in 2018 have been reported.
EGA considers its greatest contribution to environmental sustainability to be the continuous improvement of core industrial processes, including reduction and management of emissions and waste. Its commitment to sustainability is referred to in its mission and environmental protection features among its core values and Code of Conduct. EGA joined the Aluminium Stewardship Initiative in 2017.
https://www.ega.ae/en/about-us/our-history/ https://www.ega.ae/en/about-us/corporate-profile/ https://www.ega.ae/en/responsibility/our-approach/ https://af.reuters.com/article/africaTech/idAFKBN1JE0JS-OZATP
3.4.7. First Quantum Minerals
First Quantum Minerals (FQM) is a midsize publicly traded company headquartered in Canada, with seven operating mines in six countries (Mauritania, Zambia, Australia, Turkey, Finland, and Spain). The company’s main product is copper, which accounts for 80 percent of their revenue as of 2016. Established in 1996, FQM has sales revenue of $2.7 billion and 15,525 employees (as of 2015).
FQM provides an environmental policy and sustainability report with a strategy committing to implementing sound corporate governance practices and minimizing environmental impacts through the use of an ISO 14001–based environmental management system. Distinct and separate environmental, health and safety, human resources, community development, and security
to protect and improve the environment in which we live and work.”
Though the company gained entry to the Dow Jones Sustainability Index (DJSI) for the period 2010–2013, ArcelorMittal now chooses not to complete the DJSI questionnaire; instead, it provides disclosures that are relevant to the DJSI framework, that is, economic, environmental, and social dimensions. The company focuses on 10 sustainable development outcomes that they need to achieve for steel to become one of the most sustainable materials: people; products; infrastructure; resources; air, land, and water; energy and carbon; supply chains; community; scientists and engineers; and impact measurement. ArcelorMittal states that they understand that their activities can have extensive impacts on land, habitats, and biodiversity, and operations aim to follow IFC standards in regards to land management. The company does not have a corporate biodiversity policy, nor does it refer to biodiversity in their environmental policy, but country-level operations do publish biodiversity reports.
http://corporate.arcelormittal.com/who-we-are/at-a-glance http://corporate.arcelormittal.com/who-we-are/our-history http://corporate.arcelormittal.com/sustainability/reporting-hub/djsi-2016 http://annualreview2016.arcelormittal.com/overview/our-business/sustainability http://corporate.arcelormittal.com/site-services/advanced-search?query=biodiversity%20&Domain=arcelormittal &ResultPage=1&filter=&cat =arcelormittal.com&searchphrase=exact
3.4.5. BHP
BHP is a world-leading resources company that extracts and processes minerals, oil, and gas, with more than 60,000 employees and contractors, primarily in Australia and the Americas. It operates under a dual-listed company structure, with two parent companies (BHP Billiton Ltd. and BHP Billiton PLC) operated as a single economic entity.
BHP aims to avoid, minimize, and compensate for unacceptable impacts, and it has an integrated REDD+ strategy that focuses on project support, improved governance, and enhanced market stimulation for REDD+ carbon credits. It commits to not mining within World Heritage sites or IUCN category I–IV protected areas unless its activities align with the values of these sites. It commits to avoid impacts that would cause the extinction of IUCN Red List species and does not dispose of waste rock in aquatic or marine environments.
60 FOREST-SMART MINING
systems are implemented, which share synergies where possible. In countries where legislation is lacking, FQM applies management practices under the Equator Principles and IFC Performance Standards.
https://s1.q4cdn.com/857957299/files/doc_presentations/2018/05/May-3-FINAL.pdf https://s1.q4cdn.com/857957299/files/policies/2017/Sustainability-Strategy-FINAL.pdf https://s1.q4cdn.com/857957299/files/doc_downloads/Reports/Environmental-Policy-FINAL.pdf
3.4.8. Freeport-McMoRan
Freeport-McMoRan is the largest publicly traded copper producer in the world and also a major producer of gold and molybdenum. Headquartered in the United States and listed on the New York Stock Exchange, it has a market capitalization of about $20 billion with interests in North America, South America, and Indonesia.
Freeport-McMoRan has an environmental policy, produces a sustainability report, and is a member of the ICMM and the GRI. However, the focus of performance measurement is largely on compliance to the law, avoidance of major incidents, and avoidance of major fines. Freeport-McMoRan was briefly listed on the DJSI but dropped out because of issues relating its Indonesian interests. A biodiversity task force is used to advise on minimization of biodiversity impacts and to catalyze off-site conservation projects with partners, but a clear link does not always exist between the supported projects and the mine activities.
https://www.fcx.com/about https://www.bloomberg.com/quote/FCX:US https://www.fcx.com/sustainability/approach https://www.fcx.com/sustainability/environment https://www.fcx.com/sites/fcx/fi les/documents/sustainability/wtsd_2016.pdf https://www.fcx.com/sustainability/gri-content-index h t t p : / / w w w. ro b e c o s a m . c o m / i m a g e s / re v i e w -presentation-2012.pdf
3.4.9. LKAB
LKAB, a mining and minerals group, has been mining and upgrading the iron ore of Sweden for the global steel market since 1890. Today, it is a fully state-owned company that in 2017 produced 27.2 million tonnes of iron ore products, and had a value of sales of SKr 23.5 billion (~$2.66 billion). LKAB operates mines at three locations in northern Sweden, and it exports essentially
all of its products via rail and sea from Narvik (Norway) and Luleå (Sweden).
The company places great emphasis on safety and sustainability and publishes its corporate policies on its website and in an integrated annual and sustainability report. LKAB’s aim is no net loss of biodiversity when addressing environmental impacts, and the approach taken follows the mitigation hierarchy. LKAB is not a member of any international sustainability related initiative, organization, or institution, but it strives to act in accordance with such initiatives, as expressed in both its Code of Conduct as well as in a Supplier Code of Conduct.
https://www.lkab.com/en/about-lkab/lkab-in-brief/ https://www.lkab.com/en/about-lkab/from-mine-to-port/ https://www.lkab.com/en/sustainabil ity/social-responsibility/code-of-conduct/ https://www.lkab.com/en/SysSiteAssets/documents/finansiell-information/en/annual-reports/lkab_2017_annual_and_sustainability_report.pdf
3.4.10. Lundin Gold
Lundin Gold is a young, medium-sized, $470 million company developing one specific gold mining project—Fruta del Norte, in southern Ecuador. Lundin Gold is publicly traded on the Toronto and Stockholm Stock Exchanges.
The company places emphasis on community relationships, safety, and overall sustainability and it has recently started to publish its corporate policies in an annual sustainability report. The company is not a member of any international sustainability related initiatives, but it states that it strives to act in accordance with them, and that it is considering the formal adoption of relevant codes and principles. The company has established a biodiversity conservation program with a sustainable landscape vision with Conservation International Ecuador.
https://www.lundingold.com/en/about/about-lundin-gold/ https://www.lundingold.com/site/assets/files/16812/2017-sustainability-report-en.pdf https://www.lundingold.com/site/assets/files/16808/2015-2016-sustainability-report-lug-en.pdf
61FOREST-SMART MINING
3.4.11. Newmont
Newmont Mining Corporation is a $20 billion gold mining company, publicly traded on the New York Stock Exchange and operating in 13 sites across five countries.
The company places great emphasis on its safety and sustainability record and publishes its corporate policies on its website and an annual sustainability report. Social and environmental performances are referred to in its purpose, mission, vision, and values and the application of leading environmental and social practices is one of its five strategic “pillars.” Newmont’s global sustainability and stakeholder policy includes seven environmental commitments based on the mitigation hierarchy and it has 16 environmental and social standards. These include a commitment to no net loss of biodiversity in new sites, no additional loss in existing sites, and enhancement in legacy sites. Newmont is a member of the ICMM and has been listed as the sector leader on the Dow Jones Sustainability Index for the past three years.
https://www.newmont.com/about-us/default.aspx https://www.newmont.com/operations-and-projects/default.aspx https://sustainabilityreport.newmont.com/2016/overview/our-business https://www.newmont.com/newsroom/newsroom-details/2013/Newmont-and-the-ICMM-Partners-In-Sustainable-Development/default.aspx https://www.newmont.com/about-us/governance-and-ethics/policies-and-standards/default.aspx
3.4.12. Rio Tinto
Rio Tinto Group is a dual-listed Australian-British multinational corporation that is one of the world’s largest metals and mining operations. It has over 30 subsidiaries and primarily focuses on mineral extraction, but it also has operations in refining.
Rio Tinto is a prominent member of most relevant international sustainability initiatives in the minerals sector. Rio Tinto has been at the forefront of environmental stewardship for the past 15 years for its company-wide commitment to net positive impact (NPI) on biodiversity. Rio Tinto subsequently withdrew the NPI commitment in 2016 and replaced it with an aim to implement the mitigation hierarchy at a site-by-site basis in order to mitigate its biodiversity impacts. Rio Tinto was listed on the DJSI but was deleted in 2017. In other respects, Rio Tinto reports adhering to recognized international best practice and management systems, including its own in-house standards in the domains of climate change, tailings management,
water management, and community relationships. The Communities and Social Performance (CSP) standard includes provisions for helping communities to organize into formal associations in order to enter into long-term agreements with Rio Tinto over land rights and access to natural resources.
https://www.riotinto.com/our-business-75.aspx#south%20africa https://www.riotinto.com/documents/RT_SD2017.pdf http://www.riotinto.com/ourcommitment/spotlight-18130_21621.aspx http://www.riotinto.com/documents/RT_Rio_Tintos_approach_to_communities_and_social_performance.pdf http://www.robecosam.com/images/review-presentation-2017.pdf
3.4.13. RUSAL
UC RUSAL is a $7.9 billion aluminum producer company, the second largest in the world; it is publicly traded on the Hong Kong Stock Exchange, the New York Stock Exchange, Euronext, and the Moscow Exchange. UC RUSAL formed in 2007 when RUSAL, SUAL, and Glencore of Switzerland merged their operations. Today, UC RUSAL operates in 19 countries on five continents with assets covering the full production process—from bauxite and nepheline ore mines to aluminum smelters and foil mills. Its main products are primary aluminum, aluminum alloys, foil, and alumina.
Researching RUSAL’s social and environment commitments has been hampered by lack of publicly available information, with the company website not accessible at all times. To minimize and compensate for environmental impacts of the company’s activities, UC RUSAL “has undertaken to comply with legal and regulatory requirements for environmental protection, to participate in the solution of global and regional environmental problems and to search for innovative solutions.” The company’s strategic priorities include the creation of closed water cycle systems at production plants, the reclamation of disturbed soils, and the preservation of biological diversity, and it has established corporate management structures to regulate environmental issues and risks throughout its asset portfolio. Reliance on renewable sources of energy is a key focus. UC RUSAL joined the Aluminium Stewardship Initiative in 2015. RUSAL was subjected to U.S. sanctions in April 2018 due to its association with Oleg Deripaska.
https://www.rusal.ru (although this site was not accessible throughout the research)
62 FOREST-SMART MINING
https://www.reuters.com/article/aluminium-russia-merger/rusal-sual-glencore-complete-aluminium-merger-idUSL2713534620070327 https://aluminium-stewardship.org/about-asi/asi-members/uc-rusal/ https://www.reuters.com/ar t icle/us-usa-russia-sanctions-rusal-stocks/rusal-shares-plunge-over-40-percent-on-u-s-sanctions-idUSKBN1HG04H
3.4.14. Samarco
Samarco was founded in 1977, producing iron ore pellets sold to the steel industry in the Americas, the Middle East, Asia, and Europe. The corporate governance structure is formed by a joint venture between BHP Billiton do Brasil Ltda and Vale SA, each with a 50 percent interest in the company. Samarco operates one mine in Minas Gerais, Brazil, called Fundão. The mine ceased operating in 2015 following a deadly tailings dam burst in 2015, but it is likely to resume operations before the end of 2018.
Samarco has a separate sustainability approach from its parent companies, using its own structured Sustainability Model since 2012—a management tool designed to construct trust relations with society based on four pillars: role leadership, innovation and technology, collaborative networking, and responsible entrepreneurism. The company has been a signatory to Global Compact since 2002 and states its commitment to the fulfillment of the Sustainable Development Goals.
https://www.samarco.com/en/diretoria-samarco-e-conselho-de-administracao/ https://www.samarco.com/wp-content/uploads/2016/08/2014-Anual-Sustainability-Report.pdf http://www.mining.com/samarco-iron-ore-mine-reopen-year/ https://www.samarco.com/en/noticia/comunicado-64/
3.4.15. Vale
Vale has about 166,000 employees and contractors (as of 2015) and is the world’s biggest mining company in iron ore, iron pellets, and nickel. It was founded in 1942, in Minas Gerais state, Brazil, as a state company and started operations in Itabira that same year. It has been a private company since 1997, although the Brazilian government still retains a share of the company’s governance through the BNDES (Brazil Development Bank). Vale produced 348.8 million tonnes of iron ore in 2016. It is the seventh-largest company in Latin America and the first one to obtain continental mining ranking. Its market value in 2017 was $44.5 billion, which makes it the fourth-largest
mining company in the world. Vale was the second most traded company on the New York Stock Exchange in 2014.
Vale has been a member of the World Business Council for Sustainable Development (WBCSD) since its establishment, in 1995 and is a member of the Global Compact Lead platform. Vale was recognized as one of the 100 most sustainable companies in the world, joining the Global 100 ranking, organized by Canada’s Corporate Knights, in the aspects of energy use, CO2 emissions, innovation, and health and safety. Vale is a member of the Executive Committee and the Leadership Committee of Sustainable Development Solutions Network (SDSN), and participates in the discussions of the Good Governance of Extractive Resources thematic group.
http://www.vale.com/brasil/EN/aboutvale/institutional-partnerships/Pages/default.aspx http://www.vale.com/EN/aboutvale/news/Documents/aniversario-en.html http://www.vale.com/EN/aboutvale/sustainability/Pages/default.aspx#pessoas http://www.vale.com/Style%20Library/RelatorioSustentabilidade17/EN/VALE_SustainabilityReport_2017.pdf http://www.vale.com/EN/investors/company/fact-sheet/Pages/default.aspx https://www.terra.com.br/noticias/bndes-aprova-financiamento-de-quase-r-39-bilhoes-para-a-vale,ea59a418851ca310VgnCLD200000bbcceb0aRCRD.html

63FOREST-SMART MINING
3.5. AUSTRALIAFigure 3.4 Relationship between Forests and Large-Scale Mining in Australia
Note: The country m
ap shows the
extent of forest cover (in green); the
bar graph
shows
the proportion
of m
ining that
occurs in
forests
compared to the global average of
countries containing MFAs; the pie
chart shows the proportion of global
MFAs in the country.
64 FOREST-SMART MINING
3.5.1. National Overview
Australia is a high-income country with a relatively small and wealthy population spread across a wide landmass. Mining is a significant primary industry and contributor to the Australian economy (approximately 8.5 percent of GDP). Australia’s economic demonstrated resources (EDR) of industrial diamond, gold, iron ore, lead, nickel, rutile, tantalum, uranium, zinc, and zircon are the world’s largest, while bauxite, coal, copper, ilmenite, lithium, manganese, silver, and tin rank in the top five worldwide. The industry directly employed approximately 173,388 people in 2015 and is often the main source of employment in rural areas. The sector contributes $A 12.7 billion in taxes and another $A 10 billion in royalties as payment for the minerals (to state governments). Both domestic and foreign-based mining companies (global giants such as BHP Billiton and Rio Tinto, as well as mid-tier producers and junior miners) operate in Australia. Robust land tenure and planning regulatory frameworks have been established, including legislation that supports and protects species, habitats, and areas designated for biodiversity conservation. The states make most of the mining-related legislation. The Commonwealth and state governments usually require biodiversity offsets where a development removes threatened species and/or habitats.
Forests extend across Australia’s northern tropical regions, east coast subtropical regions, and warm and cool temperate zones in the southeast. Australia contains 125 million hectares of forest, which amounts to 16 percent of Australia’s land area. More than 80 percent of Australia’s native forest area is dominated by eucalypt forest and acacia forest. In addition, industrial plantations cover approximately 2 million hectares. State and territory governments are primarily responsible for the management of both native and plantation forests. Economically, the forest sector is significantly smaller than the mining sector in terms of income and employment. The timber industry contributes approximately $A 22 billion to the economy (which represents approximately 1.5 percent of GDP). The industry employs approximately 66,000 people. In many areas, the forestry industry is shrinking and provides a significantly lower salary than employment in the mining sector. Very few people are directly reliant on forest resources for subsistence.
The World Bank rates Australia as a relatively easy place to do business and environmental protection policies are rated fairly highly.
Data sources
• Australian Bureau of Statistics. 2015. “Australian National Accounts: National Income, Expenditure and Product.” Canberra, Australia.
• Australian Government. 2016. “Australia’s Forests Overview.” 2016. http://www.agriculture.gov.au/abares/forestsaustralia/profiles/australias-forests.
• ———. 2017. “Australia’s Forest Policies.” 2017. http://www.agriculture.gov.au/forestry/policies.
• Global Forest Watch. 2016. “Global Forest Watch Website.” 2016. http://www.globalforestwatch.org.
• ICMM. 2016. “Role of Mining in National Economies.” 3rd ed. London, UK.
• The Red Desk. 2017. “The Red Desk Website.” 2017. http://thereddesk.org.
• The World Bank Group. 2016. The Little Data Book 2016. Washington DC: The World Bank. https://doi.org/10.1596/978-1-4648-0834-0.
——. 2017. The Little Green Data Book 2017. Washington D.C.: The World Bank Group. https://doi.org/10.1596/978- 1-4648-1034-3
3.5.2. National Forest-Smart Takeaways
• Strong regulatory systems can be the carrot and the stick for promoting forest-smart mining. Mining activities operate in a fairly mature regulatory system, which allows companies certainty over operations and tenure while also enabling reasonable biodiversity protection, including mechanisms to provide biodiversity offsets and requirements for rehabilitation.
• A strong civil society/academic sector can be important for supporting forest-smart mining. Significant academic and research facilities are available to facilitate measurement and mitigation of impacts.
• Strong national and state regulation on biodiversity protection and no net loss of biodiversity. Forest systems require no harm or no let loss outcomes based on their biodiversity and carbon sequestration values, thus deterring development in forests in some states, or requiring restoration and/or offsets to reach these objectives.
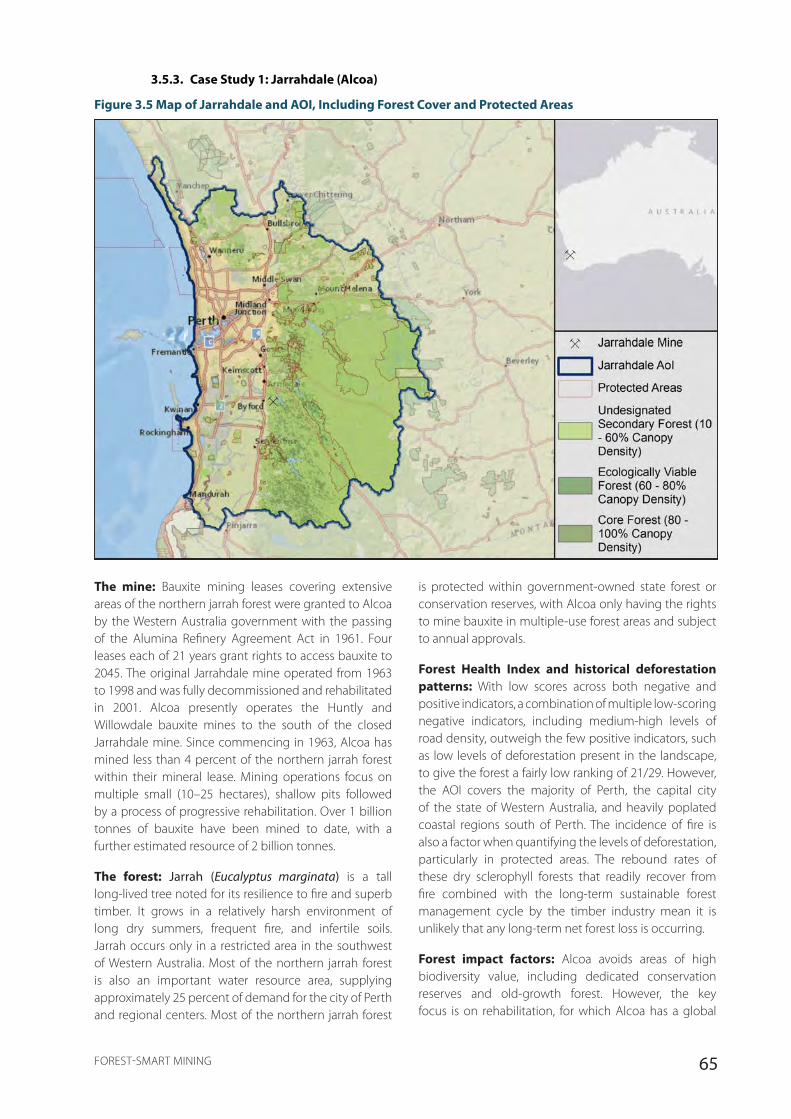
65FOREST-SMART MINING
3.5.3. Case Study 1: Jarrahdale (Alcoa)
Figure 3.5 Map of Jarrahdale and AOI, Including Forest Cover and Protected Areas
The mine: Bauxite mining leases covering extensive areas of the northern jarrah forest were granted to Alcoa by the Western Australia government with the passing of the Alumina Refinery Agreement Act in 1961. Four leases each of 21 years grant rights to access bauxite to 2045. The original Jarrahdale mine operated from 1963 to 1998 and was fully decommissioned and rehabilitated in 2001. Alcoa presently operates the Huntly and Willowdale bauxite mines to the south of the closed Jarrahdale mine. Since commencing in 1963, Alcoa has mined less than 4 percent of the northern jarrah forest within their mineral lease. Mining operations focus on multiple small (10–25 hectares), shallow pits followed by a process of progressive rehabilitation. Over 1 billion tonnes of bauxite have been mined to date, with a further estimated resource of 2 billion tonnes.
The forest: Jarrah (Eucalyptus marginata) is a tall long-lived tree noted for its resilience to fire and superb timber. It grows in a relatively harsh environment of long dry summers, frequent fire, and infertile soils. Jarrah occurs only in a restricted area in the southwest of Western Australia. Most of the northern jarrah forest is also an important water resource area, supplying approximately 25 percent of demand for the city of Perth and regional centers. Most of the northern jarrah forest
is protected within government-owned state forest or conservation reserves, with Alcoa only having the rights to mine bauxite in multiple-use forest areas and subject to annual approvals.
Forest Health Index and historical deforestation patterns: With low scores across both negative and positive indicators, a combination of multiple low-scoring negative indicators, including medium-high levels of road density, outweigh the few positive indicators, such as low levels of deforestation present in the landscape, to give the forest a fairly low ranking of 21/29. However, the AOI covers the majority of Perth, the capital city of the state of Western Australia, and heavily poplated coastal regions south of Perth. The incidence of fire is also a factor when quantifying the levels of deforestation, particularly in protected areas. The rebound rates of these dry sclerophyll forests that readily recover from fire combined with the long-term sustainable forest management cycle by the timber industry mean it is unlikely that any long-term net forest loss is occurring.
Forest impact factors: Alcoa avoids areas of high biodiversity value, including dedicated conservation reserves and old-growth forest. However, the key focus is on rehabilitation, for which Alcoa has a global
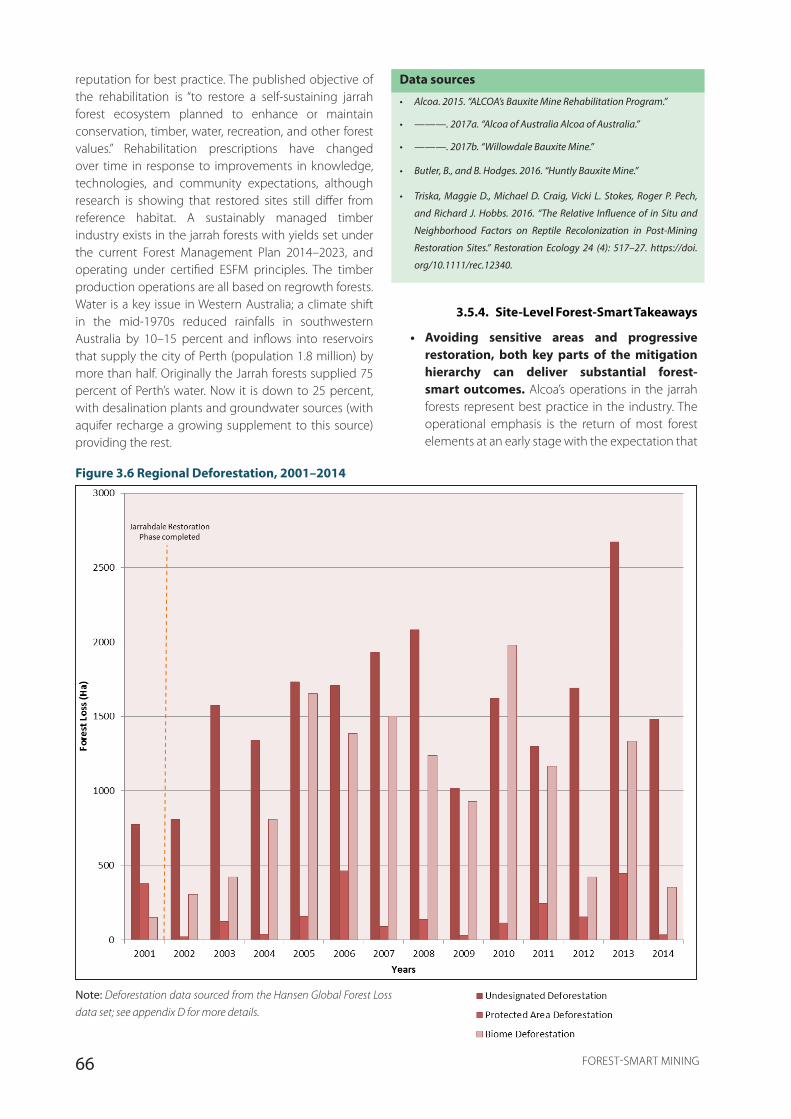
66 FOREST-SMART MINING
reputation for best practice. The published objective of the rehabilitation is “to restore a self-sustaining jarrah forest ecosystem planned to enhance or maintain conservation, timber, water, recreation, and other forest values.” Rehabilitation prescriptions have changed over time in response to improvements in knowledge, technologies, and community expectations, although research is showing that restored sites still differ from reference habitat. A sustainably managed timber industry exists in the jarrah forests with yields set under the current Forest Management Plan 2014–2023, and operating under certified ESFM principles. The timber production operations are all based on regrowth forests. Water is a key issue in Western Australia; a climate shift in the mid-1970s reduced rainfalls in southwestern Australia by 10–15 percent and inflows into reservoirs that supply the city of Perth (population 1.8 million) by more than half. Originally the Jarrah forests supplied 75 percent of Perth’s water. Now it is down to 25 percent, with desalination plants and groundwater sources (with aquifer recharge a growing supplement to this source) providing the rest.
Figure 3.6 Regional Deforestation, 2001–2014
Data sources
• Alcoa. 2015. “ALCOA’s Bauxite Mine Rehabilitation Program.”
• ———. 2017a. “Alcoa of Australia Alcoa of Australia.”
• ———. 2017b. “Willowdale Bauxite Mine.”
• Butler, B., and B. Hodges. 2016. “Huntly Bauxite Mine.”
• Triska, Maggie D., Michael D. Craig, Vicki L. Stokes, Roger P. Pech,
and Richard J. Hobbs. 2016. “The Relative Influence of in Situ and
Neighborhood Factors on Reptile Recolonization in Post-Mining
Restoration Sites.” Restoration Ecology 24 (4): 517–27. https://doi.
org/10.1111/rec.12340.
3.5.4. Site-Level Forest-Smart Takeaways
• Avoiding sensitive areas and progressive restoration, both key parts of the mitigation hierarchy can deliver substantial forest-smart outcomes. Alcoa’s operations in the jarrah forests represent best practice in the industry. The operational emphasis is the return of most forest elements at an early stage with the expectation that
Note: Deforestation data sourced from the Hansen Global Forest Loss
data set; see appendix D for more details.
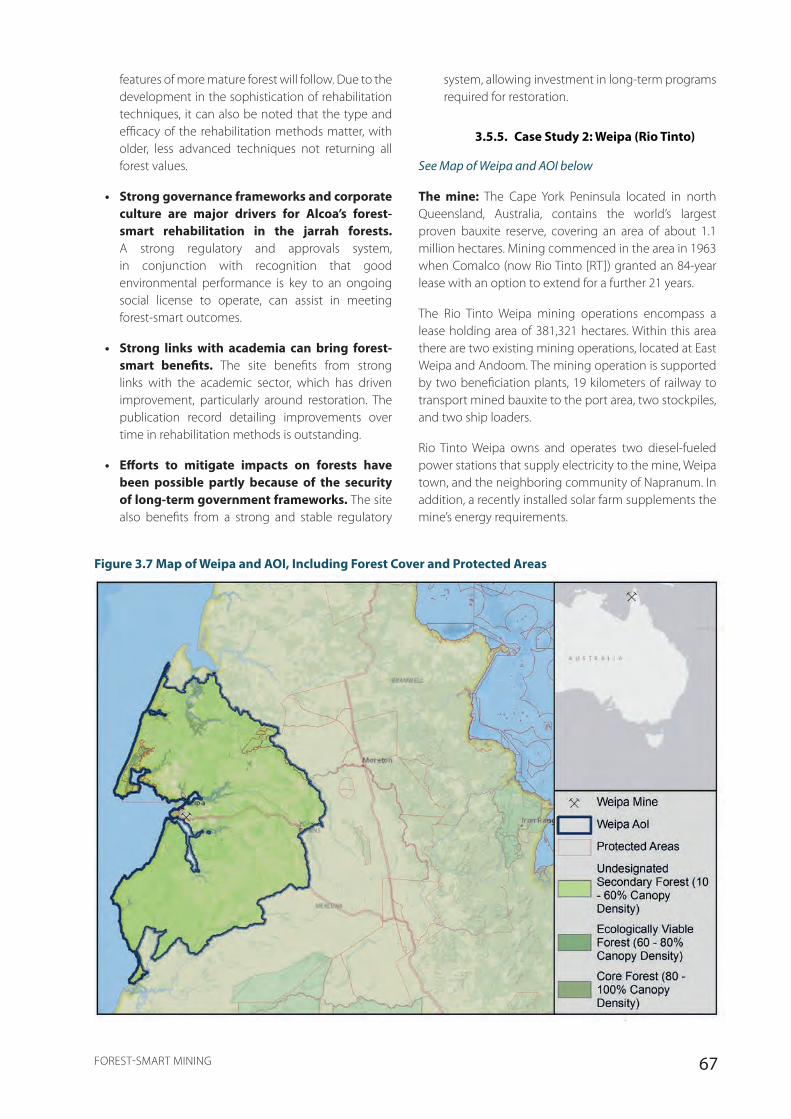
67FOREST-SMART MINING
features of more mature forest will follow. Due to the development in the sophistication of rehabilitation techniques, it can also be noted that the type and efficacy of the rehabilitation methods matter, with older, less advanced techniques not returning all forest values.
• Strong governance frameworks and corporate culture are major drivers for Alcoa’s forest-smart rehabilitation in the jarrah forests. A strong regulatory and approvals system, in conjunction with recognition that good environmental performance is key to an ongoing social license to operate, can assist in meeting forest-smart outcomes.
• Strong links with academia can bring forest-smart benefits. The site benefits from strong links with the academic sector, which has driven improvement, particularly around restoration. The publication record detailing improvements over time in rehabilitation methods is outstanding.
• Efforts to mitigate impacts on forests have been possible partly because of the security of long-term government frameworks. The site also benefits from a strong and stable regulatory
system, allowing investment in long-term programs required for restoration.
3.5.5. Case Study 2: Weipa (Rio Tinto)
See Map of Weipa and AOI below
The mine: The Cape York Peninsula located in north Queensland, Australia, contains the world’s largest proven bauxite reserve, covering an area of about 1.1 million hectares. Mining commenced in the area in 1963 when Comalco (now Rio Tinto [RT]) granted an 84-year lease with an option to extend for a further 21 years.
The Rio Tinto Weipa mining operations encompass a lease holding area of 381,321 hectares. Within this area there are two existing mining operations, located at East Weipa and Andoom. The mining operation is supported by two beneficiation plants, 19 kilometers of railway to transport mined bauxite to the port area, two stockpiles, and two ship loaders.
Rio Tinto Weipa owns and operates two diesel-fueled power stations that supply electricity to the mine, Weipa town, and the neighboring community of Napranum. In addition, a recently installed solar farm supplements the mine’s energy requirements.
Figure 3.7 Map of Weipa and AOI, Including Forest Cover and Protected Areas
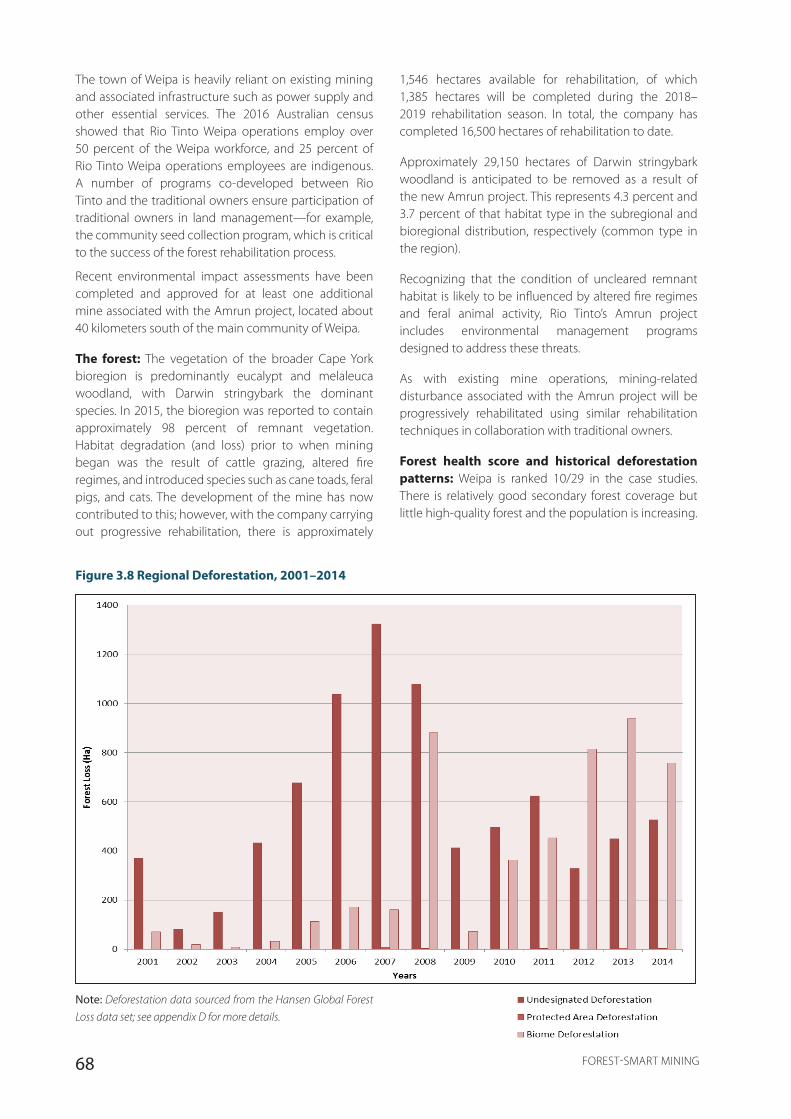
68 FOREST-SMART MINING
The town of Weipa is heavily reliant on existing mining and associated infrastructure such as power supply and other essential services. The 2016 Australian census showed that Rio Tinto Weipa operations employ over 50 percent of the Weipa workforce, and 25 percent of Rio Tinto Weipa operations employees are indigenous. A number of programs co-developed between Rio Tinto and the traditional owners ensure participation of traditional owners in land management—for example, the community seed collection program, which is critical to the success of the forest rehabilitation process.
Recent environmental impact assessments have been completed and approved for at least one additional mine associated with the Amrun project, located about 40 kilometers south of the main community of Weipa.
The forest: The vegetation of the broader Cape York bioregion is predominantly eucalypt and melaleuca woodland, with Darwin stringybark the dominant species. In 2015, the bioregion was reported to contain approximately 98 percent of remnant vegetation. Habitat degradation (and loss) prior to when mining began was the result of cattle grazing, altered fire regimes, and introduced species such as cane toads, feral pigs, and cats. The development of the mine has now contributed to this; however, with the company carrying out progressive rehabilitation, there is approximately
1,546 hectares available for rehabilitation, of which 1,385 hectares will be completed during the 2018–2019 rehabilitation season. In total, the company has completed 16,500 hectares of rehabilitation to date.
Approximately 29,150 hectares of Darwin stringybark woodland is anticipated to be removed as a result of the new Amrun project. This represents 4.3 percent and 3.7 percent of that habitat type in the subregional and bioregional distribution, respectively (common type in the region).
Recognizing that the condition of uncleared remnant habitat is likely to be influenced by altered fire regimes and feral animal activity, Rio Tinto’s Amrun project includes environmental management programs designed to address these threats.
As with existing mine operations, mining-related disturbance associated with the Amrun project will be progressively rehabilitated using similar rehabilitation techniques in collaboration with traditional owners.
Forest health score and historical deforestation patterns: Weipa is ranked 10/29 in the case studies. There is relatively good secondary forest coverage but little high-quality forest and the population is increasing.
Figure 3.8 Regional Deforestation, 2001–2014
Note: Deforestation data sourced from the Hansen Global Forest
Loss data set; see appendix D for more details.
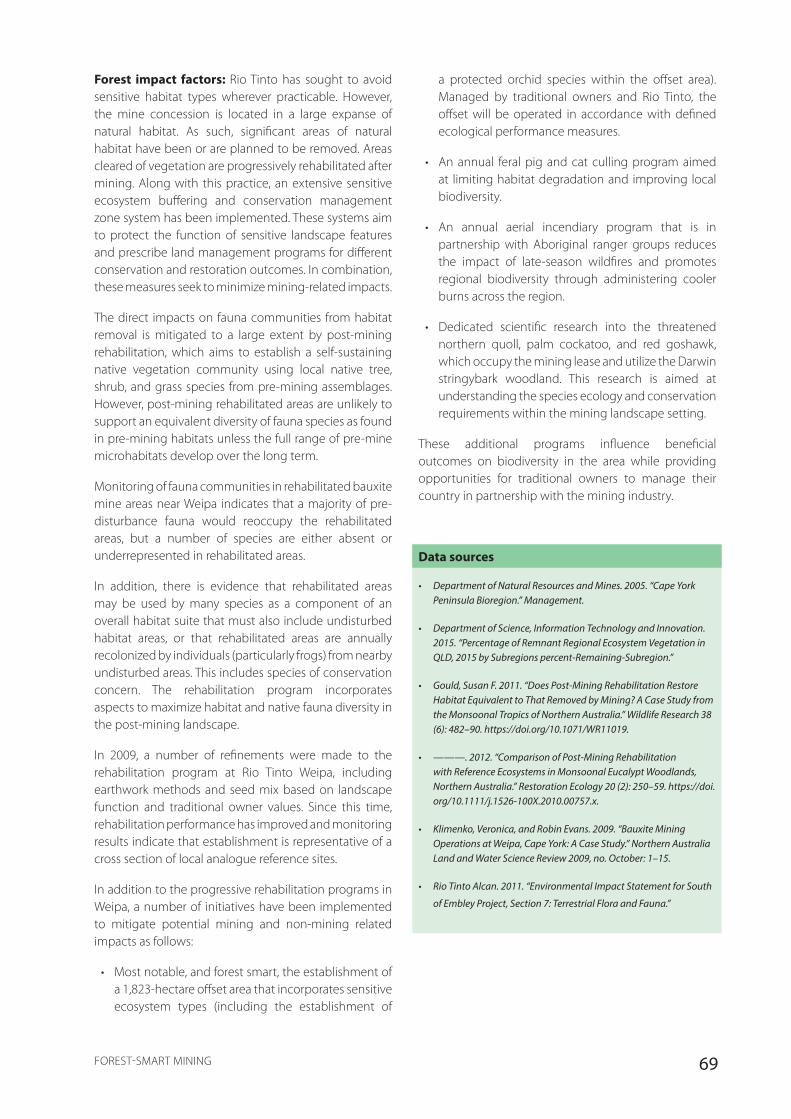
69FOREST-SMART MINING
Forest impact factors: Rio Tinto has sought to avoid sensitive habitat types wherever practicable. However, the mine concession is located in a large expanse of natural habitat. As such, significant areas of natural habitat have been or are planned to be removed. Areas cleared of vegetation are progressively rehabilitated after mining. Along with this practice, an extensive sensitive ecosystem buffering and conservation management zone system has been implemented. These systems aim to protect the function of sensitive landscape features and prescribe land management programs for different conservation and restoration outcomes. In combination, these measures seek to minimize mining-related impacts.
The direct impacts on fauna communities from habitat removal is mitigated to a large extent by post-mining rehabilitation, which aims to establish a self-sustaining native vegetation community using local native tree, shrub, and grass species from pre-mining assemblages. However, post-mining rehabilitated areas are unlikely to support an equivalent diversity of fauna species as found in pre-mining habitats unless the full range of pre-mine microhabitats develop over the long term.
Monitoring of fauna communities in rehabilitated bauxite mine areas near Weipa indicates that a majority of pre-disturbance fauna would reoccupy the rehabilitated areas, but a number of species are either absent or underrepresented in rehabilitated areas.
In addition, there is evidence that rehabilitated areas may be used by many species as a component of an overall habitat suite that must also include undisturbed habitat areas, or that rehabilitated areas are annually recolonized by individuals (particularly frogs) from nearby undisturbed areas. This includes species of conservation concern. The rehabilitation program incorporates aspects to maximize habitat and native fauna diversity in the post-mining landscape.
In 2009, a number of refinements were made to the rehabilitation program at Rio Tinto Weipa, including earthwork methods and seed mix based on landscape function and traditional owner values. Since this time, rehabilitation performance has improved and monitoring results indicate that establishment is representative of a cross section of local analogue reference sites.
In addition to the progressive rehabilitation programs in Weipa, a number of initiatives have been implemented to mitigate potential mining and non-mining related impacts as follows:
• Most notable, and forest smart, the establishment of a 1,823-hectare offset area that incorporates sensitive ecosystem types (including the establishment of
a protected orchid species within the offset area). Managed by traditional owners and Rio Tinto, the offset will be operated in accordance with defined ecological performance measures.
• An annual feral pig and cat culling program aimed at limiting habitat degradation and improving local biodiversity.
• An annual aerial incendiary program that is in partnership with Aboriginal ranger groups reduces the impact of late-season wildfires and promotes regional biodiversity through administering cooler burns across the region.
• Dedicated scientific research into the threatened northern quoll, palm cockatoo, and red goshawk, which occupy the mining lease and utilize the Darwin stringybark woodland. This research is aimed at understanding the species ecology and conservation requirements within the mining landscape setting.
These additional programs influence beneficial outcomes on biodiversity in the area while providing opportunities for traditional owners to manage their country in partnership with the mining industry.
Data sources
• Department of Natural Resources and Mines. 2005. “Cape York Peninsula Bioregion.” Management.
• Department of Science, Information Technology and Innovation. 2015. “Percentage of Remnant Regional Ecosystem Vegetation in QLD, 2015 by Subregions percent-Remaining-Subregion.”
• Gould, Susan F. 2011. “Does Post-Mining Rehabilitation Restore Habitat Equivalent to That Removed by Mining? A Case Study from the Monsoonal Tropics of Northern Australia.” Wildlife Research 38 (6): 482–90. https://doi.org/10.1071/WR11019.
• ———. 2012. “Comparison of Post-Mining Rehabilitation with Reference Ecosystems in Monsoonal Eucalypt Woodlands, Northern Australia.” Restoration Ecology 20 (2): 250–59. https://doi.org/10.1111/j.1526-100X.2010.00757.x.
• Klimenko, Veronica, and Robin Evans. 2009. “Bauxite Mining Operations at Weipa, Cape York: A Case Study.” Northern Australia Land and Water Science Review 2009, no. October: 1–15.
• Rio Tinto Alcan. 2011. “Environmental Impact Statement for South
of Embley Project, Section 7: Terrestrial Flora and Fauna.”

70 FOREST-SMART MINING
3.5.6. Site-Level Forest-Smart Takeaways
• Weipa represents a potentially important forest-smart target case for the future. With current expansion plans looking set to markedly increase forest impacts, Weipa is a strong candidate for prioritizing forest-smart approaches.
• Do not rely on restoration alone to achieve forest smartness. The primary mitigation focus is on rehabilitation and other initiatives to improve biodiversity, which retains limitations to its effectiveness.
• Strong links with academia can bring forest-smart benefits. The company has benefited from access to research facilities for habitat mapping across the state and guidance material managed. Similarly, the company has sought to work with the state herbarium to refine regional ecosystem mapping.
3.6. BRAZIL
3.6.1. National Overview
Brazil holds the third-largest global iron ore reserves’ world, with 23 billion tonnes (equivalent to 13.2 percent of world’s total reserves). The country holds other important reserves such as niobium (95.3 percent of world’s reserves), manganese (16.8 percent), tin (around 14.9 percent), nickel (12.8 percent), bauxite (9.2 percent), and gold (4.2 percent) (George 2017). Mining in Brazil is responsible for 4 percent of the national GDP (Departamento Nacional de Produção Mineral (DNPM) 2015). In 2016, the total of mineral exports, equivalent to almost 400 million tonnes (mostly iron ore), totaled $36 billion and accounted for about 20 percent of the total exports of the Brazilian trade balance (Government of Brazil 2017). Vale SA is by far the largest company in terms of production and revenues, with $29.4 billion in net revenues over 2016. It’s the world’s largest producer of iron and nickel (VALE 2016). The new National Mining Agency is linked to the Ministry of Mining and Energy, and has competence to promote the concessions for exploitation and use of mineral resources, and to set regulations, exercising control over compliance performance of mining activities, in conjunction with environmental agencies.
Around 60 percent of Brazil’s territory is still covered by natural vegetation, mostly forests, although they are concentrated in the Amazon biome. The second-largest forest biome in Brazil is Atlantic Forest, which is much more degraded than Amazon, with only 14 percent remaining. Despite federal and state government recent
efforts, deforestation rates are still very high, about 3.6 million hectares per year. Protected areas cover 18 percent of Brazil’s territory and 39 percent of the remaining area of native vegetation; however, only 6 percent of total territory is under restriction through strictly protected areas. Recent changes in Brazil’s Forest Code (2012) made the obligations in terms of natural forests conservation and recovery clearer for rural landowners (individuals and companies). The Environmental Rural Registry (“Cadastro Ambiental Rural,” or CAR), a mandatory online register of relevant environmental information for each rural property in Brazil, is also an important step.
Brazil’s position on REDD+ is that there is no expectation that emissions avoided by deforestation reduction could generate payments for REDD+ to meet their mitigation commitments under the UNFCCC; that is, the Brazilian government doesn’t support an offsetting approach. Countries and companies may voluntarily collaborate with national funds to protect forests, as long as the donations are not transformed into rights or credits of any kind. Instead, Brazil uses the Amazonia Fund, which so far has received about $890 million, with $390 million already invested. The fund resources may only be invested in forest protection projects that are additional to obligatory deforestation reduction commitments as defined in Brazil’s Nationally Determined Contributions (NDCs).
Data sources
• Alves, Patricia. 2015. “Tributação E Royalties Da Mineração No Brasil: Uma Análise Comparativa.” https://doi.org/10.1017/CBO9781107415324.004.
• Brancalion, Pedro H.S., Letícia C. Garcia, Rafael Loyola, Ricardo R. Rodrigues, Valério D. Pillar, and Thomas M. Lewinsohn. 2016. “Análise Crítica Da Lei de Proteção Da Vegetação Nativa (2012), Que Substituiu o Antigo Código Florestal: Atualizações e Ações Em Curso.” Natureza & Conservação 14: e1–16. https://doi.org/10.1016/j.ncon.2016.03.004.
• Brazil/House of Representatives. 2017a. “Fichadetramitacao_MPV790_2017.” 2017.
• ———. 2017b. MEDIDA PROVISÓRIA No 790, DE 25 DE JULHO DE 2017. Altera o Decreto-Lei N.
• Brazil. 2000. Law_9985_2000_Protected_Areas_National_System.
• ———. 2012. Law12651_2012_Native_Vegetation_Protection.
• ———. 2017a. “Brasil Exportou US$ 36,6 Bilhões Em Bens Minerais Em 2016 — Governo Do Brasil.”
• ———. 2017b. Law_13540_2017_Brazil_Mining_royalties.
• ———. 2017c. “Law_13575_2017_Brazil_Mining_Agency.”
• ———. 2017d. “Mudanças Na Legislação Deixam Setor Mais Atrativo e Seguro; Entenda — Planalto.” 2017.
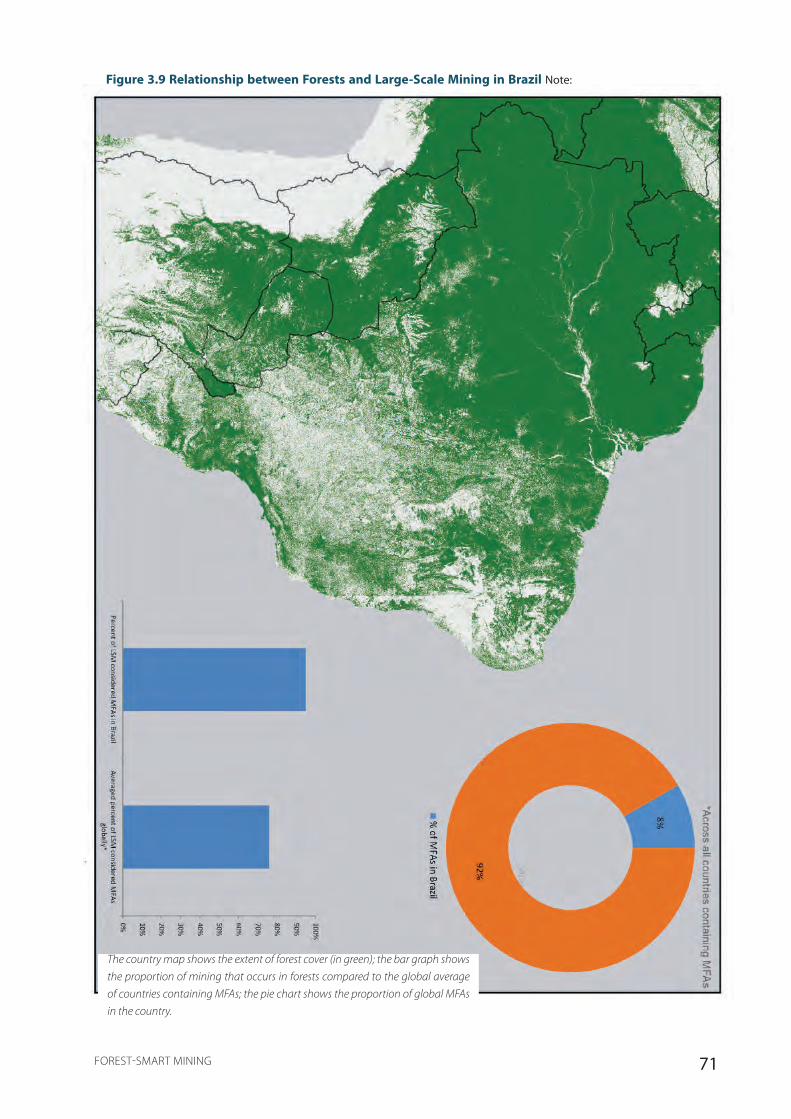
71FOREST-SMART MINING
Figure 3.9 Relationship between Forests and Large-Scale Mining in Brazil Note:
The country map shows the extent of forest cover (in green); the bar graph shows
the proportion of mining that occurs in forests compared to the global average
of countries containing MFAs; the pie chart shows the proportion of global MFAs
in the country.

72 FOREST-SMART MINING
• ———. 2017e. “Setor de Mineração Atinge Superávit de US$ 11,5 Bilhões — Governo Do Brasil.” 2017.
• Brazil, CONAMA/. 1986. Resolution - Environmental Licensing. Vol. 1.
• “Brazil Forest Service.” n.d.
• Castilhos, Z., Rodrigues-Filho, S., Cesar, R. et al. 2015. “Human Exposure and Risk Assessment Associated with Mercury Contamination in Artisanal Gold Mining Areas in the Brazilian Amazon.” Environ Sci Pollut Res 22 (15): 11255–11264.
• CIA. 2017. “The World Factbook — Central Intelligence Agency.” The World Factbook. https://doi.org/10.1177/004728573949815689.
• “Conferência Do Clima_ Empresários Pressionam Por Financeirização de Florestas, Mas Governo Resiste.” n.d.
• DNPM. 2015. “SUMÁRIO MINERAL Departamento Nacional de Produção Mineral” 35.
• Estado de São Paulo. 2017. “Projetos Poderiam Liberar 5 Milhões de Ha de Florestas à Mineração,” 2017.
• George, Micheal W. 2017. Mineral Commodity Summaries 2017. Mineral Commodity Summaries 2017. https://doi.org/https://doi.org/10.3133/70180197.
• Global Forest Watch. 2016. “Global Forest Watch Website.” 2016. http://www.globalforestwatch.org.
• Hsu et al, A. 2016. “2016 Environmental Performance Index.” Yale Center for Environmental Law & Policy, 123. https://doi.org/10.13140/RG.2.2.19868.90249.
• IBÁ. 2015. “Indústria Brasileira de Árvores - Dados e Estatísticas.” 2015.
• “IBAMA.” n.d.
• ———. 2013. “Guia Prático FCA.”
• IBGE. 2016. “Mudanças Na Cobertura e Uso Da Terra.” Instituto Brasileiro de Geografia e Estatística 1 (1): 1–29.
• ICMM. 2016a. “Role of Mining in National Economies.” 3rd ed. London, UK.
• ———. 2016b. Role of Mining in National Economies :Mining Contribution Index. Role of Mining in National Economies. 3rd ed.
• Imazon. 2017. “Emissões Do Setor de Mudança Do Uso Da Terra - Período 1990-2015.”
• Jackson, Taylor, and Kenneth P. Green. 2016. “Annual Survey of Mining Companies 2016.” Vancouver, Canada.
• Mineração, Noticias de. 2017. “Mineração Pode Gerar 2 Milhões de Empregos Até 2018 - HP Mineração.” 2017.
• Mineral, Brasil. 2017. “Maiores_empresas_brasil_2016.Pdf.” Revista Brasil Mineral, 2017.
• Miranda, Evaristo Eduardo De. 2017. “Meio Ambiente : A Salvação Pela Lavoura,” 38–44.
• MMA-Brazil. 2015. “Unidades de Conservação Por Bioma.” Unidades de Conservação Por Bioma.
• Others, RAISG & EDF & WHRC &. 2017. “Amazonian Indigenous Peoples Territories and Their Forests Related to Climate Change : Analyses and Policy Options Table of Contents.”
• Soares-filho, Britaldo, Raoni Rajão, Marcia Macedo, Arnaldo Carneiro, William Costa, Michael Coe, Hermann Rodrigues, and Ane Alencar. 2014. “Cracking Brazil ’ s Forest Code.” Science 344 (April): 363–64. https://doi.org/10.1126/science.124663.
• SOSMA e INPE. 2017. “ATLAS DOS REMANESCENTES FLORESTAIS DA MATA ATLÂNTICA PERÍODO 2015-2016.”
• Tambosi, Leandro. 2014. “Estratégias Espaciais Baseadas Em Ecologia de Paisagens Para a Otimização Dos Esforços de Restauração,” 1–116.
• The Red Desk. 2017. “The Red Desk Website.” 2017. http://thereddesk.org.
• The World Bank. n.d. “Adjusted Savings_ Net Forest Depletion (% of GNI) _ Data.”
• ———. n.d. “Ease of Doing Business Rank.”
• The World Bank Group. 2016. The Little Data Book 2016. Washington DC: The World Bank. https://doi.org/10.1596/978-1-4648-0834-0.
• ———. 2017. The Little Green Data Book 2017. Washington D.C.: The World Bank Group. https://doi.org/10.1596/978- 1-4648-1034-3.
• Transparency International. n.d. “Corruptions Perception Index 2016.”
• VALE. 2016. “Desempenho Da Vale No 4T15,” no. 4: 1–14.

73FOREST-SMART MINING
3.6.2. National Forest-Smart Takeaways
• Brazil should be a priority country for developing forest-smart mining. Due to the size of both its mining industry and its forests, Brazil would be one of the major beneficiaries of forest-smart mining, particularly for iron ore mining.
• Achieving forest-smart mining requires a better understanding of forest value. With deforestation being a major environmental challenge in Brazil, improving understanding and awareness of the multiple values of native forests will be important.
• Forest-smart mining will require better alignment of the new forest and mining codes. The new Forest Code has strengthened forest governance, but at the same time the new Mining Code (2017) has yet to improve environmental responsibility of mining companies because the National Congress has not yet approved it. There is also concern over the possible relaxation of rules regarding the environmental licensing process being discussed within the National Congress.
• Forest-smart mining will require coordination between more than just the mining and forest sectors. Many of the forest landscapes requiring
forest-smart action from the mining sector are also facing challenges from agriculture, water extraction, urbanization, and other factors. A forest-smart approach to mining will have to consider not only mining companies but also other significant stakeholders in the landscape, too.
• Forest-smart mining needs to take into account other competing land uses in the landscape. The Iron Quadrangle, the area of important geological interest for iron ore and gold mining, is also under extreme pressure from urbanization, agriculture, forest exploitation, and water provisioning. Careful integrated land use and development planning is required to balance these land uses to avoid unsustainable trade-offs or conflict between land users.
• A mosaic of issues in the landscape related to widespread mining across a vast mineral province. There are some attempts at controlling development footprint with legal requirements for set-asides and compensation for the forest systems (Cerrado and Mata Atlantica), but these haven’t always been adhered to. There is also impact on forest loss from agriculture, which is also a dominant activity in this landscape. The spikes in deforestation are primarily relative to mine development periods.
3.6.3. Case Study 4: Germano Mining Complex (BHP/Vale – Samarco)
Figure 3.10 Map of Germano and AOI, Including Forest Cover and Protected Areas
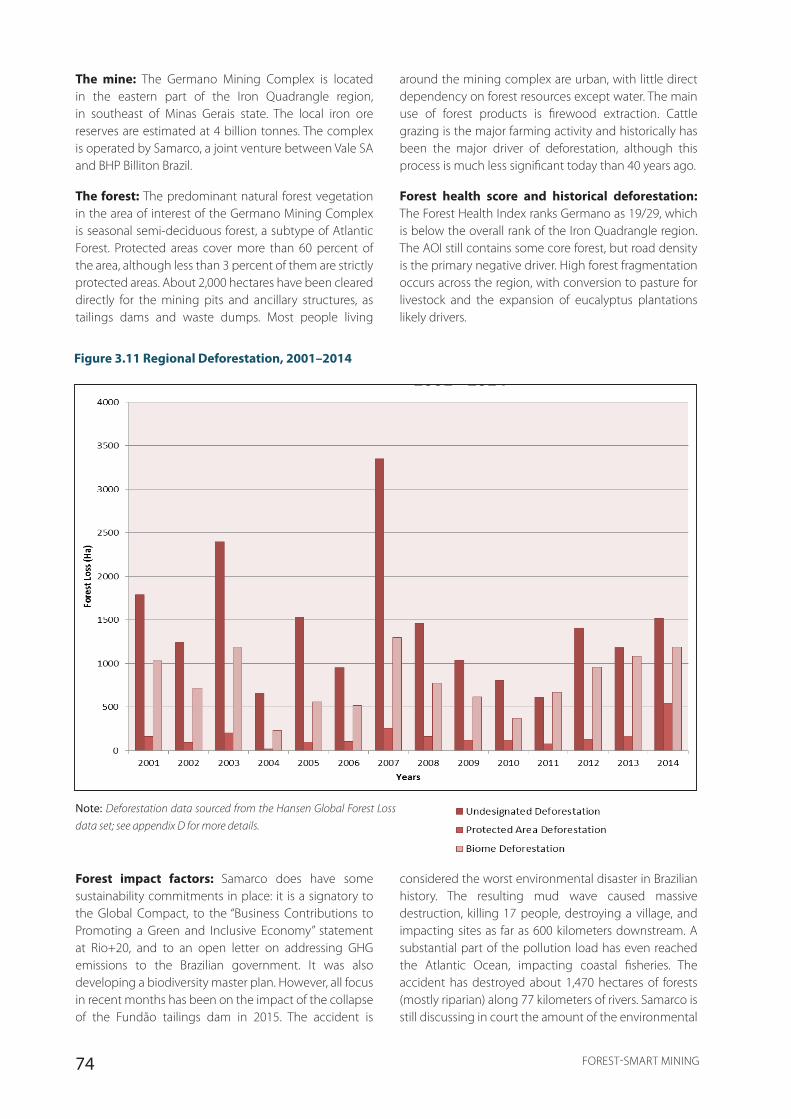
74 FOREST-SMART MINING
The mine: The Germano Mining Complex is located in the eastern part of the Iron Quadrangle region, in southeast of Minas Gerais state. The local iron ore reserves are estimated at 4 billion tonnes. The complex is operated by Samarco, a joint venture between Vale SA and BHP Billiton Brazil.
The forest: The predominant natural forest vegetation in the area of interest of the Germano Mining Complex is seasonal semi-deciduous forest, a subtype of Atlantic Forest. Protected areas cover more than 60 percent of the area, although less than 3 percent of them are strictly protected areas. About 2,000 hectares have been cleared directly for the mining pits and ancillary structures, as tailings dams and waste dumps. Most people living
Figure 3.11 Regional Deforestation, 2001–2014
around the mining complex are urban, with little direct dependency on forest resources except water. The main use of forest products is firewood extraction. Cattle grazing is the major farming activity and historically has been the major driver of deforestation, although this process is much less significant today than 40 years ago.
Forest health score and historical deforestation: The Forest Health Index ranks Germano as 19/29, which is below the overall rank of the Iron Quadrangle region. The AOI still contains some core forest, but road density is the primary negative driver. High forest fragmentation occurs across the region, with conversion to pasture for livestock and the expansion of eucalyptus plantations likely drivers.
Note: Deforestation data sourced from the Hansen Global Forest Loss
data set; see appendix D for more details.
considered the worst environmental disaster in Brazilian history. The resulting mud wave caused massive destruction, killing 17 people, destroying a village, and impacting sites as far as 600 kilometers downstream. A substantial part of the pollution load has even reached the Atlantic Ocean, impacting coastal fisheries. The accident has destroyed about 1,470 hectares of forests (mostly riparian) along 77 kilometers of rivers. Samarco is still discussing in court the amount of the environmental
Forest impact factors: Samarco does have some sustainability commitments in place: it is a signatory to the Global Compact, to the “Business Contributions to Promoting a Green and Inclusive Economy” statement at Rio+20, and to an open letter on addressing GHG emissions to the Brazilian government. It was also developing a biodiversity master plan. However, all focus in recent months has been on the impact of the collapse of the Fundão tailings dam in 2015. The accident is

75FOREST-SMART MINING
and social reparations needed to mitigate the massive impacts of the dam burst; two civil suits are proposing remediation investments close to $48 billion. More recently, the federal public prosecutor and Samarco have signed an agreement to extend the deadline for definition of the reparation value, and the judge assigned an external audit for this evaluation.
Data sources
• Brancalion, Pedro H.S., Letícia C. Garcia, Rafael Loyola, Ricardo R. Rodrigues, Valério D. Pillar, and Thomas M. Lewinsohn. 2016. “Análise Crítica Da Lei de Proteção Da Vegetação Nativa (2012), Que Substituiu o Antigo Código Florestal: Atualizações e Ações Em Curso.” Natureza & Conservação 14: e1–16. https://doi.org/10.1016/j.ncon.2016.03.004.
• Brazil. 2012. Law12651_2012_Native_Vegetation_Protection.
• IBAMA. 2015. “Laudo Técnico Preliminar.”
• ———. 2017. “Operation Augias - Oversight of Environmental Recovery Actions,” 1–3.
• IEF-MG. n.d. “Criação de Unidades de Conservação.”
• SAMARCO. 2014. “Relatório de Sustentabilidade 2014.”
• ———. 2017. “Relatório Bienal 2015-2016,” 1–96.
• Samarco mineração. 2014. “Relatório Da Administração e Demonstrações Financeiras.” Relatório Anual.
• ———. 2017. “Biennial Report.”
3.6.4. Site-Level Forest-Smart Takeaways
• Forest-smart approaches are a subset of a wider approach to responsible mining. Actions that mitigate impacts on forests should be part of an overall responsible approach to health, safety, stakeholder welfare, and the environment. Any complacency on one aspect can lead to major impacts in all other aspects.
• Mining accidents represent a major form of forest impact. The Samarco tailings dam collapse illustrates the potential environmental impacts a large mine can have far beyond the AOI used in the case studies, the importance of robust management procedures to avoid problems in the first place, and how a major accident can invalidate all other mitigation efforts.
• Effective regulation and enforcement is required to prevent large-scale forest impacts. While it appears the accident was the fault of the company, at the government level the risks were not identified and addressed before it was too late.

76 FOREST-SMART MINING
3.6.5. Case Study 5: Itabira Mining Complex (Vale)
Figure 3.12 Map of Itabira and AOI, Including Forest Cover and Protected Areas
The mine: The Itabira Mining Complex is located in the northeastern part of the Iron Quadrangle region, in Minas Gerais state. It is an opencast iron mining operation with six mines, covering about 180 square kilometers with ancillary structures and 27 tailings dams and waste dumps. Mining activities started in 1942. Cauê, the first and most important mine, was closed in 2004 and now is used as waste dump (the low-quality iron ore mixed with wastes is now reprocessed using new industrial processes). The average gross production of iron ore is 40 million tonnes per year.
The forest: The predominant natural vegetation in the area is seasonal semi-deciduous forest, a subtype of Atlantic Forest, with only 10.3 percent of this vegetation still standing in the state. Thirty strictly protected areas exist around Itabira, among them the Serra do Cipó National Park (30 kilometers away), which protects significant remnants of rocky fields, one of the rarest vegetation types in Brazil. Livestock are the main driver of deforestation in the region, especially since the decline of gold mining. The biggest dependency on ecosystem services is likely to be water, with the two rivers that supply the nearest city originating in the area. Vale shares water from its dams with the municipality for urban water supply.
Forest health score and historical deforestation: The Forest Health Index ranks Itabira 13/29, better than the wider Iron Quadrangle region on average. Like Germano, the primary positive variable is the amount of core forest remaining and road density is the primary negative variable.
Forest impact factors: Vale’s primary management response to forest impacts is to obtain private lands for conservation. Vale’s network of private natural heritage reserves (RPPN in Portuguese) in the Iron Quadrangle numbers 10 established reserves and 50 under varying stages of implementation, with plans to achieve a total of 70 RPPNs across the region, summing up almost 14,000 hectares (1.8 percent of official Iron Quadrangle total area). The total natural area within Vale’s properties in the Iron Quadrangle is equal to 68,000 hectares, which represents more than half of Vale’s total estate in the region and almost 9 percent of the Iron Quadrangle’s total area. Vale has also developed a Program for Improvement of Degraded Areas Recovery (PRORAD) with the pilot developed in the Iron Quadrangle, with an objective to consolidate and disseminate best practices over all Vale operations. The company has also supported research on the botany of iron yoke areas and has launched a guide of native plants for recovery of the closed mining areas.
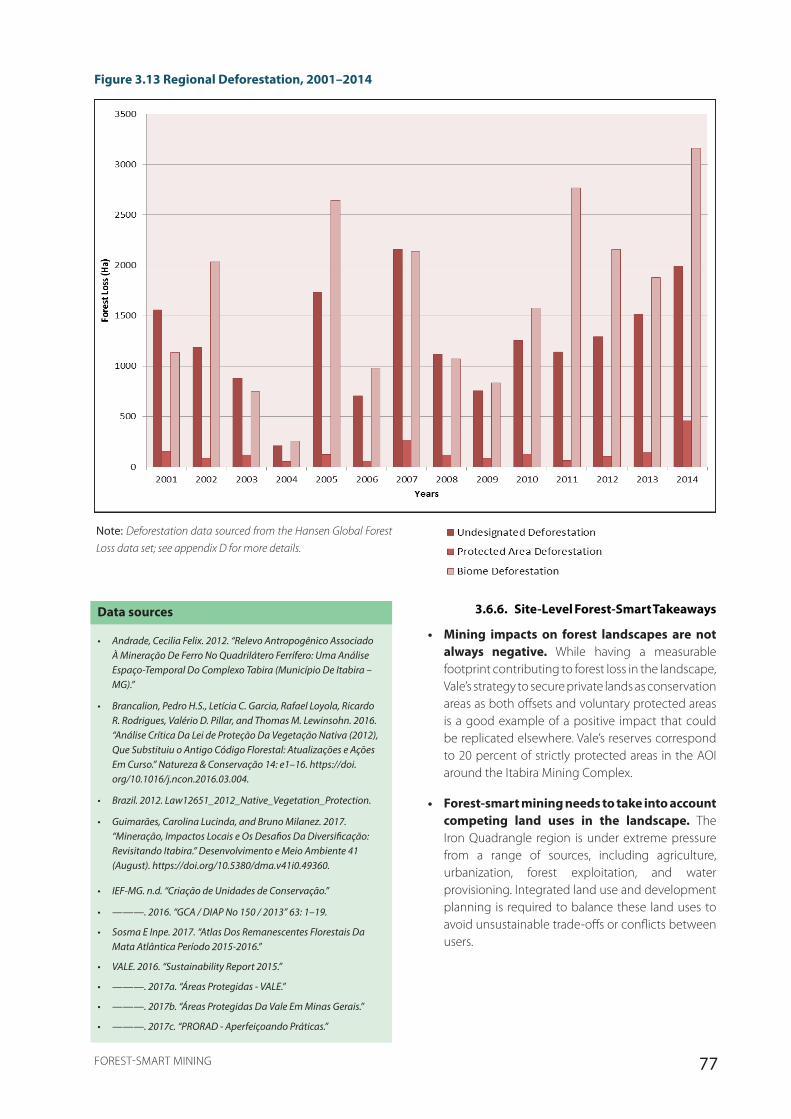
77FOREST-SMART MINING
Figure 3.13 Regional Deforestation, 2001–2014
3.6.6. Site-Level Forest-Smart Takeaways
• Mining impacts on forest landscapes are not always negative. While having a measurable footprint contributing to forest loss in the landscape, Vale’s strategy to secure private lands as conservation areas as both offsets and voluntary protected areas is a good example of a positive impact that could be replicated elsewhere. Vale’s reserves correspond to 20 percent of strictly protected areas in the AOI around the Itabira Mining Complex.
• Forest-smart mining needs to take into account competing land uses in the landscape. The Iron Quadrangle region is under extreme pressure from a range of sources, including agriculture, urbanization, forest exploitation, and water provisioning. Integrated land use and development planning is required to balance these land uses to avoid unsustainable trade-offs or conflicts between users.
Note: Deforestation data sourced from the Hansen Global Forest
Loss data set; see appendix D for more details.
Data sources
• Andrade, Cecilia Felix. 2012. “Relevo Antropogênico Associado À Mineração De Ferro No Quadrilátero Ferrífero: Uma Análise Espaço-Temporal Do Complexo Tabira (Município De Itabira – MG).”
• Brancalion, Pedro H.S., Letícia C. Garcia, Rafael Loyola, Ricardo R. Rodrigues, Valério D. Pillar, and Thomas M. Lewinsohn. 2016. “Análise Crítica Da Lei de Proteção Da Vegetação Nativa (2012), Que Substituiu o Antigo Código Florestal: Atualizações e Ações Em Curso.” Natureza & Conservação 14: e1–16. https://doi.org/10.1016/j.ncon.2016.03.004.
• Brazil. 2012. Law12651_2012_Native_Vegetation_Protection.
• Guimarães, Carolina Lucinda, and Bruno Milanez. 2017. “Mineração, Impactos Locais e Os Desafios Da Diversificação: Revisitando Itabira.” Desenvolvimento e Meio Ambiente 41 (August). https://doi.org/10.5380/dma.v41i0.49360.
• IEF-MG. n.d. “Criação de Unidades de Conservação.”
• ———. 2016. “GCA / DIAP No 150 / 2013” 63: 1–19.
• Sosma E Inpe. 2017. “Atlas Dos Remanescentes Florestais Da Mata Atlântica Período 2015-2016.”
• VALE. 2016. “Sustainability Report 2015.”
• ———. 2017a. “Áreas Protegidas - VALE.”
• ———. 2017b. “Áreas Protegidas Da Vale Em Minas Gerais.”
• ———. 2017c. “PRORAD - Aperfeiçoando Práticas.”
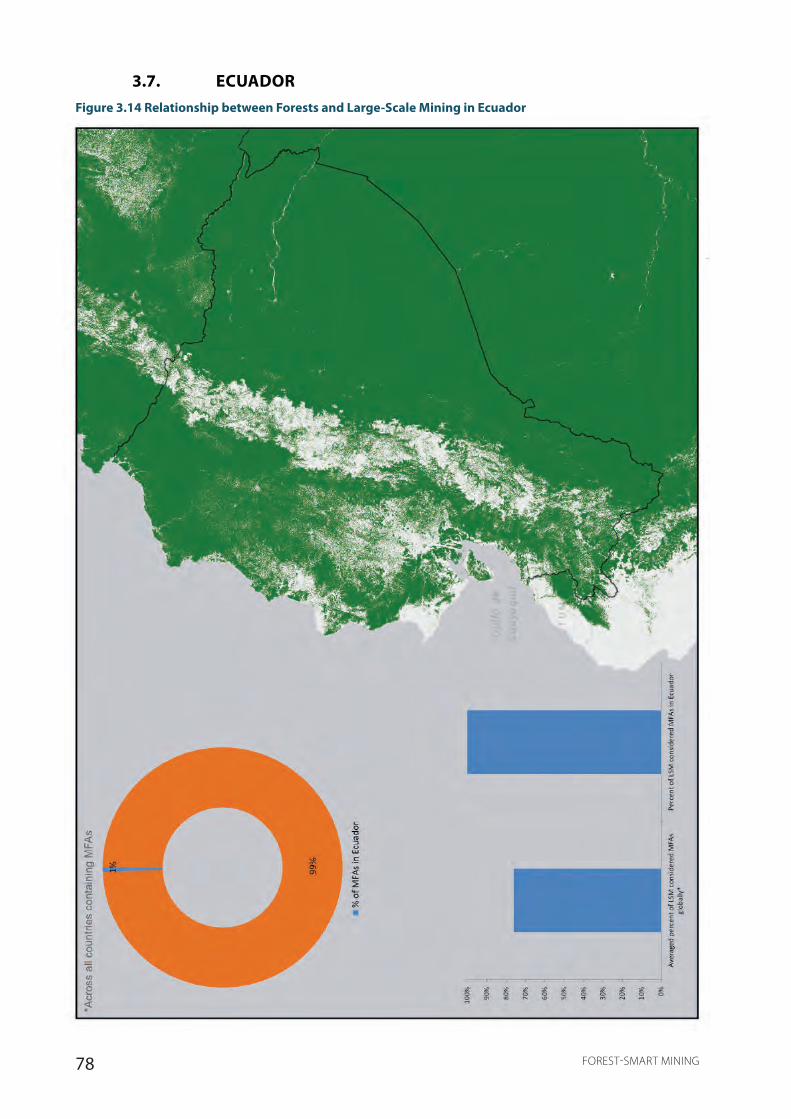
78 FOREST-SMART MINING
3.7. ECUADORFigure 3.14 Relationship between Forests and Large-Scale Mining in Ecuador
79FOREST-SMART MINING
Note: The country map shows the extent of forest cover (in green); the bar graph shows the proportion of mining that occurs in forests compared to the global average of countries containing MFAs; the pie chart shows the proportion of global MFAs in the country.
3.7.1. National Overview
Ecuador is an upper-middle-income country with a fairly diversified economy, varied geography, and high biological diversity. It has four distinct biogeographic regions: the Amazon, the Andes, the Pacific coastal plain, and the Galápagos Islands, with most forest being in the Amazon. Despite the Andean region being geologically highly prospective, Ecuador has long been seen as unattractive for international mining-related investments, although this is changing in response to a new Mining Law (2009) and associated reforms. While mining currently contributes less than 1 percent to Ecuador’s GDP, with the output almost exclusively produced through artisanal and small-scale gold mining, the government now has a clear strategy for attracting foreign investment and for promoting the development of LSM. Two large mines are due to open in Zamora-Chinchipe Province, which is a densely forested and comparatively less developed area of the country. They are part of a small number of “strategic projects” that the government is promoting. The sector is governed and regulated by the Ministry of Mining, an entity only created in 2015. Minerals are owned by the state and mining rights are awarded through concessions in a bidding-based system. The distinction between artisanal, small-, medium-, and large-scale mining is clearly articulated in the Mining Law. Each type of mining is associated with environmental and fiscal responsibilities, which become more stringent with increasing size. Ecuador’s policy on ASM has focused on formalizing and organizing the sector and improving the technical capabilities. In the long term, this is an appropriate strategy, but in the short and medium terms, it may cause substantial environmental impacts.
The Ministry of Environment governs the forests, with forest tenure being held by the state, private landowners, or indigenous peoples. By far the largest owners of forests are indigenous communities, and the protection of indigenous rights feature strongly in Ecuadorian law. The forestry sector is rather significant, although its products are mainly for the domestic market with only little being exported. The timber industry is characterized by a high number of small operators. Ecuador has a national system of protected areas covering 26 percent of the land, although the management effectiveness is rated as moderately unsatisfactory. Scores on indexes that relate to good forests and environmental management
are similarly modest. Ecuador has experienced forest loss at a mean rate of 0.6 percent per year (2000–2015). The principal driver of deforestation is agriculture, followed by others that vary in importance depending on the region, including logging, mining, and infrastructure. Reducing deforestation is a national priority and initiatives to achieve this form part of the National Development Plan and the National Afforestation and Reforestation Plan (2012), which also aims to increase the economic importance of the forestry industry.
Ecuador has been a participant in REDD+ since 2011, with three projects up and running. It is one of five countries involved in developing voluntary national REDD+ Social and Environmental Standards.
Data sources
• Añazco, M, M Morales, W Placios, E Vega, & A Cuesta, Sector forestal ecuatoriano: propuestas para una gestión forestal sostenible.Quito, Programa regional ECOBONA, 2010.
• Banco Central del Ecuador, Reporte de Minería. 2017, <https://contenido.bce.fin.ec/documentos/Estadisticas/Hidrocarburos/ReporteMinero012017.pdf>.
• Barreto, ML, P Singo, O Orozco Zevallos, FC Gamarra Chilmaza, S Spiegel, & J Hinton, Analysis of formalization approaches in the artisanal and small-scale gold mining sector based on experiences in Ecuador, Mongolia, Peru, Tanzania and Uganda. 2012, <http://www.eisourcebook.org/cms/End June 2013/Five Countries ASM Case Studies.pdf>.
• Constitutional Assembly of Ecuador, Mandato Constituyente No.6. 2008, <http://www.superley.ec/pdf/mandatos/06.pdf>.
• Ernst & Young, Ecuador. 2013, <http://www.ey.com/Publication/vwLUAssets/Tax_Alert-Ley-Reformatoria-a-la-Ley-Minera-16-Julio-2013/$File/Ley-Reformatoria-a-la-Ley-Minera-16-Julio-2013.pdf>.
• European Timber Trade Federation, ‘Ecuador’. 2016, <http://www.timbertradeportal.com/countries/ecuador/>.
• FAO, Global Forest Resources Assessment 2015: How are the world’s forests changing? Rome, Italy, 2015, <http://www.fao.org/forestry/fra2005/en/>.
• Global Forest Watch, ‘Global Forest Watch website’. 2016, <http://www.globalforestwatch.org> [accessed 15 December 2017].
• ICMM, Role of mining in national economies.3rd ed., London, UK, 2016.
• International Tropical Timber Association, Biennial review and assessment of the world timber situation 2015-2016. 2016.
• Jamasmie, C, ‘Ecuador mining industry to grow eightfold by 2021 — report’.in Mining.com, , 19 April 2017, <http://www.mining.com/ecuador-mining-industry-to-grown-eightfold-by-2021-report>.
80 FOREST-SMART MINING
• Ministerio de Minería, Plan Nacional de Desarrollo del Sector Minero. 2016.
• Ministerio del Ambiente Ecuador, Plan Nacional de Forestacion y Reforestacion. 2013, <http://extwprlegs1.fao.org/docs/pdf/ecu155382.pdf>.
• Protected Planet, ‘Protected planet database’. 2017.
• Republica del Ecuador, Ley de Gestion Ambiental, Codificacion. 2004, <http://www.ambiente.gob.ec/wp-content/uploads/downloads/2012/09/LEY-DE-GESTION-AMBIENTAL.pdf>.
• ---, Ley Forestal y de Conservacion de Areas Naturales y Vida Silvestre. 2004, <http://www.ambiente.gob.ec/wp-content/uploads/downloads/2015/06/Ley-Forestal-y-de-Conservacion-de-Areas-Naturales-y-Vida-Silvestre.pdf> [accessed 16 January 2018].
• ---, Ley Organica Reformatoria a la Ley de Mineria, a la Ley Reformatoria para la Equidad Tributaria en el Ecuador y a la Ley Organica de Regimen Tributario Interno. 2013, <http://www.etapa.net.ec/Portals/0/TRANSPARENCIA/Literal-a2/LEY-ORGANICA-REFORMATORIA-A-LA-LEY-DE-MINERIA_-A-LA-LEY-REFORMATORIA-PARA-LA-EQUIDAD.pdf>.
• ---, Reglamento Ambiental de Actividades Mineras Ministerio del Ambiente. 2014, <http://www.silec.com.ec/Webtools/LexisFinder/DocumentVisualizer/FullDocumentVisualizerPDF.aspx?id=AMBIENTE-REGLAMENTO_AMBIENTAL_DE_ACTIVIDADES_MINERAS_MINISTERIO_AMBIENTE>.
• ---, Reglamento General a la Ley de la Mineria.in Decreto Ejecutivo 119, , 2009, <http://www.mineria.gob.ec/wp-content/uploads/downloads/2015/08/Reglamento-General-a-la-Ley-de-Mineria.pdf>.
• República del Ecuador, Ley de Minería.Quito, 2009.
• ---, Reglamento del Régimen Especial de Pequeña Minería.Quito, 2009.
• Stern, M, & B Kernan, Report on Tropical Forests and Biodiversity in Ecuador. 2011.
• The World Bank, Project Performance Assessment Report Ecuador - National System of Protected Areas. 2011.
• The World Bank Group, The Little Data Book 2016.Washington DC, The World Bank, 2016, <http://elibrary.worldbank.org/doi/book/10.1596/978-1-4648-0834-0>.
• ---, The Little Green Data Book 2017.Washington D.C., The World Bank Group, 2017.
• USGS, 2014 Minerals Yearbook: Ecuador. 2016, <https://minerals.usgs.gov/minerals/pubs/country/2014/myb3-2014-ec.
pdf>.
3.7.2. National Forest-Smart Takeaways
• Ecuador looks set to be a key testing ground for forest-smart mining. Despite not ranking as a current forest mining hotspot, Ecuador looks to become one. The planned mines are situated in areas of dense forest cover. It is vital that strategic environmental studies are conducted and best environmental management practices are used.
• Government capacity is probably not yet ready. Substantial efforts must be focused on ensuring that the authorities have the requisite capabilities, potentially in partnership with LSM companies.
• Any forest-smart LSM strategy needs to incorporate ASM. ASM continues to dominate the mining sector and its impacts on forests must not be neglected when developing any LSM strategy.

81FOREST-SMART MINING
3.7.3. Case Study 9: Fruta del Norte (Lundin Gold)
Figure 3.15 Map of Fruta del Norte and AOI, Including Forest Cover and Protected Areas
The mine: Fruta del Norte (FdN) is an advanced and large (greater than 300,000 ounces per year) underground gold mining project in Zamora-Chinchipe Province, in southern Ecuador. Lundin Gold owns the project, and production of gold (and silver) is planned to start in 2019. FdN is one of five “strategic projects” that the Ecuadorian government promotes in various ways. It sits in a remote and densely forested area, in the transition between the Andes and the Amazon, with a high diversity of plants and animals.
The forest: The local forest type is Eastern Cordillera Real montane forest, and several protected areas exist near the mine, including El Zarza Wildlife Refuge and the El Cóndor Range Protected Forest. Both are situated in the transition zone between the Andes and the Amazon, with a high diversity of plants and animals. Small-scale
farming, cattle ranching, and artisanal mining are the main economic activities, but all are conducted at a subsistence level. The Shuar and Saraguro indigenous peoples inhabit areas nearby, and the Shuar traditionally rely on the forest for their livelihoods. The area immediately surrounding the mine is, however, not inhabited by any of these indigenous communities.
Forest health score and historical deforestation: The FdN AOI is dominated by very good condition forest. The AOI ranks second highest on the Forest Health Index, driven by high levels of intact and core forest and low scores for all negative variables. Historical deforestation in the AOI has been low, ranging between 200 and 1,000 hectares per year and only occurring outside protected areas, although evidence shows some increase in deforestation since the mine was announced.
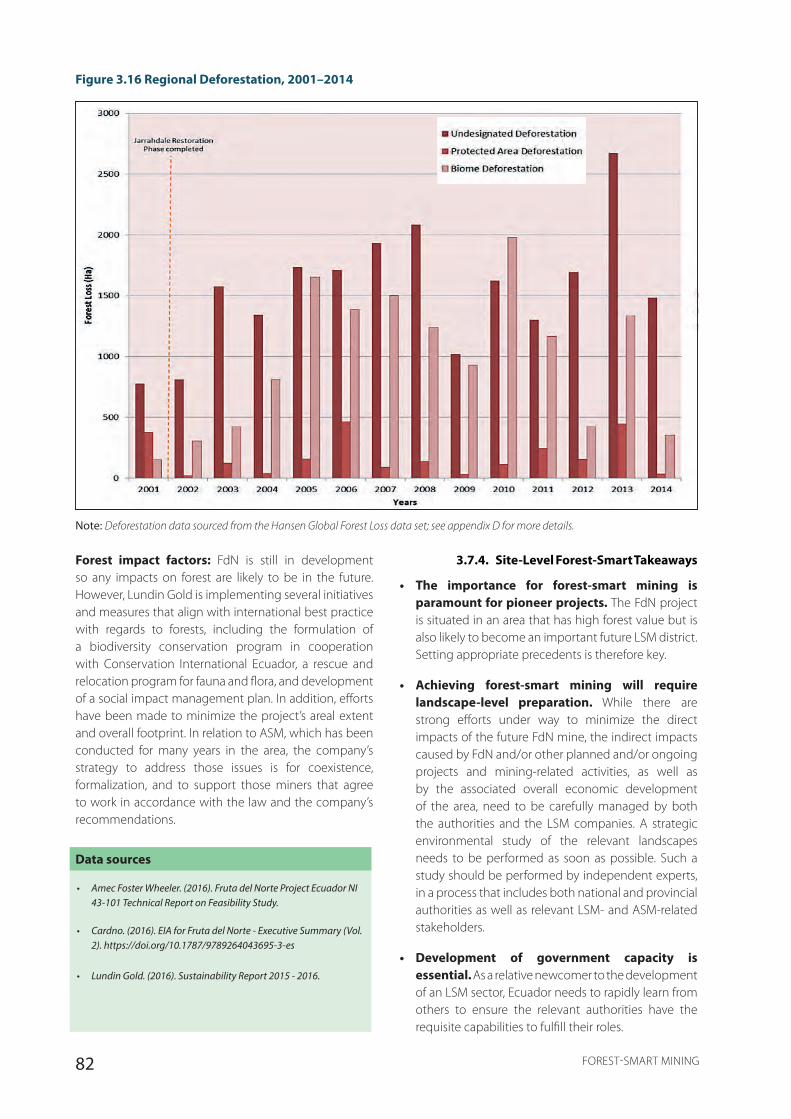
82 FOREST-SMART MINING
Figure 3.16 Regional Deforestation, 2001–2014
Forest impact factors: FdN is still in development so any impacts on forest are likely to be in the future. However, Lundin Gold is implementing several initiatives and measures that align with international best practice with regards to forests, including the formulation of a biodiversity conservation program in cooperation with Conservation International Ecuador, a rescue and relocation program for fauna and flora, and development of a social impact management plan. In addition, efforts have been made to minimize the project’s areal extent and overall footprint. In relation to ASM, which has been conducted for many years in the area, the company’s strategy to address those issues is for coexistence, formalization, and to support those miners that agree to work in accordance with the law and the company’s recommendations.
Data sources
• Amec Foster Wheeler. (2016). Fruta del Norte Project Ecuador NI 43-101 Technical Report on Feasibility Study.
• Cardno. (2016). EIA for Fruta del Norte - Executive Summary (Vol. 2). https://doi.org/10.1787/9789264043695-3-es
• Lundin Gold. (2016). Sustainability Report 2015 - 2016.
Note: Deforestation data sourced from the Hansen Global Forest Loss data set; see appendix D for more details.
3.7.4. Site-Level Forest-Smart Takeaways
• The importance for forest-smart mining is paramount for pioneer projects. The FdN project is situated in an area that has high forest value but is also likely to become an important future LSM district. Setting appropriate precedents is therefore key.
• Achieving forest-smart mining will require landscape-level preparation. While there are strong efforts under way to minimize the direct impacts of the future FdN mine, the indirect impacts caused by FdN and/or other planned and/or ongoing projects and mining-related activities, as well as by the associated overall economic development of the area, need to be carefully managed by both the authorities and the LSM companies. A strategic environmental study of the relevant landscapes needs to be performed as soon as possible. Such a study should be performed by independent experts, in a process that includes both national and provincial authorities as well as relevant LSM- and ASM-related stakeholders.
• Development of government capacity is essential. As a relative newcomer to the development of an LSM sector, Ecuador needs to rapidly learn from others to ensure the relevant authorities have the requisite capabilities to fulfill their roles.
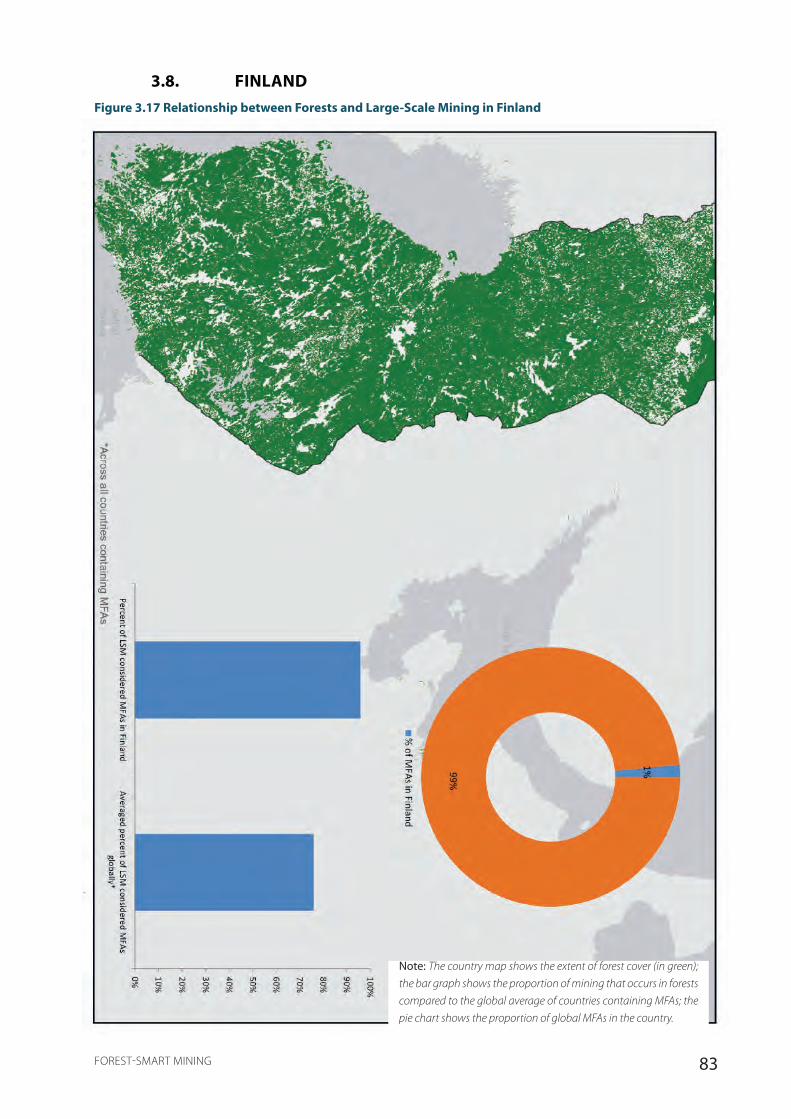
83FOREST-SMART MINING
3.8. FINLANDFigure 3.17 Relationship between Forests and Large-Scale Mining in Finland
Note: The country map shows the extent of forest cover (in green);
the bar graph shows the proportion of mining that occurs in forests
compared to the global average of countries containing MFAs; the
pie chart shows the proportion of global MFAs in the country.
84 FOREST-SMART MINING
3.8.1. National Overview
Finland is a high-income country with a rich mineral resource base, including nickel, copper, platinum, gold, zinc, diamonds, and chromium. Finland is considered one of Europe’s leading mining countries, in large part due to the production of industrial minerals. The country has a long history of mining and the state has had a strong influence in the sector, with a generally positive experience relating to regulation and control. Until the late 1990s, domestic companies supported by government agencies dominated ore exploration; however, in recent years foreign companies have taken over this role. Finland has seen a boom in the mining industry over the past decade. Currently there are over 40 active mines; increased demand for raw materials and recognition of Finland’s potential is stimulating growth in the mineral sector. New mines are being opened in unexplored terrain, and production near old mines is growing. The largest protected areas are in the northern regions, which also have the most ore potential. Areas of conflict exist between the Natura 2000 protected areas and mining exploration. Finland’s 2050 vision is to be “a global leader in the sustainable utilization of mineral resources and the minerals sector is one of the key foundations of the Finnish national economy.” It has good databases, advanced infrastructure, a stable regulatory environment, numerous mining technology companies, and leading research and development facilities with sustainable mining as a key focus.
Forest covers 73 percent of the country, with 15 percent under protection. The forest industry is Finland’s most important exporter, accounting for over 20 percent of export revenue. Pulp and paper makes up two-thirds of the total production value. Finland is one of the world’s largest producers of pulp, paper, and cardboard and one of Europe’s largest producers of sawn timber. The forestry sector is a major employer. However, 2015 saw a shift of pulp and paper production to emerging markets, resulting in mill closures in Finland. Employment in the saw and paper industry dropped by 34,000 employees between 2005 and 2016. The forestry industry continues to innovate for the future, investing in technology and services in the bio-economy, including biofuels, construction, and bio-based-energy. However, historically the industry has had a negative impact on mire habitats, including peatland forest, through drainage for commercial tree growth.
In 2017, Finland ranked number one in the world for its attractiveness for mining investment based on its mineral potential and stable policy climate, including certainty on regulations, clarity on protected areas and land disputes, good socioeconomic and community development conditions, labor and skills availability, security, and a good quality geological database.
There is strong environmental regulation and capacity to implement it. Sustainability and the mitigation of environmental impacts are written into the government mining strategy.
Data sources
• Biodiversity.fi. n.d. “Biodiversity.Fi Website.” Accessed March 13, 2018. https://www.biodiversity.fi/en/habitats/mires/mi1-drainage-status.
• Endomines. n.d. “Finish Mining Industry.” Accessed March 13, 2018. http://endomines.com/index.php/finnish-mining-industry.
• Finlex. n.d. “Finlex Data Bank Webpage.” 2018. https://www.finlex.fi/en/.
• Finnish Forest Association. 2018. “Finnish Forest Association Webpage.” 2018. https://www.smy.fi/en/forest-fi/forest-facts/finnish-forests-owned-by-finns/.
• Finnish Forest Industries. n.d. “Statistics.” Accessed March 13, 2018. https://www.forestindustries.fi/statistics/.
• ———. 2010. “The Forest Industry and Innovation.” https://www.forestindustries.fi/mediabank/885.pdf.
• Geological Survey of Finland. 2010. “Finland’s Minerals Strategy.” https://doi.org/http://projects.gtk.fi/minerals_strategy/index.html.
• Geological Survey of Finland (GTK). 2018. “Mining Finland Webpage.” 2018. http://www.miningfinland.com/.
• Global Forest Watch. 2016. “Global Forest Watch Website.” 2016. http://www.globalforestwatch.org.
• ICMM. 2016. Role of Mining in National Economies: Mining Contribution Index. Role of Mining in National Economies. 3rd ed.
• International Labour Organisation. 2017. “ILOSTAT Webpage.” 2017. http://www.ilo.org/ilostat/faces/ilostat-home/home?_adf.ctrl-state=173q41vp6g_45&_afrLoop=636541473843361#!
• Johnson, Eva Liedholm, and Magnus Ericsson. 2015. “State Ownership and Control of Minerals and Mines in Sweden and Finland.” Mineral Economics 28 (1–2): 23–36. https://link.springer.com/article/10.1007/s13563-015-0063-2.
• The World Bank Group. 2016. The Little Data Book 2016. Washington DC: The World Bank. https://doi.org/10.1596/978-1-4648-0834-0.
• ———. 2017. The Little Green Data Book 2017. Washington D.C.: The World Bank Group. https://doi.org/10.1596/978- 1-4648-1034-3.
• United Nations. 2018. “Food and Agriculture Organisation of the United Nations Country Profiles.” 2018. http://www.fao.org/
countryprofiles/en/.

85FOREST-SMART MINING
3.8.3. Case Study 10: Sakatti (Anglo American)
Figure 3.18 Map of Sakatti and AOI, Including Forest Cover and Protected Areas
The mine: Anglo American started exploration in Finland in 2004, establishing the local subsidiary in 2011 to explore the Sakatti–Sodankylä area, 150 kilometers north of the Arctic Circle. The company made a significant discovery of a polymetallic deposit and is presently assessing the financial, technical, environmental, and social feasibility of the mine. The ESIA process is also ongoing and will be completed by mid-2019. Anglo American Sakatti Mining Oy is governed by the Anglo American Group policies and standards, and it complies with Finland’s national mining and environmental regulations and the European Union’s regulation on mining in Natura 2000 sites.
The forest: The exploration area overlaps with 5.2 percent of Viiankiaapa Mire Reserve. Viiankiaapa, included in Finland’s national Mire Conservation Program and part of the Natura 2000 network, covers 65.95 square kilometers. It consists of a large mire system with important Natura habitats, including aapa mires and raised bogs, rich fens, petrifying springs, bog woodland, and western taiga. Traditional uses of Viiankiaapa and other areas within the assessment area include reindeer husbandry, hunting, berry picking, and recreation.
3.8.2. National Forest-Smart Takeaways
• Strong governance sets a good foundation for forest-smart mining. Finland has government strategies, policies, and legislation that emphasize sustainable development and minimizing environmental impacts coupled with institutional capacity for implementation. This will be an important framework during the current mining boom.
• A strong civil society sector is benefiting the development of forest-smart approaches to mining. Strong civil society organizations hold companies to account for their environmental impact. Additionally, there has been systematic development of a mining cluster of research, technology, and operation with overcoming sustainable mining challenges as a core focus. A funding agency for green mining supports the approach.
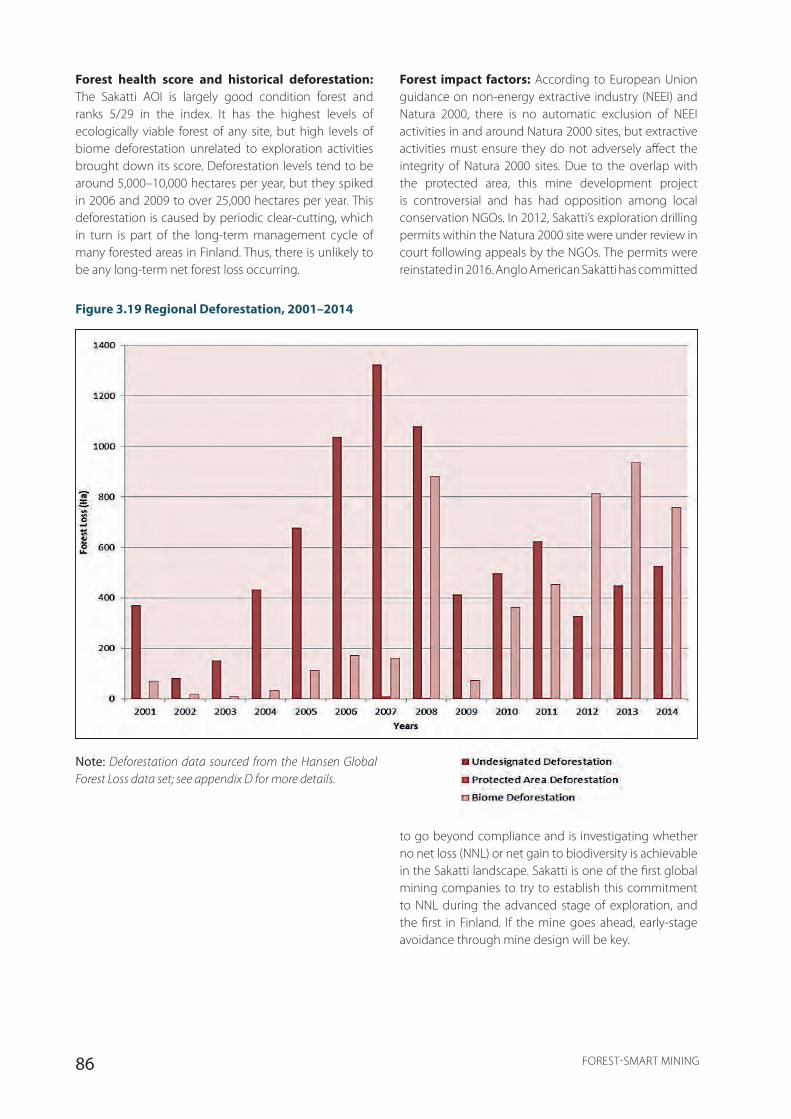
86 FOREST-SMART MINING
Figure 3.19 Regional Deforestation, 2001–2014
Note: Deforestation data sourced from the Hansen Global Forest Loss data set; see appendix D for more details.
Forest impact factors: According to European Union guidance on non-energy extractive industry (NEEI) and Natura 2000, there is no automatic exclusion of NEEI activities in and around Natura 2000 sites, but extractive activities must ensure they do not adversely affect the integrity of Natura 2000 sites. Due to the overlap with the protected area, this mine development project is controversial and has had opposition among local conservation NGOs. In 2012, Sakatti’s exploration drilling permits within the Natura 2000 site were under review in court following appeals by the NGOs. The permits were reinstated in 2016. Anglo American Sakatti has committed
to go beyond compliance and is investigating whether no net loss (NNL) or net gain to biodiversity is achievable in the Sakatti landscape. Sakatti is one of the first global mining companies to try to establish this commitment to NNL during the advanced stage of exploration, and the first in Finland. If the mine goes ahead, early-stage avoidance through mine design will be key.
Forest health score and historical deforestation: The Sakatti AOI is largely good condition forest and ranks 5/29 in the index. It has the highest levels of ecologically viable forest of any site, but high levels of biome deforestation unrelated to exploration activities brought down its score. Deforestation levels tend to be around 5,000–10,000 hectares per year, but they spiked in 2006 and 2009 to over 25,000 hectares per year. This deforestation is caused by periodic clear-cutting, which in turn is part of the long-term management cycle of many forested areas in Finland. Thus, there is unlikely to be any long-term net forest loss occurring.
87FOREST-SMART MINING
Data sources
• Anglo American. 2013. “Anglo American and the Sakatti Project.” 2013.
• ———. 2018. “Anglo American Sakatti Website.” 2018.
• European Commission. 2010. EC Guidance on Undertaking Non-Energy Extractive Activities in Accordance with Natura 2000 Requirements. https://doi.org/10.2779/98870.
• Kaivosvastuu. 2018. “Anglo American Exploration Finland, AA Sakatti Mining Oy.” 2018.
• Metsähallitus. n.d. “Nationalparks.Fi Webpage for Viiankiaapa.”
2018. http://www.nationalparks.fi/viiankiaapa.
3.8.4. Site-Level Forest-Smart Takeaways
• The “avoidance” step of the mitigation hierarchy can be taken seriously. Sakatti is a good example of an LSM conducting the appropriate environmental impact assessments before any invasive work is started and adapting plans according to the results. Defining no-go areas for protected areas in government legislation or corporate policy can reduce conflict.
• Cumulative impacts are important. The levels of biome deforestation across the AOI illustrate the need for assessing and addressing cumulative impacts across the landscape. An individual company may mitigate its own impact, but these impacts may be exacerbated by other activities
in the area (for example, forestry or hydropower). Regional strategic environmental assessments are required for informing permitting allocation. Requirements for companies to do cumulative impact assessments can help.
• Forest-smart mining should be pursued even in landscapes where commercial sustainable forestry operations may mask short-to-medium-term forest management outcomes. Cooperation with relevant authorities to develop and achieve smart forest outcomes across sectors and other land uses should be encouraged.
• No net loss is feasible. Corporate level commitments to NNL or net gain in the early stage of exploration should be encouraged to maximize the opportunity for avoidance of impacts. A government policy framework and legislation for NNL and offsets is required to reduce conflict and help individual companies meet local/ national conservation objectives.
• Strong corporate commitments can result in forest-smart mining. Anglo American has a net positive impact commitment for biodiversity and ecosystem services and has applied the mitigation hierarchy since the initial conceptual phases of this project.
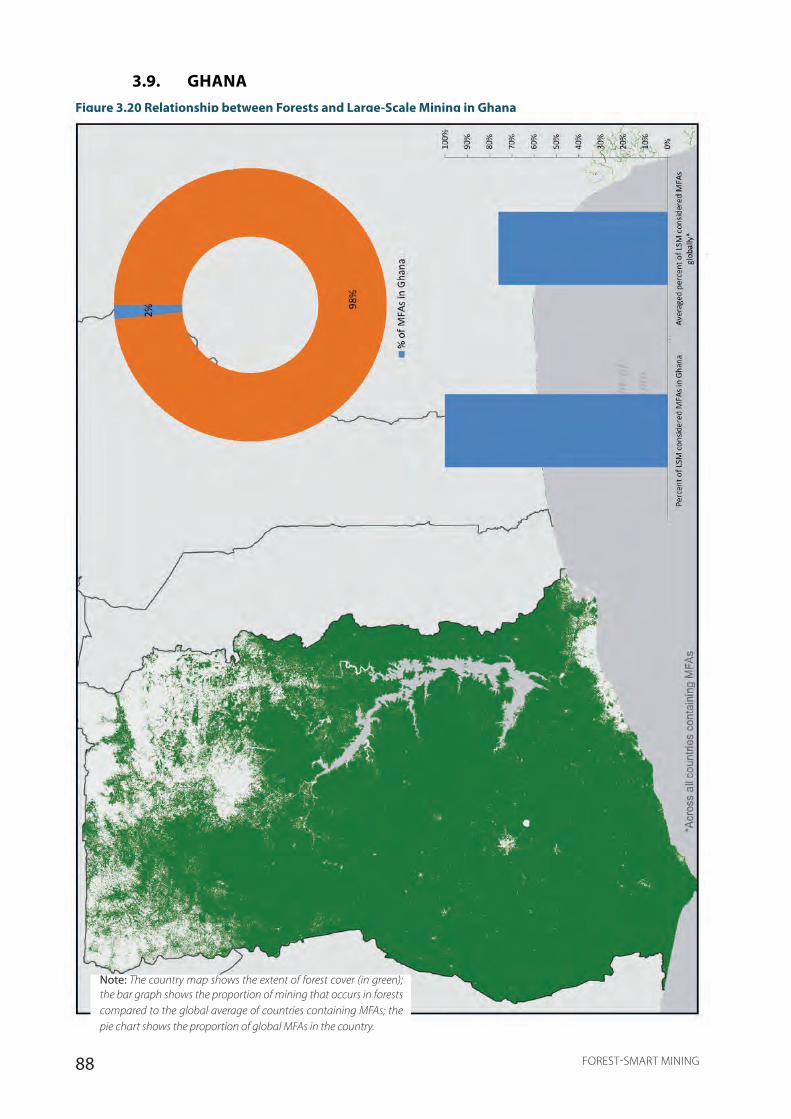
88 FOREST-SMART MINING
3.9. GHANAFigure 3.20 Relationship between Forests and Large-Scale Mining in Ghana
Note: The country map shows the extent of forest cover (in green); the bar graph shows the proportion of mining that occurs in forests compared to the global average of countries containing MFAs; the pie chart shows the proportion of global MFAs in the country.

89FOREST-SMART MINING
3.9.1. National Overview
Ghana is a lower-middle-income country with a long history of mining, particularly gold. The industry represents a significant source of export revenue and is the country’s highest source of tax revenue. After a period of transition from state control to private control the LSM sector today is dominated by a relatively small number of largely foreign-controlled firms. There is also a significant ASM industry (galamsey), largely Ghanaian controlled, which has grown in importance from 2 percent to 36 percent of production since 1989. All of Ghana’s 26 large-scale mines occur in forest landscapes and five licenses have been granted to mine in forest reserves.
Historically, Ghana was highly forested, but it has lost 60 percent of its forests since 1950 and today only 20 percent of the land is forested. Over half of the remaining forest lies within a network of forest reserves, most of which are allocated to forestry production and are in poor condition, and many more are “off reserve” (outside the protected area system). Protected areas excluding forest reserves cover only 4 percent of the land surface. About 17 percent of KBAs are in national parks and 66 percent in forest reserves. The key drivers of forest loss are agriculture (50 percent) and wood removal (35 percent); mining is estimated to account for another 5 percent of the losses. Forests play a very significant role in the Ghanaian economy. Timber production alone contributes more to the economy than mining in terms of GDP and employment, but there is also massive reliance on forests and their products in rural poor areas, with more than 1 million people living in forests and up to 70 percent of income derived from forest products, predominantly hunting, timber, and fuel. REDD+ approaches are fairly well developed in Ghana, with a national strategy published, but there is relatively little focus on forests and mining.
The Ministry of Land and Natural Resources (MLNR) controls both mineral resources (Minerals Commission) and forest resources (Forestry Commission); however, the former is significantly more influential than the latter. Mineral resources are owned by the state, but private actors can be granted complete control over resources. Forest resources are owned and managed by the state, although community resource management schemes and delegation agreements are on the rise. Environmental impacts in general are licensed and monitored by the Environmental Protection Agency but special provisions exist for mining in forest reserves, including additional permissions from the Forestry Commission, limits on the proportion of reserves that can be allocated to mining, additional tax requirements, and a cross-department management committee. Coordination between the MLNR commissions and the Environmental Protection
Agency is weak. The World Bank does not rate Ghana as a particularly easy place to do business (ranked 120 out of 190) and environmental protection policies are rated fairly poorly. However, mining companies perceive Ghana as one of the easier places to operate, possibly because of the relatively weak environmental regulations and enforcement.
Ghana has a well-developed REDD+ program. It submitted its REDD+ Readiness proposal in 2010 and was selected as a World Bank Forest Investment Program pilot country. It published its national REDD+ strategy led by the Forest Commission in 2015. The strategy recognizes ASM and LSM in forest reserves as drivers of deforestation and identifies the improvement of mining regulations as a strategic response option as well as a potential source of funding, but there does not appear to be any further action on this.
Data sources
• Appiah, Mark, Dominic Blay, Lawrence Damnyag, Francis K. Dwomoh, Ari Pappinen, and Olavi Luukkanen. 2007. “Dependence on Forest Resources and Tropical Deforestation in Ghana.” Environment, Development and Sustainability 11 (3): 471–87.
• ClientEarth. 2017. “Addressing the Risks of a Weak Legal Framework Governing Forest Conversion in Ghana.”
• FAO. 2010. “Global Forest Resources Assessment 2010 - Country Report Ghana.” Global Forest Resources Assessment 2010, 1–49.
• Forestry Commission. 2015. “Ghana National REDD+ Strategy.” http://www.fcghana.org/userfiles/files//REDD+/Ghana’s_National_REDD_Strategy_final_draft_210616.pdf.
• Global Forest Watch. 2016. “Global Forest Watch Website.” 2016. http://www.globalforestwatch.org.
• Government of Ghana. 2001. Environmental Guidelines for Mining in Production Forest Reserves in Ghana.
• ———. 2012. Ghana Forest and Wildlife Policy, 2012. Ghana. https://doi.org/http://gh.chm-cbd.net/convention/2012-ghana-forest-and-wildlife-policy.
• ICMM. 2016. “Role of Mining in National Economies.” 3rd ed. London, UK.
• National Coalition of Civil Society Groups Against Mining in Forest Reserves. 2003. “Campaign Against Mining in Ghana’s Forest Reserves.”
• Osei-Asamoah, Peter. 2016. “Ghana’s New Minerals and Mining Policy; a New Era for Lesser Known Minerals?” Mayer Brown.
• Republic of Ghana. 2014. “Mineral and Mining Policy of Ghana.,” 60.
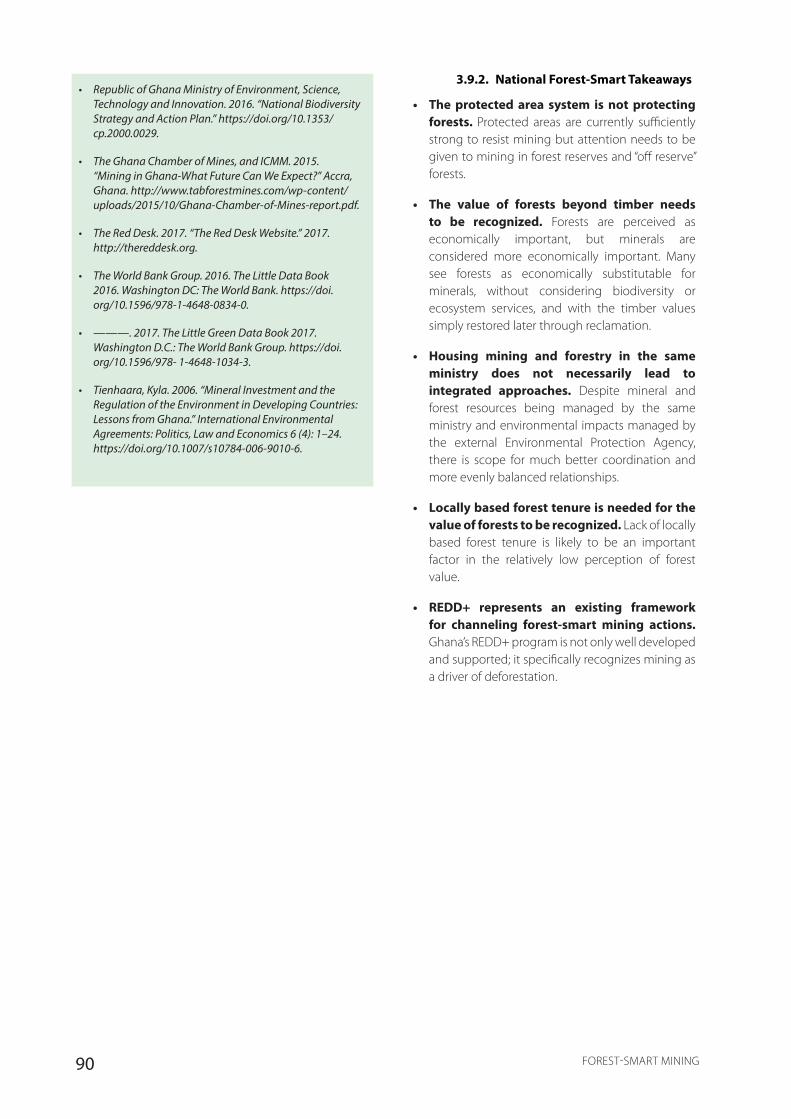
90 FOREST-SMART MINING
• Republic of Ghana Ministry of Environment, Science, Technology and Innovation. 2016. “National Biodiversity Strategy and Action Plan.” https://doi.org/10.1353/cp.2000.0029.
• The Ghana Chamber of Mines, and ICMM. 2015. “Mining in Ghana-What Future Can We Expect?” Accra, Ghana. http://www.tabforestmines.com/wp-content/uploads/2015/10/Ghana-Chamber-of-Mines-report.pdf.
• The Red Desk. 2017. “The Red Desk Website.” 2017. http://thereddesk.org.
• The World Bank Group. 2016. The Little Data Book 2016. Washington DC: The World Bank. https://doi.org/10.1596/978-1-4648-0834-0.
• ———. 2017. The Little Green Data Book 2017. Washington D.C.: The World Bank Group. https://doi.org/10.1596/978- 1-4648-1034-3.
• Tienhaara, Kyla. 2006. “Mineral Investment and the Regulation of the Environment in Developing Countries: Lessons from Ghana.” International Environmental Agreements: Politics, Law and Economics 6 (4): 1–24. https://doi.org/10.1007/s10784-006-9010-6.
3.9.2. National Forest-Smart Takeaways
• The protected area system is not protecting forests. Protected areas are currently sufficiently strong to resist mining but attention needs to be given to mining in forest reserves and “off reserve” forests.
• The value of forests beyond timber needs to be recognized. Forests are perceived as economically important, but minerals are considered more economically important. Many see forests as economically substitutable for minerals, without considering biodiversity or ecosystem services, and with the timber values simply restored later through reclamation.
• Housing mining and forestry in the same ministry does not necessarily lead to integrated approaches. Despite mineral and forest resources being managed by the same ministry and environmental impacts managed by the external Environmental Protection Agency, there is scope for much better coordination and more evenly balanced relationships.
• Locally based forest tenure is needed for the value of forests to be recognized. Lack of locally based forest tenure is likely to be an important factor in the relatively low perception of forest value.
• REDD+ represents an existing framework for channeling forest-smart mining actions. Ghana’s REDD+ program is not only well developed and supported; it specifically recognizes mining as a driver of deforestation.
91FOREST-SMART MINING
3.9.3. Case Study 13: Ahafo (Newmont)
Figure 3.21 Map of Ahafo and AOI, Including Forest Cover and Protected Areas
The mine: The Newmont Ahafo gold mining complex is located in the Brong Ahafo region of western Ghana, some 300 kilometers from Accra. Ahafo is the only operating open-pit mine in the region and has a total footprint of 2,000 hectares. The Ahafo mine started operating in 2006 and is expected to produce 6.8 million ounces of gold over 15 years. The Ahafo North mine (550 hectares) is currently in the permitting phase and the Subika underground mine is currently in construction. The operating Ahafo complex includes a mill, processing facilities, waste rock disposal sites, water storage sites, and tailings storage sites, with planned expansion to handle 10 million tonnes of ore per year. The site is owned and operated by Newmont Ghana Gold, a wholly owned subsidiary of Newmont and was partly funded through a $125 million loan from IFC in 2006.
The forest: The local forest type is moist semi-deciduous and part of the Eastern Guinean Forest. Much of the natural landscape has been converted to subsistence agriculture and small-scale livestock farming, and forest cover is relatively low. Two protected areas (forest reserves) are located between the Ahafo north and south mine areas: the Bosumkese Forest Reserve and Amama Shelterbelt Forest. Bosumkese is deemed a
production reserve designated for commercial logging and it suffered significant losses to burning in the 1980s. Both forest reserves are subject to illegal logging and hunting. However, local reliance on forests remains high. An ecosystem service review commissioned by the mine identified a high reliance on provisioning services, including wild plants, wild animals (bushmeat), plant fibers and fuel, and also on regulating services such as waste mediation, water flow mediation, and disease control.
The forest health score and historical deforestation rates: The Ahafo area rated 26 out of 29 on the Forest Health Index. The primary negative driver of the health score was deforestation in protected areas (forest reserves). Rates of deforestation are high, both in protected areas (up to 2,000 hectares a year) and in undesignated areas. The historical deforestation graph shows a steady increase of deforestation in undesignated forests from below 2,000 hectares a year to 8,000–12,000 hectares a year, although there is little data prior to the mine being established to determine historical deforestation levels.
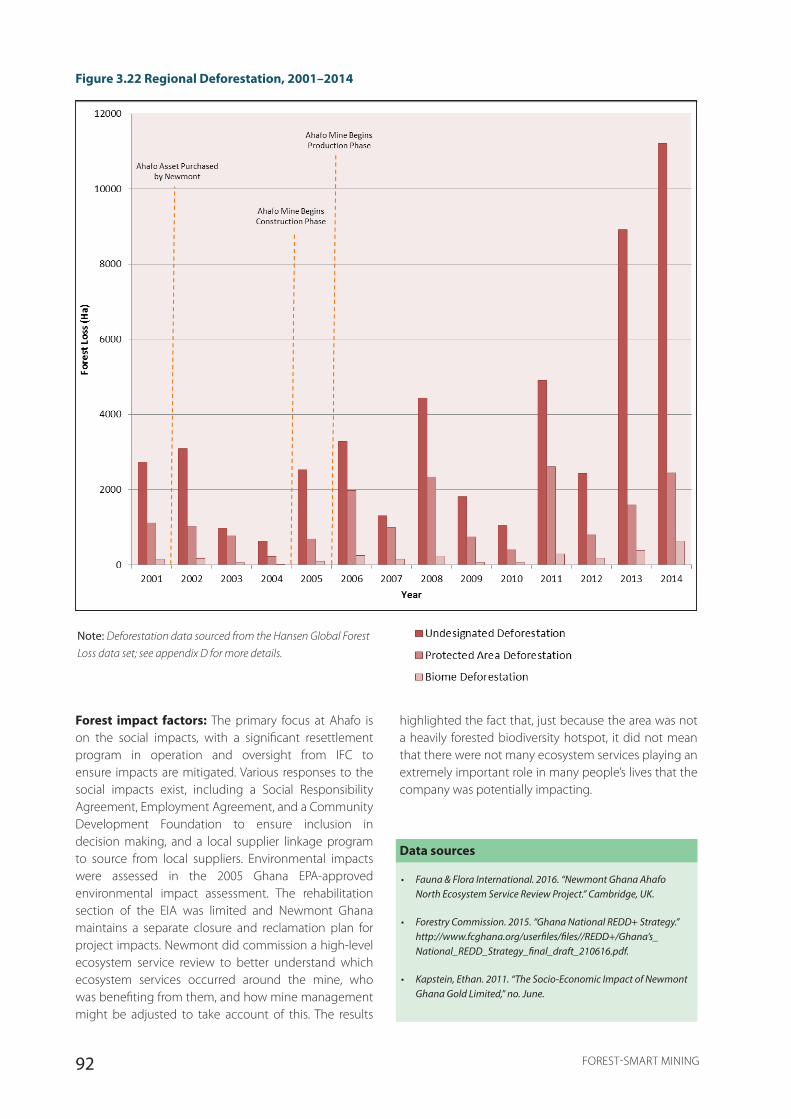
92 FOREST-SMART MINING
Figure 3.22 Regional Deforestation, 2001–2014
Note: Deforestation data sourced from the Hansen Global Forest
Loss data set; see appendix D for more details.
Forest impact factors: The primary focus at Ahafo is on the social impacts, with a significant resettlement program in operation and oversight from IFC to ensure impacts are mitigated. Various responses to the social impacts exist, including a Social Responsibility Agreement, Employment Agreement, and a Community Development Foundation to ensure inclusion in decision making, and a local supplier linkage program to source from local suppliers. Environmental impacts were assessed in the 2005 Ghana EPA-approved environmental impact assessment. The rehabilitation section of the EIA was limited and Newmont Ghana maintains a separate closure and reclamation plan for project impacts. Newmont did commission a high-level ecosystem service review to better understand which ecosystem services occurred around the mine, who was benefiting from them, and how mine management might be adjusted to take account of this. The results
highlighted the fact that, just because the area was not a heavily forested biodiversity hotspot, it did not mean that there were not many ecosystem services playing an extremely important role in many people’s lives that the company was potentially impacting.
Data sources
• Fauna & Flora International. 2016. “Newmont Ghana Ahafo North Ecosystem Service Review Project.” Cambridge, UK.
• Forestry Commission. 2015. “Ghana National REDD+ Strategy.” http://www.fcghana.org/userfiles/files//REDD+/Ghana’s_National_REDD_Strategy_final_draft_210616.pdf.
• Kapstein, Ethan. 2011. “The Socio-Economic Impact of Newmont Ghana Gold Limited,” no. June.

93FOREST-SMART MINING
• Newmont Ghana Gold Ltd. 2005. “Environmental and Social Impact Assessment: Ahafo South Project.” Accra, Ghana.
• Newmont, and International Finance Corporation (IFC). 2009. “Creating the Foundations for a Linkage Program in a Rural Setting. Lessons Learned from the Early Stages of the Ahafo Linkages Program in Ghana.” Business Linkages Practice Notes. Accra, Ghana.
• The Ghana Chamber of Mines, and ICMM. 2015. “Mining in Ghana-What Future Can We Expect?” Accra, Ghana. http://www.tabforestmines.com/wp-content/uploads/2015/10/Ghana-
Chamber-of-Mines-report.pdf.
3.9.4. Site-Level Forest-Smart Takeaways
• Poor forest condition is no reason to ignore forest impacts: While much of the damage to forests in the Ahafo region likely occurred before the mine, community dependency on the small areas of forest left—predominantly in protected areas—remains high. One of the primary drivers of protected area forest loss is illegal logging and illegal artisanal small-scale mining. Large-scale mining does result in displacement of people, which also puts pressure on forested areas for agricultural use. It is highly likely Ahafo has played a role in continued deforestation in the area due to displacement of people through resettlement.
• Avoidance of secondary induced impacts to forest requires control and closure of access routes formed during exploration and construction phases. Recognizing the implications of influx and in-migration of people into newly accessible areas, it is important for companies and government to manage land access and access routes to mitigate against such impacts.
• There are likely trade-offs between forest-smart mining and well-intended social management programs. Enabling access to new agricultural and pastoral lands through improving access routes and accessibility for in-migrants can result in unintended and unsustainable land development and forest conversion/loss.
• Forest-smart mining needs to take into account other potential land uses in the landscape and the avoidance of being an agent in unsustainable land use and forest conversion. The mine exists in a complex landscape where numerous actors exert pressures on the forests. The presence of the mine in such a landscape provides various opportunities for Newmont to engage with these actors and develop innovative forest-smart solutions; however, the cumulative impacts of multiple actors also present a significant risk at the landscape level if not addressed.
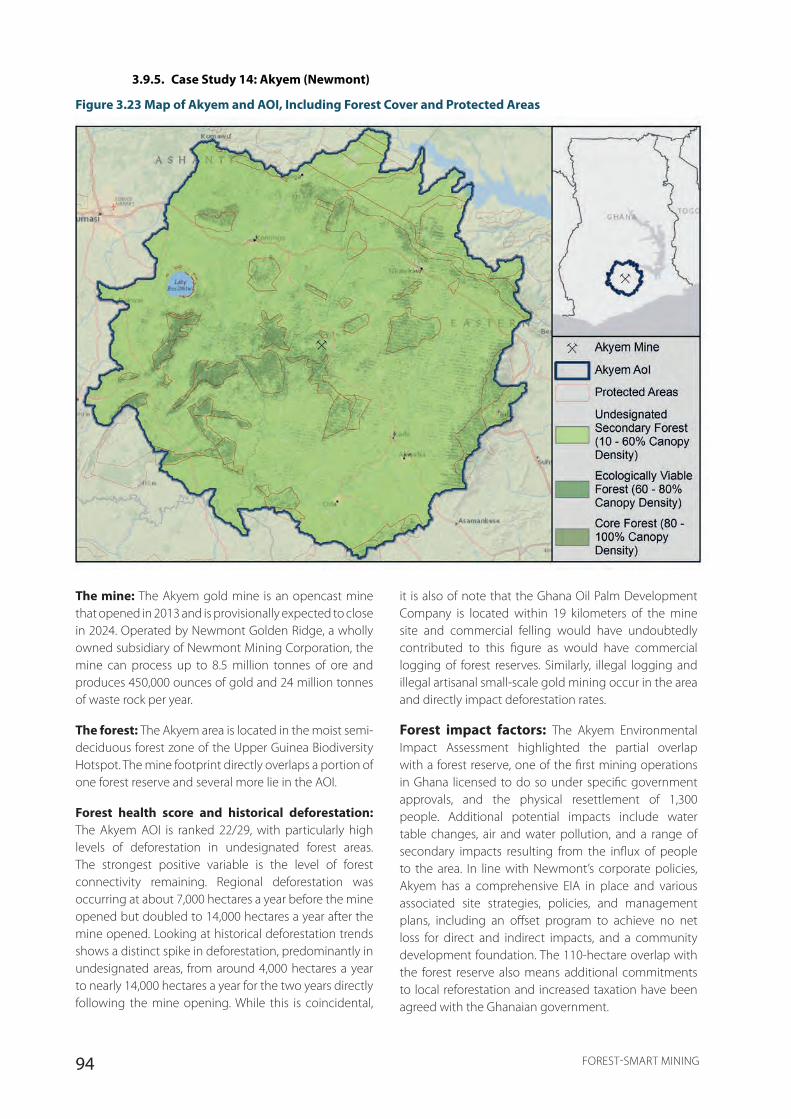
94 FOREST-SMART MINING
3.9.5. Case Study 14: Akyem (Newmont)
Figure 3.23 Map of Akyem and AOI, Including Forest Cover and Protected Areas
The mine: The Akyem gold mine is an opencast mine that opened in 2013 and is provisionally expected to close in 2024. Operated by Newmont Golden Ridge, a wholly owned subsidiary of Newmont Mining Corporation, the mine can process up to 8.5 million tonnes of ore and produces 450,000 ounces of gold and 24 million tonnes of waste rock per year.
The forest: The Akyem area is located in the moist semi-deciduous forest zone of the Upper Guinea Biodiversity Hotspot. The mine footprint directly overlaps a portion of one forest reserve and several more lie in the AOI.
Forest health score and historical deforestation: The Akyem AOI is ranked 22/29, with particularly high levels of deforestation in undesignated forest areas. The strongest positive variable is the level of forest connectivity remaining. Regional deforestation was occurring at about 7,000 hectares a year before the mine opened but doubled to 14,000 hectares a year after the mine opened. Looking at historical deforestation trends shows a distinct spike in deforestation, predominantly in undesignated areas, from around 4,000 hectares a year to nearly 14,000 hectares a year for the two years directly following the mine opening. While this is coincidental,
it is also of note that the Ghana Oil Palm Development Company is located within 19 kilometers of the mine site and commercial felling would have undoubtedly contributed to this figure as would have commercial logging of forest reserves. Similarly, illegal logging and illegal artisanal small-scale gold mining occur in the area and directly impact deforestation rates.
Forest impact factors: The Akyem Environmental Impact Assessment highlighted the partial overlap with a forest reserve, one of the first mining operations in Ghana licensed to do so under specific government approvals, and the physical resettlement of 1,300 people. Additional potential impacts include water table changes, air and water pollution, and a range of secondary impacts resulting from the influx of people to the area. In line with Newmont’s corporate policies, Akyem has a comprehensive EIA in place and various associated site strategies, policies, and management plans, including an offset program to achieve no net loss for direct and indirect impacts, and a community development foundation. The 110-hectare overlap with the forest reserve also means additional commitments to local reforestation and increased taxation have been agreed with the Ghanaian government.
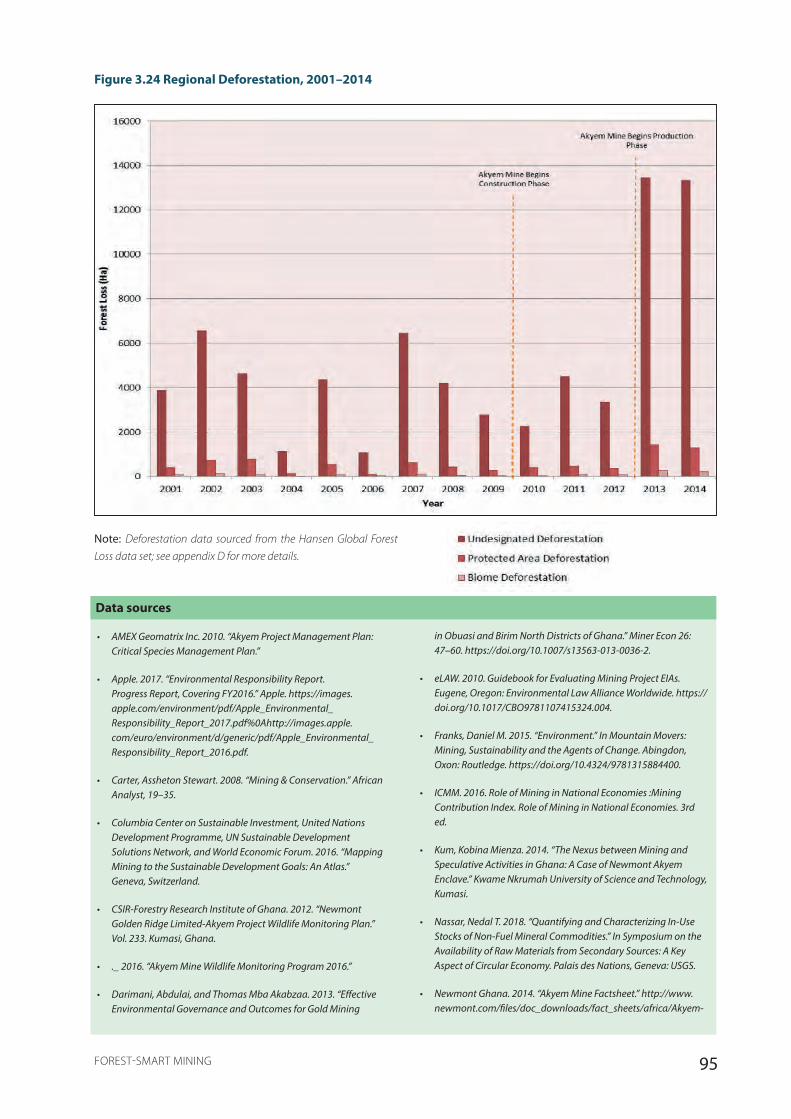
95FOREST-SMART MINING
Data sources
• AMEX Geomatrix Inc. 2010. “Akyem Project Management Plan: Critical Species Management Plan.”
• Apple. 2017. “Environmental Responsibility Report. Progress Report, Covering FY2016.” Apple. https://images.apple.com/environment/pdf/Apple_Environmental_Responsibility_Report_2017.pdf%0Ahttp://images.apple.com/euro/environment/d/generic/pdf/Apple_Environmental_Responsibility_Report_2016.pdf.
• Carter, Assheton Stewart. 2008. “Mining & Conservation.” African Analyst, 19–35.
• Columbia Center on Sustainable Investment, United Nations Development Programme, UN Sustainable Development Solutions Network, and World Economic Forum. 2016. “Mapping Mining to the Sustainable Development Goals: An Atlas.” Geneva, Switzerland.
• CSIR-Forestry Research Institute of Ghana. 2012. “Newmont Golden Ridge Limited-Akyem Project Wildlife Monitoring Plan.” Vol. 233. Kumasi, Ghana.
• ._ 2016. “Akyem Mine Wildlife Monitoring Program 2016.”
• Darimani, Abdulai, and Thomas Mba Akabzaa. 2013. “Effective Environmental Governance and Outcomes for Gold Mining
in Obuasi and Birim North Districts of Ghana.” Miner Econ 26: 47–60. https://doi.org/10.1007/s13563-013-0036-2.
• eLAW. 2010. Guidebook for Evaluating Mining Project EIAs. Eugene, Oregon: Environmental Law Alliance Worldwide. https://doi.org/10.1017/CBO9781107415324.004.
• Franks, Daniel M. 2015. “Environment.” In Mountain Movers: Mining, Sustainability and the Agents of Change. Abingdon, Oxon: Routledge. https://doi.org/10.4324/9781315884400.
• ICMM. 2016. Role of Mining in National Economies :Mining Contribution Index. Role of Mining in National Economies. 3rd ed.
• Kum, Kobina Mienza. 2014. “The Nexus between Mining and Speculative Activities in Ghana: A Case of Newmont Akyem Enclave.” Kwame Nkrumah University of Science and Technology, Kumasi.
• Nassar, Nedal T. 2018. “Quantifying and Characterizing In-Use Stocks of Non-Fuel Mineral Commodities.” In Symposium on the Availability of Raw Materials from Secondary Sources: A Key Aspect of Circular Economy. Palais des Nations, Geneva: USGS.
• Newmont Ghana. 2014. “Akyem Mine Factsheet.” http://www.newmont.com/files/doc_downloads/fact_sheets/africa/Akyem-
Figure 3.24 Regional Deforestation, 2001–2014
Note: Deforestation data sourced from the Hansen Global Forest
Loss data set; see appendix D for more details.

96 FOREST-SMART MINING
Factsheet-Final.pdf.
• Newmont Golden Ridge Limited. 2009. “BBOP Pilot Project Case Study. Akyem Gold Mining Project, Eastern Region, Ghana.” www.forest-trends.org/biodiversityoffsetprogram/guidelines/newmont-case-study.pdf.
• ———. 2017. “Environmental Management Plan: Akyem Mine 2017-2020.”
• Newmont Golden Ridge Ltd. 2008. “Environmental Impact Statement, Akyem Gold Mining Project, Eastern Region, Ghana.”
• ———. 2014. “Akyem Mine Biodiversity Strategy.”
• Newmont Mining Corporation. 2015. “Beyond the Mine: Our 2015 Social and Environmental Performance.” Denver, Colorado.
• NRGI. 2015. “NRGI Primers.” https://doi.org/10.1080/05679320500129037.
• Sonter, Laura J., Diego Herrera, Damian J. Barrett, Gillian L. Galford, Chris J. Moran, and Britaldo S. Soares-Filho. 2017. “Mining Drives Extensive Deforestation in the Brazilian Amazon.” Nature Communications 8 (1): 1013. https://doi.org/10.1038/s41467-017-00557-w.
• UNEP. 2008. “Biodiversity Offsets and the Business and Biodiversity Offsets Programme (BBOP).” UNEP/CBD/COP.
• Virah-Sawmy, Malika, Johannes Ebeling, and Roslyn Taplin. 2014. “Mining and Biodiversity Offsets: A Transparent and Science-Based Approach to Measure ‘No-Net-Loss.’” Journal of Environmental Management 143: 61–70. https://doi.
org/10.1016/j.jenvman.2014.03.027.
3.9.6. Site-Level Forest-Smart Takeaways
• By overlapping with a forest reserve, attention to forest impacts was increased. The overlap with the reserve resulted in the loss of a small area of degraded forest and was a fairly minor contributor to overall forest impacts. However, it did mean that various additional voluntary forest impact mitigation or compensation responses were triggered in contrast to, for example, Ahafo.
• Insufficient attention is given to indirect forest impacts. The Forest Health Index demonstrates that the primary forest impacts are likely indirect, occurring outside the mine footprint and primarily after production started. The Akyem EIA listed projected direct impacts on forests resulting from the mine footprint and indirect impacts resulting from population influx. However, it listed almost no responses to the indirect impacts. Interviews with Akyem staff suggested they did not perceive a responsibility for impacts outside the mine footprint and interviews with regulators demonstrated there is little expectation for the company to do so.
• Offsetting responses require government support. Offsetting residual impacts was a key component of Akyem’s response to forest impacts. However efforts failed due to conflicting government departments and external mining interests, including the reclassification of the globally significant biodiversity area under study to mining concessions. If offsetting is to be a viable response in Ghana, it will likely require clear policy support.
• Forest values are recognized but perceived as low and substitutable. While forest values (such as the local reduction in climate vulnerability and fire incidence due to the stabilization of microclimates and increase in water retention and precipitation) are recognized by both the company and government, both also referred to their substitutability with mineral values. Thus, it was perceived as acceptable to remove a forest, to extract the economic value of the minerals below, then to return the forest afterward. There was little or no recognition that forest values may not be substitutable, and that fully restoring them may not be possible. Furthermore, the focus of the regulators was the overall land available to communities, not forested land. Local communities also reportedly saw forests as low value, with little interest in using community development funds for any environmental projects.
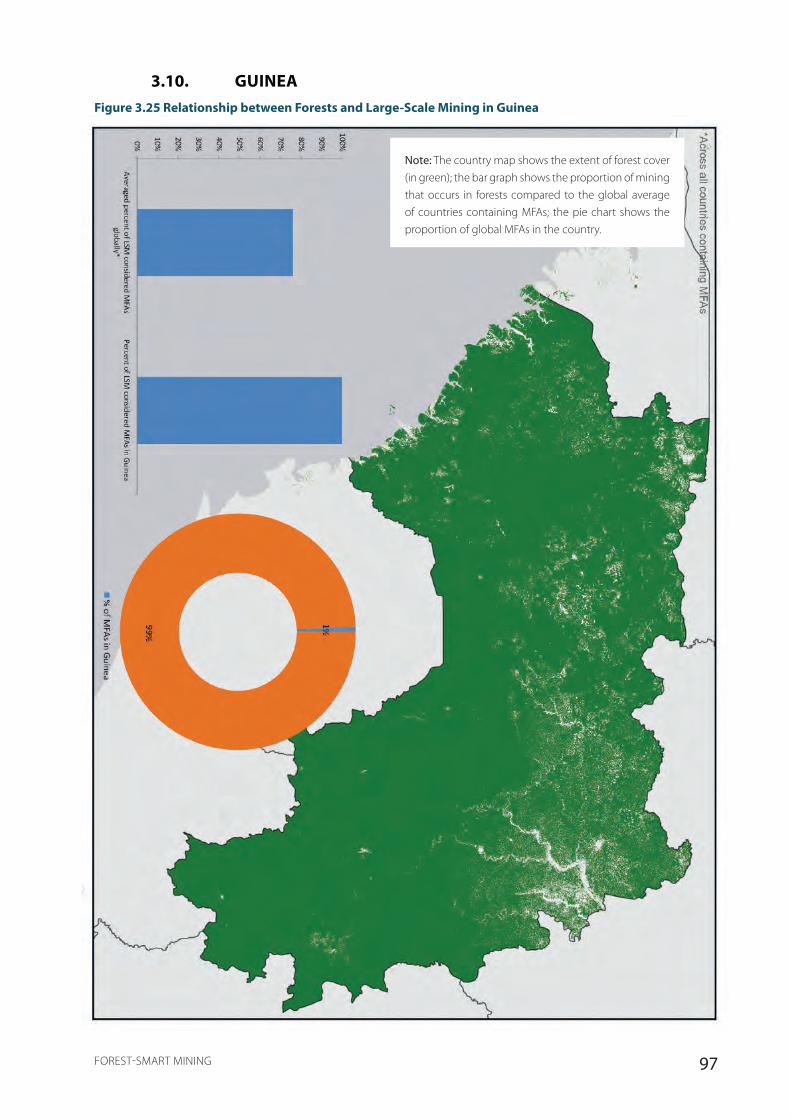
97FOREST-SMART MINING
3.10. GUINEAFigure 3.25 Relationship between Forests and Large-Scale Mining in Guinea
Note: The country map shows the extent of forest cover (in green); the bar graph shows the proportion of mining that occurs in forests compared to the global average of countries containing MFAs; the pie chart shows the proportion of global MFAs in the country.
98 FOREST-SMART MINING
3.10.1. National Overview
Guinea is a low-income country rich in mineral resources, with some of the world’s largest high-grade bauxite and iron ore reserves, as well as gold and diamonds. Sustained instability, political risks, and lack of infrastructure have limited exploitation of mineral wealth historically. This is changing and the industry now represents 90 percent of export revenue and up to 25 percent of government revenue. Between 2000 and 2013, the land area of large industrial mines is reported to have tripled, particularly for bauxite extraction.
Guinea has one of the smallest protected area networks in West Africa. Its forests decreased by an estimated 33 percent between 1975 and 2013, particularly in the south and outside of protected areas. Today, only 25.9 percent of land is forested. Drivers include agricultural expansion, uncontrolled logging, and mining and infrastructure development. Administrative agencies face challenges controlling the use forest resources, including logging, within and outside classified forests. Most of Guinea’s land is unregistered, governed by customary law, and vulnerable to transfer by the state or privatization. The Forestry Code governs the country’s forests and recognizes customary rights of communities living within or close to forests while forestry and decentralization policies enable co-management of forest reserves. Community co-management aims to support more equitable forestry and wildlife resource use and has been associated with stability and improvement in forest extent and condition.
The Ministry of Mines and Geology (MMG) controls mineral resources, while forest resources and environmental authorizations for mining are under the authority of the Ministry of Environment, Water and Forests. The MMG is reported to be considerably more influential, and pressure on the environment ministry to facilitate an efficient ESIA process and approve mining projects appears to be high. Capacity to enact updated and well-drafted legal frameworks, apply environmental regulatory texts, review ESIAs, and monitor and enforce compliance is limited. Duplicative, inconsistent, or contradictory legal texts and gaps in implementing regulations governing forestlands, natural resources, and mining are also problematic. The World Bank does not rate Guinea as an easy place to do business. Regulatory uncertainty and inconsistency of application have deterred some major corporates from investing in mining in Guinea.
REDD+ is recognized but not yet well developed in Guinea, with the country becoming a UN-REDD Program Partner in May 2015.
Data sources
• Brugiere, David, and Rebecca Kormos. 2009. “Review of the Protected Area Network in Guinea, West Africa, and Recommendations for New Sites for Biodiversity Conservation.” Biodiversity and Conservation 18 (4): 847–68. https://doi.org/10.1007/s10531-008-9508-z.
• Comité Permanent Inter-états de Lutte contre la Sécheresse dans le Sahel [CILSS]. 2016. “Landscapes of West Africa - a Window on a Changing World.” Ouagadougou, Burkina Faso. https://doi.org/http://dx.doi.org/10.5066/F7N014QZ.
• Convention on Biological Diversity. 2017. “Latest NBSAPs.” 2017. https://www.cbd.int/nbsap/about/latest/default.shtml#gn.
• EGIS International. 2016. “Strategic Environmental and Social Assessment (SESA) of the Mining Sector Reform in Guinea.”
• FAO. n.d. “FAO Statistical Yearbook: Guinea.” http://faostat.fao.org/static/syb/syb_90.pdf.
• ———. 2015. “Global Forest Resources Assessment 2015.” Rome, Italy. www.fao.org/forestry/fra.
• FAO African Forestry and Wildlife Commission. 2016. “Report on Measures Taken by Members to Implement the Recommendations of the Nineteenth Session of the African Forestry and Wildlife Commission.” http://www.fao.org/3/a-mp529e.pdf.
• Global Forest Watch. 2016. “Global Forest Watch Website.” 2016. http://www.globalforestwatch.org.
• ICMM. 2016. “Role of Mining in National Economies.” 3rd ed. London, UK.
• Kormos, Rebecca, and Cyril Kormos. 2011. “Towards a Strategic National Plan for Biodiversity Offsets for Mining in the Republic of Guinea, West Africa with a Focus on Chimpanzees.” http://www.bankinformationcenter.org/wp-content/uploads/2013/07/GuineaBiodiversityOffsetKormosKormos2011.pdf.
• Mediaguinee. 2017. “Mines: Les Dégats Environmentaux Causés Par La Société Minière de Boké (SMB).” Mediaguinee.Org. http://mediaguinee.org/mines-les-degats-environnementaux-causes-par-la-societe-miniere-de-boke-smb/.
• Republic of Guinea. 2011. “Reproduction of the 2011 Mining Code of the Republic of Guinea as Amended by the Legislation Amending the Act L/2011/006/CNT of 09 September 2011 Enacting the Mining Code of the Republic of Guinea [English Translation].” http://mines.gov.gn/assets/uploads/2016/02/Republique-de-Guinee-Code-minier-FR-EN-1.pdf.
• The Red Desk. 2017. “The Red Desk Website.” 2017. http://thereddesk.org.
• The World Bank Group. 2016. The Little Data Book 2016. Washington DC: The World Bank. https://doi.org/10.1596/978-1-4648-0834-0.
• ———. 2017. The Little Green Data Book 2017. Washington D.C.: The World Bank Group. https://doi.org/10.1596/978- 1-4648-1034-3.
• USAID. 2010. “Property Rights and Resource Governance. Country Profile - Guinea.” https://land-links.org/wp-content/uploads/2016/09/USAID_Land_Tenure_Guinea_Profile.pdf.
• USGS. 2014. “2014 Minerals Yearbook: Guinea.” https://minerals.
usgs.gov/minerals/pubs/country/2014/myb3-2014-gv.pdf.
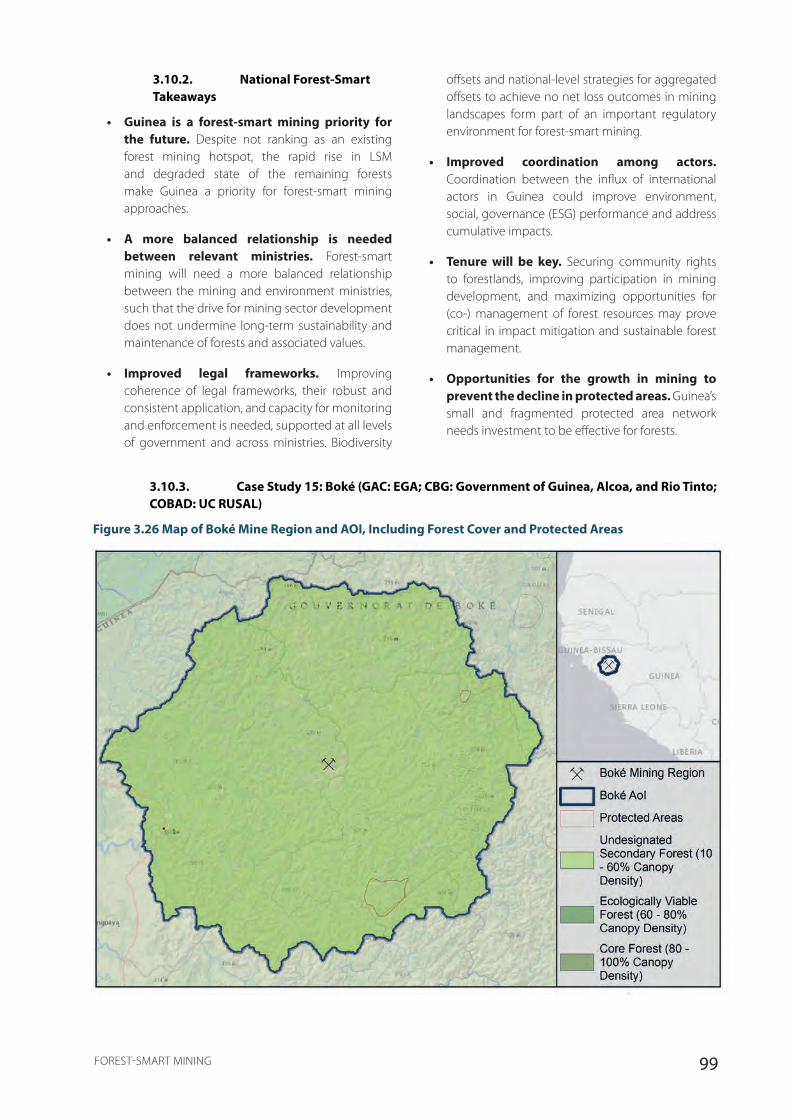
99FOREST-SMART MINING
3.10.2. National Forest-Smart Takeaways
• Guinea is a forest-smart mining priority for the future. Despite not ranking as an existing forest mining hotspot, the rapid rise in LSM and degraded state of the remaining forests make Guinea a priority for forest-smart mining approaches.
• A more balanced relationship is needed between relevant ministries. Forest-smart mining will need a more balanced relationship between the mining and environment ministries, such that the drive for mining sector development does not undermine long-term sustainability and maintenance of forests and associated values.
• Improved legal frameworks. Improving coherence of legal frameworks, their robust and consistent application, and capacity for monitoring and enforcement is needed, supported at all levels of government and across ministries. Biodiversity
offsets and national-level strategies for aggregated offsets to achieve no net loss outcomes in mining landscapes form part of an important regulatory environment for forest-smart mining.
• Improved coordination among actors. Coordination between the influx of international actors in Guinea could improve environment, social, governance (ESG) performance and address cumulative impacts.
• Tenure will be key. Securing community rights to forestlands, improving participation in mining development, and maximizing opportunities for (co-) management of forest resources may prove critical in impact mitigation and sustainable forest management.
• Opportunities for the growth in mining to prevent the decline in protected areas. Guinea’s small and fragmented protected area network needs investment to be effective for forests.
3.10.3. Case Study 15: Boké (GAC: EGA; CBG: Government of Guinea, Alcoa, and Rio Tinto; COBAD: UC RUSAL)
Figure 3.26 Map of Boké Mine Region and AOI, Including Forest Cover and Protected Areas
100 FOREST-SMART MINING
The mines: The Boké prefecture of northwestern Guinea contains some of the world’s largest reserves of high-grade bauxite. The area has a long history of mining, with the Compagnie des Bauxites de Guinée (CBG) mine in operation since 1973. In recent years, the region has been subject to increasing mining activity, with new concessions allocated, the expansion of existing projects, and greenfield projects getting under way. Within this increasingly busy, multi-operator landscape, three operations with adjacent mining concessions form the focus of this case study: (1) UC RUSAL’s Dian-Dian Complex operated by Company Bauxite and Alumina Dian-Dian (COBAD); (2) CBG’s Mine and Expansion Project (South Cogon mining concession), which is a joint venture between the government of Guinea, Alcoa, and Rio Tinto; and (3) the Bauxite Export Project of Guinea Alumina Corporation (GAC), a wholly owned subsidiary of Emirates Global Aluminium. All three projects involve the mining and export of bauxite, with port concessions on the coast (not included in case study). The GAC project includes plans to develop a refinery in a subsequent phase. The concessions are considerably larger than for other minerals—up to 114,000 hectares in UC RUSAL’s Dian-Dian concession—though the operational area may only be a small part of this. Concessions have also been leased over long time frames (up to 60 years).
The forest: In the past, the landscape supported a matrix of woodland, wooded grassland (also referred to as savanna), gallery forest (situated along the rivers and watercourses), and grassland habitat commonly known as the Bowe. Today, wooded grasslands and woodlands are increasingly under pressure from the indirect and induced impacts of mining and the direct impacts of agriculture (namely cashew), including slash and burn. As a consequence, gallery forests are becoming rare, fragmented, and degraded, forming a mosaic of degraded vegetation. The only recognized conservation areas are the Counsignaki Classified Forest, the Foye-Madinadian Protected Area, and the Boulleré KBA, but the landscape comprises areas of high-value natural habitat that support important populations of globally threatened, rare, and restricted range primates and bird species, ecosystem functions and services, and cultural values.
Forest health score and historical deforestation: The Boké AOI ranks 16/29 in the index. The AOI retains some secondary forest, but deforestation of undesignated forest was high. Deforestation levels were around 500 hectares per year during the first years of mining but increased by over 3,000 percent in 2013 and 2014, coinciding with the increase in mining activity (Figure 3.29). This may be indicative (at least in part) of induced in-migration (136 percent population increase during this period) and associated impacts. Induced in-
migration is a major concern and significant challenge for forest-smart mining given the scale of the issue and the complex and wide-ranging ways in which it may influence the governance, management, and use of land and natural resources. The trend toward elevated levels of forest loss is set to continue in the absence of immediate, collective action to mitigate impacts of mining on forests in this landscape.
Forest impact factors: The impacts of bauxite mining on natural habitat are widespread. The geological distribution of bauxite deposits results in a patchwork of mining areas rather than a single large open pit. This is coupled with the development and expansion of road and rail infrastructure and the intensification of their use. The result is widespread clearance of natural habitat, particularly wooded grassland, and the further degradation, fragmentation, disturbance, and unsustainable use of forestland and resources, with adverse effects for biodiversity, ecosystem functions and services, resilience, and community use and non-use values. Phased clearance coupled with progressive closure and rehabilitation of mined areas is proposed by all three operators (and under way in some concessions, with GAC having already begun post-construction rehabilitation) to mitigate a range of impacts; direct impacts for high-value gallery forests are primarily mitigated through the avoidance and sensitive placement of mine haul roads. However, because of the mines’ very different starting points—financing arrangements and corporate standards—great variability exists in ESG practices. For CBG, the decisions relating to mine design and mitigation were made decades ago with long-standing impacts, while GAC is embarking on greenfield mining activities for which there is potential opportunity to maximize impact avoidance and apply current international best practice. Both CBG and GAC are subject to conditions of financing from international financial institutions, whereas UC RUSAL’s Dian-Dian project is reported to be self-financed. As a result, there is great variation in the scope, quality, and accessibility of associated ESIAs, reflecting the extent to which companies are motivated to go beyond regulatory compliance (that is, through corporate policy or conditions of financing). This creates an uneven playing field with implications for forest-smart mining and sustainable forest management across the landscape. The cumulative impacts of prospecting and mining by multiple operators across large, adjacent concessions are expected to be severe and the risk of regional losses (habitat and species) is considered high, stressing the urgent need for coordination and collaboration among operators.
This is illustrated by a CBG/COBAD gratuitous easement agreement in order to provide COBAD with access to the main branch line of ANAIM’s railway. CBG agreed to
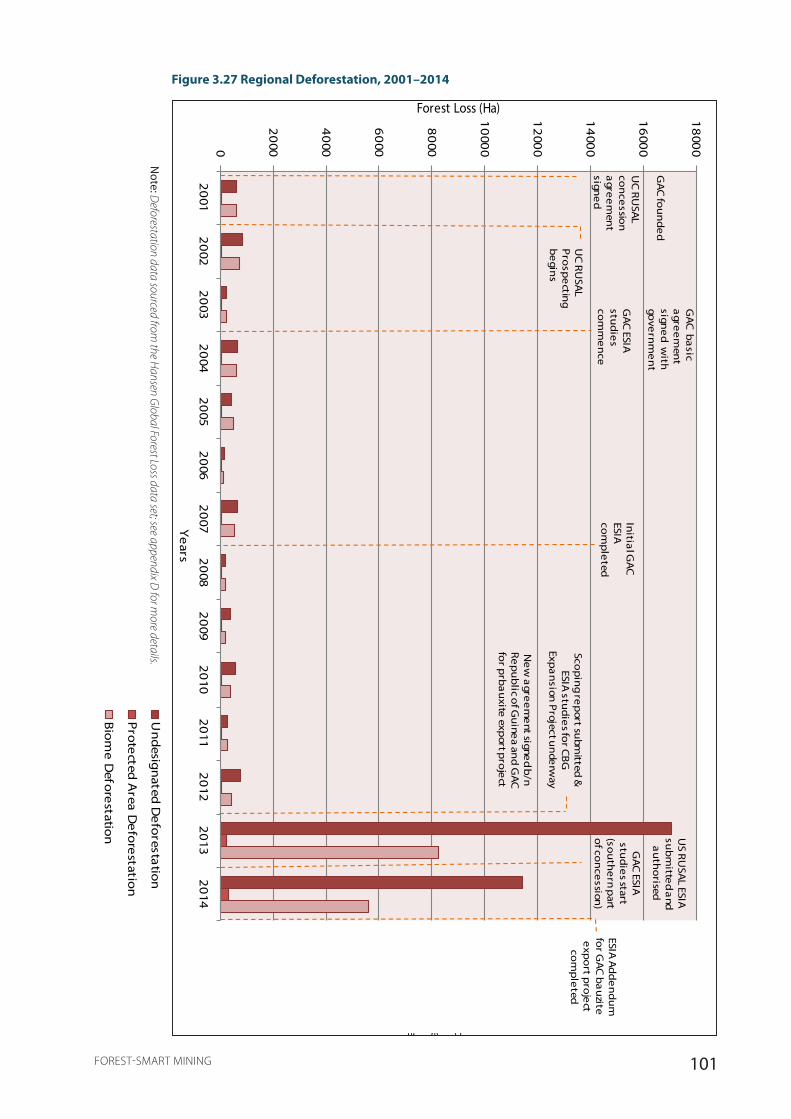
101FOREST-SMART MINING
0
20
00
40
00
60
00
80
00
10
000
12
000
14
000
16
000
18
000
20
012
002
20
032
004
20
052
006
20
072
008
20
092
010
20
112
012
20
132
014
Forest Loss (Ha)
Ye
ars
Sangared
i Defo
restation
2001 -2014
Un
desig
nated
De
foresta
tion
Pro
tected
Area
De
fore
station
Bio
me
Defo
restatio
n
UC
RU
SAL
Pro
spe
cting
be
gins
ESIAA
dd
en
du
m
for G
AC
ba
uzite
e
xpo
rt pro
ject
com
ple
ted
GA
C fo
un
de
d
UC
RU
SAL
con
cessio
n
agre
em
ent
signe
d
US R
USA
L ESIA
sub
mitte
da
nd a
uth
orised
GA
C ESIA
stu
die
sstart
(sou
the
rn part
of co
nce
ssion)
GA
C b
asic
agre
em
ent
signe
d w
ith go
vern
me
nt
GA
C ESIA
stu
die
sco
mm
en
ce
Scop
ing re
port su
bmitted
&
ESIA stu
die
s for C
BG
Exp
an
sion P
rojectun
derw
ay
Ne
w a
gree
me
nt signed b
/n
Re
pu
blic o
f Gu
inea an
d G
AC
fo
r prb
au
xite exp
ort pro
ject
Initia
l GA
C
ESIA
com
ple
ted
Figure 3.27 Regional Deforestation, 2001–2014
Note: D
eforestation data sourced from the H
ansen Global Forest Loss data set; see appendix D
for more details.
0
20
00
40
00
60
00
80
00
10
000
12
000
14
000
16
000
18
000
20
012
002
20
032
004
20
052
006
20
072
008
20
092
010
20
112
012
20
132
014
Forest Loss (Ha)
Ye
ars
Sangared
i Defo
restation
2001 -2014
Un
desig
nated
De
foresta
tion
Pro
tected
Area
De
fore
station
Bio
me
Defo
restatio
n
UC
RU
SAL
Pro
spe
cting
be
gins
ESIAA
dd
en
du
m
for G
AC
ba
uzite
e
xpo
rt pro
ject
com
ple
ted
GA
C fo
un
de
d
UC
RU
SAL
con
cessio
n
agre
em
ent
signe
d
US R
USA
L ESIA
sub
mitte
da
nd a
uth
orised
GA
C ESIA
stu
die
sstart
(sou
the
rn part
of co
nce
ssion)
GA
C b
asic
agre
em
ent
signe
d w
ith go
vern
me
nt
GA
C ESIA
stu
die
sco
mm
en
ce
Scop
ing re
port su
bmitted
&
ESIA stu
die
s for C
BG
Exp
an
sion P
rojectun
derw
ay
Ne
w a
gree
me
nt signed b
/n
Re
pu
blic o
f Gu
inea an
d G
AC
fo
r prb
au
xite exp
ort pro
ject
Initia
l GA
C
ESIA
com
ple
ted
102 FOREST-SMART MINING
an easement within its ore mining concession allowing COBAD to construct a road linking the mining concession with the main branch line of the ANAIM Railway. Within the framework of the implementation of its expansion project, CBG requested funding from several international financial institutions, in particular, from IFC. For CBG to receive that funding, activities carried out by CBG or a third party within CBG’s mining concession must be in compliance with the norms and standards developed by the financial institutions in the field of environmental protection. To meet the requirements of its creditors, CBG asked COBAD to modify the previously agreed-upon mining road track in order to protect target biodiversity areas, as well as key animal species and their habitats. Despite incurred financial losses of $5 million and a six-month delay in the project implementation, COBAD agreed with CBG’s requirement to modify the mining road track, bauxite warehouse layout, and layout of railway adjacent to ANAIM’s.
In its activities, COBAD is implementing measures designed to reduce the impact of construction and operation of the mining road on the territory of CBG’s mining concession. This specification complied with IFC standards and defined COBAD’s rights and obligations in terms of prevention, elimination, reduction, or compensation of social and environmental impacts arising from the construction and operation of the mining road within the CBG mining concession, as well as CBG’s duties to supervise the work being carried out. In accordance with those implemented measures, COBAD is required to create a habitat zone for chimpanzees. This involves a program of restoration and preservation of gallery forests and the creation of 100-meter-wide protective strips along both rivers’ banks, which are proximate to the road.
Data sources
• Aluminium Insider. 2017. “RUSAL’s Restart of Operations at Guinea’s Dian-Dian Bauxite Mine Imminent.” Aluminium Insider. 2017. https://aluminiuminsider.com/rusals-restart-operations-guineas-dian-dian-bauxite-mine-imminent/.
• EEM Sustainable Management. n.d. “Environmental and Social Impact Assessment of the CBG Mine Expansion Project.”
• ———. 2015. “Supplementary Information Package (SIP) to the ESIA of the CBG Expansion Project. Third Release. Volume I - Appendcies 9.1 to 9.6.”
• ———. 2016. “Biodiversity Management System for the CBG Expansion Project. Main Report - Version 1.”
• EGIS International. 2016. “Strategic Environmental and Social Assessment (SESA) of the Mining Sector Reform in Guinea.”
• Emirates Global Aluminium. 2018. “Emirates Global Aluminium Website.” 2018. https://www.ega.ae/en.
• ERM. 2015a. “Social and Environmental Impact Assessment (SEIA) Addendum for GAC’s Bauxite Export Project, Guinea. Non-Technical Summary.”
• ———. 2015b. “Social and Environmental Impact Assessment (SEIA) Addendum for GAC’s Bauxite Export Project, Guinea. Volumes 1 - 4.”
• GAC/EGA. 2016. “Land Acquisition, Compensation and Resettlement Framework.”
• Kormos, Rebecca, and Cyril Kormos. 2011. “Towards a Strategic National Plan for Biodiversity Offsets for Mining in the Republic of Guinea, West Africa with a Focus on Chimpanzees.” http://www.bankinformationcenter.org/wp-content/uploads/2013/07/GuineaBiodiversityOffsetKormosKormos2011.pdf.
• Reuters. 2014. “Russia’s RUSAL Starts Dian-Dian Bauxite Project in Guinea.” Reuters. 2014. https://af.reuters.com/article/commoditiesNews/idAFL6N0PL4M220140710.
• SGS Environment. 2014. “COBAD Environmental and Social Impact Assessment for the Dian-Dian Project.”
• The Ministry of Mines and Geology, and Trimble Land Administration. n.d. “Guinea Mining Cadastre Portal.” Accessed December 3, 2017. http://guinee.cadastreminier.org/en/.
• UC RUSAL. n.d. “UC RUSAL Website.” Accessed December 2, 2017. https://sr.rusal.com/.
• ———. 2016. “UC RUSAL and Guinea Agree on Partnership Development Terms.” Press Release. 2016. https://rusal.ru/en/press-center/press-releases/14781/.
• USAID. 2010. “Property Rights and Resource Governance. Country Profile - Guinea.” https://land-links.org/wp-content/uploads/2016/09/USAID_Land_Tenure_Guinea_Profile.pdf.
• World Bank Environment and Natural Resources Management Unit of the Africa Region (AFTEN), and Environment Department (ENV). 2010. “West Africa Mineral Sector Strategic Assessment (WAMSSA). An Environmental and Social Strategic Assessment for the Development of the Mineral Sector in the Mano River Union.” Washington D.C.
103FOREST-SMART MINING
3.10.4. Site-Level Forest-Smart Takeaways
• Landscape-level approaches are particularly important when multiple actors are present. Landscape-level conservation planning and a regional development plan are needed to guide the development of the mining sector, including identification of priority areas for avoidance. The cumulative impacts of mining in the region, and of induced in-migration in particular, require active management by local and national government, improved understanding of cumulative impacts, and greater coordination, collective action, and transparent communication among operators. Forest-smart mining needs all actors to come together to mitigate and manage impacts across multiple temporal and spatial scales. CBG and GAC have gone some way to address this through their REB (Reseau Environnement Bauxite) platform, where all mining companies are members, and the aim is to cluster face the cumulative impact in the region, but further stakeholder engagement from other actors in the landscape is required.
• The need for a level playing field. Companies operate with very different starting points and standards of ESG performance. There is a need to level the playing field among operators and require consistent, high standards of practice by all. Active management by local and national government will be key. In a multi-operator landscape like the Boké Mining Complex, where standards of ESG practice are highly variable, risks to site-level NNL/NPI objectives are high: decisions and actions of one operator have the potential to directly or indirectly undermine the achievement of NNL/NPI by others.
• Financial institutions are having a significant impact. The involvement of international finance institutions and the robust application of their respective ESS are driving improvements in ESG practice for new (GAC) and existing mining projects (CBG) through, for example, commitments to NNL/NPI, robust baseline studies, good practice ESIAs, upgrading of existing health, safety, environment and communities management system (CBG), and greater transparency and disclosure.
• Government and company capacities need to be improved. Implementation of proposed mitigation measures and the delivery of positive forest outcomes face myriad challenges on the ground. Within companies, building awareness, capacity and internal support for biodiversity management is a slow and ongoing process, and concerns about securing budget for biodiversity management over the medium and long terms have been highlighted. Recruiting and retaining the right staff has also proven difficult in this landscape, yet it is crucial: management plans are only as good as their effective implementation.
• Local contexts need to be integrated into forest-smart management. Understanding cultural norms (for example, hunting and land use practices) and traditional governance of forestland and resources is essential for anticipating impacts of mining activity, displacement, and in-migration, and identifying mitigation opportunities. Reinforcing the legitimacy of traditional governance systems, recognizing and realizing community forest and resources rights, improving community participation in mining development processes, and maximizing opportunities for community forest management may prove critical for forest conservation.
• Mining–community land use management influences perception. Making sure mining–community land use management is sustainable and perceived as such can alleviate some of the less sustainable practices coupled with in-migration. Local stakeholders must be supported and empowered to manage the landscape sustainably.
• The existing protected area system cannot be relied upon. Both GAC and CBG recognize this, and both have made significant up-front investment in impact mitigation, including the recent creation of the Moyen-Bafing National Park as part of offset commitments, setting an important precedent in Guinea with the potential to influence ESG performance among other operators.

104 FOREST-SMART MINING
3.10.5. Case Study 16: Nimba North (Guinea)
Figure 3.28 Map of Nimba North and AOI, Including Forest Cover and Protected Areas
The mines: In addition to the active mines at Tokadeh and Gangra, in northern Nimba County, Liberia, multiple exploration-phase mining operations for iron ore, nickel, and graphite operate in the region. The operational footprint of these projects is relatively small, consisting of some accommodation, exploration roads, and drill pads. These mining projects are part of the northern extent of the Nimba Range Mineral Province, a region that encompasses parts of Guinea, Liberia (with the Tokadeh mine), and Côte d’Ivoire.
The forest: The mining operations conducted in the area are proximate to the Guinean Nimba World Heritage site (WHS), the Ivorian Nimba WHS, and the East Nimba Nature Reserve (occurring within 50 kilometers of mining concessions). The Nimba Mountains fall within the Upper Guinean Forest zone and include lowland evergreen and deciduous forest types as well as gallery forest.
Forest health score: The Nimba North AOI ranks 27/29; only the wider Nimba Range Mineral Province AOI and the Kansanshi AOI rank lower. The primary negative variable is road density. All of the positive variables scored lowly, with the best being forest connectivity. However, the AOI crosses the border with Côte d’Ivoire and much of the deforestation occurs on the Ivoirian
side of the border. Historical deforestation hovers around 2,000–4,000 hectares per year, but it does show spikes in deforestation—although these do not appear clearly linked to mining activity.
Forest impact factors: Many of the mining projects within Nimba North are not yet operational, and thus clear mitigation procedures are not in place in many circumstances. While the commitments made by companies operating in the area vary, one company, Société des Mines de Fer de Guinée (SMFG), has committed to no net loss for biodiversity and to avoid activities that are incompatible with the outstanding universal value of the World Heritage site, in accordance with its current owner’s corporate standards. SMFG also exemplifies a company committed to responsibly managing its mining area, including significant investment in sediment control and management of its footprint. In addition, the company is currently working with the Guinean and Liberian authorities, and with ArcelorMittal in Liberia, to improve the management of the Nimba World Heritage site and adjoining East Nimba Nature Reserve by supporting fire control, patrols, and transboundary cooperation.
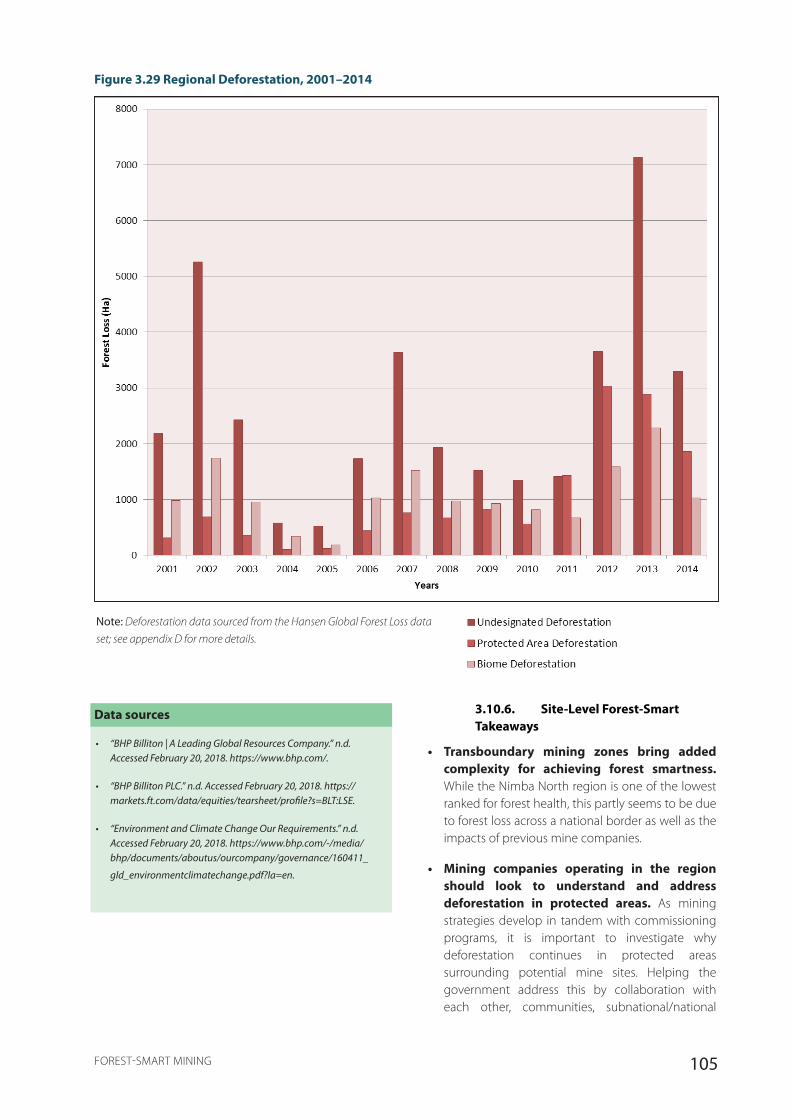
105FOREST-SMART MINING
Figure 3.29 Regional Deforestation, 2001–2014
Note: Deforestation data sourced from the Hansen Global Forest Loss data
set; see appendix D for more details.
3.10.6. Site-Level Forest-Smart Takeaways
• Transboundary mining zones bring added complexity for achieving forest smartness. While the Nimba North region is one of the lowest ranked for forest health, this partly seems to be due to forest loss across a national border as well as the impacts of previous mine companies.
• Mining companies operating in the region should look to understand and address deforestation in protected areas. As mining strategies develop in tandem with commissioning programs, it is important to investigate why deforestation continues in protected areas surrounding potential mine sites. Helping the government address this by collaboration with each other, communities, subnational/national
Data sources
• “BHP Billiton | A Leading Global Resources Company.” n.d. Accessed February 20, 2018. https://www.bhp.com/.
• “BHP Billiton PLC.” n.d. Accessed February 20, 2018. https://markets.ft.com/data/equities/tearsheet/profile?s=BLT:LSE.
• “Environment and Climate Change Our Requirements.” n.d. Accessed February 20, 2018. https://www.bhp.com/-/media/bhp/documents/aboutus/ourcompany/governance/160411_
gld_environmentclimatechange.pdf?la=en.
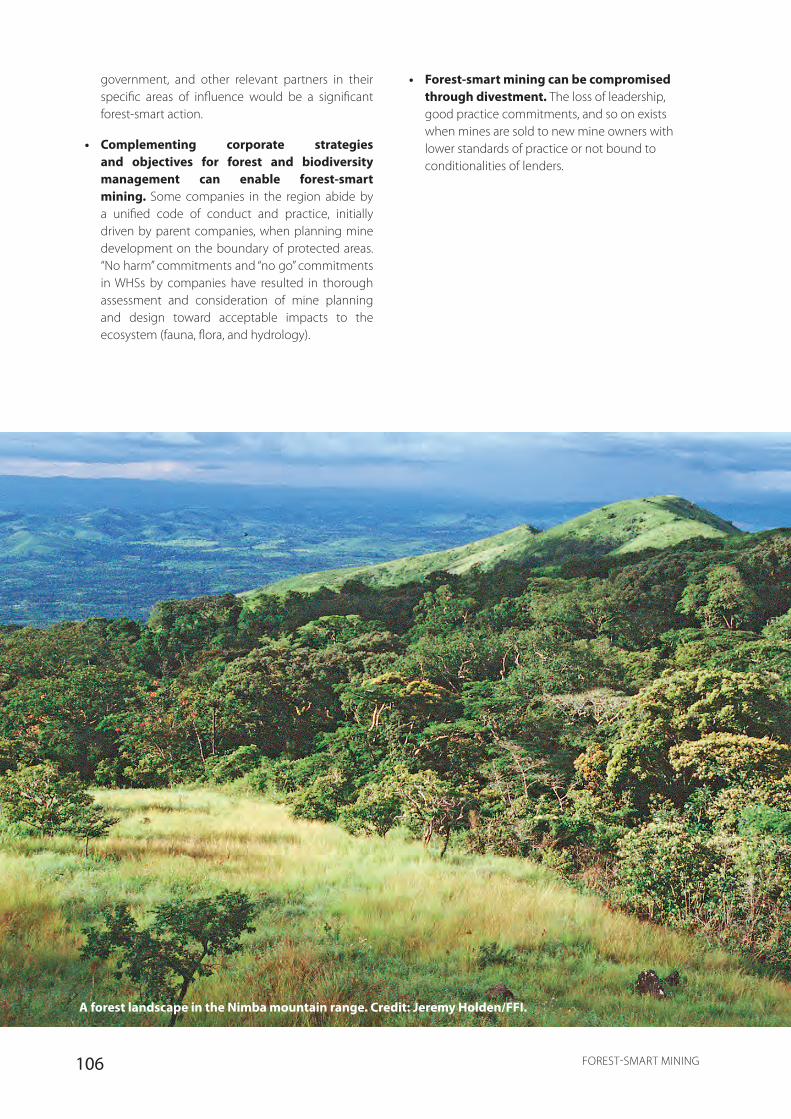
106 FOREST-SMART MINING
government, and other relevant partners in their specific areas of influence would be a significant forest-smart action.
• Complementing corporate strategies and objectives for forest and biodiversity management can enable forest-smart mining. Some companies in the region abide by a unified code of conduct and practice, initially driven by parent companies, when planning mine development on the boundary of protected areas. “No harm” commitments and “no go” commitments in WHSs by companies have resulted in thorough assessment and consideration of mine planning and design toward acceptable impacts to the ecosystem (fauna, flora, and hydrology).
• Forest-smart mining can be compromised through divestment. The loss of leadership, good practice commitments, and so on exists when mines are sold to new mine owners with lower standards of practice or not bound to conditionalities of lenders.
A forest landscape in the Nimba mountain range. Credit: Jeremy Holden/FFI.

107FOREST-SMART MINING
3.11. INDIAFigure 3.30 Relationship between Forests and Large-Scale Mining in India
Note: The country map shows the extent of forest cover (in green); the bar graph shows the proportion of mining that occurs in forests
compared to the global average of countries containing MFAs; the pie chart shows the proportion of global MFAs in the country.
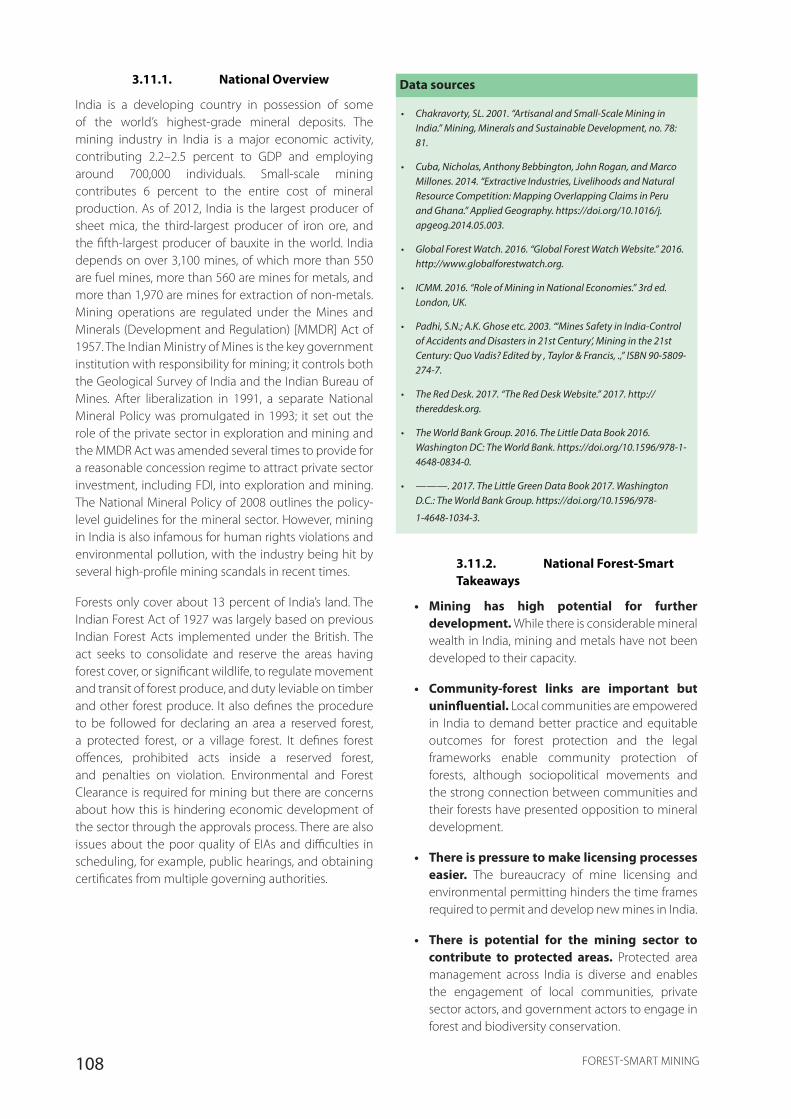
108 FOREST-SMART MINING
3.11.1. National Overview
India is a developing country in possession of some of the world’s highest-grade mineral deposits. The mining industry in India is a major economic activity, contributing 2.2–2.5 percent to GDP and employing around 700,000 individuals. Small-scale mining contributes 6 percent to the entire cost of mineral production. As of 2012, India is the largest producer of sheet mica, the third-largest producer of iron ore, and the fifth-largest producer of bauxite in the world. India depends on over 3,100 mines, of which more than 550 are fuel mines, more than 560 are mines for metals, and more than 1,970 are mines for extraction of non-metals. Mining operations are regulated under the Mines and Minerals (Development and Regulation) [MMDR] Act of 1957. The Indian Ministry of Mines is the key government institution with responsibility for mining; it controls both the Geological Survey of India and the Indian Bureau of Mines. After liberalization in 1991, a separate National Mineral Policy was promulgated in 1993; it set out the role of the private sector in exploration and mining and the MMDR Act was amended several times to provide for a reasonable concession regime to attract private sector investment, including FDI, into exploration and mining. The National Mineral Policy of 2008 outlines the policy-level guidelines for the mineral sector. However, mining in India is also infamous for human rights violations and environmental pollution, with the industry being hit by several high-profile mining scandals in recent times.
Forests only cover about 13 percent of India’s land. The Indian Forest Act of 1927 was largely based on previous Indian Forest Acts implemented under the British. The act seeks to consolidate and reserve the areas having forest cover, or significant wildlife, to regulate movement and transit of forest produce, and duty leviable on timber and other forest produce. It also defines the procedure to be followed for declaring an area a reserved forest, a protected forest, or a village forest. It defines forest offences, prohibited acts inside a reserved forest, and penalties on violation. Environmental and Forest Clearance is required for mining but there are concerns about how this is hindering economic development of the sector through the approvals process. There are also issues about the poor quality of EIAs and difficulties in scheduling, for example, public hearings, and obtaining certificates from multiple governing authorities.
Data sources
• Chakravorty, SL. 2001. “Artisanal and Small-Scale Mining in India.” Mining, Minerals and Sustainable Development, no. 78: 81.
• Cuba, Nicholas, Anthony Bebbington, John Rogan, and Marco Millones. 2014. “Extractive Industries, Livelihoods and Natural Resource Competition: Mapping Overlapping Claims in Peru and Ghana.” Applied Geography. https://doi.org/10.1016/j.apgeog.2014.05.003.
• Global Forest Watch. 2016. “Global Forest Watch Website.” 2016. http://www.globalforestwatch.org.
• ICMM. 2016. “Role of Mining in National Economies.” 3rd ed. London, UK.
• Padhi, S.N.; A.K. Ghose etc. 2003. “‘Mines Safety in India-Control of Accidents and Disasters in 21st Century’, Mining in the 21st Century: Quo Vadis? Edited by , Taylor & Francis, .,” ISBN 90-5809-274-7.
• The Red Desk. 2017. “The Red Desk Website.” 2017. http://thereddesk.org.
• The World Bank Group. 2016. The Little Data Book 2016. Washington DC: The World Bank. https://doi.org/10.1596/978-1-4648-0834-0.
• ———. 2017. The Little Green Data Book 2017. Washington D.C.: The World Bank Group. https://doi.org/10.1596/978-
1-4648-1034-3.
3.11.2. National Forest-Smart Takeaways
• Mining has high potential for further development. While there is considerable mineral wealth in India, mining and metals have not been developed to their capacity.
• Community-forest links are important but uninfluential. Local communities are empowered in India to demand better practice and equitable outcomes for forest protection and the legal frameworks enable community protection of forests, although sociopolitical movements and the strong connection between communities and their forests have presented opposition to mineral development.
• There is pressure to make licensing processes easier. The bureaucracy of mine licensing and environmental permitting hinders the time frames required to permit and develop new mines in India.
• There is potential for the mining sector to contribute to protected areas. Protected area management across India is diverse and enables the engagement of local communities, private sector actors, and government actors to engage in forest and biodiversity conservation.

109FOREST-SMART MINING
3.11.3. Case Study 17: Bunder (Rio Tinto)
Figure 3.31 Regional Map of Bunder site and AOI, Including Forest Cover and Protected Areas
The project: The Bunder diamond deposit in India was discovered in 2004 and is located in an ecologically sensitive zone about 500 kilometers (310 miles) south of New Delhi. The ore body was originally set to be developed by Rio Tinto, but it reverted back to the state of Madhya Pradesh in 2017 following a realignment of Rio Tinto’s global project portfolio; the relatively minor forest disturbance associated with Rio Tinto’s exploration program was rehabilitated before relinquishment. Regionally, there is also associated controlled/formal ASM with licenses for local miners. In 2016, there were officially 952 artisanal mines, which yielded 835 carats of diamonds. However, there are an unknown number of small illegal mines, and an unknown amount of diamonds sold on the black market.
The forest: The undeveloped ore body is located in a protected forest. The proposed mining area contains dry deciduous forest with varied species diversity, with a good mixture of teak in patches. The area has fauna and avifauna with notable vulture species. There are two protected areas—Noradehi and Panna (IUCN category IV and II, respectively)—approximately 70–100 kilometers from the site in addition to two areas of critical habitat to the north and east (although not within the AOI).
Forest health score and historical deforestation: The project’s regional AOI is ranked 18/29 on the index. Some secondary forest remains, but the primary negative variable is a high population density. Historical deforestation rates show a clear spike in deforestation in already degraded forests through 2006–2012, which may be linked to exploration starting in 2004 and subsequent development (and an associated influx of ASM) from 2007–2009 or an increase in illegal felling driven by a perceived demand for farming lands or farming lands with an expectation of price increase. Deforestation drops again after 2012, when exploration activities stopped.
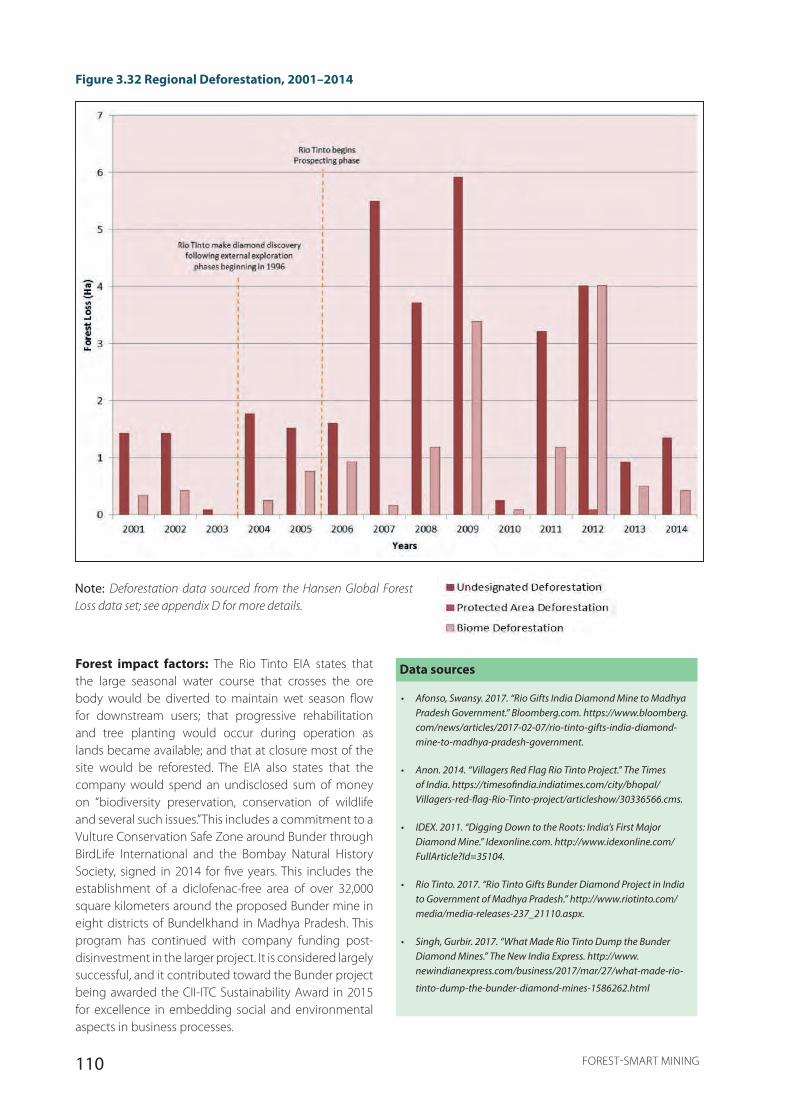
110 FOREST-SMART MINING
Figure 3.32 Regional Deforestation, 2001–2014
Note: Deforestation data sourced from the Hansen Global Forest Loss data set; see appendix D for more details.
Forest impact factors: The Rio Tinto EIA states that the large seasonal water course that crosses the ore body would be diverted to maintain wet season flow for downstream users; that progressive rehabilitation and tree planting would occur during operation as lands became available; and that at closure most of the site would be reforested. The EIA also states that the company would spend an undisclosed sum of money on “biodiversity preservation, conservation of wildlife and several such issues.” This includes a commitment to a Vulture Conservation Safe Zone around Bunder through BirdLife International and the Bombay Natural History Society, signed in 2014 for five years. This includes the establishment of a diclofenac-free area of over 32,000 square kilometers around the proposed Bunder mine in eight districts of Bundelkhand in Madhya Pradesh. This program has continued with company funding post-disinvestment in the larger project. It is considered largely successful, and it contributed toward the Bunder project being awarded the CII-ITC Sustainability Award in 2015 for excellence in embedding social and environmental aspects in business processes.
Data sources
• Afonso, Swansy. 2017. “Rio Gifts India Diamond Mine to Madhya Pradesh Government.” Bloomberg.com. https://www.bloomberg.com/news/articles/2017-02-07/rio-tinto-gifts-india-diamond-mine-to-madhya-pradesh-government.
• Anon. 2014. “Villagers Red Flag Rio Tinto Project.” The Times of India. https://timesofindia.indiatimes.com/city/bhopal/Villagers-red-flag-Rio-Tinto-project/articleshow/30336566.cms.
• IDEX. 2011. “Digging Down to the Roots: India’s First Major Diamond Mine.” Idexonline.com. http://www.idexonline.com/FullArticle?Id=35104.
• Rio Tinto. 2017. “Rio Tinto Gifts Bunder Diamond Project in India to Government of Madhya Pradesh.” http://www.riotinto.com/media/media-releases-237_21110.aspx.
• Singh, Gurbir. 2017. “What Made Rio Tinto Dump the Bunder Diamond Mines.” The New India Express. http://www.newindianexpress.com/business/2017/mar/27/what-made-rio-
tinto-dump-the-bunder-diamond-mines-1586262.html

111FOREST-SMART MINING
3.11.4. Site-Level Forest-Smart Takeaways
• Forest-smart mining requires adherence to and implementation of best practice corporate commitments. Rio Tinto’s Bunder project won the CII-ITC Sustainability Award in 2015 for excellence in embedding social and environmental aspects in business processes, one of the more prestigious CSR awards in the country. The Bunder project, like others, was selected after a detailed round of desktop analysis and rigorous field surveys and assessments. It won this award from among a list of over 80 nominations. Rare for a mining company to receive this in India, Rio Tinto’s commitment to best practice in the case of Bunder was exemplified by this award.
• When companies and responsible authorities act in tandem, forest-smart mining becomes a reality. Strong regulation and engagement of responsible authorities can deliver forest-smart mining. Corporate transparency coupled with a diligent regulator enabled recognition of important BES values while development stage baseline studies were ongoing.
• Working with local governance can mitigate indirect induced secondary impacts. Recognizing the demand for water and agricultural land could well lead to illegal felling, Rio Tinto worked with the local Panchayat (village-level elected regulators), the local Water Department, and a consulting technical NGO (AFPRO) to create water bodies (approximately 20) in the hinterland. This ensured a catchment and the ability for local farmers to move from a one crop to two or three crops a year (including cash crops). This reduced the ask for more lands and brought in natural water.
• Working closely with authorities to reduce conservation impact can have inadvertent forest-smart outcomes. Within the AOI, Rio Tinto worked closely with the state’s chief wildlife warden to mitigate the impacts on the wildlife as part of the proposed mine development. An increased presence in patrols in 2010 led to a drastic decrease in illegal deforestation (Figure 3.32). Based on the outcome of these negotiations was the state’s approval for the proposed wildlife management plan, a precursor to secure Forest Division approval. This action was doubly smart as the Wildlife Department also recognized the impact the proposed mine would have upon the behavior of the wildlife, which in turn would require upskilling the forest rangers and guards to a new operating environment, in terms of their engagement with both the wildlife and the local stakeholders. This created a less bureaucratic system in addition to preserving the wildlife, which collaterally positively impacted forests.

112 FOREST-SMART MINING
3.12. INDONESIA Figure 3.33 Relationship between Forests and Large-Scale Mining in Indonesia
Note: The country map shows the extent of forest cover (in green); the bar graph shows the proportion of mining that occurs in forests
compared to the global average of countries containing MFAs; the pie chart shows the proportion of global MFAs in the country.

113FOREST-SMART MINING
3.12.1. National Overview
Indonesia is a significant player in the global mining sector, particularly for copper, gold, tin, and nickel. As a contribution to national economic development the sector has been falling in recent years in response to some legislative reforms, but it remains close to 5 percent of the national economy overall and often represents the largest contributor to local government revenues in the areas where large projects are sited. Indonesia is also one of the most important forested countries, with about half of the country still forested and around 6 million people directly reliant on forest resources. However, these forest resources are declining fast, with Indonesia having some of the highest deforestation rates in the world and deforestation estimated to be one of the major contributors to Indonesia’s greenhouse gas emissions. Mining is not perceived as a major driver of deforestation at a national level, but it can have significant local impacts and does occur in protected forests in some places.
The regulatory environment in Indonesia is complex, with many strong laws but also various overlapping and contradictory legislation, a lack of a centralized land registry, and varied levels of enforcement and corruption. Government is increasingly decentralized, with important institutions at national, provincial, and district levels. District government provides most of the services, but some issues, including mining and forests, are still largely controlled centrally. At both the national and local levels, strong commitments have been made toward green development, with the president announcing 25–42 percent targets for emission reductions. REDD is seen as a significant mechanism for achieving this and Indonesia is home to a multitude of demonstration projects. However, despite the public commitment, Indonesia has made little progress toward actually reducing deforestation rates to date, due in part to the involvement of numerous, uncoordinated institutions, failure to establish MRV (monitoring, reporting, and verification) or finance mechanisms, failure to enforce deforestation laws. However, with REDD now under the remit of a single government ministry, finance and MRV mechanisms reportedly close to completion, and a major drive to increase community forestry tenure, Indonesia may be getting close to addressing deforestation.
Indonesia has made ambitious commitments to cut GHG emissions by up to 41 percent and sees REDD+ as a key path for achieving this. A Readiness Preparation Proposal was submitted in 2009, a Letter of Intent was signed with Norway for $1 billion in 2010, a national strategy in 2012 and readiness grants followed from the Forest Investment Program and the Forest Carbon Partnership Facility (FCPF). By 2013, over 50 REDD projects were in operation. Since then, progress has stalled with various
conflicts over who was running REDD. The newly merged Forestry and Environment Ministry now has the mandate to take it forward, but still no financial mechanisms are in place and no emissions have been avoided, meaning most of the Norwegian money remains unpaid. Mining is clearly listed in the strategy as an industry from which emissions can be reduced and also in the context of integrated landscape management. Mining companies have been exploring potential links between REDD+ and mineral extraction since as early as 2011, but no such projects have gotten off the ground.
Data sources
• Abood, Sinan A., Janice Ser Huay Lee, Zuzana Burivalova, John Garcia-Ulloa, and Lian Pin Koh. 2015. “Relative Contributions of the Logging, Fiber, Oil Palm, and Mining Industries to Forest Loss in Indonesia.” Conservation Letters 8 (1): 58–67. https://doi.org/10.1111/conl.12103.
• ASEAN Secretariat. 2009. “Fourth ASEAN State of the Environment Report.” Jakarta.
• Bachriadi, Dianto. 2007. “Mining in a State Forest? This Is Indonesia!” Inside Indonesia, July 26, 2007. http://www.insideindonesia.org/mining-in-a-state-forest-this-is-indonesia.
• Butler, Rhett A. 2013. “Mining Company Working with Indonesian Govt to Strip Forest of Protected Status.” Mongabay.Com, April 16, 2013.
• CESS-ODI. 2005. “Links between Forests and Poverty in Indonesia. What Evidence? How Can Targeting of Poverty in and near Forests Be Improved?”
• Chris Lang. 2011. “Mining for REDD in Indonesia.” World Rainforest Movement. 2011. http://wrm.org.uy/articles-from-the-wrm-bulletin/section1/mining-for-redd-in-indonesia/.
• FAO. 2010a. “FRA 2010 – Country Report, Indonesia.” FAO Forestry Paper 163, 340. papers3://publication/uuid/C311B35B-28D3-4BC2-8DFA-3358A59E0DE3.
• Global Forest Watch. 2016. “Global Forest Watch Website.” 2016. http://www.globalforestwatch.org.
• ———. 2017. “Indonesia Forest Change.” 2017. http://www.globalforestwatch.org/country/IDN?category=forest-change.
• ICMM. 2016. “Role of Mining in National Economies.” 3rd ed. London, UK.
• Jong, Hans Nicholas. 2017. “Indonesia Tries to Learn from Brazil ’ s Success in REDD +.” Mongabay.Com, November 10, 2017. https://news.mongabay.com/2017/11/indonesia-tries-to-learn-from-brazils-success-in-redd/.
• Mongabay. 2013. “Indonesia to Raise Logging , Mining Fees in Forest Areas.” Mongabay.Com, April 2013.
• PwC. 2017. Mining in Indonesia. 9th ed. PwC.
• Republic of Indonesia Ministry of National Development Planning (BAPPENAS). 2016. “Indonesian Biodiversity Strategy and Action Plan 2015-2020.” Jakarta, Indonesia.

114 FOREST-SMART MINING
• The Red Desk. 2017. “The Red Desk Website.” 2017. http://thereddesk.org.
• The World Bank Group. 2016. The Little Data Book 2016. Washington DC: The World Bank. https://doi.org/10.1596/978-1-4648-0834-0.
• ———. 2017. The Little Green Data Book 2017. Washington D.C.: The World Bank Group. https://doi.org/10.1596/978- 1-4648-1034-3.
• Wacaster, S. 2014. “The Mineral Industry of Indonesia. United States Geological Survey.” https://minerals.usgs.gov/minerals/pubs/country/2014/myb3-2014-id.pdf.
• Wijaya, A., R. A. Sugardiman, B. Budiharto, A. Tosiani, D. Murdiyarso, and L. V. Verchot. 2015. “Assessment of Large Scale Land Cover Change Classifications and Drivers of Deforestation in Indonesia.” International Archives of the Photogrammetry, Remote Sensing and Spatial Information Sciences - ISPRS Archives 40 (7W3): 557–62. https://doi.org/10.5194/isprsarchives-XL-7-W3-557-2015.
• World Resources Institute. n.d. “The State of the Forest: Indonesia.” Accessed September 13, 2017. https://www.wri.org/
publication/state-forest.
3.12.2. National Forest-Smart Takeaways
• Indonesia’s forest challenges are some of the largest in the world and are recognized as a national priority to address. Mining is not a key driver of forest loss at the national scale but can have significant local impacts. The national frameworks and institutions for addressing forest losses are not yet fit for purpose, but they are getting close. Given this context, Indonesia should be a natural focus for promoting forest-smart mining.
• Mining is set to increase in Indonesia. There is a good chance that the recent dip in mining activity in Indonesia will rise again when the challenges the legislative changes present are overcome. If and when the sector does start to grow again, there is an opportunity to ensure any growth happens in a forest-smart manner.
• Changes in mining legislation could be important for forest-smart mining. The recent changes in Indonesia’s mining laws have been viewed fairly negatively by the international mining world. The changes themselves are not inherently bad for the relationship between mining and forests in Indonesia; however, there could be a risk that they force out larger, international companies that are subject to international scrutiny and standards and replace them with local companies that may not be subject to the same pressures.
• Reducing forest impacts from mining through REDD+ has clear synergy with the Indonesian strategy. Addressing emissions related to mining is the third activity listed in the national strategy, which also recognizes the value of cross-sectoral landscape approaches. But success depends on Indonesia getting its REDD+ program running again, and it also requires companies to take clear additional actions, not to expect to gain benefits for business as usual.

115FOREST-SMART MINING
3.12.3. Case Study 18: Batu Hijau (Newmont)
Figure 3.34 Map of Batu Hijau and AOI, Including Forest Cover and Protected Areas
The mine: Batu Hijau is a copper, gold, and silver mine on the island of Sumbawa, Indonesia. The ore is composed of copper and gold, producing 328,000 ounces of gold in 2015. The 2,400-hectare open-pit mine is located in a forested area, but a 17-kilometer pipe transports materials to a port on the coast. Operations started in 2000 and are now projected to last until 2033. It is operated by PT Nusa Tenggara (PT NTT), which until recently was majority owned by Newmont and Sumitomo together with a number of junior partners, including local government. For many years, it was considered Newmont’s flagship facility, both in terms of production and environmental and social performance. However, in 2016, following the changes in Indonesia’s mining legislation, which led to several months’ production being stopped, Newmont and Sumitomo sold their majority share to PT Amman Mineral Internasional, a subsidiary of Indonesian oil and gas company Medco Energi Internasional.
The forest: The area around the mine is nearly 70 percent forested, dominated by lowland evergreen broadleaf rain forest. Much of the economic focus of the area is on marine activities—primarily fishing—meaning the forests are in fairly good condition. There is one protected area of conservation interest, the Tatar Sebang
IBA or KBA, designated for the presence of the yellow crested cockatoo and Flores green pigeon.
Forest health score and historical deforestation: Batu Hijau is ranked 8/29 in the Forest Health Index, with most of the remaining forest designated core forest. The primary negative factor is population change. Historical data show deforestation levels of around 200–400 hectares a year in both biome and undesignated areas. The impacts of the mine are not known as deforestation data only go back to 2001. However, there is a sudden spike in 2014 to 1,000 hectares a year, including some deforestation in protected areas, which would be useful to understand if forest-smart management practices are to be effective.
Forest impact factors: Much of the focus of the Batu Hijau mine has been on its impacts on the marine environment, with a reported 40 million tonnes of waste disposed at sea each year. Impacts do occur on the forest, with waste rock also dumped on land and the mine authorized to clear 2,400 hectares of the 6,400-hectare forest it sits in for the mine operations. One of the primary responses to this was the adoption of a 6,000-hectare restoration concession elsewhere on the island where
116 FOREST-SMART MINING
Figure 3.35 Regional Deforestation, 2001–2014
PT NTT is responsible for forest restoration. Individual conservation programs were also conducted with NGOs. In addition to these, the company had a wide range of social programs. In a third-party review of the company’s social and environment performance in 2015 as a pre-sale report, it was concluded that PT NTT’s responses to potential impacts were “world class and at the forefront of international best practice in Social Responsibility, Community Health and Environmental Management.” The review focused on the impacts of marine tailings, which were largely found to be minimal, but terrestrial impacts were given relatively little attention, with data from just two faunal surveys from 2014 and 2015 being used to conclude there were no significant impacts. However, additional baseline and regular fauna and flora studies go back to the late 1990s, although this data was underutilized. The site has a 50-year closure plan in place, originally costed at $650 million but recently $250 million was added following a reanalysis.
Data sources
• ARCADIS. 2015. “Expert Consultant Third Party State of Environmental, Social and Community Health Conditions Review for the Batu Hijau Operations and Nearby Communities.” Colorado, USA.
• Devi, Bernadetta, and Dody Prayogo. 2013. “Mining and Development in Indonesia : An Overview of the Regulatory Framework and Policies.” https://im4dc.org/wp-content/uploads/2013/09/Mining-and-Development-in-Indonesia.pdf.
• Goodland, Robert. 2012. “Responsible Mining: The Key to Profitable Resource Development.” https://doi.org/10.3390/su4092099.
• Miningtechnology.com. 2010. “Batu Hijau Copper-Gold Mine.” Miningtechnology.Com. 2010. http://www.mining-technology.com/projects/batu/.
• Newmont Mining Corporation. 2015. “Beyond the Mine: Our 2015 Social and Environmental Performance.” Denver, Colorado.
• Senaputra, Alexander, and Roy Simanjuntak. 2016. “Batu Hijau Mine and the Post-Acquisition Challenges.” Jakarta Post, July 28, 2016. http://www.thejakartapost.com/academia/2016/07/28/
batu-hijau-mine-and-the-post-acquisition-challenges.html.
3.12.4. Site-Level Forest-Smart Takeaways
• Changes in ownership may have important implications for forest smartness. Batu Hijau was held up as an example of best practice for environmental and social management. While
Note: Deforestation data sourced from the Hansen Global Forest
Loss data set; see appendix D for more details.

117FOREST-SMART MINING
there was clearly scope for improvement, the sale of the mine now raises questions for all of the liabilities taken on by PT NTT, particularly given the lower profile and visibility of the new owners. Best practice is only best practice if it can be ensured for the foreseeable future. Given very few mines do change hands at some point in their life cycle, such commitments are strongly dependent on the licensing process being able to ensure mine closure liabilities are adequately transferred between owners and ultimately implemented. Initial signs for Batu Hijau are worrying, with the new owners extending the expected mine life by starting to process stockpiles that were previously considered too polluting to process. While it is too early to see the impacts on Batu Hijau, it is important for the new owners to demonstrate that they remain at least as committed as Newmont to best practice, particularly on mine closure investment.
• Could investment in social programs reduce environmental impacts? While deforestation and population increases were occurring in the AOI, they were far below the levels of other areas. Newmont suggests this was partly due to the local
economy being largely marine-focused but also might have been a result of high investment into social and structural programs (including improved agriculture output due to construction of water reservoirs, cooperatives, and education), ensuring people did not need to turn to forests. This may be true, although one unintended consequence of a well-paid workforce and associated communities was a substantial rise in local prices impacting those not associated with the mine.
• Forest-smart mining should not be clouded by marine-smart mining. While the primary impacts and therefore focus for Batu Hijau were on marine impacts, the information available on forest impacts was less accessible in comparison. Detailed monitoring data were available for a range of marine impacts, yet almost nothing was available for the terrestrial impacts. There was little mention in publicly available documentation of the forest concession restoration, despite representing a $65 million liability on the books. Batu Hijau may or may not have been operating in a forest-smart way—without the data, it is very difficult to judge.
3.12.5. Case Study 19: Grasberg (Freeport-McMoRan)
Figure 3.36 Map of Grasberg and AOI, Including Forest Cover and Protected Areas
118 FOREST-SMART MINING
The mine: The Grasberg copper, gold, and silver mine in Papua Province, western Indonesia, is one of the largest and most productive mines in the world, producing around a million ounces of gold a year and with ores projected to last until at least 20412. Established over 40 years ago, the mine is owned by the U.S. company Freeport-McMoRan, with Rio Tinto and the Indonesian government also holding stakes. It is the largest taxpayer in Indonesia and accounts for over half of the provincial GDP. However, recent legislative reforms have led to an agreement for the Indonesian government to take the controlling stake in the mine. Discussions on the details of this deal were ongoing at the time of writing. Much attention has been placed on the social impacts of the mine, which have been exacerbated by the political sensitivity of the region related to Papua’s independence movement, and violent conflict is common. Direct impacts of land losses, relocations, and pollution have been highlighted, but major indirect impacts also occur, such as the social upheaval for indigenous Papuans caused by close to 2 million people moving in to the province. The environmental impacts come in part from the mine site itself, which comprises a large open-pit mine, a limestone quarry, and several underground mines, but they predominantly come from the mine waste, with a reported 200,000 tonnes a day disposed into the local river system and collected at a 230-square-kilometer deposition area. Unusually, the primary impacts of the Grasberg mine on forests are fairly well understood thanks to data published in 2016. Using satellite time series data, researchers showed that between 1987 and 2014, 138 square kilometers of forest were lost as a direct result of mine activity, with total losses projected to reach 230 square kilometers. Losses were 96 percent the result of waste management, including flooding caused by the levees designed to capture sediment. These impacts were not unexpected and proceeded in line with government and permitting approvals.
The forest: The mine site lies between 2,700 and 4,200 meters above sea level and is surrounded by montane forest; it is adjacent to the Lorentz National Park and UNESCO World Heritage site. The boundaries of the mine concession were adjusted in response to the needs of the park when it was formed in 1999.
_____________________ 2 The “Controlled Riverine Tailings Management at PT Freeport Indonesia” (PT Freeport Indonesia 2016) was used extensively to draft this case study.
Forest health score and historical deforestation: Forest health around the Grasberg mine is high relative to the other sites analyzed, giving the AOI a rank of 4/29. This is primarily due to the high levels of intact forest present. The key negative factors are population levels and population influx, with Grasberg experiencing the highest population increase of any of the case studies, but unlike for other areas, these have not affected overall forest health to the same degree. Historical patterns of deforestation were of less value for the Grasberg study since the mine predates forest data, although they show relatively low levels of deforestation continue each year, particularly in better quality
Forest impact factors: The environmental commitments by the managing company, PT Freeport Indonesia, are largely in line with corporate policy, focusing on legal compliance and minimization of impact. Closure plans are in place, with three funds, one of which is expected to yield $100 million. Total rehabilitation costs are expected in the range of $100–$150 million, with a reclamation plan approved in 2018 focusing on the downstream levee area where the waste sediment is captured. A foundation for local communities is in place, funded through 1 percent of revenue, and a biodiversity database has been set up, although a recent audit highlighted the continued absence of a biodiversity strategic plan. The license to operate reportedly requires the management of forest across the concession area, but no information on if or how this is being done is given.
Data sources
• Alonzo, Michael, Jamon Van Den Hoek, and Nabil Ahmed. 2016. “Capturing Coupled Riparian and Coastal Disturbance from Industrial Mining Using Cloud-Resilient Satellite Time Series Analysis.” Scientific Reports 6 (1): 35129. https://doi.org/10.1038/srep35129.
• Bochove, Danielle. 2018. “Rio Tinto Talks Loom as a Lifeline for Freeport in Indonesia.” Bloomberg News, January 25, 2018. https://www.bloomberg.com/news/articles/2018-01-25/rio-tinto-talks-loom-as-a-lifeline-for-freeport-in-indonesia.
• Chris Lang. 2011a. “Mining for REDD in Indonesia.” World Rainforest Movement. 2011. http://wrm.org.uy/articles-from-the-wrm-bulletin/section1/mining-for-redd-in-indonesia/.
• ———. 2011b. “Mining for REDD in Indonesia.” World Rainforest Movement. 2011. http://wrm.org.uy/articles-from-the-wrm-bulletin/section1/mining-for-redd-in-indonesia/.
• Freeport-McMoRan. 2016. “Driven by Value: 2016 Working toward Sustainable Development Report.” https://www.fcx.com/sites/fcx/files/documents/sustainability/wtsd_2016.pdf.
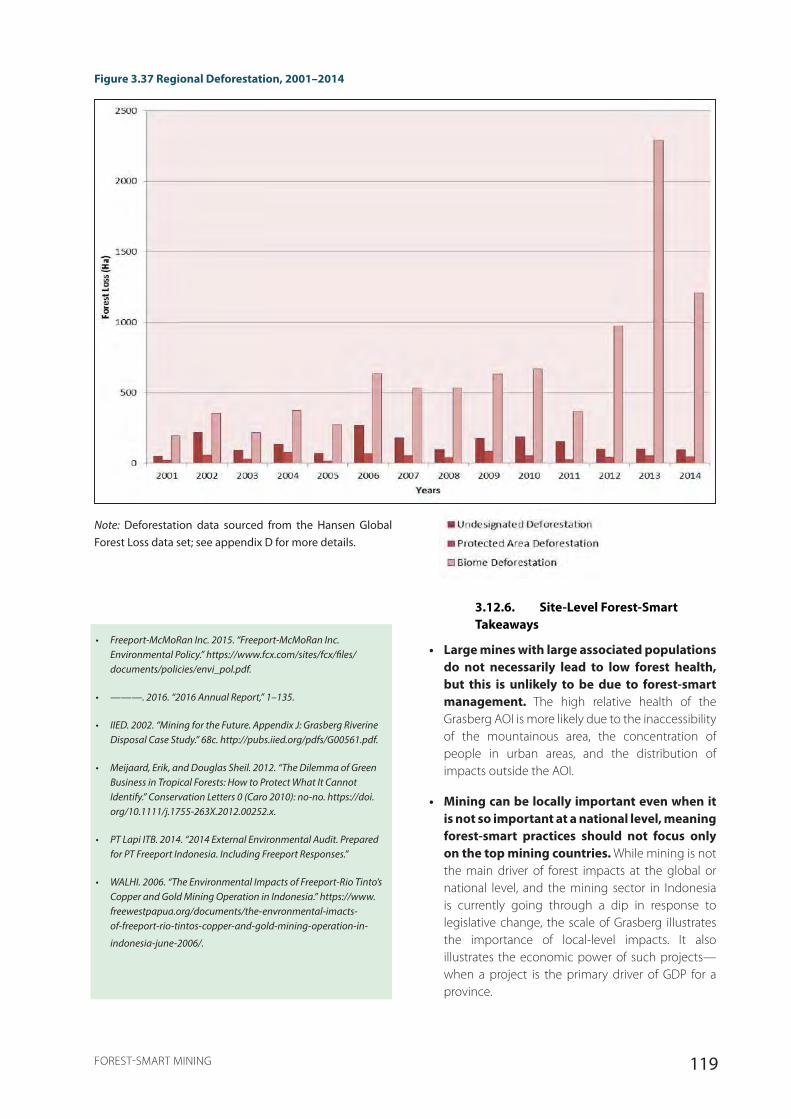
119FOREST-SMART MINING
Figure 3.37 Regional Deforestation, 2001–2014
Note: Deforestation data sourced from the Hansen Global Forest Loss data set; see appendix D for more details.
3.12.6. Site-Level Forest-Smart Takeaways
• Large mines with large associated populations do not necessarily lead to low forest health, but this is unlikely to be due to forest-smart management. The high relative health of the Grasberg AOI is more likely due to the inaccessibility of the mountainous area, the concentration of people in urban areas, and the distribution of impacts outside the AOI.
• Mining can be locally important even when it is not so important at a national level, meaning forest-smart practices should not focus only on the top mining countries. While mining is not the main driver of forest impacts at the global or national level, and the mining sector in Indonesia is currently going through a dip in response to legislative change, the scale of Grasberg illustrates the importance of local-level impacts. It also illustrates the economic power of such projects—when a project is the primary driver of GDP for a province.
• Freeport-McMoRan Inc. 2015. “Freeport-McMoRan Inc. Environmental Policy.” https://www.fcx.com/sites/fcx/files/documents/policies/envi_pol.pdf.
• ———. 2016. “2016 Annual Report,” 1–135.
• IIED. 2002. “Mining for the Future. Appendix J: Grasberg Riverine Disposal Case Study.” 68c. http://pubs.iied.org/pdfs/G00561.pdf.
• Meijaard, Erik, and Douglas Sheil. 2012. “The Dilemma of Green Business in Tropical Forests: How to Protect What It Cannot Identify.” Conservation Letters 0 (Caro 2010): no-no. https://doi.org/10.1111/j.1755-263X.2012.00252.x.
• PT Lapi ITB. 2014. “2014 External Environmental Audit. Prepared for PT Freeport Indonesia. Including Freeport Responses.”
• WALHI. 2006. “The Environmental Impacts of Freeport-Rio Tinto’s Copper and Gold Mining Operation in Indonesia.” https://www.freewestpapua.org/documents/the-envronmental-imacts-of-freeport-rio-tintos-copper-and-gold-mining-operation-in-
indonesia-june-2006/.
120 FOREST-SMART MINING
Credit: Avigator Fortuner
• Forest-smart mining is about more than mitigation of negative impacts. Grasberg illustrates the potential for driving positive impacts, with a legislative requirement to manage forest in the concession, a demonstrated willingness to invest in biodiversity, and surrounding forest that retains good health.
• Robust closure plans are an important component of forest-smart mining. Grasberg illustrates the fact that sufficient lead time is necessary when adequately planning for closure. With a significant fund established and ambitious commitments made, the funds accrued during the life of mine will cover the extensive closure plans restoring the site to its original state after 70 years.
• Changes in ownership may have important implications for forest smartness. The transfer in ownership at Grasberg could be a risk or an opportunity to forest smartness. Freeport-McMoRan and Rio Tinto are major international companies subject to various pressures to maintain and improve environmental and social performance. If lower-profile companies without the same pressures replace them, there is potential for an increase in impacts. Conversely, it could be argued local actors, particularly if state control remains high, might have more of an interest in long-term environmental and social impacts. Ensuring the change in ownership promotes the latter rather than the former will be important for forest smartness in Papua.
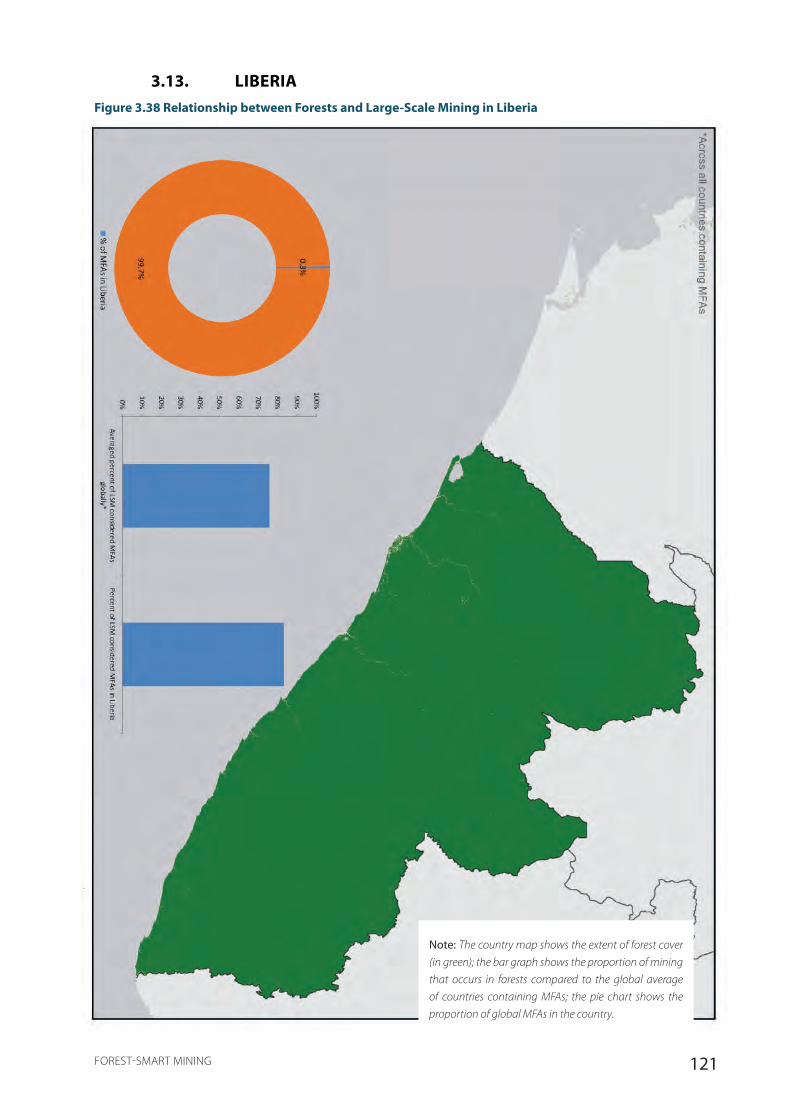
121FOREST-SMART MINING
3.13. LIBERIAFigure 3.38 Relationship between Forests and Large-Scale Mining in Liberia
Note: The country map shows the extent of forest cover
(in green); the bar graph shows the proportion of mining
that occurs in forests compared to the global average
of countries containing MFAs; the pie chart shows the
proportion of global MFAs in the country.
122 FOREST-SMART MINING
3.13.1. National Overview
Liberia is a low-income country that has traditionally relied on mining, namely iron ore, gold, and diamonds, as a major source of income (though gold and diamonds have been mined at much smaller scales than iron ore). Iron ore mining was the basis of the Liberian economy between 1960 and 1980, contributing more than 60 percent of export earnings and approximately 25 percent of GDP. At that time, Liberia was ranked as the largest exporter of iron ore in Africa and the third largest in the world, reaching a peak during the mid-1970s. However, over the next 20 years iron ore production declined due to diminished quality of the mineral resources and a weaker market. That, coupled with the civil war of 1989–1996, which destroyed much of the country’s productive infrastructure, caused mining to take a drastic downturn and the last operating iron ore mine closed in 1992. After the end of the second civil war (1999–2003), revival of the mining industry became an explicit government objective in its efforts to reconstruct the country and to underpin growth, attracting $7.6 billion of foreign investment and creating about 10,000 jobs, or 1.6 percent of Liberia’s total employment. However, LSM only accounts for less than 1 percent of the mining operations. A further 5 percent are medium-size companies, 6 percent are exploration companies, and ASM accounts for over 88 percent. It is estimated ASM for gold and diamonds in Liberia involves as many as 100,000 miners and the sector remains largely underregulated and informal.
Liberia’s forests are a global hotspot for biodiversity, covering approximately 43 percent of the country. It contains approximately 40 percent of the remaining moist forests of the Upper Guinea region—one of the most-threatened and least-protected forest ecosystems in the world—as well as many Key Biodiversity Areas, Important Bird Areas, Ramsar sites, and Alliance for Zero Extinction sites. Deforestation of around 4 percent has occurred over the past decade (though these data do not distinguish tree plantations from natural forest), with key drivers of deforestation being shifting cultivation, charcoal production, unsustainable logging, industrial oil and rubber plantations, and unsustainable mining. As well as supporting very high levels of biodiversity, these forests provide a wide range of ecosystem services, including bushmeat, medicines, and construction materials, and much of Liberia’s rural population is heavily dependent on forests for their livelihoods and ecosystem services.
The Ministry of Lands, Mines and Energy is responsible for the administration of the mineral sector, including granting mining licenses, and it has statutory oversight of the sector. The minerals sector is regulated by the
Mining and Minerals Law of 2000, though a new minerals and mining law has been drafted (still under review) that aims to improve the investment climate and industry regulation. However, while there are regulations in place, the adoption of environmental management tools such as EIAs is lacking and therefore the pressure on the environment from mining is still heavy. Furthermore, the administration of land in Liberia is hindered by the absence of a national land registry and by unclear and outdated land laws, and what constitutes public land continues to be unclear. A review of land rights and laws was undertaken in 2013 and the Land Rights Policy was published, the implementation of which could change the quantity and location of land owned by the government, and thus available for allocation as concessions. Lack of a national land use plan in Liberia and poor coordination between sectors, with the forestry, agriculture, and mining sectors largely operating independently of each other, have resulted in significant overlaps in the allocation of concessions, with concessions also being issued on community forestlands and protected forests. In an attempt to overcome this issue, in 2016 the government released a National Concession Portal, which demarcates active commercial concessions and forested areas on a map. It is hoped that this Mineral Cadastre System will help to improve transparency and land use planning of future concessions.
Liberia has been engaged in REDD+ with support from the FCPF. In 2014, an agreement was signed between Liberia and Norway to cooperate on REDD+ and develop Liberia’s agriculture sector, and under this agreement Norway intends to contribute up to $150 million to Liberia’s REDD+ efforts if verifiable deliverables for REDD+ are achieved. The first phases of this are for preparation and demonstration of REDD+ interventions ($37.5 million), and the final phase, from 2020 onward, is for payments for verified emission reductions.
Data sources
• BGS. n.d. “World Mineral Production Publications of BGS - Minerals UK: Centre for Sustainable Development.” Accessed February 19, 2018. http://www.bgs.ac.uk/mineralsuk/statistics/home.html.
• ClientEarth. 2016. “The Legal Framework Governing Forest Conversion in Liberia,” no. November: 1–9.
• ———. 2017. “Addressing the Risks of a Weak Legal Framework Governing Forest Conversion in Ghana,” no. September: 1–8.
• Ford, T. n.d. “Avoiding a ‘wild West’ Logging Sector in Liberia | Guardian Sustainable Business | The Guardian.” Accessed February 19, 2018. https://www.theguardian.com/sustainable-business/sustainable-logging-liberia-private-use-permits.
123FOREST-SMART MINING
• Global Forest Watch. 2016. “Global Forest Watch Website.” 2016. http://www.globalforestwatch.org.
• ICMM. 2016. “Role of Mining in National Economies.” 3rd ed. London, UK.
• Johnson, Sally. 2015. “A National Biodiversity Offset Scheme: A Road Map for Liberia’s Mining Sector.” Washington D.C. http://documents.worldbank.org/curated/en/183611467991015452/A-national-biodiversity-offset-scheme-a-road-map-for-Liberia-s-mining-sector.
• McGrath, M. n.d. “Liberia Signs ‘transformational’ Deal to Stem Deforestation - BBC News.” Accessed February 19, 2018. http://www.bbc.co.uk/news/science-environment-29321143.
• “National Strategy for Reducing Emissions from Deforestation and Forest Degradation (REDD+) in Liberia.” 2016. Republic of Liberia, Forestry Development Authority REDD+ Implementation Unit. https://www.ltsi.co.uk/wp-content/uploads/2015/01/Technical-Annex-A-REDD-Strategy-final.pdf.
• The Red Desk. 2017. “The Red Desk Website.” 2017. http://thereddesk.org.
• The World Bank Group. 2016. The Little Data Book 2016. Washington DC: The World Bank. https://doi.org/10.1596/978-1-4648-0834-0.
• ———. 2017. The Little Green Data Book 2017. Washington D.C.: The World Bank Group. https://doi.org/10.1596/978- 1-4648-1034-3.
• Wilson, Samuel T. K., Hongtao Wang, Martin Kabenge, and Xuejiao Qi. 2017. “The Mining Sector of Liberia: Current Practices and Environmental Challenges.” Environmental Science and Pollution Research 24 (23): 18711–20. https://doi.org/10.1007/s11356-017-9647-4.
• World Bank. n.d. “Artisanal Mining in Critical Ecosystems. A Look at Gabon, Liberia and Madagascar.” Accessed February 19, 2018. https://www.profor.info/sites/profor.info/files/ASM-brochure.
pdf.
3.13.2. National Forest-Smart Takeaways
• Mining in forests is likely to increase significantly in Liberia. Because of its civil war, Liberia has a less developed mining sector and more forest cover than many of its neighbors. The focus on redeveloping mining is likely to increase mining in forests.
• Any forest-smart development will rely on addressing land use planning and sector coordination beforehand. The development of the mining sector is happening in parallel to a rapidly developing agriculture sector, including palm oil. If the forest impacts that have been seen in other countries associated with such development are to be avoided, up-front, transparent land use planning, with clear coordination between sectors and with the implementation of the Land Rights Policy, will be essential.
• Forest-smart development will also rely on the strengthening of environmental impact assessment procedures. Implementation and enforcement of environmental management tools such as EIAs will help to limit the impacts of mining within forests, though government capacity for effective monitoring of such tools is lacking.
• ASM will have to be integrated into any forest-smart LSM approaches. Given the size and relative lack of visibility and control over the ASM sector, it is vital LSM development takes into account the formalization and regulation of ASM at the same time.
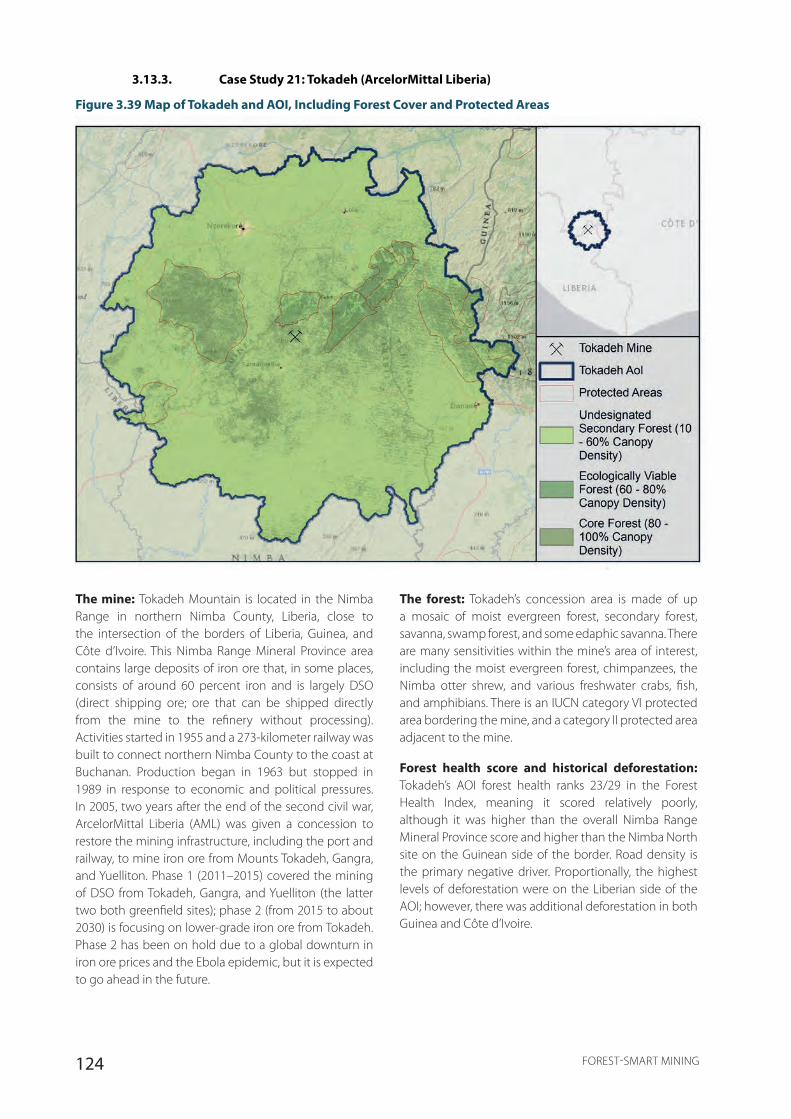
124 FOREST-SMART MINING
3.13.3. Case Study 21: Tokadeh (ArcelorMittal Liberia)
Figure 3.39 Map of Tokadeh and AOI, Including Forest Cover and Protected Areas
The mine: Tokadeh Mountain is located in the Nimba Range in northern Nimba County, Liberia, close to the intersection of the borders of Liberia, Guinea, and Côte d’Ivoire. This Nimba Range Mineral Province area contains large deposits of iron ore that, in some places, consists of around 60 percent iron and is largely DSO (direct shipping ore; ore that can be shipped directly from the mine to the refinery without processing). Activities started in 1955 and a 273-kilometer railway was built to connect northern Nimba County to the coast at Buchanan. Production began in 1963 but stopped in 1989 in response to economic and political pressures. In 2005, two years after the end of the second civil war, ArcelorMittal Liberia (AML) was given a concession to restore the mining infrastructure, including the port and railway, to mine iron ore from Mounts Tokadeh, Gangra, and Yuelliton. Phase 1 (2011–2015) covered the mining of DSO from Tokadeh, Gangra, and Yuelliton (the latter two both greenfield sites); phase 2 (from 2015 to about 2030) is focusing on lower-grade iron ore from Tokadeh. Phase 2 has been on hold due to a global downturn in iron ore prices and the Ebola epidemic, but it is expected to go ahead in the future.
The forest: Tokadeh’s concession area is made of up a mosaic of moist evergreen forest, secondary forest, savanna, swamp forest, and some edaphic savanna. There are many sensitivities within the mine’s area of interest, including the moist evergreen forest, chimpanzees, the Nimba otter shrew, and various freshwater crabs, fish, and amphibians. There is an IUCN category VI protected area bordering the mine, and a category II protected area adjacent to the mine.
Forest health score and historical deforestation: Tokadeh’s AOI forest health ranks 23/29 in the Forest Health Index, meaning it scored relatively poorly, although it was higher than the overall Nimba Range Mineral Province score and higher than the Nimba North site on the Guinean side of the border. Road density is the primary negative driver. Proportionally, the highest levels of deforestation were on the Liberian side of the AOI; however, there was additional deforestation in both Guinea and Côte d’Ivoire.
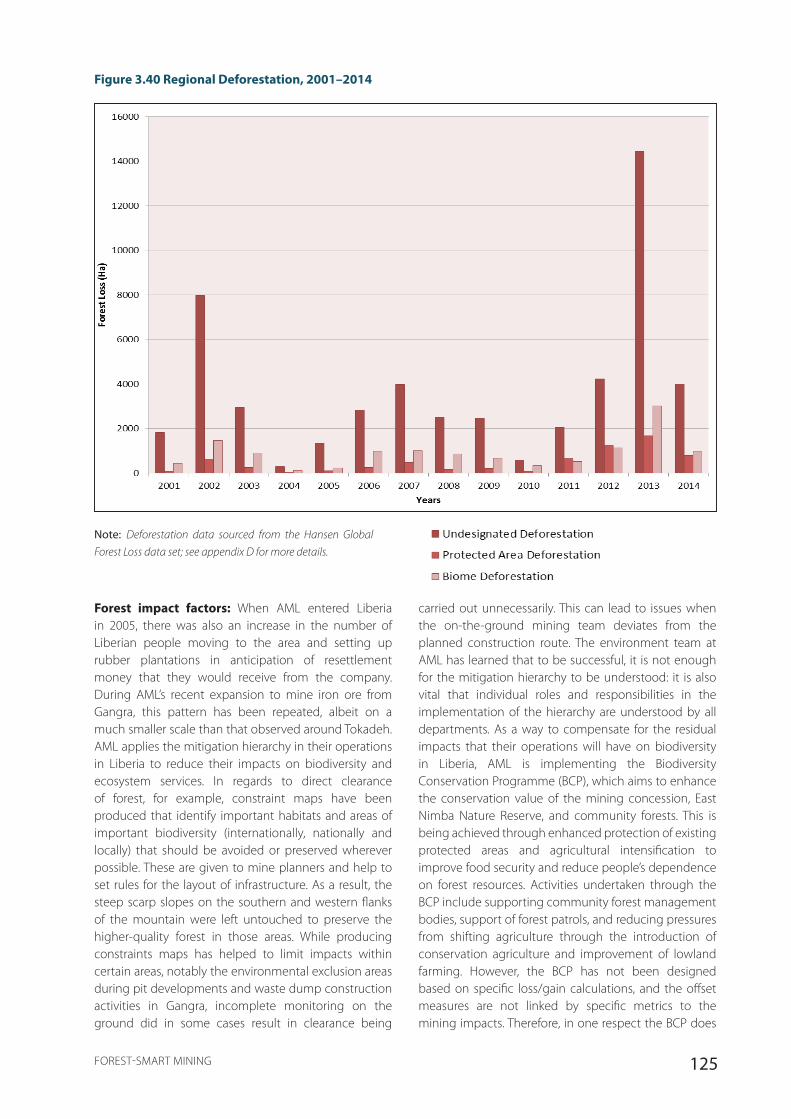
125FOREST-SMART MINING
Figure 3.40 Regional Deforestation, 2001–2014
Note: Deforestation data sourced from the Hansen Global
Forest Loss data set; see appendix D for more details.
Forest impact factors: When AML entered Liberia in 2005, there was also an increase in the number of Liberian people moving to the area and setting up rubber plantations in anticipation of resettlement money that they would receive from the company. During AML’s recent expansion to mine iron ore from Gangra, this pattern has been repeated, albeit on a much smaller scale than that observed around Tokadeh. AML applies the mitigation hierarchy in their operations in Liberia to reduce their impacts on biodiversity and ecosystem services. In regards to direct clearance of forest, for example, constraint maps have been produced that identify important habitats and areas of important biodiversity (internationally, nationally and locally) that should be avoided or preserved wherever possible. These are given to mine planners and help to set rules for the layout of infrastructure. As a result, the steep scarp slopes on the southern and western flanks of the mountain were left untouched to preserve the higher-quality forest in those areas. While producing constraints maps has helped to limit impacts within certain areas, notably the environmental exclusion areas during pit developments and waste dump construction activities in Gangra, incomplete monitoring on the ground did in some cases result in clearance being
carried out unnecessarily. This can lead to issues when the on-the-ground mining team deviates from the planned construction route. The environment team at AML has learned that to be successful, it is not enough for the mitigation hierarchy to be understood: it is also vital that individual roles and responsibilities in the implementation of the hierarchy are understood by all departments. As a way to compensate for the residual impacts that their operations will have on biodiversity in Liberia, AML is implementing the Biodiversity Conservation Programme (BCP), which aims to enhance the conservation value of the mining concession, East Nimba Nature Reserve, and community forests. This is being achieved through enhanced protection of existing protected areas and agricultural intensification to improve food security and reduce people’s dependence on forest resources. Activities undertaken through the BCP include supporting community forest management bodies, support of forest patrols, and reducing pressures from shifting agriculture through the introduction of conservation agriculture and improvement of lowland farming. However, the BCP has not been designed based on specific loss/gain calculations, and the offset measures are not linked by specific metrics to the mining impacts. Therefore, in one respect the BCP does
126 FOREST-SMART MINING
not meet the offset principles as laid out by the BBOP. Nevertheless, real biodiversity gains are being achieved through positive management interventions delivered at a landscape scale and the BCP is designed to achieve net gain as it extends over a much larger area than the company is affecting through their mining operations.
Data sources
• ArcelorMittal. 2010. “Geography and Environment of Northern Nimba County, Liberia.” www.arcelormittal.com.
• Biodiversity Offsets: A User Guide.” 2016. http://documents.worldbank.org/curated/en/344901481176051661/pdf/110820-WP-BiodiversityOffsetsUserGuideFinalWebRevised-PUBLIC.pdf.
• Goslee, Katherine, Sarah Walker, Edward Mitchard, Alex Grais, Mike Netzer, Kevin Brown, Lara Murray, Jessica Donovan, and Peter Mulbah. 2016. “Development of Liberia’s REDD+ Reference Level Final Report for Republic of Liberia Forest Development Authority.” http://forestcarbonpartnership.org/sites/fcp/files/2017/Aug/Liberia Reference Level Report Oct 2016.pdf.
• Johnson, Sally. 2015. “A National Biodiversity Offset Scheme: A Road Map for Liberia’s Mining Sector.” Washington D.C. http://documents.worldbank.org/curated/en/183611467991015452/A-national-biodiversity-offset-scheme-a-road-map-for-Liberia-
s-mining-sector.
3.13.4. Site-Level Forest-Smart Takeaways
• The importance of cooperation. The Nimba Range Mineral Province can act as a single entity geologically, ecologically, and even, to some degree, sociologically, but political borders mean impacts in one area may be difficult to control by actors in another area. Governments and companies operating in this mineral province need to cooperate and coordinate if forest-smart mining is to be achieved.
• The influx of people is one of the most important secondary impacts of mines on forests. The arrival of AML led to a significant increase in local population size. Proper planning for the indirect impact of in-migration is essential to minimize the resulting impacts. Vital to this is the timing of the implementation of mitigation actions so to avoid impacts before they occur.
• Not all forest impacts are visible on satellite imagery. One of the key forest impacts for AML was the bushmeat trade. This impact has been recognized by AML and policies are in place to address it, but good monitoring is required to ensure the intended impacts are occurring.
• Mining can bring positive impacts to forests. AML’s BCP is successfully helping to support local forest reserves even though this isn’t been accounted for as a formal offset.
• Avoidance is the most important step of the mitigation hierarchy. AML’s avoidance of some of the iron ore body due to the high importance of this habitat for biodiversity and for surrounding communities is a good example of real commitment to application of the mitigation hierarchy.
• Stability and continuity in the company’s resourcing of projects dedicated to good practice and forest-smart mining outcomes. Various challenges facing the environment team at AML have further impacted successful implementation of the mitigation hierarchy. For example, feeding the mitigation hierarchy up to all departments, ensuring that it is understood and that all departments understand their role in its implementation can be a practical challenge to overcome.
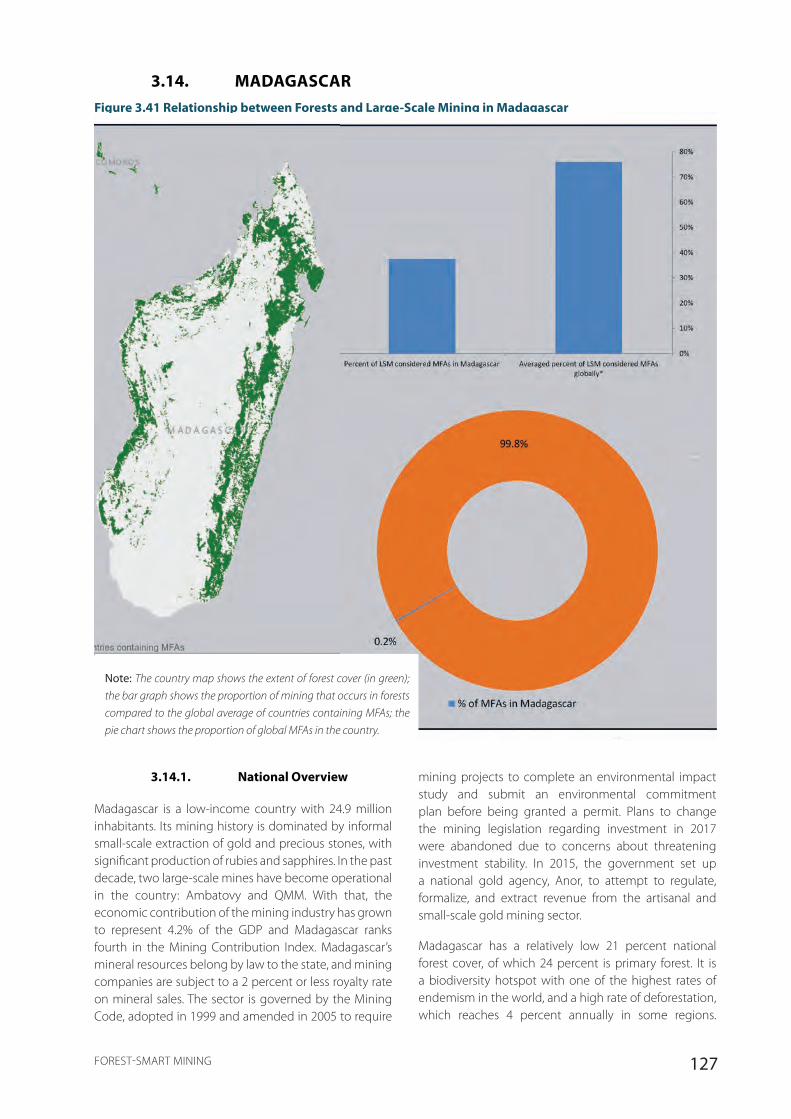
127FOREST-SMART MINING
3.14. MADAGASCARFigure 3.41 Relationship between Forests and Large-Scale Mining in Madagascar
Note: The country map shows the extent of forest cover (in green);
the bar graph shows the proportion of mining that occurs in forests
compared to the global average of countries containing MFAs; the
pie chart shows the proportion of global MFAs in the country.
3.14.1. National Overview
Madagascar is a low-income country with 24.9 million inhabitants. Its mining history is dominated by informal small-scale extraction of gold and precious stones, with significant production of rubies and sapphires. In the past decade, two large-scale mines have become operational in the country: Ambatovy and QMM. With that, the economic contribution of the mining industry has grown to represent 4.2% of the GDP and Madagascar ranks fourth in the Mining Contribution Index. Madagascar’s mineral resources belong by law to the state, and mining companies are subject to a 2 percent or less royalty rate on mineral sales. The sector is governed by the Mining Code, adopted in 1999 and amended in 2005 to require
mining projects to complete an environmental impact study and submit an environmental commitment plan before being granted a permit. Plans to change the mining legislation regarding investment in 2017 were abandoned due to concerns about threatening investment stability. In 2015, the government set up a national gold agency, Anor, to attempt to regulate, formalize, and extract revenue from the artisanal and small-scale gold mining sector.
Madagascar has a relatively low 21 percent national forest cover, of which 24 percent is primary forest. It is a biodiversity hotspot with one of the highest rates of endemism in the world, and a high rate of deforestation, which reaches 4 percent annually in some regions.

128 FOREST-SMART MINING
The timber sector has a very similar importance for the national GDP, contributing 4.3 percent in 2011. However, illegal timber extraction is widespread, in the northeast in particular, with export primarily thought to go to China. But many more people are thought to informally rely on forest services, particularly in low-income areas. Under formal law, most of Madagascar’s forests belong to the state. Under customary law the status of forests is unclear and occasionally leads to conflict. In 1990, Madagascar adopted the National Environmental Action Plan (NEAP), mainstreaming environmental considerations into key areas of sector development, and the Environmental Charter, which was revised in 2015 to explicitly address new risks, including biodiversity, climate change, forest cover loss, and land degradation. The new Protected Areas Code from 2015 established the national protected areas system, with the total protected area tripling between 2002 and 2009 to 5.58 million hectares.
Madagascar has an institutional and legal framework that, if applied effectively and coherently, could provide effective protection of forests from mineral exploitation and associated development. However, a lack of institutional coordination and law enforcement coupled with a largely informal mining sector and corruption leads to a situation where illegal mining in protected areas and high deforestation rates persist. This is particularly worrying given the extremely high level of biodiversity in the country and the low percentage of natural forest remaining.
Madagascar is a participating country to the UN-REDD Program, completing its Country Needs Assessment in 2015. The assessment encouraged Madagascar to seek legislative and regulatory reforms, in particular in the land and forestry sectors. A REDD+ national strategy is currently under development by the Technical REDD Committee and the Ministry of Agriculture.
Data sources
• African Mining Legislation Atlas. 2015. “AMLA Summary: Madagascar.” 2015. https://www.a-mla.org/countries/28?name=Madagascar.
• EITI. 2013. “EITI Madagascar Revenue Collection.” 2013. https://eiti.org/madagascar#revenue-collection.
• Faure, Mylène, Olivia Rakotomalala, and Remi Pelon. 2015. “Economic Contributions from Industrial Mining in Madagascar.” World Bank, no. Centre for Social Responsibility in Mining (CSRM).
• Global Forest Watch. 2016. “Global Forest Watch Madagascar.” 2016. http://www.globalforestwatch.org/country/MDG.
• ICMM. 2016. “Role of Mining in National Economies.” 3rd ed. London, UK.
• IUCN, and CI Ecuador. 2016. “Mapping of Relevant Policies and Regulations for Coastal Carbon Ecosystem Management in 5 Countries: From Climate Change to Forestry and Coastal Marine Resource Management,” 32.
• Jurismada. n.d. “Mining Law in Madagascar.” http://eng.jurismada.com/index.php/mining-law-in-madagascar/.
• Ministère de l’environnement des eaux et forets. 2004. Décret MECIE.
• Neudert, Regina, Jörg U. Ganzhorn, and Frank Wätzold. 2017. “Global Benefits and Local Costs - The Dilemma of Tropical Forest Conservation: A Review of the Situation in Madagascar.” Environmental Conservation 44 (1): 82–96. https://doi.org/10.1017/S0376892916000552.
• Resolve. 2017. “Analyse Du Cadre Réglementaire (Texte de Lois et Politiques) et Des Capacités Des Organisations/Institutions Afin d’instaurer Les Objectifs de Tero Perte Nette (Ou de Gain Net) de Biodiversité à Madagascar.”
• Stoddard, Ed. 2017. “Madagascar’s President Says No Plans to Change Mining Code.” Reuters, June 14, 2017. https://af.reuters.com/article/topNews/idAFKBN1951NJ-OZATP.
• The Red Desk. 2017. “The Red Desk Website.” 2017. http://thereddesk.org.
• The World Bank Group. n.d. “Poverty & Equity Data Madagascar.” http://povertydata.worldbank.org/poverty/country/MDG.
• ———. 2016a. The Little Data Book 2016. Washington DC: The World Bank. https://doi.org/10.1596/978-1-4648-0834-0.
• ———. 2016b. “The World Bank Country Profile Madagascar.” 2016. http://databank.worldbank.org/data/Views/Reports/ReportWidgetCustom.aspx?Report Name=CountryProfile&Id=b450fd57&tbar =y&dd=y&inf=n&zm=n&country=MDG.
• ———. 2017a. The Little Green Data Book 2017. Washington D.C.: The World Bank Group. https://doi.org/10.1596/978- 1-4648-1034-3.
• ———. 2017b. “The World Bank Data Madagascar.” 2017. https://data.worldbank.org/country/madagascar?view=chart.
• U.S. Geological Survey. 2015. “2014 Minerals Yearbook - Madagascar,” no. July.
• WCS, ONE, MNP, and Etc Terra. 2015. “Changement de La Couverture de Forêts Naturelles à Madagascar, 2005‐2010‐2013.” http://www.pnae.mg/index.php?option=com_content&view=article&id=186:changement-de-la-couverture-des-forets-naturelles-2005-2010-2013&catid=81:autres&Itemid=83.
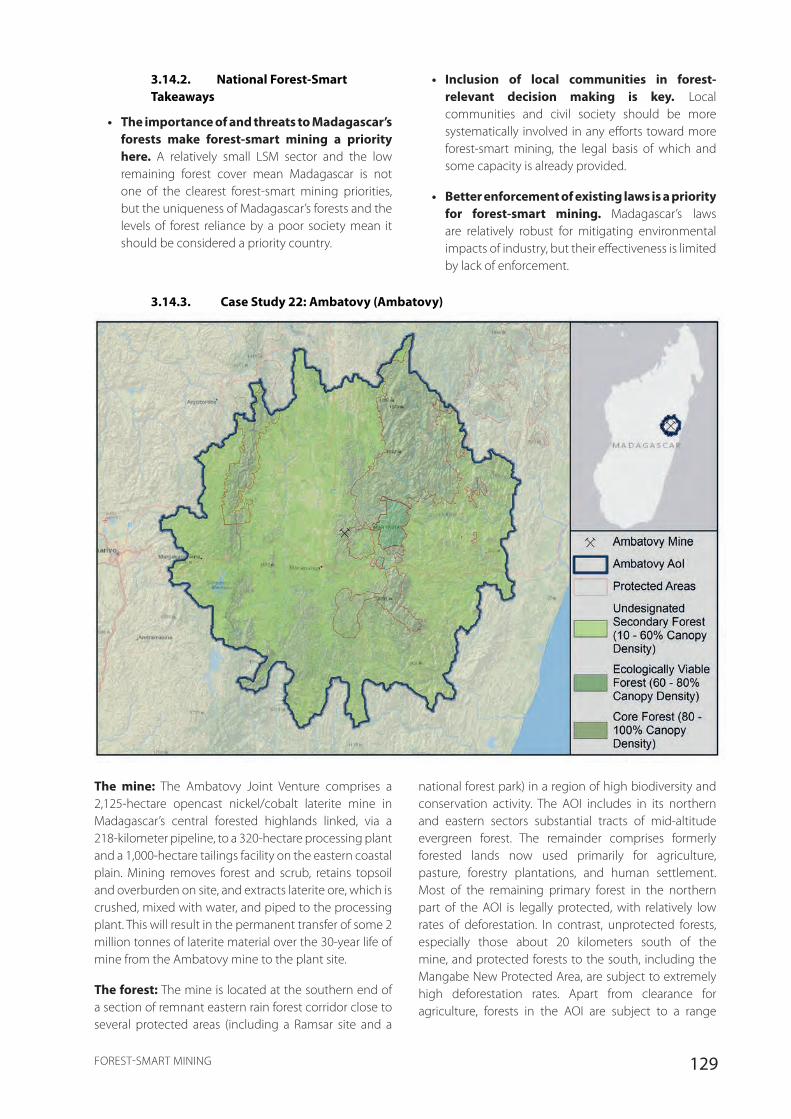
129FOREST-SMART MINING
3.14.2. National Forest-Smart Takeaways
• The importance of and threats to Madagascar’s forests make forest-smart mining a priority here. A relatively small LSM sector and the low remaining forest cover mean Madagascar is not one of the clearest forest-smart mining priorities, but the uniqueness of Madagascar’s forests and the levels of forest reliance by a poor society mean it should be considered a priority country.
• Inclusion of local communities in forest-relevant decision making is key. Local communities and civil society should be more systematically involved in any efforts toward more forest-smart mining, the legal basis of which and some capacity is already provided.
• Better enforcement of existing laws is a priority for forest-smart mining. Madagascar’s laws are relatively robust for mitigating environmental impacts of industry, but their effectiveness is limited by lack of enforcement.
3.14.3. Case Study 22: Ambatovy (Ambatovy)
Figure 3.42 Map of Ambatovy and AOI, Including Forest Cover and Protected Areas
The mine: The Ambatovy Joint Venture comprises a 2,125-hectare opencast nickel/cobalt laterite mine in Madagascar’s central forested highlands linked, via a 218-kilometer pipeline, to a 320-hectare processing plant and a 1,000-hectare tailings facility on the eastern coastal plain. Mining removes forest and scrub, retains topsoil and overburden on site, and extracts laterite ore, which is crushed, mixed with water, and piped to the processing plant. This will result in the permanent transfer of some 2 million tonnes of laterite material over the 30-year life of mine from the Ambatovy mine to the plant site.
The forest: The mine is located at the southern end of a section of remnant eastern rain forest corridor close to several protected areas (including a Ramsar site and a
national forest park) in a region of high biodiversity and conservation activity. The AOI includes in its northern and eastern sectors substantial tracts of mid-altitude evergreen forest. The remainder comprises formerly forested lands now used primarily for agriculture, pasture, forestry plantations, and human settlement. Most of the remaining primary forest in the northern part of the AOI is legally protected, with relatively low rates of deforestation. In contrast, unprotected forests, especially those about 20 kilometers south of the mine, and protected forests to the south, including the Mangabe New Protected Area, are subject to extremely high deforestation rates. Apart from clearance for agriculture, forests in the AOI are subject to a range

130 FOREST-SMART MINING
of threats, including logging, hunting for bushmeat (especially of endangered lemurs), and annual bushfires. Ambatovy does not undertake conservation activities in the western part of the AOI.
Forest health score and historical deforestation: The Ambatovy AOI ranks 20/29 in the forest health assessment, with elevated deforestation levels in protected areas being the primary cause (and the second highest in the study). Historical records show high deforestation (2,000–4,000 hectares a year across the AOI) before the mine was established, particularly in more important biome and protected area forest, and a general increase over time to 8,000–12,000 hectares a year after construction began. The assessment of forest health confirms a very low health composite score, consistent with high deforestation trends in Madagascar generally and a high level of threat in the AOI in particular. Deforestation rates within the AOI are variable, with protected areas south of the RN2, in particular Mangabe and the southern parcel of the CAZ, very badly affected.
Deforestation appears less severe around the mine site and farther north in the forest corridor. Protected areas near the mine are legally established of varying vintage—Analamazaotra Reserve (established 1964), Andasibe-Mantadia National Park (established 1989), CAZ (legally protected since 2005), the Ambatovy mine forests (lease issued 2007), CFAM proposed protected area (patrolled with Ambatovy support since 2012), and the forests of the Torotorofotsy Ramsar site (designated 2006)—and are close to the regional forestry service in Moramanga, which could explain the relatively low deforestation rates. Evaluations by the Ambatovy project report low deforestation rates for protected forests in the Ambatovy mine lease area. Thus, degree of protection appears to be a major factor influencing deforestation rates. It is also important to note that within the Ambatovy AOI there are large pinewood plantations of Fanalamanga (formerly a national forestry company), whose exploitation intensified in 2013–2014, leading to high forest loss of undesignated secondary forest (Figure 3.43).
Figure 3.43 Regional Deforestation, 2001–2014
Note: Deforestation data sourced from the Hansen Global Forest Loss data set; see appendix D for more details.

131FOREST-SMART MINING
Forest impact factors: Ambatovy has implemented a number of measures to mitigate forest impacts, including a legally binding commitment to no net loss/net gain of biodiversity and adherence to the IFC PS6 and BBOP guidelines, which require a landscape-level approach. It is important to note that the primary and largest of the four offset sites that Ambatovy supports (the Ankerana forest, on the east side of the CAZ corridor) is located outside the AOI and therefore was not considered in this assessment. Overall, Ambatovy will clear circa 2,000 hectares of forest, but the company has committed to the conservation of 500 percent more forest than they impact, including areas immediately around the mine site, such as Torotorofotsy, CFAM, and Ankarana. In addition, the company leased forestland around the mine zone and supported the establishment of a belt of community-managed forest areas through community-based associations (COBAs), which seek to protect forests by promoting alternative livelihood programs (improved rice farming, poultry production, other crops, and so on), avoidance of slash-and-burn practices (including tree clearing), and forest patrols to prevent wildlife hunting and wildfires. To the west of the AOI in the Mangoro River Basin, Ambatovy has a project supporting the planting of trees in the catchment basin to reduce erosion and sediment loads in the river from which the site draws water. The company has also partnered with various conservation organizations as a result of strong civil society presence with a focus on conservation, in particular Asity (the BirdLife partner for Madagascar) and Conservation International, to manage the offset sites.
Data sources
• Ambatovy. 2014. “Ecosystem Services Review.”
• ———. 2016. “Ambatovy 2016 Sustainability Report.” http://www.ambatovy.com/docs/wp-content/uploads/SustainabilityReportEn2016.pdf.
• ———. 2017. “Tailings.” 2017. http://www.ambatovy.com/docs/?p=388.
• Ambatovy Project. 2006. “Environmental Assessment Ambatovy Project: Summary.”
• Dickinson, Steven, and Pierre O Berner. 2010. “Ambatovy Project: Mining in a Challenging Biodiversity Setting in Madagascar.” In Malagasy Nature Volume 3: Biodiversity, Exploration, and Conservation of the Natural Habitats Associated with the Ambatovy Project, edited by S. M. Goodman and V. Mass, 2–13. http://www.vahatra.mg/volume3/mn03_01.pdf.
• Hase, Authors Amrei Von, Andrew Cooke, Aristide Andrianarimisa, Rivolala Andriamparany, Vanessa Mass, Robin Mitchell, and Kerry ten Kate. 2014. “Working towards NNL of Biodiversity and Beyond: Ambatovy, Madagascar – A Case Study ( 2014 ).” Washington, DC.
• Virah-Sawmy, Malika, Johannes Ebeling, and Roslyn Taplin. 2014. “Mining and Biodiversity Offsets: A Transparent and Science-Based Approach to Measure ‘No-Net-Loss.’” Journal of Environmental Management 143: 61–70. https://doi.org/10.1016/j.jenvman.2014.03.027.
• WCS, ONE, MNP, and Etc Terra. 2015. “Changement de La Couverture de Forêts Naturelles à Madagascar, 2005‐2010‐2013.” http://www.pnae.mg/index.php?option=com_content&view=article&id=186:changement-de-la-couverture-des-forets-
naturelles-2005-2010-2013&catid=81:autres&Itemid=83.
3.14.4. Site-Level Forest-Smart Takeaways
• Some mining companies do make ambitious commitments to forest conservation. Ambatovy’s commitments to conservation are some of the strongest of all of the case studies and provide a best-practice example for companies functioning in a complex operating environment.
• Robust governance is required to scale up site-level conservation to achieve landscape level impacts. Despite having some of the strongest corporate policies on biodiversity conservation, the AOI around Ambatovy is one of the lowest ranked for forest health. The mine exists in a complex landscape where numerous actors exert pressures on the forests, in a context of political instability and weakened enforcement. The presence of the mine in such a landscape provides various opportunities for Ambatovy to engage with these actors and develop innovative forest-smart solutions such as leasing forestland around the mine zone and the establishment of community-managed forest areas. However, when scaling these initiatives up, robust and uninterrupted governance is paramount, and with the 2009 coup d’état the region has experienced lasting negative effects, hampering the development of a landscape-level approach to mitigation.
• To achieve net gain targets, Ambatovy should continue to focus on preventing deforestation in protected areas. Protected area deforestation is the primary driver of the low AOI forest health score. While there is no evidence either way of whether this is connected to mine activity, offsite conservation efforts should be focused on working with the relevant authorities to address this urgent issue.
• Strong corporate conservation policies need to be consistently supported by strong
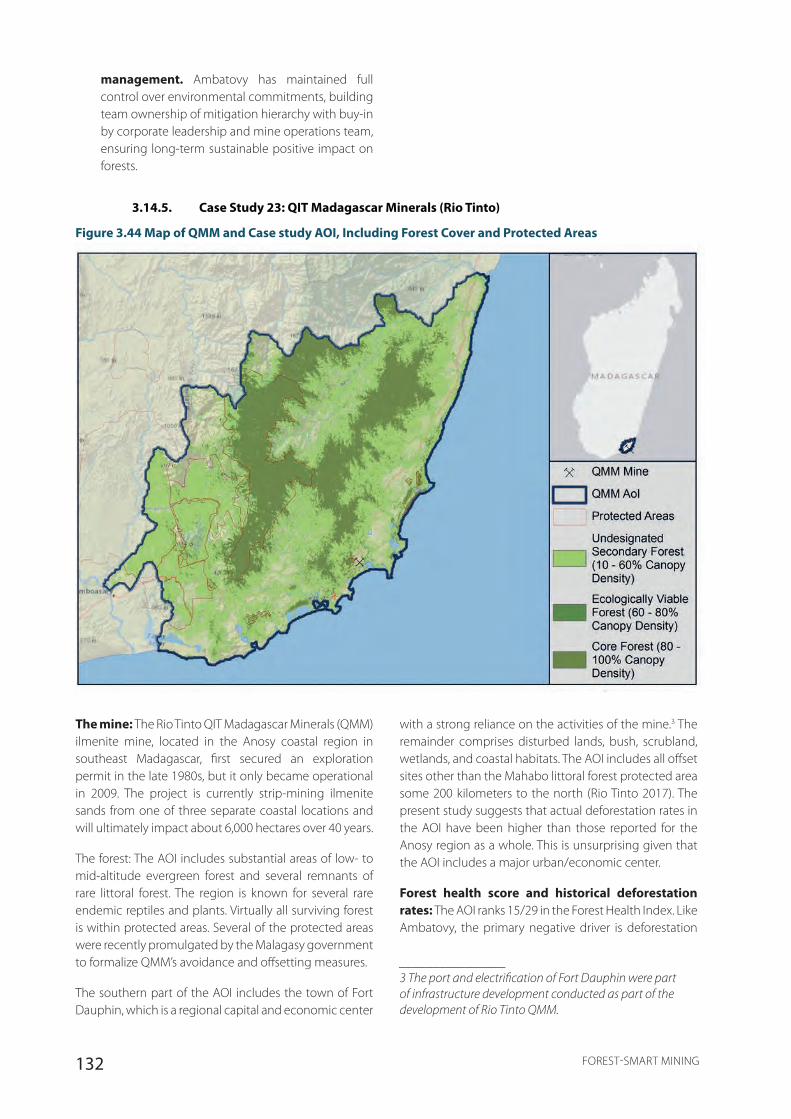
132 FOREST-SMART MINING
management. Ambatovy has maintained full control over environmental commitments, building team ownership of mitigation hierarchy with buy-in by corporate leadership and mine operations team, ensuring long-term sustainable positive impact on forests.
3.14.5. Case Study 23: QIT Madagascar Minerals (Rio Tinto)
Figure 3.44 Map of QMM and Case study AOI, Including Forest Cover and Protected Areas
The mine: The Rio Tinto QIT Madagascar Minerals (QMM) ilmenite mine, located in the Anosy coastal region in southeast Madagascar, first secured an exploration permit in the late 1980s, but it only became operational in 2009. The project is currently strip-mining ilmenite sands from one of three separate coastal locations and will ultimately impact about 6,000 hectares over 40 years.
The forest: The AOI includes substantial areas of low- to mid-altitude evergreen forest and several remnants of rare littoral forest. The region is known for several rare endemic reptiles and plants. Virtually all surviving forest is within protected areas. Several of the protected areas were recently promulgated by the Malagasy government to formalize QMM’s avoidance and offsetting measures.
The southern part of the AOI includes the town of Fort Dauphin, which is a regional capital and economic center
with a strong reliance on the activities of the mine.3 The remainder comprises disturbed lands, bush, scrubland, wetlands, and coastal habitats. The AOI includes all offset sites other than the Mahabo littoral forest protected area some 200 kilometers to the north (Rio Tinto 2017). The present study suggests that actual deforestation rates in the AOI have been higher than those reported for the Anosy region as a whole. This is unsurprising given that the AOI includes a major urban/economic center.
Forest health score and historical deforestation rates: The AOI ranks 15/29 in the Forest Health Index. Like Ambatovy, the primary negative driver is deforestation
________________3 The port and electrification of Fort Dauphin were part of infrastructure development conducted as part of the development of Rio Tinto QMM.
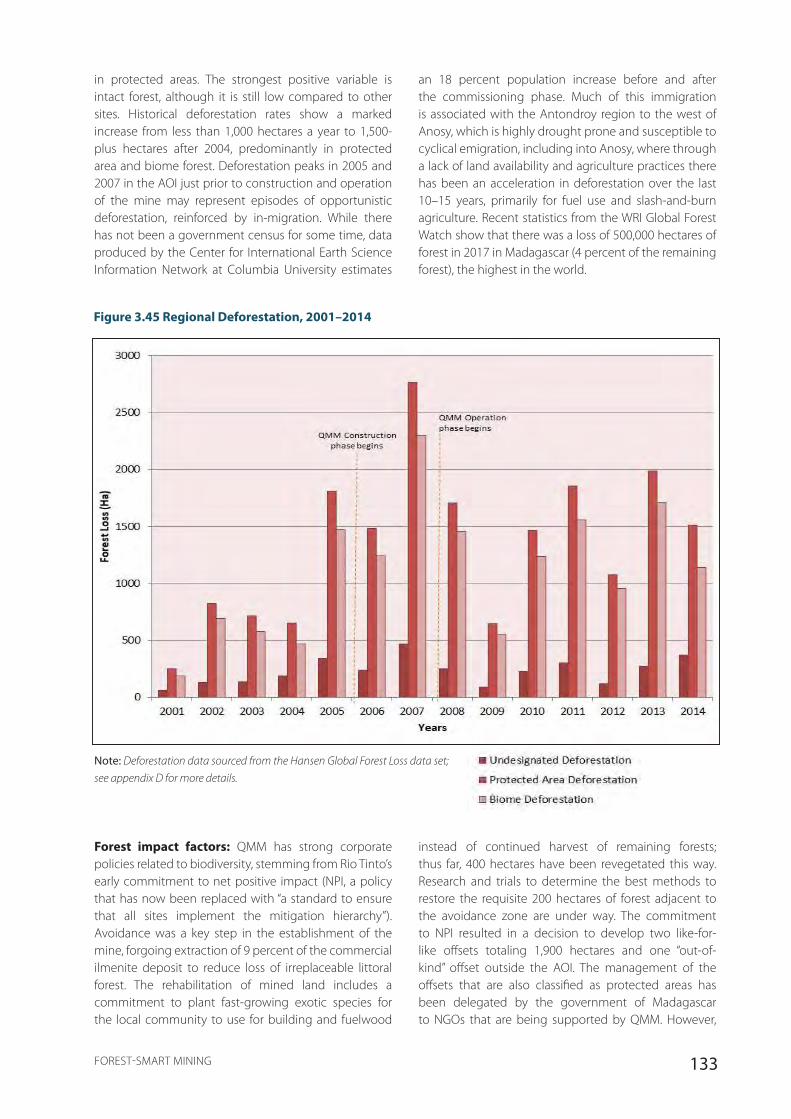
133FOREST-SMART MINING
an 18 percent population increase before and after the commissioning phase. Much of this immigration is associated with the Antondroy region to the west of Anosy, which is highly drought prone and susceptible to cyclical emigration, including into Anosy, where through a lack of land availability and agriculture practices there has been an acceleration in deforestation over the last 10–15 years, primarily for fuel use and slash-and-burn agriculture. Recent statistics from the WRI Global Forest Watch show that there was a loss of 500,000 hectares of forest in 2017 in Madagascar (4 percent of the remaining forest), the highest in the world.
Figure 3.45 Regional Deforestation, 2001–2014
Note: Deforestation data sourced from the Hansen Global Forest Loss data set;
see appendix D for more details.
in protected areas. The strongest positive variable is intact forest, although it is still low compared to other sites. Historical deforestation rates show a marked increase from less than 1,000 hectares a year to 1,500-plus hectares after 2004, predominantly in protected area and biome forest. Deforestation peaks in 2005 and 2007 in the AOI just prior to construction and operation of the mine may represent episodes of opportunistic deforestation, reinforced by in-migration. While there has not been a government census for some time, data produced by the Center for International Earth Science Information Network at Columbia University estimates
instead of continued harvest of remaining forests; thus far, 400 hectares have been revegetated this way. Research and trials to determine the best methods to restore the requisite 200 hectares of forest adjacent to the avoidance zone are under way. The commitment to NPI resulted in a decision to develop two like-for-like offsets totaling 1,900 hectares and one “out-of-kind” offset outside the AOI. The management of the offsets that are also classified as protected areas has been delegated by the government of Madagascar to NGOs that are being supported by QMM. However,
Forest impact factors: QMM has strong corporate policies related to biodiversity, stemming from Rio Tinto’s early commitment to net positive impact (NPI, a policy that has now been replaced with “a standard to ensure that all sites implement the mitigation hierarchy”). Avoidance was a key step in the establishment of the mine, forgoing extraction of 9 percent of the commercial ilmenite deposit to reduce loss of irreplaceable littoral forest. The rehabilitation of mined land includes a commitment to plant fast-growing exotic species for the local community to use for building and fuelwood
134 FOREST-SMART MINING
the long lead time between project inception and the decision to invest and classify the avoidance zones and offsets as protected areas impeded a dynamic mitigation and stakeholder engagement process. As a result, early deforestation through opportunistic human activity may have occurred. Absence of adequate land control has also hindered reforestation efforts and the relatively small offset areas are not expected to achieve a net gain in biodiversity in less than 50 years, if at all. Following the resignation of the Biodiversity Advisory Committee in response to the move away from NPI as a stand-alone measure, QMM has refocused on a holistic approach to the biodiversity mitigation hierarchy, with a particular focus on the spatial linkages between protected area management, community natural resource management, and improved livelihoods. A new committee has been established based on this approach, emphasizing multidisciplinary expertise.
Data sources
• Dufils, J. 2004. “Forest Ecology.” In The Natural History of Madagascar, edited by Steven M Goodman and Benstead P. Jonathan. University of Chicago Press.
• Ingram, Jane Carter, and Terry Dawson. 2003. “Darwin Initiative Final Report: Sustainable Development of Madagascar’s Littoral Forests Darwin Initiative for the Survival of Species.”
• QIT Madagascar Minerals SA. 2014. “Développement Durable Rapport 2014.” http://www.riotinto.com/documents/QMM_2014_rapport_developpment_durable.pdf.
• Rio Tinto. 2017. “About QIT Madagascar Minerals.” 2017. http://www.riotinto.com/energyandminerals/about-qit-madagascar-minerals-15376.aspx.
• TECSULT. 2005. “Evaluation de l’impact Environnemental et Social: Revue Des Études Environnementales et Sociales de QMM.” http://documents.worldbank.org/curated/en/903641468056646899/pdf/E11180VOL1014.pdf.
• Temple, H.J., S Anstee, J. Ekstrom, J.D. Pilgrim, J. Rabenantoandro, J.-B. Ramanamanjato, F. Randraitafika, and M. Vincellette. 2012. Forecasting the Path towards a Net Positive Impact on Biodiversity for Rio Tinto QMM. IUCN and Rio Tinto Technical Series No.2. https://doi.org/ISBN: 978-2-8317-1441-7.
• WCS, ONE, MNP, and Etc Terra. 2015. “Changement de La Couverture de Forêts Naturelles à Madagascar, 2005‐2010‐2013.” http://www.pnae.mg/index.php?option=com_content&view=article&id=186:changement-de-la-couverture-des-forets-
naturelles-2005-2010-2013&catid=81:autres&Itemid=83.
3.14.6. Site-Level Forest-Smart Takeaways
• Avoidance can be a viable option for LSM. Despite being the most important step in the mitigation hierarchy, evidence of true avoidance is scarce. QMM appears to be one of the few sites
where significant avoidance to the benefit of forest values can be demonstrated.
• Forest-smart mining requires recognition of regional priorities. The primary forest challenge around QMM is deforestation in protected areas. It is unknown the degree to which this is connected to mining activities, but any forest program should focus on working with the government to address this priority concern. Similarly, with a dwindling stock of intact forest (a rarity in a region with such a high portion of negative drivers), prioritizing areas of high ecological value regardless of their placement in gray areas subject to cumulative and/or indirect impacts is paramount when maintaining healthy forest systems.
• Effective engagement with forest-smart activities is required from project inception. More efforts during the long period between project inception and the start of any impact mitigation activities could have served to reduce forest impacts driven by a wider lack of environmental stewardship.
• Forest-smart outcomes require the inclusion of management of induced and indirect impacts resulting from the influx of people. One of the difficulties in the accounting of impacts and apportioning of responsibilities to the mining company included a shifting and discounted baseline for forest condition and health against which the company was able to discount its contributions to managing and offsetting residual impacts to biodiversity in this critical habitat.
• Good corporate governance can still be undone by failings in national authority. Significant forest-smart efforts took place in 2004–2008 under the QMM–USAID–Anosy Region Alliance to implement forest-smart solutions in the larger landscape. With the 2009 coup d’état, these initiatives were unable to continue due to the withdrawal of donor funding and the significant decrease in the number of the technical and financial partners implementing the environment programs, thus making partnerships more challenging.
• Forest-smart mining should aim for programs that are forest-smart, community-smart, biodiversity-smart, and economically smart at the same time. Satisfying the broad range of human and ecological demands requires new partnership approaches to the stewardship of Madagascar’s forests. Forests must be managed to fulfill a range of environmental, social, economic, and cultural functions for forest-smart outcomes to be achieved.
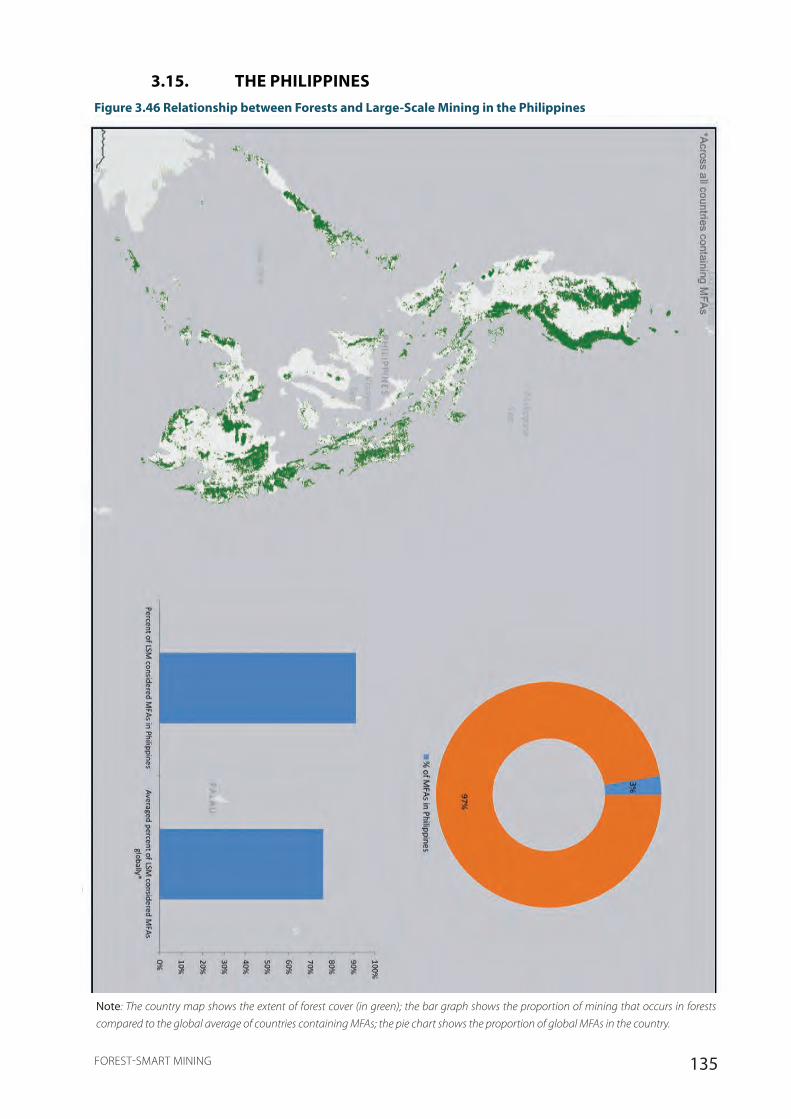
135FOREST-SMART MINING
3.15. THE PHILIPPINESFigure 3.46 Relationship between Forests and Large-Scale Mining in the Philippines
Note: The country map shows the extent of forest cover (in green); the bar graph shows the proportion of mining that occurs in forests
compared to the global average of countries containing MFAs; the pie chart shows the proportion of global MFAs in the country.

136 FOREST-SMART MINING
3.15.1. National Overview
The Philippines is a lower-middle-income country and the fifth most mineral-rich country in the world for copper, gold, nickel, and chromite. Copper is among the top 10 country exports in terms of dollar value and it is one of the world’s major nickel producers. Gold deposits are clustered within four gold districts and one gold province. Over half of the country’s gold production is through legal small-scale mining. Thirty percent of the Philippines’ 30 million hectares has high mineral potential and in 2017 2.5 percent of the total land area was covered by mining tenements. Despite this, mining has a marginal contribution to the economy, with the Philippines ranked 26th in the Mining Contribution Index.
In 2014, 27 percent of the terrestrial area was forested with 11 percent of land under protection; however, existing protected areas have low management capacity. Since the 1930s, the Philippines’ forests have declined by more than half due to agriculture, housing expansion, and commercial and illegal logging. Timber production, and its contribution to the national economy, has also declined. There have been major forest rehabilitation efforts in recent years and a shift from large-scale timber to community-based approaches as well as recognition of the multiple services provided by forests, including for carbon, water, and biodiversity. The government has a Mining Forest Program focused on replanting mined-out areas.
There have been major reforms in mining legislation in recent years following widespread environmental degradation and disasters related to large- and small-scale mining, including the “Marcopper mining disaster” (see below). After opposition to the 1995 Mining Act, in 2012 Executive Order 79 was agreed to, “institutionalizing and implementing reforms in the Philippine mining sector providing policies and guidelines to ensure environmental protection and responsible mining in the utilization of mineral resources.” The executive order called for a review of the performance of existing mining operations. In February 2017, the then Department of Environment and Natural Resources secretary, Gina Lopez, ordered the closure of 23 mines and suspension of 5 mines operating in watersheds as a result of an industry-wide environmental audit. This act was supported by many environmental groups; however, the Chamber of Mines opposed Lopez personally and the way the orders were carried out, violations were not made clear, and there was limited scope to address issues raised. After Lopez was replaced, a technical and legal review of the appeals commenced in July 2017 and was due for completion in early 2018. The Philippines now ranks among the lowest in the world for policy attractiveness
for mining investment. This is partly due to the quality of the database and political stability, but environmental regulation and the interpretation of existing regulations play a role.
In 2010, the Philippines adopted the Philippine National REDD+ Strategy, with an update to aid implementation released in June 2017. The Climate Change Commission coordinates initiatives, including REDD+, and designated the Department of Environment and Natural Resources as the operational arm of REDD+.
Data sources
• Department of Environment and Natural Resources-Forest Management Bureau (DENR-FMB). 2017. “Update of the Philippine National REDD-plus Strategy.” Manila.
• Global Forest Watch. 2016. “Global Forest Watch Website.” 2016. http://www.globalforestwatch.org.
• Government of the Republic of the Philippines. n.d. “Mines and Geoscience Bureau Facts and Figures.” 2017. http://mgb.gov.ph/images/miningfactsandfiguresforwebsiteupdatedJuly2017.jpg.
• ———. 1995. “Republic Act Number 7942 - Philippine Mining Act 1995.” 1995. http://www.chanrobles.com/republicacts/republicactno7942.html#.WoGuKrRLGUk.
• ———. 2018a. “Biodiversity Management Bureau Webpage.” 2018. http://www.bmb.gov.ph/elibrary/mainmenu-policies-52359.
• ———. 2018b. “Department of Environment and Natural Resources Webpage.” 2018. http://www.denr.gov.ph/.
• ———. 2018c. “Environmental Management Bureau.” 2018. https://emb.gov.ph/mandates-functions/.
• ———. 2018d. “Forest Management Bureau Webpage.” 2018. http://forestry.denr.gov.ph/index.php/about-fmb/forest-management-bureau-logo.
• ———. 2018e. “Mines and Geosciences Bureau.” 2018. http://www.mgb.gov.ph/.
• ICMM. 2016. “Role of Mining in National Economies.” 3rd ed. London, UK.
• International Council on Mining & Metals. 2016. “Role of Mining in National Economies :Mining Contribution Index.”
• International Labour Organisation. 2017. “ILOSTAT Webpage.” 2017. http://www.ilo.org/ilostat/faces/ilostat-home/home?_adf.ctrl-state=173q41vp6g_45&_afrLoop=636541473843361#!
• Mallari, Neil Aldrin D., Nigel J. Collar, Philip J.K. McGowan, and Stuart J. Marsden. 2016. “Philippine Protected Areas Are Not Meeting the Biodiversity Coverage and Management Effectiveness Requirements of Aichi Target 11.” Ambio 45 (3): 313–22. https://doi.org/10.1007/s13280-015-0740-y.

137FOREST-SMART MINING
• Quintans, Jasmin. 2017. “Mining Industry in the Philippines.” The Manila Times, September 4, 2017. http://www.manilatimes.net/mining-industry-philippines/348610/.
• Republic of the Philippines Forest Management Bureau. 2016. “Philippine Forests at a Glance 2016 Edition.”
• Senate of the Philippines. 2015. “Philippine Forests At A Glance.” https://doi.org/10.1086/332061.
• The Red Desk. 2017. “The Red Desk Website.” 2017. http://thereddesk.org.
• The World Bank Group. 2016. The Little Data Book 2016. Washington DC: The World Bank. https://doi.org/10.1596/978-1-4648-0834-0.
• ———. 2017. The Little Green Data Book 2017. Washington D.C.: The World Bank Group. https://doi.org/10.1596/978- 1-4648-1034-3.
• United Nations. 2018. “Food and Agriculture Organisation of the United Nations Country Profiles.” 2018. http://www.fao.org/
countryprofiles/en/.
3.15.2. National Forest-Smart Takeaways
• On paper, the Philippines has a strong policy framework for forest-smart mining. The Philippines now has a comprehensive policy and legislative framework for addressing environmental concerns, indigenous rights, and social benefits within the mining industry. However, implementation remains a challenge and enforcement is underresourced.
• Other countries could learn from the Philippines that mining governance should come before environmental disasters occur. The Philippines improved policy and legislative reforms came in response to environmental disaster. It would have been far more forest smart to have implemented them proactively rather than retroactively.
• Mining investment attractiveness may not always be a good thing. Mining investment attractiveness is measured from the perspective of the business. Stronger environmental rules may hinder investment but could promote more forest-smart mining.
3.15.3. Case Study 24: Mount Tapian (Marcopper)
Figure 3.47 Map of Mount Tapian and AOI, Including Forest Cover and Protected Areas
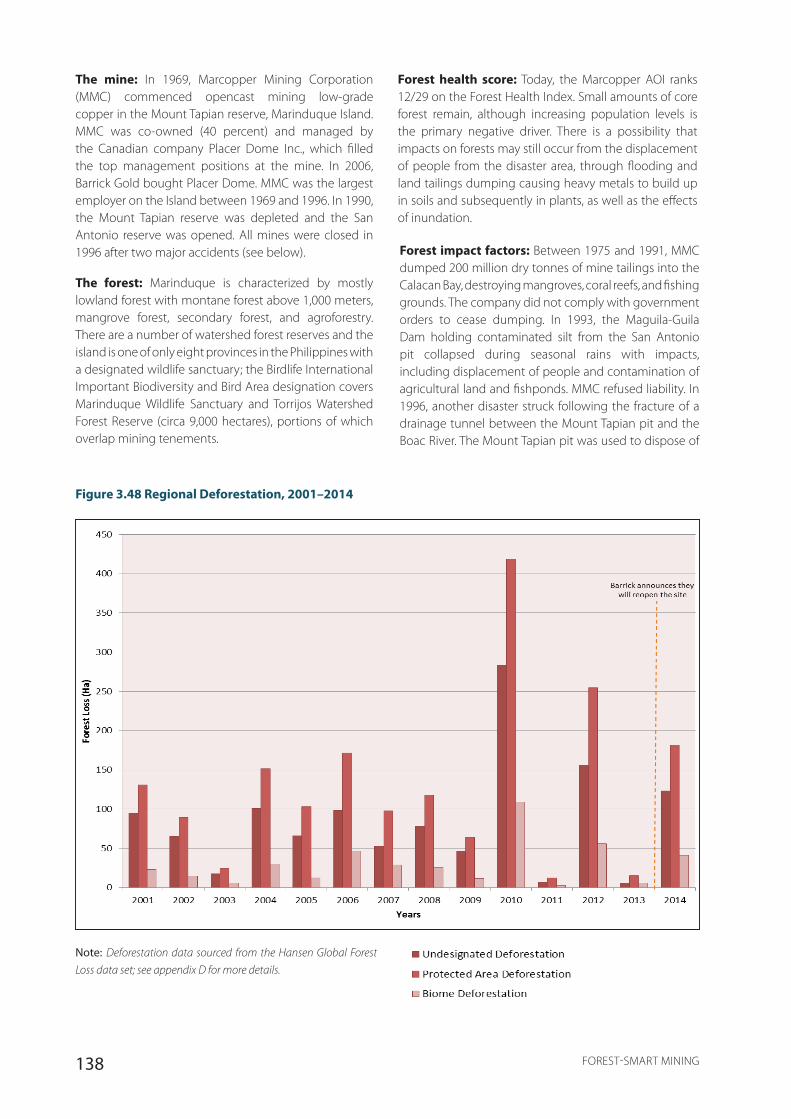
138 FOREST-SMART MINING
Note: Deforestation data sourced from the Hansen Global Forest
Loss data set; see appendix D for more details.
The mine: In 1969, Marcopper Mining Corporation (MMC) commenced opencast mining low-grade copper in the Mount Tapian reserve, Marinduque Island. MMC was co-owned (40 percent) and managed by the Canadian company Placer Dome Inc., which filled the top management positions at the mine. In 2006, Barrick Gold bought Placer Dome. MMC was the largest employer on the Island between 1969 and 1996. In 1990, the Mount Tapian reserve was depleted and the San Antonio reserve was opened. All mines were closed in 1996 after two major accidents (see below).
The forest: Marinduque is characterized by mostly lowland forest with montane forest above 1,000 meters, mangrove forest, secondary forest, and agroforestry. There are a number of watershed forest reserves and the island is one of only eight provinces in the Philippines with a designated wildlife sanctuary; the Birdlife International Important Biodiversity and Bird Area designation covers Marinduque Wildlife Sanctuary and Torrijos Watershed Forest Reserve (circa 9,000 hectares), portions of which overlap mining tenements.
Forest health score: Today, the Marcopper AOI ranks 12/29 on the Forest Health Index. Small amounts of core forest remain, although increasing population levels is the primary negative driver. There is a possibility that impacts on forests may still occur from the displacement of people from the disaster area, through flooding and land tailings dumping causing heavy metals to build up in soils and subsequently in plants, as well as the effects of inundation.
Forest impact factors: Between 1975 and 1991, MMC dumped 200 million dry tonnes of mine tailings into the Calacan Bay, destroying mangroves, coral reefs, and fishing grounds. The company did not comply with government orders to cease dumping. In 1993, the Maguila-Guila Dam holding contaminated silt from the San Antonio pit collapsed during seasonal rains with impacts, including displacement of people and contamination of agricultural land and fishponds. MMC refused liability. In 1996, another disaster struck following the fracture of a drainage tunnel between the Mount Tapian pit and the Boac River. The Mount Tapian pit was used to dispose of
Figure 3.48 Regional Deforestation, 2001–2014

139FOREST-SMART MINING
tailings from the San Antonio pit and 3 million tonnes of acidic tailings flooded into the Boac River and to the sea. The environmental and social impacts on fisheries, soil, livelihoods, and health are still present today. Neither the Maguila-Guila Dam nor the tunnel was constructed to international standards. MMC knew about the weak tunnel but took no responsibility or action due to lack of funds. Placer Dome accepted cleanup costs and immediate repairs but abandoned commitments after the sale to Barrick. The legal case continues. The failings were not only at the corporate level. Key government departments failed to ensure the company was in compliance with legislation. There was poor decision making over the approval of the Environmental Compliance Certificate allowing MMC to use the Mount Tapian pit for tailings from the San Antonio pit. There was also limited technical capacity in the Multipartite Monitoring Team responsible for inspection and monitoring compliance with environmental protection measures because of a lack of mining expertise and high staff turnover. However, the 1996 disaster was partially responsible for amendments to the rules and regulations of the 1995 Mining Act that strengthened environmental protection and social responsibility requirements.
Data sources
• Birdlife International. 2018. “Important Bird Areas Factsheet: Marinduque Wildlife Sanctuary.” 2018. http://datazone.birdlife.org/site/factsheet/marinduque-wildlife-sanctuary-iba-philippines.
• Gregory, Cheryl. 2004a. “Environmental Justice Case Study: Marcopper in the Philippines.” Environmental Justice Case Studies by University of Michigan Students. 2004.
• ———. 2004b. “Environmental Justice Case Study: Marcopper in the Philippines.” Environmental Justice Case Studies by University of Michigan Students. 2004. http://umich.edu/~snre492/Jones/marcopper.htm.
• Igual, Yna Maria L, Joan L Maglente, Don Ashley O Malabana, Kirk Thomas A Rillera, and Francis S Rosario. n.d. “Current Status of Biological and Social Impacts of Marcopper Mining Tragedy in Marinduque.” Polytechnic University of the Philippines.
• Lyday, Travis Q. 1999. “The Mineral Industry of the Philippines.” U.S. Geological Survey Minerals Yearbook. https://minerals.usgs.gov/minerals/pubs/country/1999/9326099.pdf.
• Republic of the Philippines Department of Environment and Natural Resources. 2010. “Provincial Environment and and Natural Resources Office Marinduque Statistical Profile.” 2010.
http://penro.marinduque.ph/FMS STATISTICAL PROFILE.html.
3.15.4. Site-Level Forest-Smart Takeaways
• Marcopper represents one of the strongest examples of poor corporate governance leading to major forest impacts. Failures in governance within MMC were the primary cause of massive environmental and social impacts.
• Forest-smart mining requires strong capacity of government regulators. Capacity in terms of technical skills, financial resources, and personnel within key government departments responsible for overseeing mining and environmental impacts is essential. This helps ensure environmental, social, and health impact assessments (ESHIAs) are conducted properly, permits appropriately administered and monitoring of compliance addresses impacts before a disaster occurs.

140 FOREST-SMART MINING
3.16. SURINAMEFigure 3.49 Relationship between Forests and Large-Scale Mining in Suriname
Note: The country map shows the extent of forest cover (in green); the bar graph shows the proportion of mining that occurs in forests compared to the global average of countries containing MFAs; the pie chart shows the proportion of global MFAs in the country.
141FOREST-SMART MINING
3.16.1. National Overview
Suriname is an upper-middle-income country heavily dependent on export incomes generated by the extractive sector (in particular gold, oil, and bauxite). It is a high–forest cover/low-deforestation country, with low population density. Most of the geology is old crystalline basement that forms part of the Guyana Shield and is highly prospective. The combination of large, important forests with prospective geology makes “forest smart” considerations especially important.
In legal terms, Suriname’s legal and regulatory framework for minerals, forest, and environment is fairly rudimentary. Minerals are the property of the state and separated from land ownership. The mining sector is governed by a Mining Decree (1986) that provides the basis for mining agreements, which in turn are negotiated with the government and promulgated as laws by the National Assembly. The state retains some ownership in LSM projects. A legal framework for EIA or strategic environmental assessment (SEA) does not exist yet, although a new environmental law is under development and will include such requirements. Meanwhile, EIAs are being produced and reviewed by the relevant authorities, in spite of the lack of forcing regulations in this regard.
Two large gold projects have started in recent years: the IAMGOLD-owned Rosebel gold mine and the Newmont-controlled Merian mine; both are located in forested areas. Newmont is also planning for a second mine, Sabayo, near Merian. There is also a sizable artisanal and small-scale gold mining sector, which up until recently dominated the nation’s gold production. The ASM activities are centered in the same area as the LSM operations and are largely informal.
Approximately about 90 percent of Suriname is covered by forest, of which 13 percent is formally protected and about twice that is designated as production forests. The forestry sector is, however, only modestly important to the nation’s economy, and what is produced is mainly destined for the local market. However, Suriname is one of the few countries in South America that is legally exporting considerable quantities of wildlife, and this generates a significant income. Nearly all forests are state owned (greater than 99 percent); there is very little private or other type of ownership. Indigenous or tribal land rights are not yet recognized, but there are signs that they may be in the future, as a result of ongoing legal
developments that relate to land rights. Some minor deforestation has taken place due to legal and illegal small-scale gold mining, hydropower development, infrastructure, and agriculture.
Suriname is currently undergoing the “readiness” phase for REDD+.
Data sources
• ERM. 2013. “Merian Project Final ESIA Executive Summary.”
• FAO. 2010. “GLOBAL FOREST RESOURCES ASSESSMENT 2010 COUNTRY REPORT SURINAME.”
• Global Forest Watch. 2016. “Global Forest Watch Website.” 2016. http://www.globalforestwatch.org.
• IGF. 2017. “IGF Mining Policy Framework Assessment: Suriname.” https://www.iisd.org/sites/default/files/publications/suriname-mining-policy-framework-assessment-en.pdf.
• Monsels, D.A. 2016. “Bauxite Deposits in Suriname: Geological Context and Resource Development.” Netherlands Journal of Geosciences 95 (04): 405–18. https://doi.org/10.1017/njg.2015.28.
• Newmont. 2015. “2016 Social and Environmental Performance Report.”
• RESOLVE. n.d. “Free , Prior and Informed Consent ( FPIC ) within a Human Rights Framework : Lessons from a Suriname Case Study.”
• The Red Desk. 2017. “The Red Desk Website.” 2017. http://thereddesk.org.
• The World Bank Group. 2016. The Little Data Book 2016. Washington DC: The World Bank. https://doi.org/10.1596/978-1-4648-0834-0.
• ———. 2017. The Little Green Data Book 2017. Washington D.C.: The World Bank Group. https://doi.org/10.1596/978- 1-4648-1034-3.
• USGS. 2015. “2013 Minerals Yearbook: Suriname.” U.S. Geological Survey. http://minerals.usgs.gov/minerals/pubs/commodity/
myb/.
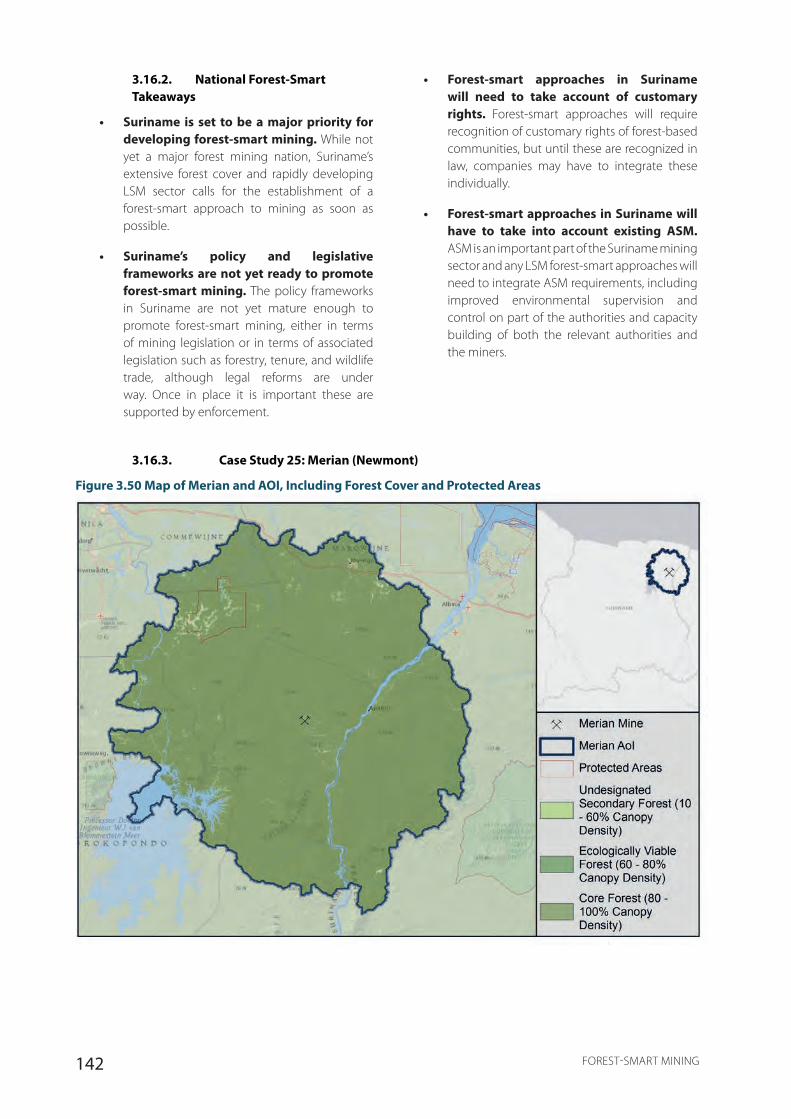
142 FOREST-SMART MINING
3.16.3. Case Study 25: Merian (Newmont)
Figure 3.50 Map of Merian and AOI, Including Forest Cover and Protected Areas
3.16.2. National Forest-Smart Takeaways
• Suriname is set to be a major priority for developing forest-smart mining. While not yet a major forest mining nation, Suriname’s extensive forest cover and rapidly developing LSM sector calls for the establishment of a forest-smart approach to mining as soon as possible.
• Suriname’s policy and legislative frameworks are not yet ready to promote forest-smart mining. The policy frameworks in Suriname are not yet mature enough to promote forest-smart mining, either in terms of mining legislation or in terms of associated legislation such as forestry, tenure, and wildlife trade, although legal reforms are under way. Once in place it is important these are supported by enforcement.
• Forest-smart approaches in Suriname will need to take account of customary rights. Forest-smart approaches will require recognition of customary rights of forest-based communities, but until these are recognized in law, companies may have to integrate these individually.
• Forest-smart approaches in Suriname will have to take into account existing ASM. ASM is an important part of the Suriname mining sector and any LSM forest-smart approaches will need to integrate ASM requirements, including improved environmental supervision and control on part of the authorities and capacity building of both the relevant authorities and the miners.
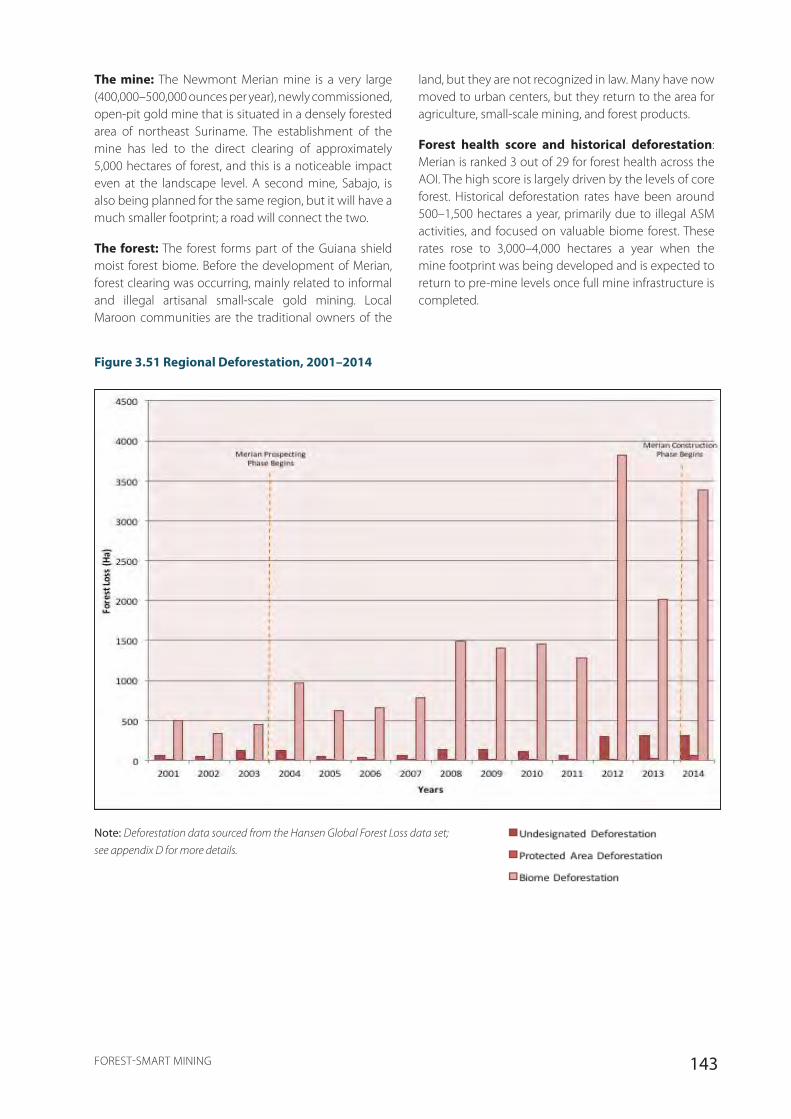
143FOREST-SMART MINING
The mine: The Newmont Merian mine is a very large (400,000–500,000 ounces per year), newly commissioned, open-pit gold mine that is situated in a densely forested area of northeast Suriname. The establishment of the mine has led to the direct clearing of approximately 5,000 hectares of forest, and this is a noticeable impact even at the landscape level. A second mine, Sabajo, is also being planned for the same region, but it will have a much smaller footprint; a road will connect the two.
The forest: The forest forms part of the Guiana shield moist forest biome. Before the development of Merian, forest clearing was occurring, mainly related to informal and illegal artisanal small-scale gold mining. Local Maroon communities are the traditional owners of the
land, but they are not recognized in law. Many have now moved to urban centers, but they return to the area for agriculture, small-scale mining, and forest products.
Forest health score and historical deforestation: Merian is ranked 3 out of 29 for forest health across the AOI. The high score is largely driven by the levels of core forest. Historical deforestation rates have been around 500–1,500 hectares a year, primarily due to illegal ASM activities, and focused on valuable biome forest. These rates rose to 3,000–4,000 hectares a year when the mine footprint was being developed and is expected to return to pre-mine levels once full mine infrastructure is completed.
Figure 3.51 Regional Deforestation, 2001–2014
Note: Deforestation data sourced from the Hansen Global Forest Loss data set;
see appendix D for more details.
144 FOREST-SMART MINING
Forest impact factors: Unlike some sites, there has not been evidence of a major influx of people to the area following the mine development. However, local communities do see the mine as an opportunity to move back from the towns and reestablish their presence in the forests. Newmont also commits to no net loss (including the creation of a botanical baseline), implementation of the mitigation hierarchy, a rescue and relocation program for fauna, trialing methods to restore the ASM impacted areas within their area of exploitation, and the development of social impact management plans. They are also working through the Suriname government on managing the relationship with artisanal miners in the area.
Data sources
• ERM. 2013a. “Merian Project Final ESIA Executive Summary.”
• ———. 2013b. “Merian Project Final ESIA Report Volume I - Environmental and Social Impact Assessment.” Vol. I.
• Newmont. 2015. “2016 Social and Environmental Performance Report.”
• “Newmont Developing Merian Gold Mine in Suriname.” 2014. Engineering and Mining Journal 215 (9).
• Newmont Mining Corporation. 2017. “Newmont Mining Corporation Website.” 2017. http://www.newmont.com.
• RESOLVE. n.d. “Free , Prior and Informed Consent ( FPIC ) within a Human Rights Framework : Lessons from a Suriname Case Study.”
• SurGold. 2011. “Merian Gold Project.”
3.16.4. Site-Level Forest-Smart Takeaways
• At present, Newmont is demonstrating a forest-smart approach by compensating for areas where governance is lacking. Newmont is demonstrating various examples of best practice at Merian and, to a certain degree, compensating for the relative lack of government policy through its efforts with local communities and mitigation of environmental impacts. However, achieving forest-smart development will likely require Newmont to continue to voluntarily fill the gaps where governance is lacking, actively help the government build capacity, and start to look more at addressing or preventing secondary impacts outside the mine footprint.
• To maintain limited forest impacts, Newmont will have to mitigate impacts of planned expansion. Despite having a fairly large direct footprint, Merian has not yet had clear secondary impacts across the landscape, with forest health still high. This is likely due in part to the remoteness of the area. However, plans for continued infrastructure development and the desire by local communities to return to the area may change this in the future and this will need to be carefully managed by the relevant authorities and the company.
• Forest-smart development around Merian will require landscape-level assessment. One of the priority areas for action where companies may well have to consider assisting the government’s lack of capacity is to conduct strategic, landscape environmental assessments encompassing all planned development across the area, not just individual site-based ESIAs.
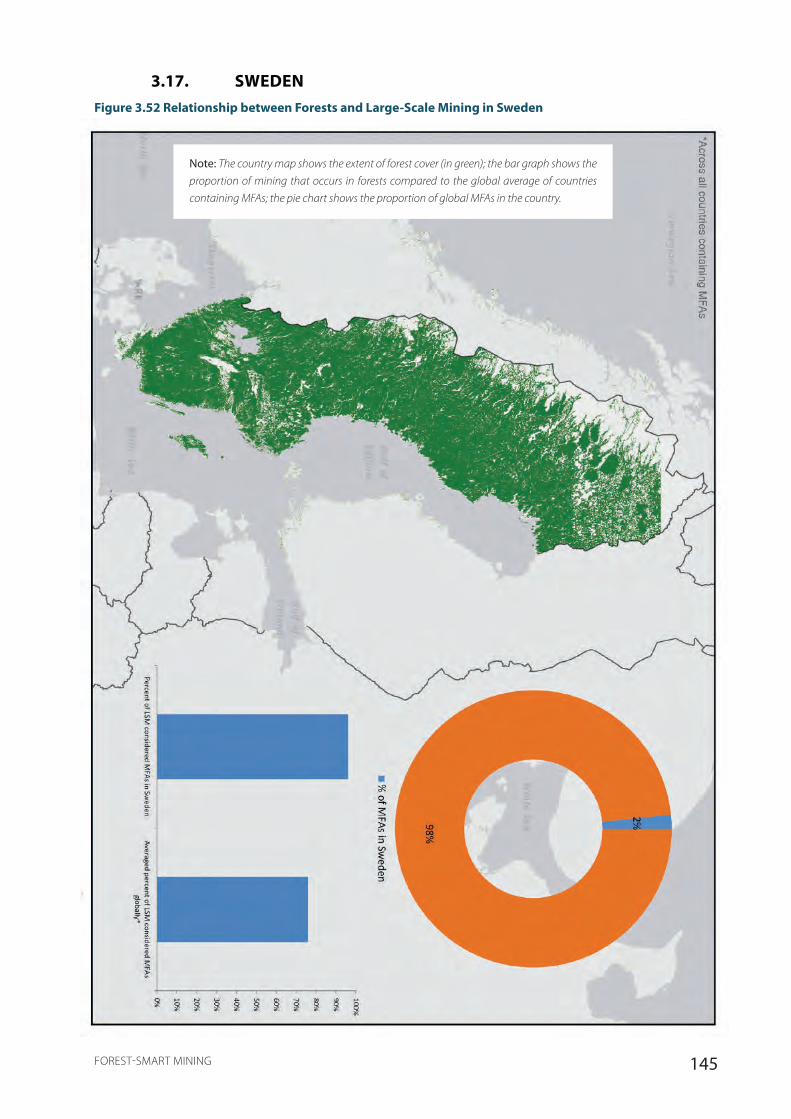
145FOREST-SMART MINING
3.17. SWEDENFigure 3.52 Relationship between Forests and Large-Scale Mining in Sweden
Note: The country map shows the extent of forest cover (in green); the bar graph shows the
proportion of mining that occurs in forests compared to the global average of countries
containing MFAs; the pie chart shows the proportion of global MFAs in the country.

146 FOREST-SMART MINING
3.17.1. National Overview
Sweden is a high-income country with a diversified economy. The forestry and mining sectors have long been important and today represent about 10 percent of total exports each. The forestry sector is important in terms of providing jobs, whereas the mining sector is less significant in this regard.
Access and use of precious minerals is controlled by the state. The mines are almost all situated within three mining districts, which in turn are forested: “Malmfälten” in the far north (iron ore and some copper/gold), “the Skellefte field” (gold and base metals) a bit farther south, and the “Bergslagen area” (smaller base metals and iron ore) in south/central Sweden. The industry is dominated by two companies: the state-owned iron ore producer LKAB and the private and listed company Boliden AB, which is mainly involved in the mining, processing, and smelting of base metals. Mines that exploit concession minerals exist at widely varying scales (0.04–35 million tonnes per year). However, the development of the mining sector has followed a clear trend of there being ever fewer but bigger mines. Today, there are 17 mines, producing 72 million tonnes of ore annually. The precious minerals mining sector is governed through the Minerals Act (1991), which in turn is supervised and controlled by the Mining Inspectorate. Mining activities are also the subject of permitting and EIA processes in accordance with the Environmental Code (1998), with permits adjudicated by the Land and Environment Courts. There are a significant number of other institutions involved in the supervision and control of mining activities (regional authorities and state agencies, including the Environmental Protection Agency). In terms of taxation, the mining sector is largely treated like any other industrial activity. Thus, there is no royalty, but there is a fee payable to landholders, where such exist.
The Swedish forests consist mostly of spruce and pine forests (boreal) with minor deciduous forest in the far south. Overall, nearly 70 percent of Sweden is covered by forests, and of this, a bit more than 80 percent is classified as being “productive forests,” forests that have been used for forestry for a long period, and as a result, very little old forests remain. Overall, each year, 2 to 3 percent of the productive forests are logged. About 60 percent of the Swedish forests are certified either through FSC or PEFC. There is no net deforestation; on the contrary, forest cover has increased significantly over the past century. Forest ownership is mainly held by families and individuals (56 percent), followed by large forestry corporations (25 percent), and the state (19 percent). The patterns of ownership of land differ significantly between the main mining areas: in the north, where
land parcels are typically very large, the state controls most of the land; the south has more fragmented parcels and mostly private ownership of land. There are significant usufructuary rights to accessing forests. First, reindeer herding by indigenous Sami reindeer herders is conducted in the northern parts, in an area that covers nearly half of Sweden. Second, there is a right of public access to nearly all areas in the countryside, including forests. The forestry sector is governed through the Forestry Act (1979), and its implementation is supervised and controlled by the Forestry Agency. Forestry activities are not subject of an EIA process, but instead the environmental aspects are included in the forest-related regulations. Overall, supervision and control of forestry is concentrated in the Forestry Agency.
Data sources
• Forests Sweden. n.d. “Https://Www.Skogssverige.Se/En.” Accessed December 21, 2017. https://www.skogssverige.se/en.
• Geological Survey of Sweden. 2017. “Geological Survey of Sweden.” 2017. www.sgu.se/mineralnaring/svensk-gruvnaring/svenska-malmgruvor.
• Global Forest Watch. 2016. “Global Forest Watch Website.” 2016. http://www.globalforestwatch.org.
• Government of Sweden. 2014. “The Swedsh Mineral Strategy (in Swedish).” http://www.regeringen.se/content/1/c6/20/96/57/14fbe930.pdf.
• ———. 2017. “Ecological Compensation (a Public State Report; in Swedish).”
• Statistics Sweden. 2017. “Statistics Sweden.” www.scb.se.
• Swedish Forestry Agency. 2015. “Forests and Forestry in Sweden.” https://doi.org/10.1007/BF00578267.
• The Red Desk. 2017. “The Red Desk Website.” 2017. http://thereddesk.org.
• The World Bank Group. 2016. The Little Data Book 2016. Washington DC: The World Bank. https://doi.org/10.1596/978-1-4648-0834-0.
• ———. 2017. The Little Green Data Book 2017. Washington D.C.: The World Bank Group. https://doi.org/10.1596/978-
1-4648-1034-3.
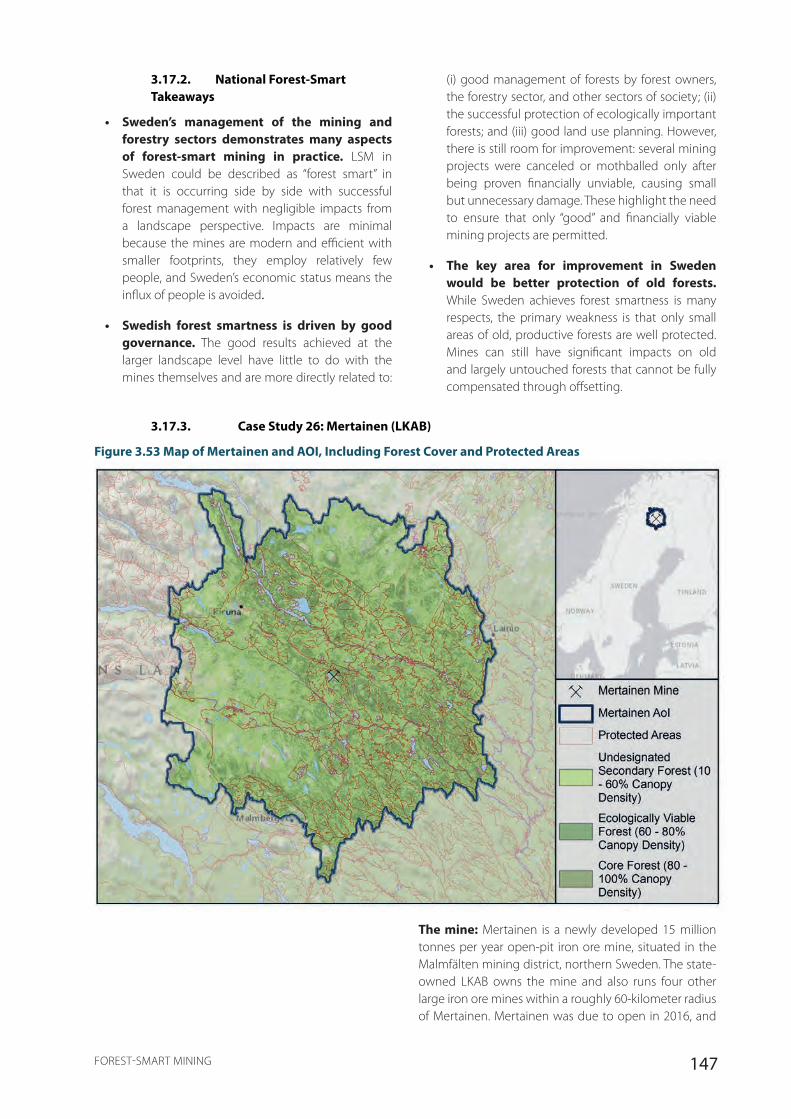
147FOREST-SMART MINING
3.17.2. National Forest-Smart Takeaways
• Sweden’s management of the mining and forestry sectors demonstrates many aspects of forest-smart mining in practice. LSM in Sweden could be described as “forest smart” in that it is occurring side by side with successful forest management with negligible impacts from a landscape perspective. Impacts are minimal because the mines are modern and efficient with smaller footprints, they employ relatively few people, and Sweden’s economic status means the influx of people is avoided.
• Swedish forest smartness is driven by good governance. The good results achieved at the larger landscape level have little to do with the mines themselves and are more directly related to:
(i) good management of forests by forest owners, the forestry sector, and other sectors of society; (ii) the successful protection of ecologically important forests; and (iii) good land use planning. However, there is still room for improvement: several mining projects were canceled or mothballed only after being proven financially unviable, causing small but unnecessary damage. These highlight the need to ensure that only “good” and financially viable mining projects are permitted.
• The key area for improvement in Sweden would be better protection of old forests. While Sweden achieves forest smartness is many respects, the primary weakness is that only small areas of old, productive forests are well protected. Mines can still have significant impacts on old and largely untouched forests that cannot be fully compensated through offsetting.
3.17.3. Case Study 26: Mertainen (LKAB)
Figure 3.53 Map of Mertainen and AOI, Including Forest Cover and Protected Areas
The mine: Mertainen is a newly developed 15 million tonnes per year open-pit iron ore mine, situated in the Malmfälten mining district, northern Sweden. The state-owned LKAB owns the mine and also runs four other large iron ore mines within a roughly 60-kilometer radius of Mertainen. Mertainen was due to open in 2016, and
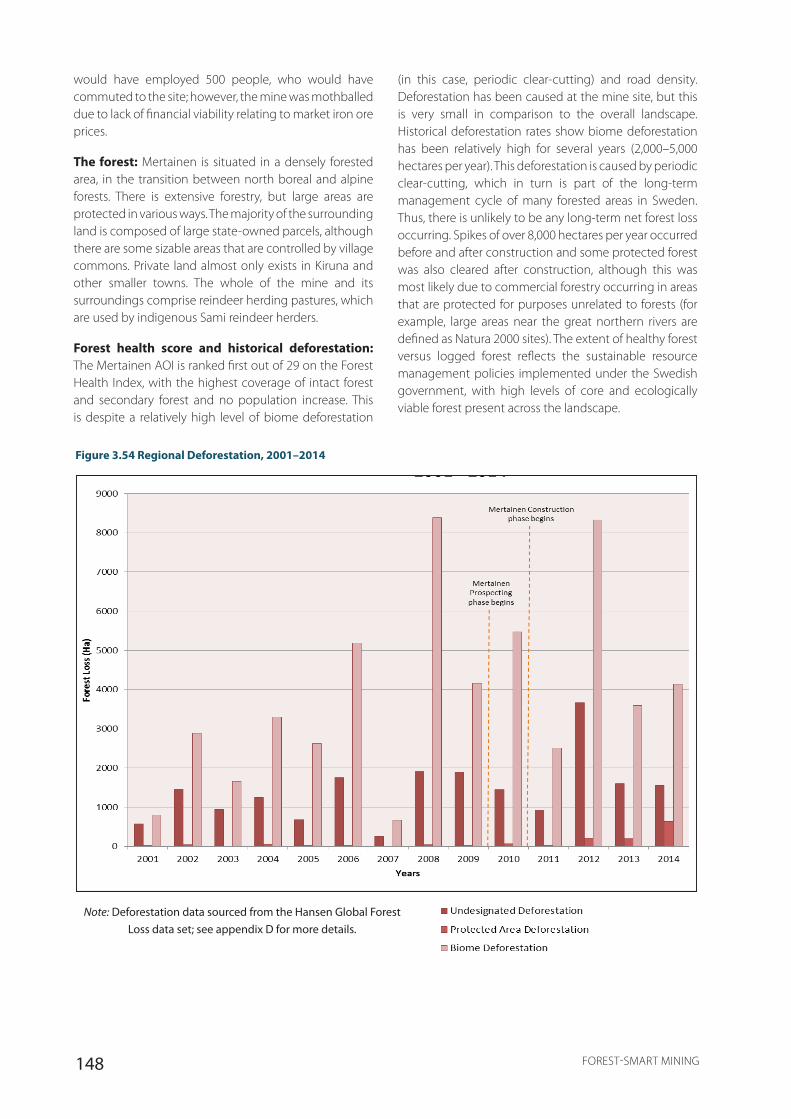
148 FOREST-SMART MINING
would have employed 500 people, who would have commuted to the site; however, the mine was mothballed due to lack of financial viability relating to market iron ore prices.
The forest: Mertainen is situated in a densely forested area, in the transition between north boreal and alpine forests. There is extensive forestry, but large areas are protected in various ways. The majority of the surrounding land is composed of large state-owned parcels, although there are some sizable areas that are controlled by village commons. Private land almost only exists in Kiruna and other smaller towns. The whole of the mine and its surroundings comprise reindeer herding pastures, which are used by indigenous Sami reindeer herders.
Forest health score and historical deforestation: The Mertainen AOI is ranked first out of 29 on the Forest Health Index, with the highest coverage of intact forest and secondary forest and no population increase. This is despite a relatively high level of biome deforestation
(in this case, periodic clear-cutting) and road density. Deforestation has been caused at the mine site, but this is very small in comparison to the overall landscape. Historical deforestation rates show biome deforestation has been relatively high for several years (2,000–5,000 hectares per year). This deforestation is caused by periodic clear-cutting, which in turn is part of the long-term management cycle of many forested areas in Sweden. Thus, there is unlikely to be any long-term net forest loss occurring. Spikes of over 8,000 hectares per year occurred before and after construction and some protected forest was also cleared after construction, although this was most likely due to commercial forestry occurring in areas that are protected for purposes unrelated to forests (for example, large areas near the great northern rivers are defined as Natura 2000 sites). The extent of healthy forest versus logged forest reflects the sustainable resource management policies implemented under the Swedish government, with high levels of core and ecologically viable forest present across the landscape.
Figure 3.54 Regional Deforestation, 2001–2014
Note: Deforestation data sourced from the Hansen Global Forest Loss data set; see appendix D for more details.
149FOREST-SMART MINING
Forest impact factors: The development phase of the mine involved appeals by the Swedish Environmental Protection Agency and an NGO regarding an EU Natura 2000 site, but the mine was eventually approved. LKAB then initiated some impact mitigation measures. Part of the mine development involved the clearance of about 100 hectares of old-growth forest, which was logged to make room for a waste rock deposit. There was an attempt to compensate for this and other impacts through an ecological compensation project, based on BBOP methodology, which is new for Sweden. There was also consultation and agreement with Sami herders to reduce impacts on reindeer herds. While worth acknowledgement, the efforts made by LKAB focused mostly on technical measures to avoid/mitigate direct impacts of the mine, and these were far from the most ambitious measures encountered in the overall study.
Data sources
• Eriksson, Stina, Annika Zachrisson, Kirsi Jokinen, Sonja Preuss, and Nic Kruys. 2017. “Management Plan for the Kuosajännkä off Set Area, Kiruna (in Swedish).”
• Government of Sweden. 2017. “Ecological Compensation (a Public State Report; in Swedish).”
• LKAB. 2012. “EIA - Mertainen (Technical Summary; in Swedish).” Vol. 1.
• ———. 2016. “Annual and Sustainability Report 2016.” http://ir.brf-global.com/conteudo_en.asp?idioma=1&tipo=52242&conta=44&id=197215.
• Naturskyddsföreningen. 2014. “The Mining Industry - Background and Proposals (in Swedish),” 1–26.
• Swedish Forestry Agency. 2015. “Forests and Forestry in Sweden.”
https://doi.org/10.1007/BF00578267.
3.17.4. Site-Level Forest-Smart Takeaways
• Mertainen demonstrates LSM can occur while maintaining high forest value across the landscape. While acknowledging Mertainen was mothballed before full operation, the development of the mine did not appear to cause the same impacts as mines elsewhere.
• Forest smartness at Mertainen was more likely due to strong forest governance and local economic strength than good corporate behavior. LKAB did implement some forest impact mitigation strategies, but these were far behind others included in this study. Some impacts, including the loss of 100 hectares of old-growth forest, appear unnecessary given the mine never entered operation, although with increasing iron ore prices, it may soon do so. At the same time, the strong management of forests by the state as well as by other forest owners ensured high levels of intact and well-connected forest remain. This coupled with the lack of economic pressure on people to move to the mine region outweighed the relatively minor footprint that was created.
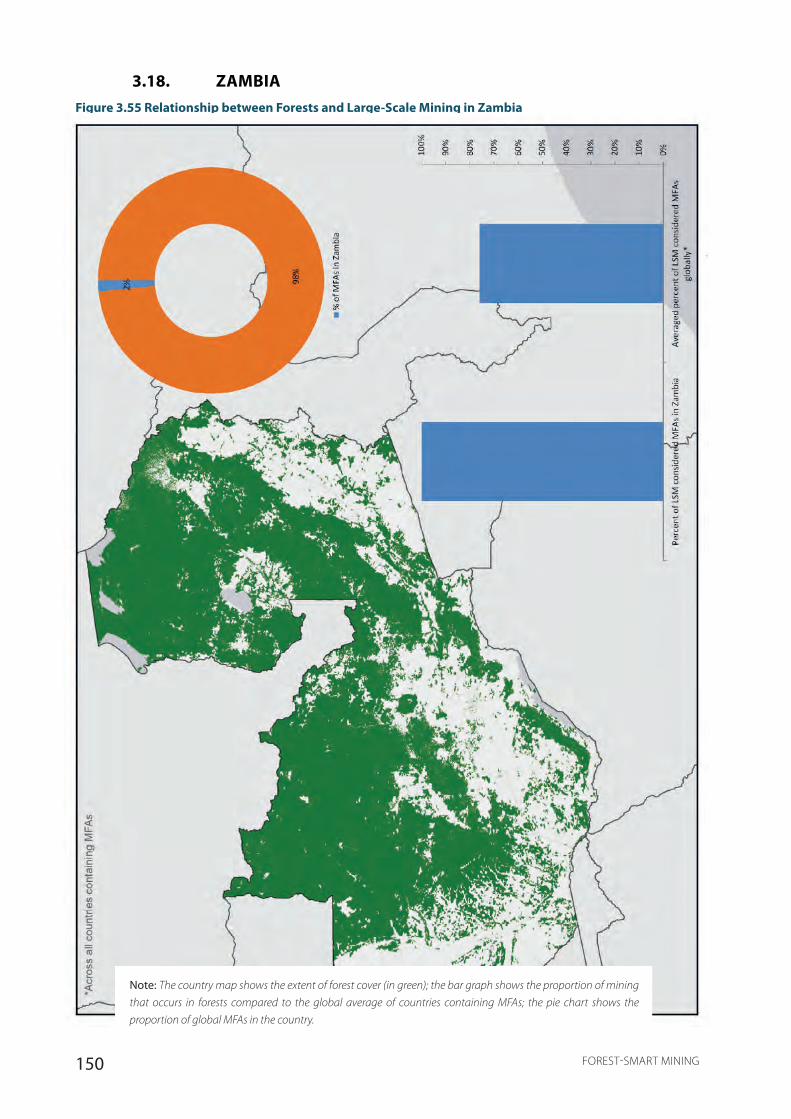
150 FOREST-SMART MINING
3.18. ZAMBIAFigure 3.55 Relationship between Forests and Large-Scale Mining in Zambia
Note: The country map shows the extent of forest cover (in green); the bar graph shows the proportion of mining
that occurs in forests compared to the global average of countries containing MFAs; the pie chart shows the
proportion of global MFAs in the country.
151FOREST-SMART MINING
3.18.1. National Overview
Zambia is a least-developed country in possession of some of the world’s highest-grade copper deposits. Zambia is the world’s sixth-largest copper producer with 715,000 tonnes equating to 4.4 percent of global output, with increased production and expansion of the copper sector likely to take Zambia into the top five global producers at over 1 million tonnes per year by 2020. The primary law governing the mining sector in Zambia is the Mines and Minerals Development Act No. 11 of 2015 of the Laws of Zambia (MMDA) as read together with the Mines and Minerals Development (Amendment) Act No. 14 of 2016. The MMDA deals with mining rights, licenses, large-scale mining rights, gemstone mining, health and safety, environmental protection, geological services on analysis, royalties, and charges.
It is estimated that over 40 percent of the country’s total land area is covered with natural forests, with high dependence on wood for fuel and building materials. Of these forests, about 7.2 million hectares are under government control in 432 forest reserves. In addition, there are 6.4 million hectares in national parks and 15.6 million hectares in game management areas. There are also about 15.4 million hectares of forest under traditional or customary land. Forest-based emissions form a significant part of the country’s GHG emissions, with the country the 10th highest global carbon emitter due to charcoal production, forest clearance, and burning. The government of the Republic of Zambia is a signatory to a number of international conventions and protocols on the protection of the environment and biodiversity conservation. At present, only national parks, when properly managed, provide good assurance of biodiversity conservation. In the game management area (GMA) category, customary land is under control of the traditional authorities, but authority over land is attributed to several authorities (ZAWA, Forestry Department, district councils, and traditional leaders), causing duplication of efforts and unclear roles. The outcome is de facto open-access property regimes and weak controls on the conversion to (slash-and-burn) smallholder agriculture even in defined protected zones. The first signs of control are evident through a combination of land use planning and judicial enforcement of these land use plans, but this needs to be significantly reinforced as open access is a major barrier to effective biodiversity conservation and the emergence of a viable bio-experience economy.
Capacity in Zambia is stretched; however, there are numerous frameworks and efforts to move from away from a legacy of unsustainable and environmentally and socially damaging mining practices. There are good legal frameworks that require enabling; however, very
often local-level land tenure issues and influence and pockets of corruption disrupt the application of law. There is often inadequate consultation and co-decision making between the Ministry of Mines, Energy and Water Development and other ministries. The Ministry of National Development Planning is aware that it needs to address integrated landscape level planning with interministerial support and consultation to improve the development planning process, decentralization, and better land tenure. The Zambia Environmental Management Agency is responsible for the protection and conservation of the environment and the sustainable management and use of natural resources. It is also responsible for the prevention and control of pollution and environmental degradation, providing for public participation in environmental decision making and access to environmental information, environmental auditing, and monitoring and implementation of international environmental agreements and conventions to which Zambia is a party. It also produces the State of the Environment Report and is responsible for the Environment Fund. Ninety-five percent of Zambian land lies under the tenure of tribal authorities and chieftains.
Zambia has a fairly well developed REDD+ program. It is one of the UNDP REDD pilot countries and part of the UN-REDD Quick Start Initiative. A National Joint Program developed the REDD+ National Strategy and the Forestry Department is the main implementing body at the national and subnational levels with representatives in each of the country’s districts.
Data sources
• Chileshe, Anne. 2001. “FOSA Country Report: Nigeria. Forestry Outlook Studies in Africa (FOSA),” no. July.
• Day, Michael, Davison Gumbo, Kaala B Moomba, Arief Wijaya, and Terry Sunderland. 2014. Zambia Country Profile: Monitoring, Reporting and Verification for REDD+.
• Global Forest Watch. 2016. “Global Forest Watch Website.” 2016. http://www.globalforestwatch.org.
• ICMM. 2016. “Role of Mining in National Economies.” 3rd ed. London, UK.
• Initiatives, Immediate, Climate Change, and Facilitation Unit. n.d. “Ministry of Tourism, Environment and Natural Resources Support to the Immediate Initiatives on Climate Change and Establishment of the Facilitation Unit.”
• Investment, T H E Mining. 2016. “Zambia Mining Investment and Governance Review,” no. April.
• KPMG International. 2013. “Mozambique Country Mining Guide.” KPMG International, 28.
• Moore Stephens LLP. 2014. “Reconciliation Report for the Year 2011 (Pre-Final Report).” Zambia Extractive Industries
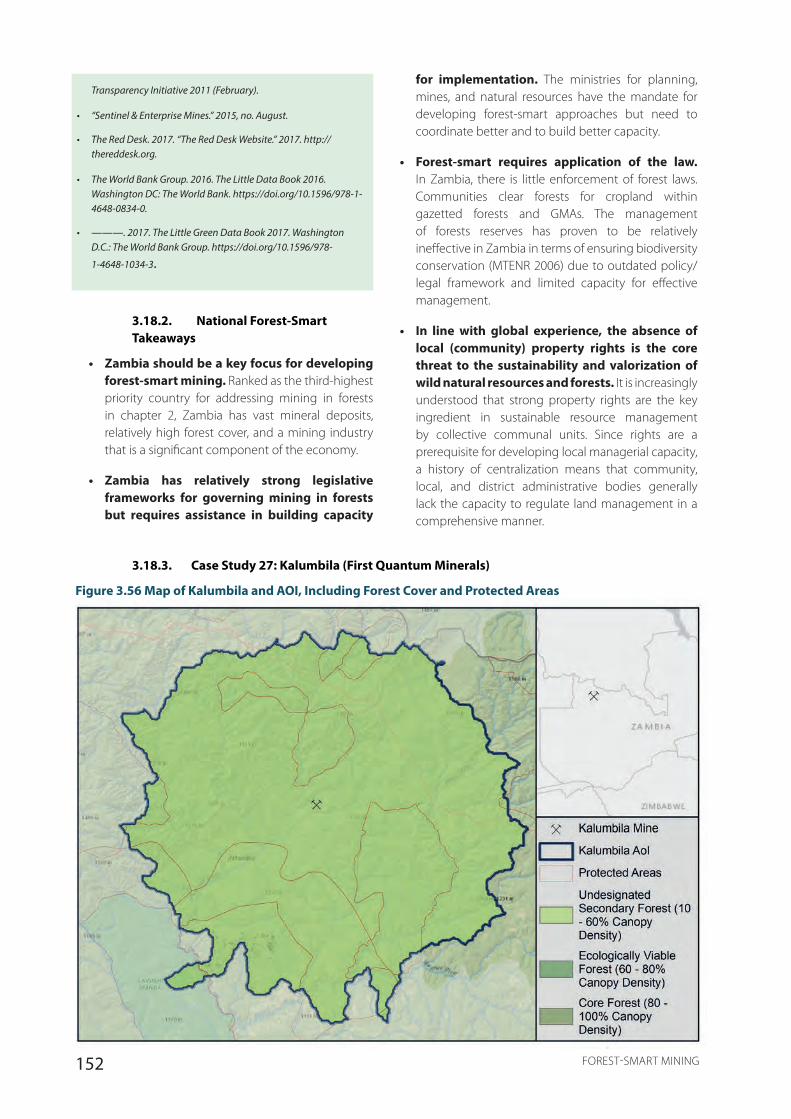
152 FOREST-SMART MINING
Transparency Initiative 2011 (February).
• “Sentinel & Enterprise Mines.” 2015, no. August.
• The Red Desk. 2017. “The Red Desk Website.” 2017. http://thereddesk.org.
• The World Bank Group. 2016. The Little Data Book 2016. Washington DC: The World Bank. https://doi.org/10.1596/978-1-4648-0834-0.
• ———. 2017. The Little Green Data Book 2017. Washington D.C.: The World Bank Group. https://doi.org/10.1596/978-
1-4648-1034-3.
3.18.2. National Forest-Smart Takeaways
• Zambia should be a key focus for developing forest-smart mining. Ranked as the third-highest priority country for addressing mining in forests in chapter 2, Zambia has vast mineral deposits, relatively high forest cover, and a mining industry that is a significant component of the economy.
• Zambia has relatively strong legislative frameworks for governing mining in forests but requires assistance in building capacity
for implementation. The ministries for planning, mines, and natural resources have the mandate for developing forest-smart approaches but need to coordinate better and to build better capacity.
• Forest-smart requires application of the law. In Zambia, there is little enforcement of forest laws. Communities clear forests for cropland within gazetted forests and GMAs. The management of forests reserves has proven to be relatively ineffective in Zambia in terms of ensuring biodiversity conservation (MTENR 2006) due to outdated policy/legal framework and limited capacity for effective management.
• In line with global experience, the absence of local (community) property rights is the core threat to the sustainability and valorization of wild natural resources and forests. It is increasingly understood that strong property rights are the key ingredient in sustainable resource management by collective communal units. Since rights are a prerequisite for developing local managerial capacity, a history of centralization means that community, local, and district administrative bodies generally lack the capacity to regulate land management in a comprehensive manner.
3.18.3. Case Study 27: Kalumbila (First Quantum Minerals)
Figure 3.56 Map of Kalumbila and AOI, Including Forest Cover and Protected Areas
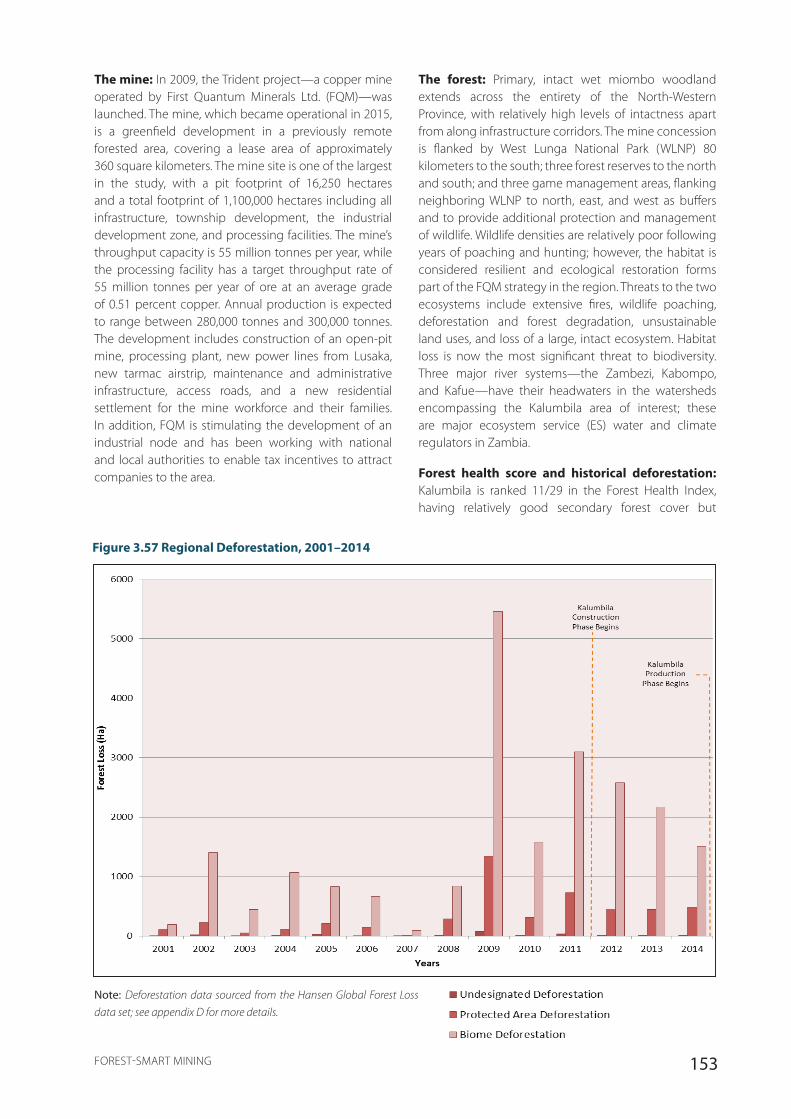
153FOREST-SMART MINING
The mine: In 2009, the Trident project—a copper mine operated by First Quantum Minerals Ltd. (FQM)—was launched. The mine, which became operational in 2015, is a greenfield development in a previously remote forested area, covering a lease area of approximately 360 square kilometers. The mine site is one of the largest in the study, with a pit footprint of 16,250 hectares and a total footprint of 1,100,000 hectares including all infrastructure, township development, the industrial development zone, and processing facilities. The mine’s throughput capacity is 55 million tonnes per year, while the processing facility has a target throughput rate of 55 million tonnes per year of ore at an average grade of 0.51 percent copper. Annual production is expected to range between 280,000 tonnes and 300,000 tonnes. The development includes construction of an open-pit mine, processing plant, new power lines from Lusaka, new tarmac airstrip, maintenance and administrative infrastructure, access roads, and a new residential settlement for the mine workforce and their families. In addition, FQM is stimulating the development of an industrial node and has been working with national and local authorities to enable tax incentives to attract companies to the area.
The forest: Primary, intact wet miombo woodland extends across the entirety of the North-Western Province, with relatively high levels of intactness apart from along infrastructure corridors. The mine concession is flanked by West Lunga National Park (WLNP) 80 kilometers to the south; three forest reserves to the north and south; and three game management areas, flanking neighboring WLNP to north, east, and west as buffers and to provide additional protection and management of wildlife. Wildlife densities are relatively poor following years of poaching and hunting; however, the habitat is considered resilient and ecological restoration forms part of the FQM strategy in the region. Threats to the two ecosystems include extensive fires, wildlife poaching, deforestation and forest degradation, unsustainable land uses, and loss of a large, intact ecosystem. Habitat loss is now the most significant threat to biodiversity. Three major river systems—the Zambezi, Kabompo, and Kafue—have their headwaters in the watersheds encompassing the Kalumbila area of interest; these are major ecosystem service (ES) water and climate regulators in Zambia.
Forest health score and historical deforestation: Kalumbila is ranked 11/29 in the Forest Health Index, having relatively good secondary forest cover but
Figure 3.57 Regional Deforestation, 2001–2014
Note: Deforestation data sourced from the Hansen Global Forest Loss
data set; see appendix D for more details.
154 FOREST-SMART MINING
little or no core or intact forest cover. The primary negative driver is deforestation in protected areas. Historically, deforestation rates across the AOI were below 1,000 hectares per year, but from 2009, the year the mine was announced, deforestation increased fivefold, predominantly in biomes and protected areas.
Forest impact factors: The quality of the ESIA and the mine licensing processes for Kalumbila appear questionable, and the environmental footprint of the mine appears to be far larger than necessary. Large-scale forest clearance for an oversize airport and two vast dammed watersheds seems unusually extensive. This is particularly significant because it occurred in previously isolated forest systems, causing large-scale fragmentation and enabling in-migration of additional people to the affected areas. The site includes an abundance of roads, which seem to be being built in anticipation of rapid and significant growth of the township and industrial node once the MFEZ (industrial zone) is declared. There is no evidence of application of the mitigation hierarchy and no accounting, aside from basic area-based measures, to determine the loss of biodiversity or forest as a result of mine development. An extensive social impact assessment and resettlement plan has been conducted and resulted in compensation of loss of livelihoods and land to local communities, but this led to large additional areas of forest lost and converted as part of this process. It has also spurred major sociodemographic and economic changes in the local community, including physical resettlement, influx of job- and opportunity-seeking migrants, shifts in livelihood strategies, and urbanization. It is unclear whether the company has full sight of the spatial and temporal implications of its impacts at the landscape and national scales. As a driver of economic development, however, there is clearly a significant investment to North-Western Province and cooperation between the company and local and national authorities. Relationships between FQM and governing authorities have not been without incident. Reports of coercion and at times lack of consultation and legal permissions cloud an otherwise massive investment in forest protection in Zambia.
However, the company has attempted to mitigate impacts. Through the Trident Foundation, FQM has developed innovative partnerships with the Forestry Department and the Department of National Parks and Wildlife to manage a 110,000-square-kilometer area including the West Lunga National Park, its three surrounding GMAs, three national protected forests, and corridors linking these in partnership with government and local communities. In addition, FQM has set aside areas of forest within the mine concession area for conservation and is restocking these areas with wildlife
from other company-owned GMAs, and the company has worked closely with local communities to develop conservation agriculture practices, honey/bee keeping, and commercial timber and woodworking.
Data sources
• ActionAid. 2014. “Community Impacted by Kalumbila Trident Project Make Plea to Government to Resolve Outstanding Issues with FQM.” 2014. http://www.actionaid.org/zambia/news/community-impacted-kalumbila-trident-project-make-plea-government-resolve-outstanding-is.
• Masialeti, Masialeti. 2016. “Organisational Learning in a Traditional Rural Context: A Case Study at Lumwana Mine in Zambia.” Stellenbosch. https://www.academia.edu/26401902/Organisational_Learning_in_a_traditional_Rural_Context_A_Case_Study_at_Lumwana_Mine_in_Zambia.
• Mondoloka, Angel. 2017. “Approaches to Supporting Local and Community Development: The View from Zambia.” 2017/41. WIDER Working Paper. https://www.wider.unu.edu/sites/default/files/wp2017-41.pdf.
• World Rainforest Movement. 2018. “Zambia.” 2018. https://wrm.
org.uy/browse-by-country/africa/zambia/.
3.18.4. Site-Level Forest-Smart Takeaways
• The Kalumbila area represents a prime candidate for improving forest-smart mining practices. As one of the first projects in what is expected to be a major industrial node that is resulting in the opening of previously remote forest, better forest-smart practices are urgently required.
• FQM appears to be a company willing to mitigate impacts, but it is not following generally accepted best practice. The scale and the ambition of the work carried out through the Trident Foundation is laudable, but at the same time FQM is failing to follow any of the fundamental approaches to forest-smart mining, including adoption of the mitigation hierarchy and strategic environmental impact assessment. If the ambition of the Trident Foundation could be better married with company activities, the site has strong potential for improvement.
• Forest-smart approaches are integrated into social management programs. Kalumbila has formed the Trident Foundation to develop forest-smart agriculture and conservation livelihoods projects to reduce impacts to the forest biome.
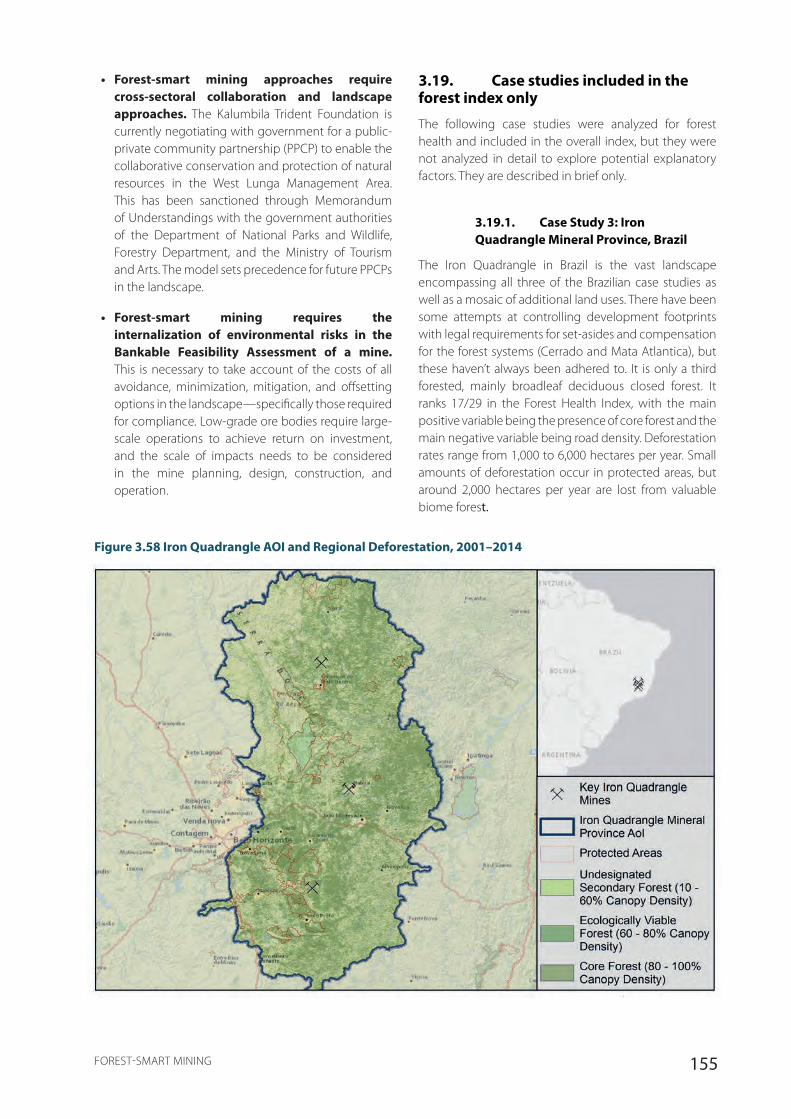
155FOREST-SMART MINING
• Forest-smart mining approaches require cross-sectoral collaboration and landscape approaches. The Kalumbila Trident Foundation is currently negotiating with government for a public-private community partnership (PPCP) to enable the collaborative conservation and protection of natural resources in the West Lunga Management Area. This has been sanctioned through Memorandum of Understandings with the government authorities of the Department of National Parks and Wildlife, Forestry Department, and the Ministry of Tourism and Arts. The model sets precedence for future PPCPs in the landscape.
• Forest-smart mining requires the internalization of environmental risks in the Bankable Feasibility Assessment of a mine. This is necessary to take account of the costs of all avoidance, minimization, mitigation, and offsetting options in the landscape—specifically those required for compliance. Low-grade ore bodies require large-scale operations to achieve return on investment, and the scale of impacts needs to be considered in the mine planning, design, construction, and operation.
3.19. Case studies included in the forest index only
The following case studies were analyzed for forest health and included in the overall index, but they were not analyzed in detail to explore potential explanatory factors. They are described in brief only.
3.19.1. Case Study 3: Iron Quadrangle Mineral Province, Brazil
The Iron Quadrangle in Brazil is the vast landscape encompassing all three of the Brazilian case studies as well as a mosaic of additional land uses. There have been some attempts at controlling development footprints with legal requirements for set-asides and compensation for the forest systems (Cerrado and Mata Atlantica), but these haven’t always been adhered to. It is only a third forested, mainly broadleaf deciduous closed forest. It ranks 17/29 in the Forest Health Index, with the main positive variable being the presence of core forest and the main negative variable being road density. Deforestation rates range from 1,000 to 6,000 hectares per year. Small amounts of deforestation occur in protected areas, but around 2,000 hectares per year are lost from valuable biome forest.
Figure 3.58 Iron Quadrangle AOI and Regional Deforestation, 2001–2014
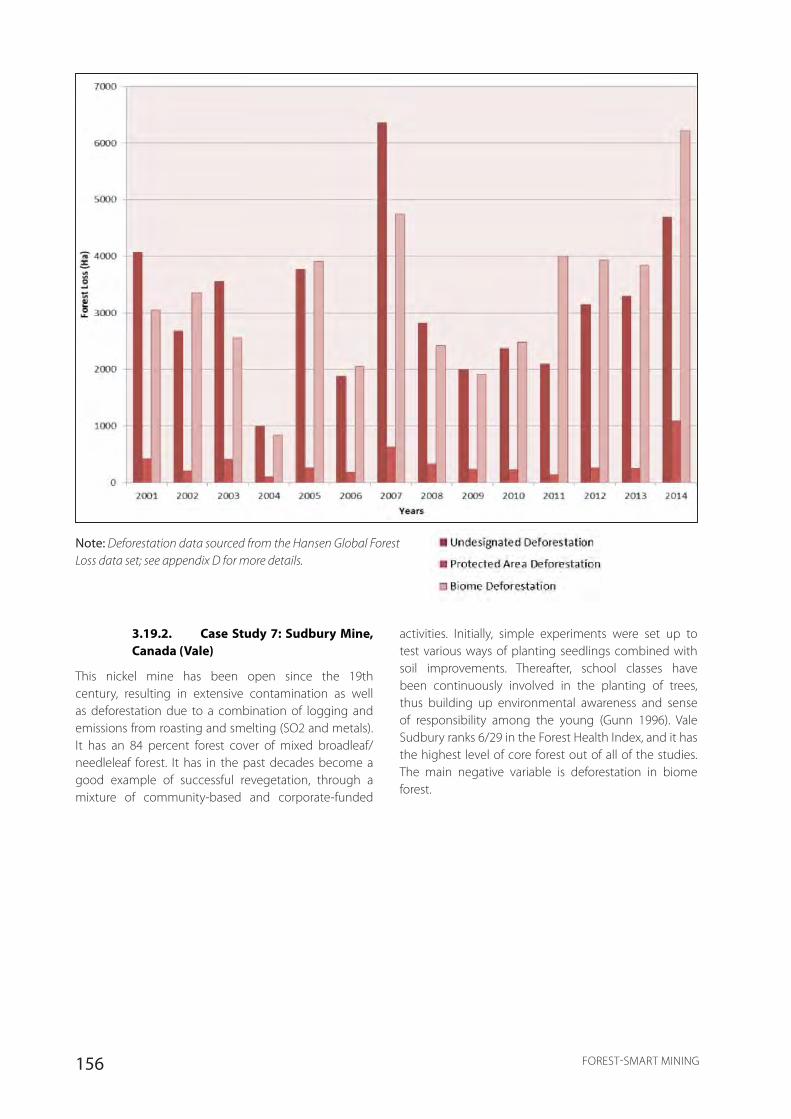
156 FOREST-SMART MINING
activities. Initially, simple experiments were set up to test various ways of planting seedlings combined with soil improvements. Thereafter, school classes have been continuously involved in the planting of trees, thus building up environmental awareness and sense of responsibility among the young (Gunn 1996). Vale Sudbury ranks 6/29 in the Forest Health Index, and it has the highest level of core forest out of all of the studies. The main negative variable is deforestation in biome forest.
Note: Deforestation data sourced from the Hansen Global Forest Loss data set; see appendix D for more details.
3.19.2. Case Study 7: Sudbury Mine, Canada (Vale)
This nickel mine has been open since the 19th century, resulting in extensive contamination as well as deforestation due to a combination of logging and emissions from roasting and smelting (SO2 and metals). It has an 84 percent forest cover of mixed broadleaf/needleleaf forest. It has in the past decades become a good example of successful revegetation, through a mixture of community-based and corporate-funded
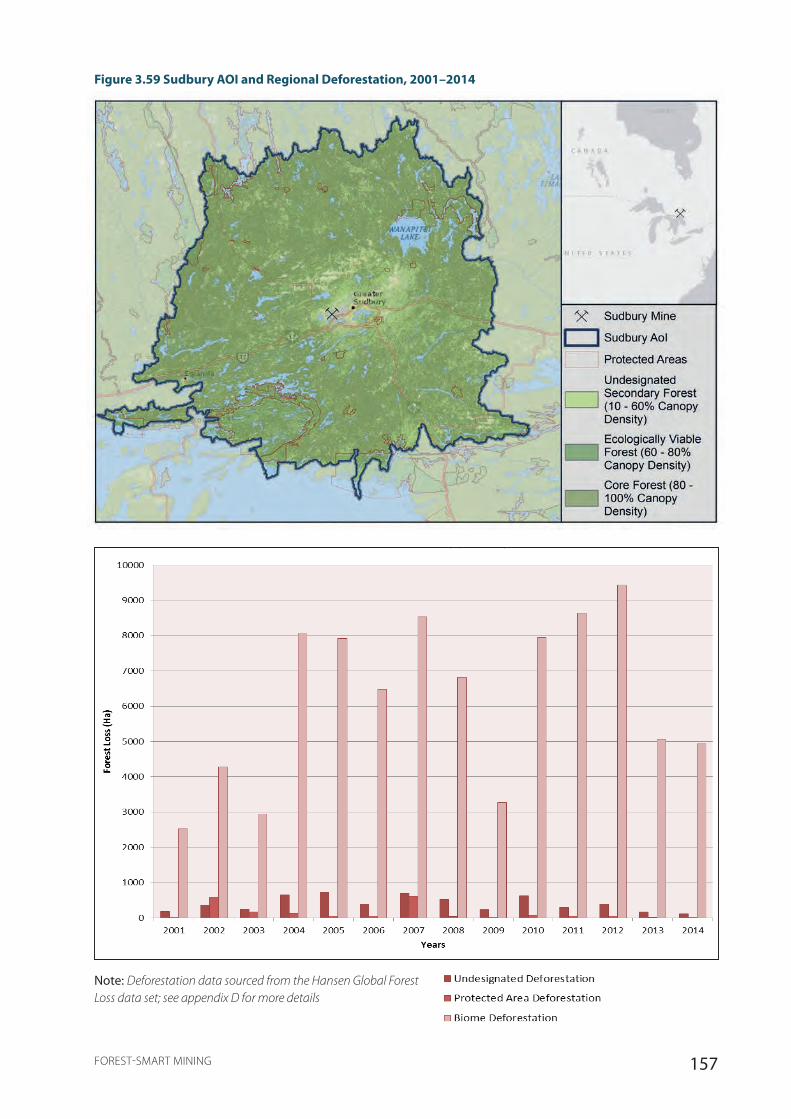
157FOREST-SMART MINING
Figure 3.59 Sudbury AOI and Regional Deforestation, 2001–2014
Note: Deforestation data sourced from the Hansen Global Forest Loss data set; see appendix D for more details.
Note: Deforestation data sourced from the Hansen Global Forest Loss data set; see appendix D for more details
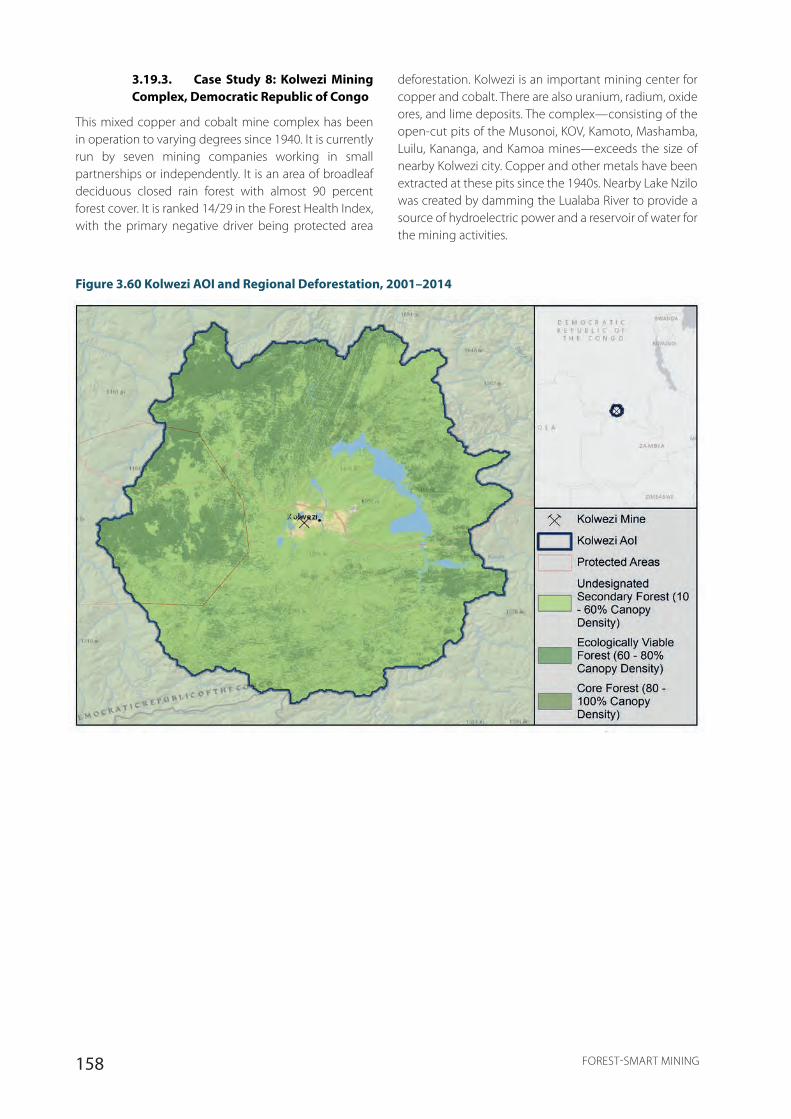
158 FOREST-SMART MINING
3.19.3. Case Study 8: Kolwezi Mining Complex, Democratic Republic of Congo
This mixed copper and cobalt mine complex has been in operation to varying degrees since 1940. It is currently run by seven mining companies working in small partnerships or independently. It is an area of broadleaf deciduous closed rain forest with almost 90 percent forest cover. It is ranked 14/29 in the Forest Health Index, with the primary negative driver being protected area
deforestation. Kolwezi is an important mining center for copper and cobalt. There are also uranium, radium, oxide ores, and lime deposits. The complex—consisting of the open-cut pits of the Musonoi, KOV, Kamoto, Mashamba, Luilu, Kananga, and Kamoa mines—exceeds the size of nearby Kolwezi city. Copper and other metals have been extracted at these pits since the 1940s. Nearby Lake Nzilo was created by damming the Lualaba River to provide a source of hydroelectric power and a reservoir of water for the mining activities.
Figure 3.60 Kolwezi AOI and Regional Deforestation, 2001–2014
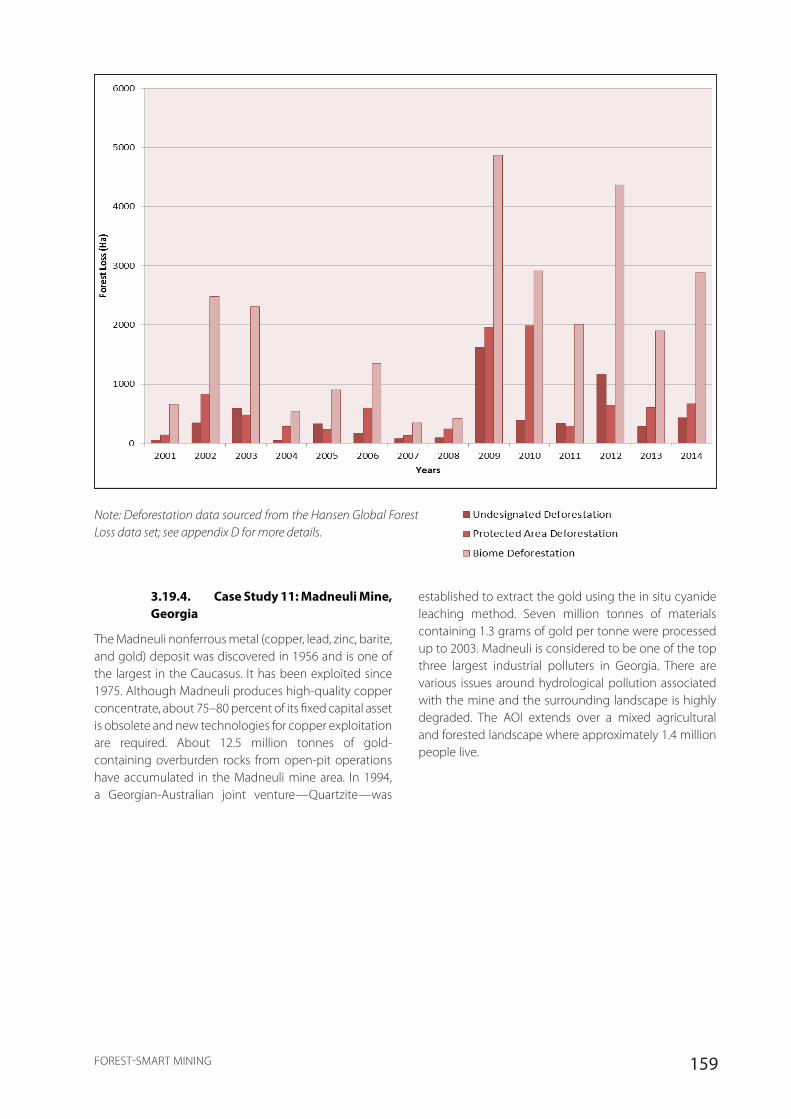
159FOREST-SMART MINING
Note: Deforestation data sourced from the Hansen Global Forest Loss data set; see appendix D for more details.
established to extract the gold using the in situ cyanide leaching method. Seven million tonnes of materials containing 1.3 grams of gold per tonne were processed up to 2003. Madneuli is considered to be one of the top three largest industrial polluters in Georgia. There are various issues around hydrological pollution associated with the mine and the surrounding landscape is highly degraded. The AOI extends over a mixed agricultural and forested landscape where approximately 1.4 million people live.
3.19.4. Case Study 11: Madneuli Mine, Georgia
The Madneuli nonferrous metal (copper, lead, zinc, barite, and gold) deposit was discovered in 1956 and is one of the largest in the Caucasus. It has been exploited since 1975. Although Madneuli produces high-quality copper concentrate, about 75–80 percent of its fixed capital asset is obsolete and new technologies for copper exploitation are required. About 12.5 million tonnes of gold-containing overburden rocks from open-pit operations have accumulated in the Madneuli mine area. In 1994, a Georgian-Australian joint venture—Quartzite—was
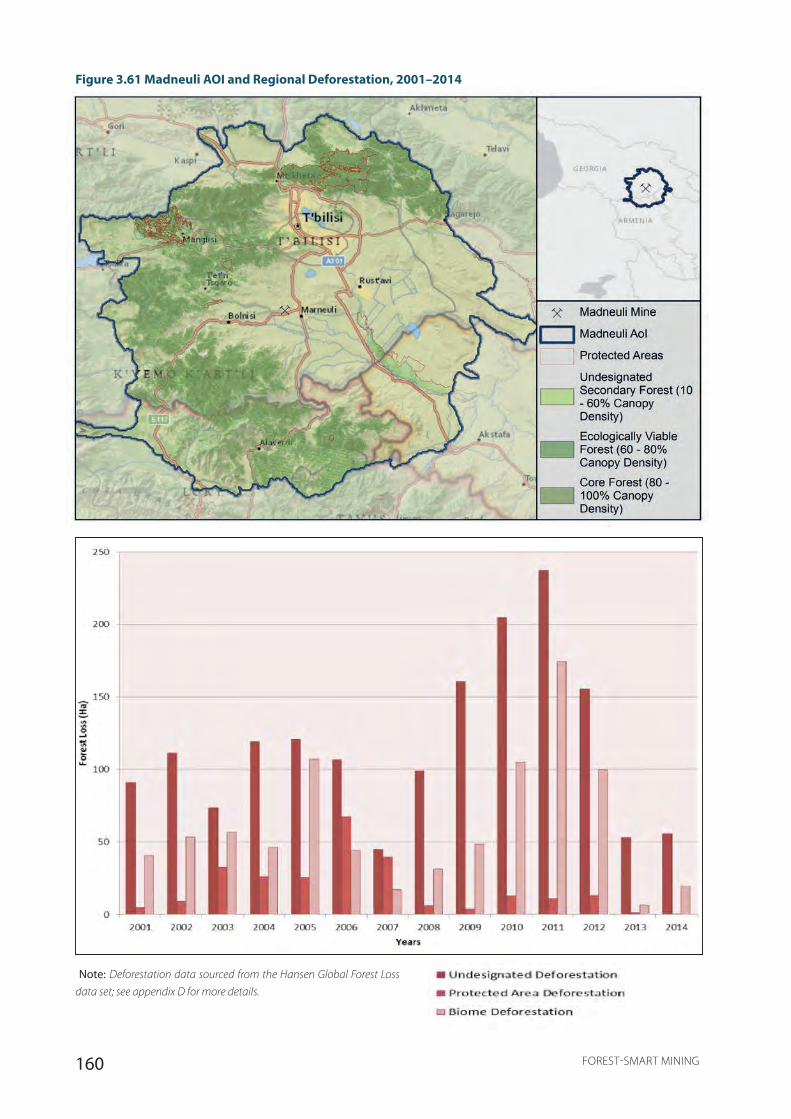
160 FOREST-SMART MINING
Figure 3.61 Madneuli AOI and Regional Deforestation, 2001–2014
Note: Deforestation data sourced from the Hansen Global Forest Loss
data set; see appendix D for more details.
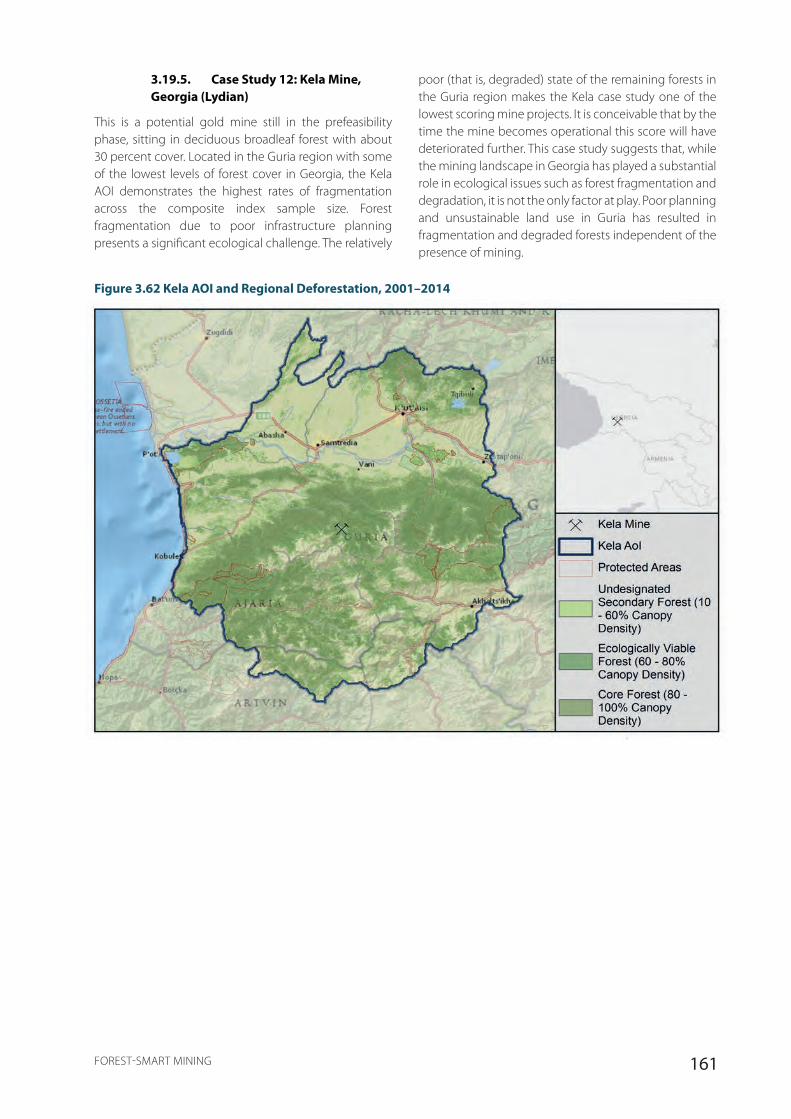
161FOREST-SMART MINING
3.19.5. Case Study 12: Kela Mine, Georgia (Lydian)
This is a potential gold mine still in the prefeasibility phase, sitting in deciduous broadleaf forest with about 30 percent cover. Located in the Guria region with some of the lowest levels of forest cover in Georgia, the Kela AOI demonstrates the highest rates of fragmentation across the composite index sample size. Forest fragmentation due to poor infrastructure planning presents a significant ecological challenge. The relatively
poor (that is, degraded) state of the remaining forests in the Guria region makes the Kela case study one of the lowest scoring mine projects. It is conceivable that by the time the mine becomes operational this score will have deteriorated further. This case study suggests that, while the mining landscape in Georgia has played a substantial role in ecological issues such as forest fragmentation and degradation, it is not the only factor at play. Poor planning and unsustainable land use in Guria has resulted in fragmentation and degraded forests independent of the presence of mining.
Figure 3.62 Kela AOI and Regional Deforestation, 2001–2014

162 FOREST-SMART MINING
3.19.6. Case Study 20: Nimba Range Mineral Province, Liberia/Guinea/Côte d’Ivoire
This key iron ore province spans Liberia, Guinea, and Côte d’Ivoire, including the case study mines at Nimba and Tokadeh. It has about 25 percent forest cover, primarily broadleaf evergreen rain forest. It ranks last (29/29) in the Forest Health Index, with the primary negative driver being road density. Some secondary forest and connectivity remains. The part of the massif located in Liberia has been greatly degraded by mining. Although dense forest still covered most of the East Nimba area in
1974, mining activities also stimulated the development of local and national road infrastructure, further impacting the habitat in the surrounding lowland. By 2014, forest cover had been greatly reduced in the Mount Nimba area. The East Nimba Nature Reserve had lost about half of its 1974 forest cover to encroachment by agriculture and settlements. The slopes of Mount Nimba had been deforested, causing soils and mineral waste to wash downhill and silt the rivers. The legacies of former mining activities, such as the carved terraces and the open-pit depression called the Blue Lake, are still visible on the land and altered the landscape of the mountain ridge.
Note: Deforestation data sourced from the Hansen Global Forest Loss
data set; see appendix D for more details.
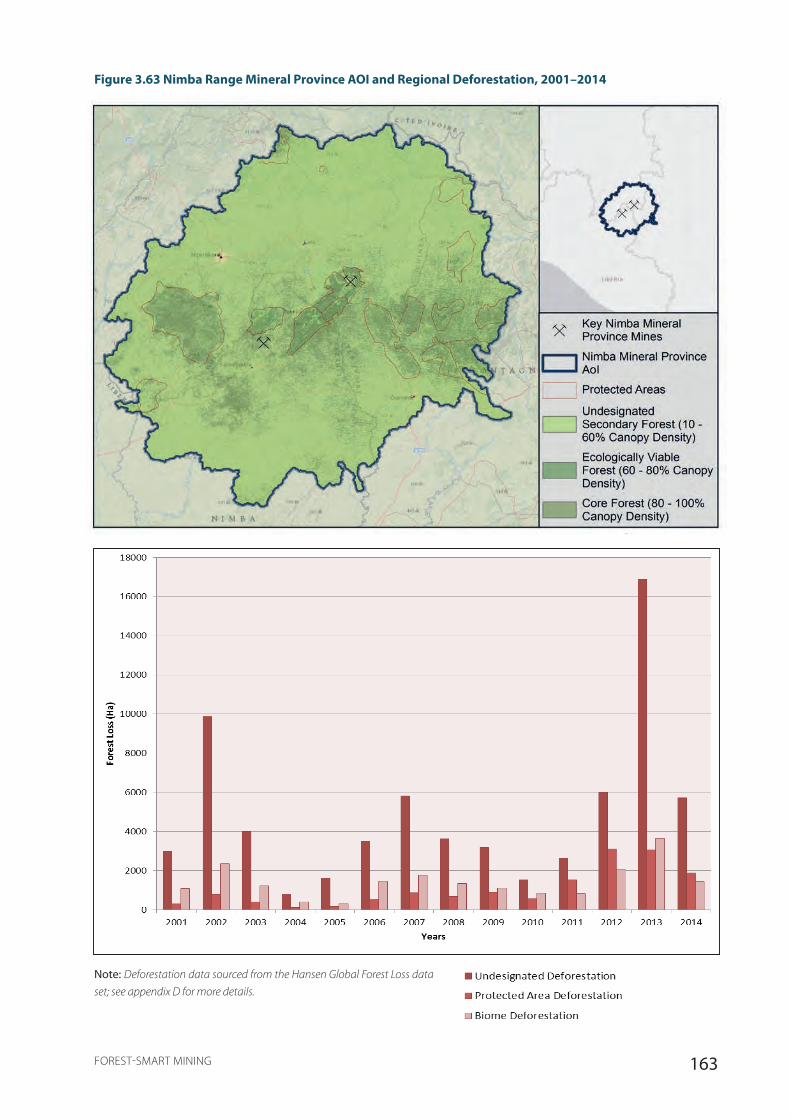
163FOREST-SMART MINING
Figure 3.63 Nimba Range Mineral Province AOI and Regional Deforestation, 2001–2014
Note: Deforestation data sourced from the Hansen Global Forest Loss data
set; see appendix D for more details.

164 FOREST-SMART MINING
3.19.7. Case Study 28: Kansanshi, Zambia (First Quantum Minerals)
The Kansanshi mine is the largest Zambian Copperbelt mine to date. Production of copper has risen from 70,000 tonnes per year in its first year of operation (2005) to an annual present-day rate of 340,000 tonnes per year. During 2013, FQM’s Kansanshi mine commenced the building of a copper smelter, planned to be the largest in the world, bringing further impacts to the area. Kansanshi mine reached full commercial production in April 2005, with direct impacts from construction correlating to
the forest loss in 2003–2004. Solwezi, the capital of North-Western Province, now has approximately 65,000 inhabitants with organic and unplanned growth of the town resulting is sprawling urbanization. It is notable that the boundaries of the mine lease area provide stark indication of the habitat characteristics prior to induced in-migration to the area. Very high forest cover, although mainly secondary with no intact forest. Mainly broadleaf deciduous rain forest. It ranks 28/29 in the Forest Health Index and has the highest levels of deforestation in protected areas of all the case studies.
Figure 3.64 Kansanshi AOI and Regional Deforestation, 2001–2014
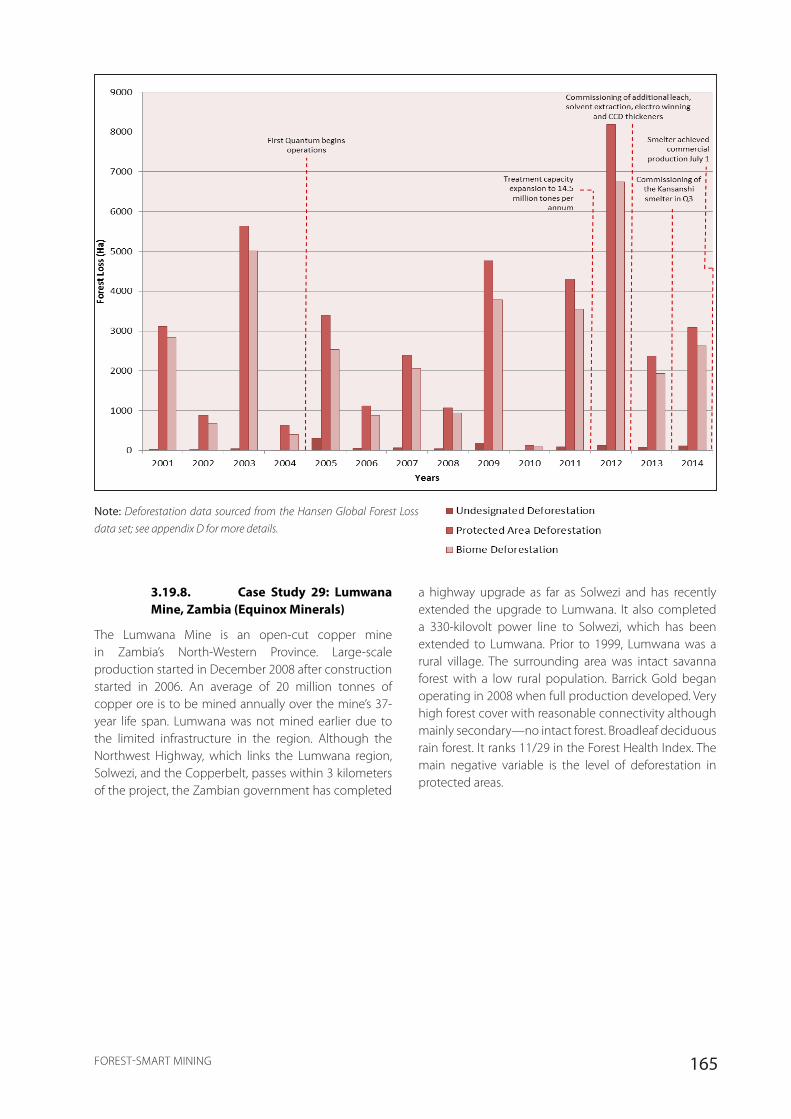
165FOREST-SMART MINING
Note: Deforestation data sourced from the Hansen Global Forest Loss
data set; see appendix D for more details.
a highway upgrade as far as Solwezi and has recently extended the upgrade to Lumwana. It also completed a 330-kilovolt power line to Solwezi, which has been extended to Lumwana. Prior to 1999, Lumwana was a rural village. The surrounding area was intact savanna forest with a low rural population. Barrick Gold began operating in 2008 when full production developed. Very high forest cover with reasonable connectivity although mainly secondary—no intact forest. Broadleaf deciduous rain forest. It ranks 11/29 in the Forest Health Index. The main negative variable is the level of deforestation in protected areas.
3.19.8. Case Study 29: Lumwana Mine, Zambia (Equinox Minerals)
The Lumwana Mine is an open-cut copper mine in Zambia’s North-Western Province. Large-scale production started in December 2008 after construction started in 2006. An average of 20 million tonnes of copper ore is to be mined annually over the mine’s 37-year life span. Lumwana was not mined earlier due to the limited infrastructure in the region. Although the Northwest Highway, which links the Lumwana region, Solwezi, and the Copperbelt, passes within 3 kilometers of the project, the Zambian government has completed
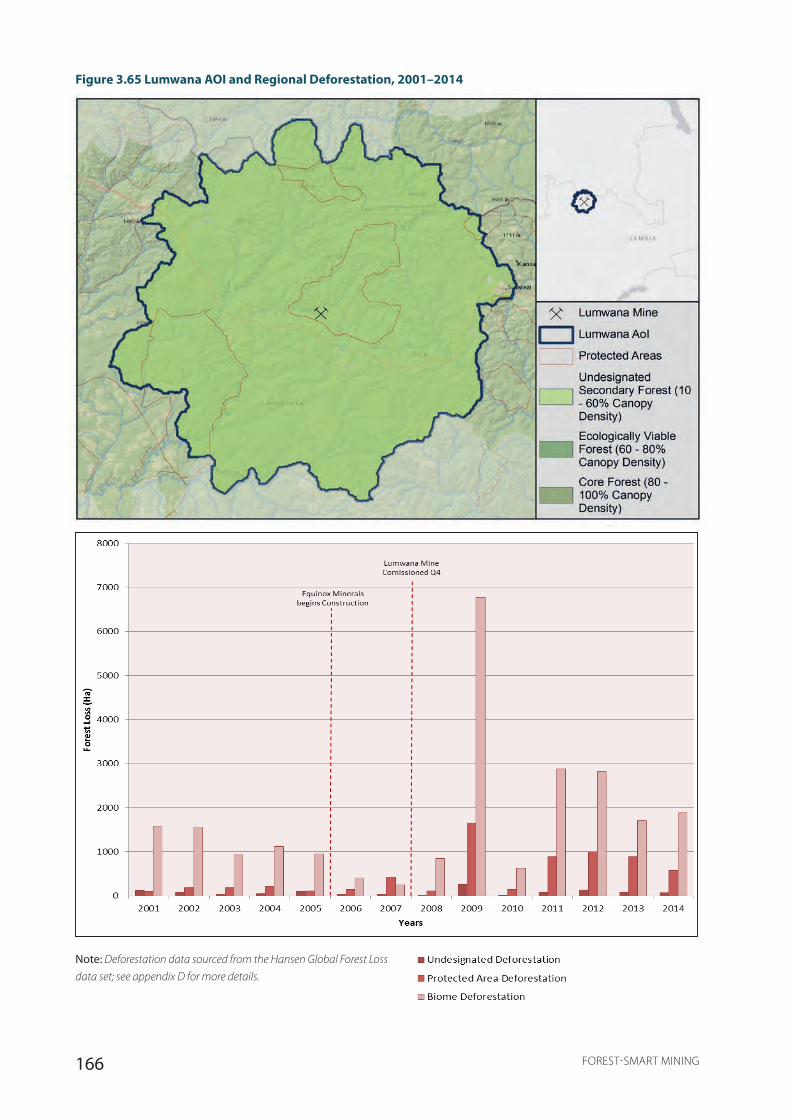
166 FOREST-SMART MINING
Figure 3.65 Lumwana AOI and Regional Deforestation, 2001–2014
Note: Deforestation data sourced from the Hansen Global Forest Loss
data set; see appendix D for more details.

167FOREST-SMART MINING
4. DISCUSSION AND CONCLUSION
fewer forest mines in total but are more reliant on forest mining, with over 60 percent of mines for each found in forest landscapes.
Estimating future trends in forest mining is limited by the lack of access to data on where economically viable deposits lie. However, past trends in forest mine opening dates show a rapid increase, particularly in the past 50 years, initially in the Americas but more recently in Asia and Sub-Saharan Africa. Given demand for commodities continues to rise, particularly in China, there is a strong expectation for the amount of forest mining to rise, and with forest cover continuing to decline, managing the impacts of such an increase must be a priority.
There is no clear example of a wholly forest-smart LSM operation.
The case studies demonstrate that large-scale mining does occur in forest landscapes where forest health is high. The projects in the top five ranked forest landscapes are Mertainen (LKAB, Sweden), Fruta del Norte (Lundin Gold, Ecuador), Merian (Newmont, Suriname), Grasberg (Freeport, Indonesia), and Sakatti (Anglo American, Finland). It is important to note that these rankings are only in relation to other studies in the project—they are not a global measure of forest health—but looking at the various variables by which they were measured, each of these forest areas does appear to have good forest cover with high levels of core, intact, and ecologically valuable forest.
However, describing any of these as a clear example of forest-smart mining would be difficult, with each coming with major caveats. To begin with, three mines are not yet operational: Mertainen was developed then mothballed; Fruta del Norte is in development and aims to start production in 2019; and Sakatti is still in the planning phase. It can be argued that the development of these mines has been forest smart to date, but until they are operational they cannot be complete examples to follow. Of the operational mines, it would also be particularly difficult to describe Grasberg as a good example of a forest-smart operation. The mine itself has one of the largest footprints of all the studies (over 10,000 hectares) and, while there are signs of some
4.1. Urgent Need to Improve Approaches to LSM in Forests
Forest mining is an economically significant sector that is set to expand in economically, socially, and environmentally sensitive areas.
Chapter 2 illustrates that mining in forests is already a significant occurrence, with more than 1,500 mostly open-pit mines in operation (representing nearly half of all mining) and a further 1,800 in development or currently nonoperational. Given evidence that mines can influence areas up to 50 kilometers away, this puts 10 percent of global forests under the potential influence of LSM, rising to 30 percent if all nonoperational or mines in development become active. Significant levels of forest mining occur in ecologically important areas. Direct overlap between forest mines and protected areas or KBAs is relatively small—just 7 percent of forest mines are inside protected areas, meaning less than 1 percent of protected areas have a large-scale mine in them. However, over half of all forest mines are within 50 kilometers of a KBA and nearly 80 percent lie within 50 kilometers of a protected area.
Geographically, most forest mines occur in Asia and Europe, over half are in low- or lower-middle-income countries, and three-quarters are in World Bank client countries. Countries considered priorities for forest mining attention (defined by having high forest cover, high economic reliance on mining, and a high density of forest mines) include Brazil, the Democratic Republic of Congo, Zambia, Ghana, and Zimbabwe. Countries where most forest mines overlap with protected areas or KBAs include Brazil and the Philippines, but countries with forest mines near protected areas were predominantly developed countries, including Finland, the United States, Australia, and Sweden.
More than half of all MFAs mine for either iron, gold, or copper. Of these commodities, gold holds particular interest since many gold mines occur in ecologically valuable biome forests. However, on a global basis, the iron, gold, and copper industries still rely more on non-forest mines than forest mines. The bauxite, titanium, and nickel industries, on the other hand, account for
168 FOREST-SMART MINING
positive corporate commitments, there are various issues around the transparency of exactly what the company is doing with regards to forest impacts. Furthermore, as one of the best-studied mine sites, it is known that the waste from Grasberg has caused vast areas of damage a long way downstream and even out to sea as well as huge social upheaval, attracting over 1.5 million people to a region with high political tensions—which has had huge impacts. The forests across the Grasberg AOI are in good condition compared to other sites, but this is more likely due to the inaccessible, mountainous terrain and the fact that key impacts are less visible to the analysis (for example, social impacts and riverine or marine environmental impacts). This leaves the fifth site: Merian, which is operating, appears to be managing potential social conflicts, and is run by a company with visible and ambitious corporate commitments (Newmont). Governance frameworks do not appear to be strong, but to a certain extent these have been voluntarily compensated for by good corporate practice. The key caveats on Merian are that it is operating in a new area in a country with an early-stage LSM strategy and low-capacity government and that it probably represents the first step in what is likely to be a major development of large-scale mining. Newmont already has plans for a new mine and potentially forest-damaging infrastructure (a major road); how these are developed will have major implications for the area. Merian could be described as being the closest mine to forest smart for now—the challenge will be to keep it forest smart as additional development occurs.
Direct impacts of mining on forests can be important at a local level, but they are probably less important at a global scale.
Chapter 1 outlines the differences between direct and indirect impacts of mining. The case studies that follow in chapter 3 illustrate that, despite the destructive appearance of an open-pit mine and the waste it generates, the direct impacts of most mines in terms of forest clearance are usually fairly small in comparison to the areas of deforestation occurring around them. Most pit sites analyzed were in the region of 2,000–3,000 hectares compared to deforestation levels in the wider landscape of several thousand hectares a year. Furthermore, most of the case studies support the global analysis referred to in chapter 2 that shows mining is rarely perceived to be the primary driver of deforestation in a landscape. No country case study reports mining as the primary driver of forest loss, and even at the scale of many of the case studies, other, more diffuse factors are identified as key drivers of forest loss, such as clearance for agriculture (for example, Ghana, Guinea, Indonesia, Madagascar), cattle rearing (Brazil), timber harvesting (Sweden and Finland), or charcoal (Madagascar).
However, while the aggregate impacts of mining footprints might be lower than other drivers of deforestation, averaging results can potentially obscure important local impacts. These are clearest when large-scale accidents occur, such as the Samarco and Marcopper tailings collapses that had major and immediate impacts on vast areas of forest and non-forest habitats and communities. But significant impacts also occur when projects operate without accident and within the realms of the law. In Zambia, for example, the Kalumbila mine’s size alone—a pit size of over 16,000 hectares and a total footprint of over a million hectares—means the mine has a far more significant impact in a landscape where background levels of deforestation are around 1,000 hectares a year. Disposal of mining waste can also have major local impacts. The Freeport-McMoRan Grasberg mine in Papua, Indonesia, has been calculated to have legally caused 138 square kilometers of forest loss so far, 96 percent of which was caused by waste disposal. The projected losses are calculated to be up to 230 square kilometers. While these are still fairly small figures on a global scale, such impacts can be particularly important when the impacted forests have specific values, such as centers of endemicity (such as seen in Madagascar, Papua, the Tokadeh and Boké sites, and Bunder), or they provide specific ecological functions for local communities.
Indirect impacts of mining on forests are important at both the local and global scales, but responsibilities for mitigation are unclear.
One important step of this study was to look at a wider area of interest around each mine site, which allowed some of the potential indirect impacts to be visible. The AOI calculations were based on published data on the distances mines can cause impacts combined with the geography of river basins, which can be a key determinant of impact zones. They represented areas over which a mine site was likely to be one of the factors driving negative impacts and/or the area of which the mine could be having a positive impact if so desired. These indirect impacts would include the impacts of displacement (with communities moving into forested areas—for example, Ahafo), the impacts of population influx (either through people moving into forest areas, or clearing them for agriculture to provide food to feed increased demand—for example, Grasberg), the impacts of increased accessibility to forest (such as via new mine roads or rail—for example, Kalumbila), the impacts of price rises (potentially resulting in those not associated with the mine to turn to forests for income—for example, Batu Hijau), or the impacts of new markets for forest products (such as bushmeat—for example, Tokadeh). The case studies show that, when looked at on a landscape scale, many forest mine sites are surrounded by large-scale forest losses. In many cases (such as Ahafo,
169FOREST-SMART MINING
Akyem, Boké, Nimba, Bunder, Ambatovy, QMM, Merian, and Kalumbila), there did appear to be notable spikes in deforestation around the time the mines were being developed. These spikes involved levels of deforestation far higher than those associated with direct impacts (see above) and support the theory that secondary impacts have far greater impacts than direct impacts.
Attaching responsibility to indirect impacts is likely to be extremely difficult. If a mine displaces a group of people and they decide to move in to a forest reserve, responsibility for the forest impact arguably remains largely with the company and only partially with the authorities managing the reserve. If those displaced in turn displace others who move in to a reserve, responsibility becomes less clear. If a worker moves to the area to work in the mine, responsibility for their impacts is predominantly with the company. Responsibility for speculative migration becomes less clear, and even less clear for families associated with speculative migrants or people who clear forest to grow crops to feed incoming people. Responsibility for people using a private mining road to access new forest areas lies with the company. Responsibility for people using public roads built in response to company requirements is less clear. In almost all cases, multiple actors share responsibility. The risk is that, as a result, nobody takes responsibility for the impacts.
The study was not in a position to tease out which impacts were specifically attributable to mine company decision making or activity, or where responsibility for addressing impacts lay, but it does highlight that achieving forest-smart mining will require some action to address secondary impacts. Replanting tens of hectares within a mine footprint while thousands of hectares continue to disappear outside the footprint, in part in response to the mine’s presence, cannot constitute forest smartness. This also has important implications for global assessments of the impact of mining on deforestation. Previous studies assessing the impacts of mining have focused largely on direct impacts visible on satellite imagery. Since indirect impacts are much harder to incorporate into such analysis, it is feasible that mining is having a much greater impact on forests than current analysis suggests.
Environmental impacts in forests lead to significant social impacts on forest-dependent communities.
Environmental and social impact assessments are good at identifying the various ways mine activities may impact, positively or negatively, the environment or local communities. However, they rarely consider how environmental impacts also affect local communities. Particularly in lower income areas, local reliance on ecosystem services from forests can be high. This was
seen in several of the case studies: sites in Brazil, Ecuador, Ghana, Guinea, Liberia, Suriname, and Zambia all have evidence of local people relying on fuel, timber, charcoal, bushmeat, medicinal plants, or other services from forests. However, with the exception of Newmont’s Ahafo mine in Ghana, there is little evidence of any company conducting an assessment of which ecosystem services are important and how mine activities might be managed to avoid impacting them. The Ahafo study highlights how such relationships might be missed by environmental teams focusing on forest area or endangered species as measures of impact, demonstrating, for example, the local reliance on local bushmeat sources, fuel, and other forest products, including from forest reserves. These then highlight potential clashes with well-meaning actions by the mine, such as a plan to source local timber for a biofuel generator to reduce greenhouse gas emissions. Similar issues were raised in the Boké Mining Complex, where local people had strongly established forest-based cultural norms and traditional governance systems that not all the area mines were necessarily incorporating into management plans.
There is also increasing evidence that forests have a significant influence on local climatic conditions, including rainfall. This is an association frequently recognized by people on the ground—for example, it was mentioned repeatedly during the Akyem study—but science is only just starting to demonstrate it to be true. Where forest losses, caused directly or indirectly by a mining project, cause declines in rainfall, there are likely to be significant impacts on subsistence.
However, the requirements of local communities do not always lead to forest-smart outcomes in terms of biodiversity. In many examples—such as in Ghana—local communities supported the mines to reforest cleared areas with fast-growing, non-native species, prioritizing the tangible timber services such areas were able to generate over the wider set of services a natural forest may be able to generate. Many of these decisions were likely related to the lack of tenure in such forests, which may reduce perceived values of less tangible services (see below).
4.2. Companies Implement Some Forest-Smart Policies but Fail to Address Key Areas
Relevant corporate policies vary widely, yet there is no clear relationship with forest health.
The case studies present a wide range of corporate commitments relevant to forest impacts. For example, Newmont’s commitment to no net loss, Anglo American’s commitments to landscape-level
170 FOREST-SMART MINING
coordination, and Alcoa’s commitment to rehabilitation are all industry-leading commitments. Other companies show best practice in other areas. Many have significant investments in foundations—for example, Quantum with its Trident Foundation—many of which are clearly doing good work relevant to forests and forest communities. Others invest in other forms of compensatory activities, such as Vale’s investment into protected areas in Brazil. However, there is no clear set of criteria against which commitments are made. Membership in organizations such as ICMM, which provides a set of shared principles, gives some structure, but in general the companies tend to have widely varying approaches to corporate commitments. Comparisons across companies are also hindered by transparency and data availability. Some companies, such as RUSAL or Freeport-McMoRan, provide very little information online to be able to judge their commitments at all. Reporting on performance toward commitments is particularly patchy. Freeport’s key measures of progress are compliance with the law, avoidance of major incidents, and avoidance of major fines. How permanent such commitments are is another question, as highlighted by Rio Tinto’s retractions from previous commitments on biodiversity. Furthermore, as one African government official commented, there is often more than one side to a company, with the language of those responsible for sustainability and public affairs not always matched by the approaches of those dealing with the regulators.
However, no clear relationship exists between companies’ corporate commitments and the forest impacts on the ground. LKAB (Mertainen) and Freeport (Grasberg), for example, operate in some of the healthiest forest areas. Both companies have some ostensibly forest-smart corporate commitments—LKAB is incorporating local community needs and exploring a new offsetting approach; Freeport has committed to ICMM principles and is setting up a biodiversity database—but neither is a clear example of best practice, with LKAB apparently needlessly clearing an area of ancient forest and Freeport’s latest audit pointing out they still did not even have a strategic plan for biodiversity management. Similarly, Ambatovy and Ahafo (Newmont) are two mines in particularly low forest health regions, despite both having a range of strong environmental commitments to net gain or no further loss, adherence to IFC PS6, and, in Newmont’s case, an industry-leading position on the Dow Jones Sustainability Index. This strongly suggests that corporate commitments and performance currently have minimal impact at a landscape scale, probably because such commitments focus largely on direct, footprint impacts (see below) that, as discussed, likely represent a subset of total mine impacts.
Examples of forest-smart approaches to managing direct impacts exist, but there is room for improvement.
There are various examples of good practice by companies working to address their direct impacts on forests, with the clearest examples generally applying the mitigation hierarchy across the life cycle of the mine. Avoidance is the first step in the mitigation hierarchy, and it is always going to be challenging for a mine since the choice of where to mine is largely defined by geology. Nevertheless, it is also the most important step in the mitigation hierarchy and often the most cost-effective response to impacts when compared to rehabilitation and offsetting if it is considered at the appropriate stage of project planning. Blanket no-go commitments are what many in the conservation community would like to see for the preproduction phase, as illustrated by the 2016 IUCN motion in which 94 percent of members voted in favor of a motion calling for businesses to treat protected areas as no-go areas (see Table B.2). The (still-under-development) IRMA mining standard also calls for no activity in protected areas. But in reality, few have committed to no go. ICMM members and members of several standards (such as ASI or the RJC) are bound by a commitment not to explore or mine in World Heritage sites. But commitments to protected areas are restricted to “respect” rather than no go. Nevertheless, some of the case studies demonstrate that avoidance is a viable step. Anglo American’s Sakatti mine in Finland is one preproduction example, carrying out rigorous feasibility analysis, EIAs, and stakeholder consultation at the exploratory stage. The mine is not without controversy as various groups oppose the plans, but by going through these steps carefully at the exploratory stage and changing decisions based on the outcomes, the project is setting a good example of how to begin the process of large-scale mining. At Ambatovy and QMM, approximately 15 percent and 9 percent of the ore bodies, respectively, have been avoided and designated as set-asides. Similarly, ArcelorMittal (Tokadeh) and Alcoa (Jarrahdale) have deposits lying under rare or sensitive vegetation types that were reportedly avoided, and at Boké, mine haul routes were changed to avoid sensitive habitats. The Fruta del Norte mine avoids impact by operating underground rather than as an open pit.
Minimization of impacts is also demonstrated at various projects. Most well-run projects have various systems for minimizing polluting waste, and several have specific activities to minimize impacts on forests—for example, at Ambatovy minimization of the footprint was achieved through paced directional clearing and salvage protocols, while at Akyem vegetation has been left within the footprint wherever possible. However,
171FOREST-SMART MINING
the case studies also show examples of projects where minimization of impacts does not appear to have been applied, such as at Kalumbila, where the mine footprint covers over a million hectares.
Restoration and rehabilitation is a key activity for many of the projects studied. Some of the best examples of practice can be found in Australia, where restoration programs have now been in place over several decades. These illustrate not only what can be achieved over time but also the limitations that remain even when time, resources, and capacity are available. For example, the restoration operations by Alcoa and Rio Tinto at Jarrahdale and Weipa have been running for 22 and 23 years, respectively, and are often held up as examples of success, but both operations have also been criticized for the differences that remain with the original habitats destroyed. Alcoa’s operations in the jarrah forest in conjunction with Australian academics are often held up as the gold standard for rehabilitation and the result of years of experimentation and major investment to maximize success. But even there, ecologists struggle to return more than 90 percent of the baseline. Vale also has invested heavily in restoration; their Improvement of Degraded Areas Recovery program is being applied across their sites to identify where restoration is and isn’t working. In Madagascar, both Ambatovy and QMM have extensive rehabilitation and restoration programs supported by research and trials, although both have some way to go to meet their targets. A key feature of success for many of these projects seems to be the involvement of local communities. In sites such as Akyem, it is clear that involving local people, who both are employed to manage the sites and have a right to a proportion of the timber and other products produced, is proving successful as it means they actively support and protect the work. In contrast, at QMM the failure to fully engage the community was identified as the reason why one of the forest restoration projects failed—because the trees were not maintained. A further factor commonly associated with restoration and rehabilitation is the use of non-native species. At Akyem, for example, Newmont only plants 50 percent native species—yet this is higher than most and above the legal requirement. Sometimes this is because such species have the biological characteristics required to bind soil as quickly as possible, or to provide shade for slower-growing native species, and sometimes they will be species actively demanded by local communities for rapid provision of timber or other products. However, given the wider importance of forests in ecological function and stability, there are concerns that reliance on non-native species for restoration and rehabilitation will not replace the original values lost.
The line between compensatory and offsetting activities, the last steps of the mitigation hierarchy, is often a little hazy. Good examples of pure offsetting—where actions are determined by careful calculations of the exact impacts caused to match the calculated residual impact—are few and far between. Most examples are of compensatory activities, where a positive action is taken to “balance out” a negative impact elsewhere but without being able to say quantifiably whether the response is equivalent to the impact or not. For example, efforts taken to support forest reserves around Tokadeh are meant to be part of an offset commitment to no net loss, but without calculations to justify the investments against the impacts caused by the mine, they have to be treated as compensation. Another example is the work of the Trident Foundation at Kalumbila, which supports the management of 110,000 square kilometers of forest reserves but without acknowledging any formal connection to their mine’s impacts—indeed, it appears the project does not even apply the mitigation hierarchy. Where formal offsets are being applied to meet no net loss commitments, many projects are struggling to succeed. At Akyem, Newmont committed to no net loss as part of its mining license and thus has to offset just 80 habitat hectares. The company sought the support of various institutions and was cited as a BBOP pilot study and followed recommended practice, yet almost a decade later there is still no offset in place due to the company’s inability to secure land. Ironically, each potential offset site they have identified has subsequently been allocated to mining. Other high-profile attempts to implement offsets are seen at Ambatovy and QMM in Madagascar. At Ambatovy, there has been some success with in-house managed sites, but other offsets hit problems when management was outsourced to NGOs or when they were found to be bio-disimilar to the areas being offset. Government support lies at the root of many of the offsetting challenges (see below), but even in countries where governance is strong, offsetting can be difficult. At Mertainen, in Sweden, for example, the company’s offsetting commitments were challenged when it was realized the old-growth forest cleared did not have an ecological equivalent that could be offset.
Finally, mine closure is a key stage of the mine life cycle for determining overall impacts. Development of a mine closure plan is generally a core component of any EIA and mining license and most of the case studies have clear closure plans in place on paper, including putting funds in escrow. While none of the case studies are of mines that had formally closed, mine closure is an area where many issues arise. First, insufficient funds are set aside to meet future liabilities. While there is no evidence this has happened in any of the cases studies, equally there is no evidence that adequate provisions for funds are in place.
172 FOREST-SMART MINING
Examples include sites such as Grasberg, where $100 million has been set aside, and Akyem, where around $15 million has been placed into escrow under joint control with the government, but in both cases neither amount represents the full amount required, with both sites requiring around $200 million. Second, many companies exit from a project before the closure liabilities have been met. At Batu Hijau, in Indonesia, for example, Newmont had established their flagship operation in terms of managing social and environmental impacts, including budgeting for closure, but when legislation changes led to divestment of foreign control, Newmont sold the site to an Indonesian company in 2017. The closure liabilities transfer to the new owners, but they do not have the same public commitments or pressure to deliver on them. In fact, initial activities suggest corners are already being cut on environmental obligations. The issue that links both of these problems is that, in the words of a Ghanaian government representative interviewed for this work, “mines never really close.” A mine may reach the end of its economic life for one company, but invariably it passes to another actor who feels they can obtain further value from the mine, possibly through new technology or approaches but also potentially by applying different standards.
Very few examples exist of forest-smart approaches to managing secondary and cumulative impacts.
While there are some good examples of mines using the mitigation hierarchy to address direct impacts, there are very few examples of mines successfully addressing indirect and cumulative impacts. One of the clearest examples of how such impacts typically “fall through the net” is seen at Akyem in Ghana, where indirect impacts were comprehensively identified in a specific section of the EIS chapter identifying potential impacts but then not mentioned at all in the following chapter that listed the various mitigating responses, since they were not considered part of the company’s remit. However, when raising this with the government regulatory body, the same issues were recognized as occurring but considered to be outside the remit of the regulatory body, either to mandate the company address them or to address them directly. As a consequence, indirect and cumulative impacts are falling between the cracks of responsibility.
One of the best examples of cumulative impacts can be seen in the case study at Mount Tapian, where there was plenty of evidence of cumulative impacts but no action taken until it was too late, leading to a major accident. The mineral landscapes at Nimba and the Iron Quadrangle in Brazil are clear candidates for cumulative impacts, too, yet very little appears to be being done to monitor this. The Boké Mining Complex is another example of multiple
actors in the same landscape with clear potential for cumulative impacts and an urgent need for some level of coordination, given that some companies present in the landscape are implementing strong risk reduction measures through the IFC Performance Standards or similar while others struggle to demonstrate any equivalent level of effort. Leveling the playing field in such situations is an important requirement for addressing cumulative impacts.
One of the most significant secondary impacts is likely to be the influx of people. This occurred in almost all mine sites for which data were available except for those with the strongest economies and employing the most modern, low-labor machinery (for example, Mertainen, Sweden). The largest example is Grasberg, where reportedly 1.5 million people have moved in to the area since 1970, diluting the local representation from close to 100 percent to less than 50 percent, causing major social upheaval in an area where political tensions and violence were already high. Many of the in-migrants were reported to be artisanal miners, who will have further contributed to riverine pollution issues, although unusually for sites with major population increases there was not such an impact on forest health around Grasberg; however, this is likely due to a combination of the mountainous terrain and the parallel social conflicts. A major population influx is also occurring in Zambia’s Copperbelt mining area. In Ghana, the area around Ahafo saw a massive population influx following establishment, with many people specifically moving to the area before construction began to clear land and plant crops to become eligible for compensation payments; this was likely one of the key drivers of low forest health in this region. However, influence of the existing population can also be key. The Akyem mine was established in a landscape that had a very high rural population density from the start, low change that was clearly exerting a heavy pressure on forest resources. Taking into account existing stressors on the landscape prior to operationalizing a mine may be prudent as the mine’s operation could exacerbate situations or encourage negative behavioral patterns if not done in a way that promotes sustainable forest management.
Road building and other infrastructure, particularly linear infrastructure, is probably the second-biggest indirect impact, with new access routes into forests often leading to increased forest impacts from people using the routes for access. In Nimba, Minas Gerais, and Batu Hijau, high road density is identified as one of the key drivers of a lower forest health score. However, road density is not always associated with a lower forest health score. In higher-income countries, such as Finland and Sweden, road density and forest health is high, indicating that the
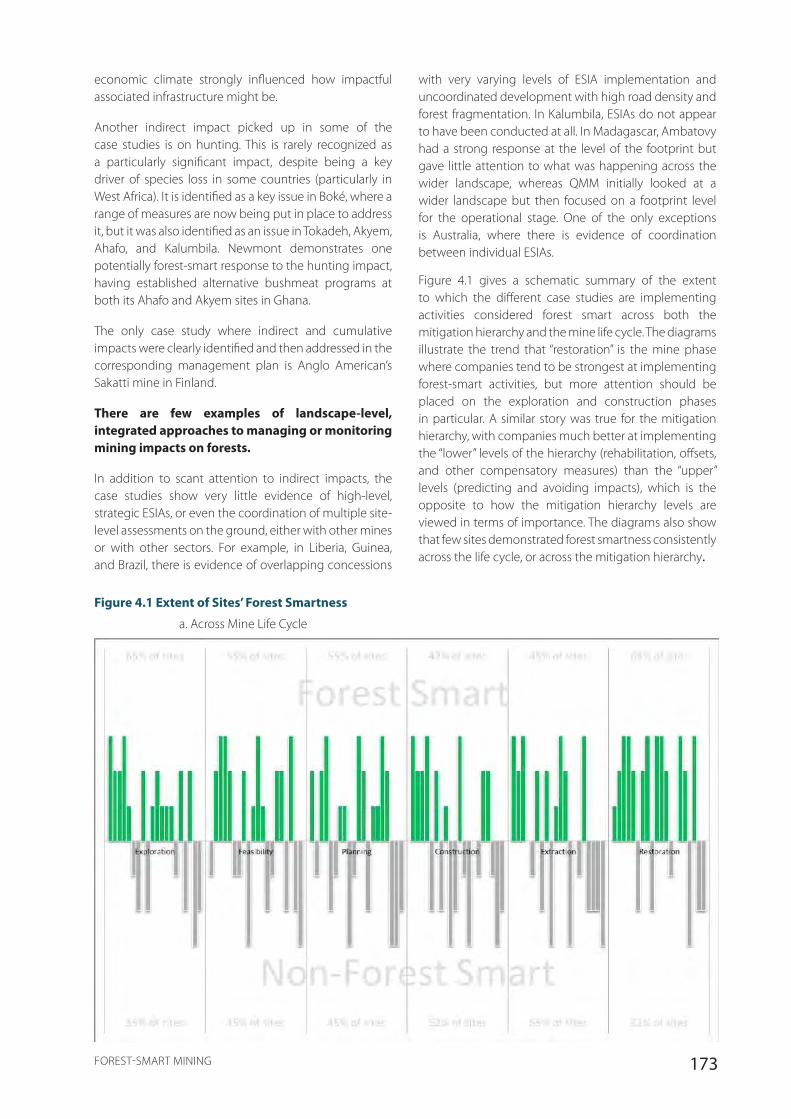
173FOREST-SMART MINING
economic climate strongly influenced how impactful associated infrastructure might be.
Another indirect impact picked up in some of the case studies is on hunting. This is rarely recognized as a particularly significant impact, despite being a key driver of species loss in some countries (particularly in West Africa). It is identified as a key issue in Boké, where a range of measures are now being put in place to address it, but it was also identified as an issue in Tokadeh, Akyem, Ahafo, and Kalumbila. Newmont demonstrates one potentially forest-smart response to the hunting impact, having established alternative bushmeat programs at both its Ahafo and Akyem sites in Ghana.
The only case study where indirect and cumulative impacts were clearly identified and then addressed in the corresponding management plan is Anglo American’s Sakatti mine in Finland.
There are few examples of landscape-level, integrated approaches to managing or monitoring mining impacts on forests.
In addition to scant attention to indirect impacts, the case studies show very little evidence of high-level, strategic ESIAs, or even the coordination of multiple site-level assessments on the ground, either with other mines or with other sectors. For example, in Liberia, Guinea, and Brazil, there is evidence of overlapping concessions
with very varying levels of ESIA implementation and uncoordinated development with high road density and forest fragmentation. In Kalumbila, ESIAs do not appear to have been conducted at all. In Madagascar, Ambatovy had a strong response at the level of the footprint but gave little attention to what was happening across the wider landscape, whereas QMM initially looked at a wider landscape but then focused on a footprint level for the operational stage. One of the only exceptions is Australia, where there is evidence of coordination between individual ESIAs.
Figure 4.1 gives a schematic summary of the extent to which the different case studies are implementing activities considered forest smart across both the mitigation hierarchy and the mine life cycle. The diagrams illustrate the trend that “restoration” is the mine phase where companies tend to be strongest at implementing forest-smart activities, but more attention should be placed on the exploration and construction phases in particular. A similar story was true for the mitigation hierarchy, with companies much better at implementing the “lower” levels of the hierarchy (rehabilitation, offsets, and other compensatory measures) than the “upper” levels (predicting and avoiding impacts), which is the opposite to how the mitigation hierarchy levels are viewed in terms of importance. The diagrams also show that few sites demonstrated forest smartness consistently across the life cycle, or across the mitigation hierarchy.
Figure 4.1 Extent of Sites’ Forest Smartness
a. Across Mine Life Cycle

174 FOREST-SMART MINING
b. Across Mitigation Hierarchy
Note: Each site was subjectively rated from -3 to +3 by the authors.
4.3. Government Oversight Has a Key Role in Promoting Forest-Smart Approaches
Government capacity and resources have a major influence on forest-smart approaches.
One of the clearest results of the company analysis is that strong corporate policy on environmental and social impacts does not necessarily lead to healthy forest landscapes due to the biggest impacts being indirect, diffuse, and difficult to attribute across the landscape. Good governance of mining and forest landscapes is therefore essential for forest-smart outcomes. This is perhaps most clearly shown by case studies where governance is strong; in Sweden, Finland, and, to a certain extent, Australia, the governance frameworks under which mining happens in forests are clear, strong, and enforced. The stable legislative environment allows companies to plan for the long term, confident they will still be there and held accountable for their actions, and specific laws can promote the implementation of certain activities. For example, in Australia, the long-term licenses against a stable policy environment means companies such as Alcoa invest substantially in environmental and social impacts to ensure they also have the social license to fulfill the licenses, while the offset laws of individual
states mean that Australia is one of the few places where offsetting is a feasible forest-smart activity. As a result, even when mining companies are not exemplary in their behavior (LKAB’s Mertainen project demonstrates some good intentions but is far from the best example of forest-smart corporate policy), their impacts in well-governed forest landscapes can be relatively minor.
In contrast, in countries were governance is weak, with issues such as corruption or lack of transparency, such as Liberia, Madagascar, or Zambia, forest impacts from mining tend to be much larger. This can lead to failure to negotiate favorable contracts for local stakeholders, failure to introduce or enforce rules around conducting and coordinating ESIAs, failure to monitor performance, and failure to react when problems occur. In some countries, instability is a key issue. In Indonesia, Guinea, and Madagascar, investment in mining has been disrupted due to lack of clarity on mining governance law changes (although it should be noted that what is “good” for mining investment is not always “good” for forest-smart outcomes—for some companies, a failure to enforce environmental laws can be seen as a favorable thing). This can be particularly important when companies are powerful, resulting in an imbalance of power. In Ecuador, Guinea, and Indonesia, for example, the economic power of the mining companies can be
175FOREST-SMART MINING
huge. Freeport is Indonesia’s largest individual taxpayer and the main contributor to the province of Papua’s GDP. Areas of weak governance do not necessarily have poor legislative frameworks; the Philippines, Madagascar, and Indonesia all have fairly strong frameworks in theory. In Indonesia, companies theoretically are responsible for all forests in their license area, or even mandated to take on additional forest concession management to compensate for forest impacts. But if they are not enforced, the effect is the same. Cases like Sakatti and Bunder, on the other hand, show how governments can have a strong influence on project direction when they enforce the law.
Weak governance can not only lead to a failure to hold companies to account for their behavior; it can also result in a failure to protect forest assets from mining impacts. In particular, governance is essential for protected areas. Governance varies widely across the case studies. In countries like Ghana, protection of national parks appears strong and enforced, but protection of forest reserves has been weak, with the law being adjusted to allow mining in reserves. Similarly in Indonesia, protection of some areas is strong, but protection of “protection forests” is weak, with specific exemptions given to mining. In other countries—Guinea and Zambia, for example—governance of protected areas is weak across the board. This is one area where companies demonstrate how the private sector could support local governance voluntarily, with Vale in Brazil taking responsibility for 20 percent of protected areas in its area of interest and First Quantum Minerals in Zambia working with the Environmental Management Agency on improving protected area management outside the mining area.
Poor coordination between relevant government departments inhibits forest-smart approaches.
One of the most common factors undermining governance in the case studies is the lack of coordination between government departments responsible for minerals and forests. In most cases, responsibility sits with different ministries, and in general the department with responsibility for mining is significantly better resourced and influential. For example, in Brazil the new Forest Code is in danger of being undermined by the new Mining Code, and in Indonesia the widely touted moratorium on forest clearance was trumped by a separate ruling on mining in protection forests. Even when departments are in the same ministry, such as in Ghana where the Ministry of Natural Resources includes departments for mining and for forests, evidence shows that the mining department has significantly more power than its forests-focused counterpart. The key issue here appears to be perceived economic value. Perceived
economic value of mining is almost always higher than the perceived value of any forest. As one representative of an African mining department responded during a case study, the value of forests is now recognized, but mining simply involves temporarily lifting up this value to access the resources below it before replacing it again a few years later. As he put it, “some people worry about the butterflies and things but in general everyone is happy.”
Lack of coordination is not only restricted to mining and forests either. Clarity over land tenure and concession rights is a major issue in many countries, with many overlapping concessions and conflicting rulings. This is particularly true in Liberia and Indonesia. Both governments are taking steps to address these issues—Liberia with its National Concession Portal and Indonesia with its OneMap initiative—although progress in Indonesia appears to have faded in recent months. Coordination in Indonesia also used to be complicated by the existence of separate ministries for mining, forests, and the environment and yet another body for coordinating REDD, although recent consolidation has now addressed this to some degree.
4.4. Empowered Civil Society Stakeholders Can Promote Forest-Smart Approaches
Lack of tenure rights for local communities can undermine forest-smart approaches.
Local communities not only represent the most exposed stakeholder to the impacts of forest mining; they also represent a potentially important influence on forest-smart outcomes. When communities have a stake in the future of forests they rely on, they generally have established sustainable systems of governance and management. Often these are completely unrecognized by national governments. The disruption of these systems—for example, when national tenure systems do not recognize customary rights or because of influxes of people to mining or other projects—can have significant impacts on forest protection and management. In many countries, forests are largely state controlled (for example, Ghana, Indonesia, Madagascar, and Suriname). This can undermine incentives for local conservation of forests, with the local population favoring short-term benefits given the lack of security for the future. In some countries, such as Ecuador and to a certain extent Guinea, protection of indigenous rights is a prominent feature of national law. In others, reforms are going through to increase community control over forests—for example, through Brazil’s Forest Code changes, Ghana’s community resource management schemes,
176 FOREST-SMART MINING
community-based approaches in the Philippines, and Indonesia’s community forestry scheme—however, in most cases the areas of land affected still remain relatively minor.
The benefits of including local communities in forest management schemes can be clearly seen on projects attempting to establish offsets. Permanence is a key feature of offsets, yet without secure tenure this can be severely undermined. At QMM, for example, failure to secure land tenure led to initial offset attempts being lost. At Akyem, on the other hand, involving local communities in the planning and implementation of forest rehabilitation plans led to far more secure plots, with local communities receiving long-term stakes in the work and thus actively protecting them from external threats.
One final implication of land tenure can be seen with the vulnerability of protected areas. Protected areas are generally characterized by the absence of people with any formal rights over the land. Where governance is weak, this can make protected areas extremely vulnerable to exploitation since there is effectively nobody there with a long-term interest in protecting them.
Active involvement of external civil society groups can promote forest-smart approaches.
In several of the case studies, relationships between civil society groups and mining projects are contributing to forest-smart outcomes. In some cases, the relationships are healthily antagonistic. In Finland, for example, the presence of a strong NGO network means Anglo American is under intense scrutiny for the development of the Sakatti site. Every potentially impactful decision is challenged, sometimes in the courts, and various forums have been established to allow stakeholders an input to the process. This has been a significant factor in ensuring Anglo American has gone beyond compliance from the very start of the mining life cycle. Similar pressures occurred in Sweden for LKAB over concerns for a Natura 2000 site potentially impacted by activities. In other cases, engagement has been more synergistic. In Australia, both Alcoa and Rio Tinto have long-running relationships with NGOs and academic institutions, facilitating research and development into rehabilitation and restoration science that has helped Australian mines to show some of the best examples of rehabilitation. In Finland, a Green Mining Fund specifically supports academic research into minimizing mining impacts. Elsewhere, partnerships exist with NGOs to act as “critical friends.” Vale in Brazil and Lundin Gold in Ecuador work closely with Conservation International, for example. Fauna and Flora International works closely with Anglo American across their portfolio of operations. Newmont
also has a history of working with NGOs to help guide project development or implement management actions, including to help them work through offsetting challenges in Ghana, and QMM uses NGOs as part of an external advisory board. NGOs are also involved in the implementation of offsetting with QMM and Ambatovy in Madagascar, although with more mixed results.
4.5. Various Existing Frameworks Could Promote Forest-Smart Mining
ESIA frameworks could better support forest-smart mining if strengthened.
The environmental and social impact assessment process can be an important framework for guiding forest-smart approaches, but the ESIAs vary widely in quality, approach, and implementation. In this study, there are good examples of ESIAs, but there are also examples of ESIAs giving scant attention to environmental impacts, ESIAs missing entire sections on responses to impacts identified, ESIAs that could not be found in the public domain, and ESIAs conducted after activities had already started. In some cases, it appears mining authorities put pressure on environmental authorities to streamline the ESIA process to minimize delays, and in many countries there is minimal capacity to oversee or assist with ESIA development or review. In the worst examples, ESIAs become a simple check box in the process of mine establishment. ESIAs will only form the basis of forest-smart mining if they are standardized in their approach and scope, if the results are coordinated and shared (ideally by a central, third party such as government), if external authorities monitor and enforce resulting management plans, and if responses to change are adaptive.
Sustainable Development Goals represent a good general framework for supporting forest-smart mining.
At the global level, the SDGs are gaining rapid traction as the agreed development framework for most countries. Forests are not really specifically covered by the SDGs, but at least 71 of the 169 targets do have relevance for mining, and further targets focused on biodiversity can be expected in 2020 as part of a process to update and integrate the Aichi Biodiversity Targets with the global development framework. Aligning forest-smart activities with the relevant SDGs will help ensure their alignment with national and global development pathways.
The Paris Agreement together with REDD+ represents a clearer framework for implementing forest-smart mining, but it is largely underused.

177FOREST-SMART MINING
With the current focus on the impacts of climate change, the Paris Agreement, and specifically the variety of national and international REDD+ initiatives that have developed in response, tying forest-smart mining activities to emission reductions through reduced deforestation represents a natural fit. However, despite national REDD+ plans almost ubiquitously mentioning mining as one of the drivers of deforestation, in almost every case national focus has been entirely on emissions related to the agriculture or forestry sectors. Based on current data, it makes sense to prioritize addressing emissions from agriculture since the direct impacts of mining are far lower. However, if the indirect impacts of mining (which often lead to clearance for agriculture) could be better understood and captured, activities addressing the impacts of mining might become much stronger candidates for national REDD+ activities.
Corporate foundations represent a potentially influential framework for action that is largely underused.
Another framework that could be better used to support forest-smart approaches are the charitable foundations often set up by mining companies. For example, Alcoa has spent about $6 million on global programs related to reforestation, biodiversity, and communities; Lundin established a foundation in Ecuador; First Quantum Minerals’ Trident Foundation is the financial vehicle through which investment in Zambian protected areas has been routed; and Newmont has established foundations at each of its sites funded through $1 per ounce of gold sold plus 1 percent of profits before taxes, which at Akyem means an annual budget in the region of $2 million a year. However, the operations of each of the foundations are largely divorced from the mining operations—they operate as independent charities with corporate representation on the board and they largely focus on off-site, compensatory actions. In Ghana, the Newmont foundations are largely governed by local groups made up of representatives from all local communities; the funds are spent on projects chosen by these groups and include support for small businesses, the development of oil palm and livestock projects, and skills development projects. Some foundation activities overlap with forest concerns—the Newmont foundations support some forest patrols and education programs, and the Trident Foundation invests directly into national parks—however, there is very little strategic coordination and no monitoring of impact. In Ghana, the Newmont foundation officials complained they could never spend money on environmental projects because the communities never asked for them, but this is largely a result of the lack of tenure for communities in forests. It might be feasible to align the work of foundations
more closely with the residual indirect impacts identified in the ESIAs that the mine is not addressing because it sees them as outside its mandate. A more integrated foundation program could be used to specifically address such impacts rather than allow them to happen and hope beneficial activities conducted elsewhere might in some way “balance” the overall outcome.
Financial institutions have an important role to play in promoting forest-smart mining approaches.
While strong governance, responsible corporate behavior, empowered communities, and engaged civil society groups are all essential components of a forest-smart approach to mining, the final stakeholder group with major influence is the financial institutions. The influence of IFC and its Performance Standards on project development has been marked. IFC alone finances some $20 billion a year, with all borrowers having to abide by the Performance Standards. However, the Performance Standards have informed the Equator Principles, to which another 90 financial institutions have signed up to, representing a further $250 billion of project finance, as well as various multilateral development banks. Of the case studies presented, IFC had a direct influence at Ahafo (Newmont) and Boké (CBG and GAC), but Ambatovy and Nimba (ArcelorMittal) both made voluntary commitments to its standards too. The impacts of IFC involvement in Guinea are particularly clear, where they can be compared directly to operations operating in the same landscape to different standards, although notedly, the environmental influence of IFC at Ahafo was surprisingly minimal. However, while the awareness of investors on the financial value of responsible operation is growing and standards such as IFC’s and associated safeguard frameworks do have a positive influence on project impacts, it should also be noted that these still represent the minority of project investment flows.
4.6. Conclusion
Achieving forest-smart mining requires better coordination of MFA stakeholders and better use of available frameworks applied at a landscape scale within a holistic approach toward smart development.
The primary conclusions of this report are that large-scale forest mining is a significant and growing sector with potentially major impacts on people in lower income countries; that the key impacts it causes are likely to be indirect, diffuse, and difficult to attribute; that developing a forest-smart approach to managing these impacts most importantly requires strong governance as well as responsible corporate behavior, empowered
178 FOREST-SMART MINING
communities, and engaged civil society stakeholders; and that, while various frameworks exist for promoting such outcomes, no single framework for action is immediately fit for purpose.
So how does large-scale mining move forward on an issue with so many moving parts? There is likely no single answer. Instead, the answer has to be an adaptive, coordinated, landscape-scale approach to mining in forests in which the different stakeholders recognize and play different roles depending on the local context.
In an ideal world, governance would be strong. Clear rules would be set for where mining can and cannot occur based on large-scale analyses of the risks of direct, indirect, and cumulative impacts, with clear targets for maximum impacts allowed. There would be agreed and transparent ESIA processes to be followed before any significant activity and wide engagement with relevant stakeholders, and the results of consultations would have tangible impacts on the plans. Local communities would have direct and long-term stakes in the outcomes and be closely involved in planning. Other civil society groups would serve as watchdogs or experts. Companies and their financial backers would have to worry about little more than how best to extract the ore in the most efficient way within the boundaries of the law.
In the real world, most new forest mining will occur in countries where governance capacity is low, forest values and community dependence on them high, environmental and social vulnerability to change equally high, and local community and civil society organization power low. The major extractive companies (and their financial backers) will likely play the key role in such scenarios. This report shows that just having strong corporate policies that focus on minimizing the social and environmental impacts of the mine footprint is not enough, as laudable as some of them are. Companies have to recognize that their primary impacts are unlikely to be the highly visible ones associated with their pits and waste sites. Instead, their biggest impacts are likely to be diffuse, dispersed over much wider areas, and largely unaccountable to a single driver. To be truly forest smart is going to require recognizing when it is necessary to go beyond compliance in terms of responsibility.
Figure 4.2 illustrates how the balance in responsibility should be seen. For countries where governance is at a “late stage”—countries like Sweden, Finland, and Australia—there is less pressure on companies to take additional responsibility beyond what is legally required. Indirect landscape impacts should largely be accounted and planned for and managed by government where required. However, for countries with less developed governance systems, the responsibility of the companies has to rise to fill this gap. It does not necessarily have to mean companies accept formal liability for indirect impacts across the landscape—it is simply a recognition that part of the reason for the impacts is the activity of their company, and in lieu of government being able to act, the company steps in. This could involve directly carrying out mitigating activities such as commissioning landscape-level EIAs for long-term planning, or it could involve building capacity within the government to help them address the issues themselves. For companies entering virgin territory, where governance and mining regulations are very early stage, such as Suriname, for example, companies are going to have to recognize that they are going to have to largely take on the role of government.
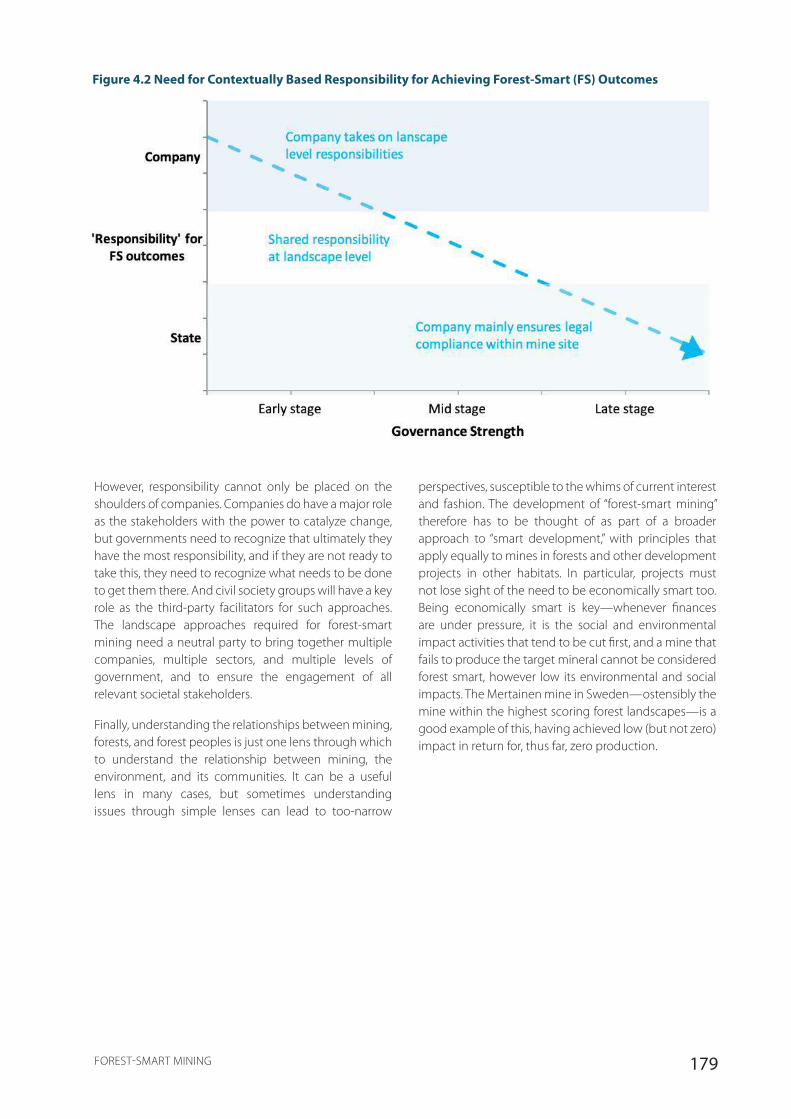
179FOREST-SMART MINING
Figure 4.2 Need for Contextually Based Responsibility for Achieving Forest-Smart (FS) Outcomes
However, responsibility cannot only be placed on the shoulders of companies. Companies do have a major role as the stakeholders with the power to catalyze change, but governments need to recognize that ultimately they have the most responsibility, and if they are not ready to take this, they need to recognize what needs to be done to get them there. And civil society groups will have a key role as the third-party facilitators for such approaches. The landscape approaches required for forest-smart mining need a neutral party to bring together multiple companies, multiple sectors, and multiple levels of government, and to ensure the engagement of all relevant societal stakeholders.
Finally, understanding the relationships between mining, forests, and forest peoples is just one lens through which to understand the relationship between mining, the environment, and its communities. It can be a useful lens in many cases, but sometimes understanding issues through simple lenses can lead to too-narrow
perspectives, susceptible to the whims of current interest and fashion. The development of “forest-smart mining” therefore has to be thought of as part of a broader approach to “smart development,” with principles that apply equally to mines in forests and other development projects in other habitats. In particular, projects must not lose sight of the need to be economically smart too. Being economically smart is key—whenever finances are under pressure, it is the social and environmental impact activities that tend to be cut first, and a mine that fails to produce the target mineral cannot be considered forest smart, however low its environmental and social impacts. The Mertainen mine in Sweden—ostensibly the mine within the highest scoring forest landscapes—is a good example of this, having achieved low (but not zero) impact in return for, thus far, zero production.
180 FOREST-SMART MINING
5. RECOMMENDATIONS
5.1. Enabling the Uptake of Forest-Smart Mining Principles
Forest-smart mining requires early consideration and careful implementation of a broad range of enabling factors covering a spectrum of institutional governance and sociocultural, behavioral, and operational practices.
Building government capacity and improving effectiveness where lacking is a priority.
Strong and effective governance is the most important aspect of achieving forest-smart outcomes. To be most effective, it needs to be interministerial and cross-discipline, and it needs to ensure the integration of forest management and protection in climate resilience strategies and the sustainable management of water resources and natural resources management, including biodiversity, agriculture, and mineral exploitation. While capacity is fast improving in many places, a risk exists that prioritization of economic targets over environmental and social targets will result in a lag between the time countries are seen as economically favorable for new mining projects and the time when the associated capacity for managing environmental and social concerns reaches the same level. When this is lacking, building capacity and resources, particularly in the relevant “non-mining” parts of government, needs to be a priority.
Companies, financial institutions, and civil society organizations need to be ready to “take up the slack” when governance is lacking.
When governance is lacking, various secondary forest impacts risk being completely unaddressed. Failure to address them can have serious ecological, social, and economic impacts in the long term. Addressing government capacity should be a priority, but as an interim measure there is a need for companies to fill the gap as “the right thing to do.” Financial institutions have a key role in incentivizing this through safeguards attached to finance for projects. Civil society organizations also play a key role, as both watchdog and facilitator. While monitoring against international standards is often done
by international consultants, national organizations are usually best placed to implement long-term monitoring and to hold companies and governments to account. Furthermore, civil society groups can act as third-party mediators, bringing together multiple companies, government departments, and local stakeholders to recognize shared goals. However, capacity for achieving this can be lacking. Various case studies highlight the need for much more investment in the development of local skills and resources. Because the need to tackle poverty is prioritized over addressing the environment, civil society frequently faces a huge challenge in lobbying governments to implement and enforce regulation in the sector. The development of mapping and digital technologies is improving the knowledge base, which will help civil society fulfill its lobbying role. For example, Global Forest Watch has been working with the Roundtable for Sustainable Palm Oil (RSPO) to carry out risk assessments and monitor the extent to which members are respecting their commitments. A similar approach could be used to monitor the mining sector.
Extensive landscape planning needs to be in place before new mining projects are approved in forest landscapes.
Understanding at the landscape level—including the full range of natural assets, the services derived from them, and the full range of actors in the landscape and their levels of reliance on said services—is an essential prerequisite before any individual forest-smart mining projects can be considered. When planning for projects, multiple scenarios need to be considered, including the option of “no go” where the risks and impacts to biodiversity and ecosystem services are unable to be mitigated and compensated. This is especially the case in forest systems considered to be critical habitat, those supporting ecosystem services inappropriate to replace for cultural reasons, or those supporting people’s livelihoods and well-being. Planning should incorporate not only specific projects but also associated railroads, roads, power generation, and other physical infrastructure that should be strategically placed and coordinated to reduce forest disruption.
181FOREST-SMART MINING
All landscape planning and individual projects need to consider multiple landscape actors, including local communities.
Mining projects need to take into account other land uses in the landscape and work with these stakeholders to minimize forest disturbance, removal, and impacts. Specific attention needs to be placed on potential cumulative and indirect impacts of mining within multiuse landscapes and cooperation between different actors in the landscape. In countries where mineral development is still in its early stages, opportunity exists for governments and project proponents to be proactive about this, to ensure a more socio-ecological approach is taken to land use planning and more sustainable development is achieved. Inclusion of local communities in planning, decision making, and implementation through FPIC processes is particularly important, especially in areas where local communities and indigenous peoples are likely to have a high dependency on forest products and services.
The mitigation hierarchy should inform the priorities of any impact mitigation response.
The mitigation hierarchy represents an appropriate framework for addressing impacts identified at the landscape or project level. However, it must be remembered that it is a hierarchy, with the first step—avoidance—being a far preferable response to the final option—offsetting or compensation. Avoidance or “no go” needs to be a viable option throughout the project, from the outset of project planning and design through construction, operation, and closure. This would include the rationalization of infrastructure with other land users where possible, and forgoing mining in some sensitive locations that compromise ecological function and biodiversity or where unacceptable trade-offs are identified, for example, to ecosystem services. Avoidance areas that recognize the biodiversity and ecosystem services values of forests should be designated through formal statutory processes and should include protected areas and KBAs as recommended by the IUCN.
The environmental and social impact assessment process is a valuable approach for identifying project specific impacts, but it needs to be standardized, transparent, and enforced.
Thorough environmental and social impact assessments covering direct, indirect, and cumulative impacts and applying FPIC with full consultation and inclusion of the guiding and managing authorities and regulators are essential steps for planning forest-smart approaches at the landscape and project levels. Legal and regulatory frameworks are required that ensure due diligence on mining companies to undertake comprehensive
ESIAs prior to mine license approval. The approval of a mine license should be conditional on demonstrable commitment and implementation of actions (including financial commitments) to net gain and no net loss to forest ecosystems in the landscape and will require the application of the mitigation hierarchy from the earliest stages of exploration through decision stage gates (including no mine) of the life of mine. Furthermore, companies need to be held to account when implementing the mitigation plans resulting from ESIAs.
Forest-smart approaches should be aligned with existing frameworks, particularly REDD+, where possible to maximize synergies, resources, and support.
Forest-smart mining can directly contribute to the SDGs, the Convention on Biological Diversity, and the UNFCCC Paris Agreement, and it should be aligned with the appropriate goals in each to encourage national and international support. Within the UNFCCC, the REDD+ mechanism represents an important yet underused framework for incentivizing forest-smart approaches. Countries with REDD+ strategies that mention mining as a driver of forest-related emissions in particular should focus on joint private-public sector initiatives to access REDD+ finance to drive forest-smart activities.
Any forest-smart project activity identified to address impacts identified in the ESIA should be guided by positive targets such as “no net loss,” not just “do less harm.”
The mitigation and ecological restoration of impacts on forest ecosystems from mining activities must consider the objective of no net loss or a net gain of biodiversity and ecosystem services in the landscape. Such activities need to be commensurate with both direct and indirect impacts accrued in the landscape and, if necessary and appropriate, efforts should be made to work with local authorities and other agencies in the landscape to develop proactive, preemptive, collaborative, and multisectoral initiatives rather than piecemeal social management or environmental interventions that may likely result in inadequate outcomes for forests.
Forest-smart activities must be applied throughout the full mining life cycle.
As shown in the case studies, focus on application of the mitigation hierarchy is rarely even across the mine life cycle. Application of the hierarchy at the exploration stage is particularly lacking, as is the failure to adequately integrate ecological considerations into closure objectives and for these to be applied throughout the life of the mine.

182 FOREST-SMART MINING
If offsetting is to form part of a forest-smart approach, it needs to be supported by legislation.
Offsetting can be an important component of the mitigation hierarchy if used as a last resort. For an offset to be appropriate in the context of forest-smart mining, it would need to ensure that time lags are adequately dealt with given the length of time a forest ecosystem requires to reach maturity. Appropriate mechanisms with full stakeholder consultations, including experts in the field of forest ecology and social practitioners, should be designed to ensure that the offset does not impinge on people’s rights to access ecosystem services and that the offset lasts at least as long as the impacts do. However, implementation of offsetting is almost never successful without legislative support to standardize approaches and ensure permanence of results.
Legislative coordination and reform should also be carried out beyond the standard mining laws.
Forest-smart approaches should be adopted and integrated into regulation governing mining, forests, water, climate, land use planning, and wildlife conservation. Issues relating to access rights and tenure of local communities and indigenous peoples need to be clearly addressed according to the FPIC principles and take into account traditional and tribal authorities over such resources. This will enable more equitable outcomes through social and environmental management activities. Improved governance of protected areas is also important, to ensure such areas are seen as off-limits and not soft targets for development.
Local community tenure over forests should be promoted and facilitated.
Increased local tenure over forests should promote greater support for forest-smart approaches. Various countries demonstrate examples of the transfer of tenure to community forestry projects, but most of these examples occur at a fairly small level. Such projects should be promoted where possible, and represent a worthy cause for company corporate social governance programs.
Implementing forest-smart approaches requires the allocation of appropriate levels of resources, capacity, and commitment at the corporate level.
Companies need to ensure the recruitment, training, and maintenance of institutional capacity to enable implementation of net gain and no net loss commitments, and to ensure that mine personnel and contractors abide by no harm commitments instituted as company standards and rules on social and environmental management.
Corporate foundations should be better harnessed to support forest-smart approaches.
The establishment of charitable foundations is one of the most common mechanisms for companies to provide direct benefits to local communities, yet the actions of the foundations often do not closely align with key impacts identified in the landscape—rather, they are driven by local demand. Where local communities have no tenure over forests, forest-smart activities will rarely be a priority. Using foundations to support community forestry projects and other activities aligned with forest-smart outcomes could help mitigate many of the negative impacts mining projects may also be having.
Financial institutions should play a proactive role in promoting forest-smart mining and development.
Financial institutions play a potentially catalytic role in promoting forest-smart mining, and the outcomes of sustainable, stable, and locally supported forest-smart projects should support both financial objectives and development objectives where relevant. The IFC Performance Standards represent a strong model for how financial institutions can promote forest-smart activities through finance safeguards, and applying or aligning with these will be a significant driver of forest-smart activities. Financial institutions potentially have a particularly important role in catalyzing cumulative impact assessments and/or strategic environmental assessments when government capacity is lacking. While many of the major multilateral financial institutions already encourage clients to take a landscape approach, the extent to which this is applied in practice for mining projects varies and is, arguably, oftentimes limited.
5.2. A Call to Action
There is an urgent need to advance forest-smart mining and its uptake by all relevant stakeholders. The following recommendations are intended to support progress and are complemented by case studies that illustrate application on the ground. Recommendations are organized according to stakeholder category and include a summary of general recommendations (relevant across more than one stakeholder category), followed by recommended actions for government, companies, and financial institutions.
General Recommendations
The mitigation hierarchy must be the basis for all action, prioritizing “avoidance,” and no net loss or a net gain should be written into project objectives.
• The feasibility of achieving no net loss or a net gain is being demonstrated by mining companies

183FOREST-SMART MINING
on the ground. The importance of prioritizing avoidance to achieve these objectives is emphasized (case studies 10, 21) and will be critical for pioneer projects in forest landscapes (case study 9), while the benefits of progressive restoration using sophisticated and up-to-date restoration techniques are also highlighted (case study 1).
• No net loss objectives at the state or national level can help to deter development in forests or promote robust remediation commitments (for example, in Australia, see section 3.5).
Forest-smart mining must go beyond the mitigation of negative impacts and drive positive outcomes for forests.
• In India, a mining company worked with village-level elected regulators, a local water department, and an NGO to improve water security and promote more sustainable farming practices, in turn reducing the clearance of forest for agriculture (case study 17).
• See also case studies 19 and 21.
Landscape-level approaches and integrated land use planning are paramount.
• Numerous case studies point to the urgent need for landscape-level, integrated land use planning to guide the development of mining and other sectors in forest landscapes and to identify priority areas for avoidance (for example, case studies 5, 9, 15, 25, 27).
Local context must inform the design and application of forest-smart approaches.
• In Guinea, an understanding of cultural norms and values among community stakeholders in the landscape is enabling mining companies to identify locally appropriate mitigation measures to help protect forest habitat and species while maintaining forest-related cultural values (case study 15).
Promote and facilitate secure tenure and rights over forests and forest resources among local community stakeholders to support long-term forest stewardship and sustainable use.
• A lack of local tenure over forests has been linked to the underestimation of forest value, poor forest protection, and unsustainable natural resource use (for example, in Ghana, Guinea, and Zambia), while the vulnerability of customary governance regimes to disruption from in-migration (particularly where
customary rights are not formally recognized in law) is also highlighted (for example, case study 15). Strong property rights are the key ingredient in sustainable resource management by collective communal units and therefore are fundamental in achieving long-term forest-smart outcomes.
• The application of REDD+ has, in many cases, required the clarification of land tenure for forest users and adjacent communities, and in doing so it has generated a range of benefits for forests, biodiversity and communities.
Community stakeholders have an important role to play in promoting forest-smart outcomes and must be empowered to do so.
• In Ghana, involving local communities in the planning and implementation of forest rehabilitation plans led to more secure plots, with local communities invested in the work and actively protecting against external threats (case study 14). In Guinea and Zambia, community (co-)management of forest and natural resources is also being enabled to promote forest conservation (case studies 15, 27).
The full range of forest values need to be under-stood and recognized among stakeholders to enable forest-smart outcomes.
• The case studies highlight a wide range of values associated with forests in mining areas, from climate resilience and water regulation to provisioning services and cultural values. Yet all too often the full value of forests remains under appreciated: in Ghana, for example, forests as perceived by some to be economically substitutable for minerals, with timber values simply restored later through reclamation and with little consideration of forest biodiversity or ecosystem services values.
LSM forest-smart approaches and strategies will need to incorporate ASM.
• In countries where ASM forms an important part of the mining sector (for example, Ecuador, Liberia, Suriname), ASM requirements and impacts on forests must be integrated into any LSM strategy.
Collaboration and cooperation between project proponents and governing authorities are essential.
• Where governance is weak, forest-smart mining approaches need to be adopted by companies in the absence of regulation as “the right thing to do.”
184 FOREST-SMART MINING
• In Suriname, one mining company demonstrates a forest-smart approach by compensating for areas where governance is lacking through its efforts with local communities and mitigation of environmental impacts (case study 25).
Forest-smart mining needs all actors to come together.
• Partnership approaches, cross-sectoral alliances, and multidisciplinary collaboration will be essential to mitigate and manage forest impacts and promote long-term forest stewardship across multiple temporal and spatial scales (for example, case studies 1, 15, 21, 23, 27).
• In Australia, collaboration with academic research institutions is supporting forest-smart outcomes through monitoring and restoration (case study 1); whereas in Zambia, a public-private community partnership could enable the collaborative conservation and protection of natural resources in the West Lunga Management Area (case study 27).
• The case studies stress the need for cooperation and coordination at the mineral province level if forest-smart mining and landscape-level objectives are to be achieved (for example, case studies 5, 15, 21).
Transboundary cooperation is essential to ensure impacts to forest integrity, function, and ecosystem services do not have transboundary impacts.
• See case studies 16 and 21.
Forest-smart approaches should be aligned with existing frameworks, particularly REDD+, where possible to maximize synergies, resources, and support.
Civil society, governments, and companies should promote all the above recommendations through actions as watchdogs, subject experts, and third-party facilitators.
• In Finland, a strong civil society sector is benefiting the development of forest-smart approaches to mining and holding companies to account for their environmental impact.
Develop and/or strengthen capacity, frameworks, and approaches for forest-smart mining.
• In countries identified as current and emerging priorities for forest-smart mining, there is an urgent need to develop and/or enhance capacity, frameworks, and approaches at the national
and local levels to enable improvements in practice, support forest conservation, and avoid environmental disasters.
Recommended Actions for Governments
• Undertake or facilitate strategic environmental assessment, regional/landscape level cumulative impact assessment, and landscape-level land use planning, particularly for infrastructure corridors, including the “no go” option when evaluating alternatives and with full understanding of all land uses and sectoral developments and their associated impacts.
» Assessments and planning should acknowledge the full suite of values associated with forest ecosystems (for example, climate resilience, water security, biodiversity conservation, and human well-being) when identifying priority areas for impact avoidance.
» In countries where mineral development is still in its early stages, opportunity exists for governments and project proponents to stay ahead of mining sector development and ensure a more socio-ecological approach is taken to land use planning to support more sustainable development.
• Establish, consistently apply, and enforce legal and regulatory frameworks that ensure due diligence on mining companies to undertake comprehensive ESIAs prior to mine license approval and to hold companies to account for noncompliance.
» The approval of a mine license should be conditional on demonstrable commitment and implementation of actions (including financial commitments) to net gain and no net loss to forest ecosystems in the landscape and will require the application of the mitigation hierarchy from the earliest stages of exploration through decision stage gates (including no mine) of the life of mine.
• Promote and enable effective interministerial coordination, address power imbalances, and reconcile conflicts in policy and legislation at all levels to support forest-smart mining.
» Strong and effective governance is the most important aspect of achieving forest-smart outcomes. To be most effective, it needs to be interministerial and cross-discipline, and it needs to ensure the integration of forest management and protection in climate resilience strategies
185FOREST-SMART MINING
and the sustainable management of water resources and natural resources management, including biodiversity, agriculture, and mineral exploitation.
» Forest-smart approaches need to be integrated into regulation governing mining, agriculture, forests, water, climate, land use planning, and conservation.
• Require cumulative impact assessments by all new proponents in any landscape where at least one mine already exists and with consideration of activities across all other sectors.
» Assessment should identify potential cumulative impacts, mitigation measures, and the entities, alliances, or partnerships needed for implementation and monitoring.
» Implementation of mitigation and management actions must be enforced.
• Ensure an enabling legal and regulatory environment for the inclusion of local communities and stakeholders in the consultation and decision-making process.
• Provide the legal and regulatory mechanisms to support the following:
» The adoption and transfer of liabilities and responsibilities for mitigation of social and environmental legacy issues
» The clarification of tenure and recognition of customary rights over forests and forest resources
» The long-term protection of forests
» The application of REDD+ and good practice biodiversity offsetting to achieve net gain or no net loss outcomes for forest ecosystems
- For countries with REDD+ strategies that include mining as a driver of forest-related emissions, this may include a focus on joint private-public sector initiatives to access REDD+ finance to drive forest-smart activities.
- For biodiversity offsetting, this may include ESIA legislation, a national offset policy, and enabling appropriate, long-term governance of offsets sites.
• Build capacity and resources, including in relevant
“non-mining” parts of government, to implement and enforce recommended actions (above) at national and subnational levels.
Recommended Actions for Companies
• Commit to a net gain or no net loss objective in the forest ecosystem.
• Apply the mitigation hierarchy and adopt a forest-smart approach throughout the full mining life cycle, from exploration through closure. Mines already established should embrace the mitigation hierarchy and forest-smart activities to reduce residual impacts and, where feasible, restore ecological integrity through the remaining life of the mine.
• Undertake a thorough social and environmental impact assessment applying free, prior and informed consent with full consultation and inclusion of the guiding and managing authorities and regulators.
• Specifically consider indirect impacts on the landscape, and to design, implement, and monitor responses to manage them.
» For example, the avoidance of secondary induced impacts to forest resulting from the influx and in-migration of people into newly accessible areas requires control and closure of access routes formed during exploration and construction phases (case study 13).
• Consider cumulative impacts and commit to a transparent and meaningful collaboration with other companies and sectors operating within the landscape to address and monitor them.
• Understand and take into account customary tenure and rights when identifying potential impacts of mining activity and opportunities for forest-smart approaches.
» In-migration, for example, may lead to disruption of customary forest governance systems, resulting in increased forest degradation and loss. Strengthening customary forest-related rights and promoting community forest management can support forest-smart outcomes (see country profiles and case studies for Guinea, Suriname, and Zambia). Where customary rights are not legally recognized, companies need to integrate these independently.
• Demonstrate corporate-level commitment to forest-smart mining and to allocate and sustain

186 FOREST-SMART MINING
appropriate levels of resources and capacity to implement forest-smart activities.
» Companies need to ensure the recruitment, training, and maintenance of institutional capacity to enable implementation of net gain and no net loss commitments, and to ensure that mine personnel and contractors abide by no harm commitments instituted as company standards and rules on social and environmental management.
• Take an integrated approach to managing social and environmental impacts in forests to identify and avoid unintended adverse impacts and trade-offs and promote positive forest smart outcomes (for example, through sustainable forest management).
» Identifying trade-offs between forest-smart mining and well-intended social management programs is essential to avoid unintended impacts. For example, enabling access to new agricultural and pastoral lands through improving access routes and accessibility for in-migrants can result in unintended and unsustainable land development and forest conversion/loss.
» In Zambia, forest-smart approaches are being integrated into social management programs, for example, through development of forest-smart agriculture and conservation livelihoods projects to reduce impacts to the forest biome (case study 27).
• Ensure a bonded commitment to mine closure, rehabilitation, and ecological restoration.
• Apply or align with international best-practice standards to ensure application of environmental and social safeguards.
• Fully consider opportunities for forest-smart approaches to the management, use, and protection of forest within the concession, particularly where the concession is larger than the footprint of the mine.
• Consider opportunities to support the creation, strengthening, or expansion of protected area networks to promote forest conservation (for example, case studies 5, 15, 22).
» In Guinea, two mining companies have made significant up-front investment in impact mitigation, including the recent creation of the Moyen-Bafing National Park as part of offset
commitments, setting an important precedent in Guinea (case study 15).
» In Brazil, one company is establishing a network of private natural heritage reserves to address forest impacts (case study 5).
• Better harness corporate foundations to support forest-smart approaches.
Recommended Actions for Financial Institutions
• Play a proactive role in promoting forest-smart mining and development.
• Support and incentivize the application of approaches outlined above for companies and governments, particularly with regard to capacity building at the government level.
• Catalyze, facilitate, and incentivize landscape-level assessment, strategic environment assessment and cumulative impact assessment in priority forest landscapes, particularly when government resources and capacity are lacking, and help ensure that resultant recommendations are implemented.
• Apply conditionalities on loans and within their environmental and social safeguards that require no net loss or a net gain outcome for forests.
» In northwest Guinea, international financial institutions are having a positive impact with robust application of their respective ESS, driving improvements in ESG practice of new and long-established mining operations.
• Encourage clients to take a landscape approach and ensure that it is applied in practice for mining projects.
• Require the early application of the mitigation hierarchy and evidence thereof for all projects financed in forest ecosystems.
• Ensure the application of FPIC and full consideration of customary tenure and rights in all mining projects and across all aspects.
187FOREST-SMART MINING
REFERENCES
ABS (Australian Bureau of Statistics). 2015. “Australian National Accounts: National Income, Expenditure and Product.”
AfDB (African Development Bank). 2013. “African Development Bank Group’s Integrated Safeguards System. Policy Statement and Operational Safeguards.” Vol. 1.
Angelsen, A., and T. Dokken. 2015. “Environmental Reliance, Climate Exposure, and Vulnerability: A Cross-Section Analysis of Structural and Stochastic Poverty.” Policy Research Working Paper 7474. World Bank, Washington, DC. https://openknowledge.worldbank.org/bitstream/handle/10986/23444/Environmental00d0stochastic0poverty.pdf?sequence=1&isAllowed=y%5Cnhttp://ep.fjernadgang.kb.dk/login?url=http://ovidsp.ovid.com/ovidweb.cgi?T=JS&CSC=Y&NEWS=N&PAGE =fulltext&D=caba6&AN=20163019.
Angelsen, A., P. Jagger, R. Babigumira, B. Belcher, N. J. Hogarth, S. Bauch, J. Börner, C. Smith-Hall, and S. Wunder. 2014. “Environmental Income and Rural Livelihoods: A Global-Comparative Analysis.” World Development 64 (S1): S12–28. https://doi.org/10.1016/j.worlddev.2014.03.006.
Apple. 2017. Environmental Responsibility Report. 2017 Progress Report, Covering FY2016. https://images.apple.com/environment/pdf/Apple_Environmental_Responsibility_Report_2017.pdf.
Arellano-Yanguas, J. 2013. “Mining and Conflict in Peru: Sowing the Minerals, Reaping a Hail of Stones.” In Social Conflict, Economic Development and Extractive Industry, edited by A. Bebbington. Routledge.
ASI (Aluminium Stewardship Initiative). 2014. “ASI Performance Standard. Part 1: Principles and Criteria.” Version 1.
Baldwin, R., and M. Cave. 1999. Understanding Regulation: Theory, Strategy, and Practice. Oxford: Oxford University Press.
Banerjee, S. D., Z. Romo, G. McMahon, P. Toedano, P. Robinson, and I. P. Arroyo. 2015. The Power of the Mine: A Transformative Opportunity for Sub-Saharan Africa. Washington, DC: World Bank.
Barber, C. P., M. A. Cochrane, C. M. Souza, and W. F. Laurance. 2014. “Roads, Deforestation, and the Mitigating Effect of Protected Areas in the Amazon.” Biological Conservation 177: 203–9. https://doi.org/10.1016/j.biocon.2014.07.004.
Bax, V., and W. Francesconi. 2018. “Environmental Predictors of Forest Change: An Analysis of Natural Predisposition to Deforestation in the Tropical Andes Region, Peru.” Applied Geography 91: 99–110.
BBOP (Business and Biodiversity Offsets Programme). 2009. “Biodiversity Offset Design Handbook.” BBOP and Forest Trends, Washington, DC. http://www.forest-trends.org/documents/files/doc_3126.pdf.
———. 2012. Glossary BBOP.
Bicknell, J. E., D. L. Gaveau, Z. G. Davies, and M. J. Struebig. 2015. “Saving Logged Tropical Forests: Closing Roads Will Bring Immediate Benefits.” Frontiers in Ecology and the Environment 13 (2): 73–74.
Blake, S., S. Strindberg, P. Boudjan, C. Makombo, I. Bila-Isia, O. Ilambu, F. Grossmann, et al. 2007. “Forest Elephant Crisis in the Congo Basin.” PLoS Biology 5 (4): 945–53. https://doi.org/10.1371/journal.pbio.0050111.
Brashares, J. S. 2004. “Bushmeat Hunting, Wildlife Declines, and Fish Supply in West Africa.” Science 306 (5699): 1180–83. https://doi.org/10.1126/science.1102425.
Bregman, T., K. McCoy, R. Servent, and C. MacFarquhar. 2016. “Turning Collective Commitments into Action: Assessing Progress by Consumer Goods Forum Members towards Achieving Deforestation-Free Supply Chains.” Tropical Forest Alliance, UK.
188 FOREST-SMART MINING
Campbell, M., M. Alamgir, and W. Laurance. 2017. “Roads to Ruin: Can We Build Roads That Benefit People While Not Destroying Nature?” Australasian Science 38 (2): 40.
Campbell, N. J. 1956. “Principles of Mineral Ownership in the Civil Law and Common Law Systems.” Proceedings (American Bar Association. Section of International and Comparative Law) (August): 37–43. http://www.jstor.org/stable/25744324.
CBD (Convention on Biological Diversity). 2010a. “Conference of the Parties Decision X/2. Strategic Plan for Biodiversity 2011-2020 and the Aichi Biodiversity Targets.” Vol. 2. Nagoya, Japan. https://www.cbd.int/decision/cop/?id=12268.
———. 2010b. “Flier: The Strategic Plan for Biodiversity 2011-2020 and the Aichi Biodiversity Targets ‘Living in Harmony with Nature.’” https://doi.org/10.1017/S0030605314000726.
———. 2015. “Biodiversity and the 2030 Agenda for Sustainable Development: Technical Note.”
CDP. 2016. “Revenue at Risk: Why Addressing Deforestation Is Critical to Business Success.” CDP, Berlin.
Changing Markets Foundation. 2018. The False Promise of Certification. Changing Markets Foundation.
Chao, S. 2012. “Forest Peoples: Numbers across the World.” Forest Peoples Programme, Moreton-in-Marsh, UK.
Chatham House. 2015. “The Impact of Mining on Forests : Information Needs for Effective Policy Responses.” London.
Chazdon, R. L., P. H. S. Brancalion, L. Laestadius, A. Bennett-Curry, K. Buckingham, C. Kumar, J. Moll-Rocek, I. C. Guimarães Vieira, and S. J. Wilson. 2016. “When Is a Forest a Forest? Forest Concepts and Definitions in the Era of Forest and Landscape Restoration.” Ambio 45 (5): 538–50. https://doi.org/10.1007/s13280-016-0772-y.
CIESIN (Center for International Earth Science Information Network)–Columbia University. 2017. “Global Population Density Grid Time Series Estimates.” Palisades, NY: NASA Socioeconomic Data and Applications Center (SEDAC). https://doi.org/10.7927/H47M05W2.
CIFOR (Center for International Forestry Research). 2016. “Strategy 2016–2025. Stepping Up to the New Climate and Development Agenda.” Bogor, Indonesia.
Coffin, A. W. 2007. “From Roadkill to Road Ecology: A Review of the Ecological Effects of Roads.” Journal of Transport Geography 15 (5): 396–406. https://doi.org/10.1016/j.jtrangeo.2006.11.006.
Columbia Center on Sustainable Investment, United Nations Development Programme, UN Sustainable Development Solutions Network, and World Economic Forum. 2016. “Mapping Mining to the Sustainable Development Goals: An Atlas.” Geneva, Switzerland.
CSBI (Cross-Sector Biodiversity Initiative). 2015. “A Cross Sector Guide for Implementing the Mitigation Hierarchy.” Cambridge, UK. http://www.unepfi.org/fileadmin/documents/biodiversity_offsets.pdf.
Deegan, L. A., C. Neill, C. L. Haupert, M. V. R. Ballester, A. V. Krusche, R. L. Victoria, S. M. Thomas, and E. de Moor. 2011. “Amazon Deforestation Alters Small Stream Structure, Nitrogen Biogeochemistry and Connectivity to Larger Rivers.” Biogeochemistry 105 (1–3): 53–74.
Donofrio, S., P. Rothrock, and J. Leonard. 2017. “Supply Change: Tracking Corporate Commitments to Deforestation-Free Supply Chains.” Supply Change, Washington, DC.
Dufils, J. 2004. “Forest Ecology.” In The Natural History of Madagascar, edited by S. M. Goodman and B. P. Jonathan. University of Chicago Press.
Durán, A. P., J. Rauch, and K. J. Gaston. 2013. “Global Spatial Coincidence between Protected Areas and Metal Mining Activities.” Biological Conservation 160: 272–78. https://doi.org/10.1016/j.biocon.2013.02.003.
EBRD (European Bank for Reconstruction and Development). 2014. “Guidance Note: EBRD Performance Requirement 6. Biodiversity Conservation and Sustainable Management of Living Natural Resources.” London.
Ecosystem Marketplace. 2017. “Unlocking Potential: State of the Voluntary Carbon Markets 2017.”
Edwards, D. P., S. Sloan, L. Weng, P. Dirks, J. Sayer, and W. F. Laurance. 2014. “Mining and the African Environment.” Conservation Letters 7 (3): 302–11. https://doi.org/10.1111/conl.12076.
EIB (European Investment Bank). 2013. “Environmental and Social Handbook.” Kirchberg, Luxembourg.

189FOREST-SMART MINING
eLAW. 2010. Guidebook for Evaluating Mining Project EIAs. Eugene, Oregon: Environmental Law Alliance Worldwide. https://doi.org/10.1017/CBO9781107415324.004.
Equator Principles Association. n.d. “The Equator Principles.” Equator Principles (website) Accessed June 30, 2017. http://www.equator-principles.com/.
FAO (Food and Agriculture Organization). 2014. State of the World’s Forests. Enhancing the Socioeconomic Benefits from Forests. Rome: FAO. http://www.fao.org/3/a-i3710e.pdf.
———. 2015a. “Forest Resources Assessment 2015: Terms and Definitions.” Forest Resources Assessment Working Paper 180. FAO, Rome. http://www.fao.org/docrep/017/ap862e/ap862e00.pdf.
———. 2015b. “Global Forest Resources Assessment 2015. How Are the World’s Forests Changing?” FAO, Rome.
———. 2016. State of the World’s Forests. Forests and Agriculture: Land-Use Challenges and Opportunities. Rome: FAO. https://doi.org/10.1146/annurev-environ-020411-130608.
Fearnside, P. M. 2018. “Challenges for Sustainable Development in Brazilian Amazonia.” Sustainable Development 26 (2): 141–49.
Forman, R., D. Sperling, J. Bissonette, A. Clevenger, C. Cutshall, V. Dale, L. Fahrig, et al. 2003. “Road Ecology: Science and Solutions.” Review Literature and Arts of the Americas, 481. https://doi.org/10.1002/ep.670220307.
Franks, D. M. 2015. “Environment.” In Mountain Movers: Mining, Sustainability and the Agents of Change. London: Routledge. https://doi.org/10.4324/9781315884400.
Funi, C., and A. Paese. 2012. “Spatial and Temporal Patterns of Deforestation in Rio Cajarí Extrative Reserve, Amapá, Brazil.” PLoS ONE. https://doi.org/10.1371/journal.pone.0051893.
Gaughan, A. E., F. R. Stevens, C. Linard, P. Jia, and A. J. Tatem. 2013. “High Resolution Population Distribution Maps for Southeast Asia in 2010 and 2015.” PLoS ONE 8 (2): e55882.
George, M. W. 2017. Mineral Commodity Summaries 2017. https://doi.org/10.3133/70180197.
GFW (Global Forest Watch). 2016. “Global Forest Watch” (website). http://www.globalforestwatch.org.
Gough, A. D., J. L. Innes, and S. D. Allen. 2008. “Development of Common Indicators of Sustainable Forest Management.” Ecological Indicators 8 (5): 425–30. https://doi.org/10.1016/j.ecolind.2007.03.001.
Gould, S. F. 2012. “Comparison of Post-Mining Rehabilitation with Reference Ecosystems in Monsoonal Eucalypt Woodlands, Northern Australia.” Restoration Ecology 20 (2): 250–59. https://doi.org/10.1111/j.1526-100X.2010.00757.x.
GSSB (Global Sustainability Standards Board). 2016. “GRI 304: Biodiversity 2016 304.” GRI Standards. Amsterdam. www.globalreporting.org.
Gullison, T., J. Hardner, S. Anstee, and M. Meyer. 2015. “Good Practices for the Collection of Biodiversity Baseline Data.” Prepared for the Multilateral Financing Institutions Biodiversity Working Group and the Cross-Sector Biodiversity Initiative.
Gunn, J. M. 1996. “Restoring the Smelter Damaged Landscape near Sudbury, Canada.” Restoration & Management Notes 14 (2): 129–36.
Hansen, M. C., P. V. Potapov, R. Moore, M. Hancher, S. A. Turubanova, A. Tyukavina, D. Thau, et al. 2013. “High-Resolution Global Maps of 21st-Century Forest Cover Change.” Science 342 (November): 850–54. https://doi.org/10.1126/science.1244693.
Hime, S. 2012. “Business Ecosystems Training (BET) Glossary of Terms and Acronyms.” http://docs.wbcsd.org/2017/02/bet/materials/BET_Glossary_of_Terms_and_Acronyms_FINAL.pdf.
Hirons, M. 2013. “Mining in Ghana’s Forests: Cross-Sectoral Linkages and the Prospects for REDD.” International Development Planning Review 35 (3): 283–302. https://doi.org/10.3828/idpr.2013.18.
Horton, A., J. A. Constantine, T. C. Hales, and B. R. Goossens. 2016. “Modification of River Meandering Caused by Tropical Deforestation along the Kinabatangan River, Borneo.” In AGU Fall Meeting Abstracts.
Hosonuma, N., M. Herold, V. De Sy, R. S. De Fries, M. Brockhaus, L. Verchot, A. Angelsen, and E. Romijn. 2012. “An Assessment of Deforestation and Forest Degradation Drivers in Developing Countries.” Environmental Research Letters 7 (4): 044009. https://doi.org/10.1088/1748-9326/7/4/044009.
190 FOREST-SMART MINING
Howard, P., and N. Jenner. 2016. “Review of Lender Safeguards and Standards in the Context of Great Ape Conservation.” Cambridge, UK.
Hughes. 2017. “Developing Priorities for Conservation in Southeast Asia.”
Hund, K., J. Schure, and A. van der Goes. 2017. “Extractive Industries in Forest Landscapes: Options for Synergy with REDD+ and Development of Standards in the Democratic Republic of Congo.” Resources Policy 54 (April): 97–108. https://doi.org/10.1016/j.resourpol.2017.09.011.
ICMM (International Council on Mining and Metals). 2016a. Role of Mining in National Economies. 3rd ed. London: ICMM.
———. 2016b. Role of Mining in National Economies: Mining Contribution Index. 3rd ed., supplement. London.
———. 2017. “ICMM 10 Principles.” https://www.icmm.com/en-gb/about-us/member-commitments/icmm-10-principles.
ICSG (International Copper Study Group). 2014. Directory of Copper Mines and Plants. Lisbon: ICSG.
IDB (Inter-American Development Bank). 2007. “Implementation Guidelines for the Environment and Safeguards Compliance Policy.” IDB, Washington, DC.
IFC (International Finance Corporation). 2012a. “Guidance Note 6: Biodiversity Conservation and Sustainable Management of Living.” IFC, Washington, DC.
———. 2012b. “Performance Standard 6: Biodiversity Conservation and Sustainable Management of Living Natural Resources.” IFC, Washington, DC.
Ingram, J. C., and T. Dawson. 2003. “Darwin Initiative Final Report: Sustainable Development of Madagascar’s Littoral Forests.” Darwin Initiative for the Survival of Species and the University of Oxford.
Intelligence Mine. n.d. mining.com (website). http://www.mining.com/author/intelligencemine.
Isac, R., A. Kruger, and A. Pascoletti. 2014. “Mining in Africa’s Copperbelt: Zambia and Democratic Republic of Congo.” Engineering and Mining Journal (February).
IUCN (International Union for Conservation of Nature). 2017. “The Bonn Challenge.” https://www.iucn.org/theme/forests/our-work/forest-landscape-restoration/bonn-challenge.
IUCN and Bonn Challenge. 2017. “The Bonn Challenge.” http://www.bonnchallenge.org/content/history-challenge.
IUCN and UNEP-WCMC. 2018. “World Database on Protected Areas (WDPA).” www.protectedplanet.net.
Johnson, S. 2015. “A National Biodiversity Offset Scheme: A Road Map for Liberia’s Mining Sector.” World Bank, Washington, DC. http://documents.worldbank.org/curated/en/183611467991015452/A-national-biodiversity-offset-scheme-a-road-map-for-Liberia-s-mining-sector.
Jones, B. 2017. “In Defining Plantations as Forest, FAO Attracts Criticism.” Mongabay.Com, March.
Klubi, E., J. M. Abril, E. Nyarko, and A. Delgado. 2018. “Impact of Gold-Mining Activity on Trace Elements Enrichment in the West African Estuaries: The Case of Pra and Ankobra Rivers with the Volta Estuary (Ghana) as the Reference.” Journal of Geochemical Exploration 190: 229–44.
Laing, T. 2015. “Rights to the Forest, REDD + and Elections: Mining in Guyana.” Working Paper 206. Centre for Climate Change Economics and Policy, London.
Lang, C. 2011. “Mining for REDD in Indonesia.” World Rainforest Movement Bulletin, no. 167.
Laurance, W. F., J. Sayer, and K. G. Cassman. 2014. “Agricultural Expansion and Its Impacts on Tropical Nature.” Trends in Ecology & Evolution 29 (2): 107–16.
Laurance, W. F. 2015. “Bad Roads, Good Roads.” In Handbook of Road Ecology, edited by R. van der Ree, D. J. Smith, and C. Grilo. Wiley Blackwell. https://doi.org/10.1002/9781118568170.ch2.
Laurance, W. F., B. M. Croes, N. Guissouegou, R. Buij, M. Dethier, and A. Alonso. 2008. “Impacts of Roads, Hunting, and Habitat Alteration on Nocturnal Mammals in African Rainforests.” Conservation Biology 22 (3): 721–32. https://doi.org/10.1111/j.1523-1739.2008.00917.x.
Laurance, W. F., M. Goosem, and S. G. W. Laurance. 2009. “Impacts of Roads and Linear Clearings on Tropical Forests.” Trends in Ecology and Evolution 24 (12): 659–69. https://doi.org/10.1016/j.tree.2009.06.009.

191FOREST-SMART MINING
Lehner, B., K. Verdin, and A. Jarvis. 2008. “New Global Hydrography Derived from Spaceborne Elevation Data.” Eos 89 (10): 93–94.
Linard, C., M. Gilbert, R. W. Snow, A. M. Noor, and A. J. Tatem. 2012. “Population Distribution, Settlement Patterns and Accessibility across Africa in 2010.” PLoS ONE 7 (2): e31743.
Liu, S., Y. Dong, L. Deng, Q. Liu, H. Zhao, and S. Dong. 2014. “Forest Fragmentation and Landscape Connectivity Change Associated with Road Network Extension and City Expansion: A Case Study in the Lancang River Valley.” Ecological Indicators 36: 160–68.
Luiselli, L., A. Starita, G. M. Carpaneto, G. H. Segniagbeto, and G. Amori. 2016. “A Short Review of the International Trade of Wild Tortoises and Freshwater Turtles Across the World and Throughout Two Decades.” Chelonian Conservation and Biology 15 (2): 167–72. https://doi.org/10.2744/CCB-1216.1.
Maisels, F., S. Strindberg, S. Blake, G. Wittemyer, J. Hart, E. A. Williamson, R. Aba’a, et al. 2013. “Devastating Decline of Forest Elephants in Central Africa.” PLoS ONE 8 (3). https://doi.org/10.1371/journal.pone.0059469.
Maniatis, D., J. Gaugris, D. Mollicone, J. Scriven, A. Corblin, C. Ndikumagenge, A. Aquino, P. Crete, and M.-J. Sanz-Sanchez. 2017. “Financing and Current Capacity for REDD+ Readiness and Monitoring, Measurement, Reporting and Verification in the Congo Basin.” Philosophical Transactions of the Royal Society B 368 (1625).
Martin, O., and G. Piatti (eds.). 2009. World Heritage and Buffer Zones. World Heritage Papers 25. Proceedings from the International Expert Meeting on World Heritage and Buffer Zones, Davos, Switzerland, March 11–14, 2008. Paris: UNESCO World Heritage Centre.
McCarthy, D., and P. Morling. 2015. Using Regulation as a Last Resort: Assessing the Performance of Voluntary Approaches. Sandy, Bedfordshire.
McFarlane, D., R. Stone, S. Martens, J. Thomas, R. Silberstein, R. Ali, and G. Hodgson. 2012. “Climate Change Impacts on Water Yields and Demands in South-western Australia.” Journal of Hydrology 475: 488–98.
McRae, B. H., V. B. Shah, and T. K. Mohapatra. 2014. “Circuitscape 4 User Guide.” The Nature Conservancy. http://www.circuitscape.org.
MINATURA. 2017. “Minatura 2020: Introduction” (webpage). http://minatura2020.eu/introduction.
Miningfacts.org. 2012. “How Many Jobs Depend on the Mining Industry?” Fraser Institute. http://www.miningfacts.org/Economy/How-many-jobs-depend-on-the-mining-industry/.
Miranda, L. S., and A. C. Marques. 2016. “Hidden Impacts of the Samarco Mining Waste Dam Collapse to Brazilian Marine Fauna: An Example from the Staurozoans (Cnidaria).” Biota Neotropica 16 (2).
Mori Junior, R., and S. H. Ali. 2016. “Designing Sustainability Certification for Greater Impact: Perceptions, Expectations and Recommendations in Sustainability Certification Schemes.” Centre for Social Responsibility in Mining, University of Queensland, Brisbane, Australia.
Mori Junior, R., D. M. Franks, and S. H. Ali. 2015. “Designing Sustainability Certification for Greater Impact: Analysis of the Design Characteristics of 15 Sustainability Standards in the Mining Industry.” Centre for Social Responsibility in Mining, University of Queensland, Brisbane, Australia.
Mori Junior, R., K. Sturman, and J.-P. Imbrogiano. 2017. “Leveraging Greater Impact of Mineral Sustainability Initiatives: An Assessment of Interoperability.” Centre for Social Responsibility in Mining, University of Queensland, Brisbane, Australia.
MTENR (Ministry of Tourism, Environment and Natural Resources). 2006. “Third National Report on the Implementation of the Convention on Biological Diversity in Zambia.” MTENR, Lusaka, Zambia.
Nassar, N. T. 2018. “Quantifying and Characterizing In-Use Stocks of Non-Fuel Mineral Commodities.” In Symposium on the Availability of Raw Materials from Secondary Sources: A Key Aspect of Circular Economy. Palais des Nations, Geneva: USGS.
Newmont. 2014. “Sustainability & Stakeholder Engagement Policy.”
Noack, F., S. Wunder, A. Angelsen, and J. Börner. 2015. - Responses to Weather and Climate: A Cross-Section Analysis of Rural Incomes.” Policy Research Working Paper 7478, World Bank, Washington, DC.
NRGI (Natural Resources Governance Institute). 2014. “Natural Resource Charter.” 2nd ed. https://resourcegovernance.org/sites/default/files/d o c u m e n t s / n rc j 1 1 9 3 _ n a t u r a l _ re s o u rc e _charter_19.6.14.pdf.

192 FOREST-SMART MINING
———. 2015. “NRGI Primers.” https://doi.org/10.1080/05679320500129037.
Oehri, J., B. Schmid, G. Schaepman-Strub, and P. A. Niklaus. 2017. “Biodiversity Promotes Primary Productivity and Growing Season Lengthening at the Landscape Scale.” 114 (38): 10160–65. https://doi.org/10.1073/pnas.1703928114.
Open Mai-Ndombe. 2016. “New Report Highlights Competition between Mining and Logging Interests with REDD+.” https://mapforenvironment.org/hub/maindombe/story/20/New-report-highlights-competition-between-mining-and-logging-interests-with-REDD.
OpenStreetMap Contributors. 2017a. “Planet Dump.” http://planet.openstreetmap.org.
———. 2017b. “Planet Dump.”
Oxfam International. 2017. “From Aspiration to Reality: Unpacking the Africa Mining Vision.” Briefing paper. Cowley, Oxford, England, UK.
Phalan, B., G. Hayes, S. Brooks, D. Marsh, P. Howard, B. Costelloe, B. Vira, A. Kowalska, and S. Whitaker. 2017. “Avoiding Impacts on Biodiversity through Strengthening the First Stage of the Mitigation Hierarchy.” Oryx, January, 1–9. https://doi.org/10.1017/S0030605316001034.
Pilgrim, J. D., S. Brownlie, J. M. M. Ekstrom, T. A. Gardner, A. von Hase, K. ten Kate, C. E. Savy, et al. 2013. “A Process for Assessing the Offsetability of Biodiversity Impacts.” Conservation Letters 6 (5): 376–84. https://doi.org/10.1111/conl.12002.
Potapov, P., A. Yaroshenko, S. Turubanova, M. Dubinin, L. Laestadius, C. Thies, D. Aksenov, et al. 2008. “Mapping the World’s Intact Forest Landscapes by Remote Sensing.” Ecology and Society 13 (2). https://doi.org/10.5751/ES-02670-130251.
Price, S. A, and J. L Gittleman. 2007. “Hunting to Extinction: Biology and Regional Economy Influence Extinction Risk and the Impact of Hunting in Artiodactyls.” Proceedings of the Royal Society B: Biological Sciences 274 (1620): 1845–51. https://doi.org/10.1098/rspb.2007.0505.
PROFOR. 2016. “Get Forest Smart. 2016 Annual Report.” World Bank, Washington, DC. http://www.profor.info/sites/profor.info/files/PROFOR_AR2016_CRA_webFinal.pdf.
PT Freeport Indonesia. 2016. “Controlled Riverine Tailings Management at PT Freeport Indonesia.” Phoenix, AZ. https://www.fcx.com/sites/fcx/files/documents/sustainability/riverine.pdf.
Rainey, H. J, E. H. B. Pollard, G. Dutson, and J. M. M. Ekstrom. 2015. “A Review of Corporate Goals or No Net Loss and Net Positive Impact on Biodiversity.” Oryx 49 (2): 232–38.
Raw Materials Group. 2015. “Raw Materials Database.”
Reeders, A. P. F., and A. G. Morton. 1983. “Vertebrate Fauna in Regenerated Mines at Weipa.” Internal report to Comalco.
Rio Tinto. 2017. “About QIT Madagascar Minerals.” 2017. http://www.riotinto.com/energyandminerals/about-qit-madagascar-minerals-15376.aspx.
RMF. 2017. “Responsible Mining Index. Draft Methodology. For Public Comment.”
Ross, M. R., B. L. McGlynn, and E. S. Bernhardt. 2016. “Deep Impact: Effects of Mountaintop Mining on Surface Topography, Bedrock Structure, and Downstream Waters.” Environmental Science and Technology 50 (4): 2064–74.
Schodde, R. 2014. “The Global Shift to Undercover Exploration: How Fast? How Effective?” In Society of Economic Geologists 2014 Conference. September. www.minexconsulting.com/publications/sep2014b.html.
———. 2016. “Long Term Trends in Gold Exploration Is the Love Affair Over, or Is It Just Warming Up?” In Technical Presentation to the Melbourne Branch of the AusIMM. June.
———. 2017. “Recent Trends and Outlook for Global Exploration.” Presentation to PDAC 2017, Toronto, March 6.
Schure, J. 2015. “Extractive Industries and REDD+: Assessment of Experiences for REDD+ Compatible Oil and Mining Development in the Democratic Republic of Congo.” World Bank, Washington, DC.
Secretariat of the Convention on Biological Diversity. 2001. “The Value of Forest Ecosystems.” CBD Technical Series 4, Secretariat of the Convention on Biological Diversity, Montreal. http://www.cbd.int/doc/publications/cbd-ts-04.pdf.
193FOREST-SMART MINING
Sonter, L. J., D. Herrera, D. J. Barrett, G. L. Galford, C. J. Moran, and B. S. Soares-Filho. 2017. “Mining Drives Extensive Deforestation in the Brazilian Amazon.” Nature Communications 8 (1): 1013. https://doi.org/10.1038/s41467-017-00557-w.
Sorichetta, A., G. M. Hornby, F. R. Stevens, A. E. Gaughan, C. Linard, and A. J. Tatem. 2015. “High-Resolution Gridded Population Datasets for Latin America and the Caribbean in 2010, 2015, and 2020.” Scientific Data 2: 150045. doi:10.1038/sdata.2015.45.
Stevens, F. R., A. E. Gaughan, C. Linard, and A. J. Tatem. 2015. “Disaggregating Census Data for Population Mapping Using Random Forests with Remotely-Sensed and Ancillary Data.” PloS One 10 (2): e0107042.
Stiles, D. 2011. “Elephant Meat and Ivory Trade in Central Africa.” Pachyderm 50 (1): 26–36.
SuRe. 2016. “The Standard for Sustainable and Resilient Infrastructure. v. 3.0.”
Tapia-Armijos, M. F., J. Homeier, C. I. Espinosa, C. Leuschner, and M. de la Cruz. 2015. “Deforestation and Forest Fragmentation in South Ecuador Since the 1970s: Losing a Hotspot of Biodiversity.” PloS One 10 (9): e0133701.
Tarras-Wahlberg, H., F. Cronjé, S. Reyneke, and S. Sweet. 2017. “Meeting Local Community Needs: The Cases of Iron Ore Mining in Sweden and South Africa.” Extractive Industries and Society. https://doi.org/10.1016/j.exis.2017.05.002.
Temple, H. J., S Anstee, J. Ekstrom, J. D. Pilgrim, J. Rabenantoandro, J.-B. Ramanamanjato, F. Randraitafika, and M. Vincellette. 2012. Forecasting the Path towards a Net Positive Impact on Biodiversity for Rio Tinto QMM. IUCN and Rio Tinto Technical Series No. 2. https://doi.org/ISBN: 978-2-8317-1441-7.
The REDD Desk. 2017. “The REDD Desk” (website). http://theredddesk.org.
Thompson, I., B. Mackey, S. McNulty, and A. Mosseler. 2009. “Forest Resilience, Biodiversity, and Climate Change: A Synthesis of the Biodiversity/Resilience/Stability Relationship in Forest Ecosystems.” CBD Technical Series 43, Secretariat of the Convention on Biological Diversity, Montreal, Canada.
Tritsch, I., and F. M. Le Tourneau. 2016. “Population Densities and Deforestation in the Brazilian Amazon: New Insights on the Current Human Settlement Patterns.” Applied Geography 76: 163–72.
UNDP (United Nations Development Programme). 2014. “New York Declaration on Forests.” http://www.undp.org/content/dam/undp/library/Environment and Energy/Forests/New York Declaration on Forests_DAA.pdf.
UNEP-WCMC, WWF, and WRI. 2007. “Global Forest Cover Map (GFM).”
UNFCCC (United Nations Framework Convention on Climate Change). 2015. “FCCC/CP/2015/L.9/Rev.1 Adoption of the Paris Agreement.” Conference of the Parties, 21st session, Paris, November 30–December 11. https://unfccc.int/resource/docs/2015/cop21/eng/l09r01.pdf.
———. 2017. “The Paris Agreement.” United Nations Climate Change (website). http://unfccc.int/paris_agreement/items/9485.php.
UN Global Compact. 2017. “United Nations Global Compact.” https://www.unglobalcompact.org/what-is-gc/strategy.
United Nations. 1992. “Convention on Biological Diversity,” 30. https://doi.org/10.1146/annurev.ento.48.091801.112645.
———. 2014. “Forests. New York Declaration on Forests. Action Statements and Action Plans.” New York.
———. 2015. “Resolution A/RES/70/1 Transforming Our World: The 2030 Agenda for Sustainable Development.” https://doi.org/10.1007/s13398-014-0173-7.2.
Vanclay, F., A. M. Esteves, I. Aucamp, and D. M. Franks. 2015. “Social Impact Assessment: Guidance for Assessing and Managing the Social Impacts of Projects.” International Association for Impact Assessment 1 (April): 98.
van Vliet, N., M. P. Quiceno Mesa, D. Cruz-Antia, L. Jonhson Neves de Aquino, J. Moreno, and R. Nasi. 2014. “The Uncovered Volumes of Bushmeat Commercialized in the Amazonian Trifrontier between Colombia, Peru and Brazil.” Ethnobiology and Conservation 7 (November): 1–11. https://doi.org/10.15451/ec2014-11-3.7-1-11.

194 FOREST-SMART MINING
Wilkie, D. S., and J. F. Carpenter. 1999. “Bushmeat Hunting in the Congo Basin: An Assessment of Impacts and Options for Mitigation.” Biodiversity & Conservation 8 (7): 927–55. https://doi.org/10.1023/A:1008877309871.
Winter, J., and R. Alford. 1999. “Terrestrial Vertebrate Fauna in Regenerated Mine Areas at Weipa.”
World Bank. 2016a. The Little Data Book 2016. Washington, DC: World Bank. https://doi.org/10.1596/978-1-4648-0834-0.
———. 2016b. “World Bank Environmental and Social Framework.” World Bank, Washington, DC.
———. 2016c. World Bank Group Forest Action Plan FY16-20. Washington, DC: World Bank.
Credit: Roel Slootweg
———. 2017. The Little Green Data Book 2017. Washington, DC: World Bank. https://doi.org/10.1596/978- 1-4648-1034-3.
WEF (World Economic Forum). 2016. “Voluntary Responsible Mining Initiatives A Review.” Global Agenda.
Wunder, S., J. Börner, G. Shively, and M. Wyman. 2014. “Safety Nets, Gap Filling and Forests: A Global-Comparative Perspective.” World Development 64 (S1): S29–42. https://doi.org/10.1016/j.worlddev.2014.03.005.
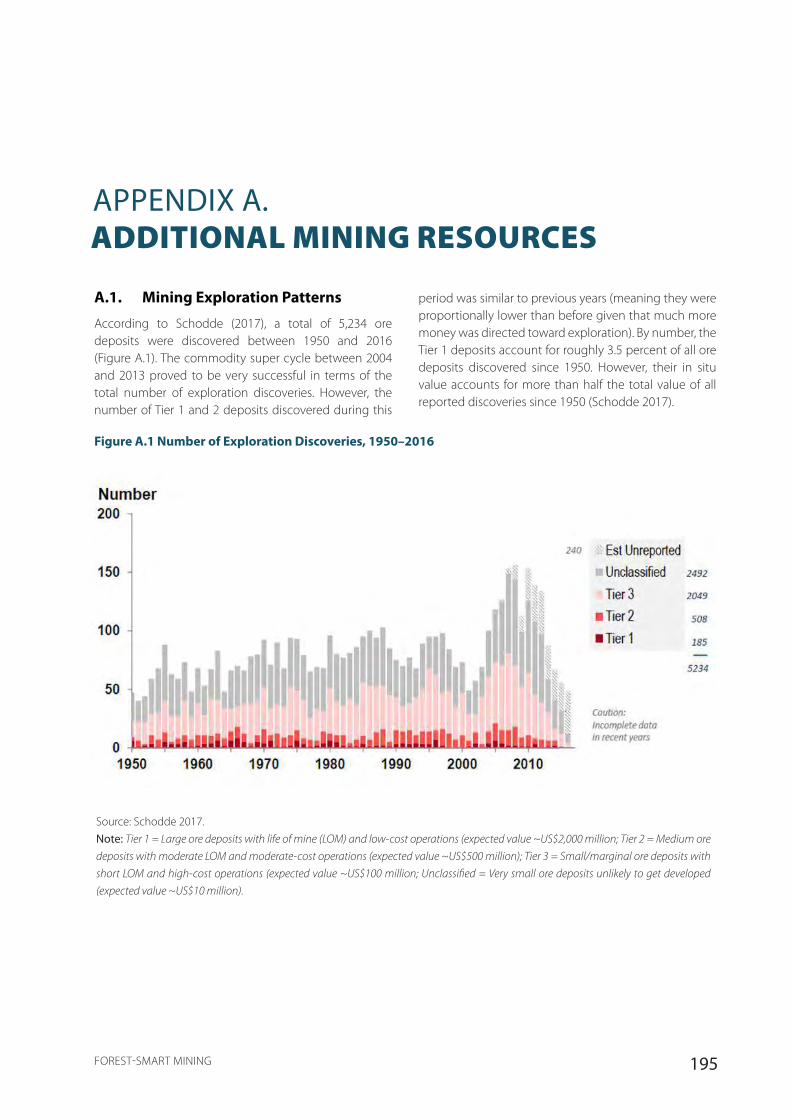
195FOREST-SMART MINING
A.1. Mining Exploration Patterns
According to Schodde (2017), a total of 5,234 ore deposits were discovered between 1950 and 2016 (Figure A.1). The commodity super cycle between 2004 and 2013 proved to be very successful in terms of the total number of exploration discoveries. However, the number of Tier 1 and 2 deposits discovered during this
period was similar to previous years (meaning they were proportionally lower than before given that much more money was directed toward exploration). By number, the Tier 1 deposits account for roughly 3.5 percent of all ore deposits discovered since 1950. However, their in situ value accounts for more than half the total value of all reported discoveries since 1950 (Schodde 2017).
APPENDIX A. ADDITIONAL MINING RESOURCES
Figure A.1 Number of Exploration Discoveries, 1950–2016
Source: Schodde 2017.Note: Tier 1 = Large ore deposits with life of mine (LOM) and low-cost operations (expected value ~US$2,000 million; Tier 2 = Medium ore
deposits with moderate LOM and moderate-cost operations (expected value ~US$500 million); Tier 3 = Small/marginal ore deposits with
short LOM and high-cost operations (expected value ~US$100 million; Unclassified = Very small ore deposits unlikely to get developed
(expected value ~US$10 million).
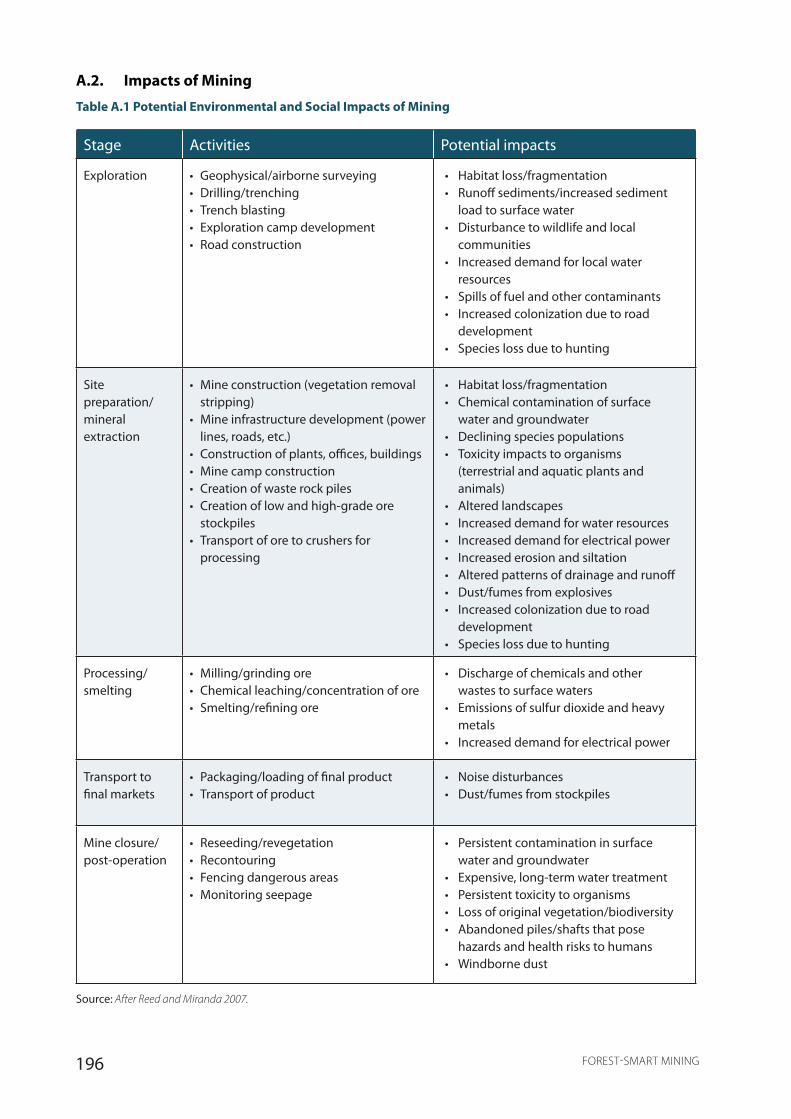
196 FOREST-SMART MINING
A.2. Impacts of Mining
Table A.1 Potential Environmental and Social Impacts of Mining
Stage Activities Potential impacts
Exploration • Geophysical/airborne surveying• Drilling/trenching• Trench blasting• Exploration camp development• Road construction
• Habitat loss/fragmentation• Runoff sediments/increased sediment
load to surface water• Disturbance to wildlife and local
communities• Increased demand for local water
resources• Spills of fuel and other contaminants• Increased colonization due to road
development• Species loss due to hunting
Site preparation/mineral extraction
• Mine construction (vegetation removal stripping)
• Mine infrastructure development (power lines, roads, etc.)
• Construction of plants, offices, buildings• Mine camp construction• Creation of waste rock piles• Creation of low and high-grade ore
stockpiles• Transport of ore to crushers for
processing
• Habitat loss/fragmentation• Chemical contamination of surface
water and groundwater• Declining species populations• Toxicity impacts to organisms
(terrestrial and aquatic plants and animals)
• Altered landscapes• Increased demand for water resources• Increased demand for electrical power• Increased erosion and siltation• Altered patterns of drainage and runoff• Dust/fumes from explosives• Increased colonization due to road
development• Species loss due to hunting
Processing/smelting
• Milling/grinding ore• Chemical leaching/concentration of ore• Smelting/refining ore
• Discharge of chemicals and other wastes to surface waters
• Emissions of sulfur dioxide and heavy metals
• Increased demand for electrical power
Transport to final markets
• Packaging/loading of final product• Transport of product
• Noise disturbances• Dust/fumes from stockpiles
Mine closure/post-operation
• Reseeding/revegetation• Recontouring• Fencing dangerous areas• Monitoring seepage
• Persistent contamination in surface water and groundwater
• Expensive, long-term water treatment• Persistent toxicity to organisms• Loss of original vegetation/biodiversity• Abandoned piles/shafts that pose
hazards and health risks to humans• Windborne dust
Source: After Reed and Miranda 2007.
197FOREST-SMART MINING
APPENDIX B. POLICY AND REGULATORY FRAMEWORKS: ADDITIONAL RESOURCES
B.1. Global Frameworks
Sustainable Development Goals
On September 25, 2015, 193 member states of the United Nations adopted Resolution 70/1, “Transforming our world: the 2030 Agenda for Sustainable Development.” The 2030 Agenda sets out 17 Sustainable Development Goals (SDGs) with 169 targets aimed at ending poverty and hunger, protecting the planet from degradation, ensuring prosperity in harmony with nature, and fostering peaceful societies. The SDGs provide a consensus-based framework and stimulus for international action to 2030.
Efforts to integrate the SDGs and targets into national policies and plans are under way and therefore will be influential in how businesses can operate in a UN member country. The ambitious and integrated nature of the SDGs requires the action of all sectors and stakeholders globally across all SDGs if the purpose is to be realized (United Nations 2015; Columbia Center on Sustainable Investment et al. 2016).
The mining sector has the potential to positively and negatively impact all 17 SDGs. A joint white paper by the Columbia Center on Sustainable Investment, United Nations Development Programme, and World Economic Forum (Columbia Center on Sustainable Investment et al. 2016) mapped the relationship between mining and the SDGs, identifying 71 of the 169 targets where mining has actual or potential impact through its core business or by leveraging its resources and partnerships. An adapted summary of the main goals and targets of relevance can be found in Table B.1.
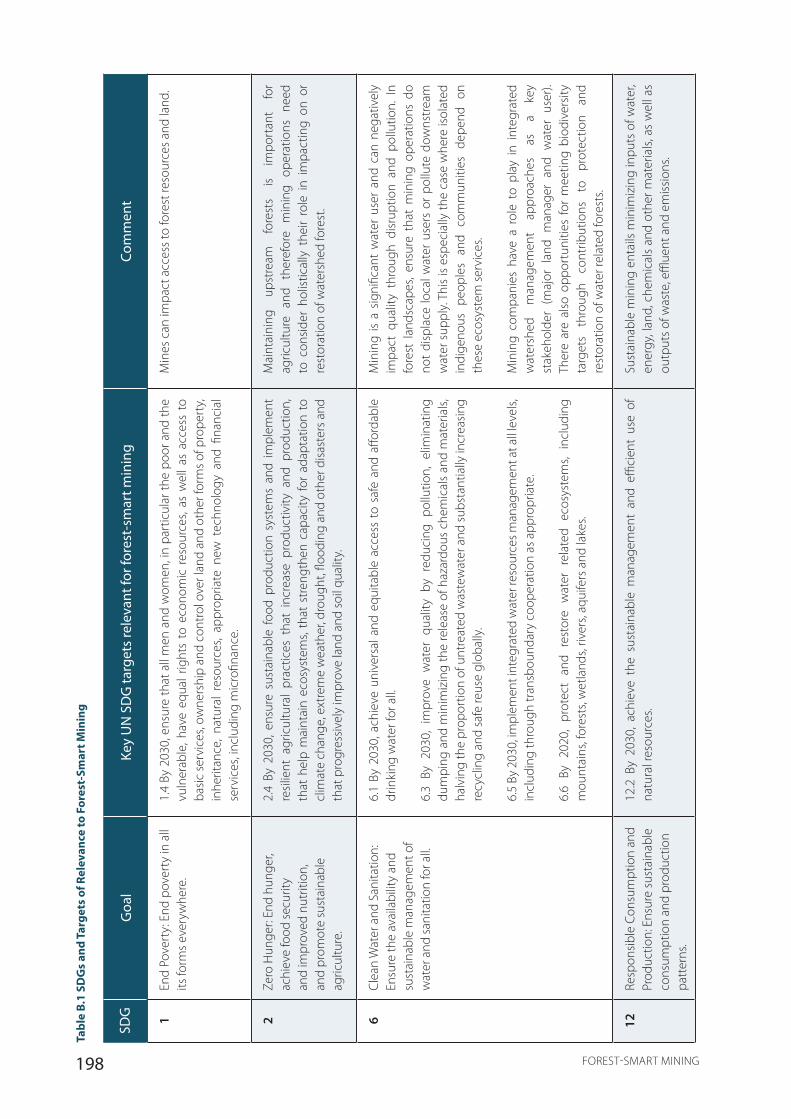
198 FOREST-SMART MINING
Tabl
e B.
1 SD
Gs
and
Targ
ets
of R
elev
ance
to F
ores
t-Sm
art M
inin
g
SDG
Goa
lKe
y U
N S
DG
targ
ets
rele
vant
for f
ores
t-sm
art m
inin
gCo
mm
ent
1En
d Po
vert
y: E
nd p
over
ty in
all
its fo
rms e
very
whe
re.
1.4
By 2
030,
ens
ure
that
all
men
and
wom
en, i
n pa
rtic
ular
the
poor
and
the
vuln
erab
le, h
ave
equa
l rig
hts
to e
cono
mic
res
ourc
es, a
s w
ell a
s ac
cess
to
basic
serv
ices
, ow
ners
hip
and
cont
rol o
ver l
and
and
othe
r for
ms o
f pro
pert
y, in
herit
ance
, na
tura
l re
sour
ces,
appr
opria
te n
ew t
echn
olog
y an
d fin
anci
al
serv
ices
, inc
ludi
ng m
icro
finan
ce.
Min
es c
an im
pact
acc
ess t
o fo
rest
reso
urce
s and
land
.
2Ze
ro H
unge
r: En
d hu
nger
, ac
hiev
e fo
od se
curit
y an
d im
prov
ed n
utrit
ion,
an
d pr
omot
e su
stai
nabl
e ag
ricul
ture
.
2.4
By 2
030,
ens
ure
sust
aina
ble
food
pro
duct
ion
syst
ems
and
impl
emen
t re
silie
nt a
gric
ultu
ral
prac
tices
tha
t in
crea
se p
rodu
ctiv
ity a
nd p
rodu
ctio
n,
that
hel
p m
aint
ain
ecos
yste
ms,
that
str
engt
hen
capa
city
for
adap
tatio
n to
cl
imat
e ch
ange
, ext
rem
e w
eath
er, d
roug
ht, fl
oodi
ng a
nd o
ther
disa
ster
s and
th
at p
rogr
essiv
ely
impr
ove
land
and
soil
qual
ity.
Mai
ntai
ning
up
stre
am
fore
sts
is im
port
ant
for
agric
ultu
re
and
ther
efor
e m
inin
g op
erat
ions
ne
ed
to c
onsid
er h
olist
ical
ly t
heir
role
in
impa
ctin
g on
or
rest
orat
ion
of w
ater
shed
fore
st.
6Cl
ean
Wat
er a
nd S
anita
tion:
En
sure
the
avai
labi
lity
and
sust
aina
ble
man
agem
ent o
f w
ater
and
sani
tatio
n fo
r all.
6.1
By 2
030,
ach
ieve
uni
vers
al a
nd e
quita
ble
acce
ss t
o sa
fe a
nd a
fford
able
dr
inki
ng w
ater
for a
ll.
6.3
By 2
030,
im
prov
e w
ater
qua
lity
by r
educ
ing
pollu
tion,
elim
inat
ing
dum
ping
and
min
imiz
ing
the
rele
ase
of h
azar
dous
che
mic
als
and
mat
eria
ls,
halv
ing
the
prop
ortio
n of
unt
reat
ed w
aste
wat
er a
nd su
bsta
ntia
lly in
crea
sing
recy
clin
g an
d sa
fe re
use
glob
ally
.
6.5
By 2
030,
impl
emen
t int
egra
ted
wat
er re
sour
ces m
anag
emen
t at a
ll le
vels,
in
clud
ing
thro
ugh
tran
sbou
ndar
y co
oper
atio
n as
app
ropr
iate
.
6.6
By 2
020,
pro
tect
and
res
tore
wat
er r
elat
ed e
cosy
stem
s, in
clud
ing
mou
ntai
ns, f
ores
ts, w
etla
nds,
river
s, aq
uife
rs a
nd la
kes.
Min
ing
is a
signi
fican
t w
ater
use
r an
d ca
n ne
gativ
ely
impa
ct q
ualit
y th
roug
h di
srup
tion
and
pollu
tion.
In
fore
st l
ands
cape
s, en
sure
tha
t m
inin
g op
erat
ions
do
not
disp
lace
loca
l wat
er u
sers
or
pollu
te d
owns
trea
m
wat
er s
uppl
y. Th
is is
espe
cial
ly th
e ca
se w
here
isol
ated
in
dige
nous
pe
ople
s an
d co
mm
uniti
es
depe
nd
on
thes
e ec
osys
tem
serv
ices
.
Min
ing
com
pani
es h
ave
a ro
le t
o pl
ay i
n in
tegr
ated
w
ater
shed
m
anag
emen
t ap
proa
ches
as
a
key
stak
ehol
der
(maj
or l
and
man
ager
and
wat
er u
ser).
Th
ere
are
also
opp
ortu
nitie
s fo
r m
eetin
g bi
odiv
ersit
y ta
rget
s th
roug
h co
ntrib
utio
ns
to
prot
ectio
n an
d re
stor
atio
n of
wat
er re
late
d fo
rest
s.
12Re
spon
sible
Con
sum
ptio
n an
d Pr
oduc
tion:
Ens
ure
sust
aina
ble
cons
umpt
ion
and
prod
uctio
n pa
tter
ns.
12.2
By
2030
, ac
hiev
e th
e su
stai
nabl
e m
anag
emen
t an
d effi
cien
t us
e of
na
tura
l res
ourc
es.
Sust
aina
ble
min
ing
enta
ils m
inim
izin
g in
puts
of w
ater
, en
ergy
, lan
d, c
hem
ical
s an
d ot
her m
ater
ials,
as
wel
l as
outp
uts o
f was
te, e
fflue
nt a
nd e
miss
ions
.
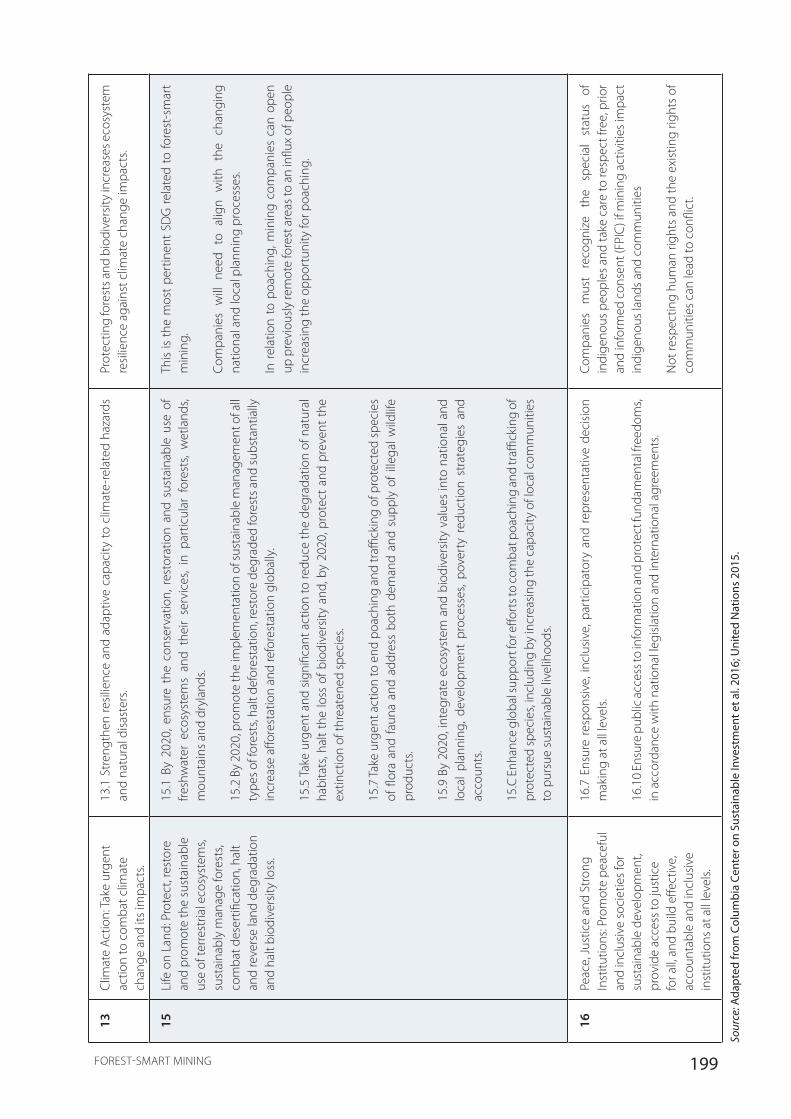
199FOREST-SMART MINING
13Cl
imat
e Ac
tion:
Take
urg
ent
actio
n to
com
bat c
limat
e ch
ange
and
its i
mpa
cts.
13.1
Str
engt
hen
resil
ienc
e an
d ad
aptiv
e ca
paci
ty to
clim
ate-
rela
ted
haza
rds
and
natu
ral d
isast
ers.
Prot
ectin
g fo
rest
s and
bio
dive
rsity
incr
ease
s eco
syst
em
resil
ienc
e ag
ains
t clim
ate
chan
ge im
pact
s.
15Li
fe o
n La
nd: P
rote
ct, r
esto
re
and
prom
ote
the
sust
aina
ble
use
of te
rrest
rial e
cosy
stem
s, su
stai
nabl
y m
anag
e fo
rest
s, co
mba
t des
ertifi
catio
n, h
alt
and
reve
rse
land
deg
rada
tion
and
halt
biod
iver
sity
loss
.
15.1
By
2020
, ens
ure
the
cons
erva
tion,
res
tora
tion
and
sust
aina
ble
use
of
fresh
wat
er e
cosy
stem
s an
d th
eir
serv
ices
, in
par
ticul
ar f
ores
ts,
wet
land
s, m
ount
ains
and
dry
land
s.
15.2
By
2020
, pro
mot
e th
e im
plem
enta
tion
of su
stai
nabl
e m
anag
emen
t of a
ll ty
pes o
f for
ests
, hal
t def
ores
tatio
n, re
stor
e de
grad
ed fo
rest
s and
subs
tant
ially
in
crea
se a
ffore
stat
ion
and
refo
rest
atio
n gl
obal
ly.
15.5
Tak
e ur
gent
and
sig
nific
ant a
ctio
n to
redu
ce th
e de
grad
atio
n of
nat
ural
ha
bita
ts, h
alt
the
loss
of b
iodi
vers
ity a
nd, b
y 20
20, p
rote
ct a
nd p
reve
nt t
he
extin
ctio
n of
thre
aten
ed sp
ecie
s.
15.7
Take
urg
ent a
ctio
n to
end
poa
chin
g an
d tr
affick
ing
of p
rote
cted
spec
ies
of fl
ora
and
faun
a an
d ad
dres
s bo
th d
eman
d an
d su
pply
of i
llega
l wild
life
prod
ucts
.
15.9
By
2020
, int
egra
te e
cosy
stem
and
bio
dive
rsity
val
ues
into
nat
iona
l and
lo
cal
plan
ning
, dev
elop
men
t pr
oces
ses,
pove
rty
redu
ctio
n st
rate
gies
and
ac
coun
ts.
15.C
Enh
ance
glo
bal s
uppo
rt fo
r effo
rts t
o co
mba
t poa
chin
g an
d tr
affick
ing
of
prot
ecte
d sp
ecie
s, in
clud
ing
by in
crea
sing
the
capa
city
of l
ocal
com
mun
ities
to
pur
sue
sust
aina
ble
livel
ihoo
ds.
This
is th
e m
ost
pert
inen
t SD
G re
late
d to
fore
st-s
mar
t m
inin
g.
Com
pani
es w
ill n
eed
to a
lign
with
the
cha
ngin
g na
tiona
l and
loca
l pla
nnin
g pr
oces
ses.
In r
elat
ion
to p
oach
ing,
min
ing
com
pani
es c
an o
pen
up p
revi
ously
rem
ote
fore
st a
reas
to a
n in
flux
of p
eopl
e in
crea
sing
the
oppo
rtun
ity fo
r poa
chin
g.
16Pe
ace,
Just
ice
and
Stro
ng
Inst
itutio
ns: P
rom
ote
peac
eful
an
d in
clus
ive
soci
etie
s for
su
stai
nabl
e de
velo
pmen
t, pr
ovid
e ac
cess
to ju
stic
e fo
r all,
and
build
effe
ctiv
e,
acco
unta
ble
and
incl
usiv
e in
stitu
tions
at a
ll le
vels.
16.7
Ens
ure
resp
onsiv
e, in
clus
ive,
par
ticip
ator
y an
d re
pres
enta
tive
deci
sion
mak
ing
at a
ll le
vels.
16.1
0 En
sure
pub
lic a
cces
s to
info
rmat
ion
and
prot
ect f
unda
men
tal f
reed
oms,
in a
ccor
danc
e w
ith n
atio
nal l
egisl
atio
n an
d in
tern
atio
nal a
gree
men
ts.
Com
pani
es
mus
t re
cogn
ize
the
spec
ial
stat
us
of
indi
geno
us p
eopl
es a
nd ta
ke c
are
to re
spec
t fre
e, p
rior
and
info
rmed
con
sent
(FPI
C) if
min
ing
activ
ities
impa
ct
indi
geno
us la
nds a
nd c
omm
uniti
es
Not
resp
ectin
g hu
man
righ
ts a
nd th
e ex
istin
g rig
hts
of
com
mun
ities
can
lead
to c
onfli
ct.
Sour
ce: A
dapt
ed fr
om C
olum
bia
Cent
er o
n Su
stai
nabl
e In
vest
men
t et a
l. 20
16; U
nite
d N
atio
ns 2
015.
200 FOREST-SMART MINING
Convention on Biological Diversity and the Aichi Biodiversity Targets
The United Nations Convention on Biological Diversity (CBD) represents the primary global framework for biodiversity conservation. It is a legally binding international treaty with the objectives of conserving biological diversity, the sustainable use of its components, and the fair and equitable sharing of the benefits arising out of the utilization of genetic resources (United Nations 1992). There are 196 parties to the convention.
The Strategic Plan for Biodiversity 2011-2020 and the Aichi Biodiversity Targets “Living in Harmony with Nature” were adopted in 2010. The plan comprises a shared vision,1 mission, five strategic goals, and 20 targets (the Aichi Biodiversity Targets); it provides a framework to establish national and regional targets and promotes the coherent implementation of the CBD objectives (CBD 2010a). Two of the targets refer specifically to forests:
• Target 5: By 2020, the rate of loss of all natural habitats, including forests, is at least halved and where feasible brought close to zero, and degradation and fragmentation is significantly reduced.
• Target 15: By 2020, ecosystem resilience and the contribution of biodiversity to carbon stocks has been enhanced, through conservation and restoration, including restoration of at least 15 percent of degraded ecosystems, thereby contributing to climate change mitigation and adaptation and to combating desertification.
The strategic plan is consistent with the 2030 agenda and the SDGs. The technical note mapping the link between the SDGs and the Aichi Targets is available from the CBD (CBD 2015).
To implement the strategic plan, countries are revising their National Biodiversity Strategies and Action Plans (NBSAP), setting new national targets, and using the NBSAP to integrate biodiversity into national development, accounting, and planning processes (CBD 2010b). This has the potential not only to influence national decision making regarding mining in forest landscapes but also to provide a framework and opportunity for mining companies to contribute to national forest-related conservation or restoration targets while contributing to global CBD commitments.
---------------------------------1 “By 2050, biodiversity is valued, conserved, restored and wisely used, maintaining ecosystem services, sustaining a healthy planet
and delivering benefits essential for all people.”
UNFCCC Paris Agreement
The Paris Agreement (FCCC/CP/2015/L.9/Rev.1) is a landmark global agreement under the United Nations Framework Convention on Climate Change. It aims to strengthen the global response to the threat of climate change by keeping a global average temperature to 2°C above preindustrial levels and pursue efforts to limit the temperature increase to 1.5°C. Additionally, it aims to increase the ability of countries to adapt to the adverse impacts of climate change (UNFCCC 2015).
The agreement was adopted by consensus in December 2015 and came into force on November 4, 2016. The agreement negotiations at COP 21 represented the largest gathering of world leaders coming together for the common cause of climate change and as of June 2017, 148 countries of the 197 parties to the convention have ratified the agreement (UNFCCC 2017).
The protection and enhancement of forests as a means of contributing to the aims is recognized in Article 5. Specifically, it calls for action to conserve and enhance sinks and reservoirs of greenhouse gases, including forests. It encourages action to implement and support “policy approaches and positive incentives for activities relating to reducing emissions from deforestation and forest degradation, and the role of conservation, sustainable management of forests and enhancement of forest carbon stocks in developing countries; and alternative policy approaches, such as joint mitigation and adaptation approaches for the integral and sustainable management of forests, while reaffirming the importance of incentivizing, as appropriate, non-carbon benefits associated with such approaches” (UNFCCC 2015).
Each party is required to provide a Nationally Determined Contribution that it intends to achieve through domestic mitigation measures. This contribution will inevitably stimulate national-level forest and climate action and provide a framework for mining in forest landscapes.
REDD+
Payments for ecosystem services (PES), specifically REDD+, also represent a framework for incentivizing the mitigation of forest losses, sometimes in association with offsetting that has been looked at in the context of mining, albeit with mixed opinions (Phalan et al. 2017) (Pilgrim et al. 2013). REDD+ stands for Reducing Emissions from Deforestation and Degradation, the “+” referring to sustainable management of forests, conservation of forest carbon stocks, and enhancement of forest carbon stocks. It has been a major policy instrument under the UNFCCC
201FOREST-SMART MINING
since 2005, focused on developing countries, although arguably it has yet to fulfill the potential first promised. The basic mechanism is the provision of compensation to countries and local forest users in return for reducing emissions from deforestation. Alongside emissions reduction, REDD+ activity can bring socioeconomic benefits and biodiversity protection. A frequent positive impact of REDD+ is in the clarity of land tenure for forest users and surrounding communities, which can bring many corollary socioeconomic benefits. Critics of REDD+ point to the technical issues and the manner and equity of the compensation provided. A major complaint is that REDD+ can provide cheap offset payments to allow unsustainable “business as usual” for damaging activities.
In preparation for REDD+, countries are required to prepare a national REDD+ strategy, identifying key drivers of deforestation and options for mitigation. Improved agricultural practices, forest conservation and management, sustainable management and utilization of forest resources and mining, appropriate energy sources, and capacity development are all thematic areas that might be included in a strategy and highlight the multisectoral challenges of addressing deforestation and forest degradation. Example activities might include: (1) conservation of high-value forest areas; (2) community-based forest management; and (3) addressing induced and indirect impacts as driver of deforestation from mining infrastructure leading to conversion of forests to agriculture. In addition, countries should submit a Forest Reference Emission Level (FREL) against which progress can be measured, a National Forest Monitoring System (NFMS), and a Safeguards Information System (SIS). These documents are generally submitted with an Investment Plan.
The potential impacts, direct and indirect, of large-scale and small-scale mining on forests already discussed mean REDD+ is potentially a highly relevant policy tool for forest-smart mining. However, the complexities of identifying and addressing these impacts is often caught up in cross-sectoral policy issues across forestry, agriculture, community development, and financial and broader economic issues. REDD+ programs at the national and project levels do frequently note the impacts of small- and large-scale mining on emissions and on deforestation in general, but activities initiated in response tend to focus on the agriculture and forestry sectors, where emissions tend to be higher. However, mining companies are increasingly looking at offsetting the environmental (and social) impacts of their activities, such as broader sponsorship of biodiversity offsets in line with the increasingly accepted mitigation hierarchy. REDD+ carbon credits as gained through a range of accreditation bodies are particularly attractive for this
purpose, but they can be an easy option for a “greenwash” (Lang 2011). Operations can also be associated with the specific development of a related REDD+ activity associated with a given mining site.
A key and growing aspect in the intersection of LSM and REDD+ is the engagement of various ministries and coordination of policies. This is proving to be an increasingly recognized positive impact of REDD+, where dialogue across—typically—finance, agriculture, lands, and community ministries in a given country is brokered through REDD+ initiatives. Local governance and community expectations are also brought into the frame where a REDD+ project provides local compensation and engagement. LSM, with its importance in national policy and planning, has the opportunity to join this broader dialogue, especially when national carbon emissions targets are required to be met.
For countries with a significant mining industry and a well-developed REDD+ policy framework, REDD+ has the potential to be an important tool in promoting forest-smart mining (Hirons 2013). In some countries, there is already evidence that the introduction of REDD policies are reducing the impacts of large-scale mining on forests despite that not being a stated objective (Laing 2015). Studies have assessed the viability of using REDD to mitigate mining forest impacts, concluding that there is clear potential but its associated with various, complex challenges around tenure, further alienation of communities, the legitimization of business as usual, cross-sectoral coordination, leakage, and corruption (Hund, Schure, and van der Goes 2017; Schure 2015). To fully realize the benefits of REDD to drive a more forest-smart mining sector, action needs to occur at a coordinated, national level; isolated activities by individual companies are not expected to be effective (Schure 2015). To this end, initial steps have been taken to design REDD+ standards specifically for the extractives industry (Hund, Schure, and van der Goes 2017). However, on a global basis, REDD+ is a widely underused tool in the drive toward forest-smart mining.
United Nations Global Compact
The UN Global Compact is a voluntary initiative based on CEO commitments to implement universal sustainability principles and to take steps to support UN goals, including the SDGs and Paris Agreement. It is the world’s largest corporate sustainability initiative, numbering more than 12,000 participants (8,000 of which are companies) across 170 countries (UN Global Compact 2017).
202 FOREST-SMART MINING
The UN Global Compact’s Ten Principles cover human rights, labor, environment, and anti-corruption and companies are supported to do business responsibly by incorporating the principles into their corporate strategies, policies, and procedures and establishing a culture of integrity. Local networks support companies to advance the initiative within different country contexts. Within its 2030 Strategy, the UN Global Compact is driving business awareness and action in full support of achieving the SDGs by 2030.
The following is pertinent to influencing forest-smart mining approaches: as of June 2017, 186 companies in the mining and industrial metals sectors and 161 banks have committed to the initiative, five of the Ten Principles are relevant relating to human rights (1 and 2) and the environment (7 and 8), the push to contribute to the SDGs includes those listed earlier as relevant to forest-smart mining.
United Nations Climate Summit New York Declaration on Forests and Action Agenda
The New York Declaration on Forests and Action Agenda is a non-legally binding political declaration to conserve, restore, and sustainably manage forests. It includes a target to cut natural forest loss in half by 2020 and strive to end it by 2030, and restore 150 million hectares of degraded land by 2020 with an additional 200 million hectares by 2030. Additionally it calls for ambitious forest targets to be included in the SDGs and to agree in 2015 that REDD+ should be part of a post-2020 global climate agreement (the Paris Agreement)—both of which have happened. The declaration was accompanied by specific action commitments (UNDP 2014).
The declaration was launched at the United Nations Climate Summit 2014, a high-level summit aimed at raising political will and action and not part of the UNFCCC negotiations. Endorsed by 190 entities from national and subnational government, NGOs, companies, and indigenous leaders, it reflects a growing political will to protect and restore forest resources.
No mining companies were signatories at the time of writing the report; however, financiers who invest or lend to the mining sector are included as are national governments of countries where mining is an important sector.
Bonn Challenge
The Bonn Challenge is a global initiative to bring 150 million hectares of the world’s deforested and degraded land into restoration by 2020, and 350 million hectares
by 2030. The 2020 target was launched in 2011 by global leaders, and endorsed and extended to 2030 by the New York Declaration on Forests at the 2014 UN Climate Summit. The Secretariat is the International Union for Conservation of Nature and it is overseen by the Global Partnership on Forest Landscape Restoration (IUCN and Bonn Challenge 2017).
The Bonn Challenge is not a new global commitment but a vehicle for realizing existing national priorities for water, food security, and rural development while contributing to international commitments on biodiversity, climate change, and land degradation.
As of June 2017, 44 national governments, private associations, and companies had pledged over 150 million hectares to the challenge (IUCN 2017). There is growing momentum and high-level interest in the challenge. Companies embarking on forest restoration within the mitigation hierarchy framework should consider the relevant national pledge as part of a forest-smart mining approach to ensure that contributions are maximized meeting both national and international commitments.
IUCN Motions
The IUCN is a membership composed of government and civil society organizations. It holds a World Conservation Congress every four years during which a series of motions (recommendations and resolutions) are passed by the IUCN membership.
In 2016, the theme was “Planet at the Crossroads” and a key topic was business and biodiversity, highlighting that there is broader recognition of the role the business community can play to meet national targets on biodiversity and delivering climate action. Of the 112 motions passed by the member states, 11 are considered key in promoting the delivery of forest-smart mining. These include strengthening protected area networks; identifying and ensuring protection of forest genetic diversity, to maintain intact forest landscapes; making the value of forests to people, economically and from a health and well-being perspective, more explicit for decision making purposes; ensuring the application of the mitigation hierarchy for projects considering biodiversity offsets; and strengthening business reporting to include more clearly their impacts and dependencies on biodiversity both directly and indirectly. The relevant motions are summarized in Table B.2.

203FOREST-SMART MINING
Table B.2 IUCN 2016 World Conservation Congress Motions Relevant to Mining and Forests
Motion Title of motion Brief summary of motion
026 Protected areas and other areas important for biodiversity in relation to environmentally damaging activities
• This motion aims to strengthen the role of protected areas in global conservation efforts and emphasizes the importance of such areas to preserving biodiversity and ecosystem services, emphasizing adherence to the “no go” option.
• It underlines that urgent action is required by governments and business to better safeguard protected areas. It stresses the need for improved regulation as well as for better law enforcement and calls on the private sector to withhold investment into and withdraw from commercial or industrial activities that can affect the integrity of these sites and other areas important for biodiversity.
040 Integrating autochthonous forest genetic diversity into protected area conservation objectives
• Recognizing the importance that genetic diversity plays in determining the sustainability of a forest ecosystem, this motion asks that states, governments, and nongovernmental organizations involved in nature conservation ensure that autochthonous forest genetic diversity is taken into account at all levels of conservation action; ensure that there is improved integration of autochthonous forest genetic diversity into the conservation goals of protected areas; recognize a protected area status (Category IV)a that corresponds to the conservation units of forest genetic diversity; encourage and facilitate the creation, expansion, monitoring and documentation of genetic resources both ex situ and close to the sites; and work in coordination with the Global Plan of Action for the Conservation, Sustainable Use and Development of Forest Genetic Resources (GPA-FGR) of the Food and Agriculture Organization of the United Nations (FAO).
041 Cooperation between the protected areas of the Guiana Shield and northeastern Amazonia
• Noting how important this area is for biodiversity, carbon, and water and the fact that illegal mining is causing immeasurable harm, the motion asks the Brazilian, French, and Surinamese states to cooperate more extensively with Guyana, Venezuela, and Colombia to protect local forests and populations in northern Amazonia and to continue their efforts to combat illegal and informal mining operations as well as all trafficking related to this activity, among other constructive community development activities.
046 Securing the future for global peatlands
• The motion is a response to the impact of forest fires and deforestation on peat ecosystems with resultant loss of biodiversity and carbon stores. The motion requests the World Commission on Environmental Law to prepare draft legislation for nations to use as a guideline recommending how to preserve and restore peatlands and how to include them alongside forests in all relevant intergovernmental agreements relating to climate change, geodiversity, and biodiversity, and recommends that states give appropriate consideration to the importance of the preservation of peatlands when implementing activities to reduce deforestation and forest degradation.
048 Protection of primary forests, ancient forests and intact forest landscapes
• Requests that forest conservation is an integral component of the work of the IUCN Program 2017–2020. It encourages states, the private sector, and international financial institutions to (1) avoid loss and degradation of primary forests, ancient forests, and intact forest landscapes; (2) promote their conservation in their development planning, NDCs, etc.; and (3) increase efforts to establish large, connected primary forest protected areas while supporting primary forest conservation initiatives through meaningful engagement with local communities and indigenous peoples.
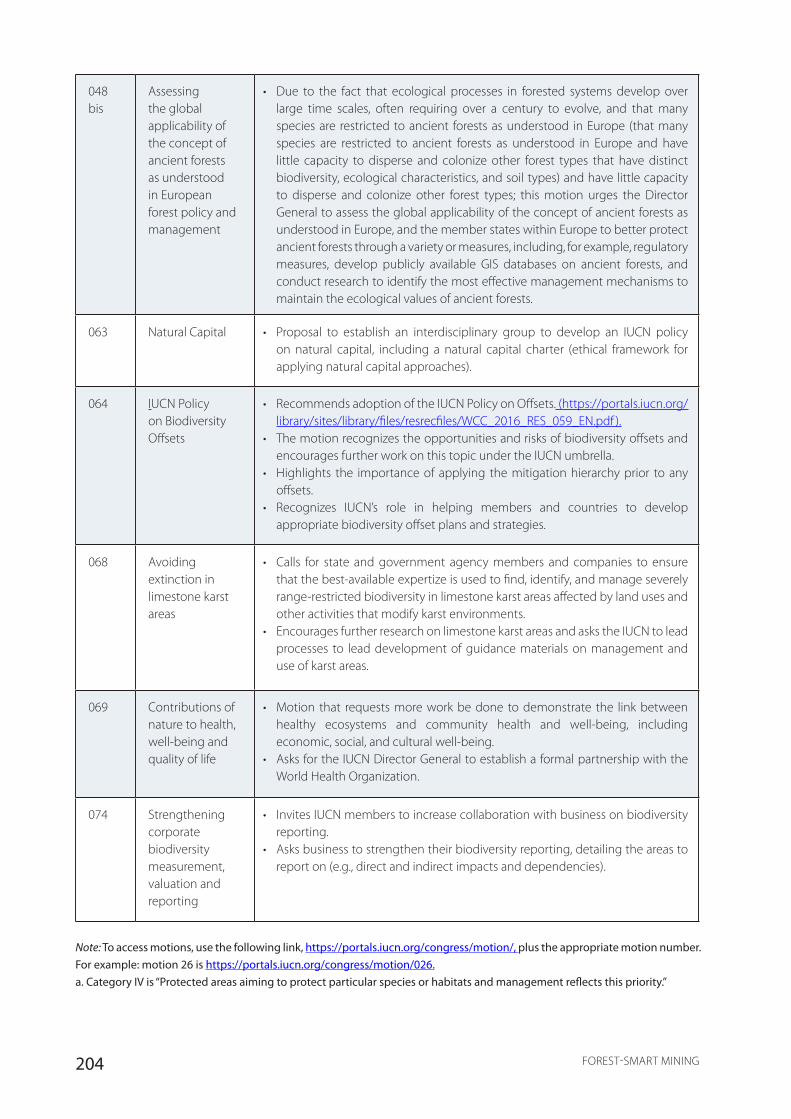
204 FOREST-SMART MINING
048 bis
Assessing the global applicability of the concept of ancient forests as understood in European forest policy and management
• Due to the fact that ecological processes in forested systems develop over large time scales, often requiring over a century to evolve, and that many species are restricted to ancient forests as understood in Europe (that many species are restricted to ancient forests as understood in Europe and have little capacity to disperse and colonize other forest types that have distinct biodiversity, ecological characteristics, and soil types) and have little capacity to disperse and colonize other forest types; this motion urges the Director General to assess the global applicability of the concept of ancient forests as understood in Europe, and the member states within Europe to better protect ancient forests through a variety or measures, including, for example, regulatory measures, develop publicly available GIS databases on ancient forests, and conduct research to identify the most effective management mechanisms to maintain the ecological values of ancient forests.
063 Natural Capital • Proposal to establish an interdisciplinary group to develop an IUCN policy on natural capital, including a natural capital charter (ethical framework for applying natural capital approaches).
064 IUCN Policy on Biodiversity Offsets
• Recommends adoption of the IUCN Policy on Offsets. (https://portals.iucn.org/library/sites/library/files/resrecfiles/WCC_2016_RES_059_EN.pdf ).
• The motion recognizes the opportunities and risks of biodiversity offsets and encourages further work on this topic under the IUCN umbrella.
• Highlights the importance of applying the mitigation hierarchy prior to any offsets.
• Recognizes IUCN’s role in helping members and countries to develop appropriate biodiversity offset plans and strategies.
068 Avoiding extinction in limestone karst areas
• Calls for state and government agency members and companies to ensure that the best-available expertize is used to find, identify, and manage severely range-restricted biodiversity in limestone karst areas affected by land uses and other activities that modify karst environments.
• Encourages further research on limestone karst areas and asks the IUCN to lead processes to lead development of guidance materials on management and use of karst areas.
069 Contributions of nature to health, well-being and quality of life
• Motion that requests more work be done to demonstrate the link between healthy ecosystems and community health and well-being, including economic, social, and cultural well-being.
• Asks for the IUCN Director General to establish a formal partnership with the World Health Organization.
074 Strengthening corporate biodiversity measurement, valuation and reporting
• Invites IUCN members to increase collaboration with business on biodiversity reporting.
• Asks business to strengthen their biodiversity reporting, detailing the areas to report on (e.g., direct and indirect impacts and dependencies).
Note: To access motions, use the following link, https://portals.iucn.org/congress/motion/, plus the appropriate motion number. For example: motion 26 is https://portals.iucn.org/congress/motion/026.a. Category IV is “Protected areas aiming to protect particular species or habitats and management reflects this priority.”
205FOREST-SMART MINING
B.2. National and Regional Frameworks
Mining companies and investors in mineral projects can choose between numerous countries when determining where and how to operate and invest. For countries interested in developing their mining sector by being open for major foreign investments, there is therefore a need to achieve a balance between enabling measures that promote exploration and those that attract investments with restrictive measures that limit and control the possible negative impacts that mining may bring (Baldwin and Cave 1999). Further, such measures must also be associated with measures that ensure meaningful stakeholder engagement processes, which can contribute to mining achieving a wider social acceptance and support (for example, Tarras-Wahlberg et al. 2017). National institutional and regulatory frameworks for mining seeking to achieve the abovementioned aims differ significantly between countries. However, some general patterns may nevertheless be discerned and these are described in the sections below.
Ownership of Natural Resources
Minerals and metals deposits may either be controlled by the state or be privately owned. The situation that prevails has to do with whether the prevalent legal system has its roots in common law, or in continental law (cf. Campbell 1956). However, the most common situation is that lesser valuable minerals are owned by the landholder, whereas precious minerals and metals are owned and/or controlled by the state. The state then issues rights and/or concessions for exploration and/or extraction. State control allows for rights for exploration and mining to be provided over privately held land even where the owner opposes such an activity. Further, state ownership allows the proceeds from a mine (taxes, royalties) to be readily distributed across a nation. The state must then ensure that such minerals projects are on balance in the best interest of the nation, and this necessarily will involve a complex process of evaluation impacts and benefits. In general, this process of evaluation is mainly performed through the environmental impact assessment process (see below).
There are some common law countries that retain extensive private ownership of minerals, as is the case on non-federal land in the United States (Campbell 1956). The fact that the minerals are privately owned means that if other stakeholders (for example, neighbors or other users of land) are not harmed by the exploration and/or mining activity, it is up to the landowner to decide whether the resource should be exploited or not. The process of assessing whether the minerals project may go ahead or not will likewise be in the form of an EIA,
as well as other applicable land use planning processes. However, the rights for other stakeholders (including the state) to interfere with or stop such a project are more limited compared to a situation where minerals are controlled by the state. Further, the state’s ability to encourage exploration and/or mining is constrained in a situation when minerals are privately owned.
The issue of how to account for mineral-related interests in local and national land use planning has proven to be problematic. This follows fundamentally because the location and size of mineral reserves (and hence importance relative to other land uses) are never known in detail. This in turn is related to the fact that exploration, and to lesser extent mining, is merely scratching the surface of the earth, and that both are conducted in a very limited geographical space. Furthermore, whether any proven reserves are economic and amenable for extraction is subject to a range of factors and thus highly uncertain to predict. Although some efforts are and have been made to designate land for mining—for example, the system of defining national interests for minerals in Sweden, or as proposed in an ongoing EU funded project (MINATURA 2017)—such initiatives are fraught with difficulties, and no known system may be seen to be truly functional.
Institutional Management of Natural Resources
Environmental issues in mining are usually controlled by the authorities in two interlinked processes, where one is a process whereby companies apply for the rights to explore and/or mine (described briefly above), and the other is the process of obtaining an environmental permit. In terms of the latter, the EIA process, with subsequent auditing and supervision, is the main regulatory tool used for controlling the environmental performance of mining projects.
In terms of the institutional set up for environmental supervision and control, different institutional and regulatory setups may be used, with the following being the most common:
• A central environmental department or agency: Responsibility for environmental supervision is placed in one specific central agency with nation-wide jurisdiction (for example, an EPA) or, as is the case in many federal countries, a corresponding authority within each state. Such organizations usually carry out the initial environmental assessment of a project as well as the ensuing control and supervision. An agency of this kind may be a semi-independent public entity, or it may be a department within the government.
206 FOREST-SMART MINING
• Environmental courts or permitting boards: Environmental permitting may be done by independent environmental courts or permitting boards, where a project is assessed according to an EIA presented by the proponent and is adjudicated base on the existing environmental (and other) legislation. Such courts or boards are typically small organizations, which rely heavily on outside expertise, for example, from a national EPA. Whereas, the courts/board decide about basic permits and conditions, the ensuing supervision and the control that requirements are met with are typically managed by other state institutions.
• Regional environmental authorities: Regional environmental public supervision entails decentralized management within a framework of national laws and regulations. Countries with a federal system of government represent a special case as they usually have separate management for each individual state or province, and the latter may even have their own environmental legislation
• Sectoral entities (for example, ministries of industry, mining, and so on): In sector wise environmental management, the responsibility for public environmental supervision within a particular sector (mining, agriculture, fishery, and so on) is left to the ministry with general responsibility for the sector. Leaving the responsibility for environmental supervision with a sector ministry involves a risk for conflict of interest. However, given that the administration of environmental matters is well separated from other issues within the ministry, such a setup may be viable, and it has been introduced with apparent success in advanced countries where a particular sector dominates the country’s economy (for example, mining in the Australian state of Western Australia).
• Mixed system: A decreasing number of countries do not have a particular authority for environmental management, and such matters are instead dealt with within the traditional sector ministries (compare the sectoral approach, above). It should be noted though that whereas large and developed industrialized nations often have a central agency for environmental issues, the supervision and control of environmental issues are typically managed in complex systems with interplay between various authorities, and a very considerable intervention by courts of justices at different levels.
B.3. Industry Frameworks
Much of the change happening around the mining-forest interface is actually being driven by the business sector, both by the mining sector itself and by those financing it. Such initiatives are increasingly being used by mining companies to help demonstrate that they are operating responsibly and by their financial backers to reduce investment risk; some schemes may also be used by civil society actors to hold mineral companies to account (Mori Junior, Franks, and Ali 2015). These schemes have the potential to promote or hinder forest-smart approaches in the mining sector. This section outlines a selection of such initiatives. It includes an overview of the mitigation hierarchy; while not a specific industry initiative itself, it is a widely accepted framework that is increasingly being used to inform and underpin industry and policy frameworks.
The Environmental Impact Assessment Process and Its Limitations
The EIA/ESIA is the standard approach for companies looking to understand, mitigate, and manage their impacts on the environment. However, various issues limit their effectiveness.
One limitation is that only the direct footprint of a mining operation and its ancillary infrastructure are generally assessed, ignoring the impacts on forest invasions, hunting, land speculation, and secondary road expansion (Laurance, Goosem, and Laurance 2009). In other cases, such as for certain mines, hydroelectric dams, and other large developments, the EIA focuses on the project itself but ignores the impact that associated infrastructure will have (Gough, Innes, and Allen 2008). In Brazil, for instance, EIAs of major new Amazonian highways were confined to a narrow swath along the road route itself, sometimes recommending such minor mitigation measures as “helping” animals to move from the planned route before road building (Gough, Innes, and Allen 2008). New roads and highways linking mineral exploitation projects will continue to be major drivers of rain forest loss and degradation so long as the EIA process is so fundamentally flawed. Efforts to promote mineral extraction in the tropics are perhaps the most striking example of how regional integration and economic development can be directly at odds with nature conservation.
Evidence suggests that even when ecological damage is anticipated and there is a corresponding loss of livelihoods, local communities tend to enter into negotiations that focus on employment opportunities, economic compensation, small local business promotion, and the implementation of social development projects
207FOREST-SMART MINING
(see, for example, Arellano-Yanguas 2013). On top of this, the integrity of the ESIA process in presenting the risks associated with loss of ecological health are often not well presented or transparent, and the health and welfare impacts associated with the development are inadequately addressed.
A core issue associated with environmental assessment practice relates to inadequate compliance with, and poor timing in the application of the mitigation hierarchy. While there has been considerable uptake of the MH as a framework for alleviating environmental harm from development projects (that is, in policy and legislation, major mining and oil and gas industries, and major MFIs), MH application on the ground continues to be inconsistent, patchy, and with inadequate attention to impact avoidance. Moreover, the extent to which the MH is being internalized and applied across sectors (beyond mining and oil and gas)—notably infrastructure, agriculture and forestry—has received more limited attention. Sectoral bias (due in part to the perception of nonapplicability) and absence of integrated land use plans have also limited the extent to which the application of the MH has been considered and applied across multiple sectors operating within a given landscape (P. Howard, pers. expertise).
It is under these international frameworks that we foresee leverage in promoting and obtaining adequate safeguards to ensure that EIAs are of “international” quality, that mitigations are appropriate and are adhered to, and that they are coupled with enforcement via fines or capital withholding. Obtaining a within-mine EIA framework of international standard is thus the immediate key challenge. However, even international-standard EIA processes usually ignore or underestimate the multitude of secondary effects of mine development, especially those on broader development patterns (Laurance, Goosem, and Laurance 2009). In particular, mining companies need to be encouraged to engage in addressing their off-site impacts. This can be undertaken in collaboration with governments, who also need to play a leadership role to address macro-level environmental, economic, and social impacts.
The Mitigation Hierarchy and Biodiversity Offsets
The mitigation hierarchy is a set of four prioritized steps to alleviate environmental harm as far as possible through avoidance, minimization (or reduction), restoration of detrimental impacts to biodiversity, and finally offsetting any residual impacts that may remain. Biodiversity offsetting is only considered appropriate to address residual impacts after all efforts to avoid, minimize, and restore detrimental impacts have been applied.
This approach favors early awareness and action to proactively and efficiently achieve “no net loss” or a “net gain” to biodiversity. The mitigation hierarchy is now widely accepted as an approach for biodiversity conservation for sustainable development. To comply with IFC Performance Standard 6 and the performance standards of several other multilateral finance institutions, a project proponent must develop and verify the implementation of a mitigation hierarchy that complies with the standard.
1. Avoidance: Includes activities that change or stop actions before they take place, to prevent their expected negative impacts on biodiversity and decrease the overall potential impact of an operation (Hime 2012) (BBOP 2012). For example, adjusting the location, scope, or timing of a development could avoid negative impacts to a vulnerable species or sensitive forest ecosystem. Avoidance not only makes good business sense—for example, by reducing later steps in the mitigation hierarchy—but also is imperative for protecting the integrity of valuable and threatened biodiversity and ecosystem services.
2. Minimization: Measures that are taken to reduce the duration, intensity, extent, and/or likelihood of impacts that cannot be completely avoided (BBOP 2012). An example of a minimization measure would be improvement to the quality treatment of water outflows from mining areas, thereby reducing impacts on aquatic systems (Temple et al. 2012).
3. Restoration: Involves altering an area in such a way as to reestablish an ecosystem’s composition, structure, and function, usually bringing it back to its original (pre-disturbance) state or to a healthy state close to the original (BBOP 2012). This is a holistic process aiming to return an ecosystem to a former natural condition and to restore ecological function. Restoration is preferred to rehabilitation, which implies putting the landscape to a new or altered use to preserve a particular human purpose.
4. Biodiversity offsets: These are measurable conservation outcomes resulting from actions designed to compensate for significant residual adverse biodiversity impacts arising from project development and persisting after appropriate avoidance, minimization, and restoration measures have been taken (BBOP 2009). Biodiversity offsets are effectively a “last resort.” A biodiversity offset should be designed and implemented to achieve measurable conservation outcomes that can
208 FOREST-SMART MINING
reasonably be expected to result in no net loss and preferably a net gain of biodiversity. A net gain is required in critical habitats—habitats with high biodiversity value, as defined by IFC (IFC 2012b).
Industry Partnerships
Industry initiatives such as the International Council on Mining and Metals and the Cross-Sector Biodiversity Initiative have an important role to play in driving improvements in social and environmental performance in the mining sector. They provide a common space for mining companies to share challenges and experience and to promote continuous improvement. Through these initiatives, practical guidance and tools have been produced to support good practice biodiversity and ecosystem service management (for example, CSBI 2015; Gullison et al. 2015), resources that are commonly referred to by the finance sector, among others.
ICMM membership includes 23 of the world’s leading mining and metals companies, and all members are required to commit to ICMM’s 10 core principles. These are intended to serve as a best-practice framework for sustainable development in the mining and metals industry. Principle 6 focuses on pursuit of continuous improvement in environmental performance; Principle 7 requires contribution to the conservation of biodiversity and integrated approaches to land use planning. Trade association codes, such as the ICMM’s principles, are valued by stakeholders though they appear not to be seen as drivers for responsible mining—perhaps because they are perceived to be industry-driven response frameworks rather than an external driver (WEF 2016).
Voluntary Standards Schemes
There has been a proliferation of voluntary responsible mining initiatives (principles, standards, certification schemes, guidelines, and so on) in recent years. Some focus on different elements of responsible mining (for example, stakeholder relations, respect for indigenous peoples, implementation of the UN Guiding Principles on Business and Human Rights, use of cyanide, management of water, application of the mitigation hierarchy, and so on), while others specialize in particular mining sectors, such as gold (for example, the Conflict-Free Gold Standard), coal (for example, the Bettercoal Code), bauxite (for example, the Aluminium Stewardship Initiative Standards), steel (Responsible Steel), or tin (for example, the ITRI Tin Supply Chain Initiative). Some have been developed for particular groups, such as small-scale or artisanal miners (for example, Alliance for Responsible Mining, Better Gold Initiative, and Fairmined Standard
for Gold and Associated Precious Metals). Others rank companies by performance, such as the Responsible Mining Index (RMF 2017).
In principle, such schemes can play an important role in driving change toward more sustainable practices, particularly if supported by policy. Aside from regulation, pressure or requirements from downstream manufacturers or suppliers was identified as a strong driver toward more responsible mineral development (WEC 2015). Thus, the influence of initiatives aimed here may prove influential in supporting or driving forest-smart approaches. However, there is concern that initiatives are numerous but not comprehensive. The need for greater coherence, interoperability, cross-recognition, and consolidation of the array of minerals-based standards has been highlighted (WEF 2016; Mori Junior and Ali 2016). Moreover, with many recently established and emerging schemes questions have been asked about the effectiveness of voluntary schemes in driving positive change (Mori Junior, Sturman, and Imbrogiano 2017; McCarthy and Morling 2015; Changing Markets Foundation 2018).
For this report, we highlight three initiatives to illustrate the different types of voluntary initiatives, variation in the incorporation of biodiversity and ecosystem service considerations and potential implications for forest-smart mining:
• Initiative for Responsible Mining Assurance: IRMA aims to establish a multistakeholder and independently verified responsible mining assurance system that improves social and environmental performance across all kinds of industrial mining2 globally—comparable to the Forest Stewardship Council certification program. Version 2.0 of the IRMA standard has been released for consultation (as of June 2017) and includes requirements relating to biodiversity and protected areas including identification of no-go areas that cover a broader range of priority areas than is often considered—for example, World Heritage sites, sites on a state party’s official Tentative List for WHS inscription, IUCN category I–III protected areas, core areas of UNESCO biosphere reserves, and areas where indigenous peoples live or are assumed to live in (voluntary) isolation. For biodiversity outside of protected areas, requirements are framed around process rather than objectives—that is, requiring a biodiversity impact assessment, management plan, monitoring, and corrective actions. No net loss or net gain objectives feature within the requirements for
-----------------------------2 Excluding thermal coal and uranium, as of June 2017.
209FOREST-SMART MINING
the biodiversity management plan. Protected areas, wetlands, and HCVs 1–3 receive specific mention as areas that should be prioritized for avoidance. By deferring to the HCV approach, the IRMA standard recognizes the importance of species diversity (HCV 1), landscape-level ecosystems and mosaics (HCV 2), and rare, threatened, or endangered ecosystems, habitats, or refugia.
• Aluminium Stewardship Initiative: ASI has developed standards for global application across the aluminum value chain. The standards are designed to enable the aluminum industry to demonstrate responsibility and provide independent and credible assurance of performance. The standards (ASI 2014) include requirements relating to biodiversity under Principle 8 such that companies are expected to manage their biodiversity impacts in accordance with the mitigation hierarchy. Specific biodiversity-related objectives (for example, no net loss) are not stipulated and individual components of biodiversity are not specified. Criteria include requirements for the assessment of risk and materiality of biodiversity impacts and dependencies and implementation of monitoring of a Biodiversity Action Plan. ASI requires commitment from mining companies to “no go” in World Heritage sites.
• Standard for Sustainable and Resilient Infrastructure: SuRe is one of the only standards to also embrace the concept of resilience. While not a mining standard per se, it is a global voluntary standard and certification scheme that aims to integrate sustainability and resilience aspects into infrastructure development and upgrade, focusing on infrastructure that meets public needs (SuRe 2016). SuRe is relevant in the context of forest-based mining and extractive sites and related infrastructure services (water, waste, energy, transport, and so on). SuRe defines resilience as “the capacity of socio-ecological systems to function so that the people living and working in them—particularly the poor and vulnerable—survive and thrive no matter what stresses or shocks they encounter.” The standard includes no net loss requirements for biodiversity and ecosystem services, makes specific reference to avoiding impacts on ecological corridors, and requires integration of ecosystem services into project design. Notably, there is specific reference to forest restoration and conservation as a performance criteria (#3.2.3), encouraging projects to achieve “zero net loss” of forests. Where deforestation is unavoidable, “at least an equivalent area should be afforested / reforested”; in this context, there is no consideration of forest condition or function, connectivity with other forest (or other
natural) areas, nor to associated biodiversity value. In the absence of more detailed guidance, this is likely to prove a key limitation and is unlikely to be conducive to forest-smart approaches.
How Do LSM-Orientated Industry Standards Address ASM?
Best-practice standards for LSM primarily address ASM through provisions for engaging with artisanal or small-scale miners where they operate on LSM concessions or where they are negatively affected by LSM operations. These engagement provisions can directly refer to ASM, such as in the draft Responsible Mining Index (ABS 2015), or may indirectly encompass engagement with ASM by recommending that LSM companies commit to contributing to sustainable development, such as in the 10 Principles of the ICMM (Dufils 2004). IRMA is currently organizing consultations to develop guidelines for LSM companies on their interactions with ASM.
Commodity-specific standards also often include specific provisions for ASM engagement. For example, the Bettercoal Code calls for companies to engage with local stakeholders at their site, including artisanal and small-scale miners, regarding social and environmental impacts, mine closure, and rehabilitation plans. It also calls for companies to promote the professionalization and formalization of ASM where it occurs within their areas of operation (Ingram and Dawson 2003).
While these guidelines do not explicitly address the environmental effects of ASM, ASM operating in or near LSM concessions can undermine environmental impact mitigation plans. Engaging with ASM and ensuring that potential conflicts around access to resources are minimized are therefore key steps toward reducing any additional environmental pressure being exerted by ASM activities.
Small-scale mining companies can face expertise or resource deficits in becoming certified and operating according to guidelines. Certification standards should recognize this and aim to remove potential barriers to smaller operators, such as by simplifying reporting requirements and minimizing bureaucratic hurdles (ABS 2015). The Initiative for Responsible Mining Assurance is currently considering options for making the IRMA standard more accessible to such smaller entities.
Corporate Reporting and Commitments
Company reporting has been highlighted as an important policy lever to promote data collection and transparency in the mining sector (Chatham House
210 FOREST-SMART MINING
2015). The Global Reporting Initiative aims to ensure that sustainability is part of business strategy and encourages companies to consider sustainability along their supply chains (Chatham House 2015). The GRI framework requires reporting on significant direct and indirect impacts for biodiversity (GSSB 2016) with reference to species affected, extent of areas impacted, duration of impacts, and reversibility or irreversibility of impacts. Considerations relating to habitat conversion, reduction in species, and changes in ecological processes are explicit in Disclosure 304-2, but organizations are not required to report on all these aspects. Reporting requirements for habit protection and restoration include confirmation of whether success has been approved by independent external professionals and condition of the area at the close of reporting period. Reporting requirements for species are limited to the total number of IUCN Red List species and national conservation list species with habitats in areas affected by the operations of the organization, broken down by level of extinction risk. Reporting requirements thus provide more limited insight into ecologically relevant aspects, including, for example, functionally important species or habitats (for example, keystone species, ecosystem engineers) and processes (for example, connectivity).
Also relevant in the context of forest-smart mining is the Carbon Disclosure Project, a global disclosure system that asks companies, cities, states, and regions for data on environmental performance through a standardized reporting system. Critical environmental risks, opportunities, and impacts are analyzed, and this information is made available to help investors, businesses, and policy makers in decision making, risk management, and identification of opportunities. The CDP’s forests program collects information relating to the four agricultural commodities responsible for most deforestation: timber, palm oil, cattle, and soy. CDP’s latest publication, reflecting input from 187 companies, reports that $906 billion in annual corporate turnover is at risk because of deforestation (CDP 2016).
Company-wide commitments to integrating biodiversity and ecosystem services considerations into mining businesses vary widely. Compared to other sectors, relatively high numbers of mining companies have set no net loss or net gain goals, most including biodiversity (Rainey et al. 2015). Newmont, for example, has set a requirement of no net loss and, when possible, a net gain of key biodiversity values in the area of interest within 10 years after mine closure for new projects and expansions, with no additional loss of key biodiversity values by the time mine closure is required for operational sites. The company makes explicit its commitment to maintaining overall ecosystem health and resilience in the areas it operates and the dependencies of communities
and operations on healthy functioning ecosystems (Newmont 2014). However, the detail and quality of no net loss or net gain goals varies considerably and so too has progress toward real outcomes on the ground (Rainey et al. 2015).
One of the highest profile corporate commitments in recent years has been the number of companies signing up to zero (net) deforestation commitments, although these have been primarily those with agricultural commodity supply chains. According to recent analyses, 62 percent of companies (447 out of 718) with supply chains dependent on the commodities responsible for most deforestation (palm oil, timber and pulp, soy and/or cattle) have made a total of 760 commitments to reducing deforestation impacts in their commodity supply chains (Donofrio, Rothrock, and Leonard 2017). Some of the largest companies are leveraging considerable influence by integrating deforestation considerations into decision making on spending of multimillion-dollar procurement budgets. Progress in fulfilling zero net deforestation commitments varies considerably: from no action at all to those making tangible steps forward, including, for example, putting in place robust policies for sustainable sourcing of forest risk commodities, improving traceability of their commodities, and procuring certified sustainable commodities (Bregman et al. 2016). The mining sector could learn lessons from these efforts in order to improve data collection and transparency in mineral supply chains and monitor the sector’s forest impacts (Chatham House 2015). To date, the mining sector is yet to make such corporate-level commitments to reducing or halting deforestation.
International Finance Sector Frameworks
Access to capital is an important driver for responsible mining (WEF 2016) and the financial sector has a crucial role to play in reducing impacts of mining on forests (Chatham House 2015) through their environmental and social safeguards (ESS). Most MFIs3 have developed ESS that set out their procedures for screening the environmental and social risk of the interventions they support and determining the level of assessment and mitigation or management that should be applied. Many, though not all, bilateral agencies have adopted safeguards systems, in some cases to comply with national legislation.
IFC Performance Standard 1 (“Assessment and management of environmental and social risks and ------------------------------------3 Including but not limited to the European Bank for Reconstruction and Development, European Investment Bank, African Development Bank, Asian Development Bank, Inter-American Development Bank, World Bank Group, International Finance Corporation.

211FOREST-SMART MINING
impacts”) and 6 (“Biodiversity conservation and sustainable management of living natural resources”) are widely considered international best practice, with influence extending beyond IFC’s direct clients.
Many commercial banks have adopted the Equator Principles, which is a risk management framework based on the IFC Performance Standards, as part of the lending approval process (Chatham House 2015). The Equator Principles are intended to “provide a minimum standard for due diligence to support responsible risk decision-making.” As of June 2017, 90 Equator Principles financial institutions in 37 countries had officially adopted the Equator Principles (Equator Principles Association, n.d.).
• IFC’s PSs have informed the evolution of performance standards and safeguards among other MFIs—both through their alignment with PS6 (see, for example, World Bank 2016) and/or deviation from PS6 (for example, in relation to core principles, scope, objectives, approach, preferred methods, and so on).
• With the increasing adoption of NNL objectives in national policy, some government ministries have sought to align with PS6, for example, through permitting conditions for mining projects in Liberia (Johnson 2015).
• Voluntary standards for the mining industry commonly refer to or explicitly incorporate elements of the IFC Performance Standards, including PS6.
• Some companies have revised their internal policies to align with PS6 and/or are voluntarily applying PS6 as best practice.
In this way, the IFC PSs and their future evolution have an important role to play to driving improvements in environmental performance in the LSM sector. It is worth recognizing, however, that such widespread influence also means that any potentially adverse effects resulting from the application of PS6 could be magnified, particularly where the understanding and interpretation of PS6 differs from its original intent and/or where PS6 is being adopted in part or isolation from the other PSs. One of the key factors influencing the role of the finance sector and their respective ESS in supporting forest-smart mining will be implementation on the ground. Data deficiencies and capacity constraints have been cited as barriers to effective implementation and compliance monitoring, particularly when dealing with complex socio-ecological aspects, and will be a relevant concern in remote and unstudied forest ecosystems. Inconsistencies in the interpretation and application of the ESS by practitioners and experts have also been highlighted (Howard and Jenner 2016) and in some cases the approaches and methodologies used to apply
ESS risk undermining the integrity and viability of species and ecosystems affected by mining developments. The extent to which the finance sector can influence forest-smart approaches to mining will further be affected by the extent to which financial institutions are effective in applying their ESS and ensuring compliance. Failure to do so can result in, or allow for, poor planning, inadequate ESIA and high-impact mining projects. The timing and duration of their engagement with a project also has a bearing on environmental outcomes. Early engagement in the project cycle offers the best opportunity to influence the ESIA and prioritization of impact avoidance and minimization.
The ESS systems of the MFIs are harmonized to a high degree, having a similar structure, requiring systematic screening of environmental and social risks, and covering a common set of environmental and social issues. However, the ESS systems do vary in ways that have potential implications in the context of forest-smart mining. In this section, we illustrate some of the variation in approaches most relevant in the context of forest-smart mining.
A key point of differentiation among the ESS systems of the major MFIs relates to the process of determining the critical nature of habitat. Areas identified as critical habitat are considered highest priority and demand the most stringent avoidance and/or mitigation measures. Many MFIs will not finance projects that are anticipated to result in significant adverse impacts to critical habitat. Thus, the approach taken to determining critical habitat is significant in the context of forest conservation and the potential for MFI ESS systems to support forest-smart approaches in the mining sector.
For some, including the European Investment Bank (EIB), there is a presumption of criticality given the intrinsic value of biodiversity and the burden of proof is on the client to demonstrate the absence of critical habitat at the project site (EIB 2013). For others, areas identified as critical habitat are intended to focus on the most globally significant sites for the persistence of a particular species, ecosystem or process (for example, IFC 2012). Thus, it becomes the responsibility of the client (and in some cases civil society) to demonstrate the presence of critical habitat. Also relevant is the way in which natural habitat is treated in terms of assessment and impact mitigation.
Critical habitat is typically determined by attributes outlined in the ESS of the respective MFI. Attributes typically include presence of, or habitat important, for critically endangered and endangered species, endemic or geographically restricted species, and globally significant migratory or congregatory species. Threatened or unique ecosystems, areas associated with key evolutionary processes, and ecological processes
212 FOREST-SMART MINING
vital for maintaining the viability of critical biodiversity are also commonly considered.
Additional attributes that may be considered by some MFIs in determining critical habitat include the following:
• Areas crucial for vulnerable species (for example, EIB 2013; IDB 2007), near threatened species (for example, IDB 2007)
• Areas important for keystone species (for example, AfDB 2013; EBRD 2014b; IFC 2012a)
• Areas highly suitable for biodiversity conservation (for example, IDB 2007)
• Areas that supply ecological networks or provide connectivity (for example, AfDB 2013)
• Areas critical for the viability of migration routes of migratory species (for example, IDB 2007)
• Areas required for the maintenance of biodiversity with significant social, economic, or cultural importance to local communities (for example, EIB 2013)
• Areas required for the maintenance of ecosystem functioning and the provision of key ecosystem goods and services (for example, EIB 2013)
• Areas holding key scientific value (for example, EIB 2013)
These attributes are highly relevant in the context of forest biodiversity and ecosystem conservation. By elevating their importance in the respective ESS systems, it demonstrates a deeper appreciation of the critical role that some species (for example, keystone species) and ecological processes (for example, connectivity) play in
maintaining ecosystem health, function, and resilience, and the importance of maintaining ecosystem integrity.
Approaches to determining the critical nature of habitat vary considerably (Howard and Jenner 2016), from systematic criteria-led approaches (for example, IFC 2012a, 2012b) to those driven more heavily by stakeholder and expert input (for example, AfDB 2013) and others that emphasize a strong understanding of the ecology and conservation priorities of the landscape (for example, EIB 2013; IDB 2007). Some apply thresholds based on global distribution and representation at species level; others refer to national and/or local representation and site specificities, with recognition for genetically distinct subspecies, subpopulations, races, and communities (Howard and Jenner 2016).
The ESS systems that (a) apply a socio-ecological approach are explicit in requirements for maintaining ecological patterns and processes, and (b) actively seek to maintain ecosystem structure, function, and resilience (that is, considering the integrity of the whole rather than focusing primarily on individual components within) are likely to be more sympathetic to, and have potential to drive improvements in, forest-smart mining in the future. In this respect, the Inter-American Development Bank (IDB) warrants particular mention owing to their emphasis on maintaining ecosystem intactness with the number of hectares of intact habitat secured alongside a project being an important measure of conservation success.
213FOREST-SMART MINING
APPENDIX C. CURRENT, PAST AND FUTURE STATUS OF LSM IN FORESTS: ADDITIONAL RESOURCES C.1. Key Commodities Mined in Forests Table C.1 (next page) Extent to Which Different Minerals Are Mined in Forests by Country
C.2. Using Kriging Analysis to Explore Future Mining Hotspots
Another way of projecting forward is to analyze past trends in the presence of mining in forests using a kriging analysis1 to those areas where mining in forests is most likely. Combining these data with geological deposits could provide a generalized overview of those areas that are most at risk of forest mining into the future. Figure C.1 shows that most forest regions have a high likelihood of forest mining due to the presence of current mining sites within those forest regions. Areas less likely to experience mining in forests include inaccessible zones such as the eastern Peruvian region bounded by the Andes and the Himalayas; areas that fall outside of this accessibility parameter but still lack mining in forests are southern Chile, central Russia, and western Ethiopia.
Figure C.1 (page 211) Modeled LSM Risk in Forested Areas
----------------------------------------1 Kriging assumes that the distance or direction between sample points reflects a spatial correlation that can be used to explain variation in the surface. The kriging tool fits a mathematical function to a specified number of points, or all points within a specified radius, to determine the output value for each location. Kriging is a multistep process; it includes exploratory statistical analysis of the data, variogram modeling, creating the surface, and (optionally) exploring a variance surface.
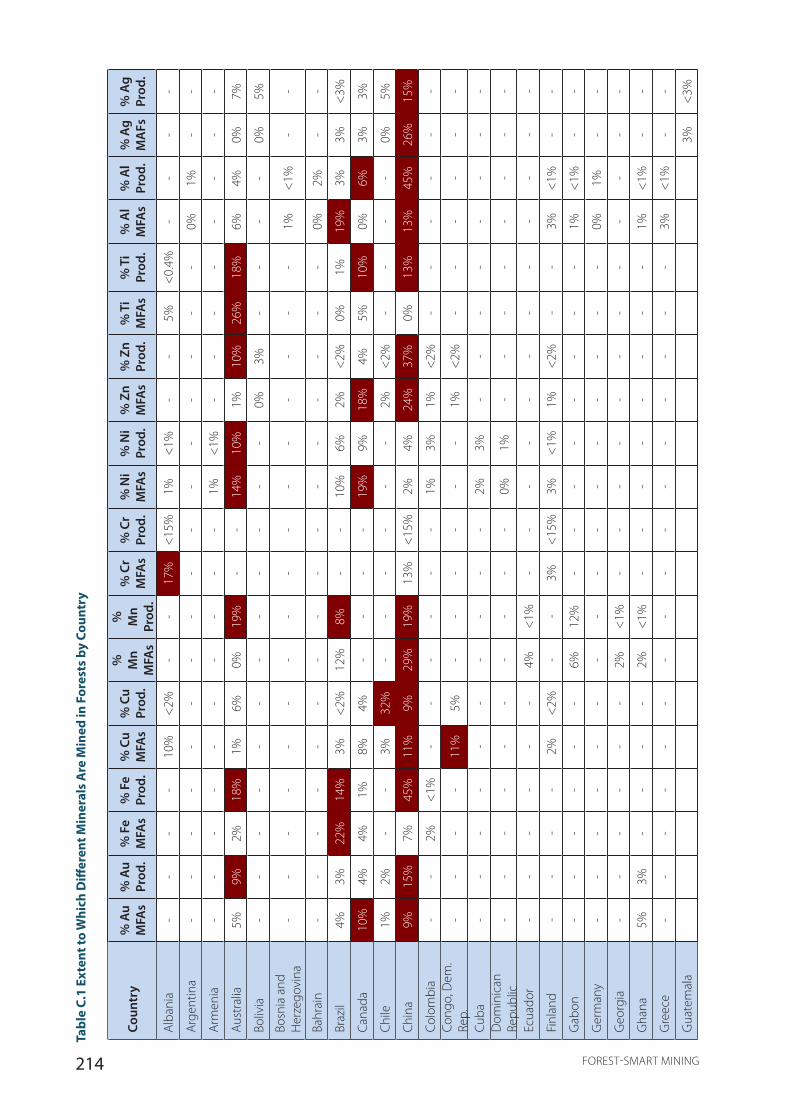
214 FOREST-SMART MINING
Coun
try
% A
u M
FAs
% A
u Pr
od.
% F
e M
FAs
% F
e Pr
od.
% C
u M
FAs
% C
u Pr
od.
%
Mn
MFA
s
%
Mn
Prod
.
% C
r M
FAs
% C
r Pr
od.
% N
i M
FAs
% N
i Pr
od.
% Z
n M
FAs
% Z
n Pr
od.
% T
i M
FAs
% T
i Pr
od.
% A
l M
FAs
% A
l Pr
od.
% A
g M
AFs
% A
g Pr
od.
Alba
nia
--
--
10%
<2%
--
17%
<15
%1%
<1%
--
5%<
0.4%
--
--
Arge
ntin
a-
--
--
--
--
--
--
--
-0%
1%-
-
Arm
enia
--
--
--
--
--
1%<
1%-
--
--
--
-
Aust
ralia
5%9%
2%18
%1%
6%0%
19%
--
14%
10%
1%10
%26
%18
%6%
4%0%
7%
Boliv
ia-
--
--
--
--
--
-0%
3%-
--
-0%
5%
Bosn
ia a
nd
Her
zego
vina
--
--
--
--
--
--
--
--
1%<
1%-
-
Bahr
ain
--
--
--
--
--
--
--
--
0%2%
--
Braz
il4%
3%22
%14
%3%
<2%
12%
8%-
-10
%6%
2%<
2%0%
1%19
%3%
3%<
3%
Cana
da10
%4%
4%1%
8%4%
--
--
19%
9%18
%4%
5%10
%0%
6%3%
3%
Chile
1%2%
--
3%32
%-
--
--
-2%
<2%
--
--
0%5%
Chin
a9%
15%
7%45
%11
%9%
29%
19%
13%
<15
%2%
4%24
%37
%0%
13%
13%
45%
26%
15%
Colo
mbi
a-
-2%
<1%
--
--
--
1%3%
1%<
2%-
--
--
-Co
ngo,
Dem
. Re
p.-
--
-11
%5%
--
--
--
1%<
2%-
--
--
-
Cuba
--
--
--
--
--
2%3%
--
--
--
--
Dom
inic
an
Repu
blic
--
--
--
--
--
0%1%
--
--
--
--
Ecua
dor
--
--
--
4%<
1%-
--
--
--
--
--
-
Finl
and
--
--
2%<
2%-
-3%
<15
%3%
<1%
1%<
2%-
-3%
<1%
--
Gab
on-
--
--
-6%
12%
--
--
--
--
1%<
1%-
-
Ger
man
y-
--
--
--
--
--
--
--
-0%
1%-
-
Geo
rgia
--
--
--
2%<
1%-
--
--
--
--
--
-
Gha
na5%
3%-
--
-2%
<1%
--
--
--
--
1%<
1%-
-
Gre
ece
--
--
--
--
--
--
--
--
3%<
1%-
-
Gua
tem
ala
3%<
3%
Tabl
e C.
1 Ex
tent
to W
hich
Diff
eren
t Min
eral
s A
re M
ined
in F
ores
ts b
y Co
untr
y
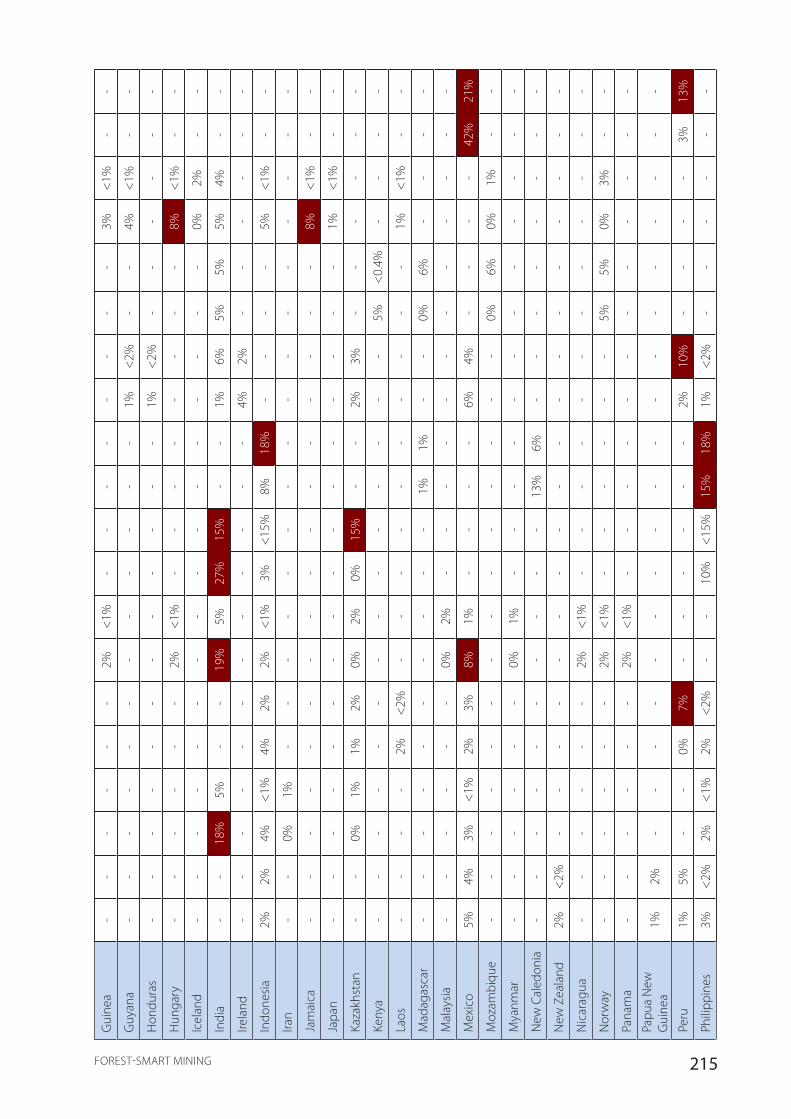
215FOREST-SMART MINING
Gui
nea
--
--
--
2%<
1%-
--
--
--
-3%
<1%
--
Guy
ana
--
--
--
--
--
--
1%<
2%-
-4%
<1%
--
Hon
dura
s-
--
--
--
--
--
-1%
<2%
--
--
--
Hun
gary
--
--
--
2%<
1%-
--
--
--
-8%
<1%
--
Icel
and
--
--
--
--
--
--
--
--
0%2%
--
Indi
a-
-18
%5%
--
19%
5%27
%15
%-
-1%
6%5%
5%5%
4%-
-
Irela
nd-
--
--
--
--
--
-4%
2%-
--
--
-
Indo
nesia
2%2%
4%<
1%4%
2%2%
<1%
3%<
15%
8%18
%-
--
-5%
<1%
--
Iran
--
0%1%
--
--
--
--
--
--
--
--
Jam
aica
--
--
--
--
--
--
--
--
8%<
1%-
-
Japa
n-
--
--
--
--
--
--
--
-1%
<1%
--
Kaza
khst
an-
-0%
1%1%
2%0%
2%0%
15%
--
2%3%
--
--
--
Keny
a-
--
--
--
--
--
--
-5%
<0.
4%-
--
-
Laos
--
--
2%<
2%-
--
--
--
--
-1%
<1%
--
Mad
agas
car
--
--
--
--
--
1%1%
--
0%6%
--
--
Mal
aysia
--
--
--
0%2%
--
--
--
--
--
--
Mex
ico
5%4%
3%<
1%2%
3%8%
1%-
--
-6%
4%-
--
-42
%21
%
Moz
ambi
que
--
--
--
--
--
--
--
0%6%
0%1%
--
Mya
nmar
--
--
--
0%1%
--
--
--
--
--
--
New
Cal
edon
ia-
--
--
--
--
-13
%6%
--
--
--
--
New
Zea
land
2%<
2%-
--
--
--
--
--
--
--
--
-
Nic
arag
ua-
--
--
-2%
<1%
--
--
--
--
--
--
Nor
way
--
--
--
2%<
1%-
--
--
-5%
5%0%
3%-
-
Pana
ma
--
--
--
2%<
1%-
--
--
--
--
--
-
Papu
a N
ew
Gui
nea
1%2%
--
--
--
--
--
--
--
--
--
Peru
1%5%
--
0%7%
--
--
--
2%10
%-
--
-3%
13%
Phili
ppin
es3%
<2%
2%<
1%2%
<2%
--
10%
<15
%15
%18
%1%
<2%
--
--
--

216 FOREST-SMART MINING
Coun
try
% A
u M
FAs
% A
u Pr
od.
% F
e M
FAs
% F
e Pr
od.
% C
u M
FAs
% C
u Pr
od.
%
Mn
MFA
s
%
Mn
Prod
.
% C
r M
FAs
% C
r Pr
od.
% N
i M
FAs
% N
i Pr
od.
% Z
n M
FAs
% Z
n Pr
od.
% T
i M
FAs
% T
i Pr
od.
% A
l M
FAs
% A
l Pr
od.
% A
g M
AFs
% A
g Pr
od.
Pola
nd-
--
-2%
2%-
--
--
-2%
<2%
--
--
0%4%
Qat
ar-
--
--
--
--
--
--
--
-0%
1%-
-
Rom
ania
--
--
2%<
2%-
--
--
--
--
--
--
-
Russ
ian
Fede
ratio
n18
%8%
16%
3%8%
5%4%
<1%
3%<
15%
0%10
%2%
<2%
5%<
0.4%
8%8%
6%7%
Serb
ia-
--
--
-2%
<1%
--
--
--
5%1%
1%<
1%-
-
Sier
ra L
eone
--
--
--
--
--
--
--
--
1%<
1%-
-
Sout
h Af
rica
2%5%
0%2%
--
0%23
%3%
42%
1%2%
--
5%16
%0%
2%-
-
Sout
h Ko
rea
--
--
--
--
--
1%<
1%-
--
--
--
-
Spai
n-
--
--
--
--
-1%
<1%
--
--
--
--
Sri L
anka
--
--
--
--
--
--
--
0%0.
4%-
--
-
Surin
ame
--
--
--
--
--
--
--
--
4%<
1%-
-
Swed
en-
-2%
1%2%
<2%
--
--
--
11%
<2%
--
--
--
Thai
land
--
--
--
--
--
--
1%<
2%-
--
--
-
Turk
ey-
--
--
-2%
<1%
--
--
--
--
--
--
Ukr
aine
--
0%3%
--
0%2%
--
--
--
0%6%
--
--
Uni
ted
Arab
Em
irate
s-
--
--
--
--
--
--
--
-0%
4%-
-
Uni
ted
Stat
es6%
8%5%
2%2%
7%-
--
-2%
<1%
10%
6%32
%4%
1%4%
13%
4%
Uzb
ekist
an0%
3%-
--
--
--
--
--
--
--
--
-
Vene
zuel
a-
-2%
1%-
--
--
--
--
--
-1%
<1%
--
Viet
nam
--
--
--
--
--
1%<
1%1%
<2%
0%7%
1%<
1%-
-
Zam
bia
--
--
14%
5%-
--
--
--
--
--
--
-
Zim
babw
e4%
<2%
--
--
--
20%
<15
%2%
<1%
--
--
--
--

217FOREST-SMART MINING
Figu
re C
.1 M
odel
ed L
SM R
isk
in F
ores
ted
Are
as
218 FOREST-SMART MINING
APPENDIX D. CASE STUDIES: ADDITIONAL RESOURCES D.1. Global Analysis MFA Data Set
The global analysis on the state of forest mining was conducted using two key data sets: the Raw Materials Database mine data and the Hansen Tree Cover data. The latter is global tree cover data as per pixel estimates of circa 2010 percent maximum (peak of growing season) tree canopy cover derived from cloud-free annual growing season composite Landsat 7 ETM+ data. A regression tree model estimating per pixel percent tree canopy cover was applied to annual composites from 2000 to 2012 inclusive (Hansen et al. 2013). Data gaps and noise from individual years were replaced using multiyear median values. First, a median from annual tree canopy cover values from the period 2009–2011 was used to estimate 2010 tree cover. For pixels still lacking an estimate, the median calculation was expanded to include tree cover values from the period 2008–2011, then 2008–2012. Any remaining gaps were filled with tree canopy cover values derived from a regression tree model using all growing season Landsat ETM+ data as inputs. The resulting layer represents estimated maximum tree canopy cover per pixel, 1–100 percent for the year 2010 in integer values (1–100).
At 30-meter resolution, the data was too large to function as a single global layer and it was partitioned as tiles covering all global forest in 10-degree segments both longitudinal and latitudinal. Using these tiles, the resolution was increased to 1 kilometer in order to mosaic them together into a single global forestry layer. As the FAO definition of 10 percent canopy density had been decided upon prior to the beginning of the analysis, this was used as the benchmark filter to produce the global forest layer, which was then combined with mining data.
The Raw Materials Database was compiled by the Raw Materials Group between 1986 and 2015 (Raw Materials Group 2015). The database lists, among other fields, commodities mined, mine status, and more sporadically, mine opening date. These three fields then were amended to provide a more comprehensive picture of the mining landscape. Mine status was concatenated down to just three designations: in development, operational,
and nonoperational. Nonoperational mines were poorly represented in the database so this designation featured less prominently in the analysis; all status titles included under the three umbrella designations are shown in Table D.1.
Mine opening dates, which only existed for 50 percent of the mines, were manually researched and added to the database; however, due to data and language limitations, mines in China and Russia were largely unfeasible when implementing this amendment.
Finally, the commodities mined field had a filter applied to exclude coal from the analysis. Additional filters were applied individually to analyses, but the removal of coal was the only overarching adjustment.
Once these alterations had taken place, the mine layer was overlaid with the global forest layer and all mines intersecting forest regions were extracted. This became the global MFA data set that was the main component of the global analysis of mining in forests.
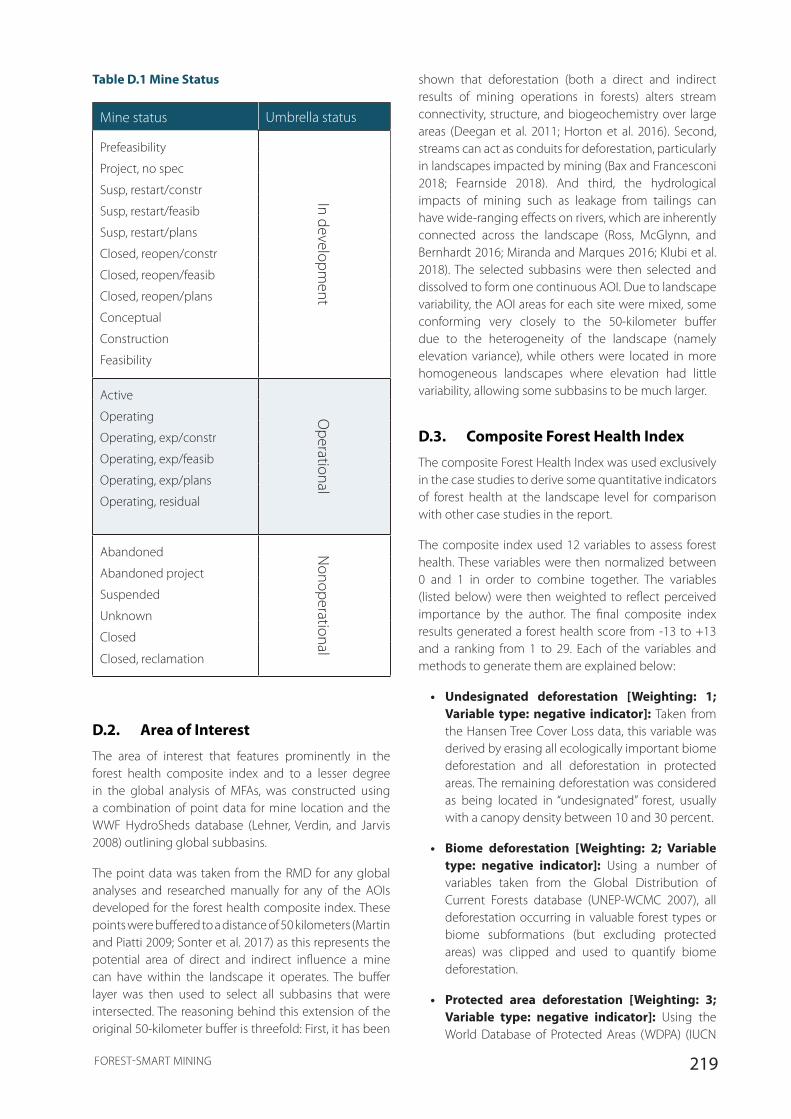
219FOREST-SMART MINING
Table D.1 Mine Status
Mine status Umbrella status
Prefeasibility
In development
Project, no spec
Susp, restart/constr
Susp, restart/feasib
Susp, restart/plans
Closed, reopen/constr
Closed, reopen/feasib
Closed, reopen/plans
Conceptual
Construction
Feasibility
Active
Operational
Operating
Operating, exp/constr
Operating, exp/feasib
Operating, exp/plans
Operating, residual
Abandoned Nonoperational
Abandoned project
Suspended
Unknown
Closed
Closed, reclamation
D.2. Area of Interest
The area of interest that features prominently in the forest health composite index and to a lesser degree in the global analysis of MFAs, was constructed using a combination of point data for mine location and the WWF HydroSheds database (Lehner, Verdin, and Jarvis 2008) outlining global subbasins.
The point data was taken from the RMD for any global analyses and researched manually for any of the AOIs developed for the forest health composite index. These points were buffered to a distance of 50 kilometers (Martin and Piatti 2009; Sonter et al. 2017) as this represents the potential area of direct and indirect influence a mine can have within the landscape it operates. The buffer layer was then used to select all subbasins that were intersected. The reasoning behind this extension of the original 50-kilometer buffer is threefold: First, it has been
shown that deforestation (both a direct and indirect results of mining operations in forests) alters stream connectivity, structure, and biogeochemistry over large areas (Deegan et al. 2011; Horton et al. 2016). Second, streams can act as conduits for deforestation, particularly in landscapes impacted by mining (Bax and Francesconi 2018; Fearnside 2018). And third, the hydrological impacts of mining such as leakage from tailings can have wide-ranging effects on rivers, which are inherently connected across the landscape (Ross, McGlynn, and Bernhardt 2016; Miranda and Marques 2016; Klubi et al. 2018). The selected subbasins were then selected and dissolved to form one continuous AOI. Due to landscape variability, the AOI areas for each site were mixed, some conforming very closely to the 50-kilometer buffer due to the heterogeneity of the landscape (namely elevation variance), while others were located in more homogeneous landscapes where elevation had little variability, allowing some subbasins to be much larger.
D.3. Composite Forest Health Index
The composite Forest Health Index was used exclusively in the case studies to derive some quantitative indicators of forest health at the landscape level for comparison with other case studies in the report.
The composite index used 12 variables to assess forest health. These variables were then normalized between 0 and 1 in order to combine together. The variables (listed below) were then weighted to reflect perceived importance by the author. The final composite index results generated a forest health score from -13 to +13 and a ranking from 1 to 29. Each of the variables and methods to generate them are explained below:
• Undesignated deforestation [Weighting: 1; Variable type: negative indicator]: Taken from the Hansen Tree Cover Loss data, this variable was derived by erasing all ecologically important biome deforestation and all deforestation in protected areas. The remaining deforestation was considered as being located in “undesignated” forest, usually with a canopy density between 10 and 30 percent.
• Biome deforestation [Weighting: 2; Variable type: negative indicator]: Using a number of variables taken from the Global Distribution of Current Forests database (UNEP-WCMC 2007), all deforestation occurring in valuable forest types or biome subformations (but excluding protected areas) was clipped and used to quantify biome deforestation.
• Protected area deforestation [Weighting: 3; Variable type: negative indicator]: Using the World Database of Protected Areas (WDPA) (IUCN
220 FOREST-SMART MINING
and UNEP-WCMC 2018), all deforestation was clipped to protected areas only.
• Secondary forest [Weighting: 1; Variable type: positive indicator]: Using the Hansen global forest cover tiles as outlined previously, forest cover with a density of 10–60 percent—10 percent was the beginning of the FAO definition of forest, while the upper bound of 60 percent pertains to the definition of ecologically viable being 60 percent or above (the next category in forest cover) (Hughes 2017)—was extracted and the aforementioned deforestation data subtracted from it. This gave an estimate of secondary forest present.
• Ecologically viable forest [Weighting: 2; Variable type: positive indicator]: Using the Hansen global forest cover tiles as outlined previously, forest cover with a density of 60–80 percent—60 percent was the beginning of the ecologically viable bracket, while the upper bound of 80 percent pertains to the definition of core forest being 80 percent or above (the next category in forest cover) (Hughes 2017)—was extracted and the aforementioned deforestation data subtracted from it. This gave an estimate of ecologically viable forest present.
• Core forest [Weighting: 3; Variable type: positive indicator]: Using the Hansen global forest cover tiles as outlined previously, forest cover with a density of >80 percent—core forest (Hughes 2017)—was extracted and the aforementioned deforestation data subtracted from it. This gave an estimate of core forest present.
• Forest connectivity [Weighting: 2; Variable type: positive indicator]: Forest patch connectivity was assessed on forest patches with greater than 60 percent canopy density. Forest data was taken from the Hansen forest cover tiles with the deforestation data from the same source subtracted from the forest cover. The connectivity of patches was modeled using Linkage Mapper (McRae, Shah, and Mohapatra 2014) and assessed for forest patches that were still connected over the landscape. The forest patches had to be greater than 1 hectare with a 30-meter buffer applied to each of these patches to limit edge effects caused by pixel shape.
• Forest Fragmentation [Weighting: 2; Variable type: negative indicator]: Forest patch fragmentation was assessed on forest patches with greater than 60 percent canopy density. Forest data was taken from the Hansen forest cover tiles with the deforestation data from the same source
subtracted from the forest cover. The fragmentation of patches was modeled using Linkage Mapper (McRae, Shah, and Mohapatra 2014) and assessed for forest patches that were disconnected from all other forest by infrastructure alone (this relates to the most common driver of mine related fragmentation). The infrastructure developments were taken from the OpenStreetMap databases (OpenStreetMap Contributors 2017a) and include all major and minor roads and railways. The forest patches had to be greater than 1 hectare with a 30-meter buffer applied to each of these patches to limit edge effects caused by pixel shape.
• Intact forest [Weighting: 5; Variable type: positive indicator]: Derived by the IFL initiative (Potapov et al. 2008), intact forest landscapes are defined as an area within today’s global extent of forest cover that contains forest and non-forest ecosystems minimally influenced by human economic activity, with an area of at least 500 square kilometers and a minimal width of 10 kilometers (measured as the diameter of a circle that is entirely inscribed within the boundaries of the territory). Intact forests are rare and given their strict definition of human influence (considered disturbed and consequently not eligible for inclusion) of any settlements (including a buffer zone of 1 kilometer), any infrastructure used for transportation between settlements or for industrial development of natural resources, any including roads (except unpaved trails), railways, navigable waterways (including seashore), pipelines, and power transmission lines (including in all cases a buffer zone of 1 kilometer on either side), any agriculture and timber production, and any industrial activities during the past 30–70 years, such as logging, mining, oil and gas exploration and extraction, peat extraction, and so on, were usually only on the periphery of the mine site AOIs.
To make the data current with the other variables in the index, the Hansen deforestation data were subtracted from the intact forest layer to show intact forest as of 2014.
• Percentage Population Change [Weighting: 2; Variable type: negative indicator]: Due to the timescale some of our case studies operated within, about 40 years for some, a decision was made to use the Global Population Density Grid Time Series Estimates data sets (CIESIN – Columbia University 2017) to estimate population change before and after mine opening. If the mine opened before the beginning of the data set, which occurred in two instances, the earliest possible CIESIN population
221FOREST-SMART MINING
estimate of 1970 was used. In one instance, the difference between mine opening and earliest possible data was only three years; however, in the other instance, the range was closer to 100 years. In the latter case, LSM activities only really began in the mid-1960s, with intermittent ASM and medium-scale mining occurring prior to this point. In terms of “after mining began,” this was as close to present day or mine closure as possible.
The population data for each case study was clipped and analyzed for people per pixel, once this had been derived a simple change analysis was conducted to determine the percentage population change in the time since the mine had been opened.
• Real Population Levels 2015 [Weighting: 1; Variable type: negative indicator]: As some areas suffered from a overburden of population on the landscape regardless of population increase it was also deemed necessary to capture the “real” levels of population the forest landscape surrounding the mine was supporting. To do this the WorldPop databases were accessed for those regions where case studies were located (Sorichetta et al. 2015; Linard et al. 2012; Gaughan, Stevens, and Linard 2013). The databases here are constructed using a combinations of approaches: Land cover-based – Through detailed mapping of settlements, and linkage of these settlement extents with gazetteer population numbers, the substantial majority of resident population can be mapped within settlements with good precision. The settlement maps are used to refine land cover data, while local high resolution census data is exploited to identify typical regional per land cover class population densities, which are then applied to redistribute census counts to map human population distributions. Random forest – Stevens et al. (2015) provides full details on the novel random forest regression tree-based mapping approach. In brief, a new semi-automated dasymetric modeling approach was built that incorporated census and a wide range of open access ancillary data sets in a flexible “random forest” estimation technique. A combination of widely available, remotely sensed, and geospatial data sets (for example, settlement locations, settlement extents, land cover, roads, building maps, health facility locations, satellite nightlights, vegetation, topography, refugee camps) contribute to the modeled dasymetric weights, and then the random forest model is used to generate a gridded prediction of population density at ~100-meter
spatial resolution. This prediction layer is then used as the weighting surface to perform dasymetric redistribution of census counts at a country level. Bottom-up population mapping –Where census data are outdated or unreliable, population distributions are estimated at high spatial resolution through a combination of satellite-derived feature extractions and household surveys. As with the percentage change (before the change analysis), the population data was estimated on a people per pixel basis and then summed across the entire AOI. This data set was found to be very precise when compared to Global Population Density Grid Time Series Estimates, however temporal data was only present as early as 2000, so it could only be relied upon to estimate “real” values for 2015.
• Road density 2015 [Weighting: 1; Variable type: negative indicator]: The road density in a forested region was considered an additional negative indicator as the penetration of roads into forests not only fragments them (Liu et al. 2014; Tapia-Armijos et al. 2015) but also has been shown to increase deforestation (Campbell, Alamgir, and Laurance 2017; Bicknell et al. 2015; Sonter et al. 2017) and ecological degradation (Barber et al. 2014), catalyze the development of further agriculture (Laurance, Sayer, and Cassman 2014), and increase the size of existing settlements or lead to the establishment of new ones (Tritsch and Le Tourneau 2016). It was deemed that the most comprehensive data set of roads is the OpenStreetMap depository (OpenStreetMap Contributors 2017b). Outlining not only major roads and rail links, these data sets also show secondary and tertiary roads, which are just as important a negative forest indicator as the major roads that cut through the landscapes. The OpenStreetMap data in this case was captured as close to 2015 as possible and clipped for the AOI while being assessed for density within the region.
D.4. Country Case Study Template
Summary (To go into main report. Please write in prose)
- Paragraph 1: Overview of the national minerals and forestry situation (covering what you consider to be the key points from section A of the details below).
- Paragraph 2: Overview of the regulatory environment (covering what you consider to be

222 FOREST-SMART MINING
the key points from section B of the details below).
- Paragraph 3: Your interpretation of the above—what you consider should be the headlines of how the national situation impacts forest-smart mining. Hopefully these will reflect some of the headlines pulled out during the workshop.
Case study details (To go into the Supplementary Information report. There is no strict guidance on length and information can be recorded in note form rather than full sentences.)
Section A
• Name:
• World Bank development status:
• Economic overview (World Bank 2016a, 2017):
o GDP:
o GNI per capita:
o % poverty (<$1.90/day):
• Minerals overview (ICMM 2016a):
o Key minerals present:
o Industry overview: (Any relevant historical context. 2–3 sentences max.)
o LSM – ASM relationship:
o Contribution to economy:
» % GDP:
» Employment:
» Export revenues:
» Tax contribution:
» Mining Contribution Index rank: (see ICMM report)
o Forest mining status:
» No. LSM mines in forests:
» % of LSM in forests:
• Forests overview (GFW 2016; World Bank 2017; The REDD Desk 2017):
o Main forest biomes:
o % land area forested:
o % land area under protection:
o Mean annual deforestation (2000–2015):
o GHG emissions from forestry/land use change:
o Net forest depletion (% GNI):
o Forestry overview: (Any relevant historical context including the relevance of forests beyond timber production. 3–4 sentences max.)
o Timber contribution to economy:
» % GDP:
» Employment:
Section B
• Regulatory environment (There is no good central source of information on this we have found, although the Global Forest Watch website country pages links to some forest policies.)
o Minerals sector:
» Mineral rights ownership:
» Key mining legislation:
» Legislation specific to mining in forests:
o Forests sector:
» Forest tenure and ownership:
» Key forestry legislation:
» Status of REDD+:
o Protected areas: (Area covered, degrees of protection)
o Key institutions: (Name, brief description, relevance to forest-smart mining)
o Regulatory environment rankings:
» EITI membership: (See https://eiti.org/countries)
» World Bank Ease of Doing Business rank (out of 190): (see http://www.doingbusiness.org/rankings)
» Transparency International Corruption score 2016: (see https://www.transparency.org/)

223FOREST-SMART MINING
» Yale Environmental Performance Index (See http://epi.yale.edu/)
• Overall:
• Forest policy:
• Biodiversity:
» Fraser Institute Mining Attractiveness ranking:
Section C
• Additional comments: If there is anything else important to note about the country that has not been captured above please add here in bullet form.
• Data sources: The following data sources are useful for filling in some of the fields above:
Please supplement with your own data sources specific to your case study.
D.5. LSM Case Study Template
(for global/parent companies – not the site-level company)
Summary (to go in main report)
• One paragraph summarizing what you consider to be the key points from below and any aspects worth highlighting promoting or detracting from forest-smart mining
Details (To go in the Supplementary Information report. There is no strict guidance on length and information can be recorded in note form rather than full sentences.)
• Name:
• Date established:
• Market cap value:
• Stock exchange listing:
• Sustainability index listing:
• ICMM membership?
• Ownership structure (including top investors if relevant):
• Corporate commitments to social and environmental performance:
• Additional comments: If there is anything else important to note about the country that has not been captured above please add here in bullet form.
• Data sources—Please record all data sources used to fill in this section here. Please ensure all references used are in the Mendeley Forest Smart Mining database and cited using the “Insert citation” function of Word. Please do not write references manually.
D.6. Site Case Study Template
Summary (To go into main report. No more than 1–2 sides of A4 please. Please write in prose.)
- Useable photograph if available
- Paragraph 1: Overview of mine operation (mine details from Section A below you feel are most important)
- Paragraph 2: Overview of ecological / forest situation in the 50-kilometer AOI (ecological details from Section A you feel are most important)
- Paragraph 3: Summary of Forest Health Index findings and key impacts and responses likely to be influencing this (the points from sections B and C you feel are most important)
- Paragraph 4: Your headlines / takeaways from the case study in bullet form. What do you think are the most important aspects promoting or preventing forest-smart mining in this case?
Case study details (To go in the Supplementary Information report. There is no strict guidance on length and information can be recorded in note form rather than full sentences.)
Section A
• Mine details:
o Location:
o Mineral(s):
o Mine type:
o Operating phase / dates:
o Associated infrastructure:
o Footprint (ha):
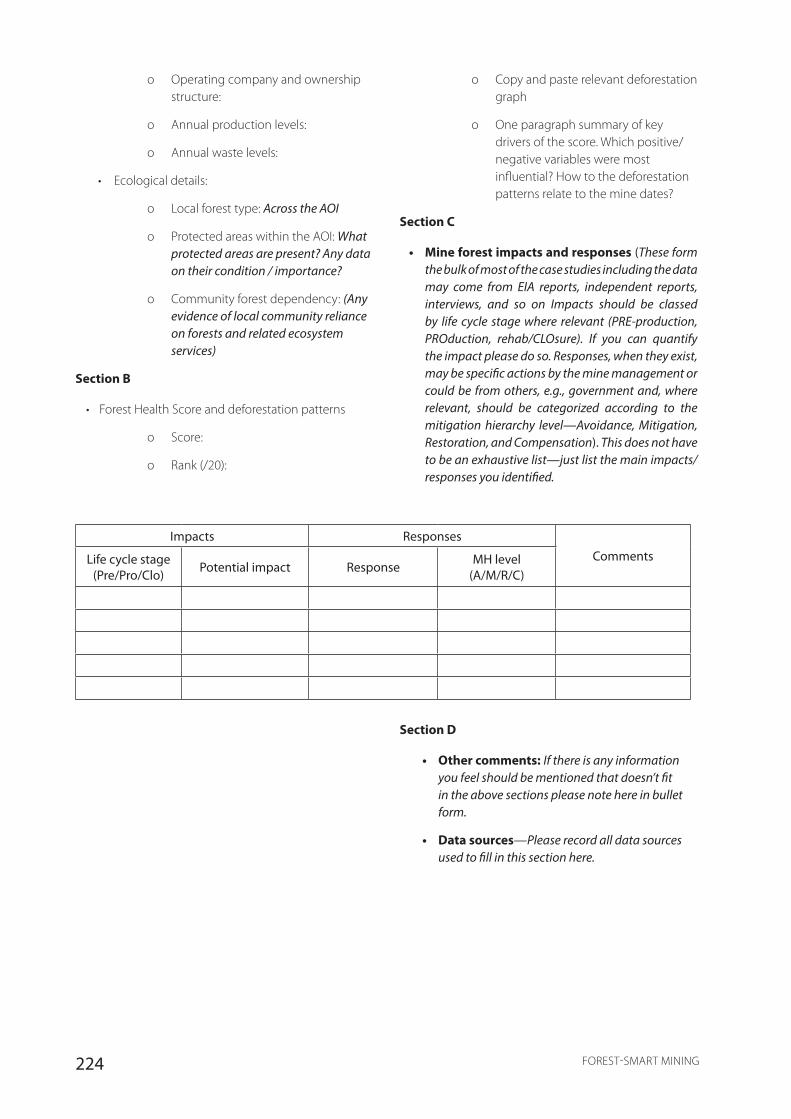
224 FOREST-SMART MINING
o Operating company and ownership structure:
o Annual production levels:
o Annual waste levels:
• Ecological details:
o Local forest type: Across the AOI
o Protected areas within the AOI: What protected areas are present? Any data on their condition / importance?
o Community forest dependency: (Any evidence of local community reliance on forests and related ecosystem services)
Section B
• Forest Health Score and deforestation patterns
o Score:
o Rank (/20):
o Copy and paste relevant deforestation graph
o One paragraph summary of key drivers of the score. Which positive/negative variables were most influential? How to the deforestation patterns relate to the mine dates?
Section C
• Mine forest impacts and responses (These form the bulk of most of the case studies including the data may come from EIA reports, independent reports, interviews, and so on Impacts should be classed by life cycle stage where relevant (PRE-production, PROduction, rehab/CLOsure). If you can quantify the impact please do so. Responses, when they exist, may be specific actions by the mine management or could be from others, e.g., government and, where relevant, should be categorized according to the mitigation hierarchy level—Avoidance, Mitigation, Restoration, and Compensation). This does not have to be an exhaustive list—just list the main impacts/responses you identified.
Impacts ResponsesCommentsLife cycle stage
(Pre/Pro/Clo) Potential impact Response MH level (A/M/R/C)
Section D
• Other comments: If there is any information you feel should be mentioned that doesn’t fit in the above sections please note here in bullet form.
• Data sources—Please record all data sources used to fill in this section here.

225FOREST-SMART MINING

226 FOREST-SMART MINING
International Bank for Reconstruction and Development /The World Bank 1818 H Street NW, Washington DC 20433, Telephone: 202-473-1000, Internet: www.worldbank.org
Copyright © 2022 FDOKUMEN