FOREST-SMART MINING - Profor
214
FOREST-SMART MINING Identifying Good and Bad Practices and Policy Responses for Artisanal & Small-Scale Mining in Forest Landscapes
-
Upload
khangminh22 -
Category
Documents
-
view
0 -
download
0
Transcript of FOREST-SMART MINING - Profor
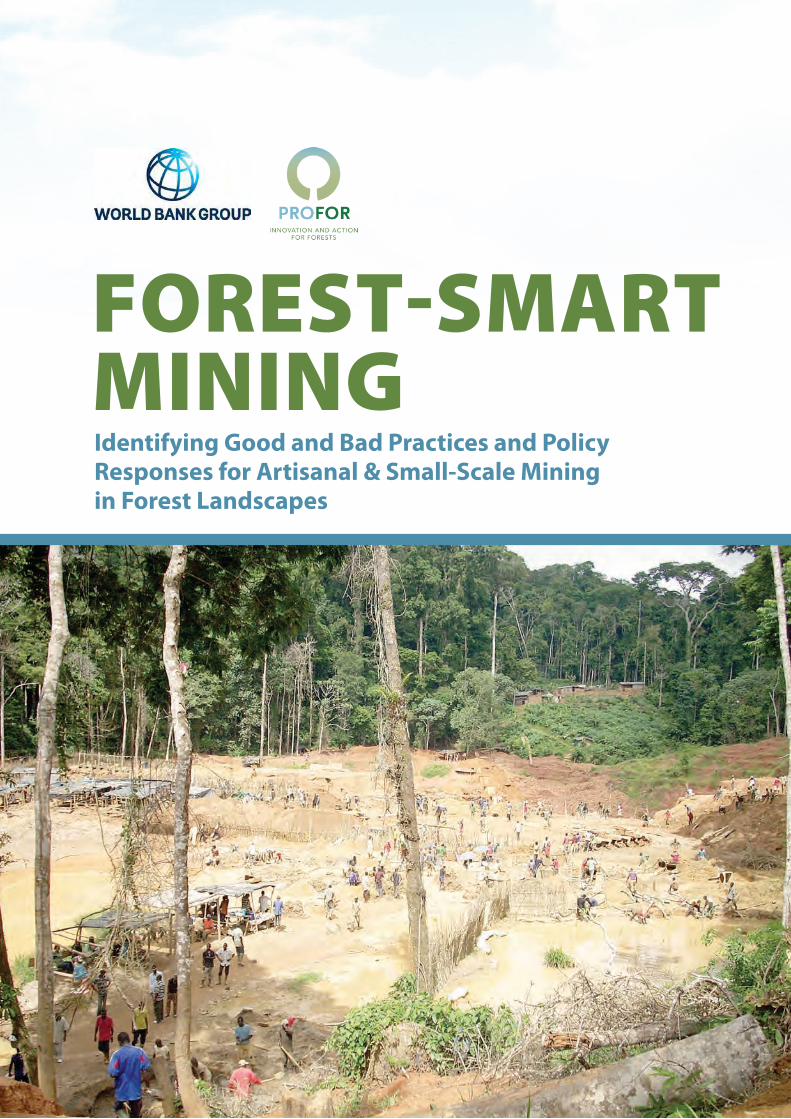
FOREST-SMART MINING Identifying Good and Bad Practices and Policy Responses for Artisanal & Small-Scale Mining in Forest Landscapes


Suggested Citation: Forest-Smart Mining: Artisanal & Small-Scale Mining in Forest Landscapes (ASM), World Bank, 2019
Disclaimer:
This work is a product of the staff of The World Bank with external contributions. All omissions and inaccuracies in this document are the responsibility of the authors. The findings, interpretations, and views expressed in this guide do not necessarily represent those of the institutions involved, nor do they necessarily reflect the views of PROFOR, The World Bank, its Board of Executive Directors, or the governments they represent.
The World Bank does not guarantee the accuracy of the data included in this work. The boundaries, colors, denominations, and other information shown on any map in this work do not imply any judgment on the part of The World Bank concerning the legal status of any territory or the endorsement or acceptance of such boundaries.
© 2019 International Bank for Reconstruction and Development / The World Bank 1818 H Street NW Washington DC 20433 Telephone: 202-473-1000 Internet: www.worldbank.org
Rights and Permissions
The material in this work is subject to copyright. Because The World Bank encourages dissemination of its knowledge, this work may be reproduced, in whole or in part, for noncommercial purposes as long as full attribution to this work is given.
Third-party content
The World Bank does not necessarily own each component of the content contained within the work. The World Bank therefore does not warrant that the use of any third-party-owned individual component or part contained in the work will not infringe on the rights of those third parties. The risk of claims resulting from such infringement rests solely with you. If you wish to re-use a component of the work, it is your responsibility to determine whether permission is needed for that re-use and to obtain permission from the copyright owner. Examples of components can include, but are not limited to, tables, figures, or images.
All FFI, Levin Sources and SGAB material displayed is subject to copyright, trademark and other intellectual property rights which are vested in FFI, Levin Sources and SGAB or our licensors. This includes photographs in this report. The material within this report may be printed, downloaded or copied for your own personal non-commercial or educational use. It must be fully acknowledged. Prior written permission must be obtained for any other use.
Financing for this study was provided by the Program on Forests (PROFOR).
Design: Michael Bunnya Kalanzi (MeBK)
Cover photo: Minkébé, Gabon (By Gustave Mbaza/WWF Gabon)
iFOREST-SMART MINING
FOREST-SMART MINING Identifying Good and Bad Practices and Policy Responses for Artisanal & Small-Scale Mining in Forest Landscapes
Final ReportApril, 2019

ii FOREST-SMART MINING
TABLE OF CONTENTS Acknowledgements ............................................................................................................................................................................ iii
Abbreviations and Acronyms .......................................................................................................................................................viii
Executive Summary .............................................................................................................................................................................2
1. Introduction ............................................................................................................................................................................... 101.1. Introduction and Terms of Reference ...................................................................................................................................................10
1.2. Introduction to Mining Sector Development and ASM ...........................................................................................................11
1.3. Introduction to Forest Sector Development ....................................................................................................................................14
1.4. Introduction to Mining in Forests ...........................................................................................................................................................17
1.5. The Importance and Definition of a “Forest Smart” Approach to Mining ......................................................................20
2. Global Distribution of ASM in Forests ............................................................................................................................. 22
2.1. Presence of Minerals in Forests .................................................................................................................................................................22
2.2. Projections for ASM in Forests ...................................................................................................................................................................22
2.3. Managing ASM in Forests ............................................................................................................................................................................24
3. Case Studies ................................................................................................................................................................................ 31
3.1. Case Study Selection .......................................................................................................................................................................................31
3.2. Case Study Methodology ............................................................................................................................................................................31
3.3. Bolivia .......................................................................................................................................................................................................................35
3.4. Colombia ................................................................................................................................................................................................................54
3.5. Democratic Republic of Congo ................................................................................................................................................................63
3.6. Ecuador....................................................................................................................................................................................................................68
3.7. Ghana .......................................................................................................................................................................................................................77
3.8. Indonesia ................................................................................................................................................................................................................90
3.9. Liberia .................................................................................................................................................................................................................... 105
3.10. Madagascar ........................................................................................................................................................................................................ 115
3.11. Mongolia ............................................................................................................................................................................................................. 128
3.12. Suriname ............................................................................................................................................................................................................. 135
3.13. Sweden ................................................................................................................................................................................................................. 141
3.14. Ukraine .................................................................................................................................................................................................................. 147
3.15. Results overview ............................................................................................................................................................................................. 153
4. Lessons Learned .....................................................................................................................................................................163
4.1. What Are the Impacts of ASM on Forests? ..................................................................................................................................... 163
4.2. Political and Economic Barriers to Forest-Smart Mining ....................................................................................................... 164
4.3. Governance Barriers to Forest-Smart Mining ............................................................................................................................... 165
4.4. The Way Forward—Solutions and Mechanisms for Forest-Smart ASM ....................................................................... 166
4.5. Comparative Analysis of the Case Studies...................................................................................................................................... 169
5. Forest-Smart ASM General Conclusions and Recommendations .....................................................................175
6. References ......................................................................................................................................................................................189
iiiFOREST-SMART MINING
This Report was led by Levin Sources and Swedish Geological AB, by a team of core authors composed of Andrew Cooke, Theodora Panayides, Håkan Tarras-Wahlberg, Estelle Levin-Nally, Blanca Racionero Gómez, Paul De Vries, Jonathan R. Stacey, Conrad Ocker and Victoria Gronwald. The extended team includes contributing researchers from Levin Sources, Swedish Geological AB, Alliance for Responsible Mining, Wildlife Conservation Society Bolivia and Independent Consultants. The extended team members who led the research of each case study analysed are: Manuel Salinas Rossel and Sandra Jahel Rivera Cordova (main authors of the Bolivian case studies), Yves Bertran (main author of the Colombian case studies) and Jairo Alonso Cardenas (main coordinator of the Colombian case studies), Ruby Stocklin-Weinberg (main author of the Indonesian case studies), Jonathan R. Stacey (main author of the Mongolian case study), Andrew Cooke (main author of the Madagascan and Ghanaian case studies), Håkan Tarras-Wahlberg (main author of the Swedish case study), Theodora Panayides and Håkan Tarras-Wahlberg (main authors of the Ecuadorian case studies), Victoria Gronwald (main author of the Ukrainian case study), Kate MacLeod (main author of the DRC case studies), Blanca Racionero Gómez (main author of the Liberian case studies) and Blanca Racionero Gómez and Victoria Gronwald (main authors of the Surinamese case study).
The Bolivian case study authors would like to thank especially to Wildlife Conservation Society (WCS Bolivia) and Oscar Loayza, who is the coordinator of the project led by WCS Bolivia called “Capacity Building to Reduce the Impact of Mining in the Polylepis Forests of Apolobamba, Madidi, and Pilón Lajas Protected Areas of Bolivia”. This project was a key reference and antecedent for all the Bolivian case studies, especially in Mapiri and Madidi. The authors are also thankful of WCS Bolivia for implementing another phase of this project to reduce the impacts of mining in protected areas.
Special thanks to Claudia Franco, Laura Cortes, Jairo Alonso Cardenas, Elizabeth Echavarria and Yves Bertran who were co-authors and reviewers of the Colombian case studies.
The Indonesian case study author would like to acknowledge Vovia Witni, who provided invaluable research assistance. And would also like to thank the individuals who participated in an interview: Kenneth Davis, Masnelyarti Hilman, Bardolf Paul, Yeni Srihartati, Daniel Stapper, Budi Susilorini, Christophe Klein and Nelly Hillman.
The lead author of the Mongolian case study, Jonathan R. Stacey, who was Project Manager of The Asia Foundation’s Engaging Stakeholders in Environmental Conservation (ESEC) II Project during its implementation and completion 2013-2016, and within which context this Noyod case was rehabilitated, would like to acknowledge the staff at The Asia Foundation during this time, and to the primary donor of the Project, the Swiss Agency for Development and Cooperation (SDC). In particular, thanks go to the following staff who collaborated as a team to implement the ESEC II Project: Bolormaa Purevjav, Undraa Nergui, Erdenechimeg Regjiibuu, Khandarmaa Ayush, Anujin Baatarkhu, Tselmeg Erdenetogtokh, Bakhytgul Titov, Tsomorlig Tserenbat and Orgil Batsukh. Seasonal staff on the Frugal Rehabilitation Team played an important role and comprised Erdene Dorjsuren, Sodnom Damba, Oyumaa Jamsran, Tungalag Sukhbaatar, Mendbaatar Osorjin, Sharav Batsukh and Danzan-Osor Avaadorj. In addition, thanks go to the many staff from the Ministry of Mining, its Mineral Resources Agency (MRAM), the Generalized Agency for Specialized Inspection (GASI), and the Ministry of the Environment, Green Development and Tourism (MoEGDT). Staff members from the Swiss Agency for Cooperation and Development (SDC), also contributed to the outcomes, as did members of their Sustainable Artisanal Mining (SAM) Project, in particular Patience Singo. Thanks also to the many NGOs and other organizations who played a contributory role in the project’s realization across the country. We also wish to acknowledge the considerable efforts of all those within Levin Sources’ international team in their convergent efforts.
The Madagascan case study lead author would like to thank Hajanirina Razafindriainibe, Minosoa Ravololoharinjara, Levy Rakotoarison, Tom Cushman, Serge Rajaobelina, Marc Jobin, Rupert Cook, and Lalalison Razafintsalama.
Many thanks to the Swedish case study main contributors; Anders Lundkvist, from AL Miljökonsult, Hans Winsa, from Bröderna Winsa AB and Per Broman, from Per B Konsult, as well as all the individuals that participated in an interview and/or were consulted including the team at LKAB.
The lead authors of the Ecuadorian case studies would like to thank Adriana Flachier for her expert consultation support as well as all the individuals that participated in an interview and/or were consulted including: Lundin Gold, the
ACKNOWLEDGEMENTS

iv FOREST-SMART MINING
Gobierno provincial Zamora-Chinchipe, Fausto Lopez, Universidad Técnica Particular de Loja, Carlos Fierro, Ministerio de Minería, Ministerio del Ambiente and ASONAMBILE, Nambija.
The Liberian case study author would like to acknowledge Michelle Klailova, Shadrach Kerwillain, Anne Gardner, the Fauna and Flora International Liberia programme team and the RSPB, GolaMA Project for their key contributions, support and quality review.
The Report is sponsored by the Program on Forests (PROFOR) of the World Bank. Overall guidance for preparation of the Report was provided by Kirsten Hund and Erik Reed. Jolien Schure has been essential for the earlier development of the ‘Forest Smart Mining’ approach. Laura Ivers, Katherine Graham and Charlotte Ampaire have played crucial roles on the PROFOR side. The team is very grateful for their generous support throughout the development of the Report.
The team also received guidance and editing advise from Yolande Kyngdon-McKay and would like to specially thank her. We are very grateful as well with the external reviewers that provided significant input and advise to improve the quality of the report, including Daniele La Porta, Remi Pelon, Douglas Graham and George Ledec. We would also like to thank all of those who provided verbal and/or informal feedback during the dissemination of key findings from the Report at conferences and events in New York, Washington and Lusaka.
The core team is very grateful with the Fauna and Flora International team that worked on the parallel study on Large Scale Mining, especially Tom Maddox, Pippa Howard, Jonathan Knox, Nicky Jenner and Dominic Ross, for their support, guidance, review and advise throughout the development of the Report.
Jane Sunderland was the principal editor of the Report and the core authors would like to thank her and all the editorial and communications team. Michael Kalanzi is to be thanked for his beautiful design.
The team drew on the background papers, analysis, research, and literature reviews of researchers and specialists from across the world. As such, the team would like to thank all the authors of those studies mentioned in the references.
The team apologizes to any individuals or organizations inadvertently omitted from this list and expresses its gratitude to all who contributed to this Report, including those whose names may not appear here.
vFOREST-SMART MINING
Figures
Figure 1-1 Different Stakeholder Perspectives and Definitions of Forests ....................................................................................15
Figure 1-2 Drivers of Tropical and Subtropical Deforestation .................................................................................................................17
Figure 1-3 The Four Spheres of How ASM Impacts the Environment ...............................................................................................18
Figure 2-1 Intact Forest Landscapes, Tree Canopy Cover, and Deposits of Gems, Gold, Emeralds, Diamonds, and Columbite ............................................................................................................................................21
Figure 3-1 GIS Analysis of Deforestation and Proximity to Recognized Forest Resources in and around San Ramón, 2000–2016 ........................................................................................................................................40
Figure 3-2 Deforestation Trends for the AOI around San Ramón, 2001–2014 .............................................................................41
Figure 3-3 GIS Analysis of Deforestation and Proximity to Recognized Forest Resources in and around Mapiri, 2000–2016 ....................................................................................................................................................46
Figure 3-4 Deforestation Trends for the AOI around Mapiri, 2001–2014 .........................................................................................47
Figure 3-5 GIS Analysis of Deforestation and Proximity to Recognized Forest Resources in and around Madidi, 2000–2016 ..................................................................................................................................................52
Figure 3-6 Deforestation Trends for the AOI around Madidi ...................................................................................................................53
Figure 3-7 GIS Analysis of Deforestation and Proximity to Recognized Forest Resources in and around Bebaramá, 2000–2016 ...........................................................................................................................................57
Figure 3-8 Deforestation Trends for the AOI around Bebaramá, 2001–2014 ................................................................................58
Figure 3-9 GIS Analysis of Deforestation and Proximity to Recognized Forest Resources in and around La Cascada, 2000–2016 .........................................................................................................................................61
Figure 3-10 Deforestation Trends for the AOI around La Cascada, 2001–2014 ..........................................................................62
Figure 3-11 GIS Analysis of Deforestation and Proximity to Recognized Forest Resources in and around Kahuzi-Biega National Park, 2000–2016 .................................................................................................66
Figure 3-12 Deforestation Trends for the AOI around Kahuzi-Biega National Park, 2001–2014 ......................................67
Figure 3-13 GIS Analysis of Deforestation and Proximity to Recognized Forest Resources in and around Nambija, 2000–2016 ..........................................................................................................................................71
Figure 3-14 Deforestation Trends for the AOI around Nambija, 2001–2014 ................................................................................72
Figure 3-15 GIS Analysis of Deforestation and Proximity to Recognized Forest Resources in and around Podocarpus, 2000–2016 ...................................................................................................................................75
Figure 3-16 Deforestation Trends for the AOI around Podocarpus, 2001–2014 ........................................................................76
Figure 3-17 LSM Exploration and Exploitation Concessions around Atewa Range Forest Reserve ..............................80
Figure 3-18 GIS Analysis of Deforestation and Proximity to Recognized Forest Resources in and around Atewa, 2000–2016 ................................................................................................................................................84
Figure 3-19 Deforestation Trends for the AOI around Atewa, 2001–2014 .....................................................................................85
Figure 3-20 GIS Analysis of Deforestation and Proximity to Recognized Forest Resources in and around Tarkwa, 2000–2016 ..............................................................................................................................................88
Figure 3-21 Deforestation Trends for the AOI around Tarkwa, 2001–2014 ....................................................................................89
Figure 3-22 GIS Analysis of Deforestation and Proximity to Recognized Forest Resources in and around Bangka, 2000–2016 .............................................................................................................................................93

vi FOREST-SMART MINING
Figure 3-23 Satellite View of ASM Activities in Bangka, 2000–2014 ..................................................................................................94
Figure 3-24 Deforestation Trends for the AOI around Bangka, 2001–2014 ..................................................................................95
Figure 3-25 GIS Analysis of Deforestation and Proximity to Recognized Forest Resources in and around Kahayan, 2000–2016 ........................................................................................................................................ 100
Figure 3-26 GIS Analysis of Annual Deforestation and Proximity to Recognized Forest Resources in and around Kahayan, 2000–2016 ............................................................................................................... 101
Figure 3-27 Gold Mining in the Upper Kahayan Catchment, 2005 (left) and 2015 (right) ............................................... 102
Figure 3-28 Deforestation Trends for the AOI around Central Kalimantan, 2001–2014 ..................................................... 104
Figure 3-29 GIS Analysis of Deforestation and Proximity to Recognized Forest Resources in and around Sapo National Park, 2000–2016 ................................................................................................................ 109
Figure 3-30 Deforestation Trends for the AOI around Sapo National Park, 2001–2014 ..................................................... 110
Figure 3-31 GIS Analysis of Deforestation and Proximity to Recognized Forest Resources in and around the Gola-Foya Corridor, 2000–2016 ........................................................................................................ 112
Figure 3-32 Deforestation Trends for the AOI around the Gola-Foya Corridor, 2001–2014 ............................................. 113
Figure 3-33 GIS Analysis of Deforestation and Proximity to Recognized Forest Resources in and around Ankarana, 2000–2016 ...................................................................................................................................... 118
Figure 3-34 Deforestation Trends for the AOI around Ankarana, 2001–2014 ........................................................................... 119
Figure 3-35 GIS Analysis of Deforestation and Proximity to Recognized Forest Resources in and around Bemainty, 2000–2016 ...................................................................................................................................... 122
Figure 3-36 Deforestation Trends for the AOI around Bemainty, 2001–2014 ........................................................................... 123
Figure 3-37 GIS Analysis of Deforestation and Proximity to Recognized Forest Resources in and around Loky Manambato, 2000–2016 ................................................................................................................... 126
Figure 3-38 Deforestation Trends for the AOI around Loky Manambato, 2001–2014 ........................................................ 127
Figure 3-39 GIS Analysis of Deforestation and Proximity to Recognized Forest Resources in and around Noyod, 2000–2016 ............................................................................................................................................ 132
Figure 3-40 Deforestation Trends for the AOI around Noyod, 2001–2014 ................................................................................. 133
Figure 3-41 Formalizing an ASM-Inclusive Environmental Management Plan through Environmental Toolkits and Capacity Building ................................................................................................................. 134
Figure 3-42 GIS Analysis of Deforestation and Proximity to Recognized Forest Resources in and around Merian, 2000–2016 ........................................................................................................................................... 138
Figure 3-43 GIS Analysis of Annual Deforestation and Proximity to Recognized Forest Resources in and around Merian, 2000–2016 ................................................................................................................... 139
Figure 3-44 Deforestation Trends for the AOI around Merian, 2001–2014 ................................................................................ 140
Figure 3-45 GIS Analysis of Deforestation and Proximity to Recognized Forest Resources in Lovisagruvan, 2000–2016 ......................................................................................................................................................... 145
Figure 3-46 Deforestation Trends for the AOI around Lovisagruvan, 2001–2014 .................................................................. 146
Figure 3-47 GIS Analysis of Deforestation and Proximity to Recognized Forest Resources, Oleksiive, 2000–2016......................................................................................................................................................................... 151
Figure 3-48 Deforestation Trends for the AOI around Polesia, 2001–2014................................................................................. 152
viiFOREST-SMART MINING
Tables
Table 3-1 Summary of the Variables Used to Calculate the AOI Forest Health Scores ...........................................................34
Table 3-2 Forest Health Score of the AOI around San Ramón ...............................................................................................................41
Table 3-3 Forest Health Score of the AOI around Mapiri ..........................................................................................................................47
Table 3-4 Forest Health Score of the AOI around Madidi .........................................................................................................................53
Table 3-5 Forest Health Score of the AOI around Bebaramá ..................................................................................................................58
Table 3-6 Forest Health Score of the AOI around La Cascada ...............................................................................................................62
Table 3-7 Forest Health Score of the AOI around Kahuzi-Biega National Park ............................................................................67
Table 3-8 Forest Health Score of the AOI around Nambija ......................................................................................................................72
Table 3-9 Forest Health Score of the AOI around Podocarpus..............................................................................................................76
Table 3-10 Forest Health Score of the AOI around Atewa ........................................................................................................................85
Table 3-11 Forest Health Score of AOI around Tarkwa ................................................................................................................................89
Table 3-12 Forest Health Score of the AOI around Bangka......................................................................................................................95
Table 3-13 Forest Health Score of the AOI around Kahayan ................................................................................................................ 104
Table 3-14 Key Differences between the Main Evictions in Sapo National Park ..................................................................... 107
Table 3-15 Forest Health Score of the AOI around Sapo National Park ......................................................................................... 110
Table 3-16 Forest Health Score of the AOI around the Gola-Foya Corridor ................................................................................ 113
Table 3-17 Forest Health Score of the AOI around Ankarana .............................................................................................................. 119
Table 3-18 Forest Health Score of the AOI around Bemainty .............................................................................................................. 123
Table 3-19 Forest Health Score of the AOI around Loky Manambato ........................................................................................... 127
Table 3-20 Forest Health Score of the AOI around Noyod .................................................................................................................... 133
Table 3-21 Forest Health Score of the AOI around Merian.................................................................................................................... 140
Table 3-22 Forest Health Score of the AOI around Lovisa ..................................................................................................................... 146
Table 3-23 Forest Health Score of the AOI around Oleksiive ............................................................................................................... 152
Table 3-24 Main Lessons Learned from ASM Case Studies ................................................................................................................... 153
Table 3-25 Forest Change Data at the Site, Regional, and Country Levels.................................................................................. 155
Table 3-26 Site-Specific Information Arranged According to the Relative Severity of Deforestation in the 5 km Buffer Zone around the ASM Operations .................................................................... 156
Table 3-27 Contextual Country-Level Information Arranged According to the Relative Severity of Deforestation in the 5 km Buffer Zone around the ASM Operations ........................................... 158
Table 3-28 Forest Health Score and Rank of Each Mine Site AOI ...................................................................................................... 160
viii FOREST-SMART MINING
ABBREVIATIONS AND ACRONYMS AEZ Artisanal Exploration ZonesAOI area of interestASGM artisanal and small-scale gold miningASM artisanal and small-scale miningASMer artisanal and small-scale minerASONAMBILE Asociación de Producción Minera Nambija LegendariaBCMM Bureau of Mining Cadastre of Madagascar CAZ Corridor Ankeniheny ZahamenaCDF Community Development FundCI Conservation InternationalCOMIFAC Central African Forests CommissionDRC Democratic Republic of CongoEIA environmental impact assessmentEMP environmental management planEPA Environmental Protection AgencyERU Emergency Response Unit (Liberia)ESEC II Engaging Stakeholders in Environmental Conservation IIESIA environmental and social impact assessmentFAO Food and Agriculture Organization (of the UN)FDA Forestry Development Authority (Liberia)FPIC free, prior and informed consentFRM Frugal Rehabilitation MethodologyFSC Forest Stewardship Council; Forest for All Forever (Sweden)GDP gross domestic productGFC global financial crisisGIZ German Agency for International CooperationGNI gross national incomeGRNP Gola Rainforest National ParkGRI Global Reporting InitiativeICMM International Council on Mining and MetalsIFC International Finance Corporation (of the World Bank Group)IFF illicit financial flowICGLR International Conference on the Great Lakes RegionIGF Intergovernmental Forum on Mining, Minerals, Metals and Sustainable DevelopmentIPIS International Peace Information ServiceIRMA Initiative for Responsible Mining AssuranceIUCN International Union for Conservation of NatureKBA Key Biodiversity AreaKBNP Kahuzi-Biega National ParkLSM large-scale mining
ixFOREST-SMART MINING
MLNR Ministry of Lands and Natural Resources (Ghana)MNP Madagascar National ParksMoU Memorandum of UnderstandingMRV monitoring, reporting and verificationNCA natural capital accountingNGO nongovernmental organizationNP national parkOECD Organisation for Economic Co-operation and DevelopmentOGS Planning Commission for the Gold Sector (Suriname)PA protected area
PEFC Programme for the Endorsement of Forest Certification
PS Performance Standard (IFC)
RCM Regional Certification Mechanism
REDD Reduced Emissions from Degradation and Deforestation
RJC Responsible Jewellery Council
RMI Responsible Mining Index
SADC Southern African Development Community
SAM Sustainable Artisanal Mining
SDC Swiss Agency for Development and Cooperation
SEIA strategic environmental impact assessment
SFRA State Forest Resources Agency (Ukraine)
SNP Sapo National Park
SSM semi-mechanized small-scale mining
UMAT University of Mines and Technology (Ghana)
UN United Nations
UNDP United Nations Development Programme
UNEP United Nations Environment Programme
UNESCO United Nations Educational, Scientific, and Cultural Organization
UNITAR United Nations Institute for Training and Research
UNOSAT United Nations Operational Satellite Applications Programme
US United States
USCF Ukrainian State Committee of Forestry
VOI local community organizations (Bemainty)
WCC World Conservation Congress
WWF World Wide Fund for Nature
All dollars are U.S. dollars unless otherwise indicated.
2 FOREST-SMART MINING
Minerals and metals are fundamentally incredibly important to societies all over the world. The activities required to extract minerals, however, often have negative impacts on forest landscapes and habitats. Although the extent of deforestation varies widely between artisanal and small-scale mine sites, our study found that the amount of forest within the 5-kilometer “buffer zone” potentially degraded by artisanal and small-scale mining (ASM) ranged from 0.1 percent to 46.2 percent. In many of the case studies, ASM was seen to have lower direct deforestation impacts compared with sectors like agriculture or forestry. However, it is important to note that these case studies show a limited picture in time and, in reality, ASM often acts in conjunction with agricultural expansion, either inadvertently or through opportunism. It should be recognized that ASM is an additional form of development contributing to overall forest loss and should not be considered as less important than other sector contributions.
Forest health is not only about deforestation; mining has been found to produce severe impacts on water and soil that can indirectly impact forest health and its ecological integrity. Moreover, impacts of mining can become significant when multiple instances of mining activities happen at the same location simultaneously, as was found in the Indonesian case studies. Therefore, there is still the need to identify and attempt to reduce the impacts of mining even in a landscape dominated by activities like agriculture and forestry.
Background and Methodology
Historically, minerals and forests have been subject to distinct development strategies and governance systems. It has been assumed their uses have rarely conflicted; the relative abundance of each has meant that trade-offs have been possible.
The situation is different today. Population growth and technological advancements have resulted in ever-higher demand for natural resources. Forests in developing countries are subsequently receding at a rate exceeding their potential for natural replenishment, with a resulting loss of biodiversity and ecosystem services.
A proliferation in the applications for minerals, and therefore rapidly increasing demand, has intensified the spread of mining into forested landscapes.
“Forest smart” implies the following:
1. Acknowledging the inter-linkages between forests and other land uses
2. Adopting a development trajectory through an integrated landscape approach that will avoid or minimize adverse impacts on forest ecosystems and their biodiversity
3. Proactively seeking win-win solutions where the above points are fully integrated in the design of the interventions
While some progress has been made in applying forest-smart approaches to aspects of large-scale mining (LSM), challenges remain. For artisanal and small-scale mining operations, which are typically informal or illegal and lack the capacity (and incentives) to mitigate their impacts, the challenges for applying forest-smart approaches are considerable.
Artisanal mining is typified as formal, informal, or illegal mining operations with predominantly rudimentary technologies in the exploration and extraction by individuals or large groups of people. Small-scale mining operations can also be mechanized, or semi-mechanized, and/or have a greater degree of capitalization than artisanal mining. Together we call these ASM.
The World Bank’s Extractive Industries in Forest Landscapes program seeks to address these challenges by promoting forest-smart extractive investments to ensure that investments in the extractives sector do not erode forest capital and instead generate positive forest outcomes.
The Food and Agriculture Organization (FAO) defines forests as “lands spanning more than 0.5 hectares with trees higher than 5 meters and a canopy cover of more than 10 percent.”
Forests cover approximately a third (30.6 percent) of global land area. Net forest area, a function of conversion
EXECUTIVE SUMMARY

3FOREST-SMART MINING
of forest status to other uses and the creation of new forested areas, fell by 3.1 percent between 1990 and 2015, with the highest losses in low-income countries. The main driver of forest loss is conversion to agriculture. Mining represents the fourth-largest driver of forest loss. Forests and the services they provide are crucial to human economic and social development and well-being.
The ASM study and the parallel study on LSM share the overarching objective of supporting the World Bank’s efforts to help client countries ensure that resource extraction from forested areas serves as a force for poverty reduction and sustainable development while respecting the environment and the needs of local communities. The secondary objective is to raise awareness of the impacts of mining on forests, the mechanisms that influence forest health and thus inspire translation of our findings into avenues for action by relevant stakeholders. The ultimate goal is to support the protection of forests by the mining sector and its stakeholders.
The methodology of the studies was twofold: to undertake a literature review of existing knowledge and experience around mining in forested landscapes, and to select and analyze a number of active mine sites as case studies to identify good and bad practices for forest-smart mining and the conditions and mechanisms that motivate these practices.
Criteria for case study selection included a representative range of geographies and forest ecologies, mine types, political and governance contexts, and landscapes, including those in which ASM occurs together with LSM. The final selection consisted of 21 sites across 12 countries and four continents. LSM and ASM were both present in five of the forest landscapes studied.
Case studies followed a standardized methodology, beginning with the collection of data at the country level (on macroeconomics, natural resource governance, forest policy, protected area coverage, land tenure and indigenous peoples’ rights, ASM organization, and regulation), and the collection of data at the site level (local context, mining operations, mineral, deposit type, mining method, mercury use, ASM dynamics, and presence of LSM).
For each study site, site-specific deforestation maps were developed using a visualization method to define the mining area and mining site, around which was drawn a 5-kilometer buffer zone. Centered on the mine site identified, the local forest change analyses were complemented by the generation of a Forest Health Index (FHI) assessment for a wider 50-kilometer-diameter “potential area of influence” around the mining site.
Key Findings
Global mapping of ASM and forests confirmed that the location of ASM is driven by geology and the presence of mineralization and revealed no evidence of a tendency for ASM to actively target forest areas. Certain types of mineral deposits are found in tropical regions; therefore, they are more likely to overlap with tropical forests, particularly in forest hotspots such as the Amazon and Congo Basins.
ASM is expected to continue to respond to demand for high-value minerals and to fluctuations in commodity prices, such as that of gold. While ASM is associated with poverty, it is ultimately driven by demand for minerals (local and international) and is increasingly the subject of capital investment, resulting in a transition to ever more mechanization and destructive forms of ASM in some places.
ASM falls under a variety of international regulations and guidance, including the Minamata Convention on Mercury, the Organisation for Economic Co-operation and Development (OECD) Due Diligence Guidance for Responsible Supply Chains of Minerals from Conflict-Affected and High-Risk Areas, and regional frameworks (Africa Mining Vision, Southern African Development Community protocol on mining). However, environmental, and specifically forest-related, considerations do not feature strongly in such guidance. Various African countries have promulgated ambitious regulatory frameworks for ASM, as have, for example, Ecuador, Peru, the Philippines, and Mongolia. ASM is also partly addressed in LSM industry frameworks, for example the International Council on Mining and Metals (ICMM) and the Initiative for Responsible Mining Assurance (IRMA), and by responsible sourcing initiatives such as Fairtrade, Fairmined, and the Responsible Jewellery Council (RJC), but again, with limited scope for incentivizing better forest management.
Some mechanisms and tools for managing ASM in forests have been developed and tested, including the designation of ASM zones, the management of ASM in protected areas, and the frugal rehabilitation of ASM mine sites, but these are typically piecemeal and infrequently applied. No comprehensive guidance exists on the management of ASM in forest landscapes.
Collectively, the data provided a rich source of contextual variation at national and site levels (macroeconomic conditions, mining and forest policy, land tenure systems, sector organization, target minerals, deposit type, mining methods, interactions with LSM and other economic sectors) and facilitated an appreciation for the
4 FOREST-SMART MINING
diversity of the forms of ASM and of the conditions and mechanisms influencing the forest outcomes of ASM.
For each case study, lessons learned were identified in relation to ASM’s impacts on forests, barriers to forest-smart ASM (political/economic or governance), and solutions and mechanisms for promoting forest-smart ASM. Key findings included the following:
Impacts
• Compared to other land uses ASM has relatively few direct impacts on forests, despite being associated with a generally poor level of environmental compliance. The amount of forest within the 5-kilometer buffer zone potentially degraded by ASM ranged from 0.1 percent to 46.2 percent. It is important to note that those deforestation percentages were extracted from Global Forest Watch satellite data and do not distinguish between deforestation caused by mining or deforestation caused by another sector’s (such as forestry or agriculture) activities. Therefore, the conclusion that ASM has relatively few direct impacts on forests has been extracted from field and desk-based research in each of the case studies.
• Other ASM impacts, such as those on soil and water quality, are often more severe and can impact forest health and its ecological integrity.
Barriers
• Commodity price increases and foreign direct investment drive surges in ASM.
• LSM can act as an enabler of ASM by opening previously inaccessible areas, discovering mineral deposits, or, in isolated cases, directly encouraging ASM as part of exploration.
• Poverty and conflict are both drivers of ASM and barriers to improvement.
• Political will and macroeconomic policies that increase economic instability may drive an upsurge in ASM activities and therefore influence the severity of ASM impacts.
• Ill-adapted ASM regulations and ineffective (or non-) enforcement exacerbate the impacts of ASM.
Based on the comparative analysis of case study data, tentative complementary findings include the following:
• Deforestation in ASM areas can be less than the regional deforestation average, especially in remote areas.
• The severity of deforestation depends mainly on the
spatial distribution of the deposit.
• Hard-rock, or mixed hard-rock and alluvial, deposits are associated with higher forest impacts, likely because of their frequent location in highly forested upland areas, whereas alluvial mining tends to occur in lowland areas that have typically already been subject to deforestation.
Factors influencing forest impacts in a negative way (deforestation, biodiversity degradation, etc.)
• With regards to ASM for gold, forest impacts tend to increase in tandem with increased mercury usage, indicating that a lack of environmental stewardship is associated with widespread impacts on ecological health.
• Forest impacts of ASM are greater for operations in phases of rapid growth, such as rush scenarios, than for stable ASM operations or those in decline.
• The presence of LSM in the landscape tends to aggravate the forest impacts of ASM because of unclear accountability between each party over forest impacts and their remediation.
• ASM forest impacts appear to be worse in developing countries with comparatively higher incomes. Normally, a greater purchasing power allows for a greater mechanization of ASM operations, which in turn increases deforestation. Forest impacts of ASM appear worse in countries where mining is a greater percentage of gross domestic product (GDP).
• Evictions appear comparatively more effective in low-income countries but have social justice implications.
• Greater levels of ASM organization appear to be associated with higher forest impacts.
Factors influencing forest impacts in a positive or neutral way
• Well-established and specific land tenure rights have a positive influence on the forest outcomes of ASM.
• Pro-forest policies appear to favor better forest outcomes from ASM.
• Recognition of indigenous peoples’ rights appears to be associated with lower forest impacts.
• Legal recognition of ASM does not appear to influence the forest impacts of ASM.
• No association was found between good governance, as scored by the Natural Resource Governance Index, and the forest impacts of ASM.
5FOREST-SMART MINING
• Countries with higher protected area coverage were not associated with lower forest impacts from ASM.
Conclusion and Recommendations
Overall, it may be concluded that contextual conditions, especially economic conditions, are stronger determinants of the forest impacts of ASM than mechanisms, such as environmental governance mechanisms, suggesting that existing mechanisms are ill adapted to the regulation of ASM. Contrary to some perceptions, increased incomes rather than poverty seem to increase impacts of ASM on forests, owing to greater organization and mechanization and thus the potential for more intensive mining. For this reason, investing in strengthened policies and regulation of ASM is critical as developing countries transition to emerging country status, foreign direct investment increases, and financial capital and mechanization become more readily available to ASM operations. Therefore, countries in this economic transition should be prioritized for support in promoting forest-smart mining.
The lower forest impacts of ASM encountered in the poorer mining countries should not be cause for complacency. In such countries, it is important to prepare for the effects of future economic growth in the ASM sector and to put in place the necessary policies and regulatory frameworks as far in advance as possible to ensure that the regulation of ASM keeps pace with its capacity to engender forest impacts. In so doing, countries should be mindful of the relatively minor actual forest impacts of mechanized ASM compared with other sources of deforestation, and the linkages between ASM and poverty, and prioritize accordingly.
A key conclusion of the study is that the forest outcomes of ASM are more strongly determined by forest and protected area policies and regulation than they are by mining sector policy and regulation, indicating that the mining ministries need to engage more effectively in the governance of ASM and the management of its forest impacts. Actions that mining ministries could take include improvements to policies and regulations for ASM, anticipation and response to commodity-price effects, coordination with environment ministries, formalization of ASM, decentralized governance of ASM, management of interactions between ASM and LSM, better use of geological information, and mobilizing more international donor support for the ASM sector.
Another key conclusion is that the environmental and forest sectors could help improve forest outcomes through improved monitoring, management of the ecological impacts of ASM (notably but not only the use of mercury in gold mining), REDD+ implementation,
environmental regulation, responsible ASM eviction procedures, and the use of geological information for forest conservation planning.
Governments also need to contribute through poverty reduction and resolving conflict, improved control of foreign investors, fighting a lack of good governance, macroeconomic planning, promoting pro-forest policies, improved gold sector governance (involving both fiscal and mining aspects), law enforcement, sector coordination, empowerment of local government, landscape planning, recognition of indigenous rights, and land tenure.
Finally, environmental regulation and governance of ASM should be based on the same principles as for LSM, and regulatory frameworks should recognize that all mining operations lie on a continuum from least to most mechanized rather than treat ASM and LSM as separate sectors. It is especially important to ensure that environmentally destructive semi-mechanized small-scale mining (SSM) operations do not benefit from lighter regulation typically imposed on artisanal mining. Mining is mining, whatever its scale, and opportunities to perform it in an environmentally and socially responsible manner should be encouraged and required to the extent possible.
In order to achieve a forest-smart ASM sector, adopting an integrated approach is recommended. The following set of principles for forest-smart mining are intended to inspire tailored guidance and actions by diverse stakeholders who can influence mining’s impacts on forests:
• General forest-smart principles for mining
Good governance
1. Develop and implement clear policies for land use allocation and land ownership.
2. Ensure that the regulatory environment of ASM attempts to stay ahead of the development of the sector (recognizing that this sector has commonly been neglected or overlooked to date).
3. Take special care to safeguard comparatively weaker communities/individuals and those with special rights.
4. Improve mining regulations to adopt an ASM forest-smart approach.
Improved understanding and approaches
5. Contextualize mining deforestation by taking into account other sectors.
6 FOREST-SMART MINING
6. Improve the understanding of where ASM is occurring and its impacts on forest landscape degradation, human health and ecosystem services as a basis for designing appropriate realistic interventions with a higher chance of success.
7. Consider all impacts of mining when considering forest-smart interventions.
8. Obtain clear understanding of the role and responsibilities of miners and regulators.
Capacity building
9. Assist and strengthen the regulators of ASM in developing countries so that they can effectively implement forest-smart mining .
10. Assist and strengthen ASM operators in developing countries so that they can effectively implement forest-smart mining practices
Widen the participants in the pursuit of forest-smart mining
11. Consider the opportunities for positive synergy between ASM and LSM, and build cooperation and alliances to enable ASM to perform better on forest impact mitigation.
12. Work with the overall poverty reduction agenda and secure a critical level of political stability in priority countries.
13. Work with the environmental education agenda to disseminate facts related to the need to safeguard/protect forests.
14. Consider the role of protected areas and REDD+ in limiting the impacts of ASM on forest landscapes.
15. Take advantage of existing frameworks for supply chain management and due diligence and use market influence to raise the business case for forest-smart mining.
• Priority action points for governments
• Prioritize the introduction of a forest-smart approach to landscapes that are more vulnerable and promote an integrated “forest-smart development” approach across standardized landscape-based approaches.
• Prepare for the effects of future economic growth by placing regulations, building awareness and capacity ahead of economic growth. Artisanal miners who intend to transition to a larger scale and more mechanized methods of extraction must only be allowed to do so if they also are able
to achieve an adequate level of environmental performance.
• Recognize the rights of indigenous peoples where they occur and adequately safeguard their autonomy over land or natural resources while ensuring the respect of environmental regulations and standards.
• Allocate mining areas for ASM and promote progressive formalization as an entry point for compliance with environmental regulations and management.
• Where gold is extracted using mercury, the use of mercury and destruction of river habitats should be assigned a higher priority for allocation of scarce preventative or remedial resources.
• Priority action points for mining entities
• Address shared cumulative environmental impacts by building coalitions with companies in different sectors operating in the same community or region.
• Support local communities’ development programs and needs, recruit local people, implement accountability, and monitor impact.
• Use previously disturbed areas, optimize mine site design to reduce the area to be cleared and implement good industry practices to minimize landslides.
• Where LSM occurs in the same areas as ASM, LSM is better positioned than ASM to positively influence forest outcomes in the landscape, but it needs help in identifying and exploiting opportunities for synergy with ASM, such as implementing affordable rehabilitation or restoration techniques.
• LSM should take greater responsibility for the induced and indirect impacts associated with mining operations, including ASM and the cumulative socio-ecological impacts on the forest landscape. These duties do not necessarily mean fully assuming all responsibilities, but nevertheless supporting ASM to fulfill theirs.
• Priority action points for international finance and development institutions
• Develop new strategies to concentrate the scarce funding resources for forest protection.
• Analyze sectors where increasing demand for minerals is driven by green economy or green values and overlaps with mines operating in forest landscapes. Target mines and countries in these
7FOREST-SMART MINING
sectors for action and support.
• Build policy and expertise bridges across sectors (water, agriculture, mining, etc.).
• Prioritize giving credit to local companies and communities and only give credit to foreign companies if exploitation is agreed with local communities and causes no conflict and minimal environmental impacts.
• Agriculture is a bigger threat to forests than mining, but impacts are higher where they occur together. An opportunity may exist to divert investments for the conversion of forests into agriculture toward the rehabilitation and conversion of post-mining land into viable agriculture instead, providing a net gain for the environment and the economy. However, mining should not be regarded as an associated development front for long-term deforestation (for agricultural development objectives).
• Priority actions for the World Bank
• Integrate the recommendations in section 5 of this report into the World Bank’s country programming.
• Engage with client governments to identify (a) those that are supportive of forest-smart mining and willing to enter loans to support the implementation of the above listed recommendations or (b) where the adoption of forest-smart mining is critical for climate or biodiversity reasons but where political will for sector loans is lacking, and seek opportunities for funding from other sources (for example, Global Climate Fund, Global Environmental Facility [GEF]).
• Scope UNDP and GEF-funded capacity building for the ASM sector to ensure implementation will benefit from forest-smart mining approaches.
• Continue to build and disseminate the evidence base for forest-smart mining to client governments through the appropriate programs.
• Promote these principles to sustainability standard or guidance-setting organizations for potential incorporation into the appropriate mining and minerals frameworks.
• Promote these principles to implementing and advocacy nongovernmental organizations (NGOs), civil society organizations, social enterprises, and consultancies operating in the ASM sector to encourage their inclusion in programming and business development.
• Priority actions for downstream companies
• Adopt forest-smart principles into due diligence frameworks. Do due diligence on supply chains, including environmental management by ASM, environmental impacts (deforestation, soil degradation, water pollution, etc.). This includes the following:
» Making a commitment to forest-smart sourcing practices in the company’s sustainability and/or responsible sourcing policies, and cascading this commitment into supporting procedures and practices.
» Putting in place appropriate risk controls in high-risk provenances, including boycotting certain origins where the rule of law makes responsible business conduct impossible or highly unlikely. A high-risk provenance is where mining is carried out in a protected area or key biodiversity area.
» Monitoring suppliers’ performance in terms of forest-smart practices and report on these to stakeholders.
• Innovate “forest-smart products” derived from materials that have been provably sourced from mines that carry out forest-smart activities.
• Lobby ASM mining and mineral trading entities to gradually introduce controls for the entire risk matrix of mining (that is, not just those risks listed in Annex II of the OECD Due Diligence Guidance but also impacts on forests, water, soil and air)
• Support the introduction of environmental education programs in communities where stable sourcing relationships are established.
• Priority actions for civil society and NGOs
• Lobby mining entities for the introduction of forest-smart mining practices in the ASM sector and governments for the introduction and application of forest-smart mining principles into governmental policy and regulations.
• Implementing NGOs should support ASM miners in the adoption of alternative “clean” methods and technologies that avoid and minimize the environmental impacts of ASM (for example, mine design and rehabilitation).
• Advocate for stronger regulation of ASM and support measures to take special care and safeguard comparatively weaker communities and those with special rights.
• Fight against the lack of good governance.
8 FOREST-SMART MINING
• Proactively employ environmental education as part of program of activities and develop platforms for cooperation and mutual understanding.
• Priority actions for standard setting organizations
• Consider adaptation and integration of the forest-smart principles into standards and guidance such as CRAFT, Fairtrade, Fairmined, iTSCi, Better Sourcing Program, and so on.
• Priority areas of further research
• Prioritize where to take action by identifying “hotspots” for intervention based on the relative importance of biodiversity impacted and the feasibility for driving change.
• Recognizing that the ASM case study inventory is somewhat limited, and that the subsector is expanding both geographically and economically, actively scope such priority countries experiencing ASM in forests for new additional case studies to inform action-research based development forest-smart mining, in terms of both avoiding and mitigating negative environmental impacts.
• Analyze how to integrate and mainstream forest-smart mining principles into policy and practice in priority countries—for example, by promoting the findings of this research to relevant institutions and individuals in each of the case study countries.
• Research how to get the mining industry to take ownership of the protection of forests and how to get forest protection communities to be inclusive of environmentally responsible mining.
• Analyze how the various economic instruments (for example, taxation, tradable rights, credit incentives, carbon trading [REDD+], PES systems) for environmental management can create incentives for forest-smart mining, and ensure the financial sustainability of monitoring systems for carbon credit mechanisms.
• Research “best in class” technologies for environmental management in the forest and mining (LSM and ASM) sectors, respectively. Analyze what lessons have been learned in the forest and mining sectors regarding the successful deployment of such technologies by different actors. Consider how to promote such lessons and better technologies in priority countries and institutions.
• Research which forms of land tenure and property rights can contribute to ensure forest-
smart mining outcomes. Additionally, research which supplementary management action and incentives are key success factors.
• Research how corporate carbon policies can be integrated into existing country-level forest and carbon monitoring and measurement, reporting and verification (MRV) systems. What can be done to ensure that countries can make better use of available technologies and support improving transparency and access to carbon finance mechanisms?
• Analyze how to integrate and mainstream forest-smart mining principles into environmental and social impact assessments, including (a) capacity to set thresholds that will be adopted; (b) implementation of simplified procedures and development of classification criteria; (c) regulations against project fragmentation; (d) improvement of technical institutional support for implementation of procedures and publication of practical cases and guides; (e) use of this instrument as a basis for open dialogue and common concern; (f) strengthened monitoring and surveillance of the proposed measures, which will help improve forecasts for the future; and (g) including cumulative and landscape assessments as essential elements of ESIA, having to take a socio-ecological approach.
• Repeat this study for development minerals and ASM coal mining to better understand their impacts on forests and ascertain whether forest-smart mining approaches should be promoted in these sectors.
9FOREST-SMART MINING
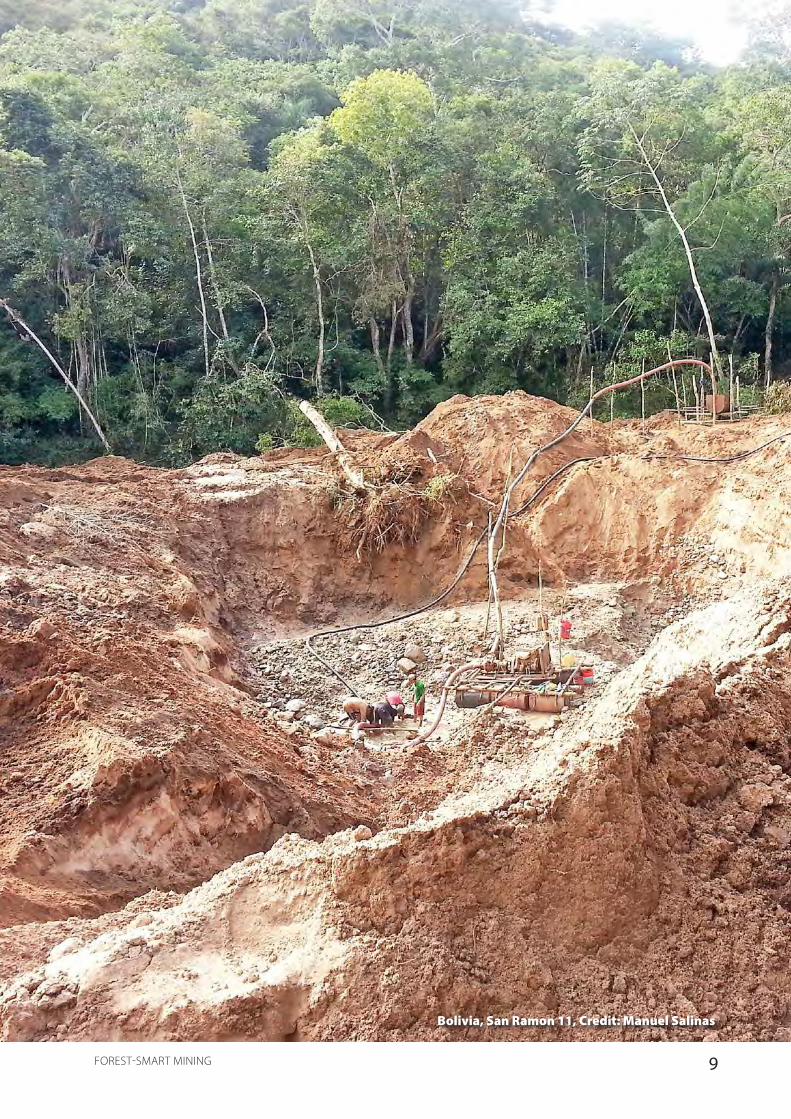
Bolivia, San Ramon 11, Credit: Manuel Salinas

10 FOREST-SMART MINING
1. INTRODUCTION1.1. Introduction and Terms of Reference
The mining sector plays a key role in modern society. First, not only are metals and minerals already essential to almost every aspect of everyday life, but they also play an increasingly important role in the development of future technology required for a transformation toward greener, more sustainable economies. Mining is not the only source of raw minerals: recycling is becoming an increasingly important part of the supply chain; steel has been recycled extensively for a long time, and now other commodities such as lead and aluminum are also extensively reused or recycled. Some companies are even taking steps to end reliance on mined minerals altogether—Apple (2017). However, recycling cannot yet meet a global demand that continues to rise. It is estimated that at least 50 percent of mineral commodity needs will have to be met by mining for the foreseeable future (Nassar 2018).
Second, mining plays a huge economic role. The sector accounts for up to about a quarter of global GDP, indirectly accounts for up to 15 percent of employment, and plays a dominant role in the economies of more than 80 countries, particularly those in the lower to middle-income bracket (ICMM 2016b). Therefore, well-managed mining has the potential to contribute positively to multiple global development goals (Columbia Center on Sustainable Investment et al. 2016).
However, national endowments of natural resources do not automatically lead to better development outcomes. On the contrary, many resource-rich nations suffer from the “resource curse,” exhibiting lower social and produced capital rates of economic growth and stability and higher rates of conflict, political authoritarianism, and social and environmental impacts (NRGI 2015). The impacts at and near the mine site are the best understood, including land clearance, displacement of people, and the generation of huge volumes of waste (eLAW 2010). To supply the 9 million tonnes of refined metals that are produced today, the waste material generated from the mining process alone is equivalent to roughly 9 tonnes per year for every person on the planet (Franks 2015). However, the less visible, indirect impacts of mining can be even more pervasive, occurring far from the mine site,
including the impacts of associated infrastructure and the influx of people that are often associated with large-scale mining projects (Sonter et al. 2017).
The impact of economic production in forest landscapes is an area of particular concern. Forests lie at the intersection of numerous development challenges. They support 80 percent of global biodiversity, which is responsible in turn for generating ecosystem services from climate and water regulatory services to food, fibers, and fuel that support over 1.6 billion people. Most of the people living near forests, and most of those with the highest dependencies on forests, are poor (UNDP 2014). Yet every year, a net 7 million hectares of forest are lost from the most sensitive areas (FAO 2016b). The importance of forests has been recognized by a range of international actors, including the World Bank, which is guided by its 2002 Forests Strategy and 2016–20 Forest Action Plan (World Bank 2016). The biggest drivers of forest loss are economic activities, so the strategy includes the vision that economic sectors do “not erode forest capital and generate instead positive forest outcomes.” A key focus of this plan is the development of forest-smart interventions across a range of economic sectors, avoiding or minimizing harmful impacts and enabling growth that does not come at the expense of forest natural assets.
Agriculture is the primary economic driver of forest loss, accounting for at least half of all deforestation globally, and thus the focus of most forest- or climate-related responses. However, the impacts of mining and associated infrastructure development can also play a significant role, particularly in early-stage deforestation (Hosonuma et al. 2012). Thousands of official and unofficial exploration and/or mining projects are located in forested landscapes, and with mineral demand continuing to rise, mining in forests is set to increase. This is particularly true in lower- or middle-income countries where mining is economically significant and where forests may play a particularly crucial role in development. However, these are also the places where the factors that lead to the resource curse tend to be most prevalent, where the poverty and vulnerability of

11FOREST-SMART MINING
people is highest and where biodiversity and ecological function is richest.
With this in mind, it is essential that existing and future mining activity in forests be “forest smart.” But what is forest-smart mining? The World Bank Program on Forests (PROFOR) defines forest smart as “a development approach that recognizes forests’ significance for sustaining growth across many sectors, including agriculture, energy, infrastructure, and water. It is sustainable and inclusive in nature, emphasizing that forests are part of a broader landscape and that changes in forest cover affect other land uses as well as the people living in that landscape. It transforms how sectors operate by identifying opportunities for mutual benefit and creating practical solutions that can be implemented at scale” (PROFOR 2016).
The negative impacts of mining on forests can be particularly visible. LSM projects can be directly responsible for clear-cutting thousands of hectares of forest, while an influx of hundreds or thousands of artisanal or small-scale miners (ASMers) can lead to extensive riparian deforestation and river pollution. Partly because of the highly visible nature of these impacts, various frameworks and guidelines for mitigation already exist. The Natural Resource Charter, for example, provides guidelines to governments looking to avoid the resource curse, including the establishment of strong environmental governance (NRGI 2014). The UN Framework Classification for Resources (UNFCR) seeks to promote an integrated global framework for resource exploitation in line with global development goals. Other examples focus on the role of business, such as the International Council on Mining and Metals good practice principles (ICMM 2017) or the International Finance Corporation (IFC) Performance Standards, particularly the standard on environmental and social sustainability (IFC 2012b).
However, does the application of good practice at the political, financial and corporate level and minimization of forest impacts at project level alone constitute forest-smart mining? Forest “smart” suggests something more than minimizing harm. It suggests a more dynamic, integrated understanding of the relationship between forests and economic activity and the identification of synergies that help to drive positive forest outcomes. Forest-smart mining, therefore, requires an understanding of the ecology of the forest landscape and all of the associated impacts and dependencies. It requires an understanding of all of the actors across the landscape and the interactions between them. It requires not only the avoidance or minimization of negative impacts but also the active pursuit of opportunities for generating positive impacts. A forest-smart mine must be more than
a mine that contributes to the economy while causing less damage than its neighbors—it must be a mine that actively understands and plays a positive role in the landscape, not only contributing economically but also actively enhancing the forest values society depends on.
The terms of reference for this project were to conduct an analysis of how to promote forest-smart mining in forest landscapes. The overall objective is “to enable client countries and the World Bank Group to make better-informed decisions about minimizing trade-offs and maximizing benefits from forest-smart mining,’’ to be achieved by “generating knowledge on the extratives-forest nexus and guidance on how to translate this into forest-smart mining.” The analysis is based on a set of in-depth case studies that investigate the key challenges countries are facing when trying to balance mineral extraction and sustainable forest management, each looking at the key issues, the opportunities for change, and the tools and policies needed to find forest-based solutions to the problems at stake.
The project has been divided into two, coordinated studies, one focusing on large-scale mining and the other on artisanal and small-scale mining. This report focuses on ASM, with the stated outcome being “the identification of good and bad practices and/or enabling conditions related to promoting forest-smart ASM based on a series of case studies.” The sibling report focusing on the same outcome from an LSM perspective is available separately.
1.2. Introduction to Mining Sector Development and ASM
While there is no universally accepted definition of ASM, the OECD definition is widely used:
“ASM-formal or informal mining operations with predominantly simplified forms of exploration, extraction, processing, and transportation. ‘ASM’ can include men and women working on an individual basis as well as those working in family groups, in partnership, or as members of cooperatives or other types of legal associations and enterprises involving hundreds or even thousands of miners” (OECD 2016).
ASM is thus typified by the use of rudimentary technology in the exploration and extraction of minerals and/or mineral-bearing ores by individuals or groups of people. However, ASM operations can also be mechanized, or semi-mechanized, depending on what is being mined and the miners’ access to capital. Capital equipment occasionally used in ASM includes excavators and draglines, while more common machinery includes sluices, generators, and water pumps. Although the

12 FOREST-SMART MINING
OECD definition states that ASM operations may employ thousands of people, they typically each have fewer than 50 people on rotation (SDC 2011).
Globally, ASM provides direct employment for an estimated 40.5 million people, and livelihoods for 150 million people (IIED 2017). It can take place in virtually any minerals industry, including low-value, high-volume commodities like coal, limestone, and mica, and high-value, low-volume minerals like diamonds, gold, emeralds, sapphires, and rubies.
The low barriers to entry of ASM make it a highly attractive employment opportunity. The deposits mined by ASM are typically more superficial than those dominated by LSM, including both primary and secondary deposits. This means that the minerals are easier to extract, requiring less equipment and machinery, and can be mined by novices. For example, any able-bodied person possessing a shovel, sieve, and a bucket can often carry out alluvial and eluvial mining of metals or gems. ASMers can also mine the discarded tailings of LSM operations, finding the minerals that were not economically feasible for the larger company to extract (Global Witness 2015). As the ore has already been extracted and crushed, this process requires little, if any, equipment. Hard-rock deposits usually require machinery, which can make them more attractive endeavors for semi-mechanized small-scale mining (SSM) operations with greater access to capital. However, some artisanal miners tackle hard-rock deposits using only rudimentary technology (Drace et al. 2012).
Documented growth trends in ASM show it is expanding in some countries, and becoming more mechanized (Verbrugge 2015). SSM uses machinery that ASM does not have access to. This machinery improves efficiency, meaning that SSM can exhaust known deposits at a faster rate, thus requiring faster access to new deposits. This can lead to competition with local agriculture sectors for land and resources, and increased environmental impacts (ACET 2017). This may also result in an increased encroachment on greenfield areas, including forests. This issue is examined in this study.
ASM’s Economic and Development Context
The earning potential of workers in the ASM sector is highly variable. Some are paid wages by mine bosses, while others collectively determine earnings based on the amount of mineral extracted and how much it sells for on the market. Despite the variability in potential income, it can be up to five times more profitable to operate in the ASM sector compared to local agricultural industries (Buxton 2013). ASM can thus play a key role in poverty alleviation. However, it is important to note that
many actors therein are also trapped in debt cycles that prevent them from leaving the sector to find alternative livelihood opportunities (Hilson 2012). This debt could be related to the challenges ASMers often face in accessing formal credit from financial institutions, especially if they are not licensed to mine (and are thus “informal”).
Informality in the ASM sector makes miners unattractive formal loan candidates because of their associated risk profile. This often forces miners to access financing options in the illicit financial sector. Illicit financial flows (IFFs) are defined as “money illegally earned, transferred or used” (GI TOC 2016). ASMers’ reliance on IFFs may result in two things: their being preyed upon by loan sharks who charge exorbitant rates of interest, perpetuating a form of modern-day slavery; and their perpetual informality, both of which may trap them in a cycle of poverty. IFFs have been associated with lower rates of formalization in the ASM sector because illicit financiers are often drawn to the sector because of the secrecy such informality allows: “it helps to keep their illegal activities and related profits, such as gold smuggling, tax evasion and money laundering, hidden from government” (GI TOC and Estelle Levin Ltd. 2016b). Therefore, once IFFs enter an ASM sector, the miners therein may face a higher risk of entering a cycle of debt from which they cannot escape (the potential environmental impacts of which will be explored further below).
ASM is nonetheless an important industry in terms of socioeconomic development. It provides a way for men—and to a lesser but ever-growing extent women (Buss et al. 2017)—to gain direct benefit from their country’s mineral resources, which are often dominated by LSM operations. LSM, because of its typically capital-intensive nature, is an industry that often quickly reaches an inflection point with regards to the number of jobs it creates in the country where the mineral is being extracted versus the number of jobs it creates outside of that country. In contrast, ASM is a labor-intensive, local pursuit that provides many different employment opportunities to local and migrant laborers, including but not limited to digger, diver, lumberman, mucker, crusher, miller, bagger, washer, amalgamation, smelter, blaster, and support roles such as electrician, security, driver, water fetcher, rodmill operator, cook, and errands runner. Industries can also emerge around ASM operations, including mechanics, restaurants, and general stores (GI TOC and Estelle Levin Ltd. 2016b). For this reason, it creates 10 times the number of domestic jobs compared to LSM (Buxton 2013). While supply chains originating in ASM can also, like LSM, create jobs outside of the country where the resource is located, the ratio of local jobs for ASM is typically much higher.
Workers are drawn to the ASM sector by myriad push-pull factors, including “shock-push,” where an unforeseen
13FOREST-SMART MINING
financial loss such as sudden unemployment or a poor agricultural yield forces them into the sector; or the “push” of inadequate wages or income from their full-time job, an issue common in the agriculture sector, which may provide only a subsistence income (ASM-PACE 2012; Banchirigah and Hilson 2010). “Pull” factors can include ASM being the only industry accessible to them (Tschakert 2009); the potential to make more money in ASM compared to other industries (ASM-PACE 2012; Banchirigah and Hilson 2010); the discovery of a new mineral deposit that is accessible to ASM (Associated Press 2017) (which often gives rise to a “rush” scenario, the environmental impacts of which are further explored below); or a sudden increase in demand for a particular mineral that improves ASM profit margins and thus makes it a more appealing industry to enter (Artisanal Gold Council 2018). These push-pull factors can influence ASM in developing, emerging, and developed countries. For example, when the global financial crisis (GFC) caused significant job losses in Australia’s LSM sector (Australian 2008), some casualties of that entered the ASM opal sector in order to make a living (pers. comm.). When the gold price increases, it has been documented that the scale of artisanal and small-scale gold mining (ASGM) in developing and emerging countries also rises (Artisanal Gold Council 2018).
Governance of ASM
In many countries, there is a lack of political will to govern ASM activities. This can be because of a belief that LSM should be prioritized over ASM; that ASM is unmanageable, which undermines productive engagement with the sector; that ASM is not a legitimate driver of economic development, although it can contribute significantly to a country’s GDP; or that ASM’s common informality and subsequent exposure to illicit markets makes it a valuable source of rents for corrupt political elites (ASM-PACE 2012).
Much of the ASM sector around the world is informal, meaning the miners do not possess the required license/s to operate. This degree of informality is usually a product of one or more of the following: onerous licensing requirements (cost, comprehension, exclusivity); obscure or imprecise legal texts; insufficient or inaccessible legally mandated mining areas; miners’ inability to access administrative capitals (because of remoteness and/or poor infrastructure); or the above-mentioned exposure to illicit financing (Hinton and Levin 2010). This informality can prevent miners from accessing resources such as training and formal credit; make them attractive sources of rents for corrupt police and government officials; and force them to work in dangerous and/or hidden locations that are less accessible to law enforcement, including protected areas (Hruschka 2015).
ASM is also often excluded from stakeholder engagement processes such as landscape planning approaches to mine and land use management. This can be because of the challenges outlined above, and/or a government preference for LSM activities (ASM-PACE 2012), which may be deemed more beneficial to national development because of the foreign direct investment they can bring (along with a greater source of rents for corrupt government officials) (SDC 2011). This can result in ASMers not having sufficient legal land to access, which, when combined with high rates of poverty and low alternative livelihood opportunities, may force them to mine in non-mandated areas (including those with a high biodiversity value). This, when combined with insufficient law enforcement and monitoring, could result in increased environmental impacts at the site level, which will be further explored below (ASM-PACE 2012).
The incidence of informality in the ASM sector has in some countries resulted in the development of local governance approaches that foster “quasi-legitimacy.” In such cases, informal miners may be technically illegal, but they have local legitimacy afforded by chiefs, local governors, or other government officials that enables their activities to continue even if they are at odds with federal law (GI TOC and Estelle Levin Ltd. 2016a). However, local authorities typically also lack the capacity (or incentive) to adequately govern ASM activities or promote the sector’s sustainable economic development, which can ultimately harm miners and surrounding communities (SDC 2011). The potential role of informality in increasing the environmental impacts of ASM is explored below. (For further background on the ASM sector, please see Annex 1).
1.2.1. The Relationship between LSM and ASM
While this report focuses on ASM, the links with LSM are strong in some countries and it is important to recognize the relationship between the two. Further investigation of the potential for forest-smart LSM is addressed in the sister report to this one.
ASM tends to focus on high value easily accessible resources in small or large deposits, including the so-called conflict minerals (tungsten, tantalum, tin, and gold, or the “3TG”), industrial minerals (cobalt, copper, rare earth, low-value commodities (like mica, sand, limestone or coal), and precious stones (like diamonds, emeralds, sapphires or rubies). However, a significant proportion of ASM also mines “development minerals” used domestically in construction, manufacturing, infrastructure, and agriculture (UNDP 2018). In contrast, LSM targets a wide range of mineral resources and geologies where they occur in commercial concentrations, including relatively
14 FOREST-SMART MINING
low value minerals where economies of scale make the exploitation profitable (such as for coal, iron ore, and so on).
ASM and LSM activities frequently and increasingly occur together, causing cumulative impacts, particularly in less developed countries. In many cases the two are inextricably linked: LSM often paves the way for ASM by exposing deposits and beginning exploration, and many of the impacts of LSM come through associated ASM activities (and vice versa). LSM and ASM can interact directly or indirectly. Direct interactions include when ASM and LSM operations compete for access to resources, or when ASM activities impact the effectiveness of LSM social or environmental impact mitigation strategies. Direct physical competition for minerals between LSM and ASM is rare, not least because of the physical dangers to ASMers working alongside LSM operations and machinery. However, ASM activities may readily occur at the margins or in parts of an LSM concession where the concentrations of target minerals are too low to justify the cost of LSM operations, or during the exploration or closure phases of an LSM concession where access may be less actively restricted. Competition by ASM during the exploration phase of an LSM concession can pose a particular challenge for LSM operators: if ASM operations are allowed to proliferate before LSM operations begin, social and political factors may make it impossible for LSM to proceed as planned, especially in a context of poverty and resource nationalism. Competition by ASM at the deposit periphery or during the closure phase may be less economically damaging, but it can pose significant reputational, social and environmental risks. Indirect interactions include social, economic, administrative, or political processes that favor one form of mining over another, such as when ASM interests negatively influence LSM licensing, or preferential treatment of LSM results in the suppression of ASM.
Where ASM operates in the same landscape as LSM, even if outside of LSM concessions and therefore without direct competition for resources, ASM can nevertheless undermine the social and environmental mitigation commitments of LSM. Examples would include where ASM impacts LSM’s ability to maintain air or water quality, or where ASM damages vegetation that the LSM project has undertaken to protect as a part of a compensation or offset program. ASM activities may also physically interfere with LSM project infrastructure, such as transport routes, mine roads, pipelines, construction camps, or accommodation blocks. This may be a particular challenge where the infrastructure lies outside the mining concession and is not subject to formal company legal ownership. Companies typically attempt to resolve such issues via their corporate social responsibility (CSR) or external affairs departments with
little support from government.
1.3. Introduction to Forest Sector Development
Definitions of forests vary greatly according to whether they are seen in ecological, economic, political, or cultural terms, with over 1,500 definitions documented (Chao 2012). For this report, the FAO definition of forests has been adopted since it is the definition for which data are most readily available. The FAO defines forests as any land spanning more than 0.5 hectares, with trees higher than 5 meters and a canopy cover of more than 10 percent. The definition is driven both by the presence of trees and the absence of other land uses; therefore, it includes areas of mangrove, bamboo, palm, rubber wood, cork, and even Christmas tree plantations but excludes other tree-based agricultural production systems, such as oil palm, fruit trees, and most agroforestry (FAO 2015a). While the FAO definition is the dominant definition of forest, it should also be noted that it has its limitations, particularly drawing criticism for its inclusion of plantation forests (Jones 2017). Furthermore, the FAO definition is informed primarily by economic timber production as opposed to ecosystem services, landscape management, socioeconomics, or any of the other potential objectives for forest management (Chazdon et al. 2016).
(see Figure 1-1)
Forests represent a major proportion of the planet’s land area. In 2015, forest area (defined by the FAO as land designated as forest—not necessarily land with trees on it) covered just under 4 billion hectares, or approximately a third (30.6 percent) of the global land area. Ninety-three percent is defined as natural forest and the remaining 7 percent as planted forests. Most of the world’s forests are in high-income countries, followed by upper-middle, lower-middle, and low-income countries (FAO 2016a). Most natural forest is in Europe (although 81 percent of the continent’s forest area accounts to the Russian Federation), followed by South and then North America (CIFOR 2016; United Nations 2014).
Forests and the services they provide are crucial to human development and well-being and are expected to play a role in the delivery of all 17 Sustainable Development Goals (Angelsen et al. 2014). Forests are an important source of cash income, particularly in developing countries where forests are the second-largest source of income. In Africa, 11 percent of the population is estimated to be lifted above the poverty line because of income from forest resources (FAO 2014). Income from the formal forest sector, which is dominated by timber production but also includes wood fuel and non-timber products, totals about $600 billion/year, or just under 1 percent of the global economy (Ecosystem Marketplace

15FOREST-SMART MINING
2017). Other forms of formal income from forests include payments for ecosystem services, including from REDD+, but these still represent a fairly small fraction of income. In 2016, the value of carbon credits from forestry and land use projects was just $67 million (Ecosystem Marketplace 2017). Outside the formal economy, an estimated $33 billion/year is generated from wood fuel and charcoal and $88 billion from non-timber products, including plant products, animal products, and medicines, although these are likely to be substantial underestimates (Angelsen et al. 2014).
Forests are also an important source of noncash income, which can represent half of total income in developing countries. This includes income from food, animal feed, building materials, fuel and medicine (Wunder et al.
2014; Noack et al. 2015; Angelsen and Dokken 2015). Forests also provide valuable services that are much harder to quantify economically. For example, forests are an important safety net for rural communities in times of economic stress. Even if people do not rely primarily on services from forests, the option to fall back on them in times of crop failure, commodity price crashes, or weather shocks can be important in certain circumstances (FAO 2014).
Moreover, forests are an important source of employment. The formal forest sector employs over 13 million people, with a further 40 million employed in the informal sector and another 840 million using forests to collect fuelwood (Miningfacts.org 2012). This can be compared to the 3.7 million employed in the formal mining sector (Chao 2012).
Figure 1-1 Different Stakeholder Perspectives and Definitions of Forests
Source: Chazdon et al. 2016.

16 FOREST-SMART MINING
A large number of people depend on the products and services forests generate, particularly in developing countries, although quantifying this is challenging. Most attempts to quantify reliance are based on the numbers of people living in and around forests. The most recent estimate of this suggests about 1.3 billion people, or one-fifth of the global population, live in or near forests and obtain direct or indirect benefits, including some 300–350 million indigenous people who depend almost entirely on forests (FAO 2014). However, these estimates are disputed and the FAO has suggested the number of forest-dependent people could be closer to 750 million (FAO 2015b).
The FAO measures changes in forest status over time through indicators of total area and composition, levels of sustainable forest management, ecological integrity and biodiversity, and economic and social benefits. Together these give a picture of falling forest cover and quality, particularly in the tropics, with potentially severe implications for the people that rely on them.
Total forest area has been falling for many decades, with forest composition changing from natural to planted and degradation increasing, but rates of change vary over time, geography, and economic status. Net forest area—a function of conversion of forest status to other uses and the creation of new forested areas—fell by 3.1 percent between 1990 and 2015, although losses have slowed by 50 percent since 2000. Rates of loss were highest in low-income countries. High-income countries actually increased forest area coverage during this period. Upper-middle countries decreased losses over time and exhibited a small increase from 2010 to 2015. Lower-income countries demonstrated the largest losses and showed almost no change in loss rates over the 25-year period. Associated with this, the highest rates of loss occurred in tropical, then subtropical forests, while temperate and boreal forests showed minimal change over the same time period. In terms of composition, most of the losses were in natural forests, while planted forests have increased. Net reductions in natural forest varied from 6 million to 8 million hectares per year between 1990 and 2015, while net changes in planted forest area increased by 3–5 million hectares per year. Forest degradation has also been a factor, with important implications for biodiversity loss, carbon flux, or further conversion. Using partial canopy cover loss as a proxy for degradation shows degradation has likely affected 9 percent of the tropical forest since 2000 and 2 percent of boreal and subtropical forest over the same time period. These trends are all expected to continue for at least the next 10 years (World Bank 2016).
The primary service forests provide with recognized economic value is timber production. Timber contributes about $600 billion per year to the global economy, or about 1 percent of gross domestic product, supporting the employment of about 50 million people (Secretariat of the Convention on Biological Diversity 2001). Other services may also have economic value locally, but they are more likely to go unrecognized because they occur in the informal economy. These include the provision of a variety of non-timber forest products, such as fuel, food, building materials, and medicines.
Forests also provide a number of services to society that are difficult or impossible to value, particularly in an economic sense. These include a range of supporting or regulating services such as water provision, watershed management, flood control, carbon sequestration, soil fertility, and climate change resilience.
The biodiversity of forests is a particularly difficult underlying value to quantify economically. Forests are extremely biodiverse, with tropical forests alone estimated to hold half of all known species (Hosonuma et al. 2012). The extent to which biodiversity is linked to the ecosystem services biological systems provide is debated; however, the link between biodiversity and resilience is widely accepted.
The key driver of forest loss is conversion to agriculture, although drivers vary by transition phase and country.² In a study of 44 tropical and subtropical countries, agriculture was shown to account for about 80 percent of forest losses in total, with commercial agriculture a key driver in Latin America. Infrastructure was the second-biggest driver, particularly in Asia and Africa, and urban expansion was a significant driver in Asia in particular (Hosonuma et al. 2012).
Mining represents the fourth-largest driver of forest loss. The impacts of mining occur particularly during the pretransition phase (although this is partly due to the influence of some resource-rich, high forest cover countries such as the Democratic Republic of Congo and Guyana) and impacts are higher in Africa and Asia than in Latin America (Hosonuma et al. 2012).
2 Deforestation tends to follow a pattern described by the four phased “forest transition model.” Pre-transition countries have high forest cover and low deforestation rates. Early transition countries show rapid forest loss; late transition countries show a slowing of forest loss; and post-transition countries show an increase in (degraded) forest cover through reforestation (GSSB 2016).
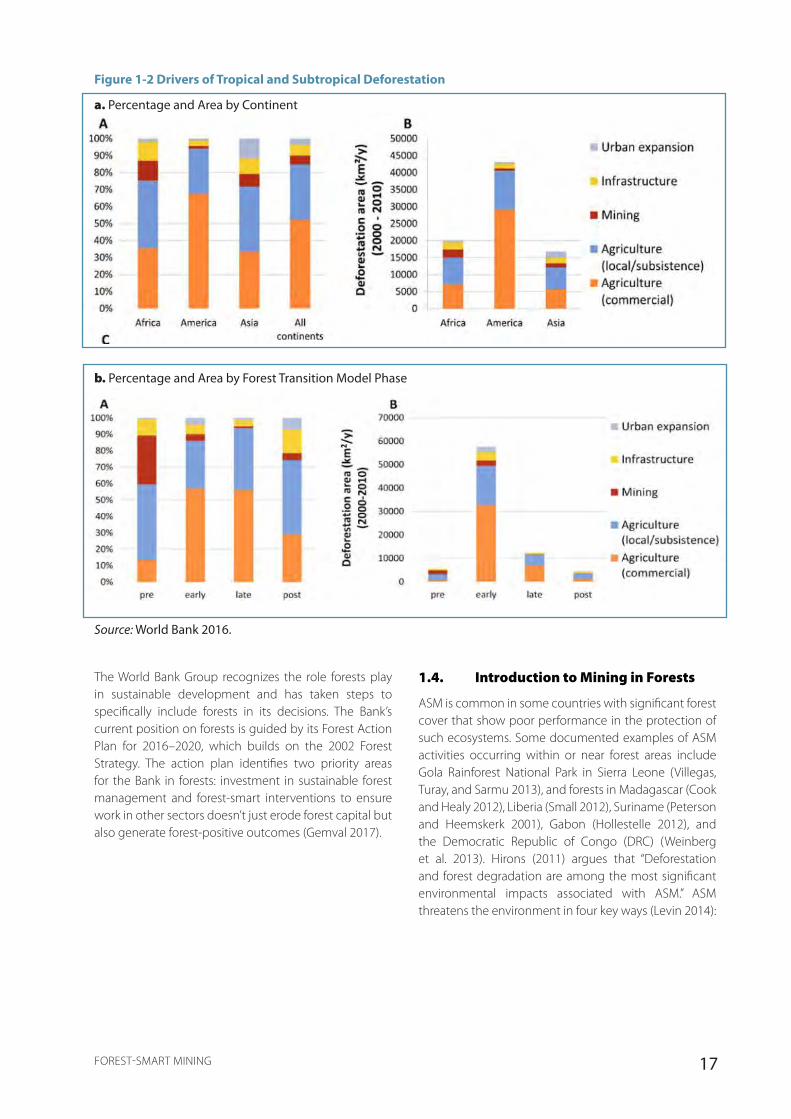
17FOREST-SMART MINING
The World Bank Group recognizes the role forests play in sustainable development and has taken steps to specifically include forests in its decisions. The Bank’s current position on forests is guided by its Forest Action Plan for 2016–2020, which builds on the 2002 Forest Strategy. The action plan identifies two priority areas for the Bank in forests: investment in sustainable forest management and forest-smart interventions to ensure work in other sectors doesn’t just erode forest capital but also generate forest-positive outcomes (Gemval 2017).
1.4. Introduction to Mining in Forests
ASM is common in some countries with significant forest cover that show poor performance in the protection of such ecosystems. Some documented examples of ASM activities occurring within or near forest areas include Gola Rainforest National Park in Sierra Leone (Villegas, Turay, and Sarmu 2013), and forests in Madagascar (Cook and Healy 2012), Liberia (Small 2012), Suriname (Peterson and Heemskerk 2001), Gabon (Hollestelle 2012), and the Democratic Republic of Congo (DRC) (Weinberg et al. 2013). Hirons (2011) argues that “Deforestation and forest degradation are among the most significant environmental impacts associated with ASM.” ASM threatens the environment in four key ways (Levin 2014):
Figure 13 The Four Spheres of How ASM Impacts the Environment
Figure 1-2 Drivers of Tropical and Subtropical Deforestation
a. Percentage and Area by Continent
b. Percentage and Area by Forest Transition Model Phase
Source: World Bank 2016.
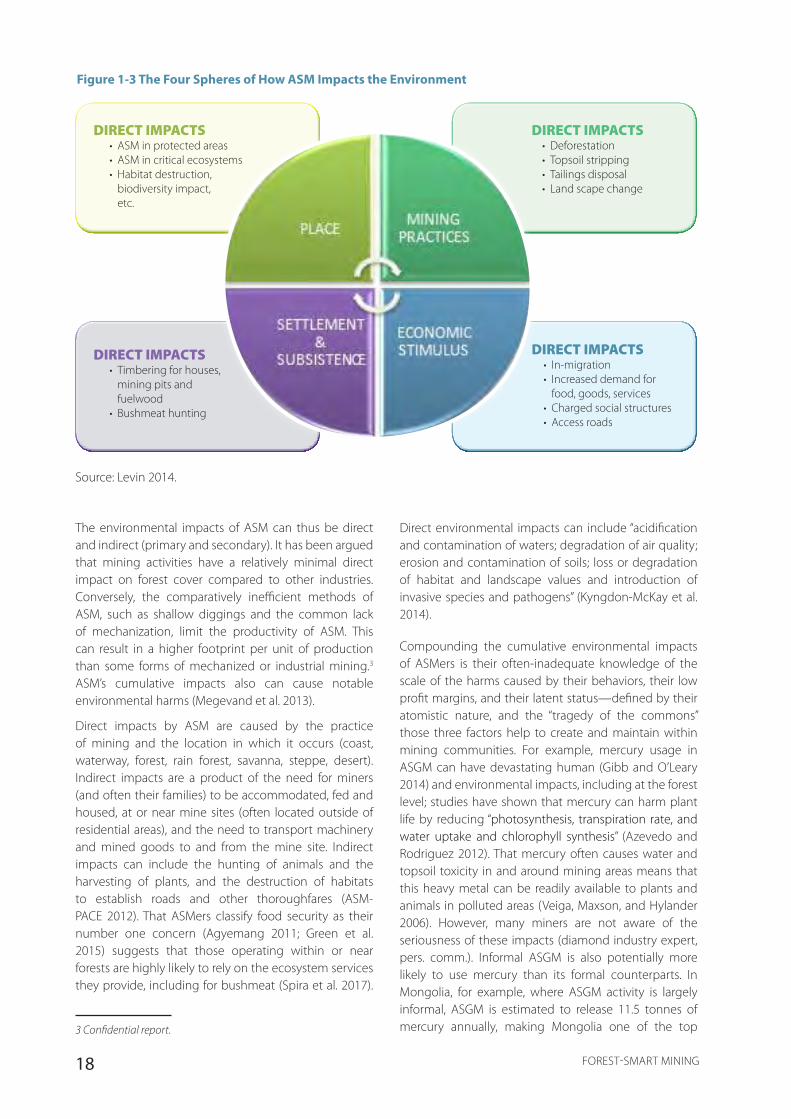
18 FOREST-SMART MINING
Source: Levin 2014.
The environmental impacts of ASM can thus be direct and indirect (primary and secondary). It has been argued that mining activities have a relatively minimal direct impact on forest cover compared to other industries. Conversely, the comparatively inefficient methods of ASM, such as shallow diggings and the common lack of mechanization, limit the productivity of ASM. This can result in a higher footprint per unit of production than some forms of mechanized or industrial mining.3 ASM’s cumulative impacts also can cause notable environmental harms (Megevand et al. 2013).
Direct impacts by ASM are caused by the practice of mining and the location in which it occurs (coast, waterway, forest, rain forest, savanna, steppe, desert). Indirect impacts are a product of the need for miners (and often their families) to be accommodated, fed and housed, at or near mine sites (often located outside of residential areas), and the need to transport machinery and mined goods to and from the mine site. Indirect impacts can include the hunting of animals and the harvesting of plants, and the destruction of habitats to establish roads and other thoroughfares (ASM-PACE 2012). That ASMers classify food security as their number one concern (Agyemang 2011; Green et al. 2015) suggests that those operating within or near forests are highly likely to rely on the ecosystem services they provide, including for bushmeat (Spira et al. 2017).
Direct environmental impacts can include “acidification and contamination of waters; degradation of air quality; erosion and contamination of soils; loss or degradation of habitat and landscape values and introduction of invasive species and pathogens” (Kyngdon-McKay et al. 2014).
Compounding the cumulative environmental impacts of ASMers is their often-inadequate knowledge of the scale of the harms caused by their behaviors, their low profit margins, and their latent status—defined by their atomistic nature, and the “tragedy of the commons” those three factors help to create and maintain within mining communities. For example, mercury usage in ASGM can have devastating human (Gibb and O’Leary 2014) and environmental impacts, including at the forest level; studies have shown that mercury can harm plant life by reducing “photosynthesis, transpiration rate, and water uptake and chlorophyll synthesis” (Azevedo and Rodriguez 2012). That mercury often causes water and topsoil toxicity in and around mining areas means that this heavy metal can be readily available to plants and animals in polluted areas (Veiga, Maxson, and Hylander 2006). However, many miners are not aware of the seriousness of these impacts (diamond industry expert, pers. comm.). Informal ASGM is also potentially more likely to use mercury than its formal counterparts. In Mongolia, for example, where ASGM activity is largely informal, ASGM is estimated to release 11.5 tonnes of mercury annually, making Mongolia one of the top 3 Confidential report.
Figure 1-3 The Four Spheres of How ASM Impacts the Environment
DIRECT IMPACTS• Deforestation• Topsoil stripping• Tailings disposal• Land scape change
DIRECT IMPACTS• ASM in protected areas• ASM in critical ecosystems• Habitat destruction,
biodiversity impact, etc.
DIRECT IMPACTS• In-migration• Increased demand for
food, goods, services• Charged social structures• Access roads
DIRECT IMPACTS• Timbering for houses,
mining pits and fuelwood
• Bushmeat hunting
19FOREST-SMART MINING
ASGM mercury polluters in the world. The link between informality in ASM and mercury usage is largely a product of the sector being out of reach of government attempts to curb mercury usage via educational outreach and/or the application of fines (GI TOC and Estelle Levin Ltd. 2016a).
Furthermore, the economics of ASM, in terms of the subsistence living it often provides, and the low profit margins otherwise typically associated with the practice, means that investing in environmentally conscious mining and processing techniques may not be deemed financially feasible by ASMers (SDC 2011). The latent status of the ASM sector also means that it does not make social or economic sense for an individual ASMer or group thereof to repair the environmental damage their mining and/or processing activities cause: the personal costs associated with doing so would not justify the benefits gained in the aggregate (Olson 1967). And finally, the enforcement vacuum that often exists in ASM communities and the sector’s low barriers to entry mean that the opportunity costs of abandoning mines and migrating elsewhere are extremely low; thus, abandoning mined-out areas without performing rehabilitation is a low-risk option for ASMers (Kyngdon-McKay et al. 2014; African Mining Vision 2011). As summarized by the World Bank, “Miners who lack a long-term perspective in relation to their small-scale mining activities pay little or no attention to environmental concerns” (SDC 2011).
The prevalence of informality in the ASM sector means that the typical mine life cycle differs from that in the LSM sector. Informal ASMers are highly unlikely to engage in extensive pre-planning activities, including the development of environmental impact assessments (EIAs) or social impact assessments (SIAs). They are also more vulnerable to short-term factors that may make continuing mining financially unviable, such as local weather events, trade disruptions, or mine site safety issues. In such cases, ASMers may be forced to abandon deposits. When informal ASMers do exhaust a deposit, it is unusual for them to engage in the any kind of mine site rehabilitation or mine closure activities. In contrast, formal ASM operations can have a similar life cycle to LSM activities (see LSM report for a typical LSM life cycle), although the legal requirements for mine site rehabilitation may be less onerous.
Informal ASMers fearful of being identified by local authorities or of conflict with other land users may feel compelled to operate in protected areas to evade identification and arrest. Protected areas can be national parks, World Heritage sites, and other demarcated areas of high biodiversity value. The management of this problem has been the focus of several studies. A summary of the literature by Kyngdon-McKay et al. (2014) shows that government attempts to reduce the incidence of ASM in
protected areas are often unsuccessful: “ ‘fortress’ or ‘stick and pen’ approaches to protected area conservation, which are defined by physical or legal barriers to entry, do not prevent incursions from the ASM sector if viable mineral deposits are known to exist therein (Dondeyne et al. 2009). The formal establishment of dedicated mining zones (in or outside reserves) are also only effective if they encompass actual mineral deposits that can sustain miners (Dondeyne and Ndunguru 2014). Furthermore, governments that elect to outlaw ASM activities, or do not provide viable options for miners to mine outside key conservation sites, do not stop the practice from occurring; rather, workers may instead be incentivized to access more isolated and remote protected areas, such as World Heritage sites, which large-scale or junior mining entities have agreed to avoid (Turner 2012), suggesting that such measures do not prevent the ASM sector’s environmental impact but only change the pattern of its impact (Robbins et al. 2006).” These findings are relevant for understanding how forest-smart ASM can be better enabled by government and civil society, an issue this report will explore in greater detail in the case studies.
1.4.1. Ecological Ramifications of Mining-Related Forest Impacts
The impacts of mining on forests are not only restricted to changes in total forest cover. Because they are complex ecological systems, forests can respond in a variety of ways to different impacts.
For example, edge effects are diverse physical and biotic changes associated with the often-abrupt verges of forest clearing, roads and linear clearings, and are particularly important in tropical rain forests. Various edge-related changes in forest structure, microclimate, and forest dynamics have been observed near linear clearings in the Amazon, the Caribbean, and tropical Australia. Forests within 50–100 meters of edges experience greater diurnal fluctuations in light, temperature, and humidity, being typically drier and hotter than forest interiors, with elevated tree mortality, numerous canopy gaps and a proliferation of disturbance-adapted vines, weeds, and pioneer species. Such changes can alter the community composition and abundance of many different faunal groups (Laurance, Goosem, and Laurance 2009).
Pollution is often considered one of the main ecological impacts of ASM, with severe implications on ecological and human health. The artisanal gold sector is the main source of mercury releases into the environment, estimated to release about 1400 tonnes/year (UNEP 2018). In aquatic ecosystems, mercury is converted to more toxic compounds, which are taken up by aquatic organisms, accumulated in their tissues, and then transmitted up the food chain, with mercury’s
20 FOREST-SMART MINING
concentrations being amplified up trophic food levels. Elevated concentrations of mercury affect reproduction and other cell functions in fish (Sandheinrich and Wiener 2011), and can be lethal if it reaches as high as 5–10 µg/g (Wiener and Spry 1996). In terrestrial ecosystems, elevated concentrations of mercury can disrupt essential microbial activity in soils (Mahbub et al. 2016) and disrupt vital cell functions in vegetation (Nagajyoti, Lee, and Sreekanth 2010).
The presence of miners and their associated mining communities in forested areas can introduce some human pressures that may compromise the ecological integrity of forests. For example, some species suffer heavy mortality near ASM sites due elevated human hunting pressure. In societies where the consumption of bushmeat is common, evidence shows that the presence of artisanal miners in forested areas can drive hunting, creating informal markets to cater for the demand for bushmeat (Spira et al. 2017). If such effects are strong enough, the site could become a population sink, contributing to local extinctions of species. Species that are rare, such as apex predators and large-bodied mammals and birds, and that require large home ranges or have low reproductive rates are generally most vulnerable to hunting pressure, and artisanal mining is known to be linked to the consumption of highly endangered species such as chimpanzees (Pan troglodytes) and gorillas (Gorilla gorilla) (Spira et al. 2017).
Clearing for roads using a cut-and-fill approach can also have knock-on effects. Unless frequent culverts are installed, filled areas impede drainage, especially in tropical regions that receive heavy wet-season rainfall. This can lead to extensive flooding on the upstream side of the road, killing large patches of inundated vegetation. On the downstream side of road fills, water flow can be impeded, causing small streams to fail and desiccation stress to vegetation, especially during the dry season. Roadcuts and local sand- and gravel-quarrying operations can also be major sources of erosion and stream sedimentation (35–500 tonnes hectares per year), further impacting aquatic ecosystems and biota and increasing the likelihood of landslides (Laurance 2015; Laurance, Goosem, and Laurance 2009). Finally, roads can alter natural disturbance regimes: in fire-maintained tropical woodlands and savannas, for example, roads can create artificial fire-breaks, leading to a proliferation of mesic vegetation at the expense of fire-adapted species (Das 2004; Barber et al. 2014).
Forest species are especially vulnerable to mining-related impacts such as linear infrastructure and forest clearing because they include many ecological specialists that avoid even narrow (<30 meters wide) clearings and forest
edges. In addition, roads have a major role in opening up forested tropical regions to destructive colonization and exploitation. Although essential in many cases for human activities and economic development, poorly planned or excessive road expansion can result in irreparable damage to, or destruction of, forests. Roads that penetrate into remote frontier regions often lead to forest encroachment and destruction. Paved highways are particularly damaging because they tend to spawn networks of secondary roads that can increase the spatial scale of their impact (Laurance, Goosem, and Laurance 2009).
Linear clearings can also facilitate species invasions in the tropics—for example, fire ants (Wasmannia auropunctuta), exotic earthworms, and non-forest vertebrates; fungal dieback, caused by Phytophthora spp.; and myriad weed species. Repeated spraying, burning, or mowing of vegetation in linear clearings favors exotic and disturbance-adapted species at the expense of native species. Road-borne invaders affect not only native biota in the tropics. In Ecuador, for example, levels of human enteric pathogens were two to eight times higher in villages near roads than in more remote areas. Likewise, increased incidences of dengue fever, malaria, and HIV have been reported in people living near roads in India, Brazil, and Uganda, respectively. By facilitating invasions of novel and potentially lethal pathogens, roads penetrating into remote frontier areas also pose a threat to indigenous groups attempting to live with limited or no contact with outsiders (Laurance 2015).
1.5. The Importance and Definition of a “Forest Smart” Approach to Mining
The importance and growth of mining and the importance and loss of forests mean that we need to ensure future mining in forest landscapes is “forest smart.” PROFOR defines forest smart as “a development approach that recognizes forests’ significance for sustaining growth across many sectors, including agriculture, energy, infrastructure, and water. It is sustainable and inclusive in nature, emphasizing that forests are part of a broader landscape and that changes in forest cover affect other land uses as well as the people living in that landscape. It transforms how sectors operate by identifying opportunities for mutual benefit and creating practical solutions that can be implemented at scale” (PROFOR 2016).
Mining best practice, where relevant to forest, generally refers to the avoidance and/or minimization of direct negative impacts and the creation and/or maximization of positive impacts on forest cover or select forest
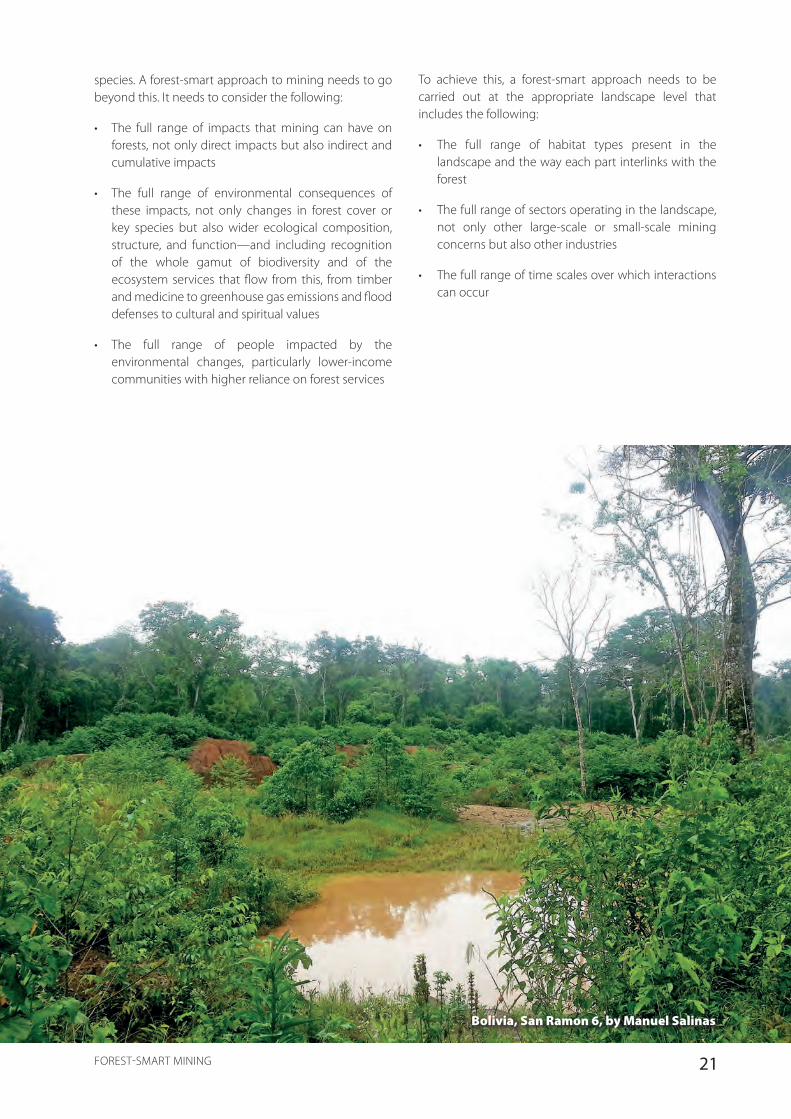
21FOREST-SMART MINING
species. A forest-smart approach to mining needs to go beyond this. It needs to consider the following:
• The full range of impacts that mining can have on forests, not only direct impacts but also indirect and cumulative impacts
• The full range of environmental consequences of these impacts, not only changes in forest cover or key species but also wider ecological composition, structure, and function—and including recognition of the whole gamut of biodiversity and of the ecosystem services that flow from this, from timber and medicine to greenhouse gas emissions and flood defenses to cultural and spiritual values
• The full range of people impacted by the environmental changes, particularly lower-income communities with higher reliance on forest services
To achieve this, a forest-smart approach needs to be carried out at the appropriate landscape level that includes the following:
• The full range of habitat types present in the landscape and the way each part interlinks with the forest
• The full range of sectors operating in the landscape, not only other large-scale or small-scale mining concerns but also other industries
• The full range of time scales over which interactions can occur
Bolivia, San Ramon 6, by Manuel Salinas
22 FOREST-SMART MINING
Figure 2-1 shows the occurrence of major deposits of: Gold, Gems, Diamonds, Columbium (Niobium), Tantalum; as proxy for ASM in low and middle-income countries, in combination with global forests and intact forest landscapes. Note that, unlike for LSM, no global spatial data set of ASM mines exists; therefore, this figure only shows an indication of where ASM hotspots could be expected. More details regarding the minerals targeted by ASM and their occurrence can be found in Annex 1.
While Figure 2-1 shows significant regions where mineral deposits and large forest areas overlap, no evidence suggests a causal relationship between mineralizations and forest occurrence. Areas defined as forests cover 43 percent of the global land area, while 42 percent of the mineralizations selected as proxies for ASM (gems, gold, coltan) occur in the same forested areas. This suggests there is no overrepresentation of such mineralizations within forests.
The lack of a causal relationship is not surprising given that the formation of most significant ore deposits is the result of geological processes operating over millions to billions of years. Conversely, modern-day flora is comparatively young and has largely developed during the Quaternary period (MacArthur 1972). Thus, the patterns that control where primary ore deposits are found and where forests are located are unrelated, and any spatial overlaps are largely coincidental. There are, however, some exceptions to this general rule. These relate to mineral deposits that form in tropical climates, and to some situations where vegetation is thought to have a role in forming actual mineralizations, notably with regards to gold.
Some recently developed mineral deposits are more likely to be present in tropical regions, which in turn make them more likely to overlap with significant tropical forests. Thus, this relationship does not represent a direct link to the presence of vegetation but rather a link to tropical climate. Examples of these include laterites, which may contain bauxite or nickel ores. Laterites are
usually relatively young deposits (formed between the mid-Tertiary to the mid-Quaternary periods), resulting from the leaching of parent sedimentary rocks, which requires repetitive wet and dry seasons to create the necessary tropical weathering conditions (Dalvi, Bacon, and Osborne 2004). Tropical weathering conditions may also upgrade some near-surface primary deposits such as gold deposits, and possibly some gems.
The root systems of big trees can act as traps where heavy minerals such as gold and gems, including diamonds, preferentially settle and form placer deposits. There is also evidence that suggests that recent biological processes may create gold deposits, and practical evidence seems to suggest that gold nuggets may be formed in close association with tree root systems, and such nuggets are often sought by ASM operators (Lintern 2007).
2.2. Projections for ASM in Forests
Increases in Global ASM
Consumption of mineral resources has increased exponentially over the past 100 years and further growth is expected. Some studies predict that more metals will have to be produced by 2050 than over the past 100 years (Vidal et al. 2017). Moreover, new technologies now require new mineral resources than the ones mostly in demand at the beginning of the 20th century. Cobalt mining, for instance, has been growing because of market demand for electric vehicles and electronics (IIED 2017) and is expected to grow by 70 percent until 2020 (Martin et al. 2017). ASM is predicted to follow this increase in demand for high-value minerals often mined by ASM and will continue to respond to fluctuations in commodity prices, such as that of gold (IIED 2017). Estimates for the growth of ASM globally vary significantly and cannot be stated with accuracy, but some indicate that in the past two decades ASM has grown at least six times faster than the average population growth (ASM Inventory 2017).
Despite the global increase in demand for raw
2. GLOBAL DISTRIBUTION OF ASM IN FORESTS
2.1. Presence of Minerals in Forests
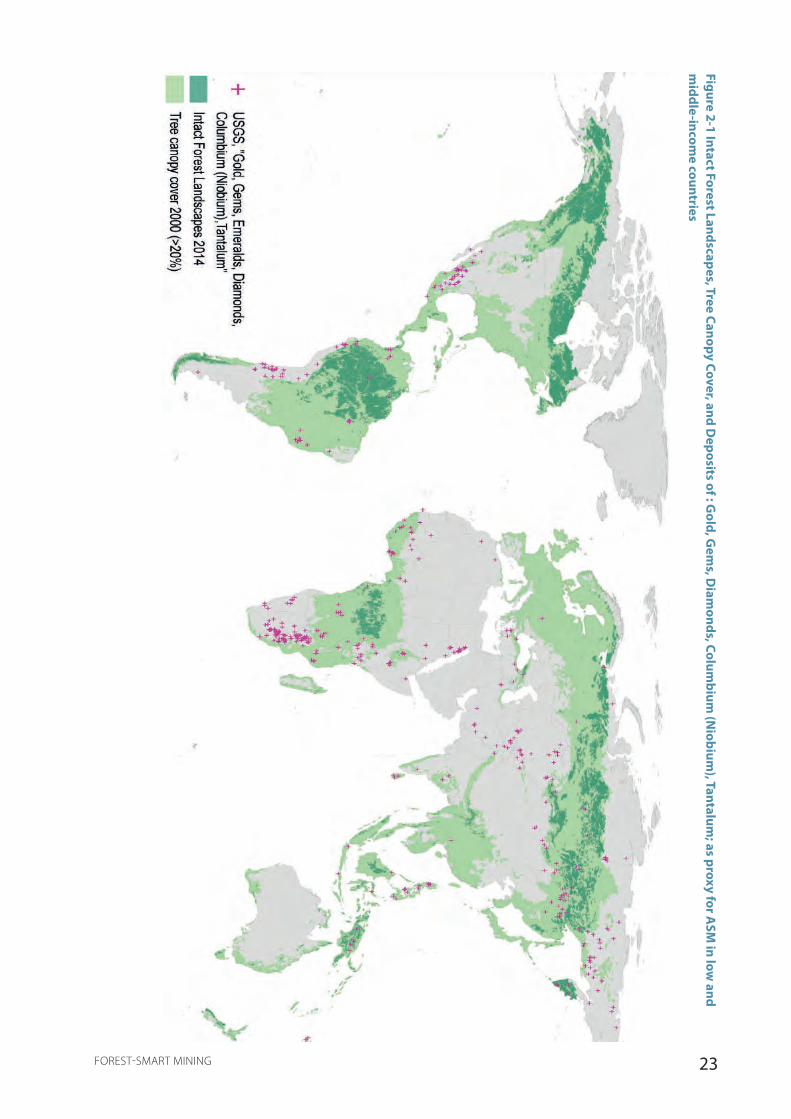
23FOREST-SMART MINING
Figure 2-1 Intact Forest Landscapes, Tree Canopy Cover, and Deposits of : G
old, Gem
s, Diam
onds, Columbium
(Niobium
), Tantalum; as proxy for A
SM in low
and m
iddle-income countries
24 FOREST-SMART MINING
minerals, as previously explained in this report, ASM is primarily a poverty-driven activity; therefore, its extent would decrease if poverty is alleviated above a certain threshold—for ASM to reduce, incomes need to be high enough for ASM to be a less attractive livelihood altogether and not act as a source of capital for more investment in ASM and its mechanization. The lack of understanding on how to break the poverty cycles in which ASMers are trapped has limited the success of many development programs (Hilson and McQuilken 2014). Many poverty reduction projects have focused on the provision of alternative livelihoods, but there is little evidence of alternative livelihood programs successfully reducing ASM activities (Hilson and Banchirigah 2009). Nowadays, however, alternative livelihood programs are being replaced with diversified livelihood projects that recognize the value of diversified income-generating activities (IIED 2017). Diversified income-generating activities have shown some promise in poverty reduction, but not ASM reduction (IIED 2017). Global trends such as climate change, conflict, and large-scale immigration are all additional background trends that can drive more people toward ASM at a large scale if they become exacerbated in the future as globally predicted.
ASM growth, however, might not be as high as expected because LSM is expected to cover areas commonly exploited by ASM (IIED 2017). Technology developments and the exhaustion of highly prospective deposits are driving mining companies to explore previously neglected lower-grade and hard-to-access resources (IIED 2017), some of which (the most accessible ones) having been predominantly mined by ASM to date. It has been observed that some LSM companies follow ASM miners during the exploration phase to identify potential new claims, obtain the license, and then evict the miners (Luning 2014), which could spike conflict and force even more ASM operators to encroach protected areas. Globally, intact forest landscapes are spread over Russia, Canada, South-East Asia, Central Africa, and South America, and we can see how reserves of gemstones, gold, and columbite, in some cases, are located within those forested areas (see Figure 2-1).
As detailed previously in this report, currently about 70–80 percent of ASM activities are unregulated. A growth in informal ASM activities, which would occur if ASM continues to grow as a sector, would potentially raise more questions about the sustainability of this production sphere. However, at the end of the day, ASM regulation will be limited by the willingness of all stakeholders in the supply chain to pay more for what is produced and engage with certification schemes, law enforcement, and monitoring. Without those put into place, informal ASM will clearly expand and create even more long-term challenges to our forested landscapes.
Increases in Global ASM in Forest Hotspots
Figure 2-1 points to some general hotspots of potential ASM activity in forests. In the Congo Basin, for example, the rising demand for minerals such as cobalt and the 3TG can be expected to drive increased ASM activity in the area. With no signs of significant political stability, poverty relief, or an end to the conflicts that have prevailed for decades, Central Africa is a region that must receive increased attention in terms of the forest impacts of mining.
The Amazon Basin also stands out as an area where impacts of ASM on forests must be monitored, particularly given past research that correlates increases in gold prices with mining-led deforestation in the Amazonian forests (Swenson et al. 2011). Countries such as Bolivia, Ecuador, and Peru have relatively high levels of organization in their ASM sector and all have detailed national development policies that include the upscaling and technical improvements to their ASM sector. Such shifts from artisanal to small- and medium-scale mining must be closely monitored, as there is the potential both to contribute to better mining methods and to amplify the scale and severity of forest impacts.
2.3. Managing ASM in Forests
2.3.1. Policy and Regulatory Landscape for ASM in Forests
A number of existing key policy and regulatory frameworks have or could have an impact on the promotion of forest-smart mining. These are on a scale between voluntary and compulsory, national and global regulations. Some contain explicit references to ASM; others indirectly link to ASM. In the following section, a variety of global and regional frameworks as well as national regulations and industry frameworks are analyzed for their potential contribution to managing the forest impacts of ASM.
Global Frameworks
A number of global frameworks and standards address environmental conservation, sustainable forest management, and protection of biodiversity and protected areas. Some of them explicitly refer to ASM; others do not, but they form part of the frameworks that guide countries’ actions in forest management and can be applied to ASM.
Frameworks That Explicitly Apply to ASM
The Minamata Convention on Mercury was adopted in 2013. As of June 2017, this international treaty counts 128 signatories and 55 parties. Its goal is to promote the
25FOREST-SMART MINING
protection of human health and the environment from mercury emissions and releases. It refers to artisanal and small-scale gold mining that uses mercury to amalgamate gold. State parties are called upon to reduce—and, where feasible, eliminate—the use of mercury in gold ASM and the emissions and releases to the environment from mining and processing. It encourages the cooperation between states to build capacity, promote mercury-free technologies, provide technical and financial assistance, and exchange knowledge. As the convention only came into effect in August 2017, its effectiveness to promote better practice in gold ASM cannot yet be assessed, although several countries have begun to design National Action Plans according to the convention.
The Intergovernmental Forum on Mining, Minerals, Metals and Sustainable Development (IGF) is a group of almost 60 countries committed to promote the positive impacts of mining on sustainable development and eliminate the negative ones. In its guidance document on ASM (IGF 2017), released in early 2017, the IGF Secretariat recommends its member states provide technical training to artisanal miners to improve productivity and safeguard the environment, and develop and enforce regulations with a particular emphasis on water sources, deforestation, and the use of mercury. Being a relatively new standard, its uptake and implementation are yet to be assessed, but by mid-2017 several member states had requested assistance for implementation from the IGF Secretariat.
The International Union for Conservation of Nature (IUCN) World Conservation Congress 2000 adopted the Recommendation 2.82 on the Protection and conservation of biological diversity of protected areas from the negative impacts of mining and exploration. It calls upon member states to prohibit mining in certain protected areas, and recommends strict planning, operating, monitoring, and post-use restoration conditions for authorized mining that affects protected areas.
At the IUCN World Conservation Congress (WCC) 2012, the IUCN Members’ Assembly adopted resolutions and recommendations on different topic areas, two of which are relevant for ASM in forests:
• WCC-2012-Res-037 – The importance of nature conservation criteria in land use planning policies: This resolution proposes that land use planning, including mining activities, be done “in harmony with the conservation of biodiversity and the natural heritage.”1
1 IUCN WCC-2012-Res-037, Art. 3.
• WCC-2012-Rec-175 – Strengthening the autonomy of Colombia’s black communities for sustainable natural resource management in their regions, with special emphasis on mining: The WCC asks the Colombian government to grant local communities artisanal gold mining concessions taking into account environmental aspects.2
Relevant Frameworks without Explicit Mention of ASM
Sustainable Development Goal (SDG) 15, on managing forests sustainably, restoring degraded lands, reducing degraded natural habitats, and ending biodiversity loss, is relevant in relation to how state parties manage their ASM sectors. Especially relevant targets are 15.1 on the conservation, restoration, and sustainable use of forests, and 15.2 on sustainable forest management, stopping deforestation, the restoration of degraded forests, and reforestation.
REDD+ (Reducing Emissions from Deforestation and Degradation) is a global payment for ecosystem services scheme whereby developing countries are rewarded financially for reducing greenhouse gas emissions via the reduction in loss of forest stocks. National REDD+ programs are designed to result in less forested land being converted into other land uses, which could impact the availability of land for ASM in forests (Hund, Schure, and van der Goes 2017).
The Aichi Biodiversity Targets, part of the Strategic Plan for Biodiversity 2011–2020 under the Convention on Biological Diversity, establish a framework for state parties to contribute to, and to base their national biodiversity targets on. Managing ASM could contribute to targets such as these: Making people aware of the value of biodiversity and how they can contribute (Target 1); fostering “conservation and sustainable use of biodiversity” (Target 3); promoting sustainable production (Target 4); reduce deforestation, forest degradation, and fragmentation (Target 5); and sustainable forest management (Target 7). The upcoming UN Biodiversity Conference of 2018 will focus on mainstreaming the biodiversity agenda in the energy, mining, infrastructure, manufacturing and processing, and health sectors.
State Parties to the Paris Agreement are called upon to conserve and enhance forests and to provide positive incentives and policy approaches for sustainable forest management and the reduction of emissions from deforestation and forest degradation. With ASM one of the drivers of deforestation, the Paris Agreement gives the mandate for ASM to be addressed under its articles.
2 IUCN WCC-2012-Rec-175, Art. 3(a).

26 FOREST-SMART MINING
The New York Declaration on Forests of 2014 is a nonbinding framework endorsed by governments, civil society, and private sector actors. It aims to halve the rate of loss of natural forests by 2020 and end it by 2030; therefore, it can provide a targets-based framework for reducing ASM-driven deforestation.
Regional Frameworks
The Regional Certification Mechanism (RCM) of the International Conference on the Great Lakes Region (ICGLR) asks member states to require ASM mine sites to progressively comply with the following provisions: conducting environmental impact studies and implementing environmental management plans, managing and treating dangerous substances and toxic chemicals, and having a plan and the funds in place for mine closure including rehabilitation. The RCM’s effectiveness and reach is currently limited; only the DRC and Rwanda have implemented it into national law.
In 2009, the African Union published the Africa Mining Vision, which mentions the importance to better address the environmental and health impacts of ASM while promoting ASM for development.
The Yaoundé Vision Statement was aimed at reducing poverty and improving livelihoods in ASM communities in Africa by 2015, the end of the Millennium Development Goals. It mentions the adoption of appropriate and enforceable environmental guidelines. While it is regarded as a seminal global commitment, the extent of its success has been debated.
The Southern African Development Community (SADC)3 adopted in 1997 the Protocol on Mining, with the objective to harmonize national policies and procedures and foster knowledge sharing on the mining sector. It calls for encouragement and assistance of small-scale mining, while also focusing on environmental protection, encouraging regional collaboration and information sharing regarding environmental impact assessments, protection and rehabilitation, and the training of environmental scientists. In order to be effective, however, the protocol has to be domesticated through regulatory reforms.
After the first summit on forests in Yaoundé in 1999, the Central African states agreed on the Yaoundé Declaration, a commitment to sustainable forest management in the region, including joint management of transboundary areas. From this declaration emerged the Central African Forests Commission (COMIFAC) Convergence Plan, revised and adopted in 2014. It
3 Angola, Botswana, Lesotho, Malawi, Mauritius, Mozambique, Namibia, South Africa, Swaziland, Tanzania, Zambia, and Zim-babwe.
includes the harmonization of environmental and forest policies, sustainable forest management, conservation and sustainable use of biodiversity—to be achieved through training and capacity strengthening, research, and sensitization and awareness raising.
National Regulations
At the national level, ASM in forests is governed by national regulations. This section gives a snapshot of how different countries around the world address this issue. The case study countries’ national legislations are analyzed in more detail in the respective subchapters and country profiles.
Often, ASM is an informal or illegal activity, without laws in place for ASMers to obtain licenses. In other cases, when ASM is included in the legal and regulatory system, no specific environmental measures are applied to them. In those latter cases, it is safe to assume that they must comply with the general environmental regulations for the mining sector at large.
Several African countries have laws in place regarding ASM and environmental protection. The following countries require general compliance of artisanal and small-scale miners with environmental legislation and/or avoidance of environmental pollution: Angola, Burkina Faso, Burundi, Central African Republic, Democratic Republic of Congo, Ethiopia, and South Sudan. Some countries have additional rules. For example, in Burkina Faso and Côte d’Ivoire, the use of chemical substances such as cyanide and mercury are prohibited for artisanal mining. Sierra Leone has provisions for rehabilitation and reclamation of artisanal and small-scale mine sites. In South Sudan, artisanal miners must evaluate the environmental impact of each mineral mined at a specific site, and forest products cannot be removed from the concession area unless authorized.
Some countries, including Peru, Ecuador, Bolivia, and Colombia, have special laws on the formalization and regulation of ASM that require ASMers to hold mine permits and abide by the respective environmental norms. In Ecuador and Colombia, artisanal, SSM, medium-scale mining (MSM), and LSM are clearly differentiated and defined in the law according to variables such as concession size, use of machinery, and volumes of production. Environmental as well as fiscal responsibilities increase proportionally with the scale of mining to account for higher income, technical capacity, and potential for environmental degradation. In Bolivia, mining is permitted in protected and forest areas if the environmental regulations are respected and the mining activities do not negatively affect the objectives of the protected areas.

27FOREST-SMART MINING
The Philippines has a separate law on SSM, the People’s Small-scale Mining Act, which makes the granting of a mining contract dependent on compliance with environmental regulations, with a focus on control of deforestation and pollution.4 Furthermore, the government is asked to invest in a Protection Fund for information dissemination and training of small-scale miners on environmental protection and other issues.5 The Indonesian Mining Law refers to People’s Mining as mineral exploitation by the local population.6 While there is a formal process for obtaining licenses for such SSM, no specific provisions are laid out for these miners in terms of environmental management.
Next to mining laws, environmental and forestry laws can be relevant frameworks for managing mining in forests. In many countries, such as Brazil and the Philippines, forestry codes specifically regulate any forest conversion activities, including by ASM. They are considered for the case studies where applicable.
While the above overview shows that several countries have provisions in place to frame artisanal and small-scale miners’ obligations in terms of environmental protection, these regulations rarely refer to forests in particular. Furthermore, the pure existence of regulations is far from sufficient for achieving forest-smart outcomes. Often, unclear or contradicting regulations or a lack of political will or capacity to enforce such regulation are barriers to forest-smart mining. The ASM sector is characterized by high informality even where regulations exist, often because of bureaucratic processes or lack of capacity of ASM operators to achieve compliance.
Industry Frameworks
International best-practice expectations are partly benchmarked by industry frameworks such as certification standards, voluntary industry guidelines, and compliance conditions set by financial institutions.
While industry-driven standards are a leading source of best-practice guidelines in the LSM sector, very few are directly applicable to the ASM sector. However, some best-practice guidelines aimed at LSM operations may indirectly promote good practice in ASM operations.
For example, while companies bound to the IFC Performance Standards (PS) (IFC 2012b) through conditions on financing agreements are typically large-scale companies, the provisions of the IFC Performance Standards that apply to a company’s supply chain have the potential to trickle down to ASM if the company
4 Philippines Republic Act 7076, Section 13.5 Philippines Republic Act 7076, Section 20.6 Indonesia Law Number 11/1967 on the Basic Provisions of Mining, Art. 11.
sources from that production sphere. PS1, requiring the implementation of environmental and social management plans, is broad enough to include ASM as an environmental risk to be considered by LSM companies. Other provisions within PS1, PS2, and particularly PS6, which deals with habitat protection, ensure that any subscribing company that includes ASM in its supply chain is responsible to undertake appropriate due diligence on the environmental impacts of ASM, including risks of pollution and loss of habitat.
Industry-Led Upstream Standards
Industry-led standards for upstream mining operations predominantly target LSM companies. Voluntary standards such as IRMA Standard (IRMA 2016), the Responsible Mining Index (RMI) (RMF 2017) and the ICMM 10 Principles (ICMM 2017) contain provisions on matters relating to ASM, but these are almost exclusively focused on the social issues of conflict, access to resources, and community relations. Almost no provisions within these standards specifically require LSM companies to assess or mitigate the impact that ASM can have on the effectiveness of their environmental management plans. While the IRMA Standard is still under development, the ICMM 10 Principles have to be implemented by any member company of the ICMM (currently 25 members).
Two certification schemes specifically apply to artisanal upstream operations: the Fairmined Standard and the Fairtrade Standards for Fairtrade and Fairmined gold and silver. These are only applicable to legal, stable, and formalized ASM organizations as opposed to rush situations or newcomer mining in environmentally sensitive areas. The environmental compliance requirements of Fairtrade and Fairmined are almost identical (Fairtrade International 2013; Fairmined 2014). Fairmined requires ASM organizations to assume responsibility for forest conservation, in collaboration with local community groups and authorities. Fairtrade has a very similar provision and requires ASM organizations to not damage ecosystems, which includes forests. Both standards include the option to comply with more stringent environmental requirements for obtaining the additional “Ecological” Fairtrade or Fairmined Gold label
Regarding mercury use, these certification standards prohibit whole ore amalgamation using mercury and encourage ASM organizations to contain mercury use away from water bodies. Amalgam burning must be done using recovery techniques such as retorts to minimize air pollution and exposure to fumes. Nitric acid for dissolving amalgam and cyanide leaching of unprocessed amalgamated tailings are both forbidden.
All mining operations must comply with national

28 FOREST-SMART MINING
environmental laws and have valid environmental licenses, and by implication must not be located in protection areas where mining is not permitted (unless impacts are proven to be insignificant through permits or environmental impact assessments). Refilling of open pits upon termination is required, proper waste management practices must be implemented, and plans for rehabilitation and restoration upon mine closure must be developed. Restoration measures must aim to enhance local biodiversity as appropriate for the native ecosystem, or to convert the area into an alternative land use.
Fairtrade and Fairmined Gold and Silver certifications, and the opportunity to access premium prices for gold and silver through it, provide an incentive for ASM to formalize in order to be eligible for certification. In turn, formalization of the ASM sector facilitates the effective control and regulation of its social and environmental impacts.
Fairmined and Fairtrade minerals are gaining traction in the industry, but because of low production volumes and high entry requirements, they are still a niche product in the market and only a very limited proportion of the ASM sector has the capability to participate.
Industry-Led Downstream Standards
Best practice in the ASM sector is also driven through voluntary standards targeting responsible sourcing by the downstream sector. While leading due diligence guidelines such as the OECD Due Diligence Guidance for Responsible Supply Chains of Minerals from Conflict-Affected and High-Risk Areas (OECD Guidance) (OECD 2016) are specifically concerned with conflict-free sourcing rather than environmental protection, guidelines such as the new Chinese Due Diligence Guidelines for Responsible Mineral Supply Chains (CCCMC 2015) have added environmental due diligence to the OECD Guidance to include the risks of compliance with air, water, and soil regulations; implementation of the mitigation hierarchy throughout the mining life cycle; mining in protected areas; and the violation of indigenous rights. The presence of these risks in a supply chain should trigger enhanced due diligence procedures and may result in the termination of sourcing agreements with the specific ASM source.
Other downstream standards such as those of the Responsible Jewellery Council (RJC) (RJC 2013) require members to assess the environmental impacts of the ASM producers they source from. The RJC Code of Practices certification is obligatory for RJC members, which number many of the large companies in the
precious mineral sector, but not mining. Reporting standards such as the Global Reporting Initiative (GRI) Standards require subscribing companies to report on their management approach for assessing the environmental performance of suppliers and for screening potential new suppliers based on environmental criteria.
However, the potential for the downstream sector to drive environmental best practice is limited because the OECD Guidance, which has become the major due diligence guideline that most standards are aligning with, does not call for any environmental due diligence.
What Does This Mean for Mining in Forests?
Most of the above mentioned laws, standards, policies, and guidelines have not had their impact measured. This is a key data gap that should be addressed in a separate research project. Nonetheless, the existence of these laws, standards, policies, and guidelines provides actors with some meaningful direction regarding minimizing mining’s environmental impacts. Expressly defining forest-smart mining, and advocating and normalizing its operationalization around the world, remains a requirement, however, if the specific features of responsibly mining in this type of biome are to be understood, and properly fulfilled.
2.3.2. Existing Mechanisms for Managing ASM in Forests
With the ASM sector being characterized by a high degree of informality, few established mechanisms exist for managing ASM and mitigating its forest impacts. To begin addressing ASM, the international community has strongly pushed for ASM formalization over the past decades. Formalization is important for the dual purpose of bringing the ASM sector into the legal sphere so that its methods and environmental impacts can be regulated, and making it so ASM operators can benefit from technical support, capacity building, and financial incentives that the relevant authorities cannot provide if the sector remains illegal or informal.
ASM Zones
Zoning and land use planning can be used to legally allocate ASM zones. These must contain viable mineral deposits, must not overlap with other mineral concessions or with protected areas according to the law, and should be designated after careful consideration of the potential ecological implications on other ecologically sensitive areas and ecosystem services. As the decision on where to designate ASM zones should form part of a general land use strategy for a wider region, strategic

29FOREST-SMART MINING
environmental impact assessments (SEIAs) should inform the decision on where to designate ASM zones and under what conditions to allow it to operate.
ASM zones are already part of the law and have been implemented in several countries, including the DRC, Indonesia, and Colombia. But the application of this approach has had limited success because of several barriers:
• Not enough ASM zones are being designated to meet demand.
• ASM zones are not always chosen based on appropriate geological assessment; therefore, they may not contain mineral deposits accessible to ASM.
• Extensive mineral-rich areas remain frozen in LSM concessions if mining authorities do not follow through with the requirement for devolution of an area that is not explored within a certain time frame.
Environmental Impact Assessments and Environmental Management Plans
Certain ASM operations have the capacity to take more responsibility for managing their environmental impacts. These tend to be mines that are formalized and organized into cooperatives, whereas ASM sectors where mining is informal or highly individualized are less likely to have the means to do so.
As part of the requirements to obtain a mining license, ASM operators should perform an environmental impact assessment (EIA) to identify the potential impacts of their proposed operation. In cases where capacity for this is low, a SEIA done by the government at a regional level can identify the likely impacts and mitigation mechanisms for ASM in the region. Once impacts are identified, an environmental management plan (EMP) that outlines how impacts will be avoided, minimized, or compensated for should be required from miners. In several countries, such as Ecuador and Colombia, these requirements for artisanal operators are as simple as a form to be filled in with the support of the government. In these countries, the requirements for complying with EIAs and EMPs get progressively more demanding for larger-scale operations (small-scale and medium-scale mining).
Rehabilitation of ASM areas is an often-overlooked aspect of environmental management, partly because of unclear tenure and ownership of land, unclear allocation of responsibilities for rehabilitation between state and miners, and lack of technical capacity to do so. Rehabilitation requirements should be embedded within the law and be required as part of EMPs. This has been successfully done in Mongolia, where the Frugal Rehabilitation Methodology was developed and applied specifically for rehabilitating areas mined by legal ASGM organizations and has since been incorporated into Mongolian mining law.7
7 Please see the Mongolia case study for further details.

30 FOREST-SMART MINING
Noyod Mine in Mongolia, prior to rehabilitation (Credit: Jonathan Stacey)
31FOREST-SMART MINING
3. CASE STUDIES3.1. Case Study Selection
Global ASM Database
A desk-based review of published information on ASM occurrences worldwide led to a database of countries where ASM is thought to occur. ASM has previously been identified in at least 70 countries. These 70 countries and any other countries where the researchers have experience working with ASM were not further investigated for evidence. For the remaining countries where the presence of ASM was unknown, an Internet search was undertaken for any reports, national laws and policies, news articles, blogs, or photographic evidence of ASM occurring in a given country. For this research, artisanal salt and sand mining were not included.
Criteria for Case Study Selection
Countries for potential case studies were narrowed down according to sets of predefined criteria. The first two criteria applied were “sufficient online data available” and “access to local expertise.” These acted as a feasibility screening, and any countries that did not meet these criteria were eliminated from the list of potential country case studies.
Other criteria were then set to ensure that the selection of case studies was representative geographically, ecologically, and geologically, and so that the case studies would cover as many issues of interest as possible. Countries were categorized based on continent, main forest habitat, and main mineral being produced. The ASM sector of each country was then classified according to the following stages in the life cycle of ASM:
• Prospection, exploration, or rush scenario
• Established and stable ASM production
• Mine closure or productivity decline
The following issues of interest were identified, and each country was marked according to its potential to yield valuable lessons learned on each of these issues:
• Mining and exploration methods and technologies
• Illegality and formalization
• Integrated natural resource planning
• Use of geological information
• Poverty as a driver of ASM
• Security and conflict
Additional criteria upon which countries were ranked include whether the country is a World Bank client country, whether the case study is likely to illustrate good or bad practice, and whether ASM is known to occur alongside LSM.
3.2. Case Study Methodology
The case study research utilized desk-based and field research techniques. The desk-based research included document analyses and interviews with relevant experts to fill noted information and/or data gaps. Documents were assessed for relevance, validity, and reliability prior to their inclusion in the study. The experts interviewed were chosen based on their qualifications, relevant expertise, and level of experience. Field-based interviews and site visits were undertaken for a selection of the case studies.
The desk and field research utilized a common framework that guided researchers with key questions about the country and the specific sites. This framework was semi-structured, and researchers could deviate from the framework when deemed beneficial to the study—namely, during the field research when richer data were available.
Each case study gathered information in four aspects:
• Contextual information at the country level
• Specific information at the site level
• Forest change data at the site level
• Lessons learned
The following contextual information was collected for each country:
• Country income level (GDP, GNI)
• Population living in poverty
• Unemployment

32 FOREST-SMART MINING
• Resource Governance Index (RGI)
• Strength of EIA regulation
• Biodiversity rating
• Mining as % of GDP
• Population employed in ASM
• Level of organization in the ASM sector
• ASM legislation
• Land tenure systems
• Indigenous populations’ rights
• REDD+ status
• Protected area coverage
• Forests policy
The following specific information was collected for each site:
• Mineral deposit type
• Degree of mechanization
• State of ASM (rush, stable, declining)
• Legal status of ASM
• Level of environmental compliance
• Land tenure of ASM areas
• Presence of ASM in protected areas
• Effectiveness of evictions
• Presence and influence of LSM
• Mercury use
The following forest change data were collected for each site:
• Degree of forest cover
• ASM forest outcomes at selected sites (affected area, deforestation rate in mining area, deforestation rate in 5-kilometer buffer zone, regional and national deforestation rates for comparison)
• Derivation of an ASM deforestation severity index based on intensity of deforestation in the mine working area and surrounding 5-kilometer buffer zone compared with the regional background rate
• ASM relative to other drivers of forest loss (for example, agriculture)
• Forest Health Index and ranking for the potential area of influence around the mining site
All research was carried out in adherence with Levin Sources’ Research Ethics Policy. Case study summaries are presented in this report (more detailed case study
narratives are available in the separate Annex 2). An overview of the results relating to the above country and site-level variables is presented in a series of tables in section 3.15.
3.2.1. Site-Level Deforestation Maps and Data
For each ASM case study, the following maps were produced:
a) Forest loss and gain between 2000 and 2016 on a local (circa 30-kilometer radius) and regional (circa 150-kilometer radius) scale
b) Color-coded yearly forest loss between 2000 and 2016
The maps additionally include a global intact forest data set, global protected areas data set, and, in some cases, country-specific forest extent data sets.
The intention was to support analysis of the patterns of forest loss in relation to ASM activity, and in relation to other human activities such as agriculture, forestry, and settlement.
The extent of ASM activity at each site was defined using, wherever possible, the following:
a) Interpretation of satellite Google Earth images
b) Mining exploitation license extents
c) Descriptions and maps of activity in existing published studies
The identification of ASM extent was undertaken without ground truthing; therefore, it should be understood as being generally reliable but not necessarily precise. ASM is not always unambiguously visible in satellite images, or mappable from indications in published studies. Further-more, ASM is often a dispersed activity, with scattered excavations and processing sites distributed among settlements, agricultural land, and forest landscapes. In cases where ASM extended along many kilometers of riverbeds, delimitation to a segment of riverbed was made.
For each site, buffer zones of 5 kilometers around the ASM activity zone were defined. Calculations on total area of forest loss (2000–2016) were made for the site and the buffer zone, as well as for the country and other administrative levels (district, province, or protected area where applicable). The forest loss in each target spatial entity was expressed as a percentage of area of loss (2000–2016) in relation to the area of forest extent in 2000. The difference between the deforestation rates at the site/buffer zone level and the average national deforestation rates was expressed as an ASM deforestation severity index.
33FOREST-SMART MINING
The purpose of the calculations of forest loss was to do the following:
a) Compare forest loss in ASM sites with loss in surrounding administrative districts or protected areas, where applicable
b) Compare forest loss between various ASM sites and establish whether particular conditions are more likely to lead to more deforestation at ASM sites.
The 2000 forest extent, 2000–2016 forest loss, and 2000–2012 forest gain data sets were obtained from Hansen et al. (2013); the intact forest data set was obtained from Potapov et al. (2008).
3.2.2. Forest Health Index
Area of Influence
For every ASM case study a Forest Health Index score was calculated for the area of interest (AOI) surrounding the mining area, using the same methodology as for the LSM study. The AOI describes the geographical area over which the mining activities might potentially be exerting an influence. This influence might be environmental or socioeconomic, direct or indirect, and include negative or positive impacts. The AOI implies nothing about a causal relationship between mining and deforestation; it simply recognizes the area over which influence may be exerted. The AOI was calculated based on a minimum circle of 50-kilometer radius from the mining location—based on evidence that LSM mines and ASM can exert influence over distances at least this far (for example, Sonter et al. 2017; UNESCO Buffer Zones1)—plus the subbasins of any rivers passing through this region since this is a key way LSM mines can exert influence over long distances. The area of each AOI, therefore, varied substantially.
Forest Condition Variables
Forest health for each AOI was then assessed by looking at 12 different variables associated with forest condition and ranking the sites according to their scores. Some variables were then weighted and the rankings combined to give an overall forest health score and rank. Weightings were agreed by the report authors and reflect perceived importance (Table 3-1) .
The results generated a forest health score from 0 to 1 and a ranking from 1 to 23 (lowest ranking being better performance). Once the scores were calculated, the case
study research was carried out on the “desktop” or “visit” sites to explore what factors from the mine management or the political and ecological environment might explain the differences between sites.
An important point to note is that these forest health scores and rankings are unique to this analysis. Because each AOI surrounding a mining site was only assessed relative to other such AOIs and sites in the study, the scores and rankings are relative and only show how forest health scores compared to other AOIs in the analysis. The forest health indexes say nothing about the absolute health of forests and forest ecosystems in the AOI or how those forests and ecosystems might be performing on a global basis. It is also important to note that the study is exploratory in nature—because the relationships between the mining site and the surrounding landscape are so complex, it does not set out to provide a quantitative analysis of the extent to which mining activities result in different forest health results.
In the context of the ASM study, the Forest Health Index for the AOI provided an additional indication of the extent of pressures on forests in the region surrounding the ASM mining area to complement the analyses of forest change in the 5-kilometer buffer zone and in the administrative district around the ASM mining area based on Global Forest Watch data.
-------------------------------1 World Heritage and Buffer Zones - UNESCO World Heritage Centre - https://whc.unesco.org/document/101965.
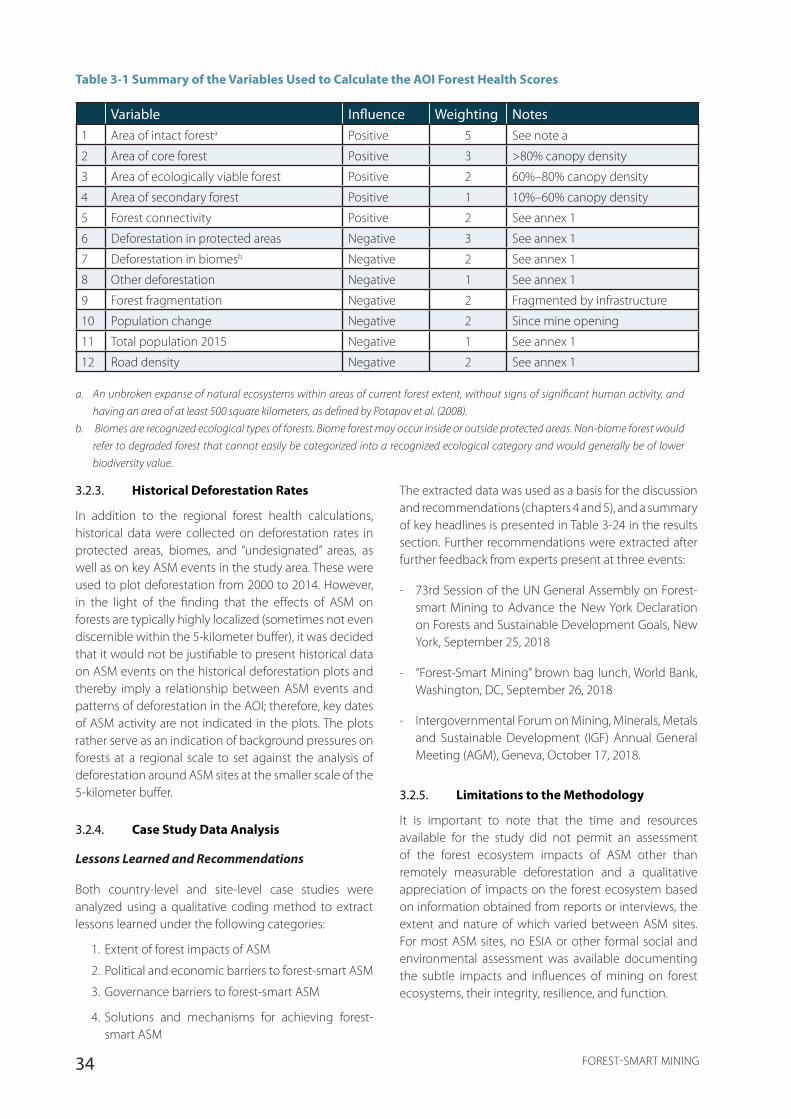
34 FOREST-SMART MINING
Table 3-1 Summary of the Variables Used to Calculate the AOI Forest Health Scores
Variable Influence Weighting Notes1 Area of intact foresta Positive 5 See note a
2 Area of core forest Positive 3 >80% canopy density
3 Area of ecologically viable forest Positive 2 60%–80% canopy density
4 Area of secondary forest Positive 1 10%–60% canopy density
5 Forest connectivity Positive 2 See annex 1
6 Deforestation in protected areas Negative 3 See annex 1
7 Deforestation in biomesb Negative 2 See annex 1
8 Other deforestation Negative 1 See annex 1
9 Forest fragmentation Negative 2 Fragmented by infrastructure
10 Population change Negative 2 Since mine opening
11 Total population 2015 Negative 1 See annex 1
12 Road density Negative 2 See annex 1
a. An unbroken expanse of natural ecosystems within areas of current forest extent, without signs of significant human activity, and
having an area of at least 500 square kilometers, as defined by Potapov et al. (2008).
b. Biomes are recognized ecological types of forests. Biome forest may occur inside or outside protected areas. Non-biome forest would
refer to degraded forest that cannot easily be categorized into a recognized ecological category and would generally be of lower
biodiversity value.
The extracted data was used as a basis for the discussion and recommendations (chapters 4 and 5), and a summary of key headlines is presented in Table 3-24 in the results section. Further recommendations were extracted after further feedback from experts present at three events:
- 73rd Session of the UN General Assembly on Forest-smart Mining to Advance the New York Declaration on Forests and Sustainable Development Goals, New York, September 25, 2018
- “Forest-Smart Mining” brown bag lunch, World Bank, Washington, DC, September 26, 2018
- Intergovernmental Forum on Mining, Minerals, Metals and Sustainable Development (IGF) Annual General Meeting (AGM), Geneva, October 17, 2018.
3.2.5. Limitations to the Methodology
It is important to note that the time and resources available for the study did not permit an assessment of the forest ecosystem impacts of ASM other than remotely measurable deforestation and a qualitative appreciation of impacts on the forest ecosystem based on information obtained from reports or interviews, the extent and nature of which varied between ASM sites. For most ASM sites, no ESIA or other formal social and environmental assessment was available documenting the subtle impacts and influences of mining on forest ecosystems, their integrity, resilience, and function.
3.2.3. Historical Deforestation Rates
In addition to the regional forest health calculations, historical data were collected on deforestation rates in protected areas, biomes, and “undesignated” areas, as well as on key ASM events in the study area. These were used to plot deforestation from 2000 to 2014. However, in the light of the finding that the effects of ASM on forests are typically highly localized (sometimes not even discernible within the 5-kilometer buffer), it was decided that it would not be justifiable to present historical data on ASM events on the historical deforestation plots and thereby imply a relationship between ASM events and patterns of deforestation in the AOI; therefore, key dates of ASM activity are not indicated in the plots. The plots rather serve as an indication of background pressures on forests at a regional scale to set against the analysis of deforestation around ASM sites at the smaller scale of the 5-kilometer buffer.
3.2.4. Case Study Data Analysis
Lessons Learned and Recommendations
Both country-level and site-level case studies were analyzed using a qualitative coding method to extract lessons learned under the following categories:
1. Extent of forest impacts of ASM
2. Political and economic barriers to forest-smart ASM
3. Governance barriers to forest-smart ASM
4. Solutions and mechanisms for achieving forest-smart ASM
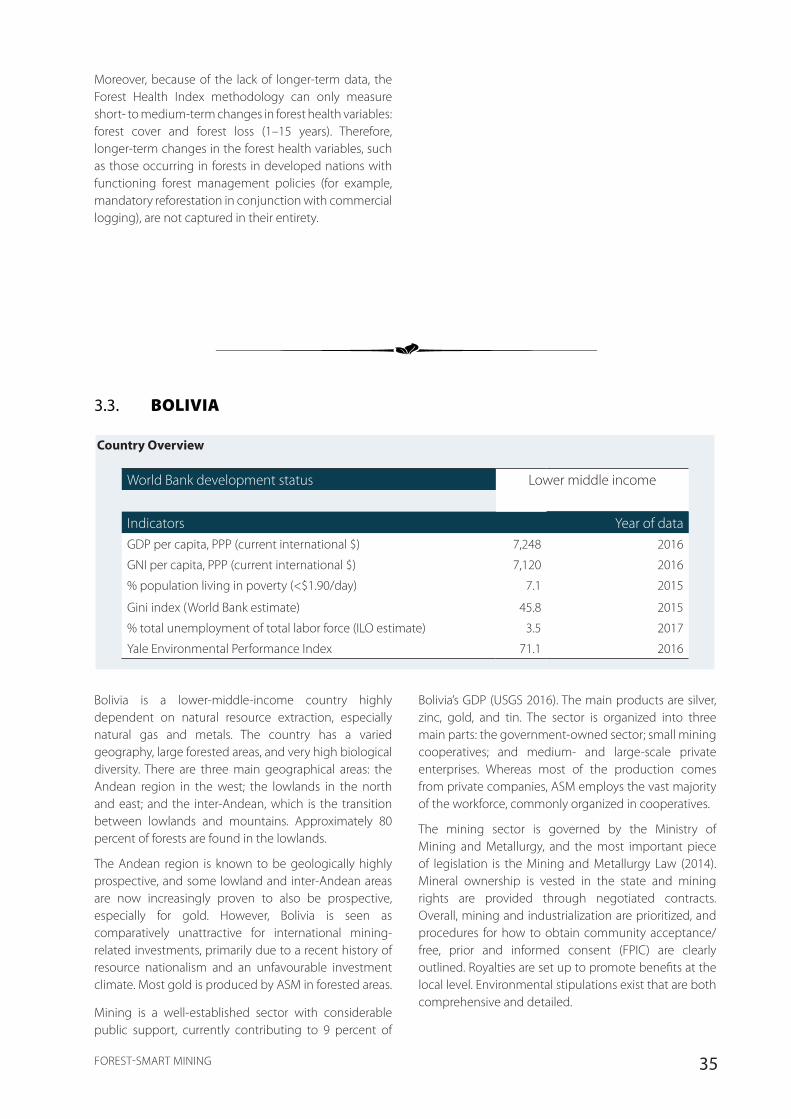
35FOREST-SMART MINING
Moreover, because of the lack of longer-term data, the Forest Health Index methodology can only measure short- to medium-term changes in forest health variables: forest cover and forest loss (1–15 years). Therefore, longer-term changes in the forest health variables, such as those occurring in forests in developed nations with functioning forest management policies (for example, mandatory reforestation in conjunction with commercial logging), are not captured in their entirety.
3.3. BOLIVIA
Country Overview
World Bank development status Lower middle income
Indicators Year of dataGDP per capita, PPP (current international $) 7,248 2016
GNI per capita, PPP (current international $) 7,120 2016
% population living in poverty (<$1.90/day) 7.1 2015
Gini index (World Bank estimate) 45.8 2015
% total unemployment of total labor force (ILO estimate) 3.5 2017
Yale Environmental Performance Index 71.1 2016
Bolivia’s GDP (USGS 2016). The main products are silver, zinc, gold, and tin. The sector is organized into three main parts: the government-owned sector; small mining cooperatives; and medium- and large-scale private enterprises. Whereas most of the production comes from private companies, ASM employs the vast majority of the workforce, commonly organized in cooperatives.
The mining sector is governed by the Ministry of Mining and Metallurgy, and the most important piece of legislation is the Mining and Metallurgy Law (2014). Mineral ownership is vested in the state and mining rights are provided through negotiated contracts. Overall, mining and industrialization are prioritized, and procedures for how to obtain community acceptance/free, prior and informed consent (FPIC) are clearly outlined. Royalties are set up to promote benefits at the local level. Environmental stipulations exist that are both comprehensive and detailed.
Bolivia is a lower-middle-income country highly dependent on natural resource extraction, especially natural gas and metals. The country has a varied geography, large forested areas, and very high biological diversity. There are three main geographical areas: the Andean region in the west; the lowlands in the north and east; and the inter-Andean, which is the transition between lowlands and mountains. Approximately 80 percent of forests are found in the lowlands.
The Andean region is known to be geologically highly prospective, and some lowland and inter-Andean areas are now increasingly proven to also be prospective, especially for gold. However, Bolivia is seen as comparatively unattractive for international mining-related investments, primarily due to a recent history of resource nationalism and an unfavourable investment climate. Most gold is produced by ASM in forested areas.
Mining is a well-established sector with considerable public support, currently contributing to 9 percent of
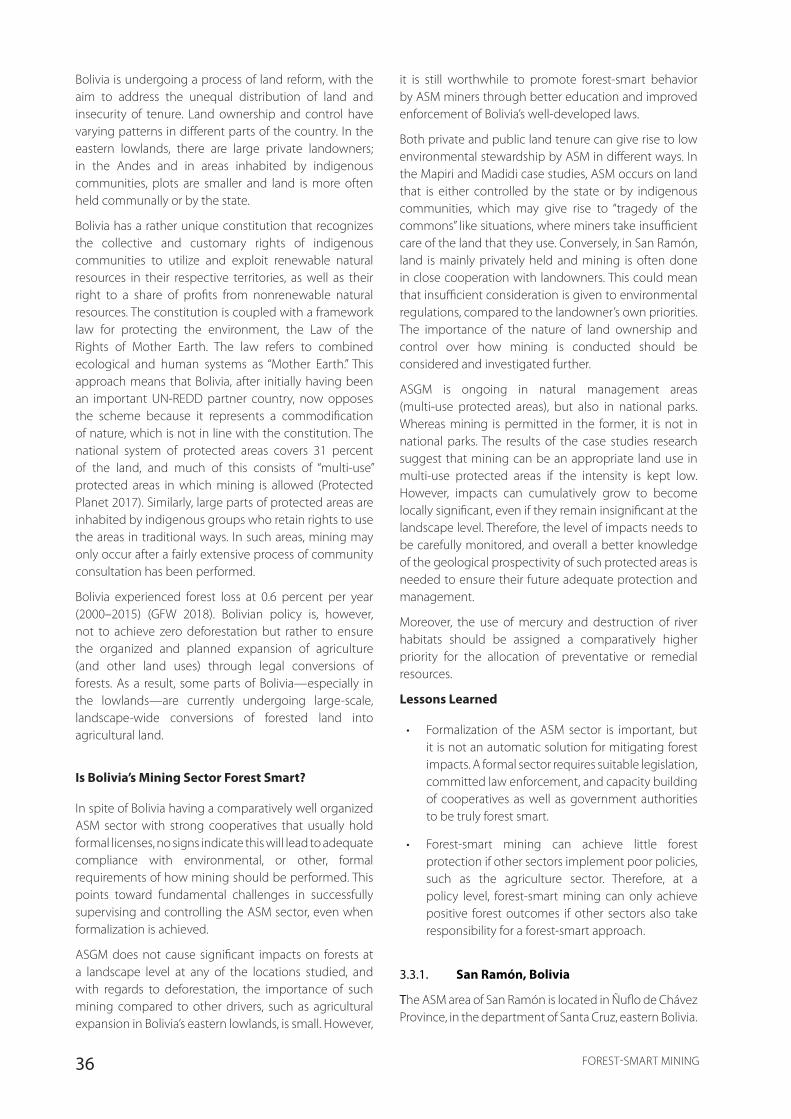
36 FOREST-SMART MINING
Bolivia is undergoing a process of land reform, with the aim to address the unequal distribution of land and insecurity of tenure. Land ownership and control have varying patterns in different parts of the country. In the eastern lowlands, there are large private landowners; in the Andes and in areas inhabited by indigenous communities, plots are smaller and land is more often held communally or by the state.
Bolivia has a rather unique constitution that recognizes the collective and customary rights of indigenous communities to utilize and exploit renewable natural resources in their respective territories, as well as their right to a share of profits from nonrenewable natural resources. The constitution is coupled with a framework law for protecting the environment, the Law of the Rights of Mother Earth. The law refers to combined ecological and human systems as “Mother Earth.” This approach means that Bolivia, after initially having been an important UN-REDD partner country, now opposes the scheme because it represents a commodification of nature, which is not in line with the constitution. The national system of protected areas covers 31 percent of the land, and much of this consists of “multi-use” protected areas in which mining is allowed (Protected Planet 2017). Similarly, large parts of protected areas are inhabited by indigenous groups who retain rights to use the areas in traditional ways. In such areas, mining may only occur after a fairly extensive process of community consultation has been performed.
Bolivia experienced forest loss at 0.6 percent per year (2000–2015) (GFW 2018). Bolivian policy is, however, not to achieve zero deforestation but rather to ensure the organized and planned expansion of agriculture (and other land uses) through legal conversions of forests. As a result, some parts of Bolivia—especially in the lowlands—are currently undergoing large-scale, landscape-wide conversions of forested land into agricultural land.
Is Bolivia’s Mining Sector Forest Smart?
In spite of Bolivia having a comparatively well organized ASM sector with strong cooperatives that usually hold formal licenses, no signs indicate this will lead to adequate compliance with environmental, or other, formal requirements of how mining should be performed. This points toward fundamental challenges in successfully supervising and controlling the ASM sector, even when formalization is achieved.
ASGM does not cause significant impacts on forests at a landscape level at any of the locations studied, and with regards to deforestation, the importance of such mining compared to other drivers, such as agricultural expansion in Bolivia’s eastern lowlands, is small. However,
it is still worthwhile to promote forest-smart behavior by ASM miners through better education and improved enforcement of Bolivia’s well-developed laws.
Both private and public land tenure can give rise to low environmental stewardship by ASM in different ways. In the Mapiri and Madidi case studies, ASM occurs on land that is either controlled by the state or by indigenous communities, which may give rise to “tragedy of the commons” like situations, where miners take insufficient care of the land that they use. Conversely, in San Ramón, land is mainly privately held and mining is often done in close cooperation with landowners. This could mean that insufficient consideration is given to environmental regulations, compared to the landowner’s own priorities. The importance of the nature of land ownership and control over how mining is conducted should be considered and investigated further.
ASGM is ongoing in natural management areas (multi-use protected areas), but also in national parks. Whereas mining is permitted in the former, it is not in national parks. The results of the case studies research suggest that mining can be an appropriate land use in multi-use protected areas if the intensity is kept low. However, impacts can cumulatively grow to become locally significant, even if they remain insignificant at the landscape level. Therefore, the level of impacts needs to be carefully monitored, and overall a better knowledge of the geological prospectivity of such protected areas is needed to ensure their future adequate protection and management.
Moreover, the use of mercury and destruction of river habitats should be assigned a comparatively higher priority for the allocation of preventative or remedial resources.
Lessons Learned
• Formalization of the ASM sector is important, but it is not an automatic solution for mitigating forest impacts. A formal sector requires suitable legislation, committed law enforcement, and capacity building of cooperatives as well as government authorities to be truly forest smart.
• Forest-smart mining can achieve little forest protection if other sectors implement poor policies, such as the agriculture sector. Therefore, at a policy level, forest-smart mining can only achieve positive forest outcomes if other sectors also take responsibility for a forest-smart approach.
3.3.1. San Ramón, Bolivia
The ASM area of San Ramón is located in Ñuflo de Chávez Province, in the department of Santa Cruz, eastern Bolivia.
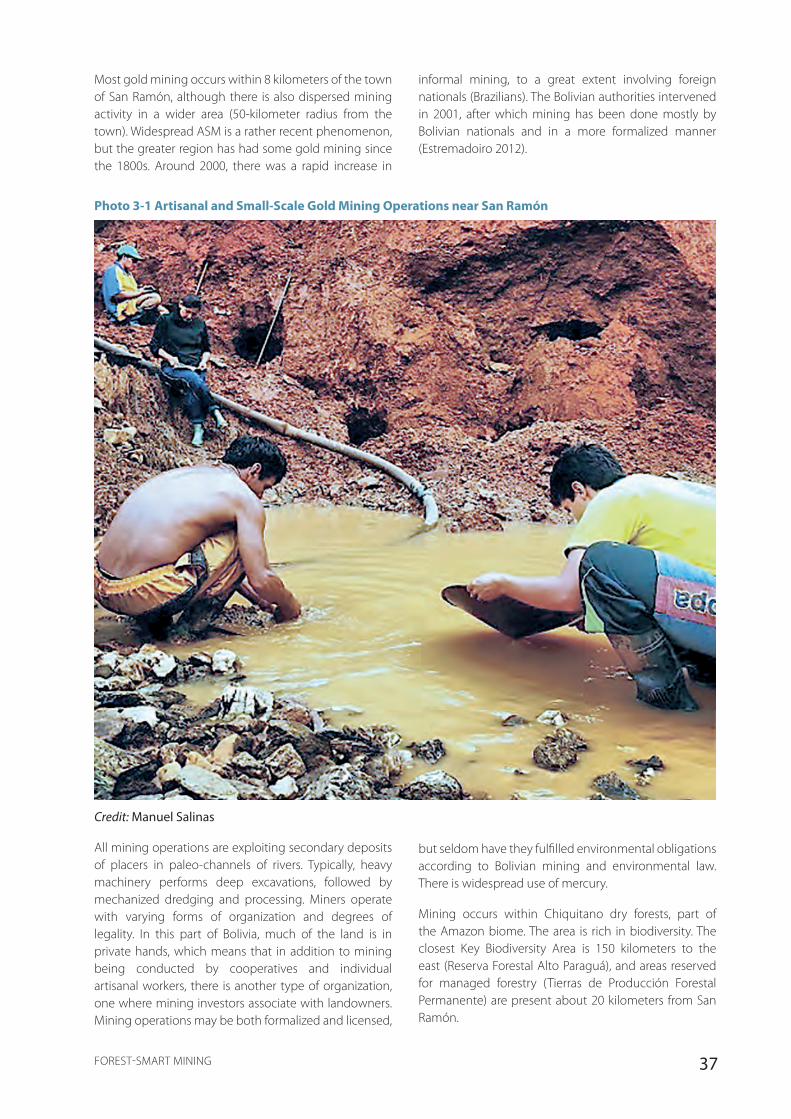
37FOREST-SMART MINING
Most gold mining occurs within 8 kilometers of the town of San Ramón, although there is also dispersed mining activity in a wider area (50-kilometer radius from the town). Widespread ASM is a rather recent phenomenon, but the greater region has had some gold mining since the 1800s. Around 2000, there was a rapid increase in
informal mining, to a great extent involving foreign nationals (Brazilians). The Bolivian authorities intervened in 2001, after which mining has been done mostly by Bolivian nationals and in a more formalized manner (Estremadoiro 2012).
Photo 3-1 Artisanal and Small-Scale Gold Mining Operations near San Ramón
Credit: Manuel Salinas
All mining operations are exploiting secondary deposits of placers in paleo-channels of rivers. Typically, heavy machinery performs deep excavations, followed by mechanized dredging and processing. Miners operate with varying forms of organization and degrees of legality. In this part of Bolivia, much of the land is in private hands, which means that in addition to mining being conducted by cooperatives and individual artisanal workers, there is another type of organization, one where mining investors associate with landowners. Mining operations may be both formalized and licensed,
but seldom have they fulfilled environmental obligations according to Bolivian mining and environmental law. There is widespread use of mercury.
Mining occurs within Chiquitano dry forests, part of the Amazon biome. The area is rich in biodiversity. The closest Key Biodiversity Area is 150 kilometers to the east (Reserva Forestal Alto Paraguá), and areas reserved for managed forestry (Tierras de Producción Forestal Permanente) are present about 20 kilometers from San Ramón.

38 FOREST-SMART MINING
Credit: Manuel Salinas
Credit: Manuel Salinas
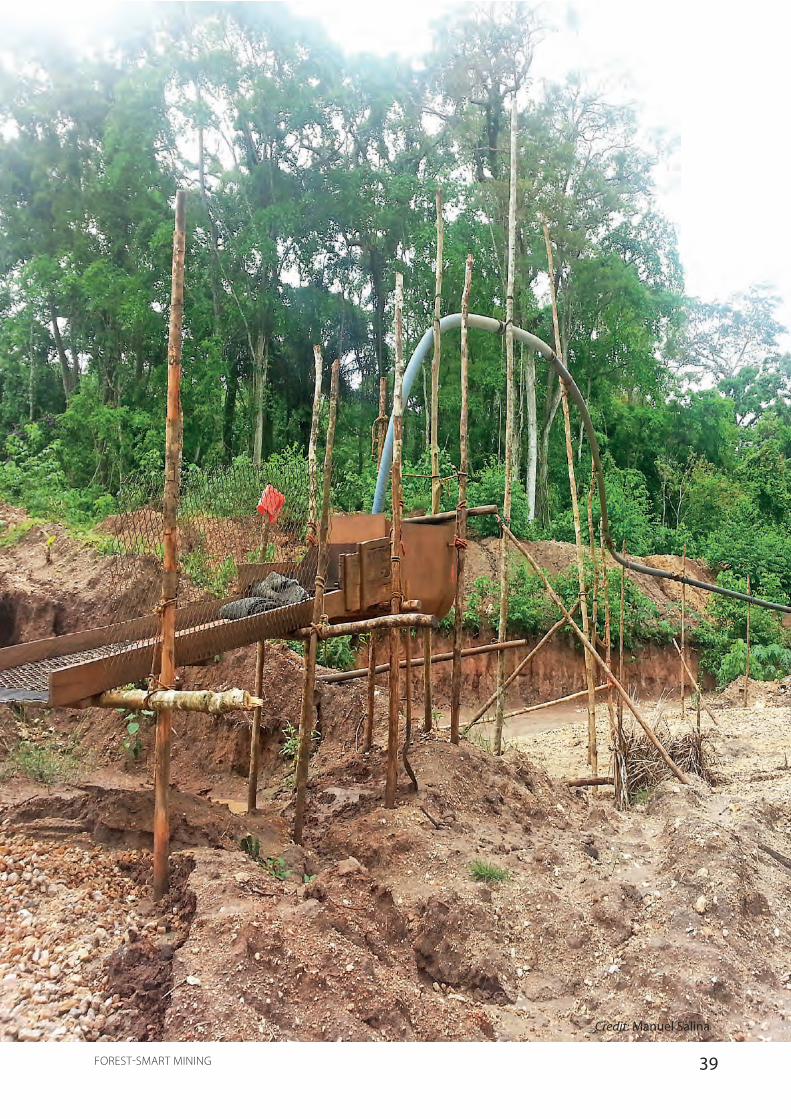
39FOREST-SMART MINING
Credit: Manuel Salina
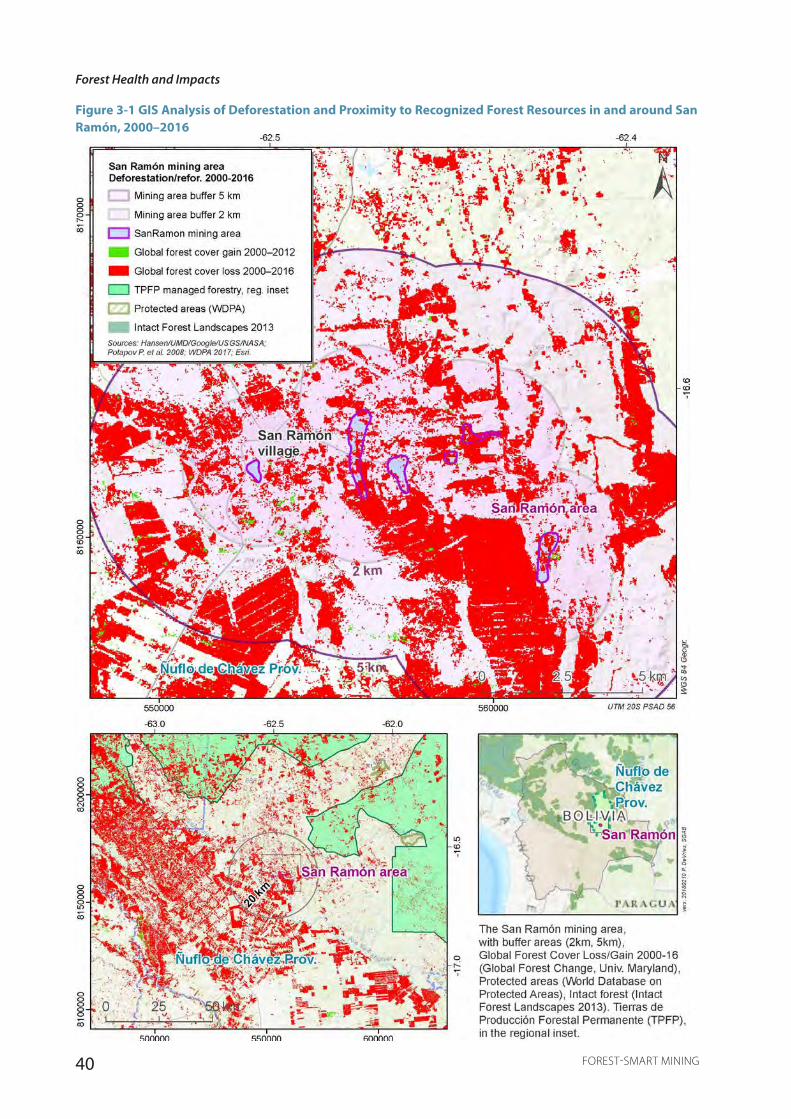
40 FOREST-SMART MINING
Forest Health and Impacts
Figure 3-1 GIS Analysis of Deforestation and Proximity to Recognized Forest Resources in and around San Ramón, 2000–2016
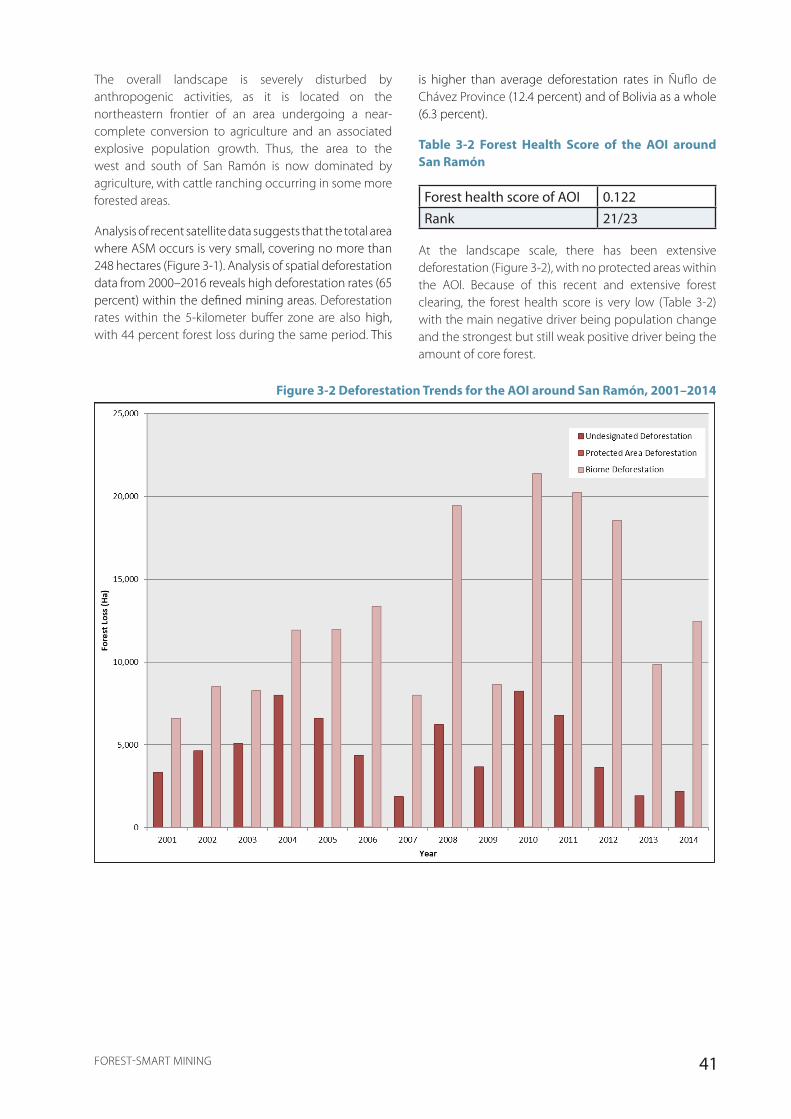
41FOREST-SMART MINING
The overall landscape is severely disturbed by anthropogenic activities, as it is located on the northeastern frontier of an area undergoing a near-complete conversion to agriculture and an associated explosive population growth. Thus, the area to the west and south of San Ramón is now dominated by agriculture, with cattle ranching occurring in some more forested areas.
Analysis of recent satellite data suggests that the total area where ASM occurs is very small, covering no more than 248 hectares (Figure 3-1). Analysis of spatial deforestation data from 2000–2016 reveals high deforestation rates (65 percent) within the defined mining areas. Deforestation rates within the 5-kilometer buffer zone are also high, with 44 percent forest loss during the same period. This
is higher than average deforestation rates in Ñuflo de Chávez Province (12.4 percent) and of Bolivia as a whole (6.3 percent).
Table 3-2 Forest Health Score of the AOI around San Ramón
Forest health score of AOI 0.122Rank 21/23
At the landscape scale, there has been extensive deforestation (Figure 3-2), with no protected areas within the AOI. Because of this recent and extensive forest clearing, the forest health score is very low (Table 3-2) with the main negative driver being population change and the strongest but still weak positive driver being the amount of core forest.
Figure 3-2 Deforestation Trends for the AOI around San Ramón, 2001–2014

42 FOREST-SMART MINING
Conclusion
The size of the overall forested area where ASM occurs in San Ramón is very small and the impacts on forests—though severe at the mining sites—are centered on the actual deposits, so mining is not particularly relevant to landscape-wide deforestation. Large-scale, landscape-wide deforestation in the San Ramón area is due to the expansion of agriculture and rapid population growth. These, in turn, are the result of a state policy to encourage agricultural expansion into forested areas.
In San Ramón, much of the land is privately held, which means that mining is often done in close cooperation with landowners who may not have a strong incentive to ensure that environmental regulations are followed. The importance of the nature of land ownership and control over how mining is conducted should be considered and investigated further.
Lessons Learned
• ASM organizations, particularly when operating through formal structures such as cooperatives, should be treated as responsible for their impacts—lack of capacity needs to be addressed through training and management support, but compliance is not unattainable if the regulations are appropriate.
• Forest tenure is an important consideration regarding who has accountability over forest protection. Private or public ownership structures can both have positive and negative outcomes, so the effects of land tenure need to be examined on a case-by-case basis.
3.3.2. Mapiri, Bolivia
The case study area is situated along tributaries of the Mapiri River, within about 10 kilometers of Mapiri town, which is located in the province of Larecaja, about 130 kilometers north of La Paz. It is a sparsely populated area, and the town has a population of 3,000. Mining occurs in tropical forests of the Amazon biome. The land is either controlled by the state or by two local indigenous communities. In the latter case, mining may only occur after a fairly extensive process of community consultation. The northern bank of the Mapiri River forms the southern border of the Apolobamba Natural Management Area, a multi-use protected area in which mining is allowed. Most of the ASM areas are designated as being available for forestry. There is also small-scale agriculture, which is a livelihood that may be combined with mining.
Gold mining in and around Mapiri started in 1985, but considerable expansion has occurred in the past decade. Activities are concentrated along rivers; miners target fluvial deposits as well as deposits on riverbanks and slopes. The mining technology ranges from the use of heavy excavation and dredging equipment (formal small-scale mining) to panning (artisanal, largely informal). In some areas, deposits have been found at depths of some meters, which miners exploit by digging shafts and lifting loads to the surface for processing. Legal and formalized mining cooperatives dominate, with an unknown number of informal artisanal miners also being active. The cooperatives arrange for participation of informal miners who reprocess the cooperatives’ tailings (barranquilleros). Few if any of the operators fulfill environmental obligations according to Bolivian mining and environmental law. There is widespread use of mercury.
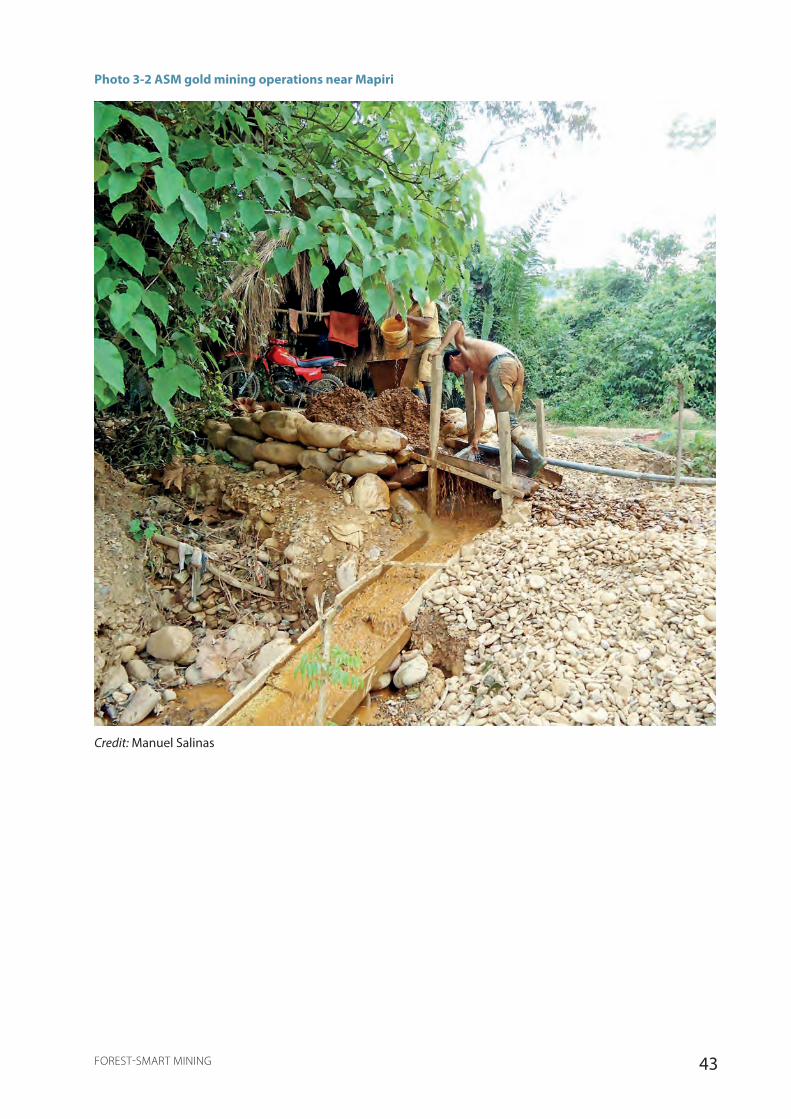
43FOREST-SMART MINING
Photo 3-2 ASM gold mining operations near Mapiri
Credit: Manuel Salinas

44 FOREST-SMART MINING
Credit: Manuel Salinas
Credit: Manuel Salinas
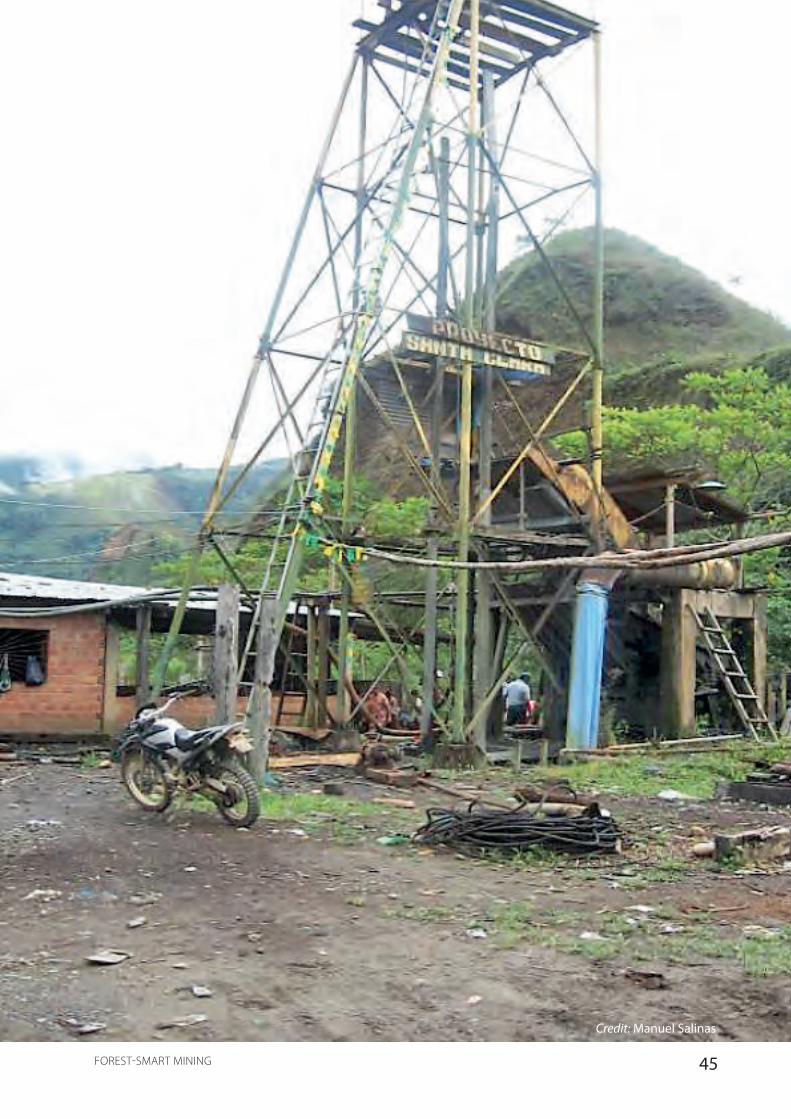
45FOREST-SMART MINING
Credit: Manuel Salinas
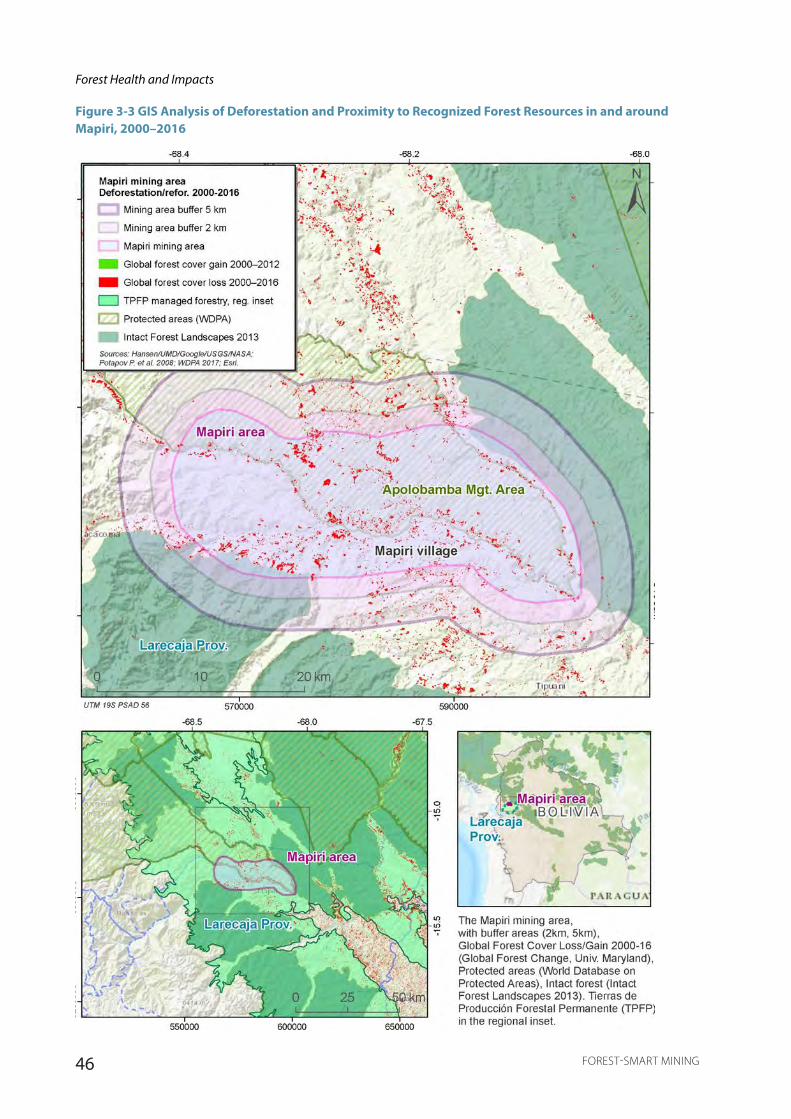
46 FOREST-SMART MINING
Forest Health and Impacts
Figure 3-3 GIS Analysis of Deforestation and Proximity to Recognized Forest Resources in and around Mapiri, 2000–2016

47FOREST-SMART MINING
Analysis of recent satellite imagery suggests that the area where ASM occurs is extensive, covering 49,423 hectares (Figure 3-3). Analysis of spatial deforestation data from 2000–2016 reveals low deforestation rates within the defined mining area (3.8 percent) occurring in an irregular pattern, although mostly concentrated in river valleys. Deforestation rates within the 5-kilometer buffer zone are low, with 2.1 percent forest loss during the same period. This may be compared with an average deforestation rate in the Larecaja Province of 2.8 percent, and in Bolivia as a whole of 6.3 percent.
The data points to significant deforestation in the mining area, including in the parts that are situated in the natural management area. Inspection of the road network and the extent of associated clearing in available satellite images suggest road construction to be a significant
cause of deforestation. The demographic growth of the Mapiri area and this associated expansion of the road network will most probably include a considerable component of mining-driven growth.
At the landscape level, there has been some significant deforestation (Figure 3-4), with population change being the main negative driver of forest health within the AOI. However, the forest health score is still overall high, owing to strong positive drivers of forest health, the main one being the extent of intact forests.
Table 3-3 Forest Health Score of the AOI around Mapiri
Forest health score of AOI 0.676Rank 3/23
Figure 3-4 Deforestation Trends for the AOI around Mapiri, 2001–2014
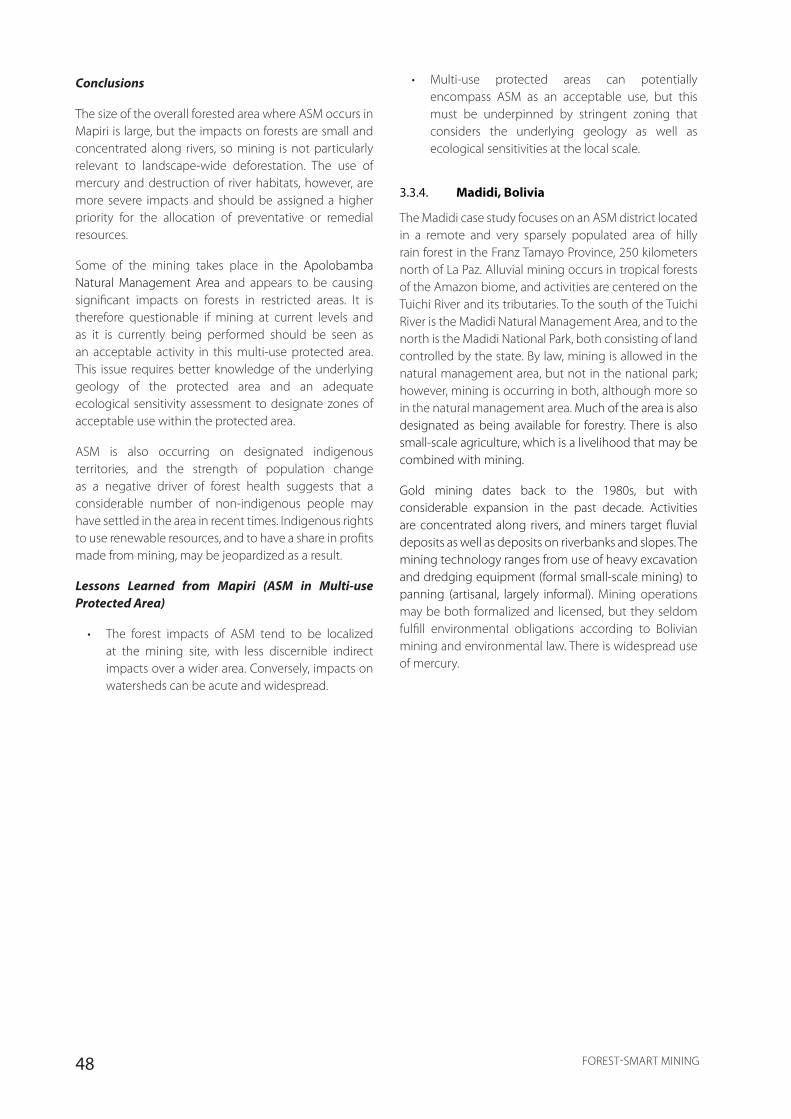
48 FOREST-SMART MINING
Conclusions
The size of the overall forested area where ASM occurs in Mapiri is large, but the impacts on forests are small and concentrated along rivers, so mining is not particularly relevant to landscape-wide deforestation. The use of mercury and destruction of river habitats, however, are more severe impacts and should be assigned a higher priority for the allocation of preventative or remedial resources.
Some of the mining takes place in the Apolobamba Natural Management Area and appears to be causing significant impacts on forests in restricted areas. It is therefore questionable if mining at current levels and as it is currently being performed should be seen as an acceptable activity in this multi-use protected area. This issue requires better knowledge of the underlying geology of the protected area and an adequate ecological sensitivity assessment to designate zones of acceptable use within the protected area.
ASM is also occurring on designated indigenous territories, and the strength of population change as a negative driver of forest health suggests that a considerable number of non-indigenous people may have settled in the area in recent times. Indigenous rights to use renewable resources, and to have a share in profits made from mining, may be jeopardized as a result.
Lessons Learned from Mapiri (ASM in Multi-use Protected Area)
• The forest impacts of ASM tend to be localized at the mining site, with less discernible indirect impacts over a wider area. Conversely, impacts on watersheds can be acute and widespread.
• Multi-use protected areas can potentially encompass ASM as an acceptable use, but this must be underpinned by stringent zoning that considers the underlying geology as well as ecological sensitivities at the local scale.
3.3.4. Madidi, Bolivia
The Madidi case study focuses on an ASM district located in a remote and very sparsely populated area of hilly rain forest in the Franz Tamayo Province, 250 kilometers north of La Paz. Alluvial mining occurs in tropical forests of the Amazon biome, and activities are centered on the Tuichi River and its tributaries. To the south of the Tuichi River is the Madidi Natural Management Area, and to the north is the Madidi National Park, both consisting of land controlled by the state. By law, mining is allowed in the natural management area, but not in the national park; however, mining is occurring in both, although more so in the natural management area. Much of the area is also designated as being available for forestry. There is also small-scale agriculture, which is a livelihood that may be combined with mining.
Gold mining dates back to the 1980s, but with considerable expansion in the past decade. Activities are concentrated along rivers, and miners target fluvial deposits as well as deposits on riverbanks and slopes. The mining technology ranges from use of heavy excavation and dredging equipment (formal small-scale mining) to panning (artisanal, largely informal). Mining operations may be both formalized and licensed, but they seldom fulfill environmental obligations according to Bolivian mining and environmental law. There is widespread use of mercury.

49FOREST-SMART MINING
Photo 3-3 ASM gold mining near Madidi
Credit: Rio Tuichi, A. Aguirre
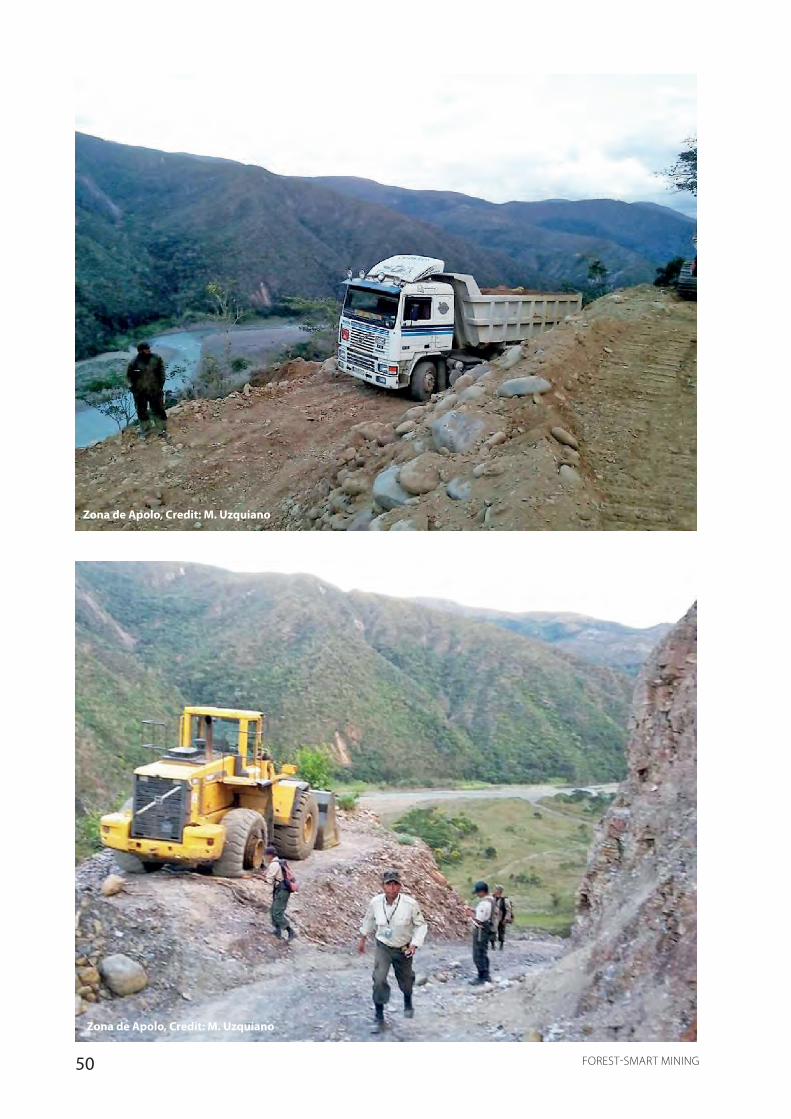
50 FOREST-SMART MINING
Zona de Apolo, Credit: M. Uzquiano
Zona de Apolo, Credit: M. Uzquiano

51FOREST-SMART MINING
Credit: Manuel Salinas
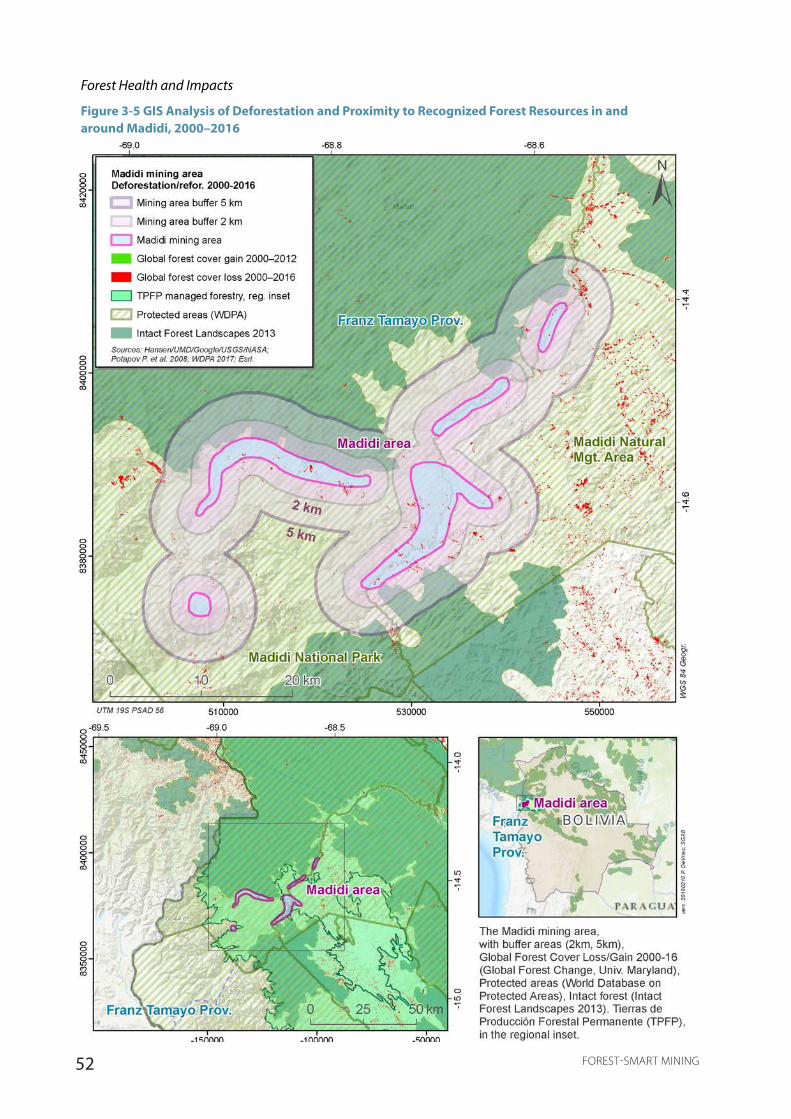
52 FOREST-SMART MINING
Forest Health and Impacts
Figure 3-5 GIS Analysis of Deforestation and Proximity to Recognized Forest Resources in and around Madidi, 2000–2016
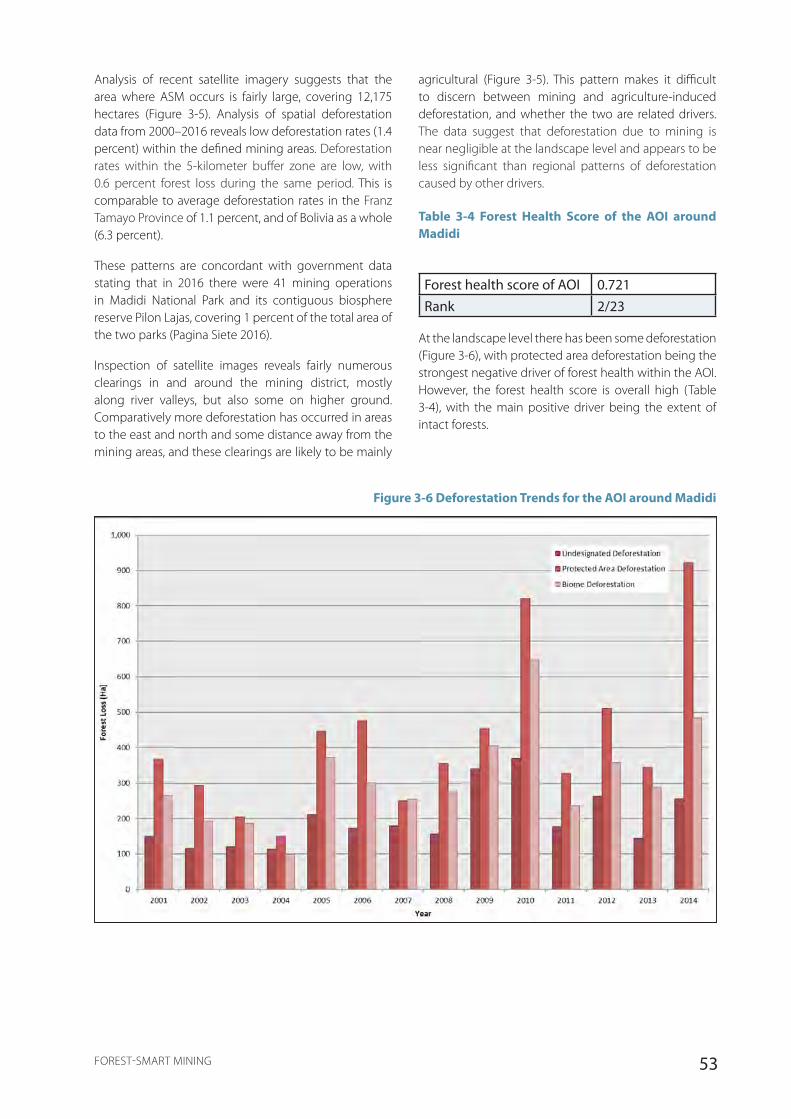
53FOREST-SMART MINING
Analysis of recent satellite imagery suggests that the area where ASM occurs is fairly large, covering 12,175 hectares (Figure 3-5). Analysis of spatial deforestation data from 2000–2016 reveals low deforestation rates (1.4 percent) within the defined mining areas. Deforestation rates within the 5-kilometer buffer zone are low, with 0.6 percent forest loss during the same period. This is comparable to average deforestation rates in the Franz Tamayo Province of 1.1 percent, and of Bolivia as a whole (6.3 percent).
These patterns are concordant with government data stating that in 2016 there were 41 mining operations in Madidi National Park and its contiguous biosphere reserve Pilon Lajas, covering 1 percent of the total area of the two parks (Pagina Siete 2016).
Inspection of satellite images reveals fairly numerous clearings in and around the mining district, mostly along river valleys, but also some on higher ground. Comparatively more deforestation has occurred in areas to the east and north and some distance away from the mining areas, and these clearings are likely to be mainly
agricultural (Figure 3-5). This pattern makes it difficult to discern between mining and agriculture-induced deforestation, and whether the two are related drivers. The data suggest that deforestation due to mining is near negligible at the landscape level and appears to be less significant than regional patterns of deforestation caused by other drivers.
Table 3-4 Forest Health Score of the AOI around Madidi
Forest health score of AOI 0.721Rank 2/23
At the landscape level there has been some deforestation (Figure 3-6), with protected area deforestation being the strongest negative driver of forest health within the AOI. However, the forest health score is overall high (Table 3-4), with the main positive driver being the extent of intact forests.
Figure 3-6 Deforestation Trends for the AOI around Madidi

54 FOREST-SMART MINING
Conclusions
The size of the overall forested area where ASM is occurring in Madidi is considerable, but because the impacts on forests are small and centered on the direct areas where mining is happening, the mining is not particularly relevant to landscape-wide deforestation. The use of mercury and destruction of river habitats, however, are more severe impacts and should be assigned a higher priority for the allocation of preventative or remedial resources.
Mining is ongoing in both a natural management area and a national park. Whereas mining in the latter is not allowed, and therefore should be made to cease, mining in the natural management area is causing fairly insignificant impacts on forests. This suggests that ASGM at the current levels may be an acceptable use allowed within the Madidi Natural Management Area; however, the level of impacts needs to be carefully monitored. Improved knowledge of the geological potential of the two protected areas should underpin and be included in the measures needed to ensure their future adequate protection and management.
As mining is conducted on land controlled by the state, this may contribute to a “tragedy of the commons” situation where miners take insufficient care of the land that they use. The importance of the nature of land ownership and control over how mining is conducted needs to be investigated further.
Lessons Learned from Madidi (ASM in Multi-use Protected Area)
• The forest impacts of ASM tend to be localized at the mining site, with less discernible indirect impacts over a wider area. Conversely, impacts on watersheds can be acute and widespread.
• Multi-use protected areas can potentially encompass ASM as an acceptable use, but this must be underpinned by stringent zoning which considers the underlying geology as well as ecological sensitivities at the local scale.
3.4. COLOMBIA
Country Overview
World Bank development status Upper middle income
Indicators Year of dataGDP per capita, PPP (current international $) 14,181 2016
GNI per capita, PPP (current international $) 13,920 2016
% population living in poverty (<$1.90/day) 5.5 2015
Gini index (World Bank estimate) 51.1 2015
% total unemployment of total labor force (ILO estimate) 9.1 2017
Yale Environmental Performance Index 75.9 2016
Colombia is an upper-middle-income country with a diversified economy. Its exceptional biodiversity puts it among one of the 17 “megadiverse countries.” Its territory is divided into six distinct biogeographic regions, from west to east: Insular, Pacific, Caribbean, Andean,
Orinoquía, and Amazon.
Colombia holds a variety of mineral resources within its five major geological provinces, the main ones being gold, silver, platinum, and emeralds. It is also
55FOREST-SMART MINING
a significant producer of coal and oil. Mining and quarrying contributed to 7 percent of the GDP in 2016; however, Colombia is highly affected by illegal mining and therefore this represents an underestimation of the overall mineral production. In 2011, only 35 percent of mining units paid royalties and 63 percent did not hold a mining license (Ministerio de Minas y Energia – Colombia 2012). The artisanal and small-scale sector dominates, with 72 percent of formal and informal mining operations having up to five workers and 26.4 percent of the mining workforce being employed in ASM (Ministerio de Minas y Energia – Colombia 2012).
Colombia has attempted to formalize the sector with limited success in past decades. One barrier has been that the Mining Code did not differentiate between different scales of mining, posing high entry bars for ASM. The 2013 National Formalization Policy recognized these barriers and Decree 1666 (2016) defined the categories of subsistence and small-, medium-, and large-scale mining based on the size of concession (for licenses in the exploration phase) and on the volumes of production (for licenses in the exploitation phase) (Republica de Colombia 2016).
Colombia has over 58,000 hectares of forests covering over 50 percent of its land mass (FAO 2015c), mostly concentrated in the Pacific (Chocó) and Amazon regions. Its national system of protected areas covers 14 percent of its terrestrial area (Protected Planet 2017). In 2017, Colombia launched the new Peace Parks initiative, which will prioritize the protection of areas affected by its history of conflict. Overall, the management effectiveness of protected areas ranged between 60 and 80 percent in an evaluation done in 2007 (Pardo and Valenzuela 2007). Colombian law allows for the subtraction of portions out of a forest reserve for mining purposes if it can be justified for public benefit, provided an environmental management plan is produced and approved.
The Ministry of Environment and Sustainable Development governs the forests, according to the Forest Policy of 1996. Colombia has a high proportion of its public forests under community management (over 50 percent in 2010) (FAO 2015c), and a third of the country is held in indigenous reserves (IWGIA 2018). The law recognizes the rights of indigenous peoples to administer their own territories.
Colombia experienced a mean forest loss rate of 0.4 percent between 1990 and 2015; however, deforestation rates increased by 44 percent from 2015 to 2016, predominantly in the Amazon region. According to the government, the main drivers of this deforestation have been land grabs (45 percent), illicit drug plantations (22 percent), infrastructure (10 percent), forest fires (8
percent), cattle ranching (8 percent), and mining (7 percent) (MinAmbiente and IDEAM 2017).
Colombia’s armed conflict has dominated politics for decades, with implications on both the environment and mining. Armed groups have profited from illegal gold mining, and the withdrawal of the Revolutionary Armed Forces of Colombia (FARC) following the peace deal has opened up space for rival groups to compete for control over gold resources even though the government has responded by deploying 80,000 soldiers and police to the vacated FARC territories (International Crisis Group 2017). Illegal mining causes severe deforestation and pollution, but there are also concerns that the unavoidable rural development that will follow after the peace deal should be done in a sustainable way, particularly in the forested but underdeveloped regions of Chocó and the Amazon.
Is Colombia’s Mining Sector Forest Smart?
Colombia has sophisticated laws and policies governing mining, forests, and the sustainable development of its mining and forestry sectors. However, the application of laws and policies has been constrained by factors such as lack of clarity over permissible activities within each forest designation, inadequate government presence in the remote but mineral- and forest-rich departments, and lack of clarity over the mandates of different mining entities.
In principle, the provision for area subtractions from forest reserves under strict environmental control can be a way for forest communities to profit from ASM sustainably. The requirements for mining subtractions are stringent and include environmental management plans, restoration plans, and resource use plans. In practice, however, this has meant few subtractions have been requested and even fewer have been approved.
Informality and illegality continue to plague the Colombian mining sector. It is important to differentiate between the two: informality refers to ASM entities that have been unable to formalize, largely because of unfriendly legislation and poor implementation of formalization policies. Illegal mining in the Colombian context is of much higher concern regarding forest impacts, as it refers to medium-scale mechanized mining that is often a source of finance for armed groups and a cause of displacement of people, contamination of rivers, and deforestation. Efforts toward halting mining-induced deforestation in Colombia should focus on this proportion of the mining sector.
The informal ASM sector in Colombia does not receive adequate capacity building, partly because of the lack of government representation throughout the country.
56 FOREST-SMART MINING
There is a role for civil society and NGOs to step in and support ASM in technical training, environmental education, and monitoring, provided that the government intentionally directs these actions.
Lessons Learned
• Good laws and policies need to strike a balance between comprehensiveness and simplicity and must be accompanied by adequate government presence in remote or marginalized areas to help the ASM sector comply with environmental requirements.
• The rise of semi-mechanized mining calls for a shift of focus from artisanal miners to small- and medium-scale mining. Severe negative forest impacts occur particularly because of ASM’s mechanization combined with its typical illegality and criminality.
3.4.1. COCOMACIA Community Council, Chocó, Colombia
The department of Chocó lies in the Tumbes-Chocó-Magdalena biodiversity hotspot and consists of a diverse array of ecosystems. A large part of the department lies within a forest reserve, and other protected areas present include national parks, World Heritage sites, and special management areas.
Chocó has the highest poverty indexes in Colombia (39.1 percent living in extreme poverty compared to a national average of 8.1 percent), and 75.68 percent of the population is Afro-Colombian, Amerindian, or indigenous (Gobernación de Chocó 2017). The area has been historically marginalized and impacted by armed conflict owing to its strategic importance for the illicit production and commercialization of drugs and minerals that have financed decades of conflict (Serra-Horhuelin and Schoeller-Díaz 2014) and displacements of people by armed groups with mining interests still occur today (Unidad Nacional de Protección del MinInterior, pers. comm., 2017).
Civil society has a strong role in regional government. Via Law 70 (1993), Afro-Colombian and indigenous populations are given priority in rights to their traditional territories (Congreso de Colombia 1993). As such, Afro-Colombian Community Councils (Consejos comunitarios) get priority when requesting a special mining zone within their territory for use by their communities, and this includes priority over forest protection. Currently, 10 Community Councils own mining concessions in Chocó (Defensoría del Pueblo Colombia 2010).
Chocó contains significant deposits of gold, platinum and copper, but 99 percent of mining occurs informally with no license (Ministerio de Minas y Energia – Colombia 2012). Artisanal mining, which has been a traditional livelihood for centuries, has in recent decades given way to illegal mechanized small-scale mining, often done by migrants who do not obtain environmental permits but pay informal fees to landowners for access to the deposits (Navarrete 2017). Given these challenges, there is a stronger role to be played by regional government in protecting community land rights and in ensuring that such rights are not subject to extortion or corruption.
An example of this occurs in the municipality of Medio Atrato, an area of Andean forest under the jurisdiction of the Community Council COCOMACIA, where mining with heavy machinery has largely replaced traditional artisanal mining. Under Law 70, COCOMACIA has obtained legal mining rights despite it being within a forest reserve—however, these rights only allow traditional artisanal mining, not mining with machinery as is currently being done.
Attempts to mitigate the environmental impacts of mining in Chocó have been limited but include efforts such as payments for ecosystem services through the BanCO2 program and mining roundtables to increase dialogue among stakeholders.

57FOREST-SMART MINING
Forest Health and Impacts
Figure 3-7 GIS Analysis of Deforestation and Proximity to Recognized Forest Resources in and around Bebaramá, 2000–2016

58 FOREST-SMART MINING
Analysis of recent satellite imagery has identified a representative mining area of 2,638 hectares (Figure 3-7). This represents one of many areas where mining of similar nature occurs, so the regional mining footprint of mining in the region is larger. Analysis of spatial deforestation data from 2000–2016 reveals low deforestation rates (1.4 percent) within the defined mining area. The deforestation rate within the 5-kilometer buffer zone is low, with 0.3 percent forest loss during the same period. This is lower than the average deforestation rate for the department of Chocó (1.6 percent) for the same time period, and also lower than the average deforestation rate for Colombia as a whole (4.0 percent).
Table 3-5 Forest Health Score of the AOI around Bebaramá
Forest health score of AOI 0.483Rank 8/23
At a landscape level, there has been some deforestation (Figure 3-8) and the forest health in the AOI around Bebaramá scores relatively high (Table 3-5). The strongest positive driver of forest health is the high amount of core forest found in Chocó, whereas the strongest negative driver is population change.
Figure 3-8 Deforestation Trends for the AOI around Bebaramá, 2001–2014
59FOREST-SMART MINING
Even though Chocó contains large extents of core forest owing to its extensive habitat of dense vegetation, community authorities in Medio Atrato note that illegal mining has increased deforestation and loss of biodiversity, caused contamination to rivers, and created roads and infrastructure that have opened up previously remote areas (Defensoría del Pueblo Colombia 2010). Agriculture, fishing, and the use of forest resources are the top three livelihoods in the municipality (Municipio del Medio Atrato 2016); therefore, impacts on forests have a particularly high implication for societies reliant on such ecosystem services. The biggest challenge community authorities face in addressing the problem of illegal mining is the difficulty of access to the areas (Corporación Autónoma Ambiental, Agencia Nacional de Minería, Unidad Nacional de Protección MinInterior, pers. comm., 2017).
Conclusions
The long-standing marginalization of minorities in Colombia (Chocó, in particular) and the resulting high levels of poverty have prompted the granting of a series of indigenous and Afro-Colombian rights as a means to repair historic wrongdoings. One of the measures implemented is the creation of Community Councils, which get priority in land claims within their traditional territories, including the right to designate mining zones within such regions.
While granting indigenous rights is a positive policy, the implication is that mining rights can take priority over forest protection. This is problematic, especially set in the context of a biodiversity hotspot. The regulation of the Community Councils’ rights must be strengthened and the environmental requirements clarified, in a way that guarantees their autonomy but allows for a stronger role of the regional government in overseeing the mining sector.
The autonomy of Community Councils can make their land rights susceptible to extortion by illegal mining operators, of particular concern because of their heavy machinery, if the government does not provide sufficient presence and backing. Often these operations are tied to armed groups and the illicit drugs trade. Government authorities do not have a strong enough presence in Chocó, enabling illegal operators to proliferate. It also means that Community Councils that show interest in responsible mining practices are not receiving the necessary support that they require to implement best practice, respond to the threat of illegal mining, and address the needs of impoverished communities.
Lessons Learned
• While indigenous rights are rightly regarded as a tool for forest protection, they can be misused with negative outcomes on forests if not properly designed and monitored.
• Marginalized regions where ASM takes place require renewed attention from central government in order to capitalize on actors and initiatives that show interest in responsible mining, even if these are relatively isolated cases.
3.4.2. La Cascada Mine, Caldas, Colombia
The department of Caldas contains mineral deposits of strategic importance and has a widespread ASM sector, albeit with a high degree of informality (Corpocaldas 2016). The department also has an economically important agriculture sector, being the second-largest coffee-producing area of Colombia. Caldas contains over 15 types of protected areas, including national parks, national and regional forest reserves, and special management areas. Its largest, the Reserva Forestal Central, which traverses eight other departments, is divided into three zones, each restricting activities to a various degree, but national regulations allow for the subtraction of an area from its protected status for low-impact and regulated projects.
In a review of its mining licenses, the government of Caldas found that more than 100 licenses overlapped with areas of ecological importance (Corpocaldas 2016). As a result, the department was rezoned into zones of mining, restricted mining, and no mining. However, most ASM miners in Caldas operate informally and have impacted watersheds and forests (Corpocaldas 2016). The regional government is committed to addressing this high level of informality by designating legal ASM areas near mining communities where miners commit to certain low-impact mining methods, and by implementing training programs that have benefited up to 1,400 miners to date (Unidad de Desarrollo Minero de la Gobernación de Caldas, Corpocaldas, pers. comm., 2017).
La Cascada is a Fairmined-certified ASM mine located in the Caldas department, near the city of Manizales. A formalized cooperative holds a concession of 220 hectares where hard-rock gold mining is done with on-site processing using gravimetric methods and cyanidation. The concession sits in tropical montane forest and parts of the concession overlap with the forest reserve of Rio Blanco and with páramo habitat, but none of the operations occur in those areas of overlap (Operational manager of La Cascada mine, pers. comm., 2017).
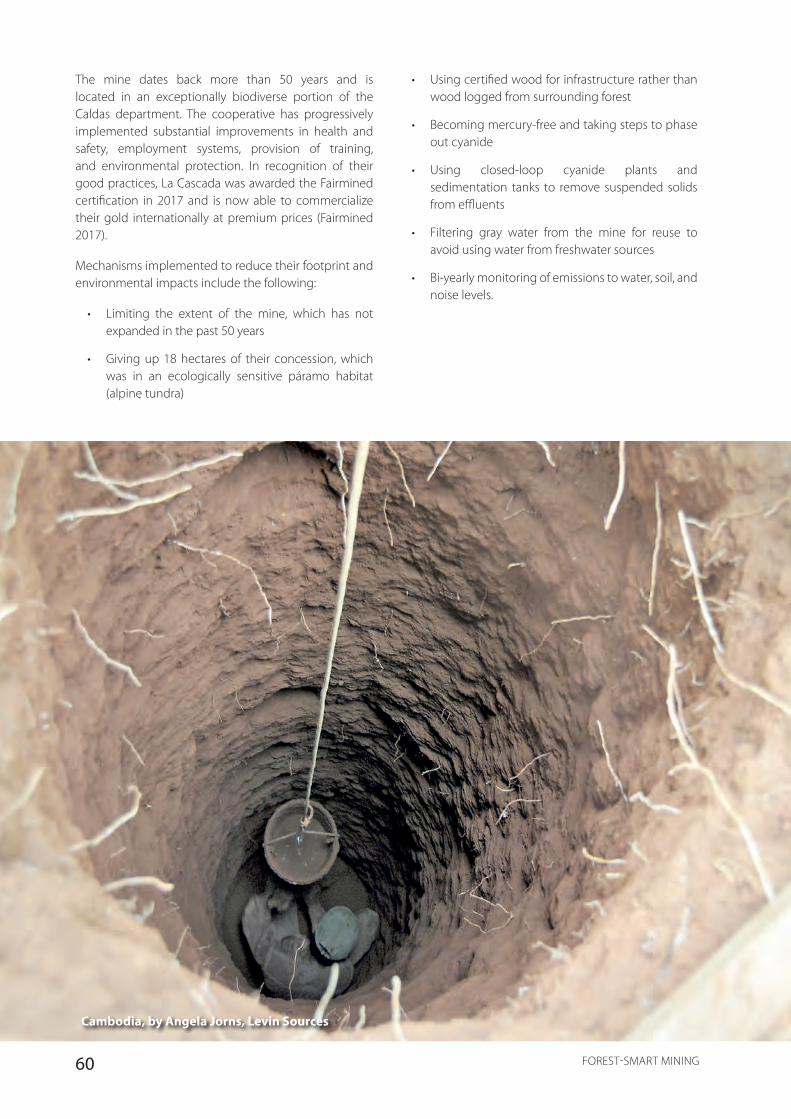
60 FOREST-SMART MINING
Cambodia, by Angela Jorns, Levin Sources
The mine dates back more than 50 years and is located in an exceptionally biodiverse portion of the Caldas department. The cooperative has progressively implemented substantial improvements in health and safety, employment systems, provision of training, and environmental protection. In recognition of their good practices, La Cascada was awarded the Fairmined certification in 2017 and is now able to commercialize their gold internationally at premium prices (Fairmined 2017).
Mechanisms implemented to reduce their footprint and environmental impacts include the following:
• Limiting the extent of the mine, which has not expanded in the past 50 years
• Giving up 18 hectares of their concession, which was in an ecologically sensitive páramo habitat (alpine tundra)
• Using certified wood for infrastructure rather than wood logged from surrounding forest
• Becoming mercury-free and taking steps to phase out cyanide
• Using closed-loop cyanide plants and sedimentation tanks to remove suspended solids from effluents
• Filtering gray water from the mine for reuse to avoid using water from freshwater sources
• Bi-yearly monitoring of emissions to water, soil, and noise levels.

61FOREST-SMART MINING
Forest Health and Impacts
Figure 3-9 GIS Analysis of Deforestation and Proximity to Recognized Forest Resources in and around La Cascada, 2000–2016
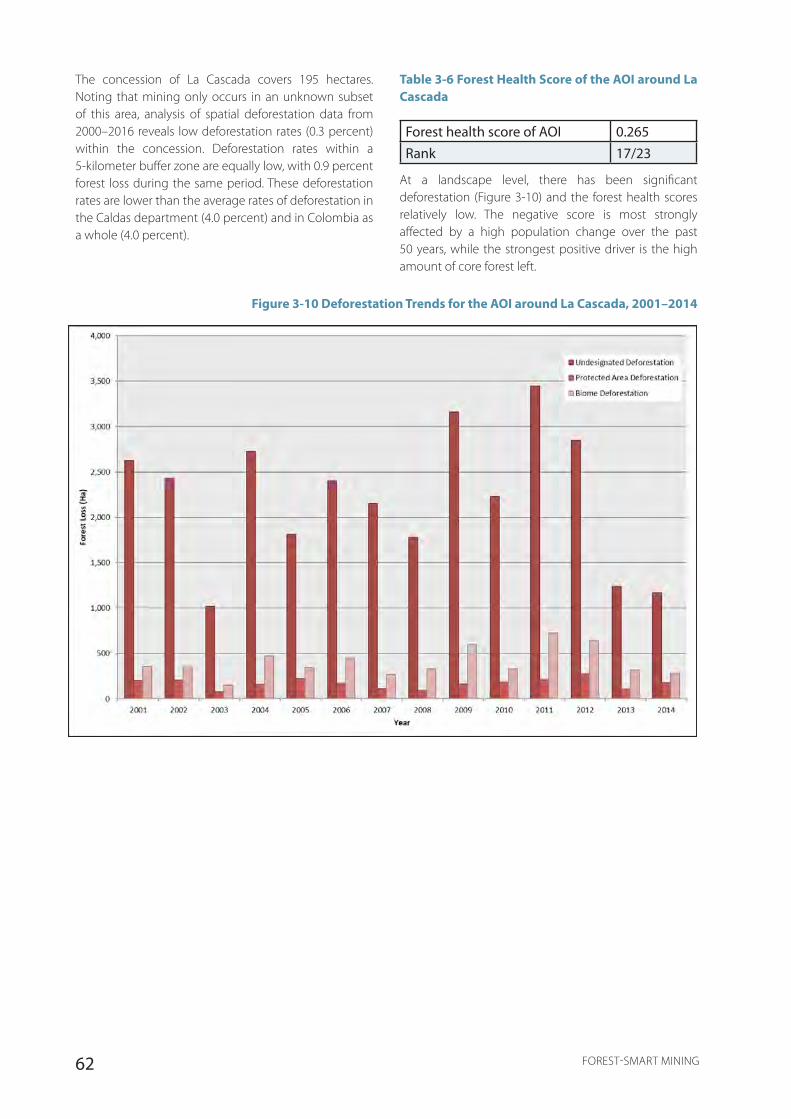
62 FOREST-SMART MINING
The concession of La Cascada covers 195 hectares. Noting that mining only occurs in an unknown subset of this area, analysis of spatial deforestation data from 2000–2016 reveals low deforestation rates (0.3 percent) within the concession. Deforestation rates within a 5-kilometer buffer zone are equally low, with 0.9 percent forest loss during the same period. These deforestation rates are lower than the average rates of deforestation in the Caldas department (4.0 percent) and in Colombia as a whole (4.0 percent).
Table 3-6 Forest Health Score of the AOI around La Cascada
Forest health score of AOI 0.265Rank 17/23
At a landscape level, there has been significant deforestation (Figure 3-10) and the forest health scores relatively low. The negative score is most strongly affected by a high population change over the past 50 years, while the strongest positive driver is the high amount of core forest left.
Figure 3-10 Deforestation Trends for the AOI around La Cascada, 2001–2014
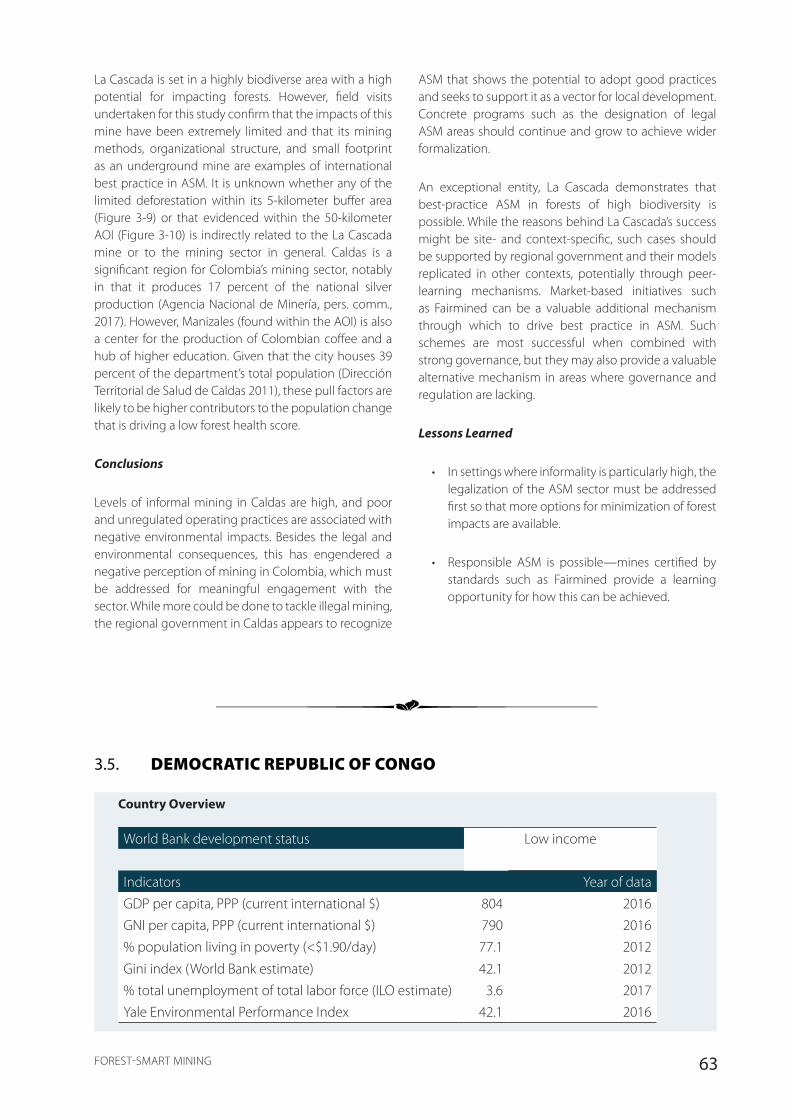
63FOREST-SMART MINING
La Cascada is set in a highly biodiverse area with a high potential for impacting forests. However, field visits undertaken for this study confirm that the impacts of this mine have been extremely limited and that its mining methods, organizational structure, and small footprint as an underground mine are examples of international best practice in ASM. It is unknown whether any of the limited deforestation within its 5-kilometer buffer area (Figure 3-9) or that evidenced within the 50-kilometer AOI (Figure 3-10) is indirectly related to the La Cascada mine or to the mining sector in general. Caldas is a significant region for Colombia’s mining sector, notably in that it produces 17 percent of the national silver production (Agencia Nacional de Minería, pers. comm., 2017). However, Manizales (found within the AOI) is also a center for the production of Colombian coffee and a hub of higher education. Given that the city houses 39 percent of the department’s total population (Dirección Territorial de Salud de Caldas 2011), these pull factors are likely to be higher contributors to the population change that is driving a low forest health score.
Conclusions
Levels of informal mining in Caldas are high, and poor and unregulated operating practices are associated with negative environmental impacts. Besides the legal and environmental consequences, this has engendered a negative perception of mining in Colombia, which must be addressed for meaningful engagement with the sector. While more could be done to tackle illegal mining, the regional government in Caldas appears to recognize
ASM that shows the potential to adopt good practices and seeks to support it as a vector for local development. Concrete programs such as the designation of legal ASM areas should continue and grow to achieve wider formalization.
An exceptional entity, La Cascada demonstrates that best-practice ASM in forests of high biodiversity is possible. While the reasons behind La Cascada’s success might be site- and context-specific, such cases should be supported by regional government and their models replicated in other contexts, potentially through peer-learning mechanisms. Market-based initiatives such as Fairmined can be a valuable additional mechanism through which to drive best practice in ASM. Such schemes are most successful when combined with strong governance, but they may also provide a valuable alternative mechanism in areas where governance and regulation are lacking.
Lessons Learned
• In settings where informality is particularly high, the legalization of the ASM sector must be addressed first so that more options for minimization of forest impacts are available.
• Responsible ASM is possible—mines certified by standards such as Fairmined provide a learning opportunity for how this can be achieved.
3.5. DEMOCRATIC REPUBLIC OF CONGO
Country Overview
World Bank development status Low income
Indicators Year of dataGDP per capita, PPP (current international $) 804 2016GNI per capita, PPP (current international $) 790 2016% population living in poverty (<$1.90/day) 77.1 2012
Gini index (World Bank estimate) 42.1 2012% total unemployment of total labor force (ILO estimate) 3.6 2017Yale Environmental Performance Index 42.1 2016

64 FOREST-SMART MINING
The Democratic Republic of Congo is a low-income country with a population of 79 million in the Congo Basin of Central Africa (BBC News 2017). The country has significant mineral wealth, including globally significant deposits of copper, cobalt, cadmium, diamonds, gold, silver, zinc, manganese, tin, uranium, germanium, columbite-tantalum, bauxite, iron ore, and coal. Mining contributes to 22 percent of the GDP (Radley 2018) and supports 14–16 percent of the population (Andrews, Bocoum, and Tshimena 2008). Minerals are owned by the state, and access is controlled through a concessionary system. The Ministry of Mines governs mining and is responsible for designating Artisanal Exploration Zones (AEZs) for legally registered artisanal miners. In practice, however, most mining occurs informally. The Mining Code prohibits any activity within designated protected areas; however, mining still persists in numerous national parks because of a lack of law enforcement, low funding for control, and lack of capacity (Walmsley and Patel 2006).
The DRC’s mineral wealth and low production costs are attractive to investors, but issues such as the presence of armed groups, and weak governance have prevented substantial development of the large-scale mining sector (US Department of State 2018). It is estimated that 90 percent of all minerals are artisanally mined, and that much of this is smuggled to border countries such as Rwanda, Burundi, and Uganda. State and non-state military groups have a strong presence in the mineral sector in the DRC, including direct control of mines and sale of the minerals, illegal taxation of miners, or illegal taxation at roadblocks along transport routes (D’Souza 2003). The international community and downstream actors have focused almost exclusively on halting the sourcing of conflict minerals, such as the OECD Guidance, the ICGLR Regional Certification Mechanism, and regulations such as the European Union Conflict Minerals Law or the Dodd-Frank Act Section 1502.
The DRC has the greatest extent of tropical rain forests in Africa—over 100 million hectares—and exceptional biodiversity (Mongabay 2006). Forests are owned by the state and tenure is controlled by the Directorate of Forest Management (WRI 2013). The forestry sector is relatively underdeveloped in the DRC compared to its neighbors and illegal logging is prevalent. The DRC government has implemented a variety of different measures to try and protect the country’s forests. The most significant is the 2002 Forest Code, which establishes basic principles for forest policy and the protections for local people in production forests (WRI 2013). These measures, however, are not seen to be very effective, and deforestation continues to be a significant issue for the country.
The DRC’s forests are at risk from artisanal mining, small-scale agriculture, and artisanal and industrial logging. Between 1990 and 2012, the DRC experienced estimated average annual rates of deforestation of 0.2 percent, which equates to 311,000 hectares of forest lost annually (FAO 2011). Today, more than 13 percent of the country is classified as protected areas, but their management is lacking and they are often inaccessible to authorities because of the presence of armed forces (Mongabay 2006). There have been issues surrounding the designation of categories to forest areas without appropriate consultation or consideration of preexisting community rights and public consent.
Efforts to reduce deforestation include a moratorium on new logging concessions to limit deforestation and review existing logging titles, active since 2002. To date, the review process and legal reforms have not been completed and nearly 90 percent of logging is illegal or informal small scale to supply domestic and regional markets (Chatham House 2014). The REDD+ program is active in the DRC; the largest REDD+ agreement, worth $200 million, was signed by the DRC in April 2016.
Is the DRC’s Mining Sector Forest Smart?
The DRC is a country of significant mineral and environmental wealth, both of which have the potential to be resources for development. However, the country is also beset with a persistent history of conflict, one of the highest indexes of poverty, and strong financial interests in illicit economies—these factors have consistently prevented mining and forests from existing in harmony.
There is a lack not only of designated AEZs for legal artisanal mining but also of suitable and profitable AEZs to incentivize miners. In order to incentivize miners to abandon profitable deposits in protected or other forested landscapes in favor of legal areas, the alternatives should be equally profitable and accessible. Congolese authorities and international donors should invest in better geological data to be made accessible to the Ministry of Mines and the artisanal mining sector, and this information should underpin decisions on where to designate new AEZs.
Strong opportunity exists for the international com-munity to expand its scope beyond conflict minerals to include environmental considerations in their due diligence regulations, standards, and guidelines. For example, due diligence guidelines such as the OECD should equip down-stream actors to check the environmental footprint of the minerals they source.

65FOREST-SMART MINING
Lessons Learned
• A minimum critical level of political stability and poverty alleviation is needed before minerals and forests can contribute to sustainable development or before conservation investments can maximize their impact.
• The international focus on conflict minerals has, to an extent, obscured the environmental impacts of ASM. With the right awareness raising and influencing, downstream players could increase demand for not only conflict-free minerals but forest-friendly minerals.
3.5.1. Kahuzi-Biega National Park, DRC
Kahuzi-Biega National Park (KBNP) is located in eastern DRC and makes up part of the largest intact forest in the Congo Basin area. ASM has been present in KBNP since the 1970s, predominantly mining coltan, wolframite, gold, and cassiterite. ASM in KBNP has been associated with the ongoing lawlessness and violence, including the financing of conflict, illegal hunting, and habitat degradation (USAID 2016). There are many mining villages outside the park whose inhabitants mine outside the boundaries but also are known to penetrate the protected area for mining.
Rush situations are not uncommon, such as in 2002 when 12,000 coltan miners moved into KBNP after an international price spike. Miners usually clear vegetation to access shallow deposits that outcrop on the surface. The International Peace Information Service (IPIS) (2017) has documented at least 13 mines within the national park, with many more around its boundaries. Mine sites can vary in size between 2.5 to over 40 square kilometers.
Contested land in and around the park is a major issue, with many communities, including indigenous groups,
claiming territory in KBNP; some refused to leave when evictions were attempted in 1975 with a view to extend the park. Communities continue to mine, hunt, farm, fish, and graze cattle within the park boundaries (Rainer 2013). One of the areas most at risk of human encroach-ment is the narrow corridor linking the highland and lowland sections of the park, which is a crucial habitat corridor for large mammals.
KBNP has been affected by conflict since the Rwandan genocide in 1994 and the First Congo War (1996–1997), when it received influxes of hundreds of thousands of refugees and displaced people (USAID 2016). Conflict and acute population pressure led KBNP to be categorized as a World Heritage Site in Danger in 1994 (Rainer 2013). In 1996, armed groups settled within the park boundaries and the Congolese Institute for Nature Conservation lost control of many parts of the park (Spira et al. 2016). Illegal hunting, habitat loss, and deforestation all continue alongside artisanal mining in the national park and limit the capacity of conservation actors to protect biodiversity in the region. Armed groups such as the Raia Mutomboki continue to have an established presence in the park and maintain smuggling routes for the trading of minerals, arms, bushmeat, and wildlife products through the porous borders with Rwanda (USAID 2016).
While several international conservation organizations and donors have supported conservation work in KBNP—including the Wildlife Conservation Society, the Jane Goodall Institute, and UNESCO—the international community has heavily focused its attention on reducing conflict minerals, thus somewhat obscuring the also pressing need for environmental action.

66 FOREST-SMART MINING
Forest Health and Impacts
Figure 3-11 GIS Analysis of Deforestation and Proximity to Recognized Forest Resources in and around Kahuzi-Biega National Park, 2000–2016
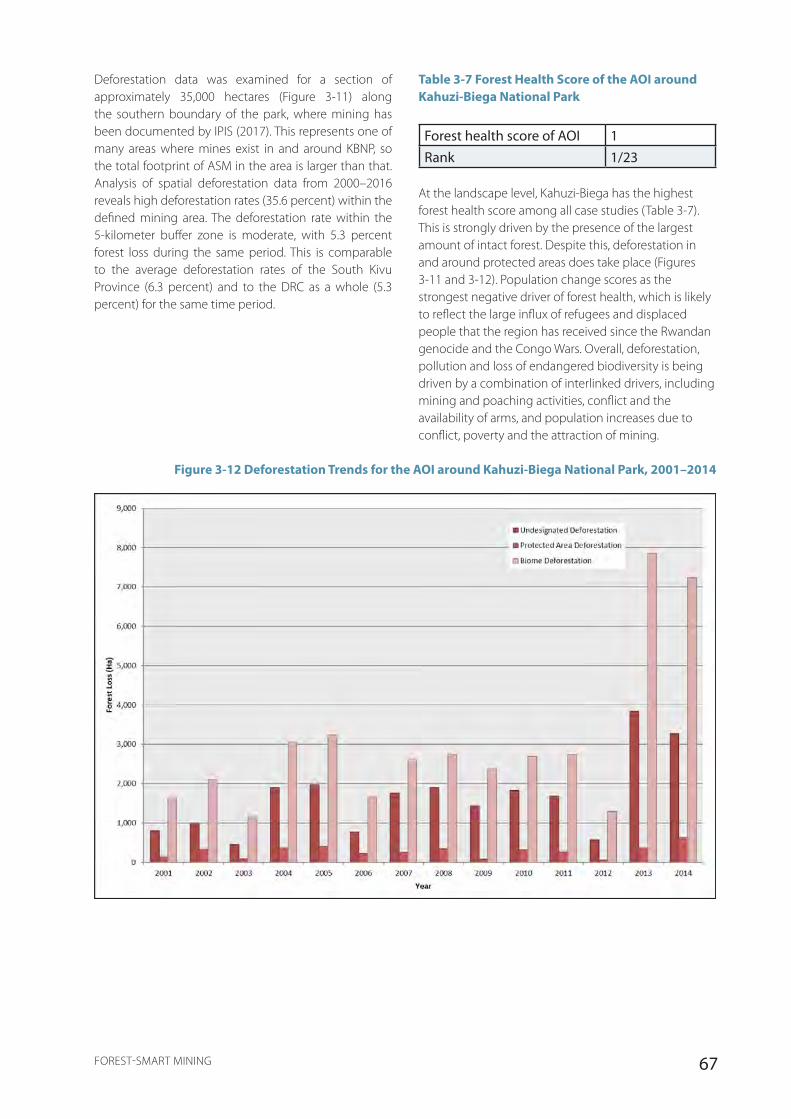
67FOREST-SMART MINING
Deforestation data was examined for a section of approximately 35,000 hectares (Figure 3-11) along the southern boundary of the park, where mining has been documented by IPIS (2017). This represents one of many areas where mines exist in and around KBNP, so the total footprint of ASM in the area is larger than that. Analysis of spatial deforestation data from 2000–2016 reveals high deforestation rates (35.6 percent) within the defined mining area. The deforestation rate within the 5-kilometer buffer zone is moderate, with 5.3 percent forest loss during the same period. This is comparable to the average deforestation rates of the South Kivu Province (6.3 percent) and to the DRC as a whole (5.3 percent) for the same time period.
Table 3-7 Forest Health Score of the AOI around Kahuzi-Biega National Park
Forest health score of AOI 1Rank 1/23
At the landscape level, Kahuzi-Biega has the highest forest health score among all case studies (Table 3-7). This is strongly driven by the presence of the largest amount of intact forest. Despite this, deforestation in and around protected areas does take place (Figures 3-11 and 3-12). Population change scores as the strongest negative driver of forest health, which is likely to reflect the large influx of refugees and displaced people that the region has received since the Rwandan genocide and the Congo Wars. Overall, deforestation, pollution and loss of endangered biodiversity is being driven by a combination of interlinked drivers, including mining and poaching activities, conflict and the availability of arms, and population increases due to conflict, poverty and the attraction of mining.
Figure 3-12 Deforestation Trends for the AOI around Kahuzi-Biega National Park, 2001–2014

68 FOREST-SMART MINING
Conclusions
Disputed land tenure is an overarching issue for KBNP and has significant impact on park conservation. The area around KBNP is densely populated and many people exert claims on park land. The rights and needs of these people must be adequately addressed in DRC law and incorporated into the strategy of conservation efforts so that people do not continue activities including mining, agriculture, and hunting within park boundaries because of a lack of viable alternatives.
Kahuzi-Biega is a case in point where, humanitarian, economic, and environmental factors compound to create a highly complex situation. Environmental degradation of KBNP and increased mining activity within the park are closely linked to conflict and instability in the region, which ultimately obstructs the success of conservation efforts. Conservation investments will be more fruitful if efforts to increase stability precede them or are weaved into their strategy, including the demilitarization of mines. In turn, illicit financing and protected or abetted criminal activities heavily underlie conflict and mining in the DRC and it is essential that these be tackled.
Bearing in mind that the above would require a long-term strategy, the state of certain endangered species
such as the gorilla is critical and should also be addressed with more short-term solutions. Rather than attempting to eradicate mining, “softer” approaches that have shown some success to date include introducing alternative protein sources, microcredit schemes, and community conservation strategies. These efforts have been local and limited in extent to date, and there is potential for the international community to scale them to a landscape level.
Lessons Learned
• In areas of conflict with strong political interests in the mining sector, political and humanitarian issues must be given priority even from a conservation perspective. Conservation efforts are unlikely to succeed, even if they entail appropriate community involvement, if powerful interests in mining and the armed conflict are not addressed first.
• Poor demarcation of park boundaries continues to manifest itself in land disputes over 40 years later. It is essential to follow appropriate FPIC procedures from the start in issues regarding land tenure as land claims and loss of trust become increasingly complex over time.
3.6. ECUADOR
Country Overview
World Bank development status Upper middle income
Indicators Year of dataGDP per capita, PPP (current international $) 11,264 2016GNI per capita, PPP (current international $) 11,050 2016% population living in poverty (<$1.90/day) 4.8 2015
Gini index (World Bank estimate) 46.5 2015% total unemployment of total labor force (ILO estimate) 5.2 2017Yale Environmental Performance Index 66.6 2016
Ecuador is an upper-middle-income country with a fairly diversified economy. It has a varied geography and very high biological diversity. It is divided into four distinct biogeographic regions: Amazon, Andes, Pacific
coastal plain, and Galápagos Islands, with the most forest being in the Amazon. Ecuador has a national system of protected areas covering 20 percent of land. The government may also set aside so-called intangible
69FOREST-SMART MINING
zones where extractive activities are not permitted, to safeguard areas of great cultural and biological importance. Such intangibles zones include areas in the Amazon that may be prospective for petroleum, and where uncontacted indigenous group still live. Overall, the management effectiveness of protected areas has been rated as moderately unsatisfactory. Scores on indexes that relate to good forest and environmental management are similarly modest.
The Andean region is geologically highly prospective, but despite this Ecuador has been seen as unattractive for international mining-related investments, although this reputation has improved in recent years because of a new Mining Law (2009) and associated reforms. While mining currently contributes less than 1 percent to Ecuador’s GDP, with the output almost exclusively produced through ASGM, there is now a clear government strategy for attracting foreign investment and promoting the development of LSM. Two large mines are due to open in the Zamora-Chinchipe Province, which is a densely forested and comparatively less developed area of the country. These two mines are part of five so-called strategic projects that the government has been promoting in various ways. The other three projects are situated in the provinces of Azuay (two projects) and Morona Santiago, both of which border Zamora-Chinchipe.
The mining sector is governed and regulated by the Ministry of Mining, an entity created in 2015. Minerals are owned by the state and mining rights are awarded through concessions in a bidding-based system. The distinction between artisanal and small-, medium-, and large-scale mining is clearly articulated in the Mining Law and is based on volumes of production, size of mining area, and machinery used. Each type of mining is associated with environmental and fiscal responsibilities, which become more stringent with increasing size. Ecuador’s policy on ASM has since at least two decades been centered on attempts to formalize the sector and improving the technical capabilities of miners.
The Ministry of Environment governs the forests and forest tenure is held by the state, private landowners, or indigenous groups. Overall, the forestry sector is rather significant, although its products are mainly for the domestic market with only little being exported. The timber industry is characterized by a high number of small operators. The largest owners of forests are indigenous communities, and the protection of indigenous rights features strongly in Ecuadorian law.
Ecuador has experienced forest loss at a mean rate of 0.6 percent per year (2000–2015). The principal driver of deforestation is agriculture, followed by others that vary in importance depending on the region, including logging,
mining, and infrastructure. Reducing deforestation is a national priority and initiatives to achieve this form part of the National Development Plan and the National Afforestation and Reforestation Plan (2012), which also aims to increase the economic importance of the forestry industry.
Is Ecuador’s Mining Sector Forest Smart?
The two large mines due to open are situated in a sparsely populated, underdeveloped, and remote province with a sizable indigenous population, dense forest cover, and high biodiversity. In developing these projects, it is vital that best environmental management practices are used, and that the mitigation hierarchy is applied to manage impacts at the site level. However, at a landscape level, it is even more important to manage and control the secondary impacts that may be caused by economic development and population increase. A range of efforts and initiatives is needed in this regard (safeguarding protected areas, ensuring responsible and clear land use planning, sustainable levels of logging, and safeguarding the rights of indigenous groups), which is mainly the responsibility of national or regional authorities. Substantial efforts must be focused on ensuring that these authorities have the requisite capabilities, and this should entail partnership and close coordination with the LSM companies. In this regard, it is also advised that strategic environmental studies are needed, possibly in a process led by the provincial authorities.
ASM continues to dominate the mining sector and its impacts on forests must not be neglected. Ecuador’s policy for ASM centers on upscaling artisanal miners to small-scale miners and formalizing them into organized groups. In the long term, this is an appropriate strategy, but in the short and medium terms, it may cause substantial problems: small-scale mining can be very destructive to forests owing to the combination of mechanization, poor environmental awareness and capability on part of the miners, and weak environmental supervision and control on part of the authorities. Any efforts to upscale the industry must be accompanied by improved environmental supervision and control on the part of the authorities, and capacity-building efforts that are directed toward the relevant authorities as well as the miners.
Although mining remains a small sector of the economy, it has been receiving considerable interest from backers (industry and sometimes government) and those that oppose it (indigenous groups, environmentalists). The political seesaw between these opposing camps has led to widely contrasting mining sector policies to be adopted over the years. It has also caused misalignment between provincial government policies, which have often opposed mining because of concerns over

70 FOREST-SMART MINING
indigenous rights and environmental health, and national policies that have aimed to attract large mining projects in mineral-rich regions. It is important for Ecuador to arrive at a policy for the sector that can be stable in the longer term, and that strikes the right balance between promoting responsible economic development, with appropriate environmental and social safeguards.
Lessons Learned
• Countries new to attracting large-scale mining projects must ensure that mining policies are consistent across political camps within the nation, to avoid the risk of being met with internal conflicts or being perceived as an unstable political environment.
• Environmental requirements must be proportional to the capacity of mining entities. Clearly defining mining types on a scale from artisanal to large scale and assigning incrementing environmental responsibilities to each level can reduce the burden of compliance on small-scale actors.
• The upscaling of artisanal miners should occur proactively as a controlled drive toward responsible and formal mining practices before mechanization occurs haphazardly with little control over forest impacts.
3.6.1. Nambija, Zamora-Chinchipe, Ecuador
The small-scale mine of Nambija is located in southeastern Ecuador, in Zamora-Chinchipe Province. It sits on one of the largest gold deposits found in Ecuador. After nearly three decades of illegality, Nambija was formalized in 2015 when a concession of 69 hectares was awarded to the small-scale mining cooperative Asociación de Producción Minera Nambija Legendaria (ASONAMBILE). Nambija is found within a tropical evergreen montane forest that shows medium to high existing levels of anthropogenic disturbance (PRAS 2015), but extensive intact forest and five protected areas exist within a 50-kilometer radius.
Mining in Nambija is hard-rock gold mining, extracted from underground tunnels using explosives. Mineral processing is done on-site and includes the use of mercury and attempts at using cyanide have been made (SES 1999). A settlement of over 300 houses with a population of some 800 inhabitants currently exists within Nambija’s concession, and rudimentary infrastructure serves the mine and miners (PRAS 2015). Demographic assessments of the population indicate a very small number of people identifying as indigenous (Ministerio del Ambiente – Ecuador 2010).
The discovery of the Nambija gold deposit in 1980 led to a gold rush attracting up to 20,000 people from within the country and abroad who organized themselves into informal cooperatives. They extracted gold in an unplanned manner using rudimentary and inefficient technology, reaching gold recovery rates of between 40 and 60 percent. Despite Ecuador receiving donor-funded technical assistance in mining methods, Nambija miners continued to mine illegally and inefficiently throughout the 1980s and early 1990s (Sandoval 2001).
A deadly landslide in 1993, which killed 400 people, drew national attention to Nambija and its informality, health and safety risks, and social degradation. Several attempts to modernize mining methods followed, but these were met with little uptake from the mining cooperatives (Sandoval 2001).
In parallel to a nationwide focus on formalization and on the eradication of illegal mining, a new process of attempted formalization began in 2010 when the Ministry of Nonrenewable Natural Resources (since renamed the Ministry of Hydrocarbons), together with the participation of the population of Nambija, created an intervention plan based on a social and environmental diagnostic study (PRAS 2015). Legalization of the mining operations was the first step of the intervention plan, and this was successfully achieved in 2015 when the formal association ASONAMBILE was created and granted the rights to the concession. The association currently has 300 members, and mining operations are ongoing.
The following steps of the plan have been implemented or are planned:
1. Technical studies to determine the size of mineral reserves and to obtain an environmental license, subject to approval of the EIA, which has already been submitted.
2. The social intervention required in order to relocate the settlement of Nambija, following public consultation and presentation of relocation alternatives for the affected community (PRAS 2015). This is required because it is illegal to have a settlement within a mining concession.
The above plans were all being implemented with some success and with the authorities allocating considerable resources. In 2016, however, a severe earthquake struck another region in Ecuador and this drew both government funding and interest away from Nambija with the result that the relocation came to a standstill. Progressively declining gold prices have also prompted many to abandon Nambija, and its population has dropped to 790 inhabitants (Sandoval 2001).

71FOREST-SMART MINING
Forest Health and Impacts
Figure 3-13 GIS Analysis of Deforestation and Proximity to Recognized Forest Resources in and around Nambija, 2000–2016
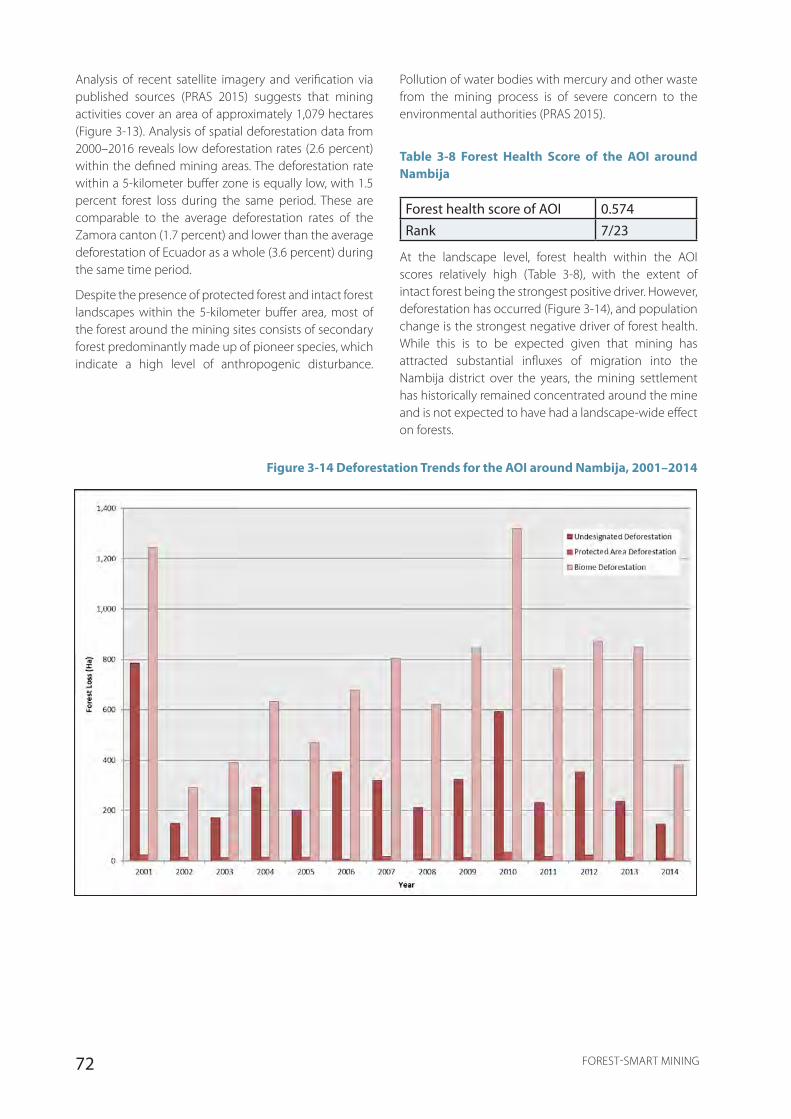
72 FOREST-SMART MINING
Analysis of recent satellite imagery and verification via published sources (PRAS 2015) suggests that mining activities cover an area of approximately 1,079 hectares (Figure 3-13). Analysis of spatial deforestation data from 2000–2016 reveals low deforestation rates (2.6 percent) within the defined mining areas. The deforestation rate within a 5-kilometer buffer zone is equally low, with 1.5 percent forest loss during the same period. These are comparable to the average deforestation rates of the Zamora canton (1.7 percent) and lower than the average deforestation of Ecuador as a whole (3.6 percent) during the same time period.
Despite the presence of protected forest and intact forest landscapes within the 5-kilometer buffer area, most of the forest around the mining sites consists of secondary forest predominantly made up of pioneer species, which indicate a high level of anthropogenic disturbance.
Pollution of water bodies with mercury and other waste from the mining process is of severe concern to the environmental authorities (PRAS 2015).
Table 3-8 Forest Health Score of the AOI around Nambija
Forest health score of AOI 0.574Rank 7/23
At the landscape level, forest health within the AOI scores relatively high (Table 3-8), with the extent of intact forest being the strongest positive driver. However, deforestation has occurred (Figure 3-14), and population change is the strongest negative driver of forest health. While this is to be expected given that mining has attracted substantial influxes of migration into the Nambija district over the years, the mining settlement has historically remained concentrated around the mine and is not expected to have had a landscape-wide effect on forests.
Figure 3-14 Deforestation Trends for the AOI around Nambija, 2001–2014
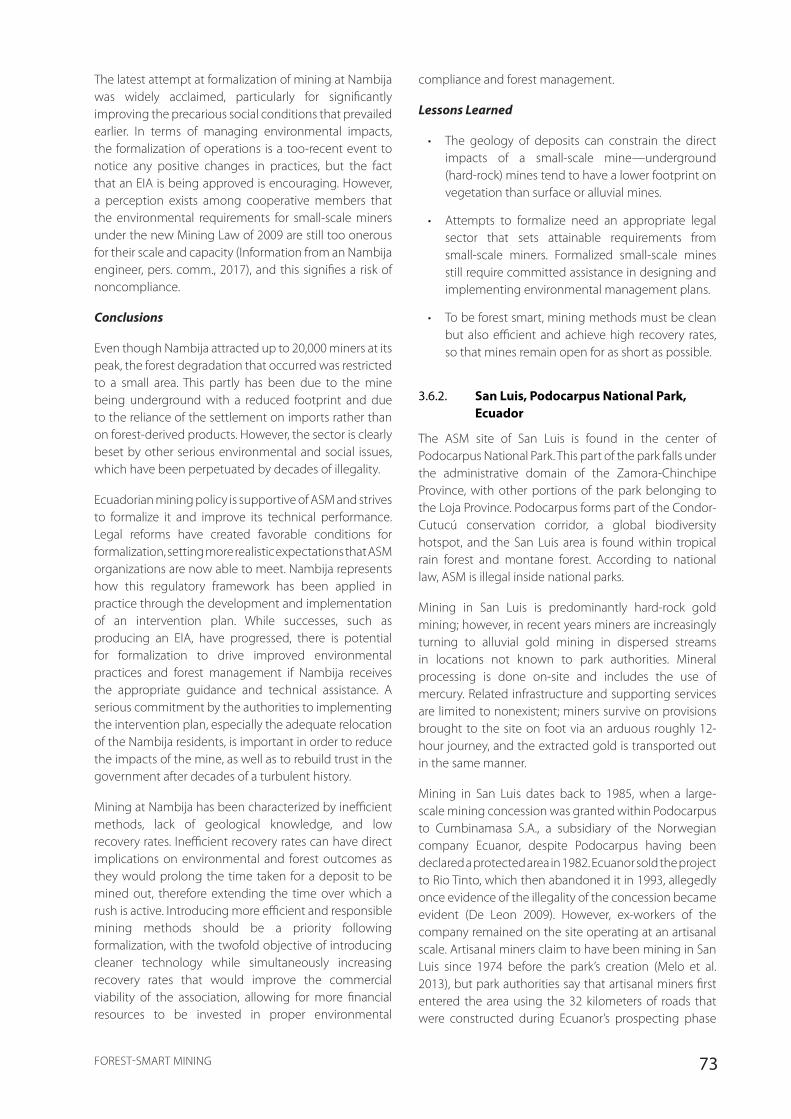
73FOREST-SMART MINING
The latest attempt at formalization of mining at Nambija was widely acclaimed, particularly for significantly improving the precarious social conditions that prevailed earlier. In terms of managing environmental impacts, the formalization of operations is a too-recent event to notice any positive changes in practices, but the fact that an EIA is being approved is encouraging. However, a perception exists among cooperative members that the environmental requirements for small-scale miners under the new Mining Law of 2009 are still too onerous for their scale and capacity (Information from an Nambija engineer, pers. comm., 2017), and this signifies a risk of noncompliance.
Conclusions
Even though Nambija attracted up to 20,000 miners at its peak, the forest degradation that occurred was restricted to a small area. This partly has been due to the mine being underground with a reduced footprint and due to the reliance of the settlement on imports rather than on forest-derived products. However, the sector is clearly beset by other serious environmental and social issues, which have been perpetuated by decades of illegality.
Ecuadorian mining policy is supportive of ASM and strives to formalize it and improve its technical performance. Legal reforms have created favorable conditions for formalization, setting more realistic expectations that ASM organizations are now able to meet. Nambija represents how this regulatory framework has been applied in practice through the development and implementation of an intervention plan. While successes, such as producing an EIA, have progressed, there is potential for formalization to drive improved environmental practices and forest management if Nambija receives the appropriate guidance and technical assistance. A serious commitment by the authorities to implementing the intervention plan, especially the adequate relocation of the Nambija residents, is important in order to reduce the impacts of the mine, as well as to rebuild trust in the government after decades of a turbulent history.
Mining at Nambija has been characterized by inefficient methods, lack of geological knowledge, and low recovery rates. Inefficient recovery rates can have direct implications on environmental and forest outcomes as they would prolong the time taken for a deposit to be mined out, therefore extending the time over which a rush is active. Introducing more efficient and responsible mining methods should be a priority following formalization, with the twofold objective of introducing cleaner technology while simultaneously increasing recovery rates that would improve the commercial viability of the association, allowing for more financial resources to be invested in proper environmental
compliance and forest management.
Lessons Learned
• The geology of deposits can constrain the direct impacts of a small-scale mine—underground (hard-rock) mines tend to have a lower footprint on vegetation than surface or alluvial mines.
• Attempts to formalize need an appropriate legal sector that sets attainable requirements from small-scale miners. Formalized small-scale mines still require committed assistance in designing and implementing environmental management plans.
• To be forest smart, mining methods must be clean but also efficient and achieve high recovery rates, so that mines remain open for as short as possible.
3.6.2. San Luis, Podocarpus National Park, Ecuador
The ASM site of San Luis is found in the center of Podocarpus National Park. This part of the park falls under the administrative domain of the Zamora-Chinchipe Province, with other portions of the park belonging to the Loja Province. Podocarpus forms part of the Condor-Cutucú conservation corridor, a global biodiversity hotspot, and the San Luis area is found within tropical rain forest and montane forest. According to national law, ASM is illegal inside national parks.
Mining in San Luis is predominantly hard-rock gold mining; however, in recent years miners are increasingly turning to alluvial gold mining in dispersed streams in locations not known to park authorities. Mineral processing is done on-site and includes the use of mercury. Related infrastructure and supporting services are limited to nonexistent; miners survive on provisions brought to the site on foot via an arduous roughly 12-hour journey, and the extracted gold is transported out in the same manner.
Mining in San Luis dates back to 1985, when a large-scale mining concession was granted within Podocarpus to Cumbinamasa S.A., a subsidiary of the Norwegian company Ecuanor, despite Podocarpus having been declared a protected area in 1982. Ecuanor sold the project to Rio Tinto, which then abandoned it in 1993, allegedly once evidence of the illegality of the concession became evident (De Leon 2009). However, ex-workers of the company remained on the site operating at an artisanal scale. Artisanal miners claim to have been mining in San Luis since 1974 before the park’s creation (Melo et al. 2013), but park authorities say that artisanal miners first entered the area using the 32 kilometers of roads that were constructed during Ecuanor’s prospecting phase

74 FOREST-SMART MINING
from 1985 onward (O. Peralta and J. C. Ortega of the Ministry of Environment, pers. comm., 2017).
Concerns about the growing illegal ASM led to the creation of an Inter-Institutional Committee of Defense for Podocarpus National Park, which achieved the peaceful eviction of 800 miners in 1994, when ASM in San Luis was at its peak. In exchange for their voluntary exit, miners were granted amnesty from legal prosecution and promised a formal mining concession outside park boundaries. However, such concession was never granted, in part due to disputes over which groups of miners were entitled to the new mining rights. Efforts to assist miners with diversifying their livelihoods toward agriculture or fisheries were equally unsuccessful (López, Torres, and Beltrán 2003). As a result, artisanal miners returned to the park.
Despite repeated attempts since then to voluntarily and forcefully evict miners, invasions continue to recur shortly after evictions. Armed forces have been deployed on occasions in an increasingly militarized approach. Both miners and park authorities have behaved aggressively, with park rangers receiving death threats from miners and authorities torching confiscated equipment and camps. It is worth noting that, even though miners have not been fully removed from the park, the number of miners in recent years has been only about 60 people in comparison to previous years when numbers have averaged at 200 (O. Peralta and J. C. Ortega of the Ministry of Environment, and F. Lopez of the Universidad Técnica Particular de Loja, pers. comm., 2017).
Forest Health and Impacts
Ecuador, by Theodora Panayides, Levin Sources
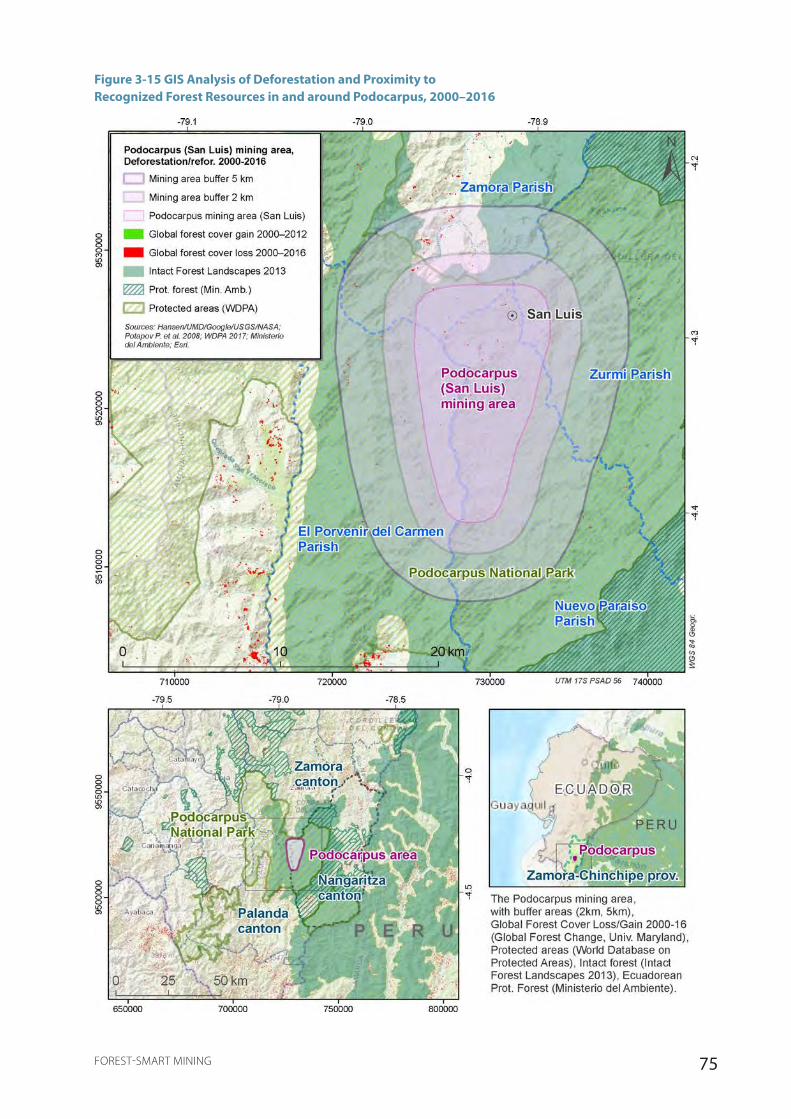
75FOREST-SMART MINING
Figure 3-15 GIS Analysis of Deforestation and Proximity to Recognized Forest Resources in and around Podocarpus, 2000–2016
76 FOREST-SMART MINING
Published geological information suggests that the mining in San Luis occurs over approximately 97 hectares (Figure 3-15). Analysis of spatial deforestation data from 2000–2016 reveals low deforestation rates (0.1 percent) within the defined mining area. The deforestation rate within the 5-kilometer buffer zone is equally low, with 0.1 percent forest loss within the same time period. This is lower than the average deforestation rates in the Nangaritza canton (1.1 percent) and in Ecuador as a whole (3.6 percent) for the same time period.
The impacts observed by Ministry of Environment staff during evictions are localized and include logging in the surroundings, inorganic waste disposal, and the construction of simple camps (Villavicencio Onofa 2016). It is known that effluents containing mercury are discharged into rivers, and water levels of streams have been reduced by the extraction of water for processing the gold. While the impacts on rivers may be discernible further downstream, impacts on forest and biodiversity are unlikely to be wide-reaching based on the minimal deforestation footprint (Figure 3-15), the localized extent of the impacts observed by Ministry of Environment staff (Villavi-cencio Onofa 2016) and observations made during an environmental expert’s site visit in 1999 (A. Flachier, pers. comm., 2017). Detailed studies of environmental impacts have not been done because of the site’s remoteness and difficult entry.
Despite the impacts from mining being small, the authorities do not tolerate illegal mining within Podocarpus out of respect to the law and in order not to set a negative precedent. However, the park management is not adequately equipped to completely eliminate illegal mining. Park rangers consider that the proportion of Podocarpus that falls within the Zamora-Chinchipe region is understaffed in comparison to the part of the park under the Loja administration, which is able to maintain a stronger deterring presence (O. Peralta and J. C. Ortega, Ministry of Environment, pers. comm., 2017). Owing to the remoteness of the site, entry to the park can be done only via helicopter and in favorable weather. In addition, the police need the authorization of the district attorney to make arrests, which in turn means that a high degree of coordination and planning is required for every eviction.
Table 3-9 Forest Health Score of the AOI around Podocarpus
Forest health score of AOI 0.611Rank 5/23
At the landscape level there has been some deforestation (Figure 3-16), with population change being the strongest negative driver of forest health within the AOI. However, the forest health score is overall high, with the main positive driver being the degree of forest connectivity.
Figure 3-16 Deforestation Trends for the AOI around Podocarpus, 2001–2014
77FOREST-SMART MINING
Conclusions
The history of Podocarpus highlights that LSM-related prospecting activities, when conducted in protected or otherwise sensitive areas, can unintentionally pave the way for ASM to establish in undesired locations. This possibility needs to be acknowledged and managed, both by authorities and companies.
Repeated evictions have not been completely efficient but appear to have been partly successful as a deterrent, indicated by a decrease in number of miners over the years. In Podocarpus, however, the state has on occasion failed to deliver on its negotiated responsibilities, making trust-based voluntary evictions unlikely to succeed and augmenting the need for a militarized approach.
Issues of understaffing and underresourcing of park authorities and other government staff involved in supervision and control of mining have prevented the park from maintaining a stronger deterring presence. Protected area managers need specific training and tools for sustainable and responsible evictions or more general park management to address ASM threats to forests.
The location and subsequent provision to artisanal miners of alternative mining concessions outside of park boundaries is a possibility that may hold some promise but is associated with some fundamental problems. The location and setting aside of such areas that are not already used or identified by other miners
requires substantial efforts by the authorities in terms of mineral prospecting. In fact, it is unlikely that the state has either the expertise or the resources needed for such an initiative to be successful. An alternative, to provide artisanal miners with concessions in areas already held by others, is likely to encounter near-insurmountable legal problems.
Lessons Learned
• The decision of where to allow LSM to occur has implications beyond its own direct or indirect impacts and can open up previously unavailable areas to activities such as ASM. Not allowing prospection in ecologically sensitive areas, therefore, becomes even more important when the social conditions of the area allow for the possibility of ASM becoming an economically attractive activity.
• Significant investment in park management is required after each eviction to prevent repeat invasions. However, even if miners do return, repeat evictions are still valuable as a deterrent to keep the number of miners to a minimum if understaffed park authorities are not able to maintain a strong enough presence to prevent invasions in the first place.
3.7. GHANA
Country Overview
World Bank development status Lower middle income
Indicators Year of dataGDP per capita, PPP (current international $) 3,980 2016GNI per capita, PPP (current international $) 4,160 2016% population living in poverty (<$1.90/day) 13.6 2012
Gini index (World Bank estimate) 42.2 2012% total unemployment of total labor force (ILO estimate) 5.8 2017Yale Environmental Performance Index 58.9 2016
Ghana is a lower-middle-income country with a long history of mining, particularly gold, and the industry represents a significant source of export revenue and is the country’s highest source of tax revenue. Following a
period of transition from state control to private control, the LSM sector today is dominated by a relatively small number of largely foreign-controlled firms. There is also a significant ASM industry, mostly Ghanaian controlled,
78 FOREST-SMART MINING
which has grown in importance from 2 per-cent to 36 percent of production since 1989. ASM includes both hard-rock mining and alluvial mining (galamsey).
Historically, Ghana was highly forested, but it has lost 60 percent of its forests since 1950 and today only 20 percent of the land is forested. Over half of the remaining forest lies within a network of forest reserves, most of which are allocated to forestry production and are in poor condition, and many more are “off reserve” (outside the protected area system). Protected areas cover 15 percent of the land surface. About 17 percent of Key Biodiversity Areas (KBAs) are in national parks and 66 percent in forest reserves.
The key drivers of forest loss are agriculture (50 percent) and wood removal (35 percent); mining accounts for 5 percent of the losses. Forests play a very significant role in the Ghanaian economy. Timber production alone contributes more to the economy than mining in terms of GDP and employment, but there is also massive reliance on forests and their products in poor rural areas, with over 1 million people living in forests and up to 70 percent of income derived from forest products, predominantly hunting, timber, and fuel. REDD+ is fairly well developed in Ghana, with a national strategy published, but there is relatively little focus on forests and mining. Ghana has also initiated a natural capital accounting (NCA) system, including the preparation of an implementation strategy.
LSM in natural forests is a relatively common occurrence, mainly through the opening up of forest reserves to mining in the early 2000s. ASM incursions to forest reserves or protected areas are reported to be very minor (although ASM significantly impacts plantations in some regions). There are several LSM mines recorded in forests in the Raw Materials Database and five licenses have been granted to mine in forest reserves. At least one forest reserve designated a KBA (Atewa Forest Reserve) is threatened by a proposed bauxite mining project.
The Ministry of Lands and Natural Resources (MLNR) controls both mineral resources (Minerals Commission) and forest resources (Forestry Commission); however, the former is significantly more influential than the latter. Mineral resources are owned by the state, but private actors can be granted complete control over resources. Forest resources are also owned and traditionally managed by the state. This is just starting to change now with the introduction of a number of community resource management schemes and delegation agreements.
Environmental impacts in general are licensed and monitored by the Environmental Protection Agency (EPA)
but special provisions exist for mining in forest reserves, including additional permissions from the Forestry Commission, limits on the proportion of reserves that can be allocated to mining, additional tax requirements, and a cross-department management committee. Coordination between the MLNR commissions and the EPA is weak. The World Bank does not rate Ghana as a particularly easy place to do business (it ranks 120th out of 190) and environmental protection policies are rated fairly poorly. However, mining companies perceive Ghana as one of the easier places to operate.
Because of the current galamsey crisis, the Ghanaian government banned all ASM in March 2017 (initially for six months, now indefinitely) and is promoting a $200 million Multilateral Mining Integrated Project (MMIP) that will review the legal regulatory regime for ASM, including streamlining permitting processes for legal ASM. The ban has temporarily reduced the pressures of ASM in all areas, including on forests.
Is Ghana’s Mining Sector Forest Smart?
Forest reserve status is insufficient to ensure protection of forest against mining. The protected area (PA) network needs to be extended and reinforced, and more KBAs turned into national parks. In combination with reinforcing the PA network, the key area of focus needs to be on limiting mining in forest reserves and “off reserve” forests.
Forests are perceived as economically important, but minerals are considered to be economically more important. Most see forests as economically substitutable for minerals, without considering biodiversity or ecosystem services, and with the timber values simply restored later through reclamation. A lack of locally based forest tenure is likely to be an important factor in the relatively low perception of forest value. In this regard, Ghana is taking positive steps by initiating the implementation of a NCA system.
The conversion of agricultural land to galamsey might be driving indirect forest conversion into agriculture to meet demand for crops. Greater awareness needs to be developed on the long-term consequences of this and policies put in place to incentivize better land use decisions.
Despite mineral and forest resources being managed by the same ministry and environmental impacts managed by an external EPA, there is scope for much better coordination and more evenly balanced relationships. Part of the appeal of Ghana to mining companies may be related to its relatively weak environmental regulations and enforcement.
79FOREST-SMART MINING
While the ban has been temporarily effective in reducing the forest impacts of galamsey, there are indications that legal ASM operators have obeyed and ceased operations, while illegal operators have restarted mining despite the ban.
Lessons Learned
• Interministerial coordination between the mining ministry and the environment agency is necessary, with both having equal standing and levels of influence across key decisions.
• Natural capital accounting is a promising mechanism through which to increase the visibility of the often-indirect economic value of forests relative to the direct economic benefits of mining.
• Strong protected area networks are essential, and the extent of coverage is as important as the degree of protection granted to the most common protected area categories. Protected areas should be promoted in landscapes where mining takes place, and full protection levels should be granted where possible.
• Extreme measures such as mining bans are reactive rather than a proactive and cannot be sustained in the long-term.
3.7.1. Atewa Range Forest Reserve, Eastern Region, Ghana
Atewa Range Forest Reserve is located near the East Akim Municipal District in Ghana’s Eastern Region and has been recognized as a Key Biodiversity Area by the IUCN. It is also the source of three major rivers (Densu, Ayensu, and Birim) that provide drinking water for an estimated 5 million people from the surrounding area and Accra, the Ghanaian capital (Triebert 2017). It was gazetted as a national forest reserve in 1926 and a special biological protection area in 1994 (A Rocha Ghana, n.d.). The Atewa landscape is one of the Hotspot Intervention Areas under Ghana’s Cocoa REDD+ program funded by the World Bank (The REDD Desk 2018). The NGO A Rocha is leading a campaign to have the Atewa reserve made into a national park to better protect its eco-system from human threats, especially LSM for bauxite (Osei-Owusu 2016). Atewa forest is threatened by ASM, LSM, farming, illegal logging, and hunting.
Atewa has substantial gold and bauxite reserves, and the government of Ghana’s renewed interest in the bauxite sector has led to the granting of exploration concessions from a variety of LSM companies in and around the park (Environmental News Agency 2017). Artisanal alluvial gold mining is a crucial form of livelihood in the region and occurs primarily along the upper part of the Birim River (ENA 2017). Underground pit mining is also present in the reserve. Miners also remove patches of forest to create “resting areas” for miners around the site (Osei-Owusu 2016).
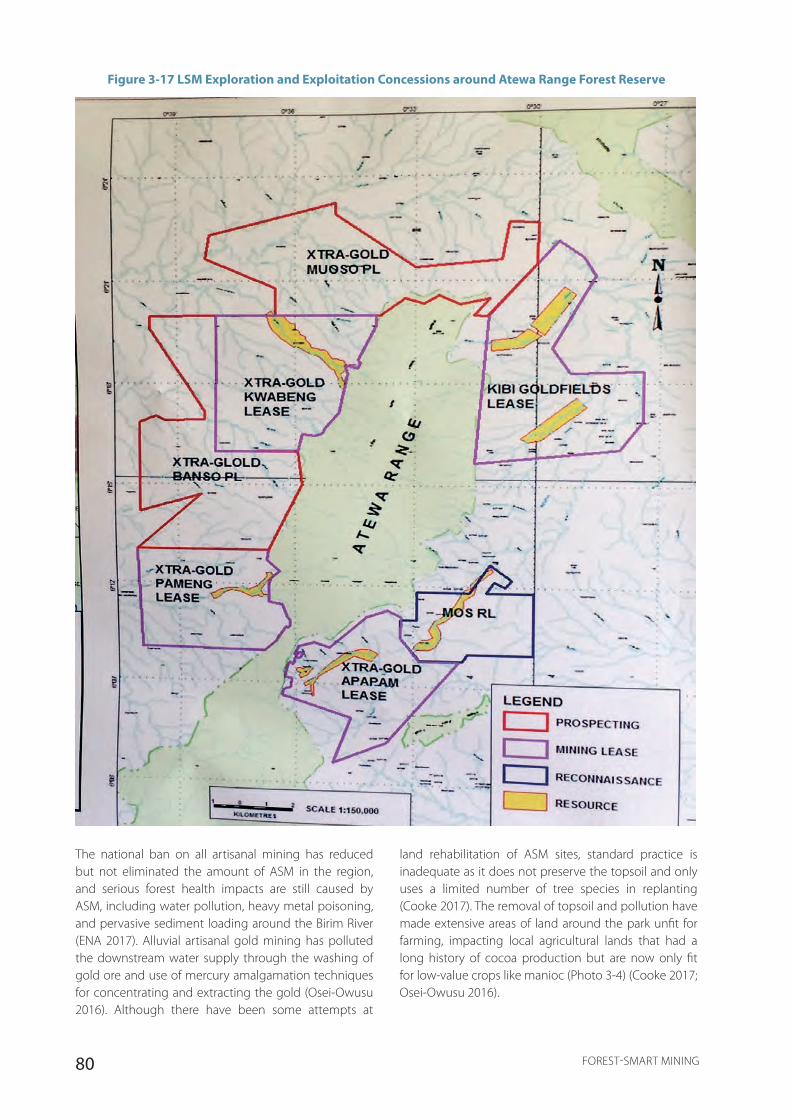
80 FOREST-SMART MINING
Figure 3-17 LSM Exploration and Exploitation Concessions around Atewa Range Forest Reserve
The national ban on all artisanal mining has reduced but not eliminated the amount of ASM in the region, and serious forest health impacts are still caused by ASM, including water pollution, heavy metal poisoning, and pervasive sediment loading around the Birim River (ENA 2017). Alluvial artisanal gold mining has polluted the downstream water supply through the washing of gold ore and use of mercury amalgamation techniques for concentrating and extracting the gold (Osei-Owusu 2016). Although there have been some attempts at
land rehabilitation of ASM sites, standard practice is inadequate as it does not preserve the topsoil and only uses a limited number of tree species in replanting (Cooke 2017). The removal of topsoil and pollution have made extensive areas of land around the park unfit for farming, impacting local agricultural lands that had a long history of cocoa production but are now only fit for low-value crops like manioc (Photo 3-4) (Cooke 2017; Osei-Owusu 2016).
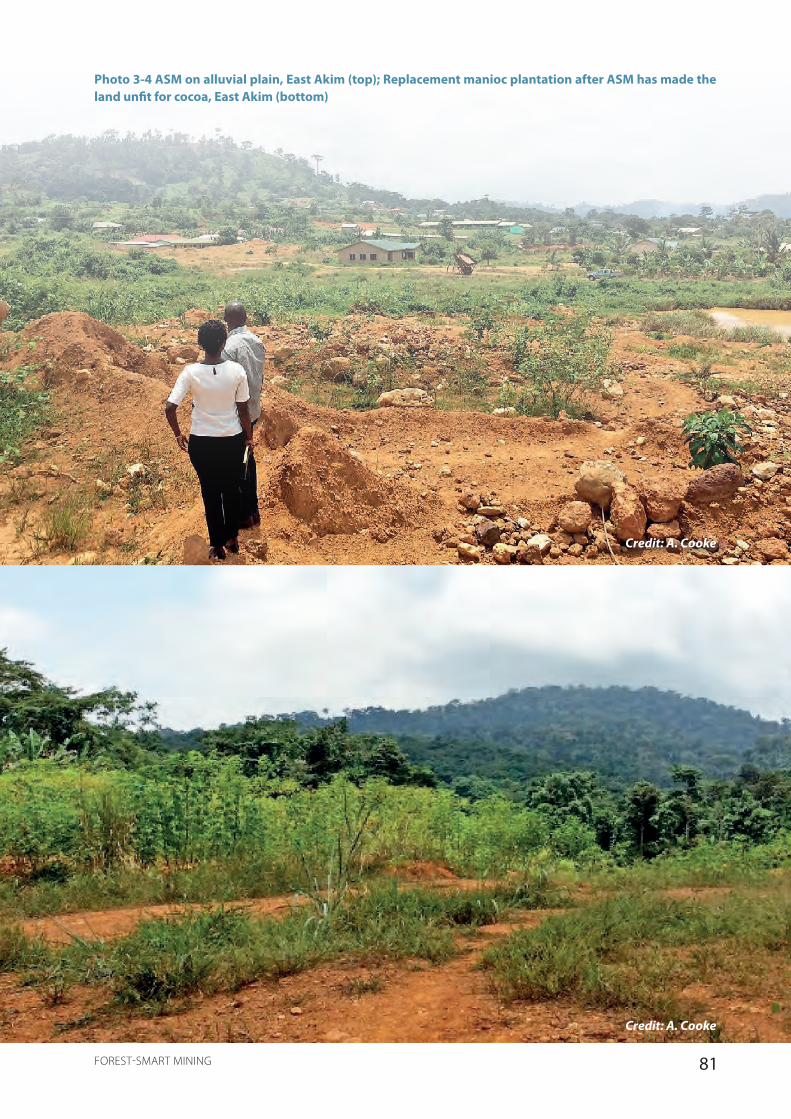
81FOREST-SMART MINING
Credit: A. Cooke
Photo 3-4 ASM on alluvial plain, East Akim (top); Replacement manioc plantation after ASM has made the land unfit for cocoa, East Akim (bottom)
Credit: A. Cooke

82 FOREST-SMART MINING
Hunting of protected and traditionally sacred animals within the reserve is widespread (A Rocha Ghana, n.d.). Logging in Atewa forest has not been permitted for many years, but illegal logging still occurs (A Rocha Ghana, n.d.). On some occasions, illegal logging has escalated to the point that the army has been called in to deal with the issue (Osei-Owusu 2016).
In 2012, a three-year program called the Atewa Critical Conservation Action Programme (ACCAP) was launched to target threats to the reserve through awareness raising activities and advocacy. This initiative did a lot to bring international attention to the reserve and the campaign resulted in subsequent work by IUCN Netherlands and NGOs A Rocha and Living Waters from the Mountain (A Rocha Ghana, n.d.).
The local district has one of the most active District Mining Committees, which endeavor to control illegal mining and to resolve land use conflicts between mining and agriculture at the local level. Local leadership appears to have a high environmental awareness, and the region boasts at least one replanted forest as well as recent rehabilitation efforts by ASM operations.
In East Akim, one community reforestation initiative dating back to 2000 stands out as a success (Photo 3-5, left), whereas attempts nearby by mining operators
to reforest mined-out areas (Photo 3-5, right) appear inadequate and unlikely to result in the reestablishment of forest.
Forest Health and Impacts
The study examined a section of ASM mining activities at Subri, to the east of the northern half of the Atewa forest, within the Kibi Goldfields industrial concession. The mining area covers 95 hectares (Figure 3-18). Analysis of spatial deforestation data from 2000–2016 reveals high deforestation rates (19 percent) within the defined mining areas. Deforestation rates within the 5-kilometer buffer zone show 8.8 percent forest loss during the same period. This is lower than the national average (12 percent) but higher than the average deforestation rates for the Eastern Region (5 percent), suggesting that ASM may be contributing measurably to deforestation in the study area.
Nevertheless, Figure 3-18 shows that there has been much less forest loss in the Atewa forest reserve (only 1.5 percent) than in other areas; therefore, the forest reserve status has a significant protection effect. Atewa forest reserve management staff interviewed confirmed that ASM incursions into the reserve had been very minor, affecting no more than a few hectares (A Rocha Ghana staff, pers. comm., 2017).
Photo 3-5 Community Reforestation Site Planted in 2000, East Akim (left); Recent Replanting by ASM Operators (right)
Credit: A. Cooke
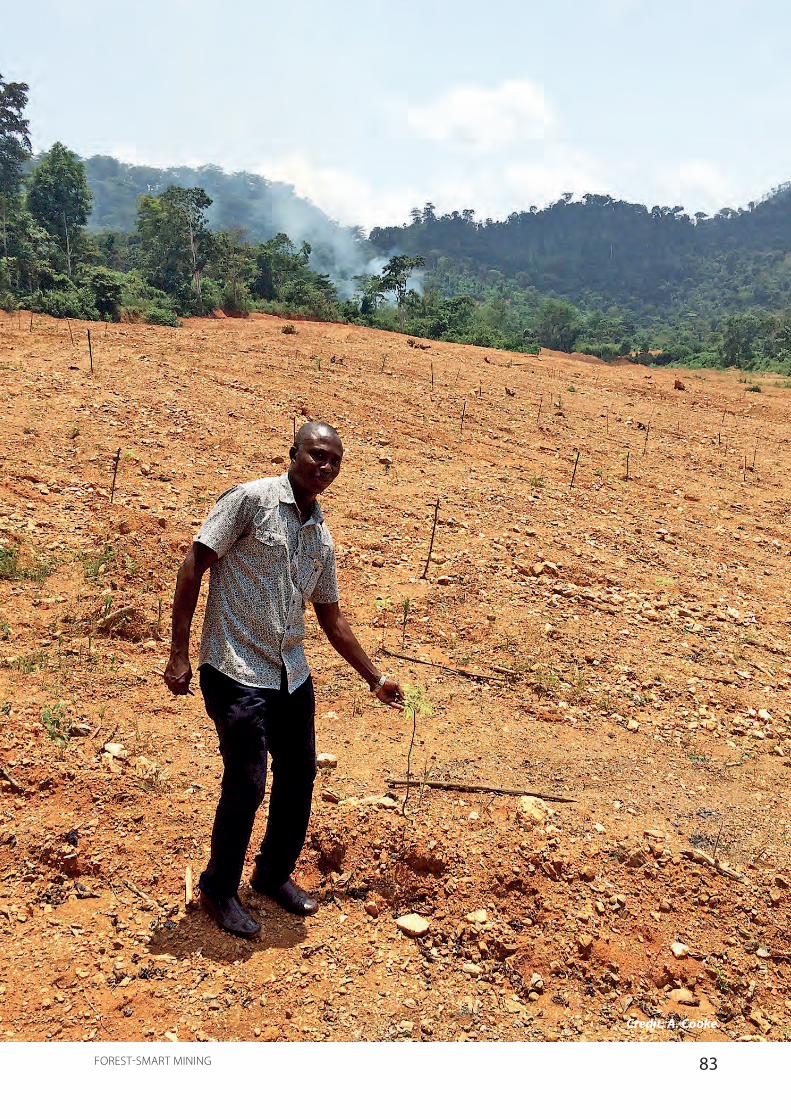
83FOREST-SMART MINING
Credit: A. Cooke

84 FOREST-SMART MINING
Figure 3-18 GIS Analysis of Deforestation and Proximity to Recognized Forest Resources in and around Atewa, 2000–2016
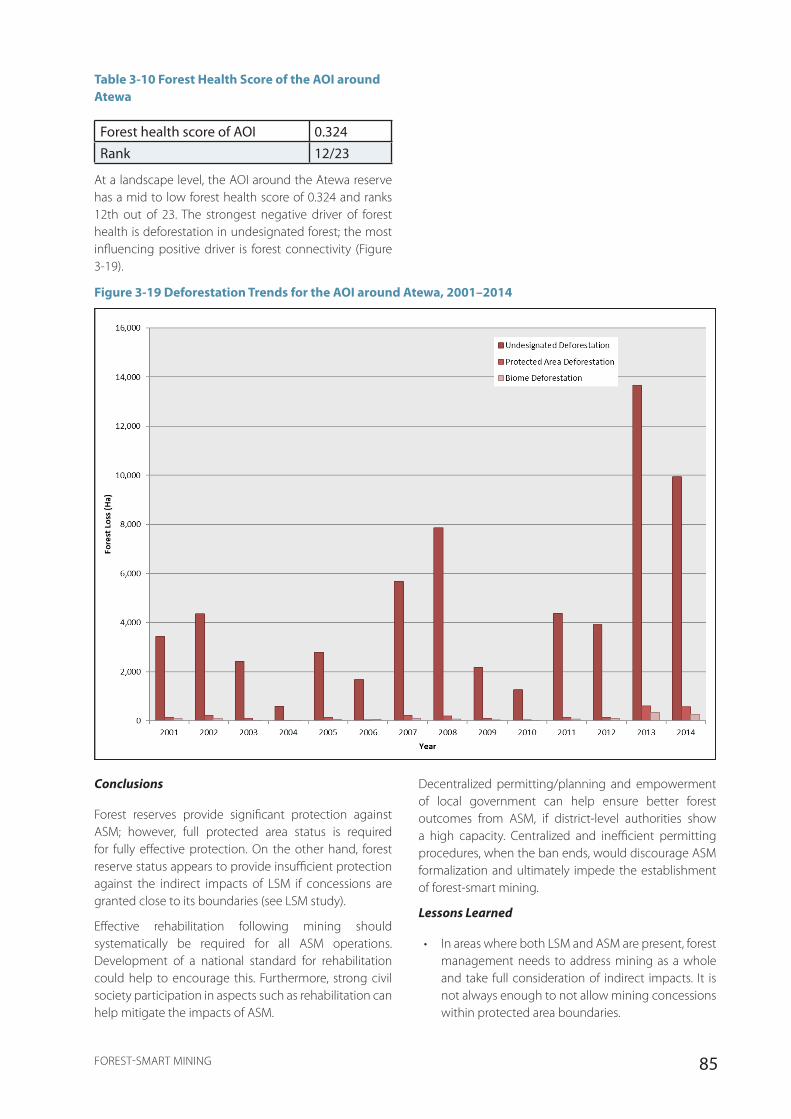
85FOREST-SMART MINING
Table 3-10 Forest Health Score of the AOI around Atewa
Forest health score of AOI 0.324Rank 12/23
At a landscape level, the AOI around the Atewa reserve has a mid to low forest health score of 0.324 and ranks 12th out of 23. The strongest negative driver of forest health is deforestation in undesignated forest; the most influencing positive driver is forest connectivity (Figure 3-19).
Figure 3-19 Deforestation Trends for the AOI around Atewa, 2001–2014
Conclusions
Forest reserves provide significant protection against ASM; however, full protected area status is required for fully effective protection. On the other hand, forest reserve status appears to provide insufficient protection against the indirect impacts of LSM if concessions are granted close to its boundaries (see LSM study).
Effective rehabilitation following mining should systematically be required for all ASM operations. Development of a national standard for rehabilitation could help to encourage this. Furthermore, strong civil society participation in aspects such as rehabilitation can help mitigate the impacts of ASM.
Decentralized permitting/planning and empowerment of local government can help ensure better forest outcomes from ASM, if district-level authorities show a high capacity. Centralized and inefficient permitting procedures, when the ban ends, would discourage ASM formalization and ultimately impede the establishment of forest-smart mining.
Lessons Learned
• In areas where both LSM and ASM are present, forest management needs to address mining as a whole and take full consideration of indirect impacts. It is not always enough to not allow mining concessions within protected area boundaries.

86 FOREST-SMART MINING
• Local government can take ownership of forest-smart mechanisms within its scope if decentralized powers are granted to them, provided that they have the backing from civil society to protect forests.
3.7.2. Tarkwa-Nsuaem Municipal District, Western Region, Ghana
Tarkwa in Ghana’s Western Region is a significant area of evergreen forest mountain ranges, with three forest reserves (Bonsa, Ekumfi, and Neung) that together represent 10 percent of the country’s closed forest (Obiri et al. 2018). Tarkwa is a center of gold and manganese mining, but 70 percent of the local people are employed in agriculture, growing crops such as cassava, maize, oil palm, rubber, citrus, and cocoa (Yaaba Baah-Ennumh and Ato Forson 2017).
The Tarkwa-Nsuaem Municipal District produces approximately 35 percent of Ghana’s gold output and ASM and LSM are both present in the region (Obiri et al. 2018). Opencast, underground, and alluvial mining are all forms of ASM in the region (Yaaba Baah-Ennumh and Ato Forson 2017). Gold processing is generally carried out on-site, with semi-mechanized production methods and the use of mercury to treat gold concentrate and on-site sale of gold to traders. Tailings are regularly shipped out for processing by industrial companies, who are able to achieve superior extraction rates compared to ASM. Artisanal gold mining has been present in Tarkwa for several decades, but tension between LSM and ASM has increased in recent years because of growing com-petition over gold-bearing land (Calys-Tagoe et al. 2015). This has led to conflict over concessions and increased illegal artisanal mining on large-scale mines, protected areas, and agricultural land because small-scale miners refuse to work in unprofitable land plots that the government allocates to them (Hilson and Potter 2005).
Tarkwa has been an area of significant conflict between illegal ASM and agricultural communities. Tenant farmers and landowners are readily bought off to allow miners to proceed, with the result that agricultural lands become permanently degraded and suitable only for marginal crops such as manioc rather than for more profitable cocoa plantations. Local people have had their land ceded to mining companies and lack of alternative livelihood leads many to illegal gold mining and processing gold from large-scale mine tailings (Obiri et al. 2018).
Surface mining in Tarkwa takes away land from agricultural use, decreasing agricultural production and reducing the fallow period from 10–15 years to 2–3 years, depleting the land further of nutrients (Hilson and Potter 2005). As agricultural concessions are lost to mining projects,
forests are converted to agriculture to meet demand. This causes substantial deforestation when combined with forests being converted to mining pits (Doso et al. 2015). A land use study noted that, between 1986 and 2002, surface mining (LSM and ASM) in the Western Region of Ghana resulted in forest loss of 58 percent of all forests within concession areas, and that the main areas affected were forest patches embedded within farmland (Schueler, Kuemmerle, and Schröder 2011).
The University of Mines and Technology (UMAT) in Tarkwa is promoting improved agricultural technology in association with alluvial gold mining. A feature of ASM is returning to the same area for repeat mining, which discourages investment in soil improvement and agriculture. If ASM methods were more efficient and could extract more gold, repeat mining could be avoided and land could be restored to plantation, safeguarding agricultural capital. UMAT proposes a system of intensive rotational quadrant mining and smart agriculture to maximize efficient value generation from land while assuring land reclamation and return to productive plantations once gold resources are exhausted.
ASM is often unregulated, and the mine sites found either to be exhausted or not to have economically viable deposits are not rehabilitated, leaving large exposed pits and making the land no longer suitable for other uses like agriculture. Opencast mining is most common, resulting in large pits, grading down of hills and removal of trees and vegetation (Yaaba Baah-Ennumh and Ato Forson 2017). Agricultural capital is further eroded in some areas because of the mercury contamination of soils. Pollution of water bodies by acid mine drainage and cyanide spillage from gold mining has been found to be a serious environmental concern for local residents.
Because of surmounting concerns over pollution, deforestation, and the informality of the sector, the Ghanaian government placed a blanket ban on small-scale mining in January 2017 that is still in place. Through the Ministerial Small-Scale Mining Office, the government has been running training on sustainable mining at UMAT in Tarkwa. An effort is also under way to provide alternative livelihood ventures for illegal miners who have been displaced by the ban.
Forest Health and Impacts
Analysis of recent satellite imagery suggests that alluvial ASM is widespread in the region. A representative section of approximately 778 hectares of ASM along the Ankobra River was chosen for this study, but the actual footprint of alluvial gold mining is larger than that (Figure 3-20). Analysis of spatial deforestation data from 2000–2016 reveals medium deforestation rates (14 percent) within
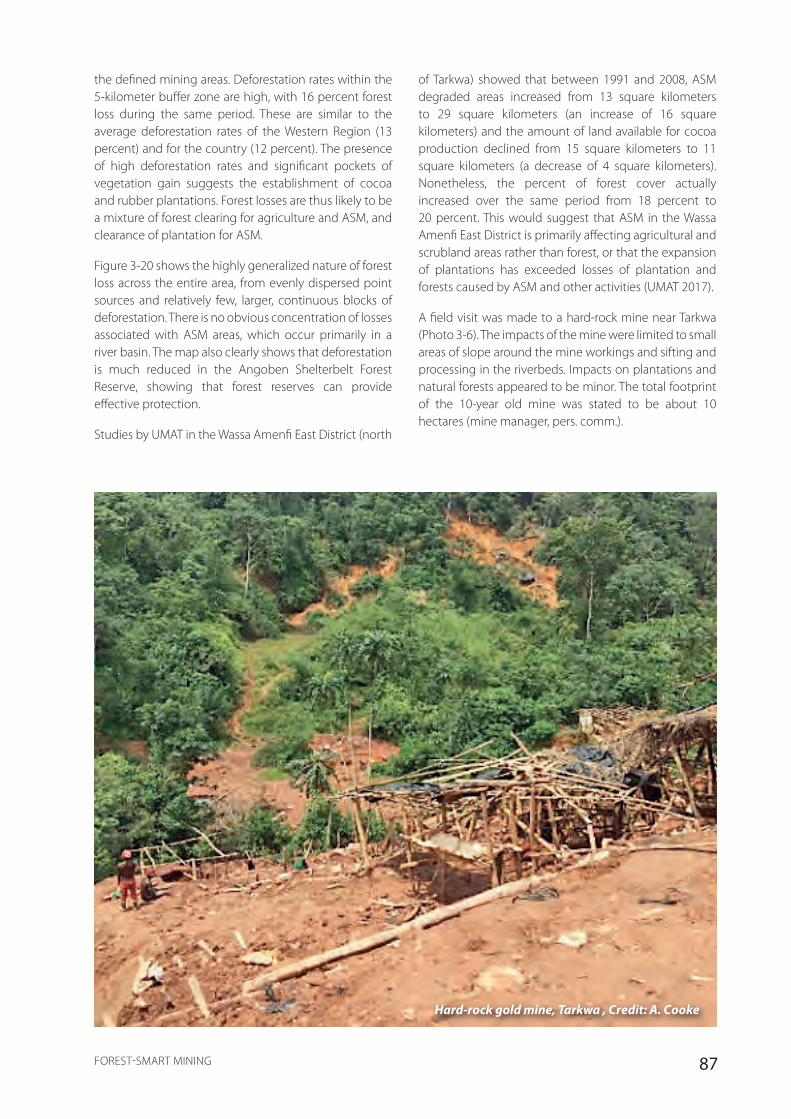
87FOREST-SMART MINING
the defined mining areas. Deforestation rates within the 5-kilometer buffer zone are high, with 16 percent forest loss during the same period. These are similar to the average deforestation rates of the Western Region (13 percent) and for the country (12 percent). The presence of high deforestation rates and significant pockets of vegetation gain suggests the establishment of cocoa and rubber plantations. Forest losses are thus likely to be a mixture of forest clearing for agriculture and ASM, and clearance of plantation for ASM.
Figure 3-20 shows the highly generalized nature of forest loss across the entire area, from evenly dispersed point sources and relatively few, larger, continuous blocks of deforestation. There is no obvious concentration of losses associated with ASM areas, which occur primarily in a river basin. The map also clearly shows that deforestation is much reduced in the Angoben Shelterbelt Forest Reserve, showing that forest reserves can provide effective protection.
Studies by UMAT in the Wassa Amenfi East District (north
of Tarkwa) showed that between 1991 and 2008, ASM degraded areas increased from 13 square kilometers to 29 square kilometers (an increase of 16 square kilometers) and the amount of land available for cocoa production declined from 15 square kilometers to 11 square kilometers (a decrease of 4 square kilometers). Nonetheless, the percent of forest cover actually increased over the same period from 18 percent to 20 percent. This would suggest that ASM in the Wassa Amenfi East District is primarily affecting agricultural and scrubland areas rather than forest, or that the expansion of plantations has exceeded losses of plantation and forests caused by ASM and other activities (UMAT 2017).
A field visit was made to a hard-rock mine near Tarkwa (Photo 3-6). The impacts of the mine were limited to small areas of slope around the mine workings and sifting and processing in the riverbeds. Impacts on plantations and natural forests appeared to be minor. The total footprint of the 10-year old mine was stated to be about 10 hectares (mine manager, pers. comm.).
Hard-rock gold mine, Tarkwa , Credit: A. Cooke

88 FOREST-SMART MINING
Figure 3-20 GIS Analysis of Deforestation and Proximity to Recognized Forest Resources in and around Tarkwa, 2000–2016

89FOREST-SMART MINING
Table 3-11 Forest Health Score of AOI around Tarkwa
Forest health score of AOI 0.279Rank 15/23
At a landscape level, the forest health in the Tarkwa area has a mid to low score. Significant deforestation has occurred since 2000 (Figure 3-21), with the strongest
Figure 3-21 Deforestation Trends for the AOI around Tarkwa, 2001–2014
negative driver of forest health being protected area deforestation. Forest connectivity was the strongest positive driver. Undesignated deforestation has shown marked increases over the period 2001–2014 (as was the case for the Atewa case study area. This suggests that deforestation in the Tarkwa area is in line with the common national trend and not significantly affected by ASM.
Conclusions
With Tarkwa being a key agricultural region, forests are under pressure by both ASM and agriculture, but agriculture is also threatened by mining-driven pollution. By incurring into plantations, mining is indirectly exacerbating deforestation as farmers who have been displaced by mining turn to forests for available land. The promotion of agroforestry, provided it is not at the expense of natural forests, provides an economic incentive for alternatives to conversion of land to ASM or to agriculture—provided it is backed up by regulatory protection and robust land tenure. Furthermore, payments for ecosystem services schemes could help to disincentivize conversion to mining, which promises higher returns for a piece of land.
Focusing alluvial mining in areas where there is already high forest loss because of agriculture, such as long
previously cleared river basins, can serve to reduce the effective forest impact of ASM. However, due to high rates of mercury contamination of agricultural land, this would need to be accompanied by strict requirements on mercury-free methods.
Effective rehabilitation and decontamination following mining should systematically be required for all ASM operations. Development of a national standard for rehabilitation could help encourage reforestation of mined-out lands. In parallel, incentives should be created to maximize gold extraction in any operation to avoid repeat mining. Access to improved technology and to industrial processing methods allows greater gold extraction for the same impact.
The fact that training and alternative livelihood schemes have begun in Tarkwa signifies some positive action on behalf of the government to take advantage of the mining ban during this time of uncertainty.

90 FOREST-SMART MINING
Lessons Learned
• ASM’s impacts on agriculture also need to be addressed—by degrading agricultural land, ASM can increase demand for new agricultural land and indirectly drive deforestation.
3.8. INDONESIA
Country Overview
World Bank development status Lower middle income
Indicators Year of dataGDP per capita, PPP (current international $) 11,632 2016GNI per capita, PPP (current international $) 11,240 2016% population living in poverty (<$1.90/day) 6.8 2016
Gini index (World Bank estimate) 39.5 2013% total unemployment of total labor force (ILO estimate) 5.6 2017Yale Environmental Performance Index 65.9 2016
Indonesia is a significant player in the global mining sector, particularly for copper, gold, tin, and nickel. As a contribution to national economic development, the sector has been falling in recent years in response to some legislative reforms, but it remains close to 5 percent of the national economy overall—6 percent of GDP comes from mining (Wacaster 2014)—and often represents the largest contributor to local government revenues in the areas where large projects are present or ASM is particularly prominent. Over the past two decades, the nation has become an Asian epicenter of artisanal mining. Of most prominence are the artisanal and small-scale cassiterite and gold sectors (EITI Indonesia 2015). Despite the size of the ASM sector and the provision for some licensed ASM operations, most miners in Indonesia operate informally, without the security of a license.
Indonesia is also one of the most important forested countries, with about half of the country still forested and millions of people directly reliant on forest resources (WRI 2017). However, these forest resources are declining fast, with Indonesia having some of the highest deforestation rates in the world and deforestation estimated to be
one of the major contributors to Indonesia’s greenhouse gas emissions (GFW 2017a). Mining is not perceived as a major driver of deforestation at a national level given the high rates of deforestation caused by extensive agricultural industries such as palm oil and rubber, but it can have significant local impacts and does occur in protected forests in some places.
The regulatory environment in Indonesia is complex, with many strong laws, but also various over-lapping and contradictory legislations, a lack of a centralized land registry, and varying levels of enforcement and corruption. Government is increasingly decentralized, with important institutions at the national, provincial, and district levels. District government provides most of the services, but some issues, including mining and forests, are still largely controlled centrally. Main governmental efforts with regards to formalization of the artisanal sector have focused on mercury eradication, given the severity of mercury pollution in many of Indonesia’s gold mining areas. Other governmental and nongovernmental efforts have also partly addressed the allocation of more People’s Mining Areas, evicting
• Mining is more profitable than agriculture or forestry in the short term. The incentive to convert forest or crop land to mining needs to be countered through payments for ecosystem services, value-add agroforestry techniques, or other financial methods.
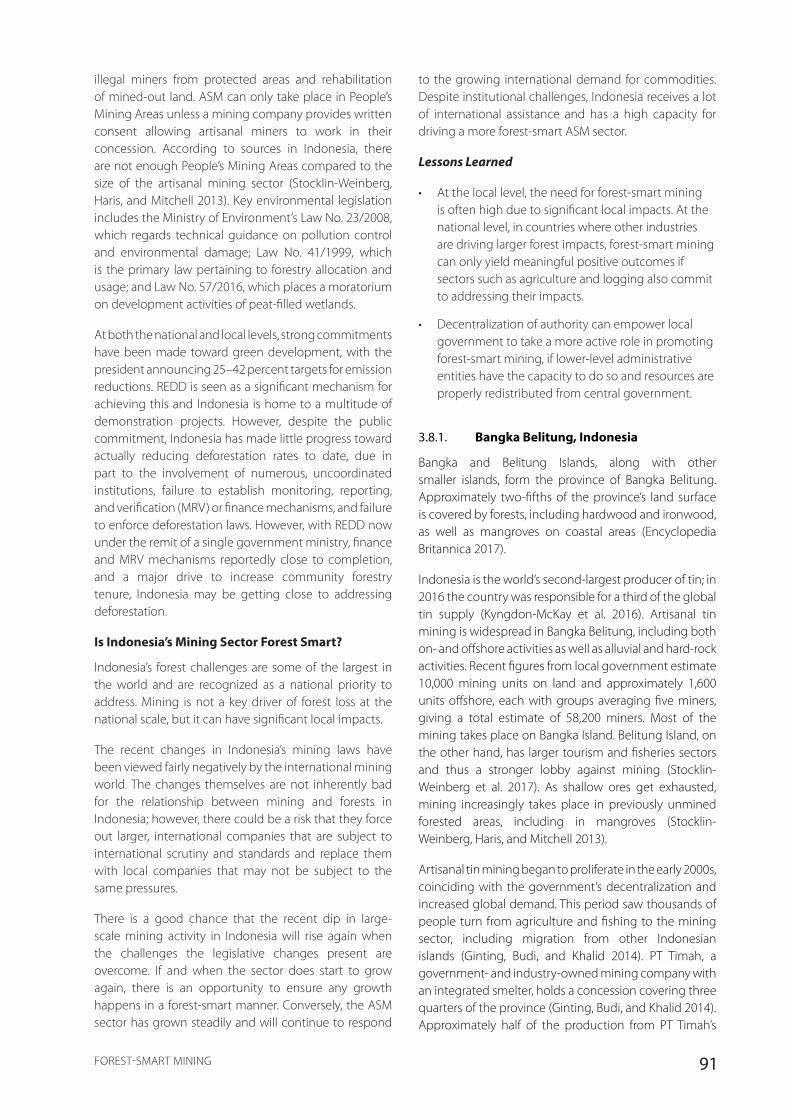
91FOREST-SMART MINING
illegal miners from protected areas and rehabilitation of mined-out land. ASM can only take place in People’s Mining Areas unless a mining company provides written consent allowing artisanal miners to work in their concession. According to sources in Indonesia, there are not enough People’s Mining Areas compared to the size of the artisanal mining sector (Stocklin-Weinberg, Haris, and Mitchell 2013). Key environmental legislation includes the Ministry of Environment’s Law No. 23/2008, which regards technical guidance on pollution control and environmental damage; Law No. 41/1999, which is the primary law pertaining to forestry allocation and usage; and Law No. 57/2016, which places a moratorium on development activities of peat-filled wetlands.
At both the national and local levels, strong commitments have been made toward green development, with the president announcing 25–42 percent targets for emission reductions. REDD is seen as a significant mechanism for achieving this and Indonesia is home to a multitude of demonstration projects. However, despite the public commitment, Indonesia has made little progress toward actually reducing deforestation rates to date, due in part to the involvement of numerous, uncoordinated institutions, failure to establish monitoring, reporting, and verification (MRV) or finance mechanisms, and failure to enforce deforestation laws. However, with REDD now under the remit of a single government ministry, finance and MRV mechanisms reportedly close to completion, and a major drive to increase community forestry tenure, Indonesia may be getting close to addressing deforestation.
Is Indonesia’s Mining Sector Forest Smart?
Indonesia’s forest challenges are some of the largest in the world and are recognized as a national priority to address. Mining is not a key driver of forest loss at the national scale, but it can have significant local impacts.
The recent changes in Indonesia’s mining laws have been viewed fairly negatively by the international mining world. The changes themselves are not inherently bad for the relationship between mining and forests in Indonesia; however, there could be a risk that they force out larger, international companies that are subject to international scrutiny and standards and replace them with local companies that may not be subject to the same pressures.
There is a good chance that the recent dip in large-scale mining activity in Indonesia will rise again when the challenges the legislative changes present are overcome. If and when the sector does start to grow again, there is an opportunity to ensure any growth happens in a forest-smart manner. Conversely, the ASM sector has grown steadily and will continue to respond
to the growing international demand for commodities. Despite institutional challenges, Indonesia receives a lot of international assistance and has a high capacity for driving a more forest-smart ASM sector.
Lessons Learned
• At the local level, the need for forest-smart mining is often high due to significant local impacts. At the national level, in countries where other industries are driving larger forest impacts, forest-smart mining can only yield meaningful positive outcomes if sectors such as agriculture and logging also commit to addressing their impacts.
• Decentralization of authority can empower local government to take a more active role in promoting forest-smart mining, if lower-level administrative entities have the capacity to do so and resources are properly redistributed from central government.
3.8.1. Bangka Belitung, Indonesia
Bangka and Belitung Islands, along with other smaller islands, form the province of Bangka Belitung. Approximately two-fifths of the province’s land surface is covered by forests, including hardwood and ironwood, as well as mangroves on coastal areas (Encyclopedia Britannica 2017).
Indonesia is the world’s second-largest producer of tin; in 2016 the country was responsible for a third of the global tin supply (Kyngdon-McKay et al. 2016). Artisanal tin mining is widespread in Bangka Belitung, including both on- and offshore activities as well as alluvial and hard-rock activities. Recent figures from local government estimate 10,000 mining units on land and approximately 1,600 units offshore, each with groups averaging five miners, giving a total estimate of 58,200 miners. Most of the mining takes place on Bangka Island. Belitung Island, on the other hand, has larger tourism and fisheries sectors and thus a stronger lobby against mining (Stocklin-Weinberg et al. 2017). As shallow ores get exhausted, mining increasingly takes place in previously unmined forested areas, including in mangroves (Stocklin-Weinberg, Haris, and Mitchell 2013).
Artisanal tin mining began to proliferate in the early 2000s, coinciding with the government’s decentralization and increased global demand. This period saw thousands of people turn from agriculture and fishing to the mining sector, including migration from other Indonesian islands (Ginting, Budi, and Khalid 2014). PT Timah, a government- and industry-owned mining company with an integrated smelter, holds a concession covering three quarters of the province (Ginting, Budi, and Khalid 2014). Approximately half of the production from PT Timah’s
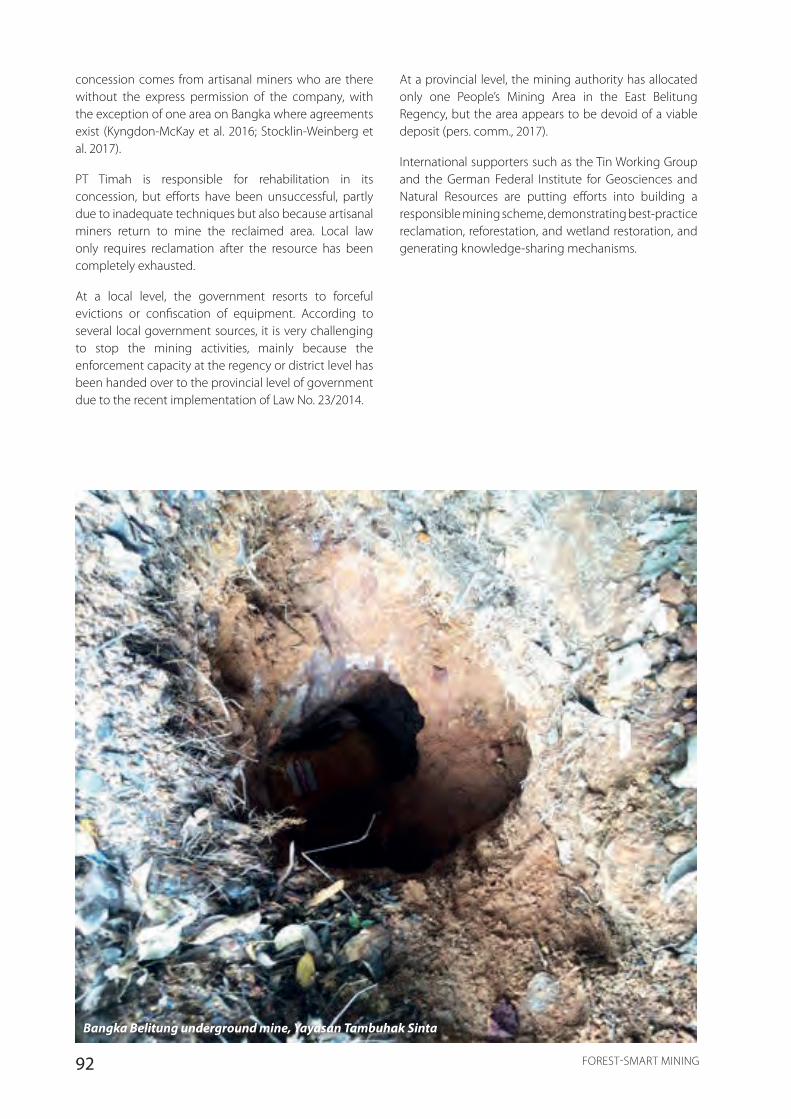
92 FOREST-SMART MINING
concession comes from artisanal miners who are there without the express permission of the company, with the exception of one area on Bangka where agreements exist (Kyngdon-McKay et al. 2016; Stocklin-Weinberg et al. 2017).
PT Timah is responsible for rehabilitation in its concession, but efforts have been unsuccessful, partly due to inadequate techniques but also because artisanal miners return to mine the reclaimed area. Local law only requires reclamation after the resource has been completely exhausted.
At a local level, the government resorts to forceful evictions or confiscation of equipment. According to several local government sources, it is very challenging to stop the mining activities, mainly because the enforcement capacity at the regency or district level has been handed over to the provincial level of government due to the recent implementation of Law No. 23/2014.
At a provincial level, the mining authority has allocated only one People’s Mining Area in the East Belitung Regency, but the area appears to be devoid of a viable deposit (pers. comm., 2017).
International supporters such as the Tin Working Group and the German Federal Institute for Geosciences and Natural Resources are putting efforts into building a responsible mining scheme, demonstrating best-practice reclamation, reforestation, and wetland restoration, and generating knowledge-sharing mechanisms.
Bangka Belitung underground mine, Yayasan Tambuhak Sinta
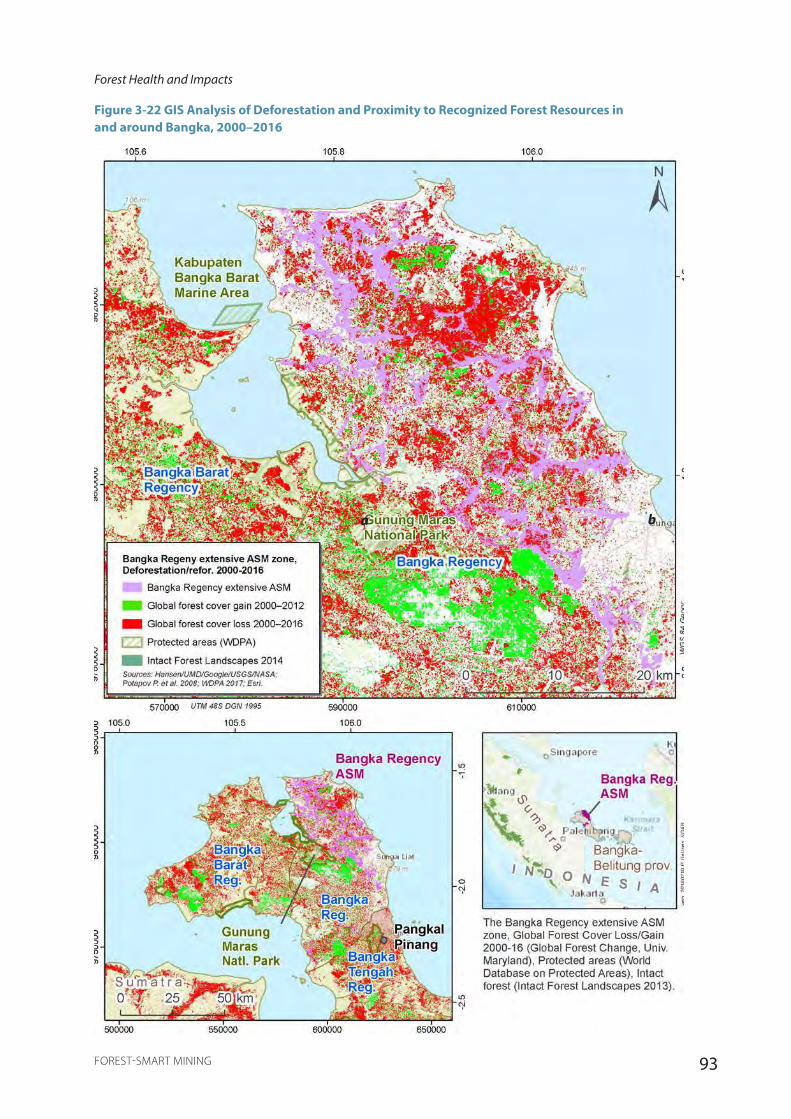
93FOREST-SMART MINING
Forest Health and Impacts
Figure 3-22 GIS Analysis of Deforestation and Proximity to Recognized Forest Resources in and around Bangka, 2000–2016
ba
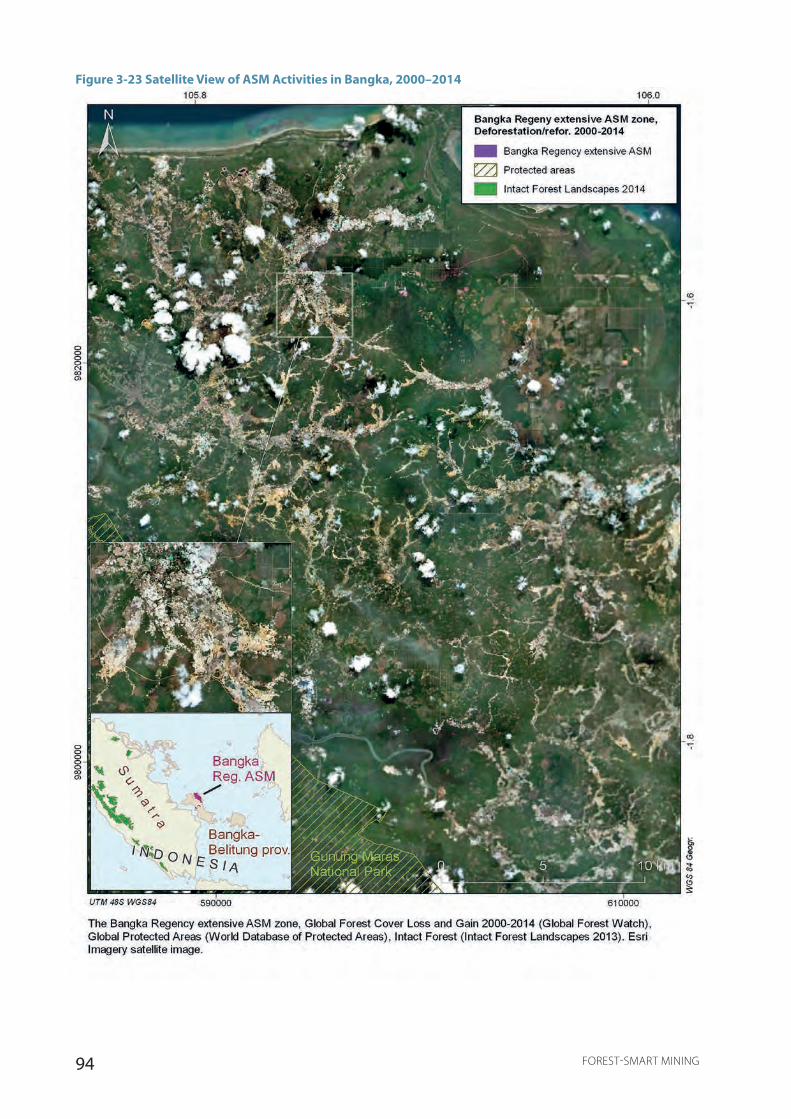
94 FOREST-SMART MINING
Figure 3-23 Satellite View of ASM Activities in Bangka, 2000–2014
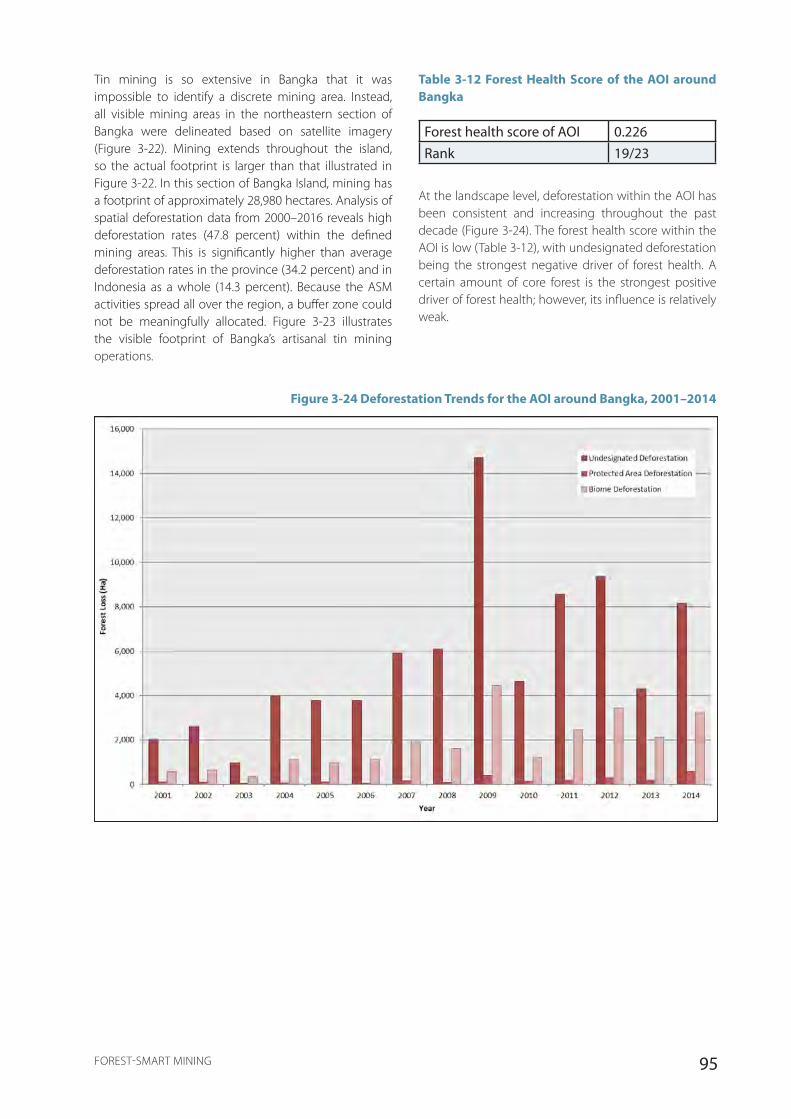
95FOREST-SMART MINING
Tin mining is so extensive in Bangka that it was impossible to identify a discrete mining area. Instead, all visible mining areas in the northeastern section of Bangka were delineated based on satellite imagery (Figure 3-22). Mining extends throughout the island, so the actual footprint is larger than that illustrated in Figure 3-22. In this section of Bangka Island, mining has a footprint of approximately 28,980 hectares. Analysis of spatial deforestation data from 2000–2016 reveals high deforestation rates (47.8 percent) within the defined mining areas. This is significantly higher than average deforestation rates in the province (34.2 percent) and in Indonesia as a whole (14.3 percent). Because the ASM activities spread all over the region, a buffer zone could not be meaningfully allocated. Figure 3-23 illustrates the visible footprint of Bangka’s artisanal tin mining operations.
Table 3-12 Forest Health Score of the AOI around Bangka
Forest health score of AOI 0.226Rank 19/23
At the landscape level, deforestation within the AOI has been consistent and increasing throughout the past decade (Figure 3-24). The forest health score within the AOI is low (Table 3-12), with undesignated deforestation being the strongest negative driver of forest health. A certain amount of core forest is the strongest positive driver of forest health; however, its influence is relatively weak.
Figure 3-24 Deforestation Trends for the AOI around Bangka, 2001–2014

96 FOREST-SMART MINING
According to the Ministry of Environment and Forestry, extensive mining activities take place in forest areas, including conservation forests (seven companies) protected forests (44 companies), and production forests (70 companies), despite it being illegal to mine in conservation forests (cited in Ginting et al. 2014). As of 2017, however, that number has decreased, with the ministry confirming that 22 mining licenses have been granted in forest areas. Recent figures from the Ministry of Environment and Forestry estimate that over 220,000 hectares of critical land have been impacted in some way by mining activities. Other land uses, particularly agricultural activities such as palm oil, are likely to also significantly contribute to forest degradation.
Conclusions
ASM activities in Bangka Belitung have been proliferating since the early 2000s, drawing tens of thousands of miners to the region. Mining is clearly a major disturbance of forest health and has a spread over an area uncharacteristically large for ASM. While extensive agriculture is also likely to be contributing equally or more significantly to forest loss, the mining sector also contributes to other serious social and environmental issues (UNITAR 2016).
The legislation of the mining sector in Indonesia does not adequately account for the artisanal mining sector. Although there are regulations around mining taking place in forest areas, these are rarely enforced, or they are unclear. Moreover, weak governance and a lack of transparency is a significant barrier for forest-smart mining.
Bangka Belitung is, therefore, an example of how regulatory, capacity, and transparency barriers affect forest health when in combination with a population base prone to the pull factors of ASM and an extensive geology of high-value and accessible deposits.
Serious commitments by authorities to clarify the laws should be a first priority and local governments should have the mandate to monitor and enforce the law, particularly for rehabilitation to be possible. Moreover, in Bangka Belitung, legal mining should be made feasible by allocating more and more viable People’s Mining Areas (one more is in the process of being designated).
Lessons Learned
• ASM can have high forest impacts if geological, social, and institutional factors create unfavorable conditions for forest-smart mining: dispersed and accessible high-value deposits, a population base willing to migrate for prospects in ASM, inadequate
b
legislations for the ASM sector, and low capacity for enforcement and monitoring.
• In such areas where ASM has already caused extensive impacts, rehabilitation should be a priority and the government must assume the responsibility for this as well as for ensuring that areas are not re-mined.
3.8.2. Central Kalimantan, Indonesia
The province of Central Kalimantan forms part of the three-nation region called Borneo, which is home to one of the world’s largest transboundary rain forests (WWF 2017). There are three bio-physical regions in Central Kalimantan: southern coastal mangroves and inland swamps; central plains and hills, much of which has been cleared for agriculture; and northern hills and mountains, whose forests remain generally intact (CIFOR 2015). Central Kalimantan contains 3 million hectares of tropical peatlands, which is 8 percent of the world’s total (CIFOR 2015). It is the pilot province of the REDD+ program.
Mining in Central Kalimantan accounts for 25 percent of the provincial annual GDP, and palm oil holds a similarly important place in the provincial economy (26 percent of GDP). According to Stapper (2011), there were approximately 43,000 artisanal gold miners working in Central Kalimantan, producing 13.3 tonnes of gold annually in both alluvial and hard-rock mining. Most of the artisanal mining sector operates informally and only around 5 percent of miners work in legal mining areas. Forms of permission range from official licenses to mine in a designated People’s Mining Area to customary permits handed over by local village cooperatives (Chairil 2006). Excavation and extraction equipment such as dredges, dredge-sluice combinations, suction pipes, and buckets are in use (UNITAR 2016). Mineral processing is done in a central facility and includes the use of mercury and, sometimes, mercury-treated tailings are then leached with cyanide (Telmer and Stapper 2007).
Central Kalimantan has a long history of gold mining, as artisanal mining has taken place since the 18th century and it is the largest artisanal gold mining area in Indonesia (WWF 2011; Nainggolan 2015). It experienced a rush of 10,000 miners in the late 1990s (Sulaiman 2007). Miners are native to the area, working in family groupings with paid workers who are either from the province or have migrated from another part of the country (Stapper 2011). Workers usually pay an “investor,” who then provides them with financing for equipment and supplies. The payment of bribes or entrance fees to the landowner or individual members of the police is a frequent occurrence (Spiegel 2011).
According to Spiegel (2011), the government is

97FOREST-SMART MINING
ambivalent about what approach to take when it comes to Central Kalimantan’s informal artisanal mining sector. Overall, however, police crack-downs on miners seem to be the most common approach.
The decentralization reforms of Indonesia have given districts (lower level) greater jurisdiction over land use than provinces (higher level). This has led to an issue of disputed forest zones such as the riparian forests of Central Kalimantan, where the two levels of government disagree over which has jurisdiction. A presidential instruction in 2013 designated these contested zones as “Holding Zones” so that the formulation of spatial plans for the rest of the area can proceed while the matter is resolved (Gnych et al. 2014).
In comparison to little governmental effort, NGOs and international organizations in Central Kalimantan have focused on mercury reduction. In the first decade of the 2000s, Central Kalimantan was one of the target areas of the UNDP-UNIDO-GEF Global Mercury Project (Sulaiman 2007). Between 2011 and 2015, the United Nations Environment Programme (UNEP) sponsored
a program of direct intervention, aimed at lowering the level of mercury used by gold processors and subsequent emissions from burning mercury amalgam by introducing retorts and conducting awareness-raising campaigns (Agrawal 2015).
Forest Health and Impacts
ASM activities are concentrated in several areas of Central Kalimantan; Kahayan has been chosen as sample area for this analysis, covering 13,971 hectares (Figures 3-25, 3-26, and 3-27). Deforestation within the estimated mining area is high, with 5,499 hectares (45.3 percent of mining area) lost between 2000 and 2016. Deforestation in the wider area within a 5-kilometer radius is also high, with 10,302 hectares of forest (19.8 percent of the 5-kilometer buffer area) lost between 2000 and 2016. Deforestation within the 5-kilometer buffer is higher than average deforestation rates in Indonesia as a whole (14.3 percent), but lower than Central Kalimantan deforestation rates (21.4 percent) over the same period of time.
Kalimantan ball mills Yayasan Tambuhak Sinta

98 FOREST-SMART MINING
Kalimantan open pit miningCredit: Yayasan Tambuhak Sinta
Bangka Belitung open pit miningCredit: Yayasan Tambuhak Sinta
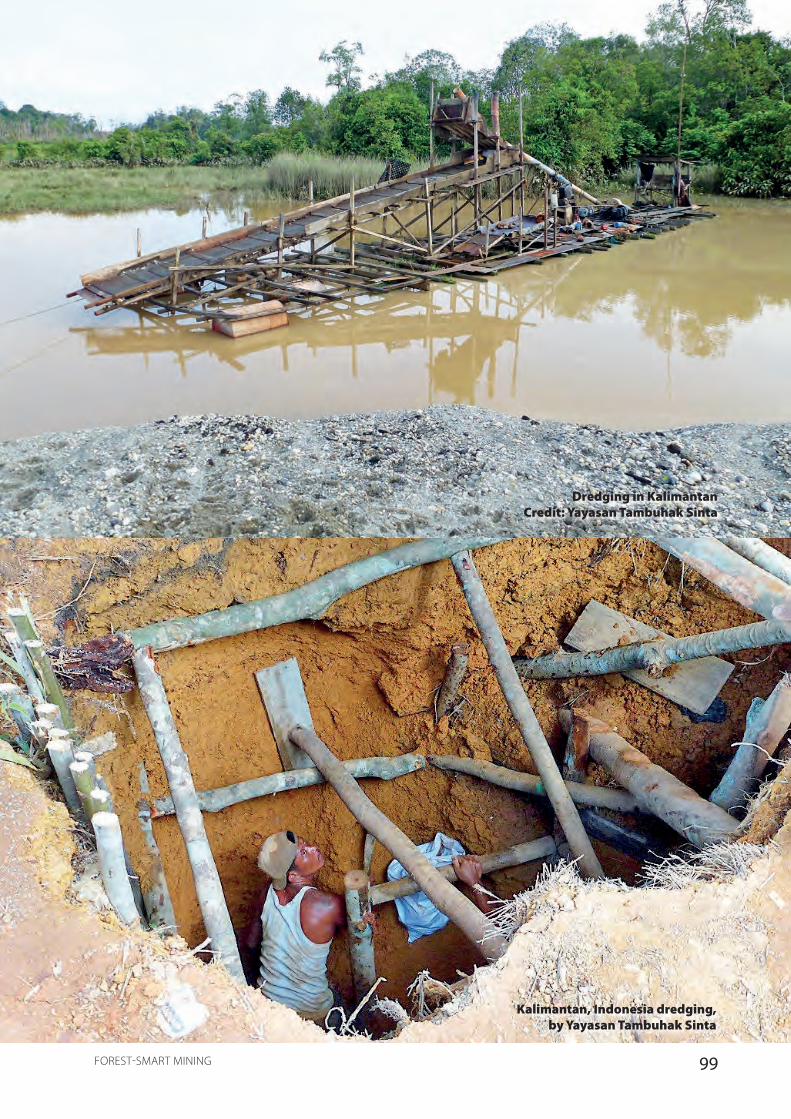
99FOREST-SMART MINING
Underground mine in KalimantanPhotograph: Yayasan Tamuhak Sinta
Dredging in KalimantanCredit: Yayasan Tambuhak Sinta
Kalimantan, Indonesia dredging, by Yayasan Tambuhak Sinta
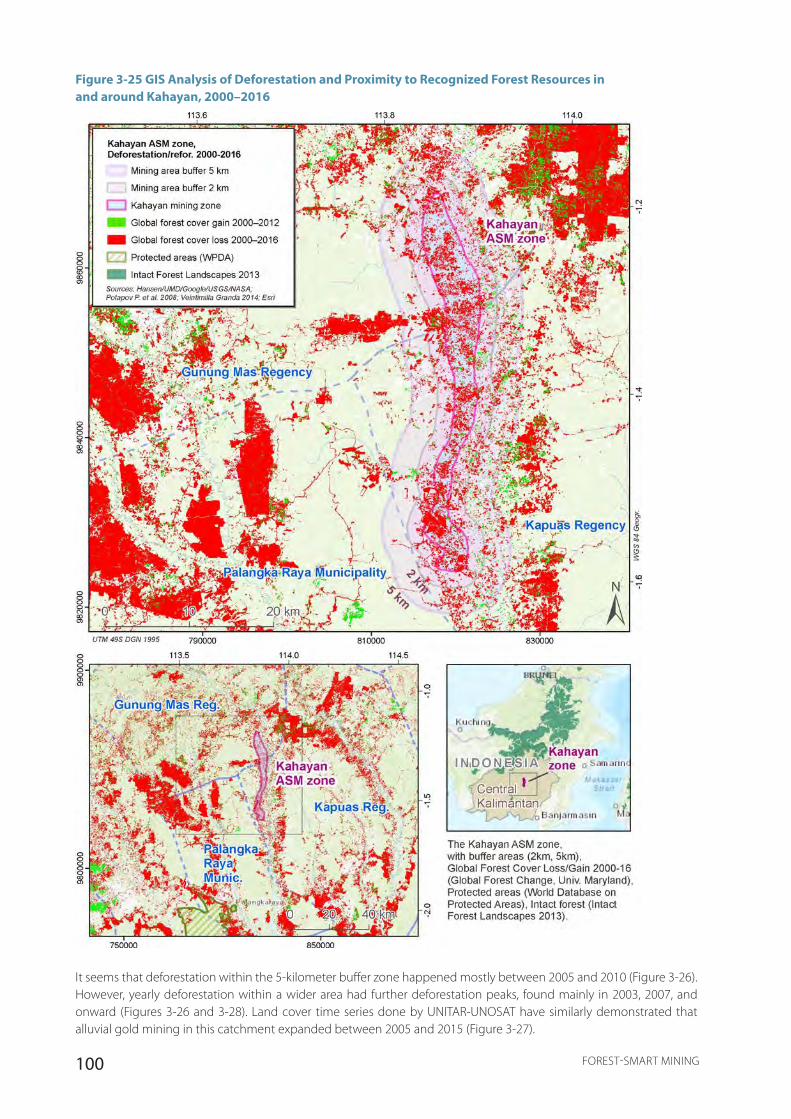
100 FOREST-SMART MINING
Figure 3-25 GIS Analysis of Deforestation and Proximity to Recognized Forest Resources in and around Kahayan, 2000–2016
It seems that deforestation within the 5-kilometer buffer zone happened mostly between 2005 and 2010 (Figure 3-26). However, yearly deforestation within a wider area had further deforestation peaks, found mainly in 2003, 2007, and onward (Figures 3-26 and 3-28). Land cover time series done by UNITAR-UNOSAT have similarly demonstrated that alluvial gold mining in this catchment expanded between 2005 and 2015 (Figure 3-27).
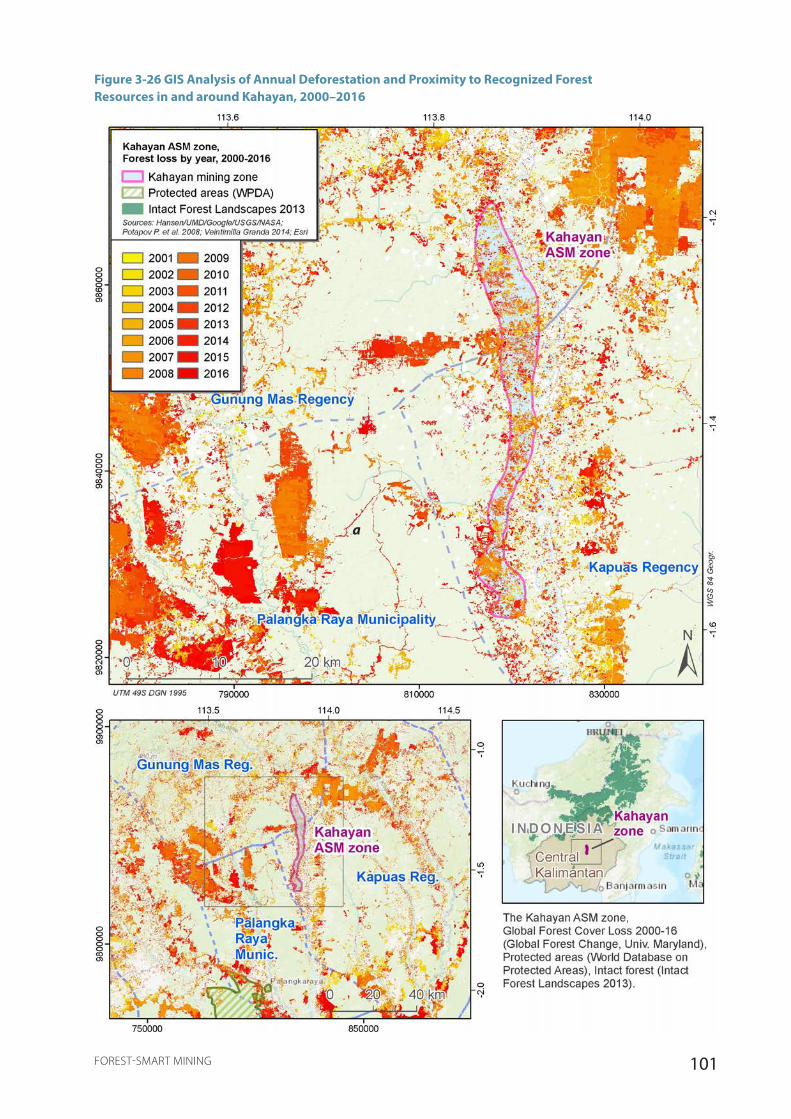
101FOREST-SMART MINING
Figure 3-26 GIS Analysis of Annual Deforestation and Proximity to Recognized Forest Resources in and around Kahayan, 2000–2016
a
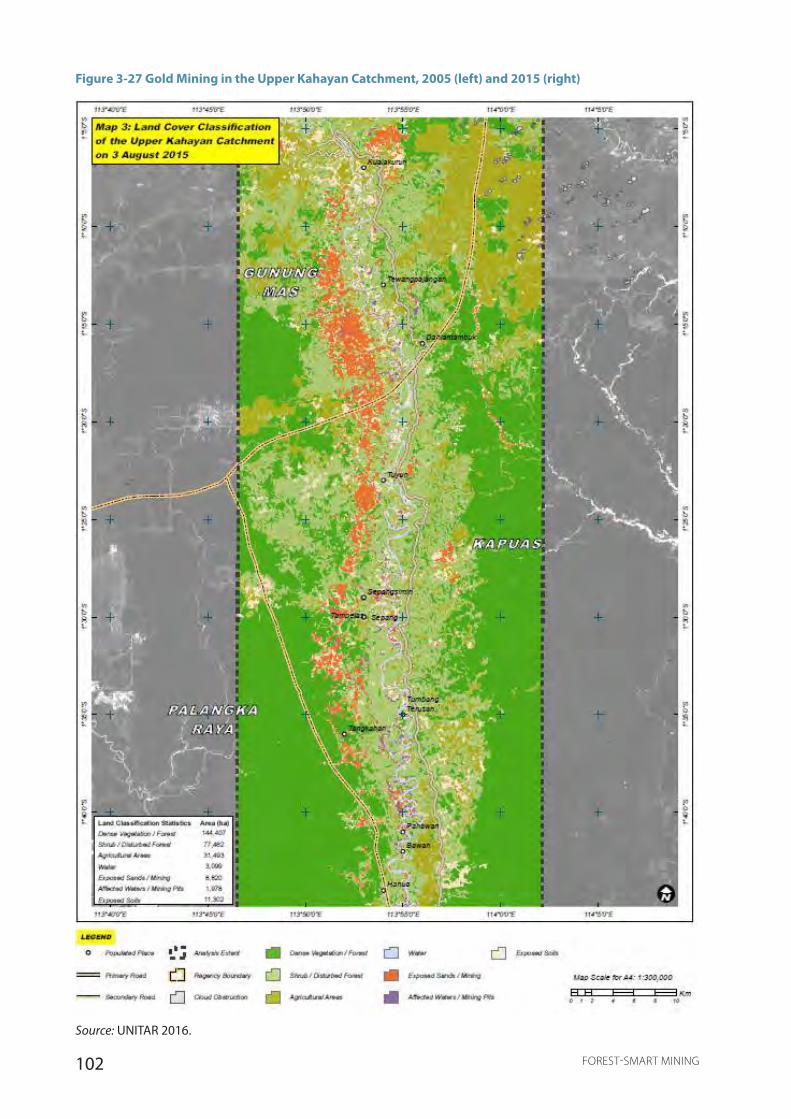
102 FOREST-SMART MINING
Figure 3-27 Gold Mining in the Upper Kahayan Catchment, 2005 (left) and 2015 (right)
Source: UNITAR 2016.

103FOREST-SMART MINING
Source: UNITAR 2016.
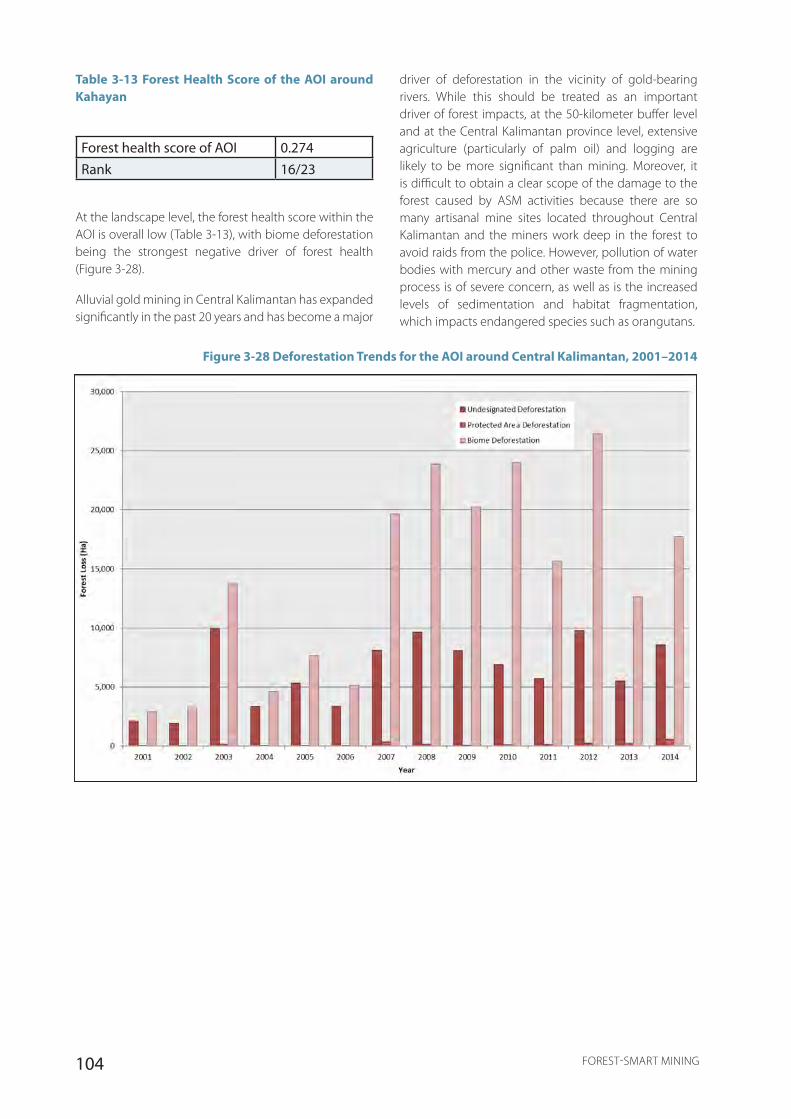
104 FOREST-SMART MINING
Table 3-13 Forest Health Score of the AOI around Kahayan
Forest health score of AOI 0.274Rank 16/23
At the landscape level, the forest health score within the AOI is overall low (Table 3-13), with biome deforestation being the strongest negative driver of forest health (Figure 3-28).
Alluvial gold mining in Central Kalimantan has expanded significantly in the past 20 years and has become a major
driver of deforestation in the vicinity of gold-bearing rivers. While this should be treated as an important driver of forest impacts, at the 50-kilometer buffer level and at the Central Kalimantan province level, extensive agriculture (particularly of palm oil) and logging are likely to be more significant than mining. Moreover, it is difficult to obtain a clear scope of the damage to the forest caused by ASM activities because there are so many artisanal mine sites located throughout Central Kalimantan and the miners work deep in the forest to avoid raids from the police. However, pollution of water bodies with mercury and other waste from the mining process is of severe concern, as well as is the increased levels of sedimentation and habitat fragmentation, which impacts endangered species such as orangutans.
Figure 3-28 Deforestation Trends for the AOI around Central Kalimantan, 2001–2014
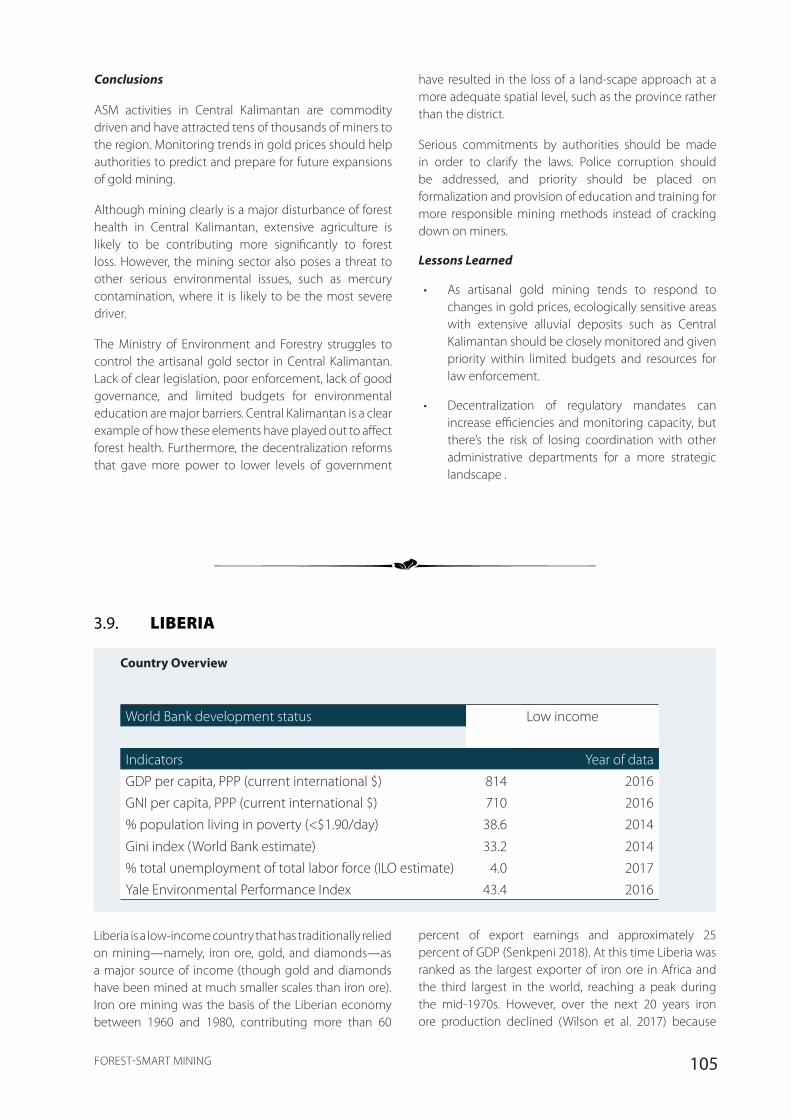
105FOREST-SMART MINING
Conclusions
ASM activities in Central Kalimantan are commodity driven and have attracted tens of thousands of miners to the region. Monitoring trends in gold prices should help authorities to predict and prepare for future expansions of gold mining.
Although mining clearly is a major disturbance of forest health in Central Kalimantan, extensive agriculture is likely to be contributing more significantly to forest loss. However, the mining sector also poses a threat to other serious environmental issues, such as mercury contamination, where it is likely to be the most severe driver.
The Ministry of Environment and Forestry struggles to control the artisanal gold sector in Central Kalimantan. Lack of clear legislation, poor enforcement, lack of good governance, and limited budgets for environmental education are major barriers. Central Kalimantan is a clear example of how these elements have played out to affect forest health. Furthermore, the decentralization reforms that gave more power to lower levels of government
have resulted in the loss of a land-scape approach at a more adequate spatial level, such as the province rather than the district.
Serious commitments by authorities should be made in order to clarify the laws. Police corruption should be addressed, and priority should be placed on formalization and provision of education and training for more responsible mining methods instead of cracking down on miners.
Lessons Learned
• As artisanal gold mining tends to respond to changes in gold prices, ecologically sensitive areas with extensive alluvial deposits such as Central Kalimantan should be closely monitored and given priority within limited budgets and resources for law enforcement.
• Decentralization of regulatory mandates can increase efficiencies and monitoring capacity, but there’s the risk of losing coordination with other administrative departments for a more strategic landscape .
3.9. LIBERIA
Country Overview
World Bank development status Low income
Indicators Year of dataGDP per capita, PPP (current international $) 814 2016GNI per capita, PPP (current international $) 710 2016% population living in poverty (<$1.90/day) 38.6 2014
Gini index (World Bank estimate) 33.2 2014% total unemployment of total labor force (ILO estimate) 4.0 2017Yale Environmental Performance Index 43.4 2016
Liberia is a low-income country that has traditionally relied on mining—namely, iron ore, gold, and diamonds—as a major source of income (though gold and diamonds have been mined at much smaller scales than iron ore). Iron ore mining was the basis of the Liberian economy between 1960 and 1980, contributing more than 60
percent of export earnings and approximately 25 percent of GDP (Senkpeni 2018). At this time Liberia was ranked as the largest exporter of iron ore in Africa and the third largest in the world, reaching a peak during the mid-1970s. However, over the next 20 years iron ore production declined (Wilson et al. 2017) because
106 FOREST-SMART MINING
of the diminished quality of the mineral resources and a weaker market. Coupled with the civil war of 1989–1996, which destroyed much of the country’s productive infrastructure, mining took a drastic downturn and the last operating iron ore mine closed in 1992.
After the end of the second civil war (1999–2003), revival of the mining industry became an explicit government objective in its efforts to reconstruct the country and to underpin growth, attracting $7.6 billion of foreign investment, contributing to 58 percent of government revenues (2016) (BGS 2018) and creating about 10,000 jobs (1.6 percent of Liberia’s total employment) (Moore Stephens LLP and Parker & Associates Inc. 2016). But ASM, which is not accounted for in employment statistics, is thought to contribute more than five times as many jobs. ASM accounts for over 88 percent of the total number of mining operations in the country, and LSM for less than 1 percent (5 percent are medium-size companies, and 6 percent exploration companies). The ASM sector for gold and diamonds in Liberia involves as many as an estimated 100,000 artisanal miners, and the sector remains largely underregulated and informal (World Bank 2018a).
Liberia’s forests are a global hotspot for biodiversity, covering approximately 43 percent of the land area. It contains approximately 40 percent of the remaining moist forests of the Upper Guinea region—one of the most threatened and least-protected forest ecosystems in the world—as well as many Key Biodiversity Areas, Important Bird Areas, Ramsar Sites and Alliance for Zero Extinction sites. Deforestation of around 4 percent has occurred over the past decade (though these data do not distinguish plantations from natural forest), with key drivers of deforestation being shifting cultivation, charcoal production, logging, industrial oil and rubber plantations, and mining. As well as supporting very high levels of biodiversity, these forests provide a wide range of ecosystem services, including bushmeat, medicines, and construction materials, and much of Liberia’s rural population is heavily dependent on forests for their livelihoods and ecosystem services. Key forest legislation includes the National Forestry Reform Law (2006), which is the current legal instrument that guides the management of forest resources in Liberia; the Community Rights Law of 2009, which defines and supports community rights in the management and use of forest resources; and the new Land Rights Law (2018), which recognizes customary land rights. Under the framework of these three laws, a variety of different permits and concessions types have been developed, dependent on the ownership and type of land, and the resources to be extracted. The National Forestry Reform Law also removes forest resources from forested land, by stating that all forest resources in Liberia are the property of the republic (apart from communal forests and
artificially generated forests on private land). Though this does not give the government ownership of the forested land itself, it allows the government or those to whom it has sold use permits to exploit forest resources regardless of the legal or customary landowners’ wishes. This gap has now been addressed by the new Land Rights Law, which recognizes customary land rights as equal to private ownership and is thought to help prevent the uprooting of communities by foreign mining companies. The implementation of the Land Rights Law, however, is seen to be difficult (Peyton 2018).
The Ministry of Lands, Mines and Energy is responsible for the administration of the mineral sector, including granting mining licenses, and it has statutory oversight of the sector. The minerals sector is regulated by the Mining and Minerals Law of 2000, though a new Minerals and Mining Law has been drafted (still under review) that aims to improve the investment climate and industry regulation. However, while there are regulations in place, the adoption of environmental management tools such as EIAs is lacking; therefore, the pressure on the environment from mining is still heavy. Furthermore, the administration of land in Liberia is hindered by the absence of a national land registry and by unclear and outdated land laws, and what constitutes public land continues to be unclear. A review of land rights and laws was undertaken in 2013 and the Land Rights Policy was published in 2018; implementation of the policy could change the quantity and location of land owned by the government, and thus the amount of land available for allocation as concessions.
Lack of a national land use plan in Liberia and poor coordination between sectors, with the forestry, agriculture, and mining sectors largely operating independently of each other, has resulted in significant overlaps in the allocation of concessions, with concessions also being issued on community forest lands and protected forests. In an attempt to overcome this issue, in 2016 the government released a National Concession Portal, which demarcates active commercial concessions and forested areas on a map. It is hoped that this Mineral Cadastre System will help to improve transparency and land use planning of future concessions. Furthermore, the formalization of the ASM sector in accordance to a regulatory road map for the ASM sector, which was developed in 2016, has been gaining traction with the recent creation of Liberia’s first artisanal diamond miner cooperatives. Immediate technical training provided to the cooperatives is expected to focus on environmental standards.
Key government institutions are the Forestry Development Authority (FDA), responsible for managing the forest resources of Liberia and establish and maintain
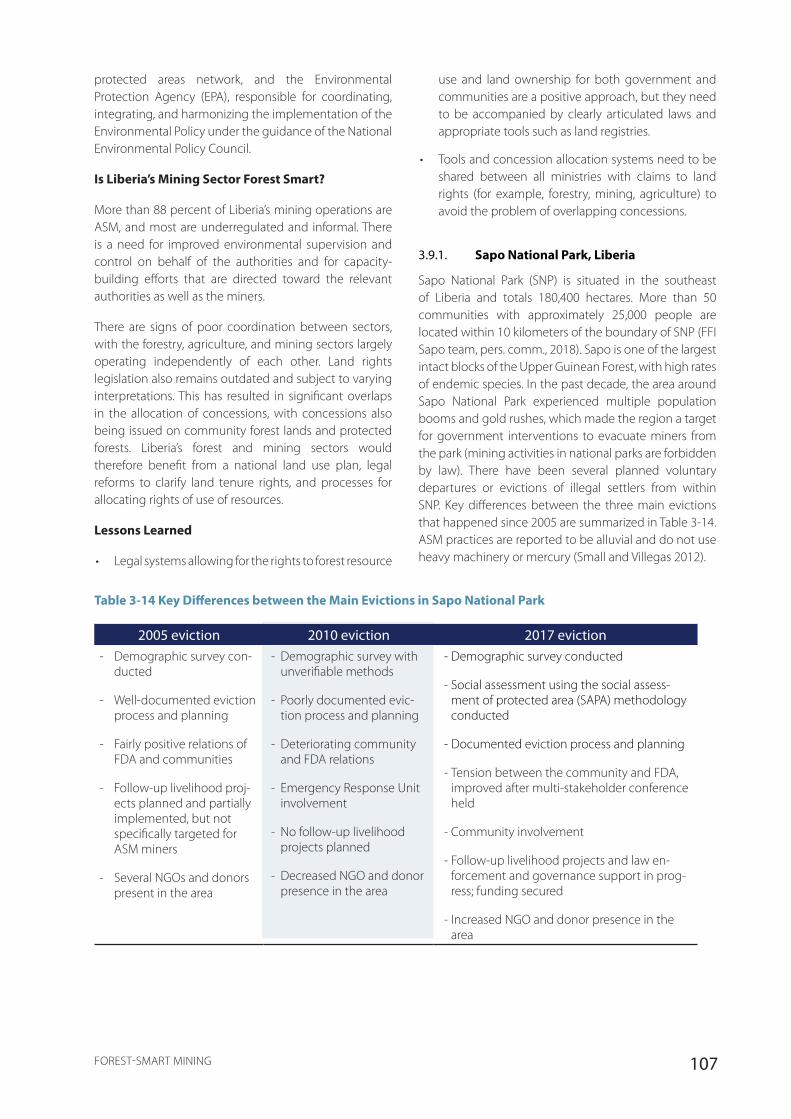
107FOREST-SMART MINING
protected areas network, and the Environmental Protection Agency (EPA), responsible for coordinating, integrating, and harmonizing the implementation of the Environmental Policy under the guidance of the National Environmental Policy Council.
Is Liberia’s Mining Sector Forest Smart?
More than 88 percent of Liberia’s mining operations are ASM, and most are underregulated and informal. There is a need for improved environmental supervision and control on behalf of the authorities and for capacity-building efforts that are directed toward the relevant authorities as well as the miners.
There are signs of poor coordination between sectors, with the forestry, agriculture, and mining sectors largely operating independently of each other. Land rights legislation also remains outdated and subject to varying interpretations. This has resulted in significant overlaps in the allocation of concessions, with concessions also being issued on community forest lands and protected forests. Liberia’s forest and mining sectors would therefore benefit from a national land use plan, legal reforms to clarify land tenure rights, and processes for allocating rights of use of resources.
Lessons Learned
• Legal systems allowing for the rights to forest resource
use and land ownership for both government and communities are a positive approach, but they need to be accompanied by clearly articulated laws and appropriate tools such as land registries.
• Tools and concession allocation systems need to be shared between all ministries with claims to land rights (for example, forestry, mining, agriculture) to avoid the problem of overlapping concessions.
3.9.1. Sapo National Park, Liberia
Sapo National Park (SNP) is situated in the southeast of Liberia and totals 180,400 hectares. More than 50 communities with approximately 25,000 people are located within 10 kilometers of the boundary of SNP (FFI Sapo team, pers. comm., 2018). Sapo is one of the largest intact blocks of the Upper Guinean Forest, with high rates of endemic species. In the past decade, the area around Sapo National Park experienced multiple population booms and gold rushes, which made the region a target for government interventions to evacuate miners from the park (mining activities in national parks are forbidden by law). There have been several planned voluntary departures or evictions of illegal settlers from within SNP. Key differences between the three main evictions that happened since 2005 are summarized in Table 3-14. ASM practices are reported to be alluvial and do not use heavy machinery or mercury (Small and Villegas 2012).
Table 3-14 Key Differences between the Main Evictions in Sapo National Park
2005 eviction 2010 eviction 2017 eviction- Demographic survey con-
ducted
- Well-documented eviction process and planning
- Fairly positive relations of FDA and communities
- Follow-up livelihood proj-ects planned and partially implemented, but not specifically targeted for ASM miners
- Several NGOs and donors present in the area
- Demographic survey with unverifiable methods
- Poorly documented evic-tion process and planning
- Deteriorating community and FDA relations
- Emergency Response Unit involvement
- No follow-up livelihood projects planned
- Decreased NGO and donor presence in the area
- Demographic survey conducted
- Social assessment using the social assess-ment of protected area (SAPA) methodology conducted
- Documented eviction process and planning
- Tension between the community and FDA, improved after multi-stakeholder conference held
- Community involvement
- Follow-up livelihood projects and law en-forcement and governance support in prog-ress; funding secured
- Increased NGO and donor presence in the area

108 FOREST-SMART MINING
Prior to the first eviction, 2,000–5,000 miners were estimated to be in two camps inside SNP. In 2005, the United Nations and the Liberian government executed an evacuation of miners. Alternative livelihood projects were not successful in providing other economic opportunities and patrolling capabilities were limited, resulting in miners returning shortly after in increased numbers. Violent tensions between miners and park staff began to escalate. The conflict culminated with the implementation of the 2010 eviction led by the FDA and the Liberian National Police. Artisanal miners were given three months to leave voluntarily, after which the remaining miners were forcefully evicted by the Emergency Response Unit (ERU) of the police.
The 2010 eviction had negative repercussions on the communities around SNP, which suffered unintended violence and damage to their properties in confrontation with the ERU. Tensions culminated with the tragic murder of one forest ranger killed by illegal settlers in early 2017 (Small and Villegas 2012; Larson 2017). However, most communities did not welcome ASM in the park and were keen to support a nonviolent eviction.
With the involvement of the FDA, community representatives, and supporting NGOs, it was decided to proceed with a community-led voluntary eviction. With the active contribution of the communities, illegal settlers were evicted non-forcefully. Community members handed out information leaflets about the eviction to the miners and stopped providing goods and services to them. Most of the illegal settlers left voluntarily, with the exception of a small group of less than 100 miners that is still found in the park.
A resolution to strengthen the effectiveness of SNP was signed by local and national stakeholders. In addition, as proposed in the revised management plan, a community advisory committee is being set up by the FDA to promote collaborative management with the communities and provide a platform through which community grievances can be addressed. Following on from the resolution adopted at the Sapo Multi-stakeholders Conference, there are plans to support communities to manage the area around the park through support to local governance institutions.
Disagreement and lack of clarity over park boundaries following an extension to Sapo National Park has been an additional source of conflict between communities, miners, and the FDA. To address this, the government is currently working toward flagging the correct park boundaries.
Forest Health and Impacts
Mining camps and communities in and around Sapo National Park have been identified and mapped by Fauna and Flora International, covering an approximate area of 20,516 hectares (Figure 3-29). Analysis of spatial deforestation data from 2000–2016 reveals low deforestation rates (0.1 percent) within the mining area. The deforestation rate within the 5-kilometer buffer zone is equally low, with 0.6 percent forest loss during the same period. These deforestation rates are lower than average deforestation rates in Sinoe County (4.5 percent) and in the country as a whole (11.9 percent) for the same time period
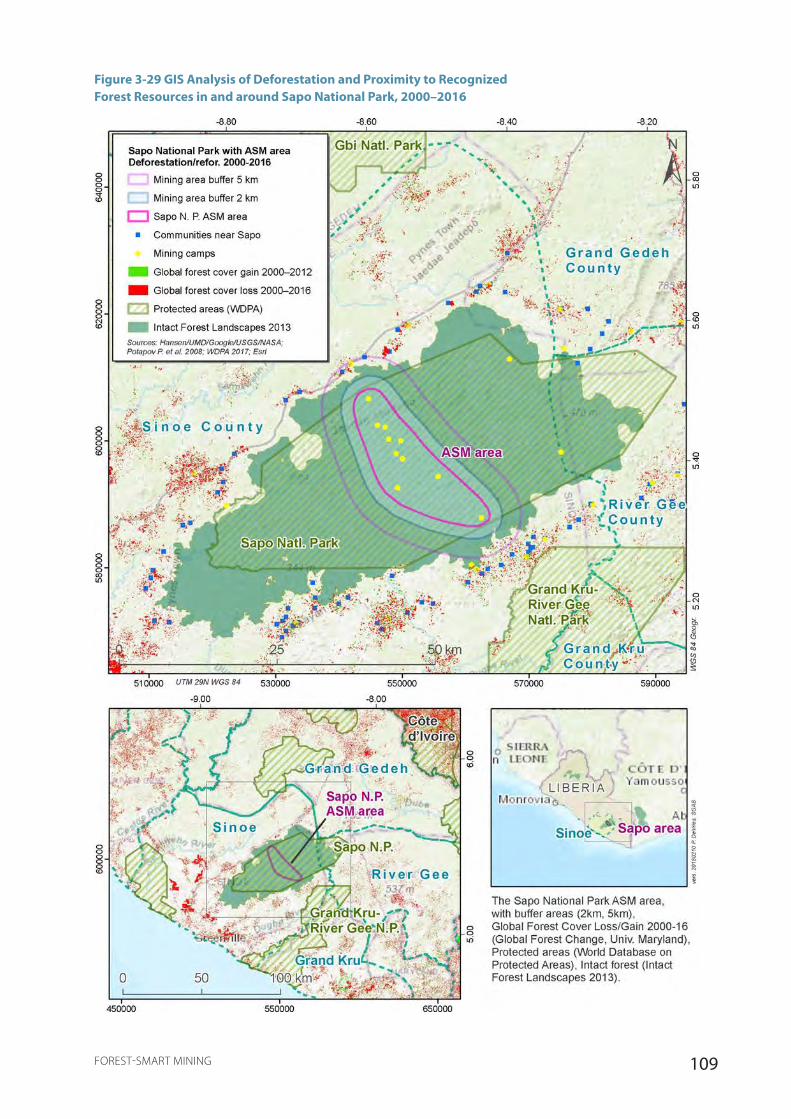
109FOREST-SMART MINING
Figure 3-29 GIS Analysis of Deforestation and Proximity to Recognized Forest Resources in and around Sapo National Park, 2000–2016

110 FOREST-SMART MINING
Table 3-15 Forest Health Score of the AOI around Sapo National Park
Forest health score of AOI 0.590Rank 6/23
At the landscape level, there has been some deforestation (Figure 3-30), with undesignated area deforestation being the strongest negative driver of forest health within the AOI. However, the forest health score is overall high (Table 3-15), with the main positive driver being the extent of intact forests.
Other than illegal mining and poaching, agriculture and logging are not occurring in the park; therefore,
the protected area deforestation is likely to be caused by artisanal mining activities. Mining and poaching in Sapo National Park have been identified as the main causes of habitat destruction via deforestation, lack of rehabilitation of abandoned mine sites, and water siltation (Collen et al. 2011). Pygmy hippo populations have been observed to decrease and increased elephant migrations are believed to be a result of mining activities. Rivers do not appear to be polluted as mercury is not used in ASM operations. Deforestation is higher outside the park boundaries (Figure 3-29) particularly where communities have settled. While communities are likely to partake in artisanal mining, deforestation is likely to be a result of several subsistence activities.
Figure 3-30 Deforestation Trends for the AOI around Sapo National Park, 2001–2014
Figure 2
111FOREST-SMART MINING
Conclusions
ASM activities in Sapo National Park have grown in the past decades and, despite deforestation rates in the park being low, mining and poaching are thought to be the main causes of habitat fragmentation and forest health disturbance.
The initial approaches to ASM evictions have been militarized and have been met with conflict and severe violence. The last eviction used a human rights–based approach and was done with the support and active participation of the community, who were empowered to be stewards of their forests. The success of this eviction is owed to several key elements:
1. Community involvement in decision making and the eviction process
2. A refrain from resorting to forceful evictions using the military or police
3. Consistent NGO support that acts as a neutral mediator to convene all the relevant stakeholders
Underresourcing and understaffing, in a national context where civil war and the Ebola outbreak have significantly set back conservation efforts, are major barriers to the appropriate follow-up investment and patrolling that is required after each eviction. The risk of miners returning to Sapo National Park is high; therefore, the communities who supported the eviction must be kept engaged and sensitized so that they continue to step in and assume a role in monitoring and patrolling the park.
Lessons Learned
• Community involvement in decision making, avoiding the use of force, and NGO support have been key factors toward the success of recent evictions in Sapo National Park.
• Underresourcing and understaffing are the major barriers that need to be addressed to make sure that return invasions do not occur and that community support of the evictions and park management remains high.
3.9.2. Gola Rainforest National Park, Liberia
The Gola Rainforest National Park (GRNP) is situated in the northwest of Liberia and southeast of Sierra Leone. The Sierra Leonean part of Gola became a national park in 2010, but the Liberian part remains a proposed protected area. The Foya Forest Reserve is another
proposed protected area in the region. The current case study will focus on the Liberian part of Gola, which has 98,000 hectares, and the surrounding area that connects with the Foya Forest Reserve. Gola is one of the largest intact blocks of the Upper Guinean Forest. In total it is home to 561 species of birds, mammals and amphibians of which 104 are listed as vulnerable in the IUCN Red List (Small and Villegas 2012).
The region has had a long-standing presence of gold and diamond alluvial ASM, and, although activities were reduced during the Ebola outbreak, ASM remains extensive in the area and is the main source of direct or indirect income of many households (Wilson et al. 2017). ASM in the area employs manual extraction techniques using basic tools such as shovels and pickaxes as well as labor-intensive, gravity-based processing methods. Mercury is not used in any step of the gold processing, but child labor has been reported.
Since the area under study is not yet a national park, ASM is allowed and licensed artisanal mines exist. However, many mines remain informal. Despite governmental efforts to formalize the sector, severe legal and procedural barriers prevent miners from formalizing.
The act establishing the Gola Rainforest National Park was passed in December 2016. The demarcation process is currently under way, but recent media reports indicate that this has caused conflict over land rights between the FDA and the local population, many of which are dependent on mining.
Recently, several Community Forest Management Agreements have been issued to some communities of the region. The Community Rights law allows the creation of community forests, whereby communities use and manage certain forests and community consent must be obtained for any forest conversion projects taking place on community forested lands. Despite its uptake, the regulation has been criticized as unclear (Moore Stephens LLP and Parker & Associates Inc. 2016) and has been subject to amendments, which are currently in progress.
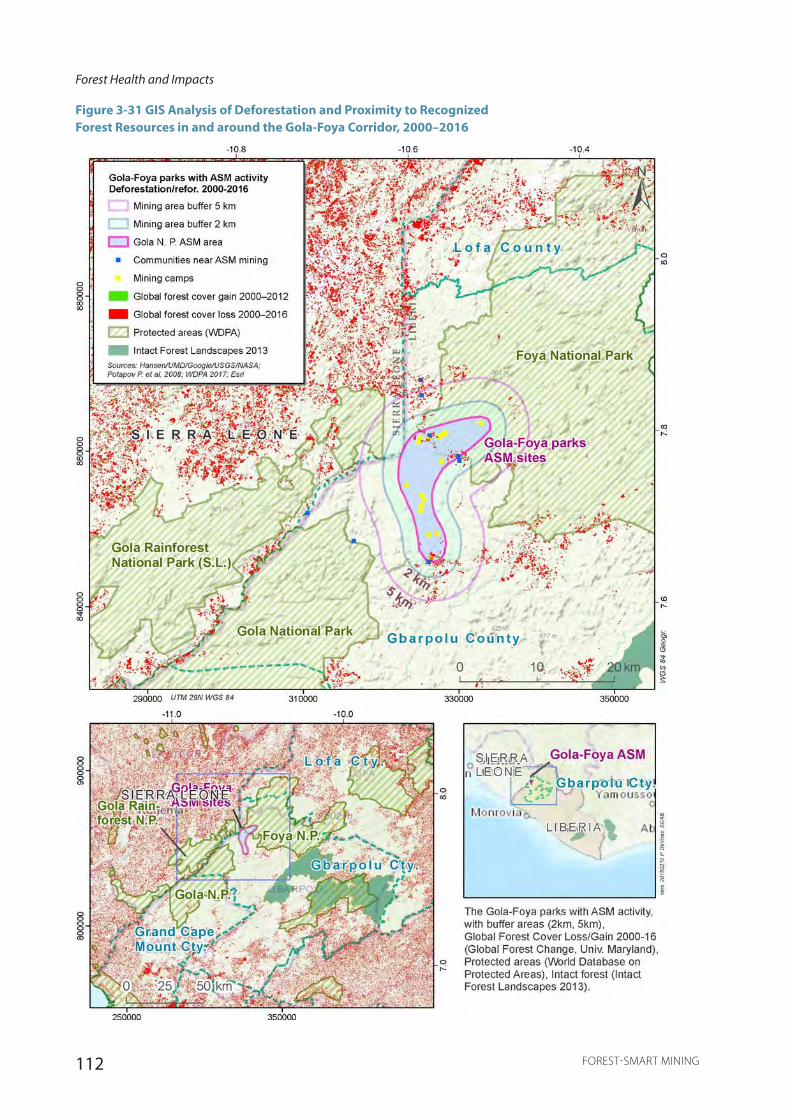
112 FOREST-SMART MINING
Forest Health and Impacts
Figure 3-31 GIS Analysis of Deforestation and Proximity to Recognized Forest Resources in and around the Gola-Foya Corridor, 2000–2016
Figure 1
Figure 1
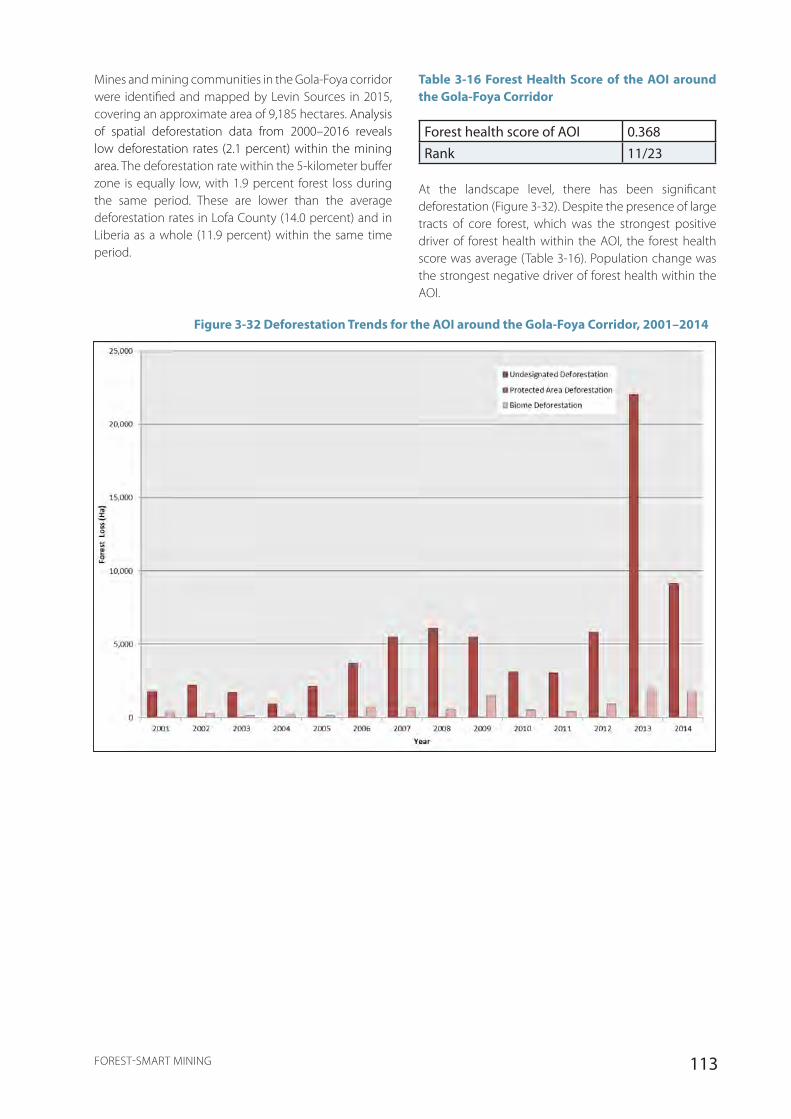
113FOREST-SMART MINING
Mines and mining communities in the Gola-Foya corridor were identified and mapped by Levin Sources in 2015, covering an approximate area of 9,185 hectares. Analysis of spatial deforestation data from 2000–2016 reveals low deforestation rates (2.1 percent) within the mining area. The deforestation rate within the 5-kilometer buffer zone is equally low, with 1.9 percent forest loss during the same period. These are lower than the average deforestation rates in Lofa County (14.0 percent) and in Liberia as a whole (11.9 percent) within the same time period.
Table 3-16 Forest Health Score of the AOI around the Gola-Foya Corridor
Forest health score of AOI 0.368Rank 11/23
At the landscape level, there has been significant deforestation (Figure 3-32). Despite the presence of large tracts of core forest, which was the strongest positive driver of forest health within the AOI, the forest health score was average (Table 3-16). Population change was the strongest negative driver of forest health within the AOI.
Figure 3-32 Deforestation Trends for the AOI around the Gola-Foya Corridor, 2001–2014
114 FOREST-SMART MINING
There is limited information about the state of biodiversity, ecosystems, habitat, flora, and fauna in the region. Water sources are reported to be impacted by the deterioration of soil and land quality; however, little evidence exists of chemical contamination (World Bank 2012).
Although ASM is prevalent in the region, it is not possible to state to what extent deforestation is attributable to mining activities, since subsistence timber production, agriculture, and poaching are also present and somewhat important in the area. Of notable difference is the markedly higher and more widespread deforestation in the contiguous Sierra Leonean side of Gola compared to the Liberian part.
Conclusions
ASM activities in the Gola-Foya corridor are fairly widespread and are the main source of direct or indirect income of many households. While demarcation in the Gola Rainforest National Park is essential in preserving the last remaining tracts of the Upper Guinean Forest, the process has already sparked conflict with artisanal miners over land rights. It is therefore essential that the approach is reassessed proactively rather than reactively, and that community consultation/FPIC procedures are adequately followed.
The Liberian government has used two main mechanisms to promote forest-smart mining: formalization and Community Forest Management Agreements. However, both mechanisms appear to have had limited success for the following reasons:
• Challenges with formalization exist due to the complexity, cost of the licensing system, the need for in-person applications in the capital, lack of access to finance, and limited knowledge on more sustainable recovery techniques, mineral valuation, and non-transparent supply chains (Tychsen et al. 2017).
• Challenges with Community Forest Management Agreements exist due to lack of clarity and incoherence in the Community Management regulation, which lead to varying interpretations. One interpretation could mean the involvement of communities in benefit sharing from commercial activities of their land resources, whereas another interpretation could be seen as restricted to noncommercial activities, leaving communities restricted within existing rural economies.
Legal assistance to authorities in order to clarify the Community Forest Management Agreements should be prioritized. Moreover, formalization process should be made more accessible to ensure that ASM, which is a significant provider of livelihoods in Liberia, can proceed under proper environmental management.
Lessons Learned
• ASM in the Gola-Foya region is widespread. There is a pressing need for the demarcation of Gola Rainforest National Park to preserve the forest in the region, but the process has already sparked conflict and it should proceed cautiously with more active community consultations.
• Community Forest Management Agreements have the potential to be effective tools for a rights-based approach to forest-smart mining. In Liberia, they are promising but require legal clarification. .

115FOREST-SMART MINING
3.10. MADAGASCAR
Country Overview
World Bank development status Low income
Indicators Year of dataGDP per capita, PPP (current international $) 1,509 2016GNI per capita, PPP (current international $) 1,450 2016% population living in poverty (<$1.90/day) 77.8 2012
Gini index (World Bank estimate) 42.7 2012% total unemployment of total labor force (ILO estimate) 2.4 2017Yale Environmental Performance Index 37.1 2016
Madagascar’s mining history is dominated by informal artisanal and small-scale extraction of gold and precious stones, with significant production of rubies and sapphires. Since 2009, production has increased strongly toward an estimated 8 to 12 tonnes per year. Estimates put the number of artisanal miners in the country between 350,000 and 500,000 (Cook and Healy 2012). In the past decade, two large-scale mines have become operational in Madagascar: Ambatovy and QMM. With that, the economic contribution of the mining industry has grown to represent 4.2 percent of the GDP (2014) and $2.2 billion of export revenues (2014). Madagascar ranks fourth in the Mining Contribution Index (ICMM 2016a; EITI 2013; USGS 2015).
The timber sector has a very similar importance for the national GDP, namely 4.3 percent in 2011. The widely illegal commercial timber extraction is above all undertaken in the country’s north-east, with export primarily to China. The government and local communities only receive little revenue from the industry. Ecosystem services are, however, very important for people living in widespread poverty, in a country with 21.4 percent forest cover (of which only 24 percent is primary forest). Madagascar is a biodiversity hotspot; it has one of the highest rates of endemism in the world and a worryingly high rate of deforestation, which reaches as much as 4 percent annually in some regions (GFW 2016a; Neudert, Ganzhorn, and Wätzold 2017; The REDD Desk 2017; World Bank 2017a; WCS et al. 2015).
Madagascar’s mineral resources belong by law to the state, and mining companies are subject to a 2 percent royalty rate on mineral sales, with some exceptions: in Ambatovy, refinement occurs in country and the rate is reduced to 1 percent on refined nickel and cobalt (Faure, Rakotomalala, and Pelon 2015). The mining sector is governed by the Mining Code, adopted in 1999 and
amended in 2005 (World Bank, African Legal Support Facility, and African Union Commission 2017). The amended version includes a systematic requirement for mining projects to complete an environmental impact study and submit an environmental commitment plan before being granted a permit, reinforcing an existing requirement for all investment projects to undertake an EIA, in place since the early 1990s (IUCN and CI Ecuador 2016; Ministère de l’Environnement des Eaux et Forêts 2004). Law No. 2001-031 from 2002 provides specific rules for large mining investments (Jurismada, n.d.). Plans to change the mining legislation in 2017 were abandoned because of concerns about threatening investment stability (Stoddard 2017). In 2015, the ministry set up a National Gold Agency, Anor, to attempt to regulate, formalize, and extract revenue from the ASM gold sector.
Under formal law, most of Madagascar’s forests are the property of the state or so-called “non-titled” land, or terrain domanial. Under customary law the status of forests is unclear and occasionally leads to conflict. In 1990, Madagascar adopted the National Environmental Action Plan (NEAP), mainstreaming environmental considerations into key areas of sector development, and the Environmental Charter, which was revised in 2015 to explicitly address new risks including biodiversity, climate change, forest cover loss, and land degradation, among others. The new Protected Areas Code from 2015 establishes the National Protected Areas System (SAPM), which confirms integral natural reserves, national parks, and natural parks as the three categories of protected areas that have a strict prohibition for natural resource use, and introduces two new categories (protected landscape, natural resource management area) with greater management flexibility. The total area of protected areas in the country tripled between 2002 and 2009, from 2.1 to 5.58 million hectares, covering 6 percent of total land surface. The 1997 Forestry Law and the

116 FOREST-SMART MINING
Decree No. 98-782 (on forest exploitation) govern forest use and conservation, stating that any appropriation of products from forestry requires a government permit. A small exception exists for customary usage rights of rural populations, or droit d’usage. The law on local management of natural resources (1996) (No. 96-025) and the decree on contractual management of forests (No. 2001-122) empower local communities to manage forests under contract to the state (IUCN and CI Ecuador 2016).
Is Madagascar’s Mining Sector Forest Smart?
Madagascar has an institutional and legal framework that, if applied effectively and coherently, could provide adequate protection of forests from mineral exploitation and associated development. However, a lack of institutional coordination and law enforcement coupled with a largely informal mining sector and a lack of good governance lead to a situation where illegal mining in protected areas and high deforestation rates persist. This is particularly worrying given the extremely high level of biodiversity in the country and the low percentage of natural forest remaining. Local communities and civil society should be more systematically involved in any efforts toward more forest-smart mining, the legal basis of which and some capacity is already provided (Resolve 2017).
Lessons Learned
• Existing regulatory framework needs to be coupled with better implementation and enforcement in order to be effective.
• In environments of high biodiversity importance and with few remnants of primary forests, addressing ASM rushes in protected areas must prioritize the sites of most critical significance for the preservation of endangered biodiversity and primary habitats.
3.10.1. Ankarana Special Reserve, Madagascar
The Ankarana Special Reserve, established in 1956, is located in northwestern Madagascar and comprises 18,225 hectares. It is composed of dry forest, other deciduous plant formations and scrubland vegetation and houses threatened tree species (for example, rosewood, a IUCN Red List species). The protected area shelters 333 animal species, including 54 endemic bird species and 9 endemic lemur species. Local communities cultivate rice, grow cash crops and collect certain plant species for local consumption. Ankarana is managed by Madagascar National Parks (MNP).
Mining has existed in Ankarana since 1994. The park was one of the country’s first major gem mining sites, containing important deposits of sapphires. The initial operators were small foreign private mining companies that held mining permits outside the park’s northern sector. The first ASM rush took place in 1996, when artisanal miners discovered a deposit of alluvial sapphires within the protected area. Within a few months, the number of miners rose to 8,000 (Randria Arson 2017). In late 2017, about 2,200 miners were still digging in the reserve (MNP 2017).
Miners sell their products to on-site local collectors, some of whom sponsor miners, and then sell the stones on to foreign traders and collectors from Antananarivo, who export the products (Cook and Healy 2012).
Illicit mining in the protected area results in deforestation and other forest impacts, including the felling of precious timber trees, holes in the ground, and sedimentation of local rivers. Mining is also occurring on agricultural fields and in sacred sites in and around the park.
Both local communities and MNP park staff have been unable to effectively prevent gemstone extraction in the protected area. In 1998, the national police was deployed to evict miners and guard the park boundaries. However, as soon as law enforcement officers left the area, artisanal miners returned. Subsequent negotiated evictions in which miners were paid compensation for quitting the site did not yield lasting results (MNP Director of Operations, pers. comm.).
In 2016, a first regional dialogue was organized between government authorities, civil society, and around 50 local miners with the support of the German Agency for International cooperation (GIZ). The stakeholders decided to search for mining sites outside of the protected areas, as well as for agricultural land and land convertible for livestock projects, and to promote employment and economic alternatives, particularly for women heads of household. The income generated through these alternatives was not considered competitive, however, compared to mining. Stakeholders also planned to decommission a portion of the current operating land on behalf of the association of sapphire miners, to introduce environmental education at schools, and to deliver the available mining titles to local communities. However, at the time of writing, a concrete plan of action was still not in place.
In 2017, the regional and protected area management authorities established a platform to support protected area managers of the region in dealing with illegal ASM. The platform agreed a series of measures including strict application of the law, cancellation of collection permits

117FOREST-SMART MINING
for the area, collaboration with the environmental and forestry services, reinforcement of forestry agent status and the relaunch of ASM eviction operations. To help finance the evictions, MNP requested special intervention funds from the Foundation for Protected Areas and Biodiversity of Madagascar (FAPBM) in 2017 to carry out an eviction of miners and oblige evicted miners to participate in alternative livelihood schemes funded by GIZ. The eviction operation was conducted in November 2017 followed by two security operations in December 2017. Using a mixed team of about 70 people including forest officers, mine police, gendarmes, military, park agents, and local committees, all miners were evicted, 11 arrested, and seizures made of carts, felled logs, sacks of charcoal, a truck, and other items (MNP Director of Operations, pers. comm.).
Forest Health and Impacts
Analysis of recent satellite imagery and verification via published sources suggests that mining activities cover an area of 1,095 hectares (Figure 3-33). Analysis of spatial deforestation data from 2000–2016 reveals a medium
deforestation rate (15.2 percent) within the defined mining areas. Deforestation rates within the 5-kilometer buffer zone are comparatively low but nevertheless significant, with 6.8 percent forest loss during the same period. These deforestation rates are comparable to the average deforestation rates of the Diana region (8.0 percent), but lower than average deforestation rates in Madagascar as a whole (16.1 percent) for the same time period.
The National Office for the Environment reported a decrease in forest area of Ankarana park on the magnitude of 129 hectares between 1990 and 2010 (Office National pour l’Environnement et al. 2013). The World Bank (2013) reported that 1–10 percent of the protected area was impacted.
Prior to the 2017 eviction campaign, MNP estimated that 250 hectares of forest were lost, 4 rivers and 8 lakes dried up, and 13 springs were contaminated (MNP 2017), amounting to about 1.4 percent of the park’s area.
Madagascar, 2013, by Rupert Cook
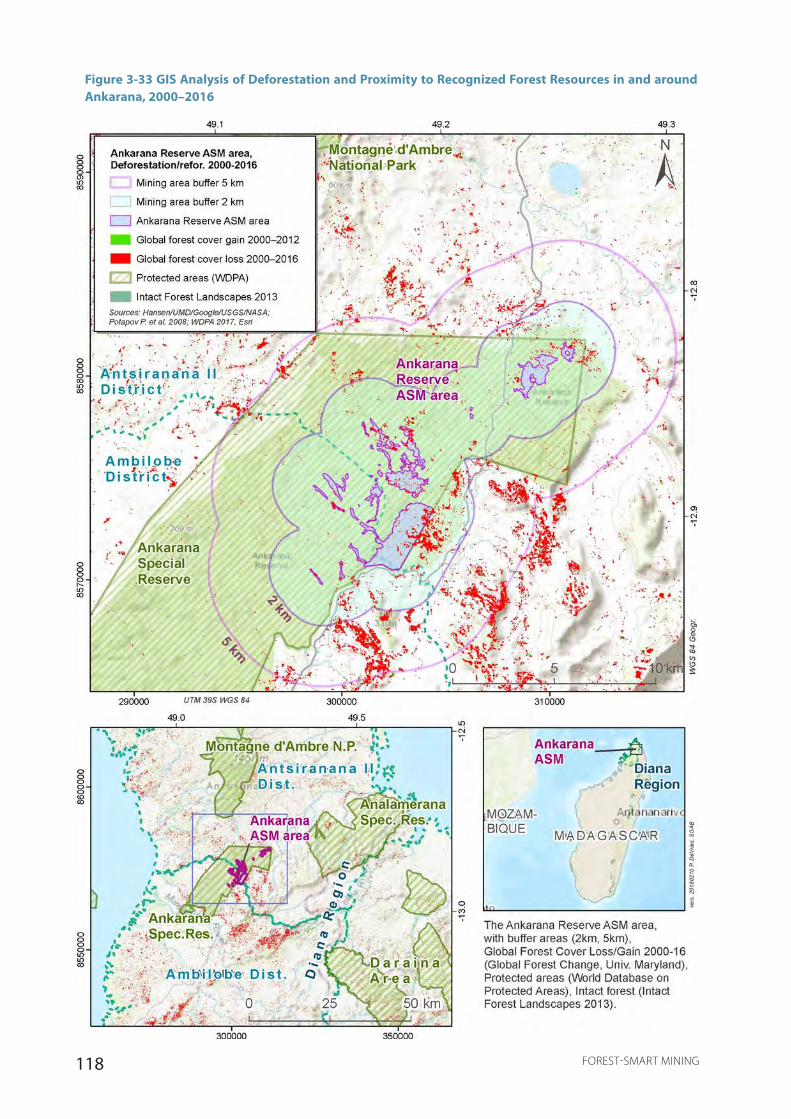
118 FOREST-SMART MINING
Figure 333 GIS Analysis of Deforestation and Proximity to Recognized Forest Resources in and around Ankarana, 2000–2016
Figure 3-33 GIS Analysis of Deforestation and Proximity to Recognized Forest Resources in and around Ankarana, 2000–2016
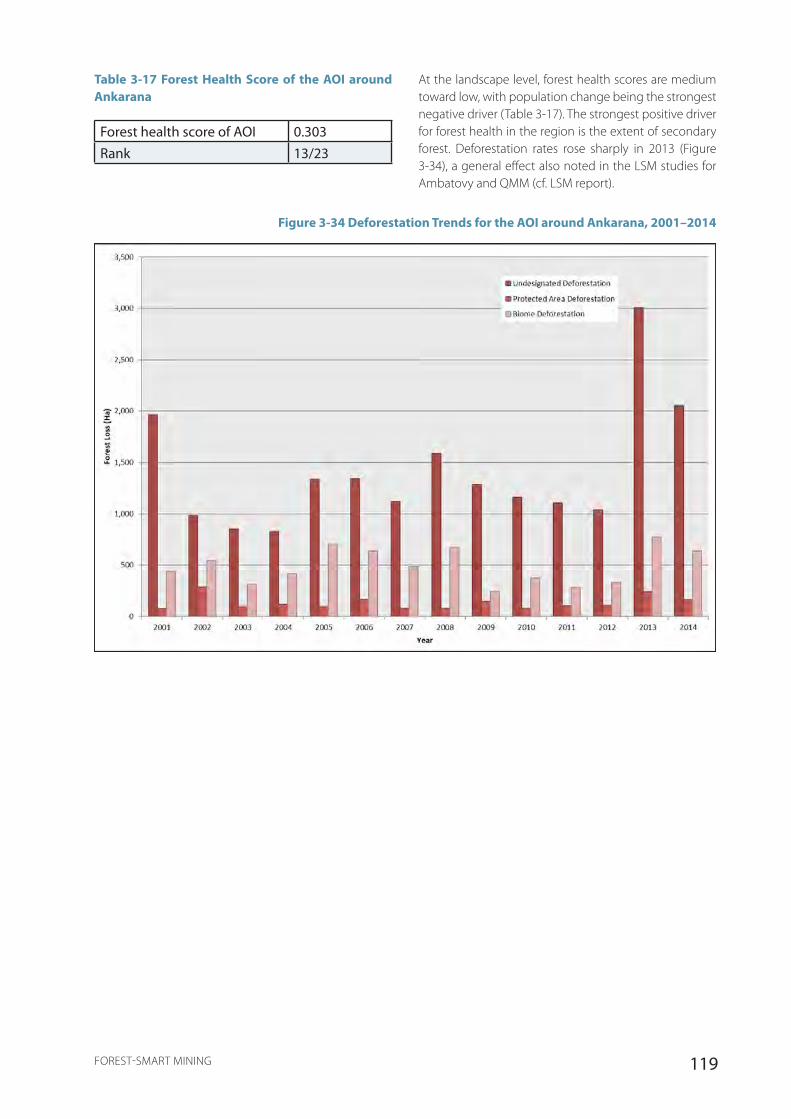
119FOREST-SMART MINING
Table 3-17 Forest Health Score of the AOI around Ankarana
Forest health score of AOI 0.303Rank 13/23
At the landscape level, forest health scores are medium toward low, with population change being the strongest negative driver (Table 3-17). The strongest positive driver for forest health in the region is the extent of secondary forest. Deforestation rates rose sharply in 2013 (Figure 3-34), a general effect also noted in the LSM studies for Ambatovy and QMM (cf. LSM report).
Figure 3-34 Deforestation Trends for the AOI around Ankarana, 2001–2014
120 FOREST-SMART MINING
Conclusions
The mining in Ankarana is partly happening in protected areas, which is highly problematic from an ecological point of view.
Several attempts of evictions have been trialed without success; the establishment of alternative livelihoods has largely failed, too, mainly because of the lack of tangible economic benefits.
The newest attempt for a solution has been evictions through mixed teams, combined with alternative livelihood schemes.
Lessons Learned
• Evictions should be well planned, targeted, swift, and adequately resourced, using mixed teams including mining and forestry officers, police, military, park staff, and local authority members. Follow-up operations to clear remaining miners and secure the site are essential, and actions must be communicated to local communities.
• Evictions without permanent enforcement, or compensated evictions, do not prevent recurrence. Attempts to establish alternative livelihoods are often ineffective because of the much higher income that can be generated by mining.
• Multi-stakeholder dialogues open the opportunity for more promising results. Establishment of coordination platforms between park managers and local authorities helps to develop effective strategies for eviction.
3.10.2. Bemainty, CAZ New Protected Area, Madagascar
The Corridor Ankeniheny Zahamena (CAZ) created in 2005, where the site of Bemainty is located, lies in the eastern biome of Madagascar and is surrounded by four preexisting protected areas: Zahamena National Park, Mangerivola Special Reserve, Betampona Integral Nature Reserve, and Analamazaotra Special Reserve, which is part of Andasibe-Mantadia National Park. The CAZ extends over some 3,810 square kilometers, making it one of the largest remaining rain forests in the country. The forest is of vital biological importance, habitat to many endemic species of fauna and flora, and provides important ecological services (Conservation International, n.d.). Communities bordering the corridor are heavily dependent on natural resources. However, slash-and-burn agriculture, a traditional practice, degrades and threatens this world heritage. Illegal forest and mining operations are also important causes of
forest degradation.
Previous rushes in the area happened on the sites Moramanga Carrière for rubies in 2004, and in Ambohibe (Didy) in 2012. Since the discovery of secondary ruby and sapphire deposits in the Bemainty site, rushes have become regular. In October 2016, around 45,000 miners moved to the area. This number subsequently decreased to around 20,000.
The extraction is done with simple handheld tools. Miners dig up to a maximum of 2–3 meters deep. The earth potentially rich in gems is then collected and sifted to collect the rubble that will be washed in the nearest stream to reveal the gems. Toward the end of 2017, most miners began using water pumps, hoses, and sieves. Self-employed miners work in groups of four or five people. Miners are financed by investors and buyers (Malagasy, Guineans, and Sri Lankans). The financiers provide the miners with food, equipment, and fuel for pumps, and hire bodyguards and cooks, while expecting a profit margin of 30 percent to 40 percent. At the start of the rushes, the miners had organized several independent “cooperatives,” but since the first half of 2017, most have come from other mining areas in the country (Perkins 2017). Foreign buyers, suspected to be supported by influential personalities, arrived in large numbers at the beginning of the rush.
Miners live in makeshift tents or huts; there is no sanitation infrastructure and drinking water is difficult to access. Bottled water, fresh or canned beverages, and food are available in stores around the site at exorbitant prices.
The local communautés de base, or Vondron’Olona Ifotony (VOI), community structures with a natural resource management contract for their land, have expressed their powerlessness in the face of the large number of miners and the progression of the illegal mining operations that have been rapidly advancing into the interior of the CAZ since October 2017. They fear that at this frantic pace, the entire forest of the corridor, the crop fields, and rice paddies will disappear before the end of the current year if the government and its partners do not intervene (Gyre 2017). Some VOI members in the area even became involved in ASM activities.
An attempt by the local police to evict miners failed, and the number of miners on the site even increased afterward. Protected area managers have used law enforcement officers—namely, mixed brigades—to proceed with the expulsion of miners and the closing of shops, only to have them reopen shortly afterward. Despite the roadblock set up by the security forces in October 2016 to curb the illicit exploitation of the
121FOREST-SMART MINING
sapphire and ruby mines in Bemainty, mining operators have continued to invade new sites in the vicinity, such as Ambodivoangy (located a few kilometers from Zahamena National Park) in November 2016; they were again repelled by the officers and agents of the park present on-site.
The following preventative security measures have been put in place by the management of the neighboring Zahamena National Park:
• Control of the entry area at Antanandava (side Ambatondrazaka) and Vavatenina to monitor the situation closely
• Reinforcement of patrols in risk areas
• Collaboration with the prefect of Fénérive Est for the requisition of military in the event of a rush
• Information sharing and search for solutions with the Regional Directorate for Environment, Ecology and Forestry (DREEF) Alaotra Mangoro region and Prefecture of Ambatondrazaka to secure the sites
• Establishment of mixed missions and exchange of information on the situation of Zahamena National Park in the face of the Bemainty/Didy rushes with the Regional Directorate of Mines
• Operations requiring the withdrawal of buyers of precious stones from the town of Ambatondrazaka
Local community organizations (the VOI) are currently working with Conservation International (CI) to ensure the “co-management” of this protected area. These communities have followed training on biological inventory, ecological monitoring, systematic control within the forest, and monitoring to be able to carry out forest patrols. They are involved in the protection and conservation of biodiversity and have become the new managers of the protected area. A change in the behavior of the VOI is observed, namely the adoption of improved agricultural practices and the abandoning of slash-and-burn agriculture, bush fires, and mining traffic.
Forest Health and Impacts
Analysis of recent satellite imagery and verification via published sources suggests that mining activities cover an approximate area of 111 hectares. Analysis of spatial deforestation data from 2000–2016 reveals a high deforestation rate (43.3 percent) within the defined mining areas. Deforestation rates within a 5-kilometer buffer zone are comparatively low (4.5 percent), and below the average for the Alaotra-Mangoro region (8.0 percent) and the country as a whole (16.1 percent), indicating the absence of deforestation drivers other than the presence of ASM in these remote forest areas.
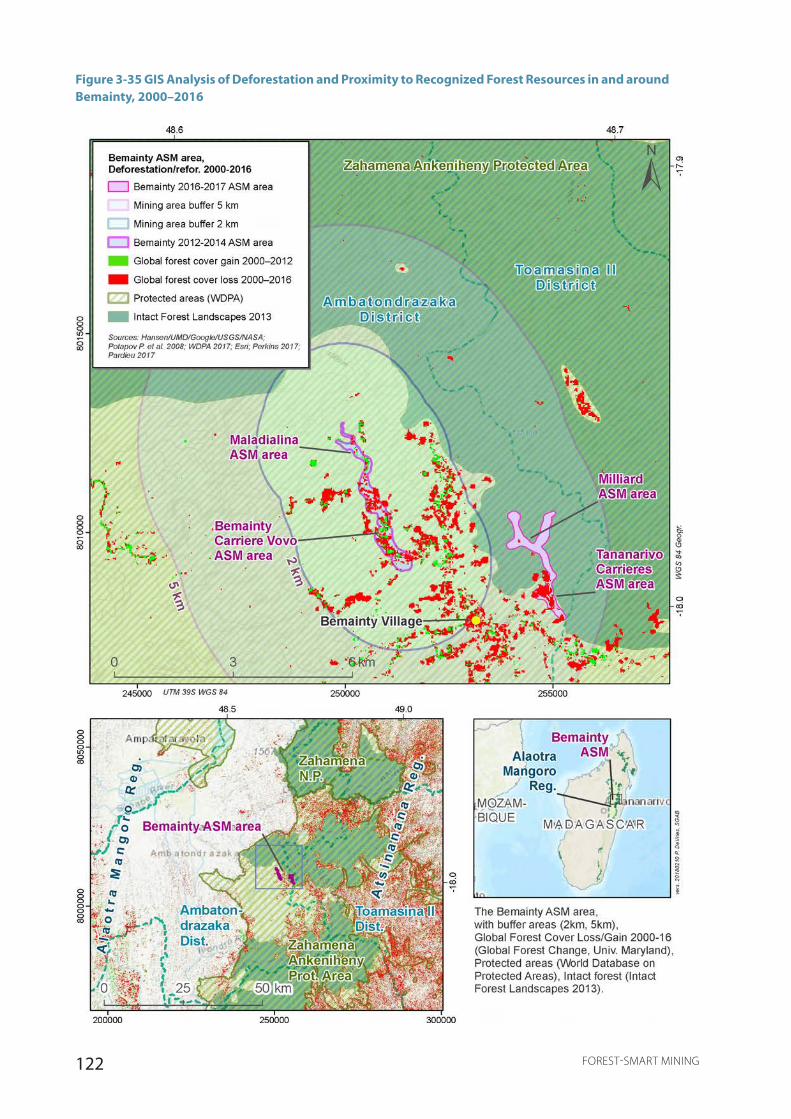
122 FOREST-SMART MINING
Figure 3-35 GIS Analysis of Deforestation and Proximity to Recognized Forest Resources in and around Bemainty, 2000–2016

123FOREST-SMART MINING
At the start of the ruby rush in Didy in 2012, a loss of 20–30 hectares of forests was estimated (Courrier de Madagascar 2012). However, deforestation associated with small mines is minor compared to other forms of deforestation, notably slash-and-burn agriculture. In CAZ, the mining operations take place mainly along river valleys in the non-forested buffer zones of the protected area and do not pose a major direct threat to the forests of CAZ (Perkins 2017). However, the high sedimentation caused by the sifting of the excavated soil affects the local rice harvests during the rushes.
Table 3-18 Forest Health Score of the AOI around Bemainty
Forest health score of AOI 0.198Rank 20/23
At the landscape level, forest health scores are low (Table 3-18), with protected area deforestation being the strongest negative driver (to be expected given that most of the AOI is protected). The strongest positive driver for forest health in the region is the extent of intact forest (also to be expected for a large, continuous forest block). Similarly to the AOI examined for the Ambatovy nickel mine (cf. LSM report), deforestation rates dipped in 2006, rose during 2007, and dipped again before rising sharply in 2013, thus following the general regional trend (Figure 3-36). No correlation with ASM activities is evident.
Figure 3-36 Deforestation Trends for the AOI around Bemainty, 2001–2014
124 FOREST-SMART MINING
Conclusions
ASM is not a major source of impact on forests in the area. Forestry and slash-and-burn agriculture are responsible for most of the negative forest outcomes. Because the zone is a protected area, however, there is a certain urgency to tackle ASM rush situations. The rushes are often driven by demand from foreign buyers. Evictions have, as in Ankarana, not proven to be successful.
Information sharing between different authorities and other actors has been used as a strategy for responding to ASM in protected results.
Lessons Learned
• Without strong coordination and government backing, security forces, NGOs, local authorities and community management organizations are ineffective in the face of large ASM rushes.
• The focus of control should be on the collectors and the market rather than the rush itself. Actions against traders and buyers are easier to achieve than those against miners.
• Community management of the environment, and strengthening their monitoring capacity, leads to more ownership and awareness among local populations, and to changes of their practices.
3.10.3. Loky Manambato (Daraina), Madagascar
The new protected area of Loky Manambato (IUCN category V) covers 79,000 hectares of forest. Loky Manambato (also referred to as Daraina) presents a unique concentration of various habitats, ecosystems, and species of Madagascar’s Sava region. This protected area contains exceptional biodiversity with an endemicity rate of up to 84 percent, including 10 species of lemurs, the largest scorpion in Madagascar, 127 species of birds, 75 species of reptiles, 36 species of amphibians, and the fossa, the largest carnivore on the island. The protected area also stands out by the presence of different types of plant formations ranging from moist to dry, with 1,773 species of plants, of which some 50 species have only recently been discovered. Three endemic species are classified as critically endangered on the IUCN Red List. The park is managed by the NGO Fanamby.
The forests of Loky Manambato serve the local population for a variety of purposes: as a timber source, to collect wood for fences, wood and coal as energy sources, supply of products during the welding period, as a reserve of medicinal plants, and to produce coffins of wood, which is considered sacred. The forest is the most important source of water of the region, used as drinking water in the village of Daraina. The water from
streams is also used for the irrigation of rice fields further downstream (ECR 2015; Ministère de l’Environnement et des Forêts and Fanamby 2013).
People in the area live mainly from agriculture, livestock, gold mining, and exploitation of forest products (ECR 2015). Additional sources of income are ecotourism, crafts, trade, and growing vanilla and cashew nuts.
Gold deposits are present in the form of veins or primary deposits, and in sedimentary form following rock erosion or as secondary deposits formed by alteration of primary deposits with reconcentration near surface waters (Cook and Healy 2012). To a lesser extent, there are also deposits of crystal, sphene, and quartz in the area. ASM takes place in four rural communes (Daraina, Maromokotra, Ampisikinana, and Nosibe). Gold mining is a traditional activity in Daraina, but the first arrival of migrants for gold mining dates back to 1980. It is one of the most important pressures and threats to the area. In 2012, mining (mainly gold) was increasing with illicit penetration into natural forests and protected areas.
In 2013, the municipality of Daraina reported more than 2,000 miners, most of whom practice the activity in a seasonal way, and independently for their own account. They reside in the operating areas, only rarely return home, and are even included in the electoral list of the commune of Daraina. In 2016, miners increased in number and began to use acid, causing health problems. Chinese nationals have also become involved. Around 100 collectors, 80 percent of whom are illicit, collect the products for resale to big buyers in Vohemar, Sambava, Ambilobe, and Antananarivo. Despite most actors not being declared at the level of the Bureau of Mining Cadastre of Madagascar (BCMM), the municipality collects royalties from some of these illegal local collectors. The reported production of gold amounts to around 2 kilograms per week. The municipality collects 2–3 percent royalties on that production, and Ar 200,000 of royalties on collectors’ cards. Miners who hold permits must pay a yearly fee of Ar 5,000 ($1.5) to the municipality. With only around a fifth of collectors and some of the miners being registered, however, considerable income still slips through the authorities’ hands.
Artisanal exploitation is done in five stages: digging using a crowbar; filling plastic bags normally used for rice or cement with a loaded weight of between 15 and 30 kilograms; transporting ore from the sampling location to the sieving site; digging a well to obtain water; and separating gold and impurities by sieving with water.2
--------------------------------- 2 However, digging a well seems a one-time occurrence per exploitation area, with multiple occurrences of the other stages.
125FOREST-SMART MINING
Mining is responsible for school dropouts by children of school age. In addition, it causes social conflicts in areas where the mines reach the agricultural fields. But above all, accidents due to gaping holes and landslides pose a real danger for miners.
Between 1995 and 1999, the miners were bound to follow certain rules, and gold mining corridors had been defined but were not respected. In 2004, miners were evicted from the forest. New evictions were attempted in 2011 and 2012, but these were blocked by individuals with interests in the mines. Control patrols are organized every 15 days at the expense of the park management.
In an alternative approach, the NGO Fanamby has worked toward empowering local communities. These communities have been organized in conjunction with the development of management rules, which include the prohibition of the use of acid and mercury in the mining process, respect of the corridors delimited for gold mining, registration of small miners and collectors in the municipality, the prohibition of felling of trees without permit, and payment of duties and taxes. This strategy has prevented chemical pollution of the site, especially that of water; on the other hand, the duties and taxes levied by the municipality represent a measure of incitement to control this activity. The municipality is required to ensure the control and monitoring of the activities, to prepare the quarterly reports, and to send the registers for the traceability of the products (which do not yet exist) to the BCMM. From 2004 to 2009, Fanamby supported local communities in the development of a mining association with 60 artisanal miners. The delimitation of gold mining corridors to mining areas and the restriction of mining activities to these corridors has, to date, prevented miners from invading the core zone of the Loky Manambato protected area.
The details of the work with local communities to control mining in the protected area are not divulged in official management reports for the protected area. According to NGO representatives, this is because certain aspects of the mining activities are technically illegal. While the management measures have helped reduce forest impacts, they may not be sustainable in the long term.
Other measures undertaken were the removal of drills to stop illicit activity, the arrest of collectors, the establishment of an environmental impact monitoring committee within the Miners Association for minimizing environmental impact, and the establishment of a strengthened monitoring committee for the protected area.
The zoning plan for Loky Manambato includes strict conservation areas that are important areas for biodiversity and the biological cycle of species and/or areas to ensure the maintenance of the integrity of the composition, structure, and function of biodiversity and ecosystems of cultural sites; and areas of controlled use including mining areas. The latter are those recognized by the communities as having high mining potential (gold, crystal, sphene). Most of these areas have already been assigned to permit holders (companies or individuals).
Forest Health and Impacts
The exploitation of gold is one of the most important pressures and threats to the national protected area. Large-scale immigration occurs after the discovery of each new deposit. Mining activities reduce vegetation cover, affect soil, and cause the siltation of waterways.
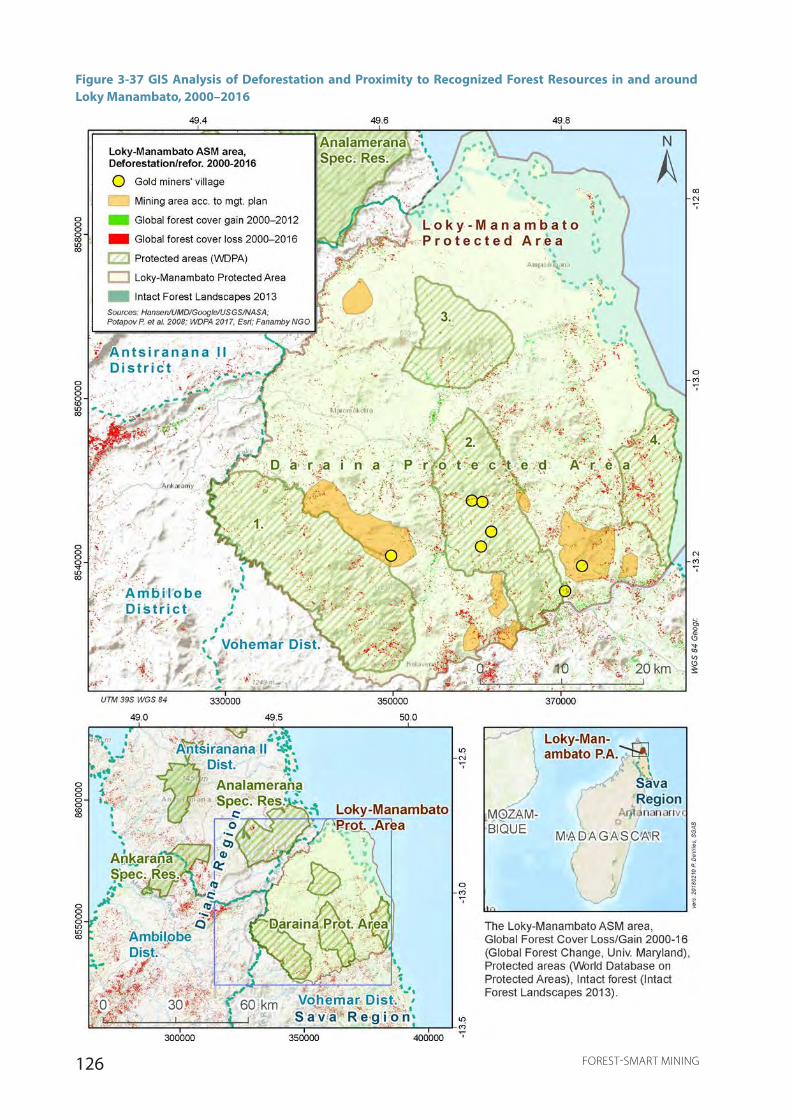
126 FOREST-SMART MINING
Figure 3-37 GIS Analysis of Deforestation and Proximity to Recognized Forest Resources in and around Loky Manambato, 2000–2016
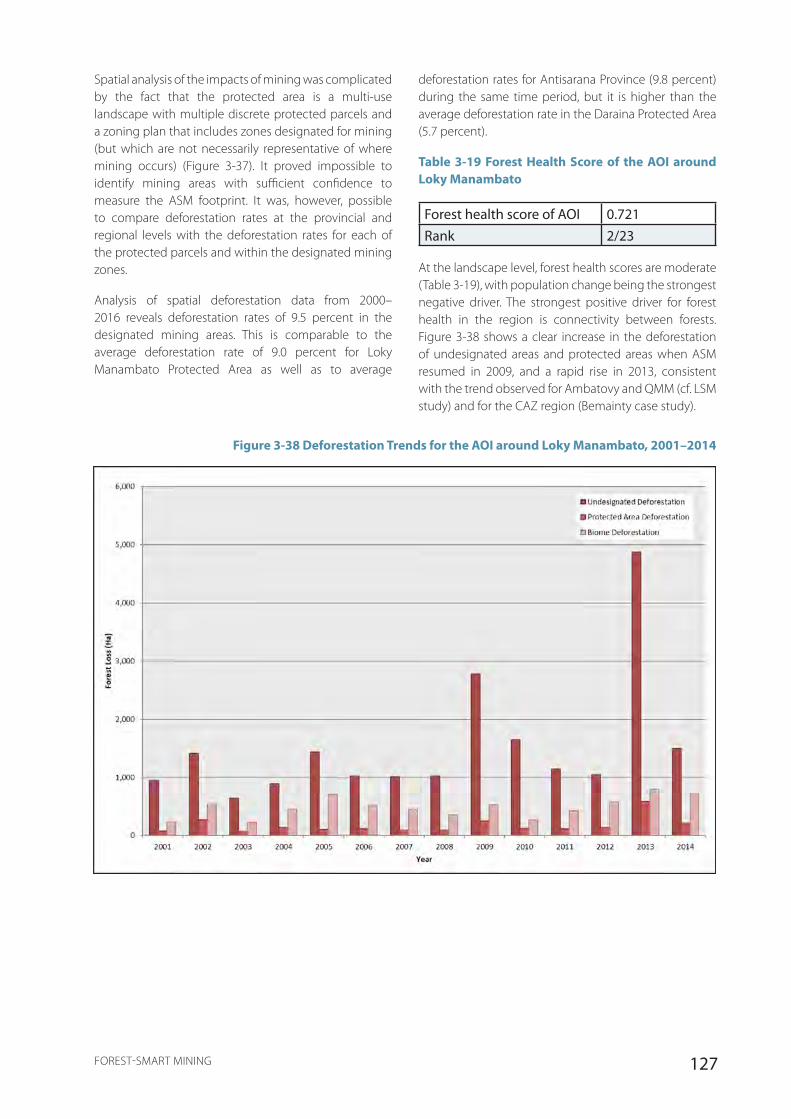
127FOREST-SMART MINING
Spatial analysis of the impacts of mining was complicated by the fact that the protected area is a multi-use landscape with multiple discrete protected parcels and a zoning plan that includes zones designated for mining (but which are not necessarily representative of where mining occurs) (Figure 3-37). It proved impossible to identify mining areas with sufficient confidence to measure the ASM footprint. It was, however, possible to compare deforestation rates at the provincial and regional levels with the deforestation rates for each of the protected parcels and within the designated mining zones.
Analysis of spatial deforestation data from 2000–2016 reveals deforestation rates of 9.5 percent in the designated mining areas. This is comparable to the average deforestation rate of 9.0 percent for Loky Manambato Protected Area as well as to average
deforestation rates for Antisarana Province (9.8 percent) during the same time period, but it is higher than the average deforestation rate in the Daraina Protected Area (5.7 percent).
Table 3-19 Forest Health Score of the AOI around Loky Manambato
Forest health score of AOI 0.721Rank 2/23
At the landscape level, forest health scores are moderate (Table 3-19), with population change being the strongest negative driver. The strongest positive driver for forest health in the region is connectivity between forests. Figure 3-38 shows a clear increase in the deforestation of undesignated areas and protected areas when ASM resumed in 2009, and a rapid rise in 2013, consistent with the trend observed for Ambatovy and QMM (cf. LSM study) and for the CAZ region (Bemainty case study).
Figure 3-38 Deforestation Trends for the AOI around Loky Manambato, 2001–2014
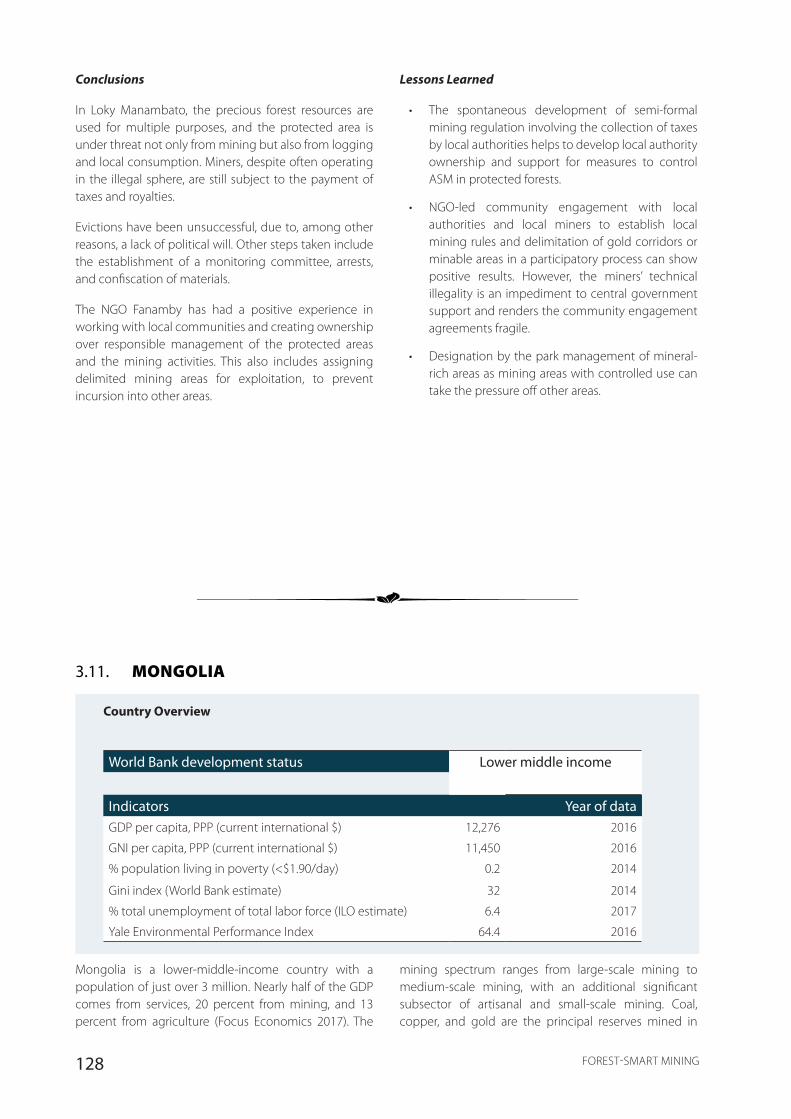
128 FOREST-SMART MINING
Conclusions
In Loky Manambato, the precious forest resources are used for multiple purposes, and the protected area is under threat not only from mining but also from logging and local consumption. Miners, despite often operating in the illegal sphere, are still subject to the payment of taxes and royalties.
Evictions have been unsuccessful, due to, among other reasons, a lack of political will. Other steps taken include the establishment of a monitoring committee, arrests, and confiscation of materials.
The NGO Fanamby has had a positive experience in working with local communities and creating ownership over responsible management of the protected areas and the mining activities. This also includes assigning delimited mining areas for exploitation, to prevent incursion into other areas.
Lessons Learned
• The spontaneous development of semi-formal mining regulation involving the collection of taxes by local authorities helps to develop local authority ownership and support for measures to control ASM in protected forests.
• NGO-led community engagement with local authorities and local miners to establish local mining rules and delimitation of gold corridors or minable areas in a participatory process can show positive results. However, the miners’ technical illegality is an impediment to central government support and renders the community engagement agreements fragile.
• Designation by the park management of mineral-rich areas as mining areas with controlled use can take the pressure off other areas.
3.11. MONGOLIA
Country Overview
World Bank development status Lower middle income
Indicators Year of dataGDP per capita, PPP (current international $) 12,276 2016
GNI per capita, PPP (current international $) 11,450 2016
% population living in poverty (<$1.90/day) 0.2 2014
Gini index (World Bank estimate) 32 2014
% total unemployment of total labor force (ILO estimate) 6.4 2017
Yale Environmental Performance Index 64.4 2016
Mongolia is a lower-middle-income country with a population of just over 3 million. Nearly half of the GDP comes from services, 20 percent from mining, and 13 percent from agriculture (Focus Economics 2017). The
mining spectrum ranges from large-scale mining to medium-scale mining, with an additional significant subsector of artisanal and small-scale mining. Coal, copper, and gold are the principal reserves mined in
129FOREST-SMART MINING
Mongolia. The minerals boom of the past 20 years is the source of the rising incomes and most indicators for human development, but it has also brought negative impacts for some Mongolians (for example, herders affected by transportation and mining infrastructure). The development of the mining industry has also brought with it political turbulence as successive government administrations adjust to the policies and practices of joint venture, and as rural stakeholders are variously impacted across the country.
Official statistics suggest that 38,000 ASMers are currently active in Mongolia, whereas unofficial estimates suggest a number closer to 100,000, with an additional 400,000 people indirectly dependent on the sector (SDC 2018). Of the active artisanal miners, an estimated 10,000 are formalized. The current term of legal reference for mining in Mongolia is the Minerals Law of 2010. The most recent development of mining law relevant to ASM has been the posting of revised procedures in May 2017 to, among other things, “establish a registry of artisanal miners, provide effective regulatory tools to mitigate environmental impacts from ASM and raise the requirement for the capacity of machinery.” In particular, May 2017 saw the adoption of a revised Regulation 151 on small-scale mining, within the Minerals Law, introducing the Frugal Rehabilitation Methodology (FRM) for ASM.
It is estimated that about 8 percent of Mongolia supports closed forest systems, and this percentage is extended where forest occurs in mosaic with forest-steppe and other open steppe habitats. Forest ecosystems in Mongolia occur across the north-central parts of the country, where the Siberian boreal taiga extends into the northern provinces of Khovsgol, Bulgan, Selenge, and Khentii. Approximately 80–90 percent of Mongolia’s forests are legally protected, both within and outside of protected areas. Mongolia has 21 priority protected areas for forest ecosystems that are vulnerable to ASM. They are either designated primarily for the representative forest ecozones and habitats that they support, or contain forest as a key ecological component of a forest-steppe matrix. Such areas as the Kentii Mountain taiga forests buffering the Khan Khentii Strictly Protected Area are already experiencing alluvial ASM and medium-scale gold mining and continue to be vulnerable to such mining developments. However, while the impacts of ASM can be locally significant along riparian zones where alluvial gold mining is operational, it is not considered to pose significant threats to forest cover in Mongolia overall.
The Long Name Law (“To Prohibit Mineral Exploration and Mining Operations at River Headwaters, Protected Zones of Water Reservoirs and Forested Areas”) was adopted
in 2009 to address such local impacts, resulting in many small-scale mining licenses being suspended. The suspensions officially held until 2015, although mining often continued under the guise of “rehabilitation.” Even under the general Law on Forestry (2007), forests within 1 kilometer of water sources are restricted; therefore, alluvial mining in such riparian forests was in contravention of this law.
A significant barrier to acceptance of the ASM community among stakeholders in the country-side was the prevalence of abandoned and degraded ASM lands that posed hazards and undermined the quality of pasturelands. In addition, illegal ASM activities within protected areas and lack of commitment to rehabilitation resulted in further widespread opposition to ASM activity. To address this and improve the ASM sector’s license to operate, the Sustainable Artisanal Mining (SAM) Project, introduced by the Swiss Agency for Development and Cooperation (SDC) in 2005, sought to encourage ASM formalization in Mongolia. During SAM’s third phase of implementation, the Engaging Stakeholders in Environmental Conservation II (ESEC II) project was initiated to address the environmental impacts of Mongolia’s ASM sector in collaboration with all stakeholders. SAM’s collaborative effort helped incorporate ASM into Mongolia’s revised Minerals Law of 2010 and was instrumental in introducing rehabilitation as a legal requirement for ASM.
Is Mongolia’s Mining Sector Forest Smart?
Central to the issue of encouraging environmentally responsible ASM is encouraging formalization through enhanced capacity and responsibility. The presence of international donors/supporters and the commitment of the Mongolian government have been critical in the implementation of formalization and capacity building with the SDC SAM project. Since 2013, the ESEC II project has successfully built environmental technical and governance capacity across 45 soums, with ASM organizations now applying environmental management and rehabilitation.
Practical and affordable mechanisms now exist in Mongolia for encouraging and realizing environmentally responsible ASM, particularly with respect to the integration of frugal rehabilitation into the ASM mine cycle. With the ESEC II project’s closure in 2016, this momentum needs to be maintained by the government by scaling up to other areas and continuing to address the remaining barriers to formalization, such as certain legislations, license reviews, monitoring and enforcement.
For example, lack of access to appropriate and suitable
130 FOREST-SMART MINING
mining land for ASM will continue to be an obstacle to formalization and will continue to engender illegal ASM in forests and other protected areas. With over 3,500 extant exploration licenses, the potential exists to identify valid license holders, their intent to mine within a given time scale, and whether such areas could be made available to formalized environmentally responsible ASM.
While the Law on Forestry 2007 in theory can safeguard protected forest zones from inappropriate mining developments, the Long Name Law 2009 appears to have had more legal leverage in protecting the forested headwaters of many river basins. However, the Long Name Law has been frequently circumvented. If mining companies are to be licensed to operate, they should now abide by revised Regulation 151 on small-scale mining and its attendant rehabilitation methodology (FRM).
Lessons Learned
• Sustained international support and a strong commitment from governments are crucial for a well-implemented formalization program. Improvements in environmental performance of ASM organizations should be a priority objective for formalization programs.
• National rehabilitation requirements and standards should be embedded into the legislation for small-scale operators, with adequate requirements for their scale of operation.
• Reliance on one law can be risky—it is preferable if both forest and mining laws have provisions for forest-smart mining, such as zone restrictions or rehabilitation requirements.
3.11.1. Noyod, Mandal soum, Selenge aimag, Mongolia
The Mongolian case study draws primarily from two national initiatives: the SAM project (SDC 2018), and the ESEC II project (2013–2016) (Asia Foundation 2015, 2016b). The projects were established to address best environmental practice in ASM and to strengthen the process of ASM formalization. During the development phase of the ESEC II project, the concept of frugal rehabilitation was conceived as an accessible approach to environmental rehabilitation of ASM-degraded abandoned lands. Frugal rehabilitation adheres to be the following:
1. Economically affordable, so that it can be under-taken by ASM with limited resources
2. Socially acceptable, so that the results of rehabilitation address the concerns and requirements of local and national stakeholders
3. Ecologically viable, so that degraded lands would be left in a condition that was technically stabilized and set on the path to an ecological recovery appropriate to locality and ecozone.
Frugal rehabilitation was piloted at 17 sites. These action-research demonstrations informed and contributed, through a process of ministerial consultation, to a Frugal Rehabilitation Methodology (Asia Foundation 2016b), which has now been approved and endorsed as a national methodology for the rehabilitation of ASM (SDC 2017) and formally integrated into the Minerals Law of 2010.
Selenge is a central northern province (aimag) of Mongolia. It is one of the most forested aimags, with boreal taiga, forest-steppe, and riparian forests. The case study focuses on the activities of an ASM NGO operating in Noyod, which demonstrated—through the ESEC II project—their capacity and commitment to introduce frugal rehabilitation into the mine cycle process (Asia Foundation 2016a). The NGO has a legal mining license to operate. Gold at Noyod is mined from hard-rock deposits on a steep forested hillside, unlike the typical alluvial ASM common in Selenge.
The ASM site had a limited footprint, extending to some 2–3 hectares. Abandoned artisanal mining works—the subject of the frugal rehabilitation demonstration project—extended to over 1 hectare. The area has relatively abundant rainfall and deep forest soils that retain moisture and were assessed to have a high potential for natural regeneration. The ASM site is located in a birch-pine forest, on the edge of mountain steppe grasslands. The forest has been structurally changed by fires that occurred in the 1990s.
The site was elected as a pilot for the FRM on the basis of meeting criteria for ecological representation, accessibility, ASM NGO capacity, and potential for successful restoration. The application of the methodology at the site was based on an adaptive and opportunistic approach, utilizing all materials available for both affordable and effective technical rehabilitation as well as optimal use of soils and organic and vegetative materials for taking advantage of the natural rehabilitation potential of the area.
In summary, the rehabilitation process consisted of the following steps:
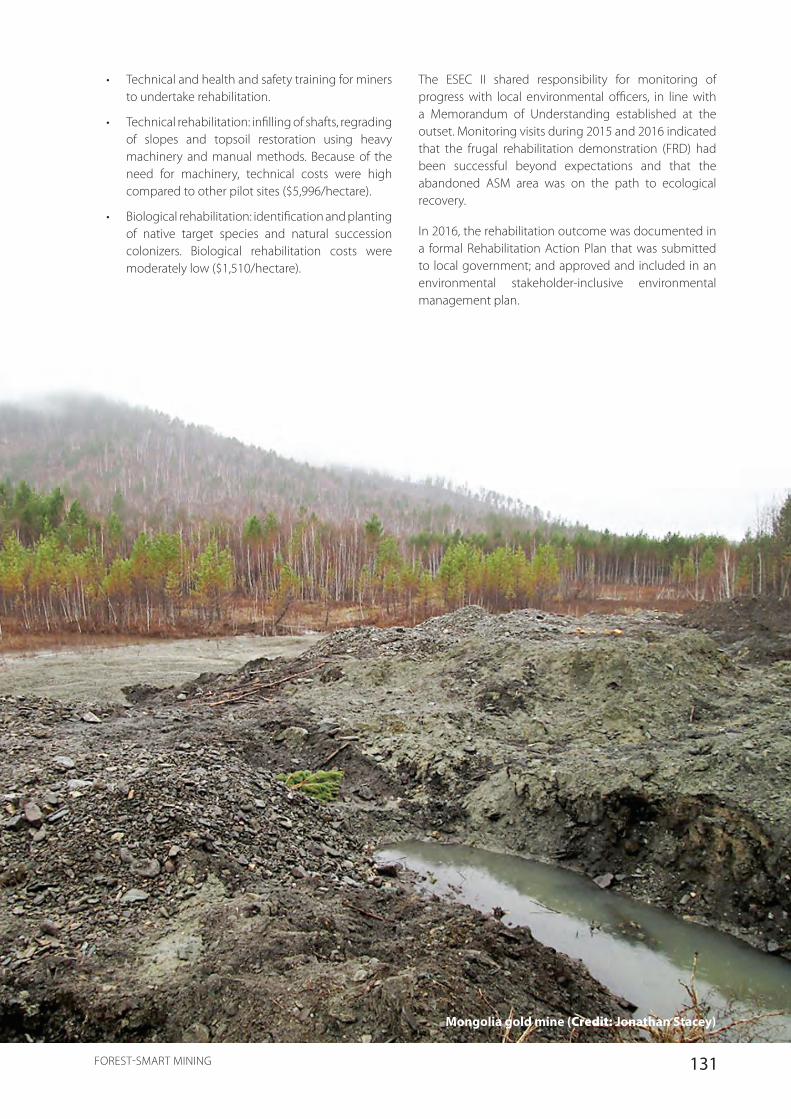
131FOREST-SMART MINING
• Technical and health and safety training for miners to undertake rehabilitation.
• Technical rehabilitation: infilling of shafts, regrading of slopes and topsoil restoration using heavy machinery and manual methods. Because of the need for machinery, technical costs were high compared to other pilot sites ($5,996/hectare).
• Biological rehabilitation: identification and planting of native target species and natural succession colonizers. Biological rehabilitation costs were moderately low ($1,510/hectare).
The ESEC II shared responsibility for monitoring of progress with local environmental officers, in line with a Memorandum of Understanding established at the outset. Monitoring visits during 2015 and 2016 indicated that the frugal rehabilitation demonstration (FRD) had been successful beyond expectations and that the abandoned ASM area was on the path to ecological recovery.
In 2016, the rehabilitation outcome was documented in a formal Rehabilitation Action Plan that was submitted to local government; and approved and included in an environmental stakeholder-inclusive environmental management plan.
Mongolia gold mine (Credit: Jonathan Stacey)

132 FOREST-SMART MINING
Forest Health and Impacts
Figure 3-39 GIS Analysis of Deforestation and Proximity to Recognized Forest Resources in and around Noyod, 2000–2016
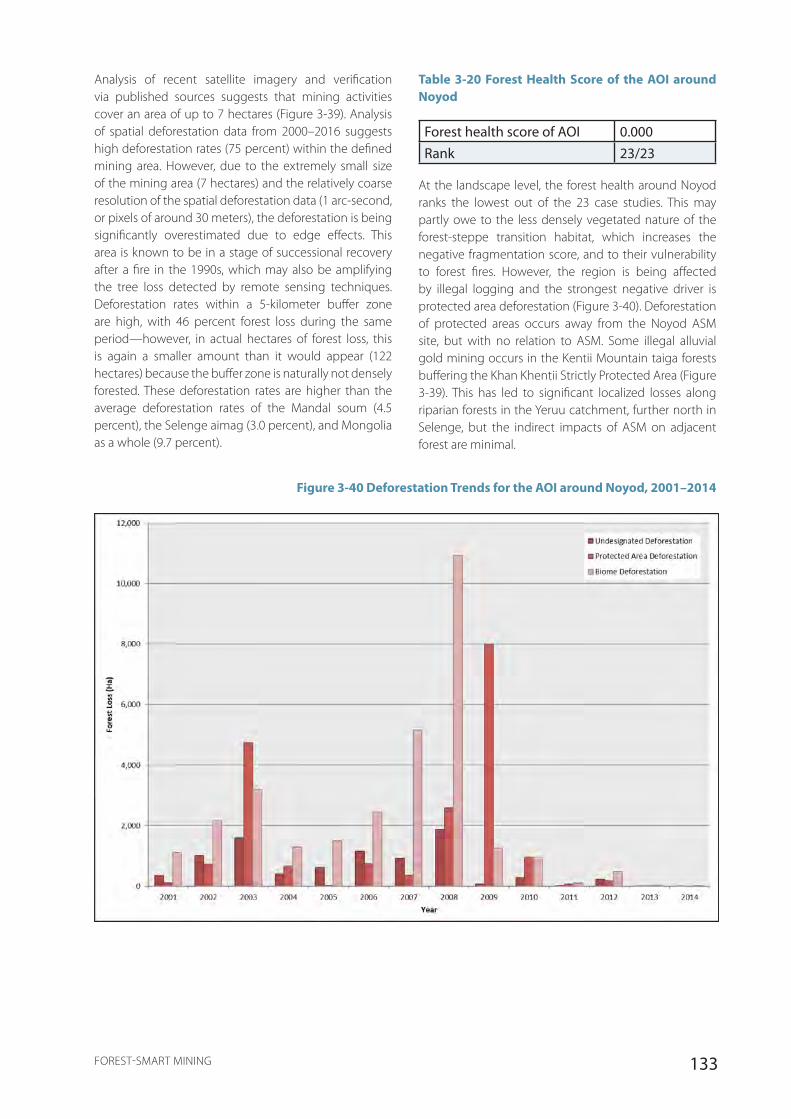
133FOREST-SMART MINING
Analysis of recent satellite imagery and verification via published sources suggests that mining activities cover an area of up to 7 hectares (Figure 3-39). Analysis of spatial deforestation data from 2000–2016 suggests high deforestation rates (75 percent) within the defined mining area. However, due to the extremely small size of the mining area (7 hectares) and the relatively coarse resolution of the spatial deforestation data (1 arc-second, or pixels of around 30 meters), the deforestation is being significantly overestimated due to edge effects. This area is known to be in a stage of successional recovery after a fire in the 1990s, which may also be amplifying the tree loss detected by remote sensing techniques. Deforestation rates within a 5-kilometer buffer zone are high, with 46 percent forest loss during the same period—however, in actual hectares of forest loss, this is again a smaller amount than it would appear (122 hectares) because the buffer zone is naturally not densely forested. These deforestation rates are higher than the average deforestation rates of the Mandal soum (4.5 percent), the Selenge aimag (3.0 percent), and Mongolia as a whole (9.7 percent).
Table 3-20 Forest Health Score of the AOI around Noyod
Forest health score of AOI 0.000Rank 23/23
At the landscape level, the forest health around Noyod ranks the lowest out of the 23 case studies. This may partly owe to the less densely vegetated nature of the forest-steppe transition habitat, which increases the negative fragmentation score, and to their vulnerability to forest fires. However, the region is being affected by illegal logging and the strongest negative driver is protected area deforestation (Figure 3-40). Deforestation of protected areas occurs away from the Noyod ASM site, but with no relation to ASM. Some illegal alluvial gold mining occurs in the Kentii Mountain taiga forests buffering the Khan Khentii Strictly Protected Area (Figure 3-39). This has led to significant localized losses along riparian forests in the Yeruu catchment, further north in Selenge, but the indirect impacts of ASM on adjacent forest are minimal.
Figure 3-40 Deforestation Trends for the AOI around Noyod, 2001–2014

134 FOREST-SMART MINING
Conclusions
ASM is not a significant driver of forest loss and degradation in Mongolia, although there are undoubtedly locally significant impacts on hydrology and riparian forest loss. Widespread degradation and particularly protected area deforestation is not strongly associated with ASM across Mongolia’s northern forests.
The success of the FRM owes to positive action at two levels:
• At the site level, the physical constraints and characteristics of the site were adequately assessed for a good rehabilitation plan that makes use of locally available resources and takes advantage of the natural regeneration capacity of the ecosystem.
• At the governance level, the FRM succeeded because of the inclusive process of engaging all local stakeholders, close collaboration with the national ministries and committed long-term support from the Asia Foundation (ESEC II project) and the Swiss Cooperation for Development (SAM project).
Having a well-established and formal ASM organization was fundamental, first in engendering interest in
rehabilitation, and second in allowing ASM to access formal assistance from partners. An integrated approach consisting of the simultaneous creation of appropriate toolkits along with capacity building of all relevant stakeholders has been crucial for successful formalization and achieving widespread acceptance of the process (Figure 3-41). While Mongolia has prioritized the formalization of their ASM sector, greater incentives for conditional ASM formalization could be realized through closer scrutiny of ASM in forested areas in terms of improved environmental governance and use of the now accepted rehabilitation methodologies.
Lessons Learned
• Rehabilitation methods for ASM must be designed to be as simple and economical as possible, fit the habitat type, and require limited technical capabilities. The Frugal Rehabilitation Methodology is a good example of how that can be achieved.
• To ensure that rehabilitation becomes systematic practice, formal ASM organizations with accountability structures are required and rehabilitation requirements should be adopted into environmental legislation for ASM.
Figure 3-41 Formalizing an ASM-Inclusive Environmental Management Plan through Environmental Toolkits and Capacity Building
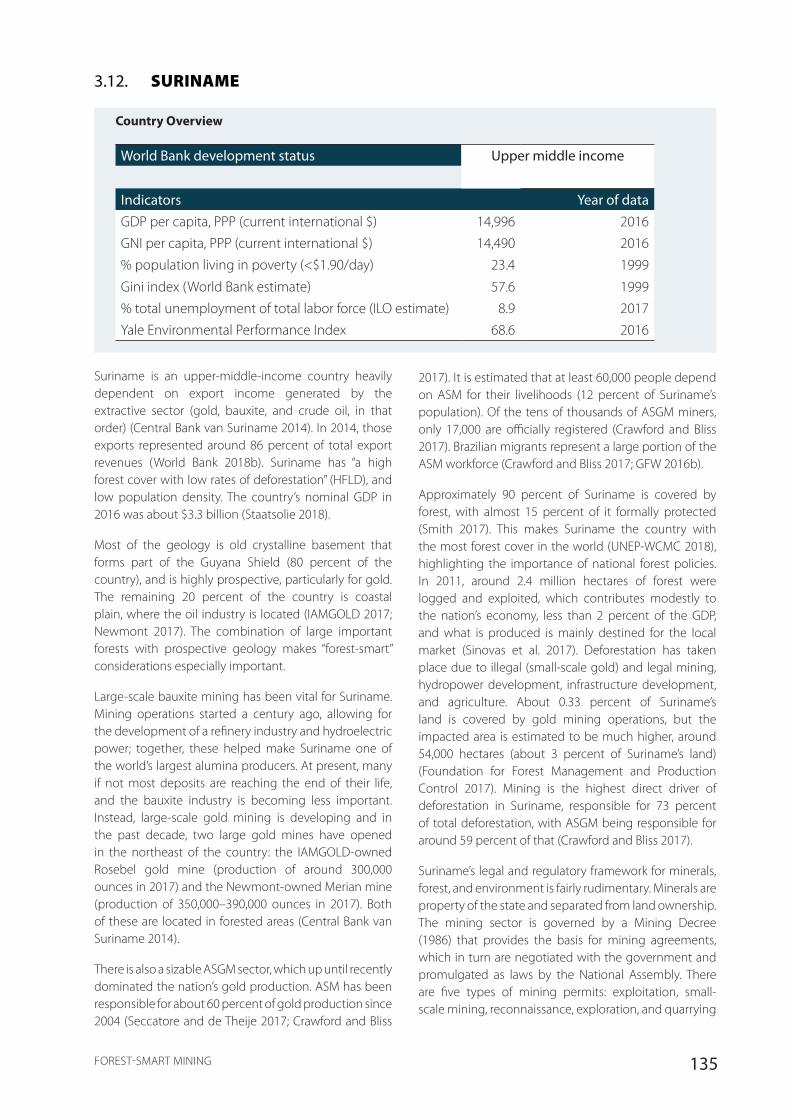
135FOREST-SMART MINING
3.12. SURINAME
Country Overview
World Bank development status Upper middle income
Indicators Year of dataGDP per capita, PPP (current international $) 14,996 2016GNI per capita, PPP (current international $) 14,490 2016% population living in poverty (<$1.90/day) 23.4 1999
Gini index (World Bank estimate) 57.6 1999% total unemployment of total labor force (ILO estimate) 8.9 2017Yale Environmental Performance Index 68.6 2016
Suriname is an upper-middle-income country heavily dependent on export income generated by the extractive sector (gold, bauxite, and crude oil, in that order) (Central Bank van Suriname 2014). In 2014, those exports represented around 86 percent of total export revenues (World Bank 2018b). Suriname has “a high forest cover with low rates of deforestation” (HFLD), and low population density. The country’s nominal GDP in 2016 was about $3.3 billion (Staatsolie 2018).
Most of the geology is old crystalline basement that forms part of the Guyana Shield (80 percent of the country), and is highly prospective, particularly for gold. The remaining 20 percent of the country is coastal plain, where the oil industry is located (IAMGOLD 2017; Newmont 2017). The combination of large important forests with prospective geology makes “forest-smart” considerations especially important.
Large-scale bauxite mining has been vital for Suriname. Mining operations started a century ago, allowing for the development of a refinery industry and hydroelectric power; together, these helped make Suriname one of the world’s largest alumina producers. At present, many if not most deposits are reaching the end of their life, and the bauxite industry is becoming less important. Instead, large-scale gold mining is developing and in the past decade, two large gold mines have opened in the northeast of the country: the IAMGOLD-owned Rosebel gold mine (production of around 300,000 ounces in 2017) and the Newmont-owned Merian mine (production of 350,000–390,000 ounces in 2017). Both of these are located in forested areas (Central Bank van Suriname 2014).
There is also a sizable ASGM sector, which up until recently dominated the nation’s gold production. ASM has been responsible for about 60 percent of gold production since 2004 (Seccatore and de Theije 2017; Crawford and Bliss
2017). It is estimated that at least 60,000 people depend on ASM for their livelihoods (12 percent of Suriname’s population). Of the tens of thousands of ASGM miners, only 17,000 are officially registered (Crawford and Bliss 2017). Brazilian migrants represent a large portion of the ASM workforce (Crawford and Bliss 2017; GFW 2016b).
Approximately 90 percent of Suriname is covered by forest, with almost 15 percent of it formally protected (Smith 2017). This makes Suriname the country with the most forest cover in the world (UNEP-WCMC 2018), highlighting the importance of national forest policies. In 2011, around 2.4 million hectares of forest were logged and exploited, which contributes modestly to the nation’s economy, less than 2 percent of the GDP, and what is produced is mainly destined for the local market (Sinovas et al. 2017). Deforestation has taken place due to illegal (small-scale gold) and legal mining, hydropower development, infrastructure development, and agriculture. About 0.33 percent of Suriname’s land is covered by gold mining operations, but the impacted area is estimated to be much higher, around 54,000 hectares (about 3 percent of Suriname’s land) (Foundation for Forest Management and Production Control 2017). Mining is the highest direct driver of deforestation in Suriname, responsible for 73 percent of total deforestation, with ASGM being responsible for around 59 percent of that (Crawford and Bliss 2017).
Suriname’s legal and regulatory framework for minerals, forest, and environment is fairly rudimentary. Minerals are property of the state and separated from land ownership. The mining sector is governed by a Mining Decree (1986) that provides the basis for mining agreements, which in turn are negotiated with the government and promulgated as laws by the National Assembly. There are five types of mining permits: exploitation, small-scale mining, reconnaissance, exploration, and quarrying
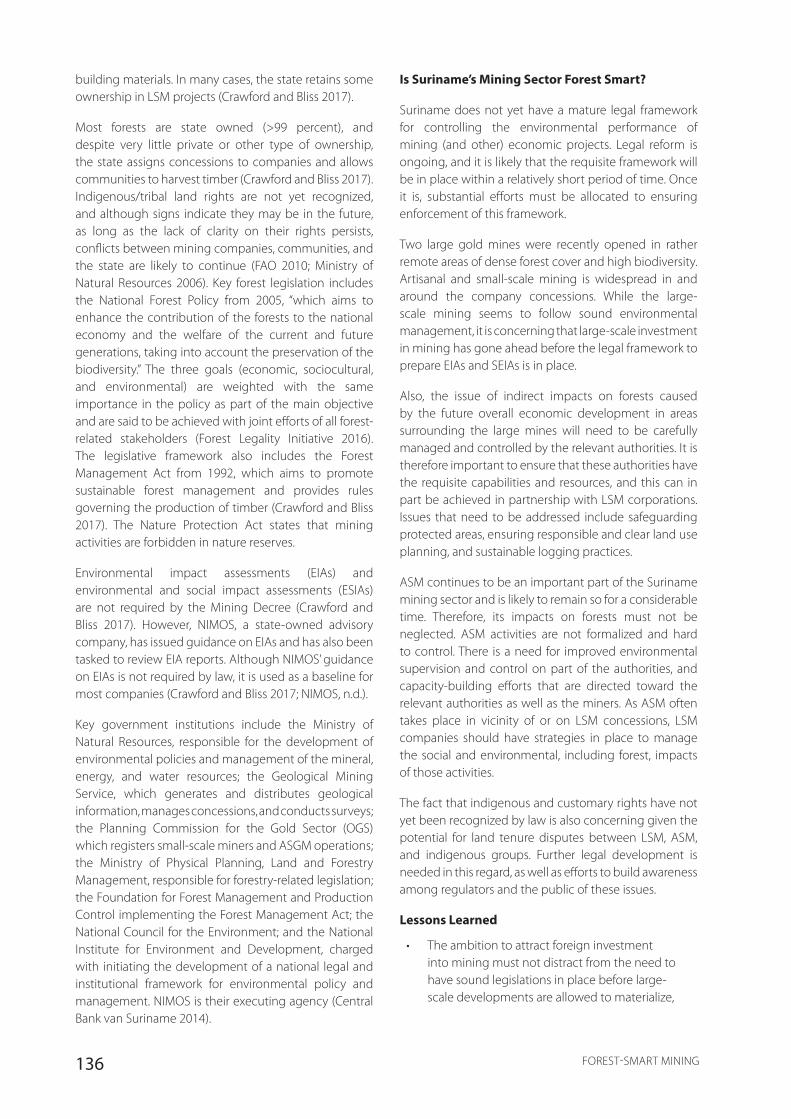
136 FOREST-SMART MINING
building materials. In many cases, the state retains some ownership in LSM projects (Crawford and Bliss 2017).
Most forests are state owned (>99 percent), and despite very little private or other type of ownership, the state assigns concessions to companies and allows communities to harvest timber (Crawford and Bliss 2017). Indigenous/tribal land rights are not yet recognized, and although signs indicate they may be in the future, as long as the lack of clarity on their rights persists, conflicts between mining companies, communities, and the state are likely to continue (FAO 2010; Ministry of Natural Resources 2006). Key forest legislation includes the National Forest Policy from 2005, “which aims to enhance the contribution of the forests to the national economy and the welfare of the current and future generations, taking into account the preservation of the biodiversity.” The three goals (economic, sociocultural, and environmental) are weighted with the same importance in the policy as part of the main objective and are said to be achieved with joint efforts of all forest-related stakeholders (Forest Legality Initiative 2016). The legislative framework also includes the Forest Management Act from 1992, which aims to promote sustainable forest management and provides rules governing the production of timber (Crawford and Bliss 2017). The Nature Protection Act states that mining activities are forbidden in nature reserves.
Environmental impact assessments (EIAs) and environmental and social impact assessments (ESIAs) are not required by the Mining Decree (Crawford and Bliss 2017). However, NIMOS, a state-owned advisory company, has issued guidance on EIAs and has also been tasked to review EIA reports. Although NIMOS’ guidance on EIAs is not required by law, it is used as a baseline for most companies (Crawford and Bliss 2017; NIMOS, n.d.).
Key government institutions include the Ministry of Natural Resources, responsible for the development of environmental policies and management of the mineral, energy, and water resources; the Geological Mining Service, which generates and distributes geological information, manages concessions, and conducts surveys; the Planning Commission for the Gold Sector (OGS) which registers small-scale miners and ASGM operations; the Ministry of Physical Planning, Land and Forestry Management, responsible for forestry-related legislation; the Foundation for Forest Management and Production Control implementing the Forest Management Act; the National Council for the Environment; and the National Institute for Environment and Development, charged with initiating the development of a national legal and institutional framework for environmental policy and management. NIMOS is their executing agency (Central Bank van Suriname 2014).
Is Suriname’s Mining Sector Forest Smart?
Suriname does not yet have a mature legal framework for controlling the environmental performance of mining (and other) economic projects. Legal reform is ongoing, and it is likely that the requisite framework will be in place within a relatively short period of time. Once it is, substantial efforts must be allocated to ensuring enforcement of this framework.
Two large gold mines were recently opened in rather remote areas of dense forest cover and high biodiversity. Artisanal and small-scale mining is widespread in and around the company concessions. While the large-scale mining seems to follow sound environmental management, it is concerning that large-scale investment in mining has gone ahead before the legal framework to prepare EIAs and SEIAs is in place.
Also, the issue of indirect impacts on forests caused by the future overall economic development in areas surrounding the large mines will need to be carefully managed and controlled by the relevant authorities. It is therefore important to ensure that these authorities have the requisite capabilities and resources, and this can in part be achieved in partnership with LSM corporations. Issues that need to be addressed include safeguarding protected areas, ensuring responsible and clear land use planning, and sustainable logging practices.
ASM continues to be an important part of the Suriname mining sector and is likely to remain so for a considerable time. Therefore, its impacts on forests must not be neglected. ASM activities are not formalized and hard to control. There is a need for improved environmental supervision and control on part of the authorities, and capacity-building efforts that are directed toward the relevant authorities as well as the miners. As ASM often takes place in vicinity of or on LSM concessions, LSM companies should have strategies in place to manage the social and environmental, including forest, impacts of those activities.
The fact that indigenous and customary rights have not yet been recognized by law is also concerning given the potential for land tenure disputes between LSM, ASM, and indigenous groups. Further legal development is needed in this regard, as well as efforts to build awareness among regulators and the public of these issues.
Lessons Learned
• The ambition to attract foreign investment into mining must not distract from the need to have sound legislations in place before large-scale developments are allowed to materialize,

137FOREST-SMART MINING
including regulations around environmental impacts as well as community rights.
• Strategic environmental studies should be performed to properly plan for, and manage, the indirect impacts that could arise from the establishment of LSM and ASM in forested areas.
3.12.1. ASM in and around Merian Mine, Suriname
Newmont’s Merian gold mine is located between the Marowijne and Commerwijne watersheds, 60 kilometers south of the Moengo–Langa Tabiki Road and about 170 kilometers away from Paramaribo. Langa Tabiki is the nearest permanent settlement. The total right of exploration area is of 25,900 hectares, which is a largely undeveloped area mainly covered with primary high dryland forest (ERM 2013b). Nine terrestrial species listed as vulnerable on the IUCN Red List have been found in the area (ERM 2013a).
The area in and around Merian is inhabited by the Pamaka (or Paramaka), one of the three autonomous groups of the Eastern Maroon (EM) community, numbering approximately 1,200 people in Merian’s project area (Resolve 2017). The Pamaka community settled along the Marowijne River in 1760 and was composed of slaves fleeing from Suriname’s sugarcane, coffee, cocoa, and cotton plantations (ERM 2013b). The Pamaka community has been involved in ASM since the 1990s (Seccatore and de Theije 2017) together with Brazilian migrants (garimpeiros), who introduced new methods of gold mining (Hoogbergen and Kruijt 2004). Tensions between artisanal miners and Merian began in 2010. In 2011, ASMers were peacefully evicted from the region by the government under Newmont’s request. Pamakans were given an alternative mining area in exchange that was not as prospective, which led to informal miners reentering Newmont’s concession area (Resolve 2017). A second eviction took place in 2015, following which Pamaka communities protested and created the Pamaka
Negotiation Committee (POC) to represent them in discussions with Newmont (Crawford and Bliss 2017). With success, as of 2016, the government, Newmont, and the Pamaka community signed a Memorandum of Understanding (MoU) in order to find win-win long-term solutions for both the mining company and the communities, and a Community Development Fund (CDF) was created. Nowadays, ASM is present right at the boundary of the concession, although there are incursions into the concession (Newmont, pers. comm., 2017). ASM practices are reported to be alluvial, seasonal, semi-mechanized, or non-mechanized and include the use of mercury and cyanide (Vaneeckhaute et al. 2017).
The IGF assessment (Crawford and Bliss 2017) identified several gaps in the environmental and ASM management legislations in Suriname. Regulations do not provide for an environmental authority, the regulation for mercury usage (Minamata Convention not ratified), and the preparation of an emergency plan. Moreover, the environmental legislation is limited, with clear gaps in the areas of environmental and social impact assessments; enhancement of local development and national development goals; community consultations; financial reassurance funds; measures to address commodity price volatility; protection of women, children, marginalized people, and ASMers; and best practices on environmental management (Crawford and Bliss 2017). Lastly, although a rehabilitation plan after mine closure is required for the exploitation permit, the plan details are vague, and it is unclear to what extent communities need to be involved and the extent of environmental and social impacts to mitigate (Crawford and Bliss 2017).
The draft Environmental Act and Mining Act of 2004 have not been adopted by the parliament of Suriname, which, together with the lack of an environmental authority, makes it very difficult to enforce environmental norms and conservation measures (Crawford and Bliss 2017).

138 FOREST-SMART MINING
Forest Health and Impacts
Figure 3-42 GIS Analysis of Deforestation and Proximity to Recognized Forest Resources in and around Merian, 2000–2016

139FOREST-SMART MINING
Figure 3-43 GIS Analysis of Annual Deforestation and Proximity to Recognized Forest Resources in and around Merian, 2000–2016

140 FOREST-SMART MINING
Mining happens along most tributaries within the concession, covering an approximate area of 2,939 hectares (Figure 3-42). Analysis of spatial deforestation data from 2000–2016 reveals high deforestation rates (55 percent) within the defined mining area. Deforestation rates within the 5-kilometer buffer zone are also high, with 5.1 percent forest loss during the same period. These are higher than average deforestation rates in the Sipalwini district (0.5 percent) and in Suriname as a whole (0.9 percent) during the same time period
There was dispersed and substantial deforestation prior to the start of Newmont’s operations in 2014 along streams, which likely can be attributed to ASM (Figure 3-43). Agriculture and logging activities in that area are limited and do not appear to be as large a driver of deforestation.
Table 3-21 Forest Health Score of the AOI around Merian
Forest health score of AOI 0.377Rank 9/23
At the landscape scale, deforestation has been steadily increasing since 2000 (Figure 3-44). Despite the presence of large areas of core and intact forest, core forest being the strongest positive driver of forest health, the forest health score of the AOI was only modestly high (Table 3-21). Population change was the main negative driver, which likely reflects the 2010/11 gold rush, during which miners migrated mainly from Brazil but also from French Guyana, Guyana, and other parts of Suriname to the area (Resolve 2017).
Figure 3-44 Deforestation Trends for the AOI around Merian, 2001–2014
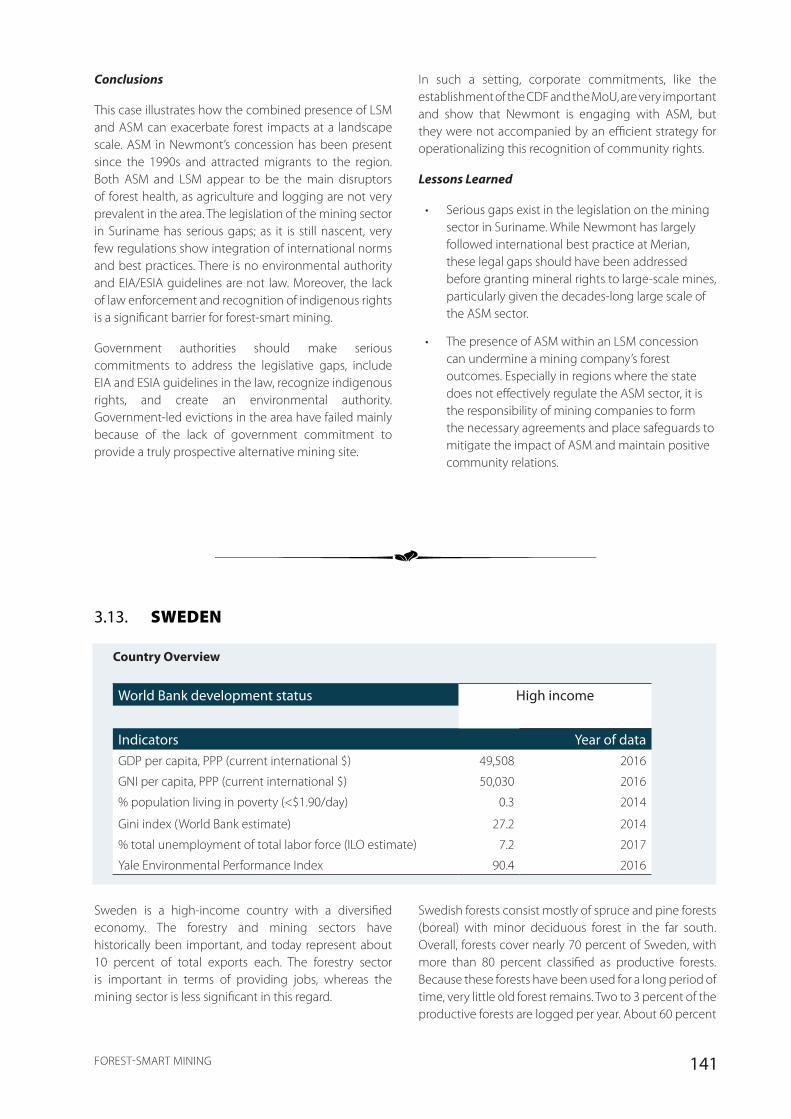
141FOREST-SMART MINING
Conclusions
This case illustrates how the combined presence of LSM and ASM can exacerbate forest impacts at a landscape scale. ASM in Newmont’s concession has been present since the 1990s and attracted migrants to the region. Both ASM and LSM appear to be the main disruptors of forest health, as agriculture and logging are not very prevalent in the area. The legislation of the mining sector in Suriname has serious gaps; as it is still nascent, very few regulations show integration of international norms and best practices. There is no environmental authority and EIA/ESIA guidelines are not law. Moreover, the lack of law enforcement and recognition of indigenous rights is a significant barrier for forest-smart mining.
Government authorities should make serious commitments to address the legislative gaps, include EIA and ESIA guidelines in the law, recognize indigenous rights, and create an environmental authority. Government-led evictions in the area have failed mainly because of the lack of government commitment to provide a truly prospective alternative mining site.
In such a setting, corporate commitments, like the establishment of the CDF and the MoU, are very important and show that Newmont is engaging with ASM, but they were not accompanied by an efficient strategy for operationalizing this recognition of community rights.
Lessons Learned
• Serious gaps exist in the legislation on the mining sector in Suriname. While Newmont has largely followed international best practice at Merian, these legal gaps should have been addressed before granting mineral rights to large-scale mines, particularly given the decades-long large scale of the ASM sector.
• The presence of ASM within an LSM concession can undermine a mining company’s forest outcomes. Especially in regions where the state does not effectively regulate the ASM sector, it is the responsibility of mining companies to form the necessary agreements and place safeguards to mitigate the impact of ASM and maintain positive community relations.
3.13. SWEDEN
Country Overview
World Bank development status High income
Indicators Year of dataGDP per capita, PPP (current international $) 49,508 2016
GNI per capita, PPP (current international $) 50,030 2016
% population living in poverty (<$1.90/day) 0.3 2014
Gini index (World Bank estimate) 27.2 2014
% total unemployment of total labor force (ILO estimate) 7.2 2017
Yale Environmental Performance Index 90.4 2016
Sweden is a high-income country with a diversified economy. The forestry and mining sectors have historically been important, and today represent about 10 percent of total exports each. The forestry sector is important in terms of providing jobs, whereas the mining sector is less significant in this regard.
Swedish forests consist mostly of spruce and pine forests (boreal) with minor deciduous forest in the far south. Overall, forests cover nearly 70 percent of Sweden, with more than 80 percent classified as productive forests. Because these forests have been used for a long period of time, very little old forest remains. Two to 3 percent of the productive forests are logged per year. About 60 percent
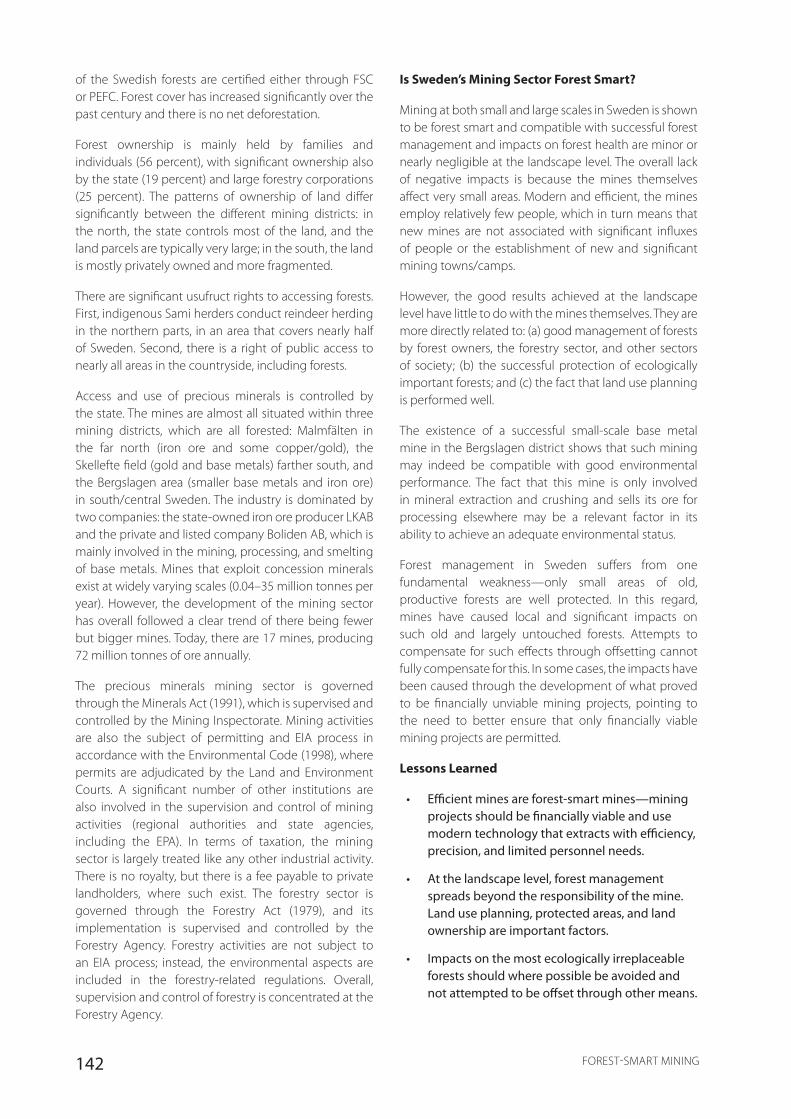
142 FOREST-SMART MINING
of the Swedish forests are certified either through FSC or PEFC. Forest cover has increased significantly over the past century and there is no net deforestation.
Forest ownership is mainly held by families and individuals (56 percent), with significant ownership also by the state (19 percent) and large forestry corporations (25 percent). The patterns of ownership of land differ significantly between the different mining districts: in the north, the state controls most of the land, and the land parcels are typically very large; in the south, the land is mostly privately owned and more fragmented.
There are significant usufruct rights to accessing forests. First, indigenous Sami herders conduct reindeer herding in the northern parts, in an area that covers nearly half of Sweden. Second, there is a right of public access to nearly all areas in the countryside, including forests.
Access and use of precious minerals is controlled by the state. The mines are almost all situated within three mining districts, which are all forested: Malmfälten in the far north (iron ore and some copper/gold), the Skellefte field (gold and base metals) farther south, and the Bergslagen area (smaller base metals and iron ore) in south/central Sweden. The industry is dominated by two companies: the state-owned iron ore producer LKAB and the private and listed company Boliden AB, which is mainly involved in the mining, processing, and smelting of base metals. Mines that exploit concession minerals exist at widely varying scales (0.04–35 million tonnes per year). However, the development of the mining sector has overall followed a clear trend of there being fewer but bigger mines. Today, there are 17 mines, producing 72 million tonnes of ore annually.
The precious minerals mining sector is governed through the Minerals Act (1991), which is supervised and controlled by the Mining Inspectorate. Mining activities are also the subject of permitting and EIA process in accordance with the Environmental Code (1998), where permits are adjudicated by the Land and Environment Courts. A significant number of other institutions are also involved in the supervision and control of mining activities (regional authorities and state agencies, including the EPA). In terms of taxation, the mining sector is largely treated like any other industrial activity. There is no royalty, but there is a fee payable to private landholders, where such exist. The forestry sector is governed through the Forestry Act (1979), and its implementation is supervised and controlled by the Forestry Agency. Forestry activities are not subject to an EIA process; instead, the environmental aspects are included in the forestry-related regulations. Overall, supervision and control of forestry is concentrated at the Forestry Agency.
Is Sweden’s Mining Sector Forest Smart?
Mining at both small and large scales in Sweden is shown to be forest smart and compatible with successful forest management and impacts on forest health are minor or nearly negligible at the landscape level. The overall lack of negative impacts is because the mines themselves affect very small areas. Modern and efficient, the mines employ relatively few people, which in turn means that new mines are not associated with significant influxes of people or the establishment of new and significant mining towns/camps.
However, the good results achieved at the landscape level have little to do with the mines themselves. They are more directly related to: (a) good management of forests by forest owners, the forestry sector, and other sectors of society; (b) the successful protection of ecologically important forests; and (c) the fact that land use planning is performed well.
The existence of a successful small-scale base metal mine in the Bergslagen district shows that such mining may indeed be compatible with good environmental performance. The fact that this mine is only involved in mineral extraction and crushing and sells its ore for processing elsewhere may be a relevant factor in its ability to achieve an adequate environmental status.
Forest management in Sweden suffers from one fundamental weakness—only small areas of old, productive forests are well protected. In this regard, mines have caused local and significant impacts on such old and largely untouched forests. Attempts to compensate for such effects through offsetting cannot fully compensate for this. In some cases, the impacts have been caused through the development of what proved to be financially unviable mining projects, pointing to the need to better ensure that only financially viable mining projects are permitted.
Lessons Learned
• Efficient mines are forest-smart mines—mining projects should be financially viable and use modern technology that extracts with efficiency, precision, and limited personnel needs.
• At the landscape level, forest management spreads beyond the responsibility of the mine. Land use planning, protected areas, and land ownership are important factors.
• Impacts on the most ecologically irreplaceable forests should where possible be avoided and not attempted to be offset through other means.

143FOREST-SMART MINING
3.13.1. Lovisagruvan, Sweden
Photo 3-7 Satellite Image of Lovisagruvan
Located in a forested, rural landscape, the Lovisagruvan mine site (center) is about 400 meters across from the southwest to northeast corners. Photograph from Google Earth.
144 FOREST-SMART MINING
The Lovisagruvan lead and zinc mine is located in a rural area in Örebro County, in the Bergslagen mining district of central Sweden. The local forest is boreal and fairly fragmented; most stands are productive forests that are logged at regular intervals and mainly privately owned. Some forests nearby are protected to varying degrees, and about 25 kilometers north, there is a large natural reserve where forestry is allowed (Malingsbo-Kloten reserve, 265 square kilometers). Sweden’s largest forest fire of recent times—the 2014 Västmanland wildfire—occurred about 60 kilometers northeast of Lovisagruvan (150 square kilometers affected).
The mine is located where historically there have been numerous metal mines. It was first opened and operated during 1991–1993, after which its then owner went bankrupt. Lovisagruvan AB took over in 2004 and since then the mine has operated continuously. An underground mine, presently about 300 meters deep, it produces some 40,000 tonnes of ore annually. As the mining is selective—very little other than the ore-bearing material is extracted—and as material is backfilled, there is no requirement for depositing waste rock on-site. The mined ore is crushed, transported by trucks to a nearby harbor, and shipped for processing in Poland (prior to 2017 it was processed at the Boliden plant at Garpenberg). Therefore, no processing plant or tailings impoundments exist on-site. Lovisagruvan is Sweden’s
smallest precious minerals mine; its mineral concession covers 88 hectares, although the industrial site is only about 5 hectares. The company owns the surface rights to only a limited part of the concession area.
The company employs 18 staff at the mine. There is no mine camp, and workers commute to the site from elsewhere. Prospecting is being done near the mine as well as elsewhere. The mine’s original permit was obtained before it was necessary to perform a full EIA. However, in Sweden, all precious mineral mines irrespective of size or scale are subject to the same requirements, so Lovisagruvan must abide by a number of environmental requirements. This has led to discharges from the mine being processed, as well as measures being taken to reduce dusting from the crusher.
Lovisagruvan AB is listed on a small Swedish stock exchange (Aktietorget); the largest shareholder is Pavillion Life Insurance (14 percent), followed by a number of individuals, including at least one of the founders. The company is a member of the Swedish Mining Association, Svemin, which entails needing to abide by some guidelines relating to taking due care of the environment, and to continuously strive to improve environmental performance.

145FOREST-SMART MINING
Forest Health and Impacts
Figure 3-45 GIS Analysis of Deforestation and Proximity to Recognized Forest Resources in Lovisagruvan, 2000–2016

146 FOREST-SMART MINING
The mine license area where mining activities are conducted is small (88 hectares; Figure 3-45). Deforestation at the mine site, or in its immediate surroundings, will have little impact on the landscape-level analysis. Analysis of spatial deforestation data from 2000–2016 reveals high deforestation rates (21.7 percent) within the mining concession. Deforestation rates within a 5-kilometer buffer zone were also high, with 16.5 percent of the buffer area lost during the same period. This is higher than the average deforestation rate in Sweden (12.7 percent during the same period). However, this deforestation is caused by periodic clear-cutting, which in turn is part of the long-term management cycle of nearly all forested areas in Sweden. Thus, there is unlikely to be any net forest loss occurring.
The mining company has an interest in maintaining a forest screen around the site, as this reduces impacts from noise and dust and also makes for better aesthetics. However, one of the neighboring forest owners recently clear-cut an area bordering the mine, thereby reducing the existing forest screen. In this case, the use of selective (uneven-aged forestry) near the mine would have provided for a better outcome, at least from the mine owner’s point of view.
Table 3-22 Forest Health Score of the AOI around Lovisa
Forest health score of AOI 0.303Rank 16/23
The Forest Health Index methodology was designed primarily for developing tropical countries; it is not as well suited for a developed country scenario, where there is an active and well-managed forestry in which reforestation happens at the same time as deforestation, having close to zero net forest loss in the long term. However, analysis of the forest health score can still provide some relevant insights. Thus, there are extensive forests near the mine, although the forest landscape is overall fragmented. However, Lovisagruvan has had no role in influencing landscape-level aspects of forest health (forest health score relatively low; see Table 3-22). Instead, the health of nearby forests is affected by the fact that the area is sparsely populated, the land ownership includes many private owners who have comparatively small landholdings, and there is active forestry. Outside the 5-kilometer buffer zone, there are some seemingly well-protected forested areas, with very little protected area deforestation shown in Figure 3-46.
Figure 3-46 Deforestation Trends for the AOI around Lovisagruvan, 2001–2014
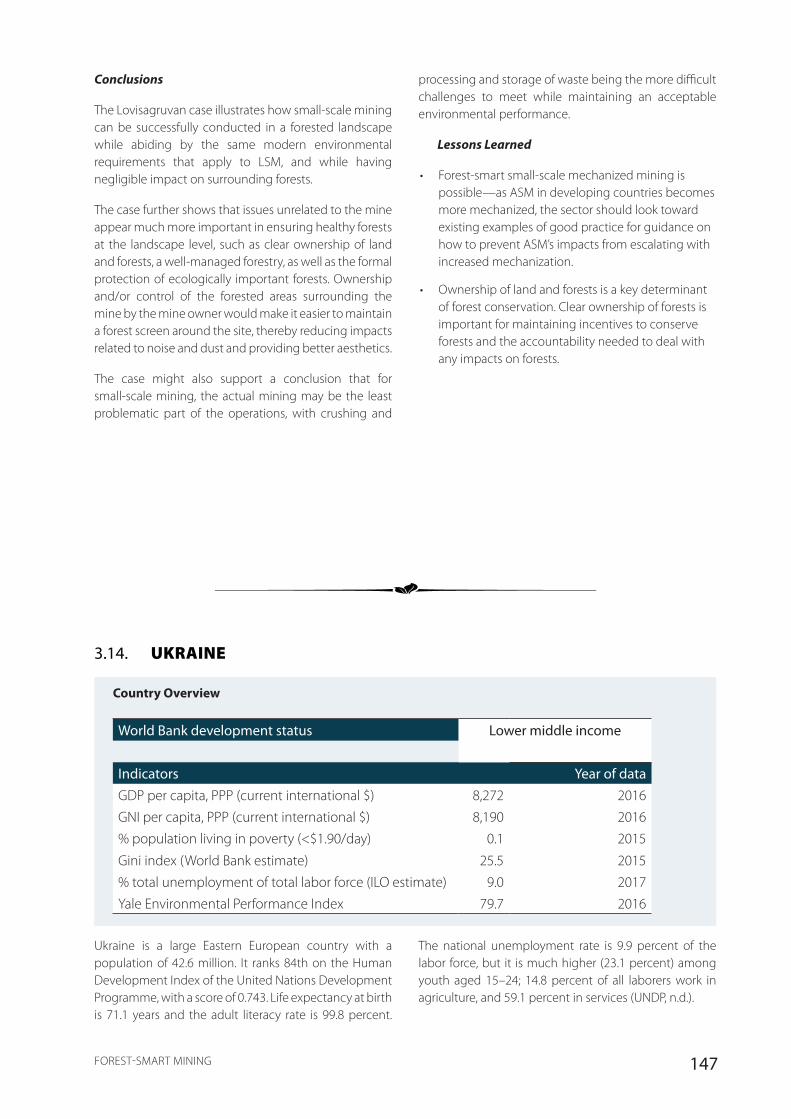
147FOREST-SMART MINING
Conclusions
The Lovisagruvan case illustrates how small-scale mining can be successfully conducted in a forested landscape while abiding by the same modern environmental requirements that apply to LSM, and while having negligible impact on surrounding forests.
The case further shows that issues unrelated to the mine appear much more important in ensuring healthy forests at the landscape level, such as clear ownership of land and forests, a well-managed forestry, as well as the formal protection of ecologically important forests. Ownership and/or control of the forested areas surrounding the mine by the mine owner would make it easier to maintain a forest screen around the site, thereby reducing impacts related to noise and dust and providing better aesthetics.
The case might also support a conclusion that for small-scale mining, the actual mining may be the least problematic part of the operations, with crushing and
processing and storage of waste being the more difficult challenges to meet while maintaining an acceptable environmental performance.
Lessons Learned
• Forest-smart small-scale mechanized mining is possible—as ASM in developing countries becomes more mechanized, the sector should look toward existing examples of good practice for guidance on how to prevent ASM’s impacts from escalating with increased mechanization.
• Ownership of land and forests is a key determinant of forest conservation. Clear ownership of forests is important for maintaining incentives to conserve forests and the accountability needed to deal with any impacts on forests.
3.14. UKRAINE
Country Overview
World Bank development status Lower middle income
Indicators Year of dataGDP per capita, PPP (current international $) 8,272 2016GNI per capita, PPP (current international $) 8,190 2016% population living in poverty (<$1.90/day) 0.1 2015
Gini index (World Bank estimate) 25.5 2015% total unemployment of total labor force (ILO estimate) 9.0 2017Yale Environmental Performance Index 79.7 2016
Ukraine is a large Eastern European country with a population of 42.6 million. It ranks 84th on the Human Development Index of the United Nations Development Programme, with a score of 0.743. Life expectancy at birth is 71.1 years and the adult literacy rate is 99.8 percent.
The national unemployment rate is 9.9 percent of the labor force, but it is much higher (23.1 percent) among youth aged 15–24; 14.8 percent of all laborers work in agriculture, and 59.1 percent in services (UNDP, n.d.).

148 FOREST-SMART MINING
Large protests in 2014 led to the removal of former president Viktor Yanukovych. Since then, Ukraine’s new government has struggled to impose authority on criminal activities, including illegal mining operations. The government’s control over state security forces such as police, border control, and park rangers has also weakened (Muliavka 2017). Shortly after Yanukovych’s departure, Russia invaded the Crimea region and has since aimed at the annexation of Crimea, leading to a violent conflict that has killed more than 33,000 civilians (CIA 2017). The ongoing conflict and complex political environment, including a trade blockade, have posed serious challenges for economic reform and growth (World Bank 2017b). However, in 2016, Ukraine began a slow recovery and experienced a growth in GDP of 2.3 percent (EBRD 2017).
The natural resources present in Ukraine are iron ore, coal, manganese, natural gas, oil, salt, sulfur, graphite, titanium, amber, magnesium, kaolin, nickel, mercury, and timber (CIA 2017). In 2014, Ukraine was one of the world’s largest producers of gallium, rutile, titanium sponge, iron ore, manganese ore, steel, ilmenite, and pig iron (USGS 2017). Ukraine has the second-largest amber deposits in the world, after Kaliningrad (Piechal 2017), with an estimated 15,000 tonnes over 380,000 hectares of land (Kozak 2017). The Ukrainian mining industry employs 220,000 workers, in more than 200 mines (ILO 2017). Mining and quarrying represented 10.7 percent of the national GDP in 2014 (USGS 2017), but the relative importance of the extractive industry as a whole has decreased to 5 percent of the GDP in 2016 (NRGI 2017).
According to the Constitution, land and natural resources, including subsoil assets, belong to the state (NRGI 2017). Amber mining requires a special permission for the use of natural resources (Belichenko 2017).
Ukraine ranked 44th out of 89 in the Resource Governance Index of 2017 (NRGI 2017). This index analyzes good governance of natural resources, including “subsoil use, fiscal management, budget planning, financial reporting, state-owned companies’ governance, open data” (Natural Resource Governance Institute 2017). Note that this applies to governing the industrial mining and oil and gas sectors, but some identified areas of concern may impact the governance of ASM: Lack of a functioning procedure of environmental impact assessment and environmental mitigation; lack of a single governmental data portal with data about reserves, production, and exports of natural resources; absence of requirements and practice of targeted revenue sharing from the extractive sector in favor of subnational budgets (there is currently no mechanism for redistributing benefits to the local budgets) (NRGI 2017).
Furthermore, Ukraine never invested in adequate institutions for revenue collection. The legislation in Ukraine does not require disclosing mining contracts. From 2018, however, this will become mandatory by the Extractive Industries Transparency Initiative (EITI) of which Ukraine is a member (NRGI 2017).
Forests cover 16.8 percent of the Ukrainian land (CIA 2017)—or 9.5 million hectares (European Timber Trade Federation 2016). Of those 9.5 million hectares, only 0.6 percent (or 60,000 hectares) is primary forest, while 47 percent (4.7 million hectares) are naturally regenerated forest and more than 50 percent (4.9 million hectares) are planted forest (ETTF 2016). Agricultural land afforestation is widespread in Ukraine, which is why the total area of forest is growing 0.1–0.3 percent per year (ETTF 2016).
The forestry industry produced more than 18.3 million cubic meters of logs in 2014; 28.5 percent of those were exported, mainly to Poland, Turkey, Romania and China, but the majority was consumed domestically. The State Committee of Forestry is responsible for around 80 percent of this production. More than 8,000 companies work in the timber and timber processing industry in the country, with a total of over 120,000 employees (ETTF 2016). In 2011, the forestry sector contributed 1.0 percent of the GDP, namely $1.5 billion (GFW 2017b).
More than 70 percent of land (or 43 million hectares) is agricultural, and a third of the world’s black soil, particularly fertile, belongs to the Ukraine. This creates a huge potential for a productive agriculture sector. However, there is currently little incentive for long-term investment and management of land, and access to credit is limited (Kahkonen 2017).
The 1994 Forest Code aims at “conservation, improvement of wood quality and sustainable forest management” (ETTF 2016). The main government authorities responsible for managing forests are the Ukrainian State Committee of Forestry (USCF) and the State Forest Resources Agency (SFRA). Between 2002 and 2015, a program called Forests of Ukraine was aimed at “improving forest conditions and quality, ecological and protective functions, and forest productivity” (Lopatin et al. 2011). It sought to develop a regulatory system for more effective forest management and conservation (Lopatin et al. 2011).
Forests and areas of conservation value are legally categorized as follows (ETTF 2016):
1. Forests with conservation, scientific, historical and cultural functions
2. Forests for recreation and health
149FOREST-SMART MINING
3. Protection forests
4. Operational forests
The state owns 99 percent of the country’s forests. The majority (70 percent) is managed by the USCF, part of the Ministry of Ecology and Natural Resources, with regional forest directorates responsible for the different provinces. The rest of the state-owned forest is managed by the SFRA, which is part of the Ministry of Agricultural Policy (24 percent), and by the Ministry of Defense (2.2 percent) (ETTF 2016).
Is Ukraine’s Mining Sector Forest Smart?
The complex political situation and ongoing conflict pose serious challenges to the government, such as a recession and loss of control over criminal activities, including illegal mining that is causing significant uncontrolled forest impacts.
The governance framework has certain gaps that need to be addressed for effective regulation of the mining industry to be possible. Aspects of proper natural resource government such as data on mineral reserves and exports, procedures for environmental impact assessments, revenue re-distribution, and contract disclosure are lacking; this, coupled with unfavorable economic conditions and unemployment, corruption networks, and low law enforcement capacity, makes Ukraine’s mining sector extremely prone to criminal activities.
Lessons Learned
• In situations where the ASM sector has become increasingly criminal, the focus must shift on identifying and demobilizing the organized crime networks, national and international, that are likely to be operating with impunity and driving financial flows into the ASM sector.
• The motives driving actors into the criminal sector, such as lack of employment opportunities and the ease of corrupt practices, must not be ignored and require a much wider social and economic lens.
3.14.1. Polesia, Ukraine
Most of Ukraine’s amber is located in the cross-border region Polesia, in the northwestern part of the country and comprising the regions Rivne, Zhytomyr, and Volyn (Wendle 2017). The dominant land use in the area is forests, with a forest cover of 36.4 percent, just before agriculture. Most people in rural regions carry out subsistence farming and collect mushrooms and berries from forests. The latter is allowed without official permit,
while collection of timber requires a permit (Zhyla et al. 2014).
Two state companies have extracted amber in the region since the 1980s. However, after the Soviet Revolution, when private wealth accumulation became possible and amber prices rose, illegal amber mining by individuals and local interest groups increased and the latter started taking over the sector. Around 200,000 people across the region make a living from the amber industry (Arte 2017; Piechal 2017). Most of them are local residents in a region that has an unemployment rate and poverty levels way beyond the national average (Interfax: Ukraine Business Daily 2015; Zhyla et al. 2014). The profit that can be obtained by amber mining is well above average salaries in other jobs (Muliavka 2017).
Ninety-nine percent of amber mining today in the Ukraine is illegal (Stewart 2015), amounting to 150–200 tonnes per year. As this illegality prevents effective revenue collection through the state, the government is believed to lose between $200 million and $300 million per year (Piechal 2017). Instead of applying to the official government permitting system, most miners are either employed by local mafia (Muliavka 2017) or form groups among themselves and buy a permit from the mafia to dig for amber (Piechal 2017). The owners of water pumps and hoses are typically at the top of the amber business and organize the extraction and control the trade (Arte 2017).
Bribery is widespread in the sector. Between 2011 and 2013, then president Yanukovych’s son and the son of the prosecutor general at the time controlled the amber mining sector, but corruption and bribery chains have become much less clear since the political turmoil in 2014. New criminal groups became involved and regularly clash (Muliavka 2017; Piechal 2017; WWF Ukraine, pers. comm.). The Ukrainian amber industry is thriving due, among other reasons, to increasing prices and export restrictions by Russia on amber from Kaliningrad (Piechal 2017). Amber is illegally sold in towns close to the digging areas, along with the wood that is cleared to access the deposits. Most of the amber reaches the Chinese market through Russia (Muliavka 2017).
Amber lies mainly in sand and sandy clay soils in up to 15 meters depth and is extracted by mechanical or hydraulic methods, using water pumps or manual drills, and sometimes altered car motors. By injecting water into the soil, the amber rises to the surface (Malanchuk et al. 2016; Muliavka 2017; Arte 2017).
In response, the government deployed a special emergency unit in 2015 composed of staff from the

150 FOREST-SMART MINING
Prosecutor General’s Office, the State Security Service, and the National Police (Lempriere 2017). Law enforcers have been patrolling forests, installed checkpoints along forest roads, arrested miners, and confiscated vehicles, motor pumps, drills, and amber (BBC Monitoring Former Soviet Union 2016). The police are, however, often met with violence, which, along with sophisticated warning systems among miners and corruption, has negatively impacted the effectiveness of these measures. Given their low salaries, many police officers and other government officials accept bribes from miners and let them operate in return (Arte 2017; Lempriere 2017; Marson 2016).
Apart from a planned animated film by WWF Ukraine, Animagrad studio, and the Fund branch about forests in Polesia, aimed at sensitizing people to the effects of forest destruction, no civil society organization seems to
Bolivia, San Ramon 11, by Manuel Salinas
operate in the area (Film UA Group 2017; WWF Ukraine, pers. comm.).
Efforts to legalize and formalize the amber mining do not look promising because of a lengthy and non-transparent licensing process and the lack of financial incentives to operate in the legal sphere (Wendle 2017; Marson 2016). In 2017, two bills were discussed in Ukraine, one on the mining and legislation of amber (No. 1351-1) and one on prospecting activities (No. 3035), but both were disregarded (Belichenko 2017). There is also weak punishment for illegal amber extraction and no punishment at all for trade or use of illegal amber (Piechal 2017). A positive development has been the adoption of resolution No. 1063 in 2016 regarding the recultivation of forest land damaged by amber mining in the Volyn, Rivne, and Zhytomyr regions (Belichenko 2017).
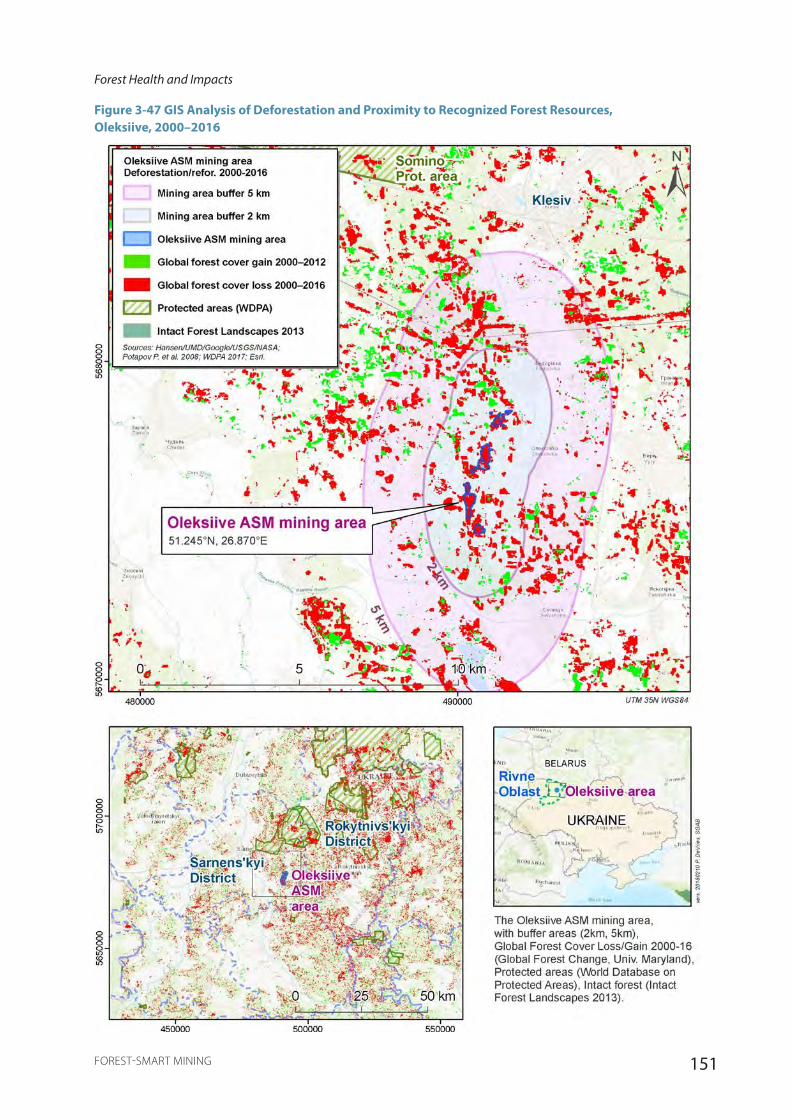
151FOREST-SMART MINING
Forest Health and Impacts
Figure 3-47 GIS Analysis of Deforestation and Proximity to Recognized Forest Resources, Oleksiive, 2000–2016
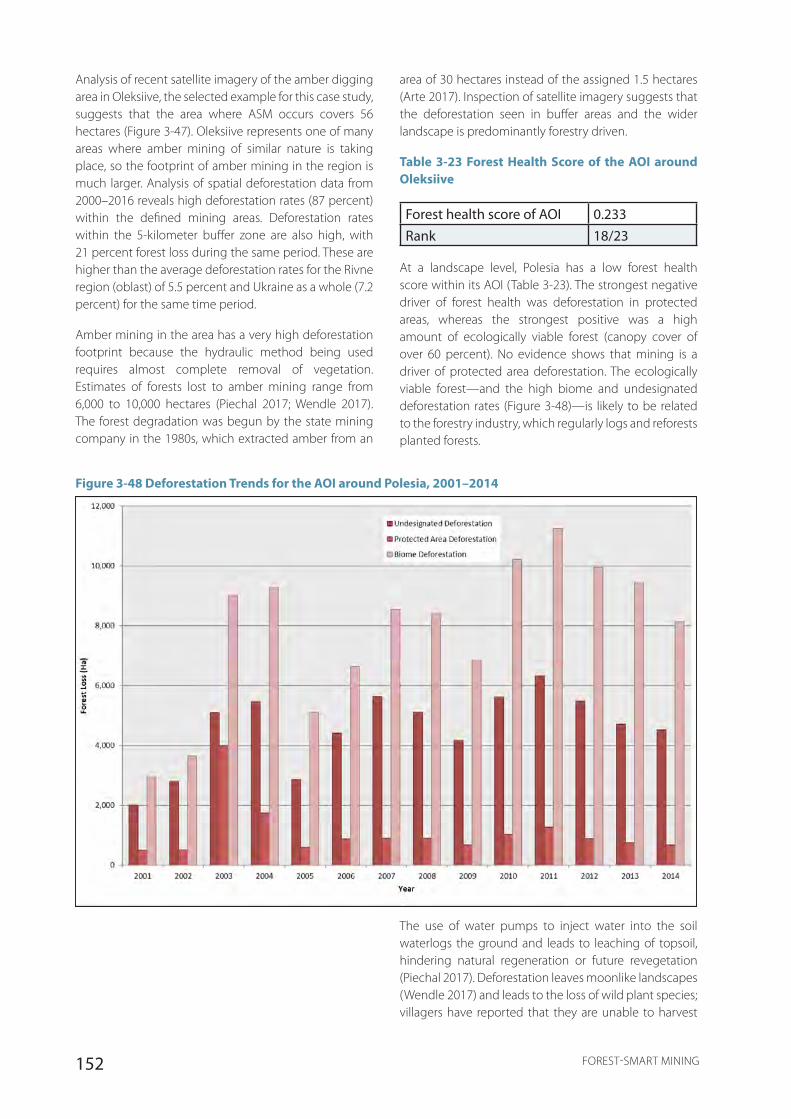
152 FOREST-SMART MINING
Analysis of recent satellite imagery of the amber digging area in Oleksiive, the selected example for this case study, suggests that the area where ASM occurs covers 56 hectares (Figure 3-47). Oleksiive represents one of many areas where amber mining of similar nature is taking place, so the footprint of amber mining in the region is much larger. Analysis of spatial deforestation data from 2000–2016 reveals high deforestation rates (87 percent) within the defined mining areas. Deforestation rates within the 5-kilometer buffer zone are also high, with 21 percent forest loss during the same period. These are higher than the average deforestation rates for the Rivne region (oblast) of 5.5 percent and Ukraine as a whole (7.2 percent) for the same time period.
Amber mining in the area has a very high deforestation footprint because the hydraulic method being used requires almost complete removal of vegetation. Estimates of forests lost to amber mining range from 6,000 to 10,000 hectares (Piechal 2017; Wendle 2017). The forest degradation was begun by the state mining company in the 1980s, which extracted amber from an
area of 30 hectares instead of the assigned 1.5 hectares (Arte 2017). Inspection of satellite imagery suggests that the deforestation seen in buffer areas and the wider landscape is predominantly forestry driven.
Table 3-23 Forest Health Score of the AOI around Oleksiive
Forest health score of AOI 0.233Rank 18/23
At a landscape level, Polesia has a low forest health score within its AOI (Table 3-23). The strongest negative driver of forest health was deforestation in protected areas, whereas the strongest positive was a high amount of ecologically viable forest (canopy cover of over 60 percent). No evidence shows that mining is a driver of protected area deforestation. The ecologically viable forest—and the high biome and undesignated deforestation rates (Figure 3-48)—is likely to be related to the forestry industry, which regularly logs and reforests planted forests.
Figure 3-48 Deforestation Trends for the AOI around Polesia, 2001–2014
The use of water pumps to inject water into the soil waterlogs the ground and leads to leaching of topsoil, hindering natural regeneration or future revegetation (Piechal 2017). Deforestation leaves moonlike landscapes (Wendle 2017) and leads to the loss of wild plant species; villagers have reported that they are unable to harvest

153FOREST-SMART MINING
wild blueberries and mushrooms. Digging on the surface leads to reemission of radioactive dust that had settled over the region from Chernobyl in 1986. And the excavation of groundwater and river water to use in mining leads to the pollution of groundwater and rivers (Muliavka 2017) as well as the diversion of natural water courses (Arte 2017).
Amber mining is also forming cavities in the soil (Malanchuk et al. 2016). Drowned animals in pits and human injuries when pits collapses are common, and there was a reported death of a civilian who fell into a pit in 2016 (Muliavka 2017).
Conclusions
Amber mining in the Ukraine is largely driven by poverty; it is an attractive livelihood because of a lack of viable economic alternatives. Demand largely from China and rising prices make it a profitable activity to participate in.
Control over the amber industry and its forest impacts is hindered by severe corruption and a lack of law enforcement. The amber industry is dominated by big
business interests of organized criminal groups, whose financial interests disincentivize a formalization of the amber extraction and trade.
Law enforcement is undermined by a lack of transparency at all government levels, from local authorities to the police force and judges, with little political will to change the current situation. Finally, the formalization process is too lengthy, is prone to corruption and does not offer enough incentives for people to engage in it.
Lessons Learned
• Efforts to combat illegal mining, which cannot be subjected to any regulation, have to follow a strategy of offering an economically attractive and easy route toward formalization, as well as alternative livelihood opportunities.
• Strengthening good governance and transparency is paramount to ensure that laws are enforced. To prevent bribery involving law enforcement officers, they need to be adequately trained and remunerated.
3.15. RESULTS OVERVIEW
3.15.1. Lessons Learned
Table 3-24 details the number of overall lessons learned from the case studies with regard to the impacts, political or economic barriers, governance barriers, and solutions and mechanisms for forest-smart ASM (Table 3-24).
Table 3 24 Main Lessons Learned from ASM Case Studies
Table 324 Main Lessons Learned from ASM Case StudiesCategory Lesson learnedImpacts ASM has relatively low direct and indirect impacts on forestsImpacts Deforestation is often not the most severe impact of ASMPolitical/economic Barriers ASM is commodity price-drivenPolitical/economic Barriers Foreign influences can drive surges in ASMPolitical/economic Barriers LSM can encourage ASM in forestsPolitical/economic Barriers Poverty and conflict are both drivers of ASM and barriers to improvementsPolitical/economic Barriers Macro-political changes can affect mining and forestsGovernance Barriers Regulations are often inappropriate for ASMGovernance Barriers Even where regulations exist, law enforcement is often inadequateGovernance Barriers Lack of coordination between mining and environmental authorities prevents forest-smart ASMSolutions and Mechanisms Effective forest protection is the main determinant of forest healthSolutions and Mechanisms Geological knowledge must underpin forest management decisionsSolutions and Mechanisms Evictions are necessary but must respect human rightsSolutions and Mechanisms Subsidiarity in governance and coordination between local government is neededSolutions and Mechanisms Formalization is needed to make ASM subject to regulationsSolutions and Mechanisms Best-practice cases should be showcased and introduced into lawSolutions and Mechanisms Stronger indigenous rights usually lead to better forest protectionSolutions and Mechanisms Where ASM and LSM overlap, LSM needs to take responsibilitySolutions and Mechanisms External support is a key enabler of forest-smart ASM
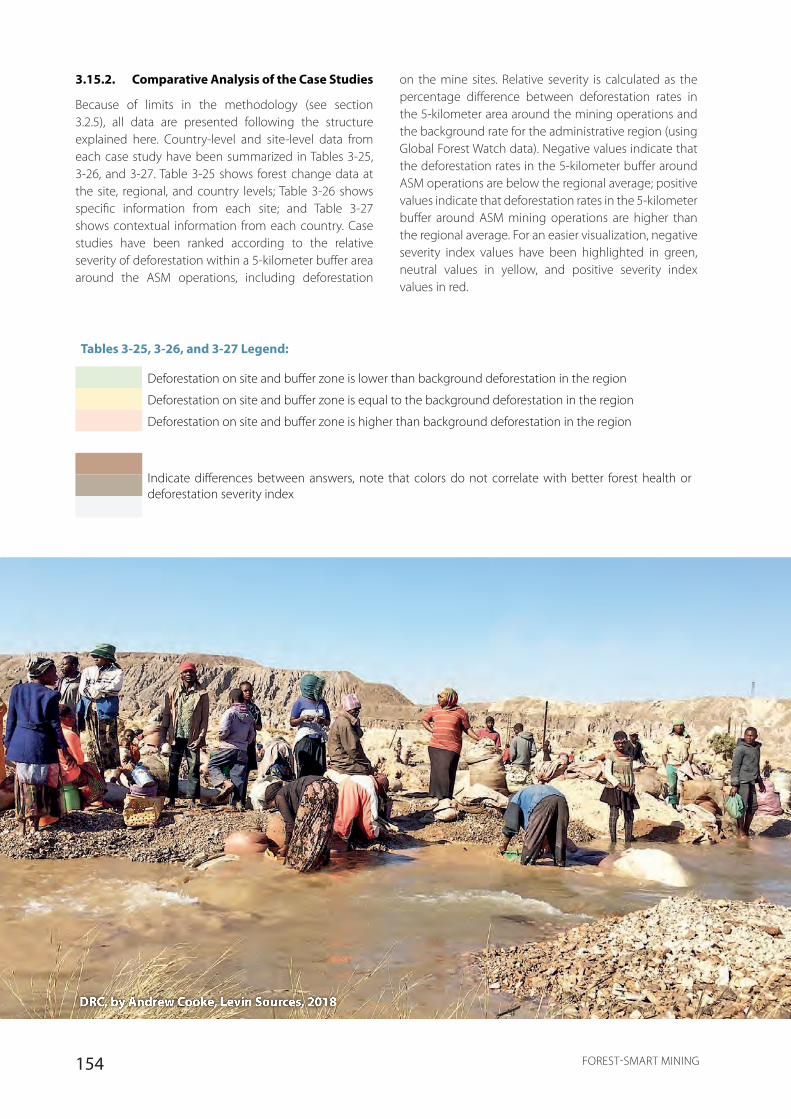
154 FOREST-SMART MINING
3.15.2. Comparative Analysis of the Case Studies
Because of limits in the methodology (see section 3.2.5), all data are presented following the structure explained here. Country-level and site-level data from each case study have been summarized in Tables 3-25, 3-26, and 3-27. Table 3-25 shows forest change data at the site, regional, and country levels; Table 3-26 shows specific information from each site; and Table 3-27 shows contextual information from each country. Case studies have been ranked according to the relative severity of deforestation within a 5-kilometer buffer area around the ASM operations, including deforestation
on the mine sites. Relative severity is calculated as the percentage difference between deforestation rates in the 5-kilometer area around the mining operations and the background rate for the administrative region (using Global Forest Watch data). Negative values indicate that the deforestation rates in the 5-kilometer buffer around ASM operations are below the regional average; positive values indicate that deforestation rates in the 5-kilometer buffer around ASM mining operations are higher than the regional average. For an easier visualization, negative severity index values have been highlighted in green, neutral values in yellow, and positive severity index values in red.
Tables 3-25, 3-26, and 3-27 Legend:
Deforestation on site and buffer zone is lower than background deforestation in the region
Deforestation on site and buffer zone is equal to the background deforestation in the region
Deforestation on site and buffer zone is higher than background deforestation in the region
Indicate differences between answers, note that colors do not correlate with better forest health or deforestation severity index
DRC, by Andrew Cooke, Levin Sources, 2018
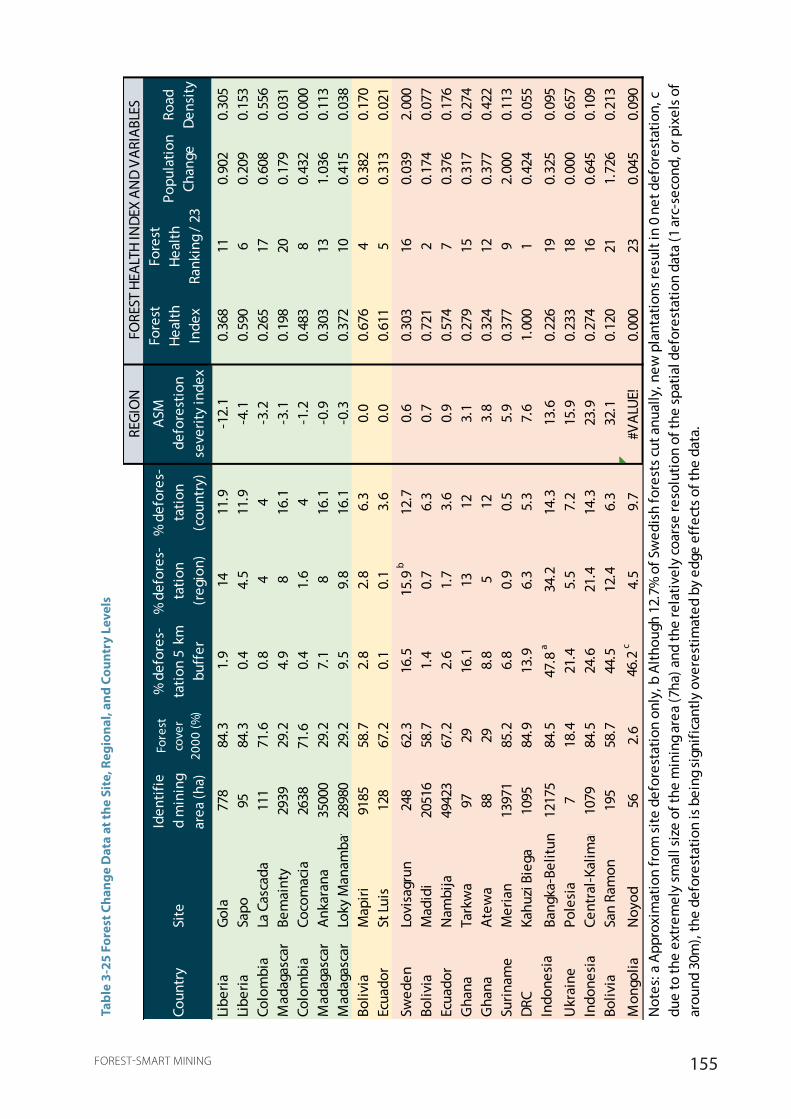
155FOREST-SMART MINING
REGI
ON
Coun
try
Site
Iden
tifie
d m
inin
g ar
ea (h
a)
Fore
st
cove
r 20
00 (%
)
% d
efor
es-
tatio
n 5
km
bu
ffer
% d
efor
es-
tatio
n (r
egio
n)
% d
efor
es-
tatio
n (c
ount
ry)
ASM
de
fore
stio
n se
verit
y in
dex
Fore
st
Heal
th
Inde
x
Fore
st
Heal
th
Rank
ing
/ 23
Popu
latio
n Ch
ange
Road
De
nsity
Libe
riaGo
la77
884
.31.
914
11.9
-12.
10.
368
110.
902
0.30
5Li
beria
Sapo
9584
.30.
44.
511
.9-4
.10.
590
60.
209
0.15
3Co
lom
bia
La C
asca
da11
171
.60.
84
4-3
.20.
265
170.
608
0.55
6M
adag
asca
rBe
mai
nty
2939
29.2
4.9
816
.1-3
.10.
198
200.
179
0.03
1Co
lom
bia
Coco
mac
ia26
3871
.60.
41.
64
-1.2
0.48
38
0.43
20.
000
Mad
agas
car
Anka
rana
3500
029
.27.
18
16.1
-0.9
0.30
313
1.03
60.
113
Mad
agas
car
Loky
Man
amba
to28
980
29.2
9.5
9.8
16.1
-0.3
0.37
210
0.41
50.
038
Boliv
ia
Map
iri91
8558
.72.
82.
86.
30.
00.
676
40.
382
0.17
0Ec
uado
rSt
Luis
128
67.2
0.1
0.1
3.6
0.0
0.61
15
0.31
30.
021
Swed
enLo
visa
grun
248
62.3
16.5
15.9
b12
.70.
60.
303
160.
039
2.00
0Bo
livia
M
adid
i20
516
58.7
1.4
0.7
6.3
0.7
0.72
12
0.17
40.
077
Ecua
dor
Nam
bija
4942
367
.22.
61.
73.
60.
90.
574
70.
376
0.17
6G
hana
Tark
wa
9729
16.1
1312
3.1
0.27
915
0.31
70.
274
Gha
naAt
ewa
8829
8.8
512
3.8
0.32
412
0.37
70.
422
Surin
ame
Mer
ian
1397
185
.26.
80.
90.
55.
90.
377
92.
000
0.11
3DR
CKa
huzi
Bie
ga10
9584
.913
.96.
35.
37.
61.
000
10.
424
0.05
5In
done
sia
Bang
ka-B
elitu
ng12
175
84.5
47.8
a34
.214
.313
.60.
226
190.
325
0.09
5U
krai
nePo
lesi
a7
18.4
21.4
5.5
7.2
15.9
0.23
318
0.00
00.
657
Indo
nesi
aCe
ntra
l-Kal
iman
tan10
7984
.524
.621
.414
.323
.90.
274
160.
645
0.10
9Bo
livia
Sa
n Ra
mon
195
58.7
44.5
12.4
6.3
32.1
0.12
021
1.72
60.
213
Mon
golia
Noy
od56
2.6
46.2
c4.
59.
7#V
ALUE
!0.
000
230.
045
0.09
0
FORE
ST H
EALT
H IN
DEX
AND
VARI
ABLE
S
Not
es: a
App
roxi
mat
ion
from
site
def
ores
tatio
n on
ly, b
Alth
ough
12.
7% o
f Sw
edis
h fo
rest
s cut
anu
ally
, new
pla
ntat
ions
resu
lt in
0 n
et d
efor
esta
tion,
c du
e to
the
extr
emel
y sm
all s
ize
of th
e m
inin
g ar
ea (7
ha) a
nd th
e re
lativ
ely
coar
se re
solu
tion
of th
e sp
atia
l def
ores
tatio
n da
ta (1
arc
-sec
ond,
or p
ixel
s of
arou
nd 3
0m),
the
defo
rest
atio
n is
bei
ng si
gnifi
cant
ly o
vere
stim
ated
by
edge
eff
ects
of t
he d
ata.
Tabl
e 3-
25 F
ores
t Cha
nge
Dat
a at
the
Site
, Reg
iona
l, an
d Co
untr
y Le
vels

156 FOREST-SMART MINING
Tabl
e 3-
26 S
ite-
Spec
ific
Info
rmat
ion
Arr
ange
d A
ccor
ding
to th
e Re
lati
ve S
ever
ity
of D
efor
esta
tion
in th
e 5
km B
uffer
Zon
e ar
ound
the
ASM
Ope
rati
ons
Coun
try
Site
Def
ores
tati
on
Seve
rity
Inde
xM
iner
al
Dep
osit
typ
eTy
pe o
f ASM
M
ercu
ry u
seA
SM r
ate
of c
hang
e LS
M p
rese
nt
Min
ing
as %
of
GD
PA
SM c
ontr
ibut
ion
to d
efor
esta
tion
Libe
riaGo
la-1
2.1
Gold
and
dia
mon
dsal
luvi
alar
tisan
alab
sent
stab
leab
sent
15 a
uncl
ear
Libe
riaSa
po-4
.1Go
ldal
luvi
alar
tisan
alab
sent
decl
ine
abse
nt15
a>o
ther
sect
ors
Colo
mbi
aLa
Cas
cada
-3.2
Gold
hard
-roc
km
ixed
abse
ntst
able
abse
nt7
<oth
er se
ctor
sM
adag
asca
rBe
mai
nty
-3.1
Sapp
hire
sal
luvi
alar
tisan
alab
sent
rush
abse
nt4
<oth
er se
ctor
s
Colo
mbi
aCo
com
acia
-1.2
Gold
, pla
tinum
and
copp
eral
luvi
alm
echa
nise
dw
ides
prea
dru
shab
sent
7si
gnifi
cant
Mad
agas
car
Anka
rana
-0.9
Sapp
hire
sal
luvi
alar
tisan
alab
sent
stab
leab
sent
4<o
ther
sect
ors
Mad
agas
car
Loky
-Man
amba
to-0
.3Go
ldm
ixed
artis
anal
abse
ntst
able
abse
nt4
<oth
er se
ctor
sBo
livia
Map
iri0.
0Go
ldal
luvi
alm
ixed
wid
espr
ead
rush
abse
nt9
<oth
er se
ctor
sEc
uado
rSa
n Lu
is0.
0Go
ldm
ixed
artis
anal
wid
espr
ead
decl
ine
aggr
avat
ing
1>o
ther
sect
ors
Swed
enLo
visa
gruv
an0.
6Le
ad a
nd zi
ncha
rd-r
ock
mec
hani
sed
abse
ntst
able
abse
nt10
<oth
er se
ctor
sBo
livia
Mad
idi
0.7
Gold
mix
edm
ixed
wid
espr
ead
stab
leab
sent
9<o
ther
sect
ors
Ecua
dor
Nam
bija
0.9
Gold
hard
-roc
kar
tisan
alw
ides
prea
dde
clin
eab
sent
1<o
ther
sect
ors
Gha
naTa
rkw
a3.
1Go
ldm
ixed
mix
edw
ides
prea
dst
able
aggr
avat
ing
10 a
sign
ifica
ntG
hana
Atew
a3.
8Go
ldm
ixed
mec
hani
sed
wid
espr
ead
stab
leag
grav
atin
g10
asi
gnifi
cant
Surin
ame
Mer
ian
5.9
Gold
allu
vial
artis
anal
wid
espr
ead
rush
aggr
avat
ing
31 c
>oth
er se
ctor
s
DRC
Kahu
zi B
iega
7.6
Colta
n, w
olfr
amite
, go
ld a
nd ca
sser
item
ixed
artis
anal
pres
ent
rush
abse
nt22
uncl
ear
Indo
nesi
aBa
ngka
13.6
Tin
mix
edar
tisan
alab
sent
rush
aggr
avat
ing
25 b
sign
ifica
nt
Ukr
aine
Pole
sia
15.9
Ambe
ral
luvi
alm
echa
nise
dab
sent
rush
abse
nt5
d>o
ther
sect
ors
Indo
nesi
aCe
ntra
l Kal
iman
tan2
3.9
Gold
mix
edm
ixed
wid
espr
ead
rush
abse
nt25
bsi
gnifi
cant
Boliv
iaSa
n Ra
mon
32.1
Gold
allu
vial
mec
hani
sed
wid
espr
ead
rush
abse
nt9
<oth
er se
ctor
sM
ongo
liaN
oyod
41.7
Gold
hard
-roc
km
ixed
abse
ntde
clin
eab
sent
20<o
ther
sect
ors
Not
es: a
All
ext
ract
ive
indu
stri
es (o
il, g
as a
nd m
inin
g), b
Fig
ure
for
Kali
man
tan
only
, c %
GD
P al
so in
clud
es o
il, l
umbe
ring
, fo
od p
roce
ssin
g an
d fi
shin
g, d
Was
red
uced
from
10
.7%
in 2
014
- sha
rp d
ecli
ne
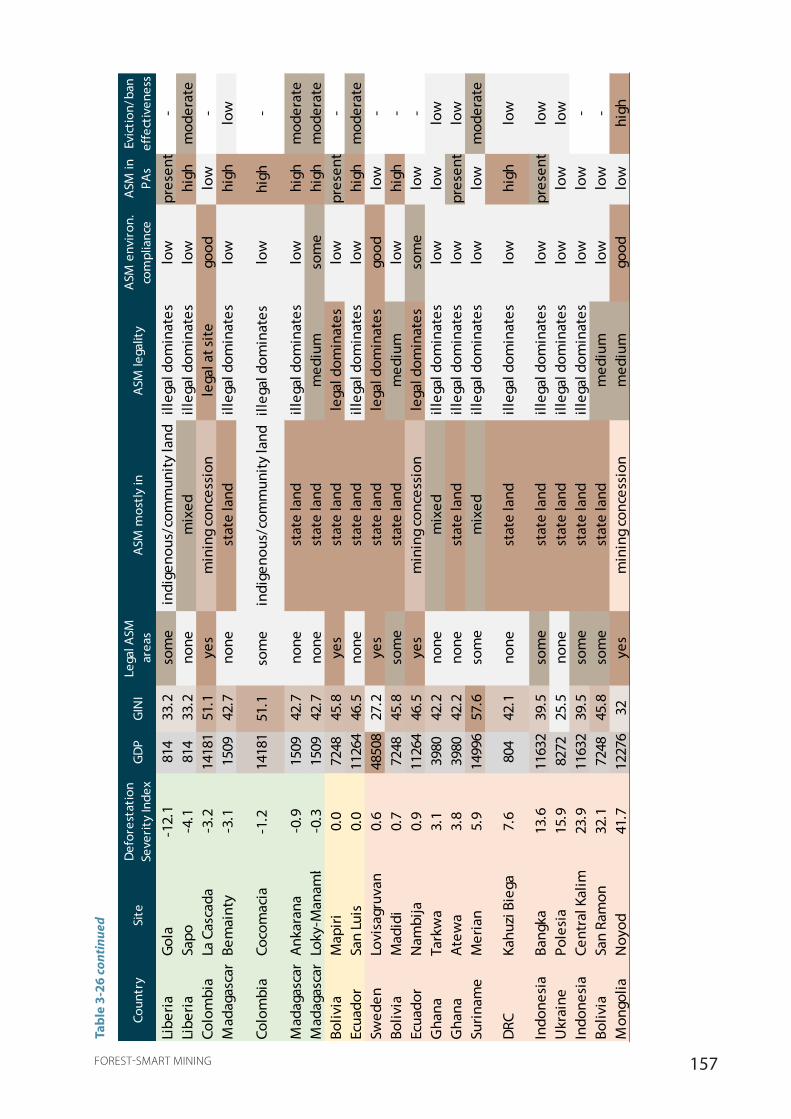
157FOREST-SMART MINING
Coun
try
Site
Def
ores
tati
on
Seve
rity
Inde
xG
DP
GIN
ILe
gal A
SM
area
s A
SM m
ostl
y in
A
SM le
galit
yA
SM e
nvir
on.
com
plia
nce
ASM
in
PAs
Evic
tion
/ban
ef
fect
iven
ess
Libe
ria
Gol
a-1
2.1
814
33.2
som
ein
dige
nous
/com
mun
ity
land
illeg
al d
omin
ates
low
pres
ent
-Li
beri
aSa
po-4
.181
433
.2no
nem
ixed
illeg
al d
omin
ates
low
high
mod
erat
eCo
lom
bia
La C
asca
da-3
.214
181
51.1
yes
min
ing
conc
essi
onle
gal a
t sit
ego
odlo
w-
Mad
agas
car
Bem
aint
y-3
.115
0942
.7no
nest
ate
land
illeg
al d
omin
ates
low
high
low
Colo
mbi
aCo
com
acia
-1.2
1418
151
.1so
me
indi
geno
us/c
omm
unit
y la
ndill
egal
dom
inat
eslo
whi
gh-
Mad
agas
car
Ank
aran
a-0
.915
0942
.7no
nest
ate
land
illeg
al d
omin
ates
low
high
mod
erat
eM
adag
asca
rLo
ky-M
anam
bato
-0.3
1509
42.7
none
stat
e la
ndm
ediu
mso
me
high
mod
erat
eBo
livia
Map
iri
0.0
7248
45.8
yes
stat
e la
ndle
gal d
omin
ates
low
pres
ent
-Ec
uado
rSa
n Lu
is0.
011
264
46.5
none
stat
e la
ndill
egal
dom
inat
eslo
whi
ghm
oder
ate
Swed
enLo
visa
gruv
an0.
648
508
27.2
yes
stat
e la
ndle
gal d
omin
ates
good
low
-Bo
livia
Mad
idi
0.7
7248
45.8
som
est
ate
land
med
ium
low
high
-Ec
uado
rN
ambi
ja0.
911
264
46.5
yes
min
ing
conc
essi
onle
gal d
omin
ates
som
elo
w-
Gha
naTa
rkw
a3.
139
8042
.2no
nem
ixed
illeg
al d
omin
ates
low
low
low
Gha
naA
tew
a3.
839
8042
.2no
nest
ate
land
illeg
al d
omin
ates
low
pres
ent
low
Suri
nam
eM
eria
n5.
914
996
57.6
som
em
ixed
illeg
al d
omin
ates
low
low
mod
erat
e
DRC
Kahu
zi B
iega
7.6
804
42.1
none
stat
e la
ndill
egal
dom
inat
eslo
whi
ghlo
w
Indo
nesi
aBa
ngka
13.6
1163
239
.5so
me
stat
e la
ndill
egal
dom
inat
eslo
wpr
esen
tlo
wU
krai
nePo
lesi
a15
.982
7225
.5no
nest
ate
land
illeg
al d
omin
ates
low
low
low
Indo
nesi
aCe
ntra
l Kal
iman
tan2
3.9
1163
239
.5so
me
stat
e la
ndill
egal
dom
inat
eslo
wlo
w-
Boliv
iaSa
n Ra
mon
32.1
7248
45.8
som
est
ate
land
med
ium
low
low
-M
ongo
liaN
oyod
41.7
1227
632
yes
min
ing
conc
essi
onm
ediu
mgo
odlo
whi
gh
Tabl
e 3-
26 c
ontin
ued
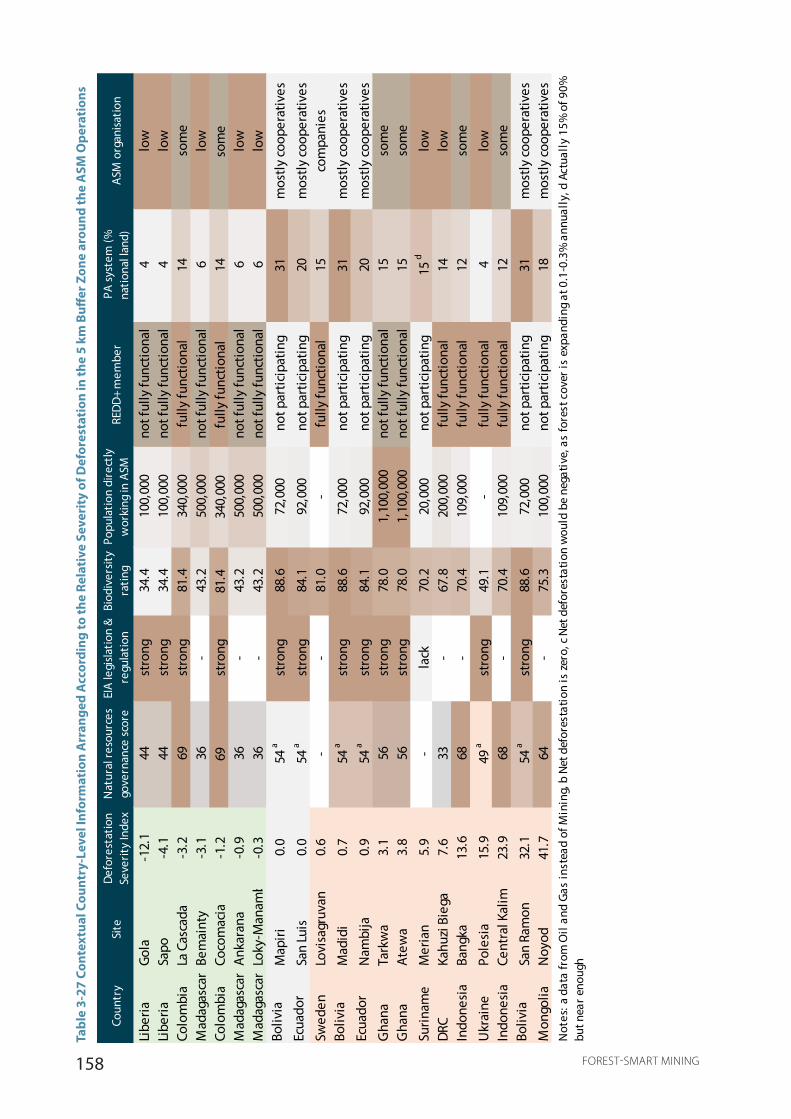
158 FOREST-SMART MINING
Tabl
e 3-
27 C
onte
xtua
l Cou
ntry
-Lev
el In
form
atio
n A
rran
ged
Acc
ordi
ng to
the
Rela
tive
Sev
erit
y of
Def
ores
tati
on in
the
5 km
Buff
er Z
one
arou
nd th
e A
SM O
pera
tion
s
Coun
try
Site
Def
ores
tati
on
Seve
rity
Inde
xN
atur
al r
esou
rces
go
vern
ance
sco
re
EIA
legi
slat
ion
&
regu
lati
onBi
odiv
ersi
ty
rati
ng
Popu
lati
on d
irec
tly
wor
king
in A
SMRE
DD
+ m
embe
rPA
sys
tem
(%
nati
onal
land
)A
SM o
rgan
isat
ion
Libe
riaGo
la-1
2.1
44st
rong
34.4
100,
000
not f
ully
func
tiona
l4
low
Libe
riaSa
po-4
.144
stro
ng34
.410
0,00
0no
t ful
ly fu
nctio
nal
4lo
wCo
lom
bia
La C
asca
da-3
.269
stro
ng81
.434
0,00
0fu
lly fu
nctio
nal
14so
me
Mad
agas
car
Bem
aint
y-3
.136
-43
.250
0,00
0no
t ful
ly fu
nctio
nal
6lo
wCo
lom
bia
Coco
mac
ia-1
.269
stro
ng81
.434
0,00
0fu
lly fu
nctio
nal
14so
me
Mad
agas
car
Anka
rana
-0.9
36-
43.2
500,
000
not f
ully
func
tiona
l6
low
Mad
agas
car
Loky
-Man
amba
to-0
.336
-43
.250
0,00
0no
t ful
ly fu
nctio
nal
6lo
wBo
livia
Map
iri0.
054
ast
rong
88.6
72,0
00no
t par
ticip
atin
g31
mos
tly co
oper
ativ
esEc
uado
rSa
n Lu
is0.
054
ast
rong
84.1
92,0
00no
t par
ticip
atin
g20
mos
tly co
oper
ativ
esSw
eden
Lovi
sagr
uvan
0.6
--
81.0
-fu
lly fu
nctio
nal
15co
mpa
nies
Boliv
iaM
adid
i0.
754
ast
rong
88.6
72,0
00no
t par
ticip
atin
g31
mos
tly co
oper
ativ
esEc
uado
rN
ambi
ja0.
954
ast
rong
84.1
92,0
00no
t par
ticip
atin
g20
mos
tly co
oper
ativ
esG
hana
Tark
wa
3.1
56st
rong
78.0
1,10
0,00
0no
t ful
ly fu
nctio
nal
15so
me
Gha
naAt
ewa
3.8
56st
rong
78.0
1,10
0,00
0no
t ful
ly fu
nctio
nal
15so
me
Surin
ame
Mer
ian
5.9
-la
ck70
.220
,000
not p
artic
ipat
ing
15 d
low
DRC
Kahu
zi B
iega
7.6
33-
67.8
200,
000
fully
func
tiona
l14
low
Indo
nesi
aBa
ngka
13.6
68-
70.4
109,
000
fully
func
tiona
l12
som
e
Ukr
aine
Pole
sia
15.9
49 a
stro
ng49
.1-
fully
func
tiona
l4
low
Indo
nesi
aCe
ntra
l Kal
iman
tan2
3.9
68-
70.4
109,
000
fully
func
tiona
l12
som
eBo
livia
San
Ram
on32
.154
ast
rong
88.6
72,0
00no
t par
ticip
atin
g31
mos
tly co
oper
ativ
esM
ongo
liaN
oyod
41.7
64-
75.3
100,
000
not p
artic
ipat
ing
18m
ostly
coop
erat
ives
Not
es: a
dat
a fr
om O
il a
nd G
as in
stea
d of
Min
ing,
b N
et d
efor
esta
tion
is z
ero,
c N
et d
efor
esta
tion
wou
ld b
e ne
gati
ve, a
s fo
rest
cov
er is
exp
andi
ng a
t 0.1
-0.3
% a
nnua
lly,
d A
ctua
lly
15%
of 9
0%
but n
ear
enou
gh
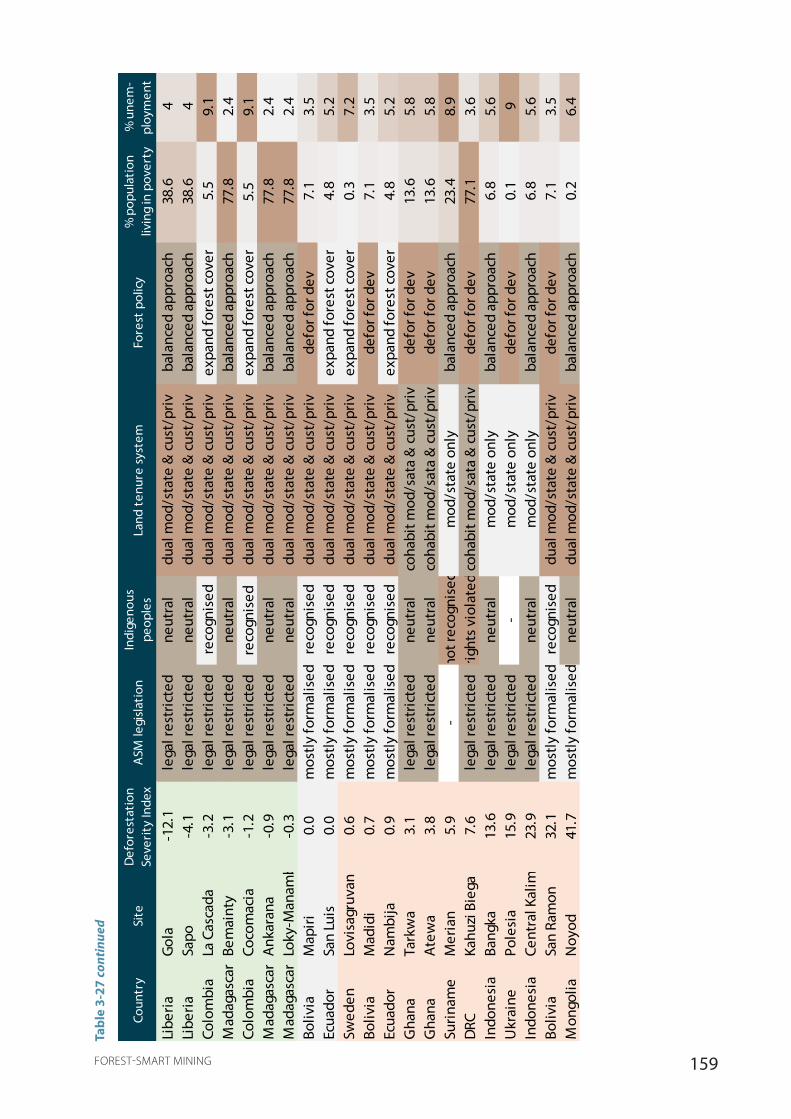
159FOREST-SMART MINING
Coun
try
Site
Def
ores
tati
on
Seve
rity
Inde
xA
SM le
gisl
atio
n In
dige
nous
pe
ople
s La
nd t
enur
e sy
stem
Fo
rest
pol
icy
% p
opul
atio
n liv
ing
in p
over
ty%
une
m-
ploy
men
t
Libe
ria
Gol
a-1
2.1
lega
l res
tric
ted
neut
ral
dual
mod
/sta
te &
cus
t/pr
ivba
lanc
ed a
ppro
ach
38.6
4Li
beri
aSa
po-4
.1le
gal r
estr
icte
dne
utra
ldu
al m
od/s
tate
& c
ust/
priv
bala
nced
app
roac
h38
.64
Colo
mbi
aLa
Cas
cada
-3.2
lega
l res
tric
ted
reco
gnis
eddu
al m
od/s
tate
& c
ust/
priv
expa
nd fo
rest
cov
er5.
59.
1M
adag
asca
rBe
mai
nty
-3.1
lega
l res
tric
ted
neut
ral
dual
mod
/sta
te &
cus
t/pr
ivba
lanc
ed a
ppro
ach
77.8
2.4
Colo
mbi
aCo
com
acia
-1.2
lega
l res
tric
ted
reco
gnis
eddu
al m
od/s
tate
& c
ust/
priv
expa
nd fo
rest
cov
er5.
59.
1M
adag
asca
rA
nkar
ana
-0.9
lega
l res
tric
ted
neut
ral
dual
mod
/sta
te &
cus
t/pr
ivba
lanc
ed a
ppro
ach
77.8
2.4
Mad
agas
car
Loky
-Man
amba
to-0
.3le
gal r
estr
icte
dne
utra
ldu
al m
od/s
tate
& c
ust/
priv
bala
nced
app
roac
h77
.82.
4Bo
livia
Map
iri
0.0
mos
tly
form
alis
edre
cogn
ised
dual
mod
/sta
te &
cus
t/pr
ivde
for f
or d
ev7.
13.
5Ec
uado
rSa
n Lu
is0.
0m
ostl
y fo
rmal
ised
reco
gnis
eddu
al m
od/s
tate
& c
ust/
priv
expa
nd fo
rest
cov
er4.
85.
2Sw
eden
Lovi
sagr
uvan
0.6
mos
tly
form
alis
edre
cogn
ised
dual
mod
/sta
te &
cus
t/pr
ivex
pand
fore
st c
over
0.3
7.2
Boliv
iaM
adid
i0.
7m
ostl
y fo
rmal
ised
reco
gnis
eddu
al m
od/s
tate
& c
ust/
priv
defo
r for
dev
7.1
3.5
Ecua
dor
Nam
bija
0.9
mos
tly
form
alis
edre
cogn
ised
dual
mod
/sta
te &
cus
t/pr
ivex
pand
fore
st c
over
4.8
5.2
Gha
naTa
rkw
a3.
1le
gal r
estr
icte
dne
utra
lco
habi
t mod
/sat
a &
cus
t/pr
ivde
for f
or d
ev13
.65.
8G
hana
Ate
wa
3.8
lega
l res
tric
ted
neut
ral
coha
bit m
od/s
ata
& c
ust/
priv
defo
r for
dev
13.6
5.8
Suri
nam
eM
eria
n5.
9-
not r
ecog
nise
dm
od/s
tate
onl
yba
lanc
ed a
ppro
ach
23.4
8.9
DRC
Kahu
zi B
iega
7.6
lega
l res
tric
ted
righ
ts v
iola
ted
coha
bit m
od/s
ata
& c
ust/
priv
defo
r for
dev
77.1
3.6
Indo
nesi
aBa
ngka
13.6
lega
l res
tric
ted
neut
ral
mod
/sta
te o
nly
bala
nced
app
roac
h6.
85.
6U
krai
nePo
lesi
a15
.9le
gal r
estr
icte
d-
mod
/sta
te o
nly
defo
r for
dev
0.1
9In
done
sia
Cent
ral K
alim
anta
n23.
9le
gal r
estr
icte
dne
utra
lm
od/s
tate
onl
yba
lanc
ed a
ppro
ach
6.8
5.6
Boliv
iaSa
n Ra
mon
32.1
mos
tly
form
alis
edre
cogn
ised
dual
mod
/sta
te &
cus
t/pr
ivde
for f
or d
ev7.
13.
5M
ongo
liaN
oyod
41.7
mos
tly
form
alis
edne
utra
ldu
al m
od/s
tate
& c
ust/
priv
bala
nced
app
roac
h0.
26.
4
Tabl
e 3-
27 c
ontin
ued
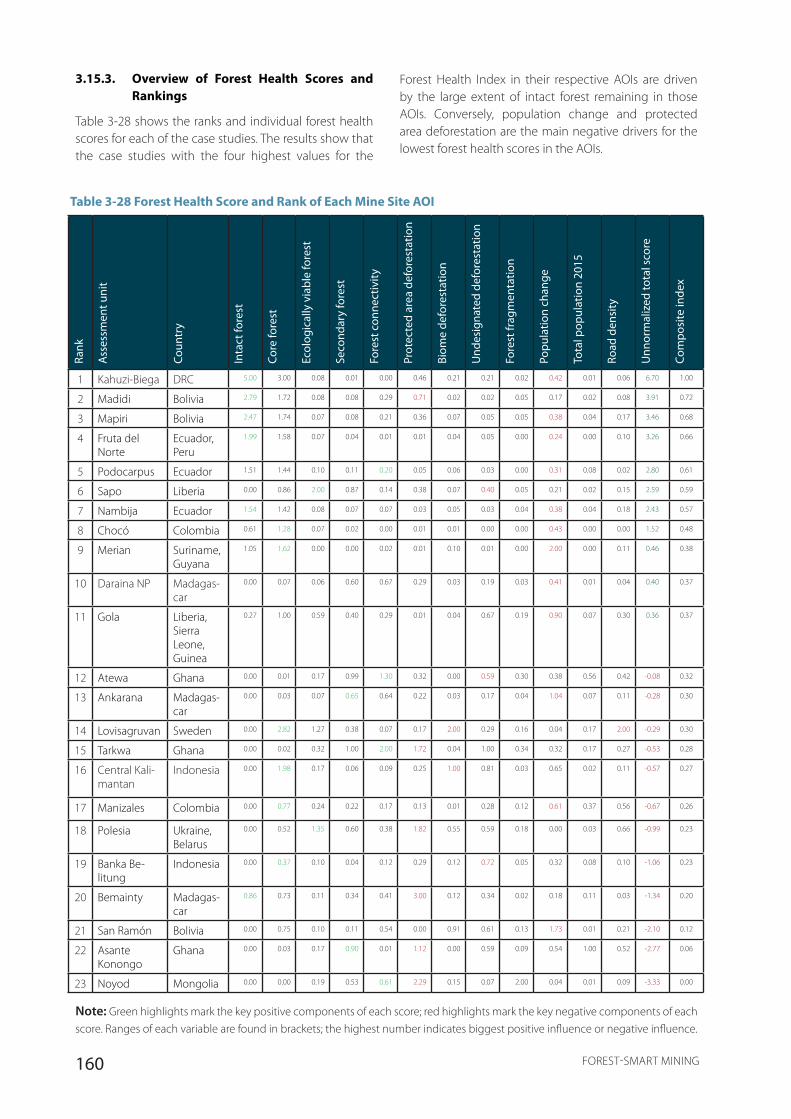
160 FOREST-SMART MINING
Table 3-28 Forest Health Score and Rank of Each Mine Site AOI
Rank
Ass
essm
ent u
nit
Coun
try
Inta
ct fo
rest
Core
fore
st
Ecol
ogic
ally
via
ble
fore
st
Seco
ndar
y fo
rest
Fore
st c
onne
ctiv
ity
Prot
ecte
d ar
ea d
efor
esta
tion
Biom
e de
fore
stat
ion
Und
esig
nate
d de
fore
stat
ion
Fore
st fr
agm
enta
tion
Popu
latio
n ch
ange
Tota
l pop
ulat
ion
2015
Road
den
sity
Unn
orm
aliz
ed to
tal s
core
Com
posi
te in
dex
1 Kahuzi-Biega DRC 5.00 3.00 0.08 0.01 0.00 0.46 0.21 0.21 0.02 0.42 0.01 0.06 6.70 1.00
2 Madidi Bolivia 2.79 1.72 0.08 0.08 0.29 0.71 0.02 0.02 0.05 0.17 0.02 0.08 3.91 0.72
3 Mapiri Bolivia 2.47 1.74 0.07 0.08 0.21 0.36 0.07 0.05 0.05 0.38 0.04 0.17 3.46 0.68
4 Fruta del Norte
Ecuador, Peru
1.99 1.58 0.07 0.04 0.01 0.01 0.04 0.05 0.00 0.24 0.00 0.10 3.26 0.66
5 Podocarpus Ecuador 1.51 1.44 0.10 0.11 0.20 0.05 0.06 0.03 0.00 0.31 0.08 0.02 2.80 0.61
6 Sapo Liberia 0.00 0.86 2.00 0.87 0.14 0.38 0.07 0.40 0.05 0.21 0.02 0.15 2.59 0.59
7 Nambija Ecuador 1.54 1.42 0.08 0.07 0.07 0.03 0.05 0.03 0.04 0.38 0.04 0.18 2.43 0.57
8 Chocó Colombia 0.61 1.28 0.07 0.02 0.00 0.01 0.01 0.00 0.00 0.43 0.00 0.00 1.52 0.48
9 Merian Suriname, Guyana
1.05 1.62 0.00 0.00 0.02 0.01 0.10 0.01 0.00 2.00 0.00 0.11 0.46 0.38
10 Daraina NP Madagas-car
0.00 0.07 0.06 0.60 0.67 0.29 0.03 0.19 0.03 0.41 0.01 0.04 0.40 0.37
11 Gola Liberia, Sierra Leone, Guinea
0.27 1.00 0.59 0.40 0.29 0.01 0.04 0.67 0.19 0.90 0.07 0.30 0.36 0.37
12 Atewa Ghana 0.00 0.01 0.17 0.99 1.30 0.32 0.00 0.59 0.30 0.38 0.56 0.42 -0.08 0.32
13 Ankarana Madagas-car
0.00 0.03 0.07 0.65 0.64 0.22 0.03 0.17 0.04 1.04 0.07 0.11 -0.28 0.30
14 Lovisagruvan Sweden 0.00 2.82 1.27 0.38 0.07 0.17 2.00 0.29 0.16 0.04 0.17 2.00 -0.29 0.30
15 Tarkwa Ghana 0.00 0.02 0.32 1.00 2.00 1.72 0.04 1.00 0.34 0.32 0.17 0.27 -0.53 0.28
16 Central Kali-mantan
Indonesia 0.00 1.98 0.17 0.06 0.09 0.25 1.00 0.81 0.03 0.65 0.02 0.11 -0.57 0.27
17 Manizales Colombia 0.00 0.77 0.24 0.22 0.17 0.13 0.01 0.28 0.12 0.61 0.37 0.56 -0.67 0.26
18 Polesia Ukraine, Belarus
0.00 0.52 1.35 0.60 0.38 1.82 0.55 0.59 0.18 0.00 0.03 0.66 -0.99 0.23
19 Banka Be-litung
Indonesia 0.00 0.37 0.10 0.04 0.12 0.29 0.12 0.72 0.05 0.32 0.08 0.10 -1.06 0.23
20 Bemainty Madagas-car
0.86 0.73 0.11 0.34 0.41 3.00 0.12 0.34 0.02 0.18 0.11 0.03 -1.34 0.20
21 San Ramón Bolivia 0.00 0.75 0.10 0.11 0.54 0.00 0.91 0.61 0.13 1.73 0.01 0.21 -2.10 0.12
22 Asante Konongo
Ghana 0.00 0.03 0.17 0.90 0.01 1.12 0.00 0.59 0.09 0.54 1.00 0.52 -2.77 0.06
23 Noyod Mongolia 0.00 0.00 0.19 0.53 0.61 2.29 0.15 0.07 2.00 0.04 0.01 0.09 -3.33 0.00
3.15.3. Overview of Forest Health Scores and Rankings
Table 3-28 shows the ranks and individual forest health scores for each of the case studies. The results show that the case studies with the four highest values for the
Forest Health Index in their respective AOIs are driven by the large extent of intact forest remaining in those AOIs. Conversely, population change and protected area deforestation are the main negative drivers for the lowest forest health scores in the AOIs.
Note: Green highlights mark the key positive components of each score; red highlights mark the key negative components of each score. Ranges of each variable are found in brackets; the highest number indicates biggest positive influence or negative influence.
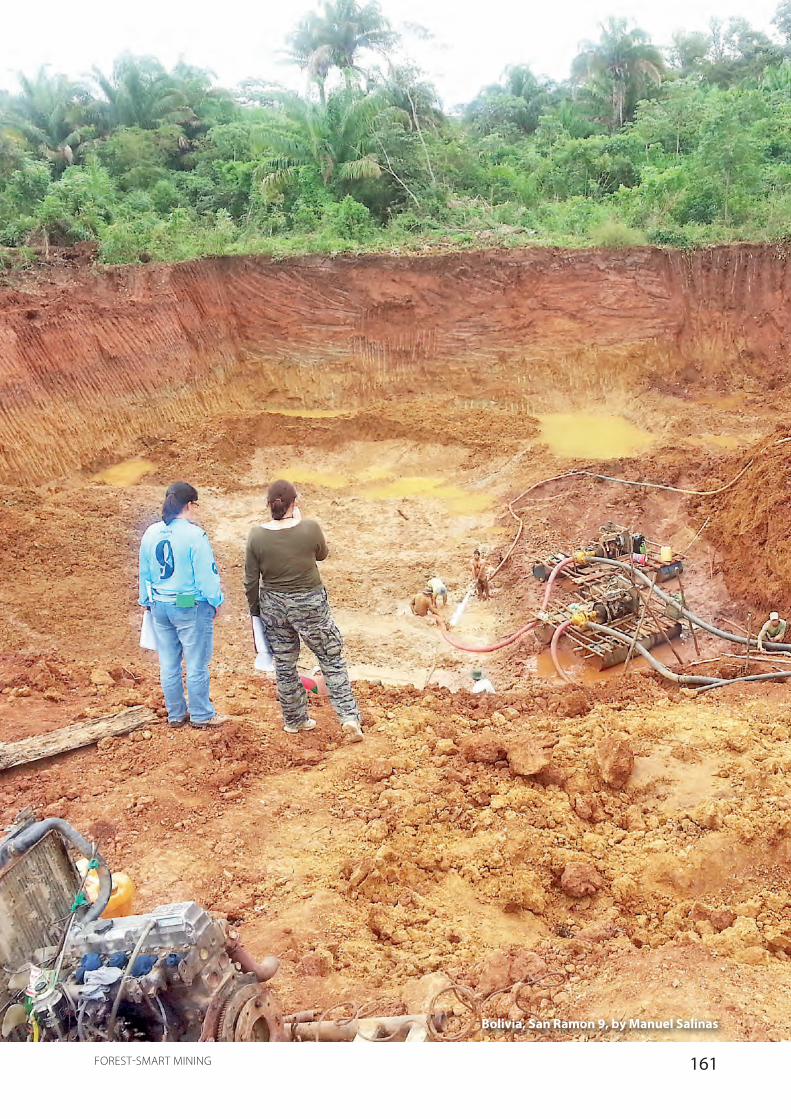
161FOREST-SMART MINING
Bolivia, San Ramon 9, by Manuel Salinas

162 FOREST-SMART MINING

163FOREST-SMART MINING
4.1. What Are the Impacts of ASM on Forests?
1. ASM has relatively minor direct impacts on forests, with notable exceptions.
Although mining overall (both LSM and ASM) contributes directly and indirectly to forest degradation and deforestation, its direct forest impacts are confined to less than 1 percent of the global land surface; in comparison, agriculture and forestry impact around 45 percent of global land (Roser and Ritchie 2018). This observation is confirmed by many of the ASM case studies featured in this report. The investigated ASM sites are found in forest landscapes that vary from near-pristine natural forests to highly degraded forests, and in all but a few cases, the evidence suggests that ASM causes less measurable deforestation than other land uses. Agriculture, in particular, is found to be the main driver of deforestation in landscapes where ASM occurs, and this may be especially noticeable in areas where government policy actively encourages conversion of forests to agriculture, such as in Bolivia. Similarly, ASM in Ghana was observed to contribute to only 5 percent of deforestation, whereas agriculture and logging contributed to 50 percent and 35 percent, respectively. In Indonesia and similar countries, large-scale agriculture such as palm oil plantations are also a much greater source of deforestation than mining at the landscape level.
Despite the general observation that ASM impacts on deforestation tend to be less significant than those of other sectors, noticeable exceptions show that geology is a key determinant of forest impacts. In most cases, the mineral deposits accessible to ASM are small and this limits the severity of forest impacts. However, cases such as Bangka Belitung, where tin deposits are wide-spread at shallow surfaces across the island, demonstrate that large and accessible deposits will attract ASM if the population base is susceptible to the pull factors of artisanal mining, resulting in severe deforestation. Polesia in Ukraine is similar, where extensive and continuous shallow amber deposits have resulted in severe deforestation. Knowledge of geological characteristics could be used as a tool for predicting and thus preemptively safeguarding
against the spread and impacts of ASM. Even where ASM is not considered to pose significant threats to forest cover and adjacent forests, impacts may be locally severe, such as with the alluvial gold mining in Ghana, which negatively impacts certain farms and plantations. Equally, in particularly ecologically sensitive habitats such as Madagascar’s protected areas, which harbor some of the island’s last primary forests, even small impacts of ASM can be considered serious because they are more likely to undermine habitat connectivity, water, or soil quality and the essential ecological functions that are critical for the survival of threatened species.
The type of mining also defines the forest impacts of ASM. Alluvial mining, for example, tends to have a larger surface footprint than hard-rock mining, in part because most hard-rock mines are subsurface, but also because of the often relatively smaller size and more concentrated nature of underground ore. But while alluvial mining has a larger surface footprint in general, lowland alluvial areas tend to have already been deforested as a result of settlements in lowland areas, while hard-rock mining is more likely to occur in upland forested areas. Thus, hard-rock mining may have greater direct impacts on forests in some cases. Alluvial mining is still very important on riparian systems. The potential for deforestation and other forest impacts by ASM increases also with the degree of mechanization. In this context, it is important to distinguish between artisanal, small, and medium-scale mining. Strictly artisanal mining rarely has significant forest impacts, whereas case studies such as Chocó in Colombia illustrate the destructive power of semi-mechanized small-scale operations, especially when they are poorly regulated. That said, manual and small-scale techniques are more inefficient, prolonging the time needed to mine out a deposit and increasing the ratio of land used to mine output. ASM deposits are also often subjected to repeat mining, preventing or delaying effective mitigation and restoration, and therefore artisanal activities may have persistent impacts.
2. ASM also has relatively minor indirect deforestation impacts.
In terms of deforestation, our spatial analysis did not
4. LESSONS LEARNED
164 FOREST-SMART MINING
identify any obvious cases where ASM seemed to induce significantly increased deforestation within the surrounding area (5-kilometer radius). Our case studies suggest that ASM is more likely to reduce the ecological integrity of forests in a diffuse way by fragmenting habitat, degrading riparian ecosystems, contaminating soils, or disturbing populations of endangered species. Furthermore, spatial analysis does not indicate forest structure; therefore, while canopy cover may remain unchanged, understories and species composition may be impacted. Ground-based ecological evidence of dominance by generalist species from cases such as Nambija in Ecuador indicate that this, indeed, can be the case in ASM sites.
3. Indirect forest impacts of ASM can be more severe.
In many cases, ASM impacts on water quality and aquatic ecosystems appear to be more serious issues than deforestation, particularly when toxic chemicals are used in separation processes, such as mercury in gold mining. This can have longer-term ecological implications for the health and function of the forest as it can impact on food webs and ecological relationships of forests, reducing their resilience to stresses such as floods, climate change, and fragmentation. It is well known that mercury pollution by ASGM is severe in some of the countries considered in this study—namely, Indonesia, Ecuador, Ghana, and Suriname. Globally, ASGM is estimated to release up to 1,400 tonnes of mercury per year into ecosystems and high levels of mercury are often found in fish in affected watersheds (UNEP 2018).
In addition to direct deforestation and water quality effects, secondary impacts of ASM include logging and bushmeat hunting. The latter is especially relevant in some Sub-Saharan African countries, and the relative severity is, in turn, related to social and demographic impacts associated with migration, especially in rush situations. Where bushmeat target species are threatened with extinction, such as gorillas in the DRC, the indirect forest impacts of ASM are especially severe.
4.2. Political and Economic Barriers to Forest-Smart Mining
The case studies have shown a variety of external political and economic factors that influence the forest-smartness of ASM. The first and perhaps most obvious factor that threatens forest health is the presence and size of the ASM sector that operates within forested landscapes.
Several political and economic factors have been shown to drive the growth of the ASM sector:
1. High commodity prices drive ASM in forests.
External influences can encourage ASM in forests, notably market demand. Peaks of ASM activity are often associated with increases in commodity prices. This is particularly evident for gold, but it has also been highlighted in the case studies on tin, coltan, and amber. Other studies have confirmed the correlation between international gold prices and deforestation caused by gold mining (for example, Swenson et al. 2011). For such demand-sensitive commodities, monitoring of international prices along with geological information on accessible deposits could help to predict rushes in ecologically sensitive areas.
2. Foreign investor influence can drive ASM in forests.
The increase in mineral demand may cause foreign investors to become involved in funding and/or promoting ASM activities. For example, Chinese junior mining companies have partnered with Ghanaian galamsey bringing in capital, machinery, and geological expertise. Sri Lankan, Thai, or other foreign traders readily buy gemstones from protected areas in Madagascar and invest in ASM operations to secure sources of supply. This involvement may become problematic in cases when those foreign investors operate outside the formal economy and regulatory environment, making their activities difficult to monitor and control. Besides reinforcing the host country’s regulations, it is evidently important to maintain open communication channels with other countries whose policies on foreign investment may have a knock-on effect on host countries.
3. LSM can act as an enabler of ASM and aggravate the forest impacts of ASM.
Large-scale mining can be another external driver of ASM, opening up new areas or deposits for ASM operations. This may happen directly because of the discovery of new mineral deposits, or later on when ASM operators take over closed LSM mines and mining areas. Planning decisions on where to allow the LSM sector to explore or mine can thus influence forest outcomes from ASM. Podocarpus in Ecuador exemplifies such a scenario, where artisanal miners invaded the protected area after an exploration license was granted to an LSM company.
4. Poverty and conflict may drive ASM and its forest impacts.
Most of these case studies confirm the perception that ASM is often a poverty-driven activity that stems from high unemployment or a lack of attractive alternative livelihood opportunities in the respective countries or

165FOREST-SMART MINING
regions. Evidence from Liberia, Suriname, Madagascar, and Ecuador suggests that attempts to promote alternative livelihoods rarely succeed because of a lack of suitable alternatives, and because earnings in mining are typically significantly higher than in other possible occupations.
The implication of poverty as a driver is that ASM places pressure on forests in the developing world, where governance and regulation tend to be weaker. Conflict can aggravate the problem by exacerbating poverty, limiting alternative livelihood opportunities or by driving migration flows into remote and mineral-rich areas where few other economic alternatives exist. Case studies of conflict-affected areas such as the DRC, Colombia, and Liberia highlight how conflict can not only be a driver of ASM in forests but also act as a barrier to forest-smart mining by undermining governance, effective regulation, or the success of forest conservation investments. This contextual understanding stresses the importance of addressing mining in forests from a political perspective—without adequate conflict resolution and poverty alleviation measures, direct investments in conservation or in responsible mining are less likely to be effective or sustainable.
5. Political will and macroeconomic policies may drive ASM impacts.
Political will and interests also play a role at a national level. In countries where mining is prioritized, aspirations for wealth generation through natural resource extraction may dominate over aspirations for forest protection. This is partly an unintended result of the unacknowledged economic value of forests as natural capital—forests remain unintegrated into sustainable development policies—compared to the high short-term economic returns from the extraction of minerals, whose value is immediate and measurable. Another contributing factor is where national policies underestimate the economic value of protected forests, such as when forestry policies are production orientated. In Ghana, for example, most remaining forests have the status of forest reserves, in which timber production and mining are permissible, rather than that of more strictly protected national parks.
Unstable political cycles within nations can also cause mining and forest policies to fluctuate significantly over the years, oscillating with changes in government. For example, economic reforms following the Soviet era in Mongolia brought political support for resource extraction, while Ecuador’s pro-mining national policy is being met with significant opposition from conservationists at regional levels. This has implications for international donors, financial institutions, and other
organizations seeking to support governments in mining or forest conservation.
4.3. Governance Barriers to Forest-Smart Mining
Like all sectors, ASM must be conducted in accordance with existing environmental and land use norms. The regulators´ role includes a responsibility to supervise and control ASM activities to ensure that these norms are respected. However, in ASM there also exists an additional responsibility for the regulators: to aid and assist ASM operators in their efforts to abide by existing norms. This is necessary because artisanal or small-scale miners often lack the financial and technical capacity to mitigate their impacts, and because in several developing countries where ASM occurs, it has become state policy to support and strengthen this sector of the economy and upscale ASM to become more formalized, skilled, and profitable.
Given this responsibility, the second most important factor that threatens forest health in ASM landscapes is the weak capacity of regulators to govern and control ASM.
Governance is undermined by the following factors:
1. A lack of appropriate regulations can aggravate the impacts of ASM.
A lack of appropriate regulation, in conflict-affected or other countries, inhibits forest-smart ASM. Without proper regulation in place, miners have no rules to follow, or rules are not enforced. The most relevant and common problems in this regard include unclear or missing regulations around land tenure and acceptable land uses. Ideally, a single identifiable stakeholder should have an interest in maintaining the condition of the land and the necessary authority over it in order to ensure positive forest or other environmental outcomes. In both Ghana and Madagascar, for example, local landowners have a strong interest in maintaining soil quality and protective forest cover to prevent soil erosion, and this is backed up by robust customary or formal legal rules. Public land tenure, where it exists, can lead to a “tragedy of the commons” whereby no stakeholder has sufficient interest in conserving the affected land. Forests and protected areas are typically owned by the state, and thus fall into this category.
Other unclear regulations can create confusion over whether responsibilities for rehabilitation lie with the government or with the ASM operators, or over which types of land uses including ASM are considered
166 FOREST-SMART MINING
acceptable for different levels of forest protection. In isolated but noteworthy cases, such as in Suriname, ASM existed for decades before proper legal frameworks were put in place to govern the mining sector.
2. Ineffective law enforcement contributes to negative forest outcomes from ASM.
Other factors negatively affecting law enforcement are a low government presence in often-remote mining districts, political crises, underresourcing and understaffing, and a lack of management systems or tools for decision making in government agencies. In Ghana, for example, a political crisis surrounding the negative impacts of small-scale mining caused the promulgation of an indiscriminate ban on all ASM mining, which has proven to be ineffective and widely flouted by illegal operators. Ironically, reports indicate that the mining ban has been obeyed by legal mining entities, leading to an unintended result whereby legal mining has ceased while illegal mining continues. Overall, significant efforts must be made to address the lack of capacity, underresourcing, and inadequate management practices and tools for decision making in mineral- and forest-rich countries.
The lack of transparency and good governance, as well as corruption, is another related factor that clearly prevents and undermines forest-smart ASM because it blocks law enforcement. Barriers stemming from a lack of good governance include the improper application of land rights, interference with protected area management, and conflicts of interest by law enforcement agencies or actors. In particular, ASM of high-value minerals such as gold or precious stones is often subject to the influence of political elites whose economic interests will tend to prevail over forest conservation. In Ukraine, for example, law enforcement officers are complicit in illegal mining and lack the necessary incentives (such as adequate salaries) to stop or regulate it.
3. Lack of coordination at central or local government level can worsen ASM impacts.
Furthermore, a lack of coordination between the ministries responsible for environment and mining governance and regulation, which often lack a common vision or have overlapping man-dates and unclear roles, can act as a barrier to the development of more forest-smart ASM. This has been an evident barrier in several case studies. In Liberia, for example, lack of a national land use plan and poor coordination between the forestry, agriculture, and mining sectors have resulted in the overlapping allocation of concessions for community forest lands and protected forests. Consolidation of mines and forests within a single ministry is alone not enough—in cases
such as Ghana, where minerals and forests are managed by the same ministry, the necessary coordination is still lacking. Besides mining and forestry, there is also a need for greater interministerial cooperation with ministries responsible for other land uses, such as agriculture, and resources such as energy and water.
Greater decentralization of sectoral regulation can allow for better planning and empowerment of local government for addressing mining at a local level, if local government demonstrates the capacity to take on this responsibility. However, a high degree of decentralization (such as in Indonesia) risks creating excessive local empowerment and losing sight of higher policy objectives in the absence of adequate collaboration and coordination between administrative districts.
4.4. The Way Forward—Solutions and Mechanisms for Forest-Smart ASM
The case studies not only have shown which factors potentially lead to more negative forest impacts of ASM or are barriers to forest-smart ASM, but also have yielded some lessons on solutions and mechanisms for forest-smart ASM and risks associated with its regulation.
1. Effective forest protection is the most important measure for forest-smart ASM.
Above all, effective forest protection is the main determinant of the forest outcomes of ASM and needs to be ensured by the increased designation of protected areas and law enforcement. Several of the case studies examined ASM occurring illegally in protected areas, but the numbers of miners inside protected areas are still on average less than those operating outside protected areas. Therefore, the creation of protected areas should continue to be the main means for protection of forests against ASM. Our results suggest, with some exceptions, that countries with the lowest incomes also have the lowest coverage of protected areas, stressing the importance of incorporating targets of protected area coverage (such as Aichi Target 11 of the Convention on Biological Diversity) into national development plans.
Recognizing that ASM does occur in protected areas where attractive deposits are found, multi-use protected areas allowing ASM can be considered as a means to allow controlled ASM in protected areas, but these require a relatively high degree of management and local stakeholder involvement to ensure that ASM remains within viable scales or does not introduce mining methods that compromise forest health. Examples of
167FOREST-SMART MINING
such approaches include Bolivia (multi-use protected areas) and Ghana (forest reserves). Negotiated land use compromises in protected areas can reduce forest impacts of ASM but may be technically unlawful and risk not being sustainable, such as in Loky Manambato (Daraina) in Madagascar.
2. Geological knowledge should underpin forest management decisions.
The ASM sector has generally been at a disadvantage in terms of geological knowledge compared to the LSM sector, with most ASM operations occurring haphazardly with only rudimentary prospection guiding decisions of where to mine. There has been no evidence of this being sufficiently implemented in any of the case studies examined. A better awareness of where viable deposits lie can help to minimize inefficient ASM operations in forest landscapes with subeconomic mineral resources, ultimately guiding decisions on the allocation of mining areas. In cases where ASM occurs predominantly informally, improved geological knowledge can help to predict rushes in protected areas and equip forest authorities to prepare action plans for responding proactively.
3. Evictions of ASM from forests can be necessary but their implementation should be improved taking account of human rights.
Evictions are sometimes necessary to safeguard protected forests from ASM incursions but can be done more sensitively and effectively. In particular, it is important to follow a human rights–based approach and to make follow-up social investments to discourage repeated incursions and evictions and to build community support for forest protection.
When ASM occurs in protected areas, or other areas where mining is strictly forbidden, it may seem a clear case for the regulator to simply evict the miners. However, the case studies show that evictions are essentially never completely successful because the affected people generally do not have any economic alternatives, with the result that they may return to mining in the same areas as soon as the opportunity arises. However, repeated attempts at evicting unlawful ASM miners—as shown in the cases of Podocarpus (Ecuador) and Sapo (Liberia)—can ultimately act as a deterrent, although a costly one, that restricts the number of miners involved and inhibits mechanization and associated increases in the size of the ASM operations.
Several of our case studies documented forceful evictions that led to aggravated confrontations between authorities and miners. Evidence from Sapo
National Park, in particular, highlights the benefits of using a human rights–based approach with voluntary rather than forceful evictions. By undertaking social assessments, documenting the eviction process, and involving the community with empowering roles in the eviction process, the latest eviction is a learning example of how to avoid conflict and violence in a volatile political climate. A recent eviction in Madagascar (Ankarana) also illustrated the benefits of thorough planning and wide stakeholder involvement.
4. Greater decentralization, capacity building, and coordination can contribute to more forest-smart ASM.
The delegation of authority and responsibilities to lower levels of government or customary leadership can contribute to more forest-smart ASM if local government has the necessary capacity and accountability for forest and ASM management. In Ghana, for example, positive results appear to be associated with governance efforts at the local level. Countries in which customary law is used for the local regulation of economic activities are better placed to mitigate the forest impacts of ASM, although the legal basis for such regulation may be precarious and vulnerable to political change or interference. Local management of ASM can be made more effective by recognizing customary regulation or decentralized legal regulation that is appropriate to the country context and is accompanied by capacity reinforcement. Building the capacity of central and local government institutions is an important precondition of forest-smart ASM.
Adequate coordination between the government bodies responsible for mining and forests has been shown to help limit forest impacts of ASM, such as in Madagascar, where the mining and environment ministries coordinate to avoid the awarding of mining permits in protected areas.
5. Formalization of ASM helps to improve compliance with regulations.
Promoting the progressive formalization of ASM so that it becomes a more manageable and governable sector is a necessary step and a complement to adequate regulation—in other words, a strong legal framework is of little use if most of the ASM sector operates informally.
Several case studies suggest that ASM formalization can increase the opportunities for regulating ASM and thus for the regulators to make it more forest smart. Formalization can empower regulators to control the location of ASM operations, the mining methods permitted, and the rules for environmental management, and to provide official technical capacity building—as
168 FOREST-SMART MINING
seen in Mongolia and Ecuador, where formalization has been used as the first step toward better environmental management. For example, formalization facilitates requiring Environmental Management Plans for ASM, which can help ASM operators to take responsibility and start managing their own impacts (as shown in Colombia, Sweden, Mongolia, and Ecuador). While we found no case studies in which ASM was contributing to REDD+ implementation, formalization should improve ASM’s ability to compensate for its forest impacts through forest conservation or plantation.
However, it is important for the environmental management process to be affordable, understandable, and beneficial to miners to incentivize their compliance. The principal barriers to such effective ASM formalization noted were unrealistic or overly restrictive regulations, bureaucratic bottlenecks (particularly relating to the award of mining permits), and the lack of deposits that are sufficiently mineralized and suitable for ASM. A mining law that recognizes a continuum between artisanal, small, and large-scale mining and adapts regulations accordingly to each scale of mining and its capabilities is beneficial for this process (as demonstrated in Ecuador and Colombia).
6. Good practice methods in ASM should be showcased and, where appropriate, be the basis for improved regulations.
Formalization and capacity building should be complemented by introducing best-practice approaches into law. Pilot projects can be very useful to demonstrate best-practice examples and motivate stakeholders to pursue their application. As the case studies show, best-practice examples in ASM do exist, even if they are relatively isolated cases, such as the Fairmined-certified gold mine in Colombia or the gold mine in Mongolia where the Frugal Rehabilitation Methodology has been piloted. Semi-mechanized mining can also look to developed countries such as Sweden for examples of best practice regarding small-scale mines. ASM operator management can be greatly assisted through peer-to-peer learning from such best-practice cases.
Useful guidance can be obtained from Mongolia, where the successful demonstration of one rehabilitation method (the FRM) led to its formal introduction into ASM law as a requirement for rehabilitation. This success is owed to a committed process of engaging all local stakeholders, close collaboration with national ministries, and the reassurance that the proposed methods were fit for the local environment as well as for the capabilities of ASM operators.
7. Indigenous rights to land and natural resources should be recognized while ensuring environmental compliance.
In case studies of countries where indigenous rights are well recognized, such as Bolivia, Colombia, and Ecuador, stronger enforcement of indigenous rights is associated with better forest out-comes from ASM. The existence of indigenous rights protection can help to prevent incursions from various industries into forested lands under indigenous control, particularly where their rights are formally respected through no-go commitments to indigenous territories or appropriate application of FPIC. However, the issues around indigenous rights are complex and their application can have unintended consequences by encouraging unsustainable exploitation of minerals by the indigenous communities themselves, as observed in Chocó, Colombia. It is therefore paramount that indigenous rights and their autonomy over land or natural resources are adequately safeguarded while ensuring the respect of environmental regulations and standards, strengthening indigenous peoples’ rights through, for example, no-go commitments to indigenous peoples’ territories.
8. Where ASM and LSM overlap, LSM should take greater responsibility for forest outcomes.
In situations where ASM occurs within the same forested landscape as LSM, in a large-scale mining concession or impacts LSM operations in any way, LSM companies need to take greater responsibility for the induced and indirect impacts associated with their operations, including ASM and the cumulative socio-ecological impacts on the forest landscape to ensure that ASM does not undermine any mitigation measures for positive forest outcomes put in place by LSM. This is because LSM is most often responsible for the increased infrastructure development into the forest and therefore the related influx of people to the area. Case studies such as that of Merian in Suriname show that forming mutually beneficial agreements with ASM is a more reliable approach than repeated evictions. In cases such as Bangka Belitung in Indonesia, where no agreements have been reached, artisanal miners continue to undermine the state-owned company’s rehabilitation efforts by re-mining areas abandoned by the LSM company. Similarly, anecdotal evidence from Ghana suggests that irresponsible practices such as encouraging illegal ASM at forest margins as part of an LSM operator’s exploration strategy continue to occur. However, LSM and government need to work together to ensure that such issues and impacts are carefully managed in a coordinated and integrated way with other land uses to ensure long-term forest sustainability.
169FOREST-SMART MINING
9. External support should be provided to enable forest-smart ASM.
Effects on forests may be less severe in countries where the forest conservation constituency is well established and well supported by international donors and NGOs. Such countries are also typically further advanced in the implementation of REDD+. The most positive examples of solutions have had some backing from donors or international NGOs (examples include Mongolia and Liberia). A strong civil society to hold governments accountable can also contribute to stronger forest protection by holding ASM operators and governments accountable for their respective responsibilities, as well as helping to combat corruption and strengthen governance. Specialist organizations that work directly with artisanal and small-scale miners are well equipped to disseminate and introduce more responsible mining methods, an undertaking that requires significant investment at the local level but is essential for achieving better efficiency with less impactful means of mining.
4.5. Comparative Analysis of the Case Studies
The detailed results are provided in spreadsheets annexed to this report. The results are summarized in matrix a series of tables of site- and country-level data.
Overall, the case studies provided a diverse sampling of ASM countries, sites, and contexts.
The 12 countries across four continents provide a rich source of contextual variation in natural resource governance, development of EIA legislation, biodiversity rating, population involved in ASM, REDD+ commitment, protected area system development, ASM organization, formalization and legislation, indigenous peoples’ rights, land tenure systems, and poverty and unemployment.
Variation is evident at the country level concerning the attributes that the case studies have qualitatively shown to have an influence on forest outcomes from ASM and for which data were available for all countries, including the relative importance of mining to GDP, ASM governance (miner organization, ASM legislation), land tenure systems (including the land rights of indigenous peoples), and the development of forest policy. In particular, we note differences in national policies for mining and forests and the management of forest-mining interactions, particularly as regards ASM.
The 21 sites examined, while mostly sharing the common feature of ASM mining in forested and high biodiversity landscapes (a result of the deliberate selection of ASM in forested landscapes for the case studies), exhibit
variation in target minerals (gold, platinum, copper, coltan, tin, diamonds, sapphires, lead, zinc, and amber), deposit type (alluvial, hard rock), interaction with LSM, presence of ASM in protected areas, conditions of land tenure, status of indigenous peoples’ rights, and in the relative importance of ASM as a source of deforestation compared with other development sectors.
In relation to attributes shown by the case studies to influence forest outcomes and for which consistent data were available, the sites show variation regarding the type of ASM (artisanal, mechanized or mixed), the effectiveness of evictions and bans, the degree of ASM organization, degree of environmental compliance, the dynamics of ASM operations (whether in active growth or “rush” scenarios, stable state or decline) and interaction with protected areas, deforestation intensity, and mercury use.
Collectively, the data facilitate an appreciation of the diversity of the forms of ASM and their operating contexts and provide indications of the conditions that can influence the forest outcomes of ASM.
Comparative analysis of case study data was undertaken in two main steps:
1. Comparison between deforestation severity in the ASM area with a range of mainly site-level parameters
2. Comparison of deforestation severity in relation to country-level attributes
Step 1: Comparison between deforestation severity in the ASM area with a range of mainly site-level or economic parameters
Sites are arranged according to the relative severity of deforestation in the 5-kilometer buffer zone around the ASM operations (that is, deforestation in the mine site itself and the surrounding buffer zone of 5-kilometer radius). Relative severity is calculated as the percentage difference between deforestation rates in the 5-kilometer area around the mining operations and the background rate for the administrative region in which the mining operations are located (using Forest Watch data). A negative value indicates that the deforestation rate in the 5-kilometer buffer around the ASM operation is below the regional average, while a positive value indicates that the deforestation rate in the buffer zone is higher than the regional average.
Data columns for other parameters are arranged beginning with those that influence the mining footprint most directly (target mineral, type of deposit, degree of mechanization, and so on), through economic drivers (mining as a percent of GDP, presence of LSM,
170 FOREST-SMART MINING
predominance of other sectors) to those, such as governance factors (legal status of ASM, protected areas, land tenure, and so on) which have a less direct influence on mining impacts.
Relationship between ASM deforestation and background deforestation rates
A first key observation is that deforestation rates in the immediate vicinity of almost half (9 out of 21) of the ASM operations studied are actually lower or no greater than the regional background deforestation rate. Considering the sites where this is the case (Gola, Sapo, La Cascada, Bemainty, COCOMACIA, Ankarana and Loky Manambato, Mapiri, and San Luis), these ASM operations share the feature of being in relatively remote forest areas as judged by consideration of road density in the AOI.
Conversely, for over half of ASM operations examined (12 out of 21), the deforestation rates in the 5-kilometer buffer around the ASM mining operation are measurably higher than the regional background rate, suggesting that ASM could be having an appreciable incremental impact on deforestation, as would be expected. Such ASM operations tend to be in less remote areas with higher road density.
When comparing the local deforestation severity associated with ASM and the Forest Health Index (FHI) for the wider AOI, it can be observed that ASM sites exhibiting more severe deforestation impacts in the 5-kilometer buffer zone are predominantly in areas with low scores for forest health (8 out of 12 cases). This would suggest that regions performing less well for the Forest Health Index also perform less well for the deforestation impacts of ASM.
Influence of mineral, deposit type, and mining methods
Gold is the predominant mineral across all sites, consistent with gold being the principal target mineral for ASM globally. A slightly higher proportion of low impact sites (4 out of 9) are for non-gold or mixed gold and other resources, while for the higher impact sites, gold clearly predominates (8 out of 12 sites). The variation and sample size are too small to suggest that gold mining has a higher impact on forests than mining for other minerals. The very high impacts of tin mining in Bangka Belitung (Indonesia) and amber mining in the Ukraine illustrate that high forest impacts can result from mining minerals other than gold.
However, the impacts of gold mining are aggravated by the use of mercury. Of the low-impact ASM areas, mercury use is reported as widespread for just 3 out of 9 sites, whereas for high-impact ASM sites, mercury use is reported as widespread for 7 out of 12 sites.
With regard to the deposit type, most of the low-impact sites (6 out of 9) are the subject of alluvial mining, whereas in the high forest impact group, there is a higher proportion of mixed or hard-rock deposits. Perhaps more significantly, most of the mixed method sites (5 out of 6) and most of the hard-rock sites (3 out of 4) are in the high-impact group. This actually runs counter to some of the case study findings; for example, in Ghana alluvial gold mining was considered to have a higher impact than hard-rock mining, but it could rather reflect the fact that a higher proportion of hard-rock or mixed deposit sites are in upland areas where forests are still extant.
The degree of mechanization appears to be a factor influencing deforestation rates by ASM. Of the low-impact ASM sites, most (6 out of 9) are purely artisanal mining, while most of the higher-impact ASM sites (8 out of 12) are mixed artisanal and mechanized or fully mechanized mining.
Influence of mining dynamics and the presence of LSM
ASM dynamics (that is, whether in state of rapid growth, stable state, or decline) may also have an influence on the forest impacts of ASM. In the low-impact group, sites are evenly spread between scenarios of rush (3), stable state (3), and decline (3), whereas in the high-impact sites, a higher proportion (6 out of 12) are in a rush/rapid growth phase and most high-impact sites (10 out of 12) are in either rapid growth or stable state.
The presence of LSM in the landscape may influence the forest outcomes of ASM. In the low-impact sites, LSM was mostly absent (present in only 1 out of 9 cases), whereas LSM was more frequent in the high-impact sites (4 out of 12 cases). In all case studies, LSM was reported as an aggravating (as opposed to neutral) factor to the deforestation impacts of ASM, which is a testament to the confusion over accountability that the presence of both ASM and LSM in the same area can create, particularly over issues such as remediation of impacts.
Relationship of ASM deforestation to economic factors
Poverty appears to be associated with lower forest impacts of ASM, while higher ASM impacts on forests are associated with increased incomes. Most (5 out of 9) low-impact sites were in countries with above the median poverty rates (7.1 percent), whereas most (8 out of 12) high-impact sites were in countries with poverty rates below or equal to the median poverty rate.
Most (5 out of 9) low-impact ASM areas are in lower-income countries, whereas 11 out of 12 high-impact ASM operations are in countries rated as low to middle income or above. This would suggest that the deforestation impacts of ASM are more severe in countries with higher
171FOREST-SMART MINING
incomes. Both this and the preceding observation could be linked to mechanization, which is associated with the availability of financial capital.
The case studies illustrate the varying contribution of economic sectors to deforestation in the landscape. At about half of the sites (10 out of 21), ASM was identified as a less dominant contributor to deforestation than other sectors, notably agriculture. ASM was a clearly significant or dominant contributor to deforestation in a similar proportion (9 out of 21) of sites. In the low-impact sites, ASM was a significant or dominant contributor only in a minority (3 out of 9) of cases, whereas in the high-impact sites, ASM was a significant or dominant contributor to deforestation in half (6 out of 12) of the sites.
Higher economic equality may also drive higher forest impacts of ASM. Equality is measured by the Gini coefficient, zero representing perfect equality and 1 representing maximum inequality. Of the 10 “more equal” countries below the median Gini index value (42.7, applicable to Madagascar with 3 sites), 8 out of 10 of the mine sites were in the high forest impact category. Of the “less equal” countries with a Gini index above the median value, only half (4 out of 8) were in the low-impact category. This suggests that higher economic equality worsens the forest impacts of ASM, consistent with greater access to capital, mechanization, and so on.
Low unemployment appears to be associated with lower forest impacts of ASM. For the countries examined, unemployment rates ranged from 2.4 percent to 9.1 percent. Most (7 out of 9) of the low-impact sites were in countries with lower unemployment. Conversely, most (9 out of 12) high-impact sites were in countries of higher unemployment. This suggests higher forest impacts of ASM are associated with higher rates of unemployment.
Finally, when considering mining as a percent of GDP, it may be observed that 7 out of 9 low-impact ASM operations are in countries in which mining’s contribution to GDP is 9 percent or below, whereas the majority of ASM sites with more severe deforestation impacts are in countries where mining makes a greater contribution to GDP. This suggests that for countries in which mining is more developed, ASM has greater access and capacity for mechanized approaches.
Relationship of ASM deforestation to governance factors
Some countries have introduced special zones reserved for ASM, with an objective to improve the management of the ASM sector. Typically, such zones would be outside forest areas, and their presence would be expected to reduce the forest impacts of ASM. However, as confirmed by some of the case studies (for example, DRC, Indonesia), such areas are rarely enforced in
practice. Considering the data in this study, about half (7 out of 12) of the high-impact sites were in countries that possessed special ASM zones, while over half of the low-impact sites were in countries that had no system of ASM zones. This suggests that provision of ASM exclusive zones does not help to reduce the forest impacts of ASM, probably because such zones are not applied in practice.
The designation of protected areas or forest reserves is one way in which countries seek to reduce deforestation caused by ASM or other threats. Considering the data, however, it may be observed that most of the low-impact ASM sites (7 out of 9 sites) are in landscapes where ASM is present or highly present in protected areas. Conversely, in the high-impact sites, only 4 out of 12 ASM mining operations are in landscapes with protected areas. This may indicate that in poorer countries ASM is driven into protected areas, while wealthier countries are better at defending protected areas from ASM. This hypothesis appears to be corroborated by the case studies for Ghana, a low- to middle-income country, where respect of protected areas by ASM was observed to be good, and Madagascar, a low-income country, where protected area incursions by ASM are frequent.
Related to the issue of ASM in protected areas are bans or evictions and their effectiveness. Of the 12 sites for which data on the effectiveness of evictions and bans were available, half (6) exhibited low effectiveness. In most of the remaining sites (5 out of 6), bans and evictions were moderately effective. Only one site reported high effectiveness (Noyod in Mongolia), which is related to the effective protection provided by the concession holder (an ASM NGO) against further illegal incursions. Most of the low-effectiveness cases (5 out of 6) were in high-impact sites, while evictions were more effective in low-impact sites (4 out of 9 sites). This suggests that bans or evictions are easier to achieve in sites where ASM is having a less severe impact, possibly associated with the higher levels of poverty at low-impact sites where ASM miners are less empowered to resist.
Land tenure systems may also influence the forest impacts of ASM. The case studies include examples of ASM operating in forested landscapes on land in state ownership, formal indigenous ownership, mixed state and recognized customary ownership, and legal mining concessions. For most ASM sites (12 out of 21), the forest impacts of ASM are occurring on purely state-owned lands. In the high-impact category, most sites (8 out of 12) were on state-owned lands, consistent with a “tragedy of the commons” scenario. In the low-impact category, the proportion was similar (5 out of 8). Interestingly, the only sites where indigenous rights were recognized were in the low-impact category, and the low-impact category also had the highest proportion (4 out of 8) of tenure

172 FOREST-SMART MINING
systems other than purely state owned. These findings suggest that the existence of specific land tenure rights can have a positive influence on the forest outcomes of ASM.
In contrast, the legal recognition of ASM does not appear to have any influence on the forest impacts of ASM. Overall, most ASM sites examined (13 out of 21) were technically illegal under the applicable national laws. Of the low-impact sites, most (6 out of 9) were predominantly illegal, with a similar proportion observed for the high-impacts sites (7 out of 12). ASM was illegal at both the highest- and lowest-impact sites.
The reported degree of compliance with environmental legislation also did not appear to have an influence. ASM at most sites (16 out of 21) was noncompliant with environmental legislation, with similar proportions for both low- (7 out of 9) and high-impact (9 out of 12) sites. Cases of “good” compliance were found in both categories.
Step 2: Specific consideration of deforestation severity in relation to country-level attributes
Relationship between ASM deforestation impacts and national biodiversity richness
National biodiversity ratings varied from 34.4 (Liberia) to 88.6 (Bolivia). While just over half (5 out of 9) of the low-impact sites were in countries with lower biodiversity ratings, only half (6 out of 12) of the high-impact sites were in countries with higher biodiversity ratings. This suggests no relationship exists between biodiversity levels and ASM forest impacts.
Relationship between ASM deforestation severity and the Resource Governance Index
The Resource Governance Index (RGI) of countries appears not to be a good predictor of the forest impacts of ASM. When comparing deforestation severity with the RGI, it is remarkable that most (5 out of 9) of the low-impact ASM sites are in countries with low RGIs, with two clear exceptions: La Cascada and COCOMACIA in Colombia. Colombia is well known for its high commitment to biodiversity conservation and Latin American states in general are known for their rigorous control of illegal ASM operations. This would suggest that the RGI is not a good predictor of how well countries perform in limiting the forest impacts of ASM, and that economic factors may be stronger determinants.
Relationship between ASM forest impacts and other national level governance factors
A number of further governance attributes were
considered for their potential influence on the forest outcomes of ASM:
• The strength of EIA legislation and regulations appears not to influence the deforestation impacts of ASM. Of the 13 countries for which the case studies provided data, most countries (12 out of 13) had “strong” EIA legislation and regulations, yet high- and low-impact sites were evenly distributed among these countries. This would suggest that EIA legislation is not a significant determinant of the forest impacts of ASM.
• Protected area coverage appears not to influence the forest impacts of ASM. Sites with the lowest ASM impacts were mostly (5 out of 9) in countries with lower (14 percent or less) protected area coverage, whereas most (8 out of 12) sites with the highest ASM impacts were in countries with higher protected areas coverage (above 14 percent).
• A higher degree of ASM organization appears to be associated with higher forest impacts. In the low-impact sites, most sites were in countries with low ASM organization, whereas of the high-impact sites, only 3 out of 12 were in countries with low ASM organization. This is in line with the findings above that a higher degree of mining sector development appears to be associated with higher forest impacts.
• Recognition of indigenous peoples’ rights appears to be associated with lower forest impacts. At the country level, as at the site level, there is some evidence that lower forest impacts are associated with greater recognition of indigenous peoples’ rights.
• Land tenure systems that recognize both modern legal and customary rights appear to be associated with lower forest impacts of ASM. All the low-impact sites were in countries possessing some sort of dual land tenure system in which both modern legal and customary land ownership rights are recognized. All sites in states recognizing only state ownership were in the high-impact category, consistent with a “tragedy of the commons” scenario.
• Pro-forest policies appear to favor better forest outcomes from ASM. Most (8 out of 9) low-impact sites were in countries with forest policies that explicitly sought to balance the conservation of forests against the development other sectors, or policies that actively promoted forest expansion, whereas most (6 out of 7) countries with policies allowing or encouraging deforestation
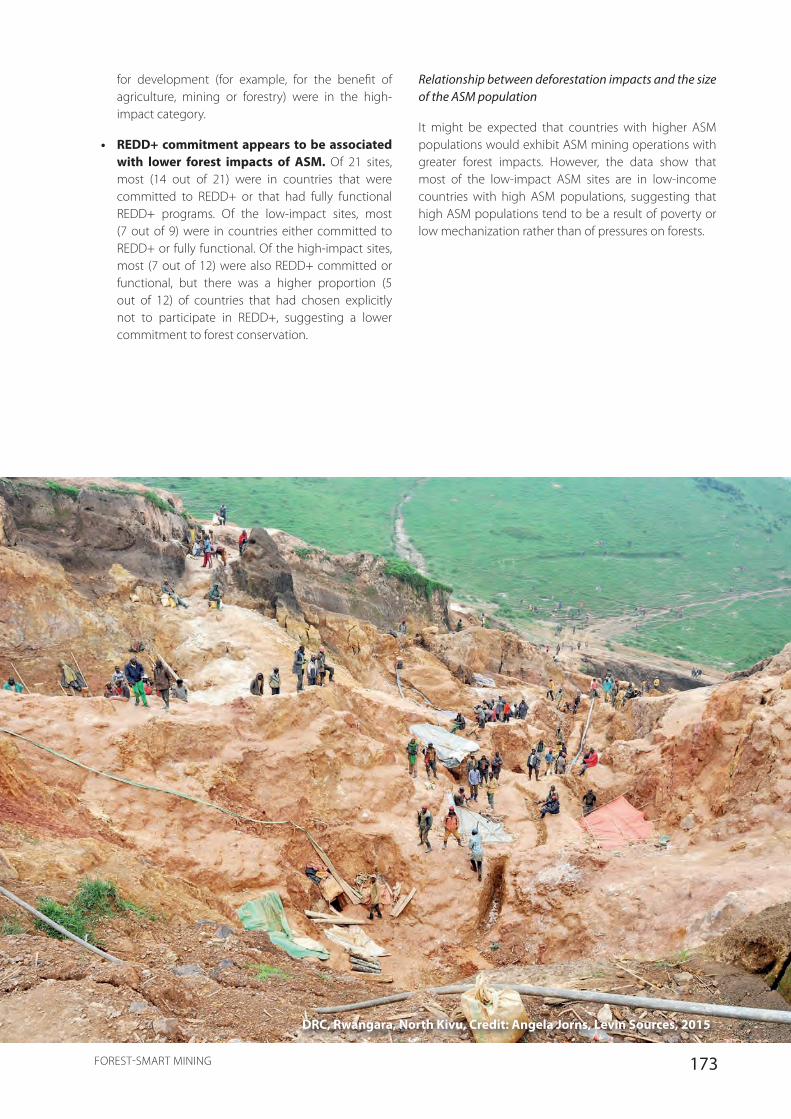
173FOREST-SMART MINING
for development (for example, for the benefit of agriculture, mining or forestry) were in the high-impact category.
• REDD+ commitment appears to be associated with lower forest impacts of ASM. Of 21 sites, most (14 out of 21) were in countries that were committed to REDD+ or that had fully functional REDD+ programs. Of the low-impact sites, most (7 out of 9) were in countries either committed to REDD+ or fully functional. Of the high-impact sites, most (7 out of 12) were also REDD+ committed or functional, but there was a higher proportion (5 out of 12) of countries that had chosen explicitly not to participate in REDD+, suggesting a lower commitment to forest conservation.
DRC, Rwangara, North Kivu, Credit: Angela Jorns, Levin Sources, 2015
Relationship between deforestation impacts and the size of the ASM population
It might be expected that countries with higher ASM populations would exhibit ASM mining operations with greater forest impacts. However, the data show that most of the low-impact ASM sites are in low-income countries with high ASM populations, suggesting that high ASM populations tend to be a result of poverty or low mechanization rather than of pressures on forests.
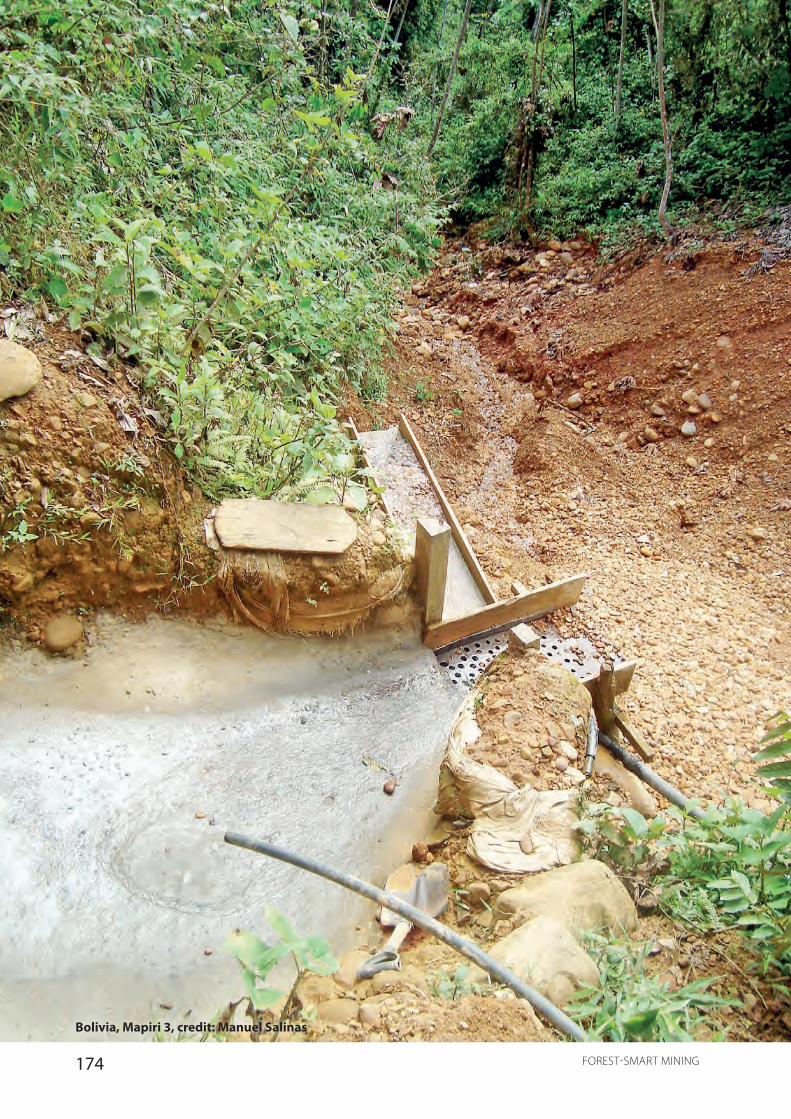
174 FOREST-SMART MINING
Bolivia, Mapiri 3, credit: Manuel Salinas
175FOREST-SMART MINING
The overarching goal of the project is to provide recommendations to the World Bank and its clients on how best to facilitate and promote forest-smart mining for ASM projects, using case studies to identify good and bad practices and to analyze the conditions and mechanisms that drive these. The findings provide the basis for recommendations for developing forest-smart mining through a socio-ecological landscape approach. From these recommendations we derive 15 principles for forest-smart mining for ASM, presented within the text on recommendations.
The case studies provide a diverse sample of 21 ASM sites across 12 countries and four continents, with variation in geological, economic, environmental, social, and
governance contexts. Collectively, the data show the diversity of ASM operations and the conditions and mechanisms that influence the forest outcomes of ASM.
The case studies show that ASM mostly has relatively minor direct impacts on forests, with a few notable exceptions, in turn primarily determined by the spatial extent and geological characteristics of the target deposits. The forest impacts of ASM are almost always substantially less than those of other development sectors, such as agriculture and forestry; nevertheless, they can be significant within the context of such diverse and cumulative drivers of forest degradation and deforestation.
5. FOREST-SMART ASM GENERAL CONCLUSION AND RE-COMMENDATIONS
Key Forest-Smart Mining Principles
1. Contextualize mining deforestation by taking into account other sectors.
Forestry and agriculture are the main drivers of deforestation in many of the studied areas. Forest-smart interventions targeting mining might be received with hostility if mining stakeholders can observe widespread deforestation from other sectors, and if they feel they are uniquely and disproportionately being held to account. However, there remains an urgent need to minimize the impacts of mining even in a landscape dominated by agriculture. The indirect impacts have the potential to undermine forest health, ecosystem function, and the overall resilience of the forest ecosystem to external threats. Therefore, the long-term health of forests can be compromised through chronic rather than acute impacts on forest ecology, and the role that ASM and their dependent communities can play in such impacts needs to be understood in greater depth.
To achieve this principle, stakeholders would need
to take the following general actions:
a. Governments
• Adopt a broader “forest-smart development” approach that includes all development sectors in a framework for evidence-based and cross-sectoral decision making.
• Promote an integrated landscape-based approach to forest-smart development.
• Prioritize the introduction of forest-smart development to landscapes that are more vulnerable to deforestation and biological degradation.
• Develop a tool for assessing the vulnerability of landscapes to support this decision making.
b. Mining entities
• Build coalitions with companies in different sectors operating in the same region to identify and address shared cumulative environmental impacts. This could be through
176 FOREST-SMART MINING
mining sector representation on community platforms for environmental protection, for example, or through multisectoral initiatives to mediate economic development with environmental protection.
c. Civil society and NGOs
• Campaign for the development of platforms for cooperation between companies operating in the same region.
» Building expertise and scientific knowledge to identify priority areas for species that require conservation and where application of forest smart mining is paramount.
» Support building expertise to understand the wider political economy of natural resources in the forest landscape to understand the feasibility of changing practices.
d. International financial entities
• Develop and support an integrated approach for businesses operating in the same region to address deforestation and biodiversity.
• Catalyze, support, and/or facilitate strategic environmental assessments.
e. World Bank
• Develop new strategies to concentrate the scarce funding resources for forest protection. Such strategies could include innovations to the landscape approaches in forests, new ways of classifying forest environments to highlight the most vulnerable or most valued sites, and so on.
• Assign independent concerns to support cross-sectoral landscape planning to facilitate a neutral, participatory, and effective process.
• Agriculture is a bigger threat to forests than mining, but impacts are higher where they occur together. An opportunity may exist to divert investments for the conversion of forests into agriculture toward the rehabilitation and conversion of post-mining land into viable agriculture instead, which could provide opportunities for achieving a net gain for the environment and the economy.
more serious, such as increased sedimentation on aquatic ecosystems, soil contamination through the use of mercury in gold mining, and poaching of endangered fauna or illegal logging. These indirect impacts have the potential to undermine forest health, ecosystem function, and the overall resilience of the forest ecosystem to external threats. Therefore, the long-term health of forests can be compromised through chronic rather than acute impacts on forest ecology, and the role that ASM and their dependent communities can play in such impacts needs to be understood in greater depth.
Alluvial mining targeting riparian forest zones often has a larger footprint than hard-rock mining, but hard-rock sites are more likely to be in upland areas where forests are still extant and therefore may have significant local impacts on forests. The direct impacts of ASM on forests also increase with the degree of mechanization and are greater during rapid growth phases.
The indirect or secondary impacts of ASM on forests in the receiving landscape also appear to be relatively minor, and they are sometimes difficult to discern. Other secondary impacts of ASM, on the other hand, can be
177FOREST-SMART MINING
Key Forest-Smart Mining Principles
2. Consider all impacts of mining when considering forest-smart interventions.
Deforestation and loss of ecological health and function are the most serious impacts of mining in most of the examined cases for example, the destruction of river habitats. Forest-smart initiatives need to target better environmental and social performance from mining, taking into account the entire risk matrix of mining. This will help to maintain ecological integrity and secure the trust and engagement of stakeholders.
To achieve this principle, stakeholders would need to take the following general actions:
a. Governments
• Where gold is extracted using mercury, the use of mercury and destruction of river habitats should be assigned a higher priority for allocation of scarce resources for prevention or remediation.
• Where poaching occurs, bushmeat hunting need to be understood, and locally/culturally appropriate strategies identified in collaboration with stakeholders to address the issue should be implemented (for example, in some cases providing cheaper alternative supplies of protein has proven effective), such as plant-based products or poultry.
b. Mining entities
• Because the minerals derived from mining are often used for activities that themselves drive deforestation, mining entities should expand their concept of impact, including not only direct impacts but also indirect and cumulative impacts.
c. Downstream companies
• Include all environmental impacts of mining when performing due diligence studies.
• Lobby mining entities to embrace the entire risk matrix of mining (that is, impacts on forests, water, soil, and air).
d. International financial entities, including the World Bank
• Build policy bridges between sectors (water, agriculture, mining, and so on).
• Use the right language to communicate—for example, talk about forest degradation, not just deforestation; talk about forest landscapes, not just forests as trees.
3. Improve the understanding of where ASM is occurring and its impacts on forest landscape degradation, human health, and ecosystem services as a basis for designing appropriate realistic interventions with a higher chance of success.
Baseline surveys of ASM need to be undertaken to ensure that any actions taken are based on a proper understanding of the actual situation, including trends toward likely future scenarios. This would allow for effective monitoring of forest health change and the activities that determine it, and for an evidence base to be established.
To achieve this principle, stakeholders would need to take the following general actions:
a. Governments
• Establish links with knowledge institutions to undertake baseline surveys. Where resources allow, surveys should combine forest and mineral/geology-related expertise to enable better prediction of forested areas likely to be targeted by ASM and a more anticipatory management of ASM-forest interactions.
• Be proactive and include stakeholders that are normally elusive or difficult to access, such as ASM miners, Chinese businesses, or non-ICMM members.
• Use USDA tools for forest health assessment to support monitoring (USDA, n.d.).
• Raise awareness on the impacts and risks of bushmeat hunting with miners and local communities.
b. International entities
• International knowledge institutions, univer-sities, and research institutions should undertake studies of the political economy of ASM operations, including the modes of production, value chain analysis and social, environmental and economic impacts.
c. World Bank:
• Analyze sectors where increasing demand for minerals is driven by a commitment to meet the Sustainable Development Goals, the Paris Agreement or to uphold the United Nations Guiding Principles on Business and Human Rights. Analyze if the extraction of those minerals overlap with mines operating in forest landscapes and target mines and countries in these sectors for action and support.
• Develop a guidance to implement this principle across all stakeholder sectors.
178 FOREST-SMART MINING
ASM and its impacts are strongly driven by the price of target commodities. ASM for gold has undergone a substantial increase since the crisis of 2009 caused a large rise in the price of gold, which remains strong to this day. ASM in developing countries is also increasingly driven by foreign investment, which can exacerbate the forest impacts of ASM, especially where such investment operates outside the formal economy.
Of the economic conditions influencing the forest impacts of ASM, poverty, inequality, low national income,
low unemployment, and low contribution of mining to GDP are all associated with lower impacts of ASM on forests, whereas higher incomes, higher equality, higher unemployment, and a higher contribution of mining to GDP are all associated with increased impacts of ASM on forests. With some exceptions, higher ASM populations are more strongly associated with poverty and lower levels of mechanization than they are with increased forest impacts.
Key Forest-Smart Mining Principles
4. Ensure that the regulatory environment of ASM attempts to stay ahead of the development of the sector (recognizing that this sector has commonly been neglected or overlooked to date).
As countries become more prosperous, some problems/challenges related to ASM tend to disappear, while environmental impacts, including forest impacts, tend to increase, requiring stronger policies and regulations, and improved capacity by regulators to enforce them.
To achieve this principle, stakeholders would need to take the following general actions:
a. Governments
• Build awareness and capacity of relevant stakeholders in order to design optimal strategies to mitigate potentially destructive practices as development increases.
• Tailor regulations according to economic autonomy and power.
• Prepare for the effects of future economic growth by placing appropriate regulations ahead of anticipated economic growth.
b. Civil society, NGOs, and mining entities
• Civil society and local NGOs should advocate for the integration of forest-smart mining practices into mining entities’ activities and government policy and regulations.
• Civil society, mining entities, and local NGOs should lobby for more effective laws.
c. Downstream companies
• Do due diligence on environmental management by ASM, including impacts on forests.
d. International entities, including the World Bank
• Advocate for the integration of forest-smart mining into international policy frameworks and guidance for achieving sustainability, responsible business conduct, and human rights protections in the mining and minerals sector.
• Consider how a forest-smart mining checklist could be used for responsible sourcing as part of supply chain due diligence.
• Support civil society movements that can contribute to stronger forest protection by holding governments and ASM operators to account.
• Suppor environmental law enforcement in the mining sector.
e. World Bank
• Consider expanding these principles into a guidance on forest-smart mining that other initiatives could incorporate into their own standards.
5. Work with the environmental education agenda to disseminate facts related to the need to safeguard/protect forests.
Hand in hand with improved regulation, it is also important that societal actors understand and assume increased individual responsibility for environmental sustainability and the importance of forest conservation.
To achieve this principle, stakeholders would need to take the following general actions:
a. Governments
• Build awareness and capacity of relevant stakeholders to design optimal strategies to mitigate potentially destructive practices as development increases.
179FOREST-SMART MINING
• Collaborate with the research community to identify and assimilate facts needed to safeguard forests.
• Build awareness of forest values and the importance of their conservation.
b. Civil society and mining entities
• Build understanding around the role of development activities like mining, agriculture, and forestry as drivers of deforestation and forest degradation.
• Civil society and local NGOs should campaign to encourage governments and private foundations to allocate resources for environmental education in mining communities.
• Civil society, mining entities, and local NGOs should proactively use environmental education as part of stakeholder engagement (mining entities) and program of activities (NGOs).
c. Downstream companies
• Support the introduction of environmental education programs in communities where stable sourcing relationships are established.
d. International entities, including the World Bank
• International entities such as ASM advocacy NGOs should develop and promote wider use of good practice guidelines for environmental education and regulation in ASM communities.
• Encourage ASM mining entities and NGOs to sign on to the New York Declaration on Forests.
• Raise the profile of ASM and LSM with the Convention on Biological Diversity (CBD) and promote forest-smart mining in forums uniting governments, businesses, civil society, and religious organizations.
• Support information campaigns concerning the reasons forests need to be protected, their value in providing ecosystem services, how mining impacts them, the extent and environmental cost of current practices, what is happening, and lessons learned from other countries.
e. World Bank
• Promote the forest-smart approach, clearing tying it to the SDGs and New York Declaration on Forests, and contextualizing forests as core to biodiversity management and to being climate-smart.
• Scope all the forest-smart tools and prioritize those for promotion and awareness raising.
• Develop forest-smart principles generally and for different stakeholders.
6. Work with the poverty reduction agenda and secure a critical level of political stability in priority countries.
A minimum critical level of political stability and poverty reduction is needed before mining can contribute to sustainable development or before conservation investments can maximize their impact. In general, the pursuit of the Sustainable Development Goals and transparency of payments, incidents, and sustainability outcomes by all actors, and the safeguarding of human rights, can support poverty reduction and political stability.
To achieve this principle, stakeholders would need to take the following general actions:
a. Governments
• Target actions to tackle unemployment and poverty, especially in mining and rural communities.
• Control foreign investors by requiring compliance with standards such as CCCMC’s Guidelines for Social Responsibility in Outbound Mining Investments (CCCMC 2017), the Principles for Responsible Investment (PRI, n.d.), and FATF’s International Standards on Combating Money Laundering and the Financing of Terrorism and Proliferation (FATF 2012–2018); complying with anti-corruption regulation; and carrying out due diligence on their environmental compliance and performance in other jurisdictions prior to allocating permissions.
• Fight against the lack of good governance and incentivize and ensure transparency in the mining sector.
• Where illegal ASM operations are protected or abetted by criminal activities like money laundering and corruption , apply appropriate security and conflict prevention measures, and consider sanctions in extreme cases.
b. Mining entities
• Mining entities should support local communities’ development programs and needs, always ensuring that such development programs and strategies to address community

180 FOREST-SMART MINING
Of the governance mechanisms potentially influencing the forest impacts of ASM, the establishment of special ASM zones, the extent of protected area coverage, the legal status accorded to ASM, and compliance with EIA legislation and environmental regulations may have
needs are sustainable from a social, economic, and environmental perspective.
• Mining entities should recruit local people and build their capacity.
• Mining entities should implement accountability and impact measurement tools and processes to support the monitoring and disclosure of the sustainability outcomes of their mining activities, for example, the CRAFT Standard.
c. Downstream companies
• Downstream companies should start doing due
diligence on their supply chains and putting in place appropriate risk controls in high-risk provenances, including boycotting certain origins where the rule of law makes responsible business conduct impossible or highly unlikely.
d. International entities, including the World Bank
• Build awareness and develop tools for conflict prevention measures where illegal ASM operations are protected or abetted by criminal activities.
• Support micro-finance schemes for alternative livelihoods.
Key Forest-Smart Mining Principles
7. Develop and implement clear policies for land use allocation and land ownership.
The predominance of state or communal land ownership and confusion regarding land use rights that prevail in many developing countries tend to result in “tragedy of the commons” scenarios. On the other hand, better forest outcomes are achieved where there is good control of how state-owned land may be used, or where systems for allocating rights for land use are both functioning and well recognized.
To achieve this principle, stakeholders would need to take the following general actions:
a. Governments
• Recognize the rights of indigenous peoples and adequately safeguard their autonomy over land or natural resources while ensuring respect of environmental regulations and standards.
• Use innovative technologies for land use mapping and environmental monitoring (for example, remote sensing, drones, telecommunications, and so on) where this is particularly helpful.
• Be inclusive of international policy frameworks and, where appropriate, use best-practice methods as the basis for improved regulation.
• Use geological mapping and knowledge to inform forest management and landscape planning decisions.
• Allocate mining areas for ASM and promote progressive formalization as an entry point for compliance with environmental regulations and management.
• Accommodate both modern legal and customary rights in land tenure systems where appropriate to the context.
b. Civil society and NGOs
• Advocate to empower indigenous peoples and other local communities to claim their rights.
• Lobby governments to apply this principle. Expand the research and evidence base in local and national case studies to support this.
c. International financial entities, including the World Bank
• Pilot integration of a forest-smart approach into relevant policy frameworks and programs.
• Pilot projects to improve landscape management integrating community landscape planning.
8. Take special care to safeguard comparatively weaker communities/individuals and those with
comparatively little influence on the forest impacts of ASM, whereas systems of land tenure that recognize modern and customary rights and the land rights of indigenous people can help to limit the forest impacts of ASM.
181FOREST-SMART MINING
Forest policy may have a tempering influence, with pro-forest policies and commitment to REDD+ being associated with lower forest impacts from ASM. On the other hand, where policies prioritize development such as mining or agriculture over forest protection, the forest impacts of ASM are increased.
special rights.
ASM, particularly the nonmechanized artisanal forms, are strongly associated with low levels of development, high degrees of poverty, subsistence lifestyles, and in some countries the presence of indigenous peoples or vulnerable communities. There are thus strong social justice and human rights implications with regard to the regulation of ASM in these particular contexts, over which special care should be taken.
To achieve this principle, stakeholders would need to take the following general actions:
d. Governments and companies
• Where they apply, strengthen indigenous peoples’ rights through no-go commitments to indigenous peoples’ territories and empowering indigenous peoples’ to claim their rights and push the forest-smart agenda.
• Build participatory approaches to forest restoration and rehabilitation, building on indigenous ecological knowledge as appropriate.
• Take a rights-based approach when designing and applying regulations. Solutions won’t be sustainable without multi-stakeholder ownership of the process and the outcomes.
• Conduct a process for free, prior and informed consent with regards to changes in land use
and resource exploitation in order to ensure proper consultation and decision making with indigenous peoples and those with special rights.
e. Civil society and NGOs
• Lobby governments to apply this principle.
• Support vulnerable groups to claim their rights through engagement, empowerment, and inclusion.
f. World Bank
• Anticipate and embrace diverse, localized definitions of forest-smart mining. Develop universal principles on forest-smart mining, for local negotiation and definition into local action plans through a participatory and facilitated process of dialogue. This process would provide capacity building across stakeholders, build trust, and effect development of the forest-smart concept. Moreover, it would provide a template for others to use or adapt. It could be integrated into company management systems, responsible mineral initiatives and standards, government policy, and other ASM and LSM dialogue processes around SDGs and environmental management.
Looking more widely at other country conditions and mechanisms influencing the forest impacts of ASM, there appears to be no association between the forest impacts of ASM and countries’ Revenue Generation Index (RGI) or with the strength of EIA legislation. On the other hand, a high degree of ASM organization or empowerment is associated with increased forest impacts from ASM, suggesting that pro-mining policies, if not counterbalanced with pro-forest policies, tend to drive deforestation. ASM capacity and organization needs to be developed within the framework of demonstrable best environmental practice-based incentives and approaches, which are embedded in improved legislation and guidance relevant to the sector, including improved environmental planning and stakeholder-inclusive governance systems.
182 FOREST-SMART MINING
often inadequate, unclear, or ill adapted to ASM, and enforcement is often ineffective. Even where regulations are adequate, their effectiveness can be compromised by lack of capacity and resources on the part of the regulators, a lack of good governance, and/or a lack of coordination between government departments.
Key Forest-Smart Mining Principles
9. Consider the role of protected areas and REDD+ in limiting the impacts of ASM on forest landscapes.
The case studies have demonstrated that mineralization suitable for ASM and effective forest protection are the strongest, yet conflicting, determinants of the forest outcomes of ASM. Case studies also show that forest impacts of ASM can be managed in multiple-use protected landscapes if based on adequate stakeholder engagement. Countries with well-developed protected area systems and REDD+ implementation appear to perform better on the forest outcomes of ASM.
To achieve this principle, stakeholders would need to take the following general actions:
a. Governments
• Improve and invest in protected area systems and the implementation of REDD+, always in collaboration with local communities.
• Review protected area and REDD+ policies, plans, management, and eviction strategies in relation to ASM to achieve better forest outcomes.
• Incorporate targets of protected area coverage (such as Aichi Target 11 of the Convention on Biological Diversity) into national development plans, and ensure effective forest protection in these protected areas.
• In environments of high biodiversity importance and with few remnants of primary forests, sites of most critical significance for the preservation of endangered biodiversity and primary habitats must be prioritized when addressing ASM rushes in protected areas.
• Follow a human rights–based approach to evict miners from protected areas and apply follow-up social investment and community support to discourage repeated incursions.
• Where eviction measures do not work, multiuse protected areas can be considered as a means to allow controlled ASM. But these multiuse areas require a relatively high degree of management and local stakeholder involvement to ensure that ASM’s impacts are minimized. Development of managed containment and exit strategies (CES) can be considered where ASM is entrenched with particular mineral reserves within protected areas.
b. Civil society, NGOs, and indigenous peoples
• Advocate and support measures to take special care and safeguard comparatively weaker communities/individuals and those with special rights when developing eviction plans, REDD+ policies, and ASM management plans. Focus on empowering vulnerable people to claim their rights and addressing barriers to them achieving this.
• Be involved in the implementation of REDD+ policies, evictions, and ASM management plans.
c. International financial entities, including the World Bank
• Consider advancing natural capital quantification to understand the externalities and bring these into mining projects. Financial mechanisms for compensation and incentives for prevention can be built by putting a financial cost to the degradation or loss of forests.
• Develop guidance on evictions and REDD+ policies, plans, and management.
There are numerous barriers to forest-smart ASM. ASM, especially when informal, is particularly poorly positioned to mitigate its own impacts, and regulators often lack the capacity to address or support ASM, with the result that ASM tends to be ignored or outlawed. Regulations are
183FOREST-SMART MINING
Key Forest-Smart Mining Principles
10. Assist and strengthen the regulators of ASM in developing countries so that they can effectively implement forest-smart mining.
The case studies have shown that ASM is a difficult sector to regulate and that it may, for various reasons, be neglected, ignored, or even be explicitly targeted for extinction by regulators. The reasons for this include lack of capacity, lack of political will, prejudice against small producers, and a lack of good governance.
To achieve this principle, stakeholders would need to take the following general actions:
a. Governments
• Ensure proper coordination between ministries and levels of governance on issues relating to ASM.
• Empower and build the capacity of central and local government institutions so that ineffective law enforcement and the lack of good governance can be overcome.
• Where regulations are nonexistent, unclear, or contradictory, governments should review or draft laws to address these issues. Newly drafted laws should be inclusive and indicate roles and responsibilities of stakeholders.
• Consider decentralizing ASM governance only if greater coordination and additional capacity reinforcement can be put in place.
b. Civil society, NGOs, and mining entities
• Advocate to strengthen the regulation of ASM and fight against corruption.
• Implementing NGOs should support stakeholders to integrate forest-smart mining principles into their risk management procedures, and to implement of forest-smart mining practices into their operations.
• Encourage national mining associations to convene a national agenda among their membership to adopt forest-smart mining principles and practices.
c. International entities, including the World Bank
• Take leadership by researching how to get the mining industry to take ownership of the protection of forests and how to get forest protection communities to be inclusive of mining.
• Pursue cross-sectoral opportunities for dialogue and trust building when developing guidance for the principles.
• Support multi-stakeholder initiatives for forest-smart mining, building trust, capacity, and neutrality between stakeholders.
• Encourage the International Council for Mining and Metals (ICMM) and the National Councils of Mines to convene and align companies, mining communities, and governments operating in priority forest landscape countries on a joint strategy to mainstream forest-smart mining.
11. Assist and strengthen ASM operators in developing countries so that they can effectively implement forest-smart mining practices.
The case studies have demonstrated that ASM typically (but with some notable exceptions) has relatively low impacts on forests compared to other development sectors, but those impacts increase with the level of economic development.
To achieve this principle, stakeholders would need to take the following general actions:
a. Governments
• Build the capacity and will of ASM actors to cooperate with regulators in order to mitigate ASM’s impacts on forests.
• Build a campaign for environmental stewardship by miners.
• Introduce approaches that incentivize environ-mental best practice, such as the promotion of affordable, socially acceptable, and ecologically viable rehabilitation methodologies.
• Institute a national or provincial competition for the best environmental stewardship by mining communities, mining companies, and individual miners.
b. ASM operators and mining entities
• Minimize forest impacts by using previously disturbed areas.
• Optimize operational mining design in ways that reduce the mining footprint and maximize potential for effective rehabilitation.
• Implement best practice in the environmental rehabilitation of mined areas.
• Implement good industry practices to minimize landslides.
184 FOREST-SMART MINING
Overall, it may be concluded that contextual conditions, especially economic conditions such as the level of development and the amount of available capital, appear to be strong determinants of the forest impacts of ASM. Mechanisms to address such impacts—such as environmental legislation, sectoral capacity building, economic incentives and governance mechanisms—are often ineffective, poorly designed, and/or siloed. Experience has shown that such approaches need to be developed as linked, coordinated efforts delivered through a program of integrated initiatives that build capacity across the spectrum of impacted and relevant stakeholders, and that such initiatives need to be developed at both national and grass-roots levels.
Contrary to some perceptions, increased prosperity in the absence of coordinated formalization rather than poverty drives increased impacts of ASM on forests. For this reason, strong policies and regulation of ASM becomes critical as developing countries transition to higher income levels and financial capital and mechanization become more readily available to ASM operations.
At the same time, the apparently low forest impacts of ASM encountered in the poorer mining countries should not be cause for complacency. In such countries, it is important to prepare for the effects of future economic
• Improve internal cooperation and external parties’ relations and cooperation.
• Introduce approaches that incentivize environmental best practice, such as holding award ceremonies to recognize forest-smart mining champions.
c. Civil society and NGOs
• Lobby to introduce forest-smart mining practices in the ASM sector.
• Implementing NGOs should support ASM miners in the adoption of alternative ASM technologies that avoid and minimize environmental impacts (for example, mine design and rehabilitation).
d. International entities, including the World Bank
• Support peer-to-peer ASM exchange for mutual learning on environmental management and replicate mining practices within and between
nations, similar to the SDC’s SAM program.
• Support cross-sectoral partnership-based approaches in countries experiencing ASM for the development of appropriate environmental best-practice tools, stakeholder-inclusive planning, and governance. This should include the development, dissemination, and adoption of alternative ASM technologies that avoid and minimize environmental impacts, and, where applicable, the targeting of mercury reduction, water, soil, and air pollution, habitat degradation, and forest restoration.
• Introduce and strengthen the prospecting skills of ASM miners.
• Proactively capture positive stories of miners across all scales as environmental stewards and seek avenues for reproduction of these successes.
growth across the ASM sector and to implement the necessary integrated policies and regulations through concerted interministerial cooperation. Such lateral and vertical coordination of incentives will help ensure that the regulation of ASM keeps pace with its economic and technical capacities and that forest-smart mining can be effectively promoted and implemented through the relevant authorities.
Overall, one of the most important lessons learned from the study is that the forest outcomes of ASM are more strongly determined by forest and protected area policy and regulation than they are by mining sector policy and regulation, indicating that the mining sector is not exerting sufficient influence on ASM’s impacts on forests and therefore is not “forest smart” for ASM. This recognizes that there is often a significant lack of equity and coordination between the respective ministries responsible for mining and for the environment.

185FOREST-SMART MINING
small-scale mining operations are not allowed to benefit from the lighter regulation typically imposed on ASM. Mining is mining, whatever its scale, and opportunities to perform it in an environmentally and socially responsible manner should be encouraged and required to the fullest extent possible.
Key Forest-Smart Mining Principles
12. Improve mining regulations to adopt an ASM Forest-Smart approach.
In some cases, mining sector policy and regulation may even act as impediments to improved forest outcomes of ASM.
To achieve this principle, stakeholders would need to take the following general actions:
a. Governments
• Mining and environmental ministries need to engage more effectively in the governance of ASM and play a greater role in the management
of ASM’s forest landscape impacts.
• Environment ministries need to recognize the presence and reality of ASM and work collaboratively and constructively to develop formalized solutions to ASM’s impacts on forested landscapes.
• Central governments need to build platforms for environmental and mining ministries to coordinate actions, clarifying roles and responsibilities.
• Regulators should clarify and enforce environmental policies within the mining sector.
Key Forest-Smart Mining Principles
13. Ensure that the roles and responsibilities of miners and regulators are clearly defined and un-derstood by all.
In more developed countries, ASM is regulated in the same way as LSM. Therefore, in the longer term, the ASM sector should strive to achieve the same standards as LSM, mindful of the contrasting conditions of each. In developing countries, it should be recognized that artisanal miners need support to become more environmentally responsible and formalized, while larger operators can reasonably be expected to abide by environmental regulations.
To achieve this principle, stakeholders would need to take the following general actions:
a. Governments
• Artisanal miners who intend to make the transition to larger scale and more mechanized methods of extraction, must only be allowed to do so if they also have demonstrated an adequate level of environmental performance
(such as, for example, through demonstrable rehabilitation effort). Or, as a minimum, they should demonstrate adequate capacity in their growth plans to manage environmental risks.
• Regulators should clarify, in legally binding terms, the definitions of artisanal and small-, medium-, and large-scale mining and ensure that the environmental requirements are clear, fair, and achievable for each technical level of mining activity.
• Delegate authority and responsibilities to lower levels of government or community leadership. Build capacity and leadership, if local government does not have the necessary capacity and leadership.
14. Consider the opportunities for positive synergy between ASM and LSM, and build cooperation and alliances to enable ASM to perform better on forest impact mitigation.
The case studies have shown that the combined presence of LSM and ASM in forested landscapes
Finally, the environmental regulation and management of ASM should be based on fundamentally the same principles as are applied to LSM rather than treat ASM and LSM differently—in essence, regulatory frameworks should recognize that all mining operations lie on a continuum from least to most mechanized. It is especially important to ensure that environmentally destructive
186 FOREST-SMART MINING
typically aggravates the forest impacts of ASM, with negative consequences for both LSM and ASM.
To achieve this principle, stakeholders would need to take the following general actions:
a. Governments
• Build cooperation and alliances between government, LSM, ASM, NGOs, and communities.
• Collaborate with local NGOs already working in the space of managing the environmental impacts of ASM.
b. Mining entities
• Where LSM occurs at the same landscape as ASM, LSM is better positioned than ASM to positively influence forest outcomes in the landscape, but it needs help in identifying and exploiting opportunities for synergy with ASM, such as implementing affordable rehabilitation or restoration techniques.
• LSM should take greater responsibility for the induced and indirect impacts associated with mining operations, including ASM and the cumulative socio-ecological impacts on the forest landscape. These duties do not necessarily mean fully assuming all responsibilities, but nevertheless supporting ASM to fulfill theirs.
c. International financial entities, including the World Bank
• Develop guidelines to replicate innovative successful solutions.
• Convene international and domestic NGOs dedicated to conservation and ASM issues in order to develop and implement multidisciplinary solutions.
15. Take advantage of existing frameworks for supply chain management and due diligence and use market influence to raise the business case for forest-smart mining.
There is a clear and urgent need to transition toward a fair and just resource-efficient and low-carbon economy. At the same time, however, the critical metals and responsible business conduct agenda commonly excludes or downgrades environmental risk management in the ASM sector. It is urgent to achieve a fair and just transition by being inclusive of ASM yet equally protective of forests.
To achieve this principle, stakeholders would need to take the following general actions:
a. Governments
• Free market organizations such as the European Commission should integrate forest-smart mining into the critical metals agenda, European Partnership for Responsible Minerals (EPRM), Public-Private Alliance for Responsible Minerals Trade (PPA), and so on.
b. Downstream companies
• Commit to undertake due diligence on environmental management by ASM including its impacts on forests.
• Adopt forest-smart mining principles into due diligence frameworks.
• Communicate the importance of forest protection to upstream partners and stakeholders.
c. International entities and NGOs
• Promote forest-smart principles in industry convenings to encourage adoption and implementation. This is especially important in mineral sectors of relevance to the transition to a green economy; it is counter-intuitive for the extraction of minerals required for a green economy to destroy forests.
• Identify and develop supportive guidance and tools that industry or regulators can append to their due diligence programs to ensure the environment, especially forests, is also protected.
187FOREST-SMART MINING
5.1. Specific recommendations for the World Bank
In addition to the recommendations listed above, it is recommended that the World Bank do the following:
i. Integrate recommendations of section 5 of this report into the World Bank’s country programming with particular reference to the mining and minerals sector.
ii. Build the case and involve other donors providing international development assistance to finance and promote the implementation of projects aligned with the above listed recommendations.
iii. Engage with client governments to identify (a) those that are supportive of forest-smart mining and willing to enter loans to support the implementation of the above listed recommendations, or (b) where the adoption of forest-smart mining is critical for climate or biodiversity reasons but where political will for sector loans is lacking, and seek opportunities for funding from other sources (for example, Global Climate Fund, Global Environmental Facility).
iv. Where IFC finance is available, priority should be given to loans to locally owned companies, with all projects subject to full ESIA demonstrating acceptable levels of environmental and social risk and effective mitigation options.
v. Continue to build and disseminate the evidence base for forest-smart mining to client governments through the appropriate programs.
vi. Promote these principles to sustainability standard or guidance-setting organizations for potential incorporation into the appropriate mining and minerals frameworks. Standard-setting organizations to approach should include but not be limited to the International Finance Corporation (IFC), OECD, European Union, China Chamber of Commerce of Metals Minerals & Chemicals Importers & Exporters (CCCMC), London Bullion Market Association (LBMA), Dubai Multi Commodities Centre (DMCC), London Metal Exchange (LME), Responsible Jewellery Council, Initiative for Responsible Mining Assurance (IRMA), International Council for Mining and Metals (ICMM) and its national mining associates’ membership, Fairtrade, Fairmined, and the Diamond Development Initiative (DDI).
Promote these principles to implementing and advocacy NGOs, civil society organizations, social enterprises, and consultancies operating in the ASM sector to encourage their inclusion in programming and business development.

188 FOREST-SMART MINING
Bolivia, San Ramon 5, by Manuel Salinas
189FOREST-SMART MINING
ACET (African Center for Economic Transformation). 2017. “The Impact of Expanding Artisanal and Small Scale Mining on Small Holder Agriculture in West Africa: A Case Study of Ghana.”
African Mining Vision. 2011. “Minerals and Africa’s Development: The International Study Group Report on Africa’s Mineral Regimes. Economic Commission for Africa and the African Union.”
Agrawal, S. 2015. “Final Report: UNEP Mercury Project: Yayasan Tambuhak Sinta. Palangka Raya, Indonesia.” https://wedocs.unep.org/bitstream/handle/20.500.11822/11717/Final_Report.pdf?sequence=1&isAllowed=y.
Agyemang, I. 2011. “Analysis of the Socio-Economic and Cultural Implications of Environmental Degradation in Northern Gha-Na Using Qualitative Approach.” African Journal of History and Culture 3: 113–22.
Alliance for Responsible Mining. 2014. “Fairmined Standard for Gold from Artisanal and Small-Scale Mining, Including Associated Precious Metals.” http://www.responsiblemines.org/images/sampledata/EstandarFairmined/FAIRMINED_V2.0-RC_EN.pdf.
Andrews, C., B. Bocoum, and D. Tshimena. 2008. “Democratic Republic of Congo: Growth with Governance in the Mining Sector.” World. http://scholar.google.com scholar?hl=en&btnG=Search&q =intitle:Democratic+Republic+of+Congo +Growth+with+Governance+in+the+Mining +Sector#6.
Angelsen, A., and T. Dokken. 2015. “Environmental Reliance, Climate Exposure, and Vulnerability: A Cross-Section Analysis of Structural and Stochastic Poverty.” Policy Research Working Paper 7474. World Bank, Washington, DC. https://openknowledge.worldbank.org/bitstream/handle/10986/23444/Environmental00d0stochastic0poverty.pdf?sequence=1&isAllowed=y%5Cnhttp://ep.fjernadgang.kb.dk/login?url=http://ovidsp.ovid.com/ovidweb.cgi?T=JS&CSC=Y&NEWS=N&PAGE =fulltext&D=caba6&AN=20163019.
Angelsen, A., P. Jagger, R. Babigumira, B. Belcher, N. J. Hogarth, S. Bauch, J. Börner, C. Smith-Hall, and S. Wunder. 2014. “Environmental Income and Rural Livelihoods: A Global-Comparative Analysis.” World Development 64 (S1): S12–28. doi:10.1016/j.worlddev.2014.03.006.
Apple. 2017. Environmental Responsibility Report. 2017 Progress Report, Covering FY2016. https://images.apple.com/environment/pdf/Apple_Environmental_Responsibility_Report_2017.pdf.
A Rocha Ghana. n.d. “Protecting Atewa Forest.” http://ghana.arocha.org/projects/protecting-atewa-forest/.
Arte. 2017. “Des mines illégales en Ukraine.” Arte. http://playtv.fr/programme-tv/1715685/arte-regards/#resume.
Artisanal Gold Council. 2018. “The Effect of Changing Gold Prices on Artisanal Mining.” http://www.artisanalgold.org/publications/articles/the-effect-of-changing-gold-prices-on-artisanal-mining/.
Asia Foundation. 2015. “Environment Programs in Mongolia.” Fact sheet. Asia Foundation, San Francisco.
———. 2016a. “Engaging Stakeholders in Environmental Conservation Project.” Fact sheet. Asia Foundation, San Francisco.
———. 2016b. “Frugal Rehabilitation Methodology (FRM): Field Handbook.” Asia Foundation, San Francisco. http://www.eisourcebook.org/cms/April%202016/Mongolial,%20Frugal%20Rehabilitation%20Methodology%20Field%20Handbook.pdf.
ASM-PACE. 2012. “Artisanal and Small-Scale Mining in Protected Areas and Critical Ecosystems Programme (ASM-PACE): A Global Solutions Study.” Cambridge, UK. http://www.profor.info/sites/profor.info/files/docs/ASM_PACE-GlobalSolutions.pdf.
ASM Inventory. 2017. Artisanal and Small-Scale Mining Knowledge Sharing Archive. http://artisanalmining.org/Inventory/.
6. REFERENCES
190 FOREST-SMART MINING
Associated Press. 2017. “The Mining Rushes Witnessed in Madagascar in Response to the Discovery of Rich Sapphire Deposits Is a Good Example of This.” Guardian, April 2. https://www.theguardian.com/world/2017/apr/02/sapphire-rush-threatens-rainforests-of-madagascar.
Australian. 2008. “Global Financial Crisis Hits Mining Companies.” December 16. http://www.theaustralian.com.au/business/latest/miners-slash-500-jobs-as-crisis-bites/news-story/f41b136ce0008aa6b94b8eca92bc7abf.
Azevedo, R., and E. Rodriguez. 2012. “Phytotoxicity of Mercury in Plants: A Review.” Journal of Botany. https://www.hindawi.com/journals/jb/2012/848614/.
Banchirigah, S. M., and G. Hilson. 2010. “De-Agrarianization, Re-Agrarianization and Local Economic Development: Re-Orientating Livelihoods in African Artisanal Mining Communities.” Policy Sciences 43 (2): 157–80. doi:10.1007/s11077-009-9091-5.
Barber, C. P., M. A. Cochrane, C. M. Souza Jr., and W. F. Laurance. 2014. “Roads, Deforestation, and the Mitigating Effect of Protected Areas in the Amazon.” Biological Conservation 177: 203–9.
BBC Monitoring Former Soviet Union. 2016. “Ukraine’s National Guard Says Amber Mining Halted in Northern District.”
BBC News. 2017. “DR Congo Profile.” http://www.bbc.co.uk/news/world-africa-13283212.
Belichenko, O. 2017. “Amber Mining: News from Ukraine.” Baltic Jewellery News, October 17. https://www.balticjewellerynews.com/single-post/2017/10/17/Amber-mining-News-from-Ukraine.
BGS. 2018. “World Mineral Production Publications of BGS - Minerals UK: Centre for Sustainable Mineral Development.” Accessed February 19. http://www.bgs.ac.uk/mineralsuk/statistics/home.html.
Buss, D., B. Rutherford, J. Hinton, J. Stewart, J. Lebert, G. E. Côté, A. Sebina-Zziwa, R. Kibombo, and F. Kisekka. 2017. “Gender and Artisanal and Small-Scale Mining in Central and East Africa: Barriers and Benefits.” GWP-2017-02 Research Contribution Paper, GrOW Working Paper Series, ISID.
Buxton, A. 2013. “Responding to the Challenge of Artisanal and Small-Scale Mining: How Can Knowledge Networks Help?” IIED, London.
Calys-Tagoe, B. N. L., L. Ovadje, E. Clarke, N. Basu, and T. Robins. 2015. “Injury Profiles Associated with Artisanal and Small-Scale Gold Mining in Tarkwa, Ghana.” Inter-National Journal of Environmental
Research and Public Health 12 (7): 7922–37. doi:https://doi.org/10.3390/ijerph120707922.
CCCMC (Chinese Chamber of Commerce of Metals, Minerals, and Chemicals Importers and Exporters). 2015. “Chinese Due Diligence Guidelines for Responsible Mineral Supply Chains.”
——. 2017. “Guidelines for Social Responsibility in Outbound Mining Investments.” http://www.cccmc.org.cn/docs/2017-08/20170804141709355235.pdf.
Central Bank van Suriname. 2014. “Leading Sectors of Suriname: The Impact of Mining, Agriculture and Tourism Activities on the Economy 1970–2012.” http://bearingpointcaribbean.com/wp-content/uploads/2015/01/Leading-Sectors-final-print-01-dec-2014.pdf.
Chairil, R. 2006. “Legal Framework for Small-Scale Mining in Indonesia.” Report to the United Nations Industrial Development Organization.
Chao, S. 2012. “Forest Peoples: Numbers across the World.” Forest Peoples Programme, Moreton-in-Marsh, U.K.
Chatham House. 2014. “Illegal Logging in the Democratic Republic of the Congo.” London. https://www.chathamhouse.org/publications/papers/view/198642.
Chazdon, R. L., P. H. S. Brancalion, L. Laestadius, A. Bennett-Curry, K. Buckingham, C. Kumar, J. Moll-Rocek, I. C. Guimarães Vieira, and S. J. Wilson. 2016. “When Is a Forest a Forest? Forest Concepts and Definitions in the Era of Forest and Landscape Restoration.” Ambio 45 (5): 538–50. doi:10.1007/s13280-016-0772-y.
CIA (Central Intelligence Agency). 2017. The World Factbook. https://www.cia.gov/library/publications/download/download-2017/index.html.
CIFOR (Center for International Forestry Research). 2015. “Mangroves: A Global Treasure under Threat.” https://forestsnews.cifor.org/31178/indonesian-mangroves-special-fact-file-a-global-treasure-under-threat?fnl=en.
———. 2016. “Strategy 2016–2025: Stepping up to the New Climate and Development Agenda.” Bogor, Indonesia.
Collen, B., R. Howard, J. Konie, O. Daniel, and J. Rist. 2011. “Field Surveys for the Endangered Pygmy Hippopotamus Choeropsis Liberiensis in Sapo National Park, Liberia.” Oryx 45 (1): 35–37.
Columbia Center on Sustainable Investment, United
191FOREST-SMART MINING
Nations Development Programme, UN Sustainable Development Solutions Network, and World Economic Forum. 2016. “Mapping Mining to the Sustainable Development Goals: An Atlas.” Geneva, Switzerland.
Congreso de Colombia. 1993. Ley 70 de 1993. Bogotá. https://www.mininterior.gov.co/sites/default/files/30_ley_70_1993.pdf.
Conservation International. n.d. “Conservation International.” https://www.conservation.org/.
Cook, R., and T. Healy. 2012. “Madagascar Case Study: Artisanal Mining Rushes in Protected Areas and a Response Toolkit.” WWF and Estelle Levin, Ltd., Nairobi and London. http://www.levinsources.com/assets/pages/ASM-PACE-Madagascar-Case-Study.pdf.
Cooke, A. 2017. “Forest-Smart Mining in Ghana: A Case Study to Inform the World Bank’s Forest Investment Program (FIP). Interim Report.” Levin Sources.
Corpocaldas. 2016. “Plan de acción institucional 2016–2019: Actualización del diagnóstico ambiental de Caldas.” http://www.corpocaldas.gov.co/publicaciones/1509/ActualizaciondelDiagnosticoAmbientaldeCaldas_Web.pdf.
Courrier de Madagascar. 2012. “Saphir et de rubis à Ambatondrazaka. L’alliance Voahary Gasy interpelle.”
Crawford, A., and M. Bliss. 2017. “IGF Mining Policy Framework Assessment: Suriname.” IGF, Winnipeg. http://www.iisd.org/sites/default/files/publications/suriname-mining-policy-framework-assessment-en.pdf?utm_source=newsletter-IGF&utm_medium=email&utm_campaign=suriname-mpf.
Dalvi, A. D., W. G. Bacon, and R. C. Osborne. 2004. “The Past and the Future of Nickel Laterites.” In PDAC 2004 International Convention, 1–27.
Das, T. P. 2004. Review of Road Ecology: Science and Solutions, by R. Forman, D. Sperling, J. Bissonette, A. Clevenger, C. Cutshall, V. Dale, L. Fahrig, et al. 2003. Environmental Progress 22 (3): 016. doi:10.1002/ep.670220307.
Defensoría del Pueblo Colombia. 2010. “La minería de hecho en Colombia.” Bogotá, Defensoría del Pueblo. https://proyectojusticia.files.wordpress.com/2017/08/guiza-suarez-mineria-de-hecho-en-colombia.pdf.
De Leon, R. B. 2009. “Road Development in Podocarpus National Park: An Assessment of Threats and
Opportunies.” Journal of Sustainable Forestry 28 (6–7): 735–54. doi:10.1080/10549810902936607.
Dirección Territorial de Salud de Caldas. 2011. “Departamento de Caldas indicadores ASIS 2011.” https://www.minsalud.gov.co/plandecenal/mapa/Analisis-de-Situacion-Salud-Caldas-2011.pdf.
Dondeyne, S., and E. Ndunguru. 2014. “Artisanal Gold Mining and Rural Development Policies in Mozambique: Per-Spectives for the Future.” Futures 62 (A): 120–27.
Dondeyne, S., E. Ndunguru, P. Rafael, and J. Bannerman. 2009. “Artisanal Mining in Central Mozambique: Policy and Environmental Issues of Concern.” Resources Policy 34 (1–2): 45–50.
Doso, S.J., G. Cieem, A. Ayensu-Ntim, B. Twumasi-Ankrah, and P. Twum Barimah. 2015. “Effects of Loss of Agricultural Land Due to Large-Scale Gold Mining on Agriculture in Ghana: The Case of the Western Region.” British Journal of Research 2 (6).
Drace, K., A. M. Kiefer, M. M. Veiga, M. K. Williams, B. Ascari, K. A. Knapper, K. M. Logan, et al. 2012. “Mercury-Free, Small-Scale Artisanal Gold Mining in Mozambique: Utilization of Magnets to Isolate Gold at Clean Tech Mine.” Journal of Cleaner Production 32: 88–95. http://www.montana.edu/msse/Framework_Toolkit/Resources/Gold_Mining.pdf.
D’Souza, K. 2003. “Scoping Study on the Artisanal Mining of Coltan in the Kahuzi Biega National Park.” http://www.ddiglobal.org/login/resources/scoping-study-on-the-artisanal-mining-of-coltan-in-the-kahuzi-biega-national-park.pdf.
EBRD (European Bank for Reconstruction and Development). 2017. “Ukraine Overview.”
Ecosystem Marketplace. 2017. “Unlocking Potential: State of the Voluntary Carbon Markets 2017.”
ECR. 2015. “Projet Managed Resources Protected Areas (MRPA) - Complexe Loky Manambato: Dossier de Business Plan.”
EITI (Extractive Industries Transparency Initiative). 2013. “EITI Madagascar Revenue Collection.” https://eiti.org/madagascar#revenue-collection.
EITI Indonesia. 2015. “Extractive Industries Transparency Initiative.” https://eiti.org/indonesia#production.
eLAW. 2010. Guidebook for Evaluating Mining Project EIAs. Eugene, Oregon: Environmental Law Alliance Worldwide. doi:10.1017/CBO9781107415324.004.
ENA (Environmental News Agency). 2017. “Threats and Pressures of Atewa Forest Reserve.” April 29.

192 FOREST-SMART MINING
Encyclopedia Britannica. 2017. “Bangka Belitung.” Accessed September 8. https://www.britannica.com/place/Bangka-Belitung.
ERM (Environmental Resources Management). 2013a. “Merian Project Final ESIA Executive Summary.”
——. 2013b. “Merian Project Final ESIA Report Volume I - Environmental and Social Impact Assessment.” Vol. I.
Estremadoiro, E. 2012. “El brillo del oro se apaga en San Ramón.” El Dia, June 17. https://www.eldia.com.bo/index.php?cat=1&pla=3&id_articulo=93325.
ETTF (European Timber Trade Federation). 2016. “Ukraine. Industry Profile.”
Fairmined. 2014. “Fairmined Standard for Gold from Artisanal and Small-Scale Mining, Including Associated Precious Metals.” Version 2.0/ARM (April). http://www.responsiblemines.org/wp-content/uploads/2017/05/Fairmined-Stnd-2-0_2014_.pdf.
——. 2017. “La Cascada LTD.” http://www.fairmined.org/community-profiles/cascada/.
Fairtrade International. 2013. “Fairtrade Standard for Gold and Associated Precious Metals for Artisanal and Small-Scale Mining.” www.fairtrade.net/standards.html.
FAO (Food and Agriculture Organization). 2010. “Annex 2: Examples of Vision or Goal Statements - Developing Effective Forest Policy,” 66–68. In Developing Effective Forest Policy: A Guide. FAO Forestry Paper 161. Rome: FAO.
———. 2011. The State of Forests in the Amazon Basin, Congo Basin and Southeast Asia. Rome: FAO.
———. 2014. State of the World’s Forests. Enhancing the Socioeconomic Benefits from Forests. Rome: FAO. http://www.fao.org/3/a-i3710e.pdf.
———. 2015a. “Forest Resources Assessment 2015: Terms and Definitions.” Forest Resources Assessment Working Paper 180. FAO, Rome. http://www.fao.org/docrep/017/ap862e/ap862e00.pdf.
———. 2015b. “Global Forest Resources Assessment 2015: How Are the World’s Forests Changing?” FAO, Rome.
———. 2015c. “Global Forest Resources Assessment 2015.” FAO, Rome. www.fao.org/forestry/fra.
———. 2016a. Global Forest Resources Assessment 2015: How Are the World’s Forests Changing? 2nd ed. Rome: FAO. http://www.fao.org/3/a-i4793e.pdf.
———. 2016b. State of the World’s Forests. Forests and Agriculture: Land-Use Challenges and Opportunities. Rome: FAO. doi:10.1146/annurev-environ-020411-130608.
FATF (Financial Action Task Force). 2012–2018. International Standards on combating Money Laundering and the Financing of Terrorism and Proliferation: The Recommendations. Paris: FATF.
Faure, M., O. Rakotomalala, and R. Pelon. 2015. “Economic Contributions from Industrial Mining in Madagascar.” World Bank, Centre for Social Responsibility in Mining (CSRM), University of Queensland.
Film UA Group. 2017. “WWF in Ukraine Now Partner of Mavka. The Forest Song Animated Film,” October 4. https://film.ua/en/news/1810.
Focus Economics. 2017. “Focus Economics,” December 18.
Forest Legality Initiative. 2016. “Risk Tool: Suriname.” http://www.forestlegality.org/risk-tool/country/suriname.
Foundation for Forest Management and Production Control. 2017. “Forest Reference Emission Level for Suriname’s REDD+ Programme.”
Franks, D. M. 2015. “Environment.” In Mountain Movers: Mining, Sustainability and the Agents of Change. Abingdon, Oxon: Routledge. doi:10.4324/9781315884400.
Gemval. 2017. “Historical Prices and the Gemval Aggregate Index.”
GFW (Global Forest Watch). 2016a. “Global Forest Watch: Madagascar.” http://www.globalforestwatch.org/country/MDG.
———. 2016b. “Global Forest Watch.” http://www.globalforestwatch.org.
———. 2017a. “Indonesia Forest Change.” http://www.globalforestwatch.org/country/IDN?category=forest-change.
———. 2017b. “Ukraine Country Profile.”
———. 2018. “Global Forest Watch: Bolivia.” http://www.globalforestwatch.org/country/BOL?category=land-cover.
Gibb, H., and K. G. O’Leary. 2014. “Mercury Exposure and Health Impacts among Individuals in the Artisanal and Small-Scale Gold Mining Community: A Comprehensive Review.” Environmental Health Perspectives 122 (7): 667–71. https://ehp.niehs.nih.gov/wp-content/uploads/122/7/ehp.1307864.pdf.

193FOREST-SMART MINING
Ginting, P., R. Budi, and K. Khalid. 2014. “Grim Portraits of Bangka Belitung Tin Mining.” Friends of the Earth Indonesia.
GI TOC (Global Initiative against Transnational Organized Crime). 2016. “Global Initiative Against Transnational Organized Crime.” http://globalinitiative.net.
GI TOC (Global Initiative against Transnational Organized Crime), and Estelle Levin Ltd. 2016a. “ASGM in Mongolia: Gold Supply Chains and Financial Flows.”
———. 2016b. “ASGM in the Philippines: Gold Supply Chains and Financial Flows.”
Global Witness. 2015. “Jade: Myanmar’s ‘Big State Secret.’”
Gnych, S., P. Wells, N. Franklin, S. Glenday, G. Limberg, G. Paoli, D. Daju, P. Resosudarmo, J. Schweithel, and I. Suryadi. 2014. “Land Use in Central Kalimantan.” https://theforestsdialogue.org/sites/default/files/cifor-tfd-landusecentralkalimantan_en.pdf.
Gobernación de Chocó. 2017. “Nuestro Departamento: Chocó.” http://www.choco.gov.co/informacion_general.shtml#economia.
Green, A., A. Jones, K. Sun, and R. L. Neitzel. 2015. “The Association between Noise, Cortisol and Heart Rate in a Small-Scale Gold Mining Community: A Pilot Study.” International Journal of Environmental Research and Public Health 12: 9952–66.
GSSB (Global Sustainability Standards Board). 2016. “GRI 304: Biodiversity 2016 304.” GRI Standards. Amsterdam. www.globalreporting.org.
Gyre, A. 2017. “Exploitations minières sauvages: Plus de mille hectares de forêt décimées.” Agir avec Madagascar (blog). January 30. agir.avec.madagascar.over-blog.com/2017/01/exploitations-minieres-sauvages-pluse-de-mille-hectares-de-foret-decimees.html.
Hansen, M. C., P. V. Potapov, R. Moore, M. Hancher, S. A. Turubanova, A. Tyukavina, D. Thau, et al. 2013. “High-Resolution Global Maps of 21st-Century Forest Cover Change.” Science 342 (November): 850–54. doi:10.1126/science.1244693.
Hilson, G. 2012. “Poverty Traps in Small-Scale Mining Communities: The Case of Sub-Saharan Africa.” Canadian Journal of Development Studies 33 (2).
Hilson, G., and S. M. Banchirigah. 2009. “Are Alternative Livelihood Projects Alleviating Poverty in Mining Communities? Experiences from Ghana.” Journal of Development Studies 45 (2): 172–196.
Hilson, G., and J. McQuilken. 2014. “Four Decades of
Support for Artisanal and Small-Scale Mining in Sub-Saharan Africa: A Critical Review.” Extractive Industries and Society 1 (1): 104–18. https://doi.org/10.1016/j.exis.2014.01.002.
Hilson, G., and C. Potter. 2005. “Structural Adjustment and Subsistence Industry: Artisanal Gold Mining in Ghana.” Development and Change 36 (1): 103–31. https://doi.org/10.1111/j.0012-155X.2005.00404.x.
Hinton, J., and E. Levin. 2010. “Property Rights and Artisanal Diamond Development (PRADD) Project: Comparative Study; Legal and Fiscal Regimes for Artisanal Diamond Mining.” Prepared by Tetra Tech ARD for the U.S. Agency for International Development. http://www.levinsources.com/assets/pages/report-usiad-legal-fiscal-regimes-artisanal-diamond-mining.pdf
Hirons, M. 2011. “Managing Artisanal and Small-Scale Mining in Forest Areas: Perspectives from a Poststructural Political Ecology.” Geographical Journal 177 (4): 347–56. doi:10.1111/j.1475-4959.2011.00405.x.
Hollestelle, M. 2012. “Gabon Case Study Report.” http://www.asm-pace.org/projects/gabon-case-study.html.
Hoogbergen, W., and D. Kruijt. 2004. “Gold, ‘Garimpeiros’ and Maroons: Brazilian Migrants and Ethnic Relationships in Post-War Suriname.” Caribbean Studies 32 (2): 3–44.
Hosonuma, N., M. Herold, V. De Sy, R. S. De Fries, M. Brockhaus, L. Verchot, A. Angelsen, and E. Romijn. 2012. “An Assessment of Deforestation and Forest Degradation Drivers in Developing Countries.” Environmental Research Letters 7 (4): 044009. doi:10.1088/1748-9326/7/4/044009.
Hruschka, F. 2015. “Comparative Analysis of ASM Strategies in Four Countries of Africa, Asia and Latin America (Ghana, Tanzania, Peru and Philippines).” Prepared for PROMINES.
Hund, K., J. Schure, and A. van der Goes. 2017. “Extractive Industries in Forest Landscapes: Options for Synergy with REDD+ and Development of Standards in the Democratic Republic of Congo.” Resources Policy 54 (April): 97–108. doi:10.1016/j.resourpol.2017.09.011.
IAMGOLD. 2017. “Rosebel Gold Mine, Suriname.” http://www.iamgold.com/English/operations/operating-mines/rosebel-gold-mines-suriname/default.aspx.
ICMM (International Council on Mining and Metals). 2016a. Role of Mining in National Economies. 3rd ed. London: ICMM.
———. 2016b. “Role of Mining in National Economies:
194 FOREST-SMART MINING
Mining Contribution Index.” In Role of Mining in National Economies, 16.
———. 2017. “ICMM 10 Principles.” https://www.icmm.com/en-gb/about-us/member-commitments/icmm-10-principles.
IFC (International Finance Corporation). 2012a. “Guidance Note 6: Biodiversity Conservation and Sustainable Management of Living.” IFC, Washington, DC.
———. 2012b. “IFC Performance Standards on Environmental and Social Sustainability.” https://www.ifc.org/wps/wcm/connect/c8f524004a73daeca09afdf998895a12/IFC_Performance_Standards.pdf?MOD=AJPERES.
IGF (Intergovernmental Forum on Mining, Minerals, Metals and Sustainable Development). 2017. “IGF Guidance for Governments: Managing Artisanal and Small-Scale Mining.” Authored by D. Paget, N. Garrett, and A. Crawford. IISD, Winnipeg. http://www.iisd.org/sites/default/files/publications/igf-guidance-for-governments-asm_0.pdf.
IIED (International Institute for Environment and Development). 2017. “Global Trends in Artisanal and Small Scale Mining (ASM): A Review of Key Numbers and Issues.” Report prepared for the Intergovernmental Forum on Mining, Minerals and Sustainable Development. IISD, Winnipeg.
ILO (International Labour Organization). 2017a. “FDI in Mining and Sustainable Development in Africa.” Accessed May 29. http://www.ilo.org/wcmsp5/groups/public/---ed_emp/---emp_ent/---multi/documents/publication/wcms_314429.pdf.
———. 2017b. “New ILO Project Aims to Reduce Work Accidents and Occupational Diseases in Ukrainian Mines.”
Interfax: Ukraine Business Daily. 2015. “Companies & Markets; Lawmakers Propose Legalizing Production and Sale of Amber.”
International Crisis Group. 2017. “Colombia’s Armed Groups Battle for the Spoils of Peace.” https://www.crisisgroup.org/latin-america-caribbean/andes/colombia/63-colombias-armed-groups-battle-spoils-peace.
IPIS (International Peace Information Service). 2017. “Interactive Map of Artisanal Mining Areas in Eastern DRC.” http://www.ipisresearch.be/mapping/webmapping/drcongo.
IRMA (Initiative for Responsible Mining Assurance). 2016. “IRMA Standard for Responsible Mining IRMA-STD-001, Draft v2.0.” http://www.
responsiblemining.net/images/uploads/IRMA_Standard_Draft_v2.0_with_MOV.pdf.
IUCN (International Union for Conservation of Nature), and CI (Conservation International) Ecuador. 2016. “Mapping of Relevant Policies and Regulations for Coastal Carbon Ecosystem Management in Five Countries: From Climate Change to Forestry and Coastal Marine Resource Management.” IUCN, CI Ecuador.
IWGIA (International Work Group for Indigenous Affairs). 2018. “Indigenous Peoples in Colombia.” https://www.iwgia.org/en/colombia.
Jones, B. 2017. “In Defining Plantations as Forest, FAO Attracts Criticism.” Mongabay.Com, March.
Jurismada. n.d. “Mining Law in Madagascar.” http://eng.jurismada.com/index.php/mining-law-in-madagascar/.
Kahkonen, S. 2017. “Ukraine Can Boost Annual Output by US$15 Billion with Land Reform.”
Kozak, M. 2017. “Ukrainian Amber Is a Problem, but It Could Be an Opportunity.”
Kyngdon-McKay, Y., P. Mitchell, G. Pearman, and E. Levin. 2014. “Best Practice Guidelines for the Exploitation of Mineral and Hydrocarbon Resources in the SADC Region.” Levin Sources.
Kyngdon-McKay, Y., R. Stocklin-Weinberg, F. Di Lorenzo, A. Barker, E. Levin-Nally, J. W. van Gelder, A. Iwundu, and E. Casajuana. 2016. “Scoping Study on Possible Activities of the European Partnership for Responsible Minerals (EPRM).” Levin Sources.
Larson, N. 2017. “Forest Rangers Tortured and Killed by Illegal Settlers in Liberia Rainforest.” https://www.theguardian.com/environment/2017/may/08/forest-rangers-tortured-and-killed-by-illegal-settlers-in-liberia-rainforest.
Laurance, W. F. 2015. “Bad Roads, Good Roads.” In Handbook of Road Ecology, edited by R. van der Ree, D. J. Smith, and C. Grilo. Wiley-Blackwell. doi:10.1002/9781118568170.ch2.
Laurance, W. F., M. Goosem, and S. G. W. Laurance. 2009. “Impacts of Roads and Linear Clearings on Tropical Forests.” Trends in Ecology and Evolution 24 (12): 659–69. doi:10.1016/j.tree.2009.06.009.
Lempriere, M. 2017. “Baltic Gold Rush: Illegal Amber Mining in Russia and Ukraine Is Destroying the Environment.” Verdict, March 28. https://www.verdict.co.uk/baltic-gold-rush-illegal-amber-mining-russia-ukraine-destroying-environment/.
Levin, E. 2014. “ASM in Protected Areas and Critical

195FOREST-SMART MINING
Ecosystems: Key Findings and Policy Directions.” Estelle Levin Ltd.
Lintern, M. J. 2007. “Vegetation Controls on the Formation of Gold Anomalies in Calcrete and Other Materials at the Barns Gold Prospect, Eyre Peninsula, South Australia.” Geochemistry: Exploration, Environment, Analysis 7: 249–66. http://citeseerx.ist.psu.edu/viewdoc/download?doi=10.1.1.1012.9475&rep =rep1&type=pdf.
Lopatin, E., J. Marttila, L. Sikanen, and T. Eklund. 2011. Atlas of the Forest Sector in Ukraine with the Focus on Wood Fuels. Vol. 9. Vantaa: Finnish Forest Tesearch Institute.
López, F., M. Torres, and R. Beltrán. 2003. “La minería en el Parque Nacional Podocarpus: Consideraciones legales y ambientales.” Fundación Arcoiris, Loja.
Luning, S. 2014. “The Future of Artisanal Miners from a Large-Scale Perspective: From Valued Pathfinders to Disposable Illegals?” Futures 62: 67–74.
MacArthur, R. H. 1972. Geographical Ecology: Patterns in the Distribution of Species. Princeton University Press.
Mahbub, K. R., K. Krishnan, M. Megharaj, and R. Naidu. 2016. “Mercury Inhibits Soilenzyme Activity in a Lower Concentration Than the Guideline Value.” Bulletin of Environmental Contamination and Toxicology 96: 76–82.
Malanchuk, Z., V. Korniyenko, Y. Malanchuk, and A. Khrystyuk. 2016. “Results of Experimental Studies of Amber Extraction by Hydromechanical Method in Ukraine.” Eastern-European Journal of Enterprise Technologies 3 (10(81)): 24. doi:10.15587/1729-4061.2016.72404.
Marson, J. 2016. “Lure of Amber Pits Ukraine’s Illegal Miners Against State.” Wall Street Journal. https://www.wsj.com/articles/lure-of-amber-pits-ukraines-illegal-miners-against-state-1464998300.
Martin, G., L. Rentsch, M. Hock, and M. Bertau. 2017. “Lithium Marker Research: Global Supply, Future Demand and Price Development.” Energy Storage Materials 6: 171–79. doi:https://doi.org/10.1016/j.ensm.2016.11.004.
Megevand, C., A. Mosnier, J. Hourticq, K. Sanders, N. Doetinchem, and C. Streck. 2013. Deforestation Trends in the Congo Basin Reconciling Economic Growth and Forest Protection Environment and Sustainable Development. Washington, DC: World Bank. https://openknowledge.worldbank.org/bitstream/handle/10986/12477/9780821397428.pdf?sequence=1&isAllowed=y.
Melo, C., C. F. Mena, M. Arsel, and L. Pellegrini. 2013. “The Estate Is Dead, Long Live the State: Re-inserting the State in the Gold-Mining Industry in Zamora-Chinchipe, Ecuador.” CoCooN NEBE working paper. doi: 10.13140/RG.2.1.3891.7603.
MinAmbiente, and IDEAM. 2017. “Estrategia integral de control a la deforestacion: Actualizacion de cifras de monitoreo de bosques 2016.” Ministerio de Ambiente y Desarrollo (Colombia) and IDEAM, Bogotá. http://www.ideam.gov.co/documents/24277/0/Presentaci%97n+Estrategia+Integral+de+Control+a+la+Deforestaci%97n/173f79bf-3e68-4cbc-9387-80123d09b5e2.
Miningfacts.org. 2012. “How Many Jobs Depend on the Mining Industry?” Fraser Institute. http://www.miningfacts.org/Economy/How-many-jobs-depend-on-the-mining-industry/.
Ministère de l’Environnement, des Eaux et Forêts – Madagascar. 2004. Décret MECIE. Antananarivo.
Ministère de l’Environnement et des Forêts – Madagascar, and Fanamby. 2013. “Nouvelle aire protégée Loky Manambato. Paysage harmonieux protégé: Plan d’amènagement et de gestion 2014–2018.” Antananarivo.
Ministerio de Minas y Energia – Colombia. 2012. “Censo Minero Departamental 2010–2011.” Bogotá. https://www.minminas.gov.co/documents/10180/698204/CensoMinero.pdf/093cec57-05e8-416b-8e0c-5e4f7c1d6820.
Ministerio del Ambiente – Ecuador. 2010. “Línea base ambiental del sector de Nambija.” Quito.
Ministry of Natural Resources – Suriname. 2006. “National Forest Policy of Suriname.” Prepared in collaboration with the Foundation for Forest Management and Production Control (SBB). Paramaribo.
MNP (Madagascar National Parks). 2017. “Rapport de Mission Brigade Mixte Speciale Reserve Speciale Ankarana.”
Mongabay. 2006. “Democratic Republic of Congo: Environmental Profile.” https://rainforests.mongabay.com/20zaire.htm.
Moore Stephens LLP, and Parker & Associates Inc. 2016. “Liberia Extractive Industries Transparency Initiative (LEITI).” London.
Muliavka, I. 2017. “Ukraine Mafia Score Big with Illegal Amber Mines.” The Observers, February 21. http://observers.france24.com/en/20170221-ukraine-far-west-amber-mining-making-mafia-rich.
Municipio del Medio Atrato. 2016. “Esquema

196 FOREST-SMART MINING
de ordenamiento territorial documento diagnostico 2005–2016.” Departamento de Chocó, Colombia. http://cdim.esap.edu.co/BancoMedios/Documentos PDF/medioatratochocoeot2005-2016.pdf.
Nagajyoti, P., K. Lee, and T. Sreekanth. 2010. “Heavy Metals, Occurrence and Toxicity Forplants: A Review.” Environmental Chemical Letters 8: 199–216.
Nainggolan, H. 2015. “Illegal Gold Mining Operations in Kalimantan Threaten Lives and the Environment.” Indonesia Expat (blog). http://indonesiaexpat.biz/business-property/illegal-gold-mining-operations-in-kalimantan-threaten-lives-and-the-environment/.
Nassar, N. T. 2018. “Quantifying and Characterizing In-Use Stocks of Non-Fuel Mineral Commodities.” Presentation at the COST “Symposium on the Availability of Raw Materials from Secondary Sources: A Key Aspect of Circular Economy,” Geneva, April 24.
Navarrete, T. 2017. “Colombia: La lucha de un consejo comunitario contra la minería ilegal en el Chocó.” Mongabay Latam, June 21. https://es.mongabay.com/2017/06/colombia-la-lucha-consejo-comunitario-la-mineria-ilegal-choco/.
Neudert, R., J. U. Ganzhorn, and F. Wätzold. 2017. “Global Benefits and Local Costs: The Dilemma of Tropical Forest Conservation; A Review of the Situation in Madagascar.” Environmental Conservation 44 (1): 82–96. doi:10.1017/S0376892916000552.
Newmont. 2017. “Operation Facts.” http://www.newmont.com/operations-and-projects/south-america/merian-suriname/operation-facts/default.aspx.
NIMOS. n.d. “National Institute for Environment and Development in Suriname.”
Noack, F., S. Wunder, A. Angelsen, and J. Börner. 2015. “Responses to Weather and Climate: A Cross-Section Analysis of Rural Incomes.” Policy Research Working Paper 7478, World Bank, Washington, DC.
NRGI (Natural Resource Governance Institute). 2014. “Natural Resource Charter.” 2nd ed. https://resourcegovernance.org/sites/default/files/documents/nrcj1193_natural_resource_charter_19.6.14.pdf.
———. 2015. “NRGI Primers.” https://resourcegovernance.org/sites/default/files/documents/nrgi_readers_compilation.pdf.
———. 2017. “Resource Governance Index 2017: ‘Home Work’ for Ukraine.” http://ua-energy.org/ckeditor_
assets/attachments/75/analitics_engl.pdf.
Obiri, S., P. A. D. Mattah, M. M. Mattah, F. A. Armah, S. Osae, S. Adu-kumi, and P. O. Yeboah. 2018. “Assessing the Environmental and Socio-Economic Impacts of Artisanal Gold Mining on the Livelihoods of Communities in the Tarkwa Nsuaem Municipality in Ghana.” International Journal of Environmental Research and Public Health 13 (2): 160. doi:https://doi.org/10.3390/ijerph13020160.
OECD (Organisation for Economic Co-operation and Development). 2016. “OECD Due Diligence Guidance for Responsible Supply Chains of Minerals from Conflict-Affected and High-Risk Areas.” OECD, Paris.
Office National pour l’Environnement, Direction Générale des Forêts / Ministère de l’Environnement et des Forêts, Conservation International – Madagascar, Foiben-Taosarintanin’i Madagasikara, and Madagascar National Parks. 2013. “Evolution de la couverture de forêts naturelles à Madagascar 2005–2010.” Antananarivo.
Olson, M. 1967. The Logic of Collective Action: Public Goods and the Theory of Groups. Cambridge: Harvard University Press.
Osei-Owusu, Y. 2016. “Justification to Upgrade Atewa Range Forest Reserve to a National Park.” A Rocha Ghana and Forestry Commission, Ghana.
Pagina Siete. 2016. “Áreas mineras en Madidi y Pilón Lajas ocupan 23.475 hectáreas,” December 13. http://www.paginasiete.bo/economia/2016/12/13/areas-mineras-madidi-pilon-lajas-ocupan-23475-hectareas-120199.html.
Pardo, M., and S. Valenzuela. 2007. “Resultados del análisis de efectividad del manejo de areas protegidas con participación social del Sistema de Parques Nacionales Naturales de Colombia – AEMAPPS: Sus implicaciones en el manejo y recomendaciones.” PowerPoint presentation.
Perkins, R. 2017. “Old and New Sapphire Rushes in the Bemainty Mining Area, Madagascar.” https://roseyperkins.com/wp-content/uploads/2017/06/Old-and-New-Sapphire-Rushes-in-Bemainty-Area-Madagascar2017.pdf.
Peterson, G. D., and M. Heemskerk. 2001. “Deforestation and Forest Regeneration Following Small-Scale Gold Mining in the Amazon: The Case of Suriname.” Environmental Conservation 28 (02): 117–26. doi:10.1017/S0376892901000121.
Peyton, N. 2018. “Liberia Set to Secure Ancestral Land Rights with Long-Awaited Law.” Reuters, August
197FOREST-SMART MINING
27. https://www.reuters.com/article/us-liberia-landrights-lawmaking/liberia-set-to-secure-ancestral-land-rights-with-long-awaited-law-idUSKCN1LC1PA.
Piechal, Tomasz. 2017. “The Amber Rush in Ukraine.” Centre for Eastern Studies, no. 241: 1–6.
Potapov, P., A. Yaroshenko, S. Turubanova, M. Dubinin, L. Laestadius, C. Thies, D. Aksenov, et al. 2008. “Mapping the World’s Intact Forest Landscapes by Remote Sensing.” Ecology and Society 13 (2). doi:10.5751/ES-02670-130251.
PRAS (Programa de Reparacion Ambiental y Social). 2015. “Diagnóstico socioambiental de la zona minera Nambija.” Ministerio del Ambiente, Quito, Ecuador.
PRI (Principles for Responsible Investment). n.d. “What Is Responsible Investment?” About the PRI, Principles for Responsible Investment. https://www.unpri.org/pri/what-is-responsible-investment.
PROFOR. 2016. “Get Forest Smart. 2016 Annual Report.” World Bank, Washington, DC. http://www.profor.info/sites/profor.info/files/PROFOR_AR2016_CRA_webFinal.pdf.
Protected Planet. 2017. “Protected Planet Database.”
Radley, B. 2018. “The DRC Is Revisiting Its Mining Code. Why Reform Is Long Overdue.” The Conversation. http://theconversation.com/the-drc-is-revisiting-its-mining-code-why-reform-is-long-overdue-79937.
Rainer, H. 2013. “The Political Ecology and Economy of Protected Areas and Violence: A Case Study of the Conflict of the Kivus in the Democratic Republic of Congo.” London School of Economics and Political Sciences.
Randria Arson, H. P. 2017. “Analyse de la corruption dans le secteur minier artisanal à Madagascar: Filière or et saphir.” Transparency International – Initiative Madagascar, Antananarivo, Madagascar.
República de Colombia. 2016. Decreto Numero 1666 de 21 Octubre 2016. https://www.minminas.gov.co/documents/10180/23517/37238-Decreto-1666-21Oct2016.pdf/17f4f90c-4481-47cd-a084-c7fa0319f9cf.
Resolve. 2017a. “Analyse du cadre réglementaire (texte de lois et politiques) et des capacités des organisations/institutions afin d’instaurer les objectifs de tero perte nette (ou de gain net) de biodiversité à Madagascar.” Washinton, DC.
Resolve. 2017b. “Free , Prior and Informed Consent (FPIC) within a Human Rights Framework: Lessons from
a Suriname Case Study.” Washington, DC.
RJC (Responsible Jewellery Council). 2013. “Responsible Jewellery Council: Code of Practices.” www.responsiblejewellery.com.
RMF. 2017. “Responsible Mining Index. Draft Methodology. For Public Comment.”
Robbins, P., K. McSweeney, T. Waite, and J. Rice. 2006. “Even Conservation Rules Are Made to Be Broken: Implications for Biodiversity.” Environmental Management 37 (2): 163.
Roser, M. and H. Ritchie. 2018. “Land Cover.” Our World in Data. https://ourworldindata.org/land-cover.
Sandheinrich, M. B, and J. G Wiener. 2011. “Methylmercury in Freshwater Fish. Recent Advances in Assessing Toxicity of Environmentally Relevant Exposures.” In Environmental Contaminants in Biota: Interpreting Tissue Concentrations, edited by W. N. Beyer and J. P Meador. Boca Raton, FL: CRC Press/ Taylor and Francis.
Sandoval, F. 2001. “Small-Scale Mining in Ecuador.” International Institute for Environment and Development, World Business Council for Sustainable Development, London. http://pubs.iied.org/pdfs/G00720.pdf.
Schueler, V., T. Kuemmerle, and H. Schröder. 2011. “Impacts of Surface Gold Mining on Land Use Systems in Western Ghana.” Ambio 40 (5): 528–39. doi:10.1007/s13280-011-0141-9.
SDC (Swiss Agency for Development and Cooperation). 2011. “SDC Experiences with Formalization and Responsible Environmental Practices in Artisanal and Small-Scale Gold Mining in Latin America and Asia (Mongolia).” Bern, Switzerland.
———. 2017. “Revised Regulation Improves Conducive Environment for Artisanal and Small-Scale Miners.” Sustainable Artisanal Mining Project Website.
———. 2018. Sustainable Artisanal Mining Project Website.
Seccatore, J., and M. de Theije. 2017. “Socio-Technical Study of Small-Scale Gold Mining in Suriname.” Journal of Cleaner Production 144: 107–19. doi:10.1016/j.jclepro.2016.12.119.
Secretariat of the Convention on Biological Diversity. 2001. “The Value of Forest Ecosystems.” CBD Technical Series 4. Montreal. http://www.cbd.int/doc/publications/cbd-ts-04.pdf.
Rainer, H. 2013. “The Political Ecology and Economy of Protected Areas and Violence: A Case Study of the
198 FOREST-SMART MINING
Conflict of the Kivus in the Democratic Republic of Congo.” London School of Economics and Political Sciences.
Randria Arson, H. P. 2017. “Analyse de la corruption dans le secteur minier artisanal à Madagascar: Filière or et saphir.” Transparency International – Initiative Madagascar, Antananarivo, Madagascar.
República de Colombia. 2016. Decreto Numero 1666 de 21 Octubre 2016. https://www.minminas.gov.co/documents/10180/23517/37238-Decreto-1666-21Oct2016.pdf/17f4f90c-4481-47cd-a084-c7fa0319f9cf.
Resolve. 2017a. “Analyse du cadre réglementaire (texte de lois et politiques) et des capacités des organisations/institutions afin d’instaurer les objectifs de tero perte nette (ou de gain net) de biodiversité à Madagascar.” Washinton, DC.
Resolve. 2017b. “Free , Prior and Informed Consent (FPIC) within a Human Rights Framework: Lessons from a Suriname Case Study.” Washington, DC.
RJC (Responsible Jewellery Council). 2013. “Responsible Jewellery Council: Code of Practices.” www.responsiblejewellery.com.
RMF. 2017. “Responsible Mining Index. Draft Methodology. For Public Comment.”
Robbins, P., K. McSweeney, T. Waite, and J. Rice. 2006. “Even Conservation Rules Are Made to Be Broken: Implications for Biodiversity.” Environmental Management 37 (2): 163.
Roser, M. and H. Ritchie. 2018. “Land Cover.” Our World in Data. https://ourworldindata.org/land-cover.
Sandheinrich, M. B, and J. G Wiener. 2011. “Methylmercury in Freshwater Fish. Recent Advances in Assessing Toxicity of Environmentally Relevant Exposures.” In Environmental Contaminants in Biota: Interpreting Tissue Concentrations, edited by W. N. Beyer and J. P Meador. Boca Raton, FL: CRC Press/ Taylor and Francis.
Sandoval, F. 2001. “Small-Scale Mining in Ecuador.” International Institute for Environment and Development, World Business Council for Sustainable Development, London. http://pubs.iied.org/pdfs/G00720.pdf.
Schueler, V., T. Kuemmerle, and H. Schröder. 2011. “Impacts of Surface Gold Mining on Land Use Systems in Western Ghana.” Ambio 40 (5): 528–39. doi:10.1007/s13280-011-0141-9.
SDC (Swiss Agency for Development and Cooperation). 2011. “SDC Experiences with Formalization and
Responsible Environmental Practices in Artisanal and Small-Scale Gold Mining in Latin America and Asia (Mongolia).” Bern, Switzerland.
———. 2017. “Revised Regulation Improves Conducive Environment for Artisanal and Small-Scale Miners.” Sustainable Artisanal Mining Project Website.
———. 2018. Sustainable Artisanal Mining Project Website.
Seccatore, J., and M. de Theije. 2017. “Socio-Technical Study of Small-Scale Gold Mining in Suriname.” Journal of Cleaner Production 144: 107–19. doi:10.1016/j.jclepro.2016.12.119.
Secretariat of the Convention on Biological Diversity. 2001. “The Value of Forest Ecosystems.” CBD Technical Series 4. Montreal. http://www.cbd.int/doc/publications/cbd-ts-04.pdf.
Senkpeni, A. D. 2018. “Appointment at LEITI Draws More Ire - Partners Threaten to Pull Out.” Front Page Africa, March 28. https://www.frontpageafricaonline.com/index.php/news/7363-appointment-at-leiti-draws-more-ire-partners-threaten-pullout.
SES (Swedish Environmental Systems). 1999. “Monitoreo ambiental de las areas mineras en el sur del Ecuador 1996-1998.” UCP Prodeminca, Quito. https://www.scribd.com/document/355537767/MonitoreoAmbiental-Prodeminca-pdf.
Serra-Horhuelin, A., and D. A. Schoeller-Díaz. 2014. “Chocó: Entre la extracción y el olvido.” https://pacificocolombia.org/wp-content/uploads/2016/05/0999215001426194614.pdf.
Sinovas, P., B. Price, E. King, A. Hinsley, and A. Pavitt. 2017. “Wildlife Trade in the Amazon Countries: An Analysis of Trade in CITES Listed Species.” Technical report prepared for the Amazon Regional Program (BMZ/DGIS/GIZ). UN Environment–World Conservation Monitoring Centre, Cambridge, UK.
Small, R., and C. Villegas. 2012. “Artisanal and Small-Scale Mining in and Around Protected Areas and Critical Ecosystems Project: Liberia Case Study Report.” Final report. Estelle Levin Ltd. and WWF.
Smith, O. 2017. “Mapped: The Countries with the Most Trees.” Telegraph, March 21. www.telegraph.co.uk/travel/maps-and-graphics/countries-with-the-most-forest-and-trees/.
Sonter, L. J., D. Herrera, D. J. Barrett, G. L. Galford, C. J. Moran, and B. S. Soares-Filho. 2017. “Mining Drives Extensive Deforestation in the Brazilian Amazon.” Nature Communications 8 (1): 1013. doi:10.1038/s41467-017-00557-w.
199FOREST-SMART MINING
Spiegel, S. 2011. “Governance Institutions, Resource Rights Regimes and the Informal Mining Sector: Regulatory Complexities in Indonesia.” World Development 40 (1): 189–205.
Spira, C., A. Kirkby, D. Kujirakwinja, and A. Plumptre. 2017. “The Socio-Economics of Artisanal Mining and Bushmeat Hunting around Protected Areas: Kahuzi–Biega National Park and Itombwe Nature Reserve, Eastern Democratic Republic of Congo.” Oryx, 1–9.
Spira, C., G. Mitamba, A. Kirkby, T. Kalikunguba, R. Nishuli, and A. Plumptre. 2016. “Grauer’s Gorilla Numbers Increasing in Kahuzi-Beiga National Park Highlands: 2015 Census in Tshivanga Sector.” Wildlife Conservation Society, Bronx, New York.
Staatsolie. 2018. “Geological Framework: Geology of Onshore Suriname.” http://opportunities.staatsolie.com/geology-of-the-guyana-suriname-basin/geological-framework/.
Stapper, D. 2011. “Artisanal Gold Mining, Mercury and Sediment in Central Kalimantan, Indonesia.” University of Victoria.
Stewart, P. 2015. “‘People Are Walking with a Noose around Their Necks’: Inside Ukraine’s Huge Shadow Economy.” VICE, December 22.
Stocklin-Weinberg, R., M. M. Veiga, C. M. Villegas, R. Sulaiman, and P. Mitchaux. 2017. “Occupational Health and Safety Situational Analysis and Training Needs Assessment for Unconventional (Artisanal) Miners in Bangka Belitung, Indonesia.” Pact, Washington, DC. https://www.idhsustainabletrade.com/uploaded/2017/06/Pact-IDH-TWG-Indonesia-OHS-project-FINALWEBSITE.pdf.
Stocklin-Weinberg, R., A. Haris, and P. Mitchell. 2013. “Situational Analysis and Sustainability Assessment of Tin Production in Bangka-Belitung, Indonesia: Assessing the Potential for Improved Sustainability and Downstream Intervention.”
Stoddard, E. 2017. “Madagascar’s President Says No Plans to Change Mining Code.” Reuters, June 14. https://af.reuters.com/article/topNews/idAFKBN1951NJ-OZATP.
Sulaiman, R. 2007. “Indonesia Country Report.” Global Mercury Project, Vienna.
Swenson, J. J., C. E. Carter, J. C. Domec, and C. I. Delgado. 2011. “Gold Mining in the Peruvian Amazon: Global Prices, Deforestation, and Mercury Imports.” PLoS ONE 6 (4). doi:10.1371/journal.pone.0018875.
Telmer, K., and D. Stapper. 2007. “Evaluating and Monitoring Small Scale Gold Mining and Mercury
Use: Building a Knowledge-Base with Satellite Imagery and Field Work. United Nations Industrial Development Organisation Project EG/GLO/01/G34. Final Report.”
The REDD Desk. 2017. “The REDD Desk” (website). http://theredddesk.org.
———. 2018. “Permian REDD+ Project in Ghana.”
Triebert, C. 2017. “Ghana’s Atewa Forest: Monitoring MIning Which May Threaten Water Sources.” Bellingcat.Com.
Tschakert, P. 2009. “Recognizing and Nurturing Artisanal Mining as a Viable Livelihood.” Resources Policy 34 (1–2): 24–31. doi:10.1016/j.resourpol.2008.05.007.
Turner, S. D. 2012. “World Heritage Sites and the Extractives Industry.”
Tychsen, J., D. Boamah, J. Ahadjie, A. Sandow, S. Alidu, P. Awuah, I. Quaicoe, et al. 2017. “ASM Sector of Liberia.” Edited by Geological Survey of Denmark and Greenland (GEUS). Artisanal and Small Scale Mining Handbook for Ghana. Copenhagen, Denmark.
UMAT. 2017. “Determining the Impact of Small-Scale Mining on Cocoa Production Using GIS and Remote Sensing: A Case Study (Draft).”
UNDP (United Nations Development Programme). n.d. “Human Development Reports Ukraine.”
———. 2014. “New York Declaration on Forests.” http://www.undp.org/content/dam/undp/library/Environment and Energy/Forests/New York Declaration on Forests_DAA.pdf.
———. 2018. “ACP-EU Development Minerals Programme.” http://developmentminerals.org/index.php/en/.
UNEP (United Nations Environment Programme). 2018. “Reducing Mercury in Artisanal and Small-Scale Gold Mining (ASGM).” http://web.unep.org/globalmercurypartnership/our-work/reducing-mercury-artisanal-and-small-scale-gold-mining-asgm.
UNEP-WCMC. 2018. “Protected Area Profile for Suriname from the World Database of Protected Areas.” https://www.protectedplanet.net/country/SR.
UNITAR. 2016. “UNITAR’s Operational Satellite Applications Programme: Satellite Mapping of Artisanal and Small-Scale Mining in Central Kalimantan, Indonesia.” AGSM Project Indonesia (UNEP and UNITAR). http://wedocs.unep.org/handle/20.500.11822/11526.
200 FOREST-SMART MINING
United Nations. 2014. “Forests. New York Declaration on Forests. Action Statements and Action Plans.” New York.
USAID. 2016. “Political Economy Analysis for Biodiversity Conservation Planning in the Context of Extractive Industries.” http://pdf.usaid.gov/pdf_docs/PA00MBT2.pdf.
USDA (US Department of Agriculture). n.d. “Forest Health Monitoring.” USDA. https://www.fs.fed.us/foresthealth/protecting-forest/forest-health-monitoring/.
US Department of State. 2018. “The Democratic Republic of the Congo.” http://www.state.gov/e/eb/rls/othr/ics/2011/157260.htm.
USGS (US Geological Survey). 2015. “The Mineral Industry of Madagascar.” Minerals Yearbook –2014. Reston, VA: USGS.
———. 2016. “The Mineral Industry of Bolivia.” Minerals Yearbook –2013. Reston, VA: USGS.
———. 2017. “The Mineral Industry of Ukraine.” Minerals Yearbook –2014. Reston, VA: USGS.
Vaneeckhaute, L. E., T. Vanwing, P. Meurs, B. Abelshausen, and W. Jacquet. 2017. “Community Capitals of a Paramaca Maroon Village in Pictures: A Photovoice Study on Community Resilience in the Context of Large-Scale Gold Mining.” Community Development Journal November: 1–21. doi:10.1093/cdj/bsx036.
Veiga, M. M., P. A. Maxson, and L. D. Hylander. 2006. “Origin and Consumption of Mercury in Small-Scale Gold Mining.” Journal of Cleaner Production 14: 436–447.
Verbrugge, B. 2015. “The Economic Logic of Persistent Informality: Artisanal and Small Scale Mining in the Southern Philippines.” Development and Change 46 (5): 1023–46.
Vidal, O., C. Rostom, C. François, and G. Giraud. 2017. “Global Trends in Metal Consumption and Supply: The Raw Material–Energy Nexus.” Elements 13 (5): 319–24. https://doi.org/10.2138/gselements.13.5.319.
Villavicencio Onofa, J. J. 2016. “Análisis jurídico de la actividad minera ilegal en la legislación ecuatoriana.” Universidad Central del Ecuador. http://www.dspace.uce.edu.ec/bitstream/25000/6262/1/T-UCE-0013-Ab-170.pdf.
Villegas, C., A. B. Turay, and D. Sarmu. 2013. “Can Artisanal Mining and Conservation Co-Exist? A Case Study of Artisanal Gold and Diamond Mining in and Adjacent to Sierra Leone’s Gola Rainforest National
Park and Recommendations on the Way Forward.” http://www.asm-pace.org/projects/sierra-leone-case-study.html.
Wacaster, S. 2014. “The Mineral Industry of Indonesia. United States Geological Survey.” https://minerals.usgs.gov/minerals/pubs/country/2014/myb3-2014-id.pdf.
Walmsley, B., and S. Patel. 2006. “Democratic Republic of Congo.” In SADC Environmental Legislation Handbook 2012, 3rd ed., 93–181. Pretoria: Development Bank of Southern Africa in collaboration with the Southern African Institute for Environmental Assessment.
WCS, ONE, MNP, and Etc Terra. 2015. “Changement de la couverture de forêts naturelles à Madagascar, 2005‐2010‐2013.” http://www.pnae.mg/index.php?option=com_content&view=article&id=186:changement-de-la-couverture-des-forets-naturelles-2005-2010-2013&catid=81:autres&Itemid=83.
Weinberg, R., A. Chishugi, E. Levin, and G. Beynon. 2013. “Exploitation miniere artisanale dans la Reserve Naturelle d’Itombwe, Republique Democratique du Congo.” http://www.asm-pace.org/projects/asm-itombwe-nature-reserve-drc.html.
Wendle, J. 2017. “The Dramatic Impact of Illegal Amber Mining in Ukraine’s Wild West.” National Geographic, 1–21.
Wiener, J. G, and D. J Spry. 1996. “Toxicological Significance of Mercury in Freshwater Fish.” In Environmental Contaminants in Wildlife: Interpreting Tissue Concentrations, edited by W. N. Beyer, G. H. Heinz, and A. W. Redmon-Norwood. Boca Raton, FL: Lewis.
Wilson, S. T. K., H. Wang, M. Kabenge, and X. Qi. 2017. “The Mining Sector of Liberia: Current Practices and Environmental Challenges.” Environmental Science and Pollution Research 24 (23): 18711–20. doi:10.1007/s11356-017-9647-4.
World Bank. 2012. “Artisanal Mining in Critical Ecosystems : A Look at Gabon, Liberia, and Madagascar.” Washington, DC.
———. 2013. “Madagascar Country Environmental Analysis (CEA): Taking Stock and Moving Forward.”
———. 2016. World Bank Group Forest Action Plan FY16–20. Washington, DC: World Bank.
———. 2017a. The Little Green Data Book 2017. Washington, DC: World Bank. doi:10.1596/978-1-4648-1034-3.
———. 2017b. “The World Bank in Ukraine.” http://www.
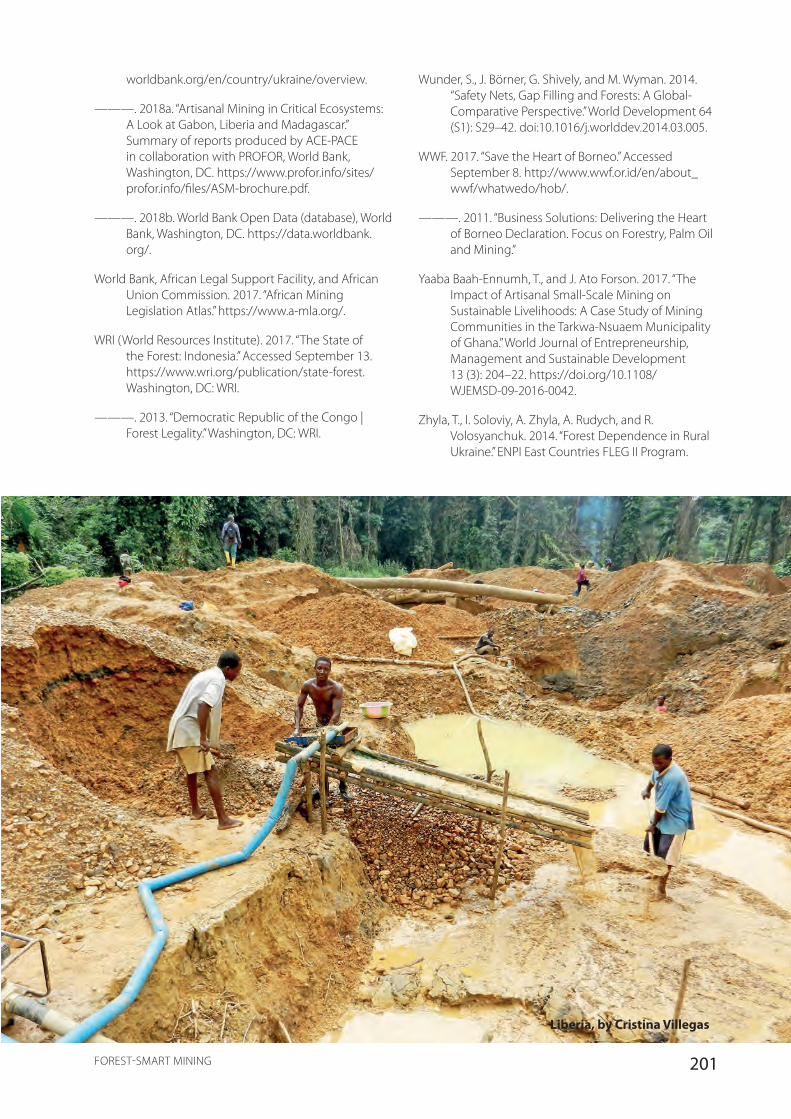
201FOREST-SMART MINING
worldbank.org/en/country/ukraine/overview.
———. 2018a. “Artisanal Mining in Critical Ecosystems: A Look at Gabon, Liberia and Madagascar.” Summary of reports produced by ACE-PACE in collaboration with PROFOR, World Bank, Washington, DC. https://www.profor.info/sites/profor.info/files/ASM-brochure.pdf.
———. 2018b. World Bank Open Data (database), World Bank, Washington, DC. https://data.worldbank.org/.
World Bank, African Legal Support Facility, and African Union Commission. 2017. “African Mining Legislation Atlas.” https://www.a-mla.org/.
WRI (World Resources Institute). 2017. “The State of the Forest: Indonesia.” Accessed September 13. https://www.wri.org/publication/state-forest. Washington, DC: WRI.
———. 2013. “Democratic Republic of the Congo | Forest Legality.” Washington, DC: WRI.
Liberia, by Cristina Villegas
Wunder, S., J. Börner, G. Shively, and M. Wyman. 2014. “Safety Nets, Gap Filling and Forests: A Global-Comparative Perspective.” World Development 64 (S1): S29–42. doi:10.1016/j.worlddev.2014.03.005.
WWF. 2017. “Save the Heart of Borneo.” Accessed September 8. http://www.wwf.or.id/en/about_wwf/whatwedo/hob/.
———. 2011. “Business Solutions: Delivering the Heart of Borneo Declaration. Focus on Forestry, Palm Oil and Mining.”
Yaaba Baah-Ennumh, T., and J. Ato Forson. 2017. “The Impact of Artisanal Small-Scale Mining on Sustainable Livelihoods: A Case Study of Mining Communities in the Tarkwa-Nsuaem Municipality of Ghana.” World Journal of Entrepreneurship, Management and Sustainable Development 13 (3): 204–22. https://doi.org/10.1108/WJEMSD-09-2016-0042.
Zhyla, T., I. Soloviy, A. Zhyla, A. Rudych, and R. Volosyanchuk. 2014. “Forest Dependence in Rural Ukraine.” ENPI East Countries FLEG II Program.
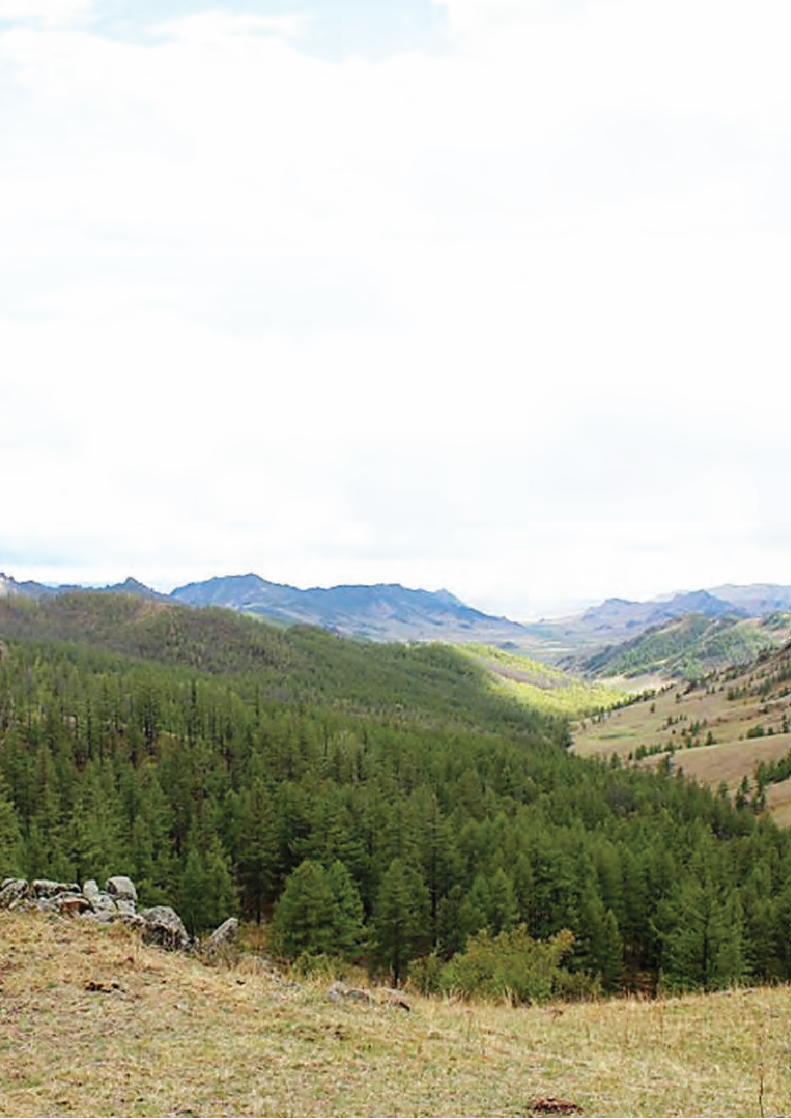
202 FOREST-SMART MINING