Galectin‐3 disruption impaired tumoral angiogenesis by reducing VEGF secretion from...
14
ORIGINAL RESEARCH Galectin-3 disruption impaired tumoral angiogenesis by reducing VEGF secretion from TGFb1-induced macrophages Camila Maria Longo Machado 1,2,3 , Luciana Nogueira Sousa Andrade 1,2 , Ver ^ onica Rodrigues Teixeira 1,2 , Fabr ıcio Falconi Costa 4 , Camila Morais Melo 1,2 , Sofia Nascimento dos Santos 1,2 , Suely Nonogaki 5 , Fu-Tong Liu 6 , Emerson Soares Bernardes 1,2 , Anamaria Aranha Camargo 7 & Roger Chammas 1,2 1 Laborato ´ rio de Oncologia Experimental—LIM24, Departamento de Radiologia e Oncologia, Faculdade de Medicina, Universidade de Sa ˜ o Paulo, Sa ˜ o Paulo, Brazil 2 Depto. de Radiologia e Oncologia, Centro de Investigac ßa ˜ o Translacional em Oncologia, Instituto do C^ ancer do Estado de Sa ˜ o Paulo, Faculdade de Medicina, Universidade de Sa ˜ o Paulo, Sa ˜ o Paulo, Brazil 3 Laborato ´ rio de Investigac ßa ˜o Me ´ dica Radioisotopos—LIM/43, Departamento de Radiologia e Oncologia, Faculdade de Medicina, Universidade de Sa ˜ o Paulo, Sa ˜ o Paulo, Brazil 4 Cancer Biology and Epigenomics Program, Ann & Robert H. Lurie Children’s Hospital of Chicago Research Center and Department of Pediatrics, Northwestern University’s Feinberg School of Medicine, Chicago, IL 60614 5 Departamento de Patologia, Instituto Adolfo Lutz, Sa ˜ o Paulo, Brazil 6 Institute of Biomedical Sciences, Academia Sinica, Taipei, Taiwan 7 Instituto Ludwig de Pesquisa sobre o C^ ancer, Sa ˜ o Paulo, Brazil Keywords Angiogenesis, galectin-3, melanoma, tumor microenvironment Correspondence Roger Chammas, Laborato ´ rio de Oncologia Experimental—LIM24, Departamento de Radiologia e Oncologia, Faculdade de Medicina, Universidade de Sa ˜ o Paulo, Sa ˜ o Paulo, Brazil. Tel: (5511)38932767; Fax: (5511)30826580; E-mail: [email protected] Funding Information This study was supported by FAPESP (grants #98/14247-6, Center for Cell-based Research Therapy; #04/14267-0 and #08/11513-0) and CNPq (grant #301987/2009-2). Received: 30 July 2013; Revised: 11 November 2013; Accepted: 12 November 2013 Cancer Medicine 2014; 3(2): 201–214 doi: 10.1002/cam4.173 Abstract In order to study the role of galectin-3 in tumor angiogenesis associated with tumor-associated macrophages (TAM) and tumor parenchyma, the galectin-3 expression was reconstituted in Tm1 melanoma cell line that lacks this protein. Galectin-3-expressing cells (Tm1G3) and mock-vector transfected cells (Tm1N3) were injected into wild-type (WT) and galectin-3 knockout (KO) C57Bl/6 mice. Tumors originated from Tm1G3 were larger in tumor volume with enlarged functional vessels, decreased necrotic areas, and increased vascular endothelial growth factor (VEGF) protein levels. Galectin-3-nonexpressing-cells injected into WT and KO showed increased levels of transforming growth fac- tor beta 1 (TGFb1) and, in WT animals this feature was also accompanied by increased VEGFR2 expression and its phosphorylation. In KO animals, tumors derived from galectin-3-expressing cells were infiltrated by CD68 + -cells, whereas in tumors derived from galectin-3-nonexpressing-cells, CD68 + cells failed to infiltrate tumors and accumulated in the periphery of the tumor mass. In vitro studies showed that Tm1G3 secreted more VEGF than Tm1N3 cells. In the lat- ter case, TGFb1 induced VEGF production. Basal secretion of VEGF was higher in WT-bone marrow-derived macrophages (BMDM) than in KO-BMDM. TGFb1 induced secretion of VEGF only in WT-BMDM. Tm1G3-induced tumors had the Arginase I mRNA increased, which upregulated alternative macrophage (M2)/TAM induction. M2 stimuli, such as interleukin-4 (IL4) and TGFb1, increased Arginase I protein levels and galectin-3 expression in WT- BMDM, but not in cells from KO mice. Hence, we report that galectin-3 disruption in tumor stroma and parenchyma decreases angiogenesis through interfering with the responses of macrophages to the interdependent VEGF and TGFb1 signaling pathways. ª 2014 The Authors. Cancer Medicine published by John Wiley & Sons Ltd. This is an open access article under the terms of the Creative Commons Attribution License, which permits use, distribution and reproduction in any medium, provided the original work is properly cited. 201 Cancer Medicine Open Access
-
Upload
independent -
Category
Documents
-
view
1 -
download
0
Transcript of Galectin‐3 disruption impaired tumoral angiogenesis by reducing VEGF secretion from...

ORIGINAL RESEARCH
Galectin-3 disruption impaired tumoral angiogenesis byreducing VEGF secretion from TGFb1-induced macrophagesCamila Maria Longo Machado1,2,3, Luciana Nogueira Sousa Andrade1,2, Veronica RodriguesTeixeira1,2, Fabr�ıcio Falconi Costa4, Camila Morais Melo1,2, Sofia Nascimento dos Santos1,2,Suely Nonogaki5, Fu-Tong Liu6, Emerson Soares Bernardes1,2, Anamaria Aranha Camargo7 &Roger Chammas1,2
1Laboratorio de Oncologia Experimental—LIM24, Departamento de Radiologia e Oncologia, Faculdade de Medicina, Universidade de Sao Paulo,
Sao Paulo, Brazil2Depto. de Radiologia e Oncologia, Centro de Investigac�ao Translacional em Oncologia, Instituto do Cancer do Estado de Sao Paulo, Faculdade de
Medicina, Universidade de Sao Paulo, Sao Paulo, Brazil3Laboratorio de Investigac�ao Medica Radioisotopos—LIM/43, Departamento de Radiologia e Oncologia, Faculdade de Medicina, Universidade de
Sao Paulo, Sao Paulo, Brazil4Cancer Biology and Epigenomics Program, Ann & Robert H. Lurie Children’s Hospital of Chicago Research Center and Department of Pediatrics,
Northwestern University’s Feinberg School of Medicine, Chicago, IL 606145Departamento de Patologia, Instituto Adolfo Lutz, Sao Paulo, Brazil6Institute of Biomedical Sciences, Academia Sinica, Taipei, Taiwan7Instituto Ludwig de Pesquisa sobre o Cancer, Sao Paulo, Brazil
Keywords
Angiogenesis, galectin-3, melanoma, tumor
microenvironment
Correspondence
Roger Chammas, Laboratorio de Oncologia
Experimental—LIM24, Departamento de
Radiologia e Oncologia, Faculdade de
Medicina, Universidade de Sao Paulo,
Sao Paulo, Brazil.
Tel: (5511)38932767; Fax: (5511)30826580;
E-mail: [email protected]
Funding Information
This study was supported by FAPESP (grants
#98/14247-6, Center for Cell-based Research
Therapy; #04/14267-0 and #08/11513-0) and
CNPq (grant #301987/2009-2).
Received: 30 July 2013; Revised: 11
November 2013; Accepted: 12 November
2013
Cancer Medicine 2014; 3(2): 201–214
doi: 10.1002/cam4.173
Abstract
In order to study the role of galectin-3 in tumor angiogenesis associated with
tumor-associated macrophages (TAM) and tumor parenchyma, the galectin-3
expression was reconstituted in Tm1 melanoma cell line that lacks this protein.
Galectin-3-expressing cells (Tm1G3) and mock-vector transfected cells
(Tm1N3) were injected into wild-type (WT) and galectin-3 knockout (KO)
C57Bl/6 mice. Tumors originated from Tm1G3 were larger in tumor volume
with enlarged functional vessels, decreased necrotic areas, and increased vascular
endothelial growth factor (VEGF) protein levels. Galectin-3-nonexpressing-cells
injected into WT and KO showed increased levels of transforming growth fac-
tor beta 1 (TGFb1) and, in WT animals this feature was also accompanied by
increased VEGFR2 expression and its phosphorylation. In KO animals, tumors
derived from galectin-3-expressing cells were infiltrated by CD68+-cells, whereas
in tumors derived from galectin-3-nonexpressing-cells, CD68+ cells failed to
infiltrate tumors and accumulated in the periphery of the tumor mass. In vitro
studies showed that Tm1G3 secreted more VEGF than Tm1N3 cells. In the lat-
ter case, TGFb1 induced VEGF production. Basal secretion of VEGF was higher
in WT-bone marrow-derived macrophages (BMDM) than in KO-BMDM.
TGFb1 induced secretion of VEGF only in WT-BMDM. Tm1G3-induced
tumors had the Arginase I mRNA increased, which upregulated alternative
macrophage (M2)/TAM induction. M2 stimuli, such as interleukin-4 (IL4) and
TGFb1, increased Arginase I protein levels and galectin-3 expression in WT-
BMDM, but not in cells from KO mice. Hence, we report that galectin-3
disruption in tumor stroma and parenchyma decreases angiogenesis through
interfering with the responses of macrophages to the interdependent VEGF and
TGFb1 signaling pathways.
ª 2014 The Authors. Cancer Medicine published by John Wiley & Sons Ltd. This is an open access article under the terms of
the Creative Commons Attribution License, which permits use, distribution and reproduction in any medium,
provided the original work is properly cited.
201
Cancer MedicineOpen Access

Introduction
Galectin-3, a conserved b-galactoside-binding animal
lectin, has important physiological roles, such as develop-
ment and activation of the immune system, besides its
involvement in tumor pathophysiology [1]. Tumor-asso-
ciated angiogenesis is a critical and targetable step of
tumorigenesis, resulting from the action of different cyto-
kines and growth factors (e.g., VEGF [2]) produced by a
variety of cellular elements within the tumor microenvi-
ronment. Different groups have suggested that galectin-3
plays a role in controlling tumor-associated angiogenesis.
In experiments with Human Umbilical Vein Endothe-
lial Cells (HUV-EC-C), Nangia-Makker et al. [3]
described that neutralizing galectin-3 by specific carbohy-
drates and anti-galectin-3 antibodies affect chemotaxis,
endothelial cell morphology, and capillary tube formation
in vitro. These authors also demonstrated that galectin-3
has pro-angiogenic activity, which may be related to its
ability to induce endothelial cell migration. In addition,
they showed that xenotransplantation of galectin-3-over-
expressing human breast ductal carcinoma cells in nude
mice promotes tumor angiogenesis more efficiently.
Markowska et al. [4] showed in vitro that galectin-3 siR-
NA knockdown as well as galectin-3 blockers resulted in
reduction in angiogenesis induced by VEGF and basic
fibroblast growth factor (bFGF). These authors demon-
strated that VEGF and bFGF-induced angiogenesis in
mouse corneal micropocket assay was reduced in galec-
tin-3 knockout (KO) mice. They provided evidence to
support the notion that galectin-3 generates VEGFR2-
clusters, thus potentiating cell signaling effects in endo-
thelial cells [5].
Release of VEGF within the tumor microenvironment
recruits bone marrow-derived cells, which turn into
tumor-associated macrophages (TAM), further enhancing
the local production of VEGF [6]. The amount of TAM
has been associated with poor prognosis and outcome by
increased macrophage gene transcription levels (e.g.,
CD68) in breast carcinomas and lymphomas [7, 8]. In
general, TAMs display an M2 phenotype, which has pro-
tumoral functions, such as promoting stromal modifica-
tions allowing for tumor cell survival, proliferation, and
spread. In in vitro studies, MacKinnon et al. [9] demon-
strated that galectin-3 is necessary for optimal M2
activation. On the other hand, Dragomir et al. [10] dem-
onstrated that toxic stimuli in vivo overrides galectin-3
deficiency in hepatic macrophages from galectin-3-dis-
rupted mice, as these cells could be induced to alternative
activation. The question of how and to what extent galec-
tin-3 contributes to M2 polarization thus remains open.
VEGF is also augmented by mediators produced by
TAM and tumor cells [11] such as transforming growth
factor beta 1 (TGFb1) and other factors, such as IL-13,
IL-4, and IL-10 [6], skewing the macrophage response
toward an M2 phenotype. In high concentrations, TGFb1may inhibit endothelial cell growth in vitro [12] and in
vivo [2]. Furthermore, TGF-b1 induces angiogenesis by
stimulating the production of positive regulators from
stromal cells and through chemoattraction of bone-mar-
row-derived monocytes [2]. TGFb1 is strongly induced in
hypoxic tissues [13] and its induction results in increased
tumor progression and peritumoral angiogenesis in mela-
nomas [14]. TGFb1 also attracts macrophages directly as
a potent chemoattractant [15] or indirectly by inducing
CCL5/regulated on activation, normal T cell expressed
and secreted [16] production by stromal cells.
Our group has established a tumorigenic melanoma
model (Tm1 cells) derived from a non-tumorigenic cell
line named Melan-A [17, 18]. Transcriptome analysis
showed that Tm1 cells lost galectin-3 expression [19].
Here, we have analyzed the impact of heterologous xeno-
genic expression of galectin-3 in Tm1 cells engrafted in
both wild-type and galectin-3 null mice to address the
role of galectin-3, and its cellular origin, in melanoma
tumor growth and tumor-associated angiogenesis.
Material and Methods
Cell culture
All cell lines were grown in RPMI-1640, pH-6.9 supple-
mented with 5% heat-inactivated fetal calf serum (Gibco,
Life Technologies, Carlsbad, CA), as described elsewhere
[17, 18]. Tm1 cells were transfected with pEF1neo plasmi-
dial vector containing human cDNA for galectin-3 or not,
originating the cell lines Tm1G3 (galectin-3-positive) and
Tm1N3 (galectin-3-negative). All transfections were per-
formed using lipofectamine (Gibco, Life Technologies)
according to the manufacturer’s protocol. Transfected
cells were maintained in RPMI 1640 containing 5% of
fetal bovine serum and 1 mg/mL geneticin (G418; Sigma-
Aldrich, St. Louis, MO). Expression of galectin-3 in each
cell line/clone was determined by immunoblotting as
detailed in the supporting information.
DNA methylation analysis
Genomic DNA from melan-A and Tm1 cells were
obtained by digestion with proteinase K (100 lg/mL; Life
Technologies) and RNAse (20 lg/mL; Life Technologies)
for 16 h at 50°C, followed by phenol/chloroform/isoamyl
alcohol extraction. The presence of CpG islands in galec-
tin-3 promoter sequence was detected by the bisulfite
genome sequencing method, essentially as described by
others [20] and as given in supporting information.
202 ª 2014 The Authors. Cancer Medicine published by John Wiley & Sons Ltd.
Galectin-3 boosts VEGF and TGFb1 pathways C. M. L. Machado et al.

Animals and tumoral growth evaluation
All procedures were in accordance with ethical principles
adopted by the Brazilian College of Animal Experimenta-
tion and approved by the Ethical Committee for Animal
Research of School of Medicine, University of Sao Paulo
(#089/09). Eight-week-old male C57black/6 wild-type
(WT) or galectin-3 KO mice [21] received a subcutaneous
inoculation of 2 9 105 cells in right flank and tumor
growth was determined as described before [22]. After
euthanasia, tumors were collected for routine histopathol-
ogy, immunohistochemistry, and immunofluorescence
followed by quantification as described in the supporting
information. A section measuring 1 mm from the tail was
collected for galectin-3 genotyping as described by Dove-
rhag et al. [23].
Western blotting
Total protein extracts were eletrophoretically separated in
sodium dodecyl sulfate polyacrylamide gel electrophoresis
(SDS-PAGE) and blotted onto polyvinylidene difluoride
(Hybond-P; GE Healthcare, Little Chalfont, U.K.), mem-
brane according to standard procedures as described by
others [24–26]. The antibodies used were: anti-galectin-3
(M3/38 Hybridoma), anti-VEGF (1:500; Santa Cruz Bio-
technology, Santa Cruz, CA), anti-VEGFR2, and its anti-
phosphorylated form, pY1214-VEGFR2 (1:500; Invitrogen,
Life Technologies, Carlsbad, CA), TGFb1 (1:3000; BD
Biosciences—Pharmingen in San Diego, CA) or Arginase
I (1:1000; BD Biosciences—Pharmingen); followed by
specific HRP (horseradish peroxidase)-labeled secondary
antibody (Sigma-Aldrich, 1:4000). The procedures are
detailed in the supporting information section.
Total RNA extraction, reverse transcription,and real-time qRT-PCR
Tumors from at least three individuals were sectioned
into four quadrants and total RNA was extracted from
tissue sections using Tryzol reagent (Invitrogen, Life
Technologies). The RNA was purified with RNeasy mini-
kit (Qiagen, Austin, TX) according to the manufacturer’s
protocol. Reverse transcription and quantitative polymer-
ase chain reaction (qPCR) were performed using 10 ng of
RNA from each sample using SuperScript� III One-Step
RT-PCR System (Invitrogen, Life Technologies) following
manufacturer’s instructions published elsewhere. qPCR
was carried out in a Rotor gene 6000 detection system
equipped with a SYBR Green fluorescence detector for
amplicon quantification. The target primers used for
qPCR are presented in Table S1. The relative expressions,
of each gene were obtained by GeNormplus algorithm
from Vandesompele et al. [27] comparing target genes to
endogenous controls (b-actin, bII-microglobulin, TATA
binding protein, RpLP3a, and RpLP0).
Macrophage cultures and in vitroexperiments
Total cells were extracted from femoral or tibial bone
marrow from both WT and KO mice. These cells were
cultivated in RPMI 1640 media (Gibco, Life Technolo-
gies) supplemented with 20% heat-inactivated fetal calf
serum (Gibco, Life Technologies), 1% of penicillin and
streptomycin (Sigma-Aldrich) and 30% of L-Cell Condi-
tioned Media as a source of Macrophage Colony Stimu-
lating Factor (M-CSF) for 7–9 days. After this period, the
medium was removed and changed to RPMI 1640 media
(Gibco, Life Technologies) supplemented with 20% heat-
inactivated fetal calf serum (Gibco, Life Technologies),
1% of penicillin and streptomycin (Sigma-Aldrich) with
specific M1 (Lipopolysaccharide [LPS] 1 lg/mL (Sigma-
Aldrich) and IFN-c 50 ng/mL; (R&D System, Minneapo-
lis, MN) or M2 (IL-4 50 ng/mL (R&D System)or TGF-b150 ng/mL, (R&D System) stimuli. To identify BMDMs
(bone marrow-derived macrophage) cells were incubated
with Fc-block (conditioned media) followed by murine—anti-F4/80 (macrophage pan marker)—PE incubation
(Caltag Laboratories South San Francisco, CA) and then
visualized by flow cytometry in a FACs-Calibur (BD Bio-
sciences—Pharmingen). These experiments showed that
these adherent cells were >93% of F4/80 positive in WT
and >95% of KO cells in each 107 isolated cells.
VEGF assay in BMDM or Tm1N3 and Tm1G3conditioned media
VEGF quantification in conditioned media from BMDM
(from both WT and KO mice) and Tm1N3 or Tm1G3
cells after stimuli were evaluated with an enzyme-linked
immunosorbent assay (ELISA) method. Equal amounts of
protein were measured using a mouse VEGF ELISA kit
(Peprotech, Rocky Hill, NJ) that recognizes VEGF. VEGF
recombinant concentrations were determined using a
standard curve prepared with each experiment.
Statistical analysis
For each experiment in vivo, the numbers of individuals
were indicated as “n” in each figure legend. The in vitro
experiments were carried out at least three/four times (in
triplicate or quadruplicate), yielding similar results in
each occasion. The most representative from all experi-
ments conducted was chosen to compose the figures.
Data were analyzed by unpaired t-test, one-way analyses
ª 2014 The Authors. Cancer Medicine published by John Wiley & Sons Ltd. 203
C. M. L. Machado et al. Galectin-3 boosts VEGF and TGFb1 pathways

of variance (ANOVA) or two-way ANOVA followed by
post test (Bonferroni) and the differences were considered
significant for P < 0.1(*), P < 0.01(**) or P < 0.001
(***). All results are expressed as means � SEM (stan-
dard error of the mean). All analyses were conducted
using GraphPad Prism version 4.0 for Windows� (Graph-
Pad� Software, San Diego, CA) and Microsoft Office�
Excel software 2007 (Microsoft, Redmond, WA).
Results
Loss of galectin-3 was associated with itspromoter methylation in Tm1 cells
We evaluated the protein levels of galectin-3 in Tm1 cells,
as compared to Melan-A and observed a total absence of
this lectin in Tm1 cells, suggesting that galectin-3 expres-
sion was downregulated upon malignant transformation.
It is well known that aberrant methylation of CpG dinu-
cleotides is responsible for gene silencing [28] and, based
on that, we first performed in silico analyses to identify
putative CpG islands in the promoter region of the galec-
tin-3 murine gene (GenBank sequence number L08649.1).
Analysis of these sequences using CpG plot (EMBL)
showed 33 CpG dinucleotides in the 5′ upstream region
of the galectin-3 gene, including the first exon and first
intron (Fig. 1A). The high content of CpG dinucleotides
around regulatory regions of the galectin-3 gene suggests
a possible role for DNA methylation in its control. To
evaluate DNA methylation status of melan-A and Tm1
cell lines, we performed bisulfite genomic sequencing of a
genomic region comprising the 33 CpG dinucleotides
A
B
C D
Figure 1. Methylation status of galectin-3 promoter region in melan-A and Tm1 cells. (A) Sequence of promoter, first exon and first intron (from
�137 upstream to +377 downstream) of the galectin-3 gene (GenBank, # L08649). The analysis of these regions using CpGplot indicated that
these regions lie within a putative CpG island. CpG dinucleotides methylated are represented as black circles whereas unmethylated CpG
dinucleotides are represented in open circles. (B) Western blotting to galectin-3 in melan-A, Tm1 and transfected cells with a plasmid containing
human cDNA for galectin-3 or the empty vector (Tm1G3 and Tm1N3) showing the presence of the murine galectin-3 in melan-A (molecular
weight, ~30 kDa), and the human galectin-3 in Tm1G3 (molecular weight, ~25 kDa). Each lane corresponded to 20 lg from total protein cell
extracts. (C) Representative graph of tumor volume after Tm1-galectin-3-nonexpressing cells implantation in C57black/6 Lgals3+/+ (WT) or
Lgal3s3�/� (KO) mice. After 14 days post inoculation a palpable mass was detected. (D) After Tm1G3 injections in WT mice (WTG3) or KO mice
(KOG3) a palpable mass was detected after 11 days post inoculation. The dashed line represents the cutoff tumoral volume to compare inocula
of Tm1 and its transfected cells. The results in each graph corresponded to mean � SEM and test used was two-way ANOVA with post test
comparing all pair of columns. WT, wild type; KO, knockout; ANOVA, analyses of variance.
204 ª 2014 The Authors. Cancer Medicine published by John Wiley & Sons Ltd.
Galectin-3 boosts VEGF and TGFb1 pathways C. M. L. Machado et al.

present in the 5′ upstream region of the galectin-3 gene.
Sequencing of bisulfite-converted DNA revealed that all
CpG dinucleotides were indeed methylated in the tumori-
genic cell line and unmethylated in melan-A (Fig. 1A).
Moreover, these regions had three extra CpG dinucleo-
tides as compared to the actual galectin-3 sequence of
Sv129 mice deposited in the GenBank.
We investigated the relationship between galectin-3
gene hypermethylation and its expression in vitro. The
parental Tm1 cell line was treated with increasing concen-
trations (2.5, 5 or 10 lmol/L) of 5′-Aza-2-deoxycytidine(5′-Aza-dCR, an inhibitor of DNA methyltransferases) for
72 h and we observed that galectin-3 expression was
restored only with the highest concentration of 5′-Aza-dCR (Fig. S1A, B and C). Besides, a marked decrease in
the original methylation pattern of the 5′ upstream region
of the galectin-3 gene was observed after treatment of
Tm1 cells with 10 lmol/L of 5′-Aza-dCR (Fig. S1B). It is
noteworthy that some CpG dinucleotides within putative
SP1-binding sites become completely unmethylated after
treatment (Fig. S1D). In addition, Western blot analysis
showed that the levels of galectin-3 protein were partially
restored after the treatment of Tm1 cells with 5′-Aza-dCR(Fig. S1D).
In order to access the impact of galectin-3 expression
in melanoma engraftment and tumor growth, Tm1 cells
were successfully transfected with a plasmid containing
human cDNA for galectin-3 or the empty vector, generat-
ing stable clones, designated as Tm1G3 and Tm1N3,
respectively. Galectin-3 expression levels were consistently
checked by Western blotting throughout all the experi-
ments, positive controls include analysis of murine galec-
tin-3, expressed by melan-A cells (apparent molecular
weight, ~30 kDa) while in Tm1G3, expressing the human
galectin-3 (~25 kDa) (Fig. 1B), as described elsewhere
[29]. No functional differences are described between
murine and human galectin-3. Galectin-3 was present in
Tm1G3, whereas it was absent in the control transfectants
(Tm1N3). Other stable clones were also selected and ren-
dered essentially the same results shown for Tm1G3 and
Tm1N3.
Galectin-3 accelerates melanoma growth
The evaluation of how the lack of galectin-3 in melanoma
cells impairs tumor growth was done by injecting Tm1
cells subcutaneously into both WT and galectin-3 KO
C57Bl/6 mice. In fact, the absence of this lectin in both
tumor cells and within the tumor microenvironment does
not seem to interfere with the tumorigenic process as all
galectin-3 KO mice injected with Tm1 cells developed
tumors (Fig. 1C). However, tumor growth was signifi-
cantly delayed in galectin-3 deficient mice.
We next injected the clones Tm1G3 or Tm1N3 into
WT or KO mice to address whether the source of galec-
tin-3 (tumor vs stromal origin) would impact on tumor
engraftment and growth. Tm1G3 cells injected into WT
mice (WTG3) grew faster in comparison to tumors origi-
nated from Tm1 parental cells or Tm1N3. Moreover,
when the galectin-3-expressing cell line (Tm1G3) was
injected into KO animals, a delay in tumor growth was
also observed comparing with its growth in WT animals.
Altogether, when galectin-3 was present in both tumor
compartments and stromal compartments, tumors grew
faster than any other combinations. On the other hand,
when galectin-3 was absent in either tumor or stromal
compartment, a significant reduction in tumor growth
was observed (Fig. 1D).
Presence of galectin-3 in both tumor celland stromal cell compartments favorstumor-associated angiogenesis andbalanced tumor growth
With the purpose of understanding differences in growth
kinetic among all groups, necrotic areas as well as tumor
vessels were evaluated by routine histopathology and
using immunohistochemistry with anti-CD34 antibodies.
We observed that tumors derived from G3 cells in WT or
KO animals (WTG3 and KOG3, respectively) had smaller
necrotic areas (Fig. 2A) and larger functional vessel areas
(Fig. 2B). On the other hand, Tm1N3 tumors in KO mice
(KON3) had larger intra-tumoral necrosis areas, which
were accompanied by smallest functional vessel areas.
Decrease in the relative area of functional vessels was also
seen in Tm1N3 tumors in WT mice.
Galectin-3 modifies VEGF expression elicitedby TGFb1
To gain a mechanistic insight into the molecular mecha-
nisms involved in the differences mentioned above,
mRNA and proteins were collected from all groups after
16 days post inoculation to evaluate VEGF and TGFb1expression levels within tumor microenvironment. Fur-
thermore, mRNA of all above-mentioned conditions was
analyzed using a dedicated microchip to evaluate the
transcriptional profile of glycosylation-related genes.
Regarding the molecular signatures of all the experimental
conditions, as shown in supplementary data 2, the expres-
sion profile of the latter genes did not alter significantly,
despite the differences observed in tumor growth, necro-
sis, and angiogenesis.
We further focused on the phenotypic differences
observed and evaluated the protein levels of angiogenic
mediators, such as VEGF and TGFb1. Corroborating our
ª 2014 The Authors. Cancer Medicine published by John Wiley & Sons Ltd. 205
C. M. L. Machado et al. Galectin-3 boosts VEGF and TGFb1 pathways

observations on the areas covered by functional vessels,
secretion of VEGF was augmented in tumors with galec-
tin-3 from either tumor or stromal origin. Tumors
expressing galectin-3 in both stroma and parenchyma
(WTG3) were the largest and contained the highest levels
of detectable VEGF (Fig. 3A). In tumors without galectin-
3 (KON3), we detected the smallest amount VEGF
proteins (Fig. 3A). The expression of VEGF receptor,
VEGFR2, was also analyzed and a higher amount of this
receptor and its phosphorylated form was found in WT
tumors when compared to tumors from KO mice. It is
interesting to note that the smallest tumors, derived from
galectin-3 nonexpressing cells growing in galectin-3 null
environments (KON3), also showed the smallest amounts
of VEGFR2 and its phosphorylated form (Fig. S3).
Based on the fact that TGFb1 improves peritumoral
angiogenesis in melanomas [14] and acts indirectly as a
potent chemoattractant for monocytes/macrophages [15],
which releases VEGF in response of TGFb1 [30], we
investigated TGFb1 protein levels in tumors. While the
unusual isoform of TGFb1 (~15 kDa) was detected in all
groups without any significant differences, the active
TGFb1 homodimer (~25 kDa) levels were increased in
WTN3 and KON3 tumors. In order to test the hypothesis
that disruption of galectin-3 in either macrophages or
tumor cells could affect VEGF secretion in response to
TGFb1 levels, we tested in vitro whether BMDM and/or
cell lines secrete VEGF when cultured in TGFb1-enrichedmedium.
Basal VEGF secretion from WT-BMDM was higher
than from KO-BMDM. Upon TGFb1 stimulation, a
significant increase in VEGF secretion was observed
(Fig. 3C) in WT-BMDM. Galectin-3 positive cells were
consistently more responsive to TGFb1 than KO cells.
Furthermore, TGFb1 led to accumulation of galectin-3 in
WT-BMDM in a dose-dependent manner (Fig. S4A).
Regarding Tm1 clones, there was an increase in
TGFb1-mediated VEGF secretion only by Tm1N3 cells,
although the basal levels of secreted VEGF by Tm1G3
cells were higher (Fig. 3D). It is worth mentioning that
TGFb1 increases did not cause any increase in galectin-3
levels in either cell clone, as a matter of fact galectin-3 in
Tm1G3 decreased after TGFb1 stimuli (Fig. S4B).
Galectin-3 disruption in stroma did notinterfere with M2 enhancing signals in vivo
We performed immunofluorescence staining of macro-
phages associated with tumors was performed in cryopre-
served tumoral tissues to determine the amount of
WTG3
WTG3 CD34
CD34
CD34
CD34
KOG3
KOG3
KOG3 (n = 5)
100 000
80 000
60 000
40 000
20 000
20 000
15 000
10 000
5000
0
0
Nec
rotic
are
a (µ
m2 )
Ves
sel a
rea
(µm
2 )
KOG3
WTN3
WTG3
WTG3 (n = 8)
WTN3 (n = 6)
WTN3
WTN3
KON3
KON3
KOG3WTG3 WTN3 KON3
***
***
*
KON3 (n = 7)
KOG3 (n = 5)
WTG3 (n = 8)
WTN3 (n = 6)
KON3 (n = 6)
KON3
A
B
Figure 2. Morphological differences evaluation by Hematoxylin and Eosin stain and Immunohystochemistry. (A) Analysis of necrotic areas by H/E
and (B) vascular density by counting CD34-positive cells per area. The results were submitted to unpaired t-test with *P < 0.1 and ***P < 0.001.
The “n” value was indicated in the figure and each bar represents the mean � SE. Graph from a representative experiment.
206 ª 2014 The Authors. Cancer Medicine published by John Wiley & Sons Ltd.
Galectin-3 boosts VEGF and TGFb1 pathways C. M. L. Machado et al.

CD68+ cells inside or in the periphery of tumor slices (as
represented in Figs. 4A and S5). The results showed more
infiltrating CD68+ cells in KOG3 tumors. On the other
hand, in tumors derived from galectin-3 negative cells
grew in galectin-3 deficient microenvironment (KON3
tumors), more peripheral CD68+ cells were observed.
As galectin-3 was shown before [9] as an important
inducer of the M2 phenotype, we asked whether this
lectin could modulate the phenotype of TAM within the
tumor microenvironment. We addressed this point by
measuring the mRNA levels of some mediators of both
M2 (Arginase I, IL4 and IL10) and M1 (IL12p40, inter-
feron gamma [INFc]) phenotypes in tumors of all groups
by qPCR. A significant difference was found in Arginase I
mRNA levels. Indeed, we observed a fivefold increase in
its level in the group with the largest tumors, WTG3 as
compared to WTN3 tumors. It is interesting to note that
in KOG3 tumors Arginase I mRNA levels had little
difference from WTG3 (Fig. 4B). Regarding IL4, IL10,
IL12-p40 and INFc mRNA expression levels, no signifi-
cant differences between WTG3, WTN3, KOG3 or KON3
were found (Fig. S6).
BMDM from galectin-3 KO animalsexpressed higher levels of Arginase 1 butwere insensitive to its modulation by M2prototypical cytokines
Based on the increased expression of Arginase I in WTG3
tumors, as well as on the notion that tumor-associated
macrophages are polarized to the protumorigenic M2
phenotype, we next tested the impact of galectin-3 dis-
ruption in this phenomenon. Once galectin-3 is regarded
as a key molecule in this polarizing event [9], we studied
the behavior of BMDM from both WT and KO mice after
in vitro stimulation with IL-4 (50 ng/mL) or TGFb1(50 ng/mL) pro-M2 stimuli and LPS 1 lg/mL plus IFN-c50 ng/mL pro-M1 stimuli with or without addition of
exogenous galectin-3 (50 lg/mL).
A
B
C
D
Figure 3. (A and B) VEGF and TGFb1 pro-angiogenic factors
accumulation were analyzed by immunoblotting, followed by
densitometric analyses of the blots using ImageJ. Each bar represents
the mean � SE of the values obtained (n represented within the
figure). (C and D) Conditioned media from bone marrow-derived
macrophages from WT or KO cells and Tm1N3 mock-cells or Tm1G3
galectin-3 transfected cells after 24 h of culture, dosed by ELISA of
secreted VEGF to media (wells)/experiment (n = 6) in basal line (0)
and after TGFb1 stimuli (50 ng/mL, 100 ng/mL). The results were
submitted to unpaired test, two-tailed with *P < 0.1; ** P < 0.01 and
***P < 0.001. Each bar represents the mean � SE and the graph is a
representative result from four independent experiments. WT, wild
type; KO, knockout; ELISA, enzyme-linked immunosorbent assay.
ª 2014 The Authors. Cancer Medicine published by John Wiley & Sons Ltd. 207
C. M. L. Machado et al. Galectin-3 boosts VEGF and TGFb1 pathways
Arginase 1 to b-actin ratios were analyzed in protein
extracts from both WT and KO-BMDM as a measure of
macrophage activation. Basal levels of arginase 1 were
higher in galectin-3 KO-BMDM (first lanes Fig. 5A, B
and C). Upon IL-4 (50 ng/mL) or TGFb1 (50 ng/mL)
stimulation, arginase 1 expression increased in
WT-BMDM; whereas, this increase was not observed in
galectin-3 KO-BMDM. It is interesting that exogenous
galectin-3 (50 lg/mL) did not restore this phenotype.
WT-BMDM treated with IL-4 (50 ng/mL) and TGFb1(50 ng/mL) increased Arg-I protein in these cells with a
slightly additive effect of exogenous galectin-3 (50 lg/mL)
in response to IL-4 stimulus (Fig. 5A and B). In KO-
BMDM, these same stimuli did not increase Arg-I protein
levels. A large increase in Arg-I protein was detected in
WT-BMDM and KO-BMDM stimulated with LPS 1
lg/mL plus IFN-c 50 ng/mL with a little additive effect of
exogenous galectin-3 (50 lg/mL) just in WT-BMDM.
Pro-M2 IL-4 (50 ng/mL) or M1 (LPS 1 lg/mL plus IFN-
c 50 ng/mL) prototype signals did not increase VEGF
protein secretion from both WT and KO -BMDM. After
exposure to IL-4 (alternative activation of macrophages,
M2), VEGF secretion was relatively more amplified in
KO-BMDM than in WT-BMDM. Upon M1 activation,
either WT-BMDM or KO-BMDM secreted the equivalent
amounts of VEGF (Fig. 5D).
Discussion
In this report, we have exploited a tumor model system
developed by our own group consisting of a tumorigenic
cell line Tm1, derived from a non-tumorignenic murine
melanocyte cell line, melan-A [17, 18]. Among the many
differences between melan-A and Tm1 cells [19], a strik-
ing difference was the loss of galectin-3 expression
through hypermethylation of a CpG island composed of
33 CpG dinucleotides located at its 5′ upstream region in
the melanoma cell. Moreover, some of these CpG dinu-
cleotides are located within putative-binding sites to SP1
transcription factors, whose binding depends on CpG
methylation [28]. This very particular model system was
generated by repeated cycles of adhesion/de-adhesion,
which in turn led to epigenetic reprogramming [31]. The
DNA methylation status in the 5′ upstream region of
galectin-3 gene was clearly associated with absence of
mRNA and protein expression in Tm1 cells. Interestingly,
DNA methylation encompassed all possible CpG dinucle-
otides present within the galectin-3 5′ upstream region.
Others had shown that galectin-3 expression is controlled
by DNA methylation [32], for example Ruebel et al. [33]
showed that galectin-3 expression is epigenetically silenced
by DNA hypermethylation in human pituitary tumors
and Ahmed and Vasta showed it likewise in prostate can-
cer [32, 34, 35]. Other members of the galectin family,
such as galectin-1, can be silenced by DNA methylation
and its re-expression induces apoptosis in cancer cells
A
B
Figure 4. (A) Quantification of CD68-positive cells inside or in the
periphery of WTG3, WTN3, KOG3, and KON3 tumors. Data were
analyzed by one-way-ANOVA with *P < 0.1 and **P < 0.01. Each bar
represents the mean � SE (n = 3 for each experiment). (B) qPCR
showing a M2-proned microenvironment by increased Arginase I
mRNA in WTG3 and KOG3 tumors. Each bar represents the
mean � SE from three individuals, mRNA relative expression for each
group, analyzed by t unpaired test, two-tailed with *P < 0.1;
**P < 0.01 and ***P < 0.001. WT, wild type; KO, knockout; ANOVA,
analyses of variance.
208 ª 2014 The Authors. Cancer Medicine published by John Wiley & Sons Ltd.
Galectin-3 boosts VEGF and TGFb1 pathways C. M. L. Machado et al.

[36]. These genes also exhibit a high density of CpG sites
around their 5′ upstream region compatible with a role of
DNA methylation in its transcriptional control. Here
we showed that galectin-3 expression was lost in our
model of melanoma progression. Although the precise
mechanisms that target DNA methyltransferases (e.g.,
DNMT1) to a specific CpG island are still not clear, our
results showed selective silencing of galectin-3 in murine
melanoma. For some time, it was confusing in the litera-
ture, whether galectin-3 expression was increased or lost
A
B
C
D
Figure 5. (A, B and C) Western blotting WT-BMDM or KO-BMDM of total protein cell extracts without stimulation or after IL-4 (50 ng/mL),
TGFb1 (50 ng/mL) and LPS (1 lg/mL) + IFN-c (50 ng/mL), with or without exogen galectin-3 (50 lg/mL). Each lane represents a pool from three
independent assays (50 lg/lane), each one performed with cells derived from one animal. The images were representative of two independent
experiments. The number above each lane represents the target/b-actin relation from densitometric analysis performed using ImageJ. (D) The
ELISA evaluated VEGF secreted in medium from bone marrow-derived macrophages WT or KO cells after 24 h of culture. The experiments were
conducted in triplicates comparing basal levels with M2 polarization (IL-4, 50 ng/mL) or M1 polarization stimuli (LPS, 1 lg/mL + IFN-c, 50 ng/mL).
Similar results were obtained in a second experiment, consisting of an analysis of pooled samples from three independent plates of BMDM, each
one obtained from different animals. WT, wild type; KO, knockout; BMDM, bone marrow-derived macrophages; ELISA, enzyme-linked
immunosorbent assay.
ª 2014 The Authors. Cancer Medicine published by John Wiley & Sons Ltd. 209
C. M. L. Machado et al. Galectin-3 boosts VEGF and TGFb1 pathways
upon tumor progression. While there was a tendency to
believe that galectin-3 would be lost in most epithelial
tumors, a seminal work from Raz and coworkers [37]
suggested that galectin-3 expression was not really lost in
most carcinomas, but instead the epitope recognized by
the most commonly used antibodies against galectin-3
was indeed processed by metalloproteases in the tumor
microenvironment. Therefore, the apparent loss of galec-
tin-3 was meant to be an artifact. Worthy of note is the
fact that a recent paper from Brown and coworkers [38]
studying human melanomas suggested that galectin-3
seems positively involved with melanoma progression to a
large extent, confirming somehow data from Prieto and
colleagues [39]; however, in more advanced stages of mel-
anomas, galectin-3 expression was lost [38]. It is still not
clear how galectin-3 expression is controlled in melano-
mas, obviously, it is possible that hypermethylation of its
promoter may play a role in this process, though.
We next exploited the model system to further address
what the selective advantage is of having tumor cells-
expressing galectin-3 and if it is critical that the origin of
galectin-3 is a tumor or a stromal cell. Our results
demonstrated that melanoma cells expressing galectin-3
(Tm1G3) secreted larger amounts of VEGF in vitro than
Tm1N3 cells, even without any specific stimulus. As far as
we know, it is shown here for the first time that galectin-
3 expression recovery in a melanoma cell increases VEGF
secretion. Besides, BMDM from WT mice have secreted
more VEGF than those derived from KO mice. Accord-
ingly, WTG3 tumors are largest in volume, display larger
functional vascular areas and have increased mRNA Argi-
nase I levels to M2-stimulated macrophages. Noteworthy,
when galectin-3-expressing tumor cells were engrafted in
galectin-3 null mice, secretion of VEGF triggered in the
tumor microenvironment was sufficient to provide for
the necessary angiogenesis, allowing for the organization
of a large functional vascular area and adequate response
of arginase 1. Our in vivo results extend what Markowska
et al. [4] showed in vitro that galectin-3 siRNA knock-
down as well as galectin-3 blockers resulted in reduction
in angiogenesis induced by VEGF and bFGF mediators.
In this regard, galectin-3 from tumor cells could orches-
trate cellular and tissue events, including recruitment of
monocytes to the tumor microenvironment. VEGF, from
both tumor cells and monocyte/macrophage origin would
then be a key mediator of angiogenesis and maintenance
of an immature status of the immune system within the
tumor, thus favoring tumor growth. The main response
to VEGF in vivo is mediated by VEGF receptor-2 (VEG-
FR2) and the way it regulates angiogenesis is through
VEGFR2 expression and its activation in cells. We
observed that VEGFR2 and its phosphorylated form were
increased just in WTG3 and KOG3 tumors suggesting
that galectin-3 from tumor cells had a crucial impact in
VEGF/VEGFR2 cell. Altogether these results point that
although galectin-3 from both tumor parenchyma and
tumor stroma may support tumor growth, as it would be
expected for a secreted protein, acting in the extracellular
milieu, galectin-3 from parenchymal (tumor) cells may be
of greater impact to tumor-associated angiogenesis.
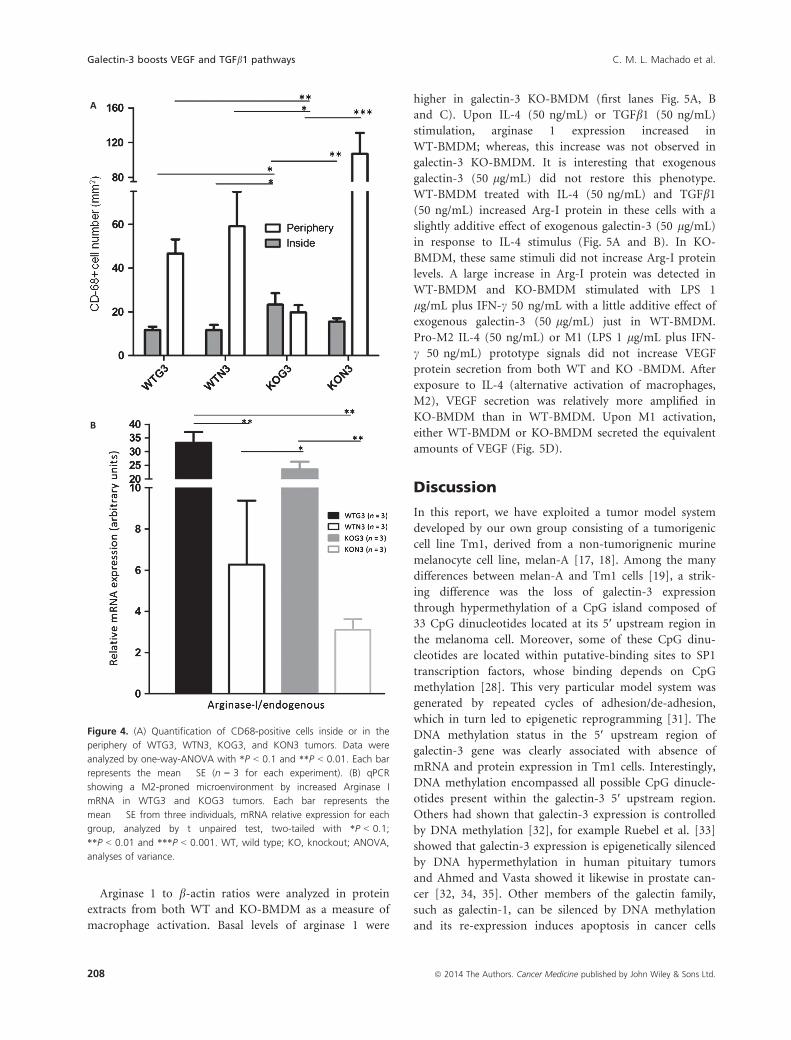
Figure 6. Diagram representing our hypothesis that galectin-3 from tumor parenchyma or stroma in the tumor microenvironments sites could
augment VEGF signals to: improve angiogenesis, enhance macrophage migration to tumors, which in turns enhance TGFb1 signaling to produce
more VEGF. In addition, galectin-3 could enhance macrophages to secreted cytokines to an immune regulatory pattern with TGFb1 as a
mediator, which in turns enhances VEGF and so on.
210 ª 2014 The Authors. Cancer Medicine published by John Wiley & Sons Ltd.
Galectin-3 boosts VEGF and TGFb1 pathways C. M. L. Machado et al.

Despite, its potential role within tumor cells, it is interest-
ing to note that galectin-3 of tumor origin may modify
signaling from stromal cells. Markowska et al. [5] hypoth-
esized that galectin-3 organize VEGFR2-clusters that
potentiate cell signaling effects in endothelial cells. Our
results essentially extend the findings of the Panjwani
group in a melanoma model [3, 4]. Of interest, a very
recent paper from the Salmon group demonstrated that
galectin-3 interferes with both VEGFR1 and VEGFR2 sig-
naling in endothelial cells [40]. These results strengthen
the notion that galectin-3 interactions are potential targets
for intervention in tumors.
While in galectin-3-expressing microenvironments, it
was possible to observe CD68-positive cells infiltrating the
tumor mass, these cells were only found in the periphery
of galectin-3 negative tumors engrafted in KO mice.
Therefore, the presence of galectin-3 interferes the pattern
of recruitment and topography of cells infiltrating tumors,
such as monocytes and macrophages. In a recent paper
[41], a very similar finding was described and a critical
issue then would be the polarity of differentiation of mac-
rophages within the tumor microenvironment. In our
experiments, BMDM from both WT and KO behave
differently before TGFb1 stimulus, regarding VEGF
expression, following the same tendency observed in in
vivo experiments. Interestingly, in the absence of galectin-
3, TGFb1 signaling seems altered in several pathophysio-
logical contexts, as illustrated by the poor fibrogenic
response in the liver of chronically infected mice, for
example [42, 43]. WT macrophages responded to TGFb1increase with increased VEGF secretion and galectin-3
expression, confirming that WT macrophages receive these
TGFb1 signals. Besides Tm1N3 cells are less responsive to
TGFb1 with modest increase in VEGF secretion
upon TGFb1 stimulus. Gong et al. [44] published recently
that TGFb1-receptor-I KO mice have decreased galectin-3
levels after M2-prone stimuli arguing in favor that there
might exist some putative role of galectin-3 in the regula-
tion of TGFb1-dependent pathways.Finally, we have evaluated in vitro aspects of the polar-
ity of the macrophage response to known stimuli, which
are processed toward either an M1 or an M2 response in
both WT and KO-BMDM. Curiously, basal level accumu-
lation of arginase 1 in KO-BMDM was higher than in
WT-BMDM. Upon activation with M2 stimuli, WT-
BMDM processed the signals and accumulated arginase 1,
whereas in the absence of galectin-3, arginase 1 protein
expression was decreased. It is likely that this effect was
due to galectin-3 functioning intracellularly, as exoge-
nously added recombinant galectin-3 did not interfere
with the result on KO-BMDM. Note that an apparent
discrepancy exists as we compare the global levels of argi-
nase expression in vivo, as performed in Figure 4, and
the production of arginase, as evaluated by Western blots
in protein extracts of macrophage differentiated and acti-
vated in vitro, as shown in Figure 5. Data in Figure 4
represent different subpopulations of macrophages pres-
ent within all the distinct tissue subcompartments of
tumors. Dissection of the different tissue contexts within
a tumor and detailed analysis of the macrophage pheno-
type within each context is warranted. Our results, as
summarized in Figure 6, support the notion that galectin-
3 is part of the alternative activation pathway of macro-
phages (M2 phenotype), as in its absence this phenotype
is dysregulated. In conclusion, regardless its source
(tumor parenchyma or stroma), galectin-3 plays a role in
the organization of the tumor microenvironment.
Decreased expression of galectin-3 in either compartment
may lead to impaired tumor angiogenesis, as we have
observed experimentally, as a result of diminished VEGF
and/or resistance to TGFb1. More studies related to these
phenomena are necessary to elucidate what is the exact
point that this galectin-3 disruption could benefit
patients, thereby providing a window for improved che-
motherapy treatment.
Acknowledgments
This study was supported by FAPESP (grants #98/14247-
6, Center for Cell-based Research Therapy; #04/14267-0
and #08/11513-0), and CNPq (grant #301987/2009-2).
Conflict of Interest
None declared.
References
1. Liu, F. T., and G. A. Rabinovich. 2005. Galectins as
modulators of tumour progression. Nat. Rev. Cancer 5:29–
41.
2. Watnick, R. S. 2012. The role of the tumor
microenvironment in regulating angiogenesis. Cold Spring
Harb. Perspect. Med. 2:a006676.
3. Nangia-Makker, P., Y. Honjo, R. Sarvis, S. Akahani, V.
Hogan, K. J. Pienta, et al. 2000. Galectin-3 induces
endothelial cell morphogenesis and angiogenesis. Am. J.
Pathol. 156:899–909.
4. Markowska, A. I., F. T. Liu, and N. Panjwani. 2010.
Galectin-3 is an important mediator of VEGF- and
bFGF-mediated angiogenic response. J. Exp. Med.
207:1981–1993.
5. Markowska, A. I., K. C. Jefferies, and N. Panjwani. 2011.
Galectin-3 protein modulates cell surface expression and
activation of vascular endothelial growth factor receptor 2
in human endothelial cells. J. Biol. Chem. 286:29913–
29921.
ª 2014 The Authors. Cancer Medicine published by John Wiley & Sons Ltd. 211
C. M. L. Machado et al. Galectin-3 boosts VEGF and TGFb1 pathways

6. Solinas, G., G. Germano, A. Mantovani, and P. Allavena.
2009. Tumor-associated macrophages (TAM) as major
players of the cancer-related inflammation. J. Leukoc. Biol.
86:1065–1073.
7. Paik, S., S. Shak, G. Tang, C. Kim, J. Baker, M. Cronin,
et al. 2004. A multigene assay to predict recurrence of
tamoxifen-treated, node-negative breast cancer. N. Engl.
J. Med. 351:2817–2826.
8. Kamper, P., K. Bendix, S. Hamilton-Dutoit, and B.
Honore. 2011. Nyengaard JR, d’Amore F.
Tumor-infiltrating macrophages correlate with adverse
prognosis and Epstein-Barr virus status in classical
Hodgkin’s lymphoma. Haematologica 96:269–276.
9. MacKinnon, A. C., S. L. Farnworth, P. S. Hodkinson, N.
C. Henderson, K. M. Atkinson, H. Leffler, et al. 2008.
Regulation of alternative macrophage activation by
galectin-3. J. Immunol. 180:2650–2658.
10. Dragomir, A. C., R. Sun, H. Choi, J. D. Laskin, and D. L.
Laskin. 2012. Role of galectin-3 in classical and alternative
macrophage activation in the liver following
acetaminophen intoxication. J. Immunol. 189:5934–5941.
11. Laskin, D. L., V. R. Sunil, C. R. Gardner, and J. D.
Laskin. 2011. Macrophages and tissue injury: agents of
defense or destruction? Annu. Rev. Pharmacol. Toxicol.
51:267–288.
12. Baird, A., and T. Durkin. 1986. Inhibition of endothelial
cell proliferation by type beta-transforming growth factor:
interactions with acidic and basic fibroblast growth factors.
Biochem. Biophys. Res. Commun. 138:476–482.
13. Hung, S. P., M. H. Yang, K. F. Tseng, and O. K. Lee.
2012. Hypoxia-induced secretion of TGF-beta 1 in
mesenchymal stem cell promotes breast cancer cell
progression. Cell Transplant. 22:1869–1882.
14. Javelaud, D., V. I. Alexaki, and A. Mauviel. 2008.
Transforming growth factor-beta in cutaneous melanoma.
Pigment Cell Melanoma Res. 21:123–132.
15. Wiseman, D. M., P. J. Polverini, D. W. Kamp, and S. J.
Leibovich. 1988. Transforming growth factor-beta (TGF
beta) is chemotactic for human monocytes and induces
their expression of angiogenic activity. Biochem. Biophys.
Res. Commun. 157:793–800.
16. Happel, C., A. D. Steele, M. J. Finley, M. A. Kutzler, and
T. J. Rogers. 2008. DAMGO-induced expression of
chemokines and chemokine receptors: the role of
TGF-beta1. J. Leukoc. Biol. 83:956–963.
17. Correa, M., J. Machado Jr, C. R. Carneiro, J. B. Pesquero,
M. Bader, L. R. Travassos, et al. 2005. Transient
inflammatory response induced by apoptotic cells is an
important mediator of melanoma cell engraftment and
growth. Int. J. Cancer 114:356–363.
18. Oba-Shinjo, S. M., M. Correa, T. I. Ricca, F. Molognoni,
M. A. Pinhal, I. A. Neves, et al. 2006. Melanocyte
transformation associated with substrate adhesion
impediment. Neoplasia 8:231–241.
19. de Souza, G. A., L. M. Godoy, V. R. Teixeira, A. H. Otake,
A. Sabino, J. C. Rosa, et al. 2006. Proteomic and SAGE
profiling of murine melanoma progression indicates the
reduction of proteins responsible for ROS degradation.
Proteomics 6:1460–1470.
20. Costa, F. F., N. V. Verbisck, A. C. Salim, D. F. Ierardi, L.
C. Pires, R. M. Sasahara, et al. 2004. Epigenetic silencing
of the adhesion molecule ADAM23 is highly frequent in
breast tumors. Oncogene 23:1481–1488.
21. Hsu, D. K., R. Y. Yang, Z. Pan, L. Yu, D. R. Salomon, W.
P. Fung-Leung, et al. 2000. Targeted disruption of the
galectin-3 gene results in attenuated peritoneal
inflammatory responses. Am. J. Pathol. 156:1073–1083.
22. Onuchic, A. C., C. M. Machado, R. F. Saito, F. J. Rios, S.
Jancar, and R. Chammas. 2012. Expression of PAFR as
part of a prosurvival response to chemotherapy: a novel
target for combination therapy in melanoma. Mediators
Inflamm. 2012:175408.
23. Doverhag, C., M. Hedtj€arn, F. Poirier, C. Mallard, H.
Hagberg, A. Karlsson, et al. 2010. Galectin-3 contributes to
neonatal hypoxic-ischemic brain injury. Neurobiol. Dis.
38:36–46.
24. Laemmli, U. K. 1970. Cleavage of structural proteins
during the assembly of the head of bacteriophage T4.
Nature 227:680–685.
25. Towbin, H., T. Staehelin, and J. Gordon. 1979.
Electrophoretic transfer of proteins from polyacrylamide
gels to nitrocellulose sheets: procedure and some
applications. Proc. Natl. Acad. Sci. USA 76:4350–4354.
26. Mozdzanowski, J., P. Hembach, and D. W. Speicher. 1992.
High yield electroblotting onto polyvinylidene difluoride
membranes from polyacrylamide gels. Electrophoresis
13:59–64.
27. Vandesompele, J., K. De Preter, F. Pattyn, B. Poppe, N.
Van Roy, A. De Paepe, et al. 2002. Accurate normalization
of real-time quantitative RT-PCR data by geometric
averaging of multiple internal control genes. Genome Biol.
3:34.1–34.11.
28. Clark, S. J., J. Harrison, and P. L. Molloy. 1997. Sp1
binding is inhibited by (m)Cp(m)CpG methylation. Gene
195:67–71.
29. Davidson, P. J., M. J. Davis, R. J. Patterson, M. A.
Ripoche, F. Poirier, and J. L. Wang. 2002. Shuttling of
galectin-3 between the nucleus and cytoplasm.
Glycobiology 12:329–337.
30. Derynck, R., R. J. Akhurst, and A. Balmain. 2001.
TGF-beta signaling in tumor suppression and cancer
progression. Nat. Genet. 29:117–129.
31. Molognoni, F., A. T. Cruz, F. M. Meliso, A. S. Morais, C.
F. Souza, P. Xander, et al. 2011. Epigenetic
reprogramming as a key contributor to melanocyte
malignant transformation. Epigenetics 6:450–464.
32. Ahmed, H., P. P. Banerjee, and G. R. Vasta. 2007.
Differential expression of galectins in normal, benign and
212 ª 2014 The Authors. Cancer Medicine published by John Wiley & Sons Ltd.
Galectin-3 boosts VEGF and TGFb1 pathways C. M. L. Machado et al.
malignant prostate epithelial cells: silencing of galectin-3
expression in prostate cancer by its promoter methylation.
Biochem. Biophys. Res. Commun. 358:241–246.
33. Ruebel, K. H., L. Jin, X. Qian, B. W. Scheithauer, K.
Kovacs, N. Nakamura, et al. 2005. Effects of DNA
methylation on galectin-3 expression in pituitary tumors.
Cancer Res. 65:1136–1140.
34. Ahmed, H. 2010. Promoter methylation in prostate cancer
and its application for the early detection of prostate
cancer using serum and urine samples. Biomark Cancer
2010:17–33.
35. Ahmed, H., F. Cappello, V. Rodolico, and G. R. Vasta. 2009.
Evidence of heavy methylation in the galectin 3 promoter in
early stages of prostate adenocarcinoma: development and
validation of a methylated marker for early diagnosis of
prostate cancer. Transl. Oncol. 2:146–156.
36. Satelli, A. 2011. Rao., U. S. Galectin-1 is silenced by
promoter hypermethylation and its re-expression induces
apoptosis in human colorectal cancer cells. Cancer Lett.
301:38–46.
37. Nangia-Makker, P., T. Raz, L. Tait, V. Hogan, R. Fridman,
and A. Raz. 2007. Galectin-3 cleavage: a novel surrogate
marker for matrix metalloproteinase activity in growing
breast cancers. Cancer Res. 67:11760–11768.
38. Brown, E. R., T. Doig, N. Anderson, T. Brenn, V. Doherty,
Y. Xu, et al. 2012. Association of galectin-3 expression
with melanoma progression and prognosis. Eur. J. Cancer
48:865–874.
39. Prieto, V. G., A. A. Mourad-Zeidan, V. Melnikova, M. M.
Johnson, A. Lopez, A. H. Diwan, et al. 2006. Galectin-3
expression is associated with tumor progression and
pattern of sun exposure in melanoma. Clin. Cancer Res.
12:6709–6715.
40. D’Haene, N., S. Sauvage, C. Maris, I. Adanja, M. Le
Mercier, C. Decaestecker, et al. 2013. VEGFR1 and
VEGFR2 Involvement in Extracellular Galectin-1- and
Galectin-3-Induced Angiogenesis. PLoS ONE 8:e67029.
41. Jia, W., H. Kidoya, D. Yamakawa, H. Naito, and N.
Takakura. 2013. Galectin-3 accelerates M2 macrophage
infiltration and angiogenesis in tumors. Am. J. Pathol.
182:1821–1831.
42. Henderson, N. C., A. C. Mackinnon, S. L. Farnworth, F.
Poirier, F. P. Russo, J. P. Iredale, et al. 2006. Galectin-3
regulates myofibroblast activation and hepatic fibrosis.
Proc. Natl. Acad. Sci. USA 103:5060–5065.
43. Oliveira, F. L., C. Brand, A. A. Paula, K. D. Arcanjo, D. K.
Hsu, F. T. Liu, et al. 2011. Lack of galectin-3 disturbs
mesenteric lymph node homeostasis and B cell niches in
the course of Schistosoma mansoni infection. PLoS ONE
6:e19216.
44. Gong, D., W. Shi, S. J. Yi, H. Chen, J. Groffen, and N.
Heisterkamp. 2012. TGFb signaling plays a critical role in
promoting alternative macrophage activation. BMC
Immunol. 15:31.
Supporting Information
Additional Supporting Information may be found in the
online version of this article:
Figure S1. (A) Methylation status of region shown in A
after genomic sequencing of bisulfite-treated DNA from
Melan-A and Tm1 cells. (B) Overexpression of galectin-3
melan-A in parental lineage and down expression in
Tm1. Tm1 cell line treated with increased concentrations
of the demethylanting agent 5′-Aza-2-deoxycytidine (5′-Aza-dCR) for 72 h showing that galectin-3 expression was
only restored with the largest concentration of 5′-Aza-dCR in PCR. (D) Analysis. Decreased methylation in
galectin-3 promoter sequence after treatment of Tm1 cells
with 10 lmol/L of 5′-Aza-dCR. Tm1 cells were stably
transfected with 1 µg of human galectin-3 gene cloned in
pEF1-neo/gal-3 (G3) or pEF1-neo (N3) in RPMI contain-
ing 5% of fetal bovine serum and geneticin, G418 (Sigma)
1 mg/mL. (F) The western blotting assay shows that
galectin-3 were expressed in Melan-A cells as well as in
Tm1G3 or pEF1-neo/gal-3 (G3) cells.
Figure S2. All DEG’s can be seen in Heatmaps where
each square represent one independent animal where red
indicates increase and blue indicates decrease. The differ-
entially expressed genes (DEG’s) in the five comparisons
(listed in the table) showing no differences in gene
expression profile between WT and KO animals. The
comparisons: WTG3 versus WTN3 and KOG3 versus
KON3 showed differentially expressed transcripts and the
transcripts identified as differentially expressed were
determined with adjusted P < 0.1 and fold change >1.3.The Venn diagram shows that 11 transcripts (intersec-
tion) sustain similar DEG’s in both models. Independent
DEG’s were observed in just WTG3 versus WTN3 (33) or
KOG3 versus KON3 (9) as represented in the diagram.
Figure S3. Evaluation of VEGFR2 and phosphorilated-
VEGFR2 (PY1214) which as pro-angiogenic receptor of
VEGF mediators. The expression was detected by immu-
noblotting from total tumors protein extraction (20 µg/lane). Each lane represented one representative result
from a number of animals/group (n were represented
inside the legend). Densitometric analysis was performed
using ImageJ and the results in each graph corresponded
to mean � SEM and the results were analyzed by t
unpaired test, two-tailed with *P < 0.1; **P < 0.01 and
***P < 0.001.
Figure S4. (A) Western blotting detection of galectin-3 of
WT-BMDM and (B) Tm1N3 mock-cells or Tm1G3 galec-
tin-3 transfected cells of total protein cells extractions
(50 lg/lane) after TGFb1 stimuli (0, 25, 50, 100 ng/mL).
These results were representative of two independent
experiments. The number above each lane represents the
ª 2014 The Authors. Cancer Medicine published by John Wiley & Sons Ltd. 213
C. M. L. Machado et al. Galectin-3 boosts VEGF and TGFb1 pathways

galectin-3/b-actin ratio from densitometry analysis were
performed using ImageJ.
Figure S5. No significant differences in IL4, IL10,
IL12p40, and INFc mRNA. These results were expression
levels from three distinct individuals. The graphs corre-
sponded to mean � SEM from three distinct animals in
each group and the results were analyzed by t unpaired
test.
Figure S6. Immunofluorescence for CD68+ cells (in
green) in WTG3, WTN3, KOG3 and KON3 tumors. Note
CD68+ inner area macrophages (above) and peripherical
macrophages (bellow) tumor-associated cells. The graphs
corresponded to mean � SEM from three distinct ani-
mals in each group and the results were analyzed by
t unpaired test.
Table S1. List of primers for semi-quantitative PCR and
qPCR.
Data S1. Supplementary materials and methods.
214 ª 2014 The Authors. Cancer Medicine published by John Wiley & Sons Ltd.
Galectin-3 boosts VEGF and TGFb1 pathways C. M. L. Machado et al.