
Silence of Hippo Pathway Associates with Pro-Tumoral ... - MDPI
16
cells Article Silence of Hippo Pathway Associates with Pro-Tumoral Immunosuppression: Potential Therapeutic Target of Glioblastomas Eui Hyun Kim 1,2 , Bo Hwa Sohn 1 , Young-Gyu Eun 1,3 , Dong Jin Lee 1,4 , Sun Young Yim 1,5 , Seok-Gu Kang 2 and Ju-Seog Lee 1, * 1 Department of Systems Biology, Division of Cancer Medicine, Unit 950, The University of Texas MD Anderson Cancer Center, 1515 Holcombe Blvd, Houston, TX 77030, USA; [email protected] (E.H.K.); [email protected] (B.H.S.); [email protected] (Y.-G.E.); [email protected] (D.J.L.); [email protected] (S.Y.Y.) 2 Department of Neurosurgery, Severance Hospital, Brain Tumor Center, Yonsei University College of Medicine, Seoul 03722, Korea; [email protected] 3 Department of Otolaryngology—Head and Neck Surgery, School of Medicine, Kyung Hee University, Seoul 02447, Korea 4 Department of Otolaryngology—Head and Neck Surgery, School of Medicine, Hallym University, Seoul 24252, Korea 5 Division of Gastroenterology and Hepatology, Department of Internal Medicine, Korea University College of Medicine, Seoul 136-701, Korea * Correspondence: [email protected]; Tel.: +82-713-834-6154; Fax: +82-713-563-4235 Received: 2 June 2020; Accepted: 21 July 2020; Published: 23 July 2020 Abstract: The critical role of the Hippo pathway has been recently investigated in various cancers, but little is known about its role in glioblastoma (GBM). In order to evaluate the clinical relevance of the Hippo pathway in GBM, we generated a core gene expression signature from four different previously-established silence of Hippo pathway (SOH) signatures. Based on a newly generated core SOH signature, a SOH and active Hippo pathway (AH) was predicted in GBM samples from The Cancer Genome Atlas (TCGA) and validated in a separate cohort. A comparative analysis was performed on multi-panel genomic datasets from TCGA and the possible association of SOH with immune activity and epithelial mesenchymal transition was also evaluated. The SOH signature was associated with poor prognosis in GBM in both cohorts. Expression levels of CTGF and CYR61, the most reliable and well-known downstream targets of YAP1, were markedly increased in the SOH subgroup of GBM patients. SOH signature was strongly associated with a high immune signature score and mesenchymal features. Genes differentially expressed between SOH and AH groups revealed many markers for inhibitory immune checkpoints and M2-polarized macrophages were upregulated in the SOH subgroup, suggesting that SOH may induce the resistance of cancer cells to host immune response in GBM. In summary, SOH is significantly associated with the poor prognosis of GBM patients and is possibly mediated by pro-tumoral immunosuppression. Keywords: glioblastoma; Hippo pathway; immune checkpoint; immune signature; macrophage; M2 polarization 1. Introduction Glioblastoma (GBM) is the most deadly cancer that develops in the central nervous system. Since 2005, concomitant and maintenance treatment with temozolomide and radiotherapy has been the standard treatment for patients with newly diagnosed GBM [1]. Most chemotherapeutic and targeted Cells 2020, 9, 1761; doi:10.3390/cells9081761 www.mdpi.com/journal/cells
-
Upload
khangminh22 -
Category
Documents
-
view
2 -
download
0
Transcript of Silence of Hippo Pathway Associates with Pro-Tumoral ... - MDPI
cells
Article
Silence of Hippo Pathway Associates withPro-Tumoral Immunosuppression: PotentialTherapeutic Target of Glioblastomas
Eui Hyun Kim 1,2 , Bo Hwa Sohn 1, Young-Gyu Eun 1,3 , Dong Jin Lee 1,4, Sun Young Yim 1,5,Seok-Gu Kang 2 and Ju-Seog Lee 1,*
1 Department of Systems Biology, Division of Cancer Medicine, Unit 950, The University of Texas MDAnderson Cancer Center, 1515 Holcombe Blvd, Houston, TX 77030, USA; [email protected] (E.H.K.);[email protected] (B.H.S.); [email protected] (Y.-G.E.); [email protected] (D.J.L.);[email protected] (S.Y.Y.)
2 Department of Neurosurgery, Severance Hospital, Brain Tumor Center, Yonsei University College ofMedicine, Seoul 03722, Korea; [email protected]
3 Department of Otolaryngology—Head and Neck Surgery, School of Medicine, Kyung Hee University,Seoul 02447, Korea
4 Department of Otolaryngology—Head and Neck Surgery, School of Medicine, Hallym University,Seoul 24252, Korea
5 Division of Gastroenterology and Hepatology, Department of Internal Medicine, Korea University College ofMedicine, Seoul 136-701, Korea
* Correspondence: [email protected]; Tel.: +82-713-834-6154; Fax: +82-713-563-4235
Received: 2 June 2020; Accepted: 21 July 2020; Published: 23 July 2020�����������������
Abstract: The critical role of the Hippo pathway has been recently investigated in various cancers,but little is known about its role in glioblastoma (GBM). In order to evaluate the clinical relevanceof the Hippo pathway in GBM, we generated a core gene expression signature from four differentpreviously-established silence of Hippo pathway (SOH) signatures. Based on a newly generatedcore SOH signature, a SOH and active Hippo pathway (AH) was predicted in GBM samples fromThe Cancer Genome Atlas (TCGA) and validated in a separate cohort. A comparative analysis wasperformed on multi-panel genomic datasets from TCGA and the possible association of SOH withimmune activity and epithelial mesenchymal transition was also evaluated. The SOH signaturewas associated with poor prognosis in GBM in both cohorts. Expression levels of CTGF and CYR61,the most reliable and well-known downstream targets of YAP1, were markedly increased in the SOHsubgroup of GBM patients. SOH signature was strongly associated with a high immune signaturescore and mesenchymal features. Genes differentially expressed between SOH and AH groupsrevealed many markers for inhibitory immune checkpoints and M2-polarized macrophages wereupregulated in the SOH subgroup, suggesting that SOH may induce the resistance of cancer cells tohost immune response in GBM. In summary, SOH is significantly associated with the poor prognosisof GBM patients and is possibly mediated by pro-tumoral immunosuppression.
Keywords: glioblastoma; Hippo pathway; immune checkpoint; immune signature; macrophage;M2 polarization
1. Introduction
Glioblastoma (GBM) is the most deadly cancer that develops in the central nervous system.Since 2005, concomitant and maintenance treatment with temozolomide and radiotherapy has been thestandard treatment for patients with newly diagnosed GBM [1]. Most chemotherapeutic and targeted
Cells 2020, 9, 1761; doi:10.3390/cells9081761 www.mdpi.com/journal/cells
Cells 2020, 9, 1761 2 of 16
agents have failed to demonstrate superiority to this regimen, mainly because of tumor heterogeneityand the blood–brain barrier [2].
The Hippo pathway is known to play a critical role in the regulation of tissue homeostasis, organ sizecontrol, and stem cell renewal [3,4]. Moreover, an increasing number of reports have suggested thatthe Hippo pathway contributes to cancer development and progression [3,5]. The kinase complex,including STK3/4 (), SAV1, and LATS1/2, is the core functional component of the pathway, inhibiting theoncogenic transcription activators YAP1 and TAZ (also known as WWTR1) through phosphorylation.When YAP1 becomes unphosphrorylated, it enters a nucleus and activates various transcriptionalfactors such as TEAD and SMAD, increasing gene expression involved in cell proliferation andsurvival [6]. CYR61, CTGF and ANKRD1 are the most well-known downstream targets of YAP1 [6,7].Despite numerous observations that the Hippo pathway is involved in various cancers [8], its rolein the development and progression of GBM has not been properly addressed, and the clinicalsignificance of the inactivation of the Hippo pathway has not been fully evaluated. Although theinactivation of the Hippo pathway is generally associated with mutations in the Hippo pathwaycomponents and the copy number amplification of YAP1, these are extremely rare in GBM (cBioPortal,http://www.cbioportal.org/).
In our previous studies [9–11], we established gene expression signatures reflecting SOH instomach, liver, ovarian, and colorectal cancers and demonstrated that SOH signatures were associatedwith poor prognosis in these four cancers. In the current study, by integrating four different SOHsignatures from different cancers, we identified a core SOH gene expression signature that was commonto all four cancer types and applied this core SOH signature to GBM tumors to assess the clinicalrelevance of the Hippo pathway in GBM.
2. Materials and Methods
2.1. General Analytic Methods
To generate the core silence of Hippo pathway (SOH) signature, we used four SOH gene expressionsignatures from our previous studies in which the role of the Hippo pathway was investigated infour different cancers: colorectal, liver, ovarian, and stomach cancers [9–11]. Gene expression data forcolorectal, liver, ovarian, stomach cancers, and glioblastoma (GBM) from The Cancer Genome Atlas(TCGA) project were obtained from a data portal site (https://tcga-data.nci.nih.gov). For validation,expression data from another GBM dataset (GSE16011) were used (http://www.ncbi.nlm.nih.gov/geo).Molecular characteristics of GBM tumors were retrieved from previous TCGA publications [12].BRB-ArrayTools (http://linus.nci.nih.gov/BRB-ArrayTools.html) was used to analyze gene expressiondata [13]. A heatmap was generated using Cluster and TreeView [14]. Other statistical analyses wereperformed in the R language (http://www.r-project.org). We used the Bayesian covariate compoundpredictor (BCCP) algorithm, which was described previously [15]. Survival analysis was performedusing the Kaplan–Meier method to compare groups. p values less than 0.05 were considered statisticallysignificant unless otherwise indicated.
2.2. Generation of a Core SOH Signature and Validation in GBM Datasets
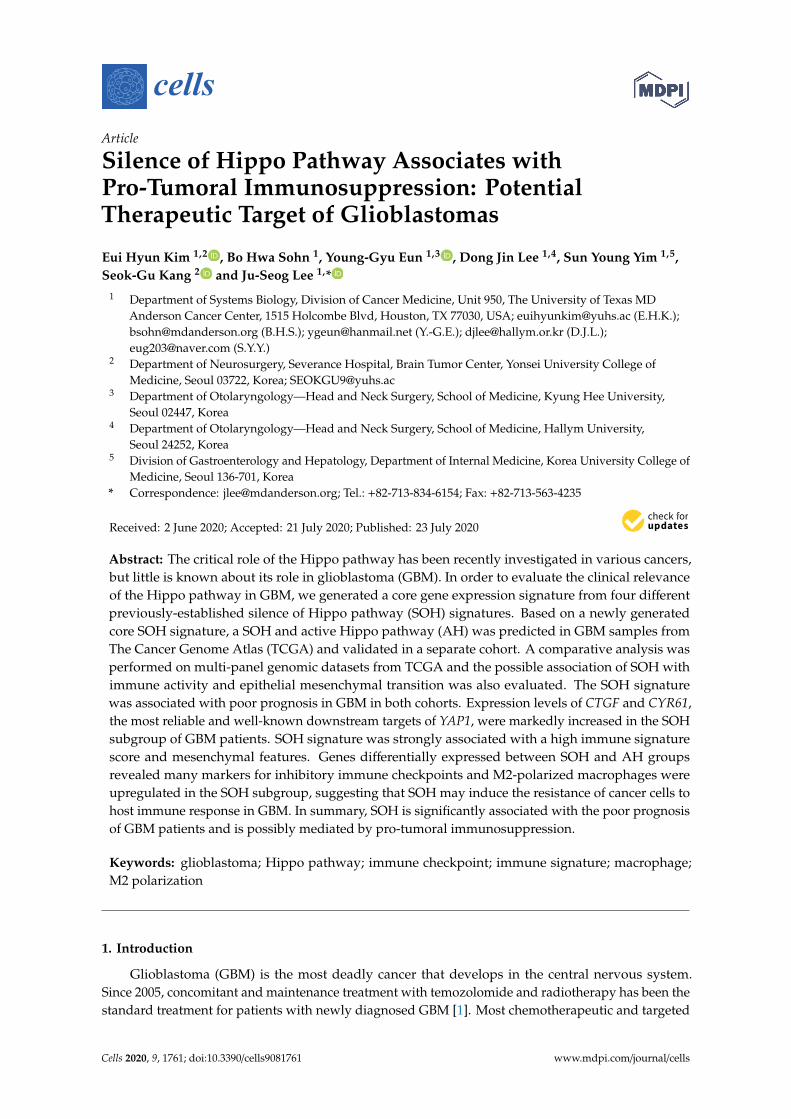
A three-step approach was applied to generate the core SOH signature (Figure 1).First, previously established SOH gene expression signatures from four cancer types were applied
to corresponding RNA-seq data from TCGA using the Bayesian covariate compound predictor (BCCP)algorithm, as described in previous studies [16–19]. Tumor sample data from TCGA comprised 262stomach tumors, 193 liver tumors, 266 ovarian tumors, and 286 colorectal tumors. Gene expression datafrom the original signatures and TCGA were re-normalized by standardization before the predictionmodel was applied. Tumors were then stratified into SOH or active Hippo pathway (AH) subgroupsaccording to corresponding SOH signatures. Second, genes differentially expressed between the SOHand AH subgroups in each TCGA dataset were selected using the Student t-test with a cutoff of
Cells 2020, 9, 1761 3 of 16
p < 0.001 and at least a two-fold difference. This yielded 5585 genes for stomach cancer, 5988 genes forliver cancer, 4127 genes for ovarian cancer, and 5859 genes for colorectal cancer. We then selected the689 genes that were common to all four gene lists for the core SOH signature.
TCGA Cohorts
Stomach Cancer(n = 262)
Colorectal Cancer(n = 286)
Ovarian Cancer(n = 266)
Liver Cancer(n = 193)
SOH Signatures AHSOH
Stomach Cancer Colorectal CancerOvarian CancerLiver Cancer
SOH: 110: 152AH
SOH: 46: 147AH
SOH: 135: 131AH
SOH: 94: 192AH
BCCP
5585 genes 5988 genes 4127 genes 5859 genes
P < 0.001
689
Core SOH Signature
Stomach Cancer Ovarian CancerLiver Cancer Colorectal Cancer
1
2
3
CTGFCYR61
Figure 1. Schematic overview of the workflow for generation of the core silence of Hippo (SOH) geneexpression signature. Step 1: original SOH gene expression signatures from each cancer type wereapplied to corresponding gene expression data from The Cancer Genome Atlas (TCGA) using theBayesian covariate compound predictor (BCCP) algorithm. Tumors in TCGA were stratified into SOHor AH (active Hippo pathway) subgroups according to the corresponding SOH signature from eachcancer type. Step 2: differentially expressed genes between the SOH and AH subgroups in each cancertype were identified by t-test (p < 0.001). Step 3: genes common to all four cancers were selected for thecore SOH signature (689 genes).
The core SOH signature generated from the four cancer types was used as a training set for furtheranalysis to assess the clinical relevance of the SOH signature in GBM. Briefly, gene expression data in thistraining set were combined to form a classifier according to the BCCP algorithm. The robustness of theclassifier was estimated using a misclassification rate determined during leave-one-out cross-validationin the training set. Then, the new BCCP classifier (689 genes in 1007 samples) estimated the likelihood
Cells 2020, 9, 1761 4 of 16
that individual samples from GBM expression data have either the SOH or AH signature, according toa Bayesian probability with a 0.5 cutoff. After stratification of tumors, the prognostic significance wasestimated using Kaplan–Meier analysis. The same prediction was performed for 172 samples fromTCGA including 154 primary and 13 recurrent GBMs and five samples of normal brain tissue.
2.3. Genomic Analysis of TCGA Cohort Data
Among 154 primary GBM samples with gene expression data (Illumina HiSeq 2000 RNASequencing platform) retrieved from TCGA, copy number variation data were available in 148 samplesand somatic mutation data were available in 147 samples. GISTIC 2.0 copy number variation data wereused to generate a heatmap and graph showing the difference between the SOH and AH subgroups [20].A previous TCGA study identified 71 significantly mutated genes in GBM, selected with a mutationfrequency above background with a q-value of <0.1 [12]. After excluding five genes in which nomutation was found in any of the 154 samples, we compared the number of mutations per samplebetween the two subgroups using the chi-square test.
2.4. Proteomics of TCGA Cohort Data
Reverse phase protein array (RPPA) data of TCGA samples were obtained from the TCGA RPPAcore at The University of Texas MD Anderson Cancer Center (Houston, TX, USA). Among the 154primary GBM samples used in our study, RPPA data were available in 72 samples. The differencesin protein expression levels between the two subgroups were evaluated using the Student t-test andp < 0.01 was considered statistically significant.
2.5. Comparison of mRNA Expression Levels and Pathway Analysis
The mRNA expression levels of Hippo pathway-related genes and Hippo target genes YAP1and TAZ were compared between the SOH and AH subgroups in two cohorts: TCGA and GSE16011.The expression level of CTGF, CYR61, and ANKRD1, the most reliable and well-known downstreamtargets of YAP1 were also compared between two subgroups [7]. Markers for macrophages and theirpolarized subtypes were selected on the basis of findings from previous studies, and differentialgene expression of these markers between the SOH and AH subgroups was investigated [21,22].For comparative analysis of differential expression of inhibitory immune checkpoints between the SOHand AH subgroups in TCGA and GSE16011, we retrieved the list of inhibitory immune checkpointmolecules from a previous study [23].
For pathway analysis, differentially expressed genes were selected by comparing mRNA expressionlevels of SOH and AH in TCGA samples using the Student t-test (p < 0.001) and at least a two-folddifference. Data were analyzed using QIAGEN’s Ingenuity Pathway Analysis (IPA) (QIAGEN,Redwood City, CA, USA; www.qiagen.com/ingenuity).
2.6. Immunohistochemistry on GBM Tissue
We retrieved the glioma dataset from The Human Protein Atlas (https://www.proteinatlas.org/)and compared immunohistochemical (IHC) stains for YAP1 and PD-1 in 7 matched GBM samples.Three GBM samples with positive IHC stain for nuclear YAP1 were considered as SOH and comparedwith other 4 AH GBM samples. The correlation between YAP1 and PD-1 were evaluated by χ2 test.
2.7. Immune Signature Score (ISS) and Leukocyte Subset Analysis
The algorithm to generate the ISS was described in our previous study [24]. Briefly, a previouslyidentified 105-gene immune signature was used to generate ISS in GBM samples in the GSE16011and TCGA datasets. Patients were stratified into high-ISS or low-ISS groups with an ISS cutoff of 0.5.To assess the activity of immune cells in GBM tissues, we carried out a meta-analysis with CIBERSORT(https://cibersort.stanford.edu), which can estimate the proportion of immune cells in a tumor mass
Cells 2020, 9, 1761 5 of 16
from mRNA expression data [25]. Analyses were performed with 100 permutations using defaultstatistical parameters.
2.8. Transforming Growth Factor Beta (TGF-β) Signature
The TGF-β signature was obtained from a previous study in which GBM tumorspheres weretreated with galunisertib (LY2157299), a well-known TGF-β receptor 1 kinase inhibitor (GSE23935) [26].A total of 284 differentially expressed genes was selected (p < 0.001) and used to construct a classifier.One hundred fifty-four GBM samples were later dichotomized into active TGF-β and inactive TGF-βsubgroups, with a 0.5 cutoff. Associations between the TGF-β signature and the core SOH signatureand previously established molecular subtypes were evaluated.
2.9. Epithelial–Mesenchymal Transition Signature
In order to classify 154 GMB samples into high and low epithelial–mesenchymal transition(EMT)-associated groups, 64-gene list was obtained from previous study on SNAI2-induced EMT [27].Briefly, the average expression level of these 64 genes, which is referred as EMT metagene score in ourstudy, was calculated in each sample of TCGA cohort. According to EMT metagene score, the sampleswere aligned and its association with Hippo signature and previously established molecular subtypeswas evaluated.
3. Results
3.1. Clinical Significance of Inactivation of the Hippo Pathway in GBM
Previous studies showed that the activity of the Hippo pathway is best reflected in transcriptome,as final effectors of the Hippo pathway are transcription factors such as YAP1 and TAZ [9–11]. For a betterunderstanding of the underlying biology related to inactivation of the Hippo pathway (or activation ofYAP1/TAZ) in cancer, we generated a core SOH gene expression signature by re-analyzing previouslyestablished SOH signatures from stomach, liver, ovarian, and colorectal cancers, as described inMaterials and Methods (Figure 1). Interestingly, the vast majority of genes in the core SOH signaturewere upregulated in the SOH subgroups across the four cancer types, suggesting that many of thesegenes might be direct targets of YAP1/TAZ, which are best known as transcription activators. In fact,the best known direct downstream targets of YAP1/TAZ, such as CTGF and CYR61 [7], were significantlyupregulated in the SOH subgroups.
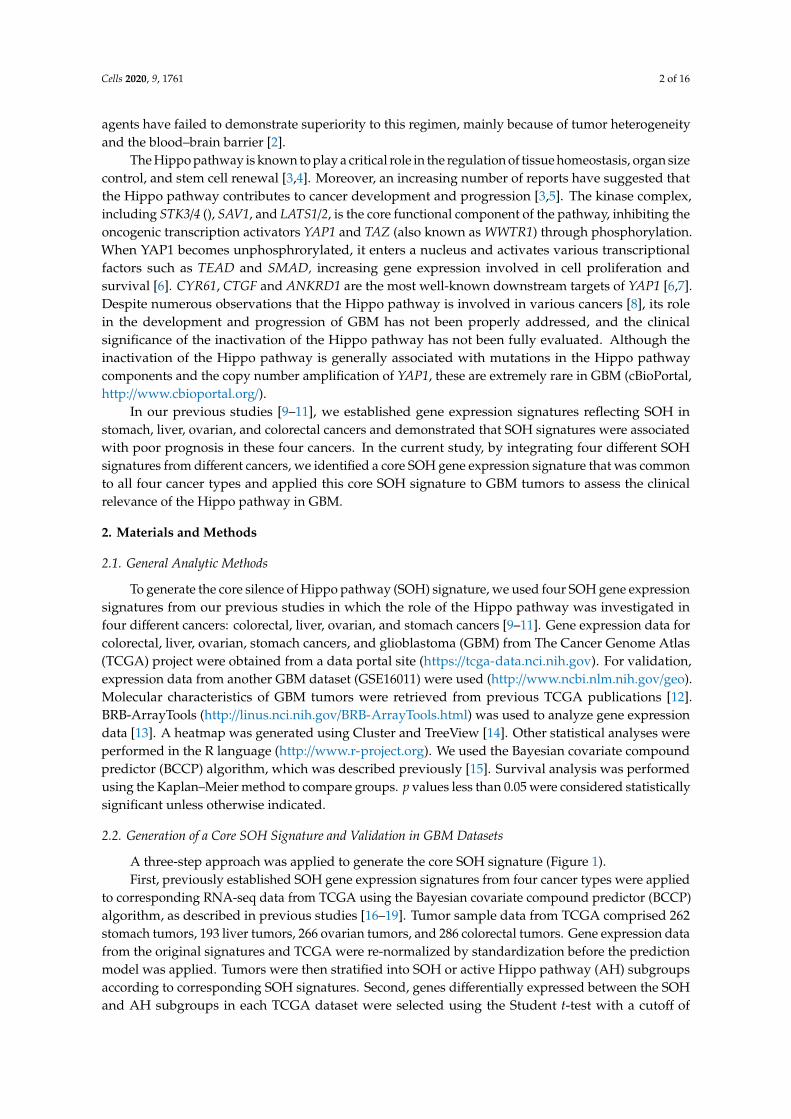
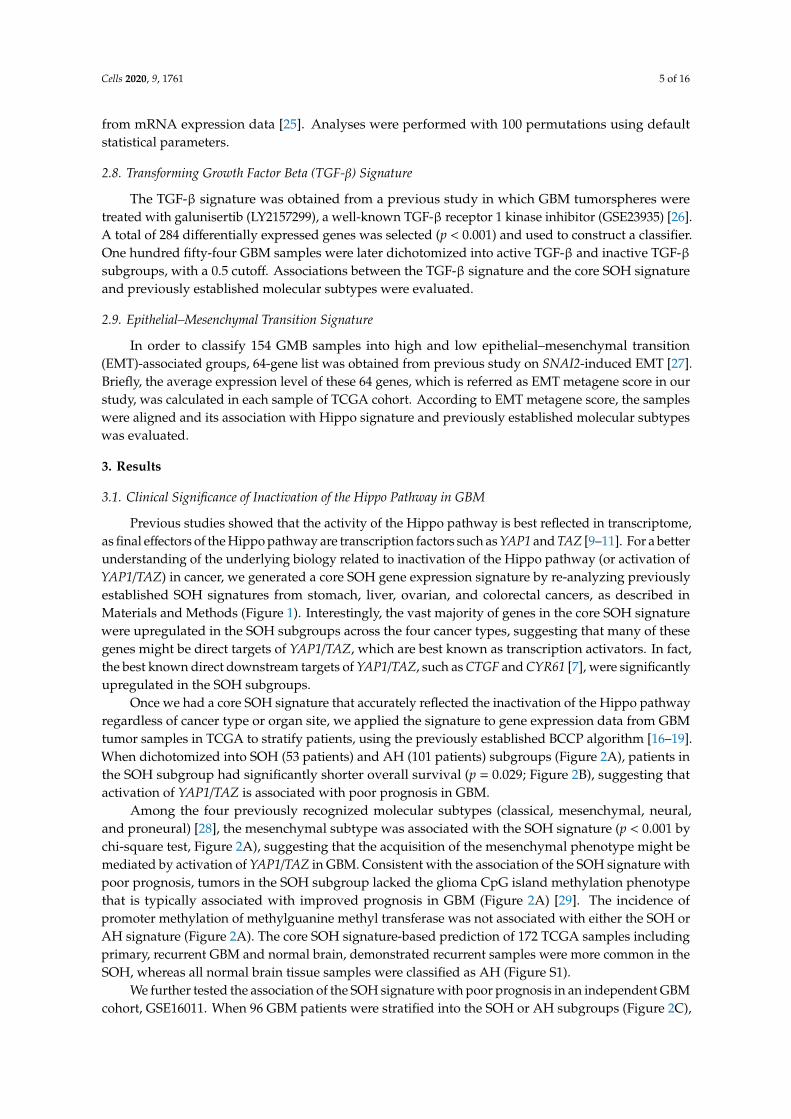
Once we had a core SOH signature that accurately reflected the inactivation of the Hippo pathwayregardless of cancer type or organ site, we applied the signature to gene expression data from GBMtumor samples in TCGA to stratify patients, using the previously established BCCP algorithm [16–19].When dichotomized into SOH (53 patients) and AH (101 patients) subgroups (Figure 2A), patients inthe SOH subgroup had significantly shorter overall survival (p = 0.029; Figure 2B), suggesting thatactivation of YAP1/TAZ is associated with poor prognosis in GBM.
Among the four previously recognized molecular subtypes (classical, mesenchymal, neural,and proneural) [28], the mesenchymal subtype was associated with the SOH signature (p < 0.001 bychi-square test, Figure 2A), suggesting that the acquisition of the mesenchymal phenotype might bemediated by activation of YAP1/TAZ in GBM. Consistent with the association of the SOH signature withpoor prognosis, tumors in the SOH subgroup lacked the glioma CpG island methylation phenotypethat is typically associated with improved prognosis in GBM (Figure 2A) [29]. The incidence ofpromoter methylation of methylguanine methyl transferase was not associated with either the SOH orAH signature (Figure 2A). The core SOH signature-based prediction of 172 TCGA samples includingprimary, recurrent GBM and normal brain, demonstrated recurrent samples were more common in theSOH, whereas all normal brain tissue samples were classified as AH (Figure S1).
We further tested the association of the SOH signature with poor prognosis in an independent GBMcohort, GSE16011. When 96 GBM patients were stratified into the SOH or AH subgroups (Figure 2C),
Cells 2020, 9, 1761 6 of 16
Kaplan–Meier plots showed a significant association between the gene signature and overall survival(p = 0.027, Figure 2D), strongly supporting the robustness of the signature and association of YAP1/TAZactivation with poor prognosis in GBM.
Mesenchymal
SOHAH
NeuralClassical
ProneuralUndetermined
MGMT methylatedMGMT unmethylated
G-CIMPnon G-CIMPUndetermined
Undetermined
Pro
bab
ility
OS (months)
TCGA
GSE16011
0 10 20 30 40 50
0.0
0 50 100 150
OS (months)
A
C
B
D
SOHAH
P = 0.029
P = 0.027
SOHAH
0.2
0.4
0.6
0.8
1.0
Pro
babili
ty
0.0
0.2
0.4
0.6
0.8
1.0
BCCP
BCCP
SubtypeG-CIMPMGMT
SOH
AH
Figure 2. Association of the silence of Hippo pathway (SOH) signature with poor prognosis in patientswith glioblastoma (GBM). (A) Heat map of gene expression patterns of GBM tumor samples from TheCancer Genome Atlas (TCGA; n = 154), which were stratified according to core SOH signature by theBayesian covariate compound predictor (BCCP) classifier. Of 154 patient samples, 53 were placed inthe SOH subgroup and 101 were placed in the active Hippo (AH) subgroup. The data are presentedin matrix format in which rows represent individual genes and columns represent individual tumorsamples. Samples are arranged according to SOH probability from BCCP. Mesenchymal subtypeswere more common in the SOH subgroup, whereas proneural subtypes were more abundant in theAH subgroup (p < 0.001). The incidence of glioma CpG island methylation phenotype (G-CIMP) andpromoter methylation of methylguanine methyl transferase (MGMT) are indicated. (B) Kaplan–Meierplots of overall survival (OS) of patients in the SOH and AH subgroups in TCGA. (C) Heatmap of geneexpression data from GBM tumors in GSE16011 (44 SOH and 52 AH). (D) Kaplan–Meier plots of OS ofpatients in the SOH and AH subgroups in GSE16011. p values were obtained using the log-rank test.
3.2. Genomic and Proteomic Characteristics Associated with the SOH Signature
In TCGA, somatic mutation analysis revealed that overall somatic mutation burden was notsignificantly different between the SOH and AH subgroups or among the four previously recognizedmolecular subtypes (Figure S2). Copy number variations were not significantly different betweenthe SOH and AH subgroups either (Figure S3). In the analysis on proteomic characteristics of GBMby using RPPA data, we identified 48 protein features associated with the SOH signature (p < 0.01;Figure S4).
Cells 2020, 9, 1761 7 of 16
3.3. Molecular Characteristics Associated with the SOH Signature
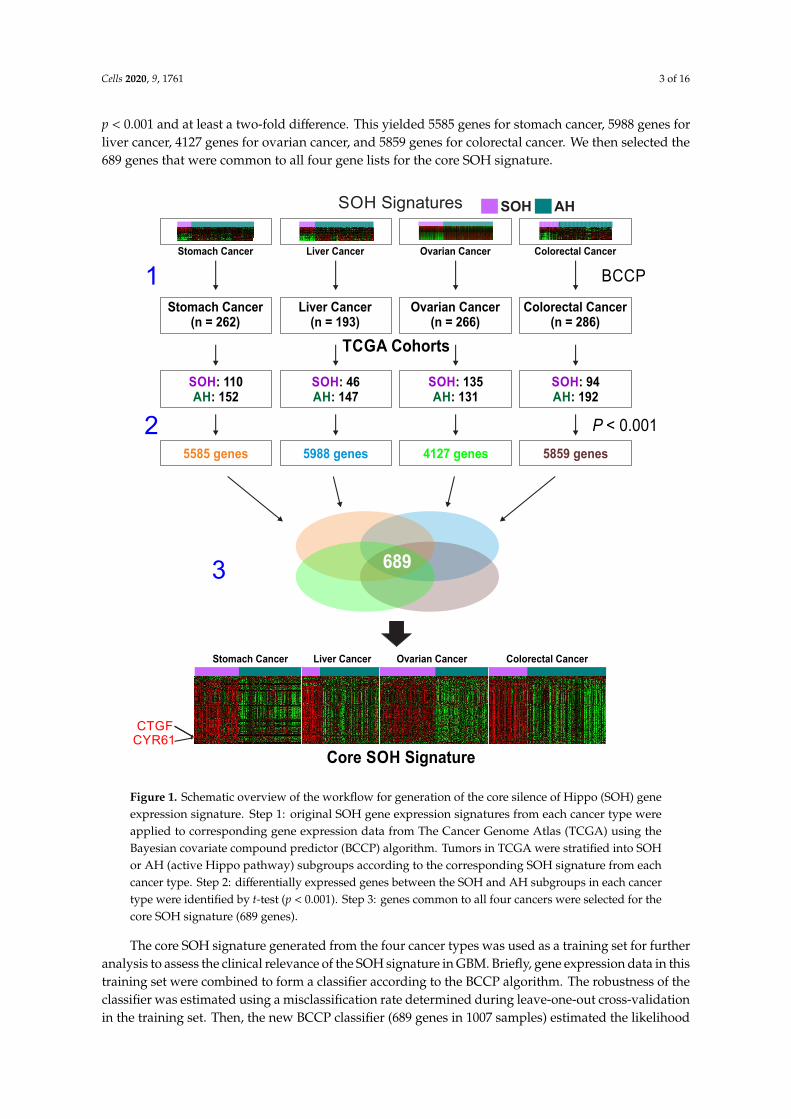
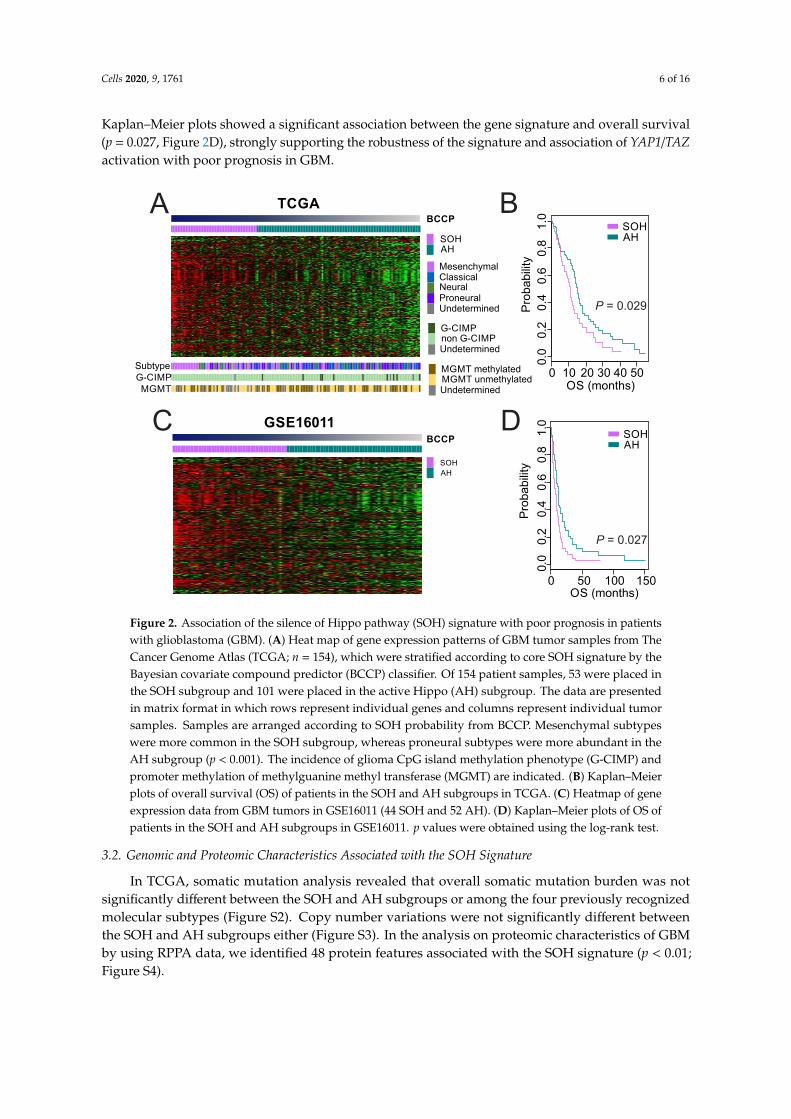
We next identified genes whose expression was significantly different between the SOH and AHsubgroups (p < 0.001) in TCGA, yielding 904 genes (Table S1). When the gene expression levels ofupstream members of Hippo pathway such as LATS1, LATS2, SAV1 were compared between SOH andAH subgroups, only MST2 and LATS2 were upregulated in SOH subgroup, which revealed that theymay be not the leading cause of YAP1 activation (Figure 3). Expression of YAP1 was not significantlydifferent between the two subgroups, which may be attributed to the fact that regulation of YAP1function largely depends on its phosphorylation state and on the site of the phosphorylation. On thecontrary, expression of TAZ was significantly higher in the SOH subgroup, suggesting that TAZ mayplay more of a role in GBM (Figure 3). Likewise, among four TEAD family members, expression ofTEAD3 and TEAD4 was significantly higher in the SOH subgroup, further supporting isoform-specificactivation of the YAP1/TAZ-TEAD pathway in GBM. Consistent with the increased expression of TAZand TEAD3/4, expression of CTGF and CYR61, the best known downstream targets of YAP1/TAZ [7],were significantly higher in the SOH subgroup than in the AH subgroup. This observation is furthersupported by our finding that expression of CTGF and CYR61 was significantly higher in the SOHsubgroup than in the AH subgroup in an independent cohort of GBM patients (GSE16011; Figure S5).
AH SOH
78
9101112
YAP1
AH SOH
78
910
11
WWTR1 (TAZ)
AH SOH
67
89
LATS1
AH SOH
67
89
LATS2
AH SOH
78
9
AH SOH
910
STK4 (MST1)
AH SOH
89
SAV1
AH SOH
10
11
12
TEAD1
AH SOH
78
910
11
TEAD2
AH SOH
67
89
TEAD3
AH SOH
56
78
9
TEAD4
AH SOH
10
12
14
CTGF
AH SOH
911
13
CYR61
AH SOH
13
5
ANKRD1
YAP/TAZ
Transcriptionfactors
Downstream targets
Upstream Hippo members
STK3 (MST2)
P < 0.001 P < 0.001 P < 0.001
P = 0.103 P = 0.965 p=0.0003 P < 0.001
P = 0.987
P = 0.445 P = 0.010 P = 0.480 P = 0.855 P < 0.001
P < 0.001
Figure 3. Differential gene expression levels of Hippo–YAP pathway-related genes in The CancerGenome Atlas. The expression level of TAZ was elevated in the silence of Hippo (SOH) subgroup,although the gene expression level of YAP1 did not differ between the SOH and active Hippo (AH)subgroups. The SOH subgroup showed higher levels of TEAD3 and TEAD4 gene expression. Above all,the expression level of CTGF and CYR61, the most reliable and well-known downstream targets of YAP1,were markedly increased in the SOH subgroup. Differential gene expression of upstream membersof Hippo pathway showed MST2 and LATS2 are upregulated in SOH subgroup revealing that thesegenes are not responsible for Hippo pathway inactivation.
Cells 2020, 9, 1761 8 of 16
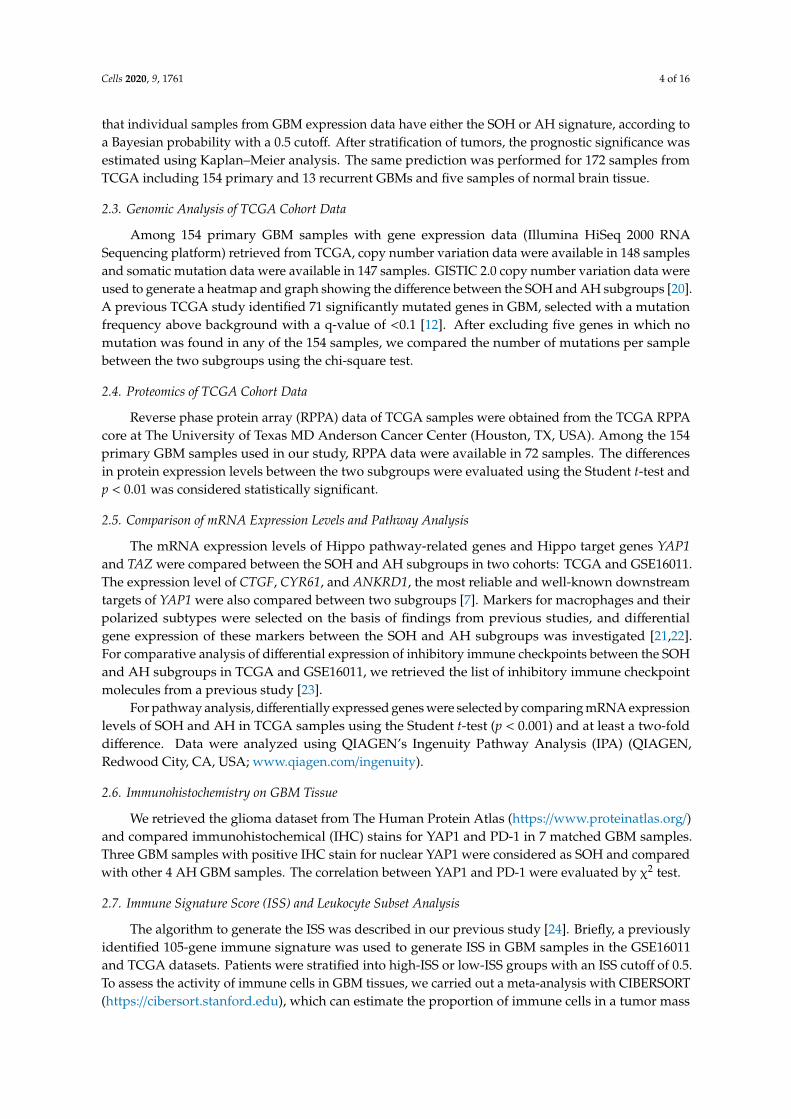
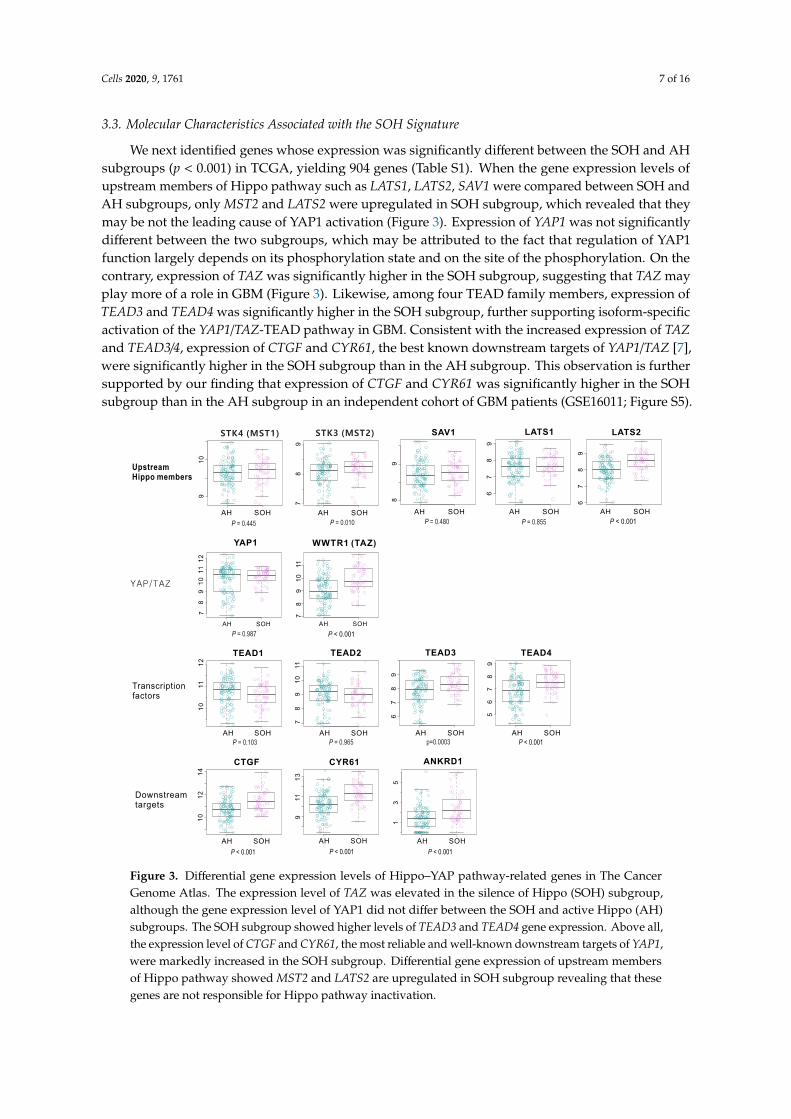
To assess the underlying biology associated with the SOH subgroup, we carried out gene networkanalysis using IPA with 904 differentially expressed genes. Interestingly, many signaling pathwaysrelated to immune response, such as TREM1 signaling, dendritic cell maturation, iCOS-iCOSL signalingin T helper cells, and CD28 signaling in T helper cells, were significantly enriched in the SOH subgroup(Figure 4).
Role of NFAT in Regulation of the Immune Response
Cd28 Signaling in T Helper Cells
Communication between Innate and Adaptive Immune Cells
iCOS-iCOSL Signaling in T Helper Cells
Leukocyte Extravasation Signaling
Acute Phase Response Signaling
Role of Pattern Recognition Receptors in Recognition of Bacteria and Viruses
Role of Osteoblasts, Osteoclasts and Chondrocytes in Rheumatoid Arthritis
IL-10 Signaling
Phagosome formation
T Helper Cell Differentiation
Complement System
Altered T Cell and B Cell Signaling in Rheumatoid ArthritisRole of Macrophages, Fibroblasts and Endothelial Cells in Rheumatoid Arthritis
Atherosclerosis Signaling
Dendritic Cell Maturation
TREM1 Signaling
Agranulocyte Adhesion and Diapedesis
Hepatic Fibrosis / Hepatic Stellate Cell Activation
Granulocyte Adhesion and Diapedesis
P-values (−log10)
0 10 20 30 40
positive z-score
z-score = 0
no activity pattern available
Figure 4. Pathway analysis based on 904 genes differentially expressed between the silence ofHippo (SOH) and active Hippo subgroups in The Cancer Genome Atlas. The top 20 canonicalpathways are shown. Only pathways with significant positive z-score are marked with color. Variousimmune-associated pathways are significantly enriched in the SOH subgroup.
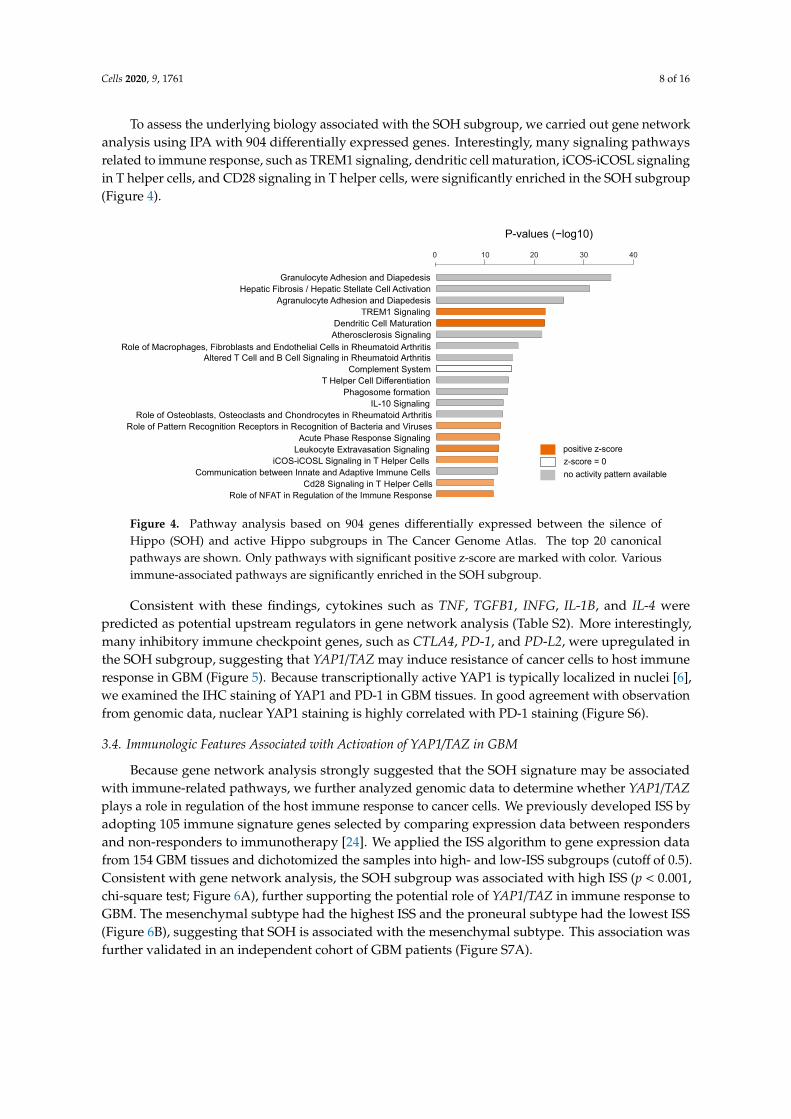
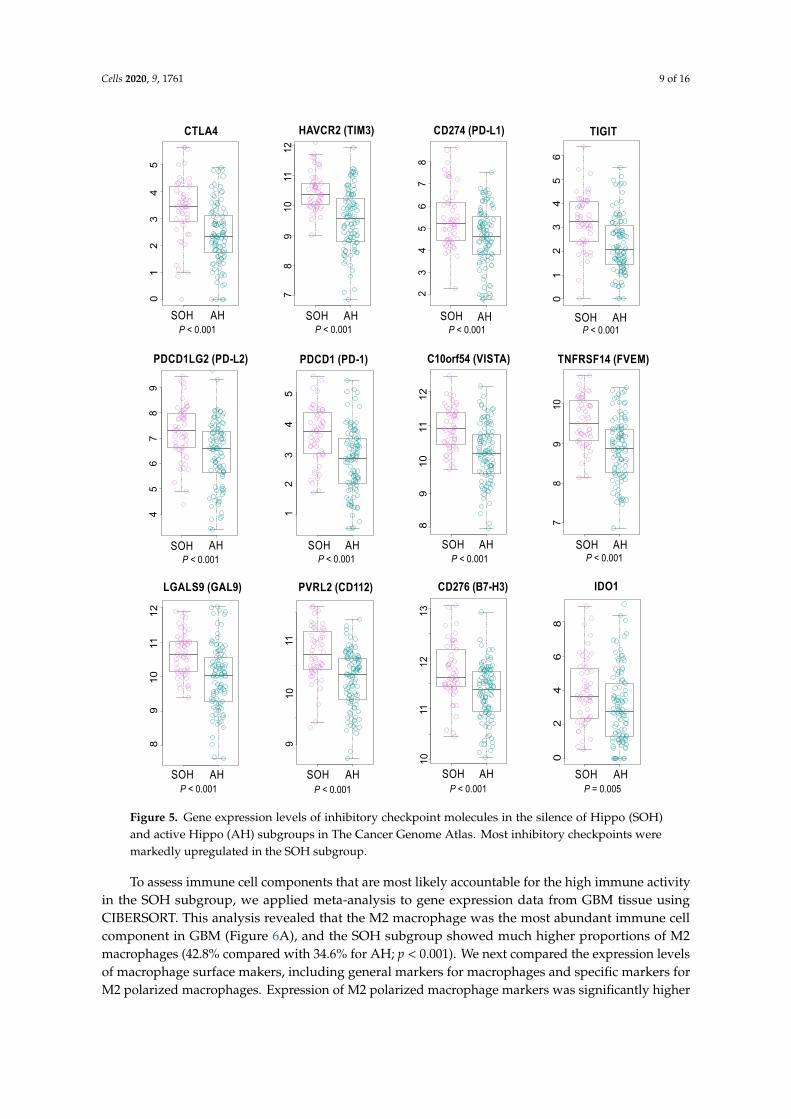
Consistent with these findings, cytokines such as TNF, TGFB1, INFG, IL-1B, and IL-4 werepredicted as potential upstream regulators in gene network analysis (Table S2). More interestingly,many inhibitory immune checkpoint genes, such as CTLA4, PD-1, and PD-L2, were upregulated inthe SOH subgroup, suggesting that YAP1/TAZ may induce resistance of cancer cells to host immuneresponse in GBM (Figure 5). Because transcriptionally active YAP1 is typically localized in nuclei [6],we examined the IHC staining of YAP1 and PD-1 in GBM tissues. In good agreement with observationfrom genomic data, nuclear YAP1 staining is highly correlated with PD-1 staining (Figure S6).
3.4. Immunologic Features Associated with Activation of YAP1/TAZ in GBM
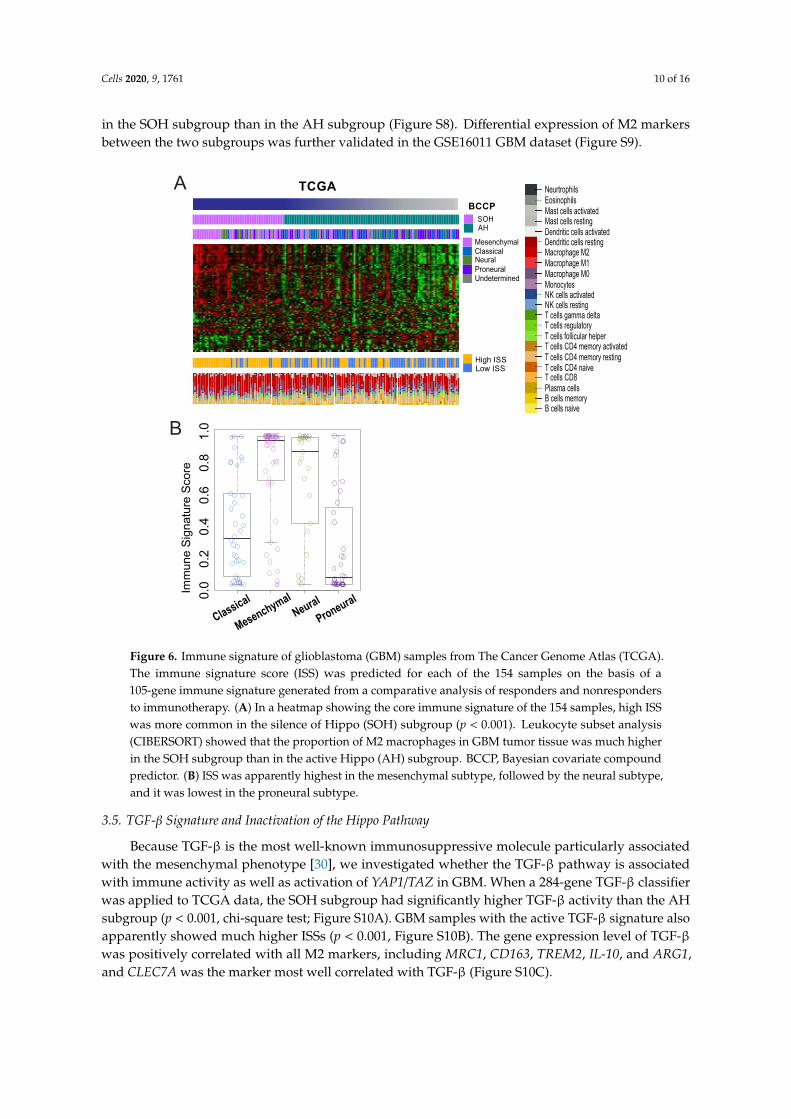
Because gene network analysis strongly suggested that the SOH signature may be associatedwith immune-related pathways, we further analyzed genomic data to determine whether YAP1/TAZplays a role in regulation of the host immune response to cancer cells. We previously developed ISS byadopting 105 immune signature genes selected by comparing expression data between respondersand non-responders to immunotherapy [24]. We applied the ISS algorithm to gene expression datafrom 154 GBM tissues and dichotomized the samples into high- and low-ISS subgroups (cutoff of 0.5).Consistent with gene network analysis, the SOH subgroup was associated with high ISS (p < 0.001,chi-square test; Figure 6A), further supporting the potential role of YAP1/TAZ in immune response toGBM. The mesenchymal subtype had the highest ISS and the proneural subtype had the lowest ISS(Figure 6B), suggesting that SOH is associated with the mesenchymal subtype. This association wasfurther validated in an independent cohort of GBM patients (Figure S7A).
Cells 2020, 9, 1761 9 of 16
0SOH AH
CTLA4
SOH AH
78
91
011
12
HAVCR2 (TIM3)
SOH AH
23
45
67
8
CD274 (PD-L1)
SOH AH
TIGIT
SOH AH
PDCD1LG2 (PD-L2)
SOH AH
PDCD1 (PD-1)
SOH AH
C10orf54 (VISTA)
SOH AH
TNFRSF14 (FVEM)
SOH AH
LGALS9 (GAL9)
SOH AH
PVRL2 (CD112)
SOH AH
02
46
8
IDO1
P < 0.001 P < 0.001 P < 0.001 P < 0.001
P < 0.001 P < 0.001
SOH AH
CD276 (B7-H3)
P < 0.001 P < 0.001
P < 0.001 P < 0.001 P < 0.001 P = 0.005
89
10
11
12
89
10
11
12
78
91
02
34
56
1
23
45
01
45
67
89
23
45
1
10
111
21
3
10
119
0
Figure 5. Gene expression levels of inhibitory checkpoint molecules in the silence of Hippo (SOH)and active Hippo (AH) subgroups in The Cancer Genome Atlas. Most inhibitory checkpoints weremarkedly upregulated in the SOH subgroup.
To assess immune cell components that are most likely accountable for the high immune activityin the SOH subgroup, we applied meta-analysis to gene expression data from GBM tissue usingCIBERSORT. This analysis revealed that the M2 macrophage was the most abundant immune cellcomponent in GBM (Figure 6A), and the SOH subgroup showed much higher proportions of M2macrophages (42.8% compared with 34.6% for AH; p < 0.001). We next compared the expression levelsof macrophage surface makers, including general markers for macrophages and specific markers forM2 polarized macrophages. Expression of M2 polarized macrophage markers was significantly higher
Cells 2020, 9, 1761 10 of 16
in the SOH subgroup than in the AH subgroup (Figure S8). Differential expression of M2 markersbetween the two subgroups was further validated in the GSE16011 GBM dataset (Figure S9).
Mesenchymal
SOHAH
NeuralClassical
ProneuralUndetermined
High ISSLow ISS
BCCP
NeurtrophilsEosinophilsMast cells activatedMast cells restingDendritic cells activatedDendritic cells restingMacrophage M2Macrophage M1Macrophage M0MonocytesNK cells activatedNK cells restingT cells gamma deltaT cells regulatoryT cells follicular helperT cells CD4 memory activatedT cells CD4 memory restingT cells CD4 naiveT cells CD8Plasma cellsB cells memoryB cells naive
TCGA
Classi
cal
Mesen
chymal
Neura
l
Proneu
ral
0.0
0.2
0.4
0.6
0.8
1.0
Imm
une S
ignatu
re S
core
A
B
Figure 6. Immune signature of glioblastoma (GBM) samples from The Cancer Genome Atlas (TCGA).The immune signature score (ISS) was predicted for each of the 154 samples on the basis of a105-gene immune signature generated from a comparative analysis of responders and nonrespondersto immunotherapy. (A) In a heatmap showing the core immune signature of the 154 samples, high ISSwas more common in the silence of Hippo (SOH) subgroup (p < 0.001). Leukocyte subset analysis(CIBERSORT) showed that the proportion of M2 macrophages in GBM tumor tissue was much higherin the SOH subgroup than in the active Hippo (AH) subgroup. BCCP, Bayesian covariate compoundpredictor. (B) ISS was apparently highest in the mesenchymal subtype, followed by the neural subtype,and it was lowest in the proneural subtype.
3.5. TGF-β Signature and Inactivation of the Hippo Pathway
Because TGF-β is the most well-known immunosuppressive molecule particularly associatedwith the mesenchymal phenotype [30], we investigated whether the TGF-β pathway is associatedwith immune activity as well as activation of YAP1/TAZ in GBM. When a 284-gene TGF-β classifierwas applied to TCGA data, the SOH subgroup had significantly higher TGF-β activity than the AHsubgroup (p < 0.001, chi-square test; Figure S10A). GBM samples with the active TGF-β signature alsoapparently showed much higher ISSs (p < 0.001, Figure S10B). The gene expression level of TGF-βwas positively correlated with all M2 markers, including MRC1, CD163, TREM2, IL-10, and ARG1,and CLEC7A was the marker most well correlated with TGF-β (Figure S10C).
Cells 2020, 9, 1761 11 of 16
3.6. Epithelial–Mesenchymal Transition and Inactivation of the Hippo Pathway
When TCGA GBM samples were predicted based on 64 genes of EMT signature, GBM sampleswith SOH signature demonstrated higher EMT metagene scores (Figure S11). Between BCCP value ofSOH and EMT metagene score, there was a strong positive correlation (r = 0.830).
4. Discussion
The inactivation of the Hippo pathway in cancers is mediated by various genetic and epigeneticevents. The Hippo pathway is a very complex regulatory network as reflected by many upstreamregulators in the pathway. However, the vast majority of pathway activity is largely mediated bytwo transcription regulators YAP1 and TAZ. Many previous studies showed that their activity is bestreflected in the transcriptome as they are strong transcription regulators [3,6]. We used transcriptionsignatures adopted from multiple datasets reflecting the inactivation of STK3/4 and SAV1 (key negativeregulators of YAP1 and TAZ) to identify tumors with inactivated Hippo pathways regardless of theirgenetic or epigenetic alterations in the Hippo pathway. In fact, their key transcription targets such asCTGF, CYR61, and ANKRD1 are significantly more expressed in SOH, strongly supporting that thecore SOH signature is a good indicator of Hippo pathway activity.
When we stratified GBM patients based on the core SOH signature, the activation of YAP1/TAZ wasassociated with poor prognosis in GBM. The association was tested and validated in two independentcohorts of patients. A further in-depth analysis of genomic data revealed that activation of YAP1/TAZmight be associated with increased host immune activity. Many inhibitory immune checkpointgenes were upregulated in the SOH subgroup (Figure 5), which possibly results in pro-tumoral T-cellexhaustion in GBM [31,32]. More interestingly, high immune activity in the SOH subgroup wasassociated with an increased fraction of M2 polarized macrophages that can suppress immune cellactivity. Thus, our analysis may provide novel biological insight into the poor prognosis associatedwith the SOH signature in GBM.
The analysis of TCGA data showed that inactivation of the Hippo pathway was more frequentlyobserved in the mesenchymal subtype, suggesting that the inactivation of the Hippo pathway may beassociated with EMT, consistent with previous observations [33]. In order to evaluate the associationof SOH with EMT, we adopted an EMT metagene scoring system from a previous study based on aglioblastoma cell line model [27]. When the EMT metagene scores of each GBM TCGA sample weremeasured based on the expression levels of 64 EMT-related genes, most of the 64 genes were upregulatedin a SOH subgroup (Figure S10). Additionally, we performed the same prediction for 13 samples ofrecurrent GBM and five samples of normal brain tissue, together with the 154 samples of primaryGBM, from TCGA to evaluate the SOH signature in recurrent GBM. Considering that GBM acquiresmesenchymal features at recurrence regardless of the original subtype [28], it is not surprising that mostof the recurrent GBM samples we examined exhibited the SOH signature and all normal brain tissueswere skewed to the AH subgroup (Figure S1). In the RPPA analysis on the TCGA cohort, we identified48 proteins associated with the SOH signature (Figure S4). Among them, we identified 48 proteinfeatures associated with the SOH signature many proteins known to be associated with poor prognosisin GBM, such as SERPINE1, FN1, CAV1, IGFBP2, HSPA1A, and SYK [34–38], were upregulated inthe SOH subgroup, strongly suggesting potential cross-talk between the Hippo pathway and othersignaling pathways associated with poor prognosis in GBM. Although the association of these proteinswith the Hippo pathway has not been investigated extensively, recent reports suggested that some ofthese proteins are possibly controlled by the Hippo pathway [39,40]. More interestingly, the expressionand activation of EGFR was negatively correlated with inactivation of the Hippo pathway, suggestingthat the activation of YAP1 and TAZ might be mutually exclusive with activation of the EGFR pathwayin GBM. The 904 genes differentially expressed between the SOH and AH subgroups, as well as thepathway analysis, strongly suggested that SOH is associated with the activation of many immunemolecules and pathways. Most notably, well-known macrophage-associated genes, including MARCO,FPR2, MRC1, POSTN, CSF3, CD163, and TREM1, were among the most upregulated genes in the
Cells 2020, 9, 1761 12 of 16
SOH subgroup. Our ISS system, which was designed to estimate the probability of response toimmune-based therapy, predicted that GBM samples with the SOH signature had high immuneactivity. Although high immune activity is generally correlated with high mutational burden (increasedneo-antigen presentation) [41], no difference was found in mutational burden between the SOH andAH subgroups, suggesting that GBM with the SOH signature gains high immunogenicity throughmutation-independent mechanisms.
Although tumors with an increased immune signature generally show better prognosis thanthose with decreased immune signatures, we did not observe a survival benefit from high ISS in ourstudy. The in-depth analysis of genomic data suggested that the high ISS in the SOH subgroup may beassociated with the innate immune system, and more specifically, with macrophages. Macrophages areamong the most abundantly recruited immune cells in the tumor microenvironment. Two distinctstates of polarized activation for macrophages have been defined: the classically activated macrophagephenotype (M1) with an antitumor effect and the alternatively-activated macrophage phenotype (M2)with a pro-tumoral and immunosuppressive effect [42,43]. In most solid cancers, M2 macrophagescomprise the majority of tumor-associated macrophages [43], and the proportion of M2 macrophages ishigher in GBM than in any other major cancer [44]. We postulated that tumor-associated macrophagesmay play pro-tumoral roles when the Hippo pathway is inactive, leading to poor prognosis despitethe high overall immune activity in the SOH subgroup. Indeed, mRNA expression of all M2-specificmarkers was upregulated in the SOH subgroup in two independent GBM cohorts. Our observationthat inhibitory immune checkpoint genes showed increased expression in the SOH subgroup alsosupports this hypothesis. Moreover, our hypothesis is in good agreement with previous observationsthat increased tumor-infiltrating lymphocytes and macrophages are most common in the mesenchymalsubtype of GBM, for which survival is the worst among the four subtypes [45]. Recent reports showedthat targeting M2 macrophages in a GBM mouse model led to a remarkable survival benefit byinhibiting CSF-1R, an M2-related marker [46], which also strongly supports our hypothesis.
TGF-β promotes pro-tumoral immunosuppression. As a pleiotropic cytokine, TGF-β maintainsimmune homeostasis through the regulation of all cell types of the innate and adaptive immunesystem [47]. In our pathway analysis, TGF-β was suggested as a key upstream regulator. In particular,TGF-β is known to be a strong inducer of the M2 polarization of macrophages [48]. The criticalrole of TGF-β in the epithelial–mesenchymal transition has also been demonstrated in many cancermodels, including GBM [30,49]. On the basis of this supporting evidence, we postulated that theTGF-β signaling pathway may be associated with the inactivation of the Hippo pathway. The SOHsignature was strongly correlated with the active TGF-β signature, which was also associated withhigh ISS and mesenchymal features. Our results suggest that TGF-β might be another potential targetthat inhibits M2 polarized macrophages in GBM. Currently, there are several TGF-β inhibitors beingtested in clinical trials for several cancer types, including GBM, and the preliminary results have beenencouraging [50].
Our study has several limitations. Since our SOH signature is not derived from GBM tissues,predicted YAP1 activity in GBM might be underestimated due to the lack of expression datareflecting neuronal specific YAP1 activity. Therefore, SOH and its possible crosstalk with the cancermicroenvironment should be further investigated directly based on GBM cell lines and mouse modelsas suggested by Okazaki et al. [51]. Secondly, because this is an association study, which is the mainlimitation of our study, further investigation is needed to verify our hypothesis and to elucidate thepro-tumoral mechanism of M2 macrophages. Furthermore, it is currently unknown if the activationof M2 macrophages is mediated by YAP1/TAZ. Although some of the association from our analysisof genomic data is functionally relevant as evidenced by good correlation between active YAP1 andPD-1 staining of infiltrated cells in IHC staining of GBM tissues, more analysis and experimentalapproaches will be needed for functional validation. Lastly, our signature may be more related toYAP1/TAZ activity than the inactivation of the Hippo pathway, as some of upstream regulators such

Cells 2020, 9, 1761 13 of 16
as MST2 and LATS are more expressed in SOH. YAP1 and TAZ might be activated independent ofupstream regulators.
In summary, GBM showing the SOH signature was associated with an increased ISS, suggestingthat these patients might be good potential candidates for immunotherapy. Many inhibitory immunecheckpoint genes are upregulated in the SOH subgroup, suggesting that YAP1/TAZ may induce theresistance of cancer cells to host immune response in GBM. M2 polarized macrophages may be anotherimportant component of pro-tumoral immunosuppression in GBM with a possible association withSOH, and thus can be another possible target of immunotherapy. Targeting the Hippo pathway andassociated TGF-β pathway might be a useful approach to enhance the clinical benefit of immunotherapyin GBM.
Supplementary Materials: The following are available online at http://www.mdpi.com/2073-4409/9/8/1761/s1,Figure S1: Subgroup prediction in 172 samples of glioblastoma (GBM) from The Cancer Genome Atlas, including154 primary and 13 recurrent GBMs and five samples of normal brain tissue, Figure S2: Mutation status in TheCancer Genome Atlas (TCGA) cohort, Figure S3: Copy number variation in glioblastoma (GBM) in the silence ofHippo (SOH) and active Hippo (AH) subgroups, Figure S4: Reverse phase protein array (RPPA) analysis of 72glioblastoma (GBM) samples from The Cancer Genome Atlas, Figure S5: Gene expression levels of downstreamtargets of YAP1 in GSE16011, Figure S6: Association of YAP1 activity with increased inhibitory immune checkpointactivity in glioblastoma (GBM), Figure S7: Immune signature of GSE16011 samples, Figure S8: Comparison ofgene expression levels of microglia markers between the silence of Hippo (SOH) and active Hippo (AH) subgroupsin The Cancer Genome Atlas, Figure S9: Comparison of gene expression levels of microglia markers betweenthe silence of Hippo (SOH) and active Hippo (AH) subgroups in the GSE16011 cohort, Figure S10: Predictionof the transforming growth factor-β (TGF-β) signature in 154 glioblastoma (GBM) samples from The CancerGenome Atlas (TCGA), Figure S11: Sixty-four genes of epithelial mesenchymal transition (EMT) signature ofTCGA glioblastoma (GBM) cohort, Table S1: Differentially expressed genes between the silence of Hippo andactive Hippo subgroups of glioblastoma in The Cancer Genome Atlas, Table S2: Upstream regulators suggestedby pathway analysis based on 904 genes differentially expressed between the silence of Hippo and active Hipposubgroups of glioblastoma in The Cancer Genome Atlas.
Author Contributions: Conceptualization, J.-S.L. and E.H.K.; Methodology, J.-S.L. and E.H.K.; Software, E.H.K.;Validation, J.-S.L. and E.H.K.; Formal Analysis, E.H.K.; Investigation, E.H.K., B.H.S., Y.-G.E., D.J.L., S.Y.Y., S.-G.K.;Resources, J.-S.L. and E.H.K.; Data Curation, J.-S.L. and E.H.K.; Writing—Original Draft Preparation, E.H.K.;Writing—Review & Editing, J.-S.L.; Visualization, E.H.K.; Supervision, J.-S.L.; Project Administration, J.-S.L.;Funding Acquisition, Not available. All authors have read and agreed to the published version of the manuscript.
Funding: This study was financially supported by the Basic Science Research Program through the NationalResearch Foundation (NRF) of Korea (NRF-2018R1C1B5042687) funded by the Korean Ministry of Science, ICT andFuture Planning and the “Dongwha” Faculty Research Assistance Program of Yonsei University College ofMedicine (6-2018-0073).
Conflicts of Interest: The authors declare no conflict of interest.
References
1. Stupp, R.; Hegi, M.E.; Mason, W.P.; van den Bent, M.J.; Taphoorn, M.J.; Janzer, R.C.; Ludwin, S.K.; Allgeier, A.;Fisher, B.; Belanger, K.; et al. Effects of radiotherapy with concomitant and adjuvant temozolomide versusradiotherapy alone on survival in glioblastoma in a randomised phase III study: 5-year analysis of theEORTC-NCIC trial. Lancet Oncol. 2009, 10, 459–466. [CrossRef]
2. Jue, T.R.; McDonald, K.L. The challenges associated with molecular targeted therapies for glioblastoma.J. Neuro-Oncol. 2016, 127, 427–434. [CrossRef] [PubMed]
3. Piccolo, S.; Dupont, S.; Cordenonsi, M. The biology of YAP/TAZ: Hippo signaling and beyond. Physiol. Rev.2014, 94, 1287–1312. [CrossRef] [PubMed]
4. Sudol, M. Yes-associated protein (YAP65) is a proline-rich phosphoprotein that binds to the SH3 domain ofthe Yes proto-oncogene product. Oncogene 1994, 9, 2145–2152. [PubMed]
5. Yu, F.X.; Zhao, B.; Guan, K.L. Hippo Pathway in Organ Size Control, Tissue Homeostasis, and Cancer. Cell2015, 163, 811–828. [CrossRef] [PubMed]
6. Zhao, B.; Ye, X.; Yu, J.; Li, L.; Li, W.; Li, S.; Yu, J.; Lin, J.D.; Wang, C.Y.; Chinnaiyan, A.M.; et al. TEAD mediatesYAP-dependent gene induction and growth control. Genes Dev. 2008, 22, 1962–1971. [CrossRef]
Cells 2020, 9, 1761 14 of 16
7. Yu, F.-X.; Zhao, B.; Panupinthu, N.; Jewell, J.L.; Lian, I.; Wang, L.H.; Zhao, J.; Yuan, H.; Tumaneng, K.; Li, H.;et al. Regulation of the Hippo-YAP pathway by G-protein coupled receptor signaling. Cell 2012, 150, 780–791.[CrossRef]
8. Harvey, K.F.; Zhang, X.; Thomas, D.M. The Hippo pathway and human cancer. Nat. Rev. Cancer 2013, 13,246–257. [CrossRef]
9. Jeong, W.; Kim, S.B.; Sohn, B.H.; Park, Y.Y.; Park, E.S.; Kim, S.C.; Kim, S.S.; Johnson, R.L.; Birrer, M.;Bowtell, D.S.; et al. Activation of YAP1 is associated with poor prognosis and response to taxanes in ovariancancer. Anticancer Res. 2014, 34, 811–817.
10. Lee, K.W.; Lee, S.S.; Kim, S.B.; Sohn, B.H.; Lee, H.S.; Jang, H.J.; Park, Y.Y.; Kopetz, S.; Kim, S.S.; Oh, S.C.; et al.Significant association of oncogene YAP1 with poor prognosis and cetuximab resistance in colorectal cancerpatients. Clin. Cancer Res. Off. J. Am. Assoc. Cancer Res. 2015, 21, 357–364. [CrossRef]
11. Sohn, B.H.; Shim, J.J.; Kim, S.B.; Jang, K.Y.; Kim, S.M.; Kim, J.H.; Hwang, J.E.; Jang, H.J.; Lee, H.S.; Kim, S.C.;et al. Inactivation of Hippo Pathway Is Significantly Associated with Poor Prognosis in HepatocellularCarcinoma. Clin. Cancer Res. Off. J. Am. Assoc. Cancer Res. 2016, 22, 1256–1264. [CrossRef]
12. Brennan, C.W.; Verhaak, R.G.; McKenna, A.; Campos, B.; Noushmehr, H.; Salama, S.R.; Zheng, S.;Chakravarty, D.; Sanborn, J.Z.; Berman, S.H.; et al. The somatic genomic landscape of glioblastoma.Cell 2013, 155, 462–477. [CrossRef] [PubMed]
13. Simon, R.; Lam, A.; Li, M.C.; Ngan, M.; Menenzes, S.; Zhao, Y. Analysis of gene expression data usingBRB-ArrayTools. Cancer Inform. 2007, 3, 11–17. [CrossRef] [PubMed]
14. Eisen, M.B.; Spellman, P.T.; Brown, P.O.; Botstein, D. Cluster analysis and display of genome-wide expressionpatterns. Proc. Natl. Acad. Sci. USA 1998, 95, 14863–14868. [CrossRef] [PubMed]
15. Ramaswamy, S.; Tamayo, P.; Rifkin, R.; Mukherjee, S.; Yeang, C.H.; Angelo, M.; Ladd, C.; Reich, M.;Latulippe, E.; Mesirov, J.P.; et al. Multiclass cancer diagnosis using tumor gene expression signatures.Proc. Natl. Acad. Sci. USA 2001, 98, 15149–15154. [CrossRef] [PubMed]
16. Lee, J.S.; Chu, I.S.; Mikaelyan, A.; Calvisi, D.F.; Heo, J.; Reddy, J.K.; Thorgeirsson, S.S. Application ofcomparative functional genomics to identify best-fit mouse models to study human cancer. Nat. Genet. 2004,36, 1306–1311. [CrossRef]
17. Lee, J.S.; Heo, J.; Libbrecht, L.; Chu, I.S.; Kaposi-Novak, P.; Calvisi, D.F.; Mikaelyan, A.; Roberts, L.R.;Demetris, A.J.; Sun, Z.; et al. A novel prognostic subtype of human hepatocellular carcinoma derived fromhepatic progenitor cells. Nat. Med. 2006, 12, 410–416. [CrossRef]
18. Lee, J.S.; Leem, S.H.; Lee, S.Y.; Kim, S.C.; Park, E.S.; Kim, S.B.; Kim, S.K.; Kim, Y.J.; Kim, W.J.; Chu, I.S.Expression signature of E2F1 and its associated genes predict superficial to invasive progression of bladdertumors. J. Clin. Oncol. Off. J. Am. Soc. Clin. Oncol. 2010, 28, 2660–2667. [CrossRef]
19. Oh, S.C.; Park, Y.Y.; Park, E.S.; Lim, J.Y.; Kim, S.M.; Kim, S.B.; Kim, J.; Kim, S.C.; Chu, I.S.; Smith, J.J.; et al.Prognostic gene expression signature associated with two molecularly distinct subtypes of colorectal cancer.Gut 2012, 61, 1291–1298. [CrossRef]
20. Mermel, C.H.; Schumacher, S.E.; Hill, B.; Meyerson, M.L.; Beroukhim, R.; Getz, G. GISTIC2.0 facilitatessensitive and confident localization of the targets of focal somatic copy-number alteration in human cancers.Genome Biol. 2011, 12, R41. [CrossRef]
21. Cherry, J.D.; Olschowka, J.A.; O’Banion, M.K. Neuroinflammation and M2 microglia: The good, the bad,and the inflamed. J. Neuroinflamm. 2014, 11, 98. [CrossRef] [PubMed]
22. Kobayashi, K.; Imagama, S.; Ohgomori, T.; Hirano, K.; Uchimura, K.; Sakamoto, K.; Hirakawa, A.; Takeuchi, H.;Suzumura, A.; Ishiguro, N.; et al. Minocycline selectively inhibits M1 polarization of microglia. Cell DeathDis. 2013, 4, e525. [CrossRef] [PubMed]
23. Blank, C.U. The perspective of immunotherapy: New molecules and new mechanisms of action in immunemodulation. Curr. Opin. Oncol. 2014, 26, 204–214. [CrossRef] [PubMed]
24. Ock, C.Y.; Hwang, J.E.; Keam, B.; Kim, S.B.; Shim, J.J.; Jang, H.J.; Park, S.; Sohn, B.H.; Cha, M.; Ajani, J.A.; et al.Genomic landscape associated with potential response to anti-CTLA-4 treatment in cancers. Nat. Commun.2017, 8, 1050. [CrossRef] [PubMed]
25. Newman, A.M.; Liu, C.L.; Green, M.R. Robust enumeration of cell subsets from tissue expression profiles.Nat. Methods 2015, 12, 453–457. [CrossRef] [PubMed]

Cells 2020, 9, 1761 15 of 16
26. Anido, J.; Saez-Borderias, A.; Gonzalez-Junca, A.; Rodon, L.; Folch, G.; Carmona, M.A.; Prieto-Sanchez, R.M.;Barba, I.; Martinez-Saez, E.; Prudkin, L.; et al. TGF-beta Receptor Inhibitors Target the CD44(high)/Id1(high)Glioma-Initiating Cell Population in Human Glioblastoma. Cancer Cell 2010, 18, 655–668. [CrossRef][PubMed]
27. Cheng, W.Y.; Kandel, J.J.; Yamashiro, D.J.; Canoll, P.; Anastassiou, D. A multi-cancer mesenchymal transitiongene expression signature is associated with prolonged time to recurrence in glioblastoma. PLoS ONE 2012,7, e34705. [CrossRef]
28. Verhaak, R.G.; Hoadley, K.A.; Purdom, E.; Wang, V.; Qi, Y.; Wilkerson, M.D.; Miller, C.R.; Ding, L.; Golub, T.;Mesirov, J.P.; et al. Integrated genomic analysis identifies clinically relevant subtypes of glioblastomacharacterized by abnormalities in PDGFRA, IDH1, EGFR, and NF1. Cancer Cell 2010, 17, 98–110. [CrossRef]
29. Noushmehr, H.; Weisenberger, D.J.; Diefes, K.; Phillips, H.S.; Pujara, K.; Berman, B.P.; Pan, F.; Pelloski, C.E.;Sulman, E.P.; Bhat, K.P.; et al. Identification of a CpG island methylator phenotype that defines a distinctsubgroup of glioma. Cancer Cell 2010, 17, 510–522. [CrossRef]
30. Iwadate, Y. Epithelial-mesenchymal transition in glioblastoma progression. Oncol. Lett. 2016, 11, 1615–1620.[CrossRef]
31. Lee, B.S.; Park, D.I.; Lee, D.H.; Lee, J.E.; Yeo, M.K.; Park, Y.H.; Lim, D.S.; Choi, W.; Lee, D.H.; Yoo, G.;et al. Hippo effector YAP directly regulates the expression of PD-L1 transcripts in EGFR-TKI-resistant lungadenocarcinoma. Biochem. Biophys. Res. Commun. 2017, 491, 493–499. [CrossRef] [PubMed]
32. Thaventhiran, J.E.; Hoffmann, A.; Magiera, L.; de la Roche, M.; Lingel, H.; Brunner-Weinzierl, M.; Fearon, D.T.Activation of the Hippo pathway by CTLA-4 regulates the expression of Blimp-1 in the CD8+ T cell. Proc. Natl.Acad. Sci. USA 2012, 109, E2223–E2229. [CrossRef] [PubMed]
33. Yuan, Y.; Li, D.; Li, H.; Wang, L.; Tian, G.; Dong, Y. YAP overexpression promotes the epithelial-mesenchymaltransition and chemoresistance in pancreatic cancer cells. Mol. Med. Rep. 2016, 13, 237–242. [CrossRef][PubMed]
34. Colin, C.; Voutsinos-Porche, B.; Nanni, I.; Fina, F.; Metellus, P.; Intagliata, D.; Baeza, N.; Bouvier, C.; Delfino, C.;Loundou, A.; et al. High expression of cathepsin B and plasminogen activator inhibitor type-1 are strongpredictors of survival in glioblastomas. Acta Neuropathol. 2009, 118, 745–754. [CrossRef] [PubMed]
35. Duncan, C.G.; Killela, P.J.; Payne, C.A.; Lampson, B.; Chen, W.C.; Liu, J.; Solomon, D.; Waldman, T.;Towers, A.J.; Gregory, S.G.; et al. Integrated genomic analyses identify ERRFI1 and TACC3 asglioblastoma-targeted genes. Oncotarget 2010, 1, 265–277. [CrossRef] [PubMed]
36. Patil, S.S.; Gokulnath, P.; Bashir, M.; Shwetha, S.D.; Jaiswal, J.; Shastry, A.H.; Arimappamagan, A.; Santosh, V.;Kondaiah, P. Insulin-like growth factor binding protein-2 regulates beta-catenin signaling pathway in gliomacells and together contributes to poor patient prognosis. Neuro-Oncology 2016. [CrossRef] [PubMed]
37. Quann, K.; Gonzales, D.M.; Mercier, I.; Wang, C.; Sotgia, F.; Pestell, R.G.; Lisanti, M.P.; Jasmin, J.F. Caveolin-1is a negative regulator of tumor growth in glioblastoma and modulates chemosensitivity to temozolomide.Cell Cycle 2013, 12, 1510–1520. [CrossRef]
38. Serres, E.; Debarbieux, F.; Stanchi, F.; Maggiorella, L.; Grall, D.; Turchi, L.; Burel-Vandenbos, F.;Figarella-Branger, D.; Virolle, T.; Rougon, G.; et al. Fibronectin expression in glioblastomas promotescell cohesion, collective invasion of basement membrane in vitro and orthotopic tumor growth in mice.Oncogene 2014, 33, 3451–3462. [CrossRef]
39. Jorgenson, A.J.; Choi, K.M.; Sicard, D.; Smith, K.M.; Hiemer, S.E.; Varelas, X.; Tschumperlin, D.J. TAZ activationdrives fibroblast spheroid growth, expression of profibrotic paracrine signals, and context-dependent ECMgene expression. Am. J. Physiol. Cell Physiol. 2017, 312, C277–C285. [CrossRef]
40. Liu, F.; Lagares, D.; Choi, K.M.; Stopfer, L.; Marinkovic, A.; Vrbanac, V.; Probst, C.K.; Hiemer, S.E.; Sisson, T.H.;Horowitz, J.C.; et al. Mechanosignaling through YAP and TAZ drives fibroblast activation and fibrosis. Am. J.Physiol. Lung Cell. Mol. Physiol. 2015, 308, L344–L357. [CrossRef]
41. Rizvi, N.A.; Hellmann, M.D.; Snyder, A.; Kvistborg, P.; Makarov, V.; Havel, J.J.; Lee, W.; Yuan, J.; Wong, P.;Ho, T.S.; et al. Cancer immunology. Mutational landscape determines sensitivity to PD-1 blockade innon-small cell lung cancer. Science 2015, 348, 124–128. [CrossRef] [PubMed]
42. Hambardzumyan, D.; Gutmann, D.H.; Kettenmann, H. The role of microglia and macrophages in gliomamaintenance and progression. Nat. Neurosci. 2016, 19, 20–27. [CrossRef] [PubMed]
43. Noy, R.; Pollard, J.W. Tumor-associated macrophages: From mechanisms to therapy. Immunity 2014, 41,49–61. [CrossRef]
Cells 2020, 9, 1761 16 of 16
44. Gentles, A.J.; Newman, A.M.; Liu, C.L.; Bratman, S.V.; Feng, W.; Kim, D.; Nair, V.S.; Xu, Y.; Khuong, A.;Hoang, C.D.; et al. The prognostic landscape of genes and infiltrating immune cells across human cancers.Nat. Med. 2015, 21, 938–945. [CrossRef] [PubMed]
45. Rutledge, W.C.; Kong, J.; Gao, J.; Gutman, D.A.; Cooper, L.A.; Appin, C.; Park, Y.; Scarpace, L.; Mikkelsen, T.;Cohen, M.L.; et al. Tumor-infiltrating lymphocytes in glioblastoma are associated with specific genomicalterations and related to transcriptional class. Clin. Cancer Res. Off. J. Am. Assoc. Cancer Res. 2013, 19,4951–4960. [CrossRef] [PubMed]
46. Pyonteck, S.M.; Akkari, L.; Schuhmacher, A.J.; Bowman, R.L.; Sevenich, L.; Quail, D.F.; Olson, O.C.;Quick, M.L.; Huse, J.T.; Teijeiro, V.; et al. CSF-1R inhibition alters macrophage polarization and blocks gliomaprogression. Nat. Med. 2013, 19, 1264–1272. [CrossRef]
47. Santarpia, M.; Gonzalez-Cao, M.; Viteri, S.; Karachaliou, N.; Altavilla, G.; Rosell, R. Programmed cell deathprotein-1/programmed cell death ligand-1 pathway inhibition and predictive biomarkers: Understandingtransforming growth factor-beta role. Transl. Lung Cancer Res. 2015, 4, 728–742. [CrossRef]
48. Gratchev, A. TGF-beta signalling in tumour associated macrophages. Immunobiology 2016. [CrossRef]49. Iser, I.C.; Pereira, M.B.; Lenz, G.; Wink, M.R. The Epithelial-to-Mesenchymal Transition-Like Process in
Glioblastoma: An Updated Systematic Review and In Silico Investigation. Med. Res. Rev. 2016. [CrossRef]50. Herbertz, S.; Sawyer, J.S.; Stauber, A.J.; Gueorguieva, I.; Driscoll, K.E.; Estrem, S.T.; Cleverly, A.L.; Desaiah, D.;
Guba, S.C.; Benhadji, K.A. Clinical development of galunisertib (LY2157299 monohydrate), a small moleculeinhibitor of transforming growth factor-beta signaling pathway. Drug Des. Dev. Ther. 2015, 9, 4479.
51. Okazaki, T.; Kageji, T.; Kuwayama, K.; Kitazato, K.T.; Mure, H.; Hara, K.; Morigaki, R.; Mizobuchi, Y.;Matsuzaki, K.; Nagahiro, S. Up-regulation of endogenous PML induced by a combination of interferon-betaand temozolomide enhances p73/YAP-mediated apoptosis in glioblastoma. Cancer Lett. 2012, 323, 199–207.[CrossRef] [PubMed]
© 2020 by the authors. Licensee MDPI, Basel, Switzerland. This article is an open accessarticle distributed under the terms and conditions of the Creative Commons Attribution(CC BY) license (http://creativecommons.org/licenses/by/4.0/).