FY 2020 CAFR.pdf - City of Virginia Beach
376
-
Upload
khangminh22 -
Category
Documents
-
view
4 -
download
0
Transcript of FY 2020 CAFR.pdf - City of Virginia Beach


COMPREHENSIVE
ANNUAL
FINANCIAL REPORT
OF THE
CITY OF VIRGINIA BEACH, VIRGINIA
FOR THE FISCAL YEAR ENDED
JUNE 30, 2020
PREPARED BY
DEPARTMENT OF FINANCE

ACKNOWLEDGEMENTS
The preparation of this report has been accomplished by the efficient and dedicated services ofthe staff of the Department of Finance. I would also like to thank the City Auditor's Office fortheir assistance in managing the audit and audit contract. The contributions of all are invaluableand sincerely appreciated and clearly reflect the high standards which have been set by the Cityof Virginia Beach.
CAFR PREPARATION TEAM
(in alphabetical order)
Kristin Bradley, Stacy Hershberger, Wendy Hu, Blake Huffman, Patricia Kephart, KevinKielbasa, James Leary, Sean Murphy, Andrew Oliver, Jeffrey Rodarmel, Murat Tosunoglu,
STAFF SUPPORT
Jessa Johnson, Bonnie Castellow,
COVER
Photographer: Craig McClure Layout: Anna Kristina Alfaro
It is also appropriate to thank the City Manager, Mayor and Members of City Council for makingpossible the excellent financial position of the City through their interest and support in planningand conducting the financial affairs of the City.

CITY OF VIRGINIA BEACH, VIRGINIACOMPREHENSIVE ANNUAL FINANCIAL REPORT
FOR THE YEAR ENDED JUNE 30, 2020
TABLE OF CONTENTS PAGE NO.
INTRODUCTORY SECTION
Elected and Appointed Officials v City Organization Chart vi Letter of Transmittal vii Certificate of Achievement for Excellence in Financial Reporting xxix
FINANCIAL SECTION
Independent Auditors' Report xxxi Management’s Discussion and Analysis 1 Basic Financial Statements: Government-Wide Financial Statements Statement of Net Position 15 Statement of Activities 16 Governmental Funds Financial Statements: Balance Sheet 18 Reconciliation of Balance Sheet to the Statement of Net Position 19 Statement of Revenues, Expenditures, and Changes in Fund Balance 20 Reconciliation of the Statement of Revenues, Expenditures, and Changes in Fund Balances of Governmental Funds to the Statement of Activities 21 Proprietary Funds Financial Statements: Statement of Net Position 22 Statement of Revenues, Expenses and Changes in Net Position 24 Statement of Cash Flows 26 Fiduciary Funds Financial Statements: Statement of Fiduciary Net Position 28 Statement of Changes in Fiduciary Net Position 29 Notes to Financial Statements: 1. Summary of Significant Accounting Policies 30 2. Fund Balances – General Fund and Nonmajor Governmental Funds 43 3. Receivables and Accrued Liabilities 44 4. Unearned Revenue 48 5. Capital Assets and Land Held for Resale 50 6. Long-Term Debt 57 7. Assets and Obligations under Leases 68 8. Deposits and Investments 69 9. Commitments and Contingencies 71 10. Tax Abatements 74 11. Interfund Balances and Transactions, Fund Results and Reconciliations 77 12. Risk Management 79 13. Retirement 82 14. Other Postemployment Benefits 106 15. Subsequent Events 128
Required Supplemental Information other than Management’s Discussion and Analysis: Schedule of Revenues, Expenditures, and Changes in Fund Balance – Budget and Actual – General
Fund 130 Schedule of Changes in the Net Pension Liability and Related Ratios 131 Schedule of Employer Pension Contributions 133 Schedule of Employer's Share of Net Pension Liability 135 Schedule of Employer's Share of Net OPEB Liability and Related Ratios 136 Schedule of OPEB Annual Contributions 138 Schedule of Employer's Share of the Net OPEB Liability 139 Schedule of OPEB Group Life Insurance Annual Contributions 141 Schedule of OPEB Line of Duty Annual Contributions 142 Schedule of OPEB Virginia Local Disability Program Annual Contributions 143 Schedule of OPEB Health Insurance Credit Program Annual Contributions 144
i

CITY OF VIRGINIA BEACH, VIRGINIACOMPREHENSIVE ANNUAL FINANCIAL REPORT
FOR THE YEAR ENDED JUNE 30, 2020
FINANCIAL SECTION (continued) PAGE NO. Other Supplemental Information
Combining Schedules Nonmajor Governmental Funds: Combining Balance Sheet – Nonmajor Governmental Funds 146 Combining Statement of Revenues, Expenditures, and Changes in Fund Balance – Nonmajor Special Revenue Funds 147
General Fund Budget to Actual: Schedule of Revenues Compared to Final Budget 150 Schedule of Expenditures Compared to Final Budget 152 Combining Schedules and Individual Funds: Combining Balance Sheet – Nonmajor Special Revenue Funds 160 Combining Statement of Revenues, Expenditures, and Changes in Fund Balance – Nonmajor Special Revenue Funds 164 Statements of Revenues, Expenditures, and Changes in Fund Balance – Budget and Actual Agriculture Reserve Program Special Revenue Fund 168 Central Business District South Tax Increment Financing Special Revenue Fund 169 Combined Area Dredging Projects Special Revenue Fund 170 Emergency FEMA Special Revenue Fund 171 Federal Section Eight Program Special Revenue Fund 172 Forfeited Assets Special Revenue Fund 173 Housing and Neighborhood Preservation Special Revenue Fund 174 Law Library Special Revenue Fund 175 Open Space Special Revenue Fund 176 Parks and Recreation Special Revenue Fund 177 Sandbridge Special Service District Special Revenue Fund 178 Sandbridge Tax Increment Financing Special Revenue Fund 179 Sheriff's Department Special Revenue Fund 180 Tourism Advertising Program Special Revenue Fund 181 Tourism Investment Program Special Revenue Fund 182 Town Center Special Service District Special Revenue Fund 183 Wetlands Board Mitigation Special Revenue Fund 184
Debt Service Fund Schedule of Revenues, Expenditures, and Changes in Fund Balance – Budget and Actual 186 Capital Projects: Schedule of General Government Capital Projects 188 Enterprise Funds: Statement of Net Position – Water and Sewer Enterprise Fund 196 Statement of Revenues, Expenses and Changes in Net Position – Water and Sewer Enterprise Fund 197 Statement of Cash Flows – Water and Sewer Enterprise Fund 198 Schedule of Operating Expenses – Budget and Actual – Water and Sewer Enterprise Fund 199 Schedule of Water and Sewer Fund Capital Projects 201 Statement of Net Position – Storm Water Enterprise Fund 206 Statement of Revenues, Expenses and Changes in Net Position – Storm Water Enterprise Fund 207 Statement of Cash Flows – Storm Water Enterprise Fund 208 Schedule of Operating Expenses - Budget and Actual – Storm Water Enterprise Fund 209 Schedule of Storm Water Fund Capital Projects 210 Statement of Net Position – Waste Management Enterprise Fund 214 Statement of Revenues, Expenses and Changes in Net Position – Waste Management Enterprise Fund 215 Statement of Cash Flows – Waste Management Enterprise Fund 216 Schedule of Operating Expenses - Budget and Actual – Waste Management Enterprise Fund 217 Statement of Net Position – Development Authority Enterprise Fund 220 Statement of Revenues, Expenses and Changes in Net Position – Development Authority Enterprise
Fund 221 Statement of Cash Flows – Development Authority Fund 222 Internal Service Funds: Combining Statement of Net Position 224 Combining Statement of Revenues, Expenses and Changes in Net Position 226 Combining Statement of Cash Flows 228
ii

CITY OF VIRGINIA BEACH, VIRGINIACOMPREHENSIVE ANNUAL FINANCIAL REPORT
FOR THE YEAR ENDED JUNE 30, 2020
FINANCIAL SECTION (continued) PAGE NO.
Trust and Agency Funds: Combining Statement of Fiduciary Assets and Liabilities – Agency Funds 232 Combining Statement of Changes in Assets and Liabilities – Agency Funds 233 Combining Statement of Fiduciary Net Position – Trust Funds 234 Combining Statement of Changes in Fiduciary Net Position – Retirement Trust Funds 235
Discretely Presented School Board Component Unit: Statement of Net Position 238 Statement of Activities 239 Balance Sheet – Governmental Funds 240 Reconciliation of the Balance Sheet to the Statement of Net Position 241 Statement of Revenues, Expenditures, and Changes in Fund Balances – Governmental Funds 242 Reconciliation of the Statement of Revenues, Expenditures, and Changes in Fund Balances of Governmental Funds to the Statement of Activities 243 Combining Balance Sheet – Nonmajor Governmental Funds – Special Revenue Funds 244 Combining Statement of Revenues, Expenditures, and Changes in Fund Balances – Nonmajor Governmental Funds – Special Revenue Funds 245 Combining Statement of Net Position – Internal Service Funds 246 Combining Statement of Revenues, Expenses and Changes in Fund Net Position Internal Service Funds 247 Combining Statement of Cash Flows – Internal Service Funds 248 Combining Statement of Changes in Assets and Liabilities – Agency Funds 249 Statement of Fiduciary Net Position 250 Statement of Changes in Fiduciary Net Position 251
STATISTICAL SECTION
Table
1 Net Position by Component – Last Ten Fiscal Years 255 2 Changes in Net Position – Last Ten Fiscal Years 256 3 Fund Balances of Governmental Funds – Last Ten Fiscal Years 258 4 Changes in Fund Balance of Governmental Funds – Last Ten Fiscal Years 260 5 Governmental Funds Tax Revenue by Source – Last Ten Fiscal Years 262 6 Assessed Value and Estimated Actual Value of Taxable Property – Last Ten Fiscal Years 263 7 Revenue Rates for Real Estate and for Personal Property – Last Ten Fiscal Years 264 8 Principal Property Taxpayers – Assessed Value 265 9 Property Tax Levies and Collections – Last Ten Fiscal Years 266 10 Ratios of Outstanding Debt by Type – Last Ten Fiscal Years 267 11 Ratios of Outstanding General Bonded Debt by Type – Last Ten Fiscal Years 268 12 Legal Debt Margin Information – Last Ten Fiscal Years 269 13 Pledged – Revenue Coverage – Last Ten Fiscal Years – Water and Sewer 270 14 Pledged – Revenue Coverage – Last Ten Fiscal Years – Storm Water 271 15 Demographic and Economic Statistics – Last Ten Fiscal Years 272 16 Principal Employers 271 17 Full-Time Equivalent Government Employees by Function – Last Ten Fiscal Years 274 18 Operating Indicators by Function – Last Ten Fiscal Years 275 19 Capital Asset Statistics by Function – Last Ten Fiscal Years 276 20 Schedule of the Treasurer’s Cash Accountability Report 277
iii

CITY OF VIRGINIA BEACH, VIRGINIACOMPREHENSIVE ANNUAL FINANCIAL REPORT
FOR THE YEAR ENDED JUNE 30, 2020
PAGE NO.Schedule
1-1 Principal Taxpayers 2801-2 Property Tax Rates and Change in Tax Levy 2811-3 Historical Assessed Value 2821-4 Property Tax Levies and Collections 2831-5 Principal Tax Revenues by Source 2842-1 Ten Largest Utility (Water) Customers 2852-2 Water and Sewer Enterprise Fund Outstanding Debt by Issue 2862-3 Water Resource Recovery Fees History of Receipts and Disbursements 2872-4 Water and Sewer Enterprise Fund System Operating Revenues, Expenses, and Coverage 2882-5 Water and Sewer Enterprise Fund Debt Service REquirements 2892-6 Water and Sewer Enterprise Fund Water and Sewer Rate History 2903-1 Ten Largest Storm Water Utility Accounts 2913-2 Storm Water Utility Distribution by Type of Property 2923-3 Storm Water Utility Fee Collections 2933-4 Storm Water Utility Fund Pro Forma Calculation of Revenue Covenants 2943-5 Storm Water Utility Fund Debt Service Requirements 2953-6 Storm Water Utility Fund Rate History 296
iv

INTRODUCTORY SECTION


v

vi

November 30 , 2020
The Honorable Robert M. Dyer, Mayor Members of the Virginia Beach City Council Municipal Center Virginia Beach, Virginia 23456
Subject: Comprehensive Annual Financial Report
Dear Mayor and Council Members:
The Comprehensive Annual Financial Report (CAFR) of the City of Virginia Beach, Virginia, for the fiscal year ended June 30, 2020, is hereby submitted. The City is required by the Code of the Commonwealth of Virginia and by the City Charter to publish at the close of each fiscal year a complete set of financial statements presented in conformity with accounting principles generally accepted in the United States (GAAP) and audited in accordance with Government Auditing Standards by a firm of independent certified public accountants. This report has been prepared by the Department of Finance and complies with state law and guidelines of the Auditor of Public Accounts of the Commonwealth of Virginia. It includes all financial activities of the financial reporting entity, which consists of the City of Virginia Beach as well as its component units including: City of Virginia Beach School Board, Virginia Beach Economic Development Authority and Community Development Corporation.
Responsibility for the accuracy of the data and the completeness and fairness of presentation, including all disclosures, rests with the City management. To the best of our knowledge and belief, the enclosed data are accurate in all material respects and are reported to present fairly the financial position of the City. All disclosures necessary to enable the reader to gain an understanding of the City’s financial activities have been included.
REPORT CONTENTS
The CAFR is presented in four sections: introductory letter of transmittal, financial, and statistical. In addition, at the end of the document the Continuing Disclosure section provides certain annual financial information and material event notices as required by Rule 15c2-12 of the Securities and Exchange Commission. GAAP requires that management provide a narrative introduction, overview and analysis to accompany the basic financial statements in the form of Management’s
DEPARTMENT OF FINANCE (757)385-4681 FAX (757) 385-4302
MUNICIPAL CENTER BUILDING 1
2401 COURTHOUSE DRIVE VIRGINIA BEACH, VA 23456
vii

Discussion and Analysis (MD&A). This letter of transmittal is intended to complement the MD&A and should be read in conjunction with it. The City of Virginia Beach’s MD&A can be found immediately following the report of the independent auditors.
CITY PROFILE AND SERVICES
The City of Virginia Beach, Virginia was established on January 1, 1963, by the merger of Princess Anne County and the former, smaller City of Virginia Beach. This merger created one of the largest cities in the Commonwealth of Virginia that covers 310 square miles and 38 miles of shore line on the Atlantic Ocean and the Chesapeake Bay. The City encompasses the entire eastern border of Virginia south of the Delmarva Peninsula and includes all of the area from the Chesapeake Bay to the North Carolina border. The latest estimated population as of July 1, 2019 for the City of Virginia Beach is 452,643 and is the most populated City in Virginia. The City of Virginia Beach derives its governing authority from a charter granted by the General Assembly of the Commonwealth of Virginia. The governing body of the City is the City Council, which formulates policies for the administration of the City. The City Council has 11-members and each member of the City Council is elected on an “at large” basis; however, seven seats must be filled by individuals who reside in the seven residence districts of the City. The City Charter was amended in 1995 to provide that the City’s seven boroughs would be replaced by these approximately equally populated residence districts. There is no district residency requirement for the remaining four seats. The Mayor is elected by the voters and occupies one of these four seats. The City Council elects a Vice-Mayor from among its members. All members of the City Council are elected for four-year terms.
The City operates under the Council-Manager form of government as established by its City Charter. The City Manager is the administrative head of the municipal government and carries out the policies of the City Council. The City Manager is appointed by the City Council and serves at the pleasure of the City Council. The City and Schools provide a full range of general governmental services. These services include police, emergency medical response, fire protection, collection and disposal of refuse, water and sewer, and storm water services, parks and recreation facilities, museums, libraries, and maintenance of streets, highways, parks and public beaches. Other services provided include public education in grades kindergarten through twelfth grade, public health and social services, certain technical and special education services, behavioral health assistance, planning and community development services, agricultural services, housing services, correctional facilities and judicial services. The City budget appropriates all funds including City, state and federal pass-through funds for education, social service, correctional facilities and judicial activities. Cities in Virginia have sole
viii

property taxing jurisdiction over the entire area within their boundaries and operate independently of any county government. There are no overlapping jurisdictions and, consequently, citizens of Virginia cities are not subject to overlapping debt or taxation. Further, cities in Virginia are prohibited from annexation to adjust their boundaries. LOCAL ECONOMY – COVID-19, MAJOR INDUSTRIES, ECONOMIC CONDITIONS AND OUTLOOK COVID-19, Economic Conditions and Outlook On March 13, 2020, the President of the United States issued a National Emergency concerning the Novel Coronavirus Disease (COVID-19) outbreak. The COVID-19 pandemic has quickly and significantly changed the economic outlook across the country and the world, including the City of Virginia Beach. The duration and extent of the impact of COVID-19 on the City’s revenues, expenses and cashflow are unknown and uncertain, however the City instituted a variety of relief programs and initiatives to help mitigate the impact, maintain critical services, and keep residents and employees safe. The City has received over $78 million in funding, the Coronavirus Aid, Relief and Economic Security (CARES) Act – Coronavirus Relief Funds (CRF), from the U.S Treasury Department for COVID-19 related expenses. In addition, the City has received other COVID related grants, such as $3.5 million CARES Act Funding from the U.S Department of Housing and Urban Development to help the community with housing and homelessness related issues caused by COVID-19 and other allocations from the state. Further information regarding COVID-19 can be found in Notes 9 and 15 of the Notes to the Financial Statements. The Virginia Beach economy continues to improve as real estate and personal property assessments continue to increase, some consumer-driven revenues including general sales continue to perform well, and hotel and restaurant meal taxes began some recovery during summer 2020. There are also recovery trends in the areas of job growth, tourism, and building activity. Continuing decrease in the unemployment rate and an increase in the overall labor force also benefit the City; and the regional economy benefits from continuing modest growth with region-wide defense–related spending increase. According to Old Dominion University’s 21st annual State of the Region Report, the regional economy grew 2.4% in 2019 and was anticipated to grow for the fourth consecutive year by February 2020, when the Coronavirus outbreak began impacting the region. The report projects periods of improvement and then retrenchment if there are continual increases or outbreaks of COVID-19 cases and absence of an effective therapeutic or vaccine. The recovery in retail trade, hotel revenue and occupancy, and traffic through the Port of Virginia will likely take years with an expectation that full recovery may be achieved in 2022. The State of Region Report states that it took Hampton Roads 100 months to recover from the Great Recession of December 2007 to June 2009, and the economic shock from COVID-19 was more severe. For example, the unemployment rate for Hampton Roads, which hovered around 3% for most of 2019, sharply increased in April 2020 to 12.1%, and then decreased to 9.6% by June 2020 compared with 3.2% for June 2019. By June and July 2020, the regional economy was improving and performing on par with the Commonwealth as the state mandated COVID-19 mitigation restrictions were eased as the virus cases lessened. Domestic and international travel restrictions and stay-at-home orders resulted in dramatic declines in hotel occupancy (31% in April 2020 compared with about 69% in April 2019 and 54.9% in June 2020 compared to 77.7% in June 2019) and hotel revenue earned per available room declined as well (declining on a year-over-year basis with 74% in April 2020 and 45% in June 2020). Regional advertising initiatives within the state
ix

and the northeast attracted visitors able and willing to drive to the region. Also, the pandemic shocked supply chains and reduced the flow of 20-foot equivalent container units (TEUs) imported and exported from the Port of Virginia by 17.2% and 4.2%, respectively, from June 2019 to June 2020. The Port lost market share from 16.5% in 2019 to 16.2% during January 2020 to May 2020. Employers in the City, excluding the military, provided jobs for 175,525 persons through the first quarter of calendar year 2020 (206,324 including the military) compared with 174,668 in the first quarter of 2019 (205,467 including the military) resulting in an increase of 857 jobs over this period. The largest employment sectors in Virginia Beach are the Service sector (primarily Health Care, Social Assistance, Accommodation, and Food Services), Military, Wholesale and Retail Trade, and Local Government. As shown in the following table, over the period March 2019 to March 2020, job gains occurred primarily in the Transportation, Warehousing, Federal government, Financial, Insurance, Real Estate, and Service sectors. Whereas, job losses occurred primarily in the Agriculture, Information, Manufacturing, Construction, Wholesale, and Retail sectors. Updated military employment data was not available prior to mid-November, so no changes in military employment are reflected (Sources: Virginia Employment Commission (VEC), Navy Region Mid-Atlantic FY 2018 Economic Impact Report).
City of Virginia Beach Average Employment by Industry Sector*
As of First Quarter 2020 and 2019
Industry Sector 2019 2020 Change in Jobs
% Change
% of Total Employment
for 2020 Private Services 85,885 86,919 1,034 1.2% 42.10% Wholesale and Retail Trade 25,884 25,426 (458) -1.8% 12.30% Construction 10,187 10,036 (151) -1.5% 4.90% Financial, Insurance and Real Estate 12,610 12,856 246 2.0% 6.20% Manufacturing 6,384 6,245 (139) -2.2% 3.00% Transportation and Warehousing 1,884 2,074 190 10.1% 1.00% Information 3,046 2,954 (92) -3.0% 1.40% Agriculture, Forestry, Fishing and Mining 74 62 (12) -16.2% 0.03% Total Private* 145,954 146,572 618 0.4% 70.93%
Public – Civilian State Government 1,699 1,689 (10) -0.6% 0.80% Local Government 20,727 20,745 18 0.1% 10.10% Federal Government 6,288 6,519 231 3.7% 3.20% Total Public – Civilian 28,714 28,953 239 0.8% 14.10%
Total Civilian Employment 174,668 175,525 857 0.5% Military 30,799 30,799 - 0.0% 14.90% Total Employment 205,467 206,324 857 0.4% 99.93%
Sources: Virginia Employment Commission, Economic Information Services Division, Quarterly Census of Employment and Wages Report (QCEW); latest data available U.S. Department of the Navy, NRMA (Navy Region Mid-Atlantic) Integrated Shore Requirements Office (N5), Navy Region Mid-Atlantic FY 2018 Economic Impact Report (December 11, 2019); based upon most current and available information. * Per the VEC, excludes unclassified businesses, and immaterial amounts have been suppressed in certain industry sub-categories, which are included in the total amounts.
x

Annual average unemployment rates for 2019 were 2.8% for Virginia Beach, 3.1% for the Virginia Beach-Norfolk-Newport News, VA-NC Metropolitan Statistical Area (MSA), 2.8% for Virginia, and 3.7% for the U.S. Unemployment rates have declined in 2019 compared with 2018 for the City, the region, the State and nation. There has been a steady decline in the unemployment rate in Virginia Beach since 2010. The shock of COVID-19 caused unemployment to increase in Virginia Beach to 12.2% in April 2020 and steadily decline to 6.0% in August 2020. Likewise, for the MSA, the unemployment rate rose to 12.1% in April and declined to 7.4% by August. For the Commonwealth of Virginia, the unemployment rate was 10.8% in April 2020 and 6.3% in August 2020. For the U.S., the unemployment rate was 14.4% in April 2020 and 8.5% in August 2020. (Source: U.S. Department of Labor, Bureau of Labor Statistics (BLS)) The average number of Virginia Beach residents employed in 2019 was 228,266 from an average labor force of 234,597. This reflects a slight increase over 2018 in average employment (225,561) and average labor force (232,337) of 1.2% and 1.0%, respectively. (Source: BLS) Based on the most recent data available, the per capita personal income for 2019 was $59,805 for Virginia Beach, $52,011 for the MSA, $59,657 for Virginia, and $56,490 for the U.S. Over the 5-year period from 2014 to 2019, the per capita personal income for Virginia Beach has increased an average of 3.3% per year. (Source: U.S. Department of Commerce, Bureau of Economic Analysis (BEA)) Also, the median household income continues to increase for Virginia Beach in 2019 at $79,054 compared with $77,059 in 2018. Median household income for the City has increased an average of 3.9% per year since 2013. (Source: US Census Bureau, 2019 American Community Survey) Hotel tax revenue collected in FY 2020 was $32.7 million, a decrease of $4.4 million (-12.0%) compared with $37.1 million collected in FY 2019. This decline was due to the decline in travel due to mitigation measures taken to stem the spread of COVID-19 pandemic. However, over the longer term, hotel tax revenues rose 2.6% annually from 2015 to 2020 on average, which is indicative of the strength of the tourism industry in Virginia Beach. The hotel tax rate remained at 8.0% plus the $2.00/room night charge throughout FY 2020.
0.0
2.0
4.0
6.0
8.0
10.0
12.0
Perc
ent
Calendar Year
Unemployment Rates
Virginia Beach MSA Virginia US
$0
$10
$20
$30
$40
$28.7 $30.6 $32.8$35.5 $37.1
$32.7
Reve
nues
($ in
mill
ions
)
Fiscal Year
Hotel Taxes
xi

Restaurant meals tax revenue collected in FY 2020 was $60.6 million, a decrease of $8.7 million (-12.6%) compared with $69.3 million collected in FY 2019. The decline was due to the economic impact of the COVID-19 pandemic and the suspension of the meals tax of 5.5% for May June 2020. Restaurant meals tax revenue has been a consistent performer and has increased annually 0.2% on average over the last six years. The restaurant tax rate remained 5.5% throughout this period. General sales tax revenue reflects the City’s 1% share of the State sales tax. The amount collected in FY 2020 was $67.9 million, an increase of $2.0 million (3.0%) compared with $65.9 million collected in FY 2019. This revenue stream has been increasing annually over the last six years by 3.1% on average. Virginia Beach real estate assessments are projected to total $61.2 billion in FY 2021, an increase of 3.3% following a 3.6% increase in FY 2020. The City’s tax base has steadily grown from FY 2015 through FY 2021 (projected) with annual increases of 3.3% on average. (Source: Real Estate Assessor’s Office, Annual Report) Beginning in September 2018 during FY 2019, the City no longer required building permits for roofing and siding activities. The number of building permits issued net of demolition, roofing and siding permits as of Calendar 2019 totaled 6,631 valued at $433.1 million compared with 4,069 and $588.0 million for calendar 2018. According to the Office of the Real Estate Assessor, for the second quarter of 2020, expansion in the tax base continued with the value of new construction of $309.7 million, which represented an increase of 12.1% over the second quarter of 2019 of $276.5 million. This growth was primarily residential totaling $204.9 million (66.2%) with $104.8 million (33.8%) being commercial construction. (Source: Department of Planning and Community Development, Office of the Real Estate Assessor, Quarterly Report). Major Industries – A diverse collection of industries provide the foundation for the local economy, including nationally and internationally known corporate headquarters, technologically advanced manufacturers, billion-dollar defense contractors, and locally owned firms. Defense and Tourism are the largest industries in the City. Agriculture is the City’s third largest industry comprising over 26,000 acres of farmland and over 200 farms and farm related businesses that annually generate more than $138 million in economic impact. It is a diverse agricultural business
$0
$20
$40
$60
$80
$60.0 $63.4 $65.2 $66.3 $69.3 $60.6
Reve
nues
($ in
mill
ions
)
Fiscal Year
Restaurant Meal Taxes
$0
$20
$40
$60
$80
$58.2 $61.1 $62.6 $63.5 $65.9 $67.9
Reve
nues
($ in
mill
ions
)
Fiscal Year
General Sales Taxes
xii

sector including production agriculture (soybeans, corn, and wheat), fruits and vegetables (over 24 different locally grown products including the area’s highly regarded strawberry crop), equine, livestock, and agritourism. Defense Spending, the Port of Virginia and Tourism continue to be stabilizers of and sources of growth in the Hampton Roads regional and Virginia Beach local economies. As mentioned previously, in its “The State of the Region Hampton Roads 2020” Report issued October 5, 2020, Old Dominion University (ODU) had projected a fourth year of growth for the regional economy, but due to the impact of COVID-19 pandemic, is projecting recovery sometime in 2022. Virginia Beach generates about 22.4% of the regional Gross Domestic Product (GDP) based on the latest data available from the U.S. Bureau of Economic Analysis from 2018 indicating GDP for Virginia Beach at $20.1 billion and the region at $89.8 billion. Defense Spending - According to ODU’s 2020 State of the Region report, the Department of Defense direct spending in Hampton Roads in FY 2020 is projected to be $23 billion reflecting an increase of $1.3 billion or 6.3% increase over the 2019 level of $21.7 billion. On Thursday, October 1, 2020, the President signed into law: H.R. 8337, the “Continuing Appropriations Act, 2021 and Other Extensions Act,” which provides federal fiscal year (FFY) 2021 appropriations to Federal agencies through December 11, 2020, for continuing projects and activities of the Federal Government under 2020 funding levels. The Bipartisan Budget Act of 2019 enacted August 2, 2019, raised the spending caps on national defense by $171.6 billion over two years, so that national defense spending will increase by $90.3 billion in FFY 2019 to $666.5 billion and $81.3 billion in FFY 2021 to $671.5 billion. FFY 2020 and FFY 2021 are the final two years that discretionary spending caps/sequestration were to be in effect per the original 2011 Budget Control Act. Likewise, Virginia Beach has experienced increased defense spending in recent years. Based on the latest economic data from the U.S. Department of the Navy, the total direct economic impact of military bases Naval Air Station Oceana and Joint Expeditionary Base Little Creek-Fort Story on the City’s economy was $3.6 billion for FFY 2018, an increase of over $504 million or 16.3% over FFY 2017. This impact includes payroll and expenditures for the procurement of goods and services to support operations of the military bases. Given the increase in federal defense budget in FFY 2019 and increased defense spending in the region estimated by ODU, it is anticipated that Virginia Beach also experienced an increase in defense spending in FFY 2019. In conjunction with defense spending, defense contract spending has a sizable impact on the economy. Based on the latest analysis by the Virginia Defense Contract Spending Impact Tool developed by Chmura Economics & Analytics for the Commonwealth, defense contract spending totaled $37.4 billion for Virginia, $11.4 billion for Hampton Roads and $1.6 billion for Virginia Beach in Federal Fiscal Year (FFY) 2018 ($34.6 billion, $9.7 billion, and $2.1 billion, respectively in FFY 2017). Defense contract spending is forecasted to increase from FFY 2018 to FFY 2020 to $41.2 billion for Virginia (10.1%), $13.3 billion for Hampton Roads (16.6%), and $1.7 billion for Virginia Beach (8.3%).
xiii

The Port of Virginia – The Port of Virginia, the third largest container port on the East Coast, is a vital segment of the Hampton Roads economy. With 50-foot channels, six marine terminals, and the largest container cranes in the world, the Port of Virginia connects global businesses to their customers anywhere, as well as being one of the nation’s 16 strategic ports for deploying military personnel and equipment worldwide. Based on data from the Port of Virginia, the number of 20-foot equivalent unit (TEU) containers shipped through the Port in Fiscal Year 2020 totaled 2.76 million, a 6.2% decrease over Fiscal Year 2019 (2.94 million). The decline in TEU was comprised of 114,030 loaded containers reflecting a 4.9% decline and 67,201 empty containers reflecting a 11.1% decline. Cargo tonnage moving through the port declined to 20.9 million tons in FY 2020 compared with 22.1 million tons in FY 2019. According to ODU in its 2020 State of the Region Report, the Port was handling less cargo and lost market share of loaded TEUs. The decline in activity at the Port is due in part to the trade wars of the Trump administration slowing international trade, and impact of COVID-19 shocking supply chains and slowing international trade. Signs of rebound are occurring at the Port of Virginia with increases in TEUs per month from May 2020 to September 2020 with September’s volume of TEUs rising to 256,439, which was 3.7% higher than August’s volume of 247,349 and 6.2% higher than the record set in September 2019 of 241,416. The Port is handling larger ships that can handle more cargo as fewer ships made calls in September. Various businesses in Virginia Beach supply cargo to the Port, such as the World Distribution Services. The Port’s ability to compete may be bolstered by the major capital investment of $800 million that began in 2016 and nearing completion to expand by one million units of additional lift capacity and modernize its two largest terminals to become a twenty-first century world-class port. Of critical importance to the Port and region is the U.S. Army Corps of Engineers Norfolk Harbor project that will deepen the Norfolk Channel to 55’, the Thimble Shoals channel to 56’, and the Atlantic Ocean channel to 59’, and widen the channel to permit two-way navigation, which will be a benefit to U.S. Naval operations. The Port anticipates the channel project to be completed in 2024. This project will improve the competitiveness of the Port, enabling it to regain its status as the deepest port on the east coast, and attract more ultra large container vessels (transporting over 15,000 TEUs), helping to diversify the regional economy. Tourism - Tourism is an important industry in Virginia Beach and a vital component in the City’s economy producing revenues supporting the provision of City services and capital projects including the convention center, sports center, and Pacific Avenue improvements. According to the Virginia Tourism Corporation 2019 Economic Impact of Domestic Travel on Virginia and Localities report, tourism and the convention industry supported 13,618 jobs with a payroll of $305.3 million in 2019, a decrease of 2.7% and increase of 1.2%, respectively, over 2018 levels of
xiv

13 ,999 jobs with $301.6 million payroll. The Tourism industry was adversely impacted by the coronavirus pandemic and state/city disease mitigation response that limited use of the beaches to fishing and exercising and closed non-essential businesses during the beginning months of the pandemic. Visitation and related tax revenues decreased with the cancellation or postponement of special events; of 841 special events that were scheduled to occur in the City between March 1 and August 10,641 were cancelled and 183 were postponed. As such, lodging sector sales performance declined in FY 2020, resulting in a 12% ($4.4 million) decrease in hotel tax revenues flowing to the City in FY 2020 compared with FY 2019. As travel and business closing restrictions were eased by the Governor, visitation and lodging sales have improved. According to Smith Travel Research data, from April 2020 to August 2020, hotel occupancy increased from 27.8% in April 2020 (-60.4% from April 2019) to 71.8% in August (-14.3% from August 2019). To aid in the recovery of the tourism industry, City Council provided additional funding in FY 2020 ($2 million) and FY 2021 ($1.4 million) for tourism advertising to support the industry as the City’s beaches reopened May 22nd. The advertising campaign targeted nearby driving markets including major cities in North Carolina, Maryland and Pennsylvania. Also, the City partnered with the City of Norfolk in a regional advertising campaign to attract visitors. According to STR, among the top 25 U.S. destination markets, from March 2020 to August 2020, the Norfolk/Virginia Beach market was recovering quicker in terms of improved hotel occupancy. KEY INITIATIVES The FY 2020 financial report reflects the use of resources to achieve the City government’s vision as defined by City Council in its ten goal areas developed in its past Annual Goal Setting Workshops. To ensure that Virginia Beach remains a preferred coastal city to attract residents, businesses and visitors, the City balances its efforts and use of resources to sustain the important components that make the City livable and successful. City Council’s vision and goals provide direction for these efforts. Highlights of some key initiatives during FY 2020 impacting the success and sustainability of the City are shown below.
xv

Resiliency Sea Level Rise/Recurrent Flooding Comprehensive Analysis - Flood control associated with sea level rise and land subsidence has become a critical issue in the Hampton Roads region and for the City. As a coastal community, Virginia Beach is proactively assessing its vulnerability, developing strategies, and implementing policy and engineering measures to increase its resiliency to reduce the impacts of tidal and storm surge flooding. The City’s approach to sea level rise incorporates the Stormwater Master Drainage Plan, the Sea Level Wise Adaptation Strategy Plan, and Water Quality Regulations. The Stormwater Master Drainage Plan is underway and is building detailed computer models of the City’s five major watersheds: Lynnhaven, Oceanfront, Elizabeth River, Little Creek and Southern Rivers (the Southern Rivers watershed includes Back Bay, North Landing River, Northwest River, and Small Coastal South). This plan, which works in conjunction with the Sea Level Wise Adaptation Strategy Plan, assesses the stormwater infrastructure performance, and identifies the cost of future flood damages and the needed infrastructure improvements to prevent or curtail those damages. The Sea Level Wise Adaptation Strategy Plan outlines a proactive, long-term approach to enable Virginia Beach to adapt to changing environmental conditions to ensure a vibrant future. This plan is the culmination of five years of work that included input from technical experts, community participants, and regional partners to gain a full understanding of flood risk and anticipated changes that will occur over time. The plan outlines policy and engineering strategies to reduce short and long-term impacts and creates city-wide and watershed-level ‘action plans’ to guide strategy implementation. Furthermore, the plan aims to improve Virginia Beach’s overall flood resilience by using natural mitigations to lessen the magnitude and extent of flooding events through open space nature-based features in addition to engineered solutions to prevent the passage of floodwater into inhabited areas. The City has developed a funding strategy using a combination of property tax increases and stormwater utility fee rate increases to fund an aggressive Capital Improvements Program that will spend $1.3 billion over the next 13 years to address recurrent flooding. These tax and fee increases were approved by City Council in the Adopted FY 2020 Budget; however, the rate increase for July 1, 2020 was postponed until FY 2022 to provide relief to residents and businesses due to the impacts of COVID-19. Beach Nourishment - The City has a strong commitment to maintain its beaches to reduce the risk of coastal flooding and resulting storm damage to public and private infrastructure. The City continues to use periodic beach nourishment projects to fortify its public beaches by maintaining their elevation and width. During a 30-month period beginning in 2018, six City public beaches will have been bolstered with sand as beach nourishment. Resort Beach and North End - The Resort Beach replenishment program was enhanced in 2001 with the implementation of the beach restoration and maintenance component of the federal
xvi

Virginia Beach, Beach Erosion Control and Hurricane Protection project in partnership with the U.S. Army Corps of Engineers (USACE). Approximately 2.5 million cubic yards of sand were placed on the beach to create a significantly higher and wider beach, which provides protection for a coastal storm event greater than a 100-year event. The first beach nourishment of the higher beach was performed in 2012, where 1.25 million cubic yards of sand were placed on the beach. A second beach nourishment was completed in 2019, where 1.4 million cubic yards of sand were placed. USACE has documented that this erosion control and hurricane protection project has prevented more than $450 million in coastal infrastructure damage. Sandbridge Beach - Beach nourishment of Sandbridge Beach, a five-mile beach from the Naval base at Dam Neck Annex/Fleet Training Center to Back Bay National Wildlife Refuge, began in 1998, and the fifth nourishment was completed in May 2020 with the placement of 1.7 million cubic yards of sand on the beach. The total cost of the recent contract was $20.3 million, of which $3.1 million was funded by USACE with the balance provided by the City’s Sandbridge Tax Increment Financing District and Sandbridge Special Service District Funds. According to USACE, the on-going beach nourishment project for Sandbridge Beach has prevented more than $140 million in coastal infrastructure damage.
Bay Beaches - Nourishment of City public beaches along the Chesapeake Bay has been accomplished through smaller-scale projects than those at the Resort and Sandbridge Beaches. The beaches adjacent to the Lynnhaven Inlet, Cape Henry and Ocean Park Beaches, have been nourished multiple times using sand from the federal/USACE Lynnhaven Inlet maintenance dredging project. The most recent replenishment of Cape Henry Beach was accomplished in June 2019 with nearly 180,000 cubic yards placed on the beach from the inlet dredging project. Chesapeake Beach (the westernmost bay beach) nourishment project was completed in May 2018 where over 430,000 cubic yards of sand were mined from a nearshore borrow site and placed on the beach. A project to continue maintenance of the restored beach is funded in the Capital Improvement Program, with the next replenishment programmed for 2022. Ocean Park Beach will be the first beach to be improved to higher and wider dimensions with a major $4 million beach and dune restoration project, which is anticipated to begin in 2021. A similar restoration project for Cape Henry Beach is programmed to follow in 2024.
Croatan Beach - The City completed significant dune restoration work at Croatan Beach in December 2018, which will be followed by a 50,000-cubic yard beach nourishment to be included in an upcoming federal/USACE Rudee Inlet maintenance dredging project to be bid in the Fall of 2020. Tourism To expand the tourism sector of the economy, City Council has supported and/or funded multiple initiatives. Convention quality hotels – As of July 2020 the available hotel room inventory in the City consisted of 10,437 hotel rooms located in 141 properties (excluding 924 timeshare units rented as hotel rooms), reflecting an increase of 20 (.02%) hotel rooms compared with July, 2019 (10,417 hotel rooms in 140 properties). The City has offered incentives for the development of convention quality hotels, including restoration of the historic Cavalier Hotel (opened in March 2018) and its two companion hotels, the Oceanfront Marriott Hotel with parking garage (adding 305 rooms and opened in May 2020), and Embassy Suite Convention Hotel Campus (anticipated to open during
xvii

2022). It is anticipated that these three hotels will produce annual revenues of $2 million to the City in Year 1 growing to $6 million by Year 7 with net present value over 20-years to the City of $65 million, net of City incentives.
Sports Center - On July 10, 2018, the City Council authorized the design-build of the Virginia Beach Sports Center. Construction of the 285,000 square-foot facility began in August 2018 at total project cost of $68 million. The Center will be City-owned and privately operated, and the debt for the project will be paid by tourism funds through the Tourism Investment Program Fund, which includes primarily hotel and restaurant meal taxes generated by visitors. This project is designed to attract tournament events from outside the region and provide an amenity for local events. The Center opened in November 2020. It is anticipated to add 68 sporting events annually having a fiscal impact of $4.2 million by the fifth year of operation.
Aquarium - Findings from an FY 2018 economic impact study conducted by Sage Policy Group, Inc. indicated that the Virginia Aquarium generated $257 million in economic impact (direct, indirect and induced) in Virginia Beach annually including 3,250 jobs, and that each Aquarium visitor generated $12 in tax revenues to the City. The City is making the following reinvestments: Construction of the Darden Marine Animal Conservation Center (began September 2018 with completion scheduled for spring 2021) totaling $18.1 million, of which $4.5 million is from the Virginia Aquarium Foundation. The project consists of two buildings totaling 18,000 square-feet. This facility will provide seawater access; animal care areas to support acquisitions/quarantine, educational outreach, and stranded animal rehabilitation; support areas for stranding response and research; laboratory spaces; and office/technical spaces for staff and volunteers. Construction of two Aquarium projects for the Owls Creek Marsh Pavilion facility with a total project cost of $28.9 million of which the Virginia Aquarium Foundation is providing $9.3 million (began in May 2020 with scheduled opening summer 2021). One project will renovate the Aquarium’s 22-year old Marsh Pavilion including new exhibits funded by the Aquarium Foundation and expanded parking. The second project will construct an adjacent Veterinary Care Center needed to meet the Association of Zoos and Aquariums accreditation standards for animal care.
xviii

The Aquarium began an aggressive Master Planning process in 2019, and future plans include a 1,500-space parking structure, a new state-of-the-art exhibit building on the current surface parking lot, and renovations of the existing 30-year old main building.
Atlantic Park (Dome site) – The Virginia Beach Development Authority negotiated a development agreement with Venture Realty Group for a $325 million mixed-use, multi-venue entertainment complex on the former Dome site, a 10.35-acre site over three blocks between 18th and 20th Streets at the oceanfront. The development agreement was approved by City Council in November 2019 with the goal of making the Oceanfront area a year-round destination. The complex will include retail, multi-family housing, a Wavegarden Surf Park, and a 3,500-seat music venue. The project will involve private financing of $230 million and a City contribution of approximately $95 million for parking, streetscapes, and an entertainment venue. The City’s contribution will be funded by the City’s Tourism Investment Program Fund. The agreement will entail a performance grant of $5 million over 20 years from the project generated tax revenues. Construction is anticipated to begin in 2021 with completion by 2025. Education Virginia Beach Public Schools is the largest school division in the region, with enrollment of 66,816 for FY 2020 consisting of 55 elementary schools, 15 middle schools, 12 high schools, and a number of secondary/post-secondary specialty centers. The Virginia Beach City Public School (VBCPS) division is one of four school divisions in the region to be 100% fully accredited for its 82 schools for the third consecutive year. For the 12th consecutive year, VBCPS has reached a record-high On-Time Graduation rate of 94.2% (compared with 93.9% in 2019) while its drop-out rate decreased to 2.39% (compared with 3% in 2019) the lowest on record. Since 2007, Virginia Beach City Public Schools has modernized or replaced twelve school facilities, representing a capital investment of $457 million dollars. Currently construction is progressing on three schools:
The $28.0 million modernization of John B. Dey Elementary School (ES), which is estimated to be completed fall 2020. The $32.5 million replacement of Thoroughgood ES is estimated to be completed in fall 2020.
xix

The $77.2 million replacement of Princess Anne Middle School is estimated to be completed in 2021.
With these three schools, 34 school facilities have been modernized or replaced in the past two decades; a capital investment of approximately three quarters of a billion dollars. Volunteerism The City has a long history of using volunteers to provide and/or assist in the provision of various services. For FY 2020, 31 departments reported use of 11,892 volunteers, who contributed 996,068.55 hours of service (equivalent to 478.88 full-time equivalent positions) valued at $27.1 million or an estimated savings on the real estate tax of 4.6-cents per $100 of assessed value. Volunteers in the Department of Emergency Medical Services (EMS) provide administrative support and serve on ambulances as patient care providers from ten independent Volunteer Rescue Squads. Virginia Beach EMS reflects the largest use of third service volunteer EMS providers in the nation. All volunteers for EMS numbered 1,195 and provided 374,472.75 hours of service equivalent to 180.03 FTEs valued at over $10.1 million. In FY 2020, the Volunteer Rescue Squads were comprised of 533 (varies daily) highly trained and certified volunteer Emergency Medical Technicians (EMT) and Paramedics distributed throughout the 17 EMS stations. The volunteers are augmented by 46 field career paramedics to ensure staffing of a minimum of 9 ambulances daily (average was 12.6 in FY 2020) with the goal of 1 ambulance per 3,000 calls for service (totaling 16 ambulances). There were over 46,000 calls for service in FY 2020. The Volunteer Rescue Squads rely on donations, grants from the State, and City support (fuel and maintenance for ambulances, insurance, training, and etc.) to operate and do not charge users for their services. Economic Development In order to meet the City’s goal to grow the tax base, the City has an ongoing Economic Development Incentive Program (EDIP) to promote business development and expansion. Since the inception of EDIP in 1994, the City and VBDA have awarded 298 EDIP grants totaling $65.5 million, which was intended to generate more than $2.5 billion in private investment and create and retain 38,983 jobs. For FY 2020, a total of $2.5 million of EDIP grants were approved for 14 projects, which are intended to leverage more than $119.7 million in private investment (ratio of $47 of private investment to $1 of public investment) and the creation/retention of 2,892 jobs in the City. Some businesses receiving EDIP wards include Apex Systems, DOMA Technologies, InMotion Hosting, Priority Title & Escrow, Olympia Development, and 17th Street Properties. Based on data for the first quarter of 2020 from the Virginia Employment Commission data, businesses with fewer than 50 employees comprise over 95% of all businesses in Virginia Beach. Small, Women-and Minority-Owned and Service Disabled Veteran-Owned (SWaM) businesses received $325,000 of these EDIP grants (13%), which is intended to generate 359 new full-time positions and $5.9 million in capital investment (ratio of $18 of private investment to $1 of public investment); SWaM businesses receiving awards include DOMA Technologies, G2 Ops and SJS Executives. In response to the impacts of the coronavirus pandemic on small businesses, City Council has authorized the use of existing EDIP funds totaling $1.5 million in FY 2020 for a Small Business Emergency Assistance Program. This program provided grants up to $10,000 to small businesses (fewer than 250 employees) for assistance with rent, utilities, taxes and other business expenses related to the coronavirus pandemic. Also, for FY 2021, City Council provided an additional $1 million of tax relief for small businesses through the Small Business Emergency Assistance
xx

Program. During the COVID-19 pandemic business and industry continued to grow. Between May and July 2020 there have been nine announcements of new businesses or business expansions that anticipate generating 756 new jobs and $136.1 million in capital investment. These include various sectors: manufacturing (Acoustical Sheetmetal), defense/manufacturing (SJS Executives), other professional services (Priority Title and Escrow), office/defense (Valkyrie Enterprises), office-biomedical-light industrial (YNOT Office Park, London Bridge CC), information technology recruitment (APEX Systems), information technology (ACA International), and hospitality (Town Center Hotel). The City continues initiatives to diversify the local economy beyond defense and tourism industries with the development of technology, bioscience, advanced manufacturing and offshore wind energy industries. Highlights of these efforts are as follows: Digital Port - The City is a growing international digital port for high-speed fiber-optic subsea telecommunication cables and associated data centers, which create higher-paid tech jobs as well as attract new businesses requiring high-speed data transmission. Subsea cables serve as the major carriers of the internet and are responsible for the majority of the world’s digital traffic. Corporate Landing Business Park, a 325-acre, light industrial, research and data center park, is the city’s hub for the digital port. In order to attract this industry, the City is offering reduced tax rates on data center equipment, fiber access hubs, streamlined permitting process, and available data center sites certified by Dominion Energy. Two cables have recently been constructed and two additional cable projects have been announced and are in various stages of development. One data center has been constructed and two additional projects announced during 2018 and are in various stages of development. The four cables are depicted in the following map:
Microsoft, Facebook and Telxius constructed the first sub-sea cable, MAREA, connecting Bilbao Spain to Virginia Beach (a distance of 4,000 miles) that became operational during fall 2017. This cable can transport 160 terabytes per second (Tbps). It is supported by Telxius Data
xxi

Center/Cable Landing Station that has a direct connection to one of the largest concentration of data centers in the world, located in Ashburn, Virginia. Telxius has completed a second under-sea cable, BRUSA, connecting Rio De Janeiro, Brazil and Puerto Rico to Virginia Beach (a distance of 6,800 miles), which became operational in 2018. It is supported by Telxius Data Center/Cable Landing Station that has a direct connection to one of the largest concentration of data centers in the world, located in Ashburn, Virginia. This cable can transport 160 Tbps and was designed to adapt and evolve with the growing demand for technology. Google announced in 2018 the construction of its Dunant cable from France’s Atlantic coast to Virginia Beach to expand its network and support growth of the Google Cloud, with anticipated completion in late 2020. It will be a 6,600 km long cable designed to deliver capacity of 300 Tbps and will land at the Telxius Data Center/Cable Landing Station. Assured Communications Advisors (ACA) International LLC and South Atlantic Express International Ltd announced in 2018 a new cable, SAEx, to link Cape Town, South Africa to Virginia Beach (a distance of 8,000 miles), which is planned to be operational in the third quarter of 2021.This cable is designed with minimum capacity of 108 Tbps. Data centers are being constructed in Virginia Beach to support the industry and newly constructed cables. Some of the new projects include: Globalinx completed a 10,750 square-foot carrier-neutral colocation carrier hotel facility and data center (Phase I) that opened in the first quarter of 2019 and a Phase II expansion of the data center is underway. This is a four-phase 21-acre data center campus that at completion, will consist of a carrier hotel and four data center buildings totaling over 280,000 square feet. Globalinx has entered into a purchase agreement to acquire 10 acres from the VBDA at $200,000 per acre to build Phase IV of their data center campus. NxtVn Virginia Beach DigiPorts acquired 10 acres with an option to purchase a total of 219 acres across Dam Neck Road from Corporate Landing Business Park to develop a data center campus of up to 1.4 million square feet at estimated cost of $1.5 to $2 billion. ACA International LLC has announced that it will be the first tenant at the NxtVN Virginia Beach DigiPorts campus. Development is underway to build a 170,000 square-foot data center later in 2020.
PointOne, a hyperscale data center developer headquartered in Alberta, Canada, will invest $80 million in Virginia Beach with the acquisition of 10.4 acres from the VBDA for $2.08 million and construction of NAP of Virginia Beach, enterprise-class data center and cable landing station campus. It will consist of two 31,000 square-foot data facilities that will house edge computing data centers, a cable landing station for eight-plus future subsea cables and an international internet business exchange. Located across the street (400 yards) from the Telxius Cable Landing Station, this data center will have direct tie-in access to the MAREA and BRUSA cables. Phase I construction began in summer 2019 and continued through summer 2020 . The facility is designed to withstand up to 200-mph winds and is being built at 15-feet above sea level. Innovation Park Infrastructure Improvement - This project represents the first phase of infrastructure needed to support the 155-acre Innovation Park, with anticipation of multiple phases to follow. The project includes the design and construction of a two-lane undivided parkway,
xxii

including utility and stormwater infrastructure, that extends east from Landstown Center Way, a distance of approximately 1,200 feet. Construction of the access road is underway in 2020. This project includes on-road bicycle accommodations and shared-use paths as well as and long-range planning for the Innovation Park. Also, in the Princess Anne corridor in the vicinity of the Nimmo Parkway/West Neck Road intersection, the State Department of Veterans Services began construction in summer 2019 of a 150,000 square-foot 128-bed rehabilitation and nursing facility for retired veterans, known as The Jones & Cabacoy Veterans Care Center. The facility will be located on 24-acres donated by the City to the Commonwealth of Virginia and is scheduled to open in 2022. The City is extending Nimmo Parkway ($4.5 million total project cost) to access the facility, with estimated completion in fall 2020. Bioscience Business Development - In March, 2019 with the culmination of the first VABeachBio Innovation Challenge, a business development challenge for biotech startup companies that began in fall 2017, 19 teams were selected to become new Virginia Beach bio-tech companies in fields such as cancer, diabetes, therapeutics, and medical device development. The City is leasing 5,706 square feet of space for the VaBeach Bio Accelerator, a new space at Convergence Center II. The space will be available to both small companies and winners of the VABeachBio Innovation Challenge — an incubator program for life sciences startups. Industry experts will nurture these companies and help them grow in the hopes that they will create new jobs and provide breakthroughs in medicine. It is anticipated that the Bio Accelerator will open in January 2021. Town Center - Town Center, an emerging downtown core in the heart of Virginia Beach’s Central Business District, features a vibrant urban mix of upscale retail, Class A office space, luxury residential units, entertainment, two performing arts centers, a central park, and other cultural facilities. The 25-acre development spans 17 city blocks. The ongoing mixed-use development encompasses more than 800,000 square feet of Class A office space, 700,000 square feet of upscale retail, dining and business-class hotels. To date, Armada Hoffler has invested nearly $487.8 million in the Town Center of Virginia Beach and the City has contributed $108 million of public investment. The success of Town Center has been a catalyst for other projects in the area. Construction of a $19 million, 14-story, 120-room Hampton Inn by Hilton is currently under development and is expected to generate $30 million in revenue over 25 years, which would generate about $9 million in tax revenue that would be reinvested into Town Center. The Central Business District will be home to two business accelerators: Virginia Beach Hive (VBH)-Incubator-Stabilization-Acceleration and Bio Accelerator for supporting innovation and entrepreneurship. The VBH will serve as a business incubator to develop business competitiveness, jobs creation, investment opportunities, infrastructural improvements, global inclusion and participation within the Hampton Roads community. VBH will strive to be recognized as the entrepreneurial, small business change-agent for the Hampton Roads business community. It is designed and developed to support an innovative
xxiii

and entrepreneurial ecosystem in Hampton Roads through collaboration with the City of Virginia Beach, academic institutions, other cities in Hampton Roads, Small Business Association, and other entrepreneurial related organizations. Offshore Wind Energy - On August 7, 2018, City Council adopted a resolution expressing its support for and commitment to the creation of an offshore wind energy industry and reaffirmed this commitment on August 6, 2019 in a second resolution. On September 16, 2019, Governor Northam issued Executive Order 43 calling on state agencies to develop a plan for Virginia to produce 30% of its electricity from renewable sources by 2030 and to be fully carbon-free by 2050. Thereafter on September 19, 2019, Dominion Energy announced a $7.8 billion project to expand its $300 million wind energy demonstration project under construction on 27 miles off the Virginia Beach coast. The expanded project will involve the construction of up to 220 giant wind turbines to generate 2,600 megawatts of electricity by 2026 enough to power 650,000 homes. Virginia/Carolina Offshore Wind Energy projects underway:
• Avangrid Renewables and its affiliate Kitty Hawk Wind LLC.: Development of 2.5 gigawatt, $5-8 billion Kitty Hawk offshore wind energy with two substations in Virginia Beach. Avangrid had recently secured an option from the City to acquire 20 acres in Princess Anne Commons and from the VBDA to acquire 30 acres in Corporate Landing Business Park to locate the substations. Local investment is estimated to be $60 million to $310 million and create 11,500 jobs regionally.
• Coastal Virginia Offshore Wind-Dominion Energy: Development of two 6-megawatt turbines on 2,135-acre site which lies 27 miles off the coast of Virginia Beach, generating about 12 megawatts to power 3,000 homes later in 2020. Project’s capital cost is $300 million and the major participants are Ørsted for the offshore installation and L.E. Meyers for the onshore installation. Project ground-breaking occurred on July 1, 2019. Dominion Energy announced on June 29, 2020, the successful installation of Coastal Virginia Offshore Wind pilot project. The first offshore wind farm to be approved by the Bureau of Ocean Energy Management and installed in federal waters, and second constructed in the United States, was built safely and on schedule despite the worldwide impact from the coronavirus pandemic. Several Virginia-based companies contributed to the pilot project and Dominion Energy remains committed to creating the expertise to position Virginia Beach to be a supply chain hub for U.S. offshore wind efforts and create thousands of clean energy jobs in Virginia.
Advanced Manufacturing Virginia Beach is continuing its effort to enhance the industrial ecosystem. The continued industrial attraction is dependent on more sites inventory Tier rating. Virginia Beach is working closely with Hampton Roads Economic Development Alliance and Virginia Economic Development Partnership (VEDP) through VEDP Business Ready Sites Program. The program
xxiv

has two components: (i) site characterization to ascertain and designate a site’s level of development and (ii) site development to further develop the sites. The goal of site development is to develop a pool of potential sites in the City that are well prepared and positioned for selection and development by prospective economic development projects that are ready to commit to the construction of a facility. These potential sites are typically at a site characterization Tier Level 4 or 5. Corporate Landing Business Park received a Tier 4 site rating. The VBDA has also applied for a GO Virginia Grant to complete Phases 2, 3 and 4 of infrastructure work to get the reminder eighty acres to Tier 4 site rating, a site readiness program in collaboration with Virginia Economic Development Partnership, Hampton Roads Planning District Commission, Reinvent Hampton Roads and Hampton Roads Alliance. This effort will assist in promoting the availability of shovel-ready sites to prospective businesses. INTERNAL CONTROL AND BUDGETARY ACCOUNTING The City’s management team is responsible for establishing and maintaining an internal control structure to protect the assets of the government from loss, theft or misuse and to ensure that adequate accounting data are compiled to allow for the preparation of financial statements in conformity with generally accepted accounting principles. The internal control structure is designed to provide reasonable, but not absolute, assurance that these objectives are met. The concept of reasonable assurance recognizes that: (1) the cost of a control should not exceed the benefits likely to be derived; and (2) the valuation of costs and benefits requires estimates and judgments by management. The City also maintains an encumbrance accounting system as one technique of accomplishing budgetary control. Appropriations for the subsequent fiscal year are increased in the amount necessary to satisfy the un-liquidated balance of encumbrances at year-end. FINANCIAL MANAGEMENT POLICIES The City employs several policies to provide the framework for sound financial management. City Council’s continuing fiscal policies include maintaining existing services to the extent possible; positioning the City to withstand local and regional economic disruptions; meeting the demands of natural growth, decline and change; ensuring that citizens understand and support the need for fiscal sustainability and the policies through which it is achieved; maintaining a diverse tax base; maintaining and monitoring existing debt policies; and providing for special services and projects through special dedicated revenue generation (e.g. Tourism Investment Program and the Tourism Advertising Program Special Revenue Funds). City Council’s policies provide overall direction and guidance for resource management. In addition, these policies resulted in the high level of financial strength that led to and continue to support the City’s bond rating on its General Obligation Bond debt of Triple-A by S&P Global Ratings (S&P), Moody’s Investors Service (Moody’s), and Fitch Ratings Inc. (Fitch). Several the City’s financial management policies govern how the operating budget is prepared and managed. For example, the budget will be balanced on a current year revenue to expenditure basis, unencumbered budget appropriations (except for those for capital projects and grants) will lapse at the end of the fiscal year, the appropriation ordinance will set the legal level of budgetary control and the City will set fees and user charges for each self-supporting enterprise fund at a level that fully supports costs. Regarding fund balance policies, the unassigned fund balance or net position of any fund shall not be used to finance continuing expenditures. Additionally, the city shall
xxv

maintain an unassigned fund balance in the General Fund of 8%-to-12% of the following year’s budgeted revenues, equating to approximately one month of operating expenses. The City further maintains policies that specify what projects may qualify as capital projects. In general, the project must be a major expenditure of over $250,000 that is ongoing in nature or requires multi-year funding. There are specific criteria used to determine whether a project will be funded by bond referendum or by Charter Bonds, or subject-to-appropriation financing. The City issues bonds for capital improvements with a cost in excess of $250,000, or which cannot be financed from current revenues. Debt management policies are presented in the following section. DEBT MANAGEMENT POLICIES The City has developed a series of Debt Management Policies to provide a functional tool for debt management and capital planning. The policies reiterate the City’s commitment to rapid principal retirement, maintaining sufficient working capital to avoid the use of short-term borrowing for operating purposes, and the use of self-supporting or revenue-supported debt where appropriate. The policies also establish target levels for key debt ratios as shown below. As shown in the following table, all debt affordability indicators were within the established guidelines for FY 2020.
Ratio Description Established Guidelines
As of June 30, 2020
Annual Debt Service to General Government Expenditures
No greater than 10% 7.7%
Overall Net Debt to Estimated Full Value of Taxable Property
No greater than 3.5% 1.7%
Overall Net Debt Per Capita No greater than $3,000 $2,199
Overall Net Debt Per Capita to Per Capita Personal Income
No greater than 6.5% 3.7%
For the eleventh consecutive year, three major rating agencies, Fitch, Moody’s and S&P, affirmed the City’s triple-A ratings with stable outlooks on its General Obligation Bonds. Ratings for Public Facility Revenue Bonds (appropriations supported) were generally one notch below the General Obligation rating at AA+/Aa1 and Aa2/AA+ by Fitch, Moody’s and S&P, respectively. Moody’s assigned a rating of Aa2 to the Series 2020B reflecting the less essential nature of the financed projects and the underlying rating of the refunded Series 2010B&C bonds. Water and Sewer Revenue Bonds were rated in September/October 2020 at AAA by Fitch and S&P and Aa1 by Moody’s with stable outlooks. Storm Water Revenue Bonds were rated in September 2020 by Fitch and Moody’s at AAA and Aa1, respectively, with stable outlooks. LONG TERM FINANCIAL PLANNING Annually, the City and Schools jointly prepare a five-year financial forecast of revenues and expenditures for the City’s General Fund and Schools Operating Fund, which serves as a planning
xxvi

tool for the annual operating budget. This forecast establishes a framework for use in decision making by highlighting significant issues that must be addressed to maintain a structurally balanced budget. It assists the City in understanding the fiscal challenges ahead and the need to establish priorities. This forecast identifies key factors that affect the City’s fiscal outlook such as changes in major revenue streams and costs. The City has established several General Fund reserves of fund balance including a general-purpose reserve, which holds funds to protect the City from unforeseen increases in expenditures or reductions in revenues, or other extraordinary events which could adversely impact the fiscal health of the City. Specific purpose reserves are created to meet identified future obligations and to fund capital projects. The City’s six-year Capital Improvement Plan is reviewed and revised annually to reflect changing conditions affecting existing projects and changing City Council priorities. This review identifies needed capital projects, estimates capital requirements, develops project financing and timing, and estimates operational expenses of projects subsequent to completion. CERTIFICATE OF ACHIEVEMENT AND AWARDS The Government Finance Officers Association of the United States and Canada (GFOA) awarded a Certificate of Achievement for Excellence in Financial Reporting to the City of Virginia Beach for its Comprehensive Annual Financial Report for the fiscal year ended June 30, 2019. This reflects the 41st time that the City has achieved this prestigious award over many years. In order to be awarded a Certificate of Achievement, a government must publish an efficiently organized CAFR providing full disclosure and transparency. This report must satisfy both GAAP and applicable legal requirements. A Certificate of Achievement is valid for a period of one year only. We believe that our current CAFR continues to meet the Certificate of Achievement Program's requirements, and we are submitting it to the GFOA to determine its eligibility for another certificate. In addition, the City was also awarded for the second time a Certificate of Achievement for Excellence in Financial Reporting by the GFOA for its Popular Annual Financial Report. The GFOA also presented a Distinguished Budget Presentation Award to the City of Virginia Beach for its annual budget for the fiscal year beginning July 1, 2019 (FY 2020). This reflects the 34th time the City has achieved this prestigious award over many years. In order to receive this award, a governmental unit must publish a budget document that meets program criteria as a policy document, an operations guide, a financial plan, and a communications device. The award is valid for a period of one year only. We believe our current budget continues to conform to program requirements, and we have submitted it to GFOA to determine its eligibility for another award. The National Institute of Governmental Purchasing's Outstanding Agency Accreditation Award (OA4) was awarded to the City of Virginia Beach from 2016 through 2022. This OA4 accreditation formally recognizes excellence in public procurement through the establishment of a body of standards that evidence sound procurement practice. The City of Virginia Beach is part of an elite group of procurement organizations as one of only 151 government agencies that have attained this distinction in the United States and Canada. Additionally, in 2019, the City was awarded the Achievement of Excellence in Procurement from the National Procurement Institute for the fourth consecutive year. The City of Virginia Beach is one of only eight agencies in Virginia and one of only 65 cities in the United States and Canada to receive the award. The Purchasing Division also
xxvii

received the Excellence in Achievement Award from Universal Public Procurement Certification Council in 2019. The award recognizes exceptional agencies that achieve a fully certified procurement staff.
ACKNOWLEDGMENTS
During the year, the staff of the Departments of Finance, Budget and Management Services as well as financial staff of other departments rendered professional and knowledgeable services to the City. We are most appreciative of these efforts and take this opportunity to recognize these outstanding public servants. They maintain the accounting records of the City on a current and timely basis and deserve special consideration.
City Council provides meaningful oversight of the financial affairs and policies of the City. Their support results in a strong financial position for the City and they are to also be commended.
Respectfully submitted,
� ·ti.--, P---z;;Patrick A. Duhaney City Manager
Wendy Hu, CPA Controller & Acting Co-Director of Finance
xxviii

xxix

This Page Intentionally Left Blank
xxx

FINANCIAL SECTION


CliftonLarsonAllen LLP CLAconnect.com
INDEPENDENT AUDITORS' REPORT
The Honorable Members of the City Council of
City of Virginia Beach, Virginia Report on the Financial Statements We have audited the accompanying financial statements of the governmental activities, business-type activities, the aggregate discretely presented component units, each major fund, and the aggregate remaining fund information of the City of Virginia Beach, Virginia (the City), as of and for the year ended June 30, 2020, and the related notes to the financial statements, which collectively comprise the entity’s basic financial statements as listed in the table of contents. Management’s Responsibility for the Financial Statements Management is responsible for the preparation and fair presentation of these financial statements in accordance with accounting principles generally accepted in the United States of America; this includes the design, implementation, and maintenance of internal control relevant to the preparation and fair presentation of financial statements that are free from material misstatement, whether due to fraud or error. Auditors’ Responsibility Our responsibility is to express opinions on these financial statements based on our audit. We did not audit the financial statements of the Virginia Beach Community Development Corporation, a discretely presented component unit, which represents 3.0 percent of the assets, -12.5 percent of the net position, and 0.6 percent of the revenues of the aggregate discretely presented component units. Those financial statements were audited by other auditors, whose reports thereon have been furnished to us, and our opinion, insofar as it relates to the amounts included for the Virginia Beach Community Development Corporation is based solely on the reports of the other auditors. We conducted our audit in accordance with auditing standards generally accepted in the United States of America and the standards applicable to financial audits contained in Government Auditing Standards, issued by the Comptroller General of the United States. Those standards require that we plan and perform the audit to obtain reasonable assurance about whether the financial statements are free from material misstatement. An audit involves performing procedures to obtain audit evidence about the amounts and disclosures in the financial statements. The procedures selected depend on the auditors’ judgment, including the assessment of the risks of material misstatement of the financial statements, whether due to fraud or error. In making those risk assessments, the auditor considers internal control relevant to the entity’s preparation and fair presentation of the financial statements in order to design audit procedures that are appropriate in the circumstances, but not for the purpose of expressing an opinion on the effectiveness of the entity’s internal control. Accordingly, we express no such opinion. An audit also includes evaluating the appropriateness of accounting policies used and the reasonableness of significant accounting estimates made by management, as well as evaluating the overall presentation of the financial statements.
xxxi

The Honorable Members of the City Council of City of Virginia Beach Page 2
We believe that the audit evidence we have obtained is sufficient and appropriate to provide a basis for our audit opinions. Opinions In our opinion, based on the audit report and the report of other auditors, the financial statements referred to above present fairly, in all material respects, the respective financial position of the governmental activities, the business-type activities, the aggregate discretely presented component units, each major fund, and the aggregate remaining fund information of the City as of June 30, 2020, and the respective changes in financial position and, where applicable, cash flows thereof for the year then ended in accordance with accounting principles generally accepted in the United States of America. Other Matters Required Supplementary Information Accounting principles generally accepted in the United States of America require that the management discussion and analysis, the budgetary comparison schedules, notes to the budgetary comparison schedules, and the Public Employee Retirement System-Primary Government schedules, as identified in the accompanying table of contents be presented to supplement the basic financial statements. Such information, although not a part of the basic financial statements, is required by the Governmental Accounting Standards Board who considers it to be an essential part of financial reporting for placing the basic financial statements in an appropriate operational, economic, or historical context. We have applied certain limited procedures to the required supplementary information in accordance with auditing standards generally accepted in the United States of America, which consisted of inquiries of management about the methods of preparing the information and comparing the information for consistency with management’s responses to our inquiries, the basic financial statements, and other knowledge we obtained during our audit of the basic financial statements. We do not express an opinion or provide any assurance on the information because the limited procedures do not provide us with sufficient evidence to express an opinion or provide any assurance. Other Information Our audit was conducted for the purpose of forming opinions on the financial statements that collectively comprise the City’s basic financial statements. The combining and individual nonmajor fund financial statements are presented for purposes of additional analysis and are not a required part of the basic financial statements.
xxxii

The Honorable Members of the City Council of City of Virginia Beach Page 3
The combining and individual nonmajor fund financial statements are the responsibility of management and were derived from and relate directly to the underlying accounting and other records used to prepare the basic financial statements. Such information has been subjected to the auditing procedures applied in the audit of the basic financial statements and certain additional procedures, including comparing and reconciling such information directly to the underlying accounting and other records used to prepare the basic financial statements or to the basic financial statements themselves, and other additional procedures in accordance with auditing standards generally accepted in the United States of America. In our opinion, the information is fairly stated, in all material respects, in relation to the basic financial statements as a whole. The introductory section and statistical section, as listed in accompanying table of contents, have not been subjected to the auditing procedures applied in the audit of the basic financial statements, and accordingly, we do not express an opinion or provide any assurance on it. Other Reporting Required by Government Auditing Standards In accordance with Government Auditing Standards, we have also issued our report dated November 30, 2020, on our consideration of the City's internal control over financial reporting and on our tests of its compliance with certain provisions of laws, regulations, contracts, and grant agreements and other matters. The purpose of that report is solely to describe the scope of our testing of internal control over financial reporting and compliance and the result of that testing, and not to provide an opinion on the effectiveness of the entity’s internal control over financial reporting or on compliance. That report is an integral part of an audit performed in accordance with Government Auditing Standards in considering City of Virginia Beach’s internal control over financial reporting and compliance.
CliftonLarsonAllen LLP
Arlington, Virginia November 30, 2020
xxxiii

This Page Intentionally Left Blank
xxxiv

MANAGEMENT’S
DISCUSSION AND ANALYSIS


CITY OF VIRGINIA BEACH, VIRGINIA MANAGEMENT’S DISCUSSION AND ANALYSIS
MANAGEMENT’S DISCUSSION AND ANALYSIS
The management of the City of Virginia Beach (the "City") provides this narrative overview and analysis of theCity’s financial performance during the fiscal year that ended June 30, 2020. Readers are encouraged to consider theinformation presented here in conjunction with the transmittal letter at the front of this report and the City’s financialstatements which follow this section.
FINANCIAL HIGHLIGHTS
At the end of the fiscal year 2020, the total net position of the City on a government-wide basis, excludingcomponent units, was $3.9 billion. Of this amount, the unrestricted net position totals $511.9 million. Total netposition increased by $85.7 million from the prior fiscal year end's net position.
The total net position for governmental activities was $2.6 billion, an increase of $49.8 million over the prioryear's net position.
The business-type activities net position was $1.2 billion, an increase of $35.9 million over the prior year'snet position.
As of the close of fiscal year 2020, the City’s governmental funds reported combined ending fund balances of$754.6 million a increase of $156.8 million in comparison with the prior year.
$11.3 million, or 1.5%, is considered nonspendable (inventories and loans receivable)
60.3 million, or 8.0%, is restricted by outside agencies
$408.5 million, of 54.1%, is committed for the capital improvement program
$126.2 million, or 16.7%, is assigned for specific purposes as identified by the City
$149.3 million, or 19.8%, is unassigned in the general fund and is available for spending at the City'sdiscretion
The City's total bonded debt increased by $245.3 million, or 13.4% from fiscal year 2019.
For the eleventh consecutive year, all three major rating agencies, Standard & Poor’s, Moody’s Investor Serviceand Fitch Ratings, affirmed the City’s triple-A ratings on its General Obligation bonds.
1

CITY OF VIRGINIA BEACH, VIRGINIA MANAGEMENT’S DISCUSSION AND ANALYSIS
OVERVIEW OF THE FINANCIAL STATEMENTS
This Comprehensive Annual Financial Report (CAFR) consists of four sections: introductory, financial, andstatistical. The financial section is illustrated in the following Figure 1. This section of the report has threecomponents: Management’s Discussion and Analysis (this section), the basic financial statements, and the requiredsupplementary information.
The City's basic financial statements comprise three components: government-wide financial statements, fundfinancial statements and notes to the basic financial statements. The government-wide financial statements provideboth long-term and short-term information about the City's overall financial status. The fund financial statementsfocus on the individual parts of the City government, reporting the operations of the City in more detail than thegovernment-wide statements. Both perspectives (government-wide and individual fund) allow the reader to addressrelevant questions, broaden the basis for comparison (year-to-year or government to government), and enhance theCity's accountability. The notes to the basic financial statements explain some of the information in the financialstatements and provide more detailed data. This section is followed by the required supplementary information thatfurther explains and supports the information in the financial statements.
Figure 1: Components of the Financial Section
Government-Wide Financial Statements
The government-wide financial statements report information about the City as a whole, using accounting methodssimilar to those used by private sector companies. The two government-wide statements, statement of net positionand statement of activities, report the City's net position and how it has changed. The Statement of Net Positionpresents information on all of the City’s assets and deferred outflows of resources compared to liabilities anddeferred inflows of resources, with the difference between them reported as net position. The Statement of Activitiespresents information showing how the City’s net position changed during the most recent fiscal year. It accounts forall of the current year's revenues and expenses, regardless of when cash is received or paid.
Over time, increases or decreases in the City's net position are indicators of whether its financial health is improvingor deteriorating. To assess the overall health of the City, one needs to consider other non financial factors such aschanges in the City's property tax base and condition of the City's infrastructure.
The government-wide financial statements of the City are divided into three categories:
Governmental Activities - Most of the City's basic services are included here, such as police, fire and other publicsafety services, parks and recreation, public works, and general administration. Property and sales taxes, charges forservices, and state and federal grants finance most of these activities.
2

CITY OF VIRGINIA BEACH, VIRGINIA MANAGEMENT’S DISCUSSION AND ANALYSIS
Business-type Activities - The City's water and sewer, storm water, waste management, certain economicdevelopment functions (blended component unit Virginia Beach Development Authority (VBDA)), and parkingoperations are reported here. Fees charged to customers help cover the costs of providing these services.
Component units - The City includes three other entities in its report - the City of Virginia Beach School Board(Schools), the Development Authority and the Community Development Corporation (CDC). Although legallyseparate, these "component units" are important because the City is financially accountable for them, providingoperating and capital funding. The Development Authority is presented as a blended component unit and included inthe City’s reporting entity. The School Board and CDC are presented as discretely component units and reported inseparate columns of the entity-wide statements.
Fund Financial Statements
The fund financial statements provide detailed information about the City's most significant funds and will be morefamiliar to traditional readers of government financial statements. The fund financial statements focus on majorfunds rather than fund types.
A fund is a grouping of related accounts used to maintain control over resources that have been segregated forspecific activities or objectives. The City uses fund accounting to ensure and demonstrate compliance withfinance-related legal requirements, such as general statutes or the City’s budget ordinances. The City’s funds aredivided into the following categories:
Governmental funds - Most of the City’s basic services are included in governmental funds, which focus on (1) howreadily cash and other financial assets can be converted to cash flow in and out and (2) year-end balances that areavailable for spending. Consequently, the governmental funds statements provide a short-term view that helpsdetermine whether there are more or fewer financial resources that can be spent in the near future to finance theCity's programs. Because this information does not encompass the additional long-term focus of thegovernment-wide statements, additional information is provided at the bottom of the governmental funds statementsthat explain the relationship (or differences) between them. Governmental funds include the General Fund, DebtService Fund, Capital Projects Fund, and special revenue funds (such as Parks and Recreation and the TourismInvestment Program).
Proprietary funds - Services for which the City charges customers a fee are generally reported in proprietary funds.These funds, like the government-wide statements, provide both long-term and short-term financial information. TheCity's enterprise funds (one type of proprietary fund) are the same as its business-type activities, but the fundfinancial statements provide more detail and additional information, such as cash flows. The City utilizes enterprisefunds to account for its water and sewer, storm water, waste management, certain economic development functions,and parking operations. The Development Authority is presented as a blended component unit and its proprietaryfund is included in the City’s reporting entity as a major enterprise fund. The City uses internal service funds (theother type of proprietary fund) to report activities that provide supplies and services for the City's other programs andactivities. The City’s internal service funds are used for providing city garage and fuel services, risk management,school site landscaping, and technology services.
Fiduciary funds – Used to account for assets held by the City in a trustee capacity or as an agent for individuals,private organizations and other governmental units. The City is responsible for ensuring that the assets reported inthese funds are used for their intended purposes. The fiduciary funds include agency funds (Special Welfare andEscheat Property), and trust funds (Sheriff’s Pension and Other Postemployment Benefits). Agency funds arecustodial in nature (assets equal liabilities) and do not involve measurement of results of operations. These fiduciaryactivities are excluded from the City's government-wide financial statements because the City cannot use these assetsto finance its operations.
3

CITY OF VIRGINIA BEACH, VIRGINIA MANAGEMENT’S DISCUSSION AND ANALYSIS
FINANCIAL ANALYSIS OF THE CITY AS WHOLE
Net Position
The Statement of Net Position serves as a useful indicator of a government’s financial position. At the end of thefiscal year, the City’s total net position was $3.9 billion. This amount represents an increase of $85.7 million, or2.3%, over the prior year's net position. The net position for governmental activities increased by $49.9 million andthe business-type activities net position increased by $35.8 million.
The City’s total assets were $6.0 billion. This amount includes $4.7 billion of capital assets, net of accumulateddepreciation, which include roads, bridges, parks, utilities (water, sewer and storm water) infrastructure, land, otherlong-lived assets, and projects in the construction in progress program. Under the “tenancy in common” with theSchool Board, the City has included $359.4 million of net book value of School Board property equal to the totaloutstanding principal balance of the “on behalf” debt at June 30, 2020.
The largest component of the City’s net position ($3.3 billion or 84.3%) is the investment in capital assets (e.g., land,buildings, machinery, and equipment), net of any outstanding related debt used to acquire those assets. The Cityuses these capital assets to provide services to citizens; therefore, these assets are not available for future spending. Although the City’s investment in capital assets is reported net of related debt, it should be noted that the resourcesneeded to repay this debt must be provided from other sources, since the capital assets themselves cannot be used toliquidate these liabilities. Net investment in capital assets for business-type activities represents, for the most part, thecapital assets of the water, sewer, and storm water utilities.
At June 30, 2020, the City reported $511.9 million in the unrestricted category of its net position. This is $112.9million higher than last year’s net position of $399.0 million. The unrestricted category includes fund balances ofthe general fund, capital projects, and special revenue funds that have been committed or assigned at the fund level.
Table 1Statement of Net Position
(in Millions)
Governmental Business- Type Total PrimaryActivities Activities Government
2020 2019 2020 2019 2020 2019
Current and Other Assets $ 916.0 $ 781.5 $ 334.6 $ 344.3 $ 1,250.6 $ 1,125.8 Capital Assets 3,423.0 3,295.7 1,289.4 1,260.7 4,712.4 4,556.4 Total Assets 4,339.0 4,077.2 1,624.0 1,605.0 5,963.0 5,682.2
Deferred Outflows of Resources 126.8 78.1 11.5 7.2 138.3 85.3
Long-Term Debt Outstanding 1,706.3 1,443.8 364.9 381.9 2,071.2 1,825.7 Other Liabilities 69.4 82.5 34.0 31.0 103.3 113.5 Total Liabilities 1,775.7 1,526.3 398.9 412.9 2,174.5 1,939.2
Deferred Inflows of Resources 42.6 31.3 4.2 2.7 46.8 34.0
Net Position Net Investment in Capital Assets 2,304.4 2,382.8 966.4 920.3 3,270.8 3,303.1 Restricted 71.6 67.0 25.8 25.2 97.4 92.2 Unrestricted (Deficit) 271.6 147.9 240.3 251.1 511.9 399.0 Total Net Position $ 2,647.6 $ 2,597.7 $ 1,232.4 $ 1,196.6 $ 3,880.0 $ 3,794.3
4

CITY OF VIRGINIA BEACH, VIRGINIA MANAGEMENT’S DISCUSSION AND ANALYSIS
Changes in Net Position (Statement of Activities)
The following table shows the revenues and expenses of the governmental and business-type activities.
Table 2Changes in Net Position
(in Millions)
Governmental Business-Type TotalActivities Activities Primary Government
2020 2019 2020 2019 2020 2019 Revenues:Program Revenues: Charges for Services 90.8 99.1 220.8 215.0 311.6 314.1 Operating Grants & Contributions 230.8 189.4 - 0.1 230.8 189.6 Capital Grants & Contributions 9.4 22.4 5.0 27.1 14.4 49.5 General Revenues: Property Taxes 705.6 696.2 - - 705.6 696.2 Other Taxes 290.3 309.6 - - 290.3 309.6 Other 74.3 76.1 5.0 6.0 79.3 82.1 Total Revenues 1,401.2 1392.8 230.9 248.3 1,632.0 1,641.1
Expenses: Legislative 1.2 1.1 - - 1.2 1.1 Executive 5.1 5.0 - - 5.1 5.0 Law 4.6 4.4 - - 4.6 4.4 Finance 19.6 19.4 - - 19.6 19.4 Human Resources 12.3 12.4 - - 12.3 12.4 Judicial 67.3 63.5 - - 67.3 63.5 Health 3.7 3.7 - - 3.7 3.7 Police 90.2 97.2 - - 90.2 97.2 Human Services 125.7 121.5 - - 125.7 121.5 Public Works 184.3 221.6 - - 184.3 221.6 Parks & Recreation 53.8 53.8 - - 53.8 53.8 Library 18.3 16.9 - - 18.3 16.9 Planning 19.6 19.0 - - 19.6 19.0 Agriculture 3.5 3.4 - - 3.5 3.4 Economic Development 0.1 2.5 - - 0.1 2.5 Convention & Visitor Bureau 26.0 30.9 - - 26.0 30.9 Cultural Affairs 3.2 - - - 3.2 - Information Technology 37.0 38.0 - - 37.0 38.0 Emergency Communication & Citizen Services 7.7 8.9 - - 7.7 8.9 Boards and Commissions 23.0 28.0 - - 23.0 28.0 Fire 52.2 59.2 - - 52.2 59.2 Budget and Management Services 1.3 1.3 - - 1.3 1.3 Education 444.6 430.8 - - 444.6 430.8 Housing & Neighborhood Preservation 33.5 31.6 - - 33.5 31.6 Museums 10.3 11.1 - - 10.3 11.1 Emergency Medical Services 11.5 13.0 - - 11.5 13.0 General Government 55.8 8.3 - - 55.8 8.3 Water & Sewer - - 122.9 139.8 122.9 139.8 Storm Water - - 33.3 38.1 33.3 38.1 Development Authority - - 11.8 12.4 11.8 12.4 Waste Management - - 34.9 34.6 34.9 34.6 Parking - - 3.3 4.2 3.3 4.2 Interest on Long-Term Debt 24.5 24.5 - - 24.5 24.5 Total Expenses 1,340.1 1,330.9 206.3 229.1 1,546.4 1,560.0 Excess (Deficiency) Before Transfers 61.1 61.9 24.6 19.2 85.4 81.1 Transfers (11.2) (22.2) 11.2 22.2 . - Change in Net Position 49.9 39.7 35.8 41.4 85.4 81.1 Net Position – Beginning 2,597.7 2,558.0 1,196.6 1,155.2 3,794.3 3,713.2 Net Position – Ending $ 2,647.6 $ 2,597.7 $ 1,232.4 $ 1,196.6 $ 3,879.7 $ 3,794.3
5

CITY OF VIRGINIA BEACH, VIRGINIA MANAGEMENT’S DISCUSSION AND ANALYSIS
Revenues
The City’s total revenues were $1.6 billion, an increase of $(9.1) million over the revenues from prior year. Theserevenues consist of program and general revenues. Program revenues are derived from the program itself and reducethe reliance on the City's general revenues; these include charges for services, operating and capital grants andcontributions. General revenues are all other revenues and include property and other taxes, and interest earnings.
For Governmental Activities, program revenues totaled $331.1 million, compared to $310.9 million from the prioryear. The increase is primarily due to increased receipts from the Commonwealth for support towards roadsmaintenance and federal and state receipts received for various grants.
General revenues totaled $1.1 billion. This represents a decrease of $(11.7) million over the prior year due to lowercollections in local taxes such as meal ($5.8 million), hotel ($1.0 million), utility ($2.1 million) and automobiletaxes ($1.1million) as a direct result from the COVID 19 shutdown starting in mid March 2020 through the end of FY 2020.
Business-type Activities generated program and general revenues of $230.9 million, primarily from charges forservices ($220.8 million). The revenues decrease of 7.0% from prior year due to the capital contribution to theVirginia Beach Developmental Authority of Housing Resource Center ($26.1 million) in FY 2019.
6

CITY OF VIRGINIA BEACH, VIRGINIA MANAGEMENT’S DISCUSSION AND ANALYSIS
Expenses
The City's total cost of all programs and services was $1.5 billion, an $(13.6) million decease over expenses from theprior year. Figure 3 shows the breakdown of major expenses by function.
Expenses (before transfers) for Governmental Activities totaled $1.3 billion, an increase of $9.2 million over theprior year. The increase in current year expenses are due mainly to the transfer of some of the Storm Wateroperations over to the General Fund, $8.1 million.. The expenses also reflect a 2% general pay raise for full-timeemployees, funding to address salary vertical compression and new full-time positions in support of public safety and public works functions.
Education continues to be one of the City's highest priorities and commitments. The City's funding for educationtotaled $444.6 million (net of the adjustment to account for the tenancy-in-common legislation). This amountrepresents an increase of $13.8 million over prior year due to additional funding for all-day kindergarten and tocontinue the expansion of the pre-kindergarten program which includes an increase full time employees by 78.
Expenses for the Business-type Activities include those related to water, sewer, storm water, and waste managementutility services as well as parking operations and certain economic development functions (blended component unit).For the current fiscal year these totaled $206.3 million, a $(22.8) million decrease from prior year. A $20 millionpayment to the City of Norfolk for the Lake Gaston water service agreement was made in FY 2019.
7

CITY OF VIRGINIA BEACH, VIRGINIA MANAGEMENT’S DISCUSSION AND ANALYSIS
FINANCIAL ANALYSIS OF THE CITY’S FUNDS
The City uses fund accounting to ensure and demonstrate compliance with finance related legal requirements.
Governmental funds
The focus of the City’s governmental funds is to provide information on near-term inflows, outflows and balances ofspendable resources. Unassigned fund balance may serve as a useful measure of a government’s net resourcesavailable for spending at the end of the fiscal year.
At the end of the fiscal year, the total fund balance for the City’s governmental funds was $754.6 million, comparedto $597.8 million in the prior fiscal year, an increase of $156.8 million. This increase was due to more cash in thegeneral government capital projects fund as of June 30, 2020 due to bond sales taking place in the current fiscal year.
At the end of the fiscal year, the classification of total governmental fund balances was as follows:
$11.3 million is nonspendable which consists of loans and inventories in the General Fund.
$60.3 million is restricted, which can be spent only for the specific purposes stipulated by external providers,such as grantors or restricted through legislation. In the General Fund this amount is for community servicesprograms ($1.5 million). Non major governmental funds consisted mainly of debt service costs ($44.3 million)and other federal and state grants funds ($14.5 million).
$407.6 million is committed, which can only be used for the specific purposes imposed by the formal action of City Council. In the General Fund committed balance of $16.5 million is for education. The non majorgovernmental funds consisting of $27.5 million for convention and visitor development, $15.1 million for the agriculture reserve program activities, $13.0 million for parks and recreation, $0.1 million for LawLibrary activities and $1.2 million for Central Business District South Tax Increment Financing fund. Included in the committed fund balance is $334.0 million for the capital improvement programs consisting of:
Engineering and Highways - $37.1 million Buildings - $75.1 million Parks & Recreation - $3.2 million Coastal - $1.4 million Economic and Tourism - $24.4 million General Government - $192.8 million
$126.2 million is assigned, which applies to amounts that are intended for specific purposes but do not meet the criteria to be classified as restricted or committed. For example, this amount includes $26.5 for the fiscal year2020’s capital program and $36.3 million for education, which includes unspent funding by the schools andreverted to the City.
$149.3 million is unassigned, which is the residual classification for the General Fund and includes allspendable amounts not contained in the other classifications.
Items to be noted include:
Real estate taxes of $603.1 million increased by $16.7 million from prior year. Real estate revenues are the City’ssingle largest revenue source and comprised 42.7% of total revenues received for the year. This is mainly due toan increase of 3.6% in real estate assessed values. The real estate tax allocated to fund Storm Water CIP projectsincreased $7.7 million in current fiscal year to $14.3 million.
Revenues recorded for personal property taxes of $112.7 million were higher than prior year by $6.7 million.
8

CITY OF VIRGINIA BEACH, VIRGINIA MANAGEMENT’S DISCUSSION AND ANALYSIS
This is mainly due to an increase of 5.9% in personal property tax assessed values. The City continues toreceive PPTRA (personal property tax relief program) reimbursements from the State of $53.4 million, whichare reported as state revenues.
Other Taxes revenue category, which includes taxes on general sales, utility purchases, cigarettes, hotel rooms,restaurant meal, amusement, business licenses, deeds, wills, and automobile licenses totaled $298.1 million. Thisrepresents a $(10.9) million decrease over the previous year mainly due to COVID-19 pandemic temporary shutdown of local businesses.
Revenues from federal and state funding of $294.2 million were higher than prior year by $35.7 million primarilyattributable to the $39.5 million of the Coronavirus Aids, Relief, and Economic Security (CARES) Act funds.
Full-time city employees received a 2% pay increase (1% general pay raise and a 1% merit raise).
Revenues received in the capital projects fund from the federal and state governments were $1.3 million and $8.6million, respectively, which were mostly in support of transportation projects. The capital projects fund receivedcash funding totaling $78.6 million from the General Fund, other special revenue funds, and the ParkingEnterprise Fund.
9

CITY OF VIRGINIA BEACH, VIRGINIA MANAGEMENT’S DISCUSSION AND ANALYSIS
Proprietary funds
The City’s proprietary fund statements offer short and long-term financial information about the activities that thegovernment operates as a business, such as the water and sewer system, storm water, waste management, parking,and development authority funds. These statements provide the same type of information found in thegovernment-wide financial statements, but in more detail. The ending net position for the proprietary funds totals$1.2 billion.
Notable items are as follows:
The Water and Sewer fund’s net position increased by $13.9 million continues to reflect strong financialmanagement and the continuing acquisition and construction of capital assets to help address continuedcompliance with federal consent order on sanitary sewer overflows. Increase in Charges for Services Revenue ,$6.4 million, due to rate increase from $4.41 to $4.90 per thousand gallons.
The net position for the Storm Water fund increased by $14.4 million, which provides funding to continueaddressing backlogs in the areas of flood control and water quality over the next several years. In the currentfiscal year, the equivalent residential unit fee increased from .458 cents to .493 cents per day.
The net position for the Waste Management fund, increased by $3.3 million. The fund accounts for the annualoperating expenses of the waste management functions, including recycling activities, waste collection, anddisposal at the landfill. Waste collection fees increased from $23/month to $25/month.
The net position for the Development Authority, which is the City’s blended component unit, increased by $4.5million which is attributable to the reduction of debt.
GENERAL FUND BUDGETARY HIGHLIGHTS
The following is a brief review of the budgetary changes from the original to the final budget and actual amounts tofinal budget (See Exhibits 12 and 13):
Final budget amounts were often greater than original amounts due to the re-appropriation of prior yearencumbrances which were completed in the current fiscal year. During the fiscal year, City Council approvedvarious modifications to the original adopted budget. Major budget adjustments include:
$12.5 million to the School's operating fund for the purchase of buses, full-day kindergartenimplementation, and other various expenditures for the Schools.
$.8 million to be reserved in the School's reserve special revenue fund to cover possible shortfalls in fiscalyear 2020.
$7.4 million for various schools renovations and replacement projects.
Actual total revenues were below the amended budget by ($6.3 million primarily due to decrease in local taxes$(8.0) million and charges for services $(4.0) million.
General fund expenditures totaled $988.8 million, which was $154.7 million less than appropriated.The unfavorable budget variances were partially offset by favorable variances stated below.
Significant positive variances were the result of the following:
Human Services ($7.9 million) - due to lower expenditures in personnel charges ($5.1 million) and budgeted coronavirus relief carryforward to FY2021 ($2.0 million).
10

CITY OF VIRGINIA BEACH, VIRGINIA MANAGEMENT’S DISCUSSION AND ANALYSIS
Public Works ($13.7 million) - due to savings in personnel charges ($1.2 million), timing of pavementmaintenance projects that were not completed during the fiscal year ($2.4 million), and under utilization ofStorm Water departments budgeted in General Fund in FY2020 ($4.8 million).
Education ($44.8 million) - mainly due to $39.0 million of unspent funding received from the City’s generalfund which was returned at year-end. This amount will be submitted to City Council in the next fiscal yearfor re-appropriation to the Schools’ funds.
At the end of the fiscal year, unassigned fund balance for the general fund was $152.8 million or 10.23% of nextfiscal year’s budgeted revenues, and is within City Council policy.
CAPITAL ASSETS
During the current fiscal year, the City’s investment in capital assets of $4.7 billion increased by $155.9 million fromprior year (Table 3). This investment includes a broad range of capital assets (e.g. land, equipment, buildings, parkfacilities, roads, bridges, water and sewer lines, and construction in progress).
Major capital projects placed in service during the year included:
Police Fourth Precinct Replacement ($9.1 million) - This project provides 17,000 square feet replacementfacility for the existing 6,017square foot facility at its current location, 840 Kempsville Road. Also, this projectincludes required parking and storage facilities. The Fourth Police Precinct service area encompasses the entireKempsville area south of Interstate 264, extending east to Lynnhaven Parkway and south to the Chesapeake line,and serves approximately 140,000 residents.
Water Utility Management Program I ($5.0 million) - Arrowhead Susquehanna Sanitary Sewer RehabilitationPhase I. This project supports Public Utilities Water Utility Asset Management Program by providing fundingfor engineering study-design, construction services, and evaluation of existing programs and practices as theyrelate to overall system performance improvements and the implementation of the Asset Management Program.
Indian River Rd/Kempsville Rd Intersection Improvements ($5.0 million) - This project is for the reconstructionof the Indian River Road/Kempsville Road intersection to increase the capacity of the intersection and improvesafety and traffic flow. The design and construction of this intersection combines two very innovativeapproaches: indirect left turns to the north and south on Kempsville Road (also known as a continuous flowintersection) and median U-turn lefts to the east and west of the intersection on Indian River Road. Design andconstruction of two half signals north and south of the intersection as well as geometric improvements to theintersection of Indian River Road and Kempsville Road and its vicinity will also be included. The project willenhance the overall safety and operational capacity of the intersection and its corridors.
Storm Water Rehabilitation and Improvements ($6.9 million) - This project provided for the inspection,evaluation and rehabilitation of the storm water infrastructure throughout the City with emphasis inneighborhoods which had reported storm water system needs. Some of the major neighborhoods planned forrehabilitation during this phase include: Price Street Apartments in the Pembroke Strategic Growth Area and Holland Road between Dam Neck Road and Nimmo Parkway.
Construction in progress expenditures for the fiscal year totaled $301.0 million for general government, $34.3million for water/sewer and $41.2 million for storm water projects. Major current year general government expenditures include:
Virginia Beach Sports Center ($3.3 million) is an indoor facility that can accommodate year round venue for tournaments and leagues
Funding for a new City Hall, Building 1 facility ($11.6) Witchduck Road project to improve capacity ($6.5 million) Indian River/Kempsville Road project to improve capacity ($6.7 million) Aquarium Marsh Pavilion Enhancements ($5.1 million) - updates to pavilion to entice more visitors
11
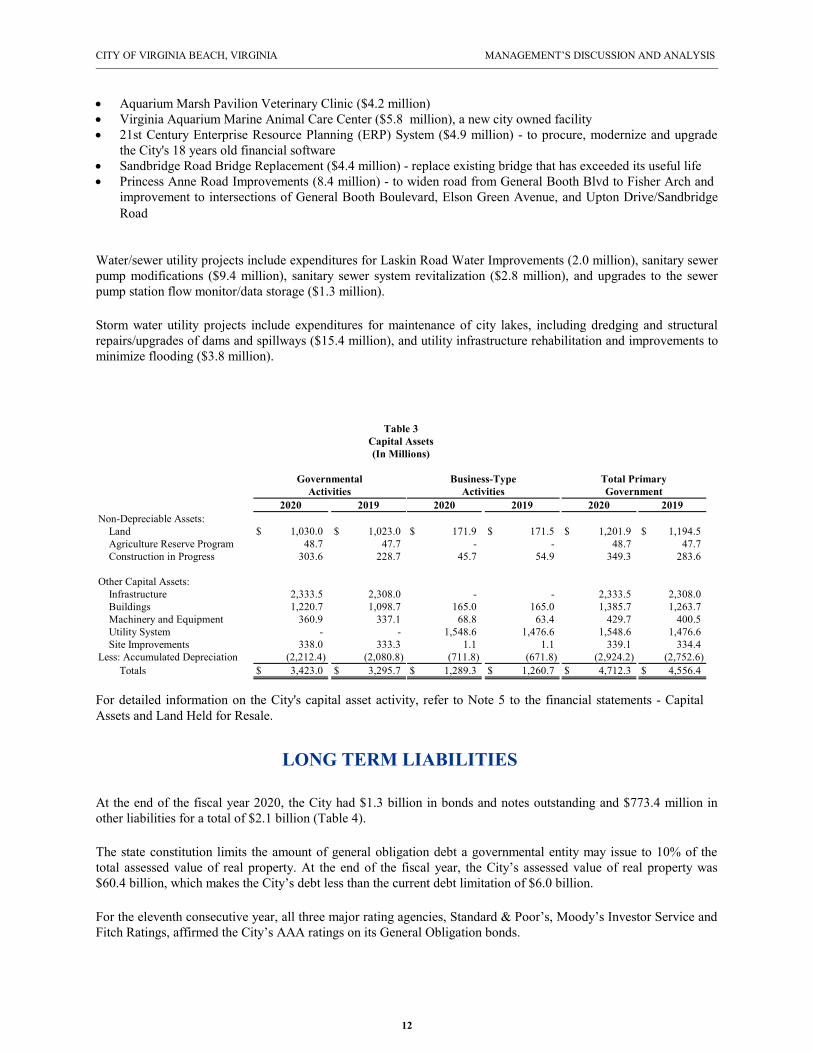
CITY OF VIRGINIA BEACH, VIRGINIA MANAGEMENT’S DISCUSSION AND ANALYSIS
Aquarium Marsh Pavilion Veterinary Clinic ($4.2 million) Virginia Aquarium Marine Animal Care Center ($5.8 million), a new city owned facility 21st Century Enterprise Resource Planning (ERP) System ($4.9 million) - to procure, modernize and upgrade
the City's 18 years old financial software Sandbridge Road Bridge Replacement ($4.4 million) - replace existing bridge that has exceeded its useful life Princess Anne Road Improvements (8.4 million) - to widen road from General Booth Blvd to Fisher Arch and
improvement to intersections of General Booth Boulevard, Elson Green Avenue, and Upton Drive/SandbridgeRoad
Water/sewer utility projects include expenditures for Laskin Road Water Improvements (2.0 million), sanitary sewerpump modifications ($9.4 million), sanitary sewer system revitalization ($2.8 million), and upgrades to the sewerpump station flow monitor/data storage ($1.3 million).
Storm water utility projects include expenditures for maintenance of city lakes, including dredging and structuralrepairs/upgrades of dams and spillways ($15.4 million), and utility infrastructure rehabilitation and improvements tominimize flooding ($3.8 million).
Table 3Capital Assets(In Millions)
Governmental Business-Type Total PrimaryActivities Activities Government
2020 2019 2020 2019 2020 2019Non-Depreciable Assets: Land $ 1,030.0 $ 1,023.0 $ 171.9 $ 171.5 $ 1,201.9 $ 1,194.5 Agriculture Reserve Program 48.7 47.7 - - 48.7 47.7 Construction in Progress 303.6 228.7 45.7 54.9 349.3 283.6
Other Capital Assets: Infrastructure 2,333.5 2,308.0 - - 2,333.5 2,308.0 Buildings 1,220.7 1,098.7 165.0 165.0 1,385.7 1,263.7 Machinery and Equipment 360.9 337.1 68.8 63.4 429.7 400.5 Utility System - - 1,548.6 1,476.6 1,548.6 1,476.6 Site Improvements 338.0 333.3 1.1 1.1 339.1 334.4 Less: Accumulated Depreciation (2,212.4) (2,080.8) (711.8) (671.8) (2,924.2) (2,752.6) Totals $ 3,423.0 $ 3,295.7 $ 1,289.3 $ 1,260.7 $ 4,712.3 $ 4,556.4
For detailed information on the City's capital asset activity, refer to Note 5 to the financial statements - CapitalAssets and Land Held for Resale.
LONG TERM LIABILITIES
At the end of the fiscal year 2020, the City had $1.3 billion in bonds and notes outstanding and $773.4 million inother liabilities for a total of $2.1 billion (Table 4).
The state constitution limits the amount of general obligation debt a governmental entity may issue to 10% of thetotal assessed value of real property. At the end of the fiscal year, the City’s assessed value of real property was$60.4 billion, which makes the City’s debt less than the current debt limitation of $6.0 billion.
For the eleventh consecutive year, all three major rating agencies, Standard & Poor’s, Moody’s Investor Service andFitch Ratings, affirmed the City’s AAA ratings on its General Obligation bonds.
12

CITY OF VIRGINIA BEACH, VIRGINIA MANAGEMENT’S DISCUSSION AND ANALYSIS
Existing Water and Sewer Revenue Bonds were last affirmed in 2018 at AAA rating by Fitch on the City’s $183.4million in outstanding bonds. Existing Storm Water Revenue Bonds were last affirmed in 2019 at AAA by Fitchand Moody’s Investors Service at Aa1 on the City's $67.0 million in outstanding bonds.
On June 17, 2020, the City issued appropriation backed Public Facility Revenue Bonds (PFRB) consisting of $159.0million of new money bonds and $37.6 million refunding bonds to achieve debt service savings of $2.69 million overthe next 4 years.
On July 31, 2019, the City issued appropriation backed General Obligation Public Improvement Bonds (PI)consisting of $101.2 million of new money bonds and $54.9 million refunding bonds to achieve debt service savingof $4.4 million over the next 11 years.
Estimated claims and judgments reflect estimated unpaid losses and ALAE (allocated loss adjustment expenses) aas of the end of the year. The projected liability by line of business consists of 80.0% for workers compensation,18.0% for general liability, and 2.0% for automobile liability. Landfill closure and post-closure care liability of$21.7 increased $0.4 million during the current fiscal year due to inflation.
Table 4Long Term Liabilities
(in Millions)
Governmental Business-Type Total PrimaryActivities Activities Government
2020 2019 2020 2019 2020 2019
General Obligation Bond $ 580.2 $ 541.6 $ - $ - $ 580.2 $ 541.6 State Literary Fund Loans 0.8 1.1 - - 0.8 1.1 Public Facility Revenue Bonds 367.4 239.0 50.4 58.3 417.8 297.3 Revenue Bonds - - 250.4 262.5 250.4 262.5 Agriculture Reserve Program 48.7 47.7 - - 48.7 47.7 Sub-total 997.1 829.4 300.8 320.8 1,297.9 1,150.2
Other Long-Term Liabilities: Landfill Closure & Post-closure Care 21.7 21.3 - - 21.7 21.3 Premium/Discount on Bonds Sold 116.9 81.7 18.4 18.9 135.3 100.6 Net Pension Liability 380.8 316.9 36.8 30.8 417.6 347.7 Net OPEB Liability 98.8 109.3 4.9 6.7 103.7 116.0 Accrued Compensated Leave 46.4 43.8 4.1 4.7 50.5 48.5 Estimated Claims & Judgments 44.6 41.5 - - 44.6 41.5
709.2 614.5 64.2 61.1 773.4 675.6 Totals $ 1,706.3 $ 1,443.9 $ 365.0 $ 381.9 $ 2,071.3 $ 1,825.8
For detailed information the City's long-term debt activity, refer to Note 6 to the financial statements - Long-termDebt.
ECONOMIC FACTORS AND NEXT YEAR’S BUDGET
The City’s strong financial management and conservative budgeting practices allow the City to continue itscommitment to the citizens of Virginia Beach. The Virginia Beach economy continues to improve as real estateassessments continue to increase, and consumer-driven revenues such as general sales, hotel tax, meals tax andamusement tax continue to perform well.
The above indicators were taken into account when adopting the budget for fiscal year 2021. The adopted budgetincludes the following highlights:
When the Proposed FY 2020-21 Resource Management Plan was presented to City Council on March 24, 2020,the City had just begun to feel the effects of COVID-19. For that reason, City Council directed City staff toreformulate the originally proposed budget to incorporate anticipated impacts of the virus and subsequent
13

CITY OF VIRGINIA BEACH, VIRGINIA MANAGEMENT’S DISCUSSION AND ANALYSIS
stay-at-home orders issued by the Governor, on the local economy. Based on this direction staff prepared arevised budget, which was presented to City Council on April 14. The revised budget eliminated nearly all thenew programs, positions, and services included in the City Manager’s originally proposed budget. The adoptedFY 2020-21 budget seeks to maintain current services and ensure flexibility moving forward through uncertaineconomic times.
The City of Virginia Beach experienced a horrific tragedy on May 31, 2019, and is still recovering from theemotional, physical, and financial impacts of the event. The Adopted Operating Budget provides funding forseveral projects and programs to help the City recover from the event, as well as resources to implementrecommendations made as a result of the independent investigation conducted by Hillard Heintze. Theserecommendations are categorized within the following areas: human resources, public safety, and facilitysecurity. The Department of Human Resources will begin the phased centralization of the department’soperations with the establishment of four new positions. It is envisioned that ultimately there will be elevenadditional positions added across the city within the next several fiscal years to fully implement the humanresource recommendations of the independent investigation.
The City revised initial FY 2020-21 revenue estimates based on expected revenue decline from the impacts ofCOVID-19, the City’s contribution to the Schools, through the revenue sharing formula, decreased by $20.4million from the initially proposed budget. In an effort to offset this loss, City Council opted to provide theSchools an additional $7.8 million beyond the amount required by the formula. The combined operatingbudgets for the City and Schools total $2.1 billion, which represents no change in the adjusted budget for fiscalyear 2020. The total budget supports $1.1 billion in City programs and $957.5 million in Schools' programs.
Real estate tax revenues are budgeted at $619.5 million, an increase of 2.3% over prior year. This increase isattributable to increases in the assessment value of homes and new development.
Personal property tax revenues decreased 2.4% to $163.5 million. There was no change in the personal propertytax rate of $4.00 per $100 of assessed value.
Hotel tax budgeted revenues total $27.2 million, a decrease of 28.3% over the prior year. There are twocomponents making up this revenue: the 8% hotel tax rate and the flat tax, which generates an additional $2 perroom night.
The storm water daily ERU (equivalent residential units) fee of 3.5 cents for FY2020-2021 has been suspendedin an effort to minimize the impact of taxes and fees on households and businesses in the wake ofCOVID-19.
The adopted Capital Improvement Program (CIP) for fiscal years 2021 through 2026 established six-yearprogrammed funding of $3.4 billion. For year one, the amount appropriated was $320.6 million. The six-yearprogram provides scheduled funding for the construction of projects for roadways ($697.6 million), storm water($704.2 million), utilities ($321.9 million), schools ($461.8 million), economic and tourism development($340.7 million), and other projects.
REQUEST FOR INFORMATION
This report is designed to provide our citizens, taxpayers, customers, investors and creditors with a general overviewof the City's finances and to demonstrate the City's accountability for the money it receives. If you have questionsabout this report or need additional financial information, contact the City's Finance Department, City of VirginiaBeach, Municipal Center, Virginia Beach, Virginia 23456, telephone 757-385-4302, or visit the City's web site atwww.vbgov.com.
14

BASIC FINANCIAL STATEMENTS

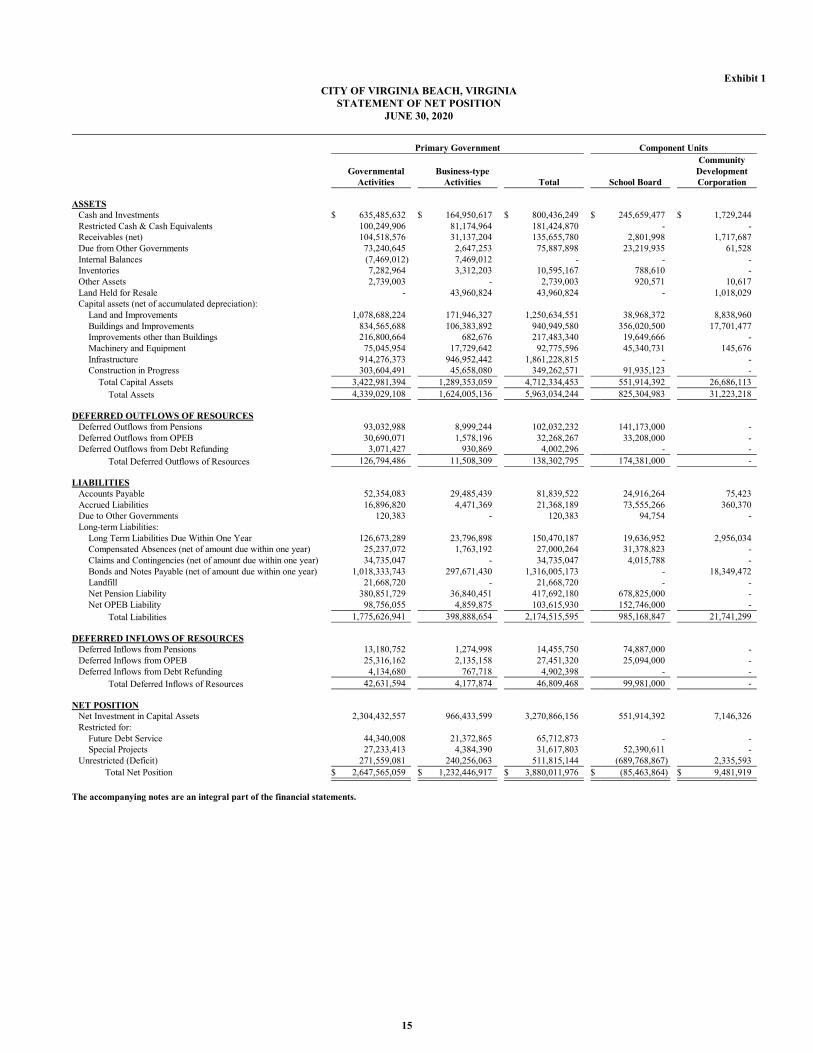
Exhibit 1CITY OF VIRGINIA BEACH, VIRGINIA
STATEMENT OF NET POSITIONJUNE 30, 2020
Primary Government Component Units
GovernmentalActivities
Business-typeActivities Total School Board
CommunityDevelopmentCorporation
ASSETSCash and Investments $ 635,485,632 $ 164,950,617 $ 800,436,249 $ 245,659,477 $ 1,729,244Restricted Cash & Cash Equivalents 100,249,906 81,174,964 181,424,870 - -Receivables (net) 104,518,576 31,137,204 135,655,780 2,801,998 1,717,687Due from Other Governments 73,240,645 2,647,253 75,887,898 23,219,935 61,528Internal Balances (7,469,012) 7,469,012 - - -Inventories 7,282,964 3,312,203 10,595,167 788,610 -Other Assets 2,739,003 - 2,739,003 920,571 10,617Land Held for Resale - 43,960,824 43,960,824 - 1,018,029Capital assets (net of accumulated depreciation):
Land and Improvements 1,078,688,224 171,946,327 1,250,634,551 38,968,372 8,838,960Buildings and Improvements 834,565,688 106,383,892 940,949,580 356,020,500 17,701,477Improvements other than Buildings 216,800,664 682,676 217,483,340 19,649,666 -Machinery and Equipment 75,045,954 17,729,642 92,775,596 45,340,731 145,676Infrastructure 914,276,373 946,952,442 1,861,228,815 - -Construction in Progress 303,604,491 45,658,080 349,262,571 91,935,123 -
Total Capital Assets 3,422,981,394 1,289,353,059 4,712,334,453 551,914,392 26,686,113Total Assets 4,339,029,108 1,624,005,136 5,963,034,244 825,304,983 31,223,218
DEFERRED OUTFLOWS OF RESOURCESDeferred Outflows from Pensions 93,032,988 8,999,244 102,032,232 141,173,000 -Deferred Outflows from OPEB 30,690,071 1,578,196 32,268,267 33,208,000 -Deferred Outflows from Debt Refunding 3,071,427 930,869 4,002,296 - -
Total Deferred Outflows of Resources 126,794,486 11,508,309 138,302,795 174,381,000 -
LIABILITIESAccounts Payable 52,354,083 29,485,439 81,839,522 24,916,264 75,423Accrued Liabilities 16,896,820 4,471,369 21,368,189 73,555,266 360,370Due to Other Governments 120,383 - 120,383 94,754 -Long-term Liabilities:
Long Term Liabilities Due Within One Year 126,673,289 23,796,898 150,470,187 19,636,952 2,956,034Compensated Absences (net of amount due within one year) 25,237,072 1,763,192 27,000,264 31,378,823 -Claims and Contingencies (net of amount due within one year) 34,735,047 - 34,735,047 4,015,788 -Bonds and Notes Payable (net of amount due within one year) 1,018,333,743 297,671,430 1,316,005,173 - 18,349,472Landfill 21,668,720 - 21,668,720 - -Net Pension Liability 380,851,729 36,840,451 417,692,180 678,825,000 -Net OPEB Liability 98,756,055 4,859,875 103,615,930 152,746,000 -
Total Liabilities 1,775,626,941 398,888,654 2,174,515,595 985,168,847 21,741,299
DEFERRED INFLOWS OF RESOURCESDeferred Inflows from Pensions 13,180,752 1,274,998 14,455,750 74,887,000 -Deferred Inflows from OPEB 25,316,162 2,135,158 27,451,320 25,094,000 -Deferred Inflows from Debt Refunding 4,134,680 767,718 4,902,398 - -
Total Deferred Inflows of Resources 42,631,594 4,177,874 46,809,468 99,981,000 -
NET POSITIONNet Investment in Capital Assets 2,304,432,557 966,433,599 3,270,866,156 551,914,392 7,146,326Restricted for:
Future Debt Service 44,340,008 21,372,865 65,712,873 - -Special Projects 27,233,413 4,384,390 31,617,803 52,390,611 -
Unrestricted (Deficit) 271,559,081 240,256,063 511,815,144 (689,768,867) 2,335,593Total Net Position $ 2,647,565,059 $ 1,232,446,917 $ 3,880,011,976 $ (85,463,864) $ 9,481,919
The accompanying notes are an integral part of the financial statements.
15

Exhi
bit 2
CIT
Y O
F V
IRG
INIA
BE
AC
H, V
IRG
INIA
STA
TEM
EN
T O
F A
CTI
VIT
IES
FOR
TH
E Y
EAR
EN
DED
JU
NE
30,
202
0
Prog
ram
Rev
enue
sN
et (E
xpen
ses)
Rev
enue
s and
Cha
nges
in N
et P
ositi
onPr
imar
y G
over
nmen
tC
ompo
nent
Uni
ts
Expe
nses
Cha
rges
for
Serv
ices
Ope
ratin
gG
rant
s and
Con
trib
utio
ns
Cap
ital
Gra
nts a
ndC
ontr
ibut
ions
Gov
ernm
enta
lA
ctiv
ities
Busin
ess-
type
Act
iviti
esTo
tal
Scho
ol B
oard
Com
mun
ityD
evel
opm
ent
Cor
pora
tion
Prim
ary
Gov
ernm
ent:
Gov
ernm
enta
l Act
iviti
es:
Legi
slativ
e$
1,18
6,75
9$
-$
-$
-$
(1,1
86,7
59)
$-
$(1
,186
,759
)$
-$
-Ex
ecut
ive
5,14
8,73
2-
--
(5,1
48,7
32)
-(5
,148
,732
)-
-La
w4,
646,
337
--
-(4
,646
,337
)-
(4,6
46,3
37)
--
Fina
nce
19,5
89,0
5386
1,38
11,
514,
482
-(1
7,21
3,19
0)-
(17,
213,
190)
--
Hum
an R
esou
rces
12,3
03,6
5020
,222
--
(12,
283,
428)
-(1
2,28
3,42
8)-
-Ju
dici
al67
,317
,493
4,97
0,67
525
,286
,918
-(3
7,05
9,90
0)-
(37,
059,
900)
--
Hea
lth3,
690,
540
-11
6,26
7-
(3,5
74,2
73)
-(3
,574
,273
)-
-Po
lice
90,1
64,4
722,
895,
919
1,67
5,92
5-
(85,
592,
628)
-(8
5,59
2,62
8)-
-H
uman
Ser
vice
s12
5,69
2,50
824
,294
,428
67,2
55,2
50-
(34,
142,
830)
-(3
4,14
2,83
0)-
-Pu
blic
Wor
ks18
4,47
6,40
92,
178,
507
44,6
80,7
51-
(137
,617
,151
)-
(137
,617
,151
)-
-Pa
rks &
Rec
reat
ion
53,7
69,2
3212
,115
,841
5,52
8,78
2-
(36,
124,
609)
-(3
6,12
4,60
9)-
-Li
brar
y18
,321
,890
446,
146
236,
603
-(1
7,63
9,14
1)-
(17,
639,
141)
--
Plan
ning
19,6
00,4
115,
313,
031
--
(14,
287,
380)
-(1
4,28
7,38
0)-
-A
gric
ultu
re3,
505,
824
97,0
8717
3,23
3-
(3,2
35,5
04)
-(3
,235
,504
)-
-Ec
onom
ic D
evel
opm
ent
130,
286
163,
000
125,
000
-15
7,71
4-
157,
714
--
Conv
entio
n &
Visi
tor D
evel
opm
ent
25,9
52,1
643,
142,
035
--
(22,
810,
129)
-(2
2,81
0,12
9)-
-Cu
ltura
l Affa
irs3,
156,
488
33,7
945,
275
-(3
,117
,419
)-
(3,1
17,4
19)
--
Info
rmat
ion
Tech
nolo
gy37
,031
,425
1,92
9,09
6-
-(3
5,10
2,32
9)-
(35,
102,
329)
--
Emer
genc
y C
omm
unic
atio
ns a
nd C
itize
n Se
rvic
es7,
651,
383
141,
396
408,
324
-(7
,101
,663
)-
(7,1
01,6
63)
--
Boar
ds a
nd C
omm
issio
ns23
,022
,240
-39
5,51
5-
(22,
626,
725)
-(2
2,62
6,72
5)-
-Fi
re52
,187
,797
422,
241
3,69
6,47
0-
(48,
069,
086)
-(4
8,06
9,08
6)-
-Bu
dget
and
Man
agem
ent S
ervi
ces
1,30
4,78
7-
--
(1,3
04,7
87)
-(1
,304
,787
)-
-Ed
ucat
ion
444,
610,
435
2,09
0,51
2-
-(4
42,5
19,9
23)
-(4
42,5
19,9
23)
--
Hou
sing
& N
eigh
borh
ood
Pres
erva
tion
33,5
26,6
9043
8,27
924
,531
,964
-(8
,556
,447
)-
(8,5
56,4
47)
--
Mus
eum
s10
,318
,444
6,36
6,01
3-
-(3
,952
,431
)-
(3,9
52,4
31)
--
Emer
genc
y M
edic
al S
ervi
ces
11,5
06,0
8677
,982
401,
380
-(1
1,02
6,72
4)-
(11,
026,
724)
--
Gen
eral
Gov
ernm
ent
55,7
56,4
6722
,781
,929
54,7
30,9
149,
443,
815
31,2
00,1
91-
31,2
00,1
91-
-In
tere
st an
d Fi
scal
Cha
rges
24,5
27,7
47-
--
(24,
527,
747)
-(2
4,52
7,74
7)-
-To
tal G
over
nmen
tal A
ctiv
ities
1,34
0,09
5,74
990
,779
,514
230,
763,
053
9,44
3,81
5(1
,009
,109
,367
)-
(1,0
09,1
09,3
67)
--
Busi
ness
-type
Act
iviti
es:
Wat
er a
nd S
ewer
122,
936,
990
130,
615,
326
-4,
063,
865
-11
,742
,201
11,7
42,2
01-
-St
orm
Wat
er33
,328
,873
44,7
79,1
83-
949,
154
-12
,399
,464
12,3
99,4
64-
-W
aste
Man
agem
ent
34,8
98,9
5437
,369
,824
35,6
58-
-2,
506,
528
2,50
6,52
8-
-D
evel
opm
ent A
utho
rity
11,8
48,7
373,
374,
565
--
-(8
,474
,172
)(8
,474
,172
)-
-Pa
rkin
g3,
279,
464
4,70
1,16
5-
--
1,42
1,70
11,
421,
701
--
Tota
l Bus
ines
s-ty
pe A
ctiv
ities
206,
293,
018
220,
840,
063
35,6
585,
013,
019
-19
,595
,722
19,5
95,7
22-
-
Tota
l Prim
ary
Gov
ernm
ent
1,54
6,38
8,76
731
1,61
9,57
723
0,79
8,71
114
,456
,834
(1,0
09,1
09,3
67)
19,5
95,7
22(9
89,5
13,6
45)
--
Com
pone
nt U
nits
:V
irgin
ia B
each
Sch
ool B
oard
934,
488,
801
11,4
22,2
8417
3,53
2,32
3-
(749
,534
,194
)-
Virg
inia
Bea
ch C
omm
unity
Dev
elop
men
t Cor
pora
tion
6,45
4,01
54,
198,
039
1,37
0,17
9-
-(8
85,7
97)
Tota
l Com
pone
nt U
nits
$94
0,94
2,81
6$
15,6
20,3
23$
174,
902,
502
$-
$-
$-
$-
$(7
49,5
34,1
94)
$(8
85,7
97)
16

Gen
eral
Rev
enue
s:Ta
xes:
Real
Est
ate
Prop
erty
Tax
es$
595,
549,
752
$-
$59
5,54
9,75
2$
-$
-Pe
rson
al P
rope
rty T
axes
110,
055,
858
-11
0,05
5,85
8-
-Sa
les
68,5
31,0
53-
68,5
31,0
53-
-U
tility
44,7
98,1
45-
44,7
98,1
45-
-Bu
sine
ss L
icen
ses
53,8
79,1
01-
53,8
79,1
01-
-M
eal
54,4
89,8
32-
54,4
89,8
32-
-Ci
ty T
ax o
n D
eeds
and
Will
s8,
554,
150
-8,
554,
150
--
Ciga
rette
10,4
77,7
89-
10,4
77,7
89-
-A
utom
obile
Lic
ense
s10
,014
,639
-10
,014
,639
--
Am
usem
ent
5,19
6,69
8-
5,19
6,69
8-
-Lo
dgin
g30
,962
,264
-30
,962
,264
--
Bank
Sto
ck3,
348,
538
-3,
348,
538
--
Tota
l City
Tax
es99
5,85
7,81
9-
995,
857,
819
--
Gra
nts a
nd c
ontri
butio
ns53
,412
,868
-53
,412
,868
270,
228,
872
-In
vestm
ent e
arni
ngs
14,4
04,6
034,
234,
320
18,6
38,9
231,
467,
641
49,1
71
M
iscel
lane
ous
6,52
6,99
980
6,36
07,
333,
359
1,00
5,98
779
,228
Tran
sfer
s(1
1,24
5,19
6)11
,245
,196
-52
8,06
9,09
4-
Tota
l Gen
eral
Rev
enue
s and
Tra
nsfe
rs1,
058,
957,
093
16,2
85,8
761,
075,
242,
969
800,
771,
594
128,
399
Chan
ge in
Net
Pos
ition
49,8
47,7
2635
,881
,598
85,7
29,3
2451
,237
,400
(757
,398
)N
et P
ositi
on -
Begi
nnin
g - R
esta
ted
2,59
7,71
7,33
31,
196,
565,
319
3,79
4,28
2,65
2(1
36,7
01,2
64)
10,2
39,3
18N
et P
ositi
on -
Endi
ng$
2,64
7,56
5,05
9$
1,23
2,44
6,91
7$
3,88
0,01
1,97
6$
(85,
463,
864)
$9,
481,
920
The
acco
mpa
nyin
g no
tes a
re a
n in
tegr
al p
art o
f the
fina
ncia
l sta
tem
ents
.
17

Exhibit 3CITY OF VIRGINIA BEACH, VIRGINIA
BALANCE SHEETGOVERNMENTAL FUNDS
JUNE 30, 2020
General Capital Projects
OtherGovernmental
Funds
TotalGovernmental
FundsASSETS
Cash and Investments $ 218,800,903 $ 303,151,981 $ 61,959,810 $ 583,912,694Cash and Investments - Restricted - 49,718,149 50,531,757 100,249,906Cash Advances 94,576 - - 94,576Receivables (net of allowance for collectibles, where applicable):
Property Tax 73,146,260 - - 73,146,260Accounts 2,200,576 - 2,271,725 4,472,301Loans 6,490,546 - 4,858,523 11,349,069
Due from:Due from Other Funds 1,960,792 - 163,990 2,124,782Due from Commonwealth 66,047,290 - 1,998,301 68,045,591Due from Federal Government 1,487,090 - 3,707,964 5,195,054
Inventories 4,769,415 - 141,784 4,911,199Total Assets 374,997,448 352,870,130 125,633,854 853,501,432
LIABILITIESVouchers and Accounts Payable 32,952,122 12,893,827 5,036,991 50,882,940Deposits Payable 3,731,906 - - 3,731,906Due to Other Funds - 5,917,522 1,960,792 7,878,314Intergovernmental Payables 63,915 53,392 - 117,307Unearned Revenue 362,995 - 3,808,262 4,171,257
Total Liabilities 37,110,938 18,864,741 10,806,045 66,781,724
DEFERRED INFLOWS OF RESOURCESUnavailable Revenue - Property Taxes 32,078,538 - - 32,078,538
Total Deferred Inflows of Resources 32,078,538 - - 32,078,538
FUND BALANCESNonspendable:
Nonspendable Inventories 4,769,415 - - 4,769,415Loans Receivable 6,490,546 - - 6,490,546
Restricted for:Debt Service - - 44,340,008 44,340,008Community Services Board 1,460,287 - - 1,460,287Housing and Community Development - - 8,857,050 8,857,050Judicial - - 504,605 504,605Public Safety - - 2,793,132 2,793,132Special Service District - - 2,358,378 2,358,378
Committed to:Agriculture - - 15,064,165 15,064,165Convention and Visitor Development - - 27,519,429 27,519,429Education 16,549,308 - 89,477 16,638,785Capital Improvement Program:
Engineering and Highways - 37,133,897 - 37,133,897Buildings - 75,145,808 - 75,145,808Parks and Recreation - 3,212,203 12,973,610 16,185,813Coastal - 1,430,851 - 1,430,851Economic and Tourism - 24,429,691 - 24,429,691General Government - 192,869,674 - 192,869,674Tax Increment Financing - - 1,186,075 1,186,075
Assigned to:Agriculture - - 658,310 658,310Education 36,303,277 - - 36,303,277Judicial - - 522,500 522,500Public Safety - - 789,246 789,246Special Service District - - 493,981 493,981General Government 60,934,492 - - 60,934,492Capital Improvement Program - General 26,457,715 - - 26,457,715
Unassigned 152,842,932 (216,735) (3,322,157) 149,304,040Total Fund Balances 305,807,972 334,005,389 114,827,809 754,641,170
Total Liabilities, Deferred Inflows, and Fund Balances $ 374,997,448 $ 352,870,130 $ 125,633,854 $ 853,501,432
The accompanying notes are an integral part of the financial statements.
18

CITY OF VIRGINIA BEACH, VIRGINIA RECONCILIATION OF BALANCE SHEET TO THE STATEMENT OF NET POSITION
JUNE 30, 2020
Total Fund Balances - Governmental funds (Exhibit 3) $ 754,641,170
Amounts reported for governmental activities in the Statement of Net Position are different because:
Capital assets used in governmental activities are not current financial resources and therefore are not reported in the governmental funds. 3,421,403,913
Other long-term assets are not available to pay for current period expenditures and therefore are offset by unearned revenue in the governmental funds. 49,030,915
Deferred Inflows and Outflows of Resources used to reflect deferred gains and losses on debt (1,063,253) refunding bonds are not reported in the governmental funds.
Deferred Inflows and Outflows of Resources used to reflect differences between expected and actual earnings on pension plan investments and other postemployment benefits are not reported in the
governmental funds (net of ISF). 83,724,832
Internal Service Funds (ISF) are used by management to charge the costs of risk management, information technology, and city garage to individual funds. The assets and liabilities of the internal service funds are included in governmental activities in the Statement of Net Position. (Exhibit 1) 1,443,631
Long-term liabilities, including bonds payable, are not due and payable in the current period and therefore are not reported as liabilities in the funds. Long-term liabilities at year-end consist of:
General Obligation Bonds (580,233,933)Net Pension Liability (net of ISF) (373,040,885)Net Other Postemployment Benefits Liability (net of ISF) (97,796,398)State Literary Fund Loans (750,000)Accrued Interest on Bonds Sold (9,466,173)Agriculture Reserve Strips (48,746,276)Public Facility Revenue Bonds (367,387,211)Premium on Bonds Sold (116,859,115)Compensated Absences (annual and sick leave) (net of ISF) (45,667,438)Landfill Closure and Post-Closure Care (21,668,720) (1,661,616,149)
Total Net Position - Governmental Activities (Exhibit 1) $ 2,647,565,059
The accompanying notes are an integral part of the financial statements.
19

Exhibit 4CITY OF VIRGINIA BEACH, VIRGINIA
STATEMENT OF REVENUES, EXPENDITURES, AND CHANGES IN FUND BALANCEGOVERNMENTAL FUNDS
FOR THE YEAR ENDED JUNE 30, 2020
General Capital Projects
OtherGovernmental
Funds
TotalGovernmental
Funds
REVENUESGeneral Property Taxes:
Real Estate property taxes $ 558,856,050 $ - $ 44,263,166 $ 603,119,216Personal property taxes 112,728,082 - - 112,728,082
Other Local Taxes 242,842,465 - 55,269,872 298,112,337Fines and Forfeitures 3,634,998 - 206,466 3,841,464Permits, Privilege Fees, and Regulatory Licenses 5,084,254 - 206,966 5,291,220From Use of Money and Property 8,844,159 232,633 9,357,747 18,434,539Charges for Services 48,424,789 - 15,865,825 64,290,614Miscellaneous 6,294,486 2,975,314 3,233,397 12,503,197From Commonwealth 165,091,508 8,551,367 25,763,387 199,406,262From Federal Government 25,165,471 1,339,787 68,252,275 94,757,533
Total Revenues 1,176,966,262 13,099,101 222,419,101 1,412,484,464
EXPENDITURESCurrent Operating:
Legislative 1,180,302 - - 1,180,302Executive 5,150,430 - - 5,150,430Law 4,595,060 - - 4,595,060Finance 19,694,983 - - 19,694,983Human Resources 12,308,232 - - 12,308,232Judicial 15,955,630 - 52,039,208 67,994,838Health 3,327,913 - 361,096 3,689,009Police 86,185,515 - 1,009,731 87,195,246Human Services 118,350,951 - 7,445,144 125,796,095Public Works 75,586,328 - 3,102,408 78,688,736Parks and Recreation 14,413,651 - 35,870,733 50,284,384Library 18,031,905 - 158,796 18,190,701Planning 18,355,508 - 1,152,170 19,507,678Agriculture 888,166 - 168,222 1,056,388Economic Development 2,914,879 - 21,286 2,936,165Convention and Visitor Development 9,229,295 - 13,284,175 22,513,470Cultural Affairs 3,156,488 - - 3,156,488Information Technology 25,166,518 - - 25,166,518Emergency Communications and Citizen Services 7,631,901 - - 7,631,901Boards and Commissions 25,951,685 - - 25,951,685Fire 44,796,114 - 4,125,447 48,921,561Budget and Management Services 1,324,913 - - 1,324,913Education 395,503,449 131,536,721 - 527,040,170Housing and Neighborhood Preservation 5,814,707 - 27,605,750 33,420,457Museums 10,151,547 - - 10,151,547General Government - - 42,058,231 42,058,231Emergency Medical Services 10,355,118 - 444,837 10,799,955
Capital Outlay - 169,446,236 - 169,446,236Debt Service:
Principal Retirement 36,633,786 - 56,665,311 93,299,097Interest and Fiscal Charges 16,141,352 - 24,866,661 41,008,013
Total Expenditures 988,796,326 300,982,957 270,379,206 1,560,158,489Excess (Deficiency) of Revenues over (under) Expenditures 188,169,936 (287,883,856) (47,960,105) (147,674,025)
OTHER FINANCING SOURCES (USES)Transfers In 16,879,932 78,622,187 79,491,285 174,993,404Transfers Out (130,560,085) - (42,641,139) (173,201,224)Proceeds of Refunding Bonds - - 80,329,587 80,329,587Issuance of Debt - 260,170,000 - 260,170,000Premium on Bonds Sold 738,393 41,764,553 8,734,990 51,237,936Payment to Refunding Bonds Escrow Agent - - (89,022,077) (89,022,077)
Total Other Financing Sources (Uses) (112,941,760) 380,556,740 36,892,646 304,507,626Net Change in Fund Balance 75,228,176 92,672,884 (11,067,459) 156,833,601Fund Balance at Beginning of Year 230,579,796 241,332,505 125,895,268 597,807,569Fund Balance at End of Year $ 305,807,972 $ 334,005,389 $ 114,827,809 $ 754,641,170
The accompanying notes are an integral part of the financial statements.
20

CITY OF VIRGINIA BEACH, VIRGINIARECONCILIATION OF THE STATEMENT OF REVENUES,
EXPENDITURES, AND CHANGES IN FUND BALANCES OF GOVERNMENTAL FUNDSTO THE STATEMENT OF ACTIVITIESFOR THE YEAR ENDED JUNE 30, 2020
Net Change in fund balance - total governmental funds (Exhibit 4) $ 156,833,601
Amounts reported for governmental activities in the Statement of Activities (Exhibit 2) are different because:
Governmental funds report capital outlay as expenditures. However, in the Statement of Activities, the cost of those assets is allocated over their estimated useful lives and reported as depreciation expense. This and the net effect of various other transactions involving capital assets increased net position.
General Government Capital Outlay Expenditures $ 169,446,236 General Government Expenditures (8,401,122)Non-Capitalizable Capital Outlay Expenditures (28,069,953)Depreciation on General Government Assets (134,556,072)Loss on Disposition of Assets 616,558 (964,353)
Revenues in the fund statements which were subject to accrual in the prior year are additions to beginning net position and, therefore, are not reported as revenues in the Statement of Activities. 11,916,107
The issuance of long-term debt provides current financial resources to governmental funds while the repayment of the principal of long-term debt consumes the current financial resources of governmental funds. Neither transaction, however, has any effect on net position. Also, governmental funds report the effect of issuance costs, premiums, discounts, and similar items when debt is first issued, whereas these amounts are deferred and amortized in the Statement of Activities. This amount is the net effect of these differences in the treatment of long-term debt and related items. (92,494,057)
Certain net expenses reported in the Statement of Activities do not require the use of current financial resources and, therefore, are not reported as expenditures in governmental funds.
Compensated Absences 2,656,551 Pension Expense (18,908,000)Other Postemployment Benefits 1,054,552
Internal Service Funds are used by management to charge the costs of fleet management and management systems to individual funds and customers. Losses arising from the internal customers are added as expenditures on the Statement of Activities as charge backs. Revenues and expenditures with outside customers are included also, as are non-operating revenues and expenses. This amount is the effect of reporting internal service funds with governmental activities. (10,246,675)
Change in net position of governmental activities (Exhibit 2) $ 49,847,726
The accompanying notes are an integral part of the financial statements.
21

CITY OF VIRGINIA BEACH, VIRGINIASTATEMENT OF NET POSITION
PROPRIETARY FUNDSJUNE 30, 2020
Business-Type Activities - Enterprise Funds
Water and Sewer Storm WaterASSETS
Current Assets:Cash and Investments $ 102,753,735 $ 35,829,236Accounts Receivable - Net 16,864,115 5,779,936Intergovernmental Receivables 2,324,307 322,946Inventory 3,312,203 -
Total Current Assets 125,254,360 41,932,118
Noncurrent Assets:Cash and Investments - Restricted 63,984,367 8,446,354Due From Other Funds - -Land Held for Resale - -Capital Assets:
Land 14,562,826 133,318,193Site Improvements - -Buildings 18,940,552 664,899Utility System 1,210,431,647 338,100,032Construction in Progress 18,189,967 27,087,635Machinery and Equipment 33,931,897 17,688,352Less: Accumulated Depreciation (570,995,589) (86,716,703)
Total Capital Assets 725,061,300 430,142,408Total Noncurrent Assets 789,045,667 438,588,762
Total Assets 914,300,027 480,520,880
DEFERRED OUTFLOWS OF RESOURCESDebt Refundings Resulting in Loss Transactions - -Deferred Outflows for Pensions 5,244,457 2,326,335Deferred Outflows for OPEB 966,003 230,445
Total Deferred Outflows of Resources 6,210,460 2,556,780
LIABILITIESCurrent Liabilities:
Vouchers and Accounts Payable 4,511,414 1,012,771Deposits Payable 132,840 263Accrued Interest Payable 2,015,937 323,558Construction Contracts Payable 3,335,422 4,901,544Unearned Revenue 1,461,087 -Current Portion of Long-term Liabilities 12,642,062 3,231,147
Total Current Liabilities 24,098,762 9,469,283
Long-term Liabilties:Compensated Absences 1,022,295 201,404Claims and Contingencies - -Bonds and Notes Payable 185,838,325 66,202,531Net Pension Liability 21,469,378 9,523,382Net OPEB Liability 2,420,692 1,482,571
Total Long-term Liabilities 210,750,690 77,409,888Total Liabilities 234,849,452 86,879,171
DEFERRED INFLOWS OF RESOURCESDebt Refundings Resulting in Gain Transactions - -Deferred Inflows for Pensions 743,026 329,591Deferred Inflows for OPEB 1,306,918 311,771
Total Deferred Inflows of Resources 2,049,944 641,362
NET POSITIONNet Investment in Capital Assets 524,685,632 360,439,709Restricted for:
Future Debt Services 17,979,295 3,393,570Special Projects - -
Unrestricted (deficit) 140,946,164 31,723,848Total Net Position $ 683,611,091 $ 395,557,127
Reconciling Items: Adjustment to reflect the consolidation of internal service fund activities related to enterprise fundsTotal Net Position of Business-type activities (Exhibit 1)
The accompanying notes are an integral part of the financial statements.
22

Exhibit 5CITY OF VIRGINIA BEACH, VIRGINIA
STATEMENT OF NET POSITIONPROPRIETARY FUNDS
JUNE 30, 2020
Business-Type Activities - Enterprise FundsGovernmental
Activities
Waste Management Development Authority Nonmajor Parking Totals Internal Service Funds
$ 12,389,149 $ 9,533,603 $ 4,444,894 $ 164,950,617 $ 51,572,9385,425,939 3,067,214 - 31,137,204 31
- - - 2,647,253 -- - - 3,312,203 2,371,765
17,815,088 12,600,817 4,444,894 202,047,277 53,944,734
- 8,744,243 - 81,174,964 -- 5,917,522 - 5,917,522 -- 43,960,824 - 43,960,824 -
- 24,065,308 - 171,946,327 -366,891 - 779,517 1,146,408 265,782
8,730 145,408,109 - 165,022,290 -- - - 1,548,531,679 -- 380,478 - 45,658,080 -
15,433,218 1,661,825 99,890 68,815,182 7,446,719(9,765,057) (43,838,082) (451,476) (711,766,907) (6,135,020)6,043,782 127,677,638 427,931 1,289,353,059 1,577,4816,043,782 186,300,227 427,931 1,420,406,369 1,577,481
23,858,870 198,901,044 4,872,825 1,622,453,646 55,522,215
- 930,869 - 930,869 -1,346,826 - 81,626 8,999,244 1,908,003
365,454 - 16,294 1,578,196 386,4011,712,280 930,869 97,920 11,508,309 2,294,404
1,638,405 13,934,376 276,943 21,373,909 1,474,218- - - 133,103 -- 537,684 - 2,877,179 -- - - 8,236,966 -- - - 1,461,087 -
528,790 7,373,672 21,227 23,796,898 10,339,3252,167,195 21,845,732 298,170 57,879,142 11,813,543
514,958 - 24,535 1,763,192 260,806- - - - 34,735,047- 45,630,574 - 297,671,430 -
5,513,537 - 334,154 36,840,451 7,810,844915,780 - 40,832 4,859,875 959,657
6,944,275 45,630,574 399,521 341,134,948 43,766,3549,111,470 67,476,306 697,691 399,014,090 55,579,897
- 767,718 - 767,718 -190,816 - 11,565 1,274,998 270,323494,425 - 22,044 2,135,158 522,768685,241 767,718 33,609 4,177,874 793,091
6,043,784 74,836,543 427,931 966,433,599 1,577,482
- - - 21,372,865 -- 4,384,390 - 4,384,390 -
9,730,655 52,366,956 3,811,514 238,579,137 (133,851)$ 15,774,439 $ 131,587,889 $ 4,239,445 1,230,769,991 $ 1,443,631
1,676,926$ 1,232,446,917
23

CITY OF VIRGINIA BEACH, VIRGINIASTATEMENT OF REVENUES, EXPENSES AND CHANGES IN NET POSITION
PROPRIETARY FUNDSFOR THE YEAR ENDED JUNE 30, 2020
Business-Type Activities - Enterprise Funds
Water and Sewer Storm Water
OPERATING REVENUESCharges for Services $ 130,442,429 $ 44,778,666Insurance Recovery 18,835 -Miscellaneous 47,494 517
Total Operating Revenues 130,508,758 44,779,183
OPERATING EXPENSESCost of Goods Sold 29,914,235 -Personal Services 29,165,491 6,699,889Contractual Services 7,777,835 3,911,353Internal Services 2,967,902 1,196,161Other Charges 18,213,850 11,885,059Leases and Rentals - -Depreciation 27,979,427 7,309,940
Total Operating Expenses 116,018,740 31,002,402
OPERATING INCOME (LOSS) 14,490,018 13,776,781
NONOPERATING REVENUES (EXPENSES)From Commonwealth - -Interest Income 3,289,659 1,037,329Gain (Loss) From Sale of Assets 56,591 37,494Payment Under Support Agreement - -Interest and Fiscal Agent Fees (7,026,660) (2,380,083)
Total Nonoperating Revenues (Expenses) (3,680,410) (1,305,260)
INCOME (LOSS) BEFORE CONTRIBUTIONSAND TRANSFERS 10,809,608 12,471,521
Capital Contributions 3,174,383 15,418Capital Contributions - Federal Government 889,482 933,736Transfers In - 1,004,873Transfers Out (1,000,554) -
CHANGE IN NET POSITION 13,872,919 14,425,548Total Net Position at Beginning of Year 669,738,172 381,131,579Total Net Position at End of Year $ 683,611,091 $ 395,557,127
Reconciling Items: Adjustment to reflect the consolidation of internal service fund activities related to enterprise funds.Change in Net Position of Business-type activities (Exhibit 2)
The accompanying notes are an integral part of the financial statements.
24

Exhibit 6CITY OF VIRGINIA BEACH, VIRGINIA
STATEMENT OF REVENUES, EXPENSES AND CHANGES IN NET POSITIONPROPRIETARY FUNDS
FOR THE YEAR ENDED JUNE 30, 2020
Business-Type Activities - Enterprise FundsGovernmental
Activities
Waste Management Development Authority Nonmajor Parking Totals Internal Service Funds
$ 37,161,454 $ 2,097,780 $ 4,701,165 $ 219,181,494 $ 47,416,611- - - 18,835 917,732
872,146 249,094 2,758 1,172,009 -38,033,600 2,346,874 4,703,923 220,372,338 48,334,343
- - - 29,914,235 9,664,94510,407,511 - 574,807 46,847,698 10,891,58914,396,831 6,025,629 2,116,337 34,227,985 4,245,7975,500,923 - 21,579 9,686,565 941,9022,990,596 - 326,011 33,415,516 19,117,876
- - 211,449 211,449 -1,737,130 3,853,177 28,537 40,908,211 509,683
35,032,991 9,878,806 3,278,720 195,211,659 45,371,792
3,000,609 (7,531,932) 1,425,203 25,160,679 2,962,551
35,658 - - 35,658 -193,754 37,112 101,059 4,658,913 1,360,72628,689 - 250 123,024 99,738
- 13,993,536 - 13,993,536 -- (1,969,931) (705,046) (12,081,720) -
258,101 12,060,717 (603,737) 6,729,411 1,460,464
3,258,710 4,528,785 821,466 31,890,090 4,423,015
- - - 3,189,801 -- - - 1,823,218 -- - 68,500 1,073,373 -- - (1,415,000) (2,415,554) (450,000)
3,258,710 4,528,785 (525,034) 35,560,928 3,973,01512,515,729 127,059,104 4,764,479 (2,529,384)
$ 15,774,439 $ 131,587,889 $ 4,239,445 $ 1,443,631
320,670$ 35,881,598
25

CITY OF VIRGINIA BEACH, VIRGINIASTATEMENT OF CASH FLOWS
PROPRIETARY FUNDSFOR THE YEAR ENDED JUNE 30, 2020
Business-Type Activities - Enterprise FundsWater and Sewer Storm Water
CASH FLOWS FROM OPERATING ACTIVITIES: Receipts from Customers and Users $ 128,220,549 $ 44,101,331 Receipts from (Payments for) Interfund Services Provided (471,680) - Other Operating Cash Receipts 47,494 517 Cash Payments to Suppliers of Goods and Services (58,716,668) (17,472,124) Cash Payments to Employees for Services (28,164,506) (6,682,670) Net Cash Provided (Used) By Operating Activities 40,915,189 19,947,054
CASH FLOWS FROM NONCAPITAL FINANCING ACTIVITIES: Intergovernmental Receipts - - Receipts from Other Funds - 1,004,873 Payments Under Support Agreement - - Payments to Other Funds (1,000,554) - Net Cash Provided (Used) By Noncapital Financing Activities (1,000,554) 1,004,873
CASH FLOWS FROM CAPITAL AND RELATED FINANCING ACTIVITIES: Capital Contributions 3,825,422 949,154 Net Interest on Long-term Debt (8,288,397) (2,653,519) Acquisition and Construction of Capital Assets (34,818,831) (32,039,242) Proceeds from Sale of Salvage 56,591 37,494 Principal Paid on Capital Debt (9,625,000) (2,525,000) Net Cash Provided (Used) By Capital and Related Financing Activities (48,850,215) (36,231,113)
CASH FLOWS FROM INVESTING ACTIVITIES: Interest and Dividends Received 3,289,659 1,037,329 Net Increase (Decrease) in Cash and Investments (5,645,921) (14,241,857) Cash and Investments, July 1 172,384,023 58,517,446 Cash and Investments, June 30 166,738,102 44,275,589
RECONCILIATION OF OPERATING INCOME (LOSS) TONET CASH PROVIDED BY OPERATING ACTIVITIES: Operating Income (Loss) 14,490,018 13,776,781 Adjustments to Reconcile Operating Income (Loss) to Net Cash Provided By Operating Activities: Depreciation and Amortization Expense 27,979,427 7,309,940 Changes in assets and liabilities: Accounts Receivable (567,460) (354,389) Intergovernmental Receivables (2,144,935) (322,946) Inventory (314,355) - Deferred Outflow of Resources (2,451,995) (845,469) Vouchers and Accounts Payable (17,841) (479,814) Deposits Payable 6,113 263 Unearned Revenue 483,237 - Deferred Inflow of Resources 1,026,990 179,523 Estimated Claims and Judgments - - Accrued Compensated Leave (22,816) (640,214) Net Pension Liability 3,605,432 1,599,297 Net OPEB Liability (1,156,626) (275,918) Net Cash Provided (Used) By Operating Activities 40,915,189 19,947,054
NONCASH INVESTING, CAPITAL, AND FINANCING ACTIVITIES: Capital Contributions of Capital Assets $ 238,443 $ -
The accompanying notes are an integral part of the financial statements.
26

Exhibit 7CITY OF VIRGINIA BEACH, VIRGINIA
STATEMENT OF CASH FLOWSPROPRIETARY FUNDS
FOR THE YEAR ENDED JUNE 30, 2020
GovernmentalBusiness-Type Activities - Enterprise Funds Activities
Waste Management Development Authority Nonmajor Parking Totals Internal Service Funds
$ 36,815,910 $ 2,342,751 $ 4,701,165 $ 216,181,706 $ 48,335,403 - 2,274,931 - 1,803,251 -
872,146 (209,116) 2,758 713,799 - (22,772,511) (6,513,049) (2,969,807) (108,444,159) (35,540,618)(10,133,542) - (553,909) (45,534,627) (7,394,825)
4,782,003 (2,104,483) 1,180,207 64,719,970 5,399,960
35,658 - - 35,658 - - - 68,500 1,073,373 (450,000) - - (1,415,000) (1,415,000) - - - (705,046) (1,705,600) -
35,658 - (2,051,546) (2,011,569) (450,000)
- 16,708,006 - 21,482,582 - - (2,468,114) - (13,410,030) -
(1,025,502) - - (67,883,575) (803,720) 28,689 - 250 123,024 99,738
- (7,449,119) - (19,599,119) - (996,813) 6,790,773 250 (79,287,118) (703,982)
193,754 37,112 101,059 4,658,913 1,360,726
4,014,602 4,723,402 (770,030) (11,919,804) 5,606,704 8,374,547 13,554,444 5,214,924 258,045,384 45,966,234
12,389,149 18,277,846 4,444,894 246,125,580 51,572,938
3,000,609 (7,531,932) 1,425,203 25,160,679 2,962,551
1,737,130 3,949,029 28,537 41,004,063 509,683
(345,544) - - (1,267,393) 1,060 - 5,286,764 - 2,818,883 - - 87,766 - (226,589) (580,355)
(635,331) - (38,224) (3,971,019) (895,963) 115,839 (3,896,110) (294,431) (4,572,357) (989,743)
- - - 6,376 - - - - 483,237 -
402,084 - 17,469 1,626,066 415,239 - - - - 3,145,557
18,874 - 5,046 (639,110) (17,123) 925,909 - 56,116 6,186,754 1,311,704 (437,567) - (19,509) (1,889,620) (462,650)
4,782,003 (2,104,483) 1,180,207 64,719,970 5,399,960
$ - $ - $ - $ 238,443 $ -
27

Exhibit 8CITY OF VIRGINIA BEACH, VIRGINIA
STATEMENT OF FIDUCIARY NET POSITIONJUNE 30, 2020
Trust FundsAgencyFunds
ASSETSCash and Investments $ - $ 261,195Fixed Income 9,546,667 -Stocks 26,821,950 -Real Estate 3,182,222 -Alternative Investments 5,909,842 -
Total Assets 45,460,681 261,195
LIABILITIESVouchers and Accounts Payable - 261,195
NET POSITIONNet Restricted for OPEB 45,460,681
The accompanying notes are an integral part of the financial statements.
28

Exhibit 9CITY OF VIRGINIA BEACH, VIRGINIA
STATEMENT OF CHANGES IN FIDUCIARY NET POSITIONFOR THE YEAR ENDED JUNE 30, 2020
TrustFunds
ADDITIONS
Contributions From Primary Government $ 7,013,877
Investment Income (Loss):Increase (Decrease) in the Fair Value of Investments 1,350,150
Total Investment Income (Loss) 1,350,150Total Additions 8,364,027
DEDUCTIONSBenefits 10,529,711Administrative Expenses 37,255
Total Deductions 10,566,966
Net Increase (Decrease) in Net Position (2,202,939)
RESTRICTED NET POSITION:Beginning of Year 47,663,620End of Year $ 45,460,681
The accompanying notes are an integral part of the financial statements.
29

CITY OF VIRGINIA BEACH, VIRGINIANOTES TO FINANCIAL STATEMENTS
JUNE 30, 2020
1. SUMMARY OF SIGNIFICANT ACCOUNTING POLICIES
The City of Virginia Beach, Virginia (the City), was formed on January 1, 1963, by the merger of Princess AnneCounty and the then former smaller City of Virginia Beach. This merger created what has become one of thelargest cities in the Commonwealth of Virginia with an area of 310 square miles and an estimated population of456,538.
The City operates under the Council-Manager form of government. The elected eleven-member City Council,vested with the legislative powers, appoints the City Manager who is the executive and administrative head ofthe City government.
The City's financial statements are prepared in conformity with generally accepted accounting principles in theUnited States of America (GAAP) as applicable to government units. The Governmental Accounting StandardsBoard (GASB) is the accepted standard-setting body for establishing governmental accounting and financialreporting principles in the United States of America. All applicable GASB statements have been implemented.The following is a summary of the significant accounting policies of the City of Virginia Beach:
A. The Financial Reporting Entity
The financial reporting entity consists of the primary government (City of Virginia Beach), as well as itscomponent units that are legally separate organizations for which the City Council is financially accountable. The accompanying financial statements present the financial data of the City of Virginia Beach and itscomponent units. The financial data of the component units are included in the City’s reporting entity because ofthe significance of their operational or financial relationship with the City of Virginia Beach.
Blended Component Unit
The Virginia Beach Development Authority (VBDA) - The VBDA, although legally separate insubstance, is presented as a blended component unit and part of the City’s reporting entity. The Cityhas responsibility through support agreements for debt payments on outstanding Public FacilityRevenue Bonds which are recorded on the VBDA’s financial records. Therefore, the VBDA’soutstanding bonds are expected to be repaid entirely from resources (support agreements) from theCity. The support agreements are for a majority of the outstanding debt of the VBDA whichnecessitates this treatment as a blended component unit.
The VBDA was established for the specific purpose of attracting new industries and the expansion ofexisting industries. The VBDA’s Commissioners are appointed by the City Council. The VBDA isauthorized to issue industrial development bonds after approval by the City Council and to purchaseland to improve and sell for development. In addition, the VBDA facilitates economic developmentprojects as needed by City Council. Complete financial statements of the VBDA may be obtained bywriting to the Virginia Beach Development Authority, 4525 Main Street, Suite 700, Virginia Beach,VA 23462.
Discretely Presented Component Units
Discretely presented component units are entities that are legally separate from the City, but for whichthe City is financially accountable, or whose relationship with the City is such that exclusion wouldcause the City’s financial statements to be misleading or incomplete. These component units arereported in separate columns to emphasize that they are legally separate from the City. All of thecomponent units have a fiscal year end of June 30.
30

CITY OF VIRGINIA BEACH, VIRGINIANOTES TO FINANCIAL STATEMENTS
JUNE 30, 2020
a. School Board - The School Board is a legally separate entity that is responsible for elementaryand secondary education within the City. The members of the School Board are elected by thevoters; however, the School Board is fiscally dependent upon the City because the City Councilannually approves its budget, levies the necessary taxes to finance operations and approves theborrowing of money and issuance of bonds. Separate financial statements including statisticalinformation of the School Board may be obtained by writing to the Virginia Beach School Board,2512 George Mason Drive, Virginia Beach, VA 23456.
b. Virginia Beach Community Development Corporation (CDC) - The CDC was organized inSeptember 1985 for the purpose of expanding and improving opportunities for low and moderateincome households in Virginia Beach, Virginia. The Board of Directors for the CDC is appointedby City Council. Funding received by the CDC from the City is in the form of grants. Completefinancial statements of the CDC may be obtained by writing to Virginia Beach CommunityDevelopment Corporation, 2700 International Parkway, Suite 300, Virginia Beach, VA 23452.
Joint Venture
Southeastern Public Service Authority (SPSA) - SPSA is a joint venture of the cities ofChesapeake, Franklin, Norfolk, Portsmouth, Suffolk and Virginia Beach and the counties of Isle ofWight and Southampton, created for the purpose of providing, operating and maintaining aregional system for the collection, transfer, processing and disposal of solid waste refuse. SPSA isa primary government, with no component units, that is a public body politic and corporate createdpursuant to the Virginia Water and Sewer Authorities Act. It is governed by a sixteen (16)member Board of Directors consisting of eight (8) members appointed by the Governor and eightmembers appointed by each of the member cities or counties. Budgeting and financing of SPSA issubject to the approval of the Board of Directors with each representative having a single vote.SPSA is responsible for its own financial matters, maintains its own books of accounts and isaudited annually by independent accountants that it engages. The participating governments donot have an equity interest in SPSA, and accordingly, no equity interest has been reflected in theCity’s financial statements June 30, 2020. Complete financial statements of the SPSA can beobtained from SPSA, 730 Woodland Drive, Chesapeake, VA 23320.
Jointly Governed Organizations
Hampton Roads Planning District Commission (HRPDC) - A regional planning agency authorizedby the Virginia Area Development Act of 1968, it was created by the merger of the SoutheasternVirginia Planning District Commission and the Peninsula Planning District Commission on July 1,1990. HRPDC performs various planning services for the cities of Chesapeake, Franklin,Hampton, Newport News, Norfolk, Portsmouth, Poquoson, Suffolk, Williamsburg and VirginiaBeach, plus the counties of Gloucester, Isle of Wight, James City, Southampton, and York.Revenue of the HRPDC is received primarily from local governmental (member) contributions andvarious state and federal grant programs. The participating governments do not have an equityinterest in the HRPDC and accordingly no equity interest has been reflected in the city's financialstatements at June 30, 2020. Completed financial statements of the HRPDC can be obtained fromthe HRPDC, 730 Woodlake Drive, Chesapeake, VA 23320.
Transportation District Commission (TDC) - The TDC was formed on June 29, 1999 to effect themerger of the Peninsula Transportation District Commission and the Tidewater TransportationDistrict Commission effective October 1, 1999. The TDC was established in accordance with theChapter 45 of Title 15.2 of the Code of Virginia. The TDC provides public transportation facilitiesand services within the cities of Chesapeake, Hampton, Norfolk, Portsmouth, Newport News andVirginia Beach. Oversight responsibility is exercised by all of the participating localities throughtheir designated representatives. Responsibility for the day-to-day operations of the TDC rests with
31

CITY OF VIRGINIA BEACH, VIRGINIANOTES TO FINANCIAL STATEMENTS
JUNE 30, 2020
professional management. The TDC is the governing body of Hampton Roads Transit (HRT).Theparticipating governments do not have an equity interest in the TDC and accordingly no equityinterest has been reflected in the city's financial statements at June 30, 2020. Completed financialstatements of the TDC can be obtained from the TDC at HRT 509 E 18th Street, Norfolk, VA23510.
Hampton Roads Transportation Alliance Committee (HRTAC) The HRTAC was formed on July1, 2014 to manage Hampton Roads Transportation Fund revenues and determine how new regionalmoney, of approximately $200 million annually will be invested in transportation projects. Thetwenty-three (23) member commission consists of mayors from local governments, state legislatorsand Commonwealth Transportation Board members from the fourteen (14) cities and countiesembraced by the Commission including Chesapeake, Franklin, Hampton, Newport News, Norfolk,Poquoson, Portsmouth, Suffolk, Virginia Beach, Williamsburg and the Counties of Isle of Wight,James City Southhampton and York. Separate financial statements are available from the HRTAC,700 Woodlake Drive, Chesapeake, VA 23320.
Hampton Roads Economic Development Alliance (HREDA) The HREDA is a non-profit, initiatives and activities are designed to promote the jurisdictions of Chesapeake, Franklin,Hampton, Isle of Wight, Newport News, Norfolk, Poquoson,, Portsmouth, Southampton County,Suffolk and Virginia Beach, Virginia. The business affairs are managed by a Board of not less thanfifty (50) or more than three hundred (300) Directors. The participating governments do not havean equity interest in HREDA and accordingly no equity interest has been reflected in the city'sfinancial statements at June 30, 2020. Separate financial statements are available from theHREDA, 500 Main Street, Suite 1300, Norfolk, VA 23510.
B. Government-Wide and Fund Financial Statements
The basic financial statements include both government-wide (based upon the City as a whole) and fundfinancial statements. Both the government-wide and fund financial statements (within the basic financialstatements) categorize primary activities as either Governmental or Business-Type. In the government-wideStatement of Net Position, both the Governmental and Business-Type Activities columns are presented on aconsolidated basis by column and are reflected on a full accrual and economic resources basis, whichincorporate long-term assets and receivables as well as long-term debt and obligations. The City generallyuses restricted assets first for expenses incurred for which both restricted and unrestricted assets areavailable. The City may defer the use of restricted assets based on a review of the specific transaction.
The statement of activities demonstrates the degree to which the direct expenses of a given function orsegment are offset by program revenues. Direct expenses are those that are clearly identifiable with aspecific function or segment.
The program revenues must be directly associated with the function (police, public works, etc.) or aBusiness-Type activity (water & sewer, waste management, etc.). Program revenues include 1) charges tocustomers or applicants who purchase, use or directly benefit from goods, services or privileges provided bya given function or segment and 2) grants and contributions that are restricted to meeting the operational orcapital requirements of a particular function or segment. Taxes and other items not properly included amongprogram revenues are reported as general revenues. The operating grants include operating-specific anddiscretionary (either operating or capital) grants while the capital grants column reflects capital-specificgrants.
Fund financial statements are provided for Governmental Funds, Proprietary Funds, and Fiduciary Funds.By definition, the assets of the Fiduciary Funds are being held for the benefit of a third-party and cannot beused to address activities or obligations of the government; therefore, these funds are excluded from the
32

CITY OF VIRGINIA BEACH, VIRGINIANOTES TO FINANCIAL STATEMENTS
JUNE 30, 2020
government-wide statements. Major individual Governmental Funds and major Enterprise Funds arereported as separate columns in the fund financial statements.
The City reports the following major Governmental Funds:
The General Fund is the City’s primary operating fund. It accounts for all financial resources of theCity, except those required to be accounted for in another fund. Revenues are derived primarily fromproperty and other local taxes, state and federal programs, licenses, permits, charges for service, andinterest income. A significant part of the General Fund’s revenues is used to finance the operations ofthe City of Virginia Beach School Board.
The Capital Projects Fund is used to account for the financial resources for the acquisition orconstruction of major capital facilities within the City.
The City reports the following major Proprietary Funds:
The Water and Sewer Fund provides water service and sanitary sewer waste collection andtransmission services to Virginia Beach citizens and accounts for operations that are financed in amanner similar to private business enterprises.
The Storm Water Fund accounts for the activities of the Storm Water Utility which charges a fee foroperational and capital needs for Storm Water management in the City.
The Waste Management Fund provides service to our residents for collection, management anddisposal of solid waste, recyclable materials and other refuse. In addition, the fund is responsible forthe operation of the City’s landfill.
The Development Authority Fund was established for the purpose of attracting new industries and theexpansion of existing industries. These services are financed through fees for Industrial Revenue Bondsand other sources.
Additionally, the City reports the following fund types:
Internal Service Funds account for the financing of goods and services provided to other departmentsand agencies of the City or to other governmental units on a cost reimbursement basis. The City utilizesInternal Service Funds for its City Garage, Risk Management, School Site Landscaping,Telecommunications, and Subscriptions.
Special Revenue Funds account for revenue derived from specific sources that are restricted by legaland regulatory provisions to finance specific activities. The City has the following Special RevenueFunds which are described in detail in the Non-major Special Revenue Fund section: AgricultureReserve Program, Central Business District South Tax Increment Financing, Combined Area DredgingProjects, Emergency FEMA, Federal Section Eight Program, Forfeited Assets, Grants Consolidated,Housing and Neighborhood Preservation, Law Library, Open Space, Parks and Recreation, SandbridgeSpecial Service District, Sandbridge Tax Increment Financing, Sheriff's Department, TourismAdvertising Program, Tourism Investment Program, Town Center Special Service District, WetlandsBoard Mitigation.
Fiduciary Funds are used to account for assets held by the City in a trustee capacity or as an agent forindividuals, private organizations and other governmental units. The Fiduciary Funds are AgencyFunds (Special Welfare, Escheat Property Agency Funds), the Pension Trust Fund and the OtherPostemployment Trust Fund. The Agency Funds are custodial in nature (assets equal liabilities) and donot involve measurement of results of operations. The Other Postemployment Benefit and Pension
33

CITY OF VIRGINIA BEACH, VIRGINIANOTES TO FINANCIAL STATEMENTS
JUNE 30, 2020
Trust Funds account for the assets in essentially the same manner as a Proprietary Fund using theeconomic resources measurement focus.
C. Basis of Accounting
The government-wide financial statements, Proprietary Fund and Fiduciary Fund financial statements arereported using the economic resources measurement focus and the accrual basis of accounting. AgencyFunds do not involve the measurement of results of operations as they are custodial in nature. They are usedto account for assets held by the city as an agent for individuals, private organizations, and othergovernmental units and/or other funds. Revenues are recorded when earned and expenses are recordedwhen a liability is incurred, regardless of the timing of related cash flows. Property taxes are recognized asrevenues in the year for which they are levied. Grants and similar items are recognized as revenues as soonas all eligibility requirements imposed by provider have been met.
The accounting and financial reporting treatment applied to a fund is determined by its measurement focus. All Governmental Funds are accounted for using a current financial resources measurement focus and themodified accrual basis of accounting. Under the modified accrual basis of accounting, revenues arerecognized when susceptible to accrual (i.e., when they become both measurable and available)."Measurable" means the amount of the transaction can be determined and "available" means collectiblewithin the current period or soon enough thereafter to be used to pay liabilities of the current period. Theterm available is limited to collection within forty-five days of the fiscal year end. Levies made prior to thefiscal year end but which are not available are recorded as deferred inflows. Expenditures are recordedwhen the related fund liability is incurred, if measurable (except for unmatured interest on general long-termdebt which is recognized when due and paid). Interest on general long-term debt is recognized asexpenditures to the extent they have matured. General capital asset acquisitions are reported asexpenditures in Governmental Funds. Proceeds of general long-term debt and acquisitions under capitalleases are reported as other financing sources.
The following is a list of the major revenue sources that meet the "susceptible to accrual" criteria:
General Property Taxes Interest on DepositsGeneral Sales Taxes Revenue from CommonwealthUtility Taxes Revenue from Federal GovernmentHotel Taxes Amusement TaxesRestaurant Taxes
Other postemployment benefits plan financial statements are prepared using the accrual basis of accounting.City and School Board retiree’s contributions are recognized in the period in which the contributions aredue. Employer contributions to each plan are recognized when due and both the City and School Boardhave made a formal commitment to provide the contributions. Benefits and refunds are recognized whendue and payable in accordance with the terms of each plan.
Unearned revenues also arise when resources are received by the government before it has a legal claim tothem. In subsequent periods, when both revenue recognition criteria are met, or when the government has alegal claim to the resources, the liability for unearned revenue is removed from the balance sheet andrevenue is recognized.
Unbilled Water and Sewer and Storm Water Enterprise Funds accounts receivable for services providedthrough June 30 are included in the financial statements.
As a general rule the effects of interfund activity have been eliminated from the government-wide financialstatements. Exceptions to this general rule are payments in lieu of taxes and other charges between theCity’s Water and Sewer Function, Storm Water Function, Waste Management Function, Parking Function
34

CITY OF VIRGINIA BEACH, VIRGINIANOTES TO FINANCIAL STATEMENTS
JUNE 30, 2020
and various other functions of the City. Elimination of these charges would distort the direct costs andprogram revenues reported for the various functions. Proprietary Funds distinguish operating revenues andexpenses from nonoperating items. Operating revenues and expenses generally result from providingservices and producing and delivering goods in connection with a Proprietary Fund’s principal ongoingoperations. The principal operating revenues of the Enterprise Funds and the City’s Internal Service Fundsare charges to customers for sales and service. Operating expenses for Enterprise Funds and InternalService Funds include the cost of sales and services, personnel, contractual services, land structures andimprovements, other charges, internal service charges and depreciation. All other revenues and expensesnot meeting this definition are reported as nonoperating revenues and expenses.
D. Capital Assets
Capital assets, which include property, plant, equipment, and infrastructure assets (e.g. roads, bridges, curbsand gutters, sidewalks, drainage systems) are reported in the applicable Governmental or Business-TypeActivities columns in the government-wide financial statements.
The City defines capital assets as assets with an initial, individual cost of more than $5,000. They arerecorded as expenditures in the Governmental Funds and as assets in the government-wide financialstatements. Depreciation is recorded on capital assets on a government-wide basis using the straight-linemethod and the following estimated useful lives:
Building and Improvements 40 yearsSite Improvements 40 yearsEquipment 5-10 yearsRoadway Network 40 yearsBridge Network 50 yearsHurricane Protection Network 50 yearsLandfill Network Percentage of Completion
Depreciation of exhaustible capital assets used by City Proprietary Funds and the blended DevelopmentAuthority are recorded as an expense against their operations and accumulated depreciation is reported onthe Proprietary Funds' balance sheets. Depreciation has been provided over the estimated useful lives usingthe straight-line method of depreciation.
The utility system in the Water and Sewer Enterprise Fund has been recorded at cost since July 1, 1976 andcontributed capital asset additions have been recorded at their estimated fair market value in the yearcontributed as determined by the City's utility engineers. Prior to that date, the utility system was recordedat "estimated historical cost depreciated" as determined by independent professional engineers.
Depreciation on the utility system, based on costs described above, and other capital assets of the CityProprietary Funds have been charged to operations and was computed as follows:
Utility System Water and Sewer 20-100 yearsUtility System Storm Water 5-50 yearsBuildings and Improvements 40 yearsSite Improvements 40 yearsMachinery and Equipment 5-10 years
Interest incurred during the construction phase of capital assets of Business-Type Activities is included aspart of the capitalized value of the assets constructed through FY 2018.
35

CITY OF VIRGINIA BEACH, VIRGINIANOTES TO FINANCIAL STATEMENTS
JUNE 30, 2020
All capital assets are reported at cost or estimated historical cost, if actual cost is not available. The valueof historical buildings is included in assets. Donated capital assets, donated works of art and similar items,and capital assets received in a service concession arrangement are reported at acquisition value.
E. Operating Budget Process
The City follows these procedures in establishing the budgetary data reflected in the financial statements:
1. The City Manager is required by the City Charter to present a proposed operating budget at least 90days before the beginning of each fiscal year which begins July 1. The proposed operating budget mustbe balanced with projected expenditures equal to estimated revenues and/or the required financing fromthe proper unassigned fund balances. The necessary budget ordinances are also submitted at this time.
2. The City Council is required by the City Charter to hold a public hearing on the budget at which timeall interested persons are given an opportunity to comment. The notice of the time and place must bepublished at least seven days prior to the hearing. In addition, City Council holds budget workshopswith the City Manager that are open to the media and public.
3. If the proposed operating budget is not legally adopted by the City Council upon one reading of thebudget ordinances by June 1, the operating budget is automatically adopted as proposed.
4. The City Manager or the Director of Budget and Management Services is authorized to approvetransfers of appropriations in an amount up to $100,000 between any Appropriation Units included inthe budget ordinance. The City Manager shall make a monthly report to the City Council of all transfersbetween $25,000 and $100,000. In addition, the City Manager may transfer, in amounts necessary,appropriations from all Reserves for Contingencies except Reserve for Contingencies - Regular, withinthe intent of the Reserve as approved by City Council. Additional appropriations require one reading ofthe ordinance for approval and must be offset by additional estimated revenues and/or a transfer fromthe proper unassigned fund balances. Additional appropriations that exceed 1% of the total estimatedexpenditures shown in the adopted budget require a public hearing and one reading of the ordinance forapproval by City Council.
5. Annual budgets are adopted for the General Fund, Enterprise Funds and all Special Revenue Fundsexcept for Wetlands Board Mitigation, Development Authority and the Grants Consolidated Fund. TheCity's Capital Project Fund and the Grants Consolidated Fund’s budgets are adopted on a project basis. The budgets for these funds are adopted in conformity with generally accepted accounting principles inthe United States of America (GAAP).
6. The accounting system is employed as a budgetary management control device to monitor theindividual departments or bureaus/divisions within departments. The legal level of budgetary control isat the organizational unit level as noted in the separately issued budget report. Additional controls areexercised administratively on some budget units, personnel positions and capital outlay items and theappropriations related thereto. A budget unit is an activity (e.g. Street Maintenance) of anorganizational unit (e.g. Public Works Department). Department Directors are authorized to makespending adjustments within non-controlled accounts (operating support accounts including contractualservices, internal service charges, other charges and supplies) that do not exceed the scope or intent ofthe department’s approved budget. The non-controlled accounts for the appropriation unit must balancein total, but do not have to balance individually. The City Manager or the Director of Budget andManagement Services is authorized to transfer appropriations up to a maximum of $100,000 throughthe accrual period.
36

CITY OF VIRGINIA BEACH, VIRGINIANOTES TO FINANCIAL STATEMENTS
JUNE 30, 2020
7. The City Manager or the Director of Budget and Management Services is authorized to change theEstimated Revenues included in the annual Budget Ordinance to reflect expected collections. If theEstimated Revenue in support of an Operating Appropriation Unit declines, the City Manager or theDirector of Budget and Management Services is authorized to reduce, subject to any other provision oflaw, those appropriations to equal the decline in Estimated Revenue. The City Manager shall give priornotice to the City Council of any reduction to total appropriations exceeding $100,000. The notice toCity Council shall identify the basis and amount of the appropriation reduction and the AppropriationUnits affected.
8. Unexpended appropriations lapse (except for the City Capital Projects and Grants Funds) and areclosed to the proper fund balances at the end of each fiscal year (June 30). (However, appropriationsfor the subsequent fiscal year are increased in the amount necessary to satisfy the outstandingencumbrances at June 30.) The current operating budget ordinance approved by City Council stipulatedthat the city shall maintain an unassigned General Fund Balance of 8% to 12% of the following years'projected revenues for contingency and emergency situations. These shall not to be used to supportappropriations already approved, except upon subsequent authorization by City Council.
9. Capital Projects for the City are budgeted separately from the Operating Budget. Since the City hasover three hundred (300) projects in its Capital Improvements Program and an annual limitation(without a referendum) on the amount of bonds that may be issued, allocations for capital projectsrepresent funding by phases of a number of projects based upon their anticipated execution ofcontractual obligations. The appropriations for the City's Capital Improvement Program require apublic hearing and one reading of the ordinance for approval. The accounting, encumbering, andcontrolling of the funds are based upon the project length of each individual project which may be overseveral years. Therefore, budgetary comparisons are not presented for Capital Projects in this report. Appropriations reallocated to new or existing capital projects require one reading of the ordinance byCity Council for approval.
10. Many of the federal and state grants in the Grants Consolidated Fund are budgeted separately from theOperating Budget and do not parallel the City's fiscal year. Expenditures are restricted by the grantoragency and are subject to financial and compliance audits. Annual revenues and expenditures arereported within the applicable Special Revenue Funds.
11. All expenditures were within existing appropriations for the governmental major funds.
F. Inventories
All inventories, except in the Water and Sewer Enterprise Fund, Development Authority, the GeneralFund’s Virginia Aquarium and Marine Science Center and the City Garage Internal Service Fund, arereported at cost using the first-in, first-out inventory method.
Reported inventories are accounted for under the consumption method (i.e., recorded as expenditures whenused) in the remaining Governmental Funds, except for General Fund Public Works inventory. Thisinventory utilizes the Purchase Method (i.e., recorded as expenditures when purchased).
The Water and Sewer Enterprise Fund and the General Fund’s Virginia Aquarium and Marine ScienceCenter, the City Garage Internal Service Fund and the Sheriff's Special Revenue Fund inventories arereported at cost using the moving weighted average cost inventory method. The Development AuthorityEnterprise Fund inventories are reported at net realizable value.
37

CITY OF VIRGINIA BEACH, VIRGINIANOTES TO FINANCIAL STATEMENTS
JUNE 30, 2020
G. Land and Building Inventory Held For Resale
Land and building inventory for Development Authority is stated at the lower of net realizable value ororiginal purchase price plus capitalized interest, if applicable, and development cost.
H. Accrued Compensated Leave
In accordance with Governmental Accounting Standards Board Statement (GASB) Number 16, an accrualhas been made in the financial statements for accrued compensated leave. Annual leave, according to agraduated scale based on years of employment, is credited to each employee as it accrues. A permanentCity employee, not participating in the VRS Hybrid Plan, may carry-forward a maximum of fifty (50) days.All full-time employees hired on or after January 1, 2014, except hazardous duty employees, and thosehired before this date, who made the irrevocable decision to participate in the Hybrid Plan shall accrue anduse Paid Time Off. Those participating in the Hybrid Plan may carry-forward a maximum of twenty-four(24) days.
City employees not participating in the Hybrid Plan are granted one sick leave day per month and mayaccumulate an unlimited number of sick leave days; however, no payment is made by the City on the unusedportion upon employment termination (except on the condition of retirement).
Compensated leave for the City (current and non-current) is recorded in the government-wide financialstatements. For Proprietary Funds the current and long-term accrued compensated leave liabilities arerecorded in the appropriate fund. The current portion of compensated leave is based upon the estimatedleave usage in the subsequent year increased by cost of living salary increases.
The City established guidelines, following IRS regulations, for the administration of the Leave DonationProgram which allows eligible employees to obtain approval to receive sick leave donations. The City alsoestablished the following plans:
Hybrid Retirement Plan - A Virginia Retirement System (VRS) program provided to eligible employeesthat specifies retirement payout and provides short-term and long-term disability income replacement underthe Virginia Local Disability Plan (VLDP).
VRS Plan 1 and Plan 2 Retirement Plan - A VRS retirement program provided to eligible employees thatspecifies retirement payout with no provisions for short-term and long-term disability income replacement.
I. Fund Balances
Fund balance is divided into five classifications based primarily on the extent to which the City is bound toobserve constraints imposed upon the use of the resources in the governmental funds. The classifications areas follows:
Nonspendable - The nonspendable fund balance category includes amounts that cannot be spent becausethey are not in spendable form, or are legally or contractually required to be maintained intact. The “not inspendable form” criterion includes items that are not expected to be converted to cash.
Restricted - Fund balance is reported as restricted when constraints placed on the use of resources are eitherexternally imposed by creditors (such as through debt covenants), grantors, contributors, laws or regulationsof other governments or is imposed by law through constitutional provisions or enabling legislation (Cityordinances). Enabling legislation authorizes the City to assess, levy, charge, or otherwise mandate paymentof resources (from external resource providers) and includes a legally enforceable requirement that thoseresources be used only for the specific purposes stipulated in the legislation. Legal enforceability means
38

CITY OF VIRGINIA BEACH, VIRGINIANOTES TO FINANCIAL STATEMENTS
JUNE 30, 2020
that the City can be compelled by an external party such as citizens, public interest groups, or the judiciaryto use resources created by enabling legislation only for the purposes specified by the legislation.
Committed - The committed fund balance classification includes amounts that can be used only for thespecific purposes imposed by formal action (ordinance) of City Council. Those committed amounts cannotbe used for any other purpose unless City Council removes or changes the specified use by taking the sametype of action (ordinance) it employed to previously commit those amounts. In contrast to fund balance thatis restricted by enabling legislation, committed fund balance classification may be redeployed for otherpurposes with appropriate due process. Constraints imposed on the use of committed amounts are imposedby City Council, separate from the authorization to raise the underlying revenue; therefore, compliance withthese constraints are not considered to be legally enforceable.
Assigned - Amounts in the assigned fund balance classification are intended to be used by the City forspecific purposes but do not meet the criteria to be classified as restricted or committed. In governmentalfunds other than the general fund, assigned fund balance represents the remaining amount that is notrestricted or committed. In the General Fund, assigned amounts represent intended uses established by CityCouncil, the City Manager or by a City official delegated that authority by appropriate action.
Unassigned - Unassigned fund balance is the residual classification for the general fund and includes allspendable amounts not contained in the other classification. In other governmental funds, the unassignedclassification is used only to report a deficit balance resulting from overspending for specific purposes forwhich amounts had been restricted, committed, or assigned.
The City applies restricted resources first when expenditures are incurred for purposes for which eitherrestricted or unrestricted (committed, assigned, and unassigned) amounts are available. Similarly, withinunrestricted fund balance, committed amounts are reduced first followed by assigned, and then unassignedamounts when expenditures are incurred for purposes for which amounts in any of the unrestricted fundbalance classifications could be used.
J. Use of Estimates
The preparation of financial statements in conformity with accounting principles generally accepted in theUnited States of America requires management to make estimates and assumptions that affect the reportedamounts of assets and liabilities and disclosure of contingent assets and liabilities as of the date of thefinancial statements, and the reported amounts of revenues and expenditures during the reporting period.Actual results could differ from those estimates.
K. Fund Balance Policy
It is the City Council’s policy that there shall be retained in the General Fund an unassigned fund balance of8% to 12% of the following year’s budgeted revenues. This level equates to approximately one month ofoperating expenses.
L. Miscellaneous
1. Cash and Investments
Cash invested at June 30 is included in the various cash accounts reflected in the financial statements. Investments are stated at amortized cost or at their fair value (Note 8). Interest earnings on investmentsare allocated to the appropriate funds based upon the average monthly cash balance of each fund.Qualified investments in State Treasurer’s LGIP, Virginia Investment Pool and SNAP are reported atamortized cost. All others are reported at fair value (Note 8).
39

CITY OF VIRGINIA BEACH, VIRGINIANOTES TO FINANCIAL STATEMENTS
JUNE 30, 2020
Other postemployment benefit investments are reported at fair value, which for the City and SchoolBoard is determined by the most recent bid and asking prices as obtained from markets of suchinvestments. Securities for which market quotations are not readily available are valued at their fairvalue as determined in good faith by the custodian under the direction of the Board of Trustees of theVirginia Pooled OPEB Trust Fund. A valuation service may be engaged to assist in the determinationof fair value.
2. Proprietary Funds' Other Charges
This category mainly consists of General Fund charges (e.g., data processing, buildings and groundsmaintenance, indirect costs) to the Water and Sewer, Storm Water, Waste Management and ResortParking Enterprise Funds, Internal Service Funds except Risk Management, and the DevelopmentAuthority. For Risk Management it represents premiums and claims payments (including currentestimated claims and judgments). The Development Authority other charges consist of selling, leaseand leasehold improvements, professional services, and other general expenses.
3. Statement of Cash Flows
For purposes of the statements of cash flows, all highly liquid debt instruments and certificates ofdeposit, with a maturity of three months or less at the time of acquisition, are grouped into cash andtemporary investments. Proprietary Funds participate in a centralized cash and investment pool andtherefore, separate information on cash equivalents (i.e., investments with maturities of three months orless upon acquisition) for the funds is not applicable.
4. Bond Premiums and Discounts
Bond premiums and discounts are deferred and amortized over the life of the bonds using thestraight-line method, which approximates the effective interest method. Bonds are reported net of theapplicable bond premium or discount.
5. Internal Balances
The amount reported in the Statement of Net Position for internal balances represents support paymentsto the blended component unit, the Virginia Beach Development Authority, during the fiscal year justended and the amounts charged back to the business type activities.
M. Net Position
The difference between assets plus deferred outflows of resources less liabilities less deferred inflows ofresources in the government-wide statement of net position must be labeled as net position. GAAP furtherrequires that net position be subdivided into three categories: net investment in capital assets, restricted netposition; and unrestricted net position.
N. Long-Term Obligations
In the Government-wide and Proprietary Fund type financial statements, long-term debt and other long-termobligations are reported as liabilities in the applicable Governmental or Business-Type Statement ofActivities, or the Proprietary Fund type Statement of Net Position. Bond premiums and deferred loss onrefunding bonds are deferred over the life of the bonds using a straight-line method. Issuance costs arereported as debt service expenditures in the year incurred.
In the fund financial statements, Governmental Fund types recognize bond premiums and discounts, as wellas bond issuance costs, during the current period. The face amount of debt issued is reported as other
40

CITY OF VIRGINIA BEACH, VIRGINIANOTES TO FINANCIAL STATEMENTS
JUNE 30, 2020
financing sources. Premiums received on debt issuances are reported as other financing sources while discounts on debt issuances are reported as other financing uses. Issuance costs, whether or not withheldfrom the actual debt proceeds, are reported as debt service expenditures.
O. Restricted Assets - Cash and Investments
Certain proceeds of the Primary Government’s revenue bond issuance have been set aside in separate bankaccounts as a reserve for future debt service payments. In addition, inclusive in this category are optiondeposits, funds held for capital projects and improvements and grant awards.
P. Unrestricted Net Position - Governmental Activities
Inclusive in Governmental Activities unrestricted net position are ending committed fund balances ofcertain Special Revenue Funds which have been earmarked for specific purposes by City Council. Thesefunds include, but are not limited to, Agriculture Reserve Fund, Tax Increment Financing Funds, OpenSpace Fund, Parks and Recreation Fund, Tourism Investment Program Fund, Tourism Advertising ProgramFund and the Capital Projects Fund.
Q. Restricted Net Position
Some primary government and component unit net position amounts are subject to various restrictions.Bond resolutions restrict the net position of the Water and Sewer, Storm Water and Debt Service Funds foroperations. The Master Water and Sewer Resolution restricts net position of the Water and SewerEnterprise Fund for the cost of operation, maintenance and debt service costs. The Agreement of Trust,dated January 1, 2000, restricts the net position of the Storm Water Enterprise Fund in a similar manner.The ending fund balance of the Debt Service Fund is restricted for future debt costs. The WasteManagement Enterprise Fund ending net position is restricted for fund operations.
Certain amounts in the General Fund, Special Revenue Funds, and component units are restricted throughother enabling legislation.
R. Deferred Outflows and Inflows of Resources
Deferred outflows of resources represent a consumption of net position that applies to a future period and assuch will not be recognized as an expense or expenditure until then. The City’s deferred outflows ofresources consist of the amount by which the principal and premium of a refunding bond exceed the netcarrying amount of the refunded debt and pension contributions subsequent to the measurement date. Thedeferred outflow related to debt is being amortized over the remaining life of the refunded debt or the life ofthe new debt, whichever is shorter.
Deferred inflows of resources represents an acquisition of net position that applies to a future period and assuch will not be recognized as a revenue until then. The City’s deferred inflows of resources consist of theamount by which the net carrying amount of refunded debt exceed the principal and premium of a refundingbond, the property tax levy recorded in the current fiscal year pertaining to Fiscal Year 2020 and pensionactivity that will be recognized as pension expense over a four to five year period. The deferred inflow isbeing amortized over the remaining life of the refunded debt or the life of the new debt, whichever isshorter. Under the modified accrual basis of accounting, the City has revenues which are applicable to afuture period, and will not be recognized until the period they become available. These amounts arerecorded on the governmental funds balance sheet as a deferred inflow of resources.
41

CITY OF VIRGINIA BEACH, VIRGINIANOTES TO FINANCIAL STATEMENTS
JUNE 30, 2020
S. Pensions
For purposes of measuring the net pension liability, deferred outflows and inflows of resources related topensions, and pension expense, information about the fiduciary net position of the Political Subdivision’sRetirement Plan and the additions to deductions from the Political Subdivision’s Retirement Plan’s net fiduciary position have been determined on the same basis as they were reported by the Virginia RetirementSystem (VRS). For this purpose, benefit payments (including refunds of employee contributions) arerecognized when due and payable in accordance with the benefit terms. Investments are reported at fairvalue.
T. Other Postemployment Benefits (OPEB)
For purposes of measuring the net OPEB liability, deferred outflows and inflows of resources related toOPEB, and OPEB expense, information about the fiduciary net position of the Political Subdivision’sOPEB Plan, and the additions to/deductions from the Political Subdivision’s OPEB Plan’s net fiduciaryposition have been determined on the same basis as they were reported by the Virginia Retirement System(VRS). For this purpose, benefit payments (including refunds of employee contributions) are recognizedwhen due and payable in accordance with the benefit terms. Investments are reported at fair value.
U. New Accounting Standards
In Fiscal Year 2020, the City did not adopt any new statements of financial accounting standards issued byGASB.
V. Pronouncements Issued but not Yet Effective
GASB has issued the following pronouncements prior to June 30, 2020 that may affect future financialposition, results of operations, cash flows or financial presentation of the City upon implementation. Management has not yet evaluated the effect of implementation of these standards.
GASBSTATEMENT NO. GASB ACCOUNTING STANDARD
EFFECTIVEFISCAL YEAR
84 Fiduciary Activities 2021 87 Leases 2022
90 Majority Equity Interests (Amendment of GASB No. 14and No. 61) 2021
91 Conduit Debt Obligations 202392 Omnibus 2020 2022
42

CITY OF VIRGINIA BEACH, VIRGINIANOTES TO FINANCIAL STATEMENTS
JUNE 30, 2020
2. FUND BALANCES – GENERAL FUND AND NONMAJOR GOVERNMENTAL FUNDS
General Fund and Nonmajor governmental fund balances are classified as nonspendable, restricted, committed,assigned and/or unassigned based primarily on the extent to which the City is bound to observe constraintsimposed upon the use of these resources. The constraints placed on fund balances for the General Fund andNonmajor governmental funds are presented below:
GENERAL FUND: NONMAJOR GOVERNMENTAL FUNDS:
Nonspendable: Restricted: Inventories $ 4,769,415 Housing and Community Development $ 8,857,050 Housing and Volunteer Rescue Squad Loans 6,490,546 Forfeited Assets - Judicial 504,605
Total Nonspendable 11,259,961 Forfeited Assets - Police 2,793,132 Special Service Districts 2,358,378
Restricted: Total Special Revenue Funds 14,513,165 Community Services Board 1,460,287 Future Debt Service 44,340,008
Total Restricted 58,853,173 Committed Education 16,549,308
Committed: Assigned: Agriculture Program 15,064,165 Community Programs $ 68,188 Convention and Visitor Development 27,519,429 Judicial 741,233 Educational 89,477 Library 296,290 Parks and Recreation Activities 12,973,610 Living Shorelines Program 46,446 Central Business District TIF Program 1,186,075 Maritime Forest Program 43,512 Total Committed 56,832,756 Oyster Heritage Program 118,426 Public Safety 28,926 Other General Programs 95,010 Assigned:
Total Special Programs 1,438,031 Agriculture Program 658,310 General Government 59,496,461 Forfeited Assets - Judicial 522,500
Total General Government 60,934,492 Forfeited Assets - Police 789,246 Education 36,303,277 Special Service Districts 493,981 Capital Improvement Program - General 26,457,715 Total Assigned 2,464,037
Total Assigned 123,695,484
Unassigned: Unassigned: General Government 152,842,932 General Government (3,322,157)
Total Fund Balance $ 305,807,972 Total Fund Balance $ 114,827,809
43

CITY OF VIRGINIA BEACH, VIRGINIANOTES TO FINANCIAL STATEMENTS
JUNE 30, 2020
3. RECEIVABLES AND ACCRUED LIABILITIES
A. Receivables
Receivables at June 30, 2020 consist of the following:
Primary Government
Governmental Business-TypeActivities Activities Total
Real Estate Taxes $ 39,056,820 $ - $ 39,056,820 Personal Property Taxes 61,552,316 - 61,552,316 Loans 11,349,069 - 11,349,069 Due from Other Government 73,240,645 2,647,253 75,887,898 Accounts 30,749,967 34,136,436 64,886,403 Gross Receivables 215,948,817 36,783,689 252,732,506 Less: Allowance forUncollectibles (38,189,596) (2,999,232) (41,188,828)Net Receivables - Entity Wide $ 177,759,221 $ 33,784,457 $ 211,543,678
Major Funds – Governmental
General FundReal Estate Taxes $ 39,056,820 Personal Property Taxes 61,552,316 Accounts 2,200,576 Loans 6,490,546 Due from Other Funds 1,960,792 Intergovernmental Accounts 67,534,380 Gross Receivables 178,795,430 Less: Allowance forUncollectibles (27,462,876)Net Receivables $ 151,332,554
Major Funds – Proprietary
VirginiaBeach
Water and Waste DevelopmentSewer Storm Water Management Authority Total
Accounts $ 19,158,736 $ 5,998,243 $ 5,912,243 $ 3,067,214 $ 34,136,436 IntergovernmentalAccounts 2,324,307 322,946 - - 2,647,253 Gross Receivables 21,483,043 6,321,189 5,912,243 3,067,214 36,783,689 Less: Allowance forUncollectibles (2,294,621) (218,307) (486,304) - (2,999,232)Net Receivables $ 19,188,422 $ 6,102,882 $ 5,425,939 $ 3,067,214 $ 33,784,457
44

CITY OF VIRGINIA BEACH, VIRGINIANOTES TO FINANCIAL STATEMENTS
JUNE 30, 2020
Component Units
Receivables at June 30, 2020 consist of the following:
CommunitySchool DevelopmentBoard Corporation Total
Notes, Deed of Trust $ - $ 893,682 $ 893,682 Accrued Interest - 144,635 144,635 Intergovernmental Accounts 23,219,935 61,528 23,281,463 Due from Affiliate - 424,318 424,318 Accounts 2,801,998 255,052 3,057,050 Net Receivables $ 26,021,933 $ 1,779,215 $ 27,801,148
B. Property Taxes Receivable
An annual ad valorem tax is levied by the City on the assessed value of real and tangible personal property. These levies are made each year on July 1 and January 1 for real property and tangible personal property,respectively. Taxes levied on these dates become liens on the subject property on the date of levy. Realproperty taxes are payable in two installments on December 5 and June 5. Personal property taxes arepayable on June 5, however, pro-rated bills on automobiles are also payable throughout the year on theportion of the year they are owned if not owned a full year. These taxes are considered delinquent when notpaid by the due dates and subject to penalties and interest charges by the City Treasurer. During FiscalYear 2020, all penalties and interest on property taxes were waived until August 3, as a means of financialrelief from the COVID-19 pandemic. City property tax revenues are recognized when levied and collected.
The City calculates its allowance for uncollectible taxes by using historical collection data. Furthermore,the taxes receivable amount which remains uncollected after the 45 day accrual period is recorded asunearned revenue for the fund financial statements.
Fiscal Year 2020 real property rate was $1.0175 per $100 of assessed valuation, except for public servicecorporation properties. In addition there are Special Service Districts that were charged an additional rate,these districts and rates are as followed:
AdditionalSpecial Service District Tax RateBayville Creek Special Service District $ 0.472 Chesopeian Colony Special Service District 0.2913 Gills Cove Special Service District 0.063 Harbour Point Special Service District 0.120 Hurds Cove Special Service District 0.438 Old Donation Special Servie District 0.184 Sandbridge Special Service District 0.060 Schilling Point Special Service District 0.404 Shadowlawn Special Service District 0.1594 Town Center Special Service District 0.450
Additionally, the real property tax rate on all real estate that has been classified as an energy efficientbuilding, not exempt from taxation, was $0.8675 on each $100 of assessed valuation thereof. Taxes on
45

CITY OF VIRGINIA BEACH, VIRGINIANOTES TO FINANCIAL STATEMENTS
JUNE 30, 2020
buildings that are individually listed on the Virginia Landmarks Register, not including the real estate orland on which the building is located, so long as the building is maintained in a condition such that it retainsthe characteristics for which it was listed on the Virginia Landmarks Register, were at a rate of $0.5475 oneach $100 of assessed valuation thereof. The personal property rate was $4.00 per $100 of assessedvaluation (100% of fair market value). Other personal property tax rates exist for qualified equipment.There are no limits currently on the property tax rates which may be established by the City Council. CityCouncil is the only governmental entity that has the local taxing authority.
C. Intergovernmental Receivables - Primary Government and School Board Component Unit – Entity Wide
1. The following revenues were due from the Commonwealth of Virginia at June 30, 2020:
Primary Government
GovernmentalActivities
General Sales Tax $ 5,715,014 Telecommunication Tax 1,706,653 Personal Property Tax Relief Act 53,412,868 Other Grants, Entitlements, & Shared Revenues 3,441,664 General Fund Salary Reimbursements 528,814 Sheriff's Department 1,363,624 Other 1,876,954 Total Due from Commonwealth $ 68,045,591
School Board Component Unit
State Share Sales Tax $ 5,966,070 Special Education-Regional Program 4,887,937 Technology Initiative 270,217 Dual Enrollment - TCC 513,189 Juvenile Detention Center 297,349 Other Grants, Entitlements and Shared Revenues 174,599 Total Due from Commonwealth-Governmental Funds $ 12,109,361
46

CITY OF VIRGINIA BEACH, VIRGINIANOTES TO FINANCIAL STATEMENTS
JUNE 30, 2020
2. The following revenues were due from various Federal agencies at June 30, 2020:
Primary Government
GovernmentalActivities
Community Development $ 794,130 Public Assistance Grants 1,487,090 Grants Consolidated 1,351,771 Housing Assistance 694,579 Emergency FEMA 864,129 Other 3,355 Total Due from Federal Government $ 5,195,054
School Board Component Unit
Adult Basic Eduction $ 83,846 Carl Perkins 768,543 DODEA MCASP GRIT 292,544 McKinney Homeless 30,588 National School Meal Program 207,258 NJROTC 79,270 Preschool Incentive 121,961 Startalk 67,555 School Feeding Program 841,767 Title I 4,801,505 Title II 436,371 Title III 20,800 Title IV 514,904 Title VI-B 2,843,662 Total Due from Federal Government $ 11,110,574
3. The following revenues were due from Other Governments at June 30, 2020:
Business - Type Activities
The Water and Sewer fund was due $2,202,034 from the Water Services Contract with the City of Norfolk and $122,273 from the City of Chesapeake in June operations, maintenance, and capital improvement costs for the Lake Gaston Water Supply Project.
The Storm Water fund was due $322,946 from FEMA for the Flood Mitigation Assist Grant Program.
47

CITY OF VIRGINIA BEACH, VIRGINIANOTES TO FINANCIAL STATEMENTS
JUNE 30, 2020
D. Allowances For Uncollectible Accounts Receivable
Allowances for uncollectible accounts receivable are generally established using historical collectiondata, specific account analysis and subsequent cash receipts. The allowances at June 30, 2020 are asfollows:
General Fund $ 27,462,876 Special Revenue Funds 10,726,720 Water and Sewer Fund 2,294,621 Storm Water Fund 218,307 Waste Management Fund 486,304 Total $ 41,188,828
E. Major Components of Accrued Liabilities at June 30, 2020 consist of the following:
Primary Government
Governmental Business-TypeActivities Activities Total
Accrued Interest Payable $ 9,466,173 $ 2,877,179 $ 12,343,352 Deposits Payable 3,259,390 133,103 3,392,493 Unearned Revenue 4,171,257 1,461,087 5,632,344 Total Accrued Liabilities $ 16,896,820 $ 4,471,369 $ 21,368,189
Component Units
CommunitySchool DevelopmentBoard Corporation Total
Accrued Interest Payable $ - $ 165,540 $ 165,540 Unearned Revenue 10,937,355 4,125 10,941,480 Deposits Payable 75,000 190,705 265,705 Accrued Salaries 62,542,911 - 62,542,911 Total Accrued Liabilities $ 73,555,266 $ 360,370 $ 73,915,636
4. UNEARNED REVENUE
Unearned revenue represents amounts for which asset recognition criteria have been met, but for which revenuerecognition criteria have not been met. Under the modified accrual basis of accounting, such amounts aremeasurable, but not available.
Unearned revenue consists of the following as of June 30, 2020:
A. General Fund
Aquarium - Advance ticket receipts $ 362,995
48

CITY OF VIRGINIA BEACH, VIRGINIANOTES TO FINANCIAL STATEMENTS
JUNE 30, 2020
B. Nonmajor Special Revenue Fund
Grants Consolidated - Unspent CARES CRF Relief Funds $ 3,707,269 Parks and Recreation - Advance Customer Receipts 99,016 Federal Section Eight Program - FY 2021 Port Revenue 1,977 Total Unearned Revenue - Special Revenue Funds 3,808,262
C. Enterprise Funds
Water and Sewer - Customers and Developers tap and meter fees $ 1,461,087
D. School Board Component Unit
School Operating Fund - Summer School Tuition $ 215,490 School Grants Fund - Early Reading Intervention, Algebra Readiness,
VA Initiative at Risk Four Year Old, 2Revolutions, and other Grants 1,784,566 Other Governmental Funds - School Cafeterias - Charges for Services 754,978 Total Unearned Revenue - Governmental Funds 2,755,034 School Health Insurance Internal Service Fund - Prepayment of July health insurance premiums 8,182,321 Total Unearned Revenue - Governmental Activities $ 10,937,355
49

CITY OF VIRGINIA BEACH, VIRGINIANOTES TO FINANCIAL STATEMENTS
JUNE 30, 2020
5. CAPITAL ASSETS AND LAND HELD FOR RESALE
A. Governmental Activities
The following is a summary of the changes in capital assets for the fiscal year ended June 30, 2020:
Balance BalanceJuly 1, 2019 Increases Decreases June 30, 2020
Capital Assets Not Being Depreciated: Land and Improvements $ 1,022,957,572 $ 6,984,376 $ - $ 1,029,941,948 Agriculture Reserve Program 47,710,144 1,036,132 - 48,746,276 Construction in Progress 228,742,905 169,446,236 94,584,650 303,604,491 Total Capital Assets Not Being Depreciated 1,299,410,621 177,466,744 94,584,650 1,382,292,715
Other Capital Assets: Buildings and Improvements 779,183,716 9,893,208 - 789,076,924 School Buildings 319,469,552 112,160,896 - 431,630,448 Site Improvements 333,030,498 4,707,969 - 337,738,467 Site Improvements - ISF 265,782 - - 265,782 Equipment 330,156,644 26,630,519 3,274,089 353,513,074 Equipment - ISF 6,894,263 803,719 251,264 7,446,718 Roadway Network 2,034,380,803 23,383,095 - 2,057,763,898 Landfill Network 18,694,498 - - 18,694,498 Bridge Network 157,339,642 1,958,238 - 159,297,880 Hurricane Protection Network 97,680,665 - - 97,680,665 Total Other Capital Assets at Historical Cost 4,077,096,063 179,537,644 3,525,353 4,253,108,354
Less Accumulated Depreciation For: Buildings and Improvements 296,358,873 17,536,999 - 313,895,872 School Buildings 42,514,651 29,731,161 - 72,245,812 Site Improvements 112,894,905 8,044,506 - 120,939,411 Site Improvements - ISF 263,939 235 - 264,174 Equipment 259,872,406 23,405,236 3,234,649 280,042,993 Equipment - ISF 5,612,663 509,447 251,264 5,870,846 Roadway Network 1,267,609,122 50,859,520 - 1,318,468,642 Landfill Network 18,676,153 - - 18,676,153 Bridge Network 44,056,633 3,025,037 - 47,081,670 Hurricane Protection Network 32,980,490 1,953,613 - 34,934,103 Total Accumulated Depreciation 2,080,839,835 135,065,754 3,485,913 2,212,419,676
Total Capital Assets Being Depreciated, Net 1,996,256,228 44,471,891 39,440 2,040,688,679 Governmental Activities Capital Assets, Net $ 3,295,666,849 $ 221,938,635 $ 94,624,090 $ 3,422,981,394
Governmental Activities capital assets net of accumulated depreciation at June 30, 2020 are comprised of thefollowing:
General Government Capital Assets, Net $ 3,421,403,913 Internal Service Fund Capital Assets, Net 1,577,481 Total $ 3,422,981,394
50

CITY OF VIRGINIA BEACH, VIRGINIANOTES TO FINANCIAL STATEMENTS
JUNE 30, 2020
Depreciation was charged to governmental functions as follows:
Finance $ 8,610 Judicial 272,819 Health 536 Police 2,694,030 Public Works 80,178,427 Parks and Recreation 4,295,987 Libraries 112,590 Planning 42,434 Economic Development 27,530 Convention & Visitors Bureau 321,243 Information Technology 11,974,185 Boards and Commisions 266,186 Emergency Communications 760,930 Fire 3,077,396 Human Services 417,955 Education and Transfer to School 29,731,161 Housing & Neighborhood Preservation 68,264 Museums 119,880 General Government 678,894 Emergency Medical Services 16,697 Total $ 135,065,754
B. Component Unit - School Board
Capital Assets activity for the year ended June 30, 2020 was as follows:
Balance BalanceJuly 1, 2019 Increases Decreases June 30, 2020
Capital Assets Not Being Depreciated: Land $ 38,968,372 $ - $ - $ 38,968,372 Construction in Progress 65,245,069 55,139,145 28,449,091 91,935,123 Total Capital Assets Not Being Depreciated 104,213,441 55,139,145 28,449,091 130,903,495
Capital Assets Being Depreciated Buildings 761,011,176 35,890,883 114,007,479 682,894,580 Improvement Other Than Buildings 65,923,256 2,995,501 - 68,918,757 Machinery and Equipment 128,868,349 7,870,068 4,209,754 132,528,663 Total Capital Assets Being Depreciated 955,802,781 46,756,452 118,217,233 884,342,000
Less Accumulated Depreciation For: Buildings 336,478,420 21,932,828 31,537,168 326,874,080 Improvement Other Than Buildings 47,123,253 2,145,838 - 49,269,091 Machinery and Equipment 82,957,714 8,270,457 4,040,239 87,187,932 Total Accumulated Depreciation 466,559,387 32,349,123 35,577,407 463,331,103
Total Capital Assets Being Depreciated, Net 489,243,394 14,407,329 82,639,826 421,010,897 Component Unit School Board, Capital Assets, Net $ 593,456,835 $ 69,546,474 $ 111,088,917 $ 551,914,392
51

CITY OF VIRGINIA BEACH, VIRGINIANOTES TO FINANCIAL STATEMENTS
JUNE 30, 2020
C. Business-Type Activities
The following is a summary of the changes in capital assets for the fiscal year ended June 30, 2020:
Balance BalanceJuly 1, 2019 Increases Decreases June 30, 2020
Capital Assets Not Being Depreciated: Land $ 171,523,241 $ 423,086 $ - $ 171,946,327 Construction in Progress 54,898,311 75,325,067 84,565,298 45,658,080 Total Capital Assets Not Being Depreciated 226,421,552 75,748,153 84,565,298 217,604,407
Capital Assets Being Depreciated Buildings 165,013,560 8,730 - 165,022,290 Improvement Other Than Buildings 1,146,408 - - 1,146,408 Utility System 1,476,480,614 72,051,065 - 1,548,531,679 Machinery and Equipment 63,390,336 6,377,864 953,017 68,815,183 Total Capital Assets Being Depreciated 1,706,030,918 78,437,659 953,017 1,783,515,560
Less Accumulated Depreciation For: * Buildings 53,987,622 4,650,776 - 58,638,398 Improvement Other Than Buildings 427,566 36,166 - 463,732 Utility System 570,101,562 31,477,675 - 601,579,237 Machinery and Equipment 47,247,591 4,743,594 905,645 51,085,540 Total Accumulated Depreciation 671,764,342 40,908,212 905,645 711,766,908
Total Capital Assets Being Depreciated, Net 1,034,266,576 37,529,447 47,372 1,071,748,651 Business-Type Activities Capital Assets, Net $ 1,260,688,128 $ 113,277,600 $ 84,612,670 $ 1,289,353,059
Depreciation expense was charged to Business-Type Activities as follows:
Water and Sewer $ 27,979,427 Storm Water 7,309,940 Waste Management 1,737,130 Development Authority 3,853,177 Parking 28,537 Total $ 40,908,211
D. Major Fund - Water and Sewer Enterprise FundBalance Balance
July 1, 2019 Increases Decreases June 30, 2020Capital Assets Not Being Depreciated: Land and Improvements $ 14,164,151 $ 398,675 $ - $ 14,562,826 Construction in Progress 20,782,604 33,860,165 36,452,802 18,189,967 Total Capital Assets Not Being Depreciated 34,946,755 34,258,840 36,452,802 32,752,793
Other Capital Assets: Buildings and Improvements 18,940,552 - - 18,940,552 Utility System 1,174,891,326 35,540,321 - 1,210,431,647 Machinery and Equipment 31,538,828 3,155,733 762,664 33,931,897 Total Other Capital Assets at Historical Cost 1,225,370,706 38,696,054 762,664 1,263,304,096
Less Accumulated Depreciation For: Buildings and Improvements 14,379,901 814,006 - 15,193,907 Utility System 503,020,520 25,574,430 - 528,594,950 Machinery and Equipment 26,353,794 1,590,991 738,053 27,206,732 Total Accumulated Depreciation 543,754,215 27,979,427 738,053 570,995,589
Total Capital Assets Being Depreciated, Net 681,616,491 10,716,627 24,611 692,308,507 Water and Sewer Capital Assets, Net $ 716,563,246 $ 44,975,467 $ 36,477,413 $ 725,061,300
52

CITY OF VIRGINIA BEACH, VIRGINIANOTES TO FINANCIAL STATEMENTS
JUNE 30, 2020
E. Major Fund – Storm Water Enterprise Fund
Balance BalanceJuly 1, 2019 Increases Decreases June 30, 2020
Capital Assets Not Being Depreciated:Land and Improvements $ 133,293,782 $ 24,411 $ - $ 133,318,193 Construction in Progress 32,930,748 41,172,623 47,015,736 27,087,635 Total Capital Assets Not Being Depreciated 166,224,530 41,197,034 47,015,736 160,405,828
Other Capital Assets: Buildings and Improvements 664,899 - - 664,899 Utility System 301,589,288 36,510,744 - 338,100,032 Machinery and Equipment 16,754,934 1,108,599 175,181 17,688,352 Total Other Capital Assets at Historical Cost 319,009,121 37,619,343 175,181 356,453,283
Less Accumulated Depreciation For: Buildings and Improvements 41,556 41,556 - 83,112 Utility System 67,081,042 5,903,246 - 72,984,288 Machinery and Equipment 12,436,584 1,365,138 152,419 13,649,303 Total Accumulated Depreciation 79,559,182 7,309,940 152,419 86,716,703
Total Capital Assets Being Depreciated, Net 239,449,939 30,309,403 22,762 269,736,580 Storm Water Capital Assets, Net $ 405,674,469 $ 71,506,437 $ 47,038,498 $ 430,142,408
F. Major Fund – Waste Management
Balance BalanceJuly 1, 2019 Increases Decreases June 30, 2020
Total Capital Assets Not Being Depreciated $ - $ - $ - $ -
Other Capital Assets: Buildings - 8,730 - 8,730 Site Improvements 366,891 - - 366,891 Machinery and Equipment 14,416,446 1,016,772 - 15,433,218 Total Other Capital Assets at Historical Cost 14,783,337 1,025,502 - 15,808,839
Less Accumulated Depreciation For: Buildings - 182 - 182 Site Improvements 76,783 16,677 - 93,460 Machinery and Equipment 7,951,144 1,720,271 - 9,671,415 Total Accumulated Depreciation 8,027,927 1,737,130 - 9,765,057
Total Capital Assets Being Depreciated, Net 6,755,410 (711,628) - 6,043,782 Waste Management Capital Assets, Net $ 6,755,410 $ (711,628) $ - $ 6,043,782
53

CITY OF VIRGINIA BEACH, VIRGINIANOTES TO FINANCIAL STATEMENTS
JUNE 30, 2020
G. Major Fund - Virginia Beach Development Authority
Balance BalanceJuly 1, 2019 Increases Decreases June 30, 2020
Capital Assets Not Being Depreciated: Land and Improvements $ 24,065,308 $ - $ - $ 24,065,308 Construction in Progress 1,184,959 292,279 1,096,760 380,478 Total Capital Assets Not Being Depreciated 25,250,267 292,279 1,096,760 24,445,786
Other Capital Assets: Buildings and Improvements 145,408,109 - - 145,408,109 Machinery and Equipment 565,065 1,096,760 - 1,661,825 Total Other Capital Assets at Historical Cost 145,973,174 1,096,760 - 147,069,934
Less Accumulated Depreciation For: Buildings and Improvements 39,566,165 3,795,032 - 43,361,197 Machinery and Equipment 418,740 58,145 - 476,885 Total Accumulated Depreciation 39,984,905 3,853,177 - 43,838,082
Total Capital Assets Being Depreciated, Net 105,988,269 (2,756,417) - 103,231,852 Development Authority Capital Assets, Net $ 131,238,536 $ (2,464,138) $ 1,096,760 $ 127,677,638
H. Component Unit - Virginia Beach Community Development Corporation
Balance BalanceJuly 1, 2019 Increases Decreases June 30, 2020
Capital Assets Not Being Depreciated: Land and Improvements $ 8,838,960 $ - $ - $ 8,838,960 Total Capital Assets Not Being Depreciated 8,838,960 - - 8,838,960
Other Capital Assets: Buildings and Improvements 34,743,151 - - 34,743,151 Machinery and Equipment 113,583 32,093 - 145,676 Total Other Capital Assets at Historical Cost 34,856,734 32,093 - 34,888,827
Less Accumulated Depreciation For: 15,887,998 1,153,676 - 17,041,674 Component Unit-VA Beach Community Dev. $ 27,807,696 $ (1,121,583) $ - $ 26,686,113
*Beginning Buildings and Equipment balances were restated to include the balance of a wholly owned subsidiary, previously excluded from the FY 2019CAFR. The inclusion increased Buildings and Equipment balances by $3,333,426 and $45,774, respectively.
I. Land and Building Inventory Held for Resale – Development Authority
Oceana West Corporate Park $ 1,555,548 Corporate Landing Office Park 9,434,877 London Bridge Commerce Park 1,624,500 Town Center Beacon Building 4,877,946 Hunt Club 2 200,305 Historic Kempsville 1,296,118 Bio-Med Park 24,971,530 Total Land Held for Resale $ 43,960,824
54

CITY OF VIRGINIA BEACH, VIRGINIANOTES TO FINANCIAL STATEMENTS
JUNE 30, 2020
J. Construction in Progress
1. Governmental Activities and School Board Component Unit
In accordance with the City’s accounting policies, these projects will not be transferred fromConstruction in Progress until completion. Construction in progress is comprised of the following:
Expended through Outstanding UnobligatedJune 30, 2020 Commitments Balance
Government Activities Engineering and Highways $ 133,251,990 $ 37,133,897 $ 307,628,694 Buildings 75,340,022 75,145,808 93,819,740 Parks and Recreation 8,606,439 3,212,203 32,370,430 Coastal 399,394 1,430,851 42,860,725 Economic and Tourism 86,006,646 24,429,691 140,478,334 Total Other Capital Assets at Historical Cost $ 303,604,491 $ 141,352,450 $ 617,157,923
School Board Component Unit Buildings and Improvements Other than Buildings $ 91,935,123 $ 36,669,111 $ -
2. Business-Type Activities
In accordance with the City’s accounting policies, these projects will not be transferred fromConstruction in Progress into the various capital asset accounts until substantially completed. Construction in Progress for Business-Type Activities is comprised of the following at June 30, 2020:
Expended through Outstanding UnobligatedJune 30, 2020 Commitments Balance
Water & Sewer Utility Projects $ 18,189,967 $ 28,787,849 $ 62,191,824 Storm Water Projects 27,087,635 47,691,110 284,484,151 Development Authority 380,478 - - Total Business-Type Activities $ 45,658,080 $ 76,478,959 $ 346,675,975
55

CITY OF VIRGINIA BEACH, VIRGINIANOTES TO FINANCIAL STATEMENTS
JUNE 30, 2020
6. LONG-TERM DEBT
A. Summary of Changes in Long-Term Liabilities
1. Primary Government - Governmental Activities
AmountsBalance Balance Due Within
July 1, 2019 Additions Reductions June 30, 2020 One YearGeneral Obligation Bonds $ 541,574,435 $ 156,125,000 $ 117,465,502 $ 580,233,933 $ 57,037,635 State Literary Fund Loans 1,125,000 - 375,000 750,000 375,000 Public Facility Revenue Bonds 238,982,892 184,374,587 55,970,268 367,387,211 26,386,328 Agriculture Reserve Program 47,710,144 1,036,132 - 48,746,276 - Total Tax Supported Debt 829,392,471 341,535,719 173,810,770 997,117,420 83,798,963
Other Debt: Landfill Closure & Post-Closure Care 21,306,528 362,192 - 21,668,720 - Premiums 81,674,907 51,237,936 16,053,728 116,859,115 11,843,829 Net Pension Liability 316,893,889 63,957,840 - 380,851,729 - Net OPEB Liability 109,285,891 - 10,529,836 98,756,055 - Accrued Compensation Leave 43,802,550 23,199,878 20,598,890 46,403,538 21,166,466 Estimated Claims & Judgements 41,453,521 3,145,557 - 44,599,078 9,864,031
Governmental Activities Long-Term Debt $ 1,443,809,757 $ 483,439,122 $ 220,993,224 $ 1,706,255,655 $ 126,673,289
2. Primary Government - Business-Type Activities
AmountsBalance Balance Due Within
July 1, 2019 Additions Reductions June 30, 2020 One YearRevenue Bonds $ 262,530,000 $ - $ 12,150,000 $ 250,380,000 $ 12,665,000 Public Facility Revenue Bonds 58,312,109 12,205,413 20,149,732 50,367,790 7,373,672 Total Self/Tax Supported Debt 320,842,109 12,205,413 32,299,732 300,747,790 20,038,672
Less/Add Deferred Amounts:For Issuance Premiums 18,958,820 966,104 1,544,615 18,380,309 1,417,997 Less Bond Discount (55,854) - (55,854) - - Total Bonds Payable 339,745,075 13,171,517 33,788,493 319,128,099 21,456,669
Net Pension Liability 30,653,697 6,186,754 - 36,840,451 - Net OPEB Liability 6,749,495 - 1,889,620 4,859,875 - Accrued Compensated Leave 4,742,529 2,236,184 2,875,292 4,103,421 2,340,229 Business-Type Activities Long-Term Debt $ 381,890,796 $ 21,594,455 $ 38,553,405 $ 364,931,846 $ 23,796,898
56

CITY OF VIRGINIA BEACH, VIRGINIANOTES TO FINANCIAL STATEMENTS
JUNE 30, 2020
3. Major Fund - Water and Sewer Enterprise Fund (Included in Business-Type Activities)
AmountsBalance Balance Due Within
July 1, 2019 Additions Reductions June 30, 2020 One YearRevenue Bonds $ 193,020,000 $ - $ 9,625,000 $ 183,395,000 $ 10,045,000
Add Deferred Amounts:For Issuance Premiums 14,803,551 - 1,157,613 13,645,938 1,157,613 Total Bonds Payable 207,823,551 - 10,782,613 197,040,938 11,202,613
Net Pension Liability 17,863,946 3,605,432 - 21,469,378 - Net OPEB Liability 3,577,318 - 1,156,626 2,420,692 - Accrued Compensated Leave 2,484,560 1,376,891 1,399,707 2,461,744 1,439,449 Water and Sewer Long-Term Liabilities $ 231,749,375 $ 4,982,323 $ 13,338,946 $ 223,392,752 $ 12,642,062
4. Major Fund – Storm Water Enterprise Fund (Included in Business-Type Activities)
AmountsBalance Balance Due Within
July 1, 2019 Additions Reductions June 30, 2020 One YearRevenue Bonds $ 69,510,000 $ - $ 2,525,000 $ 66,985,000 $ 2,620,000
Add Deferred Amounts:For Issuance Premiums 2,358,300 - 260,385 2,097,915 260,384 Total Bonds Payable 71,868,300 - 2,785,385 69,082,915 2,880,384
Net Pension Liability 7,924,085 1,599,297 - 9,523,382 - Net OPEB Liability 1,758,489 - 275,918 1,482,571 - Accrued Compensated Leave 1,192,379 306,031 946,243 552,167 350,763 Storm Water Long-Term Liabilities $ 82,743,253 $ 1,905,328 $ 4,007,546 $ 80,641,035 $ 3,231,147
5. Major Fund – Waste Management Enterprise Fund (Included in Business-Type Activities)
AmountsBalance Balance Due Within
July 1, 2019 Additions Reductions June 30, 2020 One YearNet Pension Liability $ 4,587,628 $ 925,909 $ - $ 5,513,537 $ - Net OPEB Liability 1,353,347 - 437,567 915,780 - Accrued Compensated Leave 1,024,874 533,061 514,187 1,043,748 528,790 Waste Management Long-Term Liabilities $ 6,965,849 $ 1,458,970 $ 951,754 $ 7,473,065 $ 528,790
6. Major Fund - Development Authority Enterprise Fund (Included in Business-Type Activities)
AmountsBalance Balance Due Within
July 1, 2019 Additions Reductions June 30, 2020 One YearPublic Facility Revenue Bonds $ 58,312,109 $ 12,205,413 $ 20,149,732 $ 50,367,790 $ 7,373,672 For Issuance Premiums 1,796,969 966,104 126,617 2,636,456 - Less Bond Discount (55,854) - (55,854) - - Virginia Beach Development Authority Long-Term Debt $ 60,053,224 $ 13,171,517 $ 20,220,495 $ 53,004,246 $ 7,373,672
57

CITY OF VIRGINIA BEACH, VIRGINIANOTES TO FINANCIAL STATEMENTS
JUNE 30, 2020
7. Component Unit - School Board
School-related long term debt is shown in table 6.A.1 for Primary Government - GovernmentalActivities as it is considered and reported as the City's long term debt. The City Council is the onlyelected local governing body authorized by the City Charter (sections 6.01 & 6.06) and Constitution ofVirginia (article VII, section 10) to incur debt in the name of the City.
AmountsBalance Balance Due Within
July 1, 2019 Additions Reductions June 30, 2020 One YearNet Pension Liability $ 609,201,000 $ 220,045,000 $ 150,421,000 $ 678,825,000 $ - Net OPEB Liability 168,666,000 37,916,000 53,836,000 152,746,000 - Accrued Compensated Leave 34,250,450 12,158,735 7,440,773 38,968,412 7,589,589 Estimated Claims and Judgements 18,027,162 132,732,000 134,696,011 16,063,151 12,047,363 School Board Long-Term Liabilities $ 830,144,612 $ 402,851,735 $ 346,393,784 $ 886,602,563 $ 19,636,952
8. Component Unit - Virginia Beach Community Development Corporation
Various mortgage loan agreements and notes payable with interest at 2.5% to 7.1%, collaterized byreal property.
AmountsBalance* Balance Due Within
July 1, 2019 Additions Reductions June 30, 2020 One YearNotes Payable $ 21,587,168 $ 301,212 $ 582,874 $ 21,305,506 $ 2,956,034
0
*Beginning Notes Payable were restated to include the balance of a wholly owned subsidiary, previously excluded from the FY 2019CAFR. The inclusion increased the beginning balance by $616,546.
[Remainder of page intentionally left blank]
58

CITY OF VIRGINIA BEACH, VIRGINIANOTES TO FINANCIAL STATEMENTS
JUNE 30, 2020
B. Bonds, Notes and Loans Payable
Details of long-term indebtedness are shown below with outstanding balance as of June 30, 2020:
ProprietaryPercentage
OutstandingBalance
TrueBond Issue/Purpose Dated Issue Amount Interest (%) VBDA % City
General Obligation Public Improvement (PI)Bonds and Loans:2019A PI 7/31/2019 $ 101,210,000 2.260682 - $ 101,210,000 2019B PI Refunding 7/31/2019 54,915,000 1.376528 - 54,915,000 2018A PI 3/13/2018 67,595,000 2.885678 - 60,095,000 2017A PI Refunding 12/28/2017 71,530,000 2.253621 - 71,530,000 2016A PI 2/9/2016 61,255,000 2.437448 - 49,020,000 2016B PI Refunding 2/9/2016 50,430,000 1.771418 - 13,320,000 2015A PI 4/21/2015 51,295,000 2.617345 - 38,475,000 2015B PI Refunding 4/21/2015 56,530,000 1.989322 - 56,530,000 2014A PI 4/22/2014 85,050,000 2.920553 - 60,150,000 2013A PI 4/17/2013 22,885,000 2.587348 - 16,030,000 2013B PI Refunding 4/17/2013 33,795,000 2.143873 - 22,865,000 Pleasure House Point 7/10/2012 6,000,000 0.250000 - 1,592,780 2012A PI 4/18/2012 65,000,000 2.849726 - 6,500,000 2012B PI Refunding 4/18/2012 19,630,000 2.413515 - 15,325,000 2011A PI 6/29/2010 90,000,000 3.212396 - 4,170,000 2010-1 QSCB* 7/8/2010 4,875,000 5.310000 - 2,025,000 2010 Recovery Zone 3/15/2010 5,995,000 3.038509 - 3,395,000 2008 VPSA* 12/1/2008 6,350,705 - - 3,086,153 2002 State Literary 1/1/2002 7,500,000 3.000000 - 750,000 Total General Obligation Bonds and Loans 580,983,933
Revenue Bonds:**2019 Storm Water Revenue 2/27/2019 29,525,000 3.139267 - 28,855,000 2016 A W&S Revenue 6/8/2016 46,560,000 2.711344 - 43,230,000 2016 B W&S Refunding 6/8/2016 42,865,000 1.813975 - 36,065,000 2015 A Storm Water Revenue 1/28/2015 23,500,000 2.829639 - 20,250,000 2013 W&S Revenue 11/13/2013 44,845,000 3.641572 - 38,160,000 2010 A Storm Water Revenue 11/16/2010 20,000,000 3.170505 - 14,920,000 2010 B Storm Water Refunding 11/16/2010 7,380,000 2.607102 - 2,960,000 2010 A W&S Revenue 6/29/2010 65,000,000 3.475462 - 49,515,000 2010 B W&S Refunding 6/29/2010 8,410,000 3.027560 - 3,680,000 2010 C W&S Refunding 6/29/2010 24,950,000 3.156061 - 12,745,000 Total Revenue Bonds 250,380,000
Public Facility Revenue Bonds:2020A Public Facility Revenue 6/17/2020 158,960,000 1.7175703 - 158,960,000 2020B Public Facility Refunding 6/17/2020 37,620,000 0.2897591 32.40 37,620,000 2018A Public Facility Revenue 3/28/2018 33,395,000 3.0289500 8.85 29,220,000 2016A Public Facility Revenue 11/3/2016 21,225,000 2.4588020 - 17,430,000 2016B Public Facility Revenue 11/3/2016 7,880,000 2.1224430 100.00 5,065,000 2015A Public Facility Revenue 6/25/2015 48,245,000 3.0509530 - 32,790,001 2015B Public Facility Revenue 6/25/2015 34,885,000 2.6779800 27.05 30,795,000 2014A Public Facility Revenue 6/18/2014 44,975,000 2.9840410 41.76 29,690,000 2014B Public Facility Revenue 6/18/2014 20,320,000 2.4309790 25.62 11,080,000 2013A Public Facility Revenue 6/19/2013 20,960,000 2.5996020 - 12,755,000 2012A Public Facility Revenue 6/20/2012 22,580,000 2.5996020 - 14,060,000 2012B Public Facility Refunding 6/20/2012 25,640,000 2.4489560 21.12 21,860,000 2010B Public Facility Revenue 5/25/2010 98,035,000 2.9935560 24.84 11,500,000 2010C Public Facility Refunding 5/25/2010 40,450,000 3.3969350 31.31 4,930,000 Total Public Facility Revenue Bonds 417,755,001
Other Long-Term Debt:Agricultural Reserve Program Various 48,746,276 Various - 48,746,276 Total Other Long-Term Debt 48,746,276 Grand Total Bonds, Notes and Loans Payable $ 1,297,865,210
* QSCB - Qualified School Construction Bond, VPSA - Virginia Public School Authority** Water and Sewer and Storm Water Enterprise Funds
59

CITY OF VIRGINIA BEACH, VIRGINIANOTES TO FINANCIAL STATEMENTS
JUNE 30, 2020
Defeased Debt - In current and prior years as a result of debt refunding, the City defeased certain generalobligation, public improvement, and public utility bonds by placing funds in irrevocable escrow accounts toprovide for future debt service payments on the defeased debt. Accordingly, the escrow account assets andliabilities for the defeased debt are not included in the City's financial statements. At June 30, 2020, theoutstanding balance of the defeased debt is $117.4 million, and is considered defeased.
C. Summary of Recent Refundings
Periodically, the City issues debt to refund amounts outstanding on prior bond issuances to reduce interestpayment costs. The details of these refunding issuances are as follows.
1. Current Refunding of Public Facility Revenue Bonds, Series 2010B and 2010C
On June 17, 2020, the City issued $37.6 million of Public Facility Refunding Revenue Bonds, Series2020B to refund portions of 2010B and 2010C Series Public Facility Revenue Bonds. Of the bondssold, 32.4% was to refund debt currently held by the City of Virginia Beach Development Authorityand 67.6% was to refund debt currently held by the City of Virginia Beach. The refunding bondscombined with $3.08 million in premiums provided resources to purchase U.S. Government, State andLocal Government Series securities that were placed in an irrevocable trust for the purpose ofgenerating resources for all future debt service payments of $43.57 million of Public Facility RevenueBonds. As a result, the refunded bonds are considered to be defeased and the liability has beenremoved from the business-type activities and government activities columns of the statement of netposition. The net carrying amount of the old debt exceeded the reacquisition price by $1.99 million.The difference is being netted against the new debt and amortized over the remaining life of therefunded debt, which is equal to the life of the new debt issued. This current refunding was undertakento reduce total debt service payments over a 4-year period by $2.69 million and will result in aneconomic gain of $2.68 million. The escrow agent called the 2010B and 2010C refunded bonds onAugust 1, 2020.
2. Current Refunding of General Obligation Public Improvement Bonds, Series 2009A, 2009B and2010A-2 (Taxable Build America Bonds)
On July 31, 2019, the City issued $54.91 million of General Obligation Public Improvement RefundingBonds, Series 2019B to refund the remaining portions of the 2009A, 2009B and 2010A-2 (TaxableDirect-Pay Build America Bonds) General Obligation Public Improvement Bonds. The refundingbonds combined with $6.72 million in premiums to provide resources to purchase U.S. Government,State and Local Government Series securities that were placed in an irrevocable trust for the purpose ofgenerating resources for all future debt service payments of $68.76 million of refunded GeneralObligation bonds. As a result, the refunded bonds are considered to be defeased and the liability hasbeen removed from the governmental activities column of the statement of net position. The netcarrying amount of the old debt exceeded the reacquisition price by $5.57 million. This difference isbeing netted against the new debt and amortized over the remaining life of the refunded debt, which isequal to the life of the new debt issued. This current refunding was undertaken to reduce total debtservice payments over the next 11 years by $4.4 million and resulted in an economic gain of $3.8million. The escrow agent called the 2009A and 2009B refunded bonds on July 31, 2019 and the2010A-2 refunded bonds on March 15, 2020.
3. Advance Refunding of General Obligation Public Improvement Bonds, Series 2011A and 2012A
On December 28, 2017, the City issued $71.53 million of General Obligation Public ImprovementRefunding Bonds, Series 2017A to refund a portion of the 2011A and the remaining balance of the2012A Series General Obligation Public Improvement Bonds. The refunding bonds combined with$13.59 million in premiums to provide resources to purchase U.S. Government, State and LocalGovernment Series securities that were placed in an irrevocable trust for the purpose of generating
60

CITY OF VIRGINIA BEACH, VIRGINIANOTES TO FINANCIAL STATEMENTS
JUNE 30, 2020
resources for all future debt service payments of $109.91 million of refunded General Obligationbonds. As a result, the refunded bonds are considered to be defeased and the liability has been removedfrom the governmental activities column of the statement of net position. The net carrying amount ofthe old debt exceeded the reacquisition price by $6.93 million. This difference is being netted againstthe new debt and amortized over the remaining life of the refunded debt, which is equal to the life ofthe new debt issued. This advance refunding was undertaken to reduce total debt service payments overthe next 15 years by $8.3 million and resulted in an economic gain of $6.8 million. The escrow agentwill call the series 2011A refunded bonds on June 1, 2021 and the 2012A refunded bonds on April 1,2022.
D. Summary of Annual Requirements to Amortize All Bonds and Notes Payable
Annual Debt Service requirements to maturity for General Obligation Bonds and State Literary Fund Loansare as follows:
Year Ending Governmental ActivitiesJune 30 Principal Interest Total 2021 $ 57,412,635 $ 25,113,917 $ 82,526,552 2022 54,415,076 22,608,087 77,023,163 2023 50,488,092 19,973,734 70,461,826 2024 48,380,252 17,572,811 65,953,063 2025 48,472,121 15,159,854 63,631,975
2026-2030 185,955,757 45,323,939 231,279,696 2031-2035 99,490,000 14,357,244 113,847,244 2036-2040 36,370,000 2,531,044 38,901,044
Totals $ 580,983,933 $ 162,640,630 $ 743,624,563
Annual Debt Service requirements to maturity for Revenue Bonds are as follows:
Year Ending Business-Type ActivitiesJune 30 Principal Interest Total
2021 $ 12,665,000 10,392,882 $ 23,057,882 2022 13,205,000 9,851,039 23,056,039 2023 13,810,000 9,262,334 23,072,334 2024 14,470,000 8,624,001 23,094,001 2025 15,185,000 7,939,906 23,124,906
2026-2030 67,090,000 29,784,187 96,874,187 2031-2035 60,020,000 16,218,489 76,238,489 2036-2040 41,895,000 5,030,976 46,925,976 2041-2046 12,040,000 638,325 12,678,325
Totals $ 250,380,000 $ 97,742,139 $ 348,122,139
61

CITY OF VIRGINIA BEACH, VIRGINIANOTES TO FINANCIAL STATEMENTS
JUNE 30, 2020
Annual Debt Service requirements to maturity for Public Facility Revenue Bonds are as follows:
Year Ending Governmental Activities Business-Type Activities Total Debt ServiceJune 30 Principal Interest Principal Interest Principal Interest Total
2021 $ 26,386,328 $ 13,564,302 $ 7,373,672 $ 1,863,803 $ 33,760,000 $ 15,428,105 $ 49,188,105
2022 37,011,626 13,807,607 8,438,374 1,716,049 45,450,000 15,523,656 60,973,656
2023 36,270,063 11,969,590 8,454,937 1,311,241 44,725,000 13,280,831 58,005,831
2024 35,670,785 10,255,058 5,484,215 1,015,598 41,155,000 11,270,656 52,425,656
2025 25,572,081 8,803,117 4,902,919 789,965 30,475,000 9,593,082 40,068,082
2026-2030 91,341,688 29,296,459 10,738,313 1,839,266 102,080,001 31,135,725 133,215,726
2031-2035 69,819,640 12,865,741 4,540,360 487,791 74,360,000 13,353,532 87,713,532
2036-2040 45,315,000 3,015,656 435,000 28,819 45,750,000 3,044,475 48,794,475
Totals $ 367,387,211 $ 103,577,530 $ 50,367,790 $ 9,052,532 $ 417,755,001 $ 112,630,062 $ 530,385,063
Debt service requirements for general obligation bonds are principally met by the General Fund. TheGovernmental Activities, Landfill Closure and Post-Closure Care, Federal Arbitrage Rebate (there are noset maturity dates for these liabilities) will also be liquidated by the General Fund. Compensated absences(except School Board and most Proprietary funds) will be liquidated by the General Fund. Internal ServiceFunds predominately serve the Governmental Funds. Accordingly, long-term liabilities for them areincluded as part of the above totals for Governmental Activities in Note 6A1. The net pension liability andnet OPEB liability are liquidated by the correlating funds in respect to the departmental costs and arereflected, based on allcation, on Internal Services Fund, Enterprise Fund and Entity-Wide Fund statements. Claims and Judgments are liquidated by the Risk Management Fund. Interest expense incurred on theabove noted debt for the year ended June 30, 2020, was $48,205,831.
E. Agricultural Reserve Program
On May 9, 1995, City Council adopted an ordinance establishing the Agricultural Reserve Program(“ARP”). The primary purpose of the ordinance is to promote and encourage the preservation of farmlandin the rural southern portion of the City. Through ARP, the City acquires development rights in designatedareas within the southern portion of the City through the purchase of agricultural land preservationeasements. Landowners who meet certain eligibility criteria may sell an easement to the City while holdingfee simple title to the land and continuing to farm. The City acquires these development rights by executinginstallment purchase agreements with the landowners.
These agreements provide for the payment of the principal balance of each agreement in a single installmentdue approximately twenty-five years after execution of the agreement. Interest on the unpaid principalbalance is payable semi-annually. On May 9, 1995, the City Council originally dedicated a one and one-halfcent increase in the real estate tax to finance the program, and has made the following changes to the taxrate dedication and/or uses of ARP funds. On May 11, 2004, the Council reduced the amount to one cent. On May 9, 2006 the Council reduced the amount to nine tenths of one cent. On May 12, 2015, the Council reduced the amount to 56 one-hundredths of one cent. On May 9, 2017, the Council increased the amount to nine tenths of one cent to preserve property in the
Transition Area of the City and other Agricultural Reserve Program costs. On May 15, 2018, the Council expanded the use of ARP funds to provide suppport for storm water
capital projects benefiting the southern portion of the City including $990,000 annually in cash fundingfor project 7-024, "Southern Canal/Lead Ditch and Culvert Improvements" and a one-time contributionof $1.5 million to project 7-047, "Ashville Park Drainage Improvements".
62

CITY OF VIRGINIA BEACH, VIRGINIANOTES TO FINANCIAL STATEMENTS
JUNE 30, 2020
These obligations constitute indebtedness within the meaning of Article VII, Section 10 of the VirginiaConstitution and will be general obligations of the City, pledging the full faith and credit and unlimitedtaxing power of the City. By policy, interest and principal payments will be paid from a dedicated portion ofreal estate taxes. Principal payments will be made from maturing zero coupon Treasury securitiespurchased using funds provided by the dedicated portion of real estate taxes; the term to maturity is25-years.
As of June 30, 2020, 101 installment purchase agreements totaling 9,848 acres with a total purchase price of$48,746,276 have been executed. During FY 2020 one installment purchase agreement was executedtotaling $1,036,132 for 113.07 acres. No principal was retired in FY 2020; principal will be retiredbeginning in FY 2022. Interest expense incurred on this debt for the year ended June 30, 2020 was$2,446,189.
Annual Debt Service requirements to maturity for Agricultural Reserve Program:
Year EndingJune 30 Principal Interest Total 2021 $ - $ 2,453,564 $ 2,453,564 2022 2,211,066 2,435,502 4,646,568 2023 6,949,719 1,994,479 8,944,198 2024 1,034,361 1,802,997 2,837,358 2025 2,442,859 1,765,072 4,207,931
2026-2030 9,704,085 6,435,249 16,139,334 2031-2035 9,751,345 4,499,365 14,250,710 2036-2040 9,715,499 1,534,983 11,250,482 2041-2045 6,937,342 463,153 7,400,495
Totals $ 48,746,276 $ 23,384,364 $ 72,130,640
F. Legal Debt Limit
The Constitution of Virginia (article VII, section 10) and the City Charter (section 6.05:1) impose a legallimit on the amount of general obligation debt that the City may issue without referendum; this legal limit is10% of the total assessed value of taxable real property. At June 30, 2020, the City's debt limit was $6.0billion of which $5.4 billion was available for the issuance of additional debt (which is known as the legaldebt margin).
G. Water and Sewer Enterprise Revenue Bonds
Water and Sewer Revenue Bonds are obligations of the City, payable solely from pledged revenues of theSystem (Water and Sewer Fund), subject to the prior application thereof to the payment of operatingexpenses. The City has pledged future water and sewer revenues, net of specified operating expenses, torepay the following bond issues:
• $65 million in Water and Sewer Revenue Bonds issued in June 2010. The bonds are payable solelyfrom water and sewer customer net revenues and are payable through 2036. At June 30, 2020, the totalprincipal and interest remaining to be paid on the bonds is $74,457,124.
• $8.4 million in Water and Sewer Refunding Revenue Bonds issued in June 2010. The bonds arepayable solely from water and sewer customer net revenues and are payable through 2022. At June 30,2020, the total principal and interest remaining to be paid on the bonds is $3,819,350.
63

CITY OF VIRGINIA BEACH, VIRGINIANOTES TO FINANCIAL STATEMENTS
JUNE 30, 2020
• $24.9 million in Water and Sewer Refunding Revenue Bonds issued in June 2010. The bonds arepayable solely from water and sewer customer net revenues and are payable through 2028. At June 30,2020, the total principal and interest remaining to be paid on the bonds is $14,385,216.
• $44.8 million in Water and Sewer Revenue Bonds issued in November 2013. The bonds are payablesolely from water and sewer customer net revenues and are payable through 2039. At June 30, 2020,the total principal and interest remaining to be paid on the bonds is $54,575,675.
• $46.7 million in Water and Sewer Revenue Bonds issued in June 2016. The bonds are payable solelyfrom water and sewer customer net revenues and are payable through 2042. At June 30, 2020, the totalprincipal and interest remaining to be paid on the bonds is $60,918,037.
• $42.9 million in Water and Sewer Refunding Revenue Bonds issued in June 2016. The bonds arepayable solely from water and sewer customer net revenues and are payable through 2031. At June 30,2020, the total principal and interest remaining to be paid on the bonds is $44,708,087.
The aforementioned Water and Sewer Revenue Bonds were issued for rehabilitation of aging infrastructure,neighborhood improvement projects, system expansion, and roadway and storm water coordination projectsadopted in the City's Capital Improvement Program. The total principal and interest remaining to be paid onthe outstanding Water and Sewer Revenue Bonds is $252,863,489. The City will fix, charge, collect andrevise its fees, rates and other charges for the use of and for the services furnished by the system so as toproduce revenues sufficient to meet its cash requirements each fiscal year. Furthermore, City Council set agoal of debt service coverage on its water and sewer revenue bonds at not less than 1.50-times of netrevenues to debt service. At June 30, 2020, the debt service coverage on the water and sewer revenue bondsis 3.1-times. The total principal and interest expense for the current year and net available customeroperating income were $17,023,916 and $52,933,487, respectively.
H. Storm Water Revenue Bonds
Storm Water Revenue Bonds are obligations of the City, payable solely from pledged revenues of theSystem (Storm Water Fund), subject to the prior application thereof to the payment of Operating Expenses.The City has pledged future storm water revenues, net of specified operating expenses, to repay thefollowing bond issues:
• $20 million in Storm Water Revenue Bonds issued in November 2010. The bonds are payable solelyfrom storm water customer net revenues and are payable through 2036. At June 30, 2020, the totalprincipal and interest remaining to be paid on the bonds is $22,004,568.
• $7.4 million in Storm Water Revenue Bonds issued in November 2010. The bonds are payable solelyfrom storm water customer net revenues and are payable through 2025. At June 30, 2020, the totalprincipal and interest remaining to be paid on the bonds is $3,215,322.
• $23.5 million in Storm Water Revenue Bonds issued in January 2015. The bonds are payable solelyfrom storm water customer net revenues and are payable through 2040. At June 30, 2020, the totalprincipal and interest remaining to be paid on the bonds is $27,201,716
$29.5 million in Storm Water Revenue Bonds issued in February 27, 2019. The bonds are payablesolely from storm water customer net revenues and are payable through 2043. At June 30, 2020, thetotal principal and interest remaining to be paid on the bonds is $42,837,044.
The aforementioned Storm Water Revenue Bonds were issued to address flood control, water quality andcapital maintenance adopted in the City's Capital Improvement Program. The total principal and interestremaining to be paid on the outstanding Storm Water Revenue Bonds is $95,258,650. The City will fix,charge, collect and revise its fees, rates and other charges for the use of and for the services furnished by the
64

CITY OF VIRGINIA BEACH, VIRGINIANOTES TO FINANCIAL STATEMENTS
JUNE 30, 2020
system so as to produce revenues sufficient to meet its cash requirements each fiscal year. Furthermore, theCity has a policy of debt service coverage on its storm water revenue bonds at not less than 1.5-times of netrevenues to debt service. At June 30, 2020, the debt service coverage on the storm water revenue bonds is4.5-times. The total principal and interest expense for the current year and net available customer operatingincome were $4,927,590 and $22,124,050, respectively.
I. Debt Service ExpendituresSummarized below are the annual requirements to pay debt service costs on all outstanding long-term debtas of June 30, 2020.
Principal Interest and FiscalGeneral Government City: Retirement1 Charges2 TotalGeneral Obligation Bonds $ 56,980,502 $ 24,565,433 $ 81,545,935 State Literary Fund Loans 375,000 33,750 408,750 Public Facility Revenue Bonds 29,055,881 10,225,867 39,281,748 Agriculture Reserve Program - 2,446,189 2,446,189 Bank Charges & Bond Issuance Costs - 1,644,029 1,644,029 Total Tax Supported Debt Service 86,411,383 38,915,268 125,326,651
Principal1 Interest and Fiscal2
Retirement Charges TotalEnterprise Funds:Revenue Bonds 12,150,000 10,912,667 23,062,667 Public Facility Revenue Bonds 7,449,119 2,468,114 9,917,233 Bank Charges & Bond Issuance Costs - 29,251 29,251 Total Enterprise Debt Service 19,599,119 13,410,032 33,009,151
Total Debt Service $ 106,010,502 $ 52,325,300 $ 158,335,802
1 Excludes bonds refunded2 Excludes Premium from bond sales
65

CITY OF VIRGINIA BEACH, VIRGINIANOTES TO FINANCIAL STATEMENTS
JUNE 30, 2020
J. Accrued Compensated Leave
The accrued compensated leave is as follows at June 30, 2020:
Primary GovernmentGovernmental Business-Type School Board
Activities Activities Component Unit TotalCity - Annual $ 34,420,057 $ 3,174,059 $ - $ 37,594,116 City - Compensatory 9,016,629 516,844 - 9,533,473 City - Sick 2,966,852 412,517 - 3,379,369 School - Annual - - 13,368,095 13,368,095 School - Sick - - 19,603,797 19,603,797 School - Personal - - 5,996,520 5,996,520 Total $ 46,403,538 $ 4,103,420 $ 38,968,412 $ 89,475,370
K. Authorized But Unissued BondsA summary of debt authorized by City Council as of June 30, 2020, but not yet issued is listed below. TheCity's practice is to issue debt on a reimbursement bases after capital project expenses have been incurred.
Charter Based Debt: General Obligation Debt:
2015 Charter Bonds $ 4,013,438 2016 Charter Bonds 44,435,081 2017 Charter Bonds 36,972,406 2018 Charter Bonds 40,623,457 2019 Charter Bonds 65,332,867 2020 Charter Bonds 69,741,841
Total General Obligation Debt 261,119,090
Revenue Bond Debt: Water and Sewer Debt: 2013 W & S Revenue Bonds 5,682,666 2014 W & S Revenue Bonds 27,000,000 2015 W & S Revenue Bonds 20,000,000 2019 W & S Revenue Bonds 14,373,971 2020 W & S Revenue Bonds 1,318,515 Total Water and Sewer Debt 68,375,152
Storm Water Utility Debt: 2015 Storm Water Utility Revenue Bonds 7,879,607 2015 Storm Water Utility Revenue Bonds 15,977,102 2017 Storm Water Utility Revenue Bonds 30,143,013 2018 Storm Water Utility Revenue Bonds 30,077,004 2019 Storm Water Utility Revenue Bonds 25,000,000 2020 Storm Water Utility Revenue Bonds 34,708,495 Total Storm Water Utility Debt 143,785,221
Total Authorized and Unissued Charter & Revenue Bond Debt - June 30, 2020 473,279,463
Appropriation-Supported Debt: Public Facility Revenue Bonds 241,395,909 Total Authorized and Unissued Debt - June 30, 2020 $ 714,675,372
66

CITY OF VIRGINIA BEACH, VIRGINIANOTES TO FINANCIAL STATEMENTS
JUNE 30, 2020
L. Revenue Covenants
Management believes the City is in compliance with all significant financial covenants contained in thevarious bond indentures, including those found in the Master Resolution adopted February 1992, asamended and supplemented, for the Water & Sewer Revenue Bonds, as well as those found in theAgreement of Trust dated January 1, 2000, as amended and supplemented, for the Storm Water RevenueBonds.
M. Compliance
Management believes the City has no violations of finance related legal and contractual provisions.
N. Public Facility Revenue Bonds and Associated VBDA Support Agreements
City Council through the Capital Improvement Program has previously authorized the financing of variouspublic facilities with the utilization of Public Facility Revenue Bonds (PFRB) issued through the VirginiaBeach Development Authority (VBDA), a blended component unit of the City.
The VBDA issued PFRBs, Series 2005B, and 2007A & B, to finance the acquisition of three public parkinggarages and appurtenant structures for the Town Center Project - Phase II and III. VBDA issued 2014APublic Facility Revenue Bonds and paid $20.5 million (includes premium) to purchase the Block 11 garagein Town Center Phase V during FY 2014. These bonds are limited obligations of the Authority, payablefrom certain payments to be made by the City pursuant to a Support Agreement dated June 1, 2002, asamended.
The Authority issued PFRBs, Series 2010B & C, Series 2012B, 2014B, 2015B, and 2016B to advancerefund certain maturities of the previously issued PFRBs series 2002A, 2003A, 2005A, 2007A, 2005B,2007B and its 1998 Lease Revenue Bonds. During FY 2018, the Authority issued PFRB, Series 2018A, ofwhich $3.1 million (including premiums) paid for a public plaza and public infrastructure to elevate ZeidersAmerican Dream Theater in Town Center Phase VI. During FY 2020, the Authority issued PFRB, Series2020A, of which $68.6 million (including premiums) paid for the Virginia Beach Sports Center and relatedparking located on 19th Street across from the Virginia Beach Convention Center. In addition, it issuedPFRB, Series 2020B to refund certain maturities of the previously issued series 2010B and 2010C bonds.
A portion of the PFRBs, Series 2003, 2005A, 2007A, 2010A, Series 2012A, 2014A, 2018A, and 2020Awas used to finance acquisition and construction of various capital improvements in the City of VirginiaBeach.
PFRB debt is subject to annual appropriation by the City Council, and therefore, does not constitute ageneral obligation debt of the City, or a pledge of the full faith and credit of the City. The bonds are limitedobligations of the Authority, payable solely from payments made by the City pursuant to a SupportAgreement dated September 1, 2003, as supplemented and amended.
7. ASSETS AND OBLIGATIONS UNDER LEASES
The City is leasing the Social Services Facility through a financing arrangement with the Virginia BeachDevelopment Authority. Under the arrangement, the Authority issued $9,800,000 in tax-exempt Lease RevenueBonds to finance the Facility. In December 2018, the remaining balance of the Lease Revenue Bonds for SocialServices was retired. The leasing arrangement is for monthly payments of $47,910 to be placed in a reserve andused as needed for capital and structural improvements, maintenance and repair of the facility.
67

CITY OF VIRGINIA BEACH, VIRGINIANOTES TO FINANCIAL STATEMENTS
JUNE 30, 2020
8. DEPOSITS AND INVESTMENTS
All cash of the City including the School Board Component Unit (excluding the School Board Activity Funds) ismaintained in accounts collateralized in accordance with the Virginia Security for Public Deposits Act, Section2.2-4400 et. seq. of the Code of Virginia or covered by Federal depository insurance. Funds deposited inaccordance to the Virginia Security for Public Deposits Act are considered to be insured, thereby reducingcustodial credit risk. The custodial credit risk for deposits is the risk that, in the event of the failure of adepository financial institution, a government will not be able to recover deposits or will not be able to recovercollateral securities that are in the possession of an outside party.
The City has compensating balance arrangements with two financial institutions. Bank of America providesservices to the City while a $3.5 million balance is maintained in a demand deposit account. A fluctuatingchecking balance based on monthly investment services is a requirement of Branch Banking & Trust (BB&T).
The City categorizes its fair value measurements within the fair value hierarchy established by generallyaccepted accounting principles. The hierarchy is based on the valuation inputs used to measure fair value of theassets. Level 1 inputs are quoted prices in an active market for identical assets; Level 2 inputs are significantother observable inputs; and Level 3 inputs are significant unobservable inputs (the City does not value any ofits investments using level 3 inputs).
As of June 30, 2020, the City had the following recurring investments. Except for the investments in the StateNon Arbitrage Program (SNAP), Virginia Investment Pool (VIP), and Local Government Investment Pool(LGIP), all investments are in an internal investment pool.
Quoted Prices in Significant SignificantActive Markets Other Other Weighted
for Identical Observable Unobservable AverageAssets Inputs Inputs Maturities
Investments at Fair Value: June 30, 2020 (Level 1) (Level 2) (Level3) (in months)Money Market funds $ 10,000,000 $ - $ 10,000,000 $ - 0.01 Commercial Paper 74,810,883 - 74,810,883 - 0.15 U. S. Government Securities 120,118,472 - 120,118,472 - 0.12
$ 204,929,355 $ - $ 204,929,355 $ -
Investments Measured at amortized Cost:Certificates of Deposits $ 65,248,934 0.13 State Non Arbitrage Program – SNAP 112,755,946 0.12 State Treasurer's Local Government Pool(LGIP) 292,000,000 0.30 Virginia Investment Pool (VIP) 11,071,845 0.01 Virginia Investment Pool (VIP) - LiquidityPool 288,654,264 0.30 Total Fair Value $ 769,730,989
Total InvestmentsPortfolio Weighted Average Maturity $ 974,660,344 0.23
The City has investments in U.S. Government securities valued at $120.1 million (Level 2 inputs). Theseinvestments are classified in Level 2 of the fair value hierarchy and are valued using matrix pricing techniquesmaintained by various pricing vendors. Matrix pricing is used to value securities based on the securities’
68

CITY OF VIRGINIA BEACH, VIRGINIANOTES TO FINANCIAL STATEMENTS
JUNE 30, 2020
relationship to benchmark quoted prices. Fair value is defined as the quoted market value on the last trading dayof the period. These prices are obtained from various pricing sources by our custodian bank.
Investments in Money Market Funds (Level 2 inputs) and Commercial Paper (Level 2 inputs) are classified inLevel 2 of the fair value hierarchy and are valued in accordance with pricing sources by our custodian bank.
The remaining investments, measured in accordance with existing GASB standards and at amortized costs,totaled $769.7 million at June 30, 2020. Investments within the SNAP Investment Pool are held there to meetthe debt service reserve requirements of the bond covenants and therefore cannot be withdrawn for any otherpurpose. Investments within the Local Government Investment Pool (LGIP) have no restrictions on withdrawalsand can be obtained upon demand. Investments in the Virginia Investment Pool (VIP) fall within two primaryfunds, 1-3 Year High Quality Bond Fund and Stable NAV Liquidity Pool. The 1-3 High Quality Bond Fundredemptions are available twice a month and participants are required to provide 5 days’ notice. Redemptionsgreater than $5 million are requested to be submitted 60 days in advance and if the redemption is greater than10% of the portfolio’s net asset value without the 60 days’ notice, the redemption can be executed over time. The Stable NAV Liquidity Pool has no restrictions on withdrawals and funds are available the same day.
Reconciliation of total deposits and investments to the government-wide financial statements at June 30, 2020:
School BoardPrimary Component
Government Unit TotalCash and Investment $ 800,436,249 $ 245,659,477 $ 1,046,095,726 Restricted Cash and Cash Equivalents 181,424,870 0 181,424,870 Fiduciary Funds 261,195 20,406,736 20,667,931 Total $ 982,122,314 $ 266,066,213 1,248,188,527
Less: Cash on Deposit (273,528,183)Total Fair Value of Investment at June 30, 2020 $ 974,660,344
In addition to the above cash and investments reported on the government-wide financial statements the carryingvalues as of June 30, 2020 of the City and School Board OPEB Trust Fund's deposits and investments held bythe Virginia Pooled OPEB Trust (VML/VACo Pooled OPEB Trust) was $45,460,681 and $-, respectively.
Interest Rate Risk:
As a means of limiting its exposure to fair value loses arising from rising interest rates, the City’s investmentpolicy limits maximum final stated maturities of investments to five years. In addition, the City will structurethe investment portfolio so that securities mature to meet cash requirements and by investing operating fundsprimarily in shorter-term securities.
Investments of debt proceeds held by bond trustees are governed by provisions of the debt agreements. Reverseand escrow funds may be invested in securities exceeding five years to maturity if the maturities of suchinvestments are made to coincide as nearly as practicable with the expected use of the funds.
The City assumes all investments will be held until maturity or until called at their par value. However, aninvestment may be sold at an earlier date to meet certain obligations or if the investment’s credit quality drops.This makes the City’s investments sensitive to market rate fluctuations. To mitigate the impact of market ratefluctuations, the City maintains enough liquidity to meet its short-term needs with a smaller portion invested inlong-term government-sponsored organizations and high-quality corporate notes.
69

CITY OF VIRGINIA BEACH, VIRGINIANOTES TO FINANCIAL STATEMENTS
JUNE 30, 2020
Credit Risk:
Credit risk is the risk an investor is subject to as a result of the credit quality of investments in debt securities. Statutes as well as the City’s investment policy authorize the City to invest in obligations of the United States oragencies thereof; the Commonwealth of Virginia or political subdivisions thereof; obligations of theInternational Bank for Reconstruction and Development (World Bank); the Asian Development Bank; theAfrican Development Bank; commercial paper rated A-1 by Standard & Poor's Corporation or P-1 by Moody's Commercial Paper Record; bankers’ acceptance instruments; repurchase agreements which are collateralizedwith securities approved for direct investment; State Treasurer’s Local Government Investment Pool (LGIP);and corporate notes with at least a rating of Aa by Moody's or AA by Standard and Poor's.
The LGIP is an externally managed investment pool that is not registered with the Securities ExchangeCommission but is managed as a “2a-7 like pool”. Pursuant to the Code of Virginia, the Treasury Board of theCommonwealth sponsors the LGIP and has delegated certain functions to the State Treasurer. The LGIP reportsto the Treasury Board at their regularly scheduled monthly meetings. The LGIP values portfolio securities by theamortized cost method and on a monthly basis this valuation is compared to current market to monitor anyvariance. The fair value of the City’s position in the pool is the same as the value of the pool shares.
Custodial Credit Risks Investments – For an investment, this is the risk that, in the event of a failure of thecounterparty, the City will not be able to recover the value of its investment or collateral securities that are in thepossession of an outside party. The City requires that all investments be clearly marked as to ownership and tothe extent possible, be registered in the name of the City. In addition, the City pre-qualifies the financialinstitutions, brokers/dealers, intermediaries and advisors with which the City will do business.
The City’s rated debt investments as of June 30, 2020 were rated by Standard & Poor’s and Moody’s and/or anequivalent national rating organization and the ratings are presented below using the respective rating scale fromboth agencies.
AAA A1/P1/F1+
State Treasurer's Local Government Investment Pool (LGIP) $ 292,000,000 $ - U. S. Government Securities 120,118,472 - State Non Arbitrage Program (SNAP) 112,755,946 - Commercial Paper 74,810,883 -
Concentration of Credit Risk: Concentration of credit risk represents the risk of investments in any one issuethat represents five percent or more of investments. The City’s investment policy limits the amount it can investin commercial paper and bankers’ acceptance instruments. By policy, investments in commercial paper arelimited to 35% of the total available for investment, and not more than 5% of the total available for investmentcan be invested in any one issuing corporation. Bankers’ acceptance instruments shall not exceed 50% of thetotal investment portfolio’s book value on the date of acquisition.
All City and School Board Funds participate in a centralized cash and investment pool. Interest earnings oninvestments are allocated to the appropriate funds based upon the average monthly cash balance of each fund.
70

CITY OF VIRGINIA BEACH, VIRGINIANOTES TO FINANCIAL STATEMENTS
JUNE 30, 2020
9. COMMITMENTS AND CONTINGENCIES
A. Litigation
The City is a named defendant in litigation filed by parties concerning alleged personal injuries, propertydamage, and other causes of action. The City is vigorously defending all cases and expects no losses willbe incurred which would have a material effect on the City's financial position.
B. Intergovernmental Grants, Entitlements, and Shared Revenues
The City participates in a number of federal and state grants, entitlements, and shared revenues programs.These programs are subject to financial and program compliance audits by the applicable federal or stateagency or their representatives.
Furthermore, Federal grant programs in which the City participates have been audited in accordance withthe provisions of the Office of Management 2 CFR 200, Uniform Administrative Requirements. Theamounts, if any, of expenditures which may be disallowed by these audits cannot be determined at this timealthough the City expects such amounts, if any, would not have a material adverse effect on the City'sfinancial position.
C. Salaries Payable
The outstanding School Board Component Unit Funds' amount represents salaries due (2 months) to schoolteachers who have opted to be paid over a twelve-month period, and to substitute and supplemental schoolpersonnel.
D. Landfill Closure and Environmental Trust Fund Claims
On May 24, 2016, the City entered into a use and support agreement with Southeastern Public ServiceAuthority of Virginia (SPSA). Under this agreement, effective January 1, 2018 which continues until June2027, the City agreed to use SPSA's solid waste disposal system to dispose of solid waste generated withinand collected by the City. For this service, the City agreed to pay tipping fees to SPSA.
The total remaining capacity as of March 1, 2020 of the permitted cells at the City landfill is 1.76 milliontons. The City used 3.6 million tons prior to the date of the agreements (August 1984). Total usage to datehas been estimated at 8.246 million tons. Estimated remaining life of the landfill, based on current fill ratesis 24 years for the existing developed capacity and 73 years for the permitted capacity.
As of March 1, 2020, approximately 77 percent of the permitted landfill has been used. Based on a June2020 analysis, the present value of the estimated cost for both closure and post-closure care is $21,668,720,an amount based on landfill capacity used to date. Until another cell of the landfill is opened, no additionalestimated closure and post-closure care costs will be recognized, except for the effects of inflation, changesin landfill conditions, changes in estimates, changes in technology or changes in laws or regulations. Thisamount is reflected in the government-wide financial statements. The City is required by law to submit aworksheet that demonstrates the ability to fund landfill closure and post-closure care costs.
The Environmental Trust Funds were established through agreements between the City, Suffolk and SPSAwhich include the Suffolk Environmental Trust fund and the Virginia Beach Environmental Trust Fund. The purpose of these accounts are to provide for all costs relating to legal suits and other similar claimactivity relating to environmental pollution that are made against the Regional Landfill and the VirginiaBeach Landfill during a thirty (30) year period after cessation of each landfill’s operation. The City’sproportionate share of the funds, held by SPSA, total $307,907 as of June 30, 2020.
71

CITY OF VIRGINIA BEACH, VIRGINIANOTES TO FINANCIAL STATEMENTS
JUNE 30, 2020
E. Encumbrances
Encumbrance accounting, the recording of purchase orders, contracts, and other monetary commitments inorder to reserve an applicable portion of an appropriation is used as an extension of formal budgetarycontrol by the City. At June 30, 2020 the City had outstanding encumbrances as follows:
General Fund General Government $ 2,537,445 Computer Replacement Program 134,180
Emergency Management 478,069 Housing 515,178
Museums and Cultural Arts 116,561 Information Technology 2,397,038 Planning 159,134 Sandler Center for the Performing Arts 1,601,383 Human Services 299,948 Police 202,653 Public Works 3,657,291 Parks and Recreation 274,221 Vehicle Replacement 1,113,108 Total General Fund 13,486,209 Capital Projects Fund Engineering and Highways 37,133,897 Buildings 75,145,808 Parks and Recreation 3,212,203 Coastal 1,430,851 Economic and Tourism 24,429,691 Total Capital Projects Fund 141,352,450 Nonmajor Special Revenue Funds 2,061,680 Total $ 156,900,339
F. COVID-19
The World Health Organization declared the spread of Coronavirus Disease (COVID-19) a worldwidepandemic. The COVID-19 pandemic significantly affected global markets, supply chains, businesses, andcommunities. Specific to the City of Virginia Beach, COVID-19 may impact various future operations andfinancial results. Management believes the City has taken appropriate actions to mitigate any negativeimpact. However, the ultimate impact of COVID-19 is unknown and cannot be reasonably estimable at thistime.
The City received $39,258,497 of Coronavirus Aid, Relief and Economic Security Act (CARES) Funding inJune 2020. Funding can only be used to cover costs that are necessary expenditures with respect to theCOVID-19, not accounted for in the most recent budget and were incurred between March 1, 2020 throughDecember 30, 2020. The City has identified eligible expenses and will be compliant with the terms of theaward.
In addition the City has received other COVID related grants, such as $3.5 million CARES Act Fundingfrom the U.S. Department of Housing and Urban development to help the community with housing andhomelessness related issues caused by the COVID-19 and other allocations from the State.
72

CITY OF VIRGINIA BEACH, VIRGINIANOTES TO FINANCIAL STATEMENTS
JUNE 30, 2020
10. TAX ABATEMENTS
Virginia Beach TaxAbatement Disclosure as Programs Administered by City of Virginia Beach
required by StatementNo. 77 of the
Governmental Tourism Development Financing Program (TDFP) Business License Incentive Program (BPOL)Accounting Standards Cavalier
Provides incentive payment annually of "but for" project Incentive program providing partial tax exemption for revenues after a project is operational and has paid sales new businesses, and will foster business developmenttaxes. This annual incentive payment is to assist in and encourage entrepreneurialism.
1) Purpose of Program closing a financing gap between debt and equity adeveloper currently has and the total financing requiredby a tourism project.
2) Tax being abated 1% local sales tax Business License Tax3) Authority under which VA Code 58.1-3851.1 City Code Chapter 18.202-208
abatement agreements City Code Chapter 35.4are entered into
Capital investment greater than $30 million and taxable A qualifying business that locates in the City of Virginia 4) Criteria to be eligible sales greater than $1 million annually. Compensates for Beach for the first time and anticipates gross receipts
to receive abatement a shortfall in project funding, not to exceed 30% of a greater than $100K. qualified project's total cost.
5) How recipients' taxes Through sales tax dedication based on generated sales. Pay maximum license fee of $60 for the first 2 calendarare reduced years.
1) 1% of local sales tax generated on-premise is paid to Business License Tax reduced to $50.developer as an incentive payment - total of $8.17M
6) How amount of 2) 1% of state sales tax generated on-premise is paid to abatement is developer as an incentive payment - total of $8.17Mdetermined
3) 1% developer access fee that is paid to the state isprovided to the developer as an incentive payment- total of $8.17M
7) Provisions for N/A N/Arecapturing abated taxes
1) Economic Development Investment Program Grant - Eligible for Economic Development Investment Program$8.2M (FY 2014) Grant:
FY2019 - $687,2628) Types of commitments 2) Green Space/Historic Preservation Easement - $2.37M
made by the City other (FY2014)than to reduce taxes
3) Cavalier Drive Improvements - $2.45M (FY2014 and2017)
4) Annual Grants based on increased Real Estate TaxRevenues - capped at $5M in total; not yet paid
9) Gross dollar amount, on Real Estate Tax: Business License Tax:accrual basis, by which FY2020 - $1,401,369 FY2020 - $516.954the City's tax revenues FY2019 - $951,367 FY2019 - $410,812were reduced as a result of abatement Sales Tax:agreement FY2020 - $174,943 (City's portion only)
FY2019 - $119,529 (City's portion only)
73

CITY OF VIRGINIA BEACH, VIRGINIANOTES TO FINANCIAL STATEMENTS
JUNE 30, 2020
Virginia Beach TaxAbatement Disclosure as Programs Administered by City of Virginia Beach
required by StatementNo. 77 of the
Governmental Yes Oceana APZ-1 Incentives ViBE Creative DistrictAccounting Standards
Developed to meet the requirements of the Base To attract creative industries to the City, newRealignment and Closure (BRAC) Commission to establishments at which creative activities are carriedprotect our citizens and keep the Navy's East Coast on, establish framework for broadening economic
1) Purpose of Program master jet base, Naval Air Station (NAS) Oceana, in development through creative endeavors, and to Virginia Beach. Consists of zoning ordinances and encourage creative activites at existing venues. incentives to foster the conversion of nonconformingbusinesses in APZ-1 into conforming ones and relocatingones that cannot be converted to another part of VirginiaBeach.
2) Tax being abated Real Estate Tax; Business License Tax and Fees Real Estate Tax; Business License Tax and Fees3) Authority under which VA Code 58.1-3220.1 and 58.3221 VB Code Section 9-1 through 9-9.
abatement agreements Ord. No. 2786, 9-23-03 Ord. No. 3402are entered into Ord. No. 2932, 3-28-06
VB Code 35-72.1, 35.2-11The assessed value after the rehabilitation, renovation, or Being a qualifying organization including one that is
4) Criteria to be eligible replacement of the structure shall be at least 20% greater intended for unique production of works created by to receive abatement than the base assessed value; for commercial or industrial artists, a museum, theater, entity engaged in architecture,
use; consistent with the City's Comprehensive Plan and culinary arts, design, film, publishing, and softwareZoning Ordinances; result in conversion of a development, etc.; and shall be physically located within nonconforming use to a conforming use. a Creative District designated by the City Council.
5) How recipients' taxes Credit on tax bill, rebate, and reimbursements of fees. All Credit on bill for real estate tax. Through reimbursementare reduced last 15 years. of business, professional, and occupational license taxes.
Reimbursement of fees. The difference between the taxes computed upon the Real estate credit is amount equal to the greater of initialbase value and the initial rehabilitated assessed value of increase in assessed value of the structure above its base the property for each year of the partial exemption from value resulting from the rehabilitation of the structure or
6) How amount of real estate taxes; credit shall not increase. 90% of an amount equal to fifty percent of the qualifying costs ofabatement is business license taxes imposed by Chapter 18. rehabilitating the structure, for 10 years. determined Entitled to reimbursement for up to 10 years of BPOL
taxes. Total reimbursement of fees if qualified.
7) Provisions for N/A N/Arecapturing abated taxes
Eligible for Economic Development Investment Program Eligible for Economic Development Investment ProgramGrant: Grant.
FY2020 - $3,232 FY2020 - $30,9258) Types of FY2019 - $142,078 FY2019 - $21,637
commitments made by the City other than toreduce taxes
9) Gross dollar amount, Business License Tax: There are currently only two qualifying establishmentson accrual basis, by FY2020 - $56,204 under this program and due to Virginia Law this amountwhich the City's tax FY2019 - $67,747 cannot be disclosed, therefore it is included with therevenues were reduced No Real Estate Taxes have been credited to-date amount in APZ-1. as a result of abatementagreement
74

CITY OF VIRGINIA BEACH, VIRGINIANOTES TO FINANCIAL STATEMENTS
JUNE 30, 2020
Virginia Beach TaxAbatement Disclosure as Programs Administered by City of Virginia Beach
required by StatementNo. 77 of the Governmental Public Private Partnerships
Accounting Standards Field House 25th Street Parking Garage and iFLYThe Virginia Beach Field House is a 175,000 sf Indoor The City partnered with a private company to develop aMultipurpose Field House Venue opened in September unique tourism amenity and to provide public parking in
the2010. It is located in the Princess Anne Athletic Complex resort area. The project includes a public garage, and
1) Purpose of Program filling a need for recreational facilities. Eastern Sports privately owned entertainment facility and apartments.Management operates the facility. Private investment was The project is aligned with Council's Resort Strategic$15.7 million and included a ground lease from the City Action Plan (2008) for year-round entertainment, (percentage rent of 5% for annual sales over a year-round residential development/presence,$5.5 million). and public parking. The Venue opened in 2016 and
had private investment of $21.66 million.2) Tax being abated Real Estate Tax Admissions Tax3) Authority under which Development Agreement approved by City Council Virginia Public-Private Education Facilities and
abatement agreements Infrastructure Act of 2002are entered into
The project's comprehensive agreement was approved by The project's comprehensive agreement was approved by 4) Criteria to be eligible City Council February 2010. City Council February 2013.
to receive abatement
5) How recipients' taxes Company receives a rebate/incentive payment. Company receives a rebate/incentive payment. are reduced
100% of annual real estate taxes, paid to the city are 90% of admission taxes remitted to the City are rebatedrebated back as an incentive payment (but for revenues) back as an incentive payment (but for revenues) until for the first 10 years. a total of $1.6 million have been returned.
6) How amount ofabatement isdetermined
7) Provisions for N/A N/Arecapturing abated taxes
N/A The City sold the 25th Street parking lot to the developerfor $7.65 million. After the developer built 147 apartmentunits, 2,500 square feet of retail space, "iFLY"
8) Types of commitments entertainment facility, and a 565-space garage, the City made by the City other purchased the parking garage for $7.65 million. Also, thethan to reduce taxes City contributed approximately $250,000 towards
landscaping and $586,000 for streetscape improvements.
9) Gross dollar amount, on Real Estate Tax: Admission Tax:accrual basis, by which FY2020 - $68,360 (Last payment made Dec. 2019) FY2020 - $61,155the City's tax revenues FY2019 - $136,307 FY2019 - $85,820were reduced as aresult of abatementagreement
75

CITY OF VIRGINIA BEACH, VIRGINIANOTES TO FINANCIAL STATEMENTS
JUNE 30, 2020
11. INTERFUND BALANCES AND TRANSACTIONS, FUND RESULTS AND RECONCILIATIONS
A. Interfund Transfers
Interfund transfers for the year ended June 30, 2020 were made up of the following:
Water & NonmajorGeneral Nonmajor Sewer Parking Internal
Transfer To: Fund Governmental Enterprise Enterprise Service TotalGeneral Fund $ 3,468 $ 16,526,464 $ - $ - $ 350,000 $ 16,879,932 Capital Projects Fund 53,914,264 22,257,370 1,000,554 1,350,000 100,000 78,622,188 Storm Water Fund - 1,004,873 - - - 1,004,873 Nonmajor Governmental 76,642,353 2,783,932 - 65,000 - 79,491,285 Nonmajor Enterprise Funds - 68,500 - - - 68,500 Total $ 130,560,085 $ 42,641,139 $ 1,000,554 $ 1,415,000 $ 450,000 $ 176,066,778
Purpose:
Transfers From General Fund:
$ 3,468 General Fund: Circuit Court Clerk Technology Fee Trust Fund 53,914,264 Capital Projects Fund: Funding for Pay-As-You-Go Capital Projects Fund 76,642,353 Nonmajor Governmental Funds: Funding for Special Revenue programs and Debt Fund
Transfers From Nonmajor Governmental Funds:
$ 16,526,464 General Fund: Special Revenue Funds, primarily surplus funds from Sandbridge TIF 22,257,370 Capital Projects Fund: Funding for Pay-As-You Go capital projects.
1,004,873 Storm Water Fund: Funding for support of Storm Water operations. 2,783,932 Nonmajor Governmental Funds: Funding for support of existing programs
68,500 Nonmajor Enterprise Funds: Funding for Parking support.
Transfer From Water and Sewer Enterprise Fund:
$ 1,000,554 Capital Projects: Buildings and IT Projects
Transfer From Nonmajor Enterprise Fund:
$ 1,350,000 Capital Project Funds: Economic and Tourism. 65,000 Nonmajor Governmental Funds: Funding for support of existing programs.
Transfer From Internal Service Fund:
$ 350,000 General Fund: COVID-19 Public Safety Supplies 100,000 Capital Project Funds: Funding for support of Roadway Capital Projects
76

CITY OF VIRGINIA BEACH, VIRGINIANOTES TO FINANCIAL STATEMENTS
JUNE 30, 2020
B. Net Position Deficit
The following Primary Government funds have deficit balances in equity at June 30, 2020:
Proprietary Funds:Risk Management Fund $ (10,947,408)Grants Consolidated Fund $ (2,515,814)Sheriff's Department Fund $ (806,343)
The deficit in the Risk Management Fund represents the actuarially estimated liability for future claims. Therate structure for the Risk Management Fund is continually being evaluated for adjustments.
The deficit in the Grants Consolidated Fund is a result of a delays in requests for grant reimbursements dueto filing extensions and state review of grant requirements.
The defiicit in the Sheriffs Department Fund is a result of court closures due to COVID-19, resulting in aloss of state revenues.
C. Restatement
The beginning net position of the Virginia Beach Community Development Corporation was restated to reflectthe inclusion of Citywide Homes 2001, L.P. which was not reported with the consolidated statements for theyear then ended. Prior to June 30, 2018 VBCDC did not control the operations of Citywide and was notincluded in the consolidated financial statements. As of June 30, 2019 the VBCDC is the sole owner ofCitywide and is able to exert control over its operations. The following table reflects the change on theVBCDC's June 30, 2019 consolidate financial statements. .
FY 2020 Beginning Balance Prior to Restatement Restatement
FY 2020 Beginning Balance Resated
$ 10,318,428 $ (79,110) $ 10,239,318
77

CITY OF VIRGINIA BEACH, VIRGINIANOTES TO FINANCIAL STATEMENTS
JUNE 30, 2020
12. RISK MANAGEMENT
A. Primary Government Self-Insurance Program
The City is exposed to various risks of loss related to torts; theft of, damage to, and destruction of assets;errors and omissions; injuries to employees; and natural disasters. During Fiscal Year 1973, the Cityestablished an internal service Risk Management Fund to account for and finance its uninsured risks of loss.Under this program, the Fund provides coverage for up to a maximum of $1,250,000 for each workers’compensation claim, $2,000,000 for each general and auto liability claim, $50,000 for each fire andproperty claim ($100,000 for schools), and $2,000,000 for each public officials (errors and omissions)claim.
The City is also exposed to the risk of loss for employee medical benefits. These medical benefits areaccounted for in the School Health Insurance Internal Service Fund. This fund accounts for and financesthis joint self-insured program between the City and the School Board.
The insurance coverage for each major category of risk is the same as those reported in the prior fiscal year.There have not been any reductions in commercial insurance coverage from the prior year and the amountof settlements applied against this coverage in each of the past three years did not exceed the commercialinsurance. The City has $10,000,000 of excess insurance coverage per claim and $20,000,000 aggregate. In addition, the City purchased Cyber insurance with a $10,000,000 limit for each claim and in aggregatepolicy. These coverages include data breach incident response, network security, privacy liability, databreach liability, regulatory liability, business interruption, data restoration, cyber extortion and medialiability. At this time, the claims received and exposure from COVID-19 have had minimal impact on theCity and the Self-Insurance Program.
All funds of the City participate in the program (except for School Board Component Unit funds) and makepayments to the Risk Management Fund based on normal underwriting criteria and each agency’s lossexperience. The City uses an actuary to aid in the determination of self-insurance liabilities.
The claims liability of $44,599,078 is based on the ultimate cost of settling the claims, which includesincremental claim adjustment expenses (i.e., outside legal assistance) and estimated recoveries on unsettledclaims as required by GASB Statement No. 30. The City prepares an update of the actuarial liabilityannually, and believes the estimates contained herein substantially reflect estimated claims and judgmentsfor the period ending June 30, 2020.
Fiscal Beginning Claims & Changes Claims Balance atYear Liability in Estimates Payments Year-End2019 40,902,030 11,075,214 10,523,723 41,453,521
2020 41,453,521 13,609,333 10,463,776 44,599,078
78

CITY OF VIRGINIA BEACH, VIRGINIANOTES TO FINANCIAL STATEMENTS
JUNE 30, 2020
B. School Board Self-Insurance Program
The School Board is self-insured for a portion of its risks. The self-insurance coverage for Fire and PropertyInsurance is $100,000 per occurrence (includes unnamed windstorm and earthquake damage) and 1% of thetotal insured value of the damaged covered property when such loss or damage results from a namedwindstorm (minimum deductible - $250,000 per occurrence); Boiler and Machinery Breakdown coverage is$10,000 per occurrence; School Leaders Liability (errors and omissions) coverage is $350,000 peroccurrence; Crime (Employee Dishonesty) coverage is $2,500 per occurrence; Environmental Impairment is$25,000 and Cyber Liability coverage has a $50,000 self-insured retention. Automobile Liability coverage(engine on) is $450,000 per occurrence; Automobile Physical Damage coverage (engine off) is $60,000 peroccurrence; General and Automobile and Workers’ Compensation self-insured retention is $750,000 perclaim.
Commercial insurance is purchased to cover the amount in excess of the above self-insured levels forspecific losses. When economically feasible, commercial insurance is purchased to cover certain exposurescompletely. The amount of settlements did not exceed insurance coverage for each of the past three fiscalyears and the insurance coverage is substantially the same as in recent prior fiscal years.
Claims processing and payments for all insurance claims are made through commercial carriers andthird-party administrators. The School Board uses the information provided by the third-partyadministrators to aid in the determination of self-insurance liabilities. The computed liability for the lastthree years are as follows:
Beginning of Current Year Balance atFiscal Fiscal Year Claims & Changes Claims FiscalYear Liability in Estimates Payments Year-End2019 7,971,000 7,550,000 6,924,000 8,597,000 2020 8,597,000 5,931,000 6,719,849 7,808,151
Self-Insured Health Care Benefits Program
Effective January 1, 2000, the School Board eand City Councel established a self-insured health carebenefits program for all School Board and City employees. Certain claims expenses paid on behalf of eachemployee during a single policy year are covered by excess loss insurance with a specific stop-loss limit of$600,000. The amount of settlements did not exceed insurance coverage for each of the past three fiscalyears.
Claims processing and payments for all health care claims are made through third-party administrators. TheSchool Board uses the information provided by the third-party administrators and a health care benefitsconsultant to aid in the determination of self-insurance liabilities. The computed liability for the last threeyears are as follows:
Beginning of Current Year Balance atFiscal Fiscal Year Claims & Changes Claims FiscalYear Liability in Estimates Payments Year-End2018 7,324,000 134,456,000 132,452,000 9,328,000 2019 9,328,000 142,338,000 142,235,838 9,430,162 2020 9,430,162 126,801,000 127,976,162 8,255,000
79

CITY OF VIRGINIA BEACH, VIRGINIANOTES TO FINANCIAL STATEMENTS
JUNE 30, 2020
C. Surety Bonds
All City employees, including employees of elected constitutional officers (Commissioner of the Revenue,Treasurer, Commonwealth's Attorney, Sheriff, Clerk of the Circuit Court), are bonded in favor of the City inthe amount of $1,000,000. This bond is written by the Travelers Insurance Company.
The Commonwealth of Virginia has secured a blanket bond for the City Treasurer and Finance Director($1,600,000) Commissioner of Revenue ($3,000) and the Sheriff ($30,000) which covers the bondsrequired by law or contract for the position they hold. The bond is written by Travelers Casualty and SuretyCompany of America.
The Commonwealth of Virginia also provides coverage through the “Faithful Performance of Duty BondPlan” in the amount of $500,000 for the constitutional officers. This does take the place of a separate bondrequired by law or contract.
All School Board employees are covered by a faithful performance bond in the amount of $100,000 toprotect the School Board in the event of fraudulent acts.
80

CITY OF VIRGINIA BEACH, VIRGINIANOTES TO FINANCIAL STATEMENTS
JUNE 30, 2020
13. RETIREMENT
A. Virginia Retirement System
Plan Description
The City and School Board contribute to the Virginia Retirement System (VRS), which provides agent,multiple employer and cost-sharing, multiple-employer defined benefit pension plans administered by theVirginia Retirement System (System). The City employees and School Non Professional employees arecovered by the VRS Political Subdivision Retirement Plan, which is the agent, multiple employer definedbenefit. All full-time, salaried permanent (professional) employees of Virginia Beach City Public Schools(VBCPS) are covered by the VRS Teacher Retirement Plan, which is the cost-sharing, multiple employerdefined benefit plan upon employment.
For purposes of measuring the net pension liability, deferred outflows of resources and deferred inflows ofresources related to pensions, and pension expense, information about the fiduciary net position of theVirginia Retirement System Retirement Plans and the additions to/deductions from the VRS Retirementplans' net fiduciary position have been determined on the same basis as they were reported by VRS. For thispurpose, benefit payments (including refunds of employee contributions) are recognized when due andpayable in accordance with the benefit terms. Investments are reported at fair value.
All full-time, salaried permanent employees of the City and School Board are automatically covered by theVRS Retirement Plan upon employment. This plan is administered by the Virginia Retirement System (theSystem) along with plans for other employer groups in the Commonwealth of Virginia. Members earn onemonth of service credit for each month they are employed and for which they and their employer paycontributions to VRS. Members are eligible to purchase prior service, based on specific criteria a definedin the Code of Virginia, as amended. Eligible prior service that may be purchased includes prior publicservice, active military service, certain periods of leave, and previously refunded service.
The System administers three different benefit structures for covered employees – Plan 1, Plan 2, and,Hybrid. Each of these benefit structures has a different eligibility criteria. The specific information foreach plan and the eligibility for covered groups within each plan are set out in the table below:
81

CITY OF VIRGINIA BEACH, VIRGINIANOTES TO FINANCIAL STATEMENTS
JUNE 30, 2020
PLAN 1 PLAN 2HYBRID
RETIREMENT PLAN
About Plan 1:Plan 1 is a defined benefit plan.The retirement benefit is based on amember’s age, creditable service andaverage final compensation atretirement using a formula.
About Plan 2:Plan 2 is a defined benefit plan.The retirement benefit is based on amember’s age, creditable service andaverage final compensation atretirement using a formula.
About the Hybrid RetirementPlan:The Hybrid Retirement Plancombines the features of a definedbenefit plan and a defined contributionplan.• The defined benefit is based on amember’s age, creditable service andaverage final compensation atretirement using a formula.• The benefit from the definedcontribution component of the plandepends on the member and employercontributions made to the plan and theinvestment performance of thosecontributions.• In addition to the monthly benefitpayment payable from the definedbenefit plan at retirement, a membermay start receiving distributions fromthe balance in the defined contributionaccount, reflecting the contributions,investment gains or losses, and anyrequired fees.
Eligible Members:Employees are in Plan 1 if theirmembership date is before July 1,2010, and they were vested as ofJanuary 1, 2013, and they have nottaken a refund.
Eligible Members:Employees are in Plan 2 if theirmembership date is on or after July 1,2010, or their membership date isbefore July 1, 2010, and they were notvested as of January 1, 2013.
Eligible Members:Employees are in the HybridRetirement Plan if their membershipdate is on or after January 1, 2014.This includes:• Political subdivision employees• Members in Plan 1 or Plan 2 whoelected to opt into the plan during theelection window held January 1-April30, 2014; the plan’s effective date foropt-in members was July 1, 2014.
82

CITY OF VIRGINIA BEACH, VIRGINIANOTES TO FINANCIAL STATEMENTS
JUNE 30, 2020
PLAN 1 PLAN 2 HYBRIDRETIREMENT PLAN
Hybrid Opt-In Election:VRS non-hazardous duty coveredPlan 1 members were allowed to makean irrevocable decision to opt into theHybrid Retirement Plan during aspecial election window held January 1through April 30, 2014.
The Hybrid Retirement Plan’s effectivedate for eligible Plan 1 members whoopted in was July1, 2014.
If eligible deferred members returnedto work during the election window,they were also eligible to opt into theHybrid Retirement Plan.
Members who were eligible for anoptional retirement plan (ORP) andhad prior service under Plan 1 were noteligible to elect the Hybrid RetirementPlan and remain as Plan 1 or ORP.
Hybrid Opt-In Election:Eligible Plan 2 members wereallowed to make an irrevocabledecision to opt into the HybridRetirement Plan during a specialelection window held January 1through April 30, 2014.
The Hybrid Retirement Plan’s effectivedate for eligible Plan 2 members whoopted in was July1, 2014.
If eligible deferred members returnedto work during the election window,they were also eligible to opt into theHybrid Retirement Plan.
Members who were eligible for anoptional retirement plan (ORP) andhave prior service under Plan 2 werenot eligible to elect the HybridRetirement Plan and remain as Plan 2or ORP.
*Non-Eligible Members:Some employees are not eligibleto participate in the HybridRetirement Plan. They include:• Political subdivision employees whoare covered by enhanced benefits forhazardous duty employees.
Those employees eligible for anoptional retirement plan (ORP) mustelect the ORP plan or the HybridRetirement Plan. If these membershave prior service under Plan 1 or Plan2, they are not eligible to elect theHybrid Retirement Plan and mustselect Plan 1 or Plan 2 (as applicable)or ORP.
Retirement Contributions: Employees contribute 5% of theircompensation each month to theirmember contribution account through apre-tax salary reduction. Membercontributions are tax-deferred untilthey are withdrawn as part of aretirement benefit or as a refund.The employer makes a separateactuarially determined contribution toVRS for all covered employees. VRSinvests both member and employercontributions to provide funding forthe future benefit payment.
Retirement Contributions:Employees contribute 5% of theircompensation each month to theirmember contribution account through apre-tax salary reduction.
Retirement Contributions:A member’s retirement benefit isfunded through mandatory andvoluntary contributions made by themember and the employerto both the defined benefit and thedefined contribution components ofthe plan. Mandatory contributions arebased on a percentage of theemployee’s creditable compensationand are required from both themember and the employer.Additionally, members may choose tomake voluntary contributions to thedefined contribution component of theplan, and the employer is required tomatch those voluntary contributionsaccording to specified percentages.
83
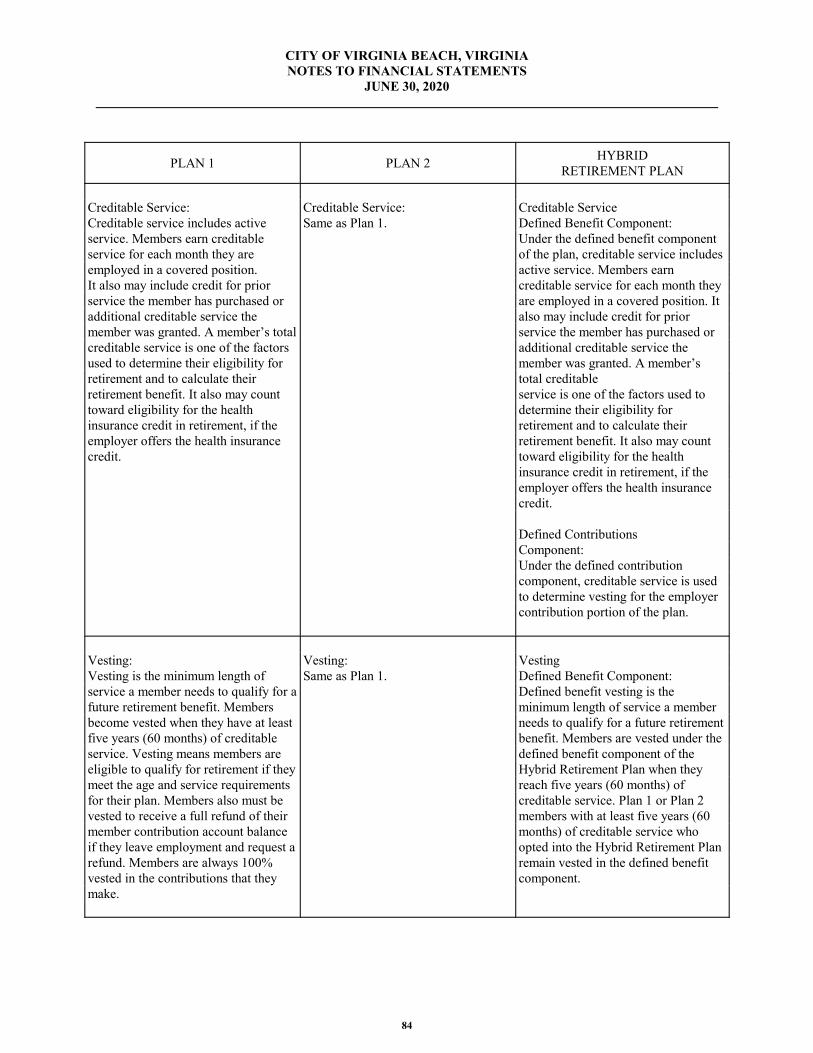
CITY OF VIRGINIA BEACH, VIRGINIANOTES TO FINANCIAL STATEMENTS
JUNE 30, 2020
PLAN 1 PLAN 2 HYBRIDRETIREMENT PLAN
Creditable Service:Creditable service includes activeservice. Members earn creditableservice for each month they areemployed in a covered position.It also may include credit for priorservice the member has purchased oradditional creditable service themember was granted. A member’s totalcreditable service is one of the factorsused to determine their eligibility forretirement and to calculate theirretirement benefit. It also may counttoward eligibility for the healthinsurance credit in retirement, if theemployer offers the health insurancecredit.
Creditable Service:Same as Plan 1.
Creditable ServiceDefined Benefit Component:Under the defined benefit componentof the plan, creditable service includesactive service. Members earncreditable service for each month theyare employed in a covered position. Italso may include credit for priorservice the member has purchased oradditional creditable service themember was granted. A member’stotal creditableservice is one of the factors used todetermine their eligibility forretirement and to calculate theirretirement benefit. It also may counttoward eligibility for the healthinsurance credit in retirement, if theemployer offers the health insurancecredit.
Defined ContributionsComponent:Under the defined contributioncomponent, creditable service is usedto determine vesting for the employercontribution portion of the plan.
Vesting:Vesting is the minimum length ofservice a member needs to qualify for afuture retirement benefit. Membersbecome vested when they have at leastfive years (60 months) of creditableservice. Vesting means members areeligible to qualify for retirement if theymeet the age and service requirementsfor their plan. Members also must bevested to receive a full refund of theirmember contribution account balanceif they leave employment and request arefund. Members are always 100%vested in the contributions that theymake.
Vesting:Same as Plan 1.
VestingDefined Benefit Component:Defined benefit vesting is theminimum length of service a memberneeds to qualify for a future retirementbenefit. Members are vested under thedefined benefit component of theHybrid Retirement Plan when theyreach five years (60 months) ofcreditable service. Plan 1 or Plan 2members with at least five years (60months) of creditable service whoopted into the Hybrid Retirement Planremain vested in the defined benefitcomponent.
84

CITY OF VIRGINIA BEACH, VIRGINIANOTES TO FINANCIAL STATEMENTS
JUNE 30, 2020
PLAN 1 PLAN 2 HYBRIDRETIREMENT PLAN
Defined ContributionsComponent:Defined contribution vesting refers tothe minimum length of service amember needs to be eligible towithdraw the employer contributionsfrom the defined contributioncomponent of the plan.
Members are always 100% vested inthe contributions that they make.
Upon retirement or leaving coveredemployment, a member is eligible towithdraw a percentage of employercontributions to the definedcontribution component of the plan,based on service.• After two years, a member is50% vested and may withdraw50% of employer contributions.• After three years, a member is 75%vested and may withdraw 75% ofemployer contributions.• After four or more years, amember is 100% vested and maywithdraw 100% of employercontributions.
Distribution is not required by lawuntil age 70½.
Calculating the Benefit:The Basic Benefit is calculatedbased on a formula using the member’saverage final compensation, aretirement multiplier and total servicecredit at retirement. It is one of thebenefit payout options available to amember at retirement.
Calculating the Benefit:See definition under Plan 1.
Calculating the Benefit DefinedBenefit Component: See definition under Plan 1.
85

CITY OF VIRGINIA BEACH, VIRGINIANOTES TO FINANCIAL STATEMENTS
JUNE 30, 2020
PLAN 1 PLAN 2 HYBRIDRETIREMENT PLAN
An early retirement reduction factor isapplied to the Basic Benefit if themember retires with a reducedretirement benefit or selects a benefitpayout option other than the BasicBenefit.
Defined ContributionComponent:The benefit is based on contributionsmade by the member and anymatching contributions made by theemployer, plus net investment earningson those contributions.
Average Final Compensation: A member’s average finalcompensation is the average of the 36consecutive months of highestcompensation as a covered employee.
Average Final Compensation:A member’s average finalcompensation is the average of their 60consecutive months of highestcompensation as a covered employee.
Average Final Compensation: Same asPlan 2. It is used in the retirementformula for the defined benefitcomponent of the plan.
Service Retirement Multiplier VRS: The retirement multiplier is a factorused in the formula to determine a finalretirement benefit. The retirementmultiplier for non-hazardous dutymembers is 1.70%.
Sheriffs and regional jailsuperintendents: The retirement multiplier for sheriffsand regional jail superintendents is1.85%.
Political subdivision hazardous dutyemployees: The retirement multiplier of eligiblepolitical subdivision hazardous dutyemployees other than sheriffs andregional jail superintendents is 1.70%or 1.85% as elected by the employer.
Service Retirement Multiplier VRS: Same as Plan 1 for service earned,purchased or granted prior to January1, 2013. For non-hazardous dutymembers the retirement multiplier is1.65% for creditable service earned,purchased or granted on or afterJanuary 1, 2013.
Sheriffs and regional jailsuperintendents: Same as Plan 1.
Political subdivision hazardous dutyemployees: Same as Plan 1.
Service Retirement Multiplier DefinedBenefit Component: VRS: Theretirement multiplier for the definedbenefit component is 1.00%.
For members who opted into theHybrid Retirement Plan from Plan 1 orPlan 2, the applicable multipliers forthose plans will be used to calculatethe retirement benefit for servicecredited in those plans.
Sheriffs and regional jailsuperintendents: Not applicable.
Political subdivision hazardous dutyemployees: Not applicable.
Defined ContributionComponent:Not applicable.
86

CITY OF VIRGINIA BEACH, VIRGINIANOTES TO FINANCIAL STATEMENTS
JUNE 30, 2020
PLAN 1 PLAN 2 HYBRIDRETIREMENT PLAN
Normal Retirement Age VRS: Age 65.
Political subdivisions hazardous dutyemployees: Age 60.
Normal Retirement Age VRS: NormalSocial Security retirement age.
Political subdivisions hazardous dutyemployees: Same as Plan 1.
Normal Retirement Age DefinedBenefit Component: VRS: Same as Plan 2.
Political subdivisions hazardous dutyemployees: Not applicable.
Defined ContributionComponent:Members are eligible to receivedistributions upon leavingemployment, subject to restrictions.
Earliest UnreducedRetirement EligibilityVRS: Age 65 with at least fiveyears (60 months) of creditable serviceor at age 50 with at least30 years of creditable service.
Political subdivisions hazardous dutyemployees: Age 60 with at least five years ofcreditable service or age 50 with atleast 25 years of creditable service.
Earliest UnreducedRetirement EligibilityVRS: Normal Social Securityretirement age with at least five years(60 months) of creditable service orwhen their age and service equal 90.
Political subdivisions hazardous dutyemployees: Same as Plan 1.
Earliest Unreduced RetirementEligibility Defined BenefitComponent: VRS: Normal Social Security retirement ageand have at least five years (60months) of creditable service or whentheir age and service equal 90.
Political subdivisions hazardous dutyemployees: Not applicable.
Defined ContributionComponent:Members are eligible to receivedistributions upon leavingemployment, subject to restrictions.
87

CITY OF VIRGINIA BEACH, VIRGINIANOTES TO FINANCIAL STATEMENTS
JUNE 30, 2020
PLAN 1 PLAN 2 HYBRIDRETIREMENT PLAN
Earliest Reduced RetirementEligibility VRS: Age 55 with at least fiveyears (60 months) of creditable serviceor age 50 with at least 10 years ofcreditable service.
Political subdivisions hazardous dutyemployees: 50 with at least five years of creditableservice.
Earliest Reduced RetirementEligibility VRS: Age 60 with at least fiveyears (60 months) of creditableservice.
Political subdivisions hazardous dutyemployees: Same as Plan 1.
Earliest Reduced RetirementEligibility Defined Benefit Component:VRS: Age 60 with at least five years(60 months) of creditable service.
Political subdivisions hazardous dutyemployees: Not applicable.
Defined ContributionComponent:Members are eligible to receivedistributions upon leavingemployment, subject to restrictions.
Cost-of-Living Adjustment(COLA) in Retirement:The Cost-of-Living Adjustment(COLA) matches the first 3% increasein the Consumer Price Index for allUrban Consumers (CPI-U) and half ofany additional increase (up to 4%) upto a maximum COLA of 5%.
Eligibility:For members who retire with anunreduced benefit or with a reducedbenefit with at least 20 years ofcreditable service, the COLA will gointo effect on July 1 after one fullcalendar year from the retirement date.
For members who retire with a reducedbenefit and who have less than 20years of creditable service, the COLAwill go into effect on July 1 after onecalendar year following the unreducedretirement eligibilitydate.
Cost-of-Living Adjustment(COLA) in Retirement:The Cost-of-Living Adjustment(COLA) matches the first 2% increasein the CPI-U and half of any additionalincrease (up to 2%), for a maximumCOLA of 3%.
Eligibility:Same as Plan 1.
Cost-of-Living Adjustment (COLA) inRetirement Defined BenefitComponent: Same as Plan 2.
Defined ContributionComponent:Not applicable.
Eligibility:Same as Plan 1 and Plan 2.
88

CITY OF VIRGINIA BEACH, VIRGINIANOTES TO FINANCIAL STATEMENTS
JUNE 30, 2020
PLAN 1 PLAN 2 HYBRIDRETIREMENT PLAN
Exceptions to COLA EffectiveDates:The COLA is effective July 1following one full calendar year(January 1 to December 31) under anyof the following circumstances:• The member is within five years ofqualifying for an unreduced retirementbenefit as of January 1, 2013.• The member retires ondisability.• The member retires directly fromshort-term or long-term disabilityunder the Virginia Sickness andDisability Program (VSDP).• The member is involuntarilyseparated from employment for causesother than job performance ormisconduct and is eligible to retireunder the Workforce Transition Act orthe Transitional Benefits Program.• The member dies in service and themember’s survivor or beneficiary iseligible for a monthly death-in-servicebenefit. The COLA will go into effecton July 1 following one full calendaryear (January 1 to December 31) fromthe date the monthly benefit begins.
Exceptions to COLA EffectiveDates:Same as Plan 1.
Exceptions to COLA EffectiveDates:Same as Plan 1 and Plan 2.
Disability Coverage:Members who are eligible to beconsidered for disability retirement andretire on disability, the retirementmultiplier is 1.7% on all service,regardless of when it was earned,purchased or granted.
VSDP members are subject to aone-year waiting period beforebecoming eligible for non-work-related disability benefits.
Disability Coverage:Members who are eligible to beconsidered for disability retirement andretire on disability, the retirementmultiplier is 1.65% on all service,regardless of when it was earned,purchased or granted.
VSDP members are subject to aone-year waiting period beforebecoming eligible for non-work relateddisability benefits.
Disability Coverage:Employees of political subdivisions(including Plan 1 and Plan2 opt-ins)participate in the Virginia LocalDisability Program (VLDP) unlesstheir local governing body providesand employer-paid comparableprogram for its members.
Hybrid members (including Plan1 and Plan 2 opt-ins) covered underVLDP are subject to a one-yearwaiting period before becomingeligible for non-work-related disability benefits.
89

CITY OF VIRGINIA BEACH, VIRGINIANOTES TO FINANCIAL STATEMENTS
JUNE 30, 2020
PLAN 1 PLAN 2 HYBRIDRETIREMENT PLAN
Purchase of Prior Service:Members may be eligible to purchaseservice from previous publicemployment, active duty militaryservice, an eligible period of leave orVRS refunded service as creditableservice in their plan. Prior creditableservice counts toward vesting,eligibility for retirement and the healthinsurance credit. Only active membersare eligible to purchase prior service.Members also may be eligible topurchase periods of leave without pay.
Purchase of Prior Service:Same as Plan 1. Purchase of Prior Service Defined
Benefit Component:
Same as Plan 1, with the followingexceptions:
- Hybrid Retirement Plan members areineligible for ported service.
Defined Contribution
Component:
Not applicable.
The System issues a publicly available comprehensive annual financial report that includes financial statementsand required supplemental information for VRS. A copy of the most recent report may be obtained from the VRSwebsite at https://www.varetire.org/pdf/publications/2019-annual-report.pdf, or by writing to the System’s ChiefFinancial Officer at P.O. Box 2500 Richmond, VA., 23218-2500.
90

CITY OF VIRGINIA BEACH, VIRGINIANOTES TO FINANCIAL STATEMENTS
JUNE 30, 2020
Employees Covered by Benefit Terms
As of the June 30, 2018 actuarial valuation, the following employees were covered by the benefit terms ofthe pension plan:
School Board
CityNon
ProfessionalInactive Members or Their Beneficiaries Currently ReceivingBenefits 4,145 1,643 Inactive Members:
Vested 842 296 Non-Vested 1,277 834 Long Term Disability 4 6 Active Elsewhere in VRS 828 393
Total Inactive Members 2,951 1,529 Active Members 6,057 2,018 Total 13,153 5,190
Contributions
The contribution requirement for active employees is governed by §51.1-145 of the Code of Virginia, asamended, but may be impacted as a result of funding options provided to political subdivisions and Schooldivisions by the Virginia General Assembly. Employees are required to contribute 5.00% of theircompensation toward their retirement. Prior to July 1, 2012, all or part of the 5.00% member contributionmay have been assumed by the employer. Beginning July 1, 2012 new employees were required to pay the5.00% member contribution. In addition, for existing employees, employers were required to begin makingthe employee pay the 5.00% member contribution. This could be phased in over a period of up to 5 yearsand the employer was required to provide a salary increase equal to the amount of the increase in theemployee-paid member contribution.
The City's contractually required employer contribution rate for the year ended June 30, 2020 was 14.54%of covered employee compensation. This rate was based on an actuarially determined rate from anactuarial valuation as of June 30, 2017. This rate, when combined with employee contributions, wereexpected to finance the costs of benefits earned by employees during the year, with an additional amount tofinance any unfunded accrued liability.
The School Board Professional VRS plan's contractually required employer contribution rate for the yearended June 30, 2020 was 15.68% of covered employee compensation. This rate was based on an actuariallydetermined rate from an actuarial valuation as of June 30, 2017. The actuarially determined rate, whencombined with employee contributions, was expected to finance the costs of benefits earned by employeesduring the year, with an additional amount to finance any unfunded accrued liability. The School Board(Non Professional) VRS pension plan's contractually required contribution rate for the year ended June 30,2019 was 6.73% of annual covered payroll. This rate was based on an actuarially determined rate from anactuarial valuation as of June 30, 2017. This rate, when combined with employee contributions, wereexpected to finance the costs of benefits earned by employees during the year, with an additional amount tofinance any unfunded accrued liability.
91

CITY OF VIRGINIA BEACH, VIRGINIANOTES TO FINANCIAL STATEMENTS
JUNE 30, 2020
Contributions made by the Employer and Employee for the years ended June 30, 2019 and June 30, 2018are listed in the table below:
City School Board - Professional School Board - Non-ProfessionalFiscal Employer Employee Employer Employee Employer EmployeeYear Contributions Contributions Contributions Contributions Contributions Contributions 2020 $ 47,363,487 $ 16,153,428 $ 65,059,000 $ 63,710,000 $ 2,929,000 $ 2,885,000 2019 47,366,085 16,075,182 63,710,358 20,315,803 2,885,329 2,146,633
Net Pension Liability
The City’s net pension liability measured as of June 30, 2019 totaled $417,692,180. The total pensionliability used to calculate the net pension liability was determined by an actuarial valuation performed as ofJune 30, 2018, using updated actuarial assumptions, applied to all periods included in the measurement androlled forward to the measurement date of June 30, 2019.
As of June 30, 2020, the School Board Professional Retirement Plan reported a liability of $657,817,000for its proportionate share of the net pension liability. The net pension liability was measured as of June 30,2019 and the total pension liability used to calculate the net pension liability was determined by an actuarialvaluation as of that date. The School Board's proportion of the net pension liability was based on the SchoolBoard's actuarially determined employer contributions to the pension plan for the year ended June 30, 2019relative to the total actuarially determined employer contributions for all participating employers. At June30, 2019, the School Board’s proportion was 4.99839% as compared to 5.07577% at June 30, 2018. TheSchool Board’s net pension liability for the Non Professional Retirement Plan measured as of June 30, 2019totaled $21,008,000. The total pension liability used to calculate the net pension liability was determined byan actuarial valuation performed as of June 30, 2018, using updated actuarial assumptions, applied to allperiods included in the measurement and rolled forward to the measurement date of June 30, 2019.
Actuarial Assumptions – City General Employees
The total pension liability for general employees in the City's Retirement Plans was based on an actuarialvaluation as of June 30, 2018, using the Entry Age Normal actuarial cost method and the followingassumptions, applied to all periods included in the measurement and rolled forward to the measurementdate of June 30, 2019.
Inflation: 2.5 percentSalary increases, including inflation: 3.5 percent - 5.35 percentInvestment rate of return: 6.75 percent, net of pension plan investment expenses,
including inflation*
* Administrative expenses as a percent of the market value of assets for the last experience study werefound to be approximately 0.06% of the market assets for all of the VRS plans. This would provide anassumed investment return rate for GASB purposes of slightly more than the assumed 6.75%. However,since the difference was minimal, and a more conservative 6.75% investment return assumption provided aprojected plan net position that exceeded the projected benefit payments, the long- term expected rate ofreturn on investments was assumed to be 6.75% to simplify preparation of pension liabilities.
92

CITY OF VIRGINIA BEACH, VIRGINIANOTES TO FINANCIAL STATEMENTS
JUNE 30, 2020
Mortality rates:
Largest 10 - Non-LEOS: 20% of deaths are assumed to be service related.Pre-Retirement:RP-2014 Employee Rates to age 80, Healthy Annuitant Rates at ages 81 and older projected with ScaleBB to 2020; males 95% of rates; females 105% of rates.Post-Retirement:RP-2014 Employee Rates to age 49, Healthy Annuitant Rates at ages 50 and older projected with Scale BBto 2020; males set forward 3 years; females 1.0% increase compounded from ages 70 to 90.Post-Disablement:RP-2014 Disability Mortality Rates projected with Scale BB to 2020; males set forward 2 years, 110% ofrates; females 125% of rates.
All Others (Non 10 Largest) – Non-LEOS: 15% of deaths are assumed to be service related.Pre-Retirement:RP-2014 Employee Rates to age 80, Healthy Annuitant Rates at ages 81 and older projected with ScaleBB to 2020; males 95% of rates; females 105% of rates.Post-Retirement:RP-2014 Employee Rates to age 49, Healthy Annuitant Rates at ages 50 and older projected with Scale BBto 2020; males set forward 3 years; females 1.0% increase compounded from ages 70 to 90.Post-Disablement:RP-2014 Disability Mortality Rates projected with scale BB to 2020; males set forward 2 years; 110% ofrates; females 125% of rates.The actuarial assumptions used in the June 30, 2018 valuation were based on the results of an actuarialexperience study for the period July 1, 2012 through June 30, 2016, except the change in the discount rate,which was based on VRS Board action effective as of July 1, 2019. Changes to the actuarial assumptionsas a result of the experience study and VRS Board action are as follows:
Largest 10-Non-LEOS: Updated mortality rates to a more current mortality table - RP 2014 projected to 2020 Lowered retirement rates at older ages and extended final retirement from 70 to 75 Adjusted withdrawal rates to better fit experience at each year age and service through 9 years of service Lowered disability rates Increased line of duty disability rates from 14% to 20% Decreased discount rate from 7.00% to 6.75%
All Others (Non 10 Largest) – Non-LEOS: Updated mortality rates to a more current mortality table - RP 2014 projected to 2020 Lowered retirement rates at older ages and changed final retirement from 70 to 75 Adjusted withdrawal rates to better fit experience at each year age and service through 9 years of service Lowered disability rates Increased line of duty disability rates from 14% to 15% Decreased discount rate from 7.00% to 6.75%
93

CITY OF VIRGINIA BEACH, VIRGINIANOTES TO FINANCIAL STATEMENTS
JUNE 30, 2020
Actuarial Assumptions – City Public Safety Employees
The total pension liability for Public Safety employees in the City's Retirement Plan was based on anactuarial valuation as of June 30, 2018, using the Entry Age Normal actuarial cost method and thefollowing assumptions, applied to all periods included in the measurement and rolled forward to themeasurement date of June 30, 2019.
Inflation: 2.5 percentSalary increases, including inflation: 3.5 percent - 4.75 percentInvestment rate of return: 6.75 percent, net of pension plan investment expenses,
including inflation*
* Administrative expenses as a percent of the market value of assets for the last experience study werefound to be approximately 0.06% of the market assets for all of the VRS plans. This would provide anassumed investment return rate for GASB purposes of slightly more than the assumed 6.75%. However,since the difference was minimal, and a more conservative 6.75% investment return assumption provided aprojected plan net position that exceeded the projected benefit payments, the long- term expected rate ofreturn on investments was assumed to be 6.75% to simplify preparation of pension liabilities.
Mortality rates:
Largest 10 - LEOS: 70% of deaths are assumed to be service relatedPre-Retirement:RP-2014 Employee Rates to age 80, Healthy Annuitant Rates at ages 81 and older projected with ScaleBB to 2020; males 90% of rates; females set forward 1 year.Post-Retirement:RP-2014 Employee Rates to age 49, Healthy Annuitant Rates at ages 50 and older projected with Scale BBto 2020; males set forward 1 year, 1.0% increase compounded from ages 70 to 90; females set forward 3years.Post-Disablement:RP-2014 Disability Mortality Rates projected with Scale BB to 2020; males set forward 2 years; unisexusing 100% of male.
All Others (Non 10 Largest) – Non-LEOS: 45% of deaths are assumed to be service relatedPre-Retirement:RP-2014 Employee Rates to age 80, Healthy Annuitant Rates at ages 81 and older projected with ScaleBB to 2020; males 90% of rates; females set forward 1 year.Post-Retirement:RP-2014 Employee Rates to age 49, Healthy Annuitant Rates at ages 50 and older projected with Scale BBto 2020; males set forward 1 year, 1.0% increase compounded from ages 70 to 90; females set forward 3years.Post-Disablement:RP-2014 Disability Mortality Rates projected with Scale BB to 2020; males set forward 2 years; unisexusing 100% male.
The actuarial assumptions used in the June 30, 2018 valuation were based on the results of an actuarialexperience study for the period July 1, 2012 through June 30, 2016, except the change in the discount rate,which was based on VRS Board action effective as of July 1, 2019. Changes to the actuarial assumptions asa result of the experience study are as follows:
94

CITY OF VIRGINIA BEACH, VIRGINIANOTES TO FINANCIAL STATEMENTS
JUNE 30, 2020
Largest 10-LEOS: Updated mortality rates to a more current mortality table - RP 2014 projected to 2020 Lowered retirement rates at older ages Adjusted withdrawal rates to better fit experience at each year age and service year Increased disability rates Increased line of duty disability rates from 60% to 70% Decreased discount rate from 7.00% to 6.75%
All Others (Non 10 Largest) – LEOS: Updated mortality rates to a more current mortality table - RP 2014 projected to 2020 Increased retirement age 50 rates and lowered rates at older ages Adjusted withdrawal rates to better fit experience at each year age and service through 9 years of service Adjusted disability rates to better fit experience Decreased line of duty disability rates from 60% to 45% Decreased discount rate from 7.00% to 6.75%
Actuarial Assumptions – School Board
Professional/Teacher Retirement Plan
The total pension liability for the VRS Professional/Teacher Retirement Plan was based on an actuarialvaluation as of June 30, 2018, using the Entry Age Normal actuarial cost method and the followingassumptions, applied to all periods included in the measurement and rolled forward to the measurement dateof June 30, 2019.
Inflation 2.5 percentSalary increases, includingInflation 3.5 percent – 5.95percentInvestment rate of return 6.75 Percent, net of pension plan investment expense,
including inflation*
* Administrative expenses as a percent of the market value of assets for the last experience study were foundto be approximately 0.06% of the market assets for all of the VRS plans. This would provide an assumedinvestment return rate for GASB purposes of slightly more than the assumed 6.75%. However, since thedifference was minimal, and a more conservative 6.75% investment return assumption provided a projectedplan net position that exceeded the projected benefit payments, the long-term expected rate of return oninvestments was assumed to be 6.75% to simplify preparation of pension liabilities.
Mortality rates:
Pre-Retirement:RP-2014 White Collar Employee Rates to age 80, White Collar Healthy Annuitant Rates at ages 81 andolder projected with Scale BB to 2020.Post-Retirement:RP-2014 White Collar Employee Rates to age 49, White Collar Healthy Annuitant Rates at ages 50 andolder projected with Scale BB to 2020; males 1% increase compounded from ages 70 to 90; females setback 3 years with 1.5% increase compounded from ages 65-70 and 2.0% increase compounded from ages75-90.
Post-Disablement:RP-2014 Disability Mortality Rates projected with Scale BB to 2020; 115% of rates for males and females.
95

CITY OF VIRGINIA BEACH, VIRGINIANOTES TO FINANCIAL STATEMENTS
JUNE 30, 2020
The actuarial assumptions used in the June 30, 2018 valuation were based on the results of an actuarialexperience study for the four-year period from July 1, 2012 through June 30, 2016, except the change inthe discount rate, which was based on VRS Board action effective as of July 1, 2019. Changes to theactuarial assumptions as a result of the experience study are as follows:
Updated mortality rates to a more current mortality table - RP-2014 projected to 2020 Lowered retirement rates at older ages and changed final retirement from 70 to 75 Adjusted withdrawal rates to better fit experience at each year age and service through 9 years of service Adjusted disability rates to better match experience No change to salary scale Decrease discount rate from 7.00% to 6.75%
Non Professional Retirement Plan
The total pension liability for Non Professional (Non Teacher) Retirement Plan was based on an actuarialvaluation as of June 30, 2018, using the Entry Age Normal actuarial cost method and the followingassumptions, applied to all periods included in the measurement and rolled forward to the measurement dateof June 30, 2019.
Inflation 2.5 percentSalary increases, including inflation 3.5 percent – 5.35Investment rate of return 6.75 percent, net of pension plan investment expense,
including inflation*
* Administrative expenses as a percent of the market value of assets for the last experience study were foundto be approximately 0.06% of the market assets for all of the VRS plans. This would provide an assumedinvestment return rate for GASB purposes of slightly more than the assumed 6.75%. However, since thedifference was minimal, and a more conservative 6.75% investment return assumption provided a projectedplan net position that exceeded the projected benefit payments, the long-term expected rate of return oninvestments was assumed to be 6.75% to simplify preparation of pension liabilities.
Mortality rates:Largest 10 - 20% of deaths are assumed to be service relatedAll Others (Non 10 Largest) - 15% of deaths are assumend to be service related
Pre-Retirement:RP-2014 Employee Rates to age 80, Healthy Annuitant Rates at ages 81 and older projected with Scale BBto 2020; males 95% of rates; females 105% of rates.Post-Retirement:RP-2014 Employee Rates to age 49, Healthy Annuitant Rates at ages 50 and older projected with Scale BBto 2020; males set forward 3 years; females 1.0% increase compounded from ages 70 to 90.Post-Disablement:RP-2014 Disability Mortality Rates projected with Scale BB to 2020; males set forward 2 years, 110% ofrates; females 125% of rates.
The actuarial assumptions used in the June 30, 2017 valuation were based on the results of an actuarialexperience study for the period from July 1, 2012 through June 30, 2017. Changes to the actuarialassumptions as a result of the experience study are as follows:
• Update mortality rates to a more current mortality table - RP-2014 projected to 2020• Lowered retirement rates oat older ages and extended final retirement age from 70 to 75• Adjusted termination rates to better fit experience at each age and service year
96

CITY OF VIRGINIA BEACH, VIRGINIANOTES TO FINANCIAL STATEMENTS
JUNE 30, 2020
• Lowered disability rates
Long-Term Expected Rate of Return
The long-term expected rate of return on pension system investments was determined using a log-normaldistribution analysis in which best-estimate ranges of expected future real rates of return (expected returns,net of pension system investment expense and inflation) are developed for each major asset class. Theseranges are combined to produce the long-term expected rate of return by weighting the expected future realrates of return by the target asset allocation percentage and by adding expected inflation. The target assetallocation and best estimate of arithmetic real rates of return for each major asset class are summarized inthe following table:
Arithmetic Weighted AverageLong-Term Long-Term
Target Expected ExpectedAsset Class (Strategy) Allocation Rate of Return Rate of Return*
Public Equity 34.00% 5.61% 1.91%Fixed Income 15.00% 0.88% 0.13%Credit Strategies 14.00% 5.13% 0.72%Real Assets 14.00% 5.27% 0.74%Private Equity 14.00% 8.77% 1.23%MAPS - Multi-Asset PublicStrategies 6.00% 3.52% 0.21%PIP - Private Investment Partnership 3.00% 6.29% 0.19%Total 100.00% 5.13%
Inflation 2.50%Expected arithmetic nominal return* 7.63%
* The above allocation provides a one-year return of 7.63%. However, one-year returns do not take intoaccount the volatility present in each of the asset classes. In setting the long-term expected return for thesystem, stochastic projections are employed to model future returns under various economic conditions.The results provide a range of returns over various time periods that ultimately provide a median return of7.11%, including expected inflation of 2.50%. The VRS Board elected a long-trem rate of 6.75% which isroughly at the 40th percentile of expected long-term results of the VRS fund asset allocation.
Discount Rate
The discount rate used to measure the total pension liability was 6.75%. The projection of cash flows usedto determine the discount rate assumed that member contributions will be made per the VRS Statutes andthe employer contributions will be made in accordance with the VRS funding policy at rates equal to thedifference between actuarially determined contribution rates adopted by the VRS Board of Trustees and themember rate. Through the fiscal year ending June 30, 2020, the rate contributed by the City and SchoolBoard’s Retirement Plans will be subject to the portion of the VRS Board-certified rates that are funded bythe Virginia General Assembly. From July 1, 2020 on, participating employers are assumed to contribute100% of the actuarially determined contribution rates. Based on those assumptions, the pension plan’sfiduciary net position was projected to be available to make all projected future benefit payments of currentactive and inactive employees. Therefore the long-term expected rate of return was applied to all periods ofprojected benefit payments to determine the total pension liability.
97

CITY OF VIRGINIA BEACH, VIRGINIANOTES TO FINANCIAL STATEMENTS
JUNE 30, 2020
Changes in Net Pension Liability
City Increase/(Decrease)
Total PensionPlan Fiduciary
Net Net PensionLiability Position Liability
(a) (b) (a) - (b)Balances at June 30, 2018 $ 2,020,209,232 $ 1,672,661,646 $ 347,547,586 Changes for the Year: Service Cost 39,607,023 - 39,607,023 Interest 137,584,382 - 137,584,382
Changes in assumptions 58,968,730 - 58,968,730 Difference between expected and actual experience 6,189,119 - 6,189,119 Contribution - Employer - 47,363,487 (47,363,487) Contribution - Employee - 16,153,428 (16,153,428) Net Investment Income - 109,869,540 (109,869,540) Benefit payments, including refunds of Employee Contributions (109,436,121) (109,436,121) - Administrative Expense - (1,110,715) 1,110,715 Other Changes - (71,080) 71,080 Net Changes 132,913,133 62,768,539 70,144,594 Balances at June 30, 2019 $ 2,153,122,365 $ 1,735,430,185 $ 417,692,180
School Board Non Professional Increase/(Decrease)
Total PensionPlan Fiduciary
Net Net PensionLiability Position Liability
(a) (b) (a) - (b)Balances at June 30, 2018 $ 226,914,559 $ 214,623,616 $ 12,290,943 Changes for the Year: Service Cost 3,788,974 - 3,788,974 Interest 15,432,954 - 15,432,954
Changes in assumptions 6,306,405 - 6,306,405 Difference between expected and actual experience 2,127,992 - 2,127,992 Contribution - Employer - 2,880,916 (2,880,916) Contribution - Employee - 2,161,296 (2,161,296) Net Investment Income - 14,049,158 (14,049,158) Benefit payments, including refunds of Employee Contributions (12,468,334) (12,468,334) - Refunds of contributions (419,254) (416,254) Administrative Expense - (143,574) 143,574 Other Changes - (8,810) 8,810 Net Changes 14,768,737 6,054,398 8,717,339 Balances at June 30, 2019 $ 241,683,296 $ 220,678,014 $ 21,008,282
98

CITY OF VIRGINIA BEACH, VIRGINIANOTES TO FINANCIAL STATEMENTS
JUNE 30, 2020
Sensitivity of the Net Pension Liability to Changes in the Discount Rate
The following presents the net pension liability for the City, School Board Non Professional and SchoolBoard's proportional share for the Professional/Teacher Retirement Plans, each using the discount rate of6.75%, as well as what the net pension liability would be if it were calculated using a discount rate that isone percentage point lower (5.75%) or one percentage point higher (7.75%) than the current rate:
1% Current 1%Decrease Discount Increase(5.75)% Rate (6.75%) (7.75)%
City's Net Pension Liability $ 683,769,350 $ 417,692,180 $ 204,473,984 School Board Non Professional Net PensionLiability $ 49,044,000 $ 21,008,000 $ (1,551,000)School Board's Proportionate Share of the NetPension Liability for the VRSProfessional/Teacher Retirement Plan $ 990,300,000 $ 657,817,000 $ 382,915,000
Pension Expense and Deferred Outflows of Resources and Deferred Inflows of Resources Related toPensions
For the year ended June 30, 2020, the City recognized pension expense of $69,419,966. At June 30, 2020,the City reported deferred outflows of resources and deferred inflows of resources related to pensions fromthe following sources:
CityDeferred Outflows Deferred Inflows
of Resources of Resources
Differences between expected and actual experience $ 6,859,836 $ - Changes of assumptions 46,921,034 - Net difference between projected and actual earnings on plan investments - 14,455,750 Employer contributions subsequent to the measurement date 48,251,362 - Total $ 102,032,232 $ 14,455,750
The $48,251,362 reported as deferred outflows of resources related to pensions resulting from the City'scontributions subsequent to the measurement date will be recognized as a reduction of the Net PensionLiability in the fiscal year ending June 30, 2021. Other amounts reported as deferred outflows of resourcesand deferred inflows of resources related to pensions will be recognized in pension expense in futurereporting periods as follows:
Year Ended June 30:2021 $ 18,869,094 2022 1,515,947 2023 15,623,026 2024 3,317,053 2025 - Thereafter -
99

CITY OF VIRGINIA BEACH, VIRGINIANOTES TO FINANCIAL STATEMENTS
JUNE 30, 2020
School Board Professional/Teachers Pension Expense and Deferred Outflows of Resources andDeferred Inflows of Resources Related to Pensions
For the year ended June 30, 2020, the School Board recognize pension expense of $64,181,000 for theProfessional/Teacher Retirement Plan. At June 30, 2020, the City reported deferred outflows of resourcesand deferred inflows of resources related to pensions from the following sources:
School Board ProfessionalDeferred Outflows
of ResourcesDeferred Inflows
of Resources
Differences between expected and actual experience $ - $ 42,123,000 Change of assumptions 65,139,000 - Net difference between projected and actual earnings on plan investments - 14,444,000 Changes in proportion and differences between employer contributions and porportionate share of contributions 365,000 13,872,000 Employer contributions subsequent to the Measurement Date 65,059,000 Total $ 130,563,000 $ 70,439,000
The $65,059,000 reported as deferred outflows of resources related to pensions resulting from the contributions by the School Board for the Professional/Teachers plan subsequent to the measurement datewill be recognized as a reduction of the Net Pension Liability in the fiscal year ending June 30, 2021. Otheramounts reported as deferred outflows of resources and deferred inflows of resources related to pensionswill be recognized in pension expense in future reporting periods as follows:
Year Ended June 30:2021 $ (4,520,000)2022 (16,679,000)2023 2,935,000 2024 8,888,000 2025 4,441,000
In addition, for the year ended June 30, 2020, the School Board recognized pension expense was$6,675,000 for the Non Professional Retirement Plan. At June 30, 2020, the School Board Non ProfessionalPlan reported deferred outflows of resources and deferred inflows of resources related to pensions from thefollowing sources:
School Board Non ProfessionalDeferred Outflows
of ResourcesDeferred Inflows of
Resources
Differences between expected and actual experience $ 1,290,000 $ 28,000 Changes in Assumptions 3,823,000 - Net difference between projected and actual earnings on planinvestments 2,568,000 4,420,000 Employer contributions subsequent to the measurement date 2,929,000 - Total $ 10,610,000 $ 4,448,000
100

CITY OF VIRGINIA BEACH, VIRGINIANOTES TO FINANCIAL STATEMENTS
JUNE 30, 2020
The $2,929,000 reported as deferred outflows of resources related to pensions resulting from thecontributions by the School Board Non Professional plan made subsequent to the measurement date will berecognized as a reduction of the Net Pension Liability in the fiscal year ending June 30, 2020. Otheramounts reported as deferred outflows of resources and deferred inflows of resources related to pensionswill be recognized in pension expense in future reporting periods as follows:
Year Ended June 30:2021 $ 3,321,000 2022 (190,000)2023 (37,000)2024 139,000 2025 -
B. Sheriff’s Supplemental Retirement Plan
1. Description of the Plan
The Sheriff’s Supplemental Plan is a defined contribution plan that was established by the City Councilof Virginia Beach, Virginia (“City Council”) in 1995 in accordance with Internal Revenue CodeSection 401. The Plan sponsor and participating employer is the City of Virginia Beach Sheriff’s Office(“Employer”). The Plan is available to all employees of the City of Virginia Beach Sheriff’s Office,who have completed one year of service, as defined by the Plan.
The City Code of Virginia Beach, Virginia establishes a Deferred Compensation Board (“Board”) tosupervise, administer and implement the Plan. The Board has full power and authority to adopt rulesand regulations for the administration of the Plan. The Board also contracts with providers to managethe investment of plan assets and is responsible for selecting the Plan investment options. Planprovisions and contribution requirements are established and may be amended by the City Council.
The Deferred Compensation Board and the City Council and School Board of the City of VirginiaBeach, Virginia, the Plan Sponsor, voted to offer its employees the Commonwealth of Virginia CashMatch Plan (COV). In January 2020, Sheriff's existing plan was transferred to COV and continue forthe benefit of employees of the City of Virginia Beach.
The Virginia Cash Match Plan provides an opportunity for the City of Virginia Beach to make adiscretionary contribution on behalf of employees. The investment options for the plan are organizedinto three pathways to make it easier for participants to implment investment decisions according totheir knowlege of investments and investment style. The Do-It-For-Me Path includes the target dateportfolios for participants who prefer a pre-mixed portfolio that is already diversified. TheHelp-Me-Do-It Path includes a carefully selected menu of ten funds for participants who prefer to takea more active role in investing and want to construct a portfolio that addresses their invidual needs. TheDo-It-Myself Path includes a self-directed brokerage account (SDBA) for those who believe that areskilled and knowledgeable about investments. Investments for the SDBA include mutual funds,exchange-traded funds (ETFs) and individaul securities.
Plan financials for the year ended June 30, 2020 are presented in accordance with U.S. GAAP accrualaccounting.
101

CITY OF VIRGINIA BEACH, VIRGINIANOTES TO FINANCIAL STATEMENTS
JUNE 30, 2020
As of June 30, 2020, the composition of participants was as follows:
Employed participants with ending balances 304 Terminated participants with ending balances 93 Participants with zero ending balances 23
420
Participants may not contribute to the Plan. The Employer may contribute discretionary amounts to bedetermined by the City of Virginia Beach Sheriff’s Office annually. The employer did not make anycontributions during the plan year end. Employer contributions to the Plan, and any earnings theygenerate, are vested as follows:
Years of Service Vested Percentage
0- 5 years 0%
5 years of more 100%
Participants may withdraw from their accounts during a qualifying distribution event. Qualifyingdistribution events are: retirement, permanent disability, termination from employment, attainment ofage 59½, and death. Ordinary income tax will apply to each withdrawal. Withdrawals received prior toage 59½ may also be assessed a 10% early withdrawal federal tax penalty.
Participant Accounts – Each participant’s account is credited with an allocation of the City’sdiscretionary contributions as well as Plan earnings. Participant accounts are charged with an allocationof administrative expenses that are paid by the Plan. Allocations are based on participantcompensation, account balances, or specific participant transactions as defined. The benefit to whichthe participant is entitled is the benefit that can be provided from the participant’s vested account.
Payment of Benefits – On termination of service due to death, disability, or retirement, a participantmay elect to receive either a lump-sum amount equal to the value of the participant’s vested interest inhis or her account, or annual installments not to exceed the lifetime of the payee. For termination ofservice for other reasons, a participant may receive the value of the vested interest in his or her accountas a lump-sum distribution.
Investment Options – Participants direct the investment of their accounts into various investmentoptions offered by the Plan. The Plan’s investments are stated at fair value (except for fullybenefit-responsive investment contracts, which are valued at contract value). Fair value is the pricereceived to sell an asset or paid to transfer a liability in an orderly transaction between marketparticipants at the measurement date. Contract value is the relevant measure for the portion of netassets available for benefits attributable to fully benefit-responsive investment contracts becausecontract value is the amount participants normally would receive if they were to initiate permittedtransactions under the terms of the Plan.
Forfeitures - During the year ended June 30, 2019, there were no forfeited non-vested accounts.Forfeitures of the Plan's contribution are reallocated to eligible participants.
2. Summary of Significant Accounting Policies
Basis of Accounting – The Plan’s financial statements are prepared in accordance with accountingprinciples generally accepted in the United States of America (GAAP) using the financial reportingframework established by the Governmental Accounting Standards Board (“GASB”).
102

CITY OF VIRGINIA BEACH, VIRGINIANOTES TO FINANCIAL STATEMENTS
JUNE 30, 2020
Use of Estimates – The preparation of financial statements in conformity with generally acceptedaccounting principles in the United States requires management to make estimates and assumptions thataffect certain reported amounts and disclosures. Accordingly, actual results could differ from thoseestimates.
Investments Valuation and Income Recognition – Investments are reported at fair value. Planmanagement determines the Plan’s valuation policies utilizing information provided by the custodian.
Purchases and sales of securities are recorded on a trade-date basis. Interest income is recorded on theaccrual basis. Dividends are recorded on the ex-dividend date. Net depreciation includes the Plan’sgains and losses on investments bought and sold as well as held during the year.
Contributions – Contributions are recognized in the year when due in accordance with the terms of thePlan.
Benefit Payments – Benefit payments are recorded when paid.
Administrative Expenses – Administrative expenses are recorded when incurred. Certain administrativefunctions are performed by the City and are not reflected in these statements.
3. Investments
The Board has adopted an investment policy that sets forth the goals and objectives of the investmentoptions available to the Plan. The Board chooses which investment options will be available under thePlan and monitors the investment options’ compliance to the investment policy. The Plan’s authorizedinvestments allows for funds within fifteen major asset classes defined by either investment objective orrisk category.
The Plan had the following investments as of June 30, 2020:
Mutual funds, at fair value:Bond Fund $ 268,134 Global Real Estate Fund 13,188 Inflation-Protected Bond Fund 2,076 International Stock Fund 133,996 Retirement Portofolio 127,947 Small/Mid-Cap Stock Fund 288,617 Stable Value Fund 835,333 Stock Fund 958,781 Traget Date 2025 Portfolio 97,560 Traget Date 2030 Portfolio 139,820 Traget Date 2035 Portfolio 114,461 Traget Date 2040 Portfolio 156,026 Traget Date 2045 Portfolio 62,781 Traget Date 2050 Portfolio 20,781 Traget Date 2055 Portfolio 45
3,219,546
Custodial Credit Risk – This is the risk that in the event of the failure of the counterparty, the Plan willnot be able to recover the value of the investment of collateral securities that are in the possession of anoutside party. The Plan limits its exposure to custodial credit risk by maintaining its investments incustodial accounts. Wells Fargo Bank, N.A. serves as custodian to the Plan. The Sheriff's Plan is
103

CITY OF VIRGINIA BEACH, VIRGINIANOTES TO FINANCIAL STATEMENTS
JUNE 30, 2020
self-trusted and thus does not have a Plan custodian. Securities that exist in book entry form are held intrust by the custodian in the name of the Plan.
4. Fair Value Measurements
The Plan categorizes its fair value measurements within the fair value hierarchy established bygenerally accepted accounting principles. The hierarchy is based on the valuation inputs used tomeasure the fair value of the asset. Level 1 inputs are quoted prices in active markets for identicalassets; Level 2 inputs are significant other observable inputs; Level 3 inputs are significantunobservable inputs. The Plan has the following recurring fair value measurements as of June 30, 2019:
Assets at Fair Value as of June 30, 2020Level 1 Level 2 Level 3 Total
Mutual Funds $ 3,219,546 $ - $ - $ 3,219,546 Total $ 3,219,546 $ - $ - $ 3,219,546
A stand-alone financial report can be obtained by contacting Sheriff Ken Stolle, City of Virginia BeachSheriff’s Office, 2501 James Madison Avenue, Virginia Beach, VA 23456.
104

CITY OF VIRGINIA BEACH, VIRGINIANOTES TO FINANCIAL STATEMENTS
JUNE 30, 2020
14. OTHER POSTEMPLOYMENT BENEFITS
A. Single-Employer, Defined Benefit Plan
Plan Description
The City and School Board Other Postemployment Benefit Plans (OPEB) are each a single-employer, definedbenefit plan, administered by the City and School Board in accordance with State and City Statutes. Section15.2-1500 of the Virginia State Code provides that every locality shall provide for the governmental functionsof the locality, including employment of the officers and other employees. In connection with this employment,the City has established certain plans to provide OPEB other than pensions as defined in Section 15.2-1545 ofthe Virginia Code to retirees and their spouses and eligible dependents.
In accordance with Article 8, Chapter 15, Subtitled II of Title 15.2 of the Virginia Code, the City and SchoolBoard have elected to establish a trust for the purpose of accumulating and investing assets to fund OPEB. Inaccordance with the election, the City and School Board have joined the Virginia Pooled OPEB Trust Fund(Trust), which was established by the Virginia Municipal League and the Virginia Association of Counties in2008 for the purpose of accumulating and investing assets to fund OPEB other than pensions for counties, cities,towns, school divisions and other authorized political subdivisions of the Commonwealth of Virginia. ThePooled OPEB Trust issues a publicly available CAFR that includes financial statements are requiredsupplemental information for the OPEB Trust Fund. A copy of the most recent report may be obtained from theVML VACo website at http://valocalfinace.org/opeb.
The Trust’s Board of Trustees has fiduciary responsibility for the investment of monies and administration ofthe Trust pursuant to the Trust Agreement. The Board of Trustees is composed of nine members. Trustees aremembers of Local Finance Boards of participating employers and are elected for staggered three-year terms bythe participants in the Trust. In accordance with Section 15.2-1547 of the Virginia Code, City Councilappointed the City’s Deferred Compensation Board Trust as the OPEB’s Local Finance Board to serve as thetrustee of the City and School Board with respect to the OPEB trust. The board includes City employees, anappointee from City Council, a member of the Sheriff’s Office, a member of the School Board, and the Schools’Chief Financial Officer. The trust does not administer the retiree health benefits of each participating employer. Deposits to this trust are irrevocable and are held solely for the payment of OPEB benefits for the City andSchool Board.
Plan Membership
The membership as of January 1, 2020 includes:
CitySchoolBoard
Active Participants 5,999 10,312 Retirees and Surviving Spouses 727 618 Spouses of Current Retirees 89 53 Total 6,815 10,983
Benefits Provided
The City and School Board provide health insurance benefits for their retirees. These benefits are providedthrough a self-insured program. Employees that retire under VRS guidelines with at least 25 years of servicewith the City and/or School Board or City employees with 5 years or more of service with a work related
105

CITY OF VIRGINIA BEACH, VIRGINIANOTES TO FINANCIAL STATEMENTS
JUNE 30, 2020
disability compensable under the Workers’ Compensation Act are eligible to health insurance coverage. Thisbenefit is payable until the retiree becomes eligible for Medicare.
Contributions
Contribution requirements of the City, School Board and plan members are established and may be amended bythe respective legislative bodies. The required contributions were actuarially determined and are based uponprojected pay as you go financing requirements with an additional amount to prefund benefits. For the periodending June 30, 2020 the actuarially determined contribution was set at $4,571,500 for the City and at$5,704,500 for the School Board. Plan members from each organization contributed $3,075, $2,103 and $1,459for the POS Premier, POS Standard, and POS Basic plans, respectively, annually for retiree-only point ofservice coverage. City and School Board retirees with coverage for their spouses contributed $10,284, $8,019and $6,519 for the POS Premier, POS Standard, and POS basic plans, respectively, annually until Medicareeligibility. The City and School Board have determined that all current employees and retirees shall contributeto the cost of their health care coverage and no level of benefit shall be provided free of charge. Rates arecalculated by an actuary with the City and School Board health care consultant and finalized by the BenefitsExecutive Committee, comprised of City and School Board executive leadership.
Investments Policy, Target Allocation, and Long-Term Expected Rate of Return
The OPEB plan’s policy in regard to the allocation of invested assets is established and may be amended by theVirginia Pooled OPEB Trust Fund Board of Trustees. Plan assets are managed on a total return basis with along-term objective of achieving and maintaining a fully funded status for the benefits provided through theOPEB plan.
The best-estimate range for the long-term expected rate of return is determined by adding expected inflation toexpected long-term real returns and reflecting expected volatility and correlation. The capital marketassumptions are per Milliman’s investment consulting practice as of June 30, 2020.
The following is for the City and School Board:
Expected ExpectedArithmetic Geometric
Target Real Rate of Real Rate ofAsset Class Allocation Return ReturnCore Fixed Income 21.00% 1.56% 1.47%Large Cap US Equities 26.00% 4.33% 3.23%Small Cap US Equities 10.00% 5.64% 3.82%Global Equities 5.00% 5.27% 4.01%Developed Foreign Equities 13.00% 5.94% 4.45%Emerging Market Equities 5.00% 8.03% 5.28%Hedge Funds/Absolute Return 10.00% 2.88% 2.40%Real Estate (REITS) 7.00% 3.84% 3.13%Commodities 3.00% 2.83% 1.27%
Assumed Inflation 2.60% 2.60%
Portfolio Real Mean Return 4.10% 3.53%
Portfolio Nominal Mean Return 6.70% 6.22%
Portfolio Standard Deviation 10.53%
Long-Term Expected Rate of Return 6.50%
106

CITY OF VIRGINIA BEACH, VIRGINIANOTES TO FINANCIAL STATEMENTS
JUNE 30, 2020
Net OPEB Liability
The City’s Net OPEB Liability was measured as of June 30, 2020 and totaled $38,578,877. The SchoolBoard’s Net OPEB Liability was measured as of June 30, 2020 and totaled $48,976,423. The City and SchoolBoard’s Total OPEB Liability was determined by an actuarial valuation as of the valuation date, calculatedbased of the discount rate and actuarial assumptions below, and projected forward to the measurement date. There have been no significant changes between the valuation date and the fiscal year end.
Changes in Net OPEB Liability
CityTotal OPEB Fiduciary Net Net OPEB
Liability Position Liability(a) (b) (a) - (b)
Balances as of June 30, 2019 $ 101,514,170 $ 44,147,786 $ 57,366,384 Changes for the year:
Service Cost 2,124,026 - 2,124,026 Interest on Total OPEB Liability 6,702,911 - 6,702,911 Effect of Plan Changes - - - Effect of Economic/Demographic Gains or Losses 2,935,229 - 2,935,229 Effect of Assumptions Changes or Inputs (22,223,261) - (22,223,261)Benefit Payments (7,013,877) (7,013,877) - Emoployer Contributions - 7,013,877 (7,013,877)Member Contributions - - - Net Investment Income - 1,349,790 (1,349,790)Administrative Expenses - (37,255) 37,255
Balances as of June 30, 2020 $ 84,039,198 $ 45,460,321 $ 38,578,877
School BoardTotal OPEB Fiduciary Net Net OPEB
Liability Position Liability(a) (b) (a) - (b)
Balances as of June 30, 2019 $ 99,814,583 $ 31,768,081 68,046,502 Changes for the year:
Service Cost 2,566,620 - 2,566,620 Interest on Total OPEB Liability 6,616,759 - 6,616,759 Effect of Plan Changes - - - Effect of Economic/Demographic Gains or Losses 2,340,909 - 2,340,909 Effect of Assumptions Changes or Inputs (22,674,032) - (22,674,032)Benefit Payments (5,945,243) (5,945,243) - Employer Contributions - 6,950,743 (6,950,743)Member Contributions - - - Net Investment Income - 997,100 (997,100)Administrative Expenses - (27,508) 27,508
Balances as of June 30, 2020 $ 82,719,596 $ 33,743,173 $ 48,976,423
107

CITY OF VIRGINIA BEACH, VIRGINIANOTES TO FINANCIAL STATEMENTS
JUNE 30, 2020
Sensitivity Analysis
The following presents the Net OPEB Liability of the City and the School Board calculated using the discountrate of 6.50%, as well as what the City and School Board’s Net OPEB Liability would be if it were calculatedusing a discount rate that is 1 percentage point lower or 1 percentage point higher than the current rates.
1% Decrease Discount Rate 1% Increase5.50% 6.50% 7.50%
City's Net OPEB Liability $ 45,089,734 $ 38,578,877 $ 32,682,163
School Board's Net OPEB Liability $ 55,266,135 $ 48,976,423 $ 43,170,035
The following presents the Net OPEB Liability of the City and the School Board using the current healthcarecost trend rates, as well as what the City and School Board’s Net OPEB Liability would be if it were calculatedusing healthcare cost trend rates that are 1 percentage point lower or 1 percentage point higher than the currentrates.
Current Trend1% Decrease Rate 1% Increase
City's Net OPEB Liability $ 31,397,828 $ 38,578,877 $ 46,860,535
School Board's Net OPEB Liability $ 41,390,840 $ 48,976,423 $ 57,733,653
OPEB Expense and Deferred Outflows of Resources and Deferred Inflows of Resources Related to OPEB
For the year ended June 30, 2020 the City’s and School Board’s recognized OPEB expenses was $5,812,113and $8,167,925 respectively.
At June 30, 2020 the City reported deferred outflows of resources and deferred inflows of resources related toOPEB from the following sources:
Deferred Outflow Deferred Inflow of Resources of Resources
Differences between Expected and Actual Experience $ 2,515,911 2,180,243 Changes in Assumptions 11,750,192 19,048,509 Net Difference between Projected and Actual Earnings 1,425,066 -
Total $ 15,691,169 $ 21,228,752
Amounts recognized as deferred outflows of resources and deferred inflows of resources related to OPEB willbe recognized in OPEB expense as follows:
Fiscal Year Ended June 30:
2021 $ (183,665) 2022 (183,666) 2023 15,178 2024 (187,441) 2025 (2,242,561)
Thereafter (2,755,428)
108

CITY OF VIRGINIA BEACH, VIRGINIANOTES TO FINANCIAL STATEMENTS
JUNE 30, 2020
At June 30, 2020 the School Board reported deferred outflows of resources and deferred inflows of resourcesrelated to OPEB from the following sources:
Deferred Outflows Deferred Inflowsof Resources of Resources
Differences between Expected and Actual Experience $ 2,849,389 $ - Changes in Assumptions 14,528,024 19,609,974 Net Difference between Projected and ActualEarnings 1,046,519 -
Total $ 18,423,932 $ 19,609,974
Amounts recognized as deferred outflows of resources and deferred inflows of resources related to OPEB willbe recognized in OPEB expense as follows:
Fiscal YearEnded June 30:
2021 $ 1,053,248 2022 1,053,247 2023 1,188,332 2024 1,042,532 2025 (1,676,592)
Thereafter (3,846,809)
Discount Rate
The discount rate used to measure the total OPEB liability was 6.50%. The plan’s Fiduciary Net Position wasprojected to be available to make all projected future benefit payments of current active and inactive employees. Therefore, the discount rate for calculating the Total OPEB Liability is equal to the long-term expected rate ofreturn.
Actuarial Assumptions
The demographic assumptions used are predominately consistent with those used in the City’s June 30, 2018Virginia Retirement System (VRS) valuation. The following represent the summary of information included inthe January 1, 2020 actuarial valuation prepared for Milliman, Inc. for the period:
Valuation Date: January 1, 2020Measurement Date: June 30, 2020Inflation: 2.50%Actuarial Cost Method: Projected Unit CreditSalary Increases Per Year of Service (Including Inflation):
General Employees with 1 to 19 years ofservice, the increases range from 5.35% to3.65% and for those with 20 or more years ofservice the increase is 3.50%.
Healthcare Cost Trend Rate Law Officers with 1 to 19 years of service, the increases range from 4.75% to 4.00% and forthose with 20 or more years of service theincrease is 3.50%.
Mortality Rates Based on the RP-2014 Employee MortalityRates for males and females, as appropriate,with adjustement for mortality improvements
109

CITY OF VIRGINIA BEACH, VIRGINIANOTES TO FINANCIAL STATEMENTS
JUNE 30, 2020
based on scale BB to 2020.
B. Multiple Employer, Cost Sharing Defined Benefit Plans
In addition, The City and School Board participates in a number Other Postemployment Benefit Plans each ofwhich are multiple-employer, cost-sharing plans that are administered by the Virginia Retirement System (VRS). These plans include; Group Life Insurance, Line of Duty Act Program, and Virginia Local Disability Program.Information pertaining to each of this plans is included below.
Plan Descriptions
Group Life Insurance
The Group Life Insurance (GLI) Program was established pursuant to §51.1-500 et seq. of the Code of Virginia,as amended, and which provides the authority under which benefit terms are established or may be amended. The GLI is a defined benefit plan that provides a basic group life insurance benefit for employees ofparticipating employers. All full-time, salaried permanent employees of the City and School Board areautomatically covered by the VRS GLI Program upon employment. This plan is administered by VRS, alongwith pension and other OPEB plans, for public employer groups in the Commonwealth of Virginia. In additionto the Basic GLI benefit, members are also eligible to elect additional coverage for themselves as well as aspouse or dependent children through the Optional Group Life Insurance Program. For members who elect theoptional life insurance coverage, the insurer bills employees directly for the premiums. Employers deduct thesepremiums from members’ paychecks and pay the premiums to the insurer. Since this is a separate and fullyinsured program, it is not included as part of the GLI Program OPEB. Specific information for the GLIProgram, including eligibility, coverage and benefits is set out in the table on the following page.
110

CITY OF VIRGINIA BEACH, VIRGINIANOTES TO FINANCIAL STATEMENTS
JUNE 30, 2020
GROUP LIFE INSURANCE PROGRAM PLAN PROVISIONSEligible EmployeesThe Group Life Insurance (GLI) Program was established July 1, 1960, for state employees, teachers andemployees of political subdivisions that elect the program. Basic group life insurance coverage is automaticupon employment. Coverage end for employees who leave their position before retirement eligibility or whotake a refund of their member contributions and accrued interest.
Benefit AmountsThe benefits payable under the GLI Program have several components
Natural Death Benefit The natural death benefit is equal to the employee's covered compensation rounded to the nearest highestthousand and then doubled
Accidental Death BenefitThe accidental death benefit is double the natural death benefit.
Other Benefit ProvisionsIn addition to the basic natural and accidental death benefit, the program provides additional benefits underspecific circumstance. These Include:
Accidental dismemberment benefitSafety Belt benefitRepatriation benefitFelonious assault benefitAccelerated death benefit option
Reduction in Benefit AmountsThe benefit amounts provided to members covered under the Group Life Insurance Program are subject to areduction factor. The benefit amount reduces by 25% on January 1 following one calendar year of separation. The benefit amount reduces by an additional 25% on each subsequent January 1 until it reaches 25% of itsoriginal value.
Minimum Benefit Amount and Cost-of-Living Adjustment (COLA)For covered members with at least 30 years of creditable service, there is a minimum benefit payable under theGroup Life Insurance Program. The minimum benefit was set at $8,000 by statute in 2015. This will beincreased annually based on the VRS Plan 2 cost-of-living adjustment. The minimum benefit adjusted for theCOLA was $8,463 as of June 30, 2020.
111

CITY OF VIRGINIA BEACH, VIRGINIANOTES TO FINANCIAL STATEMENTS
JUNE 30, 2020
Line of Duty Act Program
The Line of Duty Act (LODA) Program was established pursuant to §9.1-400 et seq. of the Code of Virginia, asamended, and which provides the authority under which benefit terms are established or may be amended. TheLODA Program provides death and health insurance benefits to eligible state and local government employees,including volunteers, who die or become disabled as a result of the performance of their duties as a public safetyofficer. All paid employees and volunteers in hazardous duty positions in the City are automatically covered by theLine of Duty Act Program. As required by statute, VRS is responsible for managing the assets of the program. Participating employers made contributions to the program beginning in FY 2012. The employer contributions aredetermined by VRS’s actuary using anticipating program cost and the number of covered individuals associated withall participating employers. Specific information for the Line of Duty Act Program, including eligibility, coverageand benefits is set out in the table below.
LINE OF DUTY ACT PROGRAM PLAN PROVISIONSEligible EmployeesThe eligible employees of the Line and Duty Act Program (LODA) are paid employees and volunteers inhazardous duty positions in Virginia localities and hazardous duty employees who are covered under theVirginia Retirement System (VRS), the State Police Officers’ Retirement System (SPORS), or the VirginiaLaw Officers’ Retirement System (VaLORS).
Benefit AmountsThe LODA Program provides death and health insurances for eligible individuals:
Death Benefit - The LODAProgram death benefit is a one-time payment made to the beneficiary orbeneficiaries of a covered individual. Amounts vary as follows:
• $100,000 when a death occurs as the direct or proximate result of performing duty as of January 1,2006, or after.• $25,000 when the cause of death is attributed to one of the applicable presumptions and occurredearlier than five years after the retirement date.• An additional $20,000 benefit is payable when certain members of the National Guard and USmilitary reserves are killed in action in any armed conflict on or after October 7, 2001.
Health Insurance - The LODA Program provides health insurance for eligible individuals:• Prior to July 1, 2017, these benefits were managed through various employer plans and maintainedthe benefits that existed prior to the employee’s death or disability. These premiums were reimbursed tothe employer by the LODA program.• Beginning July 1, 2017, the health insurance benefits are managed through the Virginia Departmentof Human Resources Management. The health benefits are modeled after the State Employee Healthbenefits program plans and provide consistent, premium-free continued health plan coverage forLODA-eligible disabled individuals, survivors and family members. Individuals receiving the healthinsurance benefits must continue to meet eligibility requirements as defined by the Line of Duty Act
112

CITY OF VIRGINIA BEACH, VIRGINIANOTES TO FINANCIAL STATEMENTS
JUNE 30, 2020
Virginia Local Disability Program
All full-time salaried general employees; including local law enforcement officers, firefighters, or emergencymedical technicians of political subdivisions who do not provide enhanced hazardous duty benefits; who are in theVRS Hybrid Retirement Plan benefit structure and whose employer has not elected to opt out of the VRS-sponsoredprogram are automatically covered by the VRS Political Subdivision Employee and Teacher Employee VirginiaLocal Disability Program. This plan is administered by VRS, along with pension and other OPEB plans, for publicemployer groups in the Commonwealth of Virginia. Political subdivisions are required by Title 51.1 of the Code ofVirginia, as amended to provide short-term and long-term disability benefits for their Hybrid employees eitherthrough a local plan or through the Virginia Local Disability Program. Specific information for the VLDP, includingeligibility, coverage and benefits is set out in the table below.
POLITICAL SUBDIVISION EMPLOYEE AND TEACHER EMPLOYEE VIRGINIA LOCALDISABILITY PROGRAM (VLDP) PLAN PROVISIONS
Eligible EmployeesThe Teacher Employee and Political Subdivision Employee Virginia Local Disability Program wasimplemented January 1, 2014 to provide short-term and long-term disability benefits for non-work-related andwork-related disabilities for employees with Hybrid retirement benefits. Eligible employees are enrolledautomatically upon employment, unless their employer has elected to provide comparable coverage. Theyinclude:Teachers and other full-time permanent (professional) salaried employees of public school divisions coveredunder VRS.Full-time general employees; including local law enforcement officers, firefighters, or emergency medicaltechnicians who do not have enhanced hazardous duty benefits; of public political subdivisions covered underVRS.Benefit AmountsThe Teacher Employee and Political Subdivision Employee Virginia Disability Local Program (VLDP)provides the following benefits for eligible employees:
Short-Term Disability • The program provides a short-term disability benefit beginning after a seven-calendar-day waiting periodfrom the first day of disability. Employees become eligible for non-work-related short-term disabilitycoverage after one year of continuous participation in VLDP with their current employer.• During the first five years of continuous participation in VLDP with their current employer, employees areeligible for 60% of their pre-disability income if they go out on non-work-related or work-related disability.• Once the eligibility period is satisfied, employees are eligible for higher income replacement levelsLong-Term Disability • The VLDP program provides a long-term disability benefit beginning after 125 workdays of short-termdisability. Members are eligible if they are unable to work at all or are working fewer than 20 hours per week.• Members approved for long-term disability will receive 60% of their pre-disability income. If approved forwork-related long-term disability, the VLDP benefit will be offset by the workers’ compensation benefit. Members will not receive a VLDP benefit if their workers’ compensation benefit is greater than the VLDPbenefit.
Virginia Local Disability Program Notes:• Members approved for short-term or long-term disability at age 60 or older will be eligible for a benefit,provided they remain medically eligible.• VLDP Long-Term Care Plan is a self-funded program that assists with the cost of covered long-term careservices.
113

CITY OF VIRGINIA BEACH, VIRGINIANOTES TO FINANCIAL STATEMENTS
JUNE 30, 2020
Health Insurance Credit Program
The Teacher Employee Health Insurance Credit Program was established pursuant to §51.1-1400 et seq. of the Codeof Virginia, as amended, and which provides the authority under which benefit terms are established or may beamended. The Teacher Employee Health Insurance Credit Program is a defined benefit plan that provides a credittoward the cost of health insurance coverage for retired teachers. All full-time, salaried permanent (professional)employees of public school divisions are automatically covered by the VRS Teacher Employee Health InsuranceCredit Program. This plan is administered by the Virginia Retirement System (the System), along with pension andother OPEB plans, for public employer groups in the Commonwealth of Virginia. Members earn one month ofservice credit toward the benefit for each month they are employed and for which their employer pays contributionsto VRS. The health insurance credit is a tax-free reimbursement in an amount set by the General Assembly for eachyear of service credit against qualified health insurance premiums retirees pay for single coverage, excluding anyportion covering the spouse or dependents. The credit cannot exceed the amount of the premiums and ends upon theretiree’s death.
The specific information for the Teacher Health Insurance Credit Program OPEB, including eligibility, coverage,and benefits is set out in the table below:
TEACHER EMPLOYEE HEALTH INSURANCE CREDIT PROGRAM (HIC) PLAN PROVISIONS
Eligible EmployeesThe Teacher Employee Retiree Health Insurance Credit Program was established July 1, 1993 for retiredTeacher Employees covered under VRS who retire with at least 15 years of service credit.
Eligible employees are enrolled automatically upon employment. They include:Full-time permanent (professional) salaried employees of public school divisions covered under VRS.
Benefit AmountsThe Teacher Employee Retiree Health Insurance Credit Program provides the following benefits for eligibleemployees:At Retirement – For Teacher and other professional school employees who retire, the monthly benefit is $1.50per year of service per month with a benefit of $45.00 per month.Disability Retirement – For Teacher and other professional school employees who retire on disability or go onlong-term disability under the Virginia Local Disability Program (VLDP), the monthly benefit is $45.00 permonth.
Health Insurance Credit Program Notes:The monthly Health Insurance Credit benefit cannot exceed the individual premium amount.Employees who retire after being on long-term disability under VLDP must have at least 15 year of servicecredit to qualify for the health insurance credit as a retiree.
Contributions
Group Life Insurance
The contribution requirements for the Group Life Insurance Program are governed by §51.1-506 and §51.1-508 ofthe Code of Virginia, as amended, but may be impacted as a result of funding provided to state agencies and school
114

CITY OF VIRGINIA BEACH, VIRGINIANOTES TO FINANCIAL STATEMENTS
JUNE 30, 2020
divisions by the Virginia General Assembly. The total rate for the Group Life Insurance Program was 1.31% ofcovered employee compensation. This was allocated into an employee and employer component using a 60/40 split. Employers may elect to pay all or part of the employee contribution, however the employer must pay all of theemployer contribution. Each Employer’s contractually required employer contribution rate for the year ended June30, 2020 was 0.52% of covered employee compensation. This rate was based on an actuarially determined rate froman actuarial valuation as of June 30, 2017. The actuarially determined rate, when combined with employeecontributions, was expected to finance the costs of benefits payable during the year, with an additional amount tofinance any unfunded accrued liability. Contributions to the Group Life Insurance Program for the City were$4,492,958 and $4,364,895 for the years ended June 30, 2020 and June 30, 2019, respectively. Contributions to theGroup Life Insurance Program for the School Board for combined professionals and nonprofessionals were$2,507,975 and $2,432,000 for the years ended June 30, 2020 and June 30, 2019, respectively.
Line of Duty Act Program
The contribution requirements for the Line of Duty Act Program are governed by §9.1-400.1 of the Code ofVirginia, as amended, but may be impacted as a result of funding provided to state agencies and school divisions bythe Virginia General Assembly. Each employer’s contractually required employer contribution rate for the Line ofDuty Act Program for the year ended June 30, 2020 was $705.77 per covered full-time-equivalent employee. Thisrate was based on an actuarially determined rate from an actuarial valuation as of June 30, 2017 and represents thepay-as-you-go funding rate and not the full actuarial cost of the benefits under the program. The actuariallydetermined pay-as-you-go rate was expected to finance the costs and related expenses of benefits payable during theyear. Contributions to the Line of Duty Act Program for the City were $1,347,489 and $1,377,661 for the yearsended June 30, 2020 and June 30, 2019, respectively.
Virginia Local Disability Program
The contribution requirements for active hybrid employees is governed by §51.1-400.1 of the Code of Virginia, asamended, but may be impacted as a result of funding provided to state agencies and school divisions by the VirginiaGeneral Assembly. Each political subdivision’s contractually required employer contribution rate for the year endedfor the year ended June 30, 2020 was 0.72% of covered employee compensation for employees in the VRS PoliticalSubdivision Employee Virginia Local Disability Program. This rate was based on an actuarially determined ratefrom an actuarial valuation as of June 30, 2017. The actuarially determined rate was expected to finance the costs ofbenefits earned by employees during the year, with an additional amount to finance any unfunded accrued liability. Contributions to the Virginia Local Disability Program for the City were $533,352 and $434,722 for the years endedJune 30, 2020 and June 30, 2019, respectively. Contributions to the Teacher Employee Virginia Local DisabilityProgram for the School Board were $423,008 and $333,074 for the years ended June 30, 2020 and June 30, 2019,respectively. Contributions to the Political Subdivision Employee Virginia Local Disability Program for the SchoolBoard were $122,065 and $102,908 for the years ended June 30, 2020 and June 30, 2019, respectively.
Health Insurance Credit Program
The contribution requirements for active employees is governed by §51.1-1401(E) of the Code of Virginia, asamended, but may be impacted as a result of funding provided to state agencies and school divisions by the VirginiaGeneral Assembly. Each school division's contractually required employer contribution rate for the year ended June30, 2020 was 1.20% of covered employee compensationfor employees in the VRS Teacher Employee HealthInsurance Credit Program. This rate was based on an actuarially determined rate from an actuarial valuation as ofJune 30, 2017. The actuarially determined rate was expected to finance the costs of benefits earned by employeesduring the year, with an additional amount to finance any unfunded accrued liability. Contributions from the schooldivision to the VRS Teacher Employee Health Insurance Credit program were $5,148,298 and $4,997,000 for theyears ended June 30, 2020 and June 30, 2019, respectively.
115

CITY OF VIRGINIA BEACH, VIRGINIANOTES TO FINANCIAL STATEMENTS
JUNE 30, 2020
OPEB Liabilities, OPEB Expense, and Deferred Outflows of Resources and Deferred Inflows of ResourcesRelated to OPEB
As June 30, 2020, the City and School Board reported the following liabilities for their proportionate share of themultiple-employer, cost sharing plans administered by VRS:
City School BoardNet OPEB Liabilities:Group Life Insurance Program $ 27,791,102 $ 38,546,680 Line of Duty Act Program 36,847,507 - Virginia Local Disability Program 398,444 192,172 Health Insurance Credit Program - 65,030,846
$ 65,037,053 $ 103,769,698
The net OPEB liabilities were measured as of June 30, 2019 and the total OPEB liabilities used to calculate the netOPEB liabilities was determined by an actuarial valuation as of that date. The City and School Board’s proportionof the Net OPEB liabilities were based on the City and School Board’s contributions to VRS for the above plans forthe year ended June 30, 2019 relative to the total of the employer contributions for all participating employers. Acomparison of the City’s and School Board’s proportion of the City and School Board’s contribution from June 30,2019 to June 30, 2018 were as followed:
City School BoardProportionate Share of Contributions as of June 30, 2019Group Life Insurance 1.70784% 2.36880%Line of Duty Act Program 10.27005% N/AVirginia Local Disability Program - Political Subdivsions 19.99173% 4.62460%Virginia Local Disability Program - Teachers N/A 16.94127%Health Insurance Credit Program N/A 4.96761%
Proportionate Share of Contributions as of June 30, 2018Group Life Insurance 1.72678% 2.39294%Line of Duty Act Program 10.29832% N/AVirginia Local Disability Program - Political Subdivisions 19.35404% 4.93874%Virginia Local Disability Program - Teachers N/A 16.82241%Health Insurance Credit Program N/A 5.04954%
For the year ended June 30, 2019, the City and School Board recognized OPEB expenses were as followed:
Recognized Net OPEB Expense: City School BoardGroup Life Insurance $ 669,430 $ 742,378 Line of Duty Act Program 3,178,030 - Virginia Local Disability Program - Political Subdivision 468,815 109,618 Virginia Local Disability Program - Teachers - 297,847 Health Insurance Credit Program - 5,088,410
Total $ 4,316,275 $ 6,238,253
116

CITY OF VIRGINIA BEACH, VIRGINIANOTES TO FINANCIAL STATEMENTS
JUNE 30, 2020
Since there were changes in the proportionate shares between measurement dates of the City and School Board’scontribution a portion of the Net OPEB expense were related to deferred amounts from changes in proportion.
At June 30, 2020 the City reported deferred outflows of resources and deferred inflows of resources related to OPEBfrom the following sources:
Deferred Outflows Deferred Inflows Group Life Insurance of Resources of Resources
Difference between Expected & Actual Experience $ 1,848,274 $ 360,474 Net Difference between Projected and Actual Earnings - 570,851 Changes in Assumptions 1,754,568 838,024 Changes in Proportionate Share 270,620 252,680 Employer Contributions subsequent to the Measurement Date 1,744,761 -
Total Group Life Insurance 5,618,223 2,022,029
Line of Duty ActDifference between Expected & Actual Experience 5,355,759 15 Net Difference between Projected and Actual Earnings - 72,952 Changes in Assumptions 1,728,928 3,194,254 Changes in Proportionate Share 1,838,028 905,819 Employer Contributions subsequent to the Measurement Date 1,368,198 -
Total Line of Duty Act 10,290,913 4,173,040
Virginia Local Disability Program - Political SubdivisionDifference between Expected & Actual Experience 199,852 12,257 Net Difference between Projected and Actual Earnings 1,363 - Changes in Assumptions 11,413 15,242 Changes in Proportionate Share 2,417 - Employer Contributions subsequent to the Measurement Date 452,917 -
Total Virginia Local Disability Program 667,962 27,499
Grand Total $ 16,577,098 $ 6,222,568
Employer Contributions subsequent to the measurement date totaled $3,678,025 will be recognized as a reduction ofthe City’s OPEB liability in the Fiscal Year ending June 30, 2021. Other amounts reported as deferred outflows ofresources and deferred inflows of resources related to OPEB will be recognized in the City’s OPEB expense infuture reporting periods as follows:
Fiscal YearEnded June 30: GLI LODA VLDP
2021 $ 99,567 $ 464,541 $ 169,130 2022 99,584 465,336 166,531 2023 341,363 476,633 163,532 2024 562,016 488,752 159,734 2025 571,819 492,346 155,136
Thereafter 159,154 1,428,667 - $ 1,833,503 $ 3,816,275 $ 814,063
117

CITY OF VIRGINIA BEACH, VIRGINIANOTES TO FINANCIAL STATEMENTS
JUNE 30, 2020
At June 30, 2020 the School Board reported deferred outflows of resources and deferred inflows of resources relatedto OPEB from the following sources:
Deferred Outflows Deferred Inflows Group Life Insurance of Resources of Resources
Difference between Expected & Actual Experience $ 2,563,585 $ 499,985 Net Difference between Projected and Actual Earnings - 791,779 Changes in Assumptions 2,433,613 1,162,352 Changes in Proportionate Share - 689,371 Employer Contributions subsequent to the Measurement Date 2,507,975 -
Total Group Life Insurance 7,505,173 3,143,487
Virginia Local Disability Progam - Political SubdivisionDifference between Expected & Actual Experience 46,990 2,881 Net Difference between Projected and Actual Earnings 321 - Changes in Assumptions 2,685 3,585 Changes in Proportionate Share - 2,421 Employer Contributions subsequent to the Measurement Date 122,065 -
Total Viriginia Local Disability Program 172,061 $ 8,887
Virginia Local Disability Program - TeachersDifference between Expected & Actual Experience - 11,884 Net Difference between Projected and Actual Earnings 380 - Changes in Assumptions 16,814 - Changes in Proportionate Share 816 Employer Contributions subsequent to the Measurement Date 423,008 -
Total Virginia Local Disability Program 441,018 $ 11,884
Health Insurance Credit ProgramDifference between Expected & Actual Experience - 368,341 Net Difference between Projected and Actual Earnings 4,106 - Changes in Assumptions 1,513,569 451,875 Changes in Proportionate Share - 1,499,783 Employer Contributions subsequent to the Measurement Date 5,148,298 -
Total Group Life Insurance 6,665,973 2,319,999
Grand Total $ 14,784,225 $ 5,484,257
Employer Contributions subsequent to the measurement date totaled $8,201,346 will be recognized as a reduction ofthe School Board’s OPEB liability in the Fiscal Year ending June 30, 2021. Other amounts reported as deferredoutflows of resources and deferred inflows of resources related to OPEB will be recognized in the School Board’sOPEB expense in future reporting periods as follows:
Fiscal YearEnded June 30:
2021 $ (205,016) 2022 (205,113) 2023 158,428 2024 469,952 2025 600,944
Thereafter 279,427
118

CITY OF VIRGINIA BEACH, VIRGINIANOTES TO FINANCIAL STATEMENTS
JUNE 30, 2020
Actuarial Assumptions
The total Cost sharing OPEB liabilities administered by VRS were based on an actuarial valuation as of June 30,2018, using the Entry Age Normal actuarial cost method and the following assumptions, applied to all periodsincluded in the measurement and rolled forward to the measurement date of June 30, 2019.
Inflation 2.50 percentSalary increases, including inflation –
General state employees 3.50 percent – 5.35 percentTeachers 3.50 percent – 5.95 percentSPORS employees 3.50 percent – 4.75 percentVaLORS employees 3.50 percent – 4.75 percentJRS employees 4.50 percentLocality – General employees 3.50 percent – 5.35 percentLocality – Hazardous Duty employees 3.50 percent – 4.75 percent
Investment rate of return – GLI, VLDP and HIC 6.75 Percent, net of investment expenses,including inflation*
Investment rate of return – LODA 3.50 Percent, net of investment expenses,including inflation*
* Administrative expenses as a percent of the market value of assets for the last experience study werefound to be approximately 0.06% of the market assets for all of the VRS plans. This would provide anassumed investment return rate for GASB purposes of slightly more than the assumed 6.75%. However, since the difference was minimal, and a more conservative 6.75% investment returnassumption provided a projected plan net position that exceeded the projected benefit payments, thelong-term expected rate of return on investments was assumed to be 6.75% to simplify preparation ofthe OPEB liabilities. For LODA, this would provide an assumed investment return rate for GASBpurposes of slightly more than the assumed 3.50%. However, since the difference was minimal, a moreconservative 3.50% investment return assumption has been used. Since LODA is funded on acurrent-disbursement basis, the assumed annual rate of return of 3.50% was used since it approximatesthe risk-free rate of return.
Mortality rates – General State Employees
Pre-Retirement:RP-2014 Employee Rates to age 80, Healthy Annuitant Rates to 81 and older projected with Scale BB to
2020; males set back 1 year, 85% of rates; females set back 1 year. Post-Retirement:
RP-2014 Employee Rates to age 49, Healthy Annuitant Rates at ages 50 and older projected with Scale BBto 2020; males set forward 1 year; females set back 1 year with 1.5% increase compounded from ages70 to 85.
Post-Disablement:RP-2014 Disability Life Mortality Table projected with scale BB to 2020; males 115% of rates; females
130% of rates.
The actuarial assumptions used in the June 30, 2018 valuation were based on the results of an actuarial experiencestudy for the period from July 1, 2012 through June 30, 2016. Changes to the actuarial assumptions as a result ofthe experience study are as follows:
119

CITY OF VIRGINIA BEACH, VIRGINIANOTES TO FINANCIAL STATEMENTS
JUNE 30, 2020
Mortality Rates (Pre-retirement, post-retirementhealthy, and disabled)
Updated to a more current mortality table – RP-2014 projectedto 2020
Retirement Rates Lowered rates at older ages and changed final retirement from70 to 75
Withdrawal Rates Adjusted rates to better fit experience at each year age andservice through 9 years of service
Disability Rates Adjusted rates to better match experienceSalary Scale No changeLine of Duty Disability Increased rate from 14% to 25%Discount Rate Decrease rate from 7.00% to 6.75%
Mortality rates – Teachers
Pre-Retirement:RP-2014 White Collar Employee Rates to age 80, White Collar Healthy Annuitant Rates at ages 81 and
older projected with scale BB to 2020. Post-Retirement:
RP-2014 White Collar Employee Rates to age 49, White Collar Health Annuitant Rates at ages 50 andolder projected with scale BB to 2020; males 1% increase compounded from ages 70 to 90; femalesset back 3 years with 1.5% increase compounded from ages 65 to 70 and 2.0% increase compoundedfrom ages 75 to 90.
Post-Disablement:RP-2014 Disability Mortality Rates projected with Scale BB to 2020; 115% of rates for males and females.
The actuarial assumptions used in the June 30, 2018 valuation were based on the results of an actuarial experiencestudy for the four-year period from July 1, 2012 through June 30, 2016. Changes to the actuarial assumptions as aresult of the experience study are as follows:
Mortality Rates (Pre-retirement,post-retirement healthy, and disabled)
Updated to a more current mortality table – RP-2014 projected to2020
Retirement Rates Lowered rates at older ages and changed final retirement from 70 to75
Withdrawal Rates Adjusted rates to better fit experience at each year age and servicethrough 9 years of service
Disability Rates Adjusted rates to better match experienceSalary Scale No changeDiscount Rate Decrease rate from 7.00% to 6.75%
Mortality rates – Largest Ten Locality Employers - General Employees
Pre-Retirement:RP-2014 Employee Rates to age 80, Healthy Annuitant Rates to 81 and older projected with Scale BB to
2020; males 95% of rates; females 105% of rates. Post-Retirement:
RP-2014 Employee Rates to age 49, Healthy Annuitant Rates at ages 50 and older projected with Scale BBto 2020; males set forward 3 years; females 1.0% increase compounded from ages 70 to 90.
Post-Disablement:RP-2014 Disability Life Mortality Table projected with scale BB to 2020; males set forward 2 years, 110%
of rates; females 125% of rates
120

CITY OF VIRGINIA BEACH, VIRGINIANOTES TO FINANCIAL STATEMENTS
JUNE 30, 2020
The actuarial assumptions used in the June 30, 2018 valuation were based on the results of an actuarial experiencestudy for the period from July 1, 2012 through June 30, 2016. Changes to the actuarial assumptions as a result ofthe experience study are as follows:
Mortality Rates (Pre-retirement, post-retirementhealthy, and disabled)
Updated to a more current mortality table – RP-2014 projectedto 2020
Retirement Rates Lowered retirement rates at older ages and extended finalretirement age from 70 to 75
Withdrawal Rates Adjusted termination rates to better fit experience at each ageand service year
Disability Rates Lowered disability ratesSalary Scale No changeLine of Duty Increase rate from 14% to 20%Discount Rate Decrease rate from 7.00% to 6.75%
Mortality rates – Non-Largest Ten Locality Employers - General Employees
Pre-Retirement:RP-2014 Employee Rates to age 80, Healthy Annuitant Rates to 81 and older projected with Scale BB to
2020; males 95% of rates; females 105% of rates. Post-Retirement:
RP-2014 Employee Rates to age 49, Healthy Annuitant Rates at ages 50 and older projected with Scale BBto 2020; males set forward 3 years; females 1.0% increase compounded from ages 70 to 90.
Post-Disablement:RP-2014 Disability Life Mortality Table projected with scale BB to 2020; males set forward 2 years, 110%
of rates; females 125% of rates.
The actuarial assumptions used in the June 30, 2018 valuation were based on the results of an actuarial experiencestudy for the period from July 1, 2012 through June 30, 2016. Changes to the actuarial assumptions as a result ofthe experience study are as follows:
Mortality Rates (Pre-retirement, post-retirementhealthy, and disabled)
Updated to a more current mortality table – RP-2014 projectedto 2020
Retirement Rates Lowered retirement rates at older ages and extended finalretirement age from 70 to 75.
Withdrawal Rates Adjusted termination rates to better fit experience at each ageand service year
Disability Rates Lowered disability ratesSalary Scale No changeLine of Duty Increase rate from 14% to 15%Discount Rate Decrease rate from 7.00% to 6.75%
Line of Duty Act
Mortality rates – Largest Ten Locality Employers with Public Safety Employees
Pre-Retirement:RP-2014 Employee Rates to age 80, Healthy Annuitant Rates to 81 and older projected with Scale BB to
2020; males 90% of rates; females set forward 1 year.
121

CITY OF VIRGINIA BEACH, VIRGINIANOTES TO FINANCIAL STATEMENTS
JUNE 30, 2020
Post-Retirement:RP-2014 Employee Rates to age 49, Healthy Annuitant Rates at ages 50 and older projected with Scale BB
to 2020; males set forward 1 year with 1.0% increase compounded from ages 70 to 90; females setforward 3 years.
Post-Disablement:RP-2014 Disability Life Mortality Table projected with scale BB to 2020; males set forward 2 years;
unisex using 100% male
The actuarial assumptions used in the June 30, 2018 valuation were based on the results of an actuarial experiencestudy for the period from July 1, 2012 through June 30, 2016. Changes to the actuarial assumptions as a result ofthe experience study are as follows:
Mortality Rates (Pre-retirement, post-retirementhealthy, and disabled)
Updated to a more current mortality table – RP-2014 projectedto 2020
Retirement Rates Lowered retirement rates at older ages Withdrawal Rates Adjusted termination rates to better fit experience at each age
and service year Disability Rates Increased disability ratesSalary Scale No changeLine of Duty Disability Increased rate from 60% to 70%Discount Rate Decrease rate from 7.00% to 6.75%
Mortality rates – Non-Largest Ten Locality Employers with Public Safety Employees
Pre-Retirement:RP-2014 Employee Rates to age 80, Healthy Annuitant Rates to 81 and older projected with Scale BB to
2020; males 90% of rates; females set forward 1 year. Post-Retirement:
RP-2014 Employee Rates to age 49, Healthy Annuitant Rates at ages 50 and older projected with Scale BBto 2020; males set forward 1 year with 1.0% increase compounded from ages 70 to 90; females setforward 3 years.
Post-Disablement:RP-2014 Disability Life Mortality Table projected with scale BB to 2020; males set forward 2 years;
unisex using 100% male
The actuarial assumptions used in the June 30, 2018 valuation were based on the results of an actuarial experiencestudy for the period from July 1, 2012 through June 30, 2016. Changes to the actuarial assumptions as a result ofthe experience study are as follows:
Mortality Rates (Pre-retirement, post-retirementhealthy, and disabled)
Updated to a more current mortality table – RP-2014 projectedto 2020
Retirement Rates Increased age 50 rates and lowered rates at older ages.Withdrawal Rates Adjusted rates to better fit experience at each age and service
yearDisability Rates Adjusted rates to better match experienceSalary Scale No changeLine of Duty Disability Decreased rate from 60% to 45%Discount Rate Decrease rate from 7.00% to 6.75%
122

CITY OF VIRGINIA BEACH, VIRGINIANOTES TO FINANCIAL STATEMENTS
JUNE 30, 2020
Mortality rates – Largest Ten Locality Employers – Hazardous Duty Employees
Pre-Retirement:RP-2014 Employee Rates to age 80, Healthy Annuitant Rates to 81 and older projected with Scale BB to
2020; males 90% of rates; females set forward 1 year. Post-Retirement:
RP-2014 Employee Rates to age 49, Healthy Annuitant Rates at ages 50 and older projected with Scale BBto 2020; males set forward 1 year with 1.0% increase compounded from ages 70 to 90; females setforward 3 years.
Post-Disablement:RP-2014 Disability Life Mortality Table projected with scale BB to 2020; males set forward 2 years;
unisex using 100% male.
The actuarial assumptions used in the June 30, 2018 valuation were based on the results of an actuarial experiencestudy for the period from July 1, 2012 through June 30, 2016. Changes to the actuarial assumptions as a result ofthe experience study are as follows:
Mortality Rates (Pre-retirement, post-retirementhealthy, and disabled)
Updated to a more current mortality table – RP-2014 projectedto 2020
Retirement Rates Lowered retirement rates at older agesWithdrawal Rates Adjusted termination rates to better fit experience at each age
and service year Disability Rates Increased disability ratesSalary Scale No changeLine of Duty Increase rate from 60% to 70%Discount Rate Decrease rate from 7.00% to 6.75%
Mortality rates – Non-Largest Ten Locality Employers – Hazardous Duty Employees
Pre-Retirement:RP-2014 Employee Rates to age 80, Healthy Annuitant Rates to 81 and older projected with Scale BB to
2020; males 90% of rates; females set forward 1 year. Post-Retirement:
RP-2014 Employee Rates to age 49, Healthy Annuitant Rates at ages 50 and older projected with Scale BBto 2020; males set forward 1 year with 1.0% increase compounded from ages 70 to 90; females setforward 3 years.
Post-Disablement:RP-2014 Disability Life Mortality Table projected with scale BB to 2020; males set forward 2 years;
unisex using 100% male.
The actuarial assumptions used in the June 30, 2018 valuation were based on the results of an actuarial experiencestudy for the period from July 1, 2012 through June 30, 2016. Changes to the actuarial assumptions as a result ofthe experience study are as follows:
Mortality Rates (Pre-retirement, post-retirementhealthy, and disabled)
Updated to a more current mortality table – RP-2014 projectedto 2020
Retirement Rates Lowered retirement rates at older agesWithdrawal Rates Adjusted termination rates to better fit experience at each age
and service yearDisability Rates Increase disability rates Salary Scale No changeLine of Duty Increase from 60% to 70%Discount Rate Decrease rate from 7.00% to 6.75%
123

CITY OF VIRGINIA BEACH, VIRGINIANOTES TO FINANCIAL STATEMENTS
JUNE 30, 2020
The following changes were made to the LODA program as a result of legislation in 2016 and 2017, but werespecifically not considered in the June 30, 2017 actuarial valuation results which were rolled forward to themeasurement date of June 30, 2018. There was limited actuarial experience on which to base the adjustments andthe combined impact of the changes was not considered to be material to the final results. The following changeswill be factored into future actuarial valuations for the LODA program: discontinuance of the spouse health carecoverage, if a covered spouse divorces a disabled employee or a covered surviving spouse remarries; the potentialfor VRS’s periodic review of the disability status of a disabled employee; for those beneficiaries who becomeeligible for health care benefits as the result of a disability when VRS certifies current income exceeds salary at thetime of the disability, indexed for inflation; the extension of health care benefits for dependent children to age 26;and, the expansion of the definition of presumption of death or disability to include infectious diseases.
Net OPEB Liability
The net OPEB liability (NOL) represents the program’s total OPEB liability determined in accordance with GASBStatement No. 74, less the associated fiduciary net position. As of June 30, 2019, NOL amounts for each programare as follows (amounts expressed in thousands):
Virginia LocalDisability - Virginia Local Health
Group Life Line of Duty Political Disability - InsuranceInsurance Act Subdivision Teachers Credit
Total OPEB Liability $ 3,390,238 $ 361,626 $ 3,989 $ 2,241 $ 1,438,114 Plan Fiduciary Net Position 1,762,972 2,839 1,962 1,661 129,016 Employers' Net OPEB Liability $ 1,627,266 $ 358,787 $ 2,027 $ 580 $ 1,309,098 Plan Fiduciary Net Position as a Percentageof the Total OPEB Liability 52.00% 0.79% 49.19% 74.12% 8.97%
The total OPEB liability is calculated by VRS’s actuary, and each plan fiduciary net position is reported in VRS’sfinancial statements. The net OPEB liability is disclosed in accordance with the requirements of GASB StatementNo. 74 in the VRS’s notes to the financial statements and required supplementary information.
Long-Term Expected Rate of Return
Group Life Insurance, Virginia Local Disability Program and Health Insurance Credit Program
The long-term expected rate of return on the VRS investments was determined using a log-normal distributionanalysis in which best-estimate ranges of expected future real rates of return (expected returns, net of VRSinvestment expense and inflation) are developed for each major asset class. These ranges are combined to producethe long-term expected rate of return by weighting the expected future real rates of return by the target assetallocation percentage and by adding expected inflation. The target asset allocation and best estimate of arithmeticreal rates of return for each major asset class are summarized in the following table:
Expected Expected Arithmetic Geometric
Target Real Rate of Real Rate of Asset Class Allocation Return ReturnPublic Equity 34.00% 5.61% 1.91%Fixed Income 15.00% 0.88% 0.13%Credit Strategies 14.00% 5.13% 0.72%Real Assets 14.00% 5.27% 0.74%Private Equity 14.00% 8.77% 1.23%MAPS - Multi-Asset Public Strategies 6.00% 3.52% 0.21%
124

CITY OF VIRGINIA BEACH, VIRGINIANOTES TO FINANCIAL STATEMENTS
JUNE 30, 2020
PIP - Private Investment Partnership 3.00% 6.29% 0.19%Total 100.00% 5.13%
Inflation 2.50%Expected arithmetic nominal return 7.63%
*The above allocation provides a one-year return of 7.63%. However, one-year returns do not take into account thevolatility present in each of the asset classes. In setting the long-term expected return for the system, stochasticprojections are employed to model future returns under various economic conditions. The results provide a range ofreturns over various time periods that ultimately provide median returns of 7.11%, including expected inflation of2.50%. The VRS Board elected a long-term rate of 6.75% which is roughly at the 40th percentile of expectedlong-term results of the VRS fund asset allocation.
Line of Duty Act Program
The long-term expected rate of return on Line of Duty Act OPEB investments was set at 3.50% for this valuation. Since Line of Duty Act is funded on a current-disbursement basis, it is not able to use the VRS pooled Investments6.75% assumption. Instead, the assumed annual rate of return of 3.50% was used since it approximates the risk-freerate of return. The Single Equivalent Interest Rate (SEIR) is the applicable municipal bond index rate based on theBond Buyer General Obligation 20-year Municipal Bond Index published monthly by the Board of Governors of theFederal Reserve System as of the measurement date of June 30, 2019.
Discount Rate
Group Life Insurance, Virginia Local Disability Program, and Health Insurance Credit Program
The discount rate used to measure the City and School Board’s Group Life Insurance and Virginia Local DisabilityProgram OPEB was 6.75%. The projection of cash flows used to determine the discount rate assumed that employercontributions will be made in accordance with the VRS funding policy at rates equal to the actuarially determinedcontribution rates adopted by the VRS Board of Trustees. Through the fiscal year ending June 30, 2019, the ratecontributed by the City and School Board for the VRS Group Life Insurance and VRS Virginia Local DisabilityProgram will be subject to the portion of the VRS Board-certified rates that are funded by the Virginia GeneralAssembly. From July 1, 2019 on, all employer are assumed to contribute 100% of the actuarially determinedcontribution rates. Based on those assumptions, the Group Life Insurance and Virginia Local Disability ProgramOPEB plan’s fiduciary net position was projected to be available to make all projected future benefit payments ofeligible employees. Therefore the long-term expected rate of return was applied to all periods of projected benefitpayments to determine the total Group Life Insurance and Virginia Local Disability Program OPEB liability.
Line of Duty Act Program
The discount rate used to measure the total Line of Duty Act OPEB liability was 3.50%. The projection of cashflows used to determine the discount rate assumed that employer contributions will be made per the VRS Statutesand that they will be made in accordance with the VRS funding policy and at rate equal to the actuarially determinedcontribution rates adopted by the VRS Board of Trustees. Through the fiscal year ending June 30, 2019, the ratecontributed by participating employers to the Line of Duty Act OPEB Program will be subject to the portion of theVRS Board-certified rates that are funded by the Virginia General Assembly.
125

CITY OF VIRGINIA BEACH, VIRGINIANOTES TO FINANCIAL STATEMENTS
JUNE 30, 2020
Sensitivity Analysis
The following presents the City and School Board’s proportionate share of the Net OPEB liabilities using the currentdiscount rate, as well as what the City and School Board’s net OPEB liability would be if it were calculated using adiscount rate that is one percentage point lower or one percentage point higher than the current.
1% Decrease Discount Rate 1% Increase5.75% 6.75% 7.75%
Group Life Insurance:City $ 36,509,831 $ 27,791,102 $ 20,720,490 School Board 50,639,668 38,546,680 28,739,604
Virginia Local Disability Program - Political Subdivision:City $ 523,445 $ 398,444 $ 297,072 School Board 107,739 93,686 81,397
Virginia Local Disability Program - Teachers:School Board $ 144,677 $ 98,486 $ 58,589
Health Insurance Credit Program:School Board $ 72,780,573 $ 65,030,846 $ 58,447,463
Line of Duty Act Program
1% Decrease Discount Rate 1% Increase2.50% 3.50% 4.50%
Line of Duty ActCity $ 42,745,889 $ 36,847,507 $ 32,182,452
Because the Line of Duty Act Program contains a provisions for the payment of health insurances premiums, theliabilities are also impacted by the health care trend rate. The following presents the covered employer’sproportionate share of the net Line of Duty Act OPEB liability using health care trend rate of 7.75% decreasing to5.00%, as well as what the covered employer’s proportionate share of the net Line of Duty Act OPEB liability wouldbe if it were using a health care trend rate that is one percentage point lower (6.75% decreasing to 4.00%) or onepercentage point higher (8.75% decreasing to 6.00%) than the current rate:
Health Care1% Decrease Trend Rates 1% Increase
6.75% 7.75% 8.75%deacreasing to deacreasing to deacreasing to
3.75% 4.75% 5.75%Line of Duty Act:
City $ 31,154,320 $ 36,847,507 $ 44,027,383
OPEB Plan Fiduciary Net Position
Detailed information about the Fiduciary Net Position is available in the separately issued VRS 2019 ComprehensiveAnnual Financial Report (CAFR). A copy of the 2019 VRS CAFR may be downloaded from the VRS website athttp://www.varetire.org/Pdf/Publications/2019-annual-report.pdf, or by writing to the VRS Chief Financial Officer atPO Box 2500, Richmond, VA, 23218-2500.
126

CITY OF VIRGINIA BEACH, VIRGINIANOTES TO FINANCIAL STATEMENTS
JUNE 30, 2020
15. SUBSEQUENT EVENTS
New City Manager
On July 20, 2020 Patrick Duhaney was appointed as new City Manager. Mr. Duhaney began his career with theCity of Cincinnati in June 2009. He has served as the acting City Manager, Assistant City Manager and asCincinnati's Chief Procurement Officer. Before his work in local government, Duhaney served in the U.S. Armyon active duty and in reserve capacity from 1999 to 2015 under combat engineer and ordnance commands. Healso worked for a community development financial institution in Cincinnati, where he served as a programofficer responsible for issuing community development loans, oversaw the local LISC office’s loan portfolio,and worked to bring resources to aid in the redevelopment of Cincinnati neighborhoods. Duhaney has served onnumerous boards in Cincinnati pertaining to neighborhood economic development and redevelopment andchaired the City of Cincinnati's Minority/Small/Women Business Enterprise Advisory Board.
Duhaney holds a Bachelor of Arts in Sociology and Urban Studies from the Cleveland State University and aMasters degree in Community Planning from the University of Cincinnati. He is a graduate of the UrbanLeague’s African-American Leadership Development Program. He is also a certified Economic DevelopmentFinance Professional and a Certified Public Procurement Buyer issued by the National Institute for GovernmentProcurement (NIGP).
Bond Sales
On October 7, 2020, the City issued $77.4 million in Storm Water Utility Revenue Bonds, Series 2020A and$14.1 million in Storm Water Utility Refunding Revenue Bonds, Series 2020B for various stormwater capitalimprovement projects. The combined true interest cost of the winning bidder for both bond series was1.936308% (comprised of Series 2020A at 2.013284% and Series 2020B at 1.246522%).
On October 22, 2020, the City issued $45.6 million in Water and Sewer System Revenue Bonds, Series 2020Aand $51.1 million in Water and Sewer System Refunding Revenue Bonds, Series 2020B for various water andsewer capital improvement projects. The combined true interest cost of the winning bidder for both bond serieswas 1.595321% (comprised of Series 2020A at 1.813325% and Series 2020B at 1.268969%).
On October 30, 2020, the City issued $3.4 million in General Obligation Refunding Bonds, Series 2020 torefinance the outstanding portion of its $5.9 million General Obligation Recovery Zone Economic DevelopmentBonds, Series 2010A (taxable). The bonds will bear interest at a rate of 1.28% per annum.
Agricultural Reserve Program
On October 20, 2020, City Council approved an ordinance authorizing the acquisition of an Agricultural LandPreservation Easement from Holly Road, LLC and Ola Hill Krueger and the issuance of Contract Obligations inthe maximum amount of $681,174.
CARES-CRF Funding
On August 11, 2020, the City received $39,258,491 from the Coronavirus Aid, Relief and Economic Security(CARES) - Coronavirus Relief Funding (CRF) from the Commonwealth. This was the second and finalallocation for the City. A total of $78,516,982 of CARES-CRF funding was recevied.
127

This Page Intentionally Left Blank
128

REQUIRED
SUPPLEMENTAL
INFORMATION
(Unaudited)


REQUIRED SUPPLEMENTAL INFORMATION
GENERAL FUND - BUDGET TO ACTUAL
VIRGINIA RETIREMENT SYSTEM PENSION
OTHER POSTEMPLOYMENT BENEFITS (OPEB)
(UNAUDITED)
In accordance with the Governmental Accounting Standards Board, the following information is a required part of the BasicFinancial Statements.
129

CITY OF VIRGINIA BEACH, VIRGINIASCHEDULE OF REVENUES, EXPENDITURES, AND CHANGES IN FUND BALANCE
BUDGET AND ACTUALGENERAL FUND
FOR THE YEAR ENDED JUNE 30, 2020
Budget Amounts
VarianceFinal Budget
PositiveOriginal Final Actual Amounts (Negative)
REVENUESGeneral Property Taxes:
Real Estate property taxes $ 558,748,264 $ 558,748,264 $ 558,856,050 $ 107,786Personal property taxes 110,084,733 110,024,733 112,728,082 2,703,349
Other Local Taxes 254,410,971 250,840,460 242,842,465 (7,997,995)Fines and Forfeitures 4,393,419 4,393,419 3,634,998 (758,421)Permits, Privilege Fees, and Regulatory Licenses 5,256,841 5,256,841 5,084,254 (172,587)From Use of Money and Property 9,660,420 9,660,420 8,844,159 (816,261)Charges for Services 52,316,866 52,463,797 48,424,789 (4,039,008)Miscellaneous 7,043,889 7,459,549 6,294,486 (1,165,063)From Commonwealth 160,434,641 161,790,695 165,091,508 3,300,813From Federal Government 22,236,295 22,593,431 25,165,471 2,572,040
Total Revenues 1,184,586,339 1,183,231,609 1,176,966,262 (6,265,347)
EXPENDITURESLegislative 1,233,376 1,262,687 1,180,302 82,385Executive 5,261,516 5,351,720 5,150,430 201,290Law 4,557,406 4,631,045 4,595,060 35,985Finance 21,428,925 22,155,899 19,694,983 2,460,916Human Resources 27,741,352 27,747,928 12,308,232 15,439,696Judicial 16,356,138 17,276,235 15,955,630 1,320,605Health 3,479,631 3,697,035 3,327,913 369,122Police 102,960,533 106,602,513 86,185,515 20,416,998Human Services 122,495,144 126,219,981 118,350,951 7,869,030Public Works 86,491,991 89,249,966 75,586,328 13,663,638Parks and Recreation 14,862,428 15,283,566 14,413,651 869,915Library 18,262,617 19,120,937 18,031,905 1,089,032Planning 18,990,898 19,381,328 18,355,508 1,025,820Agriculture 930,931 948,802 888,166 60,636Economic Development 5,654,013 7,980,283 2,914,879 5,065,404Convention and Visitor Development 10,390,900 10,803,730 9,229,295 1,574,435Cultural Affairs 3,142,946 5,162,174 3,156,488 2,005,686Information Technology 27,408,401 28,667,998 25,166,518 3,501,480Emergency Communications and Citizen Services 10,982,909 11,316,120 7,631,901 3,684,219Boards and Commissions 29,723,697 32,386,284 25,951,685 6,434,599Fire 56,383,336 60,118,974 44,796,114 15,322,860Budget and Management Services 1,451,354 1,474,793 1,324,913 149,880Education 415,469,824 440,331,075 395,503,449 44,827,626Housing and Neighborhood Preservation 6,273,110 6,431,792 5,814,707 617,085Museums 12,271,722 12,629,602 10,151,547 2,478,055Emergency Medical Services 12,580,859 12,857,299 10,355,118 2,502,181Debt Service:
Principal Retirement 36,633,786 36,633,786 36,633,786 -Interest and Fiscal Charges 17,780,444 17,780,444 16,141,352 1,639,092
Total Expenditures 1,091,200,187 1,143,503,996 988,796,326 154,707,670Excess (Deficiency) of Revenues over (under) Expenditures 93,386,152 39,727,613 188,169,936 148,442,323
OTHER FINANCING SOURCES (USES)Transfers In 819,224 16,881,833 16,879,932 (1,901)Transfers Out (128,260,616) (130,561,412) (130,560,085) 1,327Premium on Bonds Sold - - 738,393 738,393Use of Fund Balance 34,055,240 73,951,966 - (73,951,966)
Total Other Financing Sources (uses) (93,386,152) (39,727,613) (112,941,760) (73,214,147)Net Change in Fund Balance - - 75,228,176 75,228,176Fund Balance at Beginning of Year 230,579,796 230,579,796 230,579,796 -Fund Balance at End of Year $ 230,579,796 $ 230,579,796 $ 305,807,972 $ 75,228,176
130

CITY OF VIRGINIA BEACH, VIRGINIASCHEDULES OF REQUIRED SUPPLEMENTAL INFORMATION
SCHEDULE OF CHANGES IN THE NET PENSION LIABILITY AND RELATED RATIOSFOR THE YEAR ENDED JUNE 30, 2020
CityFY 2014 FY 2015 FY 2016 FY 2017 FY 2018 FY 2019
Total Pension LiabilityService Cost $ 35,838,242 $ 35,932,562 $ 36,304,048 $ 36,385,569 $ 38,749,786 $ 39,607,023 Interest 114,650,965 119,573,242 122,642,141 127,496,045 132,764,815 137,584,382 Changes of benefit terms - - - - - - Changes in assumptions - - - 7,551,961 - 58,968,730 Differences between expected and actualexperience - (24,723,400) 3,527,958 1,570,175 2,420,090 6,189,119 Benefit Payments, including refunds ofemployee contributions (77,985,409) (82,356,519) (91,525,484) (94,739,837) (100,731,357) (109,436,121)Net change in total pension liability 72,503,798 48,425,885 70,948,663 78,263,913 73,203,334 132,913,133 Total pension liability - beginning 1,676,863,639 1,749,367,437 1,797,793,322 1,868,741,985 1,947,005,898 2,020,209,232 Total pension liability - ending (a) $ 1,749,367,437 $ 1,797,793,322 $ 1,868,741,985 $ 1,947,005,898 $ 2,020,209,232 $ 2,153,122,365
Plan Fiduciary Net PositionContributions - employer $ 45,827,648 $ 48,703,360 $ 49,521,364 $ 43,305,500 $ 44,514,635 47,363,487 Contributions - employee 14,813,559 14,937,006 15,185,917 15,780,809 16,102,282 16,153,428 Net investment income 194,451,721 64,442,330 24,961,833 175,963,753 117,134,461 109,869,540 Benefit Payments, including refunds ofemployee contributions (77,985,409) (82,356,519) (91,525,484) (94,739,837) (100,731,357) (109,436,121)Administrative expenses (1,053,309) (887,459) (910,017) (1,029,901) (1,022,764) (1,110,715)Other 10,242 (13,597) (10,675) (156,044) (103,817) (71,080)Net change in plan fiduciary net position 176,064,452 44,825,121 (2,777,062) 139,124,280 75,893,440 62,768,539 Plan fiduciary net position - beginning 1,239,531,415 1,415,595,867 1,460,420,988 1,457,643,926 1,596,768,206 1,672,661,646 Plan fiduciary net position - ending (b) $ 1,415,595,867 $ 1,460,420,988 $ 1,457,643,926 $ 1,596,768,206 $ 1,672,661,646 $ 1,735,430,185
Net pension liability, ending $ 333,771,570 $ 337,372,334 $ 411,098,059 $ 350,237,692 $ 347,547,586 $ 417,692,180
Net position as a percentage of the totalpension liability 80.9% 81.2% 78.0% 82.0% 82.8% 80.6%
Covered payroll $ 292,873,927 $ 299,462,518 $ 305,412,468 $ 317,193,072 $ 328,337,502 $ 333,558,319
City's net pension liability as apercentage of covered payroll 114.0% 112.7% 134.6% 110.4% 105.9% 125.2%
*Schedule is intended to show information for 10 years. Additional years will be included as they become available.
131

CITY OF VIRGINIA BEACH, VIRGINIASCHEDULES OF REQUIRED SUPPLEMENTAL INFORMATION
SCHEDULE OF CHANGES IN THE NET PENSION LIABILITY AND RELATED RATIOSFOR THE YEAR ENDED JUNE 30, 2020
School Board Non ProfessionalFY 2015 FY 2016 FY 2017 FY 2018 FY 2019
Total Pension LiabilityService Cost $ 4,089,939 $ 4,079,432 $ 4,027,098 $ 3,831,060 $ 3,788,974 Interest 13,574,596 14,020,741 14,519,133 14,994,765 15,432,954 Changes of benefit terms - - - - - Differences between expected and actualexperience (747,303) 264,387 1,300,649 (114,972)
2,127,992
Changes in assumptions - - (1,332,150) - 6,306,405 Benefit Payments, including refunds of employeecontributions (10,023,655) (11,063,812) (11,425,531) (12,014,444)
(12,468,334)
Net change in total pension liability 6,893,577 7,300,748 7,089,199 6,696,409 14,768,737 Total pension liability - beginning 198,934,626 205,828,203 213,128,951 220,218,150 226,914,559 Total pension liability - ending (a) $ 205,828,203 $ 213,128,951 $ 220,218,150 $ 226,914,559 $ 241,683,296
Plan Fiduciary Net PositionContributions - employer $ 3,739,486 $ 3,876,348 $ 2,959,847 $ 2,967,419 $ 2,880,916 Contributions - employee 2,041,468 2,113,676 2,124,981 2,121,653 2,161,296 Net investment income 8,507,018 3,214,427 22,825,346 15,092,474 14,049,158 Benefit Payments, including refunds of employeecontributions (10,023,655) (11,063,812) (11,425,531) (12,014,444)
(12,468,334)
Administrative expenses (118,985) (120,635) (135,200) (133,315) (143,574)Other (1,792) (1,394) (20,191) (13,321) (8,810)Net change in plan fiduciary net position 4,143,540 (1,981,390) 16,329,252 8,020,466 6,470,652 Plan fiduciary net position - beginning 188,111,748 192,255,288 190,273,898 206,603,150 214,623,616 Plan fiduciary net position - ending (b) $ 192,255,288 $ 190,273,898 $ 206,603,150 $ 214,623,616 $ 221,094,268
Net pension liability - ending $ 13,572,915 $ 22,855,053 $ 13,615,000 $ 12,290,943 $ 20,589,028 Plan fiduciary net position as a percentage oftotal pension liability 93.41% 89.28% 93.82% 94.58% 91.48% Covered payroll $ 40,017,176 $ 40,970,605 $ 42,344,732 $ 42,112,697 $ 42,872,651
Net pension liability as a percentage of coveredpayroll 33.92% 55.78% 32.15% 29.19% 48.02% *Schedule is intended to show information for 10 years. Additional years will be included as they become available.
132

CITY OF VIRGINIA BEACH, VIRGINIASCHEDULES OF REQUIRED SUPPLEMENTAL INFORMATION
SCHEDULE OF EMPLOYER PENSION CONTRIBUTIONSJUNE 30, 2020
Contributions inRelation to Contributions
Contractually Contractually Contribution Employer's as a % ofRequired Required Deficiency Covered Covered
Contribution Contributions (Excess) Payroll PayrollDate (1) (2) (3) (4) (5)
CityJune 30, 2010 $ 46,669,506 N/A N/A $ 283,887,453 - June 30, 2011 48,318,936 N/A N/A 276,523,016 - June 30, 2012 49,052,965 N/A N/A 284,200,896 - June 30, 2013 44,694,773 N/A N/A 285,349,525 - June 30, 2014 45,827,648 45,827,648 - 292,873,927 15.65 June 30, 2015 48,703,360 48,703,360 - 299,462,518 16.26 June 30, 2016 49,847,919 49,847,919 - 305,412,468 16.32 June 30, 2017 43,919,386 43,919,386 - 317,193,072 13.85 June 30, 2018 44,501,507 44,501,507 - 328,337,502 13.55 June 30, 2019 47,366,085 47,366,085 - 333,558,319 14.20 June 30, 2020 48,251,362 48,251,362 - 342,477,093 14.09
School Board Non ProfessionalJune 30, 2011 2,426,088 N/A N/A 38,755,403 - June 30, 2012 2,495,274 N/A N/A 39,860,613 - June 30, 2013 3,671,537 N/A N/A 40,302,269 - June 30, 2014 3,645,565 3,645,565 - 40,017,176 9.11 June 30, 2015 3,732,422 3,732,422 - 40,970,605 9.11 June 30, 2016 3,857,605 3,857,605 - 42,344,732 9.11 June 30, 2017 2,956,311 2,956,311 - 42,112,697 7.02 June 30, 2018 2,969,741 2,969,741 - 42,303,998 7.02 June 30, 2019 2,885,329 2,885,329 - 42,872,651 6.73 June 30, 2020 2,928,810 2,928,810 - 43,518,726 6.73
.
School Board Professional / TeacherJune 30, 2011 15,177,733 N/A N/A 386,201,856 - June 30, 2012 23,959,120 N/A N/A 378,501,098 - June 30, 2013 44,228,510 N/A N/A 379,318,265 - June 30, 2014 43,992,831 43,992,831 - 377,297,007 11.66 June 30, 2015 55,858,551 55,858,551 - 385,231,385 14.50 June 30, 2016 54,463,409 54,463,409 - 387,364,218 14.06 June 30, 2017 57,698,763 57,698,763 - 393,579,555 14.66 June 30, 2018 65,402,518 65,402,518 - 400,750,722 16.32 June 30, 2019 63,710,358 63,710,358 - 406,316,058 15.68 June 30, 2020 65,059,491 65,059,491 414,920,223 15.68
133

CITY OF VIRGINIA BEACH, VIRGINIASCHEDULES OF REQUIRED SUPPLEMENTAL INFORMATION
SCHEDULE OF EMPLOYER PENSION CONTRIBUTIONSFOR THE YEAR ENDED JUNE 30, 2020
Changes of benefit terms – There have been no actuarially material changes to the System benefit provisions since the prioractuarial valuation.
Changes of assumptions – The actuarial assumptions used in the June 30, 2018, valuation were based on the results of anactuarial experience study for the period from July 1, 2012, through June 30, 2016, except the change in the discount rate, whichwas based on VRS Board action effective as of July 1, 2019. Changes to the actuarial assumptions as a result of the expereincestudy and VRS Board action are as follows:
Largest 10 – Non-LEOS:- Updated mortality rates to a more current mortality table - RP 2014 projected to 2020- Lowered retirement rates at older ages and changed final retirement from 70 to 75- Adjusted withdrawal rates to better fit experience at each year age and service through 9 years of service- Lowered disability rates- Increased line of duty disability rate from 14% to 20%- Decreased discount rate from 7.00% to 6.75%
All Others (Non 10 Largest) – Non-LEOS:- Updated mortality rates to a more current mortality table - RP 2014 projected to 2020- Lowered retirement rates at older ages and changed final retirement from 70 to 75- Adjusted withdrawal rates to better fit experience at each year age and service through 9 years of service- Lowered disability rates- Increased line of duty disability rate from 14% to 15%- Decreased discount rate from 7.00% to 6.75%
Largest 10 –LEOS:- Updated mortality rates to a more current mortality table - RP 2014 projected to 2020- Lowered retirement rates at older ages- Adjusted withdrawal rates to better fit experience- Increased disability rates- Increased line of duty disability rate from 60% to 70%- Decreased discount rate from 7.00% to 6.75%
All Others (Non 10 Largest) – LEOS:- Updated mortality rates to a more current mortality table - RP 2014 projected to 2020- Increased retirement 50 rates, and lowered rates at older ages- Adjusted withdrawal rates to better fit experience at each year age and service through 9 years of service- Decreased line of duty rate from 60% to 45%- Decreased discount rate from 7.00% to 6.75%
134

CITY OF VIRGINIA BEACH, VIRGINIASCHEDULES OF REQUIRED SUPPLEMENTAL INFORMATION
SCHEDULE OF EMPLOYER'S SHARE OF NET PENSION LIABILITYJUNE 30, 2020
School Board Professional / TeacherEmployer's
Proportionate Plan FiduciaryEmployer's Employer's Share of the Net PositionProportion Proportionate NPL as a % as a % of the
of the Share of the Employer's of its TotalNet Pension Net Pension Covered Covered Pension
Liability Liability Payroll Payroll LiabilityDate (a) (b) (c) (d) (e)
June 30, 2015 5.19364% 653,690,000 385,231,385 169.69 70.68 June 30, 2016 5.12286% 717,924,000 387,364,218 185.34 68.28 June 30, 2017 5.08685% 625,579,000 393,579,555 158.95 72.92 June 30, 2018 5.07577% 596,910,000 400,750,722 148.95 74.81 June 30, 2019 4.99839% 657,816,528 406,316,058 161.90 73.51
*Schedule is intended to show information for 10 years. Additional years will be included as they become available. The amounts presented have a measurement date of the prior fiscal year-end.
135

CITY OF VIRGINIA BEACH, VIRGINIASCHEDULES OF REQUIRED SUPPLEMENTAL INFORMATION
SCHEDULE OF EMPLOYER'S SHARE OF NET OPEB LIABILITY AND RELATED RATIOS
CityFY 2017 FY 2018 FY 2019 FY 2020
Total OPEB LiabilityService Cost $ 2,092,692 $ 1,452,138 $ 2,038,460 $ 2,124,026 Interest 5,784,254 5,558,785 6,656,348 6,702,911 Economic/Demographic Gains or Losses - (3,737,558) - - Assumption Changes - 15,718,896 3,781,224 (19,288,032)Benefit Payments (6,074,717) (7,387,237) (7,894,660) (7,013,877)
Net change in total OPEB liability 1,802,229 11,605,024 4,581,372 (17,474,972)Total OPEB liability - beginning 83,525,542 85,327,774 96,932,798 101,514,170 Total OPEB liability - ending (a) $ 85,327,771 $ 96,932,798 $ 101,514,170 $ 84,039,198
Plan Fiduciary Net PositionEmployer Contributions $ 6,074,717 $ 7,387,237 $ 7,894,660 $ 7,013,877 Benefit Payments (6,074,717) (7,387,237) (7,894,660) (7,013,877)Net Investment Income 4,405,718 3,693,879 1,942,585 1,349,790 Administrative Expenses (34,423) (35,921) (36,956) (37,255)
Net change in plan fiduciary net position 4,371,295 3,657,958 1,905,629 1,312,535 Plan fiduciary net position - beginning 34,212,904 38,584,199 42,242,157 44,147,786 Plan fiduciary net position - ending (b) $ 38,584,199 $ 42,242,157 $ 44,147,786 $ 45,460,321
Political subdivisions's net OPEB liability, ending (a) - (b) $ 46,743,572 $ 54,690,641 $ 57,366,384 $ 38,578,877
Fiduciary net position as a percentage of the total OPEBliability 43.58% 43.58% 43.49% 54.09%
Covered Payroll $ 306,050,000 $ 327,257,500 $ 327,257,500 $ 340,412,201
City's OPEB liabilty as a percentage of covered payroll 15.27% 16.71% 17.53% 11.33%
Net Money-Weighted Rate of Return 12.89% 9.58% 4.60% 3.06%
The money-weighted rate of return considers the changing amounts actually invested during a period and weights the amount of planinvestments by the proportion of time they are available to earn a return during that period. External cash flows are determined on amonthly basis and are assumed to occur at the beginning of each month. External cash inflows are netter with external cash outflows,resulting in a net external cash flow in each month. The money weighted rate of return is calculated net of investment expenses.
* Schedules are intended to show information for 10 years. The first year for this presentation is 2017; additional years will beincluded as they become available
136

CITY OF VIRGINIA BEACH, VIRGINIASCHEDULES OF REQUIRED SUPPLEMENTAL INFORMATION
SCHEDULE OF EMPLOYER'S SHARE OF NET OPEB LIABILITY AND RELATED RATIOS
School BoardFY 2017 FY 2018 FY 2019 FY 2020
Total OPEB LiabilityService Cost $ 1,529,672 $ 1,239,627 $ 2,429,766 $ 2,566,620 Interest 4,928,893 5,027,382 6,508,729 6,616,759 Economic/Demographic Gains or Losses - 1,400,273 - 2,340,909 Assumption Changes - 20,370,070 3,705,597 (22,674,032)Benefit Payments (5,661,710) (6,679,101) (6,650,666) (5,945,243)Net change in total OPEB liability 796,855 21,358,251 5,993,426 (17,094,987)Total OPEB liability - beginning 71,666,051 72,462,906 93,821,157 99,814,583 Total OPEB liability - ending (a) $ 72,462,906 $ 93,821,157 $ 99,814,583 $ 82,719,596
Plan Fiduciary Net PositionEmployer Contributions $ 5,661,710 $ 7,369,401 $ 6,650,666 $ 6,950,743 Benefit Payments (5,661,710) (6,679,101) (6,650,666) (5,945,243)Net Investment Income 3,098,316 2,597,704 1,397,854 997,100 Administrative Expenses (24,357) (25,409) (26,592) (27,508)Net change in plan fiduciary net position 3,073,959 3,262,595 1,371,262 1,975,092 Plan fiduciary net position - beginning 24,060,265 27,134,224 30,396,819 31,768,081 Plan fiduciary net position - ending (b) $ 27,134,224 $ 30,396,819 $ 31,768,081 $ 33,743,173
Political subdivisions's net OPEB liability, ending (a) - (b) $ 45,328,682 $ 63,424,338 $ 68,046,502 $ 48,976,423
Fiduciary net position as a percentage of the total OPEBliability 37.45% 32.40% 31.83% 40.79%
Covered Payroll $ 426,884,300 $ 444,517,100 $ 444,517,100 $ 466,464,228
School Board's OPEB liabilty as a percentage of coveredpayroll 10.62% 14.27% 15.31% 10.50%
Net Money-Weighted Rate of Return 12.89% 9.56% 4.60% 3.04%
The money-weighted rate of return considers the changing amounts actually invested during a period and weights the amount of planinvestments by the proportion of time they are available to earn a return during that period. External cash flows are determined on amonthly basis and are assumed to occur at the beginning of each month. External cash inflows are netted with external cash outflows,resulting in a net external cash flow in each month. The money weighted rate of return is calculated net of investment expenses.
* Schedules are intended to show information for 10 years. The first year for this presentation is 2017; additional years will beincluded as they become available
137

CITY OF VIRGINIA BEACH, VIRGINIASCHEDULES OF REQUIRED SUPPLEMENTAL INFORMATION
SCHEDULE OF OPEB ANNUAL CONTRIBUTIONS
CityFiscal Year Actuarially Actual Contribution Contribution
Ending Determined Employer Deficiency Covered as a Percent ofJune 30 Contributions Contribution 1 (Excess) Payroll Covered Payroll
2009 $ 8,932,300 $ 8,932,300 $ - $ 280,202,000 3.19%2010 8,854,100 8,854,100 - 285,407,400 3.10%2011 8,854,100 8,854,100 - 285,407,400 3.10%2012 8,714,600 8,714,600 - 283,026,400 3.08%2013 8,871,000 8,871,000 - 283,026,400 3.13%2014 7,101,900 7,101,900 - 290,297,000 2.45%2015 7,259,200 7,259,200 - 290,297,000 2.50%2016 5,186,400 5,998,200 (811,800) 306,050,000 1.96%2017 5,296,700 6,074,700 (778,000) 306,050,000 1.98%2018 6,296,000 7,387,237 (1,091,237) 327,257,500 2.26%2019 6,405,600 7,894,660 (1,489,060) 327,257,500 2.41%2020 4,571,500 7,013,877 (2,442,377) 340,412,201 2.06%
School BoardFiscal Year Actuarially Actual Contribution Contribution
Ending Determined Employer Deficiency Covered as a Percent ofJune 30 Contributions Contribution 1 (Excess) Payroll Covered Payroll
2009 $ 8,829,800 $ 8,829,800 $ - $ 440,959,600 2.00%2010 8,881,900 8,881,900 - 432,476,800 2.05%2011 8,881,900 8,881,900 - 432,476,800 2.05%2012 7,721,500 7,721,500 - 409,662,700 1.88%2013 7,858,100 7,858,100 - 409,662,700 1.92%2014 5,700,900 5,700,900 - 421,065,100 1.35%2015 5,832,200 5,832,200 - 421,065,100 1.39%2016 4,462,800 5,748,000 (1,285,200) 426,884,300 1.35%2017 4,542,400 5,661,700 (1,119,300) 426,884,300 1.33%2018 7,369,400 7,369,400 - 444,517,100 1.66%2019 7,656,200 6,650,666 1,005,534 444,517,100 1.50%2020 5,704,500 6,950,743 (1,246,243) 466,464,228 1.49%
1 Employer contributions include trust contributions and explicit subsidy payments provided directly to retirees from the City and School Boardown resources. They also include estimated implicit subsidy payments for retirees from the City and School Board own resourcesValuation Timing Actuarial valuations for OPEB funding purposes are performed annually as of January 1. The
most recent valuation was performed as of January 1, 2018.Actuarial Cost Method Projected unit creditAmortization Method Level dollarAmortization Period 28 years remaining as of January 1, 2018Asset Valuation Method 5-year asset smoothingInflation 2.50%Salary Increases General Employees with 1 to 19 years of service, the increases range from 5.35% to 3.65% and
for those with 20 or more years of service the increase is 3.50%. Law Officers with 1 to 19 years of service, the increases range from 4.75% to 4.00% and for those with 20 or more years of service the increase is 3.50%
Payroll Growth None AssumedDiscount Rate 6.50%Retirement Age VRS Plan 1: 65 and VRS Plans 2/Hybrid: Normal social security retirement ageMortality Based on the RP-2000 Employee Mortality Table for Males or Females, as appropriate, with
adjustments for mortality improvements based on Scale AA.
138

CITY OF VIRGINIA BEACH, VIRGINIASCHEDULES OF REQUIRED SUPPLEMENTAL INFORMATION
SCHEDULE OF EMPLOYER'S SHARE OF THE NET OPEB LIABILITY
For Measurement Dates 6/30/2019 6/30/2018 6/30/2017City:
Group Life Insurance (GLI)Employer's Portion of the Net GLI OPEB Liability 1.70784% 1.72678% 1.71960%Employers Proportionate Share of the Net GLI OPEBLiability $ 27,791,102 $ 26,225,000 $ 25,877,000 Employer's Covered Payroll $ 343,539,338 $ 328,337,502 $ 317,193,072 Employer's Proportionate Share of the Net GLI OPEBLiability as a Percentage of its Covered Payroll 8.09% 7.99% 8.16%Plan Fiduciary Net Position as a Percentage of the TotalGLI OPEB Liability 52.00% 51.22% 48.86%
Line of Duty Act (LODA)Employer's Portion of the Net LODA OPEB Liability 10.27005% 10.29832% 9.48107%Employers Proportionate Share of the Net LODA OPEBLiability $ 36,847,507 $ 32,288,000 $ 24,916,000 Employer's Covered Employee Payroll $ 110,370,707 $ 110,808,888 $ 103,532,167 Employer's Proportionate Share of the Net LODA OPEBLiability as a Percentage of its Covered Payroll 33.39% 29.14% 24.07%Plan Fiduciary Net Position as a Percentage of the TotalLODA OPEB Liability 6.00% 0.60% 1.30%
Virginia Local Disability Program (VLDP) - PoliticalSubdivision
Employer's Portion of the Net VLDP OPEB Liability 19.66871% 19.35404% 18.65503%Employers Proportionate Share of the Net VLDP OPEBLiability $ 398,444 $ 156,000 $ 100,000 Employer's Covered Payroll $ 60,789,141 $ 46,992,859 $ 34,255,962 Employer's Proportionate Share of the Net VLDP OPEBLiability as a Percentage of its Covered Payroll 0.66% 0.33% 0.29%Plan Fiduciary Net Position as a Percentage of the TotalVLDP OPEB Liability 51.39% 51.39% 38.40%
139

CITY OF VIRGINIA BEACH, VIRGINIASCHEDULES OF REQUIRED SUPPLEMENTAL INFORMATION
SCHEDULE OF EMPLOYER'S SHARE OF THE NET OPEB LIABILITY
For Measurement Dates 6/30/2019 6/30/2018 6/30/2017School Board:
Group Life Insurance (GLI)Employer's Portion of the Net GLI OPEB Liability 2.36880% 2.39294% 2.41666%Employers Proportionate Share of the Net GLI OPEBLiability $ 38,546,680 $ 36,342,000 $ 36,367,000 Employer's Covered Payroll $ 464,367,468 $ 455,011,974 $ 435,693,000 Employer's Proportionate Share of the Net GLI OPEBLiability as a Percentage of its Covered Payroll 8.30% 7.99% 8.35%Plan Fiduciary Net Position as a Percentage of the TotalGLI OPEB Liability 52.00% 51.22% 48.86%
Health Insurance CreditEmployer's Portion of the Net LODA OPEB Liability 4.96761% 5.04954% 5.06312%Employers Proportionate Share of the Net LODA OPEBLiability $ 65,030,846 $ 64,113,000 $ 64,231,000 Employer's Covered Payroll $ 416,667,852 $ 408,375,692 $ 393,580,000 Employer's Proportionate Share of the Net LODA OPEBLiability as a Percentage of its Covered Payroll 15.61% 15.70% 16.32%Plan Fiduciary Net Position as a Percentage of the TotalHIC OPEB Liability 8.97% 8.08% 7.04%
Virginia Local Disability Program (VLDP) - Political SubdivisionEmployer's Portion of the Net VLDP OPEB Liability 4.62460% 4.93874% 5.20662%Employers Proportionate Share of the Net VLDP OPEBLiability $ 93,686 $ 38,000 $ 30,000 Employer's Covered Payroll $ 14,290,947 $ 11,991,585 $ 9,515,500 Employer's Proportionate Share of the Net VLDP OPEBLiability as a Percentage of its Covered Payroll 0.66% 0.32% 0.31%Plan Fiduciary Net Position as a Percentage of the TotalVLDP OPEB Liability 49.19% 51.39% 38.40%
Virginia Local Disability Program (VLDP) - TeachersEmployer's Portion of the Net VLDP OPEB Liability 16.94127% 16.82241% 16.44512%Employers Proportionate Share of the Net VLDP OPEBLiability $ 98,486 $ 127,000 $ 98,000 Employer's Covered Payroll $ 81,239,317 $ 62,725,531 $ 49,489,310 Employer's Proportionate Share of the Net VLDP OPEBLiability as a Percentage of its Covered Payroll 0.12% 0.20% 0.21%Plan Fiduciary Net Position as a Percentage of the TotalVLDP OPEB Liability 74.12% 46.18% 31.96%
140

CITY OF VIRGINIA BEACH, VIRGINIASCHEDULES OF REQUIRED SUPPLEMENTAL INFORMATION
SCHEDULE OF OPEB GROUP LIFE INSURANCE ANNUAL CONTRIBUTIONS
Date
ContractuallyRequired
Contribution
Contributionsin Relation toContractually
RequiredContribution
ContributionDeficiency(Excess)
Employer'sCoveredPayroll
Contributionsas a % ofCoveredPayroll
Primary Government2010 $ 1,021,995 $ 577,462 $ 444,533 $ 213,874,865 0.27%2011 1,216,701 774,264 442,437 276,523,016 0.28%2012 1,250,484 795,763 454,721 284,200,896 0.28%2013 1,512,352 1,369,678 142,674 285,349,525 0.48%2014 1,552,232 1,405,795 146,437 292,873,827 0.48%2015 1,587,151 1,437,420 149,731 299,462,518 0.48%2016 1,618,686 1,465,980 152,706 305,412,468 0.48%2017 1,649,404 1,649,404 - 317,193,072 0.52%2018 1,707,355 1,707,355 - 328,337,502 0.52%2019 1,740,935 1,740,935 - 334,796,183 0.52%2020 1,786,400 1,786,400 - 343,539,339 0.52%
School Board - Nonprofessional2010 $ 149,737 $ 81,292 $ 68,445 $ 30,108,222 0.27%2011 180,009 114,551 65,458 40,911,148 0.28%2012 177,366 112,869 64,497 40,310,446 0.28%2013 214,874 194,603 20,271 40,542,262 0.48%2014 214,578 194,335 20,243 40,486,356 0.48%2015 221,058 200,204 20,854 41,709,123 0.48%2016 231,831 209,960 21,871 43,741,730 0.48%2017 230,517 230,517 - 44,330,131 0.52%2018 234,625 234,625 - 45,120,109 0.52%2019 242,000 242,000 - 46,160,454 0.52%2020 250,065 250,065 - 47,915,825 0.52%
School Board - Teachers2010 $ 1,413,188 $ 752,881 $ 660,307 $ 278,844,851 0.27%2011 1,702,047 1,083,121 618,926 386,828,969 0.28%2012 1,670,960 1,063,338 607,622 379,763,714 0.28%2013 2,020,542 1,829,925 190,617 381,234,424 0.48%2014 2,011,839 1,822,043 189,796 379,592,250 0.48%2015 2,053,604 1,859,868 193,736 387,472,533 0.48%2016 2,079,432 1,883,259 196,173 392,345,632 0.48%2017 2,087,447 2,087,447 - 401,432,134 0.52%2018 2,131,438 2,131,438 - 409,891,865 0.52%2019 2,190,000 2,190,000 - 418,203,923 0.52%2020 2,257,910 2,257,910 - 429,568,184 0.53%
141

CITY OF VIRGINIA BEACH, VIRGINIASCHEDULES OF REQUIRED SUPPLEMENTAL INFORMATION
SCHEDULE OF OPEB LINE OF DUTY ANNUAL CONTRIBUTIONS
Date
ContractuallyRequired
Contribution
Contributionsin Relation toContractually
RequiredContribution
ContributionDeficiency(Excess)
Employer'sCovered
EmployeePayroll
Contributions asa % of Covered
Payroll
Primary Government 2010 N/A** N/A** N/A** N/A** N/A** 2011 N/A** N/A** N/A** N/A** N/A** 2012 $ 399,191 $ 399,191 $ - $ 90,230,497 0.44% 2013 849,069 849,069 - 90,935,125 0.93% 2014 984,695 984,695 - 91,967,153 1.07% 2015 957,130 957,130 - 94,604,103 1.01% 2016 968,155 968,155 - 96,868,601 1.00% 2017 1,022,399 1,022,399 - 103,532,167 0.99% 2018 1,097,008 1,097,008 - 110,808,888 0.99% 2019 1,378,367 1,378,367 - 110,370,707 1.25% 2020 1,374,489 1,374,489 - 109,959,120 1.25%
**FY 2011 was the first year for the Line of Duty Act Program (LODA), however there were no contributions.
142

CITY OF VIRGINIA BEACH, VIRGINIASCHEDULES OF REQUIRED SUPPLEMENTAL INFORMATION
SCHEDULE OF OPEB VIRGINIA LOCAL DISABILITY PROGRAM ANNUAL CONTRIBUTIONS
Date
ContractuallyRequired
Contribution
Contributionsin Relation toContractually
RequiredContribution
ContributionDeficiency(Excess)
Employer'sCoveredPayroll
Contributionsas
a % ofCoveredPayroll
Primary Government 2010 N/A** N/A** N/A** N/A** N/A** 2011 N/A** N/A** N/A** N/A** N/A** 2012 N/A** N/A** N/A** N/A** N/A** 2013 N/A** N/A** N/A** N/A** N/A** 2014 $ 8,612 $ 8,612 $ - $ 1,435,308 0.60% 2015 68,668 68,668 - 11,444,652 0.60% 2016 137,137 137,137 - 22,856,172 0.60% 2017 205,536 205,536 - 34,255,962 0.60% 2018 281,957 281,957 - 46,992,859 0.60% 2019 376,838 376,838 - 60,780,141 0.62% 2020 536,372 536,372 - 74,495,268 0.72%
School Board - Nonprofessional 2010 N/A** N/A** N/A** N/A** N/A** 2011 N/A** N/A** N/A** N/A** N/A** 2012 N/A** N/A** N/A** N/A** N/A** 2013 N/A** N/A** N/A** N/A** N/A** 2014 $ 1,611 $ 1,611 $ - $ 268,436 0.60% 2015 18,242 18,242 - 3,040,304 0.60% 2016 40,146 40,146 - 6,691,000 0.60% 2017 57,365 57,365 - 9,560,850 0.60% 2018 71,950 71,950 - 11,991,585 0.60% 2019 102,908 102,908 - 14,290,947 0.72% 2020 122,065 122,065 - 16,950,791 0.72%
School Board - Teachers 2010 N/A** N/A** N/A** N/A** N/A** 2011 N/A** N/A** N/A** N/A** N/A** 2012 N/A** N/A** N/A** N/A** N/A** 2013 N/A** N/A** N/A** N/A** N/A** 2014 $ 2,253 $ 2,253 $ - $ 776,969 0.29% 2015 14,772 14,772 - 15,383,610 0.10% 2016 80,152 80,152 - 27,638,756 0.29% 2017 143,865 143,865 - 46,408,200 0.31% 2018 194,449 194,449 - 62,725,531 0.31% 2019 333,000 333,000 - 81,239,317 0.41% 2020 423,008 423,008 - 102,504,393 0.41%
**FY 2014 was the first year for the Virginia Local Disability Program
143

CITY OF VIRGINIA BEACH, VIRGINIASCHEDULES OF REQUIRED SUPPLEMENTAL INFORMATION
SCHEDULE OF OPEB HEALTH INSURANCE CREDIT PROGRAM ANNUAL CONTRIBUTIONS
Date
ContractuallyRequired
Contribution
Contributionsin Relation toContractually
RequiredContribution
ContributionDeficiency(Excess)
Employer'sCovered Payroll
Contributions asa % of Covered
Payroll
School Board - Teachers 2011 $ 4,150,250 $ 1,305,695 $ 2,844,555 $ 384,282,424 0.34% 2012 4,075,643 2,264,246 1,811,397 377,374,381 0.60% 2013 4,440,741 4,213,011 227,730 379,550,508 1.11% 2014 4,417,613 4,191,068 226,545 377,573,722 1.11% 2015 4,556,498 4,093,125 463,373 386,143,862 1.06% 2016 4,609,056 4,140,339 468,717 390,598,006 1.06% 2017 4,914,862 4,435,363 479,499 399,582,254 1.11% 2018 5,023,021 5,023,021 - 408,375,692 1.23% 2019 4,997,000 4,997,000 - 416,667,852 1.20% 2020 5,148,298 5,148,298 - 427,749,309 1.20%
Detailed information about the individual Cost sharing OPEB plans are available in the seperately issued VRS 2018 ComprehensiveAnnual Financial Report (CAFR). A copy of the 2018 VRS CAFR may be downloaded from the VRS website athttps://www.varetire.org/pdf/Publications/2019-annual-report.pdf, or by writing to the System's Chief Financial Officer at P.O. Box2500, Richmond, VA, 23218-2500.
144

OTHER SUPPLEMENTAL
INFORMATION


NONMAJOR
GOVERNMENTAL FUNDS


NONMAJOR GOVERNMENTAL FUNDS
Special Revenue Funds - are used to account for the proceeds of specific revenue sources (other than capital projects) whichare legally restricted to be expended for specific purposes.
Debt Service Fund - is used to account for the financial resources for, and the payment of, general long-term debt principal,interest, and related costs.
145

Exhibit 10CITY OF VIRGINIA BEACH, VIRGINIA
COMBINING BALANCE SHEETNONMAJOR GOVERNMENTAL FUNDS
JUNE 30, 2020
SpecialRevenue Funds
DebtService Fund
Total NonmajorGovernmental Funds
ASSETSCash and Investments $ 61,959,810 $ - $ 61,959,810Cash and Investments - Restricted 6,191,749 44,340,008 50,531,757Receivables (net of allowance for uncollectibles, where applicable):
Accounts 2,271,725 - 2,271,725Loans 4,858,523 - 4,858,523
Due from:Due from Other Funds 163,990 - 163,990Commonwealth 1,998,301 - 1,998,301Federal Government 3,707,964 - 3,707,964Inventories 141,784 - 141,784
Total Assets 81,293,846 44,340,008 125,633,854
LIABILITIESVouchers and Accounts Payable 5,036,991 - 5,036,991Due to Other Funds 1,960,792 - 1,960,792Unearned Revenue 3,808,262 - 3,808,262
Total Liabilities 10,806,045 - 10,806,045
FUND BALANCESRestricted for:
Debt Service - 44,340,008 44,340,008Housing and Community Development 8,857,050 - 8,857,050Judicial 504,605 - 504,605Public Safety 2,793,132 - 2,793,132Special Service District 2,358,378 - 2,358,378
Committed to:Agriculture 15,064,165 - 15,064,165Convention and Visitor Development 27,519,429 - 27,519,429Education 89,477 - 89,477Parks and Recreation 12,973,610 - 12,973,610Tax Increment Financing 1,186,075 - 1,186,075
Assigned to:Agriculture 658,310 - 658,310Judicial 522,500 - 522,500Public Safety 789,246 - 789,246Special Service District 493,981 - 493,981
Unassigned (3,322,157) - (3,322,157)Total Fund Balances 70,487,801 44,340,008 114,827,809
Total Liabilities, Deferred Inflows and Fund Balances $ 81,293,846 $ 44,340,008 $ 125,633,854
146

Exhibit 11CITY OF VIRGINIA BEACH, VIRGINIA
COMBINING STATEMENT OF REVENUES, EXPENDITURES, AND CHANGES IN FUND BALANCENONMAJOR GOVERNMENTAL FUNDSFOR THE YEAR ENDED JUNE 30, 2020
SpecialRevenue Funds
DebtService Fund
Total NonmajorGovernmental Funds
REVENUESGeneral Property Taxes - Real Estate $ 44,263,166 $ - $ 44,263,166Other Local Taxes 55,269,872 - 55,269,872Fines and Forfeitures 206,466 - 206,466Permits, Privilege Fees, and Regulatory Licenses 206,966 - 206,966From Use of Money and Property 3,248,759 6,108,988 9,357,747Charges for Services 15,865,825 - 15,865,825Miscellaneous 3,233,397 - 3,233,397From Commonwealth 25,763,387 - 25,763,387From Federal Government 67,910,314 341,961 68,252,275
Total Revenues 215,968,152 6,450,949 222,419,101
EXPENDITURESCurrent Operating:
Judicial 52,039,208 - 52,039,208Health 361,096 - 361,096Police 1,009,731 - 1,009,731Human Services 7,445,144 - 7,445,144Public Works 3,102,408 - 3,102,408Parks and Recreation 35,870,733 - 35,870,733Library 158,796 - 158,796Planning 1,152,170 - 1,152,170Agriculture 168,222 - 168,222Economic Development 21,286 - 21,286Convention and Visitor Development 13,284,175 - 13,284,175Fire 4,125,447 - 4,125,447Housing and Neighborhood Preservation 27,605,750 - 27,605,750General Government 42,058,231 - 42,058,231Emergency Medical Services 444,837 - 444,837Debt Service:
Principal Retirement 27,210,428 29,454,883 56,665,311Interest and Fiscal Charges 11,278,348 13,588,313 24,866,661
Total Expenditures 227,336,010 43,043,196 270,379,206Excess (Deficiency) of Revenues over (under) Expenditures (11,367,858) (36,592,247) (47,960,105)
OTHER FINANCING SOURCES (USES)Transfers In 36,220,210 43,271,075 79,491,285Transfers Out (42,641,139) - (42,641,139)Proceeds of Refunding Bonds - 80,329,587 80,329,587Premium on Bonds Sold - 8,734,990 8,734,990Payment to Refunding Bonds Escrow Agent - (89,022,077) (89,022,077)
Total Other Financing Sources and (Uses) (6,420,929) 43,313,575 36,892,646Net Change in Fund Balance (17,788,787) 6,721,328 (11,067,459)Fund Balance at Beginning of Year 88,276,588 37,618,680 125,895,268Fund Balance at End of Year $ 70,487,801 $ 44,340,008 $ 114,827,809
147

This Page Intentionally Left Blank
148

GENERAL FUND


GENERAL FUND
The General Fund is the general operating fund of the City which is used to account for all of the financial resources, exceptthose required to be accounted for in another fund.
149

Exhibit 12CITY OF VIRGINIA BEACH, VIRGINIA
GENERAL FUNDSCHEDULE OF REVENUES COMPARED TO FINAL BUDGET
FOR THE YEAR ENDED JUNE 30, 2020
Original Budget Final Budget Actual
VariancePositive
(Negative)General Property Taxes
Real Estate $ 556,766,602 $ 556,766,602 $ 556,552,700 $ (213,902)Personal Property 107,112,186 107,052,186 109,472,891 2,420,705Interest and Penalties on Personal Property 2,972,547 2,972,547 3,255,191 282,644Interest and Penalties on Real Estate Taxes 1,981,662 1,981,662 2,303,350 321,688
Total General Property Taxes 668,832,997 668,772,997 671,584,132 2,811,135
Other Local TaxesGeneral Sales 66,745,446 66,745,446 67,855,536 1,110,090Utility 49,578,224 49,578,224 45,584,479 (3,993,745)Business Licenses 51,892,052 51,892,052 52,759,292 867,240Automobile Licenses 11,652,769 11,652,769 10,112,035 (1,540,734)Bank Stock 3,987,443 3,987,443 3,348,538 (638,905)City Tax on Deeds 7,625,760 7,625,760 8,494,352 868,592City Tax on Wills 91,768 91,768 59,798 (31,970)Cigarette 10,433,892 10,433,892 9,663,350 (770,542)Amusement - - 7,117 7,117Hotel Taxes 7,794,883 7,794,883 6,719,833 (1,075,050)Restaurant Meals 44,608,734 41,038,223 38,238,135 (2,800,088)
Total Other Local Taxes 254,410,971 250,840,460 242,842,465 (7,997,995)
Permits, Privilege Fees, and Regulatory LicensesPolice Permits and Licenses 542,355 542,355 480,702 (61,653)Planning Permits and Licenses 4,457,525 4,457,525 4,384,051 (73,474)Other Permits, Fees and Licenses 47,090 47,090 40,851 (6,239)Public Works Fees 1,871 1,871 8,900 7,029Fire Permits 208,000 208,000 169,750 (38,250)
Total Permits, Privilege Fees, and Regulatory Licenses 5,256,841 5,256,841 5,084,254 (172,587)
Fines and ForfeituresCourt Fines and Forfeitures 2,649,419 2,649,419 1,970,481 (678,938)Overweight Vehicles Fees 215,000 215,000 110,852 (104,148)DUI Response Reimbursements 29,000 29,000 43,028 14,028Red Light Violations 1,500,000 1,500,000 1,510,637 10,637
Total Fines and Forfeitures 4,393,419 4,393,419 3,634,998 (758,421)
From Use of Money and PropertyRevenue from Use of Money:Interest on Bank Deposits 4,948,493 4,948,493 5,399,152 450,659Revenue from Use of Property:Farmers Market Fees 32,229 32,229 41,998 9,769Photocopying Machines 104,544 104,544 64,209 (40,335)Convention Center Rent 1,810,000 1,810,000 1,363,338 (446,662)Convention Center Concessions 1,201,200 1,201,200 919,435 (281,765)Rent - Amphitheatre 218,844 218,844 246,386 27,542Lease of Land and Property 1,168,251 1,168,251 712,349 (455,902)Tower/Antenna Leases 176,859 176,859 97,292 (79,567)
Total from Use of Money and Property 9,660,420 9,660,420 8,844,159 (816,261)
Charges For ServicesCourt Costs 1,161,192 1,161,192 1,107,339 (53,853)Police - False Alarm Fees 545,000 545,000 561,089 16,089Fire Services 370,900 370,900 246,135 (124,765)Animal Adoption Fees 33,200 33,200 34,055 855Other Charges and Fees 254,271 254,271 153,298 (100,973)Human Services 24,202,339 24,202,339 24,294,243 91,904Aquarium and Historical Houses 9,321,279 9,321,279 6,719,068 (2,602,211)Library Fees 336,000 336,000 190,746 (145,254)Planning Maps, Publications, and Fees 293,780 293,780 252,259 (41,521)Convention Center 163,223 163,223 103,304 (59,919)Other Services Provided 1,639,431 1,640,281 980,032 (660,249)Reimbursement - Freedom of Information Act Costs 18,400 18,400 26,013 7,613Water and Sewer Direct Charges 5,982,178 6,128,259 5,761,535 (366,724)Waste Management Direct Charges 1,738,861 1,738,861 1,738,861 -Storm Water Direct Charges 2,256,812 2,256,812 2,256,812 -Water and Sewer Right of Way Utility 4,000,000 4,000,000 4,000,000 -
Total Charges for Services 52,316,866 52,463,797 48,424,789 (4,039,008)
150(continued)

Exhibit 12CITY OF VIRGINIA BEACH, VIRGINIA
GENERAL FUNDSCHEDULE OF REVENUES COMPARED TO FINAL BUDGET
FOR THE YEAR ENDED JUNE 30, 2020
Original Budget Final Budget Actual
VariancePositive
(Negative)Miscellaneous Revenue
Returned Check Processing Charges 74,350 74,350 52,704 (21,646)Donations 100,400 206,600 171,765 (34,835)City Treasurer Charges 1,199,145 1,199,145 1,312,811 113,666Contemporary Arts 58,700 58,700 66,278 7,578Aquarium Foundation 1,183,526 1,183,526 914,485 (269,041)Sale of Properties - - 2,644 2,644Sale of Salvage Materials 502,000 502,000 302,631 (199,369)Refund of Surplus - Health Department 90,000 90,000 307,231 217,231DVP Street Light Reimbursement 510,000 510,000 21,657 (488,343)Reimbursement - DMV 657,000 657,000 59,739 (597,261)Miscellaneous 2,668,768 2,978,228 3,082,541 104,313
Total Miscellaneous Revenue 7,043,889 7,459,549 6,294,486 (1,165,063)
From CommonwealthRolling Stock Tax 14,640 14,640 6,502 (8,138)Mobile Homes Sales Tax 44,760 44,760 25,248 (19,512)Passenger Car Rental Tax 1,224,922 1,224,922 1,148,776 (76,146)Reimbursement - Treasurer 678,403 678,403 668,340 (10,063)Reimbursement - Commissioner of the Revenue 739,254 739,254 737,019 (2,235)Reimbursement - General Registrar's Salary 76,954 76,954 395,515 318,561Reimbursement - Clerk of Circuit Court 2,122,288 2,122,288 2,110,275 (12,013)Reimbursement - Commonwealth's Attorney 2,876,872 2,876,872 2,844,368 (32,504)Reimbursement - Health Department Automobile 120,099 120,099 17,096 (103,003)Reimbursement - State Aid Law Enforcement 12,162,602 12,162,602 12,162,604 2Personal Property Paid by Commonwealth 53,412,868 53,412,868 53,412,868 -State Prisoner Transportation 350,000 350,000 227,700 (122,300)Mental Health, Developmental Services and Substance Abuse 12,498,621 13,095,135 14,303,567 1,208,432Juvenile Justice Block Grant 3,868,127 3,868,127 4,865,669 997,542Circuit Court Clerk Technology - - 211,462 211,462Maintenance of Roads 50,000,889 50,000,889 50,180,619 179,730Recordation Fees 2,127,387 2,127,387 1,492,573 (634,814)Public Assistance Grants 15,919,482 16,679,022 17,092,750 413,728Medicaid 323,000 323,000 366,262 43,262DMV Select Program 136,079 136,079 109,123 (26,956)Virginia Commission For The Arts 4,500 4,500 5,275 775Wireless E-911 Services Board 1,479,749 1,479,749 1,578,041 98,292State Aid Library 252,710 252,710 236,603 (16,107)Other State Revenue 435 435 893,253 892,818
Total From Commonwealth 160,434,641 161,790,695 165,091,508 3,300,813
From Federal GovernmentPublic Law 95-469 - Refuge Revenue Sharing Act - - 82,601 82,601Indirect Costs - Social Services 846,732 846,732 895,909 49,177Federal Emergency Management Agency 102,914 330,050 227,136 (102,914)SEVAMP Grant 60,000 60,000 145,360 85,360Mental Health, Developmental Services and Substance Abuse 3,370,648 3,500,648 4,167,583 666,935USDA Juvenile Detention 65,829 65,829 122,015 56,186Public Assistance Grants 17,507,409 17,507,409 19,402,774 1,895,365Federal Reimbursement of Interest 282,763 282,763 122,093 (160,670)
Total From Federal Government 22,236,295 22,593,431 25,165,471 2,572,040
TOTAL REVENUES 1,184,586,339 1,183,231,609 1,176,966,262 (6,265,347)
Other Financing SourcesTransfers In 819,224 16,881,833 16,879,932 (1,901)Use of Fund Balance 34,055,240 73,951,966 - (73,951,966)Premium on Bonds Sold - - 738,393 738,393
Total Other Financing Sources 34,874,464 90,833,799 17,618,325 (73,215,474)
TOTAL REVENUES AND OTHER FINANCING SOURCES $ 1,219,460,803 $ 1,274,065,408 $ 1,194,584,587 $ (79,480,821)
151

Exhibit 13CITY OF VIRGINIA BEACH, VIRGINIA
GENERAL FUNDSCHEDULE OF EXPENDITURES COMPARED TO FINAL BUDGET
FOR THE YEAR ENDED JUNE 30, 2020
Original Budget Final Budget Actual
VariancePositive
(Negative)Legislative Department
Municipal Council $ 663,050 $ 666,050 $ 628,943 $ 37,107City Clerk 570,326 596,637 551,359 45,278
Total Legislative Department 1,233,376 1,262,687 1,180,302 82,385
Executive DepartmentCity Manager 2,531,814 2,507,415 2,421,239 86,176Organizational Development Office 624,907 659,617 591,392 68,225Media and Communication Group 1,796,015 1,861,862 1,841,006 20,856Volunteer Council 308,780 322,826 296,793 26,033
Total Executive Department 5,261,516 5,351,720 5,150,430 201,290
Law DepartmentCity Attorney 4,557,406 4,631,045 4,595,060 35,985
Finance DepartmentDirector of Finance:
Director's Office 1,511,776 1,560,405 1,328,651 231,754Controller's Office 1,123,324 1,151,891 941,220 210,671Payroll 805,234 817,950 844,252 (26,302)Purchasing 2,016,598 2,175,922 2,099,596 76,326Local Vehicle Registration 1,610,000 1,610,000 722,007 887,993
Total Director of Finance 7,066,932 7,316,168 5,935,726 1,380,442
Commissioner of the Revenue 4,829,737 5,062,612 5,031,995 30,617Board of Equalization 2,980 4,380 2,444 1,936City Real Estate Assessor 3,332,487 3,390,272 3,212,873 177,399Treasurer 6,196,789 6,382,467 5,511,945 870,522
Total Finance Department 21,428,925 22,155,899 19,694,983 2,460,916
Human Resource DepartmentDirector's Office 553,322 562,701 510,761 51,940Employee Relations 3,121,790 3,377,074 2,936,789 440,285Benefits Administration 22,638,990 22,317,433 7,456,922 14,860,511Occupational Safety 1,427,250 1,490,720 1,403,760 86,960
Total Human Resources Department 27,741,352 27,747,928 12,308,232 15,439,696
Judicial DepartmentCircuit Court 1,154,854 1,198,523 1,189,605 8,918General District Court 549,071 567,948 389,250 178,698Juvenile and Domestic Relations - District Court 224,774 227,225 185,908 41,317Commonwealth's Attorney 9,183,377 9,302,685 9,132,619 170,066Clerk of the Circuit Court 3,658,384 4,388,796 3,945,496 443,300Magistrates 54,858 54,858 44,064 10,794Juvenile Probation 1,530,820 1,536,200 1,068,688 467,512
Total Judicial Department 16,356,138 17,276,235 15,955,630 1,320,605
Health DepartmentPreventive Medicine 3,479,631 3,697,035 3,327,913 369,122
Human Services DepartmentAdministration 12,683,479 12,987,996 8,981,855 4,006,141Mental Health 23,085,324 24,040,368 21,018,058 3,022,310Developmental Services 22,376,329 22,738,856 22,890,052 (151,196)Substance Abuse 5,880,028 6,188,027 6,115,701 72,326Social Services 35,761,339 37,315,562 34,855,176 2,460,386Comprehensive Services Act Administration & Social Services 11,471,664 11,522,806 12,889,224 (1,366,418)Indian River Road ICF/MR 5,686,350 5,766,029 5,772,363 (6,334)Juvenile Detention Center 5,550,631 5,660,337 5,828,522 (168,185)
Total Human Services Department 122,495,144 126,219,981 118,350,951 7,869,030
152(continued)

Exhibit 13CITY OF VIRGINIA BEACH, VIRGINIA
GENERAL FUNDSCHEDULE OF EXPENDITURES COMPARED TO FINAL BUDGET
FOR THE YEAR ENDED JUNE 30, 2020
Original Budget Final Budget Actual
VariancePositive
(Negative)Police Department
Director's Office 3,273,890 4,132,651 3,411,144 721,507Personnel and Training 4,827,723 4,907,428 4,349,839 557,589Crime Prevention 76,698,775 79,086,497 59,954,884 19,131,613Investigative Division 18,160,145 18,475,937 18,469,648 6,289
Total Police Department 102,960,533 106,602,513 86,185,515 20,416,998
Public Works DepartmentDirector's Office 305,580 311,437 385,716 (74,279)Administration Services 7,361,176 7,376,808 7,343,088 33,720Real Estate Office 10,910,529 11,226,317 9,249,453 1,976,864Customer Service/Administration 65,330,703 67,697,433 56,278,171 11,419,262Support Services and Systems Support 1,012,407 1,025,149 933,538 91,611Facilities Management 1,571,596 1,612,822 1,396,362 216,460
Total Public Works Department 86,491,991 89,249,966 75,586,328 13,663,638
Library DepartmentDirector's Office 1,658,159 1,956,647 1,832,378 124,269Central Library 2,219,579 2,255,257 2,181,623 73,634Great Neck Area Library 666,209 679,206 675,237 3,969Bayside Area Library 1,060,715 1,077,614 1,035,408 42,206Oceanfront Area Library 701,477 712,489 693,583 18,906Kempsville Area Library 1,251,507 1,271,718 1,174,199 97,519Windsor Woods Area Library 680,440 691,144 679,043 12,101Pungo/Blackwater Area Library 408,484 415,152 384,622 30,530Princess Anne Library 1,128,293 1,146,147 1,077,539 68,608Joint Use Library 1,901,271 1,929,931 1,831,273 98,658Youth and Family Services 1,346,683 1,367,985 1,399,376 (31,391)Support Services 5,239,800 5,617,647 5,067,624 550,023
Total Library Department 18,262,617 19,120,937 18,031,905 1,089,032
Planning DepartmentDirector's Office 1,551,567 1,717,181 1,412,688 304,493Development Services 3,052,476 3,102,513 3,092,557 9,956Public Utilities - Development Services 332,419 337,972 335,013 2,959Current Planning 8,267,449 8,334,807 8,305,823 28,984Building Permits and Inspection 4,269,948 4,349,500 3,832,769 516,731Transportation Program 160,837 165,745 121,390 44,355Zoning Administration 1,356,202 1,373,610 1,255,268 118,342
Total Planning Department 18,990,898 19,381,328 18,355,508 1,025,820
Agriculture DepartmentDirector's Office 310,416 320,165 329,405 (9,240)Virginia Cooperative Extension 330,852 333,035 299,354 33,681Farmers Market 289,663 295,602 259,407 36,195
Total Agriculture Department 930,931 948,802 888,166 60,636
Economic Development DepartmentDirector of Economic Development 2,759,304 5,038,979 2,431,281 2,607,698Growsmart 394,709 441,304 329,610 111,694Development Opportunity Grants 2,500,000 2,500,000 153,988 2,346,012
Total Economic Development Department 5,654,013 7,980,283 2,914,879 5,065,404
153(continued)

Exhibit 13CITY OF VIRGINIA BEACH, VIRGINIA
GENERAL FUNDSCHEDULE OF EXPENDITURES COMPARED TO FINAL BUDGET
FOR THE YEAR ENDED JUNE 30, 2020
Original Budget Final Budget Actual
VariancePositive
(Negative)Convention and Visitor Development
Director's Office 1,705,126 1,769,611 1,497,482 272,129Tourism Marketing and Sales 548,521 556,496 625,288 (68,792)Convention Marketing and Sales 1,168,656 1,185,300 989,410 195,890Sports Marketing 634,929 642,818 522,222 120,596Convention Center 6,333,668 6,649,505 5,594,893 1,054,612
Total Convention and Visitor Development 10,390,900 10,803,730 9,229,295 1,574,435
Parks and Recreation DepartmentLandscape Administration 2,624,903 2,708,188 2,749,430 (41,242)Grounds Maintenance 7,641,800 7,780,803 7,369,420 411,383Parks Maintenance 3,058,058 3,237,195 2,845,766 391,429Special Zones Management 803,269 814,521 766,026 48,495Resort Area Landscaping 734,398 742,859 683,009 59,850
Total Parks and Recreation Department 14,862,428 15,283,566 14,413,651 869,915
Cultural AffairsCultural Affairs 1,507,735 1,591,125 1,230,987 360,138Sandler Center 750,211 2,686,049 1,060,846 1,625,203Arts and Humanities Commission 885,000 885,000 864,655 20,345
Total Cultural Affair 3,142,946 5,162,174 3,156,488 2,005,686
Boards and CommissionsGeneral Registrar 1,733,731 2,558,950 2,262,937 296,013Audit Services 938,831 955,412 823,608 131,804COG - Community Organization Grants 500,599 500,599 500,599 -Lease/Rent of Facilities 4,380,800 4,594,201 1,991,265 2,602,936Regional Participation 2,584,135 2,576,235 2,548,661 27,574Vehicle Replacements 5,357,514 5,845,764 4,538,037 1,307,727Revenue Reimbursements 12,334,917 12,334,917 10,569,506 1,765,411Independent Financial Services 164,999 164,999 164,557 442Computer Replacement Program 1,728,171 2,855,207 2,552,515 302,692
Total Boards and Commissions 29,723,697 32,386,284 25,951,685 6,434,599
Fire DepartmentFire Marshall's Office 2,536,286 2,610,334 2,837,516 (227,182)Fire Administration 2,193,774 2,926,898 2,492,763 434,135Fire Operations 49,832,546 51,606,326 37,894,670 13,711,656Emergency Management 548,202 1,700,294 171,033 1,529,261Fire Training 1,272,528 1,275,122 1,400,132 (125,010)
Total Fire Department 56,383,336 60,118,974 44,796,114 15,322,860
Information TechnologyIT Business Center 5,748,003 5,846,586 5,463,570 383,016Applications Support 8,502,047 9,428,106 8,125,447 1,302,659Operations Support 1,483,824 1,513,607 1,128,765 384,842System Support 8,503,662 8,617,275 7,395,667 1,221,608Center for GIS 1,920,069 1,953,323 1,895,138 58,185Video Services - - 279 (279)GF Telecommunications 1,065,747 1,110,665 848,795 261,870Technology Services - 11,223 58,343 (47,120)Mail Services 185,049 187,213 250,514 (63,301)
Total Information Technology 27,408,401 28,667,998 25,166,518 3,501,480
154(continued)

Exhibit 13CITY OF VIRGINIA BEACH, VIRGINIA
GENERAL FUNDSCHEDULE OF EXPENDITURES COMPARED TO FINAL BUDGET
FOR THE YEAR ENDED JUNE 30, 2020
Original Budget Final Budget Actual
VariancePositive
(Negative)Emergency Communications and Citizens Services
Emergency Communications 8,421,734 8,715,602 5,235,879 3,479,723Director's Office 237,225 241,136 274,546 (33,410)Administration 463,281 469,439 424,794 44,645Citizen Services 935,736 953,075 856,341 96,734Training 100,824 101,178 39,580 61,598Technology and Support 824,109 835,690 800,761 34,929
Total Emergency Communications and Citizen Services 10,982,909 11,316,120 7,631,901 3,684,219
Housing and Neighborhood PreservationCode Enforcement 6,273,110 6,431,792 5,814,707 617,085
Museums DepartmentAquarium and Marine Science Center 11,088,196 11,334,871 9,225,975 2,108,896Aquarium Foundation 1,183,526 1,199,691 925,033 274,658Historical Preservation - 95,040 539 94,501
Total Museum Department 12,271,722 12,629,602 10,151,547 2,478,055
Budget and Management Services DepartmentDirector's Office 1,451,354 1,474,793 1,324,913 149,880
Emergency Medical ServicesDirector's Office 835,507 917,012 821,836 95,176Operations 3,865,545 3,963,053 3,625,265 337,788Lifeguard Services 2,236,365 2,268,004 2,329,755 (61,751)Training 883,336 898,031 829,433 68,598Emergency Response System 4,523,363 4,570,650 2,482,696 2,087,954Regulation & Enforcement 236,743 240,549 266,133 (25,584)
Total Emergency Medical Services 12,580,859 12,857,299 10,355,118 2,502,181
Debt ServicePrincipal Retirement 36,633,786 36,633,786 36,633,786 -Interest and Fiscal Charges 17,780,444 17,780,444 16,141,352 1,639,092
Total Debt Service 54,414,230 54,414,230 52,775,138 1,639,092
EducationSchool Operating 405,328,824 417,050,828 378,023,202 39,027,626School Capital Projects 3,591,000 10,930,247 10,930,247 -School Operating from Reserves 6,550,000 12,350,000 6,550,000 5,800,000
Total Education 415,469,824 440,331,075 395,503,449 44,827,626
Total Department Expenditures 1,091,200,187 1,143,503,996 988,796,326 154,707,670
155(continued)

Exhibit 13CITY OF VIRGINIA BEACH, VIRGINIA
GENERAL FUNDSCHEDULE OF EXPENDITURES COMPARED TO FINAL BUDGET
FOR THE YEAR ENDED JUNE 30, 2020
Original Budget Final Budget Actual
VariancePositive
(Negative)Other Financing Uses
Transfers Out:General Debt Service 42,658,736 42,658,736 42,658,736 -Housing and Neighborhood Preservation 507,868 517,729 517,729 -General Government Capital Projects 22,209,467 24,631,244 24,631,244 -Engineering and Highways Capital Projects 13,255,953 13,255,953 13,255,953 -Parks and Recreation Capital Projects 3,588,418 3,588,418 3,588,418 -Economic & Tourism Capital Projects 3,034,890 2,434,920 2,434,920 -Coastal Capital Projects 11,388,729 10,003,729 10,003,729 -Grants Consolidated 994,714 1,131,801 1,130,474 1,327Sheriff's Department 23,990,583 25,421,343 25,421,343 -Parks and Recreation 6,415,983 6,664,325 6,664,325 -Federal Section 8 74,742 95,473 95,473 -Federal Housing Assistance Program 119,568 115,815 115,815 -Public Safety City Marina 20,965 20,965 20,965 -Oyster Heritage Fund - 20,961 20,961 -
Total Other Financing Uses 128,260,616 130,561,412 130,560,085 1,327
TOTAL EXPENDITURES AND OTHER FINANCING SOURCES $ 1,219,460,803 $ 1,274,065,408 $ 1,119,356,411 $ 154,708,997
156

NONMAJOR
SPECIAL REVENUE FUNDS


NONMAJOR SPECIAL REVENUE FUNDS
The Nonmajor Special Revenue Funds are used to account for and report the proceeds of specific revenue sourcesthat are restricted or committed to expenditure for specified purposes other than debt service or capital projects.
The City has the following Nonmajor Special Revenue Funds:
Agriculture Reserve Program - accounts for revenue and expenses to promote and encourage the preservation offarmland in the rural southern portion of the City, in which agricultural uses predominate. As established by CityCouncil, this is a voluntary purchase of development rights rather than regulatory, . Fund balance will be used forpayments of future interest costs of U.S. Treasury Securities and the maturing interest on each agreement.
Central Business District South Tax Increment Financing - accounts for incremental growth in real estate taxrevenues and debt service funding of public parking and other public improvements in this business district. Fundbalance is maintained to meet planned construction and debt service costs for improvements in this district asapproved by City Council.
Combined Area Dredging Projects – this fund supports the special service districts of Old Donation Creek,Bayville Creek Shadowlawn, Chesopeian Colony, Harbour Point, Gills Cove and Hurds Cove, where additional realestate taxes are assessed on residents of those districts and collected to provide neighborhood channel dredging ofcreeks and rivers.
Emergency FEMA - accounts for receipts from the Federal Emergency Management Agency (FEMA), for the costof providing urban search and rescue services in support of disaster declarations, and reimbursements to the City forthe cost of local disasters. The level of fund balance is subject to final audit by the Inspector General.
Federal Section Eight Program - accounts for funds received from the Federal Department of Housing and UrbanDevelopment to provide rental assistance to low and moderate income families. A separate fund is required by theFederal government and fund balance must be used for rental assistance.
Forfeited Assets – accounts for the City’s share of Federal revenues derived from any Federal agency where moneyor assets are seized. If the Commonwealth’s Attorney is involved in the case, the department gets a portion of thefunds. All State seizures are divided with the Commonwealth’s Attorney receiving 25% and the Police Departmentreceiving 75%. All real estate seized is split 50%/50% between the Commonwealth’s Attorney and the PoliceDepartment. Fund balance must be used in compliance with Federal and State regulations to fund Police orCommonwealth’s Attorney projects.
Grants Consolidated - accounts for certain Commonwealth of Virginia and Federal Grants (with matching localfunds, if required).
Housing and Neighborhood Preservation - accounts for the combined activities of the Federal CommunityDevelopment Block Grant (CDBG), Federal Housing Assistance Grant, Community Development Loan andprograms, and Virginia State Rental Assistance Program (SRAP). This fund supports the administration of bothcapital improvement projects in target neighborhoods and various other housing programs. The uses of fund balanceare restricted to the federal and state programs that generated the funds.
157

Law Library - accounts for the revenues and expenditures of providing legal information and research. Revenuesare raised through a set charge per civil court case and donations, which are used for library operations.
Open Space - accounts for the acquisition and preservation of land in the City of Virginia Beach. This fund receivesdedicated revenues from a percentage of the restaurant meal tax
Parks and Recreation - accounts for revenues raised through Parks and Recreation programs. This fund alsoreceives dedicated funding from a portion of the real estate taxes to support and maintain the City’s recreationcenters.
Sandbridge Special Service District - accounts for the revenues raised by the additional real estate tax, hotel taxand other Sandbridge related revenue. The Virginia Beach code restricts the uses of fund balance to CapitalImprovement Program projects associated with beach and shoreline restoration and maintenance within theSandbridge District.
Sandbridge Tax Increment Financing– accounts for the incremental growth in real estate tax revenues within thedistrict. These incremental revenues are generated by assessment growth beyond the base year, and are used tosupport beach and shoreline restoration in the Sandbridge district as established by City Council.
Sheriff's Department - accounts for the cost of the care and custody of persons placed in the Virginia BeachCorrectional Center by the courts and for the operation of the Sheriff’s Department, as established by City Council.
Tourism Advertising Program - accounts for revenue and expenses related to tourism advertising. This fundreceives dedicated funding from a percentage of the hotel room tax and restaurant meal tax. There is a City Councilappointed committee that oversees the use of these funds.
Tourism Investment Program - accounts for the revenue streams to fund tourism related capital projects andexpenditures for oceanfront programs and events, maintenance, operating costs, and debt service of tourism-relatedprojects, as established by City Council. This fund receives dedicated funding from a percentage of the followinglocal taxes: amusement, hotel room, and restaurant meal tax receipts.
Town Center Special Service District – established to provide for the maintenance of public parking facilities andother infrastructure in conjunction with realizing a long-term City Council goal of developing a town center. This issupported by revenues from an additional real estate tax rate applied to each property owner in the Central BusinessDistrict (CBD) within the Pembroke area of the City.
Wetlands Board Mitigation – accounts for the fines assessed for the destruction of wetlands and are to be used forthe purchase of land and re-creation of wetlands.
158

This Page Intentionally Left Blank
159

CITY OF VIRGINIA BEACH, VIRGINIACOMBINING BALANCE SHEET
NONMAJOR SPECIAL REVENUE FUNDSJUNE 30, 2020
Agriculture ReserveProgram
Central BusinessDistrict South Tax
Increment FinancingCombined Area
Dredging Projects Emergency FEMAASSETS
Cash and Investments $ 15,722,903 $ 1,186,075 $ 493,981 $ -Restricted Cash - - - -Accounts Receivable - - - -Loans Receivable - - - -Due from Other Funds - - - -Due from Commonwealth - - - -Due from Federal Government - - - 864,129Inventories - - - -
Total Assets 15,722,903 1,186,075 493,981 864,129
LIABILITIESVouchers and Accounts Payable 428 - - 466Due to Other Funds - - - 283,961Unearned Revenue - - - -
Total Liabilities 428 - - 284,427
FUND BALANCESRestricted for:
Housing and Community Development - - - -Judicial - - - -Public Safety - - - 579,702Special Service District - - - -
Committed for:Agriculture 15,064,165 - - -Convention and Visitor Development - - - -Education - - - -Parks and Recreation - - - -Tax Increment Financing - 1,186,075 - -
Assigned to:Agriculture 658,310 - - -Judicial - - - -Public Safety - - - -Special Service District - - 493,981 -
Unassigned - - - -Total Fund Balances 15,722,475 1,186,075 493,981 579,702
TOTAL LIABILITIES AND FUND BALANCES $ 15,722,903 $ 1,186,075 $ 493,981 $ 864,129
160

Exhibit 14CITY OF VIRGINIA BEACH, VIRGINIA
COMBINING BALANCE SHEETNONMAJOR SPECIAL REVENUE FUNDS
JUNE 30, 2020
Federal Section EightProgram Forfeited Assets Grants Consolidated
Housing andNeighborhoodPreservation Law Library Open Space
$ - $ - $ 81,964 $ - $ 94,424 $ 1,318,306109,950 4,067,823 - 2,013,976 - -
1,672,309 - 23,999 55,786 - -- - - 4,858,523 - -- - - 713 - -- - 607,957 26,720 - -
346,409 - 1,351,771 1,142,300 - -- - - - - -
2,128,668 4,067,823 2,065,691 8,098,018 94,424 1,318,306
172,544 38,042 874,236 332,931 4,947 748693,275 - - 168,909 - -
1,977 - 3,707,269 - - -867,796 38,042 4,581,505 501,840 4,947 748
1,260,872 - - 7,596,178 - -- 504,605 - - - -- 2,213,430 - - - -- - - - - -
- - - - - -- - - - - -- - - - 89,477 -- - - - - 1,317,558- - - - - -
- - - - - -- 522,500 - - - -- 789,246 - - - -- - - - - -- - (2,515,814) - - -
1,260,872 4,029,781 (2,515,814) 7,596,178 89,477 1,317,558
$ 2,128,668 $ 4,067,823 $ 2,065,691 $ 8,098,018 $ 94,424 $ 1,318,306
161(continued)

Exhibit 14CITY OF VIRGINIA BEACH, VIRGINIA
COMBINING BALANCE SHEETNONMAJOR SPECIAL REVENUE FUNDS
JUNE 30, 2020
Parks and RecreationSandbridge Special
Service DistrictSandbridge Tax
Increment Financing Sheriff's DepartmentASSETS
Cash and Investments $ 11,767,014 $ 440,826 $ - $ -Restricted Cash - - - -Accounts Receivable 138,708 - - -Loans Receivable - - - -Due from Other Funds 163,277 - - -Due from Commonwealth - - - 1,363,624Due from Federal Government - - - 3,355Inventories - - - 141,784
Total Assets 12,068,999 440,826 - 1,508,763
LIABILITIESVouchers and Accounts Payable 721,047 3,375 - 1,500,459Due to Other Funds - - - 814,647Unearned Revenue 99,016 - - -
Total Liabilities 820,063 3,375 - 2,315,106
FUND BALANCESRestricted for:
Housing and Community Development - - - -Judicial - - - -Public Safety - - - -Special Service District - 437,451 - -
Committed for:Agriculture - - - -Convention and Visitor Development - - - -Education - - - -Parks and Recreation 11,248,936 - - -Tax Increment Financing - - - -
Assigned to:Agriculture - - - -Judicial - - - -Public Safety - - - -Special Service District - - - -
Unassigned - - - (806,343)Total Fund Balances 11,248,936 437,451 - (806,343)
TOTAL LIABILITIES AND FUND BALANCES $ 12,068,999 $ 440,826 $ - $ 1,508,763
162

Exhibit 14CITY OF VIRGINIA BEACH, VIRGINIA
COMBINING BALANCE SHEETNONMAJOR SPECIAL REVENUE FUNDS
JUNE 30, 2020
Tourism AdvertisingProgram
Tourism InvestmentProgram
Town Center SpecialService District
Wetlands BoardMitigation Totals
$ 4,724,114 $ 23,691,636 $ 2,031,451 $ 407,116 $ 61,959,810- - - - 6,191,749- 380,923 - - 2,271,725- - - - 4,858,523- - - - 163,990- - - - 1,998,301- - - - 3,707,964- - - - 141,784
4,724,114 24,072,559 2,031,451 407,116 81,293,846
717,477 559,767 110,524 - 5,036,991- - - - 1,960,792- - - - 3,808,262
717,477 559,767 110,524 - 10,806,045
- - - - 8,857,050- - - - 504,605- - - - 2,793,132- - 1,920,927 - 2,358,378
- - - - 15,064,1654,006,637 23,512,792 - - 27,519,429
- - - - 89,477- - - 407,116 12,973,610- - - - 1,186,075
- - - - 658,310- - - - 522,500- - - - 789,246- - - - 493,981- - - - (3,322,157)
4,006,637 23,512,792 1,920,927 407,116 70,487,801
$ 4,724,114 $ 24,072,559 $ 2,031,451 $ 407,116 $ 81,293,846
163

CITY OF VIRGINIA BEACH, VIRGINIACOMBINING STATEMENT OF REVENUES, EXPENDITURES AND CHANGES IN FUND BALANCE
NONMAJOR SPECIAL REVENUE FUNDSFOR THE YEAR ENDED JUNE 30, 2020
Agriculture ReserveProgram
Central BusinessDistrict South Tax
Increment FinancingCombined Area
Dredging Projects Emergency FEMA
REVENUESGeneral Property Taxes $ 5,019,374 $ 6,558,503 $ 652,488 $ -Other Local Taxes - 500,000 - -Fines and Forfeitures - - - -Permits, Privilege Fees, and Regulatory Licenses - - - -From Use of Money and Property 309,028 8,306 - -Charges for Services - - - -Miscellaneous - - - -From Commonwealth 173,233 - - 117,059From Federal Government - - - 627,745
Total Revenues 5,501,635 7,066,809 652,488 744,804
EXPENDITURESCurrent:
Judicial - - - -Health - - - -Police - - - -Human Services - - - -Public Works - - - -Parks and Recreation - - - -Library - - - -Planning - - - -Agriculture 168,222 - - -Economic Development - - - -Convention and Visitor Development - - - -Fire - - - -Housing and Neighborhood Preservation - - - -General Government - - - 1,324,995Emergency Medical Services - - - -
Debt Service:Principal Retirement - 6,102,236 - -Interest and Fiscal Charges 2,448,609 2,125,570 - -
Total Expenditures 2,616,831 8,227,806 - 1,324,995
EXCESS OF REVENUES OVER(UNDER) EXPENDITURES 2,884,804 (1,160,997) 652,488 (580,191)
OTHER FINANCING SOURCES (USES)Transfers In - - - -Transfers Out (1,602,339) (150,000) (161,678) -
Total Other Financing Sources (Uses) (1,602,339) (150,000) (161,678) -
EXCESS OF REVENUES ANDOTHER FINANCING SOURCESOVER (UNDER) EXPENDITURESAND OTHER FINANCING USES 1,282,465 (1,310,997) 490,810 (580,191)
FUND BALANCES - JULY 1 14,440,010 2,497,072 3,171 1,159,893
FUND BALANCES - JUNE 30 $ 15,722,475 $ 1,186,075 $ 493,981 $ 579,702
164

Exhibit 15CITY OF VIRGINIA BEACH, VIRGINIA
COMBINING STATEMENT OF REVENUES, EXPENDITURES AND CHANGES IN FUND BALANCENONMAJOR SPECIAL REVENUE FUNDS
FOR THE YEAR ENDED JUNE 30, 2020
Federal SectionEight Program Forfeited Assets Grants Consolidated
Housing andNeighborhoodPreservation Law Library Open Space
$ - $ - $ - $ - $ - $ -- - - - - 4,911,193- - - - - -- - - - - -
14,312 81,113 - 54,748 2,589 9,830- - 185 - 205,005 -
2,866,787 - 180,461 323 1,602 -- 399,360 4,629,964 1,189,192 - -
19,341,205 144,327 45,317,230 2,225,250 - -22,222,304 624,800 50,127,840 3,469,513 209,196 4,921,023
- 11,909 832,754 - - -- - 361,096 - - -- 51,756 957,975 - - -- - 7,445,144 - - -- - 20,000 - - -- - 16,049 - - 333,649- - - - 158,796 -- - - - - -- - - - - -- - 21,286 - - -- - - - - -- - 4,125,447 - - -
21,909,516 - 1,983,970 3,712,264 - -- - 38,772,082 - - -- - 444,837 - - -
- - - - - 2,041,205- - - - - 464,959
21,909,516 63,665 54,980,640 3,712,264 158,796 2,839,813
312,788 561,135 (4,852,800) (242,751) 50,400 2,081,210
95,473 - 1,152,713 650,391 - -(1,734) - (343,968) (128,858) (40,000) (2,552,644)93,739 - 808,745 521,533 (40,000) (2,552,644)
406,527 561,135 (4,044,055) 278,782 10,400 (471,434)
854,345 3,468,646 1,528,241 7,317,396 79,077 1,788,992
$ 1,260,872 $ 4,029,781 $ (2,515,814) $ 7,596,178 $ 89,477 $ 1,317,558
165(continued)

Exhibit 15CITY OF VIRGINIA BEACH, VIRGINIA
COMBINING STATEMENT OF REVENUES, EXPENDITURES AND CHANGES IN FUND BALANCENONMAJOR SPECIAL REVENUE FUNDS
FOR THE YEAR ENDED JUNE 30, 2020
Parks and RecreationSandbridge Special
Service DistrictSandbridge Tax
Increment Financing Sheriff's Department
REVENUESGeneral Property Taxes $ 19,385,940 $ 729,251 $ 10,293,538 $ -Other Local Taxes - 4,125,227 - -Fines and Forfeitures 1,224 - - -Permits, Privilege Fees, and Regulatory Licenses - - - -From Use of Money and Property 1,408,555 12,038 118,970 7,303Charges for Services 11,042,388 - - 4,593,774Miscellaneous 117,363 - - 6,404From Commonwealth 8,914 - - 19,245,665From Federal Government - - - 254,557
Total Revenues 31,964,384 4,866,516 10,412,508 24,107,703
EXPENDITURESCurrent:
Judicial - - - 51,194,545Health - - - -Police - - - -Human Services - - - -Public Works - 523,267 - -Parks and Recreation 34,852,689 - - -Library - - - -Planning - - - -Agriculture - - - -Economic Development - - - -Convention and Visitor Development - - - -Fire - - - -Housing and Neighborhood Preservation - - - -General Government - - - -Emergency Medical Services - - - -
Debt Service:Principal Retirement 2,640,113 - - -Interest and Fiscal Charges 1,580,340 - - -
Total Expenditures 39,073,142 523,267 - 51,194,545
EXCESS OF REVENUES OVER(UNDER) EXPENDITURES (7,108,758) 4,343,249 10,412,508 (27,086,842)
OTHER FINANCING SOURCES (USES)Transfers In 6,685,290 65,000 - 25,421,343Transfers Out (5,621,568) (4,957,001) (15,367,008) (10,404)
Total Other Financing Sources (Uses) 1,063,722 (4,892,001) (15,367,008) 25,410,939
EXCESS OF REVENUES ANDOTHER FINANCING SOURCESOVER (UNDER) EXPENDITURESAND OTHER FINANCING USES (6,045,036) (548,752) (4,954,500) (1,675,903)
FUND BALANCES - JULY 1 17,293,972 986,203 4,954,500 869,560
FUND BALANCES - JUNE 30 $ 11,248,936 $ 437,451 $ - $ (806,343)
166

Exhibit 15CITY OF VIRGINIA BEACH, VIRGINIA
COMBINING STATEMENT OF REVENUES, EXPENDITURES AND CHANGES IN FUND BALANCENONMAJOR SPECIAL REVENUE FUNDS
FOR THE YEAR ENDED JUNE 30, 2020
Tourism AdvertisingProgram
Tourism InvestmentProgram
Town Center SpecialService District
Wetlands BoardMitigation Totals
$ - $ - $ 1,624,072 $ - $ 44,263,16611,000,267 34,733,185 - - 55,269,872
- - 179,066 26,176 206,466- 206,966 - - 206,966
61,297 787,970 363,992 8,708 3,248,7597,042 - 17,431 - 15,865,8256,669 53,334 454 - 3,233,397
- - - - 25,763,387- - - - 67,910,314
11,075,275 35,781,455 2,185,015 34,884 215,968,152
- - - - 52,039,208- - - - 361,096- - - - 1,009,731- - - - 7,445,144- 2,559,141 - - 3,102,408- 668,346 - - 35,870,733- - - - 158,796- 1,152,170 - - 1,152,170- - - - 168,222- - - - 21,286
9,830,757 3,453,418 - - 13,284,175- - - - 4,125,447- - - - 27,605,750- - 1,961,154 - 42,058,231- - - - 444,837
- 16,426,874 - - 27,210,428- 4,658,870 - - 11,278,348
9,830,757 28,918,819 1,961,154 - 227,336,010
1,244,518 6,862,636 223,861 34,884 (11,367,858)
2,000,000 - 150,000 - 36,220,210(56,838) (11,014,873) (632,226) - (42,641,139)
1,943,162 (11,014,873) (482,226) - (6,420,929)
3,187,680 (4,152,237) (258,365) 34,884 (17,788,787)
818,957 27,665,029 2,179,292 372,232 88,276,588
$ 4,006,637 $ 23,512,792 $ 1,920,927 $ 407,116 $ 70,487,801
167

Exhibit 15-ACITY OF VIRGINIA BEACH, VIRGINIA
AGRICULTURE RESERVE PROGRAM SPECIAL REVENUE FUNDSCHEDULE OF REVENUES, EXPENDITURES, AND CHANGES IN FUND BALANCE - BUDGET AND ACTUAL
FOR THE YEAR ENDED JUNE 30, 2020
Budget Amounts
VarianceFinal Budget
PositiveOriginal Final Actual Amounts (Negative)
REVENUESReal Estate Property Taxes $ 5,146,034 $ 5,146,034 $ 5,019,374 $ (126,660)From Use of Money and Property 143,880 143,880 309,028 165,148From Commonwealth - 173,233 173,233 -
Total Revenues 5,289,914 5,463,147 5,501,635 38,488
EXPENDITURESAgriculture Reserve Program 223,779 398,137 168,222 229,915Debt Service:
Interest and Fiscal Charges 4,457,539 3,845,200 2,448,609 1,396,591Total Expenditures 4,681,318 4,243,337 2,616,831 1,626,506
EXCESS OF REVENUES OVER(UNDER) EXPENDITURES 608,596 1,219,810 2,884,804 1,664,994
OTHER FINANCING SOURCES (USES)Transfers Out (1,980,000) (1,602,339) (1,602,339) -Use of Fund Balance 1,371,404 382,529 - (382,529)
Total Other Financing Sources (Uses) (608,596) (1,219,810) (1,602,339) (382,529)
EXCESS OF REVENUES ANDOTHER FINANCING SOURCESOVER (UNDER) EXPENDITURESAND OTHER FINANCING USES - - 1,282,465 1,282,465
FUND BALANCE - JULY 1 14,440,010 14,440,010 14,440,010 -
FUND BALANCE - JUNE 30 $ 14,440,010 $ 14,440,010 $ 15,722,475 $ 1,282,465
168

Exhibit 15-BCITY OF VIRGINIA BEACH, VIRGINIA
CENTRAL BUSINESS DISTRICT SOUTH TAX INCREMENT FINANCING SPECIAL REVENUE FUNDSCHEDULE OF REVENUES, EXPENDITURES, AND CHANGES IN FUND BALANCE - BUDGET AND ACTUAL
FOR THE YEAR ENDED JUNE 30, 2020
Budget Amounts
VarianceFinal Budget
PositiveOriginal Final Actual Amounts (Negative)
REVENUESReal Estate Property Taxes $ 8,033,042 $ 8,033,042 $ 6,558,503 $ (1,474,539)Other Local Taxes 500,000 500,000 500,000 -From Use of Money and Property 2,000 2,000 8,306 6,306
Total Revenues 8,535,042 8,535,042 7,066,809 (1,468,233)
EXPENDITURESDebt Service:
Principal Retirement 6,102,236 6,102,236 6,102,236 -Interest and Fiscal Charges 2,134,275 2,134,275 2,125,570 8,705
Total Expenditures 8,236,511 8,236,511 8,227,806 8,705Contingencies 148,531 148,531 - 148,531
EXCESS OF REVENUES OVER(UNDER) EXPENDITURES 150,000 150,000 (1,160,997) (1,310,997)
OTHER FINANCING SOURCES (USES)Transfers Out (150,000) (150,000) (150,000) -
Total Other Financing Sources (Uses) (150,000) (150,000) (150,000) -
EXCESS OF REVENUES ANDOTHER FINANCING SOURCESOVER (UNDER) EXPENDITURESAND OTHER FINANCING USES - - (1,310,997) (1,310,997)
FUND BALANCE - JULY 1 2,497,072 2,497,072 2,497,072 -
FUND BALANCE - JUNE 30 $ 2,497,072 $ 2,497,072 $ 1,186,075 $ (1,310,997)
169

Exhibit 15-CCITY OF VIRGINIA BEACH, VIRGINIA
COMBINED AREA DREDGING PROJECTS SPECIAL REVENUE FUNDSCHEDULE OF REVENUES, EXPENDITURES, AND CHANGES IN FUND BALANCE - BUDGET AND ACTUAL
FOR THE YEAR ENDED JUNE 30, 2020
Budget Amounts
VarianceFinal Budget
PositiveOriginal Final Actual Amounts (Negative)
REVENUESReal Estate Property Taxes $ 649,470 $ 649,470 $ 652,488 $ 3,018
Total Revenues 649,470 649,470 652,488 3,018
EXPENDITURESReserves 489,365 489,365 - 489,365
EXCESS OF REVENUES OVER(UNDER) EXPENDITURES 160,105 160,105 652,488 492,383
OTHER FINANCING SOURCES (USES)Transfers Out (161,678) (161,678) (161,678) -Use of Fund Balance 1,573 1,573 - (1,573)
Total Other Financing Sources (Uses) (160,105) (160,105) (161,678) (1,573)
EXCESS OF REVENUES ANDOTHER FINANCING SOURCESOVER (UNDER) EXPENDITURESAND OTHER FINANCING USES - - 490,810 490,810
FUND BALANCE - JULY 1 3,171 3,171 3,171 -
FUND BALANCE - JUNE 30 $ 3,171 $ 3,171 $ 493,981 $ 490,810
170

Exhibit 15-DCITY OF VIRGINIA BEACH, VIRGINIA
EMERGENCY FEMA SPECIAL REVENUE FUNDSCHEDULE OF REVENUES, EXPENDITURES, AND CHANGES IN FUND BALANCE - BUDGET AND ACTUAL
FOR THE YEAR ENDED JUNE 30, 2020
Budget Amounts
VarianceFinal Budget
PositiveOriginal Final Actual Amounts (Negative)
REVENUESFrom Commonwealth $ - $ - $ 117,059 $ 117,059From Federal Government - 1,309,366 627,745 (681,621)
Total Revenues - 1,309,366 744,804 (564,562)
EXPENDITURESFEMA Operations - 1,309,366 1,324,995 (15,629)
EXCESS OF REVENUES ANDOTHER FINANCING SOURCESOVER (UNDER) EXPENDITURESAND OTHER FINANCING USES - - (580,191) (580,191)
FUND BALANCE - JULY 1 1,159,893 1,159,893 1,159,893 -
FUND BALANCE - JUNE 30 $ 1,159,893 $ 1,159,893 $ 579,702 $ (580,191)
171

Exhibit 15-ECITY OF VIRGINIA BEACH, VIRGINIA
FEDERAL SECTION EIGHT PROGRAM SPECIAL REVENUE FUNDSCHEDULE OF REVENUES, EXPENDITURES, AND CHANGES IN FUND BALANCE - BUDGET AND ACTUAL
FOR THE YEAR ENDED JUNE 30, 2020
Budget Amounts
VarianceFinal Budget
PositiveOriginal Final Actual Amounts (Negative)
REVENUESFrom Use of Money and Property $ - $ - $ 14,312 $ 14,312Miscellaneous 3,735,855 3,735,855 2,866,787 (869,068)From Federal Government 18,044,601 18,552,076 19,341,205 789,129
Total Revenues 21,780,456 22,287,931 22,222,304 (65,627)
EXPENDITURESRental Subsidy Program 21,887,043 22,417,378 21,909,516 507,862
EXCESS OF REVENUES OVER(UNDER) EXPENDITURES (106,587) (129,447) 312,788 442,235
OTHER FINANCING SOURCES (USES)Transfers In 74,742 95,473 95,473 -Transfers Out - (1,734) (1,734) -Use of Fund Balance 31,845 35,708 - (35,708)
Total Other Financing Sources (Uses) 106,587 129,447 93,739 (35,708)
EXCESS OF REVENUES ANDOTHER FINANCING SOURCESOVER (UNDER) EXPENDITURESAND OTHER FINANCING USES - - 406,527 406,527
FUND BALANCE - JULY 1 854,345 854,345 854,345 -
FUND BALANCE - JUNE 30 $ 854,345 $ 854,345 $ 1,260,872 $ 406,527
172

Exhibit 15-FCITY OF VIRGINIA BEACH, VIRGINIA
FORFEITED ASSETS SPECIAL REVENUE FUNDSCHEDULE OF REVENUES, EXPENDITURES, AND CHANGES IN FUND BALANCE - BUDGET AND ACTUAL
FOR THE YEAR ENDED JUNE 30, 2020
Budget Amounts
VarianceFinal Budget
PositiveOriginal Final Actual Amounts (Negative)
REVENUESFrom Use of Money and Property $ - $ - $ 81,113 $ 81,113From Commonwealth - - 399,360 399,360From Federal Government - - 144,327 144,327
Total Revenues - - 624,800 624,800
EXPENDITURESCommonwealth Attorney 100,000 522,500 11,909 510,591Police - 1,076,297 51,756 1,024,541
Total Expenditures 100,000 1,598,797 63,665 1,535,132
EXCESS OF REVENUES OVER(UNDER) EXPENDITURES (100,000) (1,598,797) 561,135 2,159,932
OTHER FINANCING SOURCES (USES)Transfers Out - (549,636) - 549,636Use of Fund Balance 100,000 2,148,433 - (2,148,433)
Total Other Financing Sources (Uses) 100,000 1,598,797 - (1,598,797)
EXCESS OF REVENUES ANDOTHER FINANCING SOURCESOVER (UNDER) EXPENDITURESAND OTHER FINANCING USES - - 561,135 561,135
FUND BALANCE - JULY 1 3,468,646 3,468,646 3,468,646 -
FUND BALANCE - JUNE 30 $ 3,468,646 $ 3,468,646 $ 4,029,781 $ 561,135
173

Exhibit 15-GCITY OF VIRGINIA BEACH, VIRGINIA
HOUSING AND NEIGHBORHOOD PRESERVATION SPECIAL REVENUE FUNDSCHEDULE OF REVENUES, EXPENDITURES, AND CHANGES IN FUND BALANCE - BUDGET AND ACTUAL
FOR THE YEAR ENDED JUNE 30, 2020
Budget Amounts
VarianceFinal Budget
PositiveOriginal Final Actual Amounts (Negative)
REVENUESFrom Use of Money and Property $ - $ - $ 54,748 $ 54,748Miscellaneous 196,000 196,000 323 (195,677)From Commonwealth 966,266 1,232,232 1,189,192 (43,040)From Federal Government 3,123,487 4,242,107 2,225,250 (2,016,857)
Total Revenues 4,285,753 5,670,339 3,469,513 (2,200,826)
EXPENDITURESHousing and Neighborhood Preservation 3,818,065 4,958,808 3,172,231 1,786,577State Rental Assistance Program 966,266 1,233,064 540,033 693,031
Total Expenditures 4,784,331 6,191,872 3,712,264 2,479,608
EXCESS OF REVENUES OVER(UNDER) EXPENDITURES (498,578) (521,533) (242,751) 278,782
OTHER FINANCING SOURCES (USES)Transfers In 627,436 650,391 650,391 -Transfers Out (128,858) (128,858) (128,858) -
Total Other Financing Sources (Uses) 498,578 521,533 521,533 -
EXCESS OF REVENUES ANDOTHER FINANCING SOURCESOVER (UNDER) EXPENDITURESAND OTHER FINANCING USES - - 278,782 278,782
FUND BALANCE - JULY 1 7,317,396 7,317,396 7,317,396 -
FUND BALANCE - JUNE 30 $ 7,317,396 $ 7,317,396 $ 7,596,178 $ 278,782
174

Exhibit 15-HCITY OF VIRGINIA BEACH, VIRGINIA
LAW LIBRARY SPECIAL REVENUE FUNDSCHEDULE OF REVENUES, EXPENDITURES, AND CHANGES IN FUND BALANCE - BUDGET AND ACTUAL
FOR THE YEAR ENDED JUNE 30, 2020
Budget Amounts
VarianceFinal Budget
PositiveOriginal Final Actual Amounts (Negative)
REVENUESFrom Use of Money and Property $ 2,000 $ 2,000 $ 2,589 $ 589Charges for Services 255,000 255,000 205,005 (49,995)Miscellaneous - - 1,602 1,602
Total Revenues 257,000 257,000 209,196 (47,804)
EXPENDITURESLaw Library 217,000 217,000 158,796 58,204
EXCESS OF REVENUES OVER(UNDER) EXPENDITURES 40,000 40,000 50,400 10,400
OTHER FINANCING SOURCES (USES)Transfers Out (40,000) (40,000) (40,000) -
Total Other Financing Sources (Uses) (40,000) (40,000) (40,000) -
EXCESS OF REVENUES ANDOTHER FINANCING SOURCESOVER (UNDER) EXPENDITURESAND OTHER FINANCING USES - - 10,400 10,400
FUND BALANCE - JULY 1 79,077 79,077 79,077 -
FUND BALANCE - JUNE 30 $ 79,077 $ 79,077 $ 89,477 $ 10,400
175

Exhibit 15-ICITY OF VIRGINIA BEACH, VIRGINIA
OPEN SPACE SPECIAL REVENUE FUNDSCHEDULE OF REVENUES, EXPENDITURES, AND CHANGES IN FUND BALANCE - BUDGET AND ACTUAL
FOR THE YEAR ENDED JUNE 30, 2020
Budget Amounts
VarianceFinal Budget
PositiveOriginal Final Actual Amounts (Negative)
REVENUESOther Local Taxes $ 5,591,945 $ 5,144,589 $ 4,911,193 $ (233,396)From Use of Money and Property - - 9,830 9,830
Total Revenues 5,591,945 5,144,589 4,921,023 (223,566)
EXPENDITURESOpen Space Program 582,900 582,900 333,649 249,251Debt Service:
Principal Retirement 2,041,205 2,041,205 2,041,205 -Interest and Fiscal Charges 467,840 467,840 464,959 2,881
Total Expenditures 3,091,945 3,091,945 2,839,813 252,132
EXCESS OF REVENUES OVER(UNDER) EXPENDITURES 2,500,000 2,052,644 2,081,210 28,566
OTHER FINANCING SOURCES (USES)Transfers Out (3,000,000) (2,552,644) (2,552,644) -Use of Fund Balance 500,000 500,000 - (500,000)
Total Other Financing Sources (Uses) (2,500,000) (2,052,644) (2,552,644) (500,000)
EXCESS OF REVENUES ANDOTHER FINANCING SOURCESOVER (UNDER) EXPENDITURESAND OTHER FINANCING USES - - (471,434) (471,434)
FUND BALANCE - JULY 1 1,788,992 1,788,992 1,788,992 -
FUND BALANCE - JUNE 30 $ 1,788,992 $ 1,788,992 $ 1,317,558 $ (471,434)
176

Exhibit 15-JCITY OF VIRGINIA BEACH, VIRGINIA
PARKS AND RECREATION SPECIAL REVENUE FUNDSCHEDULE OF REVENUES, EXPENDITURES, AND CHANGES IN FUND BALANCE - BUDGET AND ACTUAL
FOR THE YEAR ENDED JUNE 30, 2020
Budget Amounts
VarianceFinal Budget
PositiveOriginal Final Actual Amounts (Negative)
REVENUESReal Estate Property Taxes $ 19,875,128 $ 19,875,128 $ 19,385,940 $ (489,188)Fines and Forfeitures - - 1,224 1,224From Use of Money and Property 1,564,354 1,564,354 1,408,555 (155,799)Charges for Services 16,063,039 16,063,039 11,042,388 (5,020,651)Miscellaneous 110,400 110,400 117,363 6,963From Commonwealth 11,000 11,000 8,914 (2,086)
Total Revenues 37,623,921 37,623,921 31,964,384 (5,659,537)
EXPENDITURESAdministration, Marketing, and Building Systems 4,712,695 4,483,341 4,137,470 345,871Programming and Operations 31,270,706 32,016,307 28,894,763 3,121,544Sports Management 1,471,328 1,489,595 1,107,149 382,446Landscape Management 793,054 805,384 713,307 92,077Debt Service:
Principal Retirement 2,640,113 2,640,113 2,640,113 -Interest and Fiscal Charges 1,581,873 1,581,873 1,580,340 1,533
Total Expenditures 42,469,769 43,016,613 39,073,142 3,943,471
EXCESS OF REVENUES OVER(UNDER) EXPENDITURES (4,845,848) (5,392,692) (7,108,758) (1,716,066)
OTHER FINANCING SOURCES (USES)Transfers In 6,436,948 6,685,290 6,685,290 -Transfers Out (2,618,100) (5,621,568) (5,621,568) -Use of Fund Balance 1,027,000 4,328,970 - (4,328,970)
Total Other Financing Sources (Uses) 4,845,848 5,392,692 1,063,722 (4,328,970)
EXCESS OF REVENUES ANDOTHER FINANCING SOURCESOVER (UNDER) EXPENDITURESAND OTHER FINANCING USES - - (6,045,036) (6,045,036)
FUND BALANCE - JULY 1 17,293,972 17,293,972 17,293,972 -
FUND BALANCE - JUNE 30 $ 17,293,972 $ 17,293,972 $ 11,248,936 $ (6,045,036)
177

Exhibit 15-KCITY OF VIRGINIA BEACH, VIRGINIA
SANDBRIDGE SPECIAL SERVICE DISTRICT SPECIAL REVENUE FUNDSCHEDULE OF REVENUES, EXPENDITURES, AND CHANGES IN FUND BALANCE - BUDGET AND ACTUAL
FOR THE YEAR ENDED JUNE 30, 2020
Budget Amounts
VarianceFinal Budget
PositiveOriginal Final Actual Amounts (Negative)
REVENUESReal Estate Property Taxes $ 735,502 $ 735,502 $ 729,251 $ (6,251)Other Local Taxes 4,165,452 4,165,452 4,125,227 (40,225)From Use of Money and Property 7,037 7,037 12,038 5,001
Total Revenues 4,907,991 4,907,991 4,866,516 (41,475)
EXPENDITURESBeach Operations 463,064 700,535 523,267 177,268
EXCESS OF REVENUES OVER(UNDER) EXPENDITURES 4,444,927 4,207,456 4,343,249 135,793
OTHER FINANCING SOURCES (USES)Transfers In 65,000 65,000 65,000 -Transfers Out (4,957,001) (4,957,001) (4,957,001) -Use of Fund Balance 447,074 684,545 - (684,545)
Total Other Financing Sources (Uses) (4,444,927) (4,207,456) (4,892,001) (684,545)
EXCESS OF REVENUES ANDOTHER FINANCING SOURCESOVER (UNDER) EXPENDITURESAND OTHER FINANCING USES - - (548,752) (548,752)
FUND BALANCE - JULY 1 986,203 986,203 986,203 -
FUND BALANCE - JUNE 30 $ 986,203 $ 986,203 $ 437,451 $ (548,752)
178

Exhibit 15-LCITY OF VIRGINIA BEACH, VIRGINIA
SANDBRIDGE TAX INCREMENT FINANCING SPECIAL REVENUE FUNDSCHEDULE OF REVENUES, EXPENDITURES, AND CHANGES IN FUND BALANCE - BUDGET AND ACTUAL
FOR THE YEAR ENDED JUNE 30, 2020
Budget Amounts
VarianceFinal Budget
PositiveOriginal Final Actual Amounts (Negative)
REVENUESReal Estate Property Taxes $ 10,411,393 $ 10,411,393 $ 10,293,538 $ (117,855)From Use of Money and Property 54,799 54,799 118,970 64,171
Total Revenues 10,466,192 10,466,192 10,412,508 (53,684)
EXPENDITURESSandbridge TIF 8,768,193 268,193 - 268,193
EXCESS OF REVENUES OVER(UNDER) EXPENDITURES 1,697,999 10,197,999 10,412,508 214,509
OTHER FINANCING SOURCES (USES)Transfers Out (1,697,999) (15,367,008) (15,367,008) -Use of Fund Balance - 5,169,009 - (5,169,009)
Total Other Financing Sources (Uses) (1,697,999) (10,197,999) (15,367,008) (5,169,009)
EXCESS OF REVENUES ANDOTHER FINANCING SOURCESOVER (UNDER) EXPENDITURESAND OTHER FINANCING USES - - (4,954,500) (4,954,500)
FUND BALANCE - JULY 1 4,954,500 4,954,500 4,954,500 -
FUND BALANCE - JUNE 30 $ 4,954,500 $ 4,954,500 $ - $ (4,954,500)
179

Exhibit 15-MCITY OF VIRGINIA BEACH, VIRGINIA
SHERIFF'S DEPARTMENT SPECIAL REVENUE FUNDSCHEDULE OF REVENUES, EXPENDITURES, AND CHANGES IN FUND BALANCE - BUDGET AND ACTUAL
FOR THE YEAR ENDED JUNE 30, 2020
Budget Amounts
VarianceFinal Budget
PositiveOriginal Final Actual Amounts (Negative)
REVENUESFrom Use of Money and Property $ 11,000 $ 11,000 $ 7,303 $ (3,697)Charges for Services 5,116,608 5,116,608 4,593,774 (522,834)Miscellaneous 2,000 2,000 6,404 4,404From Commonwealth 20,085,626 20,085,626 19,245,665 (839,961)From Federal Government 140,000 140,000 254,557 114,557
Total Revenues 25,355,234 25,355,234 24,107,703 (1,247,531)
EXPENDITURESJudicial 49,345,817 51,369,421 51,194,545 174,876
EXCESS OF REVENUES OVER(UNDER) EXPENDITURES (23,990,583) (26,014,187) (27,086,842) (1,072,655)
OTHER FINANCING SOURCES (USES)Transfers In 23,990,583 25,421,343 25,421,343 -Transfers Out - (10,404) (10,404) -Use of Fund Balance - 603,248 - (603,248)
Total Other Financing Sources (Uses) 23,990,583 26,014,187 25,410,939 (603,248)
EXCESS OF REVENUES ANDOTHER FINANCING SOURCESOVER (UNDER) EXPENDITURESAND OTHER FINANCING USES - - (1,675,903) (1,675,903)
FUND BALANCE - JULY 1 869,560 869,560 869,560 -
FUND BALANCE - JUNE 30 $ 869,560 $ 869,560 $ (806,343) $ (1,675,903)
180

Exhibit 15-NCITY OF VIRGINIA BEACH, VIRGINIA
TOURISM ADVERTISING PROGRAM SPECIAL REVENUE FUNDSCHEDULE OF REVENUES, EXPENDITURES, AND CHANGES IN FUND BALANCE - BUDGET AND ACTUAL
FOR THE YEAR ENDED JUNE 30, 2020
Budget Amounts
VarianceFinal Budget
PositiveOriginal Final Actual Amounts (Negative)
REVENUESOther Local Taxes $ 12,794,047 $ 12,285,688 $ 11,000,267 $ (1,285,421)From Use of Money and Property 67,000 67,000 61,297 (5,703)Charges for Services 53,000 53,000 7,042 (45,958)Miscellaneous 10,000 10,000 6,669 (3,331)
Total Revenues 12,924,047 12,415,688 11,075,275 (1,340,413)
EXPENDITURESVisitor Information Center 716,887 736,723 485,267 251,456Tourism and Convention Advertising 10,976,906 13,003,798 8,704,637 4,299,161Sports Marketing 1,173,416 1,173,416 640,853 532,563
Total Expenditures 12,867,209 14,913,937 9,830,757 5,083,180
EXCESS OF REVENUES OVER(UNDER) EXPENDITURES 56,838 (2,498,249) 1,244,518 3,742,767
OTHER FINANCING SOURCES (USES)Transfers In - 2,000,000 2,000,000 -Transfers Out (56,838) (56,838) (56,838) -Use of Fund Balance - 555,087 - (555,087)
Total Other Financing Sources (Uses) (56,838) 2,498,249 1,943,162 (555,087)
EXCESS OF REVENUES ANDOTHER FINANCING SOURCESOVER (UNDER) EXPENDITURESAND OTHER FINANCING USES - - 3,187,680 3,187,680
FUND BALANCE - JULY 1 818,957 818,957 818,957 -
FUND BALANCE - JUNE 30 $ 818,957 $ 818,957 $ 4,006,637 $ 3,187,680
181

����������� ������� �� � ���������� �� � ����� ��� ���������������������� ������������������������������������������� ������������������� ���������������������������������������������������� ����!"��#"#"�$%&'���()$*�+ �,-�,*.'��*,/��$%&'��)+���0'�-�&�*,/ ��*,/ �.�$,/��()$*�+ 1�'&,��0'2��������34567�89:;<�=;>6? @ ABCDEBCFGD @ HGCDBHCBFD @ HACFHHCIEJ @ KACALGCEEFMN67OP4?C�N7PQP<6R6�S66?C�;TU�V6RW<;497X�8P:6T?6? HDGCIBL HDGCIBL DBLCGLL KIDDCIABMS79O�Y?6�9Z�[9T6X�;TU�N79\674X AHGCJBB AHGCJBB FEFCGFB HAECAFB]5;7R6?�Z97�̂67QP:6? HCJBB HCJBB _ KHCJBBM[P?:6<<;T69W? AFFCELG IFHCBBJ JHCHHA KIIGCLFIM=94;<�V6Q6TW6? AICJHBCFLF ABCIAECIEH HJCFEICAJJ KACHLLCFDEM������ �����]W<4W7;<�̀ZZ;P7? FJCJBB FJCJBB JBCJBB DJCBBBa6;:5�3\67;4P9T? DCBEICHHF DCALICJIB ICGLLCLBH AGACGBFbP76:4�]9?4? ICIJACEHB ICIJACEHB ICIJDCIFB DCLLB\̂6:P;<�cQ6T4? JCABJCDBD LCBHICIIF HCABDCGIE DCLDECIGGV6:X:<PTR IBDCBBB IBDCBBB EDCGDF IGCBFH8;TU?:;\PTR EALCFIH EJHCAGG LLECHAL IEJCIJH[;PT46T;T:6 FIACFGI FHICGJD JBGCLII DDDCHAIb6d4�̂67QP:6eN7PT:P\;<�V64P76O6T4 ILCADLCEFA ILCADLCEFA ILCADLCEFA _fT4676?4�;TU�SP?:;<�]5;7R6? LCAIDCHEG LCAIDCHEG ACLJECEFB ICFJHCJIG]9T4PTR6T:P6? ECDGLCDJE HCEGFCBGA _ HCEGFCBGA=94;<�c>\6TUP4W76? AICJIJCEGA HECIALCFLJ DECGIECEIG GCDDFCGAL�����������������������1�����2������� ����� IACEFH DCBBICAIE LCELDCLHL ACELICDIE������� ���� �����������1����2=7;T?Z67?�3W4 KIACEFHM KIICBIACEFHM KIICBIACEFHM _Y?6�9Z�SWTU�a;<;T:6 _ GCBIHCAJJ _ KGCBIHCAJJM=94;<�34567�SPT;T:PTR�̂9W7:6?�KY?6?M KIACEFHM KDCBBICAIEM KIICBIACEFHM KGCBIHCAJJM����������������������������� ���� ���������������1�����2������� ���������������� ���� ������� _ _ KACIJDCDHFM KACIJDCDHFM�������������� ����� DFCLLJCBDG DFCLLJCBDG DFCLLJCBDG _�������������� ����!" @ DFCLLJCBDG @ DFCLLJCBDG @ DHCJIDCFGD @ KACIJDCDHFM
182

Exhibit 15-PCITY OF VIRGINIA BEACH, VIRGINIA
TOWN CENTER SPECIAL SERVICE DISTRICT SPECIAL REVENUE FUNDSCHEDULE OF REVENUES, EXPENDITURES, AND CHANGES IN FUND BALANCE - BUDGET AND ACTUAL
FOR THE YEAR ENDED JUNE 30, 2020
Budget Amounts
VarianceFinal Budget
PositiveOriginal Final Actual Amounts (Negative)
REVENUESReal Estate Property Taxes $ 2,111,141 $ 2,111,141 $ 1,624,072 $ (487,069)Fines and Forfeitures 170,000 170,000 179,066 9,066From Use of Money and Property 299,500 299,500 363,992 64,492Charges for Services 24,300 24,300 17,431 (6,869)Miscellaneous - - 454 454
Total Revenues 2,604,941 2,604,941 2,185,015 (419,926)
EXPENDITURESTown Center Parking Operations 2,141,480 2,211,738 1,928,533 283,205Town Center Operations 62,438 77,558 32,621 44,937
Total Expenditures 2,203,918 2,289,296 1,961,154 328,142
EXCESS OF REVENUES OVER(UNDER) EXPENDITURES 401,023 315,645 223,861 (91,784)
OTHER FINANCING SOURCES (USES)Transfers In 150,000 150,000 150,000 -Transfers Out (631,976) (632,226) (632,226) -Use of Fund Balance 80,953 166,581 - (166,581)
Total Other Financing Sources (Uses) (401,023) (315,645) (482,226) (166,581)
EXCESS OF REVENUES ANDOTHER FINANCING SOURCESOVER (UNDER) EXPENDITURESAND OTHER FINANCING USES - - (258,365) (258,365)
FUND BALANCE - JULY 1 2,179,292 2,179,292 2,179,292 -
FUND BALANCE - JUNE 30 $ 2,179,292 $ 2,179,292 $ 1,920,927 $ (258,365)
183

Exhibit 15-QCITY OF VIRGINIA BEACH, VIRGINIA
WETLANDS BOARD MITIGATION SPECIAL REVENUE FUNDSCHEDULE OF REVENUES, EXPENDITURES, AND CHANGES IN FUND BALANCE - BUDGET AND ACTUAL
FOR THE YEAR ENDED JUNE 30, 2020
Budget Amounts
VarianceFinal Budget
PositiveOriginal Final Actual Amounts (Negative)
REVENUESFines and Forfeitures $ - $ - $ 26,176 $ 26,176From Use of Money and Property - - 8,708 8,708
Total Revenues - - 34,884 34,884
EXCESS OF REVENUES ANDOTHER FINANCING SOURCESOVER (UNDER) EXPENDITURESAND OTHER FINANCING USES - - 34,884 34,884
FUND BALANCE - JULY 1 372,232 372,232 372,232 -
FUND BALANCE - JUNE 30 $ 372,232 $ 372,232 $ 407,116 $ 34,884
184

DEBT SERVICE FUND


DEBT SERVICE FUND
The Debt Service Fund is used to account for the accumulation of resources for, and the payment of, general long-term debtprincipal, interest and related costs.
185

Exhibit 16CITY OF VIRGINIA BEACH, VIRGINIA
DEBT SERVICE FUNDSCHEDULE OF REVENUES, EXPENDITURES, AND CHANGES IN FUND BALANCE - BUDGET AND ACTUAL
FOR THE YEAR ENDED JUNE 30, 2020
Budget Amounts
VarianceFinal Budget
PositiveOriginal Final Actual Amounts (Negative)
REVENUESFrom Use of Money and Property $ - $ - $ 6,108,988 $ 6,108,988Federal Reimbursement of Interest - - 341,961 341,961
Total Revenues - - 6,450,949 6,450,949
EXPENDITURESPrincipal 29,454,883 30,067,222 29,454,883 612,339Interest 13,858,999 13,858,999 13,588,313 270,686
Total Expenditures 43,313,882 43,926,221 43,043,196 883,025
EXCESS OF REVENUES OVER(UNDER) EXPENDITURES) (43,313,882) (43,926,221) (36,592,247) 7,333,974
OTHER FINANCING SOURCES (USES)Transfers In 43,313,882 43,926,221 43,271,075 (655,146)Proceeds of Refunding Bonds - - 80,329,587 80,329,587Premium on Bonds Sold - - 8,734,990 8,734,990Payment to Refunding Bonds Escrow Agent - - (89,022,077) (89,022,077)
Total Other Financing Sources (Uses) 43,313,882 43,926,221 43,313,575 (612,646)
EXCESS OF REVENUES ANDOTHER FINANCING SOURCESOVER (UNDER) EXPENDITURESAND OTHER FINANCING USES - - 6,721,328 6,721,328
FUND BALANCE - JULY 1 37,618,680 37,618,680 37,618,680 -
FUND BALANCE - JUNE 30 $ 37,618,680 $ 37,618,680 $ 44,340,008 $ 6,721,328
186

GENERAL GOVERNMENT
CAPITAL PROJECTS


GENERAL GOVERNMENT CAPITAL PROJECTS
The General Government Capital Projects Fund is used to account for all revenues and expenditures related to theconstruction of the City’s General Government fixed assets and infrastructure. The categories of projects accounted for in thisfund are engineering and highways, buildings and assets, parks and recreation, coastal, and economic and tourismdevelopment.
187

Exhibit 17CITY OF VIRGINIA BEACH, VIRGINIA
ENGINEERING AND HIGHWAYS CAPITAL PROJECTS EXPENDITURESFOR THE YEAR ENDED JUNE 30, 2020
Project Budget Current Year Total Construction Outstanding AvailableNumber Project Name to Date Expenditures In Progress Encumbrances Balance
2022 MAJOR BRIDGE REHAB II $ 10,040,284 $ 529,254 $ 3,993,363 $ 3,993,363 $ 401,468 $ 5,645,453 2024 RURAL ROAD IMPROVEMENTS II 1,304,424 - 14,054 14,054 155,549 1,134,821 2025 WITCHDUCK ROAD - PHASE II 60,288,998 6,886,681 49,645,188 49,645,188 5,013,351 5,630,459 2026 STREET RECONSTRUCTION II 15,050,000 3,365,081 11,805,897 3,365,081 1,669,225 1,574,878 2027 VARIOUS COST PARTICIPATION PROJECTS II 250,000 - - - - 250,000 2028 WETLANDS MITIFATION BANKING II 700,000 - - - - 700,000 2033 PRINCESS ANNE ROAD PHASE VII-A 350,000 - 218,082 218,082 1,640 130,278 2038 ROSEMONT ROAD PHASE V 18,541,000 - 807,284 807,284 871,251 16,862,465 2040 LASKIN ROAD PHASE I 18,045,009 - - - - 18,045,009 2042 INDIAN RIVER/PROVIDENCE INTER IMPROVE 2,052,200 33,725 480,174 480,174 66,408 1,505,618 2045 PACIFIC AVENUE IMPROVEMENTS 15,080,000 1,385 14,379,392 - - 700,608 2046 CAVALIER DRIVE IMPROVEMENTS 2,449,040 - 2,059,972 - - 389,068 2047 UPTON DR EXT/DAM NECK IMPROVEMENTS 1,300,000 - 13,219 13,219 1,286,780 1 2048 PRINCESS ANNE RD/KEMPSVILLE RD INTERSECTION IMPR 86,171,045 150 85,999,500 - 109,210 62,335 2050 LANDSTOWN RD IMPROVEMENTS 8,951,014 78,710 778,856 778,856 516,184 7,655,974 2054 FERRELL PARKWAY 1,262,750 - 708 708 - 1,262,042 2057 PLEASURE HOUSE ROAD STREET IMPROV PH II 350,000 - - - - 350,000 2072 FIRST COLONIAL RD/VB BLVD INTERSECTION IMPROVEMENT 31,902,054 (212,305) 11,698,079 4,463,464 893,439 19,310,536 2078 SANDBRIDGE ROAD-NIMMO VVI-A 9,878,020 80,309 1,272,522 1,272,522 456,025 8,149,473 2088 WEST NECK ROAD PHASE IV 8,966,533 35,145 1,360,004 1,360,004 1,012,198 6,594,331 2094 BUS STOP INFRASTRUCTURE/ACCESSIBILITY IM 1,018,157 350 357,020 357,020 404,556 256,581 2110 NIMMO PARKWAY VII-B 2,921,281 376,548 1,069,442 1,069,442 470,894 1,380,945 2111 TRAFFIC SAFETY IMPROVEMENTS IV 10,126,122 1,777,936 3,626,774 3,626,774 1,583,450 4,915,898 2112 INDEPENDENCE BLVD/BAKTER RD SIDEWALK 1,296,007 36,650 147,812 147,812 29,627 1,118,568 2117 SHORE DRIVE CORRIDOR IMPRV-PHASE III 26,739,722 132,870 2,114,470 2,114,470 82,135 24,543,117 2118 SHORE DRIVE CORRIDOR IMPRV-PHASE IV 2,025,076 - 398,437 398,437 351,639 1,275,000 2119 PROVIDENCE RD SIDEWALK 971,450 43,094 129,934 129,934 42,377 799,139 2120 WEST GREAT NECK RD SIDEWALK 924,000 639,626 743,955 743,955 81,369 98,676 2124 ELBOW RD EXTENDED PHASE II-C 500,000 43,531 43,531 43,531 456,469 - 2125 INDIAN RIVER ROAD PHASE VII-B 1,570,000 - - - - 1,570,000 2126 LASKIN ROAD PHASE I-A (VDOT) 23,505,041 - - - - 23,505,041 2127 I-264/INDEPENDENCE INTERCHANGE IMPRV 500,000 - - - - 500,000 2130 BUCCANEER RD BULKHEAD REPLACEMENT 4,500,000 2,438,228 2,672,619 2,672,619 12,312 1,815,069 2131 PUNGO FERRY BRIDGE REHAB (#134-8029) 3,900,000 - - - - 3,900,000 2135 CLEVELAND ST IMPROVEMENTS IV 1,761,000 1,200 1,200 1,200 - 1,759,800 2146 LASKIN ROAD PHASE III 300,000 - - - - 300,000 2149 BIRDNECK ROAD - PHASE II 8,415,975 - 8,069,685 - 344,363 1,927 2152 ELBOW ROAD EXTENDED - PHASE II 43,082,485 148,495 6,925,126 6,925,126 486,586 35,670,773 2154 GENERAL BOOTH/CAMP PENDLETON INTERS IMPR 1,779,000 37,117 37,117 37,117 311,954 1,429,929 2156 LASKIN ROAD - PHASE I (VDOT) 2,278,981 - 2,266,061 2,266,061 - 12,920 2158 HOLLAND ROAD - PHASE VI (PARTIAL) 5,632,883 - 5,288,350 - 6,231 338,302 2159 PARLIAMENT DRIVE SIDEWALK PHASE II - FY19 966,353 1,327 1,327 1,327 205,650 759,376 2160 CITY WIDE STREET LGHTG IMPRVMNTS-PHASE II 820,000 63,852 641,668 348,455 15,535 162,797 2165 LASKIN ROAD - PHASE II 1,518,100 - 625,465 625,465 - 892,635 2167 LYNNHAVEN PARKWAY - PHASE XI 1,769,125 - 1,402,919 - - 366,206 2168 LESNER BRIDGE REPLACEMENT 114,954,439 1,958,683 109,607,584 - 147,167 5,199,688 2176 TRANSPORTATION NETWORK ANALYSIS 2,632,250 19,672 2,439,929 19,672 51,215 141,106 2183 TRAFFIC CALMING 200,000 - - - - 200,000 2184 RURAL ROAD RECURRING FLOODING, SLR & RESILENCY 500,000 - - - - 500,000 2188 SANDBRIDGE RD - NIMMO PHASE VII-A SLR RESILENCY IM 500,000 - - - - 500,000 2195 PRINCESS ANNE RD-INTERSECTION IMPRVMNTS 38,609,843 8,362,177 19,826,242 15,806,086 9,384,331 9,399,270 2256 INDIAN RIVER ROAD - PHASE VII 39,705,578 461,357 7,890,985 7,890,985 734,443 31,080,150 2300 TRAFFIC SAFETY IMPROVEMENTS - PHASE III 17,237,458 1,082,483 15,867,725 - 1,225,443 144,290 2401 GREENWICH RD/CLEVELAND ST CROSSOVER 14,731,314 746,150 7,913,285 7,913,285 791,816 6,026,213 2409 CENTERVILLE TURNPIKE INTERIM IMPROVEMNTS 40,178,270 133,237 3,414,943 3,414,943 545,495 36,217,832 2410 TRAFFIC SIGNAL REHAB-PHASE II 2,730,250 640,894 1,363,390 1,363,390 365,146 1,001,714 2414 SHIPPS CORNER ROAD IMPROVEMENTS 2,779,050 - 351,451 351,451 2,397,311 30,288 2416 SANDBRIDGE ROAD BRIDGE REPLACEMENT 7,887,467 4,428,985 6,597,923 6,597,923 912,102 377,442 2418 INDIAN RD/KEMPSVILLE RD IMPROVMENT 23,113,848 5,577,935 19,448,243 - 2,477,226 1,188,379 2419 CENTERVILLE TURNPIKE PHASE III 10,256,851 190,458 1,403,335 1,403,335 671,441 8,182,075 2422 PUNGO TURN LANE 250,000 - 210,211 210,211 - 39,789 2501 NIMMO PARKWAY PHASE II 4,527,261 39,377 359,965 359,965 92,886 4,074,410
TOTAL ENGINEERING & HIGHWAYS CAPITAL PROJECTS $ 762,547,008 $ 40,180,367 $ 417,784,417 $ 133,251,990 $ 37,133,897 $ 307,628,694
188

Exhibit 17CITY OF VIRGINIA BEACH, VIRGINIA
BUILDINGS CAPITAL PROJECTS EXPENDITURESFOR THE YEAR ENDED JUNE 30, 2020
Project Budget Current Year Total Construction Outstanding AvailableNumber Project Name to Date Expenditures Expenditures In Progress Encumbrances Balance
3025 BLDG 2 ELECTRICAL UPGRADE $ 75,054 $ - $ 67,778 $ - $ - $ 7,276 3028 AQUARIUM MARSH PAVILION ENHANCEMENTS 15,422,933 5,095,812 7,021,994 7,021,994 6,709,504 1,691,435 3047 LANDFILL #2 PHASE 1 CAPPING 15,435,000 1,995 7,628,518 7,628,518 158,323 7,648,159 3056 PUBLIC SAFETY EQUIPMENT REPLACEMENT 5,722,385 1,056,863 3,150,552 3,150,552 - 2,571,833 3065 CENTRAL PARK GENERATOR 5,305,585 3,977,257 4,376,358 4,376,358 220,021 709,206 3069 EUCLID YARD FACILITY REPLACEMENT 225,000 - - - - 225,000 3071 LIBRARY ENHANCEMENTS 5,835,215 1,863,463 3,091,770 - 158,605 2,584,840 3072 CITY HALL PLANNING & CONCEPT DEVELOPEMENT 50,250,000 11,616,872 14,732,593 14,443,909 27,703,211 7,814,196 3074 AQUARIUM MARSH PAVILION PH II 11,737,869 4,120,684 5,443,916 5,443,916 5,676,468 617,485 3075 FIRE/EMS STATION BURTON STATION 7,810,000 95,440 636,952 636,952 218,709 6,954,339 3095 CIT-POLICE-INTGRTD PUB SFTY RCRD MGT SYS 17,630,162 472,698 8,126,584 - 5,119,426 4,384,152 3103 HERITAGE BUILDING - MAINTENANCE PROGRAM 3,700,261 259,909 1,865,797 - 196,084 1,638,380 3115 JUDICAL CNTR MAINTENANCE 649,356 27,958 432,938 - 168,492 47,926 3119 CIT-CABLE ACCESS INFRASTRUCTURE REPLACE 3,797,261 187,194 1,874,819 - 44,307 1,878,135 3122 POLICE DEPT HELICOPTER 9,127,667 - 4,334,089 - - 4,793,578 3132 HERITAGE BUILDING MAINTENANCE II 1,600,000 52,042 52,042 52,042 574,097 973,861 3133 FIRE TRAINING CTR IMPROVE-PHASE III 5,152,170 83,522 662,984 662,984 132,768 4,356,418 3135 FIRE APPARATUS IV 7,580,975 1,634,533 5,523,467 1,634,533 2,051,828 5,680 3136 VAR BLDGS HVAC REHAB & RENEWAL PH III 11,259,331 488,472 11,098,818 - 80,941 79,572 3137 VARIOUS BLDGS REHAB & RENEWAL PH III 14,289,599 288,477 13,991,205 - 87,643 210,751 3139 VARIOUS SITE ACQUISITIONS PHASE II 9,737,716 - 8,748,525 - - 989,191 3140 ENERGY PERFORMANCE CONTRACTS (CITY) 5,459,915 16,139 4,608,777 - 800,000 51,138 3141 VARIOUS BUILDINGS HVAC REHAB & RENEW IV 5,000,000 1,601,409 2,381,164 1,601,409 867,145 1,751,691 3142 CIT-COMMUNICATIONS INFRA REPLACE-PHII 32,106,051 2,087,814 28,300,827 - 297,312 3,507,912 3146 VA AQUARIUM BLDG SYS REHAB & RENEW-PH I 14,909,803 1,441,093 11,047,112 - 2,635,088 1,227,603 3149 VARIOUS BUILDINGS REHAB & RENEWAL IV 9,045,572 4,177,595 5,432,756 - 1,034,757 2,578,059 3153 VARIOUS SITE ACQUISITIONS III 1,343,644 - 3,300 3,300 - 1,340,344 3154 FIRE TRAINING CENTER IMPROVEMENTS IV 1,373,155 - - - - 1,373,155 3155 VIRGINIA AQUARIUM RENEW & REPLACE III 1,200,000 52,422 60,719 - 150,000 989,281 3157 FACILITIES PLANNING SERVICES 370,467 86,431 142,263 - 128,342 99,862 3159 EMS HEADQUARTERS GENERATOR 801,728 208,421 236,000 - 24,779 540,949 3162 VETERANS MEMORIAL SUSTAINMENT 400,000 31,284 31,284 - 19,607 349,109 3163 EMS HEADQUARTERS AUDIO & VISUAL UPGRADES 250,000 - 247,950 247,950 - 2,050 3164 ENERGY PERFORMANCE CONTRACTS (CITY) II 550,000 - - - - 550,000 3165 VA AQUARIUM BUILDING SYSTEMS & FACILITY INFRASTRUCT 1,434,540 58,371 58,371 58,371 35,380 1,340,789 3166 BUILDING SECURITY 125,000 76,722 76,722 76,722 48,278 - 3174 OPERATIONS FACILITIES RENOVATIONS 4,000,000 2,451,495 2,451,495 2,451,495 168,293 1,380,212 3278 VA AQUARIUM RENEWAL & REPLACEMENT-PH II 3,445,000 173,350 2,310,137 - 31,639 1,103,224 3292 VA AQUARIUM ANIMAL CARE ANNEX 18,074,338 5,880,140 15,542,362 15,542,362 2,049,952 482,024 3344 POLICE FOURTH PRECINCT-REPLACEMENT 9,051,779 2,957,602 8,726,257 - 169,381 156,141 3503 HOUSING RESOURCE CENTER 24,440,288 269,701 23,915,460 - 41,381 483,447 3506 FIRE FACILITY REHAB & RENEWAL PH III 4,790,891 379,232 4,566,746 - 37,000 187,145 3508 ARC FLASH MITIGATION 4,080,000 590,658 2,518,749 - 857,133 704,118 3510 INTRMEDIATE CARE FACILITIES REN/REP PH I 1,549,776 33,576 190,031 - - 1,359,745 3518 CONVENTION CTR CAPITAL MAINTENANCE 6,443,369 322,814 3,295,206 - 942,204 2,205,959 3523 CORRECTION CTR MASTER CONTROL UPGRADE 5,000,000 1,070,303 1,703,121 1,703,121 3,195,319 101,560 3610 CIT-OCEANFRONT CAMERAS 3,465,400 1,876 2,910,068 - - 555,332 3615 CIT-BUS REV/PERS PROP RACS IMPLEMENTATION 4,300,500 605,880 4,145,486 605,880 154,600 414 3652 CIT-TELECOMMUNICATIONS REPLACMENT PH II 2,704,494 945,995 2,228,572 - 191,121 284,801 3663 CIT-ENTERPRISE SCHEDULING/TIMEKEEPING SY 2,740,796 605,325 793,343 793,343 1,042,737 904,716 3664 CIT-METROPOLITAN AREA NETWORK 9,634,989 438,989 5,909,605 - 963,642 2,761,742 3677 CIT-STORM SURGE AND SUSTAIN MODELING 306,158 28,979 197,902 - 31,698 76,558 3678 CIT-FIRE MOBILE RADIO REPEATERS 475,520 32,650 32,650 32,650 299,735 143,135 3683 CIT-MAINTAIN & SECURE CORPORATE DATA 460,000 124,824 460,000 - - - 3690 CIT-ENTERPRISE CUST RELATIONSHIP MGMT SY 608,166 214,539 225,854 - 320,026 62,286 3693 CIT-IT SERVICE CONTINUITY II 4,207,604 1,193,529 3,318,645 - 750,694 138,265 3695 CIT-21ST CENTURY ENTERPRISE RESOURCE PLANNING SYST 14,017,284 5,054,645 7,145,366 7,145,366 2,722,922 4,148,996 3697 CIT-CITY SOFTWARE UPGRADE/REPLACEMENT 6,195,800 2,169,198 4,033,520 - 880,073 1,282,207 3700 CIT - FIRE ASSET MANAGEMENT SYSTEM 518,827 - - - - 518,827 3703 CIT - POLICE SPECIAL INVESTIGATION VIDEO STORAGE 926,248 10,156 22,396 - 401,240 502,612 3705 CIT-HUMAN SERVICES CLIENT INFORM II 974,168 223,332 227,902 - 665,752 80,514 3706 CIT-SHERIFF INMATE TRACKING & STATUS MONITOR 988,009 14,055 14,055 14,055 745,677 228,277 3714 CIT-NETWORK INFRASTRUCTURE REPLACE III 4,751,769 950,555 950,555 - 1,037,173 2,764,041 3715 CIT-CABLE ACCESS INFRASTRUCTURE REPL II 630,000 - - - - 630,000 3716 CIT-21ST CENTURY ENTERPRISE RESOURCE (HCM) 500,000 - - - - 500,000 3717 CIT-ACCELA SUSTAINMENT 896,532 271,464 303,662 - 254,230 338,640 3718 CIT-POLICE RADIO ENCRYPTION 1,671,171 - 12,240 12,240 1,658,931 - 3719 CIT-COMMUNICATIONS INFRASTRUCT REPL III 3,903,708 14,751 14,751 - 103,010 3,785,947 3723 CIT-NEXT GENERATION CONTENT MANAGEMENT SYSTEM 275,000 120,370 120,370 - 89,130 65,500
TOTAL BUILDINGS CAPITAL PROJECTS $ 422,740,998 $ 68,310,875 $ 253,775,450 $ 75,340,022 $ 75,145,808 $ 93,819,740
NOTE: CIT - COMMUNICATIONS AND INFORMATION TECHNOLOGY
189

Exhibit 17CITY OF VIRGINIA BEACH, VIRGINIA
PARKS AND RECREATION CAPITAL PROJECTS EXPENDITURESFOR THE YEAR ENDED JUNE 30, 2020
Project Budget Current Year Total Construction Outstanding AvailableNumber Project Name to Date Expenditures Expenditures In Progress Encumbrances Balance
4025 WOODSTOCK COVE SHORELINE RE-CONSTRUCT $ 742,623 $ - $ 712,067 $ - $ - $ 30,556 4039 PAAC MULTI-PURPOSE ATHLETIC FIELD RENOV 5,250,000 97,540 5,229,681 - 6,676 13,643 4044 LYNNHAVEN MARINA BULKHEAD REPL/FAC RENO 1,643,000 758,160 1,474,641 - 100,954 67,405 4045 FOXFIRE TRAIL PEDESTRIAN BRIDGE 1,123,530 14,848 15,198 15,198 160,212 948,120 4047 LITTLE ISLAND PARK PARKING LOT IMPROVEMENT 1,797,400 - - - - 1,797,400 4049 WOODSTOCK PARK HRSD COST CONTRIBUTION FY19 2,000,000 - - - - 2,000,000 4050 CENTERVILLE COMMUNITY RECREATION CENTER 100,000 - - - - 100,000 4064 CITY BIKEWAYS & TRAILS PLAN IMPLEM PH II 4,363,371 438,150 2,036,524 2,036,524 27,683 2,299,164 4079 THALIA CREEK GREENWAY I 3,050,000 31,504 458,927 458,927 49,133 2,541,940 4080 SPORTSPLEX/NATL TRNG CTR REN & REPLACE 5,231,498 394,312 3,627,194 394,312 36,472 1,567,832 4300 COM REC CTRS REPAIRS & RENOV-PHIII 18,087,768 1,177,533 9,025,826 - 272,616 8,789,326 4301 PRKS/SPEC USE FACILIT DEV/RENOV-PHIII 11,839,253 1,738,507 9,303,908 1,738,507 70,570 2,464,775 4302 GOLF COURSES CONT'TUAL OBLIGATIONS-MAINT 1,080,000 221,417 607,138 - 209,067 263,795 4303 GREENWAY SCENIC WATER & NAT AREA PH III 1,545,000 65,942 653,430 653,430 750,889 140,681 4305 TENNIS COURT RENOVATIONS - PHASE III 2,175,000 224,432 1,596,288 - - 578,712 4306 OPEN SPACE PARK DEVELOPMENT/MAINT-PHII 14,908,691 1,235,436 8,088,427 1,235,436 1,085,042 5,735,222 4307 ATHLETIC FIELDS LIGHTING/RENOV-PH III 2,327,277 539,398 1,639,512 1,639,512 214,133 473,632 4500 PARK PLAYGROUND RENOVATIONS-PHASE III 3,667,327 239,552 2,943,139 239,552 55,841 668,347 4502 LYNNHAVEN BOAT RAMP/BEACH FAC REP/RENOV 473,378 55,766 149,516 - 98,810 225,052 4506 PARKS INFRASTRUCTURE RENEWAL/REPLACMENT 3,676,724 252 3,570,911 - 10,497 95,316 4517 STUMPY LAKE GOLF COURSE LEASE OBLIGATIONS PH I 269,503 73,037 88,450 73,037 30,478 150,575 4519 BIKEWAYS/TRAILS REPAIRS/RENOVATIONS 1 1,680,000 122,004 452,202 122,004 19,523 1,208,275 4520 GROMMET ISLAND PARK REPAIRS & RENOV-PHI 144,000 - 33,338 - - 110,662 4522 THALIA CREEK GREENWAY TRAIL 800,000 70,225 786,393 - 13,607 -
TOTAL PARKS & RECREATION CAPITAL PROJECTS $ 87,975,343 $ 7,498,015 $ 52,492,710 $ 8,606,439 $ 3,212,203 $ 32,270,430
190

Exhibit 17CITY OF VIRGINIA BEACH, VIRGINIA
COASTAL CAPITAL PROJECTS EXPENDITURESFOR THE YEAR ENDED JUNE 30, 2020
Project Budget Current Year Total Construction Outstanding AvailableNumber Project Name to Date Expenditures Expenditures In Progress Encumbrances Balance
8010 SANDBRIDGE BEACH RESTORATION II $ 22,550,000 $ 91,478 $ 21,817,144 $ - $ 41,818 $ 691,038 8011 VARIOUS MINOR DREDGING II 2,275,000 541,323 2,203,351 - 15,496 56,153 8013 LYNNHAVEN MAINTENANCE DREDGING II 1,967,450 175,650 958,288 - 8,962 1,000,200 8015 BEACH PROFILE MONITORING II 395,000 84,880 305,428 - 9,366 80,206 8016 GILLS COVE NEIGHBORHOOD DREDGING 781,786 5,137 128,082 - 78,438 575,266 8020 BAY BEACHES RESILIENCY STUDY/RESTORATION 4,125,000 146,751 287,316 - 24,418 3,813,266 8021 CROATAN BEACH RESTORATION 1,760,000 27,748 223,697 223,697 26,517 1,509,786 8024 PLEASURE HOUSE POINT MITIGATION FUNDS 230,000 225 225 - - 229,775 8025 BEACH REPLENISHMENT II 8,241,921 75,771 8,208,706 - 32,067 1,148 8026 SANDBRIDGE BEACH RESTORATION III 18,455,000 - - - - 18,455,000 8027 NEIGHBORHOOD DREDGING SPUR CHANNELS 410,767 8,408 8,408 8,408 35,441 366,918 8036 DREDGE OPERATIONS REHAB & MODIFICATIONS 250,000 - - - - 250,000 8037 SCHILLING POINT NEIGHBORHOOD DREDGING FY19 137,718 35,458 35,458 35,458 21,075 81,185 8110 EASTERN BRANCH LYNNHAVEN RIVER DREDGING 5,214,935 54,344 605,521 54,344 769,856 3,839,558 8402 REPLACMENT RUDEE INLET DREDGE 1,291,536 - - - - 1,291,536 8405 SANDBRIDGE BEACH ACCESS IMPROV PH II 2,375,000 42,435 1,730,392 - 299,203 345,405 8406 RUDEE INLET FEDERAL DREDGING PH II 3,960,000 362,693 2,485,204 - - 1,474,796 8407 RUDEE INLET OUTER CHAN MAINT DREDG PH II 5,525,000 - 2,569,841 - - 2,955,159 8408 PLEASURE HOUSE POINT MITIGATION 3,020,000 19,963 385,420 - 41,072 2,593,508 8409 CHESAPEAKE BAY BEACHES 5,878,079 48,701 5,764,615 - 5,501 107,963 8503 CHESOPEIAN COLONY NEIGHBORHOOD DREDGING 2,677,034 1,101,385 2,647,641 - 7,370 22,023 8505 HURDS COVE NEIGHBORHOOD DREDGING 3,462,000 77,487 326,913 77,487 14,251 3,120,836
TOTAL COASTAL CAPITAL PROJECTS $ 94,983,226 $ 2,899,837 $ 50,691,650 $ 399,394 $ 1,430,851 $ 42,860,725
191

Exhibit 17 CITY OF VIRGINIA BEACH, VIRGINIA
ECONOMIC AND TOURISM CAPITAL PROJECTS EXPENDITURESFOR THE YEAR ENDED JUNE 30, 2020
Project Budget Current Year Total Construction Outstanding AvailableNumber Project Name to Date Expenditures Expenditures In Progress Encumbrances Balance 9006 WINSTON-SALEM AVE IMPROVEMENTS $ 8,320,000 $ 55,616 $ 614,263 $ 614,263 $ 7,705,737 $ - 9008 HISTORIC KEMPSVILLE 4,550,000 335,935 4,263,233 335,935 259,718 27,049 9011 RAIL-TO-TRAIL SHARED USE PATH DEVELOPMENT 1,000,000 717 733,897 - - 266,103 9020 VIBE DISTRICT STREET INFRASTRUCTURE I 8,801,058 120,179 1,179,580 1,179,580 1,510,411 6,111,067 9021 LONDON BRIDGE COMMERCE CTR INFRA I 2,095,100 37,558 90,754 90,754 - 2,004,346 9022 BURTON STATION ROADWAY IMPROV I 12,989,931 1,026,533 8,728,038 8,728,038 1,173,798 3,088,095 9028 LYNNHAVEN PARKWAY CORRIDOR IMPROVEMENTS 4,000,000 31,843 377,245 377,245 108,127 3,514,628 9030 VA BEACH BIO INFRASTUCTURE PHASE 3,709,000 3,300,803 3,708,941 3,708,941 - 59 9037 APZ-1 ECONOMIC INCENTIVES 1,857,692 50,037 552,123 - - 1,305,569 9039 17TH STREET IMPROVEMENTS - PHASE 1 2,000,000 - - - 979,221 1,020,779 9041 VIRGINIA BEACH SPORTS CENTER 58,000,000 31,446,250 56,669,381 56,669,381 1,330,619 - 9045 CENTRAL BEACH/CONVENTION DISTRICT PARKING 10,141,047 (83,409) 6,500,166 - 3,640,881 - 9047 TOWN CENTER REINVESTMENT 300,000 137,067 145,040 - 31,038 123,922 9050 DOME SITE STREETSCAPE 7,500,000 - - - - 7,500,000 9053 DOME SITE ENTERTAINMENT VENUE 30,000,000 - - - - 30,000,000 9055 TOWN CENTER GARAGE & PLAZA CAP MAINT II 705,452 - - - - 705,452 9056 OCEANFRONT PARKING FACILITY CAP MAIN/DEV II 2,112,101 655,891 659,763 - 374,096 1,078,242 9059 OCEANA & ITA CONFORMITY & ACQUISITION II 6,225,482 211,738 4,401,745 211,738 82,770 1,740,967 9062 HOUSING & NEIGHBORHOOD STRATEGY 200,000 - - - - 200,000 9063 17TH ST IMPROVEMENTS II 250,000 - - - - 250,000 9065 DOME SITE PARKING 58,050,000 14,486 14,486 14,486 - 58,035,514 9067 ECONOMIC DEVELOPMENT INVESTMENT PROGRAM II 3,384,890 - - - - 3,384,890 9068 DOME SITE DEVELOPMENT SITE ACQUISITION 9,000,000 - - - - 9,000,000 9081 STATEGIC GROWTH AREA PROGRAM 10,629,687 225,545 9,541,334 225,545 1,042,013 46,340 9082 OCEANFRONT GARAGES CAPITAL MAINTENANCE 6,337,991 977,048 5,746,019 - 147,165 444,807 9083 TOWN CENTER GARAGE & PLAZA CAPITAL MAINT 3,368,179 373,857 2,147,222 - 113,280 1,107,677 9086 OCEANFRONT RESTROOM 250,000 34,443 34,443 34,443 64,064 151,493 9091 SGA-BURTON STATION RD IMPROVEMNTS-PH III 10,041,465 43,957 2,484,194 2,484,194 1,904,992 5,652,279 9096 OCEANFRONT CAPITAL PROJECTS REINVEST 4,780,877 658,309 4,267,289 4,267,289 371,438 142,150 9100 19TH STREET INFRASTRUCTURE IMPROVEMENTS 14,926,700 5,217,770 11,131,983 5,217,770 3,396,917 397,800 9108 29TH STREET IMPROVEMENTS 2,504,771 57,359 1,847,044 1,847,044 193,406 464,321 9141 ECONOMIC DEVELOPMENT INVESTMENT PROGRAM 57,892,016 3,384,890 55,359,384 - - 2,532,632 9500 VB AMPHITHEATER CAPITAL MAINTENANCE 2,241,446 187,585 2,059,293 - - 182,153
TOTAL ECONOMIC & TOURISM CAPITAL PROJECTS $ 348,164,885 $ 48,502,007 $ 183,256,860 $ 86,006,646 $ 24,429,691 $ 140,478,334
192

Exhibit 17CITY OF VIRGINIA BEACH, VIRGINIA
SUMMARY OF GENERAL GOVERNMENT CAPITAL PROJECTS REVENUESFOR THE YEAR ENDED JUNE 30, 2020
Budget Actual RevenuesRevenues Prior Years Current Year Total
FEDERAL FUNDING $ 138,132,987 $ 118,426,526 $ 1,339,787 $ 119,766,313
STATE FUNDING 216,450,595 111,578,877 8,551,364 $ 120,130,241
LOCAL FUNDING 1,361,827,878 799,881,960 252,227,962 $ 1,052,109,922
TOTAL GENERAL GOVERNMENT CAPITAL PROJECTS REVENUES $ 1,716,411,460 $ 1,029,887,363 $ 262,119,113 $ 1,292,006,476
193

Exhibit 17 CITY OF VIRGINIA BEACH, VIRGINIA
SUMMARY OF GENERAL GOVERNMENT CAPITAL PROJECTS EXPENDITURESFOR THE YEAR ENDED JUNE 30, 2020
Budget Current Year Total Construction Outstanding AvailableProject Name to Date Expenditures Expenditures In Progress Encumbrances Balance
ENGINEERING AND HIGHWAYS $ 762,547,008 $ 40,180,367 $ 417,784,417 $ 133,251,990 $ 37,133,897 $ 307,628,694
BUILDINGS 422,740,998 68,310,875 253,775,450 75,340,022 75,145,808 93,819,740
PARKS AND RECREATION 87,975,343 7,498,015 52,492,710 8,606,439 3,212,203 32,370,430
COASTAL 94,983,226 2,899,837 50,691,650 399,394 1,430,851 42,860,725
ECONOMIC AND TOURISM 348,164,885 48,502,007 183,256,860 86,006,646 24,429,691 140,478,334
GENERAL GOVERNMENT EXPENDITURES $ 1,716,411,460 167,391,101 $ 958,001,087 $ 303,604,491 $ 141,352,450 $ 617,157,923
CLOSED CAPITAL PROJECTS EXPENDITURES 2,055,125
TOTAL CURRENT YEAR CAPITAL PROJECTS EXPENDITURES AND OTHER FINANCING USES $ 169,446,226
TOTAL GENERAL GOVERNMENT CAPITAL PROJECTS REVENUES $ 1,292,006,476 TOTAL GENERAL GOVERNMENT CAPITAL PROJECTS EXPENDITURES (958,001,087)GENERAL GOVERNMENT CAPITAL PROJECT FUND BALANCE $ 334,005,389
194

WATER AND SEWER
ENTERPRISE FUND


WATER AND SEWER ENTERPRISE FUND
The Water and Sewer Enterprise Fund operates the water distribution and sanitary sewer collection systems. The mission ofthis fund is to provide public water, including water for fire protection, and public sanitary sewer service to the urban areas ofVirginia Beach.
195

Exhibit 18
CITY OF VIRGINIA BEACH, VIRGINIAWATER AND SEWER ENTERPRISE FUND
STATEMENT OF NET POSITIONJUNE 30, 2020
ASSETS Current Assets: Cash and Investments $ 102,753,735 Accounts Receivable - Net of Estimated Uncollectibles 16,864,115 Intergovernmental Receivables 2,324,307 Inventory 3,312,203 Total Current Assets 125,254,360
Noncurrent Assets: Cash and Investments - Restricted 63,984,367 Capital Assets: Land 14,562,826 Buildings 18,940,552 Utility System 1,210,431,647 Machinery and Equipment 33,931,897 Construction in Progress 18,189,967
Less: Accumulated Depreciation (570,995,589)Total Capital Assets 725,061,300
Total Noncurrent Assets 789,045,667 Total Assets 914,300,027
DEFERRED OUTFLOWS OF RESOURCES Deferred Outflows for Pensions 5,244,457 Deferred Outflows for OPEB 966,003
Total Deferred Outflow of Resources 6,210,460
LIABILITIES Current Liabilities: Vouchers and Accounts Payable 4,511,414 Deposits Payable 132,840 Accrued Interest Payable 2,015,937 Construction Contracts Payable 3,335,422 Unearned Revenue 1,461,087 Current Portion of Long-term Liabilites 12,642,062
Total Current Liabilities 24,098,762
Long-Term Liabilities: Compensated Abscences 1,022,295 Bonds and Notes Payable 185,838,325 Net Pension Liability 21,469,378 Net OPEB Liability 2,420,692
Total Long-Term Liabilities 210,750,690 Total Liabilities 234,849,452
DEFERRED INFLOWS OF RESOURCESDeferred Inflows for Pensions 743,026 Deferred Inflows for OPEB 1,306,918
Total Deferred Inflow of Resources 2,049,944
NET POSITION Net Investment in Capital Assets 524,685,632 Restricted for Debt Service 17,979,295 Unrestricted 140,946,164
Total Net Position $ 683,611,091
196

Exhibit 19CITY OF VIRGINIA BEACH, VIRGINIA
WATER AND SEWER ENTERPRISE FUND STATEMENT OF REVENUES, EXPENSES, AND CHANGES IN NET POSITION
FOR THE YEAR ENDED JUNE 30, 2020
OPERATING REVENUES Service Charges $ 76,803,078 Sale of Water 49,651,688 Tap Fees 462,389 Fire Hydrant Rental 3,143 Navy Wheelage Charges 129,109 Interfund Services Provided 3,225,481 Miscellaneous 233,870 Total Operating Revenues 130,508,758
OPERATING EXPENSES Cost of Goods Sold - Water Purchases 29,914,235 Personal Services 29,165,491 Contractual Services 7,777,835 Internal Services 2,967,902 Other Charges 17,256,573 CIP Annual Expenditures 957,277 Depreciation 27,979,427 Total Operating Expenses 116,018,740
OPERATING INCOME (LOSS) 14,490,018
NONOPERATING REVENUES (EXPENSES) Interest Income 3,289,659 Gain From Sale of Assets 56,591 Interest and Fiscal Charges (7,026,660)Total Non Operating Expenses, net (3,680,410)
INCOME (LOSS) BEFORE CONTRIBUTIONS 10,809,608
Capital Contributions 3,174,383 Capital Contributions - Federal Government 889,482 Transfers Out (1,000,554)
CHANGE IN NET POSITION 13,872,919
TOTAL NET POSITION - BEGINNING 669,738,172
TOTAL NET POSITION - ENDING $ 683,611,091
197

Exhibit 20CITY OF VIRGINIA BEACH, VIRGINIA
WATER AND SEWER ENTERPRISE FUNDSTATEMENT OF CASH FLOWS
FOR THE YEAR ENDED JUNE 30, 2020
CASH FLOWS FROM OPERATING ACTIVITIES: Receipts from Customers and Users $ 128,220,549 Receipts from Interfund Services Provided (471,680) Other Operating Cash Receipts 47,494 Cash Payments to Suppliers of Goods and Services (58,716,668) Cash Payments to Employees for Services (28,164,506) Net Cash Provided (Used) By Operating Activities 40,915,189
CASH FLOWS FROM NONCAPITAL FINANCING ACTIVITIES: Payments to Other Funds (1,000,554) Net Cash Provided (Used) By Noncapital Financing Activities (1,000,554)
CASH FLOWS FROM CAPITAL AND RELATED FINANCING ACTIVITIES: Receipts of Capital Contributions 3,825,422 Net Interest on Long-term Debt (8,288,397) Acquisition and Construction of Capital Assets (34,818,831) Proceeds from Sale of Salvage 56,591 Principal Paid on Capital Debt (9,625,000) Net Cash Provided (Used) By Capital and Related Financing Activities (48,850,215)
CASH FLOWS FROM INVESTING ACTIVITIES: Interest and Dividends Received 3,289,659
Net Increase (Decrease) in Cash and Investments (5,645,921)
Cash and Investments, July 1 172,384,023
Cash and Investments, June 30 166,738,102
RECONCILIATION OF OPERATING INCOMETO NET CASH PROVIDED BY OPERATING ACTIVITIES:
Operating Income 14,490,018 Adjustments to Reconcile Operating Income to Net Cash Provided By Operating Activities: Depreciation 27,979,427 Net changes in assets and liabilities: Accounts Receivable (567,460) Intergovernmental Receivables (2,144,935) Inventory (314,355) Deferred Outflow of Resources (2,451,995) Vouchers and Accounts Payable (17,841) Deposits Payable 6,113 Unearned Revenue 483,237 Deferred Inflow of Resources 1,026,990 Accrued Compensated Leave (22,816) Net Pension Liability 3,605,432 Net OPEB Liability (1,156,626) Net Cash Provided (Used) By Operating Activities 40,915,189
NONCASH INVESTING, CAPITAL, AND FINANCING ACTIVITIES: Capital Contributions of Capital Assets $ 238,443
198

Exhibit 21CITY OF VIRGINIA BEACH, VIRGINIA
WATER AND SEWER ENTERPRISE FUNDSCHEDULE OF OPERATING EXPENSES - BUDGET AND ACTUAL
FOR THE YEAR ENDED JUNE 30, 2020Budget Actual Variance
Director of Public Utilities Personal Services $ 271,214 $ 278,846 $ (7,632) Fringe Benefits 88,001 106,087 (18,086) Contractual Services 10,250 1,196 9,054 Internal Services 29,195 28,607 588 Other Charges 50,285 37,178 13,107 Total Director of Public Utilities 448,945 451,914 (2,969)Engineering Staff Personal Services 5,733,619 4,654,514 1,079,105 Fringe Benefits 1,751,568 1,544,269 207,299 Contractual Services 844,618 658,759 185,859 Internal Services 294,329 254,033 40,296 Other Charges 368,116 147,869 220,248 Total Engineering Staff 8,992,250 7,259,444 1,732,806
Regulatory Management, Operations and Maintenance 4,282,200 840,090 3,442,110
Water Services Contract 31,702,775 29,914,235 1,788,540 Operations and Maintenance Administration Personal Services 1,932,458 1,718,209 214,249 Fringe Benefits 616,588 540,762 75,826 Contractual Services 2,481,898 1,108,332 1,373,566 Internal Services 139,688 142,353 (2,665) Other Charges 943,202 992,751 (49,549) Total Operations and Maintenance Administration 6,113,834 4,502,407 1,611,427 Water Distribution Personal Services 2,570,145 2,377,808 192,337 Fringe Benefits 845,232 764,383 80,849 Contractual Services 253,544 146,653 106,891 Internal Services 513,331 479,576 33,755 Other Charges 989,514 922,293 67,222 Total Water Distribution 5,171,766 4,690,713 481,054 Lake Gaston Facilities Contractual Services 1,973,225 1,154,322 818,903 Internal Services 85,700 12,381 73,319 Other Charges 1,441,600 933,787 507,813 Total Lake Gaston Facilities 3,500,525 2,100,490 1,400,035 Sewer Collection Systems Personal Services 3,231,215 2,917,210 314,005 Fringe Benefits 1,046,872 910,734 136,138 Contractual Services 181,597 69,257 112,339 Internal Services 1,086,095 1,050,459 35,637 Other Charges 829,098 632,692 196,407 Total Sewer Collection Systems 6,374,877 5,580,351 794,526 Sewer Pump Stations Personal Services 2,635,465 2,470,164 165,301 Fringe Benefits 919,940 877,933 42,007 Contractual Services 359,133 119,247 239,886 Internal Services 513,317 498,876 14,441 Other Charges 2,277,238 2,120,965 156,273 Total Sewer Pump Stations 6,705,093 6,087,185 617,908
199(continued)

Exhibit 21CITY OF VIRGINIA BEACH, VIRGINIA
WATER AND SEWER ENTERPRISE FUNDSCHEDULE OF OPERATING EXPENSES - BUDGET AND ACTUAL
FOR THE YEAR ENDED JUNE 30, 2020Budget Actual Variance
Technical Services Personal Services 1,723,343 1,531,919 191,424 Fringe Benefits 531,813 427,844 103,969 Contractual Services 127,822 49,843 77,979 Internal Services - 3,030 (3,030) Other Charges 75,750 11,832 63,918 Total Technical Services 2,458,728 2,024,468 434,260 Customer Services Personal Services 3,215,282 2,493,289 721,993 Fringe Benefits 1,130,398 841,775 288,623 Contractual Services 3,290,737 2,334,105 956,633 Internal Services 244,666 200,020 44,646 Other Charges 1,297,043 889,750 407,293 Total Customer Services 9,178,126 6,758,938 2,419,188 Meter Operations Personal Services 1,431,238 1,365,186 66,052 Fringe Benefits 489,275 488,978 297 Contractual Services 1,722,574 1,260,034 462,540 Internal Services 234,823 223,542 11,281 Other Charges 857,402 690,196 167,206 Total Meter Operations 4,735,313 4,027,935 707,378 Electrical Support Personal Services 1,110,729 1,108,815 1,914 Fringe Benefits 369,906 377,119 (7,213) Contractual Services 53,000 35,863 17,137 Internal Services 80,404 75,027 5,377 Other Charges 85,723 40,839 44,884 Total Meter Operations 1,699,762 1,637,663 62,099 General Fund Charges Office Rental 507,960 204,408 303,552 Landscape Services 559,605 568,230 (8,625) Support Personnel 646,204 648,934 (2,730) Occupational Health 33,750 17,500 16,250 Building Maintenance 165,130 106,854 58,276 Communication Technology Charges 2,074,214 2,074,214 - Indirect Cost Allocation 2,141,396 2,034,599 106,797 Right of Way Utility 4,000,000 4,000,000 - Water Assistance 250,000 181,681 68,319 Total General Fund Charges 10,378,259 9,836,420 541,839 Other Charges Retiree Health Insurance 550,500 345,981 204,519 CIP Annual Expenditures - 957,278 (957,278) Net Deferred OPEB Contributions - (64,399) 64,399 Net Deferred Pension Contributions - 1,088,200 (1,088,200) Reserves 1,174,638 - 1,174,638 Total Other Charges 1,725,138 2,327,060 (1,776,560)
Total Budgeted Operating Expenses $ 103,467,591 $ 88,039,313 $ 14,253,640
Note: Depreciation is not included in the Budgeted Operating Expenses. The City does not budget for depreciation.
200

Exhibit 22CITY OF VIRGINIA BEACH, VIRGINIA
WATER AND SEWER FUND CAPITAL PROJECTSWATER CAPITAL PROJECTS EXPENDITURES
FOR THE YEAR ENDED JUNE 30, 2020
Project Budget Current Year Total Construction Outstanding AvailableNumber Project Name to Date Expenditures Expenditures In Progress Encumbrances Balance 5010000 RAW WATER TRANSMISSION SYSTEM REHAB $ 8,640,000 $ 609,254 $ 3,369,987 $ - $ 4,020,822 $ 1,249,191 5014000 WATER PUMP REPAIRS & REPLACEMENTS 205,000 42,881 75,799 - - 129,201 5020000 CLEVELAND ST WATER IMPROVEMENTS 700,000 278,926 508,775 508,775 71,267 119,958 5021000 PEMBROKE MEADOWS NEIGHBORHOOD WATER 5,000,000 - - - 55,214 4,944,786 5023000 GREAT NECK WATER TANK REPLACEMENT 2,200,000 193,354 193,354 193,354 166,305 1,840,341 5028000 WITCHDUCK RD - PHASE II WATER IMPRO 1,787,000 50 1,777,655 1,777,655 9,345 - 5030000 SHORE DRIVE WATER LINE IMPROVEMENTS 3,385,000 - 100,440 100,440 42,420 3,242,140 5031000 SYSTEM EXP COST PARTICIPATION AGREE 400,000 21,000 151,000 - - 249,000 5033000 WATER TRANSMISSION SYSTEM UPGRADE PR 2,220,000 24,469 24,469 - 1,167,105 1,028,426 5034000 WATER LINE EXTENSION, REPL & REHAB P 500,000 - - - - 500,000 5043000 LANDSTOWN ROAD WATER IMPROVEMENTS 720,000 - 13,700 13,700 4,300 702,000 5045000 ROSEMONT RD PHASE V WATER IMPROVEMEN 1,740,000 - - - - 1,740,000 5101000 VIBE DISTRICT WATER IMPROVEMENTS 600,000 - - - - 600,000 5121000 CAMP PENDLETON WATER IMPROVEMENTS 530,000 - 517,003 517,003 - 12,997 5122000 SERVICE ORDER AUTOMATION SOLUTION PH 463,095 57,837 83,441 - 5,449 374,205 5148000 ELBOW ROAD EXT - PH I & II 1,179,663 16,737 396,399 16,737 13,694 769,570 5149000 INDIAN RIVER RD - PHASE VII 253,548 - 58,224 - 10,324 185,000 5151000 LANDSTOWN YARD IMPROVEMENTS - PHASE 5,721,000 135,343 2,424,084 - 40,701 3,256,215 5155000 UTILITIES TECHNOLOGY SUPPORT PROGRA 450,000 2,063 2,063 2,063 53,865 394,072 5156000 VIRGINIA BEACH BLVD WATER SYSTEM IM 350,000 - - - - 350,000 5168000 SHORE DR WATER LINE IMPROVE II (VDO 175,000 - - - - 175,000 5207000 LASKIN ROAD - PHASE I 3,310,458 2,039,737 2,409,640 2,254,034 17,838 882,980 5251000 VARIOUS RDWY STORM WATER COOR VI 3,050,000 174,997 1,414,632 - 284,751 1,350,617 5405000 CUSTOMER INFO SYSTEM VERSION MIGRAT 1,850,000 380,169 656,235 656,235 746,104 447,661 5452000 COMPREHENSIVE WATER MASTER PLANNING 635,149 181,369 609,372 - 9,039 16,738 5501000 WTR PUMP STATION/TANK UPGRADE PRG - 18,699,996 640,270 16,010,852 - 2,537,603 151,541 5601000 FIRST COLONIAL/VB BLVD INTERSECTION 1,095,000 - 40,648 40,648 - 1,054,352 5604000 PA ROAD WATER IMPROVEMENTS - PHASE 1,130,000 13,560 22,621 22,621 - 1,107,379 5708000 RESORT AREA NEIGHBORHOOD REVITALIZA 6,896,636 278,867 4,667,512 - 3,028 2,226,096 5804000 WATER LINE EXT REPLACE REHAB PROGRA 8,035,000 220,791 5,814,202 - 380,789 1,840,009 5952000 WTR PUMP STA FLOW MONITOR/DATA STOR 1,498,942 - 1,419,695 - 79,208 39 5953000 WATER TAP INSTALLATION PROGRAM PH I 2,139,754 245,030 1,642,364 - 459,887 37,503
TOTAL WATER CAPITAL PROJECT EXPENDITURES $ 85,560,241 $ 5,556,704 $ 44,404,166 $ 6,103,265 $ 10,179,058 $ 30,977,017
CLOSED WATER CAPITAL PROJECTS EXPENDITURES 89,307
TOTAL CURRENT YEAR CAPITAL PROJECT EXPENDITURES $ 5,646,011
201

Exhibit 22 CITY OF VIRGINIA BEACH, VIRGINIA
WATER AND SEWER FUND CAPITAL PROJECTSSEWER CAPITAL PROJECTS EXPENDITURES
FOR THE YEAR ENDED JUNE 30, 2020
Project Budget Current Year Total Construction Outstanding AvailableNumber Project Name to Date Expenditures Expenditures In Progress Encumbrances Balance 6019000 RESORT AREA NEIGHBORHOOD REVITALIZATION $ 15,333,000 $ 506,006 $ 14,047,152 $ - $ 269,969 $ 1,015,879 6041000 PUMP STATION MODIFICATIONS-PHASE V 74,695,640 9,431,670 71,987,714 - 2,252,100 455,826 6043000 LANDSTOWN ROAD SEWER IMPROVEMENTS 370,000 - 18,040 18,040 5,960 346,000 6051000 INDIAN RIVER ROAD - PHASE VII 129,717 - 9,473 9,473 - 120,244 6058000 ROYAL PALM ARCH SANITARY SEWER REHAB 5,350,000 3,966,384 3,967,915 3,967,915 1,210,279 171,806 6070000 INFILTRATION & REHAB PH V 28,155,000 3,869,732 27,477,362 - 581,346 96,292 6075000 LASKIN ROAD - PHASE I 3,950,264 1,915,818 2,012,613 2,012,583 16,573 1,921,078 6088000 CLEVELAND ST SEWER IMPROV 700,000 52,150 250,338 250,338 73,826 375,836 6092000 VACUUM VALVE MONITORING SYSTEM 2,345,000 16,254 1,334,007 - 125,619 885,374 6093000 CONSENT ORDER REHAB PLAN IMPLEMENTATION - PH I 7,282,248 276,660 6,798,434 - 307,756 176,058 6099000 ARROWHEAD SUSQEHANNA SANITARY SEWER REHAB 250,000 12,874 205,713 205,713 - 44,287 6101000 VIBE DISTRICT SEWER IMPROVEMENTS 1,000,000 20,868 807,304 807,304 2,790 189,906 6107000 SEWER PUMP REPAIRS & REPLACEMENTS 1,095,000 484,775 880,927 - 207,320 6,753 6108000 PEMBROKE MEADOWS NEIGHBORHOOD SANITARY SEWER 800,000 - - - - 800,000 6110000 SANITARY SEWER REGULATORY COMPLIANCE PRG II 1,760,000 769,169 846,927 846,927 352,558 560,515 6111000 SANITARY SEWER REVITALIZATION PROGRAM III 5,600,000 116,007 116,007 - 3,439,730 2,044,263 6121000 CAMP PENDLETON SEWER IMPROVEMENTS 770,000 - 765,714 765,714 - 4,286 6122000 SERVICE ORDER AUTOMATION SOLUTION PHA II 462,895 57,837 83,441 - 5,449 374,005 6151000 LANDSTOWN YARD IMPROVEMENTS - PHASE IV 4,905,000 121,075 1,919,453 - 52,748 2,932,799 6153000 PUMP STATION PROGRAM VI 12,119,398 391,372 391,372 - 3,819,538 7,908,488 6155000 UTILITIES TECHNOLOGY SUPPORT PROGRAM 450,000 2,063 2,063 2,063 53,865 394,072 6405000 CUSTOMER INFO SYSTEM VERSION MIGRATION 1,850,000 380,169 638,004 638,004 746,104 465,892 6501000 AUX POWER PRG-SEWER PMP STATIONS-PH III 13,706,075 272,200 10,036,741 - 343,685 3,325,649 6551000 SYSTEM EXP COST PARTICIPATION AGREE III 3,150,000 223,856 2,169,452 - 3,065 977,483 6552000 SANITARY SEWER SYS REVITAL'N PRG-PH II 29,465,736 2,841,668 27,945,560 - 1,403,621 116,555 6556000 VARIOUS ROADWAY/STORM WATER COORD VI 4,300,000 212,425 1,535,065 - 422,513 2,342,422 6557000 SGA SANITARY SEWER SYSTEM IMPROVEMENTS 2,943,738 446,989 507,925 507,925 1,857,158 578,655 6601000 FIRST COLONIAL/VB BLVD INTERSECTION IMPROV 1,510,000 - 40,648 40,648 - 1,469,352 6604000 WITCHDUCK ROAD-PHASE II SEWER IMPROVEMENTS 1,706,499 259,150 1,638,426 1,638,426 56,487 11,586 6804000 SANIT SWR REGULATORY COMPLICANCE PRG - PH I 27,988,476 375,629 27,673,810 375,629 140,892 173,774 6952000 SWR PUMP STA FLOW MONITOR/DATA STORAGE 27,651,062 1,260,312 26,564,881 - 190,825 895,356 6953000 SEWER TAP INSTALLATION PROGRAM PH II 3,271,811 423,629 2,570,480 - 667,015 34,316
TOTAL SEWER CAPITAL PROJECT EXPENDITURES $ 285,066,559 $ 28,706,741 $ 235,242,961 $ 12,086,702 $ 18,608,791 $ 31,214,807
CLOSED SEWER CAPITAL PROJECT EXPENDITURES $ 431,774
TOTAL CURRENT YEAR SEWER CAPITAL PROJECTS EXPENDITURES $ 29,138,515
WATER AND SEWER CAPITAL PROJECTS $ 370,626,800 $ 34,784,526 $ 279,647,127 $ 18,189,967 $ 28,787,849 $ 62,191,824
TOTAL WATER AND SEWER CAPITAL PROJECTS REVENUES $ 314,782,247 TOTAL WATER AND SEWER CAPITAL PROJECTS EXPENDITURES (279,647,127)WATER AND SEWER CASH RESTRICTED FOR CAPITAL PROJECTS $ 35,135,120
202

Exhibit 22CITY OF VIRGINIA BEACH, VIRGINIA
WATER AND SEWER FUND CAPITAL PROJECTSBUDGETED AND ACTUAL REVENUESFOR THE YEAR ENDED JUNE 30, 2020
Budget Actual RevenuesRevenues Prior Years Current Year Total
FEDERAL FUNDING $ 372,245 $ 372,245 $ - $ 372,245
STATE FUNDING 90,121 90,121 - 90,121
LOCAL FUNDING 370,164,434 293,842,958 20,476,923 314,319,881
TOTAL WATER AND SEWERCAPITAL PROJECTS REVENUES $ 370,626,800 $ 294,305,324 $ 20,476,923 $ 314,782,247
203

This Page Intentionally Left Blank
204

STORM WATER
ENTERPRISE FUND


STORM WATER ENTERPRISE FUND
The Storm Water Enterprise Fund accounts for revenues and expenditures generated by the storm water utility fee foroperational and capital needs for storm water management in the city. The storm water CIP is designed to create an effectivedrainage and storm water management system, protect natural resources, enhance quality of land and waterways, maintain thecity's utility systems, encourage development only in accordance with principles of natural environment protection, andprovide adequate resources to maintain existing infrastructure.
205

Exhibit 23CITY OF VIRGINIA BEACH, VIRGINIA
STORM WATER ENTERPRISE FUNDSTATEMENT OF NET POSITION
JUNE 30, 2020
ASSETS Current Assets: Cash and Investments $ 35,829,236 Accounts Receivable - Net of Estimated Uncollectibles 5,779,936
Intergovernmental Receivables 322,946 Total Current Assets 41,932,118
Non-current Assets: Cash and Investments - Restricted 8,446,354 Capital Assets: Land 133,318,193 Building 664,899 Utility System 338,100,032 Machinery and Equipment 17,688,352 Construction in Progress 27,087,635 Less: Accumulated Depreciation (86,716,703) Total Capital Assets 430,142,408 Total Non-current Assets 438,588,762 Total Assets 480,520,880
DEFERRED OUTFLOWS OF RESOURCES Deferred Outlflows for Pensions 2,326,335 Deferred Outflows for OPEB 230,445 Total Deferred Outflow of Resources 2,556,780
LIABILITIES Current Liabilities: Vouchers and Accounts Payable 1,012,771
Deposits Payable 263 Accrued Interest Payable 323,558 Construction Contracts Payable 4,901,544 Current Portion of Long-term Liabilities 3,231,147 Total Current Liabilities 9,469,283
Compensated Abscences 201,404 Bond and Notes Payable 66,202,531 Net OPEB Liability 1,482,571 Net Pension Liability 9,523,382 Total Long-term Liabilities 77,409,888 Total Liabilities 86,879,171
DEFERRED INFLOWS OF RESOURCES Deferred Inflows for Pensions 329,591 Deferred Inflows for OPEB 311,771 Total Deferred Inflows of Resources 641,362
NET POSITION Net Investment in Capital Assets 360,439,709 Restricted for Future Debt Services 3,393,570 Unrestricted 31,723,848
Total Net Position $ 395,557,127
206

Exhibit 24CITY OF VIRGINIA BEACH, VIRGINIASTORM WATER ENTERPRISE FUND
STATEMENT OF REVENUES, EXPENSES, AND CHANGES IN NET POSITIONFOR THE YEAR ENDED JUNE 30, 2020
OPERATING REVENUES Service Charges $ 44,778,666 Miscellaneous 517 Total Operating Revenues 44,779,183
OPERATING EXPENSES Personal Services 6,699,889 Contractual Services 3,911,353 Internal Services 1,196,161 Other Charges 11,885,059 Depreciation 7,309,940 Total Operating Expenses 31,002,402
OPERATING INCOME (LOSS) 13,776,781
NONOPERATING REVENUES (EXPENSES) Interest Income 1,037,329 Gain (Loss) From Sale of Assets 37,494 Interest and Fiscal Charges (2,380,083) Total Nonoperating Revenues (Expenses) (1,305,260)
INCOME (LOSS) BEFORE TRANSFERS AND CONTRIBUTIONS 12,471,521
Capital Contributions 15,418 Capital Contributions - Federal Government 933,736 Transfers In 1,004,873 Total Transfers and Contributions 1,954,027
CHANGE IN NET POSITION 14,425,548
TOTAL NET POSITION - BEGINNING 381,131,579
TOTAL NET POSITION - ENDING $ 395,557,127
207

Exhibit 25CITY OF VIRGINIA BEACH, VIRGINIA
STORM WATER ENTERPRISE FUNDSTATEMENT OF CASH FLOWS
FOR THE YEAR ENDED JUNE 30, 2020
CASH FLOWS FROM OPERATING ACTIVITIES: Receipts from Customers and Users $ 44,101,331 Other Operating Cash Receipts 517 Cash Payments to Suppliers of Goods and Services (17,472,124) Cash Payments to Employees for Services (6,682,670) Net Cash Provided (Used) By Operating Activities 19,947,054
CASH FLOWS FROM NONCAPITAL FINANCING ACTIVITIES: Receipts from Other Funds 1,004,873 Net Cash Provided (Used) By Noncapital Financing Activities 1,004,873
CASH FLOWS FROM CAPITAL AND RELATED FINANCING ACTIVITIES:Receipts of Capital Contributions 949,154
Net Interest on Long-term Debt (2,653,519) Acquisition and Construction of Capital Assets (32,039,242) Proceeds from Sale of Salvage 37,494 Principal Paid on Capital Debt (2,525,000) Net Cash Provided (Used) By Capital and Related Financing Activities (36,231,113)
CASH FLOWS FROM INVESTING ACTIVITIES: Interest and Dividends Received 1,037,329
Net Increase (Decrease) in Cash and Investments (14,241,857)
Cash and Investments, July 1 58,517,446
Cash and Investments, June 30 44,275,589
RECONCILIATION OF OPERATING INCOMETO NET CASH PROVIDED BY OPERATING ACTIVITIES:
Operating Income 13,776,781 Adjustments to Reconcile Operating Income to Net Cash Provided By Operating Activities: Depreciation 7,309,940 Net changes in assets and liabilities: Accounts Receivable (354,389) Intergovernmental Receivables (322,946) Deferred Outflow of Resources (845,469) Vouchers and Accounts Payable (479,814) Deposits Payable 263
Deferred Inflow of Resources 179,523 Accrued Compensated Leave (640,214)Net Pension Liability 1,599,297 Net OPEB Liability (275,918)
Net Cash Provided (Used) By Operating Activities $ 19,947,054
208

Exhibit 26CITY OF VIRGINIA BEACH, VIRGINIA
STORM WATER ENTERPRISE FUNDSCHEDULE OF OPERATING EXPENSES - BUDGET AND ACTUAL
FOR THE YEAR ENDED JUNE 30, 2020
VariancePositive
Budget Actual (Negative)
Operations and Maintenance Personal Services 4,890,018 3,697,271 1,192,747 Fringe Benefits 1,530,838 1,457,118 73,720 Contractual Services 5,655,942 2,708,164 2,947,778 Internal Services 1,248,622 1,178,271 70,351 Other Charges 578,489 373,904 204,585 Total Operations and Maintenance 13,903,909 9,414,728 4,489,181
Inspections and Environmental Spill Response Personal Services 667,765 594,947 72,818 Fringe Benefits 228,807 210,616 18,191 Contractual Services 50,250 27,499 22,751 Internal Services 18,827 17,890 937 Other Charges 28,755 17,677 11,078 Total Inspections and Environmental Spill Response 994,404 868,629 125,775
Residential Street Sweeping Contractual Services 1,335,161 1,175,690 159,472 Total Residential Street Sweeping 1,335,161 1,175,690 159,472
General Fund Charges Direct Cost Allocations 254,891 254,891 - Indirect Cost Allocations 1,939,049 1,939,049 - Landscape Services 68,057 68,057 - IT Core Services 53,691 53,691 - Stormwater Regulations 142,324 142,324 - Total General Fund Charges 2,458,012 2,458,012 -
Other Charges Retiree Health Insurance 177,092 82,503 94,589 CIP Annual Expenditures - 8,134,590 (8,134,590) Water and Sewer Billing System Charges 900,877 900,877 - Net Deferred OPEB Contributions - 174,729 (174,729) Net Deferred Pension Contributions - 482,704 (482,704) Reserves 1,206,145 - 1,206,145 Total Other Charges 2,284,114 9,775,403 (7,491,289)
Total Budgeted Operating Expenses $ 20,975,600 $ 23,692,462 $ (2,716,861)
Note: Total General Fund Charges reclassified as Other Charges. Depreciation is not included in the Budgeted Operating Expenses. The City does not budget for depreciation.
209

Exhibit 27CITY OF VIRGINIA BEACH, VIRGINIA
STORM WATER CAPITAL PROJECTS EXPENDITURESFOR THE YEAR ENDED JUNE 30, 2020
ProjectNumber Project Name
Budget toDate
Current YearExpenditures
Total Expenditures
Construction In Progress
Outstanding Encumbrances
Available Balance
7005000 NORTH LAKE HOLLY WATERSHED $ 21,671,135 $ 2,250,050 $ 16,481,151 $ - $ 549,152 $ 13,426,667 7016000 SOUTH LAKE HOLLY WATERSHED (PARTIAL) 16,609,587 2,569,261 14,380,067 - 1,724,444 15,130,758 7023000 PRIMARY SYSTEM INFRASTRUCTURE IMPROVE II 12,890,000 1,631,903 10,048,161 - 598,373 12,890,000 7024000 SOUTHERN CANAL/LEAD DITCH & CULVERT IMPRV 6,130,000 937,721 2,753,946 - 612,875 5,830,000 7026000 RESIDENTIAL DRAINAGE COST PART PRGM II 350,000 2,835 229,915 - 4,125 350,000 7027000 SWM MSTR PLANNING, ANALYSIS, & INVENTORY 9,770,906 1,584,540 6,310,197 - 1,403,876 9,042,000 7028000 WINDSOR WOODS DRAINAGE 14,345,237 2,317,886 8,791,502 8,791,502 1,129,462 9,052,453 7030000 SEA LEVEL RISE/RECURRENT FLOODING ANALYSIS 4,004,447 797,683 3,439,628 - 261,454 3,160,000 7032000 FLOOD MITIGATION ASSISTANCE GRANT PROGRAM 1,227,144 442,878 1,206,144 - 21,000 - 7036000 BAKER ROAD CULVERT & DITCH IMPROVEMENTS 450,000 58,136 365,200 365,200 67,102 450,000 7041000 CENTRAL RESORT DIST DRAINAGE IMPROV 800,000 32,886 157,704 - 352,957 300,000 7042000 SURFACE WATER REG COMPLIANCE PROG 8,831,942 2,255,117 5,762,141 5,762,141 1,621,099 8,831,942 7043000 WATER QUALITY & RESTORE PART II 116,773 - - - - 116,773 7044000 FLOOD MITIGATION GRANT PROGRAM II 874,061 419,490 779,505 - 62,349 - 7047000 ASHVILLE PARK DRAINANGE IMPROVEMENTS 12,000,000 1,072,060 2,397,092 - 7,242,964 10,500,000 7048000 SHERWOOD LAKES DRAINANGE IMPROVEMENTS 3,400,000 1,260,647 3,098,688 - 17,686 3,000,000 7050000 PRINCESS ANNE PLAZA DRAINAGE AREA 5,073,597 788,101 2,747,238 2,747,238 1,183,112 5,073,597 7051000 THE LAKES DRAINAGE IMPROVEMENTS 2,000,000 171,861 1,279,370 1,279,370 257,628 2,000,000 7053000 LAKE CHUBB/BRADFORD LAKE 3,252,300 337,080 411,461 411,461 213,876 3,252,300 7054000 LYNNHAVEN RIVER WATERSHED II 3,021,605 184,443 190,789 190,789 44,840 3,021,605 7055000 CANAL MANAGEMENT PHASE I 500,000 355,587 460,748 - 34,990 500,000 7058000 FLOOD MITIGATION ASSIST GRANT PROGRAM III 2,914,976 1,514,170 1,966,556 - 819,359 - 7059000 LYNNHAVEN RIVER BASIN ECOSYSTEM RESTORATION 6,000,000 4,068,506 4,069,914 - - 6,000,000 7060000 BAYVILLE LAKE WATER QUALITY IMPROVEMENTS 1,000,000 - - - - 1,000,000 7064000 CENTRAL RESORT DISTRICT - 24TH ST 1,200,000 - - - 1,100,000 1,200,000 7065000 EASTERN SHORE DR-CAPE HENRY CANAL P 1,800,000 - - - - 1,800,000 7068000 ESDD-LYNNHAVEN COLONY PARK PUMP STA 500,000 - - - - 500,000 7069000 E SHORE DR-LYNNHAVEN DRIVE PUMP STA 2,500,000 3,374 3,374 3,374 - 2,500,000 7072000 LYNNHAVEN RIVER WATERSHED STORMWATE 780,000 - - - - 780,000 7077000 WINDSOR WOODS PUMP STATION 500,000 - - - - 500,000 7078000 WINDSOR WOODS TIDE GATE 4,500,000 718,947 718,947 718,947 889,555 4,500,000 7079000 42ND ST PUMP STATION OUTFALLS 4,476,522 285,220 285,220 - 139,550 4,476,522 7081000 ATLANTIC OCEAN WATERSHED STORMWATER 500,000 - - - - 500,000 7082000 BMP MAINTENANCE 1,000,000 26,000 26,000 - 112,600 1,000,000 7151000 EASTERN SHORE DRIVE DRAINAGE 17,500,000 3,068,926 7,604,617 - 7,091,834 17,500,000 7152000 DAM & SPILLWAY STRUCTURAL IMPROVEMENTS 6,953,735 78,514 6,898,268 - 43,284 4,173,172 7400000 ARAGONA DRAINAGE IMPROVEMENTS 4,400,000 320,938 776,023 776,023 3,301,226 4,400,000 7402000 COLLEGE PARK/LEVEL GREEN DRAINAGE IMPROV 1,498,687 338,388 667,093 - 399,691 1,498,687 7406000 ELIZABETH RIVER TMDL IMPLEMENTATION PLAN 9,285,150 199,089 4,675,011 4,675,011 417,207 9,285,150 7410000 SOUTHERN RIVER TMDL IMPLEMENTATION PLAN 2,500,000 282,923 888,277 888,277 163,670 2,500,000 7411000 OCEANFRONT STORM WATER FACILITIES MAINT 8,380,740 1,275,108 4,974,246 - 2,050,923 8,380,740 7412000 STORM WATER PUMP STATION MODIFICATIONS 7,525,229 1,570,851 6,151,610 - 484,957 7,525,229 7413000 NEIGBORHD SW INFRASTRUCTURE IMPRO PH II 5,430,503 422,475 3,657,064 - 274,962 5,116,464 7414000 STORM WATER QUALITY ENHANCEMENTS PH II 13,017,948 478,302 6,385,135 478,302 4,719,780 12,677,010 7415000 LAKE MANAGEMENT PH II 37,155,432 3,296,522 27,532,204 - 5,721,289 37,136,100 7416000 SW INFRASTRUCTURE REHAB & INPROV PH II 43,606,982 3,732,263 38,515,115 - 2,557,859 43,606,982
TOTAL STORM WATER EXPENDITURES $ 312,244,638 $ 41,150,681 $ 197,085,321 $ 27,087,635 $ 47,691,110 $ 284,484,151
CLOSED CAPITAL PROJECTS EXPENDITURES 21,942
STORM WATER CAPITAL PROJECTS $ 312,244,638 $ 41,172,623 $ 197,085,321 $ 27,087,635 $ 47,691,110 $ 284,484,151
TOTAL STORM WATER CAPITAL PROJECTS REVENUES $ 200,314,899 TOTAL STORM WATER CAPITAL PROJECTS EXPENDITURES (197,085,321)STORM WATER CASH RESTRICTED FOR CAPITAL PROJECTS $ 3,229,578
210

Exhibit 27CITY OF VIRGINIA BEACH, VIRGINIA
STORM WATER CAPITAL PROJECTS BUDGETED AND ACTUAL REVENUESFOR THE YEAR ENDED JUNE 30, 2019
Budget Actual Revenues Funding Sources Revenues Prior Years Current Year Total
FEDERAL FUNDING $ 13,106,235 $ 5,817,547 $ 682,806 $ 6,500,353
STATE FUNDING 431,153 411,821 - 411,821
LOCAL FUNDING 298,707,250 163,387,307 30,015,418 193,402,725
TOTAL STORM WATER UTILITY CAPITALPROJECTS $ 312,244,638 $ 169,616,675 $ 30,698,224 $ 200,314,899
211

This Page Intentionally Left Blank
212

WASTE MANAGEMENT
ENTERPRISE FUND


WASTE MANAGEMENT ENTERPRISE FUND
The Waste Management Enterprise Fund provides citywide residential automated, manual and special solid wastecollections, providing containers for residents to dispose of large quantities of yard debris, centralizing the City’srecycling effort, operating a city landfill, and serving as a conduit between the City and the Southeastern PublicService Authority, which is the agency responsible for the regional waste disposal program.
213

Exhibit 28CITY OF VIRGINIA BEACH, VIRGINIA
WASTE MANAGEMENT ENTERPRISE FUNDSTATEMENT OF NET POSITION
JUNE 30, 2020
ASSETS Current Assets: Cash and Investments $ 12,389,149 Accounts Receivable - Net of Estimated Uncollectibles 5,425,939 Total Current Assets 17,815,088
Non-current Assets: Capital Assets: Machinery and Equipment 15,433,218 General Site Improvements Other Than Buildings 366,891
Building 8,730 Less: Accumulated Depreciation (9,765,057) Total Capital Assets 6,043,782 Total Non-current Assets 6,043,782 Total Assets 23,858,870
DEFERRED OUTFLOWS OF RESOURCES Deferred Outflows for Pensions 1,346,826 Deferred Outflows for OPEB 365,454 Total Deferred Outflow of Resources 1,712,280
LIABILITIES Current Liabilities: Vouchers and Accounts Payable 1,638,405 Current Portion of Long-term Liabilities 528,790 Total Current Liabilities 2,167,195
Long-Term Liabilities (less current portion): Net OPEB Liability 915,780 Net Pension Liability 5,513,537 Accrued Compensated Leave 514,958 Total Long-Term Liabilities (less current portion) 6,944,275 Total Liabilities 9,111,470
DEFERRED INFLOWS OF RESOURCES Deferred Inflows for Pensions 190,816 Deferred Inflows for OPEB 494,425 Total Deferred Inflow of Resources 685,241
NET POSITION Net Investment in Capital Assets 6,043,784 Unrestricted (deficit) 9,730,655
Total Net Position $ 15,774,439
214

Exhibit 29
CITY OF VIRGINIA BEACH, VIRGINIAWASTE MANAGEMENT ENTERPRISE FUND
STATEMENT OF REVENUES, EXPENSES, AND CHANGES IN NET POSITIONFOR THE YEAR ENDED JUNE 30, 2020
OPERATING REVENUES Service Charges $ 37,161,454 Miscellaneous 872,146 Total Operating Revenues 38,033,600
OPERATING EXPENSES Personal Services 10,407,511 Contractual Services 14,396,831 Internal Services 5,500,923 Other Charges 2,990,596 Depreciation 1,737,130 Total Operating Expenses 35,032,991
OPERATING INCOME (LOSS) 3,000,609
NONOPERATING REVENUES (EXPENSES) Interest Income 193,754 Gain (Loss) From Sale of Assets 28,689 From Commonwealth 35,658 Total Nonoperating Revenues (Expenses) 258,101
INCOME (LOSS) BEFORE TRANSFERS 3,258,710
Transfers In -
CHANGE IN NET POSITION 3,258,710
TOTAL NET POSITION - BEGINNING 12,515,729 TOTAL NET POSITION - ENDING $ 15,774,439
215

Exhibit 30CITY OF VIRGINIA BEACH, VIRGINIA
WASTE MANAGEMENT ENTERPRISE FUNDSTATEMENT OF CASH FLOWS
FOR THE YEAR ENDED JUNE 30, 2020
CASH FLOWS FROM OPERATING ACTIVITIES: Receipts from Customers and Users $ 36,815,910 Other Operating Cash Receipts 872,146 Cash Payments to Suppliers of Goods and Services (22,772,511) Cash Payments to Employees for Services (10,133,542) Net Cash Provided (Used) By Operating Activities 4,782,003
CASH FLOWS FROM NONCAPITAL FINANCING ACTIVITIES: Intergovernmental Receipts 35,658 Net Cash Provided (Used) By Noncapital Financing Activities 35,658
CASH FLOWS FROM CAPITAL AND RELATED FINANCING ACTIVITIES: Acquisition and Construction of Capital Assets (1,025,502) Proceeds from Sale of Salvage 28,689 Net Cash Provided (Used) By Capital and Related Financing Activities (996,813)
CASH FLOWS FROM INVESTING ACTIVITIES: Interest and Dividends Received 193,754
Net Increase (Decrease) in Cash and Investments 4,014,602
Cash and Investments, July 1 8,374,547
Cash and Investments, June 30 12,389,149
RECONCILIATION OF OPERATING INCOME (LOSS) TO NET CASH PROVIDED BY OPERATING ACTIVITIES: Operating Income (Loss) 3,000,609 Adjustments to Reconcile Operating Income to Net Cash Provided By Operating Activities: Depreciation 1,737,130 Net changes in assets and liabilities: Accounts Receivable (345,544) Deferred Outflow of Resources (635,331) Vouchers and Accounts Payable 115,839 Deferred Inflow of Resources 402,084 Accrued Compensated Leave 18,874 Net Pension Liability 925,909 Net OPEB Liability (437,567)
Net Cash Provided (Used) By Operating Activities $ 4,782,003
216

Exhibit 31CITY OF VIRGINIA BEACH, VIRGINIA
WASTE MANAGEMENT ENTERPRISE FUNDSCHEDULE OF OPERATING EXPENSES - BUDGET AND ACTUAL
FOR THE YEAR ENDED JUNE 30, 2020
VariancePositive
Budget Actual (Negative)Program Support Personal Services $ 698,107 $ 667,320 $ 30,787 Fringe Benefits 261,276 233,289 27,987 Contractual Services 611,250 10,377 600,873 Internal Services 90,041 87,854 2,187 Other Charges 49,984 30,796 19,188 Total Program Support 1,710,658 1,029,636 681,022 Bureau of Waste Disposal Personal Services 703,946 826,903 (122,957) Fringe Benefits 193,246 204,390 (11,144) Contractual Services 9,032,368 8,938,320 94,048 Internal Services 540,064 499,813 40,251 Other Charges 247,735 163,285 84,450 Total Bureau of Waste Disposal 10,717,359 10,632,711 84,648 Bureau of Waste Collections Personal Services 5,640,611 5,590,431 50,180 Fringe Benefits 2,102,320 1,960,222 142,098 Contractual Services 165,342 113,026 52,316 Internal Services 4,981,063 4,784,214 196,849 Other Charges 293,592 238,804 54,788 Total Bureau of Waste Collections 13,182,928 12,686,697 496,231 Yard Debris & Hazardous Household Waste Personal Services 256,388 258,878 (2,490) Fringe Benefits 77,506 84,323 (6,817) Contractual Services 1,482,015 1,129,616 352,399 Internal Services 130,410 126,660 3,750 Other Charges 34,600 17,675 16,925 Total Yard Debris & Hazardous Household Waste 1,980,919 1,617,152 363,767 Recycling Personal Services 141,560 142,831 (1,271) Fringe Benefits 52,546 52,993 (447) Contractual Services 4,333,385 4,205,492 127,893 Internal Services 3,445 2,382 1,063 Other Charges 41,015 29,402 11,613 Total Recycling 4,571,951 4,433,100 138,851 General Fund Charges Direct Costs Allocation 1,503,496 1,503,496 - Landfill 235,365 235,365 - Total General Fund Charges 1,738,861 1,738,861 - Other Charges Retiree Health Insurance 173,929 130,838 43,091 Water and Sewer Billing System Charges 772,378 772,378 - Net Deferred Retirement Contributions - 278,850 (278,850) Net Deferred OPEB Contributions - (24,364) 24,364 Total Other Charges 946,307 1,157,702 (211,395)
Total Budgeted Operating Expenses $ 34,848,983 $ 33,295,859 $ 1,553,124
Note: Total General Fund Charges reclassified as Other Charges. Depreciation is not included in the Budgeted Operating Expenses, as the City does not budget for depreciation.
217

This Page Intentionally Left Blank
218

DEVELOPMENT AUTHORITY
ENTERPRISE FUND


DEVELOPMENT AUTHORITY ENTERPRISE FUND
The Development Authority Enterprise Fund (Authority) was established for the specific purpose of attracting new industriesand the expansion of existing industries. The Authority’s Commissioners are appointed by the City Council. The Authority isauthorized to issue industrial development bonds after approval by the City Council and to purchase land to improve and sellfor development. In addition, the Authority facilitates economic development projects as approved by City Council. TheDevelopment Authority is presented as a blended component unit and is included in the City’s reporting entity. The City hasresponsibility through support agreements for debt payments on outstanding Public Facility Revenue Bonds which arerecorded on the Authority’s financial records.
219

Exhibit 32CITY OF VIRGINIA BEACH, VIRGINIA
DEVELOPMENT AUTHORITY ENTERPRISE FUNDSTATEMENT OF NET POSITION
JUNE 30, 2020
ASSETS Current Assets: Cash and Investments $ 9,533,603 Accounts Receivable - Net 3,067,214 Total Current Assets 12,600,817
Non-current Assets: Cash and Investments - Restricted 8,744,243 Due From Other Funds 5,917,522 Land Held for Resale 43,960,824 Capital Assets: Land 24,065,308 Buildings 145,408,109 Construction in Progress 380,478 Machinery and Equipment 1,661,825
Less: Accumulated Depreciation (43,838,082)Total Capital Assets 127,677,638
Total Non-current Assets 186,300,227 Total Assets 198,901,044
DEFERRED OUTFLOWS OF RESOURCESDebt Refundings Resulting in Loss Transactions 930,869
LIABILITIES Current Liabilities: Vouchers and Accounts Payable 13,934,376 Accrued Interest Payable 537,684 Current Portion of Long-term Liabilities 7,373,672 Total Current Liabilities 21,845,732
Long-Term Liabilities: Public Facility Revenue Bonds 42,994,118 Premium on Revenue Bonds 2,636,456
Total Long-Term Liabilities 45,630,574 Total Liabilities 67,476,306
DEFERRED INFLOWS OF RESOURCESDebt Refundings Resulting in Gain Transactions 767,718
NET POSITIONNet Investment in Capital Assets 74,836,543 Restricted for Debt Service 4,384,390 Unrestricted 52,366,956
Total Net Position $ 131,587,889
220

Exhibit 33CITY OF VIRGINIA BEACH, VIRGINIA
DEVELOPMENT AUTHORITY ENTERPRISE FUND STATEMENT OF REVENUES, EXPENSES, AND CHANGES IN NET POSITION
FOR THE YEAR ENDED JUNE 30, 2020
OPERATING REVENUES Charges for Services $ 2,097,780 Miscellaneous 249,094 Total Operating Revenues 2,346,874
OPERATING EXPENSES Contractual Services 6,025,629 Depreciation 3,853,177 Total Operating Expenses 9,878,806
OPERATING INCOME (LOSS) (7,531,932)
NONOPERATING REVENUES (EXPENSES) Interest Income 37,112 Payment Under Support Agreement 13,993,536 Interest and Fiscal Charges (1,969,931) Total Nonoperating Revenues 12,060,717
CHANGE IN NET POSITION 4,528,785
TOTAL NET POSITION - BEGINNING 127,059,104
TOTAL NET POSITION - ENDING $ 131,587,889
221

Exhibit 34CITY OF VIRGINIA BEACH, VIRGINIA
DEVELOPMENT AUTHORITY ENTERPRISE FUNDSTATEMENT OF CASH FLOWS
FOR THE YEAR ENDED JUNE 30, 2020
CASH FLOWS FROM OPERATING ACTIVITIES: Receipts from Customers and Users $ 2,342,751 Payments for Interfund Services Provided 2,274,931 Other Operating Cash Receipts (Disbursements) (209,116) Cash Payments to Suppliers of Goods and Services (6,513,049) Net Cash Provided (Used) By Operating Activities (2,104,483)
CASH FLOWS FROM CAPITAL AND RELATED FINANCING ACTIVITIES: Capital Contributions 16,708,006 Interest Paid on Long-term Debt (2,468,114) Principal Paid on Capital Debt (7,449,119) Net Cash Provided (Used) By Capital and Related Financing Activities 6,790,773
CASH FLOWS FROM INVESTING ACTIVITIES: Interest and Dividends Received 37,112
Net Increase (Decrease) in Cash and Investments 4,723,402
Cash and Investments, July 1 13,554,444
Cash and Investments, June 30 18,277,846
RECONCILIATION OF OPERATING INCOME (LOSS) TO NET CASH PROVIDED BY OPERATING ACTIVITIES: Operating Income (Loss) (7,531,932) Adjustments to Reconcile Operating Loss to Net Cash Provided By Operating Activities: Depreciation 3,853,177 Amortization 95,852 Net changes in assets and liabilities: Intergovernmental Receivables 5,286,764 Land Inventory 87,766 Vouchers and Accounts Payable (3,896,110) Net Cash Provided (Used) By Operating Activities (2,104,483)
222

INTERNAL SERVICE FUNDS


INTERNAL SERVICE FUNDS
The Internal Service Funds are used to account for the financing of goods and services provided by one department or agencyto other departments or agencies of the governmental unit, or to other governmental units, on a cost reimbursement basis. TheCity has established Internal Service Funds for the following activities:
City Garage - provides vehicle repairs, parts, fuel and related services to City departments.
Risk Management - provides insurance, claims handling, risk identification, and consulting services to City departments.
School Site Landscaping - provides for landscaping services for City and Schools.
Telecommunications – provides maintenance, support, contract administration, cable management, billing, dial toneprovision, service coordination, moves, adds, and changes for the City’s telephone system.
Subscriptions – provides for the collection and support of specific service agreements between customer departments and the Information Technology department. These agreements relate to specialized applications, services, and/or hardwareassociated with customer departments, not enterprise needs.
223

CITY OF VIRGINIA BEACH, VIRGINIAINTERNAL SERVICE FUNDS
COMBINING STATEMENT OF NET POSITIONJUNE 30, 2020
City Garage Risk Management
ASSETSCurrent Assets:
Cash and Investments $ 4,951,900 $ 34,482,002Accounts Receivable - -Inventory 2,371,765 -
Total Current Assets 7,323,665 34,482,002
Noncurrent Assets:Capital Assets:
Site Improvements 265,782 -Machinery and Equipment 3,749,982 -Less: Accumulated Depreciation (2,943,077) -
Net Property, Plant and Equipment 1,072,687 -
Total Assets 8,396,352 34,482,002
DEFERRED OUTFLOWS OF RESOURCESDeferred Outflows for Pensions 1,112,151 102,032Deferred Outflows for OPEB 188,546 16,294
Total Deferred Outflows of Resources 1,300,697 118,326
LIABILITIESCurrent Liabilities:
Vouchers and Accounts Payable 555,569 442,484Current Portion of Long-term Liabilities 327,304 9,875,181
Total Current Liabilities 882,873 10,317,665
Noncurrent Liabilities:Compensated Absences 206,482 -Claims and Contingencies - 34,735,047Net Pension Liability 4,552,845 417,692Net OPEB Liability 463,854 40,831
Total Noncurrent Liabilities 5,223,181 35,193,570
Total Liabilities 6,106,054 45,511,235
DEFERRED INFLOWS OF RESOURCESDeferred Inflows for Pensions 157,568 14,456Deferred Inflows for OPEB 255,085 22,045
Total Deferred Inflows of Resources 412,653 36,501
NET POSITIONNet Investment in Capital Assets 1,072,688 -Unrestricted (deficit) 2,105,654 (10,947,408)
Total Net Position $ 3,178,342 $ (10,947,408)
224

Exhibit 35CITY OF VIRGINIA BEACH, VIRGINIA
INTERNAL SERVICE FUNDSCOMBINING STATEMENT OF NET POSITION
JUNE 30, 2020
School SiteLandscaping Telecommunications Subscriptions Totals
$ 1,976,538 $ 4,837,166 $ 5,325,332 $ 51,572,938- 31 - 31- - - 2,371,765
1,976,538 4,837,197 5,325,332 53,944,734
- - - 265,7822,979,426 - 717,311 7,446,719
(2,483,904) - (708,039) (6,135,020)495,522 - 9,272 1,577,481
2,472,060 4,837,197 5,334,604 55,522,215
499,958 193,862 - 1,908,003158,284 23,277 - 386,401658,242 217,139 - 2,294,404
49,707 7,050 419,408 1,474,21872,969 63,871 - 10,339,325
122,676 70,921 419,408 11,813,543
14,841 39,483 - 260,806- - - 34,735,047
2,046,692 793,615 - 7,810,844396,643 58,329 - 959,657
2,458,176 891,427 - 43,766,354
2,580,852 962,348 419,408 55,579,897
70,833 27,466 - 270,323214,145 31,493 - 522,768284,978 58,959 - 793,091
495,522 - 9,272 1,577,482(231,050) 4,033,029 4,905,924 (133,851)
$ 264,472 $ 4,033,029 $ 4,915,196 $ 1,443,631
225

CITY OF VIRGINIA BEACH, VIRGINIAINTERNAL SERVICE FUNDS
COMBINING STATEMENT OF REVENUES, EXPENSES AND CHANGES IN NET POSITIONFOR THE YEAR ENDED JUNE 30, 2020
City Garage Risk Management
OPERATING REVENUESBillings to Departments $ 18,537,340 $ 18,381,253Insurance Recovery 95,124 822,608
Total Operating Revenues 18,632,464 19,203,861
OPERATING EXPENSESCost of Goods Sold 9,664,945 -Personal Services 6,284,010 459,934Contractual Services 527,206 756,064Internal Services 365,884 10,807Other Charges 634,289 16,698,795Depreciation 286,553 -
Total Operating Expenses 17,762,887 17,925,600
OPERATING INCOME (LOSS) 869,577 1,278,261
NONOPERATING REVENUES (EXPENSES) AND TRANFERSInterest Income 226,928 875,982Gain (Loss) on Disposition of Assets 72,489 -Transfers Out - (350,000)
Total Nonoperating Revenues (Expenses) 299,417 525,982
CHANGE IN NET POSITION 1,168,994 1,804,243
TOTAL NET POSITION - BEGINNING 2,009,348 (12,751,651)
TOTAL NET POSITION - ENDING $ 3,178,342 $ (10,947,408)
226

Exhibit 36CITY OF VIRGINIA BEACH, VIRGINIA
INTERNAL SERVICE FUNDSCOMBINING STATEMENT OF REVENUES, EXPENSES AND CHANGES IN NET POSITION
FOR THE YEAR ENDED JUNE 30, 2020
School SiteLandscaping Telecommunications Subscriptions Totals
$ 4,571,314 $ 3,089,625 $ 2,837,079 $ 47,416,611- - - 917,732
4,571,314 3,089,625 2,837,079 48,334,343
- - - 9,664,9452,990,795 1,156,850 - 10,891,589
450,950 780,750 1,730,827 4,245,797532,509 32,702 - 941,902296,833 677,864 810,095 19,117,876156,919 - 66,211 509,683
4,428,006 2,648,166 2,607,133 45,371,792
143,308 441,459 229,946 2,962,551
43,890 97,698 116,228 1,360,72627,249 - - 99,738
- (100,000) - (450,000)71,139 (2,302) 116,228 1,010,464
214,447 439,157 346,174 3,973,015
50,025 3,593,872 4,569,022 (2,529,384)
$ 264,472 $ 4,033,029 $ 4,915,196 $ 1,443,631
227

CITY OF VIRGINIA BEACH, VIRGINIAINTERNAL SERVICE FUNDS
COMBINING STATEMENT OF CASH FLOWSFOR THE YEAR ENDED JUNE 30, 2020
City Garage Risk ManagementCASH FLOWS FROM OPERATING ACTIVITIES Receipts from Customers and Users $ 18,633,534 $ 19,203,861 Cash Payments to Suppliers of Goods and Services (12,210,495) (17,950,291) Cash Payments to Employees for Services (6,067,624) 2,691,373 Net Cash Provided (Used) By Operating Activities 355,415 3,944,943
CASH FLOWS FROM NONCAPITAL FINANCING ACTIVITIES Receipts from Other Funds - (350,000)
CASH FLOWS FROM CAPITAL AND RELATEDFINANCING ACTIVITIES Acquisition and Construction of Capital Assets (617,419) - Proceeds from Sale of Salvage 72,489 - Net Cash Provided (Used) By Capital and Related Financing Activities (544,930) -
CASH FLOWS FROM INVESTING ACTIVITIES Interest and Dividends Received 226,928 875,982
Net Increase (Decrease) in Cash and Temporary Investments 37,413 4,470,925
Cash and Temporary Investments, July 1 4,914,487 30,011,077
Cash and Temporary Investments, June 30 4,951,900 34,482,002
RECONCILIATION OF OPERATING INCOME (LOSS) TONET CASH PROVIDED (USED) BY OPERATING ACTIVITIES: Operating Income 869,577 1,278,261 Adjustments to Reconcile Operating Income to Net Cash Provided By Operating Activities: Depreciation Expense 286,553 - Net Changes in assets and liabilities: Accounts Receivable 1,070 - Inventory (580,355) - Deferred Outflow of Resources (521,409) (47,584) Vouchers and Accounts Payable (437,816) (484,625) Net Pension Liability 764,576 70,144 Net OPEB Liability (225,751) (19,509) Deferred Inflow of Resources 198,970 17,034 Estimated Claims and Judgments - 3,145,557 Accrued Compensated Leave - (14,335) Net Cash Provided (Used) By Operating Activities $ 355,415 $ 3,944,943
228

Exhibit 37CITY OF VIRGINIA BEACH, VIRGINIA
INTERNAL SERVICE FUNDSCOMBINING STATEMENT OF CASH FLOWS
FOR THE YEAR ENDED JUNE 30, 2020
School SiteLandscaping Telecommunications Subscriptions Totals
$ 4,571,314 $ 3,089,615 $ 2,837,079 $ 48,335,403 (1,626,681) (1,499,960) (2,253,191) (35,540,618)(2,893,520) (1,125,054) - (7,394,825)
51,113 464,601 583,888 5,399,960
- (100,000) - (450,000)
(186,301) - - (803,720) 27,249 - - 99,738
(159,052) - - (703,982)
43,890 97,698 116,228 1,360,726
(64,049) 462,299 700,116 5,606,704
2,040,587 4,374,867 4,625,216 45,966,234
1,976,538 4,837,166 5,325,332 51,572,938
143,308 441,459 229,946 2,962,551
156,919 - 66,211 509,683
- (10) - 1,060 - - - (580,355)
(236,927) (90,043) - (895,963)(346,389) (8,644) 287,731 (989,743) 343,709 133,275 - 1,311,704 (189,520) (27,870) - (462,650) 175,924 23,311 - 415,239
- - - 3,145,557 4,089 (6,877) - (17,123)
$ 51,113 $ 464,601 $ 583,888 $ 5,399,960
229

This Page Intentionally Left Blank
230

TRUST AND AGENCY FUNDS


TRUST FUNDS and AGENCY FUNDS
Trust Funds and Agency Funds are used to account for the assets held by a governmental unit as an agent for individuals,private organizations, other governmental units, and/or other funds. Agency Funds do not involve the measurement of resultsof operations, as they are custodial in nature (assets = liabilities).
The City has the following Trust Funds:
Other Postemployment Benefits – established by the City in accordance with Article 8, Chapter 15, Subtitle II of Title 15.2,of the Virginia Code, for the purpose of accumulating and investing assets to fund OPEB obligations.
Sheriff’s Office Pension – accounts for the plan assets of the defined contribution pension plan established by the Sheriff’sOffice and approved by Council.
The City has the following Agency Funds:
Escheat Property – funds held on behalf of others payable to the Commonwealth of Virginia.
Special Welfare - is established under the authority of Section 63.1-51, Code of Virginia, as amended. This fund accountsfor Social Security or Veteran's Administration benefits for specific individuals for which the City is acting as the custodian. It also accounts for donations and the provision for emergency assistance to indigent citizens.
231

Exhibit 38CITY OF VIRGINIA BEACH, VIRGINIA
AGENCY FUNDSCOMBINING STATEMENT OF FIDUCIARY ASSETS AND LIABILITIES
JUNE 30, 2020
Escheat Property Special Welfare Total
ASSETSCash and Investments $ 71,391 $ 189,804 $ 261,195
- - -
LIABILTIESVouchers and Accounts Payable $ 71,391 $ 189,804 $ 261,195
232

Exhibit 39CITY OF VIRGINIA BEACH, VIRGINIA
AGENCY FUNDSCOMBINING STATEMENT OF CHANGES IN ASSETS AND LIABILITIES
FOR THE YEAR ENDED JUNE 30, 2020
Balance BalanceJuly 1, 2019 Additions Deductions June 30, 2020
SPECIAL WELFAREASSETS
Cash and Investments $ 176,775 $ 355,339 $ 342,310 $ 189,804
LIABILITIESVouchers and Accounts Payable 176,775 355,409 342,380 189,804
ESCHEAT PROPERTYASSETS
Cash and Investments 290,504 1,643,707 1,862,820 71,391
LIABILITIESVouchers and Accounts Payable 290,504 1,879,765 2,098,878 71,391
TOTALS-ALL AGENCY FUNDSASSETS
Cash and Investments 467,279 1,999,046 2,205,130 261,195
LIABILITIESVouchers and Accounts Payable $ 467,279 $ 2,235,174 $ 2,441,258 $ 261,195
233

Exhibit 40CITY OF VIRGINIA BEACH, VIRGINIA
TRUST FUNDSCOMBINING STATEMENT OF FIDUCIARY NET POSITION
JUNE 30, 2020
OtherPostemployment
Benefits
Sheriff's OfficePension
Trust Fund Total
ASSETSInvestments, at Fair Value:
Fixed Income $ 9,546,667 $ - $ 9,546,667Stocks 26,821,950 - 26,821,950Real Estate 3,182,222 - 3,182,222Alternative Investments 5,909,842 - 5,909,842
Total Assets 45,460,681 - 45,460,681
NET POSITIONNet Restricted for OPEB 45,460,681 - 45,460,681
234

Exhibit 41CITY OF VIRGINIA BEACH, VIRGINIA
COMBINING STATEMENT OF CHANGES IN FIDUCIARY NET POSITIONRETIREMENT TRUST FUNDS
FOR THE YEAR ENDED JUNE 30, 2020
OtherPostemployment
Benefits Sheriffs Office Total
AdditionsContributions From Primary Government $ 7,013,877 $ - $ 7,013,877Increase (Decrease) in Fair Value 1,350,150 - 1,350,150
Total Additions 8,364,027 - 8,364,027
DeductionsBenefits 7,013,877 3,515,834 10,529,711Administrative Expenses 37,255 - 37,255
Total Deductions 7,051,132 3,515,834 10,566,966
Net Increase in Net Position 1,312,895 ( 3,515,834) ( 2,202,939)
Total Net Position - beginning 44,147,786 3,515,834 47,663,620
Total Net Position - ending $ 45,460,681 $ - $ 45,460,681
235

This Page Intentionally Left Blank
236

DISCRETELY PRESENTED
SCHOOL BOARD
COMPONENT UNIT


237

Exhibit 42CITY OF VIRGINIA BEACH, VIRGINIA
DISCRETELY PRESENTED SCHOOL BOARD COMPONENT UNITSTATEMENT OF NET POSITION
JUNE 30, 2020
GovernmentalActivities
ASSETS Current Assets:
Cash and Temporary Investments $ 245,659,477 Accounts Receivable 2,801,998 Due from Commonwealth 12,109,361 Due from Federal Government 11,110,574 Inventories 788,610 Prepaid Items 920,571
Total Current Assets 273,390,591 Noncurrent Assets:
Capital Assets:Land 38,968,372 Buildings, Improvements, Equipment and Vehicles (net of accumulated depreciation) 421,010,897 Construction in Progress 91,935,123
Total Noncurrent Assets 551,914,392 Total Assets 825,304,983
DEFERRED OUTFLOWS OF RESOURCES Deferred Outflows from Pensions 141,173,000 Deferred Outflows from OPEB 33,208,000
Total Deferred Outflows of Resources 174,381,000 LIABILITIES
Current Liabilities:Salaries Payable 62,542,911 Vouchers and Accounts Payable 24,916,264 Deposits Payable 75,000 Due to Commonwealth 6,840 Due to Federal Government 87,914 Unearned Revenue 10,937,355 Long-term Liabilities (due within one year) 19,636,952
Total Current Liabilities 118,203,236 Noncurrent Liabilities:
Net Pension Liability 678,825,000 Net OPEB Liability 152,746,000 Long-term Liabilities (due in more than one year) 35,394,611
Total Liabilities 985,168,847 DEFERRED INFLOWS OF RESOURCES
Deferred Inflows from Pensions 74,887,000 Deferred Inflows from OPEB 25,094,000
Total Deferred Inflows of Resources 99,981,000
NET POSITIONInvestment in Capital Assets 551,914,392 Restricted for:
Capital Projects 32,377,544 Grants 2,352,340 Cafeterias 9,787,357 Textbooks 7,873,370
Unrestricted (689,768,867)Total Net Position $ (85,463,864)
238

Exhibit 43CITY OF VIRGINIA BEACH, VIRGINIA
DISCRETELY PRESENTED SCHOOL BOARD COMPONENT UNITSTATEMENT OF ACTIVITIES
FOR THE YEAR ENDED JUNE 30, 2020
Program Revenues Net (Expenses)Operating Capital Revenues and
Charges for Grants and Grants and Change InExpenses Services Contributions Contributions Net Position
GOVERNMENTAL ACTIVITIES
Instruction $ 703,745,203 $ 1,540,097 $ 147,853,737 $ - $ (554,351,369)Admin, Attendance, & Health 24,107,377 - - - (24,107,377)Pupil Transportation 36,973,229 634,957 - - (36,338,272)Operations and Maintenance 92,626,699 281,549 262 - (92,344,888)Cafeterias 29,492,968 7,371,901 18,857,507 - (3,263,560)Technology 47,543,325 1,593,780 6,820,817 - (39,128,728)
Total Governmental Activities $ 934,488,801 $ 11,422,284 $ 173,532,323 $ - $ (749,534,194)
General Revenues:Local Sources:
Local Government $ 528,069,094 Miscellaneous 828,322 Sale of Capital Assets 177,665
Federal and State Aid not Restricted to Specific Purposes:State Basic Aid 176,893,073 State Sales Tax 79,610,836 Federal Impact Aid 13,724,963
Interest Earnings 1,467,641 Total General Revenues 800,771,594
Change in Net Position 51,237,400 Total Net Position - July 1 (136,701,264)Total Net Position - June 30 $ (85,463,864)
239

Exhibit 44CITY OF VIRGINIA BEACH, VIRGINIA
DISCRETELY PRESENTED SCHOOL BOARD COMPONENT UNITBALANCE SHEET
GOVERNMENTAL FUNDSJUNE 30, 2020
Other TotalSchool School School Capital Governmental Governmental
Operating Grants Cafeterias Projects Funds Funds
ASSETSCash and Investments $ 63,129,056 $ - $ 11,497,968 $ 55,042,484 $ 12,281,240 $ 141,950,748 Accounts Receivable 232,921 154,243 5,880 - - 393,044 Due from Other Funds 3,224,906 - - - - 3,224,906 Due from Commonwealth 10,854,007 1,255,354 - - - 12,109,361 Due from Federal Government 79,270 9,982,279 1,049,025 - - 11,110,574 Inventories - - 788,610 - - 788,610 Prepaid Items 614,133 - 806 - - 614,939
Total Assets 78,134,293 11,391,876 13,342,289 55,042,484 12,281,240 170,192,182
LIABILITIESSalaries Payable 58,008,333 3,270,740 1,227,279 36,283 - 62,542,635 Vouchers and Accounts Payable 4,800,010 752,484 783,259 14,208,582 87,648 20,631,983 Deposits Payable - - - - 75,000 75,000 Due to Other Funds - 3,224,906 - - - 3,224,906 Due to City of Virginia Beach - - - - - - Due to Commonwealth - 6,840 - - - 6,840 Due to Federal Government - - - 87,914 - 87,914 Unearned Revenue 215,490 1,784,566 754,978 - - 2,755,034
Total Liabilities 63,023,833 9,039,536 2,765,516 14,332,779 162,648 89,324,312
FUND BALANCESNonspendable 614,133 - 789,416 - - 1,403,549 Restricted - 2,352,340 9,787,357 32,377,544 7,873,370 52,390,611 Committed - - - 8,332,161 4,245,222 12,577,383 Assigned 14,496,327 - - - - 14,496,327 Unassigned - - - - - -
Total Fund Balances 15,110,460 2,352,340 10,576,773 40,709,705 12,118,592 80,867,870 Total Liabilities and Fund Balances $ 78,134,293 $ 11,391,876 $ 13,342,289 $ 55,042,484 $ 12,281,240 $ 170,192,182
240

CITY OF VIRGINIA BEACH, VIRGINIADISCRETELY PRESENTED SCHOOL BOARD COMPONENT UNIT
RECONCILIATION OF THE BALANCE SHEET TO THE STATEMENT OF NET POSITION
JUNE 30, 2020
Amounts reported for governmental activities in the Statement of Net Position (Exhibit 44)are different from amounts reported for governmental funds in this exhibit because:
Total Fund Balances - Governmental Funds (this exhibit) $ 80,867,870
Capital assets used in governmental activities are not financial resources and, therefore,are not reported in the governmental funds.
Cost of Capital Assets 1,015,245,495 Less: Accumulated Depreciation (463,331,103) 551,914,392
Long-term liabilities are not due and payable in the current period and, therefore, are notreported as liabilities in the governmental funds. Long-term liabilities at year end consistof the following:
Compensated Absences (38,968,412)
Internal Service Funds are used to account for the risk management and health insuranceprograms; and related charges to the various governmental funds. The assets andliabilities of the internal service funds are included in governmental activities in theStatement of Net Position.
Total Assets 106,423,315 Less: Total Liabilities (28,530,029)
Total Net Position 77,893,286
Governmental Accounting Standards Board Statement Number 68 on Accounting andFinancial Reporting for Pensions was implemented in Fiscal Year 2015. Pensions are notreported in the governmental funds.
Net Pension Liability (678,825,000)Deferred Outflows of Resources 141,173,000 Deferred Inflows of Resources (74,887,000) (612,539,000)
Governmental Accounting Standards Board Statement Number 75 on Accounting andFinancial Reporting for OPEB was implemented in Fiscal Year 2018. OPEB is notreported in the governmental funds.
Net OPEB Liability (152,746,000)Deferred Outflows of Resources 33,208,000 Deferred Inflows of Resources (25,094,000) (144,632,000)
Total Net Position - Governmental Activities (Exhibit 44) $ (85,463,864)
241

Exhibit 45CITY OF VIRGINIA BEACH, VIRGINIA
DISCRETELY PRESENTED SCHOOL BOARD COMPONENT UNITSTATEMENT OF REVENUES, EXPENDITURES, AND CHANGES IN FUND BALANCES
GOVERNMENTAL FUNDSFOR THE YEAR ENDED JUNE 30, 2020
Other TotalSchool School School Capital Governmental Governmental
Operating Grants Cafeterias Projects Funds Funds
REVENUES From Use of Money and Property $ 281,549 $ - $ 324,311 $ 434,540 $ 869,009 $ 1,909,409 Charges for Services 1,081,961 - 6,890,554 - 129,432 8,101,947 Miscellaneous 3,174,023 376,845 513,017 - 19,852 4,083,737 From Local Government 383,837,199 - - 144,231,895 - 528,069,094 From Commonwealth 364,713,404 9,261,215 729,167 - 3,999,558 378,703,344 From Federal Government 16,671,591 29,881,074 18,128,340 - - 64,681,005 Total Revenues 769,759,727 39,519,134 26,585,389 144,666,435 5,017,851 985,548,536
EXPENDITURES Current: Instruction 573,394,750 39,661,604 - 601,333 1,180,460 614,838,147 Admin, Attendance, & Health 24,526,915 - - - - 24,526,915 Pupil Transportation 37,039,105 - - - - 37,039,105 Operations and Maintenance 87,816,421 - - 5,020,997 - 92,837,418 Cafeterias - - 29,191,803 - - 29,191,803 Technology 39,854,686 3,199,952 431,420 152,101 2,667,868 46,306,027 Capital Outlay - - - 66,178,539 - 66,178,539 Total Expenditures 762,631,877 42,861,556 29,623,223 71,952,970 3,848,328 910,917,954
EXCESS (DEFICIENCY) OF REVENUESOVER (UNDER) EXPENDITURES 7,127,850 (3,342,422) (3,037,834) 72,713,465 1,169,523 74,630,582
OTHER FINANCING SOURCES (USES) Transfers In - 4,001,247 - - - 4,001,247 Transfers Out (4,001,247) - - - - (4,001,247) Sale of Capital Assets 177,665 - - - - 177,665 Total Other Financing Sources (Uses) (3,823,582) 4,001,247 - - - 177,665
NET CHANGES IN FUND BALANCES 3,304,268 658,825 (3,037,834) 72,713,465 1,169,523 74,808,247
FUND BALANCES - JULY 1 11,806,192 1,693,515 13,614,607 (32,003,760) 10,949,069 6,059,623
FUND BALANCES - JUNE 30 $ 15,110,460 $ 2,352,340 $ 10,576,773 $ 40,709,705 $ 12,118,592 $ 80,867,870
242

CITY OF VIRGINIA BEACH, VIRGINIADISCRETELY PRESENTED SCHOOL BOARD COMPONENT UNIT
RECONCILIATION OF THE STATEMENT OF REVENUES,EXPENDITURES AND CHANGES IN FUND BALANCES OF GOVERNMENTAL FUNDS
TO THE STATEMENT OF ACTIVITIESFOR THE YEAR ENDED JUNE 30, 2020
Amounts reported for governmental activities in the Statement of Activities (Exhibit 45)are different from amounts reported for governmental funds in this exhibit because:
Net Change in Fund Balances - Governmental Funds (this exhibit) $ 74,808,247
Capital outlays to purchase or build capital assets are reported in governmental funds asexpenditures. However, for governmental activities those costs are shown in the Statementof Net Position and allocated over their estimated useful lives as annual depreciationexpenses in the Statement of Activities. This is the amount by which capital outlayexceeded depreciation expense (including other transactions (e.g., loss on disposals)) for thefiscal year. 50,125,858
Compensated absences (annual, sick, and personal leave) are reported in governmentalfunds as expenditures, which are measured by the amount of financial resources used(essentially, the amounts actually paid). However, for governmental activities those costsare shown and measured by the net of the amounts of leave used and earned for the fiscalyear in the Statement of Activities.
Leave Used 7,440,773 Leave Earned (12,158,735) (4,717,962)
Internal Service Funds are used to account for the risk management and health insuranceprograms, and related charges to the various governmental funds. The change in netposition for the Internal Service Funds for the fiscal year is reported with governmentalactivities in the Statement of Activities.
Risk Management 404,217 Health Insurance 24,105,341 24,509,558
Section 15.2-1800.1 of the Code of Virginia, as amended, affects the reporting of localSchool Board capital assets and related debt for financial reporting purposes. Under thislegislation, the City has a "tenancy in common" with the School Board whenever the Cityincurs "on-behalf" of debt for any school property owned by the School Board which ispayable over more than one year. For financial reporting purposes, the City will report theNet Book Value of School Board property (the School Board incurs the depreciationexpense) equal to the total outstanding principal balance of the applicable "on-behalf" ofdebt at June 30, 2019. This amount is the applicable Net Book Value change anddepreciation expense for the fiscal year. (91,668,301)
Governmental Accounting Standards Board Statement Number 68 on Accounting andFinancial Reporting for Pensions was implemented in Fiscal Year 2015. This amount is thePension Expense and Deferred Outflow (pension contributions paid) for the fiscal year.
Pension Expense (69,624,000)Deferred Inflow 1,117,000 Deferred Outflow 65,952,000 (2,555,000)
Governmental Accounting Standards Board Statement Number 75 on Accounting andFinancial Reporting for OPEB was implemented in Fiscal Year 2018. This amount is theOPEB Expense and Deferred Outflow (OPEB contributions paid) for the fiscal year.
OPEB Expense 15,920,000 Deferred Inflow (19,640,000)Deferred Outflow 4,455,000 735,000
Change in Net Position of governmental activities in the Statement of Activities (Exhibit45) $ 51,237,400
243

Exhibit 46CITY OF VIRGINIA BEACH, VIRGINIA
DISCRETELY PRESENTED SCHOOL BOARD COMPONENT UNITCOMBINING BALANCE SHEET
NONMAJOR GOVERNMENTAL FUNDS - SPECIAL REVENUE FUNDSFOR THE YEAR ENDED JUNE 30, 2020
SchoolCommunication School School
School Towers/ Vending EquipmentTextbooks Technology Operations Replacement Totals
ASSETSCash and Investments $ 7,873,370 $ 3,201,516 $ 61,772 $ 1,144,582 $ 12,281,240 Accounts Receivable - - - - - Prepaid Items - - - - -
Total Assets 7,873,370 3,201,516 61,772 1,144,582 12,281,240
LIABILITIES AND FUND BALANCESLiabilities:
Vouchers and Accounts Payable - 87,648 - - 87,648 Deposits Payable - 75,000 - - 75,000
Total Liabilities - 162,648 - - 162,648
Fund Balances:Nonspendable - - - - - Restricted 7,873,370 - - - 7,873,370 Committed - 3,038,868 61,772 1,144,582 4,245,222
Total Fund Balances 7,873,370
--
3,038,868
--
61,772
--
1,144,582
--
12,118,592 Total Liabilities and Fund Balances $ 7,873,370 $ 3,201,516 $ 61,772 $ 1,144,582 $ 12,281,240
244

Exhibit 47CITY OF VIRGINIA BEACH, VIRGINIA
DISCRETELY PRESENTED SCHOOL BOARD COMPONENT UNITCOMBINING STATEMENT OF REVENUES, EXPENDITURES, AND CHANGES IN FUND BALANCES
NONMAJOR GOVERNMENTAL FUNDS - SPECIAL REVENUE FUNDSFOR THE YEAR ENDED JUNE 30, 2020
SchoolCommunication School School
School Towers/ Vending EquipmentTextbooks Technology Operations Replacement Totals
REVENUESFrom Use of Money and Property $ 144,464 $ 698,576 $ 783 $ 25,186 $ 869,009 Charges for Services 52 - 129,380 - 129,432 Miscellaneous 19,852 - - - 19,852 From Commonwealth 3,999,558 - - - 3,999,558
Total Revenues 4,163,926 698,576 130,163 25,186 5,017,851
EXPENDITURESInstruction 1,030,660 - 149,800 - 1,180,460 Technology 2,289,503 378,365 - - 2,667,868
Total Expenditures 3,320,163 378,365 149,800 - 3,848,328
EXCESS (DEFICIENCY) OF REVENUESOVER (UNDER) EXPENDITURES 843,763 320,211 (19,637) 25,186 1,169,523
NET CHANGE IN FUND BALANCES 843,763 320,211 (19,637) 25,186 1,169,523
FUND BALANCES - JULY 1 7,029,607 2,718,657 81,409 1,119,396 10,949,069
FUND BALANCES - JUNE 30 $ 7,873,370 $ 3,038,868 $ 61,772 $ 1,144,582 $ 12,118,592
245

Exhibit 48CITY OF VIRGINIA BEACH, VIRGINIA
DISCRETELY PRESENTED SCHOOL BOARD COMPONENT UNITCOMBINING STATEMENT OF NET POSITION
INTERNAL SERVICE FUNDSJune 30, 2020
School SchoolRisk Health
Management Insurance Totals
ASSETSCash and Investments $ 14,936,354 $ 88,772,375 $ 103,708,729 Accounts Receivable 5,298 2,403,656 2,408,954 Prepaid Items 305,632 - 305,632
Total Assets 15,247,284 91,176,031 106,423,315
LIABILITIESCurrent Liabilities:
Salaries Payable 136 140 276 Vouchers and Accounts Payable 211,956 4,072,325 4,284,281 Unearned Revenue - 8,182,321 8,182,321 Estimated Claims and Judgments (due within one year) 5,856,113 6,191,250 12,047,363
Total Current Liabilities 6,068,205 18,446,036 24,514,241 Noncurrent Liabilities:
Estimated Claims and Judgments (due in more than one year) 1,952,038 2,063,750 4,015,788 Total Liabilities 8,020,243 20,509,786 28,530,029
NET POSITIONUnrestricted $ 7,227,041 $ 70,666,245 $ 77,893,286
246

Exhibit 49CITY OF VIRGINIA BEACH, VIRGINIA
DISCRETELY PRESENTED SCHOOL BOARD COMPONENT UNITCOMBINING STATEMENT OF REVENUES, EXPENSES, AND CHANGES IN FUND NET POSITION
INTERNAL SERVICE FUNDSFOR THE YEAR ENDED JUNE 30, 2020
School SchoolRisk Health
Management Insurance Totals
OPERATING REVENUESCharges for Services $ 6,805,724 $ 151,786,911 $ 158,592,635 Miscellaneous Revenue 58,405 - $ 58,405
Total Operating Revenues 6,864,129 151,786,911 158,651,040
OPERATING EXPENSESPersonnel Services 324,101 427,902 752,003 Fringe Benefits 105,826 160,763 266,589 Purchased Services 482,244 1,768,443 2,250,687 Other Charges 5,930,631 126,801,404 132,732,035
Total Operating Expenses 6,842,802 129,158,512 136,001,314
OPERATING INCOME (LOSS) 21,327 22,628,399 22,649,726
NONOPERATING REVENUES (EXPENSES)Transfers In - - - Interest Income 382,890 1,476,942 1,859,832
Total Nonoperating Revenues (Expenses) 382,890 1,476,942 1,859,832
CHANGE IN NET POSITION 404,217 24,105,341 24,509,558
TOTAL NET POSITION - JULY 1 6,822,824 46,560,904 53,383,728
TOTAL NET POSITION - JUNE 30 $ 7,227,041 $ 70,666,245 $ 77,893,286
247

Exhibit 50CITY OF VIRGINIA BEACH, VIRGINIA
DISCRETELY PRESENTED SCHOOL BOARD COMPONENT UNITCOMBINING STATEMENT OF CASH FLOWS
INTERNAL SERVICE FUNDSFOR THE YEAR ENDED JUNE 30, 2020
School SchoolRisk Health
Management Insurance Totals
CASH FLOWS FROM OPERATING ACTIVITIES:Receipts from Customers and Users $ 6,860,829 $ 151,472,252 $ 158,333,081 Payments to Vendors for Goods and Services (7,315,748) (130,403,023) (137,718,771)Payments to Employees for Services (431,458) (588,774) (1,020,232)
Net Cash Provided (Used) By Operating Activities (886,377) 20,480,455 19,594,078
CASH FLOWS FROM NONCAPITAL FINANCING ACTIVITIES:Intergovernmental Receipts - - -
CASH FLOWS FROM INVESTING ACTIVITIES:Interest Received on Investments 382,890 1,476,942 1,859,832
Net Increase (Decrease) in Cash and Investments (503,487) 21,957,397 21,453,910
Cash and Temporary Investments, July 1 15,439,841 66,814,978 82,254,819
Cash and Temporary Investments, June 30 14,936,354 88,772,375 103,708,729
RECONCILIATION OF OPERATING INCOME (LOSS) TONET CASH PROVIDED BY OPERATING ACTIVITIES:
Operating Income (Loss) 21,327 22,628,399 22,649,726 Adjustments to Reconcile Operating Income (Loss) to
Net Changes in Assets and Liabilities:Accounts Receivable (3,300) (506,297) (509,597)Prepaid Items 11,432 - 11,432 Salaries Payable (1,531) (109) (1,640)Vouchers and Accounts Payable (125,456) (658,014) (783,470)Unearned Revenue - 191,638 191,638 Estimated Claims and Judgments (788,849) (1,175,162) (1,964,011)
Total Adjustments (907,704) (2,147,944) (3,055,648)Net Cash Provided By Operating Activities $ (886,377) $ 20,480,455 $ 19,594,078
248

Exhibit 51CITY OF VIRGINIA BEACH, VIRGINIA
DISCRETELY PRESENTED SCHOOL BOARD COMPONENT UNITCOMBINING STATEMENT OF CHANGES IN ASSETS AND LIABILITIES
AGENCY FUNDSFOR THE YEAR ENDED JUNE 30, 2020
Balance BalanceJuly 1, 2019 Additions Deductions June 30, 2020
PAYROLL DEDUCTIONSASSETS
Cash and Investments $ 6,622,631 $ 151,555,929 $ 151,477,156 $ 6,701,404 Accounts Receivable 91,832 - 91,247 585 Prepaid - 14,148 -
Total Assets 6,714,463 15,570,077 151,568,403 6,701,989
LIABILITIESVouchers and Accounts Payable 6,714,463 151,570,077 151,568,403 6,716,137
FRINGE BENEFITSASSETS
Cash and Investments 9,047,533 120,086,577 119,876,387 9,257,723 Accounts Receivable 205 - 205 410
Total Assets 9,047,738 120,086,577 119,876,592 9,258,133
LIABILITIESVouchers and Accounts Payable 9,047,738 120,086,577 119,879,592 9,254,723
SCHOOL ACTIVITY ACCOUNTSASSETS
Cash and Investments 4,166,903 7,595,946 7,312,240 4,450,609
LIABILITIESVouchers and Accounts Payable 4,166,903 7,595,946 7,312,240 4,450,609
TOTAL - AGENCY FUNDSASSETS
Cash and Investments 19,837,067 279,238,452 278,668,783 20,406,736 Accounts Receivable 92,037 - 91,452 585
Total Assets 19,929,104 279,238,452 278,760,235 20,407,321
LIABILITIESVouchers and Accounts Payable 19,929,104 279,252,600 278,760,235 20,421,469
249

Exhibit 52CITY OF VIRGINIA BEACH, VIRGINIA
DISCRETELY PRESENTED SCHOOL BOARD COMPONENT UNITSTATEMENT OF FIDUCIARY NET POSITION
JUNE 30, 2020
OtherPostemployment
Benefits AgencyTrust Fund Funds
ASSETS Cash and Investments $ - $ 20,406,736 Fixed Income 7,086,066 - Stocks 19,908,473 - Real Estate 2,362,022 - Alternative Investments 4,386,612 - Accounts Receivable - 585
Prepaid - 14,148Total Assets 33,743,173 20,421,469
LIABILITIESVouchers and Accounts Payable - 20,421,469
NET POSITIONRestricted for Postemployment Benefits Other than Pensions $ 33,743,173 $ -
250

Exhibit 53CITY OF VIRGINIA BEACH, VIRGINIA
DISCRETELY PRESENTED SCHOOL BOARD COMPONENT UNITSTATEMENT OF CHANGES IN FIDUCIARY NET POSITION
FOR THE YEAR ENDED JUNE 30, 2020
Other Postemployment
BenefitsTrust Fund
ADDITIONSContributions:
Employer $ 6,950,743
Investment Earnings:Increase in Fair Value of Investments 997,100
Total Additions 7,947,843
DEDUCTIONSBenefits 5,945,243 Administrative Expenses 27,508
Total Deductions 5,972,751
Change in Net Position 1,975,092
Net Position at Beginning of Year 31,768,081
Net Position at End of Year $ 33,743,173
251

This Page Intentionally Left Blank
252

STATISTICAL SECTION


Statistical Section
This part of the City of Virginia Beach comprehensive annual financial report presents detailed information as a context forunderstanding what the information in the financial statements, note disclosures, and required supplementary information saysabout the City’s overall financial health.
Contents Page
Financial Trends 255 These schedules contain trend information to help the reader understand how the City’sfinancial performance has changed over time.
Revenue Capacity 262 These schedules contain information to help the reader assess the factors affecting the City'sability to generate its property and sales taxes.
Debt Capacity 267 These schedules present information to help the reader assess the affordability of the City'scurrent levels of outstanding debt and the City's ability to issue additional debt in the future.
Demographic and Economic Information 272 These schedules offer demographic and economic indicators to help the reader understandthe environment within which the City's financial activities take place and to help makecomparisons over time and with other governments.
Operating Information 275 These schedules contain information about the City's operations and resources to help thereader understand how the City's financial information relates to the services the Cityprovides and the activities it performs.
Schedule of the Treasurer's Cash Accountability 277 This schedule contains information about the City's deposits and investments.
Sources: Unless otherwise noted, the information in these schedules is derived from the comprehensive annual financialreports for the relevant year.
253

This Page Intentionally Left Blank
254

Tab
le 1
CIT
Y O
F V
IRG
INIA
BE
AC
H, V
IRG
INIA
NE
T P
OSI
TIO
N B
Y C
OM
PON
EN
TL
AST
TE
N F
ISC
AL
YE
AR
S(A
CC
RU
AL
BA
SIS
OF
AC
CO
UN
TIN
G)
(UN
AU
DIT
ED
)
2011
2012
2013
2014
2015
2016
2017
2018
2019
2020
Gov
ernm
enta
l Act
iviti
esN
et In
vest
men
t in
Cap
ital A
sset
s $
2,4
58,8
77,9
44
$ 2
,383
,146
,998
$
2,4
28,2
53,8
90
$ 2
,273
,830
,446
$
2,2
52,1
54,5
57
$ 2
,286
,145
,556
$
2,3
24,6
72,4
99
$ 2
,382
,782
,109
$
2,3
82,7
82,1
09
$ 2
,304
,432
,557
R
estri
cted
63,
015,
179
38,
529,
754
40,
925,
256
272
,044
,037
3
43,6
75,4
22
362
,820
,736
3
47,3
82,6
48
67,
047,
985
68,
166,
411
71,
573,
421
Unr
estri
cted
16,
225,
877
216
,468
,300
2
03,2
60,1
67
168
,304
,006
(1
71,5
54,6
44)
(122
,670
,333
)(8
4,47
0,89
7) 1
47,8
77,2
39
146
,768
,813
2
71,5
59,0
81
To
tal G
over
nmen
tal A
ctiv
ities
Net
Pos
ition
2,5
38,1
19,0
00
2,6
38,1
45,0
52
2,6
72,4
39,3
13
2,7
14,1
78,4
89
2,4
24,2
75,3
35
2,5
26,2
95,9
59
2,5
87,5
84,2
50
2,5
97,7
07,3
33
2,5
97,7
17,3
33
2,6
47,5
65,0
59
Bus
ines
s-ty
pe A
ctiv
ities
Net
Inve
stm
ent i
n C
apita
l Ass
ets
699
,132
,196
7
40,7
10,2
53
790
,083
,898
7
16,0
74,5
22
758
,928
,371
7
60,0
03,6
98
813
,703
,550
9
20,2
73,9
99
920
,273
,999
9
66,4
33,5
99
Res
trict
ed 1
34,0
34,7
58
134
,288
,475
1
32,8
51,3
93
249
,548
,491
2
12,3
57,6
44
259
,716
,984
2
46,3
64,6
46
25,
178,
718
25,
178,
718
25,
757,
255
Unr
estri
cted
4,5
47,7
13
32,
339,
713
23,
258,
816
29,
249,
082
30,
523,
779
31,
289,
060
33,
551,
935
251
,112
,602
2
51,1
12,6
02
240
,256
,063
Tota
l Bus
ines
s-ty
pe A
ctiv
ities
Net
Pos
ition
837
,714
,667
9
07,3
38,4
41
946
,194
,107
9
94,8
72,0
95
1,0
01,8
09,7
94
1,0
51,0
09,7
42
1,0
93,6
20,1
31
1,1
96,5
65,3
19
1,1
96,5
65,3
19
1,2
32,4
46,9
17
Prim
ary
Gov
ernm
ent
Net
Inve
stm
ent i
n C
apita
l Ass
ets
3,1
58,0
10,1
40
3,1
23,8
57,2
51
3,2
18,3
37,7
88
2,9
89,9
04,9
68
3,0
11,0
82,9
28
3,0
46,1
49,2
54
3,1
38,3
76,0
49
3,3
03,0
56,1
08
3,3
03,0
56,1
08
3,2
70,8
66,1
56
Res
trict
ed 1
97,0
49,9
37
172
,818
,229
1
73,7
76,6
49
521
,592
,528
5
56,0
33,0
66
622
,537
,720
5
93,7
47,2
94
92,
226,
703
93,
345,
129
97,
330,
676
Unr
estri
cted
20,
773,
590
248
,808
,013
2
26,5
18,9
83
197
,553
,088
(1
41,0
30,8
65)
(91,
381,
273)
(50,
918,
962)
398
,999
,841
3
97,8
81,4
15
511
,815
,144
Tota
l Prim
ary
Gov
ernm
ent N
et P
ositi
on $
3,3
75,8
33,6
67
$ 3
,545
,483
,493
$
3,6
18,6
33,4
20
$ 3
,709
,050
,584
$
3,4
26,0
85,1
29
$ 3
,577
,305
,701
$
3,6
81,2
04,3
81
$ 3
,794
,282
,652
$
3,7
94,2
82,6
52
$ 3
,880
,011
,976
Sour
ce:
City
Dep
artm
ent o
f Fin
ance
255

Tab
le 2
C
ITY
OF
VIR
GIN
IA B
EA
CH
, VIR
GIN
IAC
HA
NG
ES
IN N
ET
PO
SIT
ION
Las
t Ten
Fis
cal Y
ears
(Acc
rual
Bas
is o
f Acc
ount
ing)
(Una
udite
d)
2011
2012
2013
2014
2015
2016
2017
2018
2019
2020
Expe
nses
G
over
nmen
tal A
ctiv
ities
:
Le
gisla
tive
$ 1
,105
,878
$
1,0
90,6
48
$ 1
,273
,769
$
1,1
89,5
12
$ 1
,186
,251
$
1,1
99,2
61
$ 1
,181
,030
$
1,1
97,8
02
$ 1
,137
,306
$
1,1
86,7
59
Exec
utiv
e 2
,513
,730
2
,780
,170
2
,596
,006
2
,498
,694
2
,621
,111
3
,788
,704
4
,185
,699
4
,291
,911
4
,989
,525
5
,148
,732
La
w 3
,599
,766
3
,666
,859
3
,679
,233
3
,937
,096
3
,776
,063
3
,763
,766
3
,978
,553
4
,407
,207
4
,398
,166
4
,646
,337
Fi
nanc
e 1
6,91
2,34
0 1
7,77
5,81
5 1
8,01
5,28
1 1
8,52
1,84
0 1
7,24
1,25
8 1
7,07
7,30
6 1
8,38
2,69
6 1
8,91
4,57
7 1
9,36
9,24
4 1
9,58
9,05
3
H
uman
Res
ourc
es 8
,222
,168
9
,055
,986
9
,916
,732
1
0,47
9,99
4 1
1,03
1,25
8 1
1,75
0,62
7 1
1,26
4,02
0 1
1,83
9,13
7 1
2,40
9,89
7 1
2,30
3,65
0
Ju
dici
al 4
9,73
8,21
0 5
1,87
1,48
2 5
3,42
7,86
6 5
6,38
9,21
6 5
4,16
0,60
8 5
6,30
8,36
4 6
1,62
2,02
8 6
1,57
1,61
6 6
3,54
3,64
7 6
7,31
7,49
3
H
ealth
2,9
39,4
95
2,9
31,3
61
2,8
71,4
75
3,1
26,1
76
3,2
15,2
69
3,1
79,2
40
3,3
91,8
17
3,4
38,8
12
3,7
02,7
96
3,6
90,5
40
Polic
e 8
7,55
0,83
4 8
9,80
6,84
1 9
4,30
6,68
4 9
8,88
5,66
2 9
6,43
1,05
9 9
3,98
8,33
5 1
01,6
44,6
05
99,
016,
027
97,
153,
874
90,
164,
472
Hum
an S
ervi
ces
113
,614
,181
1
12,3
31,3
88
108
,913
,384
1
10,2
66,4
30
110
,140
,108
1
09,1
33,4
50
116
,434
,440
1
14,8
96,8
78
121
,506
,719
1
25,6
92,5
08
Publ
ic W
orks
144
,084
,373
1
95,5
57,1
35
197
,205
,942
2
01,5
65,4
78
151
,146
,960
1
75,4
77,7
90
173
,634
,278
1
82,0
99,7
02
221
,572
,129
1
84,4
76,4
09
Park
s and
Rec
reat
ion
42,
919,
471
42,
619,
362
44,
461,
864
46,
944,
369
46,
372,
607
45,
082,
490
47,
512,
722
52,
804,
501
53,
773,
326
53,
769,
232
Libr
ary
15,
258,
538
15,
639,
419
16,
135,
167
17,
811,
215
17,
581,
450
17,
001,
977
18,
354,
780
17,
605,
034
16,
876,
449
18,
321,
890
Plan
ning
9,3
50,1
24
9,4
54,7
72
9,3
90,2
72
9,7
88,3
52
9,9
63,6
22
9,6
89,9
50
11,
162,
446
19,
392,
297
18,
951,
218
19,
600,
411
Agr
icul
ture
2,8
44,4
10
811
,303
8
82,7
78
889
,198
1
,249
,439
1
,427
,900
4
,605
,108
3
,327
,833
3
,429
,550
3
,505
,824
Ec
onom
ic D
evel
opm
ent
1,9
89,0
67
2,1
95,5
09
942
,848
1
,531
,524
1
,624
,276
2
,076
,114
1
,562
,948
4
,463
,692
2
,460
,004
1
30,2
86
Conv
entio
n an
d V
isito
r Dev
elop
men
t 2
4,45
0,03
4 2
5,21
1,87
0 2
4,25
9,21
1 2
1,97
0,21
2 2
9,15
3,69
4 2
5,83
6,56
0 2
8,76
1,95
7 2
9,39
8,08
9 3
0,88
0,56
6 2
5,95
2,16
4
Cu
ltura
l Affa
irs -
- -
- -
- -
- -
3,1
56,4
88
Info
rmat
ion
Tech
nolo
gy 2
4,97
5,51
6 2
7,11
3,85
3 2
8,52
4,90
3 3
5,27
1,94
6 3
3,63
0,01
4 3
3,64
1,83
2 3
8,96
4,86
8 4
3,48
2,11
6 3
8,01
0,07
9 3
7,03
1,42
5
Em
erge
ncy
Com
mun
icat
ions
and
Citi
zen
Serv
ices
8,2
33,4
37
8,6
44,1
35
8,5
85,7
26
8,9
48,7
09
8,7
50,0
26
8,1
40,5
36
8,9
70,1
42
9,0
50,5
82
8,8
83,4
45
7,6
51,3
83
Boar
ds a
nd C
omm
issio
ns 2
9,80
9,48
1 3
0,81
3,01
1 2
8,15
0,54
0 2
8,20
5,25
1 2
9,45
0,28
4 3
0,23
0,16
4 3
4,73
8,70
7 2
6,46
1,34
0 2
8,03
8,99
5 2
3,02
2,24
0
Fi
re 4
6,49
6,01
5 4
8,60
4,32
6 4
9,29
9,62
7 5
2,57
7,15
7 4
9,68
0,38
0 5
0,30
6,08
8 5
7,10
4,37
6 5
8,98
3,14
4 5
9,20
5,90
2 5
2,18
7,79
7
Bu
dget
and
Man
agem
ent S
ervi
ces
1,4
52,3
77
1,4
88,7
32
1,6
00,7
43
1,4
66,1
32
1,4
20,9
17
1,4
15,0
41
1,3
65,5
06
1,3
41,6
40
1,2
63,5
05
1,3
04,7
87
Educ
atio
n 3
62,6
27,5
43
346
,343
,221
3
71,8
31,3
66
376
,409
,572
3
90,0
15,0
55
398
,127
,741
3
96,3
04,0
03
423
,487
,979
4
30,8
08,1
33
444,
610,
435
Hou
sing
and
Nei
ghbo
rhoo
d Pr
eser
vatio
n 2
5,28
6,35
9 2
5,10
2,01
0 2
7,09
4,23
0 2
6,18
5,22
1 2
6,34
8,55
7 2
6,30
0,16
5 2
8,32
5,39
4 2
8,48
5,38
0 3
1,58
7,07
7 3
3,52
6,69
0
M
useu
ms
8,8
12,6
89
9,5
24,0
54
9,5
57,2
37
10,
314,
480
10,
704,
799
10,
841,
342
11,
113,
741
10,
775,
551
11,
115,
822
10,
318,
444
Emer
genc
y M
edic
al S
ervi
ces
7,6
93,0
52
8,6
67,9
55
8,9
11,5
01
10,
052,
359
10,
028,
682
10,
201,
025
12,
532,
240
12,
591,
888
13,
018,
124
11,
506,
086
Stra
tegi
c G
row
th A
rea
- 1
,011
,323
9
40,8
19
1,2
54,3
62
1,1
02,8
64
638
,519
-
- -
-
G
ener
al G
over
nmen
t 2
2,31
5,40
4 6
,689
,626
2
,785
,087
1
,657
,913
2
,095
,946
1
,826
,647
2
0,90
5,05
1 3
,705
,291
8
,269
,691
5
5,75
6,46
7
In
tere
st o
n Lo
ng-te
rm D
ebt
42,
665,
372
48,4
81,5
22
35,
483,
724
32,
290,
625
33,
395,
513
33,
580,
400
29,
622,
762
24,
905,
558
24,
541,
657
24,
527,
747
To
tal G
over
nmen
tal A
ctiv
ities
Exp
ense
s $
1,1
07,4
59,8
64
$ 1
,145
,283
,688
$
1,1
61,0
44,0
15
$ 1
,190
,428
,695
$
1,1
53,5
18,0
70
$ 1
,182
,031
,334
$
1,2
47,6
25,9
17
$ 1
,271
,935
,584
$
1,3
30,8
96,8
46
$ 1
,340
,095
,749
Bu
sines
s-Ty
pe A
ctiv
ities
:
W
ater
and
Sew
er $
104
,625
,349
$
102
,310
,240
$
103
,110
,267
$
107
,549
,122
$
110
,779
,437
$
109
,232
,931
$
107
,922
,521
$
115
,336
,137
$
139
,843
,870
$
122
,936
,990
St
orm
Wat
er 1
4,17
8,46
8 1
5,65
0,64
5 1
6,59
2,16
0 1
9,56
1,22
3 2
2,90
8,80
3 2
3,28
8,94
4 3
4,66
6,54
5 3
3,51
8,18
3 3
8,12
0,18
1 3
3,32
8,87
3
D
evel
opm
ent A
utho
rity
- -
11,
210,
520
10,
154,
302
11,
025,
011
9,9
20,4
41
39,
724,
605
17,
545,
543
12,
383,
812
11,
848,
737
Was
te M
anag
emen
t -
- -
- 4
1,90
7,75
4 3
9,96
5,30
2 1
2,58
2,90
3 3
7,05
1,53
2 3
4,56
9,61
2 3
4,89
8,95
4
Pa
rkin
g 1
,603
,150
1
,973
,867
1
,668
,933
1
,902
,855
4
,419
,983
3
,770
,402
3
,383
,691
3
,984
,236
4
,211
,205
3
,279
,464
Tota
l Bus
ines
s-Ty
pe A
ctiv
ities
Exp
ense
s $
120
,406
,967
$
119
,934
,752
$
132
,581
,880
$
139
,167
,502
$
191
,040
,988
$
186
,178
,020
$
198
,280
,265
$
207
,435
,631
$
229
,128
,680
$
206
,293
,018
Tota
l Prim
ary
Gov
ernm
ent E
xpen
ses
$ 1
,227
,866
,831
$
1,2
65,2
18,4
40
$ 1
,293
,625
,895
$
1,3
29,5
96,1
97
$ 1
,344
,559
,058
$
1,3
68,2
09,3
54
$ 1
,445
,906
,182
$
1,4
79,3
71,2
15
$ 1
,560
,025
,526
$
1,5
46,3
88,7
67
Prog
ram
Rev
enue
s
Gov
ernm
enta
l Act
iviti
es:
Char
ges f
or se
rvic
es:
Ju
dici
al $
4,4
02,4
63
$ 5
,377
,347
$
3,6
88,1
39
$ 3
,101
,433
$
3,7
35,2
09
$ 3
,549
,429
$
4,9
07,6
94
$ 5
,409
,133
$
5,4
39,7
07
$ 4
,970
,675
Polic
e 4
,026
,448
3
,670
,550
3
,747
,317
3
,472
,080
3
,854
,581
3
,965
,201
3
,308
,747
2
,967
,178
2
,897
,398
2
,895
,919
Hum
an S
ervi
ces
23,
797,
305
24,
322,
382
23,
782,
371
25,
031,
069
25,
615,
214
24,
956,
662
25,
167,
062
25,
755,
690
26,
226,
827
24,
294,
428
Pu
blic
Wor
ks 6
,743
,429
1
3,46
5,43
6 3
0,84
5,23
5 4
4,38
0,91
6 2
,766
,927
3
,564
,521
4
,058
,165
2
,193
,888
4
,244
,989
2
,178
,507
Park
s and
Rec
reat
ion
14,
405,
985
13,
876,
204
14,
891,
219
15,
114,
163
14,
974,
524
15,
569,
444
15,
021,
272
16,
988,
062
17,
445,
906
12,
115,
841
Li
brar
y 7
60,4
80
706
,607
7
28,3
17
760
,734
7
89,5
08
726
,001
6
95,1
52
671
,348
5
57,5
76
446
,146
Plan
ning
4,0
97,2
87
4,2
65,6
30
4,4
32,1
98
4,4
96,0
79
5,2
26,9
04
5,0
20,7
17
5,0
97,9
44
5,4
31,8
04
5,0
51,8
31
5,3
13,0
31
A
gric
ultu
re 1
27,1
56
170
,091
5
2,89
3 5
5,58
5 7
2,72
5 6
2,17
1 8
6,44
9 1
15,1
76
135
,819
9
7,08
7
Econ
omic
Dev
elop
men
t -
- -
- -
367
,208
-
- 1
6,50
0 1
63,0
00
Co
nven
tion
and
Visi
tor D
evel
opm
ent
5,0
67,2
97
5,3
13,0
30
5,4
37,2
03
5,4
84,3
57
5,2
70,4
19
5,90
4,18
4 6
,620
,853
5
,174
,206
5
,334
,377
3
,142
,035
Fire
409
,613
3
46,6
80
414
,091
1
41,7
47
404
,789
4
13,1
15
665
,923
7
17,1
11
480
,369
4
22,2
41
H
ousin
g an
d N
eigh
borh
ood
Pres
erva
tion
215
,523
1
,170
,964
1
,831
,674
2
,033
,427
2
,300
,624
2,
427,
410
2,8
41,8
67
182
,387
2
47,1
21
438
,279
256

2011
2012
2013
2014
2015
2016
2017
2018
2019
2020
M
useu
ms
$ 7
,208
,895
$
7,5
48,6
40
$ 8
,073
,443
$
7,7
01,8
99
$ 8
,343
,814
$
9,1
71,6
46
$ 9
,679
,208
$
9,8
56,7
00
$ 1
0,18
1,85
6 $
6,3
66,0
13
G
ener
al G
over
nmen
t 8
,096
,615
7
,395
,885
7
,535
,955
7
,532
,896
7
,480
,645
6
,690
,903
6
,795
,827
1
1,56
1,55
9 1
7,18
7,43
7 2
2,78
1,92
9
Oth
er A
ctiv
ities
545
,787
4
97,3
76
551
,983
3
,590
,913
4
,088
,006
3
,867
,123
3
,726
,144
3
,644
,173
3
,675
,786
5
,154
,383
O
pera
ting
gran
ts a
nd c
ontri
butio
ns 1
95,5
43,6
54
169
,430
,851
1
66,1
49,1
72
163
,734
,763
1
67,0
99,9
83
176
,554
,087
1
80,7
92,6
70
182
,245
,742
1
89,3
79,2
34
230
,763
,053
Ca
pita
l gra
nts a
nd c
ontri
butio
ns 3
2,76
7,79
2 4
1,57
2,81
9 3
7,50
2,48
6 6
9,77
1,67
4 4
9,91
0,24
9 4
9,35
8,72
6 3
0,38
0,17
1 3
2,12
9,23
8 2
2,41
3,38
9 9
,443
,815
Tota
l Gov
ernm
enta
l Act
iviti
es $
308
,215
,729
$
299
,130
,492
$
309
,663
,696
$
356
,403
,735
$
301
,934
,121
$
312
,168
,549
$
299
,790
,140
$
305
,043
,395
$
310
,916
,122
$
330
,986
,382
Bu
sines
s-ty
pe A
ctiv
ities
:
Ch
arge
s for
serv
ices
:
Wat
er a
nd S
ewer
$ 1
02,3
98,5
24
$ 1
09,2
00,2
04
$ 1
15,1
60,6
70
$ 1
22,0
79,2
74
$ 1
22,6
09,5
20
$ 1
24,3
03,9
22
$ 1
25,1
24,5
05
$ 1
27,9
39,7
34
$ 1
27,2
20,5
50
$ 1
30,6
15,3
26
St
orm
Wat
er 2
1,32
1,42
6 2
7,84
1,16
5 3
2,72
1,54
0 3
7,08
7,51
9 3
9,04
8,82
4 3
9,52
2,70
3 4
0,16
4,45
4 4
1,71
5,74
4 4
2,19
2,45
4 4
4,77
9,18
3
Dev
elop
men
t Aut
horit
y -
- 2
,630
,055
1
89,0
11
4,6
65,1
61
4,9
99,0
07
35,
390,
065
7,7
21,7
39
6,1
15,7
57
3,3
74,5
65
W
aste
Man
agem
ent
- -
- -
43,
457,
679
37,
766,
169
2,8
59,7
07
34,
225,
087
34,
050,
587
37,
369,
824
Pa
rkin
g 3
,213
,279
2
,879
,725
3
,134
,711
2
,879
,228
4
,535
,524
3
,824
,504
5
,235
,807
6
,014
,164
5
,408
,631
4
,701
,165
O
pera
ting
gran
ts a
nd c
ontri
butio
ns 3
,569
,248
1
,306
,092
-
- 9
0,23
7 7
2,74
0 3
19,8
88
42,
871
45,
382
35,
658
Capi
tal g
rant
s and
con
tribu
tions
1,8
77,9
89
974
,355
1
,945
,692
7
,507
,130
7
,413
,070
8
,175
,896
6
,611
,382
2
8,25
8,90
4 2
7,12
4,07
5 5
,013
,019
Tota
l Bus
ines
s-ty
pe A
ctiv
ities
$ 1
32,3
80,4
66
$ 1
42,2
01,5
41
$ 1
55,5
92,6
68
$ 1
69,7
42,1
62
$ 2
21,8
20,0
15
$ 2
18,6
64,9
41
$ 2
15,7
05,8
08
$ 2
45,9
18,2
43
$ 2
42,1
57,4
36
$ 2
25,8
88,7
40
Tota
l Prim
ary
Gov
ernm
ent P
rogr
am R
even
ues
$ 4
40,5
96,1
95
$ 4
41,3
32,0
33
$ 4
65,2
56,3
64
$ 5
26,1
45,8
97
$ 5
23,7
54,1
36
$ 5
30,8
33,4
90
$ 5
15,4
95,9
48
$ 5
50,9
61,6
38
$ 5
53,0
73,5
58
$ 5
56,8
75,1
22
Net
(Exp
ense
s) R
even
ues
G
over
nmen
tal A
ctiv
ities
$(7
99,2
44,1
35)
$(8
46,1
53,1
96)
$(8
51,3
80,3
19)
$(8
34,0
24,9
60)
$(8
51,5
83,9
49)
$(8
69,8
62,7
86)
$(9
47,8
35,7
77)
$(9
66,8
92,1
89)
$(1
,019
,980
,724
) $
(1,0
09,1
09,3
67)
Bu
sines
s-ty
pe A
ctiv
ities
11,
973,
499
22,
266,
789
23,
010,
788
30,
574,
660
30,
779,
027
32,
486,
921
17,
425,
543
38,
482,
612
13,
028,
756
19,
595,
722
Tota
l Prim
ary
Gov
ernm
ent N
et E
xpen
ses
$(7
87,2
70,6
36)
$(8
23,8
86,4
07)
$(8
28,3
69,5
31)
$(8
03,4
50,3
00)
$(8
20,8
04,9
22)
$(8
37,3
75,8
65)
$(9
30,4
10,2
34)
$(9
28,4
09,5
77)
$(1
,006
,951
,968
) $
(989
,513
,645
)
Gen
eral
Rev
enue
s and
Oth
er C
hang
es in
Net
Pos
ition
G
over
nmen
tal A
ctiv
ities
:
Ta
xes:
G
ener
al P
rope
rty T
axes
-
Re
al E
stat
e &
Per
sona
l Pro
perty
$ 5
37,5
21,5
03
$ 5
37,8
43,8
13
$ 5
51,9
50,3
61
$ 5
43,9
60,5
94
$ 5
74,0
64,4
11
$ 6
22,3
89,1
62
$ 6
45,9
72,4
61
$ 6
73,0
06,8
32
$ 6
96,2
06,5
55
$ 7
05,6
05,6
10
Sa
les
51,
945,
150
53,
038,
789
55,
995,
114
55,
990,
140
58,
521,
297
61,
409,
466
66,
262,
790
63,
647,
610
65,
946,
655
68,
531,
053
U
tility
47,
159,
975
43,
074,
104
46,
635,
170
42,
665,
494
44,
724,
955
40,
961,
377
48,
275,
048
48,
908,
305
47,
636,
484
44,
798,
145
Bu
sines
s Lic
ense
s 4
1,18
3,38
9 4
1,20
5,98
1 4
4,67
1,81
8 4
3,65
7,87
7 4
5,15
5,69
8 4
4,95
6,51
0 4
7,14
3,39
8 4
8,77
7,76
6 4
9,12
9,28
4 5
3,87
9,10
1
Mea
l 5
0,87
0,24
6 5
3,54
0,55
9 5
5,29
6,25
2 5
7,04
1,07
2 5
9,69
3,98
1 6
3,55
8,42
7 6
8,90
0,06
5 6
6,60
8,92
4 6
9,54
0,21
0 5
4,48
9,83
2
Lodg
ing
24,
401,
106
25,
624,
528
26,
265,
622
26,
252,
617
28,
216,
513
29,
999,
408
32,
385,
074
36,
467,
582
37,
085,
103
30,
962,
264
A
mus
emen
t 5
,312
,439
5
,617
,464
5
,365
,290
6
,247
,637
6
,001
,024
6
,953
,928
7
,032
,632
6
,485
,738
7
,295
,403
5
,196
,698
City
Tax
on
Dee
ds a
nd W
ills
5,8
64,2
24
6,2
84,6
35
7,5
30,4
69
6,3
77,8
34
7,0
44,9
58
7,2
99,0
45
7,8
58,4
06
7,5
65,4
71
7,8
09,0
55
8,5
54,1
50
Ci
gare
tte 1
2,27
0,18
5 1
2,21
3,13
5 1
1,74
8,00
3 1
2,07
3,54
0 1
2,98
3,84
7 1
0,95
0,79
9 1
2,06
0,43
3 1
1,44
7,55
3 1
0,30
9,97
1 1
0,47
7,78
9
Aut
omob
ile L
icen
ses
9,0
18,2
55
8,9
47,5
35
10,
278,
790
9,4
21,0
28
9,0
48,5
39
10,
867,
860
11,
762,
967
11,
147,
509
11,
232,
389
10,
014,
639
O
ther
Tax
es 1
0,98
1,66
9 1
0,77
0,99
2 1
1,04
9,73
2 1
0,23
1,84
0 1
1,46
0,71
0 1
3,48
0,84
2 1
0,93
7,88
0 5
,783
,324
3
,607
,656
3
,348
,538
G
rant
s and
con
tribu
tions
not
rest
ricte
d 6
7,91
3,07
3 5
3,41
4,00
0 5
3,41
2,86
8 5
3,41
2,86
8 5
3,41
2,86
8 5
3,41
2,86
8 5
3,41
2,86
8 5
3,41
2,86
8 5
3,41
2,86
8 5
3,41
2,86
8
In
vest
men
t Ear
ning
s 1
,755
,326
9
,351
,455
1
99,9
20
3,5
57,9
73
3,9
56,6
35
7,1
72,4
59
2,2
55,0
88
6,4
88,4
05
15,
272,
598
14,
404,
603
Misc
ella
neou
s 1
0,58
4,15
4 1
1,09
3,31
7 2
0,53
3,87
5 2
2,45
4,26
8 1
4,87
6,71
3 1
4,36
9,40
6 1
7,44
6,14
7 1
6,75
2,79
1 7
,464
,961
6
,526
,999
Tr
ansf
ers
716
,322
(1
,303
,678
)(1
5,25
8,70
4)(1
7,58
0,64
6)(1
5,85
0,87
3)(1
5,89
8,14
7)(2
2,61
1,18
9)(2
3,40
9,46
2)(2
2,24
8,56
4)(1
1,24
5,19
6)
Tota
l Gov
ernm
enta
l Act
iviti
es $
877
,497
,016
$
870
,716
,629
$
885
,674
,580
$
875
,764
,136
$
913
,311
,276
$
971
,883
,410
$
1,0
09,0
94,0
68
$ 1
,033
,091
,216
$
1,0
59,7
00,6
28
$ 1
,058
,957
,093
Bu
sines
s-ty
pe A
ctiv
ities
:
In
vest
men
t Ear
ning
s $
761
,924
$
264
,732
$
586
,174
$
522
,661
$
660
,764
$
814
,880
$
2,5
73,6
57
$ 4
,196
,130
$
5,0
46,9
19
$ 4
,234
,320
M
iscel
lane
ous
- -
- 2
1 (4
78,8
76)
- -
1,1
15,0
89
997
,384
8
06,3
60
Tran
sfer
s(7
16,3
22)
1,3
03,6
78
15,
258,
704
17,
580,
646
15,
850,
873
15,
898,
147
22,
611,
189
23,
409,
462
22,
248,
564
11,
245,
196
To
tal B
usin
ess-
type
Act
iviti
es $
45,
602
$ 1
,568
,410
$
15,
844,
878
$ 1
8,10
3,32
8 $
16,
032,
761
$ 1
6,71
3,02
7 $
25,
184,
846
$ 2
8,72
0,68
1 $
28,
292,
867
$ 1
6,28
5,87
6
To
tal P
rimar
y G
over
nmen
t $
877
,542
,618
$
872
,285
,039
$
901
,519
,458
$
893
,867
,464
$
929
,344
,037
$
988
,596
,437
$
1,0
34,2
78,9
14
$ 1
,061
,811
,897
$
1,0
87,9
93,4
95
$ 1
,075
,242
,969
Cha
nge
in N
et P
ositi
on
G
over
nmen
tal A
ctiv
ities
$ 7
8,25
2,88
1 $
24,
563,
433
$ 3
4,29
4,26
1 $
41,
739,
176
$ 6
1,72
7,32
7 $
102
,020
,624
$
61,
258,
291
$ 6
6,19
9,02
7 $
39,
719,
904
$ 4
9,84
7,72
6
Bu
sines
s-ty
pe A
ctiv
ities
12,
019,
101
23,
835,
199
38,
855,
666
48,
677,
988
46,
811,
788
49,
199,
948
42,
610,
389
67,
203,
293
41,
321,
623
35,
881,
598
To
tal P
rimar
y G
over
nmen
t $
90,
271,
982
$ 4
8,39
8,63
2 $
73,
149,
927
$ 9
0,41
7,16
4 $
108
,539
,115
$
151
,220
,572
$
103
,868
,680
$
133
,402
,320
$
81,
041,
527
$ 8
5,72
9,32
4
Sour
ce:
City
Dep
artm
ent o
f Fin
ance
Not
e: S
trate
gic
Gro
wth
Are
a m
erge
d w
ith P
lann
ing
in 2
018
257

Tab
le 3
C
ITY
OF
VIR
GIN
IA B
EA
CH
, VIR
GIN
IAFU
ND
BA
LA
NC
ES O
F G
OV
ER
NM
ENT
AL
FU
ND
SL
AST
TE
N F
ISC
AL
YEA
RS
(UN
AU
DIT
ED
)
2
011*
2012
2013
2014
2015
2016
2017
2018
2019
2020
Gen
eral
Fun
d
N
onsp
enda
ble
$ 4
53,0
56
$ 5
06,3
39
$ 5
81,0
99
$ 7
,482
,460
$
7,0
93,8
61
$ 1
0,93
7,94
6 $
10,
647,
511
$ 1
1,08
8,35
0 $
10,
934,
636
$ 1
1,25
9,96
1
Res
trict
ed 9
87,7
01
721
,002
8
92,7
01
892
,701
1
,080
,998
6
75,6
16
2,0
47,7
51
2,2
01,9
65
2,9
01,4
70
1,4
60,2
87
C
omm
itted
33,
756,
567
16,
397,
989
19,
310,
560
16,
616,
865
12,
299,
308
12,
299,
308
17,
299,
308
17,
299,
308
17,
299,
308
16,
549,
308
A
ssig
ned
41,
286,
701
69,
462,
951
65,
524,
909
50,
789,
758
46,
342,
481
54,
485,
191
69,
793,
355
85,
216,
602
78,
139,
398
123
,695
,484
Una
ssig
ned
113
,003
,754
1
03,9
61,1
51
102
,363
,793
9
6,08
4,79
1 9
7,00
4,93
3 1
07,1
19,3
81
118
,396
,300
1
14,2
98,4
52
121
,304
,984
1
52,8
42,9
32
R
eser
ved
- -
- -
- -
- -
- -
U
nres
erve
d -
- -
- -
- -
- -
-
Tota
l Gen
eral
Fun
d $
189
,487
,779
$
191
,049
,432
$
188
,673
,062
$
171
,866
,575
$
163
,821
,581
$
185
,517
,442
$
218
,184
,225
$
230
,104
,677
$
230
,579
,796
$
305
,807
,972
All
Oth
er G
over
nmen
tal F
unds
N
onsp
enda
ble
$ -
$ -
$ -
$ -
$ 6
,453
,867
$
6,4
88,6
66
$ -
$ -
$ 4
7,30
7 $
-
Res
trict
ed 3
6,58
3,67
6 4
2,91
0,05
3 4
0,03
2,55
5 4
1,30
3,25
5 3
6,87
8,32
8 4
3,56
8,70
0 4
9,56
7,84
1 4
9,24
2,71
9 5
4,28
2,99
8 5
8,85
3,17
3
Com
mitt
ed 2
05,2
54,0
77
337
,853
,345
3
02,8
68,8
39
321
,477
,382
3
37,4
02,9
46
357
,531
,393
3
36,8
73,1
03
387
,589
,280
3
11,6
54,2
34
391
,912
,535
Ass
igne
d 1
33,7
09,7
15
6,5
83,1
70
3,8
41,8
98
8,6
01,6
14
9,0
47,0
83
6,1
54,6
07
2,2
73,1
80
1,0
52,7
30
2,3
61,6
60
2,4
64,0
37
U
nass
igne
d -
- -
(554
,019
)(3
91,7
69)
- -
- (1
,118
,426
)(4
,396
,547
)
Res
erve
d, R
epor
ted
In:
-
A
ll O
ther
Gov
ernm
ent F
unds
- -
- -
- -
- -
- -
Deb
t Ser
vice
Fun
ds -
- -
- -
- -
- -
-
Unr
eser
ved,
Rep
orte
d In
:
Sp
ecia
l Rev
enue
Fun
ds -
- -
- -
- -
- -
-
C
apita
l Pro
ject
s Fun
ds -
- -
- -
- -
- -
-
Tota
l All
Oth
er G
over
nmen
tal F
unds
$ 3
75,5
47,4
68
$ 3
87,3
46,5
68
$ 3
46,7
43,2
92
$ 3
70,8
28,2
32
$ 3
89,3
90,4
55
$ 4
13,7
43,3
66
$ 3
88,7
14,1
24
$ 4
37,8
84,7
29
$ 3
67,2
27,7
73
$ 4
48,8
33,1
98
Sour
ce:
City
Dep
artm
ent o
f Fin
ance
*Not
e: C
ity A
dopt
ed G
ASB
54
in F
isca
l Yea
r 201
1
258

This Page Intentionally Left Blank
259

Tab
le 4
C
ITY
OF
VIR
GIN
IA B
EA
CH
, VIR
GIN
IAC
HA
NG
ES
IN F
UN
D B
AL
AN
CE
OF
GO
VE
RN
ME
NT
AL
FU
ND
SL
ast T
en F
isca
l Yea
rs(U
naud
ited)
2011
2012
2013
2014
2015
2016
2017
2018
2019
2020
RE
VE
NU
ES
R
eal E
stat
e Ta
xes
$ 4
74,4
74,6
48
$ 4
61,4
80,3
33
$ 4
76,2
17,1
20
$ 4
64,4
39,6
67
$ 4
81,7
74,1
92
$ 5
26,4
51,9
09
$ 5
44,3
02,4
60
$ 5
67,5
73,0
17
$ 5
86,4
07,7
84
$ 6
03,1
19,2
16
Pe
rson
al P
rope
rty T
axes
119
,356
,403
7
3,70
5,37
9 7
4,72
3,03
5 7
8,67
8,32
2 9
0,89
8,63
5 9
5,93
0,68
2 1
00,0
75,2
05
108
,123
,397
1
06,0
29,0
83
112
,728
,082
T
otal
Gen
eral
Pro
perty
Tax
es 5
93,8
31,0
51
535
,185
,712
5
50,9
40,1
55
543
,117
,989
5
72,6
72,8
27
622
,382
,591
6
44,3
77,6
65
675
,696
,414
6
92,4
36,8
67
715
,847
,298
Oth
er L
ocal
Tax
es:
G
ener
al S
ales
51,
743,
905
53,
375,
318
54,
978,
531
56,
431,
418
58,
164,
569
61,
099,
407
62,
614,
614
63,
511,
403
65,
851,
817
67,
855,
536
U
tility
45,
129,
301
45,
254,
169
44,
623,
292
44,
050,
182
43,
308,
157
42,
658,
906
44,
829,
994
49,
832,
408
47,
636,
484
45,
584,
479
B
usin
ess L
icen
ses
41,
281,
806
41,
129,
895
44,
224,
356
44,
027,
381
44,
586,
110
45,
301,
911
47,
009,
925
48,
676,
655
49,
141,
505
52,
759,
292
F
ranc
hise
Tax
es-C
ox C
omm
unic
atio
ns -
6,9
62,3
20
7,1
92,9
40
7,5
31,5
93
7,9
39,5
84
8,1
15,1
71
5,1
63,1
59
- -
-
Aut
omob
ile L
icen
ses
9,0
18,1
42
- -
- -
10,
862,
073
11,
189,
995
10,
961,
726
11,
260,
550
10,
112,
035
B
ank
Stoc
k 3
,029
,323
2
,615
,883
2
,354
,647
2
,151
,058
2
,739
,645
3
,023
,394
3
,100
,922
3
,469
,803
3
,607
,656
3
,348
,538
City
Tax
on
Dee
ds 5
,796
,601
6
,203
,751
7
,458
,847
6
,297
,952
6
,970
,299
7
,222
,757
7
,755
,788
7
,475
,502
7
,708
,985
8
,494
,352
City
Tax
on
Will
s 6
7,62
3 8
0,88
4 7
1,62
2 7
9,88
2 7
4,65
9 7
6,28
8 1
02,6
18
89,
969
99,
895
59,
798
C
igar
ette
12,
063,
516
12,
182,
212
11,
953,
020
11,
693,
536
13,
707,
486
10,
164,
199
11,
906,
282
11,
406,
153
10,
568,
721
10,
353,
589
A
mus
emen
t 5
,314
,873
5
,472
,204
5
,482
,948
6
,015
,026
5
,902
,807
7
,034
,792
6
,811
,740
6
,349
,234
6
,762
,346
6
,300
,510
Hot
el T
axes
24,
169,
996
25,
003,
788
26,
049,
027
26,
643,
369
27,
914,
212
29,
780,
108
29,
196,
087
35,
494,
796
37,
127,
745
32,
682,
467
R
esta
uran
t Mea
ls 5
0,59
4,18
1 5
3,25
4,31
3 5
5,12
2,46
5 5
6,87
2,79
4 5
9,96
8,37
5 6
3,43
7,48
5 6
5,20
7,69
9 6
6,26
4,68
5 6
9,27
8,65
2 6
0,56
1,74
1
Tra
nsie
nt O
ccup
ancy
Tax
es 1
,122
,301
1
,106
,769
1
,178
,742
7
61,5
57
771
,695
8
15,0
25
3,6
09,5
10
- -
-
T
otal
Oth
er L
ocal
Tax
es 2
49,3
31,5
68
252
,641
,506
2
60,6
90,4
37
262
,555
,748
2
72,0
47,5
98
289
,591
,516
2
98,4
98,3
33
303
,532
,334
3
09,0
44,3
56
298
,112
,337
Fi
nes a
nd F
orfe
iture
s 7
,432
,059
6
,821
,979
6
,902
,298
5
,443
,331
7
,359
,085
6
,417
,007
5
,507
,315
5
,749
,252
5
,784
,450
3
,841
,464
Perm
its, P
rivile
ge F
ees,
and
Reg
ulat
ory
Lice
nses
3,8
24,1
68
4,2
39,7
86
4,2
22,3
12
6,3
12,0
79
5,1
38,0
80
4,9
22,3
98
5,2
50,1
46
5,2
60,1
71
4,9
48,9
73
5,2
91,2
20
Fr
om U
se o
f Mon
ey a
nd P
rope
rty 7
,582
,471
1
5,49
5,68
7 8
,486
,602
9
,281
,953
9
,706
,351
1
5,85
6,36
7 8
,910
,323
1
5,58
9,06
9 2
0,76
6,14
3 1
8,43
4,53
9
Cha
rges
for S
ervi
ces
61,
278,
029
68,
489,
147
85,
837,
389
110
,064
,203
7
2,56
5,58
6 7
0,99
8,94
9 7
1,80
0,88
6 7
2,35
6,34
9 7
4,79
4,92
5 6
4,29
0,61
4
Misc
ella
neou
s 1
5,25
5,08
6 1
5,90
0,63
4 2
5,74
4,60
5 1
8,04
1,51
2 1
1,93
5,46
3 1
1,14
8,71
4 1
3,72
3,10
5 1
2,91
7,05
5 1
3,24
5,09
8 1
2,50
3,19
7
Sale
of P
rope
rty 1
5,00
0 -
- -
- -
- -
- -
Fr
om O
ther
Loc
al G
over
nmen
ts 1
4,92
1,90
7 2
47,7
09
2,5
95,2
94
98,
153
49,
077
- -
- -
-
From
Com
mon
wea
lth 1
37,8
44,4
48
183
,494
,275
1
76,2
15,1
87
178
,507
,205
1
99,2
09,8
92
216
,035
,262
2
04,5
02,4
38
187
,643
,619
1
96,3
65,1
67
199
,406
,262
From
Fed
eral
Gov
ernm
ent
81,
029,
447
73,
006,
854
64,
423,
364
59,
113,
705
65,
227,
667
57,
728,
271
56,
119,
173
77,
856,
895
62,
086,
134
94,
757,
533
To
tal R
even
ues
$ 1
,172
,345
,234
$
1,1
55,5
23,2
89
$ 1
,186
,057
,643
$
1,1
92,5
35,8
78
$ 1
,215
,911
,626
$
1,2
95,0
81,0
75
$ 1
,308
,689
,384
$
1,3
56,6
01,1
58
$ 1
,379
,472
,113
$
1,4
12,4
84,4
64
EX
PEN
DIT
UR
ES
Le
gisla
tive
$ 1
,104
,591
$
1,0
78,7
47
$ 1
,298
,568
$
1,1
84,8
83
$ 1
,208
,704
$
1,2
33,9
34
$ 1
,173
,001
$
1,2
48,2
40
$ 1
,144
,252
$
1,1
80,3
02
Ex
ecut
ive
2,5
63,3
72
2,6
97,0
88
2,6
05,1
43
2,5
28,0
02
2,6
15,0
31
3,9
98,3
71
4,0
93,8
80
4,4
88,0
41
5,0
13,4
72
5,1
50,4
30
La
w 3
,576
,615
3
,640
,226
3
,697
,386
3
,913
,804
3
,919
,348
4
,022
,217
3
,969
,488
4
,477
,543
4
,529
,203
4
,595
,060
Fina
nce
15,
804,
138
16,
600,
949
16,
993,
124
17,
367,
222
17,
815,
815
18,
062,
607
18,
207,
252
19,
293,
822
20,
044,
583
19,
694,
983
H
uman
Res
ourc
es 8
,229
,652
9
,010
,045
9
,924
,243
1
0,41
6,98
7 1
1,17
4,60
2 1
1,91
4,85
1 1
1,24
5,57
2 1
1,91
2,01
7 1
2,54
5,58
2 1
2,30
8,23
2
Judi
cial
49,
040,
448
51,
006,
576
53,
276,
187
55,
458,
238
55,
398,
991
58,
516,
561
61,
187,
703
63,
333,
087
65,
909,
658
67,
994,
838
H
ealth
2,9
34,8
99
2,9
26,6
50
2,8
66,3
04
3,1
13,7
72
3,2
13,1
91
3,1
77,8
62
3,3
76,7
61
3,4
42,4
78
3,7
16,7
50
3,6
89,0
09
260

2011
2012
2013
2014
2015
2016
2017
2018
2019
2020
Po
lice
$ 8
5,65
4,99
0 $
87,
210,
424
$ 9
1,04
8,02
3 $
95,
036,
357
$ 9
4,25
9,57
7 $
95,
179,
158
$ 9
7,55
0,85
9 $
99,
210,
134
$ 9
9,39
5,67
5 $
87,
195,
246
H
uman
Ser
vice
s 1
13,4
22,7
55
111
,828
,043
1
09,1
36,1
60
110
,005
,531
1
12,5
06,8
29
112
,944
,110
1
15,1
93,8
57
117
,245
,898
1
24,1
88,9
22
125
,796
,095
Publ
ic W
orks
90,
570,
064
99,
611,
309
103
,023
,351
1
04,5
83,8
10
63,
701,
224
66,
744,
291
73,
368,
698
71,
637,
743
72,
246,
833
78,
688,
736
Pa
rks a
nd R
ecre
atio
n 4
0,08
7,30
0 4
2,67
7,95
3 4
5,25
3,41
7 4
8,89
1,41
7 4
6,97
3,30
1 4
3,26
5,38
4 4
3,76
8,39
3 4
8,54
7,48
2 5
0,72
3,02
1 5
0,28
4,38
4
Libr
ary
15,
442,
912
15,
475,
052
16,
033,
907
17,
381,
850
17,
618,
171
17,
368,
746
17,
615,
908
18,
018,
356
17,
274,
298
18,
190,
701
Pl
anni
ng 9
,324
,289
9
,379
,626
9
,289
,151
9
,291
,336
9
,874
,195
9
,741
,864
1
0,99
3,10
5 1
9,19
3,97
6 1
9,29
6,05
1 1
9,50
7,67
8
Agr
icul
ture
2,8
37,1
46
2,9
58,8
94
3,0
40,5
99
3,3
89,5
46
3,5
03,3
27
1,4
68,5
60
4,6
07,6
50
969
,705
1
,043
,558
1
,056
,388
Econ
omic
Dev
elop
men
t 2
,007
,505
2
,210
,063
2
,343
,970
3
,018
,382
3
,037
,408
3
,949
,271
3
,749
,275
4
,242
,488
5
,577
,029
2
,936
,165
Con
vent
ion
and
Visi
tor D
evel
opm
ent
23,
994,
441
50,
515,
866
51,
583,
205
52,
048,
685
50,
793,
408
26,
306,
456
27,
050,
391
27,
058,
450
27,
868,
190
22,
513,
470
C
ultu
ral A
ffairs
- -
- -
- -
- -
- 3
,156
,488
Info
rmat
ion
Tech
nolo
gy 1
9,37
1,70
0 2
0,99
2,61
4 2
2,34
8,35
2 2
2,24
9,37
2 2
2,00
8,12
8 2
0,46
3,89
5 2
2,13
2,28
8 2
4,77
4,17
8 2
5,70
7,31
2 2
5,16
6,51
8
Emer
genc
y C
omm
unic
atio
ns a
nd C
itize
n Se
rvic
es 8
,233
,437
8
,644
,135
8
,585
,726
9
,033
,409
8
,985
,752
8
,609
,489
8
,859
,237
9
,122
,044
9
,147
,638
7
,631
,901
Boar
ds a
nd C
omm
issio
ns 3
4,45
4,56
0 3
4,73
0,10
7 3
3,49
5,19
4 3
4,74
2,68
4 3
5,60
3,08
0 3
5,36
7,59
0 6
0,71
4,68
0 3
3,60
1,25
7 3
6,87
5,46
7 2
5,95
1,68
5
Fire
43,
756,
960
44,
898,
737
45,
434,
088
47,
774,
858
49,
212,
062
51,
237,
605
55,
117,
288
58,
151,
454
59,
007,
138
48,
921,
561
Bu
dget
and
Man
agem
ent S
ervi
ces
1,4
84,0
95
1,4
71,5
47
1,5
95,9
14
1,4
81,2
62
1,5
26,6
64
1,4
85,4
96
1,4
09,7
75
1,3
65,1
83
1,3
23,8
59
1,3
24,9
13
D
evel
opm
ent A
utho
rity
- -
55,
539
736
,650
4
00,4
29
- 5
5,00
8 -
- -
Ed
ucat
ion
350
,272
,315
3
99,6
36,8
31
364
,589
,660
3
82,9
71,8
59
372
,506
,081
3
88,0
92,3
26
407
,548
,658
4
36,8
11,9
68
401
,945
,731
5
27,0
40,1
70
H
ousin
g an
d N
eigh
borh
ood
Pres
erva
tion
25,
578,
349
25,
057,
346
27,
088,
836
26,
138,
828
26,
490,
648
26,
550,
331
28,
246,
526
28,
499,
449
31,
727,
306
33,
420,
457
M
useu
ms
8,8
05,1
16
9,4
30,0
30
9,5
42,9
60
10,
225,
773
11,
435,
283
11,
140,
739
10,
961,
337
10,
880,
638
11,
318,
527
10,
151,
547
G
ener
al G
over
nmen
t 1
,830
,932
8
,293
,239
8
,014
,133
7
,489
,469
1
1,48
2,23
8 2
,566
,531
2
,331
,474
4
,685
,528
3
,641
,535
4
2,05
8,23
1
Emer
genc
y M
edic
al S
ervi
ce 7
,590
,345
8
,302
,029
8
,501
,568
9
,500
,960
9
,508
,751
1
0,11
1,25
3 1
1,40
5,73
4 1
2,21
3,68
9 1
2,63
7,13
6 1
0,79
9,95
5
Stra
tegi
c G
row
th A
rea
- 1
,011
,323
9
40,8
19
1,2
23,2
32
1,1
36,2
61
746
,889
-
- -
-
Cap
ital O
utla
y 1
52,4
39,0
78
134
,374
,158
1
32,2
01,4
26
142
,572
,128
1
80,7
58,5
00
148
,425
,984
7
5,59
6,09
8 1
27,0
54,1
15
180
,430
,527
1
69,4
46,2
36
D
ebt S
ervi
ce:
Prin
cipa
l Ret
irem
ent
80,
413,
257
28,
759,
234
59,
341,
275
58,
392,
964
61,
522,
444
86,
698,
132
88,
609,
860
87,
908,
194
91,
689,
035
93,
299,
097
Inte
rest
and
Fisc
al C
harg
es 4
3,14
1,57
2 1
6,49
6,68
3 3
1,14
7,74
4 2
9,11
4,20
5 3
2,24
8,02
3 4
5,18
8,80
1 4
6,49
8,27
8 4
2,87
2,48
8 4
2,77
3,28
6 4
1,00
8,01
3
Tota
l Exp
endi
ture
s $
1,2
43,9
66,8
33
$ 1
,250
,925
,524
$
1,2
74,2
95,9
72
$ 1
,321
,277
,475
$
1,3
22,4
37,4
66
$ 1
,314
,579
,304
$
1,3
16,6
38,0
34
$ 1
,392
,259
,645
$
1,4
38,7
41,5
74
$ 1
,560
,158
,489
Ex
cess
(Def
icie
ncy)
of R
even
ues
ov
er (u
nder
) Exp
endi
ture
s $
(71,
621,
599)
$(9
5,40
2,23
5) $
(88,
238,
329)
$(1
28,7
41,5
97)
$(1
06,5
25,8
40)
$(1
9,49
8,22
9) $
(7,9
48,6
50)
$(3
5,65
8,48
7) $
(59,
269,
461)
$(1
47,6
74,0
25)
OT
HE
R F
INA
NC
ING
SO
UR
CE
S (U
SES)
Tr
ansf
ers I
n $
225
,159
,580
$
79,
048,
006
$ 1
34,7
06,3
91
$ 1
31,8
54,5
70
$ 1
42,1
95,7
56
$ 1
51,5
03,5
13
$ 1
53,8
05,9
94
$ 1
60,3
58,2
11
$ 1
61,1
80,5
42
$ 1
74,9
93,4
04
Tr
ansf
ers O
ut(2
32,0
16,2
09)
(80,
346,
618)
(149
,713
,095
)(1
30,9
79,0
95)
(144
,189
,251
)(1
56,2
45,1
23)
(166
,095
,354
)(1
70,7
48,8
99)
(172
,092
,918
)(1
73,2
01,2
24)
A
gric
ultu
re R
eser
ve A
gree
men
t -
- -
270
,504
3
44,8
42
565
,264
3
,728
,464
-
- -
Is
suan
ce o
f Deb
t 9
4,87
5,00
0 1
18,5
96
83,
640,
000
111
,248
,370
9
9,54
0,00
0 1
11,6
85,0
00
21,
225,
000
98,
035,
000
- 2
60,1
70,0
00
Pr
emiu
m o
n Bo
nds S
old
6,6
00,6
90
132
,850
,000
7
,342
,754
1
6,09
6,11
2 2
9,21
3,78
6 1
3,62
3,89
4 2
,922
,087
2
2,47
6,88
7 -
51,
237,
936
Pr
ocee
ds o
f Ref
undi
ng B
onds
- -
- 2
0,32
0,00
0 9
1,41
5,00
0 -
- 7
1,53
0,00
0 -
80,
329,
587
In
crea
se (D
ecre
ase)
in T
reas
ury
Strip
s(4
9,82
3) 2
3,19
4,10
7 (2
,225
,854
) -
- -
- -
- -
Pa
ymen
t to
Ref
undi
ng B
onds
Esc
row
Age
nt -
(55,
071,
638)
(37,
929,
148)
(22,
353,
602)
(109
,664
,176
)(5
5,58
5,54
7) -
(84,
900,
655)
- (8
9,02
2,07
7)
To
tal O
ther
Fin
anci
ng S
ourc
es (U
ses)
$ 9
4,56
9,23
8 $
99,
792,
453
$ 3
5,82
1,04
8 $
126
,456
,859
$
108
,855
,957
$
65,
547,
001
$ 1
5,58
6,19
1 $
96,
750,
544
$(1
0,91
2,37
6) $
304
,507
,626
Net
Cha
nge
in F
und
Bala
nce
$ 2
2,94
7,63
9 $
4,3
90,2
18
$(5
2,41
7,28
1) $
(2,2
84,7
38)
$ 2
,330
,117
$
46,
048,
772
$ 7
,637
,541
$
61,
092,
057
$(7
0,18
1,83
7) $
156
,833
,601
Deb
t Ser
vice
as a
Per
cent
age
of N
onca
pita
l Exp
endi
ture
s11
.3%
4.1%
7.9%
7.4%
8.2%
11.3
%10
.9%
10.3
%10
.7%
9.7%
Sour
ce:
City
Dep
artm
ent o
f Fin
ance
Not
e: F
ranc
hise
Tax
was
com
bine
d w
ith U
tility
Tax
beg
inni
ng in
FY
2018
261

Tab
le 5
C
ITY
OF
VIR
GIN
IA B
EA
CH
, VIR
GIN
IAG
OV
ER
NM
EN
TA
L F
UN
DS
TA
X R
EV
EN
UE
BY
SO
UR
CE
Las
t Ten
Fis
cal Y
ears
(Una
udite
d)
2011
2012
2013
2014
2015
2016
2017
2018
2019
2020
City
Tax
es
Rea
l Est
ate
$ 4
74,4
74,6
48
$ 4
61,4
80,3
33
$ 4
76,2
17,1
20
$ 4
64,4
39,6
67
$ 4
81,7
74,1
92
$ 5
26,4
51,9
09
$ 5
44,3
02,4
60
$ 5
67,5
73,0
17
$ 5
86,4
07,7
84
$ 6
03,1
19,2
16
Pe
rson
al P
rope
rty 6
5,94
3,53
5 7
3,70
5,37
9 7
4,72
3,03
5 7
8,67
8,32
2 9
0,89
8,63
5 9
5,93
0,68
2 1
00,0
75,2
05
108
,123
,397
1
06,0
29,0
83
112
,728
,082
Gen
eral
Sal
es 5
1,74
3,90
5 5
3,37
5,31
8 5
4,97
8,53
1 5
6,43
1,41
8 5
8,16
4,56
9 6
1,09
9,40
7 6
2,61
4,61
4 6
3,51
1,40
3 6
5,85
1,81
7 6
7,85
5,53
6
Util
ity 4
5,12
9,30
1 4
5,25
4,16
9 4
4,62
3,29
2 4
4,05
0,18
2 4
3,30
8,15
7 4
2,65
8,90
6 4
4,82
9,99
4 4
9,83
2,40
8 4
7,63
6,48
4 4
5,58
4,47
9
Bus
ines
s Lic
ense
s 4
1,28
1,80
6 4
1,12
9,89
5 4
4,22
4,35
6 4
4,02
7,38
1 4
4,58
6,11
0 4
5,30
1,91
1 4
7,00
9,92
5 4
8,67
6,65
5 4
9,14
1,50
5 5
2,75
9,29
2
Fran
chis
e Ta
xes
6,8
27,4
22
6,9
62,3
20
7,1
92,9
40
7,5
31,5
93
7,9
39,5
84
8,1
15,1
71
5,1
63,1
59
- -
-
Aut
omob
ile L
icen
ses
9,0
18,1
42
8,9
70,5
35
9,4
37,6
35
9,3
46,9
71
9,2
25,1
76
10,
862,
073
11,
189,
995
10,
961,
726
11,
260,
550
10,
112,
035
B
ank
Stoc
k 3
,029
,323
2
,615
,883
2
,354
,647
2
,151
,058
2
,739
,645
3
,023
,394
3
,100
,922
3
,469
,803
3
,607
,656
3
,348
,538
City
Tax
on
Dee
ds 5
,796
,601
6
,203
,751
7
,458
,847
6
,297
,952
6
,970
,299
7
,222
,757
7
,755
,788
7
,475
,502
7
,708
,985
8
,494
,352
City
Tax
on
Will
s 6
7,62
3 8
0,88
4 7
1,62
2 7
9,88
2 7
4,65
9 7
6,28
8 1
02,6
18
89,
969
99,
895
59,
798
C
igar
ette
12,
063,
516
12,
182,
212
11,
953,
020
11,
693,
536
13,
707,
486
10,
164,
199
11,
906,
282
11,
406,
153
10,
568,
721
10,
353,
589
A
mus
emen
t 5
,314
,873
5
,472
,204
5
,482
,948
6
,015
,026
5
,902
,807
7
,044
,913
6
,811
,740
6
,349
,234
6
,762
,346
6
,300
,510
Hot
el T
axes
25,
292,
297
26,
110,
557
27,
227,
769
27,
404,
926
28,
685,
907
30,
595,
133
32,
805,
597
35,
493,
796
37,
127,
745
32,
682,
467
R
esta
uran
t Mea
ls 5
0,59
4,18
1 5
3,25
4,31
3 5
5,12
2,46
5 5
6,87
2,79
4 5
9,96
8,37
5 6
3,43
7,48
5 6
5,20
7,69
9 6
6,26
4,68
5 6
9,27
8,65
2 6
0,56
1,74
1
To
tal
$ 7
96,5
77,1
73
$ 7
96,7
97,7
53
$ 8
21,0
68,2
27
$ 8
15,0
20,7
08
$ 8
53,9
45,6
01
$ 9
11,9
84,2
28
$ 9
42,8
75,9
98
$ 9
79,2
27,7
48
$ 1
,001
,481
,223
$
1,0
13,9
59,6
35
Sour
ce:
City
Dep
artm
ent o
f Fin
ance
Not
e: F
ranc
hise
Tax
was
com
bine
d w
ith U
tility
Tax
beg
inni
ng in
FY
2018
H
otel
Tax
es in
clud
e Tr
ansi
ent O
ccup
ancy
Tax
es
262

Tab
le 6
C
ITY
OF
VIR
GIN
IA B
EA
CH
, VIR
GIN
IAA
SSE
SSE
D V
AL
UE
AN
D E
STIM
AT
ED
AC
TU
AL
VA
LU
E O
F T
AX
AB
LE
PR
OPE
RT
YL
AST
TE
N F
ISC
AL
YE
AR
S(U
NA
UD
ITE
D)
Rea
l Pro
pert
y T
otal
Tax
able
Pe
rson
al P
rope
rty
Tot
al T
axab
le
Est
imat
ed
Ass
esse
d V
alue
Fisc
al A
sses
sed
Val
ue
Rea
l Pro
pert
y D
irec
t Tax
Ass
esse
d V
alue
Per
sona
lPr
oper
ty
Dir
ect T
ax A
ctua
l as
a P
erce
ntag
eY
ear
Res
iden
tial
Com
mer
cial
P
ublic
Ser
vice
* A
sses
sed
Val
ue
Rat
e R
esid
entia
l C
omm
erci
al
Pub
lic S
ervi
ce
Ass
esse
d V
alue
R
ate
Tax
able
Val
ue
of A
ctua
l Val
ue
2011
43,
967,
169,
845
8,0
08,2
31,6
01
926
,192
,535
5
2,90
1,59
3,98
1 0
.890
0 3
,105
,575
,058
9
72,5
20,2
33
1,3
17,2
11
4,0
79,4
12,5
02
3.7
000
56,
981,
006,
483
100.
0%20
12 4
2,58
2,79
7,35
4 7
,925
,225
,472
9
37,5
65,5
94
51,
445,
588,
420
0.8
900
3,2
25,2
16,2
84
1,0
79,9
09,6
16
761
,493
4
,305
,887
,393
3
.700
0 5
5,75
1,47
5,81
3 10
0.0%
2013
40,
815,
993,
416
8,0
36,0
01,2
42
929
,117
,285
4
9,78
1,11
1,94
3 0
.950
0 3
,306
,948
,272
9
42,7
44,2
60
725
,885
4
,250
,418
,417
3
.700
0 5
4,03
1,53
0,36
0 10
0.0%
2014
40,
590,
297,
065
8,1
47,3
17,1
25
888
,427
,995
4
9,62
6,04
2,18
5 0
.930
0 3
,362
,985
,338
9
71,0
33,5
85
622
,805
4
,334
,641
,728
3
.700
0 5
3,96
0,68
3,91
3 10
0.0%
2015
42,
110,
642,
755
8,4
66,6
36,4
25
873
,940
,844
5
1,45
1,22
0,02
4 0
.930
0 3
,446
,918
,395
1
,122
,915
,183
1
,555
,727
4
,571
,389
,305
4
.000
0 5
6,02
2,60
9,32
9 10
0.0%
2016
43,
302,
214,
028
8,7
14,1
60,4
76
893
,717
,743
5
2,91
0,09
2,24
7 0
.990
0 3
,552
,544
,174
1
,029
,515
,444
1
,762
,202
4
,583
,821
,820
4
.000
0 5
7,49
3,91
4,06
7 10
0.0%
2017
45,
017,
777,
981
8,8
22,7
68,0
56
943
,063
,814
5
4,78
3,60
9,85
1 0
.990
0 3
,612
,948
,282
1
,079
,435
,074
2
,030
,566
4
,694
,413
,922
4
.000
0 5
9,47
8,02
3,77
3 10
0.0%
2018
46,
426,
321,
920
9,0
94,3
79,3
13
981
,368
,382
5
6,50
2,06
9,61
5 1
.002
5 3
,662
,270
,285
1
,124
,495
,564
2
,239
,486
4
,789
,005
,335
4
.000
0 6
1,29
1,07
4,95
0 10
0.0%
2019
47,
819,
472,
210
9,4
79,8
85,4
09
1,0
17,6
79,8
83
58,
317,
037,
502
1.0
025
4,4
65,6
18,1
46
1,1
81,4
48,7
70
2,4
99,8
89
5,6
49,5
66,8
05
4.0
000
63,
966,
604,
307
100.
0%20
20 4
9,37
3,62
3,87
5 9
,975
,795
,660
1
,043
,594
,888
6
0,39
3,01
4,42
3 1
.017
5 4
,570
,825
,950
1
,410
,040
,850
3
,326
,909
5
,984
,193
,709
4
.000
0 6
6,37
7,20
8,13
2 10
0.0%
Sour
ces:
Offi
ce o
f Rea
l Est
ate
Ass
esso
r C
omm
issio
ner o
f the
Rev
enue
C
ity A
dopt
ed R
esou
rce
Man
agem
ent P
lan
Not
es:
1 -
The
City
is th
e on
ly e
ntity
with
loca
l tax
ing
auth
ority
with
in it
s bou
ndar
ies.
2 -
See
Tabl
e 7
for r
even
ue ra
tes
* T
he a
sses
sed
valu
e in
clud
es P
ublic
Ser
vice
Per
sona
l Pro
perty
taxe
d at
the
sam
e ra
te a
s Rea
l Est
ate
263

Tab
le 7
C
ITY
OF
VIR
GIN
IA B
EA
CH
, VIR
GIN
IAR
EV
EN
UE
RA
TE
S FO
R R
EA
L E
STA
TE
AN
D F
OR
PE
RSO
NA
L P
RO
PER
TY
LA
ST T
EN
FIS
CA
L Y
EA
RS
(UN
AU
DIT
ED
)
Add
ition
al
Add
ition
al
Add
ition
al
Add
ition
al
Add
ition
al
Add
ition
al
Add
ition
al
Add
ition
al
Add
ition
al
Add
ition
al
Bas
eR
eal P
rope
rty
Rea
l Pro
pert
yR
eal P
rope
rty
Rea
l Pro
pert
yR
eal P
rope
rty
Rea
l Pro
pert
yR
eal P
rope
rty
Rea
l Pro
pert
yR
eal P
rope
rty
Rea
l Pro
pert
yPe
rson
alFi
scal
Rea
l Pro
pert
yT
ax R
ate
Tax
Rat
eT
ax R
ate
Tax
Rat
eT
ax R
ate
Tax
Rat
eT
ax R
ate
Tax
Rat
eT
ax R
ate
Tax
Rat
ePr
oper
ty T
axY
ear
Tax
Rat
eSa
ndbr
idge
SSD
Tow
n C
ente
r SS
DO
ld D
onat
ion
SSD
Bay
ville
Cre
ek S
SDSh
adow
law
n SS
DC
heso
peia
n SS
DH
arbo
r Po
int S
SDG
ills C
ove
SSD
Hur
ds C
ove
SSD
Schi
lling
Poi
ntR
ate
2011
0.8
900
0.0
600
0.4
500
- -
- -
- -
- -
3.7
00
2012
0.8
900
0.0
600
0.4
500
0.1
840
- -
- -
- -
- 3
.700
20
13 0
.950
0 0
.060
0 0
.450
0 0
.184
0 0
.363
0 -
- -
- -
- 3
.700
20
14 0
.930
0 0
.060
0 0
.450
0 0
.184
0 0
.363
0 0
.159
4 -
- -
- -
3.7
00
2015
0.9
300
0.0
600
0.4
500
0.1
840
0.3
630
0.1
594
0.2
913
0.0
790
0.0
630
- -
4.0
00
2016
0.9
900
0.0
600
0.4
500
0.1
840
0.3
630
0.1
594
0.2
913
0.0
790
0.0
630
0.4
380
- 4
.000
20
17 0
.990
0 0
.060
0 0
.450
0 0
.184
0 0
.363
0 0
.159
4 0
.291
3 0
.079
0 0
.063
0 0
.438
0 -
4.0
00
2018
1.0
025
0.0
600
0.4
500
0.1
840
0.5
690
0.1
594
0.2
913
0.0
790
0.0
630
0.4
380
- 4
.000
20
19 1
.002
5 0
.060
0 0
.450
0 0
.184
0 0
.472
0 0
.159
4 0
.291
3 0
.120
0 0
.063
0 0
.438
0 -
4.0
00
2020
1.0
175
0.0
400
0.4
500
0.1
840
0.4
720
0.1
594
0.2
913
0.1
200
0.0
630
0.4
380
0.4
040
4.0
00
Rea
l Pro
pert
y T
otal
Dir
ect T
ax R
ate
Fisc
alSa
ndbr
idge
SSD
Tow
n C
ente
r SS
DO
ld D
onat
ion
SSD
Bay
ville
Cre
ek S
SDSh
adow
law
n SS
DC
heso
peia
n SS
DH
arbo
r Po
int S
SDG
ills C
ove
SSD
Hur
ds C
ove
SSD
Schi
lling
Poi
ntY
ear
Reg
ular
Res
iden
tsR
esid
ents
Res
iden
tsR
esid
ents
Res
iden
tsR
esid
ents
Res
iden
tsR
esid
ents
Res
iden
tsR
esid
ents
2011
$ 0
.890
0 $
0.9
500
$ 1
.340
0 $
0.8
900
$ 0
.890
0 $
0.8
900
$ 0
.890
0 $
0.8
900
$ 0
.890
0 $
0.8
900
$ 0
.890
0 20
12 0
.890
0 0
.950
0 1
.340
0 1
.074
0 0
.890
0 0
.890
0 0
.890
0 0
.890
0 0
.890
0 0
.890
0 0
.890
0 20
13 0
.950
0 1
.010
0 1
.400
0 1
.134
0 1
.313
0 0
.950
0 0
.950
0 0
.950
0 0
.950
0 0
.950
0 0
.950
0 20
14 0
.930
0 0
.990
0 1
.380
0 1
.114
0 1
.293
0 1
.089
4 0
.930
0 0
.930
0 0
.930
0 0
.930
0 0
.930
0 20
15 0
.930
0 0
.990
0 1
.380
0 1
.114
0 1
.293
0 1
.089
4 1
.221
3 1
.009
0 0
.993
0 0
.930
0 0
.930
0 20
16 0
.990
0 1
.050
0 1
.440
0 1
.174
0 1
.353
0 1
.149
4 1
.281
3 1
.069
0 1
.053
0 1
.428
0 0
.990
0 20
17 0
.990
0 1
.050
0 1
.440
0 1
.174
0 1
.353
0 1
.149
4 1
.281
3 1
.069
0 1
.053
0 1
.428
0 0
.990
0 20
18 1
.002
5 1
.062
5 1
.452
5 1
.186
5 1
.571
5 1
.161
9 1
.293
8 1
.081
5 1
.065
5 1
.440
5 1
.002
5 20
19 1
.002
5 1
.062
5 1
.452
5 1
.186
5 1
.474
5 1
.161
9 1
.293
8 1
.122
5 1
.065
5 1
.440
5 1
.002
5 20
20 1
.017
5 1
.057
5 1
.467
5 1
.201
5 1
.489
5 1
.176
9 1
.308
8 1
.137
5 1
.080
5 1
.455
5 1
.421
5
Sour
ce:
City
Ado
pted
Res
ourc
e M
anag
emen
t Pla
n
Not
es:
1 - T
he C
ity is
the
only
ent
ity w
ith lo
cal t
axin
g au
thor
ity w
ithin
its b
ound
arie
s.2
- Rea
l Pro
perty
Tax
Rat
e is
appl
ied
to R
eal E
stat
e su
ch a
s lan
d an
d bu
ildin
gs.
3 - P
erso
nal P
rope
rty T
ax R
ate
is ap
plie
d to
per
sona
l pro
perty
such
as a
utom
obile
s and
equ
ipm
ent.
4 - T
he ta
x ba
ses a
re m
utua
lly e
xclu
sive.
264

Table 8CITY OF VIRGINIA BEACH, VIRGINIAPRINCIPAL PROPERTY TAXPAYERS
CURRENT YEAR AND NINE YEARS AGO(UNAUDITED)
Percent of Percent ofReal Total Real Real Total Real
Property Property Property PropertyAssessed Assessed Assessed Assessed
Value Value Rank Value Value Rank2020 2011
Virginia Electric & Power Company $ 645,615,537 1.09 % 1 $ 487,715,425 0.94 % 1 Armada Hoffler 532,344,000 0.90 2 318,436,000 0.61 2 Ramon W. Breeden, Jr. 377,876,100 0.64 3 234,437,638 0.45 6 A.D. & L.E. Fleder & J.M. & R.J. Caplan 334,168,300 0.56 4 - - - E. C. & A. F. Ruffin & B. L. Thompson 286,455,900 0.48 5 265,167,300 0.51 4 Lynnhaven Mall LLC 284,071,300 0.48 6 283,277,900 0.55 3 Pembroke Square Associates 215,983,400 0.36 7 182,616,100 0.35 8 Virginia Natural Gas Inc 167,175,598 0.28 8 - - - Franklin W. Taylor 166,994,200 0.28 9 - - - Cheryl P. McLeskey 161,805,700 0.27 10 - - - Verizon Virginia LLC - - - 236,412,822 0.45 5 J. M. , R.J.F. , A.D. & L.E. Caplan - - - 198,042,900 0.38 7 F. Wayne McLeskey, Jr. - - - 140,327,424 0.27 9 Christian Broadcasting Associates/Net, Inc. - - - 138,896,300 0.27 10
Totals $ 3,172,490,035 5.34 % $ 2,485,329,809 4.78 %
* Formerly Virginia Electric & Power Company
Sources: Office of Real Estate Assessor Commissioner of the Revenue
265

Table 9 CITY OF VIRGINIA BEACH, VIRGINIA
PROPERTY TAX LEVIES AND COLLECTIONSLAST TEN FISCAL YEARS
(UNAUDITED)
Collected within the Total Total Fiscal Year of the Levy Collections Total Collections to Date
Fiscal Real Estate Personal Property Percentage in Subsequent Percentage Year Tax Levy 1 Tax Levy 1 Amount of Levy Years Amount of Levy
2011 $ 456,029,699 $ 67,556,570 $ 504,769,073 96.4 $ 15,200,927 519,970,000 99.3 %2012 443,160,075 79,426,777 501,282,299 95.9 15,894,160 517,176,459 99.0 2013 457,287,081 79,331,585 516,542,429 96.3 16,354,153 532,896,582 99.3 2014 446,015,531 81,020,900 509,339,982 96.6 16,067,605 525,407,587 99.7 2015 463,184,807 95,236,086 537,056,367 96.2 18,155,104 555,211,471 99.4 2016 510,528,757 102,577,135 589,411,524 96.1 18,210,834 607,622,358 99.1 2017 528,410,384 106,583,082 609,085,906 95.9 19,983,532 629,069,438 99.1 2018 551,883,966 110,388,668 636,789,707 96.2 20,206,339 656,996,046 99.2 2019 570,105,091 117,968,242 638,348,095 92.8 17,972,254 656,320,349 95.4 2020 596,677,843 125,943,586 631,762,062 87.4 - 631,762,062 87.4
Source: Comissioner of Revenue, Real Estate Assessor's Office and City Department of Finance
Note: Collections in subsequent years represents delinquent accounts collected during the course of the fiscal year for all prior fiscalyears.
1 Includes Public Service.
266

Tab
le 1
0 C
ITY
OF
VIR
GIN
IA B
EA
CH
, VIR
GIN
IAR
AT
IOS
OF
OU
TST
AN
DIN
G D
EB
T B
Y T
YPE
Las
t Ten
Fis
cal Y
ears
(Una
udite
d)
Gov
ernm
enta
l Act
iviti
esB
usin
ess T
ype
Act
iviti
esR
atio
of N
etSt
ate
Publ
icO
blig
atio
nsN
etD
ebt P
er C
apita
Gen
eral
Lite
rary
Faci
lity
Und
erC
ertif
icat
esW
illia
ms
Agr
icul
ture
Vir
gini
a B
each
Gen
eral
T
otal
D
ebt
to P
er C
apita
Fisc
alO
blig
atio
nFu
ndR
even
ueC
apita
l of
Farm
Res
erve
Dev
elop
men
t O
blig
atio
nR
even
ue P
rim
ary
Per
Per
sona
lY
ear
Bon
dsL
oans
2B
onds
Lea
ses
Part
icip
atio
nPr
oper
tyPr
ogra
mA
utho
rity
3B
onds
Bon
dsG
over
nmen
t 4C
apita
5In
com
e 6
2011
$ 6
68,5
52,0
06
$ 5
,507
,046
$
242
,545
,000
$
- $
- $
1,0
62,5
00
$ 3
8,36
5,51
2 $
79,
760,
000
$ 9
62,4
70
$ 2
06,6
13,6
29
$ 1
,243
,368
,163
$
2,2
71
4.9%
2012
1 7
27,2
74,5
97
4,7
50,0
00
281
,315
,118
-
- 6
37,5
00
38,
799,
844
81,
434,
386
528
,450
2
03,1
08,7
52
1,3
37,8
48,6
47
2,2
44
4.6%
2013
1 6
86,5
44,3
46
4,1
25,0
00
283
,928
,041
-
- 2
12,5
00
41,
193,
588
77,
990,
571
222
,016
1
94,5
36,0
62
1,2
88,7
52,1
24
2,1
62
4.5%
2014
1 7
20,1
18,5
15
3,5
00,0
00
290
,013
,866
-
- -
41,
464,
092
93,
124,
312
- 2
32,7
74,2
17
1,3
80,9
95,0
02
2,2
56
4.4%
2015
1 7
16,6
12,3
42
2,8
75,0
00
320
,169
,585
-
- -
41,
808,
934
85,
183,
901
- 2
46,7
92,3
83
1,4
13,4
42,1
45
2,2
58
4.3%
2016
1 7
21,3
10,4
01
2,2
50,0
00
294
,372
,839
-
- -
42,
374,
198
78,
760,
588
- 2
83,5
55,4
87
1,4
22,6
23,5
13
2,1
95
4.1%
2017
1 6
55,8
54,9
25
1,8
75,0
00
288
,582
,663
-
- -
46,
102,
662
71,
945,
485
- 2
72,7
59,2
01
1,3
37,1
19,9
36
2,0
40
3.6%
2018
1 6
64,5
58,8
68
1,5
00,0
00
292
,789
,906
-
- -
46,
102,
662
67,
524,
535
- 2
60,9
14,8
96
1,3
33,3
90,8
67
2,0
56
3.5%
2019
1 6
00,6
63,0
13
1,1
25,0
00
261
,569
,221
-
- -
47,
710,
144
60,
053,
224
- 2
79,6
91,8
51
1,2
50,8
12,4
53
1,8
56
3.1%
2020
1 6
49,9
74,1
13
750
,000
4
15,5
34,7
11
- -
- 4
8,74
6,27
6 5
1,97
5,68
1 -
266
,123
,853
1
,433
,104
,634
2
,199
3.
7%
Sour
ce:
City
Dep
artm
ent o
f Fin
ance
Not
es:
1Fi
scal
Yea
rs 2
012-
2020
hav
e be
en a
djus
ted
to re
flect
the
rela
ted
unam
ortiz
ed p
rem
ium
s and
disc
ount
s. D
etai
led
prem
ium
info
rmat
ion
for p
rior y
ears
was
una
vaila
ble
and
ther
efor
e no
t adj
uste
d.
2Th
e St
ate
Lite
rary
Fun
d Lo
an p
rogr
am is
par
t of t
he V
irgin
ia P
ublic
Sch
ool A
utho
rity
(VPS
A) p
oole
d bo
nd p
rogr
am a
nd is
not
a lo
an. I
t is G
ener
al O
blig
atio
n de
bt fo
r the
City
.
3In
clud
es b
alan
ces o
f VBD
A N
ote
Paya
ble
secu
red
by a
sure
ty a
gree
men
t pro
vide
d by
Tow
n C
ente
r Ass
ocia
tes,
L.L.
C. f
or F
Y 2
013
and
FY 2
014.
Not
e w
as p
aid
off d
urin
g FY
201
5.
4To
tal P
rimar
y G
over
nmen
t Deb
t for
FY
201
1 ex
clud
es 1
998
Soci
al S
ervi
ces L
ease
Rev
enue
Bon
d, a
s it i
s Virg
inia
Bea
ch D
evel
opm
ent A
utho
rity
debt
serv
ice.
Thi
s rev
enue
bon
d w
as p
aid
off i
n FY
201
2.5
For c
alcu
latio
n of
Net
Deb
t Per
Cap
ita, t
he p
opul
atio
n is
per T
able
15.
FY
202
0 po
pula
tion
is a
proj
ectio
n by
the
City
. FY
201
9 re
-sta
ted
usin
g la
test
pop
ulat
ion
estim
ate
from
Uni
vers
ity o
f Virg
inia
/Wel
don
Coo
per C
ente
r for
Pub
lic S
ervi
ce. I
nad
ditio
n, N
et D
ebt P
er C
apita
exc
lude
s Rev
enue
Bon
ds, A
gric
ultu
re R
eser
ve, a
nd th
e pr
emiu
ms a
nd d
iscou
nts i
nclu
ded
in th
is ta
ble
pres
enta
tion.
6Fo
r cal
cula
tion
of D
ebt P
er C
apita
to P
er C
apita
Per
sona
l Inc
ome,
the
per C
apita
Per
sona
l Inc
ome
info
rmat
ion
thro
ugh
FY 2
020
is pe
r Tab
le 1
5. S
ince
dat
a fro
m th
e Bu
reau
of E
cono
mic
Ana
lysis
is n
ot y
et a
vaila
ble,
a p
roje
ctio
n of
$59
,805
isus
ed fo
r per
cap
ita p
erso
nal i
ncom
e fo
r FY
202
0, w
hich
is b
ased
on
the
actu
al fo
r FY
201
9.
FY 2
020
Prem
ium
det
ail a
nd re
conc
iliat
ion
to N
ote
6A1
& 6
A2:
Gov
ernm
enta
l Act
iviti
esSt
ate
Publ
icG
ener
alL
itera
ryFa
cilit
yA
gric
ultu
reT
otal
Tot
al T
otal
O
blig
atio
nFu
ndR
even
ueR
eser
veG
over
nmen
tal
Bus
ines
s P
rim
ary
Bon
dsL
oans
Bon
dsPr
ogra
mA
ctiv
ityA
ctiv
ityG
over
nmen
t (1)
Prin
cipa
l 5
80,2
33,9
33
750
,000
3
67,3
87,2
11
48,
746,
276
997
,117
,420
3
00,7
47,7
90
1,2
97,8
65,2
10
Prem
ium
69,
740,
180
- 4
7,11
8,93
5 -
116
,859
,115
1
8,38
0,30
9 1
35,2
39,4
24
Tota
l $
649
,974
,113
$
750
,000
$
414
,506
,146
$
48,
746,
276
$ 1
,113
,976
,535
$
319
,128
,099
$
1,4
33,1
04,6
34
Tax
Sup
porte
d D
ebt s
ubto
tal p
er 6
A1
$ 9
97,1
17,4
20
Pre
miu
ms p
er 6
A1
116
,859
,115
S
elf/T
ax S
uppo
rted
Deb
t sub
tota
l per
6A
2 3
00,7
47,7
90
Pre
miu
ms p
er 6
A2
18,
380,
309
Tot
al p
er n
ote
6A1
& 6
A2
$ 1
,433
,104
,634
267

Table 11 CITY OF VIRGINIA BEACH, VIRGINIA
RATIOS OF OUTSTANDING GENERAL BONDED DEBT BY TYPELast Ten Fiscal Years
(Unaudited)
State Percentage ofGeneral Literary Appropriation Estimated Actual Net
Fiscal Obligation Fund Backed Full Value of DebtYear Bonds 2 Loans 2 Debt 3 Total Property 4 Per Capita 5
2011 $ 669,514,476 $ 5,507,046 $ 323,367,500 $ 998,389,022 1.8 $ 2,271 2012 1 727,803,047 4,750,000 363,387,004 1,095,940,051 2.0 2,244 2013 1 686,766,362 4,125,000 362,131,112 1,053,022,474 1.9 2,162 2014 1 720,118,515 3,500,000 383,138,178 1,106,756,693 2.0 2,256 2015 1 716,612,342 2,875,000 405,353,486 1,124,840,828 2.0 2,258 2016 1 721,310,401 2,250,000 373,133,427 1,096,693,828 1.9 2,195 2017 1 655,854,925 1,875,000 360,528,148 1,018,258,073 1.7 2,040 2018 1 664,558,868 1,500,000 360,314,441 1,026,373,309 1.7 2,056 2019 1 600,663,013 1,125,000 321,622,445 923,410,458 1.4 1,856 2020 1 649,974,113 750,000 467,510,392 1,118,234,505 1.7 2,199
1 Fiscal Years 2012-2020 have been adjusted to reflect the related unamortized premiums and discounts. Detailedpremium information for prior years was unavailable and therefore not adjusted.
2 Per Table 10. The State Literary Fund Loan program is part of the Virginia Public School Authority (VPSA)pooled bond program and is not a loan. It is General Obligation debt for the City.
3 Includes all Governmental Public Facility Revenue Bonds, Capital Leases, COP's, Williams Farm Loan, andBusiness Type Virginia Beach Development Authority Debt as per Table 10.
4 Actual Full Value of property is from Table 6.5 Population is from Table 15. Computation of Net Debt Per Capita is net of premiums and discounts in the above
numbers.
268

Tab
le 1
2 C
ITY
OF
VIR
GIN
IA B
EA
CH
, VIR
GIN
IAL
EG
AL
DE
BT
MA
RG
IN IN
FOR
MA
TIO
NL
ast T
en F
isca
l Yea
rs(U
naud
ited)
2011
2012
2013
2014
2015
2016
2017
2018
2019
2020
Deb
t Lim
it $
5,2
90,2
91,1
19
$ 5
,144
,671
,623
$
4,9
78,1
83,7
83
$ 4
,962
,666
,499
$
5,1
45,2
77,5
75
$ 5
,291
,185
,445
$
5,4
78,3
60,9
85
$ 5
,650
,206
,962
$
5,8
31,7
03,7
50
$ 6
,039
,301
,442
Tota
l Net
Deb
t app
licab
le to
lim
it 1
713
,387
,034
7
16,1
77,1
98
685
,988
,698
7
12,3
84,3
23
697
,079
,775
6
97,5
20,7
21
641
,749
,326
6
46,0
61,1
32
590
,409
,579
6
29,7
30,2
09
Lega
l Deb
t Mar
gin
$ 4
,576
,904
,085
$
4,4
28,4
94,4
25
$ 4
,292
,195
,085
$
4,2
50,2
82,1
76
$ 4
,448
,197
,800
$
4,5
93,6
64,7
24
$ 4
,836
,611
,659
$
5,0
04,1
45,8
30
$ 5
,241
,294
,171
$
5,4
09,5
71,2
33
Tota
l Net
Deb
t app
licab
le to
the
li
mit
as a
per
cent
age
of d
ebt l
imit
13.4
8%13
.92%
13.7
8%14
.35%
13.5
5%13
.18%
11.7
1%11
.43%
10.1
2%10
.43%
Leg
al D
ebt M
argi
n C
alcu
latio
n Fo
r Fi
scal
Yea
r 20
19A
sses
sed
Val
ue o
f Rea
l Pro
perty
(Tax
able
)2 :
Reg
ular
$ 5
9,34
9,41
9,53
5
Pub
lic S
ervi
ce (e
xclu
ding
veh
icle
ass
essm
ents
) 1
,043
,594
,888
T
otal
Ass
esse
d V
alue
of R
eal P
rope
rty 6
0,39
3,01
4,42
3
Deb
t lim
it (1
0% o
f Tot
al A
sses
sed
Val
ue)
6,0
39,3
01,4
42
Tota
l Net
Deb
t app
licab
le to
lim
it 6
29,7
30,2
09
L
egal
Deb
t Mar
gin
$ 5
,409
,571
,233
Not
es:
1To
tal n
et d
ebt a
pplic
able
to th
e lim
it is
tax-
supp
orte
d de
bt, w
hich
incl
udes
Gen
eral
Obl
igat
ion
Bon
ds, S
tate
Lite
rary
Fun
d de
bt fo
r Pub
lic S
choo
ls, a
nd A
gric
ultu
ral R
eser
ve P
rogr
am in
stal
lmen
tpu
rcha
se a
gree
men
ts. U
nder
Sta
te la
w, t
he C
ity's
outs
tand
ing
gene
ral o
blig
atio
n de
bt sh
ould
not
exc
eed
10%
of t
otal
ass
esse
d pr
oper
ty v
alue
. In
add
ition
, the
City
has
est
ablis
hed
finan
cial
affo
rdab
ility
in
dica
tors
to re
stric
t deb
t as f
ollo
ws:
●Th
e to
tal a
nnua
l deb
t ser
vice
for g
ener
al g
over
nmen
t sup
porte
d de
bt w
ill n
ot e
xcee
d 10
% o
f gen
eral
gov
ernm
ent e
xpen
ditu
res (
excl
udin
g in
terf
und
trans
fers
).●
The
City
's ov
eral
l net
deb
t will
not
exc
eed
3.5%
of t
he e
stim
ated
full
valu
e of
taxa
ble
real
pro
perty
.●
The
City
's ov
eral
l net
deb
t per
cap
ita w
ill n
ot e
xcee
d $3
,000
.●
The
City
's ov
eral
l net
deb
t per
cap
ita sh
all n
ot e
xcee
d 6.
5% o
f per
cap
ita p
erso
nal i
ncom
e.
2A
sses
sed
valu
e of
real
pro
perty
bas
ed o
n da
ta fr
om T
able
6; t
he a
sses
sed
valu
e is
bas
ed o
n Ju
ne 3
0th
of e
ach
fisca
l yea
r inc
ludi
ng su
pple
men
ts a
nd e
xone
ratio
ns.
Sour
ces:
The
follo
win
g so
urce
s wer
e us
ed in
com
pilin
g th
e ab
ove
info
rmat
ion:
City
Dep
artm
ent o
f Fin
ance
Virg
inia
Sta
te C
orpo
ratio
n C
omm
issi
on, P
ublic
Ser
vice
Cor
pora
tions
Rep
ort R
eal a
nd P
erso
nal P
rope
rty A
sses
smen
t
269

Table 13 CITY OF VIRGINIA BEACH, VIRGINIA
PLEDGED-REVENUE COVERAGELast Ten Fiscal Years
(Unaudited)
Water and Sewer Revenue BondsWater
and Sewer Less: Net Fiscal Charges Operating Available Debt ServiceYear and Other Expenses 1 Revenue Principal Interest 2 Total Coverage
2011 $ 102,819,740 $ 74,439,073 $ 28,380,667 $ 5,811,090 $ 6,382,454 $ 12,193,544 2.33 2012 109,514,875 72,319,602 37,195,273 7,022,735 6,959,920 13,982,655 2.66 2013 115,249,243 73,834,321 41,414,922 7,251,071 6,697,692 13,948,763 2.97 2014 121,766,102 72,145,813 49,620,289 7,796,175 7,231,505 15,027,680 3.30 2015 127,007,164 75,396,537 51,610,627 9,083,131 8,091,897 17,175,028 3.00 2016 128,045,227 73,930,294 54,114,933 9,371,805 8,202,712 17,574,517 3.08 2017 130,403,502 72,814,216 57,589,286 7,812,706 7,808,592 15,621,298 3.69 2018 130,905,466 79,514,710 51,390,756 8,820,728 8,160,477 16,981,205 3.03 2019 130,015,725 80,883,044 49,132,681 9,215,276 7,791,849 17,007,125 2.89 2020 136,972,800 84,039,313 52,933,487 9,625,000 7,398,916 17,023,916 3.11
1 Operating expenses exclude depreciation and right of way utility cost, see Exhibit 21.2 Includes Bank Charges. Interest amounts shown for 2011-2020 are net of federal subsidy. As such, the coverage ratios shown on this table may be
different from the amounts shown on Continuing Disclosure Schedule 2-4 that are calculated based on gross interest.
Note: Water and Sewer Revenue Bonds are obligations of the City, payable solely from pledged revenues of the System (Water and Sewer Fund), subjectto the prior application thereof to the payment of Operating Expenses. The City will fix, charge, collect and revise its fees, rates and other chargesfor the use of and for the services furnished by the system so as to produce revenues sufficient to meet its cash requirements each fiscal year.
Coverage: The Master Water and Sewer Revenue Bond Resolution, Section 601, dated February 11, 1992, as amended and supplemented, states that the Cityshall fix, charge and collect such rates, fees, and other charges for the use of and for the services furnished by the system and and collect such rates,fees, and other charges for the use of and for the services furnished by the system and shall from time to time and as often as shall appear necessary,revise such rates, fees and other charges so as to meet two independent requirements.
Source: City Department of Finance
270

Table 14 CITY OF VIRGINIA BEACH, VIRGINIA
PLEDGED-REVENUE COVERAGELast Ten Fiscal Years
(Unaudited)
Storm Water Utility Revenue Bonds
Storm Water Less: Net Fiscal Charges Operating Available Debt ServiceYear and Other 1 Expenses Revenue Principal Interest 2 Total Coverage 3
2011 $ 23,891,004 $ 11,234,614 $ 12,656,390 $ 761,468 $ 813,283 $ 1,574,751 8.04 2012 27,892,419 13,311,162 14,581,257 1,404,020 1,097,204 2,501,224 5.83 2013 32,954,179 14,317,957 18,636,222 1,296,433 1,058,805 2,355,238 7.91 2014 37,150,524 15,366,723 21,783,801 1,232,016 1,026,704 2,258,720 9.64 2015 39,294,658 17,489,866 21,804,792 1,030,000 1,228,238 2,258,238 9.66 2016 39,648,163 18,385,165 21,262,998 1,660,000 1,733,570 3,393,570 6.27 2017 40,471,105 26,074,915 14,396,190 1,700,000 1,692,383 3,392,383 4.24 2018 42,158,382 26,051,322 16,107,060 1,740,000 1,647,563 3,387,563 4.75 2019 43,419,299 29,702,205 4 13,717,094 1,795,000 1,745,480 3,540,480 3.87 2020 45,816,512 23,692,462 4 22,124,050 2,525,000 2,402,590 4,927,590 4.49
1 Storm Water Charges and Other include interest income, see Exhibit 24.2 Interest amounts shown for 2011-2018 are at gross. Beginning in FY 2019, interest shown net of federal subsidy and includes bank charges and
issuance costs.3 Revenue coverage ratios for debt service shown on this table may differ from amounts shown on the Continuing Disclosure Schedule 3-4 due to
differences in the basis for the calculations regarding operating expenses and debt service. The calculation shown in this table reflects annualgross debt service, whereas the calculation in Schedule 3-4 reflects maximum annual debt service per bond issue.
4 Beginning in FY 2019, operating expenses are based on Exhibit 26, which include annual Capital Improvement Program (CIP) expenditures.Operating expenses for prior fiscal years excluded annual CIP expenditures based on terms set forth in the Master Agreement of Trust.
Note: Storm Water Revenue Bonds are obligations of the City, payable solely from pledged revenues of the System (Storm Water Fund), subject to theprior application thereof to the payment of Operating Expenses. The City will fix, charge, collect and revise its fees, rates and other charges forthe use of and for the services furnished by the system so as to produce revenues sufficient to meet its cash requirements each fiscal year.
Source: City Department of Finance
271

Table 15 CITY OF VIRGINIA BEACH, VIRGINIA
DEMOGRAPHIC AND ECONOMIC STATISTICSLAST TEN FISCAL YEARS
(UNAUDITED)
EducationLevel In
Per Capita Number Years ofFiscal Personal Personal Median of City Formal School UnemploymentYear Population* Income**Ɨ Income** Age Employees Schooling Enrollment Rate
2011 441,246 20,612,666 46,574 34.9 7,481 14.0 69,219 6.0%2012 447,489 21,677,217 48,708 34.7 7,477 13.8 68,977 5.5%2013 449,628 21,616,863 48,284 35.0 7,477 13.9 68,614 5.6%2014 451,672 22,768,499 50,725 35.7 7,669 13.9 68,569 5.5%2015 453,500 23,857,409 52,981 35.9 7,560 14.0 68,351 4.4%2016 453,628 24,286,519 53,852 35.9 7,370 13.9 67,890 3.8%2017 454,448 25,213,295 56,042 36.4 7,087 13.9 67,152 3.8%2018 453,410 26,092,866 58,004 36.4 7,255 13.9 67,091 2.8%2019 452,643 26,910,910 59,805 36.4 7,332 13.9 66,593 2.7%2020 454,209 *** *** 36.9 7,410 14.0 66,714 8.2%
Sources: City Department of FinanceCity Department of Economic DevelopmentWeldon Cooper Center for Public ServiceVirginia Employment CommissionBureau of Economic AnalysisUnited States Census Bureau
Notes: * Weldon Cooper Center for Public Service; except for 2020 which is a projection.** Figures were updated to reflect the latest data released by the Bureau of Economic Analysis on November 17, 2020.
*** Information UnavailableƗ In thousands of dollars
272

Table 16CITY OF VIRGINIA BEACH, VIRGINIA
PRINCIPAL EMPLOYERSCURRENT YEAR AND NINE YEARS AGO
(UNAUDITED)
Approximate Percent of Approximate Percent ofNumber of Total City Number of Total CityEmployees Employment Rank Employees Employment Rank
2020 2011
City of Virginia Beach / Schools 17,899 7.71 1 18,114 8.52 1 * Naval Air Station Oceana-Dam Neck 5,850 2.52 2 - - -
Sentara Healthcare 5,200 2.24 3 4,600 2.16 2 * Joint Expeditionary Base Little Creek/ Ft. Story 3,600 1.55 4 - - -
GEICO General Insurance Company 2,700 1.16 5 2,300 1.08 4 * Lynnhaven Mall 2,600 1.12 6 - - -
Gold Key/PHR Hotels and Resorts 2,365 1.02 7 1,943 0.91 7 STIHL Inc 2,113 0.91 8 2,000 0.94 5 Amerigroup (Anthem) 1,850 0.80 9 1,850 0.87 8 Navy Exchange Service Command 1,550 0.67 10 2,000 0.94 6 SAIC - - - 2,500 1.18 3 Christian Broadcasting Network, Inc. - - - 1,000 0.47 9 LifeNet Health - - - 500 0.24 10 Totals 45,727 19.70 36,807 17.31
Sources: City Department of Economic Development City Department of Finance City Department of Budget and Management Services
* Information not available for 2011.
273

Tab
le 1
7 C
ITY
OF
VIR
GIN
IA B
EA
CH
, VIR
GIN
IAFU
LL
-TIM
E E
QU
IVA
LE
NT
GO
VE
RN
ME
NT
EM
PLO
YE
ES
BY
FU
NC
TIO
NL
AST
TE
N F
ISC
AL
YE
AR
S(U
NA
UD
ITE
D)
2011
2012
2013
2014
2015
2016
2017
2018
2019
2020
Dep
artm
ent
A
gric
ultu
re 1
2.0
12.
0 1
2.0
12.
0 1
2.0
12.
0 1
2.0
12.
5 9
.0
9.0
Bud
get a
nd M
anag
emen
t Ser
vice
s 1
5.0
15.
0 1
5.0
14.
0 1
5.0
15.
0 1
4.0
14.
0 1
4.0
14.
0
City
Atto
rney
40.
4 3
9.0
39.
6 3
9.6
39.
6 3
9.6
40.
6 4
2.6
42.
6 4
3.6
C
ity A
udito
r 6
.0
6.0
6
.0
6.0
6
.0
7.0
7
.0
7.0
8
.0
8.0
City
Man
ager
's O
ffic
e 2
3.0
21.
0 1
9.5
19.
5 2
0.5
34.
0 3
3.0
16.
5 2
0.0
19.
0
City
Rea
l Est
ate
Ass
esso
r 3
4.3
34.
0 3
4.3
34.
3 3
4.3
34.
3 3
4.0
34.
0 3
4.0
35.
0
City
Tre
asur
er 7
2.2
72.
0 7
1.8
75.
8 7
6.8
74.
6 7
4.6
74.
6 7
4.6
77.
6
Com
mis
sion
er o
f the
Rev
enue
57.
9 6
0.9
62.
9 6
3.9
64.
9 6
4.9
64.
9 6
5.5
64.
9 6
4.9
C
omm
onw
ealth
's A
ttorn
ey 8
7.4
84.
0 8
5.3
86.
3 8
6.7
87.
4 9
4.9
94.
8 9
7.8
103
.8
C
omm
unic
atio
ns O
ffice
1 -
- -
- -
- -
18.
5 2
0.5
20.
5
Con
vent
ion
and
Vis
itor B
urea
u 1
13.5
1
13.5
1
13.5
1
10.5
1
06.7
1
06.3
1
20.3
1
20.3
1
20.3
1
20.3
Cou
rts a
nd C
ourts
' Sup
port
76.
0 7
5.0
75.
0 7
5.0
75.
0 7
5.0
75.
0 7
5.0
75.
0 7
4.0
C
ultu
ral A
ffai
rs 3
.0
3.0
3
.0
3.0
3
.0
3.0
3
.0
3.0
4
.0
4.0
Dep
artm
ent o
f Aqu
ariu
m a
nd M
useu
ms
151
.5
153
.0
155
.5
155
.9
161
.0
164
.5
156
.8
153
.6
151
.2
131
.0
Ec
onom
ic D
evel
opm
ent
15.
0 1
6.0
18.
0 1
8.0
18.
0 1
8.0
18.
0 1
9.0
20.
0 2
1.0
Em
erge
ncy
Com
mun
icat
ions
& C
itize
n Se
rvic
es 1
22.0
1
23.5
1
22.8
1
27.8
1
31.8
1
31.8
1
30.8
1
37.8
1
37.8
1
35.8
Emer
genc
y M
edic
al S
ervi
ces
62.
6 6
5.3
65.
3 6
9.3
73.
3 7
5.1
80.
1 8
7.6
89.
6 9
5.6
Fi
nanc
e 5
4.0
55.
0 5
6.0
57.
0 5
7.0
57.
0 5
7.0
59.
0 5
9.0
62.
0
Fire
466
.7
466
.0
479
.7
479
.7
485
.7
485
.7
501
.7
521
.7
523
.2
528
.2
H
ealth
10.
8 1
0.8
9.1
9
.1
9.1
9
.1
9.1
9
.0
9.1
7
.4
H
ousi
ng a
nd N
eigh
borh
ood
Pres
erva
tion
67.
0 6
6.0
64.
0 6
3.0
62.
0 6
1.0
64.
0 7
9.0
80.
0 8
0.0
H
uman
Res
ourc
es 4
7.0
47.
0 4
7.0
47.
0 4
7.0
47.
0 4
7.0
49.
0 5
0.0
57.
0
Hum
an S
ervi
ces
1,0
45.7
1
,066
.4
1,0
69.4
1
,081
.4
1,1
15.2
1
,094
.9
1,0
99.0
1
,148
.7
1,1
77.7
1
,188
.7
In
form
atio
n Te
chno
logy
179
.8
183
.0
178
.5
180
.5
183
.5
168
.0
175
.0
184
.0
193
.0
252
.5
Le
gisla
tive
2 1
7.0
17.
0 1
7.0
17.
0 1
7.0
17.
0 1
7.0
17.
0 1
7.0
17.
0
Libr
ary
227
.5
227
.5
265
.5
260
.0
255
.0
253
.5
251
.5
251
.5
253
.0
252
.5
O
ffic
e of
Em
erge
ncy
Man
agem
ent
- -
- -
- -
4.0
5
.0
6.0
8
.0
Pa
rks a
nd R
ecre
atio
n 8
55.4
8
43.4
8
46.9
8
43.9
8
38.1
8
30.1
8
82.3
8
86.2
8
86.5
8
70.1
Plan
ning
113
.0
110
.0
108
.0
109
.0
116
.0
115
.5
133
.0
134
.0
137
.0
141
.0
Po
lice
995
.7
1,0
07.4
1
,007
.4
1,0
09.4
1
,015
.8
1,0
15.8
1
,028
.8
1,0
40.8
1
,048
.5
1,0
48.5
Publ
ic U
tiliti
es 4
04.5
4
12.0
4
11.0
4
12.0
4
15.0
4
18.0
4
14.0
4
17.0
4
15.0
4
15.0
Publ
ic W
orks
866
.4
882
.0
890
.4
890
.4
893
.9
902
.9
902
.9
925
.9
938
.9
950
.9
Sh
eriff
's O
ffic
e 5
24.4
5
19.6
5
24.4
5
25.4
5
25.4
5
14.4
5
26.4
5
32.8
5
36.8
5
35.8
Stra
tegi
c G
row
th A
reas
3 1
5.0
15.
0 1
7.0
17.
0 1
8.0
20.
0 -
- -
-
Stra
tegy
, Tra
nspa
renc
y, In
nova
tion
& R
esili
ency
Offi
ce -
- -
- -
- 4
.0
6.0
6
.0
6.0
Vot
er R
egis
tratio
n &
Ele
ctio
ns
12.
0 1
2.0
12.
0 1
2.0
11.
9 1
1.9
12.
0 1
2.0
12.
0 1
2.0
Tota
l City
Pos
ition
s 6
,793
.7
6,8
33.3
6
,902
.8
6,9
24.7
6
,990
.2
6,9
64.3
7
,087
.7
7,2
54.9
7
,331
.9
7,4
09.7
To
tal S
choo
l Pos
ition
s 1
0,47
6.3
10,
387.
3 1
0,32
6.5
10,
190.
9 1
0,22
0.0
10,
034.
3 1
0,15
4.8
10,
207.
8 1
0,33
3.4
10,
549.
0
TOTA
L PO
SITI
ON
S 1
7,27
0.0
17,
220.
6 1
7,22
9.3
17,
115.
6 1
7,21
0.2
16,
998.
6 1
7,24
2.5
17,
462.
7 1
7,66
5.3
17,
958.
7
Sour
ce:
City
of V
irgin
ia B
each
Res
ourc
e M
anag
emen
t Pla
ns
1 Com
mun
icat
ions
Offi
ce w
as p
revi
ousl
y re
porte
d as
par
t of t
he C
ity M
anag
er's
Off
ice.
2 City
Cle
rk a
nd C
ounc
il ar
e re
porte
d in
Leg
isla
tive.
3 Stra
tegi
c G
row
th A
rea
was
con
solid
ated
with
Pla
nnin
g in
201
7.
274

Tab
le 1
8 C
ITY
OF
VIR
GIN
IA B
EA
CH
, VIR
GIN
IAO
PER
AT
ING
IND
ICA
TO
RS
BY
FU
NC
TIO
NL
AST
TE
N F
ISC
AL
YE
AR
S (U
NA
UD
ITE
D)
2011
2012
2013
2014
2015
2016
2017
2018
2019
2020
FUN
CT
ION
Po
lice
Num
ber o
f phy
sica
l adu
lt ar
rest
s 2
3,92
3 2
3,70
5 2
3,63
3 2
2,22
4 2
1,69
8 1
9,04
2 1
7,93
3 1
8,30
7 1
6,97
1 1
7,41
5
N
umbe
r of c
alls
for s
ervi
ce 1
96,6
26
195
,156
1
87,8
84
179
,974
1
76,4
74
173
,451
1
78,9
29
173
,602
1
67,5
98
163
,134
N
umbe
r of t
raff
ic a
ccid
ents
8,3
91
8,1
02
8,1
69
8,1
38
7,9
13
8,3
68
8,8
13
8,2
90
7,9
16
7,6
37
Fi
re
N
umbe
r of s
truct
ure
fire
inci
dent
s 4
53
474
4
30
410
3
96
463
3
98
398
4
06
389
N
umbe
r of n
on-s
truct
ure
fire
inci
dent
s 7
99
714
5
35
614
5
46
543
5
42
543
3
79
449
N
umbe
r of m
edic
al a
ssis
ted
inci
dent
s 1
7,93
0 2
0,72
7 2
5,65
6 2
6,09
9 2
6,95
2 2
7,78
6 2
7,85
4 2
7,25
7 2
7,14
1 2
2,98
9
N
umbe
r of o
ther
inci
dent
s 1
1,48
8 1
3,16
6 1
3,30
7 1
3,37
9 1
3,67
9 1
6,30
9 1
7,03
1 1
4,59
7 1
3,68
8 1
4,55
2
Pu
blic
Util
ities
Num
ber o
f wat
er c
onne
ctio
ns 1
31,8
97
132
,010
1
32,3
24
132
,615
1
32,9
40
133
,411
1
33,7
77
134
,076
1
37,3
75
134
,665
N
umbe
r of s
ewer
con
nect
ions
129
,584
1
29,1
50
129
,417
1
29,6
39
129
,908
1
30,5
99
130
,926
1
31,1
86
131
,464
1
31,7
47
Pl
anni
ng a
nd C
omm
unity
Dev
elop
men
t
N
umbe
r of b
uild
ing
perm
its is
sued
7,6
36
8,0
03
7,9
56
7,6
07
8,1
92
8,3
49
8,4
50
10,
461
6,2
22
3,4
29
Stor
m W
ater
Num
ber o
f sto
rm w
ater
con
nect
ions
***
***
***
***
***
***
***
***
118
,580
Was
te M
anag
emen
t
N
umbe
r of h
omes
rece
ivin
g re
fuse
col
lect
ion
124
,179
1
24,1
71
124
,536
1
24,6
34
122
,041
1
22,2
82
122
,369
1
22,6
22
122
,942
1
23,2
94
Num
ber o
f ton
s of g
arba
ge c
olle
cted
147
,760
1
37,4
13
133
,958
1
30,2
45
208
,917
2
11,0
04
180
,757
1
71,3
15
178
,590
1
87,4
16
Publ
ic L
ibra
ries
Num
ber o
f ite
ms c
ircul
ated
3,6
36,4
16
3,6
14,3
78
3,5
73,6
63
3,2
69,5
63
3,0
76,5
75
2,7
77,9
54
2,5
57,1
04
2,4
78,6
87
2,4
82,4
08
1,9
32,7
01
Num
ber o
f vis
its to
libr
arie
s 2
,536
,191
1
,741
,936
1
,624
,940
1
,784
,513
1
,808
,352
1
,916
,430
1
,672
,127
1
,431
,773
1
,270
,459
8
63,2
06
C
ultu
re a
nd R
ecre
atio
n
N
umbe
r of v
isits
to re
crea
tion
cent
ers
1,5
38,6
16
1,6
14,6
82
1,7
95,7
82
1,8
71,3
12
1,8
96,6
15
2,0
04,3
01
1,9
05,7
63
2,5
98,4
93
1,7
79,1
07
1,2
44,0
91
Num
ber o
f rec
reat
ion
cent
ers
6
7
7
7
7
7
7
7
7
7
Ed
ucat
ion
Stud
ent m
embe
rshi
p 6
9,21
9 6
8,97
7 6
8,61
4 6
8,56
9 6
8,35
1 6
7,89
0 6
7,15
2 6
7,09
1 6
6,59
3 6
6,71
4
N
umbe
r of e
lem
enta
ry sc
hool
s 5
5 5
5 5
5 5
5 5
5 5
5 5
5 5
5 5
5 5
5
N
umbe
r of s
econ
dary
scho
ols
24
24
24
24
24
25
25
25
25
25
Num
ber o
f spe
cial
ty sc
hool
s 7
7
9
8
8
8
7
7
7
7
Sour
ces:
Var
ious
City
Dep
artm
ents
***
Info
rmat
ion
not a
vaila
ble.
275

Table 19 CITY OF VIRGINIA BEACH, VIRGINIA
CAPITAL ASSET STATISTICS BY FUNCTIONLAST TEN FISCAL YEARS
(UNAUDITED)
2011 2012 2013 2014 2015 2016 2017 2018 2019 2020FUNCTION Police Stations 4 4 4 4 4 4 4 4 4 4 Patrol Vehicles Units - Marked 242 269 262 262 246 230 206 227 222 222 Helicopter 2 2 2 2 2 2 2 2 2 2 Watercraft: Boats 8 8 8 6 8 9 8 9 9 9
Fire Stations 19 19 19 19 19 19 19 20 20 20 Fire Trucks 50 46 45 45 45 47 49 52 57 60
Public Works Miles of streets: Lane miles: Arterial 739 738 744 744 745 750 712 717 717 722 Collector/Local 2,676 2,676 2,680 2,686 2,714 2,726 2,701 2,704 2,705 2,710 Center Lane miles: Arterial 192 192 192 192 193 193 173 174 174 174 Collector/Local 1,307 1,308 1,312 1,312 1,326 1,330 1,322 1,324 1,324 1,327 Number of Street Lights 46,806 48,277 48,418 48,747 48,788 49,118 49,285 49,342 49,335 49,335 Collection Trucks 101 109 100 100 100 103 99 84 84 84
Public Library . Number of Branches 10 10 10 10 10 10 10 10 10 10 Number of Physical Items 877,015 910,470 866,255 858,784 757,209 717,734 678,122 683,371 587,946 525,265 Number of Electronic Items *** *** *** *** *** *** *** *** 720,473 889,374
Culture and Recreation Number of Developed District Parks 8 8 8 8 8 8 8 8 8 8 Number of Developed Community Parks 13 13 11 11 11 13 13 13 13 11 Number of Developed Neighborhood Parks 180 181 182 179 179 169 167 167 167 167 Number of Natural Parks 3 5 5 5 5 5 5 5 5 6 Other Park Areas 45 46 47 48 48 48 48 48 50 83 Number of Acres in Developed Parks 3,174 3,648 3,648 3,649 3,661 3,664 3,685 3,685 3,927 3,676 Golf Courses (City Owned) 5 5 5 5 5 5 5 5 5 5 Recreation Centers 6 7 7 7 7 7 7 7 7 7
Water Miles of Water Lines 1,488 1,490 1,492 1,496 1,499 1,499 1,501 1,503 1,505 1,504 Water Pumping Stations 9 9 9 9 10 10 10 10 10 11
Sewer Miles of Sewer Lines 1,630 1,635 1,639 1,646 1,653 1,646 1,646 1,648 1,649 1,648 Sewer Pumping Stations 406 405 406 407 408 408 408 410 412 412
Storm Water* Miles of Pipe Lines *** *** *** *** *** *** *** 1,109 1,156 1,165 Miles of Ditches *** *** *** *** *** *** *** 717 657 755 Storm Water Pumping Stations *** *** *** *** *** *** *** 16 16 16
Source: Various City Departments *** Information not available.
Note: Ambulances are not included in the above information as they are privately owned by the Volunteer Rescue Squads.
276

CITY OF VIRGINIA BEACH, VIRGINIA Table 20 SCHEDULE OF THE TREASURER'S CASH ACCOUNTABILITY
JUNE 30, 2020(UNAUDITED)
Cash in Office $ 6,100
Cash With Bank of America: Regular 166,541,346 Investments 8,000,000 Welfare 596,958 School Board Empl Salary Escrow 197,976 BB&T: Collateralized Deposit Program 10,000,000 School Payroll 6,009,196 BB&T Capital Markets: Investments 39,764,390 Raymond James Investments 128,330,480 RBC: Investments 25,900,033 SunTrust Bank: City Payroll 19,552,119 Towne Bank: Investments 55,000,000 Treasurer of Virginia: Investment Pool 292,000,000 Union Bank: Investment 10,248,934 VML/VACO: Virginia Investment Pool 11,071,845 Virginia Investment Pool - Liquidity Pool 288,654,264 Total Deposits and Investments 1,061,867,541
Cash with Trust Agents Cash With SNAP Program 112,755,946 Cash With Trustee - Debt Service 9,623,520 Cash With Trustee - Treasury Strips 44,340,007 Total Cash with Trust Agents 166,719,473
Total Cash Accountability 1,228,593,114 Add: Accrued Interest on Investments 2,503,009 Commonwealth of Virginia - Deferred Debits 6,497 Deposits in Transit 6,018,944
8,528,450 Deduct: Commonwealth of Virginia - Current Credits 264,645 Treasurer Restitution 46,632 Treasurer Court Costs & Fines (1,005) V. Leigh Henderson - Deferred Account 12,714 Over and Short 11,103 Outstanding Checks: Bank of America 11,098,822 Bank of America - Welfare 122,755 BB&T - School Payroll 7,920 SunTrust - City Payroll 102,121 (11,665,707)
Total Cash Accountability 1,225,455,857 Reconciliation of Cash Accountability to the government-wide financial statements at June 30, 2018 as reported in Note 8: Balance of City and School funds 1,225,455,857
Funds for which the Treasurer does not act as fiscal agent:School Cafeteria Funds 5,000 School Activity Funds 4,450,609 Development Authority 18,277,846 Other (785)
Total deposits and investments of the government-wide financial statements $ 1,248,188,527
277

This Page Intentionally Left Blank
278

CONTINUING DISCLOSURE


Continuing Disclosure
This part of the City of Virginia Beach comprehensive annual financial report presents detailed information with regards toRule 15c2-12 promulgated by the Securities and Exchange Commission to provide certain annual financial information andmaterial event notices.
Contents Page
General Obligation and Public Facility Revenue Bond Operating Data:…………………………………………….……300Schedule 1-1 Principal TaxpayersSchedule 1-2 Property Tax Rates and Changes in Tax LevySchedule 1-3 Historical Assessed ValueSchedule 1-4 Property Tax Levies and CollectionsSchedule 1-5 Principal Tax Revenue by Source
Water and Sewer Revenue Bond Operating Data:………………………………………………………………….………305Schedule 2-1 Ten Largest Utility (Water) CustomersSchedule 2-2 Outstanding Debt by IssueSchedule 2-3 History of Receipts and DisbursementsSchedule 2-4 System Operating Revenues, Expenses and CoverageSchedule 2-5 Debt Service RequirementsSchedule 2-6 Water and Sewer Rate History
Storm Water Revenue Bond Operating Data:……………………………………………………………………….………311Schedule 3-1 Ten Largest Storm Water Utility AccountsSchedule 3-2 Distribution by Type of PropertySchedule 3-3 Utility Fee CollectionsSchedule 3-4 Pro Forma Calculation of Revenue CovenantsSchedule 3-5 Debt Service RequirementsSchedule 3-6 Storm Water Rate History
Sources: Unless otherwise noted, the information in these schedules is derived from the comprehensive annual financial reports for the relevant year.
279

Schedule 1-1CITY OF VIRGINIA BEACH, VIRGINIA
PRINCIPAL TAXPAYERS*FISCAL YEAR ENDING JUNE 30, 2020
(UNAUDITED)
Real PropertyTaxpayer Business Type Assessed
1 Dominion Energy, Inc. Utility $ 645,615,537 2 Armada Hoffler Office/ Apartments/ Hotel/ Retail/ Restaurant/ College/Parking Garage/
Vacant Land/ Single Family Residence 532,344,000
3 Ramon W. Breeden, Jr. Apartments/ Shopping Center/ Fast-Food/ Restaurant/ Office/ VacantLand/ Single Family Residence
377,876,100
4 A.D. & L.E. Fleder & J.M. & R.J. Caplan Shopping Centers/ Retail/ Restaurant/ Apartments/ Condominiums/Vacant Land
334,168,300
5 E. C. & A. F. Ruffin & B. L. Thompson Hotel/ Apartments/ Shopping Center/ Retail/ Restaurant/ Office/Parking Garage/ Vacant Land/ Single Family Residences
286,455,900
6 Lynnhaven Mall LLC Shopping Mall 284,071,300
7 Pembroke Square Associates LLC Shopping Mall/ Retail/ Bank/ Restaurants/ Fast Food/ ShoppingCenters/ Office/ Apartments/ Condominium/ Warehouse/ Vacant Land
215,983,400
8 W. Taylor Franklin Apartments/ Single Family Residence 166,994,200
9 Cheryl P. McLeskey Shopping Centers/ Townhouses/ Condominiums/ Marina/ Retail/ CarDealership/ Vacant Land/ Single Family Residences & Lots
161,805,700
10 Virginia Natural Gas, Inc. Utility 159,335,485
11 Thomas J. Lyons, Jr. & Joan N. Hotel/Office/ Single Family Residence 143,556,700 12 Watergate Treehouse & Chanticleer Associates LP Apartments 138,683,400
13 Christian Broadcasting Associates, Inc./Network, Inc. Broadcasting/ Office/ Apartments/ Hotel 137,730,400 14 Verizon Virginia, LLC Utility 137,532,672
15 Shamin Hotels Hotel 126,619,100
16 Windsor Lake & Shoreline Apartments LLC. Apartments/ Shopping Center/ Restaurant/ Vacant Land 118,560,600
17 Potter Properties Shopping Center/ Banks/ Fast-Food/ Restaurant/ Retail/ Vacant Land/Single Family Residence
107,280,400
18 Sifen, Michael D. Shopping Centers/ Restaurant/ Retail/ Parking Garage/ Vacant Land/Single Family Residence
102,940,800
19 Westminster Canterbury of Hampton Roads, Inc. Retirement Center/ Condominiums/ Vacant Land 102,936,700
20 Wal Mart Real Estate Business Trust Retail Stores 92,347,100
21 Landstown Commons Owner LLC Shopping Center 86,481,100
22 Paul Van Apartments/ Single Family Residence 83,030,800
23 T.J. & A. Stiffler & M.B. & M.J. Stone Lewis Office/ Hotel/ Retail/ Shopping Center/ Single Family Residence 77,819,000
24 Occidental Development, Ltd. Apartments 72,799,000
25 CGC Sun Union Maple Bay LLC Apartments 68,648,700
Total $ 4,761,616,394
* Also see Statistical Table 8
Sources: Office of Real Estate Assessor Commissioner of the Revenue
280

Schedule 1-2CITY OF VIRGINIA BEACH, VIRGINIA
PROPERTY TAX RATES AND CHANGE IN TAX LEVYFISCAL YEARS 2010 THROUGH 2020
(UNAUDITED)
Tax Rate Real Percentage AnnualFiscal on Real Property Change inYear 1 Property 2 Tax Levy 3 Tax Levy
2010 $ 0.8900 $ 485,659,493 (2.43)2011 0.8900 456,029,699 (6.10)2012 0.8900 443,160,075 (2.82)2013 0.9500 457,057,821 3.14 2014 0.9300 446,015,531 (2.42)2015 0.9300 463,184,807 3.85 2016 0.9900 510,528,757 10.22 2017 0.9900 528,410,384 3.50 2018 1.0025 551,883,966 4.44 2019 1.0025 4 570,105,091 3.30 2020 1.0175 596,677,843 4.66
Source: City Department of Finance
1 Eleven years of data are shown for consistency with past Official Statements.2 Tax rate per $100 per assessed value. See Statistical Table 7.3 Calculation of the Real Property Tax Levy begins with the Real Property Assessed Value on Schedule 1-3 and then is
adjusted by Supplements, Exonerations, Special Service District additional levies and other miscellaneous adjustments to arrive at the Tax Levy. See Statistical Table 9.4 Reflects correction to tax rate from prior schedule.
281

Sche
dule
1-3
CIT
Y O
F V
IRG
INIA
BE
AC
H, V
IRG
INIA
HIS
TO
RIC
AL
ASS
ESS
ED V
AL
UE
FISC
AL
YE
AR
S 20
10 T
HR
OU
GH
202
0(U
NA
UD
ITE
D)
Publ
icR
eal
Perc
enta
ge
Pers
onal
Perc
enta
ge
Serv
ice
Perc
enta
ge
Perc
enta
ge
Prop
erty
C
hang
e Pr
oper
tyC
hang
e Pr
oper
tyC
hang
e T
otal
Cha
nge
Fisc
alA
sses
sed
From
Ass
esse
dFr
omA
sses
sed
From
Ass
esse
dFr
omY
ear
1V
alue
2Pr
ior
Yea
rV
alue
Prio
r Y
ear
Val
ue 3
Prio
r Y
ear
Val
uePr
ior
Yea
r
2010
$ 5
5,37
9,97
3,66
5 (2
.44)
$ 3
,611
,774
,884
(2
.71)
$ 8
90,2
29,1
32
10.
19
$ 5
9,88
1,97
7,68
1 (2
.29)
2011
51,
975,
401,
446
(6.1
5) 4
,078
,095
,291
1
2.91
9
27,5
09,7
46
4.1
9 5
6,98
1,00
6,48
3 (4
.84)
2012
50,
508,
022,
826
(2.8
2) 4
,305
,125
,900
5
.57
938
,327
,087
1
.17
55,
751,
475,
813
(2.1
6)20
13 4
8,85
1,99
4,65
8 (3
.28)
4,2
49,6
92,5
32
(1.2
9) 9
29,8
43,1
70
(0.9
0) 5
4,03
1,53
0,36
0 (3
.09)
2014
48,
737,
614,
190
(0.2
3) 4
,334
,018
,923
1
.98
889
,050
,800
(4
.39)
53,
960,
683,
913
(0.1
3)20
15 5
0,57
7,27
9,18
0 3
.77
4,5
69,8
33,5
78
5.4
4 8
75,4
96,5
71
(1.5
2) 5
6,02
2,60
9,32
9 3
.82
2016
52,
016,
374,
504
2.8
5 4
,582
,059
,618
0
.27
895
,479
,945
2
.28
57,
493,
914,
067
2.6
3 20
17 5
3,84
0,54
6,03
7 3
.51
4,6
92,3
83,3
56
2.4
1 9
45,0
94,3
80
5.5
4 5
9,47
8,02
3,77
3 3
.45
2018
55,
520,
701,
233
3.1
2 4
,786
,765
,849
2
.01
983
,607
,868
4
.08
61,
291,
074,
950
3.0
5 20
19 5
7,29
9,35
7,61
9 3
.20
5,6
47,0
66,9
16
17.
97
1,0
20,1
79,7
72
3.7
2 6
3,96
6,60
4,30
7 4
.37
2020
59,
349,
419,
535
3.5
8 5
,980
,866
,800
5
.91
1,0
46,9
21,7
97
2.6
2 6
6,37
7,20
8,13
2 3
.77
1 El
even
yea
rs o
f dat
a ar
e sh
own
for c
onsi
sten
cy w
ith p
ast O
ffici
al S
tate
men
ts.
2 R
eal P
rope
rty is
ass
esse
d at
100
% o
f fai
r mar
ket v
alue
.3
Incl
udes
bot
h re
al e
stat
e an
d pe
rson
al p
rope
rty a
sses
smen
t. A
ll pu
blic
serv
ice
prop
erty
is ta
xed
at th
e re
al e
stat
e ta
x ra
te, e
xcep
t for
veh
icle
s.
Sour
ce:
City
Dep
artm
ent o
f Fin
ance
, Sta
tistic
al T
able
6
282

Schedule 1-4 CITY OF VIRGINIA BEACH, VIRGINIA
PROPERTY TAX LEVIES AND COLLECTIONSFISCAL YEARS 2010 THROUGH 2020
(UNAUDITED)
Collected within the Total Fiscal Year of the Levy Collections Total Collections to Date
Fiscal Tax Percentage in Subsequent Percentage Year 1 Levy 2 Amount of Levy Years Amount of Levy
2010 $ 546,129,490 $ 526,040,648 96.3 $ 17,124,532 $ 543,165,180 99.5 2011 523,586,269 504,769,073 96.4 15,200,927 519,970,000 99.3 2012 522,586,852 501,282,299 95.9 15,894,160 517,176,459 99.0 2013 536,618,666 516,542,429 96.3 16,354,153 532,896,582 99.3 2014 527,036,431 509,339,982 96.6 16,067,605 525,407,587 99.7 2015 558,420,893 537,056,367 96.2 18,155,104 555,211,471 99.4 2016 613,105,892 589,411,524 96.1 18,210,834 607,622,358 99.1 2017 634,993,466 609,085,906 95.9 19,983,532 629,069,438 99.1 2018 662,272,634 636,789,707 96.2 20,206,339 656,996,046 99.2 2019 688,073,333 638,348,095 92.8 17,972,254 656,320,349 95.4 2020 722,621,429 631,762,062 87.4 631,762,062 87.4
Source: City Department of Finance
Note: Collections in Subsequent Years represents delinquent accounts collected during the course of the fiscal year for all prior fiscal years. FY 2011through FY 2019 updated since last schedule.
1 Eleven years of data are shown for consistency with past Official Statements.2 Includes both Real and Personal Property including Public Service Corporations. See Statistical Table 9. For FY 2020, the breakdown is as follows:
Real Property tax levy (includes Public Service Corporation real property): $ 596,677,843 Personal Property tax levy (includes Public Service Corporation personal property): 125,943,586
$ 722,621,429
283

Sche
dule
1-5
CIT
Y O
F V
IRG
INIA
BEA
CH
, VIR
GIN
IAPR
INC
IPA
L TA
X R
EVEN
UES
BY
SO
UR
CE
FISC
AL
YEA
RS
2010
TH
RO
UG
H 2
020
(UN
AU
DIT
ED)
Rea
lPe
rson
alG
ener
al
Res
taur
ant
Tot
alFi
scal
Prop
erty
Pr
oper
tySa
les
Util
ityM
eal
Oth
erT
axes
Yea
r 1
Tax
es 2
Tax
es 2
Tax
Tax
Tax
Tax
esA
sses
sed
2010
$ 5
04,3
34,9
61
$ 5
9,81
3,52
6 $
50,
263,
545
$ 4
6,66
2,62
2 $
48,
442,
376
$ 1
03,3
85,9
29
$ 8
12,9
02,9
59
2011
474
,474
,648
6
5,94
3,53
5 5
1,74
3,90
5 4
5,12
9,30
1 5
0,59
4,18
1 1
08,6
91,6
03
796
,577
,173
20
12 4
61,4
80,3
33
73,
705,
379
53,
375,
318
45,
254,
169
53,
254,
313
109
,728
,241
7
96,7
97,7
53
2013
476
,217
,120
7
4,72
3,03
5 5
4,97
8,53
1 4
4,62
3,29
2 5
5,12
2,46
5 1
15,4
03,7
84
821
,068
,227
20
14 4
64,4
39,6
67
78,
678,
322
56,
431,
418
44,
050,
182
56,
872,
794
114
,548
,325
8
15,0
20,7
08
2015
481
,774
,192
9
0,89
8,63
5 5
8,16
4,56
9 4
3,30
8,15
7 5
9,96
8,37
5 1
19,8
31,6
73
853
,945
,601
20
16 5
26,4
51,9
09
95,
930,
682
61,
099,
407
42,
658,
906
63,
437,
485
122
,405
,839
9
11,9
84,2
28
2017
544
,302
,460
1
00,0
75,2
05
62,
614,
614
44,
829,
994
65,
207,
699
125
,846
,026
9
42,8
75,9
98
2018
567
,573
,017
1
08,1
23,3
97
63,
511,
403
49,
832,
408
3 6
6,26
4,68
5 1
23,9
22,8
38 3
979
,227
,748
20
19 5
86,4
07,7
84
106
,029
,083
6
5,85
1,81
7 4
7,63
6,48
4 6
9,27
8,65
2 1
26,2
77,4
03
1,0
01,4
81,2
23
2020
603
,119
,216
1
12,7
28,0
82
67,
855,
536
45,
584,
479
60,
561,
741
124
,110
,581
1
,013
,959
,635
Sour
ce:
City
Dep
artm
ent o
f Fin
ance
, see
Sta
tistic
al T
able
5
Not
e: R
eal
and
Pers
onal
Pro
perty
Tax
Rev
enue
s inc
lude
col
lect
ions
for C
urre
nt Y
ear a
nd P
rior y
ears
levi
es c
olle
cted
with
in th
e C
urre
nt F
isca
l Yea
r.
1El
even
yea
rs o
f dat
a ar
e sh
own
for c
onsi
sten
cy w
ith p
ast O
ffici
al S
tate
men
ts.
2In
clud
es ta
xes,
pena
lty &
inte
rest
($10
min
imum
) on
delin
quen
t col
lect
ions
from
prio
r yea
rs.
3Fr
anch
ise
Taxe
s wer
e in
clud
ed in
Oth
er T
axes
prio
r to
FY 2
018.
Beg
inni
ng F
Y 2
018,
Fra
nchi
se T
axes
are
incl
uded
with
Util
ity T
axes
.
284
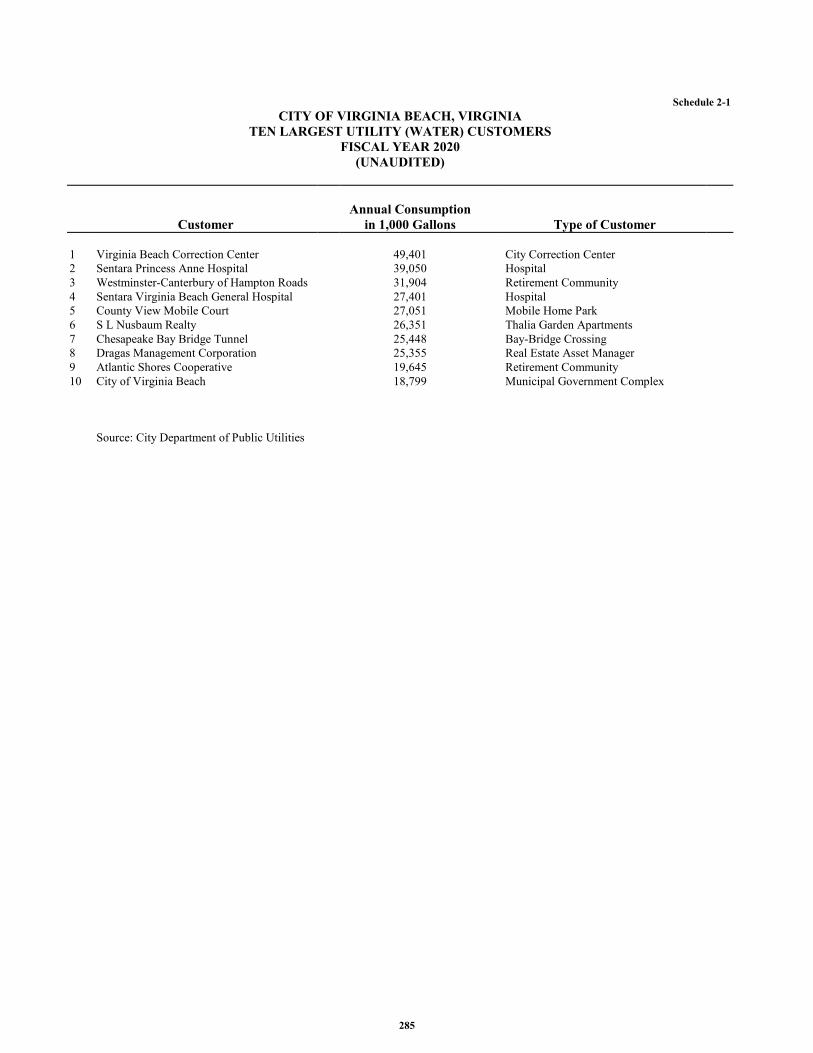
Schedule 2-1CITY OF VIRGINIA BEACH, VIRGINIA
TEN LARGEST UTILITY (WATER) CUSTOMERSFISCAL YEAR 2020
(UNAUDITED)
Annual ConsumptionCustomer in 1,000 Gallons Type of Customer
1 Virginia Beach Correction Center 49,401 City Correction Center2 Sentara Princess Anne Hospital 39,050 Hospital3 Westminster-Canterbury of Hampton Roads 31,904 Retirement Community4 Sentara Virginia Beach General Hospital 27,401 Hospital5 County View Mobile Court 27,051 Mobile Home Park6 S L Nusbaum Realty 26,351 Thalia Garden Apartments7 Chesapeake Bay Bridge Tunnel 25,448 Bay-Bridge Crossing8 Dragas Management Corporation 25,355 Real Estate Asset Manager9 Atlantic Shores Cooperative 19,645 Retirement Community10 City of Virginia Beach 18,799 Municipal Government Complex
Source: City Department of Public Utilities
285

Schedule 2-2CITY OF VIRGINIA BEACH, VIRGINIA
WATER AND SEWER ENTERPRISE FUNDOUTSTANDING DEBT BY ISSUE
AT JUNE 30, 2020(UNAUDTED)
2016-B $42,865,000 Water and Sewer Refunding Revenue Bonds $ 36,065,000 2016A Water and Sewer Revenue Bonds 43,230,000 2013 Water and Sewer System Revenue Bonds 38,160,000 2010A Water and Sewer System Revenue Bonds 49,515,000 2010B Water and Sewer System Refunding Revenue Bonds 3,680,000 2010C Water and Sewer System Refunding Revenue Bonds 12,745,000
Total Water and Sewer Debt Outstanding 1 $ 183,395,000
1 All Water & Sewer Bonds listed above are Parity Debt.
Source: City Department of Finance
286

Schedule 2-3CITY OF VIRGINIA BEACH, VIRGINIAWATER RESOURCE RECOVERY FEES
HISTORY OF RECEIPTS AND DISBURSEMENTSFISCAL YEAR 2015 THROUGH 2020
(IN THOUSANDS OF DOLLARS)(UNAUDITED)
Fiscal Year2015 2016 2017 2018 2019 2020
Balance - July 1 $ - $ - $ - $ - $ - $ -
Fees Received 3,120 2,414 2,796 2,046 2,107 2,143
Disbursements 3,120 2,414 2,796 2,046 2,107 2,143
Balance - June 30 $ - $ - $ - $ - $ - $ -
Source: City Departments of Finance and Public Utilities.
287

Schedule 2-4
CITY OF VIRGINIA BEACH, VIRGINIAWATER AND SEWER ENTERPRISE FUND
SYSTEM OPERATING REVENUES, EXPENSES AND COVERAGE FOR FISCAL YEAR JUNE 30, 2020(IN THOUSANDS OF DOLLARS)
(UNAUDITED)
Fiscal Year2016 2017 2018 2019 2020
Operating Revenues Service Charges $ 75,233 $ 75,767 $ 77,126 $ 77,256 $ 76,803 Water Usage 44,847 45,599 45,485 44,679 49,652 Interfund Services Provided 1,170 1,497 1,421 1,082 3,225 Miscellaneous 1,771 1,616 1,297 1,008 829 Total Operating Revenues 123,021 124,479 125,329 124,025 130,509
Operating Expenses Water Acquisition 24,488 24,722 24,811 27,529 29,914 Water Distribution 6,832 7,189 7,187 6,576 6,791 Sewer Collection 13,812 14,494 14,329 13,547 13,305 Administration and Engineering 18,646 16,708 22,349 22,801 23,242 Customer Services 10,152 9,701 10,839 10,430 10,787 Total Operating Expenses 73,930 72,814 79,515 80,883 84,039 Net Operating Income 49,091 51,665 45,814 43,142 46,470
Non-Operating Revenues/(Expense) Interest 597 2,082 2,640 2,981 3,290 Water Resource Recovery Fee 2,414 2,796 2,046 2,107 2,143 Connection Fees 1,187 1,047 890 903 1,070 Norfolk Water True-Up 825 - - - - Total Non-Operating Income 5,023 5,925 5,576 5,991 6,503
Income Available For Debt Service 54,114 57,590 51,390 49,133 52,973
Annual Debt Service1
Water and Sewer Revenue Bonds $ 18,520 $ 16,569 $ 17,918 $ 17,921 $ 17,913 Coverage of Debt Service on Water and
Sewer Revenue Bonds 2 2.92 x 3.48 x 2.87 x 2.74 x 2.96 x
1 Includes Principal, Interest at gross, and Bank Charges2 The Water and Sewer has Master Bond Resolution dated February 11, 1992, as amended and supplemented that sets the debt
service coverage and revenue requirements at 115% of maximum annual debt service for Water and Sewer revenue bonds and1.0 times for Water and Sewer General Obligation Bonds. City Council set the revenue coverage goal of not less than 1.5xannual debt service for Water and Sewer Bonds and 1.2x for total debt (combined Water and Sewer Revenue Bonds and anyWater and Sewer General Obligation Bonds) May 14, 2002 in the FY 2003 Operating Budget.
Source: City Departments of Finance and Public Utilities.
288

Schedule 2-5CITY OF VIRGINIA BEACH
WATER AND SEWER ENTERPRISE FUNDDEBT SERVICE REQUIREMENTS
AS OF JUNE 30, 2020(UNAUDITED)
Fiscal Gross Debt Debt Service Net PrincipalYear Principal Interest Service Subsidy of Subsidy Outstanding
2021 1 $ 10,045,000 $ 7,959,694 $ 18,004,694 $ 480,557 $ 17,524,137 $ 209,930,000 2022 10,800,000 8,012,525 18,812,525 - 18,812,525 199,130,000 2023 11,405,000 7,457,400 18,862,400 - 18,862,400 187,725,000 2024 12,045,000 6,871,150 18,916,150 - 18,916,150 175,680,000 2025 12,720,000 6,252,025 18,972,025 - 18,972,025 162,960,000 2026 13,445,000 5,597,900 19,042,900 - 19,042,900 149,515,000 2027 11,470,000 4,992,675 16,462,675 - 16,462,675 138,045,000 2028 11,960,000 4,464,787 16,424,787 - 16,424,787 126,085,000 2029 10,075,000 3,984,075 14,059,075 - 14,059,075 116,010,000 2030 10,555,000 3,529,375 14,084,375 - 14,084,375 105,455,000 2031 11,000,000 3,075,675 14,075,675 - 14,075,675 94,455,000 2032 8,985,000 2,660,775 11,645,775 - 11,645,775 85,470,000 2033 9,400,000 2,289,100 11,689,100 - 11,689,100 76,070,000 2034 9,775,000 1,960,194 11,735,194 - 11,735,194 66,295,000 2034 10,125,000 1,669,988 11,794,988 - 11,794,988 56,170,000 `2036 10,460,000 1,387,250 11,847,250 - 11,847,250 45,710,000 2037 6,985,000 1,133,006 8,118,006 - 8,118,006 38,725,000 2038 7,210,000 911,250 8,121,250 - 8,121,250 31,515,000 2039 7,435,000 685,025 8,120,025 - 8,120,025 24,080,000 2040 4,740,000 509,800 5,249,800 - 5,249,800 19,340,000 2041 4,855,000 387,775 5,242,775 - 5,242,775 14,485,000 2042 4,985,000 262,500 5,247,500 - 5,247,500 9,500,000 2043 2,300,000 176,000 2,476,000 - 2,476,000 7,200,000 2044 2,350,000 128,031 2,478,031 - 2,478,031 4,850,000 2045 2,400,000 77,563 2,477,563 - 2,477,563 2,450,000 2046 2,450,000 26,031 2,476,031 - 2,476,031 -
Totals $ 219,975,000 $ 76,461,569 $ 296,436,569 $ 480,557 $ 295,956,012
1 Reflects debt service after the issuance of 2020A Water and Sewer System Revenue Bonds or 2020B Water and Sewer SystemRefunding Revenue Bonds in FY 2021 (October 22, 2020). Fiscal Year 2021 has been adjusted to reflect the impact on the respectivedebt service interest payments of federal sequestration in effect at 5.9% July through September and 5.7% October through June. Theproceeds of the Series 2020B Bonds refunded certain of the City's outstanding Water and Sewer System Revenue Bonds, Series 2010A-2(Taxable-Build American Bonds) and Series 2010B&C refunding revenue bonds, which will reduce the federal subsidy during FY 2021from $861,754 to $480,557 and eliminate it in FY 2022 onward.All Water & Sewer Debt is comprised of Revenue Bonds and Notes issued pursuant to Article VII, Sec. 10(a)(3) of the Constitution ofVirginia, secured solely by the Revenues of the system.
Source: City Department of Finance
289

Schedule 2-6
CITY OF VIRGINIA BEACH, VIRGINIAWATER AND SEWER ENTERPRISE FUND
WATER AND SEWER RATE HISTORY(UNAUDITED)
Sanitary Sewer Service Effective Date of Water Commodity Rate Charge Single Family Rate Adjustment (per 1,000 gallons) Residence (per month)
July 1, 1983 $ 1.62 $ 9.46 August 1, 1987 1.81 9.46 October 1, 1987 1.99 9.46
July 1, 1988 2.18 9.46 July 1, 1989 2.51 9.46 July 1, 1990 2.69 9.46
October 1, 1990 2.77 9.65 July 1, 1991 2.96 10.58 July 1, 1992 3.11 11.38 July 1, 1993 3.38 11.38 July 1, 1994 3.65 11.38 July 1, 1999 3.55 11.38 July 1, 2001 3.55 12.29 July 1, 2002 3.55 13.27 July 1, 2003 3.55 14.34 July 1, 2005 3.65 15.92 July 1, 2006 3.70 16.88 July 1, 2007 3.80 17.72 July 1, 2008 3.95 18.61 July 1, 2009 4.10 19.54 July 1, 2010 4.41 19.54 July 1, 2011 4.41 22.12 July 1, 2012 4.41 24.86 July 1, 2013 4.41 27.76 July 1, 2014 4.41 30.81 July 1, 2015 4.41 30.81 July 1, 2016 4.41 30.81 July 1, 2017 4.41 30.81 July 1, 2018 4.41 30.81July 1, 2019 4.90 30.81July 1, 2020 4.90 30.81
Source: City Department of Public Utilities
290

Schedule 3-1
CITY OF VIRGINIA BEACH, VIRGINIATEN LARGEST STORM WATER UTILITY ACCOUNTS
FOR BILLING PERIOD ENDING JUNE 30, 2020(UNAUDITED)
Customer Fees Billed
Lynnhaven Mall Group $ 240,993
Stihl, Inc. 182,175
Virginia Wesleyan College 130,616
Sentara Healthcare 129,858
Spence Crossing Res Inc 124,735
Pembroke Square Associates 94,807
Evergreen Virginia LLC 87,970
Emerald Point LLC 87,892
Sentara Virginia Beach General Hospital 83,750
Wal Mart Real Estate Business 79,047
Source: City Department of Public Utilities
291

Schedule 3-2CITY OF VIRGINIA BEACH, VIRGINIA
STORM WATER UTILITYDISTRIBUTION BY TYPE OF PROPERTY
AS OF JUNE 30, 2020(UNAUDITED)
FY 2020
Type of PropertyPercent of Equivalent
Residential Units (ERU)
Residential 47.8%Multi-Family 12.5%Non-Residential 39.7%
Source: City Department of Public Works/Storm Water Management
292

Schedule 3-3CITY OF VIRGINIA BEACH, VIRGINIA
STORM WATER UTILITY FEE COLLECTIONSAS OF JUNE 30, 2020
(UNAUDITED)
Fiscal Year Assessed fees Collected fees 1 % Collected
2011 $ 20,883,989 20,833,505 99.76 2012 27,632,407 27,541,919 99.67 2013 32,006,788 31,852,199 99.52 2014 36,709,700 36,537,711 99.53 2015 39,055,783 38,684,230 99.05 2016 39,804,972 39,530,243 99.31 2017 39,738,434 2 39,593,321 2 99.63 2018 43,099,967 2 42,896,849 2 99.53 2019 41,918,755 41,579,356 99.19 2020 44,935,049 3 41,267,793 3 91.84
1 Represents collections of Equivalent Residential Unit (ERU) Fees through June30th of each Fiscal Year. The City anticipates that for each of the recent yearscollection rates will be consistent with earlier years.
2 The City included incorrect amounts for FY 2017 and FY 2018 in previousschedules provided in its annual continuing disclosure reports as well as the OfficialStatement for the Series 2019 Storm Water Utility Revenue Bonds. Previously,Assessed Fees and Collected Fees were shown as $39,854,926 and $40,046,975with 100.48% collected for FY 2017 and $42,654,304 and $41,579,356 with98.12% collected for FY 2018, respectively.
3 Fee collection for FY 2020 declined year-over-year as a result of the delinquentterminations moratorium (suspension of water service disconnections) due to apolicy decision by the City after the May 31st mass shooting incident and theCOVID-19 (coronavirus).
Source: City Departments of Public Works/Storm Water Management and Public Utilities
293

Schedule 3-4CITY OF VIRGINIA BEACH, VIRGINIA
STORM WATER UTILITY FUNDPRO FORMA CALCULATION OF REVENUE COVENANTS
(UNAUDITED)
Revenue Requirement A Fiscal Year2016 2017 2018 2019 2020 2021 Budget
Total Revenues: System Revenues (including interest income) $ 39,648,163 $ 40,471,105 $ 42,148,983 $ 43,419,253 $ 45,815,995 $ 45,964,564 Budgeted Operating Expenses 18,487,455 26,074,916 26,383,086 25,697,342 14,900,439 14,540,384 Revenues Available for Debt Service 21,160,708 14,396,189 15,765,897 17,721,911 30,915,556 31,424,180
Maximum Principal and Interest Requirement on Revenue Bonds 1 $ 3,399,201 $ 3,399,201 $ 3,393,984 $ 3,393,984 $ 5,180,749 $ 10,556,775 Debt Service Coverage Ratio 2 6.2 x 4.2 x 4.6 x 5.2 x 6.0 x 3.0 x
Revenue Requirement B 3 Fiscal Year2016 2017 2018 2019 2020 2021 Budget
Total System Revenues (including interest income) $ 39,648,163 $ 40,471,105 $ 42,148,983 $ 43,419,253 $ 45,815,995 $ 45,964,564 Less: Budgeted Operating Expenses 18,487,455 26,074,916 26,383,086 25,697,342 14,900,439 14,540,384 Revenue Bond Debt Service 1:
Requirement on Series 2010A Bonds 1,394,533 1,391,695 1,386,025 1,382,793 1,376,896 642,600 Requirement on Series 2010B Bonds 641,481 641,581 641,481 645,475 642,881 558,250 Requirement on Series 2015 Bonds 1,357,556 1,359,106 1,360,056 1,358,631 1,359,256 1,360,606 Requirement on Series 2019 Bonds - - - - 1,786,638 1,787,262 Requirement on Series 2020A Bonds - - - - - 1,711,996 Requirement on Series 2020B Bonds - - - - - 382,287
Parity Double Barrel Bond Fund - - - - - - Subordinate Debt Fund (Prior Bonds) - - - - - - Total Debt Service 3,393,570 3,392,382 3,387,562 3,386,899 5,165,671 6,443,001 Capital Improvement Account (Cash) 4 8,490,000 7,500,000 7,500,000 8,000,000 21,554,151 22,451,777 Deposit to Debt Service Reserve Fund 5 - - - - - -
Total Expenditures 30,371,025 36,967,298 37,270,648 37,084,241 41,620,261 43,435,162
Surplus Revenue $ 9,277,138 $ 3,503,807 $ 4,878,335 $ 6,335,012 $ 4,195,734 $ 2,529,402
Reconciliation of Expenses to CAFRTotal Operating Expenses (per CAFR) $ 23,177,375 $ 33,123,109 $ 32,853,281 $ 36,161,097 $ 31,002,402 NA Add (Subtract):
Depreciation (4,792,210) (5,466,520) (5,670,476) (6,458,891) (7,309,940) Annual CIP Expense (463,098) (1,091,586) (1,131,483) (4,447,355) (8,134,590) Net Deferred Retirement Contribution 565,388 (490,087) 283,027 433,800 (482,704) OPEB Expenditures 48,737 8,691 (174,729)
Total Budgeted Expenses (Pro Forma Requirement) $ 18,487,455 $ 26,074,916 $ 26,383,086 $ 25,697,342 $ 14,900,439
1 All Interest is presented at "gross", and does not reflect the United States Treasury subsidy payment to be received for a portion of the series 2010A-2 bonds issued as "Build AmericaBonds. In FY 2021, reflects the refunding of a portion of the Series 2010A-2 Bonds and Series 2010 Bonds refunded by the Series 2020B Bonds.
2 Per the Agreement of Trust dated January 1, 2000, as amended and supplemented, pledged revenues will be sufficient to equal the sum of (1) the Operating Expenses shown in the AnnualOperating Budget and (2) 115% of Maximum Annual Debt Service.
3 Also per the Agreement of Trust, system revenues will be sufficient to equal the sum of (1) the Operating Expenses payable from System Revenues shown in the Annual Operating Budget,(2) the amount required to be paid into the Bond Fund, (3) the amount (if any) required to be paid into the Parity Double Barrel Bond Fund, (4) the amount (if any) required to be paid intothe Subordinate Debt Fund, (5) the amount of any other indebtedness of the City attributable to the System required to be paid from Pledged Revenues, (6) the amount transferred to theCapital Improvement Account as may be determined by the Director of Public Works and (7) any amount necessary to be paid into the Debt Service Reserve Fund to restore the amount ondeposit therein to the amount of the Debt Service Reserve Requirement.
4 Reflects use of current year pay-go/cash and excludes use of net position.5 Deposits to the Storm Water Debt Service Reserve required as a result of new bond issuances are made from the Storm Water Enterprise Fund and not from system revenues, and are not
reflected under Revenue Requirement B. The amounts deposited from the Storm Water Enterprise Fund for Storm Water Utility Revenue Bonds, Series: 2015 issued January 28, 2015 - $1,353.563; 2019 issued July 31, 2019 - $1,786,637.51; and 2020 issued October 7, 2020 - $4,140,050.NA = Not applicable
Source: City Department of Finance
294

Schedule 3-5CITY OF VIRGINIA BEACH, VIRGINIA
STORM WATER UTILITY FUNDDEBT SERVICE REQUIREMENTS
AS OF JUNE 30, 2020(UNAUDITED)
Fiscal Year Principal Interest Subsidy1 Total
2021 $ 2,620,000 $ 3,823,002 $ (98,615) $ 6,344,387 2022 4,265,000 5,039,538 - 9,304,5382023 4,470,000 4,841,281 - 9,311,2812024 4,700,000 4,627,631 - 9,327,6312025 4,955,000 4,394,381 - 9,349,3812026 4,550,000 4,165,231 - 8,715,2312027 4,800,000 3,940,306 - 8,740,3062028 5,035,000 3,708,231 - 8,743,2312029 5,290,000 3,469,006 - 8,759,0062030 5,550,000 3,222,982 - 8,772,9822031 5,815,000 2,970,131 - 8,785,1312032 6,100,000 2,704,606 - 8,804,6062033 6,345,000 2,468,381 - 8,813,3812034 6,565,000 2,269,731 - 8,834,7312035 6,780,000 2,069,556 - 8,849,5562036 7,010,000 1,862,706 - 8,872,7062037 6,035,000 1,666,163 - 7,701,1632038 6,220,000 1,478,894 - 7,698,8942039 6,410,000 1,284,209 - 7,694,2092040 6,615,000 1,083,425 - 7,698,4252041 5,440,000 896,888 - 6,336,8882042 5,615,000 724,013 - 6,339,0132043 5,795,000 544,538 - 6,339,5382044 5,980,000 359,288 - 6,339,2882045 4,355,000 199,875 - 4,554,8752046 4,485,000 67,275 - 4,552,275
$ 141,800,000 $ 63,881,268 $ (98,615) $ 205,582,653
1 Reflects debt service after the issuance of Series 2020A Storm Water Utility Revenue Bonds and Series 2020B StormWater Utility Refunding Revenue Bonds in FY 2021 (October 7, 2020). Fiscal Year 2021 has been adjusted to reflect theimpact on the respective debt service interest payments of federal sequestration in effect at 5.9% July through Septemberand 5.7% October through June. The proceeds of the Series 2020B Bonds refunded certain of the City's outstanding StormWater Utility Revenue Bonds, Series 2010A-2 (Taxable-Build American Bonds) and Series 2010B refunding revenuebonds, which will reduce the federal subsidy during FY 2021 from $131,381 to $98,615 and eliminate it in FY 2022onward.
Source: City Department of Finance
295

Schedule 3-6
CITY OF VIRGINIA BEACH, VIRGINIA
STORM WATER UTILITY FUND
STORM WATER RATE HISTORY
(UNAUDITED)
Effective Date Rate per day per ERU
7/1/2011 $ 0.316
7/1/2012 0.366
7/1/2013 0.416
7/1/2014 0.433
7/1/2015 0.433
7/1/2016 0.433
7/1/2017 0.458
7/1/2018 0.458
7/1/2019 0.493
7/1/2020 0.493
Source: City Department of Public Works/Storm Water Management
Code of the City of Virginia Beach, Section 32.5-2
296