Analysis of Harvested Wetlands Potential in Virginia Beach
177
Technical Memorandum Analysis of Harvested Wetlands Potential in Virginia Beach December 2012 City of Virginia Beach, VA Corps No. W91236-09-D-0034 0031 URS No. 11658362
-
Upload
khangminh22 -
Category
Documents
-
view
0 -
download
0
Transcript of Analysis of Harvested Wetlands Potential in Virginia Beach
Technical Memorandum
Analysis of Harvested Wetlands Potential in Virginia Beach
December 2012
City of Virginia Beach, VA
Corps No. W91236-09-D-0034 0031 URS No. 11658362
Table of Contents Executive Summary ......................................................................................................................................... 1 Background ...................................................................................................................................................... 2 Similar Studies ................................................................................................................................................. 3 Phragmites Inventory ....................................................................................................................................... 4 Plant Sampling and Laboratory Analysis ......................................................................................................... 5 Sampling Results ............................................................................................................................................. 6 Potential Yield for Chesapeake Bay TMDL Purposes ..................................................................................... 6 Phragmites Disposal ......................................................................................................................................... 7 Regulatory Considerations ............................................................................................................................... 8 Phragmites Harvesting Specification ............................................................................................................... 9 Harvesting Costs ............................................................................................................................................ 10 Findings and Conclusions ............................................................................................................................. 11 Study Caveats................................................................................................................................................. 12 Contact Information ....................................................................................................................................... 13 Figures Figure 1.1 Sampling Location Map .............................................................................................................. 14 Figure 1.2 Sampling Location Map .............................................................................................................. 15 Figure 2.1 Dry Weight Inventory Map ......................................................................................................... 16 Figure 2.2 Dry Weight Inventory Map ......................................................................................................... 17 Figure 3. TN vs. Dry Weight ........................................................................................................................ 18 Figure 4. TP vs. Dry Weight ......................................................................................................................... 19 Figure 5. Examples of Cutting Equipment ................................................................................................... 20 Tables Table 1. Dry Weight Ranges .......................................................................................................................... 21 Table 2. Average Yield Rates ........................................................................................................................ 21 Table 3. Harvesting Cost Opinion.................................................................................................................. 22 Table 4. Potential Chesapeake Bay TMDL Pollutant Reduction .................................................................. 23 Table 5. Corps Permitting Matrix ................................................................................................................. 25 Table 6. Comparative Treatment Costs .......................................................................................................... 26 Table F-1. Yield Calculations ....................................................................................................................... F-1 Appendices A. Detailed Sampling Locations .................................................................................................................. A-1 B. Photographs ............................................................................................................................................. B-1 C. Laboratory Results .................................................................................................................................. C-1 D Article 14 of the Virginia Beach City Zoning Ordinance ........................................................................ D-1 E. Meeting Notes .......................................................................................................................................... E-1 F. Yield Calculations .................................................................................................................................... F-1
Analysis of Harvested Wetlands Potential in Virginia Beach
i URS No. 11658362 December 2012

Technical Memorandum
Analysis of Harvested Wetlands Potential in Virginia Beach December 2012 City of Virginia Beach, VA Corps No. W91236-09-D-0034 0031 URS No. 11658362 Executive Summary Engineers and planners from the City of Virginia Beach, Corps of Engineers, and URS Corporation (the Project Delivery Team) have completed a study to assist the City of Virginia Beach in evaluating the potential of harvesting wetland plant stalks to help meet stormwater pollutant removal requirements stemming from the Chesapeake Bay Total Maximum Daily Load (Chesbay TMDL) regulations. ‘Harvesting’ in this context means the careful cutting of plant stalks according to a harvesting protocol (described herein), and their removal from the watershed. The stalks contain nutrients that have been effectively filtered by the plant. Uptake of nutrients by these plants and removal of their stalks reduces nutrient discharges from the watershed into the Chesapeake Bay. These nutrients would otherwise contribute to algal blooms, leading to dissolved oxygen and other water quality problems. If the pants are allowed to experience their normal growth and die-back cycles, the nutrients decay with the plant stalks in place, and are re-introduced into the waters that flow into the Bay. Removing the stalks creates a harvest of pollutants (nutrients). Cutting the stalks according to a harvesting protocol minimizes the disturbance of sensitive lands, such as marsh surfaces, and leaves at least a foot to 18 inches of stalk in place for regenerative growth—it does not kill the plants. The process is similar to pruning garden plants to keep them healthy. Specifically, the team obtained informal guidance and feedback from regulatory agencies as to which wetland species, such as Phragmites, might be suitable for these purposes, and developed a harvesting protocol and specifications for future contracting. The team reviewed wetlands inventory data within the City, and developed an initial plan for harvesting that identifies specific plant colonies that could be harvested. Computations were made to estimate how much Total Nitrogen (TN) and Total Phosphorous (TP) removal credit could be claimed based upon 480 plant tissue samples that were collected as part of the study. The study was initially conceived to address multiple plant species, to include Cattails. However when the field screening was conducted, there was an abundance of Phragmites, but generally only fringe
Analysis of Harvested Wetlands Potential in Virginia Beach
1 URS No. 11658362 December 2012

colonies of Cattails. Based upon the sampling results from 480 Phragmites stalks at 80 locations described herein, readily discernible populations of Phragmites (in 2012), and the assumptions used to arrive at a dry-weight yield, the project delivery team estimates that it may be possible to harvest a maximum of 13,500 Pounds of TN, and 1,000 Pounds of TP annually for Chesapeake Bay TMDL pollutant reduction credit. While maximum costs for these harvesting operations could be on the order of $ 500,000 per year, when compared to the cost of nutrient removal through other BMPs over time, the idea of harvesting Phragmites becomes attractive enough to implement. If the program goes well, the City may have found a cost-effective method to include in its Watershed Implementation Plan to meet the pollutant discharge requirements of the Chesapeake Bay TMDL. This study shows that such potential exists. On a unit-cost basis, the removal of one pound of TN by Phragmites harvesting would be $37 annually, and the cost to remove one pound of TP would be $500 annually. The total annual effort would require the harvesting of suitable stalks from approximately 33 acres of land, with cutting limited to between September 1st and November 19th. Initially, the City would like to perform a 5-year study, in which some sites would be harvested each year, while others would be harvested every other year in order to compare the effects of harvesting on the regrowth of phragmites and the health of the plant stalks. Because this type of harvesting operation has not been previously performed in the region, there is not much data upon which to build estimates of stalk yield. Identifying the areas to be harvested should be a straightforward process, but the pounds of stalks to be collected from those areas are based on plant density and height estimates that are speculative. As the program progresses and harvesting data is collected, the City should be able to develop good baseline information that can be used to more accurately assess the yields. Findings or recommendations contained herein do not constitute Corps of Engineers approval of any project(s) or eliminate the need to follow normal regulatory permitting processes. Background The City must develop plans to comply with pollutant removal targets stemming from the Chesbay TMDL regulation and Executive Order 13508. These pollutant removal targets will be difficult to satisfy, and the City is considering using innovative techniques to achieve compliance in a cost-effective manner. This study provides support to the City to investigate the feasibility of harvesting the stalks of certain existing wetlands species, such as Phragmites, to help meet the mandated pollutant reduction targets. Under the Chesbay TMDL, municipalities must reduce discharges of nitrogen, phosphorous, and sediment in their stormwater. Localities must select a number of Best Management Practices (BMPs) to meet the reduction targets. Some BMPs, such as the construction of new stormwater retention basins, are extremely expensive and require long lead times to implement. Other BMPs, such as street sweeping and erosion & sediment control programs are already in place and can help meet the reduction targets. However, the Chesbay TMDL set the bar sufficiently high that new BMPs will be required. One potential BMP is the harvesting of existing wetlands plant stalks. Wetlands plants typically remove nutrient pollutants from the water column by uptake processes, and the pollutants remain in the plants until they decay. If they are harvested before the decay occurs, these pollutants are physically removed from the stormwater system. There are three key pollutants addressed by the Bay TMDL: nitrogen, phosphorous, and sediment. Wetlands systems are generally effective in reducing all three pollutants, but by different processes. Nitrogen (mostly) and phosphorous are taken up into the plant stalks, but sediment is filtered by settling and sorption processes such that the sediment is not present in the plant stalks. In other words, the
Analysis of Harvested Wetlands Potential in Virginia Beach
2 URS No. 11658362 December 2012

sediment benefits of wetlands occur because the plants slow the flow and gravity and sorption processes remove the sediment from the water column. While wetlands systems are reported to have relatively high sediment removal efficiencies, the sediment ends up in the bottom of the basin or lake, and is not present in the plant stalks. There is no significant sediment present in the plant stalks, and therefore the harvesting of wetlands stalks will not be effective at reducing sediment. For this reason, this study was limited to nitrogen and phosphorus only. For localities such as Virginia Beach, nutrient reductions mandated under the Chesapeake Bay TMDL will be stipulated in a forthcoming MS4 permit. In the meantime DCR has created the Virginia Assessment Scenario Tool (VAST) to allow localities to study different modeling scenarios, and to evaluate alternative measures to meet the required reduction goals. Unfortunately, problems with the Chesapeake Bay Watershed Model and its associated data have led to confusion about exactly what a locality must do to meet the requirements of the Chesapeake Bay TMDL. In a discussion with James Davis-Martin of DCR on 11 December 2012, he stated that target reduction loads will be based upon the difference between the “2009 Progress Scenario” and Virginia’s “WIP I Scenario.” Using VAST on 14 December 2012 to evaluate the differences between the 2009 Progress Scenario and Virginia’s WIP I Scenario, the City must reduce its annual nutrient discharges from stormwater to the Bay by approximately 37,000 pounds of TN, 7,200 pounds of TP, and 2,557,000 pounds of TSS. These values exclude all federal lands. DCR and the U.S. Environmental Protection Agency (EPA) have given provisional approval to use harvested wetlands as a BMP for Chesbay TMDL purposes. Although provisional approval has been granted by the regulators, important details remain to be resolved. Questions include: the efficiency of the plant stalks in up-taking nitrogen and phosphorous; the extent of suitable plant colonies within the City; the appropriate and allowable protocols for harvesting; the pounds of pollutants that could be removed through annual harvesting; the appropriate disposal methods for the harvested stalks; and the ability to perform harvesting operations within regulatory and permitting agency constraints. Funding for this project was provided under Section 22 of the Water Resources Development Act of 1974, as amended, which provides authority for the Corps of Engineers to provide planning assistance to states and tribes, with cost-sharing participation by the City. Planning Assistance States (PAS) Program funds were used for this project. Similar Studies The importance of wetland vegetation in the reduction of pollutants in aquatic systems is well known. Stands of aquatic plants act as a natural filter to help remove suspended solids in sediment laden runoff, as well as suspended forms of nutrients and trace metals. Biologic processes allow for the uptake of dissolved nutrients that make their way into waterways through stormwater runoff and groundwater transport. The ability of wetland vegetation to remove excess nutrients from an aquatic ecosystem is highly variable. The type of vegetation, local climate, hydrology, and pollutant loads in runoff are just a few of the factors that affect the ability of aquatic vegetation to take up excess nutrients. Nutrient removal efficiencies often vary within a given system due to seasonal changes, or climatic events such as droughts or flooding. While nutrient removal rates and efficiencies may be highly variable from one wetland system to the next, studies have shown that the contributions of aquatic vegetation in reducing pollutants can be significant. A United States Geologic Survey study published in 2000, Effects of a Cattail Wetland on Water Quality of Irondequoit Creek near Rochester, New York (Water-resources Investigations Report 00-4032) by William F. Coon, John M. Bernard, and Frank K. Seischab, measured the reduction of pollutants in Irondequoit creek by marsh vegetation over a six-year period. The study area was a 423-acre marsh,
Analysis of Harvested Wetlands Potential in Virginia Beach
3 URS No. 11658362 December 2012

predominantly vegetated by cattails (Typha glauca). Irondequoit creek has a drainage area of 151 square miles comprised mainly of urban and suburban land uses. The study showed the marsh vegetation had an average removal efficiency of 47 percent for total suspended solids (TSS) and 28 percent for total phosphorus (TP) over the six-year study. Nitrogen levels were reduced slightly in the system, with an average total nitrogen (TN) removal efficiency of only 4.3 percent over the same six-year period. Although the removal efficiency for TN was much lower than that for TSS or TP, it accounted for an average annual reduction of nitrogen for Irondequoit creek in the study area of 24,000 pounds. The average annual reduction for TSS and TP was 26.6 million pounds and 14,400 pounds respectively. The practice of harvesting wetland species near the end of the growing season, when nitrogen and phosphorus concentrations are highest in the above-ground biomass, aims to prevent nutrients from being reintroduced into the aquatic system through decomposition of plant material, or translocation of nutrients from above ground biomass to the roots. An ongoing project in Manitoba, Canada; the Netley-Libau Nutrient-Bioenergy Project by Richard E. Grosshans, The International Institute for Sustainable Development, the University of Manitoba, and Ducks Unlimited Canada has studied the harvesting of cattails (Typha spp.) in the Netley-Libau Marsh as a way to reduce nutrient loads in Lake Winnipeg, as well as provide a source of biomass to be used for energy production. The study has shown that when standing biomass is harvested, stored nutrients are removed and prevented from being re-released into the marsh. Harvested cattails yield approximately 20-60 kg of phosphorus per hectare; or 18-54 pounds per acre. http://www.redriverbasincommission.org/Conference/Proceedings/29th_Proceedings/Grosshans_-RRBC_2012.pdf. A study published in 2009 by M. Ruiz and J. Velasco, Nutrient Bioaccumulation in Phragmites australis: Management Tool for Reduction of Pollution in the Mar Menor studied the nutrient levels in Phragmites in the Albujón rambla drainage basin leading into Mar Menor, a Mediterranean lagoon in southeast Spain. The drainage area is approximately 441 km2 and drains agricultural and urban land. Also within the basin is a water treatment plant that inadequately treats sewage for an urban area with approximately 100,000 people. Phragmites grows in dense stands along the banks of Albujón rambla. In late summer, the phragmites has been typically harvested along the banks to increase conveyance during a flood and reduce damage to urban infrastructure. The study showed the peak nutrient levels in the above ground biomass of the phragmites typically occur in late July. Maximum nitrogen yields were 0.54 metric tons per hectare (approx. 480 lbs/acre), while maximum phosphorus yields were 0.025 metric tons per hectare (approx. 22 lbs/acre) with a maximum above-ground biomass dry weight of 3.72 kg/m2 (0.76 lbs/ft2). Phragmites Inventory Wetlands plant inventories have been available in GIS formats for many years—developed by the City of Virginia Beach, the Virginia Institute of Marine Science, the Virginia Department of Conservation and Recreation, other agencies, and private parties. It would be helpful if these separate inventories could be combined into a comprehensive mapping set, but currently there is no such inventory of Phragmites. Lacking detailed GIS mapping data, engineers and planners must resort to estimating likely locations based upon local knowledge and/or aerial or Internet mapping, then make field visits to confirm the presence of the plants. Although Phragmites is a remarkably persistent plant, seasonal Growth rates, human activity (cutting, spraying to eradicate, land development), and other factors can cause wide fluctuations in plant population at any given site. There is no guarantee that populations will remain constant on a year-over-year basis at any particular location. Phragmites does not show up well on aerial imagery. Internet mapping sites such Google Maps or Bing Maps have a great deal of high-resolution aerial imagery for Virginia Beach, but it is not possible to spot Phragmites colonies with any degree of certainty using those images. Street-view or street-side imagery,
Analysis of Harvested Wetlands Potential in Virginia Beach
4 URS No. 11658362 December 2012
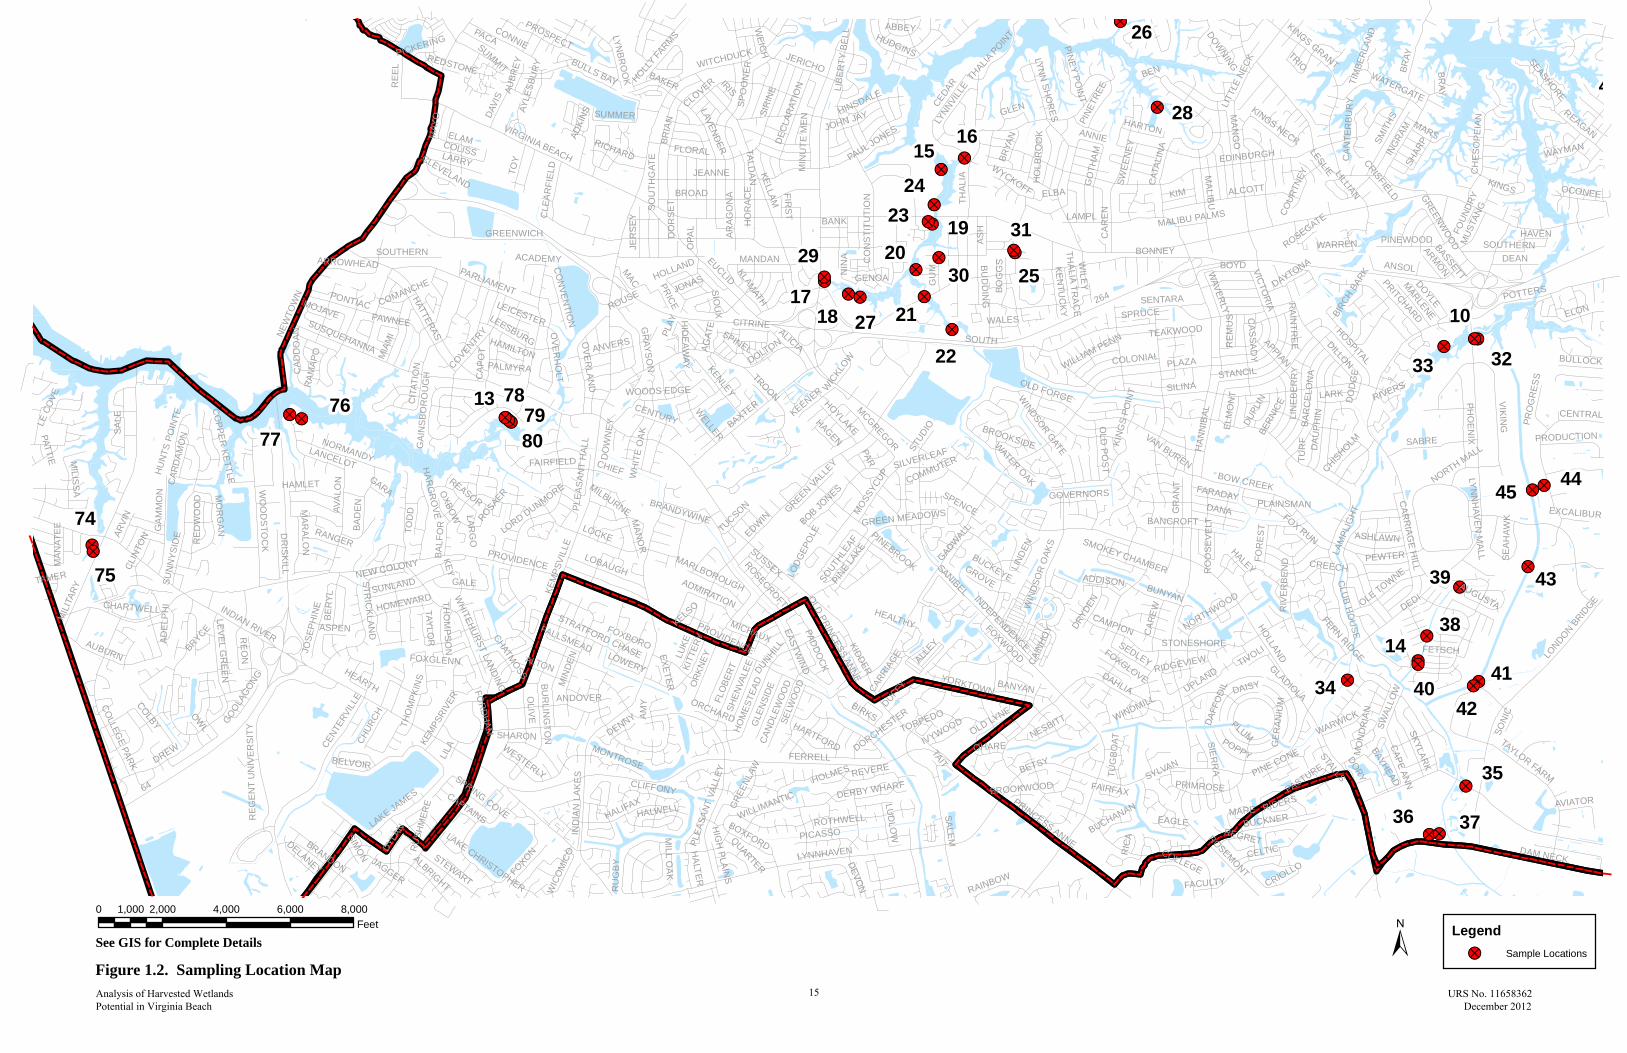
where also available on Google and Bing, can provide a better look at plant colonies growing close to roads, but field verification is needed to confirm the existence of colonies at any particular location. For this study Internet imagery was used to screen potential sites for sampling. However, of the 80 locations that were originally screened for sampling, approximately one dozen did not actually have enough plants to sample when field personnel arrived. The sampling teams just moved on and found additional locations to make sure that 80 locations were sampled in all. The mapping in this technical memorandum shows the 80 locations that were successfully sampled. Plant Sampling and Laboratory Analysis Aerial photographs were used to identify areas where Phragmites was visible and appeared to grow in dense, monotypic stands. Other areas, such as disturbed areas, or areas along drainage ditches and canals were also noted. Before sampling began, a field visit was made to several potential sampling locations to verify the location and densities of phragmites seen in the aerial photographs. Sampling sites were chosen based on location and accessibility. As many sampling locations as possible were chosen on City owned property, or property within a right-of-way or permanent easement. Sites where harvesting is most feasible, primarily areas where Phragmites can be reached from upland areas without disturbing or entering wetlands, were also prioritized. In all, 80 locations were chosen for sampling. Large areas of extensive phragmites growth were often assigned more than one sampling location as checks and to account for possible spatial variations in the phragmites growth. Approximately 12 sites did not contain Phragmites in numbers to warrant sampling. Twelve additional locations were found during the sampling effort to replace those that were not sampled. Several of these were located in areas where phragmites did not appear to be prevalent in the aerial photos. Figure 1 shows an overview of the sampling locations, and detailed sampling locations can be found in Appendix A. The number of plant stalks within a one-foot square was counted at each sampling location, as well as an estimation of overall plant density in the general sampling area. Six representative phragmites stalks were cut one-foot above the ground at each sample location. Each stalk was then measured for total length, before being cut into pieces approximately 1 to 4 inches in length. Each stalk was placed in an individual paper envelope, sealed and assigned a sample number. All samples were shipped the day they were cut using overnight delivery to an agronomy lab. Spectrum Analytic of Washington Court House, Ohio was the agronomy laboratory selected for this analytical work. This lab was highly recommended by several Hampton Roads laboratories (who perform water sampling but not plant tissue sampling), and by staff at the Hampton Roads Agricultural Research and Extension in Virginia Beach. No local lab was found that could perform the plant tissue sampling. In addition, Spectrum Analytic performs this type of analysis on a routine basis, and demonstrated their analytic experience through the detailed plant tissue analysis protocols they provided to URS. Spectrum Analytic was also able to meet federal contracting procurement requirements for small businesses with prompt and complete responses to requests for information. At the lab, the samples were dried for 24 hours in an air drying oven at 150° F. They were then ground to pass a 40 mesh screen and weighed. Total nitrogen concentrations were measured using a Carlo Erba Nitrogen Analyzer. National Bureau of Standards (NBS) citrus leaves and an in-house check sample were analyzed with the plant samples as checks. To measure total phosphorus concentrations, samples first underwent microwave digestion. Nitric acid (HNO3) was combined with 0.5 grams of each sample and placed in a tightly closed vessel before being placed in a microwave digester. Once digestion was complete, samples underwent inductively coupled plasma (ICP) analysis to determine phosphorus concentrations. Lab results for each plant sample contained the sample number, the lab ID number,
Analysis of Harvested Wetlands Potential in Virginia Beach
5 URS No. 11658362 December 2012

received weight, dry weight, total nitrogen as a percent of the dry weight, and total phosphorus as a percent of the dry weight. Lab results were received by URS approximately one week after samples were received by the lab. Sampling Results Sampling at 80 locations resulted in dry weight ranges from 0.168 to 1.37 pounds per square foot (see Table 1). The average percentage of TN by dry weight per stalk ranged from 0.59 to 3.96 percent, and the average percentage of TP by dry weight per stalk ranged from 0.01 to 0.40 percent (see Appendix C). The average percentage of TN by dry weight in all samples was 1.5 percent. The average percentage TP by dry weight in all samples was 0.11 percent. Measurements of stalk height and density were taken by the sampling crews at each site in Figures 1.1 and 1.2. These sampling counts are listed in Table F-1, and were used in developing the yield calculations. The dry weight results were broken into low, medium and high ranges by taking the mean of the dry weights reported by the laboratory, and computing bands within one standard deviation of the mean in both directions, as indicated in Figures 3 and 4. Average yield rates were computed with each of the three ranges. GIS work was performed to map areas that appeared to be low, medium or high yielding Phragmites colonies, and these average yield rates were used to compute the pollutant yields in Table 4. The results of this study are comparable with the similar studies cited above; both in terms of dry weight yield within the stalks analyzed at the laboratory and the yield calculations in Table F-1. Potential Yield for Chesapeake Bay TMDL Purposes There are four essential steps required to quantify the potential TN and TP yield for Chesapeake Bay TMDL purposes:
1. Conduct sampling to determine the average dry weight concentrations of TN and TP in local Phragmites plants;
2. Estimate how much Phragmites exists in the Chesapeake Bay watershed within the City of Virginia Beach;
3. Estimate the dry weight yield of TN and TP for the Phragmites colonies that comprise the harvestable inventory; and
4. Estimate how much of that Phragmites inventory could actually be harvested on an annual basis. The first step is straightforward, and the sampling results for this study indicate that laboratory values are in line with published values. As noted above, currently there is no reliable Phragmites inventory for the City of Virginia Beach. The project delivery team used available aerial mapping and Internet imagery to locate active colonies of Phragmites, and conducted field visits to confirm the presence of the plants. GIS processing was performed to create polygons of Phragmites, estimating how much of the area could be reached for harvesting, and how much dry weight could be harvested from these locations. Figure 2 and Appendix F contain the details of this estimation process on a site-by-site basis. Consideration was given to which
Analysis of Harvested Wetlands Potential in Virginia Beach
6 URS No. 11658362 December 2012
areas could be accessed with side-boom mowers, and which would require cutting by hand. Hand cutting and the use of stand-off equipment will be the only harvesting methods allowed. The field sampling conducted for this study involved counting the number of stalks per square foot and the stalk density at 80 sampling locations. To account for the fact that not all stalks are healthy and suitable for harvesting an adjustment factor was used based upon observations by the sampling team. This adjustment factor is listed as the “Fraction of Viable Stalks” in Table F-1, and simply recognizes that some stalks are too small, decayed, broken, or otherwise do not have significant amounts of nutrients in their stalks. Further and more detailed analyses could be conducted, but would have required more time and budget than was available for this project. Using the procedures and methods described in this technical memorandum, the Chesapeake Bay TMDL maximum pollutant reductions that could be achieved by harvesting Phragmites stalks are tabulated in Table 4 to be approximately 13,500 pounds of TN and 1,000 pounds of TP annually. Approximately 33 acres of Phragmites would have to be harvested within the allowable harvest window (September 1st to November 19th) to achieve these yields. Although 33 acres may seem like a small area, access issues and the need to keep off the marsh surface and away from sensitive habitat will make harvesting operations a challenge. Annual yields will be lower if some sites are harvested on a bi-annual basis. Phragmites Disposal After harvesting, the collected biomass needs to be transported for disposal. Once the Phragmites stalks have been cut and collected, chipping or shredding the stalks would be the most efficient way to reduce the volume of harvested biomass for transport, reducing the number of trucks needed to haul the material away. The main concern with the disposal of the biomass is the reintroduction of the nutrients back into the environment through burning, or disposal in a landfill. For this reason, disposal outside of the Chesapeake Bay watershed is recommended. It may be possible to turn the harvested Phragmites over to a facility where biofuel pellets are manufactured. In Europe, Phragmites has been used as a fuel source for years. Phragmites along with cattails can be turned into biofuel by compressing the material into pellets. Biofuel can be converted into energy through gasification. Gasification furnaces convert organic material into carbon monoxide, hydrogen and carbon dioxide by heating the material to a high temperature without combustion. Oxygen and/or steam are added to the material producing a gas that can be used as a fuel itself. The advantage to gasification is that organic waste material can be converted to energy, and unlike incineration, the emissions contain very little nitrogen or phosphorus to be put back into the atmosphere, and unlike fossil fuels, the materials used in biofuel are renewable. In Virginia, biofuel use is increasing and Virginia’s Renewable Portfolio Standard calls for the State’s energy producers to use renewable resources for 15% of their power generation by 2025. Dominion Virginia Power will convert three of its coal burning plants to use biofuel by 2014. In October of 2011 Dominion Virginia power made a deal with Enviva LP to supply two of those plants: one in Hopewell, Virginia and one in Southampton County, Virginia, with wood chips. Enviva LP produces wood pellets and wood chips for use as biofuel, and recently purchased a port facility in Chesapeake, Virginia to ship wood pellets to Europe for fuel. Enviva LP will soon have two pellet producing plants near the City of Virginia Beach. There is a plant in Ahoskie, NC, and the company just broke ground for a new plant in Southampton in July of 2012. According to the Enviva LP website, the Ahoskie plant will produce approximately 385,000 tons of wood pellets annually, and the Southampton facility is expected to produce an estimated 550,000 tons of pellets each year. Given the growth in the biofuel industry, and the need for raw materials for the production of wood pellets, a biofuel producer may gladly accept the harvested Phragmites biomass from the City.
Analysis of Harvested Wetlands Potential in Virginia Beach
7 URS No. 11658362 December 2012

It may also be possible for the City to generate some revenue to offset the costs of harvesting operations, but the project delivery team was not authorized to pursue or initiate any negotiations, and therefore purposely avoided making any contact with potential buyers for the harvested material. Questions about how to dispose of harvested plant stalks in pits or landfill applications, or by burning, should be treated ‘evenly’ with respect to fate and transport. The current (Phase 5) Chesapeake Bay Watershed Model does not account for groundwater transport of infiltrated runoff into the Bay. If infiltration-type BMPs are used, there is a “free pass” of sorts that exists in accounting for the disposition of the infiltrated nutrients in the modeling world. Similarly, the fate of settled and re-suspended nutrients in ponds is not completely accounted for in the Phase 5 Watershed Model—likewise, the recovery of plants or bed material from bioretention facilities. To demand that harvested plant stalks be held to a higher disposal standard than other BMPs for Bay TMDL credit is inappropriate given the current limits of modeling technology. Fortunately, the biomass industry appears to have an excellent alternative for disposal of the stalks, but if those options close, the disposal of Phragmites stalks should be evaluated on a level playing field with other BMPs. Regulatory Considerations Any activity in or near wetlands areas will be of concern to regulatory authorities, and may require wetlands permits to be issued before work can begin. The concept of harvesting wetlands plants for Chesapeake Bay TMDL credit has not been previously explored with any regulatory personnel in a formal sense. Although it could require many months or even years to settle permitting requirements for this type of work, the project delivery team attempted to solicit informal preferences from regulatory personnel. By soliciting informal guidance and opinions, the project delivery team was able to keep this study on schedule while attempting to avoid problems later on that could come from blindsiding the regulatory community. The regulators were very helpful and their insights and preferences have been incorporated into the recommendations offered herein. Three meetings were held with regulatory personnel to discuss these issues. Meeting notes are provided in Appendix E. The first meeting with regulatory personnel was held at the Norfolk District Corps of Engineers on 26 April 2012, and Tom Walker, Chief of the Norfolk District’s Regulatory Branch, provided input on several types of wetlands harvesting, including harvesting of planted and floating wetlands. As the current study evolved, the focus became harvesting of Phragmites. Mr. Walker subsequently provided a Corps Permitting Matrix as presented in Table 5. Regulatory personnel were invited to two other meetings, one on 18 September 2012 at the Norfolk District Corps of Engineers, and another on 22 October at the Virginia Institute of Marine Science (VIMS) in Gloucester Point. The project delivery team was fortunate to have these opportunities to dialog with experts in Phragmites and wetlands plant growth, as documented in Appendix E. Based upon the input received from the subject matter experts and regulators, several key concerns and constraints were highlighted, including:
Plants should be cut no shorter than one foot above the ground. Cutting shorter than one foot could kill the plants.
Seasonal variations in plant growth result in nutrients moving from the rhizomes into the stalks, and then back into the rhizomes. We cannot assume that TN and TP are constantly present in the stalks of these plants. It is fortunate that the field sampling for this study took place in late October, so the agronomy lab results should match the time of year when harvesting will occur.
Analysis of Harvested Wetlands Potential in Virginia Beach
8 URS No. 11658362 December 2012

Disturbance of marsh surfaces and wildlife habitat must be minimized. Harvesting must occur above the mean high water line. VIMS estimated a typical dry weight yield of 4 to 6 tons per acre of wetlands, and that
approximately 30-percent of the wetlands in the Lynnhaven River are Phragmites. They further estimated that could mean there are 170 acres of Phragmites present in the Lynnhaven. Unfortunately, much of this plant population is located along private shorelines that are difficult to access.
Public education about future Phragmites harvesting operations will be important. Many citizens seek to eradicate Phragmites, and have been prohibited from doing so by Article 14 of the City Zoning Ordinance. The City will need to communicate that it is not intending to kill plants—quite the opposite—and that controlled harvesting by the City is a cost-effective measure by which the City can meet its requirements to reduce pollution into the Bay.
Impacts to wildlife from the harvesting of Phragmites should be minimal if carefully managed. While some species of birds, such as marsh wrens, will nest in stands of Phragmites, nesting occurs in the spring, while harvesting efforts will take place in the fall. Much of the Phragmites in the City is located in areas that are inaccessible to mechanical equipment of any kind, let alone heavy trucks or tractors. Since impacts to marsh soils are to be avoided during harvesting efforts, the amount of phragmites that can be removed from an area will be a fraction of what is growing there and will generally be limited to narrow strips along ditch and marsh edges that can be reached by boom mounted mowing equipment or harvested by hand. Article14 of the City Zoning Ordinance is provided in Appendix D. The Phragmites harvesting envisioned in this study should not be in violation of Article 14. City staff discussed this issue with the City Attorney's Office, which concurs that this harvesting would not be in violation of the ordinance. It is important to remember that the goal of the proposed harvesting is not to eradicate plants, but similar to pruning, to promote the healthy, continued growth of these plants. Phragmites Harvesting Specification For potential harvesting purposes, the Phragmites plants must be located in areas that are practical to harvest, and the plants have to exist in reliable, large quantities. Small, isolated patches of plants, located along private shorelines are not worth considering for now—for practical reasons, including gaining permission to enter private property. The following harvesting protocols and requirements should be followed to maximize harvested nutrient yields, and minimize impacts to harvested locations (in addition to standard Virginia Beach contracting terms and conditions):
1. Phragmites shall be harvested in a manner that minimizes the disturbance of marsh soils. Anything that disturbs the roots will be subject to jurisdiction by the U.S. Army Corps of Engineers. Heavy equipment use on marsh soils and surfaces is prohibited.
2. Phragmites harvesting shall be performed above the mean high water line, to prevent tidal inundation of the cut stalks, which could kill the new shoots.
3. Nutrients are relocated from the stalks to the rhizomes after the growing season to supplement the next year’s growth. Cutting stalks too close to the ground may have a detrimental effect on the following year’s new growth, or kill the plants entirely. To prevent this, stalks must be cut a minimum of 18 inches above the ground.
4. Only one pass shall be permitted per season in any given area. The Contractor may not work any area twice within one harvesting season.
Analysis of Harvested Wetlands Potential in Virginia Beach
9 URS No. 11658362 December 2012

5. To maximize nutrient yield in harvested stalks, harvesting is only allowed between September 1st and November 19th, when nutrient levels are highest in the above ground biomass, but before translocation of nutrients to the rhizomes occurs.
6. Mower attachments such as flail mowers that allow the cut stalks to be shredded or ground up shall not be used, since it will be difficult or impossible to collect the fragments.
7. Stalks must be cut without grinding them in order to maximize the biomass that could be collected after cutting.
8. The use of sickle-bar mowers or handheld cutters with disk blades is required. 9. Contractors may suggest areas for harvesting to the City, but in no case shall harvesting
operations be performed without prior approval of the City to ensure that adequate notifications have been made to citizens.
10. All areas to be harvested must be approved by the City for location and harvesting schedule. The City reserves the right to suspend or deny harvesting operations at any location.
11. Harvesting operations shall only take place during daylight hours. 12. The Contractor shall avoid the disturbance of wildlife habitat areas. 13. The Contractor shall secure all necessary permits for this work. 14. All harvested material shall be weighed prior to disposal at the approved disposal site. 15. The City is particularly interested in the quantities of plant stalks that are harvested, the specific
locations of the plants that are cut, and the harvesting production rates. The Contractor must maintain daily logs of harvesting activities, and record the total weight of Phragmites delivered to the disposal site each day, and the location from which the material was harvested (including the latitude and longitude and text description of the harvesting operations. For example, “36.906683, -76.063253 at the Lynnhaven Drive dredge disposal site,” or “36.801931, -76.068156 along the canal between New Land Drive and Crusader Circle.”
16. Working in areas where Phragmites is growing presents specific safety concerns. All workers shall wear protective eyewear, long-sleeved shirts or jackets, and gloves to avoid puncture and cut wounds. All standard safety precautions such as reflective vest and footwear requirements must be incorporated into the project safety plan.
Due to the relatively short window for harvesting the City may opt to use work crews from the Sherriff’s department, or Public Works/Operations crews to perform some or all of this work. City workers should follow these requirements as well. The City should consider the method of payment carefully. Paying by the ton for collected material should lead to aggressive and efficient harvesting, but could create issues with careless disturbance of the environment. Likewise, the City should provide full, independent inspection of the harvesting operations. Harvesting Costs Due to a lack of data, and with no local contractors having experience with harvesting Phragmites, it is difficult to reliably estimate the cost to harvest Phragmites in Virginia Beach. Estimated costs for harvesting operations are presented in Table 3. There is a great deal of uncertainty in these costs, particularly with respect to the daily yield that a harvesting crew can achieve, and the locations of the transfer site and ultimate disposal location. The crews can only work between September 1st and November 19th, and need to harvest up to approximately 33 acres (again a number that requires significant assumptions). Detailed cost assumptions are listed in Table 3, but the cost to harvest 33 acres would be approximately $ 500,000. At this level, the unit cost to remove TP by harvesting Phragmites annually is comparable to some other BMPs the City is considering in Table 6, such as stream restoration, stream bank stabilization, and bioretention basins,
Analysis of Harvested Wetlands Potential in Virginia Beach
10 URS No. 11658362 December 2012

and is much cheaper than other options such as wet ponds. Unit costs for TN removal are close to Oyster Reefs, and much cheaper than other options. In order to adequately compare costs among alternative BMPs, it is necessary to normalize the unit costs, specifically adjusting for real estate acquisition, long term maintenance, and project depreciation. Costs are based on an assumption of an 8-person work crew, with two pieces of equipment (one to cut and the other to ‘rake’ and load the material onto trucks,) using an intermediate transfer station, from which the material would be hauled to the final disposal site. Figure 5 shows pictures of some of the types of cutting equipment that might be used. A total of 66 crew-days would be required, which could be spread over two or three crews (allowing for bad weather) within the harvesting window (September 1st to November 19th). Findings and Conclusions When considering how to meet the requirements of a program as large and expensive as the Chesapeake Bay TMDL, costs become relative. While it is difficult to estimate the total pounds of TN and TP that could be harvested in Phragmites from Virginia Beach, the real value of this type of study is in its screening potential—particularly compared to other alternatives. If the sampling results and estimations of potential harvest yields clearly pointed to higher unit costs (in terms of pounds of pollutants removed), then the City could abandon the idea of harvesting Phragmites, and focus efforts on using other BMPs—such as constructed Oyster Reefs, wet ponds, nutrient management, street sweeping, etc.—to reach the prescribed annual pollutant reduction goals of the Bay TMDL. In that case, the City could pragmatically conclude that the “squeeze is not worth the juice.” There are certain undeniable benefits to the concept of harvesting Phragmites to help satisfy Bay TMDL requirements. First, the removal of plant stalks containing TN and TP is a direct removal from the treatment train. Whereas other BMPs may ‘treat’ pollutants by methods such as infiltration, there is considerable debate about how much is actually being accomplished. Infiltrated pollutants enter our groundwater, which transports them ultimately back into the Bay. Conversely, if harvested plant stalks can be removed from the Bay watershed and processed overseas for biomass fuel consumption, arguably they are as far out of the watershed as we can accomplish with any BMP. The City can use the results of this study to begin a harvesting program. If the program costs are tracked carefully, and trucks hauling harvested stalks are weighed consistently, the cost and benefits of harvesting Phragmites should be well understood within the first two years. It is also likely that as local contractors and City crews gain harvesting experience, dry weight yields and pollutant removals should increase while unit costs decrease. Given the substantial and profound costs facing the City to achieve compliance with the Bay TMDL, it appears that Phragmites harvesting has great potential. The harvesting envisioned does not necessarily have to be an ‘annual’ event. As long as the City tracks how much plant material is removed at specific locations, appropriate TN and TP reduction should be claimed based on actual (not prescribed) removals. Annual or biannual harvesting is recommended to allow the plants sufficient time to recover from the harvesting and reach full maturity within a growing season. The City would like to perform a 5-year study in which some areas are harvested annually, and others biannually to compare the effects of harvesting on the phragmites growth. If the harvested plant colonies prove to be particularly hearty, the City could explore more frequent harvesting. However the maximum harvest yields estimated through this study assume annual harvesting only.
Analysis of Harvested Wetlands Potential in Virginia Beach
11 URS No. 11658362 December 2012
Based upon the sampling results from 480 Phragmites stalks at 80 locations described herein, readily discernible populations of Phragmites (in 2012), and the assumptions used to arrive at a dry-weight yield, the project delivery team estimates that a maximum annual harvest of 13,500 Pounds of TN, and 1,000 Pounds of TP may be possible for Chesapeake Bay TMDL pollutant reduction credit. Although they are difficult to estimate, costs for harvesting operations could be on the order of $ 500,000 per year, as summarized in Table 3. On a unit-cost basis, removal of one pound of TN by Phragmites harvesting would range from 25 to 150 dollars and the cost to remove one pound of TP would range from 500 to 1,500 dollars. These results and estimates are promising, in that the comparative costs to remove these pollutant discharges are much higher for most other types of BMPs, such as constructing new wet ponds or water quality retrofit facilities. For example, as presented in Table 6, City staff estimates that the annual cost to treat one pound of TN ranges from 15 to 9,500 dollars, and the cost to treat one pound of TP ranges from 200 to 85,000 dollars. There are many factors and conditions that produce the wide variability of these costs—obviously the City would not choose to spend large amounts of money on BMPs that provide only small gains towards meeting Bay TMDL requirements, but these facilities are often planned for other reasons, and the City should take credit where possible. It is also important to consider that the City cannot simply spend its entire budget on a single BMP. There are many constraints and complexities, such as limited land availability, regulatory constraints, private property restrictions, drainage patterns in the watershed (detention ponds built at the top of a hill don’t collect much runoff), the need to remove multiple pollutants (TN, TP and TSS) and so forth. The City should consider mapping the inventory of available, harvestable Phragmites colonies, and use the mapping to plan and execute annual harvesting operations. One way to obtain better data than is currently on hand would be to allow the contactors selected to perform this work to make recommendations for harvesting at alternative sites. If payment under the harvesting contracts that are awarded is based upon tonnage delivered to the disposal site, they would obviously have an incentive to find efficient locations with minimal haul routes. Communication with the public will be very important. Citizens should be made aware that the City is conducting the harvesting of Phragmites as a planned BMP to meet the requirements of the Chesapeake Bay TMDL. Due to its invasive characteristics and proliferation, citizens in the past tried to eradicate plants that blocked their views, or that they otherwise found objectionable. Sometimes their efforts to kill Phragmites plants resulted in the application of toxic or non-approved herbicides (such as Roundup®) directly into waterways. Sometimes the destruction of the Phragmites plants destabilized their shoreline. The problems created by homeowners were addressed in Article 14 of the City Zoning Ordinance (see Appendix D). The intent of this ordinance should not be compromised by the proposed harvesting of Phragmites. The City should be careful to distinguish between its efforts to reduce pollution by harvesting Phragmites from careless attempts by citizens to kill the plants. Likewise the City should conduct an awareness campaign to notify citizens about the need for harvesting, the need to keep the plants alive after the harvesting, and the need to comply with the current ordinance and other regulations. Study Caveats Although portions of this study can be quantified with a reasonable degree of confidence, significant unknowns remain. The plant tissue sampling results are consistent with well-established values for TN and TP—which is not surprising given 480 samples that were collected for this study.
Analysis of Harvested Wetlands Potential in Virginia Beach
12 URS No. 11658362 December 2012
The potential harvest yield remains as the major unknown. Estimates can be developed by making good assumptions, and these assumptions are indeed necessary given the lack of available data (no one has tried this in Virginia before and there is no data on the inventory of Phragmites colonies in the City). The dry weight yields from harvesting could be increased if equipment could operate on the growing surface. There are areas such as dredge disposal sites that have sandy bottoms that can support harvesting equipment. However there are also marsh and mucky areas where no equipment can be supported, and areas where the marsh surface is too soft to support even foot traffic. In the absence of survey data or accurate inventory information, the harvesting rates and areas that can be suitably and economically harvested have been assumed, as indicated in Table 4. The project delivery team has attempted to be conservative in estimating how much Phragmites can be harvested, while honoring the wishes of regulatory personnel to minimize disturbance of the plants, habitat, and growing surfaces. If the City decides to pursue the harvesting of Phragmites for Chesapeake Bay TMDL purposes, accurate recording keeping and experience gained during the first two to five years of operations should close the gap between these early estimates and what can actually be harvested—and the costs to conduct these operations. Given what appears to be a strong and growing regional market for biofuel material, the City might be able to generate some revenue to offset the harvesting costs. The project delivery team was not authorized to make any inquiries in this regard, and did not attempt to contact any potential biofuel producers or biomass consumers. Findings or recommendations contained herein do not constitute Corps of Engineers approval of any project(s) or eliminate the need to follow normal regulatory permitting processes. Contact Information Steve McLaughlin (757.385.4783) served as the project manager for the City of Virginia Beach. Mark Mansfield coordinated the project, and Susan Conner served as the Contracting Officer’s Representative for the Corps of Engineers, Norfolk District (757.201.7390). Sean Bradberry and Stephanie Hood served as the project engineers, and John Paine as the project manager for URS (757.873.0559).
Analysis of Harvested Wetlands Potential in Virginia Beach
13 URS No. 11658362 December 2012

!?!?
!?
!?
!?
!?!?
!?!?
!?
!?!?
!?
!?
!?
!? !?
!?
!?
!?
!?
!?
!?!?!?
!?!?!?
!?
!?
!?
!?
!?
!?
!?
!?
!?
!?!?
!?
!?
!?!?
!?!?!?!?!?!?!?
!?!? !?!?!?
73
71
58
5654
5367
66 65
64
49
4746
62
0706
03
68
01
08
28
31
3029
26
12
11
1615
24
7257
55
5251
63
48
61
60
5950
7069
05
0402
09
25
23
2019
17
LASKIN
SHORE
264
ATLANTIC
VIRGINIA BEACH
19TH
POTTERS
PACIFIC
GR
EAT
NEC
K
THA
LIA
EWEL
L
ARC
TIC
BONNEY
BALTIC
24TH
WITCHDUCK
HAR
RIS
IND
EPEND
ENC
E
18TH
BIRD
NE
CK
CA
RE
N
NORFOLK
HERMITAGE
HOOD
CYPR
ESS
21ST
KINGS GRANT
22ND
16TH
WOLFSNARE
INLYNNVIEW
JEANNE
25TH
KLIN
E
EDINBURGH
RIVER
CAR
DIN
AL
BRAY
BOBO
LINK
BROAD BAY
LAMPL
ALCOTT
CHURCH POINT
20TH
FIRS
T CO
URT
ORIOLE
KELLAM
ING
RAM
55TH
DONNA
FIVE POIN
T
BAY
PINE
WO
OD
ASHLEY
26TH
SYK
ES
FIRST C
OLO
NIAL
12TH
YORK
STEPH
EN
S
MIL
L D
AM
13THWE
ST
PEMBROKE
ANSOL
MA
LIBU
WISHART
MED
ITERR
ANEAN
OLD DONATION
LYNN
SHO
RES
LINKHORN
SMIT
HS
THOROUGHGOOD
SIR
INE
14TH
OC
EANA
52ND
IVY
FIVE FORKS
30TH
CEDAR
REAGAN
CO
NS
TITU
TIO
N
HILL
NORTHAMPTON
BAY COLONY
HILLTO
P
MA
NG
O
OHIO
BRU
TON
51ST
BAY PO
INT
PLAZA
ADAM KEELING
LAKE
PAGE
VIRGINIA
ROSE HALL
STRATFORD
GODFREY
MIN
UTE
MEN
PLAN
TATI
ON
EDEN
JERICHO
15TH
DELCO
LAKEVIEW FALCON
CATO
N
CH
ES
OPE
I AN
49TH
INLET
KIM
9TH
BOB
WO
ODSIDE
35TH
ASH
LIND
SLEY
HONEYGROVE
48TH
DEY COVE
PLEA
SUR
E H
OU
SE
SUFFOLK
BROAD GO
THAM
REYNOLDS
34TH
DELAWARE
DELRAY
LITTLE HAVEN
EGO
PAR
KSI
DE
VILLAGE
CAT
ALIN
A
33RD
DEAN
LYNNHAVEN
MABLE
62ND
43RD
KINGS LAKE
DITCHLEY
WIN
THR
OPE
WINDSOR
STAPLEFORD
LOR
DS
OLI
VER
BOYD
WA
KEFI
ELD
LOU
ISA
GOODSPEED
KINGS
LEE
WATERGATE
WINDWARD SHORE
BAY SH
OR
E
54TH
BAYVILLE
WILDWOOD
WESTMINSTER
65TH
ALAN
TON
TEMPLETON
BREEZY
DELMAR
DEC
LAR
ATIO
N
TRANT LAKE
57TH
63RD
SPIGEL
SULLIVAN
ALLEYHUDGINS
WILL O WISP
BISH
OP
27TH
BAYNE
GREE
N HI
LL
66TH
ST MARSHALL
71ST
REGENCY
64TH
70TH
WH
ITTIER
CALYPSO
SIM
PKIN
S
SYC
AMO
RE
LAUREL
PRIN
CE PH
ILLIP
MEADOW LAKE
MARS
RICHARDSON
GU
M
MAXEY
FERRY PLANTATION
BRADSTON
SOUTHERN
69TH
80TH
67TH
78TH
SUSAN CONSTANT
45TH
RO
SEMO
NT
KINGS WAY
76TH
LYNNDALE
4TH
77TH
FAR
MIN
GTO
N
ABB
EY
RALLY
81ST
EAST
HAVERSHAM
SHAR
P
79TH
QU
EEN
ELIZA
BE
TH
28THOXFO
RD
HAYGOOD
OVERMAN
72ND
LYN
NW
OO
D
FROST
74TH
SPINDRIFT
IND
IAN
HIL
L
BIN
GH
AM
73RD
59TH
68TH
ADAM
MILES STANDISH
82ND
CHUMLEY
HURDS
HINSDALEBLUEBIRD
GLEN EDEN
OAK
60TH
IND
IAN
61ST
REPUBLIC
RUST
DEAR
Y
BOG
GS
WRIGHT
RO
LFE
GA
RC
IA
BYR
D
THALIA
POIN
T
DERMO
TT
36TH
WYCKOFF
BARRY
TANAGER
FRAN
KLIN
HO
LBR
OO
K
KEN
TUC
KY
JOHN JAY
SEA
BREE
ZE
PINE
TREE
HERONS
OCONEE
RED
OAK
BUCCANEER
SANDEE
OLD SHELL
SEA
DUNSTAN
MARLIN BAY
VICTORY
WO
OD
HO
USE
BANK
LITTLE NECK
BRYA
N
32NDOLD CUTLER
JADE
HARTON
TOR
Y
LYNNVI
LLE
LON
DO
N B
RID
GE
KAREN
PAUL REVERE
QUIMBY
PELHAM
KINGS NECK
TRUMAN
PARA
MO
RE
HEBDEN
ELDE
R
JOHNSON
FAIR
LAD
Y
DUKE OF W
INDSOR
CU
RLE
W
AIR STATIONLO
VELL C
OVEY
HOPE
ARC
HE
R
MUS
TANG
SPRI
NG H
OUS
E
KILDEER
WY
THE
TRIO
LAKESIDE
KINGSTO
N
GLEN
GRA
HAM
MIL
LWO
OD
ALFRIENDS
OC
EAN FR
ON
T
CAMELO
T
GR
EE
NTR
EE
HO
LLY
RO
YAL
OAK
SWEE
NEY
DO
WN
SHIR
E
BRANT
OLD GREAT NECK
PHIL
LIP
BISCAYNE
BAILLIOROBIN
ADR
IAN
WAYMAN
SHERWOOD
CH
AR
ITY
DINWIDDIE
EAGLE NEST
DO
NATIO
N
TIMBER RIDGE
CA
NTE
RB
UR
Y
HIDDEN
NEVAN
HIGH
ST JAMES
MEER
ARMON
DATO
N
GARDEN
WHITESIDE
ANNIE
23RD
FIV
E H
ILL
LYNNFIELD
WARREN
ENGLISH
GOLDEN MAPLE
VALH
ALLA
LITCH
FIELD
BRO
OKE
83RD
ENFIELD
SIR RICHARD
WILLO
W
RIDGE
46TH
CATHEDRAL
CHANDLER
CORAL
BACK C
OV
E
SOU
THFIELD
WILEY
GREENWELL
TWO WOODS
PAUL JONES
BRIA
RWOOD
GABLE
LIB
ER
TY B
ELL
ECHO
CO
LD S
PR
ING
CO
VE
RD
ALE
ERIE
HAVEN
BASIN
PINEY PO
INT
SOUVERAIN
HANSONBLAIR
ADD
ING
TON
JAMES
BASSETT
ARR
OW
HE
AD
LAN
DV
IEW
GOLF
LILLIAN
YEATES
APPL
EWO
OD
BLACKFRIARS PILLO
W
40TH
DU
KE
OF
YOR
K
SUNSET
PAR
ISH
SIR WILFRED
SAFI
39TH
LINB
AY
ESTATES
SHASTA
MORRISON
SEASHORE
PENGUIN
PIN
ELAN
D
LESLIE
TWIN
COVE
SHO
VELLER
DOWNING
BEN
STAN
FIEL
D
BISHOPSGATE
CED
AR C
OVE
REED
TOW
N
DOGWOOD
BRIDGEHAMPTON
ST ALBANS
VILL
IER
NIN
A
WY
E
SALISBURY
42ND
TRAVIS
LAUREL V
IEW
LINLIER
BLACKTHORNE
WESLEY
SCO
TT
BELDOVER
GA
INES
MITC
HER
BEV
ER
LY
RIDL
EY
CRAB
BERS
COV
E
HOLLADAY
CRISFIELD
CHINQUAPIN
STAFFOR
D37TH
SMOKEY
WIN
DW
AR
D
CANNON
OYSTER BLUFF
TAHITIAN
CH
ER
RY
PALL
ETS
EDEN
RO
C
SCHOONER
WITCH POINT OLD BAY
TWIN
LAKE
MALIBU PALMS
CONSOLVO
DRIFTWOOD
WINCHESTER
VENABLE
YAWL
LOVE
TTS
POND
YARMOUTH
EARLY
TREL
AWNE
Y
CLIPPER
BRITANNICA
GUNSTON
FOUN
DRY
SHOREWAY
SWAINE
POLO
SEA
BR
I DG
E
BAIL
EYW
ICK
POPLAR
SECURE
ELBA
GLO
UC
ESTER
GENOA
MERRIMAC
26TH
24TH
ALLEY
23RD
SOUTHERN
OR
IOLE
OC
EAN FR
ON
T
LYNNHAVEN
HOLLY
OC
EA
NA
B RA Y
9THSOUTHERN
27TH
Figure 1.1. Sampling Location Map
See GIS for Complete Details ± Legend
!? Sample Locations
0 2,000 4,000 6,000 8,0001,000Feet
Analysis of Harvested Wetlands Potential in Virginia Beach
14 URS No. 11658362 December 2012
!? !?!?!? !?
!?!?
!?
!?
!?
!?
!?!?
!?!?
!?
!?
!?
!?
!?
!?
!? !?
!?
!?!?
!?
!?
!?
!?
!?
!?
!?!?
!?
!?
!?
!?
!?
!?
!?
10
43
40
35
42
45
33
37
39
34
38
75
28
31
3029
27
26
13
1615
24
22
21
77
36
32
41
44
4
74
14
25
23
2019
1817
7978
80
76
64
264
PLAZA
LYNNHAVEN
VIRGINIA BEACH
HOLLAND
PRINCESS ANNE ROSEMONT
INDEPENDENCE
EDWIN
INDIAN RIVER
FERRELL
SOUTH
BONNEY
PROVIDENCE
KEM
PSVI
LLE
THA
LIAJEANNE
DAHLIA
SILINA
MIL
ITAR
Y
SALEM
BUCKNER
DAM NECK
ARA
GO
NA
LOCKE
BROAD
CA
RE
N
KELLAM
BAXTER
EUCLID
GREENWICH
EDINBURGH
BOW CREEK
WIN
DSO
R O
AKS
BRIA
N
IND
IAN
LA
KE
S
LAMPL
ALCOTT
KINGS GRANT
LITT
LE N
ECK
DILLON
ING
RAM
CENT
ERVI
LLE
DREW
PARLIAMENT
AVA
LON
POTTERS
LONDON B
RIDGE
FOXWOOD
SIR
INE
DYLA
N
BRAY
RE
ON
ANSOL
MA
LIBU
LORD DUNMORE
LYNN
SHO
RES
MIN
DEN
COLONIAL
PONTIAC
LAVENDER
VIKIN
G
CLOVER
COVENTRY
APPIAN
SMIT
HS
SABRE
PLEA
SAN
T VA
LLEY
SALE
WITCHDUCK
ROSECROFT
HALIFAX
OLD FORGE
STANCIL
SUSQUEHANNA
CEDA
R
CO
NS
TITU
TIO
N
DA
UP
HIN
SUN
NYS
IDE
CENTRAL
JERICHO
AUBURN
BALF
OR
MA
NG
O
CA
PO
T
ALBRIGHT
TOY
WO
OD
STO
CK
LAM
PLIG
HT
WAVER
LY
MIA
MI
GA
MM
ON
PHO
EN
IX
ALTON
LAKE JAMES
BIRKS
WELLER
NEW
TOW
N
POPPY
BAR
CE
LON
A
MIN
UT E
ME
N
FLORAL
COLLEG
E PARK
OLIV
E
REAGAN
HATTERAS
KENLEY
VICTO
RIA
DO
RS
ET
RI V
ER
BE
ND
MAC
ELAM
BAD
EN
CONNIE
TAYLOR FARM
DANA
CH
ES
OP
EIA
N
CLU
B HO
USE
HAN
NIB
AL
MANDAN
BRANDON
KIM
EASTWIN
D
BUD
DIN
G
ELON
OVE
RH
OLT
SPO
ON
ER
SUNLAND
BUR
LING
TON
RA
INTR
EE
DO
DG
E
FAIRFIELD
MAN
OR
ASH
NESBITT
OVE
RLA
ND
WHITEHURST LANDING
REVERE
RE
EL
STONESHORE
ANDOVER
GALE
GO
THAM
DORY
CAMPIONR
UG
BY
LARRY
FLO
BERT
COLISS
NORMANDY
ALICIA
CAT
ALIN
A
LOBAUGH
CA
SS
AD
Y
DEAN
BER
YL
CIT
ATIO
N
BOB JONES
HOSPITALBOYD
FOXON
OPA
L
SKYLARK
KINGS
RE
GE
NT
UN
IVE
RS
ITY
WATERGATE
WESTERLYPRIMROSE
HUDGINS
KITT
ERY
CAR
RIAG
E HILL
WARWICK
SWAL
LOW
LEV
EL GR
EE
N
STRIC
KLA
ND
DAVI
S
DEVON
PLUM
GR
AYSO
N
MILIS
SA
DEC
LAR
ATIO
N
DUNHILL
LARK
STEWART
DELANEY
PICASSO
LUKE
PACA
ORK
NEY
DOLTON
SELW
OO
D
KEN
TUC
KY
HO
RA
CE
SHARON
SOUTHERN
CELTIC
CAR
EW
COLBY
LYNBR
OO
K
TOD
D
HO
MES
TEAD
DOYLE
GREEN MEADOWS
PINEWOOD
DAISY
GLADIOLA
GLE
NSI
DE
SENTARA
UPLAND
HAR
GR
OVE
OLE TOWNE
MARS
MO
RG
AN
JOSE
PHIN
E
S OU
THG
ATE
GU
M
SEDLEY
BANYAN
ANVERS
SIMO
N
LIN
EB
ER
RY
BANCROFT
REASOR
JER
SE
Y
PINE
LAKE
BERN
ICE
ADMIRATION
BOG
GS
NORTHWOOD
SHAR
PTALD
AN
RICHARD
BUNYAN
TUR
F
KLAMATH
HINSDALE
BELVOIR
BOXFORD
BAKER
PRITCHARD
OLD
PO
STSILVERLEAF
BAYHEAD
ASHLAWN
STRATFORD CHASE
DR
ISK
IL L
OLD PRINCESS ANNEHEARTH
MA
RA
LON
MAY
O
PASTURE
ARVI
N
LEESBURG
MICHAUX
TAYLO
R
MARLENE
HAMLET
HOYLAKE
THO
MPK
INS
ORCHARD
WOODS EDGE
THALIA
POIN
T
SHEN
VALE
E
CLIN
TON
MONTROSE
DRYD
EN
DAF
FOD
IL
WYCKOFF
IRIS
MCGREGORLU
DLO
W
HO
LBR
OO
K
JOHN JAY
GE
RAN
IUM
MOSS
YCUP
WIC
OM
ICO
PEWTER
CHUR
CH
PINE
TREE
RANGER
CLIFFONY
PINEBROOK
FACULTY
OCONEE
DUPL
IN
BULLS BAY
HOMEWARD
GROVE
TUG
BO
AT
BANK
DUFFY
BRYA
N
CAN
DLEW
OO
D
CHIEF
HARTON
OLD LYNE
LYNNVI
LLE
AMY
ALLEY
BULLOCK
KEM
PSRI
VER
DAYTONA
CLE
AR
FIEL
D
KINGS NECK
MILL O
AK
AVIATOR
WALES
HA
LTER
CITRINE
FOR
ES
T
FARADAY
CENTURY
BRANDYWINE
CAR
DAM
ON
MUS
TANG
LIND
EN
RE
MU
S
ARROWHEAD
PRODUCTION
TRIO
GLEN
STALLS
COLLEGE
TUCSON
RAM
APO
LOWERY
HU
NTS
PO
INTE
SWEE
NEY
WILLIMANTIC
JONAS
WAYMAN
MARLBOROUGHADDISONSO
UTHLE
AF
ASPEN
PAR
LE C
OVE
CA
NTE
RB
UR
Y
OHARE
ADE
LPH
I
WATER OAK
EAGLE
CARR
IAGE
PRO
GR
ESS
SEA
HAW
KSO
NIC
ARMON
LYN
NH
AVEN
MA
LL
ABBEY
RE
DW
OO
D
SPINEL
RAINBOW
ANNIE
WIC
KLOW
LAKE CHRISTOPHER
GADWALL
HAGEN
QUARTER
WARREN
CHISHOLM
CO
NVEN
TION
FOR
DH
AMR
ICA
DENNY
ELM
ON
T
COMANCHE
CAIN
HOY
FIRS
T
CLEVELAND
GR
AN
T
GREEN VALL
EY
PALMYRA
ROSAER
KEENER
WILLIAM PENN
GOOLAGONG
PRICE
MA
NAT
EE
AUBR
EY
WILEY
SUMMER
HOLLY FA
RMSTIVOLI
IVYWOOD
PAUL JONES
OXBO
W
LIB
ER
TY B
ELL
AYLE
SBU
RY
CRIOLLO
SANIBEL
CAPE AN
N
COUR
TNEY
HAVEN
PINEY PO
INT
PLE
ASA
NT
HAL
L
FOX RUN
DERBY WHARF
FALLSMEAD
TROON
TEAKWOOD
ROTHWELL
GA
INS
BO
RO
UG
H
MILBURNE
KELSO
MOJAVE
CHATMOSS
BASSETT
THO
MP
SO
N
REGRET
FETSCH
LILLIAN
HALEY
BUCHANAN
GARA
LOD
GEP
OLE
SUMMIT
GOVERNORS
ACADEMY
PLAY
KIDDER
OWL
KIN
GS
POIN
T
AGAT
E
LARG
O
BRYCE
BETSY
GREENWOO
D
BUCKEYE
STUD
IO
LANCELOT
MARE RIDERS
NEW COLONY
PROSPECT
WEIC
H
KEY
HOLMES
GRE
ENLA
W
HALWELL
RIDGEVIEW
SEASHORE
WH
ITE
OA
K
HAMILTON
COMMUTER
THA
LIA TRA
CE
LESLIEFERN RIDGE
VAN BUREN
DOWNING
BEN
NORTH MALL
SMOKEY CHAMBER
CHARTWELL
LILA
RIVERS
NIN
A
CO
PPER KETTLE
PLAINSMAN EXCALIBUR
SPENCE
FOXBORO
AUGUSTA
PADD
OCK
HIG
H PLAIN
S
MO
ND
RIA
N
ROUSE
EXETER
RO
OS
EV
EL T
HARTFORD
DO
WN
EY
LEICESTER
SUSSEX
RU
SHM
ERE
PAWNEE
SIOU
X
HEALTHY
CA
DD
OAN
CRISFIELD
PINE CONE
FAIRFAX
JAGGER
BIRC
H BA
RK
PATTIE
YORKTOWN
SPRUCE
SPRING COVE
WINDMILL
DORCHESTER
MALIBU PALMS
PICKERING
FOXGLOVE
DEDI
TIM
BER
LAN
D
ADKI
NS
TAIT
SYLVAN
WINDSOR GATE
FOUN
DRY
ROSEGATE
BROOKSIDE
FOXGLENN
SIER
RA
CREECH
BROOKWOOD
TAMER
REDSTONE
CAPTAINS
HID
EAW
AY
ELBA
TORPEDO
GENOAHOLLAND
PROVIDENCE
BRAY
SOUTHERN
Figure 1.2. Sampling Location Map
See GIS for Complete Details ± Legend
!? Sample Locations
0 2,000 4,000 6,000 8,0001,000Feet
Analysis of Harvested Wetlands Potential in Virginia Beach
15 URS No. 11658362 December 2012

LASKIN RD
GR
EAT
NEC
K R
D
ATLANTIC AV
BIRDNECK RD
LYNN
HAVEN
PW
LON
DO
N B
RID
GE R
D
VIRGINIA BEACH BL
FIRST C
OLO
NIA
L RD
GEN
ERA
L B
OO
TH B
L
HOLLAND RD
PAC
IFIC AV
SHORE DR
LITTLE NEC
K R
D
Figure 2.1. Dry Weight Inventory Map
See GIS for Complete Details ± LegendDry Weight Category
Low
Medium
High
0 2,000 4,000 6,000 8,0001,000Feet
Analysis of Harvested Wetlands Potential in Virginia Beach
16

PLAZA TL
IND
EPEN
DEN
CE
BL
VIRGINIA BEACH BL
PRINCESS ANNE RD
PROVIDENCE RD
NEWTO
WN R
D
LITTLE NEC
K R
D
HOLLAND RD
ROSEM
ONT RD
MIL
ITAR
Y HY
WITCHDUCK RD
INDIAN RIVER RD
KEM
PSVI
LLE
RD
NORTHAMPTON BL
WIT
CH
DU
CK
RD
Figure 2.2. Dry Weight Inventory Map
See GIS for Complete Details ±LegendDry Weight Category
Low
Medium
High
0 2,000 4,000 6,000 8,0001,000Feet
Analysis of Harvested Wetlands Potential in Virginia Beach
17

Figure 3. TN vs. Dry Weight
y = 608.25x + 27.394R² = 0.7424
0
100
200
300
400
500
600
700
800
900
1000
0.00 0.20 0.40 0.60 0.80 1.00 1.20 1.40 1.60
TN (lbs/ac)
Dry Weight (lbs/sf)
TN vs. Dry Weight
TN vs. Dry Weight Linear (TN vs. Dry Weight)
Dry wt Mean = 0.593Standard Deviation = 0.233
2x Standard Deviation
Analysis of Harvested Wetlands Potential in Virginia Beach
18 URS No. 11658362 December 2012
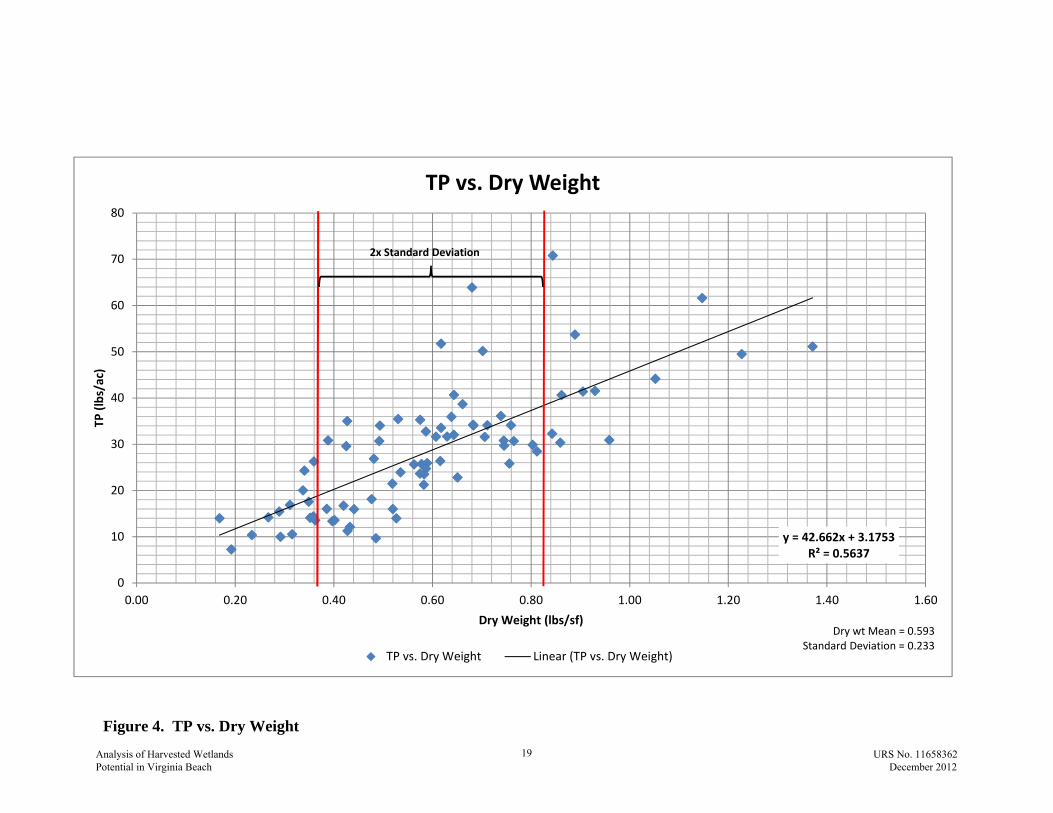
Figure 4. TP vs. Dry Weight
y = 42.662x + 3.1753R² = 0.5637
0
10
20
30
40
50
60
70
80
0.00 0.20 0.40 0.60 0.80 1.00 1.20 1.40 1.60
TP (lbs/ac)
Dry Weight (lbs/sf)
TP vs. Dry Weight
TP vs. Dry Weight Linear (TP vs. Dry Weight)
Dry wt Mean = 0.593Standard Deviation = 0.233
2x Standard Deviation
Analysis of Harvested Wetlands Potential in Virginia Beach
19 URS No. 11658362 December 2012

Figure 5. Examples of Cutting Equipment
Analysis of Harvested Wetlands Potential in Virginia Beach
20 URS No. 11658362 December 2012

Low 0.168 - 0.360
Medium 0.360 - 0.826
High 0.826 - 1.371
TN TPLow 0.298 202 15
Medium 0.582 386 28
High 0.991 616 46
Table 1. Dry Weight RangesYield
Category Range (lbs./s.f.)
Table 2. Average Yield RatesYield
CategoryDry Wt. (lbs./s.f.)
Removal (lbs./ac.)
Analysis of Harvested Wetlands Potential in Virginia Beach
21 URS No. 11658362 December 2012

Table 3. Harvesting Cost Opinion
Item Description Quantity Unit Unit Cost Total1 Articulated Boom Arm Mowing Equipment Per Day 8 Hr $90 $7202 Truck/Tractor Mounted Grapple 8 Hr $75 $6003 Manual Labor (8 Man Crew) 64 Hr $12 $768
4Debris Haul to Central Collection Point (0-15 miles, Tandem Dump Truck) 270 CY $7 $1,890
5Debris Haul From Collection Point To Final Disposition (30-60 miles, Semi Tractor Trailer) 270 CY $8 $2,160
6 Traffic Control 1 Day $150 $150Crew Cost Per Day for 1/2 Acre Harvested $6,288
7 Harvesting of 33 Acres of Phragmites 66 Day 6288 $415,0088 Contingency 20 % $83,001.60 $83,002
$498,010
could be harvested per day.3. A contingency of 20% was added considering this type of harvesting is new, and equipment requirements or
Total Cost
field conditions may alter harvesting methods, protocols, or yields.
Assumptions:1. Cubic yards of material/day to haul based on estimate of 1/2 acre harvested and stalk density of 10 stalks/ft2 or
ground of approximately .027 ft2 (approx. 4"x4"x3").2. Due to equipment transport from one harvest site to the next, it was assumed that approximately 1/2 acre
Analysis of Harvested Wetlands Potential in Virginia Beach
22 URS No. 11658362 December 2012
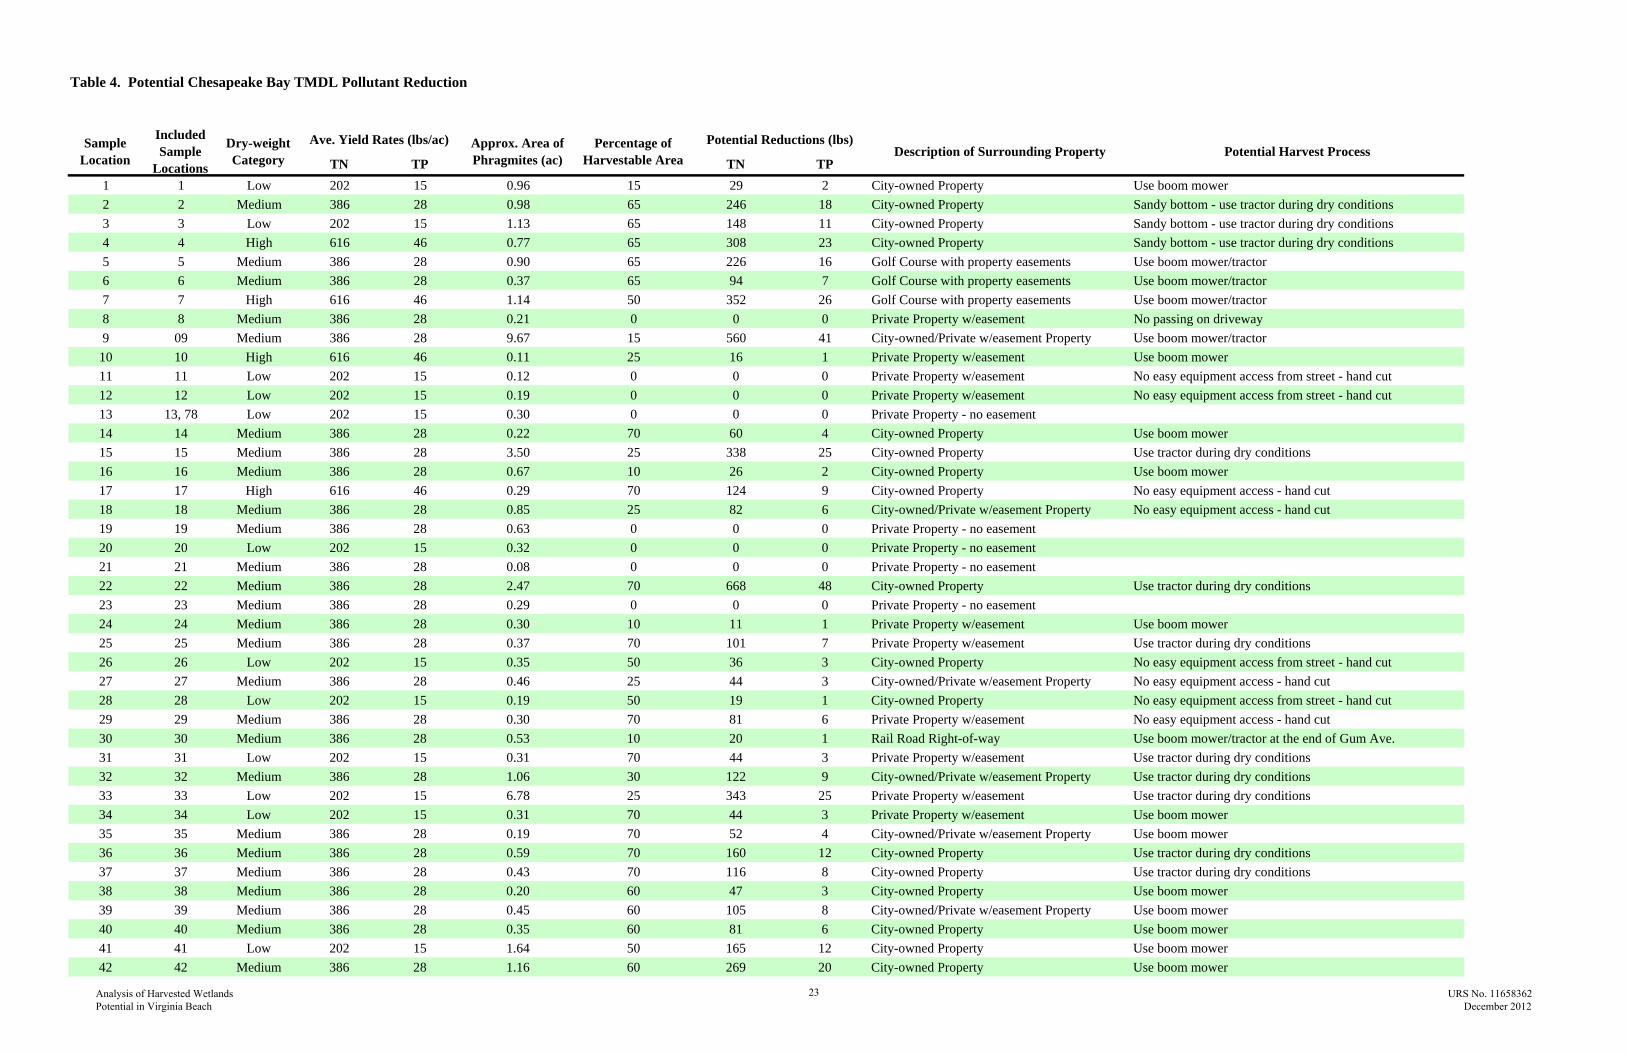
Table 4. Potential Chesapeake Bay TMDL Pollutant Reduction
TN TP TN TP1 1 Low 202 15 0.96 15 29 2 City-owned Property Use boom mower
2 2 Medium 386 28 0.98 65 246 18 City-owned Property Sandy bottom - use tractor during dry conditions
3 3 Low 202 15 1.13 65 148 11 City-owned Property Sandy bottom - use tractor during dry conditions
4 4 High 616 46 0.77 65 308 23 City-owned Property Sandy bottom - use tractor during dry conditions
5 5 Medium 386 28 0.90 65 226 16 Golf Course with property easements Use boom mower/tractor
6 6 Medium 386 28 0.37 65 94 7 Golf Course with property easements Use boom mower/tractor
7 7 High 616 46 1.14 50 352 26 Golf Course with property easements Use boom mower/tractor
8 8 Medium 386 28 0.21 0 0 0 Private Property w/easement No passing on driveway
9 09 Medium 386 28 9.67 15 560 41 City-owned/Private w/easement Property Use boom mower/tractor
10 10 High 616 46 0.11 25 16 1 Private Property w/easement Use boom mower
11 11 Low 202 15 0.12 0 0 0 Private Property w/easement No easy equipment access from street - hand cut
12 12 Low 202 15 0.19 0 0 0 Private Property w/easement No easy equipment access from street - hand cut
13 13, 78 Low 202 15 0.30 0 0 0 Private Property - no easement
14 14 Medium 386 28 0.22 70 60 4 City-owned Property Use boom mower
15 15 Medium 386 28 3.50 25 338 25 City-owned Property Use tractor during dry conditions
16 16 Medium 386 28 0.67 10 26 2 City-owned Property Use boom mower
17 17 High 616 46 0.29 70 124 9 City-owned Property No easy equipment access - hand cut
18 18 Medium 386 28 0.85 25 82 6 City-owned/Private w/easement Property No easy equipment access - hand cut
19 19 Medium 386 28 0.63 0 0 0 Private Property - no easement
20 20 Low 202 15 0.32 0 0 0 Private Property - no easement
21 21 Medium 386 28 0.08 0 0 0 Private Property - no easement
22 22 Medium 386 28 2.47 70 668 48 City-owned Property Use tractor during dry conditions
23 23 Medium 386 28 0.29 0 0 0 Private Property - no easement
24 24 Medium 386 28 0.30 10 11 1 Private Property w/easement Use boom mower
25 25 Medium 386 28 0.37 70 101 7 Private Property w/easement Use tractor during dry conditions
26 26 Low 202 15 0.35 50 36 3 City-owned Property No easy equipment access from street - hand cut
27 27 Medium 386 28 0.46 25 44 3 City-owned/Private w/easement Property No easy equipment access - hand cut
28 28 Low 202 15 0.19 50 19 1 City-owned Property No easy equipment access from street - hand cut
29 29 Medium 386 28 0.30 70 81 6 Private Property w/easement No easy equipment access - hand cut
30 30 Medium 386 28 0.53 10 20 1 Rail Road Right-of-way Use boom mower/tractor at the end of Gum Ave.
31 31 Low 202 15 0.31 70 44 3 Private Property w/easement Use tractor during dry conditions
32 32 Medium 386 28 1.06 30 122 9 City-owned/Private w/easement Property Use tractor during dry conditions
33 33 Low 202 15 6.78 25 343 25 Private Property w/easement Use tractor during dry conditions
34 34 Low 202 15 0.31 70 44 3 Private Property w/easement Use boom mower
35 35 Medium 386 28 0.19 70 52 4 City-owned/Private w/easement Property Use boom mower
36 36 Medium 386 28 0.59 70 160 12 City-owned Property Use tractor during dry conditions
37 37 Medium 386 28 0.43 70 116 8 City-owned Property Use tractor during dry conditions
38 38 Medium 386 28 0.20 60 47 3 City-owned Property Use boom mower
39 39 Medium 386 28 0.45 60 105 8 City-owned/Private w/easement Property Use boom mower
40 40 Medium 386 28 0.35 60 81 6 City-owned Property Use boom mower
41 41 Low 202 15 1.64 50 165 12 City-owned Property Use boom mower
42 42 Medium 386 28 1.16 60 269 20 City-owned Property Use boom mower
Sample Location
Included Sample
Locations
Dry-weight Category
Approx. Area of Phragmites (ac)
Percentage of Harvestable Area Description of Surrounding Property
Ave. Yield Rates (lbs/ac) Potential Reductions (lbs)Potential Harvest Process
Analysis of Harvested Wetlands Potential in Virginia Beach
23 URS No. 11658362 December 2012
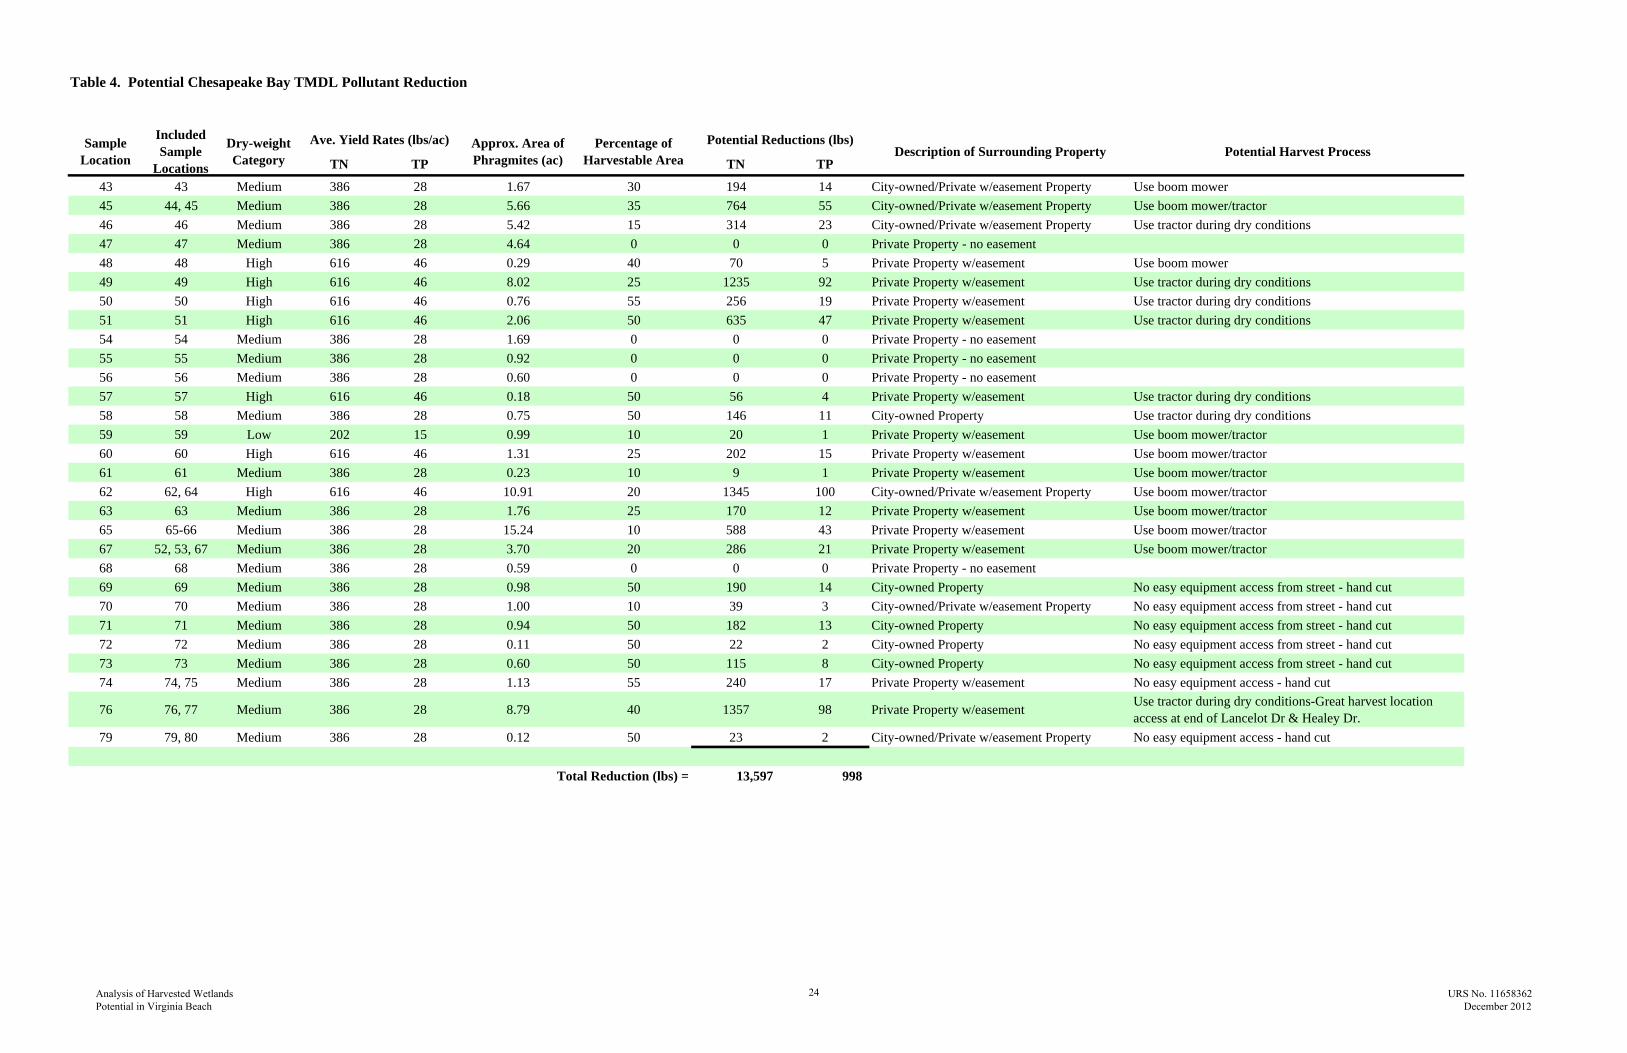
Table 4. Potential Chesapeake Bay TMDL Pollutant Reduction
TN TP TN TPSample
Location
Included Sample
Locations
Dry-weight Category
Approx. Area of Phragmites (ac)
Percentage of Harvestable Area Description of Surrounding Property
Ave. Yield Rates (lbs/ac) Potential Reductions (lbs)Potential Harvest Process
43 43 Medium 386 28 1.67 30 194 14 City-owned/Private w/easement Property Use boom mower
45 44, 45 Medium 386 28 5.66 35 764 55 City-owned/Private w/easement Property Use boom mower/tractor
46 46 Medium 386 28 5.42 15 314 23 City-owned/Private w/easement Property Use tractor during dry conditions
47 47 Medium 386 28 4.64 0 0 0 Private Property - no easement
48 48 High 616 46 0.29 40 70 5 Private Property w/easement Use boom mower
49 49 High 616 46 8.02 25 1235 92 Private Property w/easement Use tractor during dry conditions
50 50 High 616 46 0.76 55 256 19 Private Property w/easement Use tractor during dry conditions
51 51 High 616 46 2.06 50 635 47 Private Property w/easement Use tractor during dry conditions
54 54 Medium 386 28 1.69 0 0 0 Private Property - no easement
55 55 Medium 386 28 0.92 0 0 0 Private Property - no easement
56 56 Medium 386 28 0.60 0 0 0 Private Property - no easement
57 57 High 616 46 0.18 50 56 4 Private Property w/easement Use tractor during dry conditions
58 58 Medium 386 28 0.75 50 146 11 City-owned Property Use tractor during dry conditions
59 59 Low 202 15 0.99 10 20 1 Private Property w/easement Use boom mower/tractor
60 60 High 616 46 1.31 25 202 15 Private Property w/easement Use boom mower/tractor
61 61 Medium 386 28 0.23 10 9 1 Private Property w/easement Use boom mower/tractor
62 62, 64 High 616 46 10.91 20 1345 100 City-owned/Private w/easement Property Use boom mower/tractor
63 63 Medium 386 28 1.76 25 170 12 Private Property w/easement Use boom mower/tractor
65 65-66 Medium 386 28 15.24 10 588 43 Private Property w/easement Use boom mower/tractor
67 52, 53, 67 Medium 386 28 3.70 20 286 21 Private Property w/easement Use boom mower/tractor
68 68 Medium 386 28 0.59 0 0 0 Private Property - no easement
69 69 Medium 386 28 0.98 50 190 14 City-owned Property No easy equipment access from street - hand cut
70 70 Medium 386 28 1.00 10 39 3 City-owned/Private w/easement Property No easy equipment access from street - hand cut
71 71 Medium 386 28 0.94 50 182 13 City-owned Property No easy equipment access from street - hand cut
72 72 Medium 386 28 0.11 50 22 2 City-owned Property No easy equipment access from street - hand cut
73 73 Medium 386 28 0.60 50 115 8 City-owned Property No easy equipment access from street - hand cut
74 74, 75 Medium 386 28 1.13 55 240 17 Private Property w/easement No easy equipment access - hand cut
76 76, 77 Medium 386 28 8.79 40 1357 98 Private Property w/easementUse tractor during dry conditions-Great harvest location access at end of Lancelot Dr & Healey Dr.
79 79, 80 Medium 386 28 0.12 50 23 2 City-owned/Private w/easement Property No easy equipment access - hand cut
Total Reduction (lbs) = 13,597 998
Analysis of Harvested Wetlands Potential in Virginia Beach
24 URS No. 11658362 December 2012
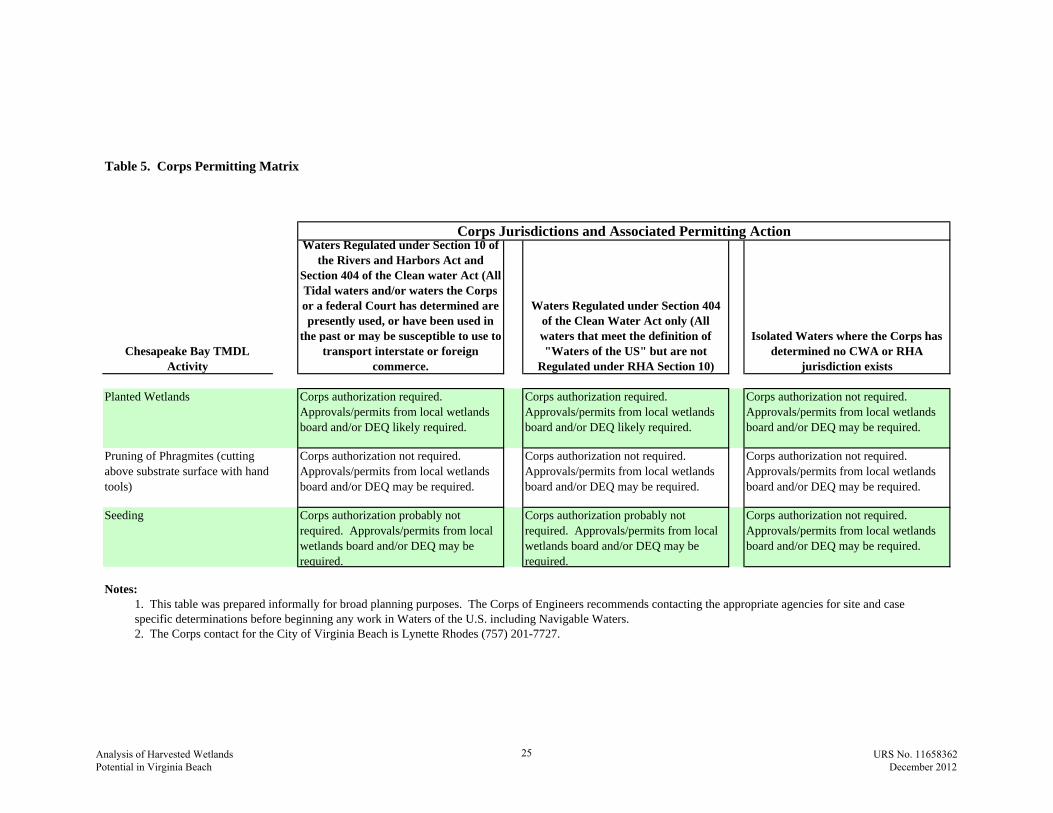
Table 5. Corps Permitting Matrix
Chesapeake Bay TMDL Activity
Waters Regulated under Section 10 of the Rivers and Harbors Act and
Section 404 of the Clean water Act (All Tidal waters and/or waters the Corps or a federal Court has determined are presently used, or have been used in
the past or may be susceptible to use to transport interstate or foreign
commerce.
Waters Regulated under Section 404 of the Clean Water Act only (All waters that meet the definition of "Waters of the US" but are not
Regulated under RHA Section 10)
Isolated Waters where the Corps has determined no CWA or RHA
jurisdiction exists
Planted Wetlands Corps authorization required. Approvals/permits from local wetlands board and/or DEQ likely required.
Corps authorization required. Approvals/permits from local wetlands board and/or DEQ likely required.
Corps authorization not required. Approvals/permits from local wetlands board and/or DEQ may be required.
Pruning of Phragmites (cutting above substrate surface with hand tools)
Corps authorization not required. Approvals/permits from local wetlands board and/or DEQ may be required.
Corps authorization not required. Approvals/permits from local wetlands board and/or DEQ may be required.
Corps authorization not required. Approvals/permits from local wetlands board and/or DEQ may be required.
Seeding Corps authorization probably not required. Approvals/permits from local wetlands board and/or DEQ may be required.
Corps authorization probably not required. Approvals/permits from local wetlands board and/or DEQ may be required.
Corps authorization not required. Approvals/permits from local wetlands board and/or DEQ may be required.
Notes:1. This table was prepared informally for broad planning purposes. The Corps of Engineers recommends contacting the appropriate agencies for site and casespecific determinations before beginning any work in Waters of the U.S. including Navigable Waters.2. The Corps contact for the City of Virginia Beach is Lynette Rhodes (757) 201-7727.
Corps Jurisdictions and Associated Permitting Action
Analysis of Harvested Wetlands Potential in Virginia Beach
25 URS No. 11658362 December 2012

Table 6. Comparative Treatment Costs
Source: City of Virginia Beach, Public Works
BMP 1
Cost for Removal of Total Nitrogen
(TN)
Cost for Removal of Total Phosphorous
(TP)
Cost for Removal of Total Suspended
Solids(TSS)
Sanctuary Oyster Reef 2
(Reconstruction/Renovation Every 5 Years) 50 to 100 N/A 0.50 to 1.50
Sanctuary Oyster Reef 2
(Reconstruction/Renovation Every 10 Years) 25 to 50 N/A 0.25 to 1.00
Boat Pumpouts in No
Discharge Zone 3 15 to 75 200 to 1,000 20 to 250
Phragmites Harvesting 4 25 to 150 500 to 1,500 N/A
Stream Restoration 5 400 to 750 2,500 to 5,000 5 to 8
Stream Bank Stabilization 5 400 to 750 2,500 to 5,000 5 to 8
Bioretention Basin 6 300 to 600 3,000 to 4,000 10 to 15
Pond 7 500 to 2,000 4,000 to 8,000 15 to 75
Cistern 8 5,500 to 9,500 45,000 to 85,000 700 to 1,000
Notes:1. The estimated pollutant removal costs do not include land acquisition or easement fees required for construction and/or maintenance of the BMPs.
3. Boat Pumpout in No Discharge Zone costs are based on estimates of removal rates of 0.014 lbs./gal. for TN, 0.001 lbs./gal. for TP and 0.01 to 0.001 lbs./gal. for TSS. The annual pumpout volume was calculated assuming 3 twenty-five gallon pumpouts per hour at pumpout facility, 12 hours per day for 260 days per year. A capital outlay of $50,000 every 10 years was assumed, as well as a $5 fee per pumpout per the Clean Vessel Act.
Annual Estimated Cost Per Pound of Pollutant Removed
(2012 Dollars)
2. Sanctuary Oyster Reef removal estimates based upon Nitrogen removal rates of 200 pounds Total Nitrogen / Acre / Year and Total Suspended Solids removal rates of 20,000 pounds Total Suspended Solids / Acre / Year with no Phosphorus change, at a construction/renovation cost of $50,000 to $100,000 per Acre with oyster spat on shell planted annually or bi-annually.
Analysis of Harvested Wetlands Potential in Virginia Beach
26 URS No. 11658362 December 2012

Table 6. Comparative Treatment Costs
Source: City of Virginia Beach, Public Works
4. Nitrogen and phosphorus removal costs for harvesting phragmites were estimated assuming the harvest of 33 acres with a maximum total yield of approximately 13,500 lbs. of nitrogen and approximately 1,000 lbs. of phosphorous. Harvest rates were assumed to be 1/2 acre per day. Harvest costs include cutting and transport of the biomass out of the Chesapeake Bay watershed.
8. Cistern estimates based upon Center for Watershed Protection work, does not include pumps, piping, controls needed for use of the water.
5. Stream Restoration and Stream Bank Stabilization estimates based upon Center for Watershed Protection work with reconstruction/renovation at full original construction cost every 5 to 10 years.
6. Biorention Basin estimates based upon Center for Watershed Protection work with reconstruction/renovation at full original construction cost every 2.5 to 3 years.
7. Average annual pollutant removal costs for ponds for a 10 year period assuming reconstruction/retrofitting equal to the original construction cost after 10 years. Maintenance costs for the 10 year period were assumed to be 10% of the original construction cost.
Analysis of Harvested Wetlands Potential in Virginia Beach
27 URS No. 11658362 December 2012

Appendix A
Detailed Sampling Locations
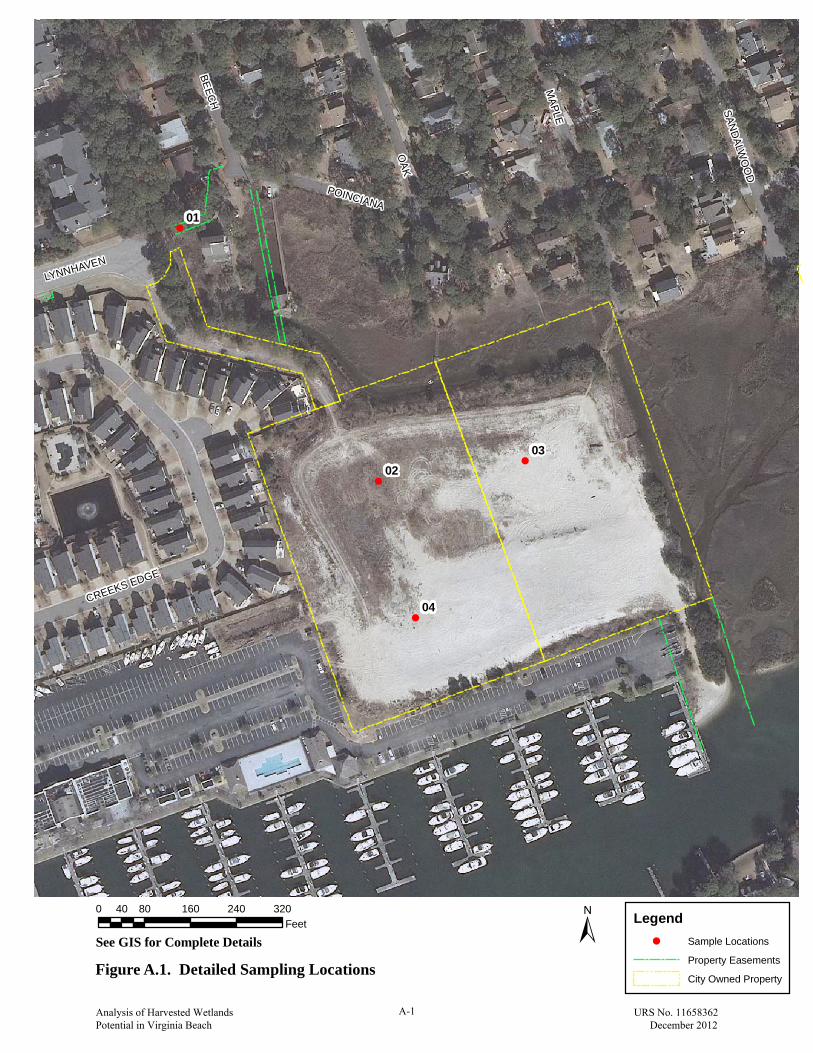
!
!
!
!03
04
02
01
OAK
MAPLE
POINCIANA
BEECH
SAND
ALWO
OD
CREEKS EDGE
LYNNHAVEN
Figure A.1. Detailed Sampling Locations
See GIS for Complete Details ± Legend! Sample Locations
Property Easements
City Owned Property
0 80 160 240 32040Feet
Analysis of Harvested Wetlands Potential in Virginia Beach
A-1 URS No. 11658362 December 2012

!
!
!07
0605
DEY COVE
CHAMBERLING
CH
AND
ON
GO
DFR
EY
Figure A.2. Detailed Sampling Locations
See GIS for Complete Details ± Legend! Sample Locations
Property Easements
City Owned Property
0 80 160 240 32040Feet
Analysis of Harvested Wetlands Potential in Virginia Beach
A-2 URS No. 11658362 December 2012

!
!
!
!
!
!73
72
71
70
69
68
24TH
BALTIC
25TH
26TH
LASKIN
22ND
B
264
21ST
C
HOLL
Y
30TH
A
ME
DITE
RR
AN
EAN
23RD
23RD HALF
27TH
22ND HALF
ORIOLE
21ST HALF
PAR
KS
PINEY BRANCH
24TH HALF
OLD VIRGINIA BEACH
25TH HALFOAKLAND
SEAWINDS
JIM COOKBARBERTON
CYP
RE
SS
LOR
AN
ELIZABETH
DRAKETAIL
TEN
BEE
FLEM
ING
WIIGWAS
QUAIL COVEY
26TH HALF
MARABOU
SUN
NIN
GH
ILL
PIN
E T
OP
S
MANOOMIN
MAR
SH C
REE
K
SEAWATCH
DONALD
23RD
22ND
CYPR
ESS
Figure A.3. Detailed Sampling Locations
See GIS for Complete Details ± Legend! Sample Locations
Property Easements
City Owned Property
0 200 400 600 800100Feet
Analysis of Harvested Wetlands Potential in Virginia Beach
A-3 URS No. 11658362 December 2012
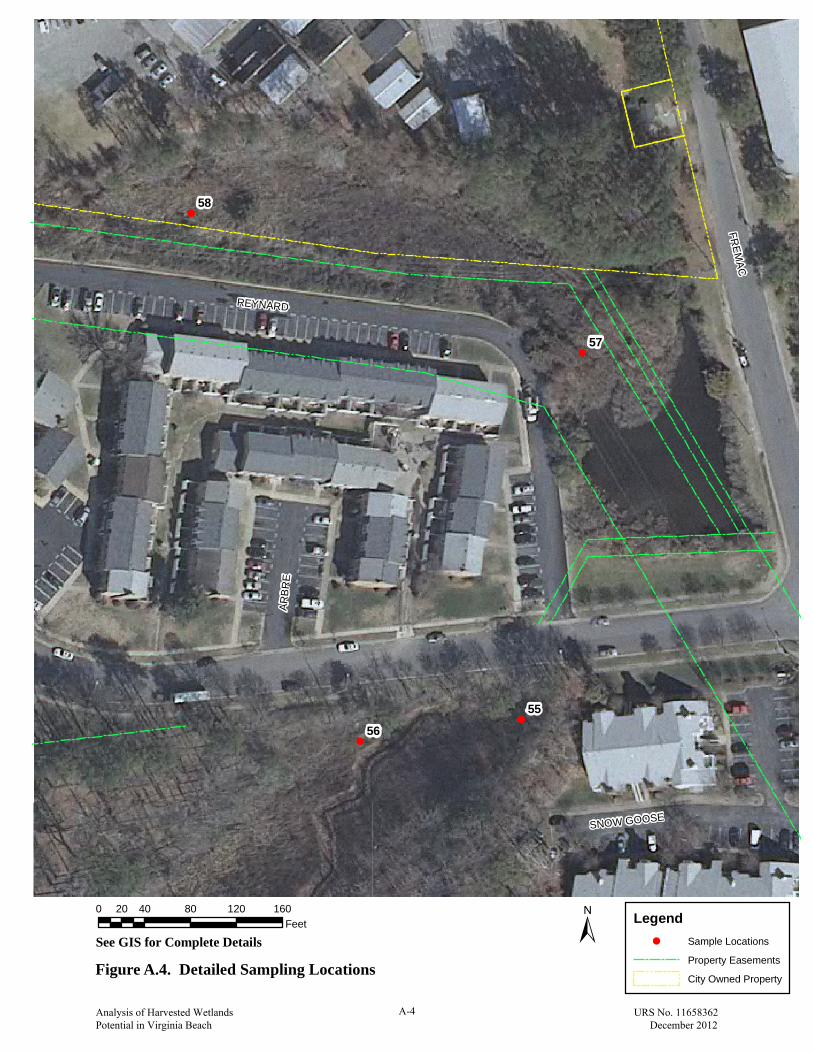
!
!
!
!58
57
56
55
REYNARD
FREM
AC
ARB
RE
SNOW GOOSE
Figure A.4. Detailed Sampling Locations
See GIS for Complete Details ± Legend! Sample Locations
Property Easements
City Owned Property
0 40 80 120 16020Feet
Analysis of Harvested Wetlands Potential in Virginia Beach
A-4 URS No. 11658362 December 2012
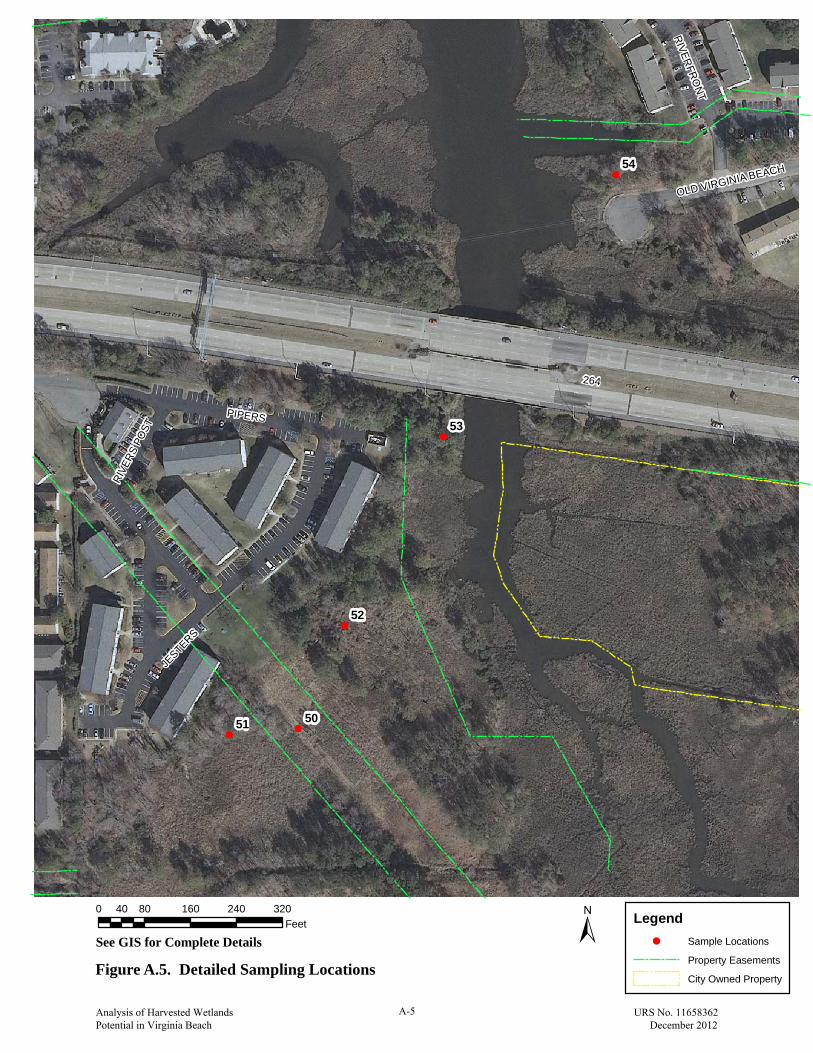
!!
!
!
!54
53
52
51 50
264
PIPERS
JESTERS
OLD VIRGINIA BEACH
RIVE
RS P
OST
RIVER
FRO
NT
Figure A.5. Detailed Sampling Locations
See GIS for Complete Details ± Legend! Sample Locations
Property Easements
City Owned Property
0 80 160 240 32040Feet
Analysis of Harvested Wetlands Potential in Virginia Beach
A-5 URS No. 11658362 December 2012

!
!
!
!
!
!67
66
63
60
59
09
VIRGINIA BEACH
ST P
AU
LS
DU
KE
S
CARVER
Figure A.6. Detailed Sampling Locations
See GIS for Complete Details ± Legend! Sample Locations
Property Easements
City Owned Property
0 80 160 240 32040Feet
Analysis of Harvested Wetlands Potential in Virginia Beach
A-6 URS No. 11658362 December 2012

!
!
!
!65
64
62
61
JENSEN
SOUTHERN
DIS
TRIB
UTI
ON
JACKSON
Figure A.7. Detailed Sampling Locations
See GIS for Complete Details ± Legend! Sample Locations
Property Easements
City Owned Property
0 100 200 300 40050Feet
Analysis of Harvested Wetlands Potential in Virginia Beach
A-7 URS No. 11658362 December 2012
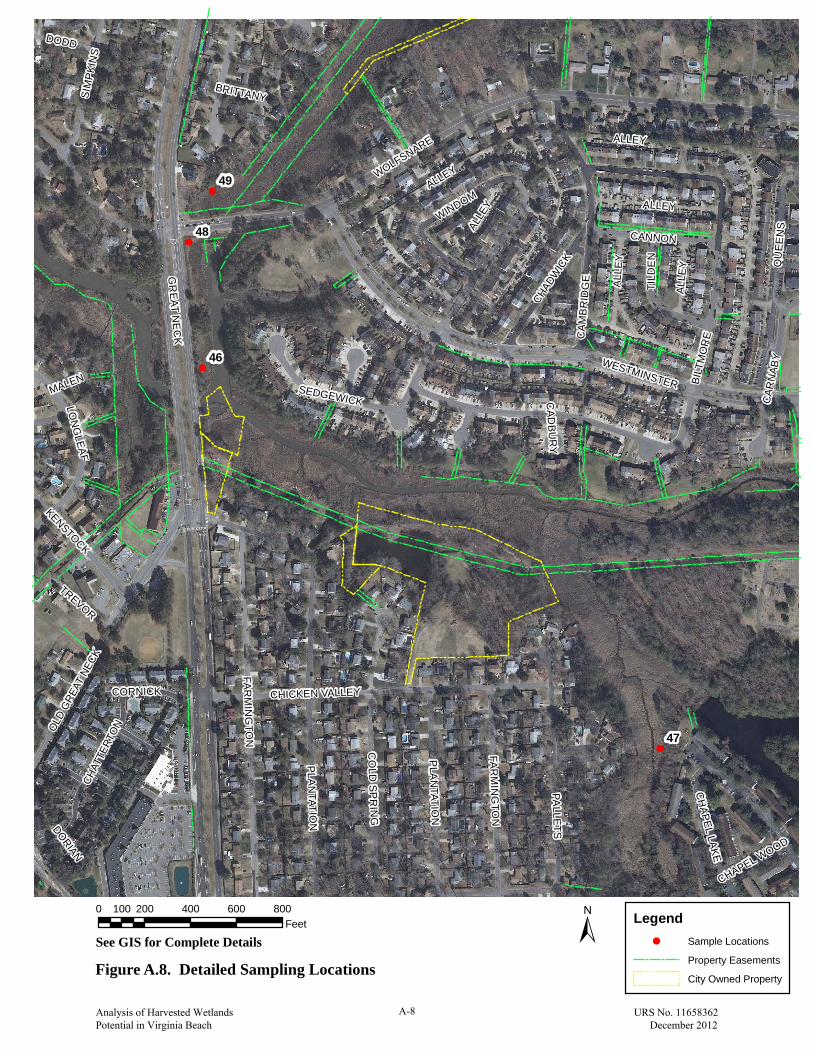
!
!
!
!49
48
47
46
GR
EAT N
EC
K
WOLFSNARE
WESTMINSTER BILT
MO
REC
AM
BR
IDG
E
CHICKEN VALLEY
ALLEY
CO
LD S
PR
ING
PLA
NTATIO
N
SIM
PKI
NS
OLD
GRE
AT N
ECK
FAR
MIN
GTO
N
CAR
NAB
Y
CANNON
QU
EE
NS
PAL LE
TS
T ILD
EN
CHAD
WIC
K
CHAT
TERT
ON
LON
GLEA
F
KENSTOCK
WINDOM
CH
APEL LAKE
DODD
CORNICK
TREVOR
SEDGEWICK
CHAPEL WOOD
BRITTANY
MALEN
DORIAN
CA
DB
UR
Y
ALL
EY
ALLEY
ALL
EY
PL A
NTAT IO
N
ALLEY
ALLE
Y
FAR
MIN
GTO
N
Figure A.8. Detailed Sampling Locations
See GIS for Complete Details ± Legend! Sample Locations
Property Easements
City Owned Property
0 200 400 600 800100Feet
Analysis of Harvested Wetlands Potential in Virginia Beach
A-8 URS No. 11658362 December 2012

!
!
!10
33
32
LYN
NH
AVEN
VIKING
MARLENE
POTTERS
GOLDEN OAK
EMERALD
GIM
BERT
Figure A.9. Detailed Sampling Locations
See GIS for Complete Details ±Legend
! Sample Locations
Property Easements
City Owned Property
0 120 240 360 48060Feet
Analysis of Harvested Wetlands Potential in Virginia Beach
A-9 URS No. 11658362 December 2012
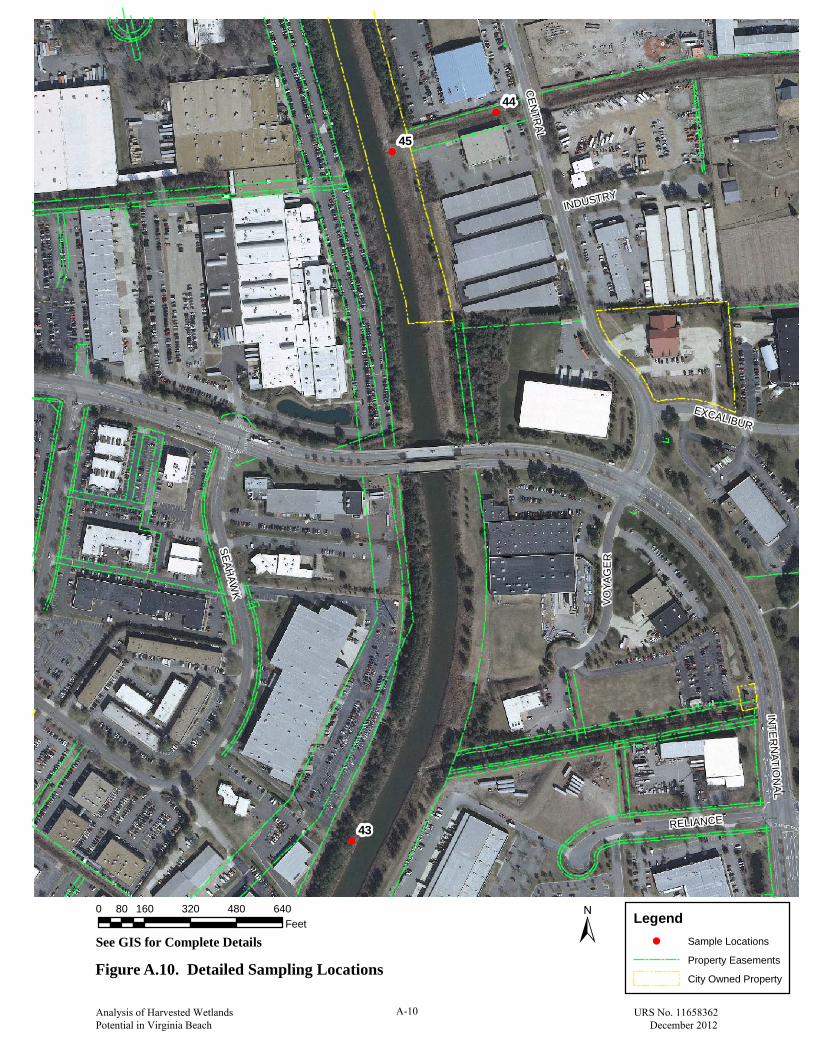
!
!
!43
45
44
INTE
RN
ATION
AL
CEN
TRAL
SEAHAW
K
RELIANCE
VO
YAG
ER
INDUSTRY
EXCALIBUR
Figure A.10. Detailed Sampling Locations
See GIS for Complete Details ± Legend! Sample Locations
Property Easements
City Owned Property
0 160 320 480 64080Feet
Analysis of Harvested Wetlands Potential in Virginia Beach
A-10 URS No. 11658362 December 2012
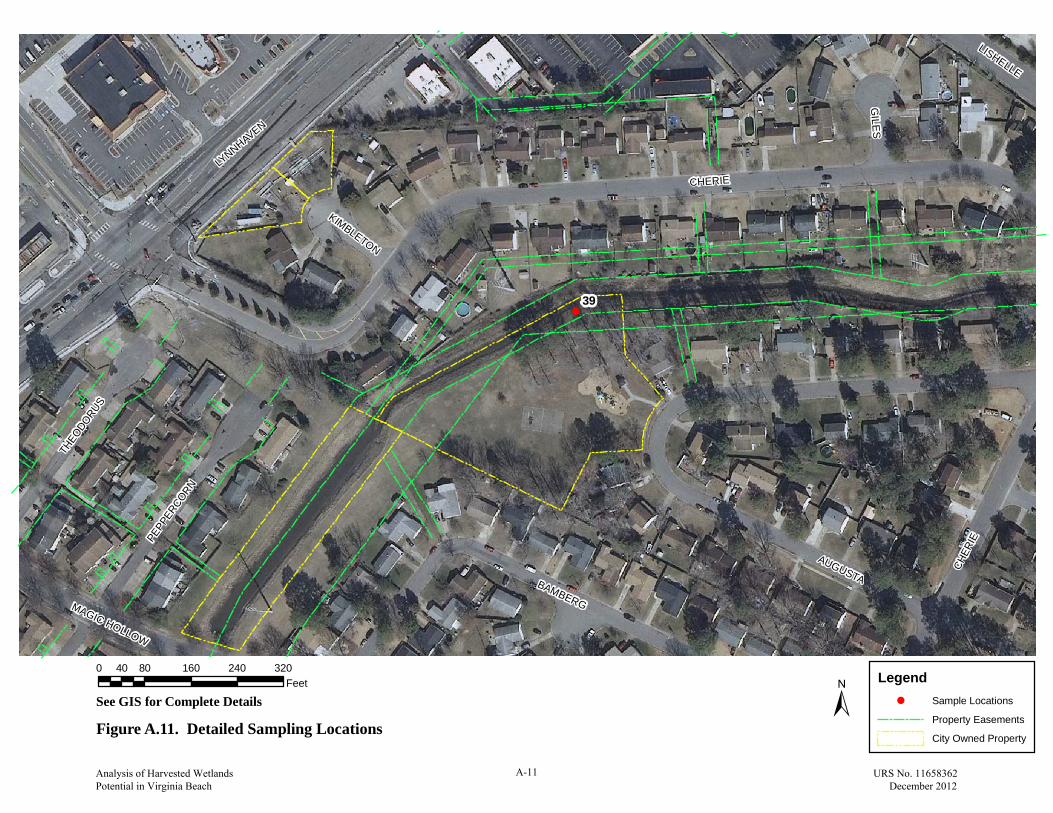
!39
CHERIE
AUGUSTABAMBERG
LYNNHAVEN
PEPP
ERCORN
THEO
DORUS
GILE
S
MAGIC HOLLOW
LISHELLE
KIMBLETON
CHER
IE
Figure A.11. Detailed Sampling Locations
See GIS for Complete Details ±Legend
! Sample Locations
Property Easements
City Owned Property
0 80 160 240 32040Feet
Analysis of Harvested Wetlands Potential in Virginia Beach
A-11 URS No. 11658362 December 2012

!38
DURBIN
BLACKSTO
NE
DUBOIS
DANTEJA
NS
EN
BAM
BER
GBLITZ
DEDI
CARDO
MAGIC HOLLOW
TREW
EY
BOSCO
FAWKES
DEKOLTA
HERRMANN
BRESLAW
TALON
COMTE
Figure A.12. Detailed Sampling Locations
See GIS for Complete Details ± Legend! Sample Locations
Property Easements
City Owned Property
0 80 160 240 32040Feet
Analysis of Harvested Wetlands Potential in Virginia Beach
A-12 URS No. 11658362 December 2012

!
!40
14
SALISBUR
Y
MAGIC HOLLOW
DELAWARE
OLD GLORY
GUTHER
FETSCH
BLITZ
NEW L
AND
BLACKSTONE
DURBIN
ARDITO
DUBOIS
BRACKEN
STURBRIDGE
NEW
LAN
DN
EW
LA
ND
Figure A.13. Detailed Sampling Locations
See GIS for Complete Details ± Legend! Sample Locations
Property Easements
City Owned Property
0 80 160 240 32040Feet
Analysis of Harvested Wetlands Potential in Virginia Beach
A-13 URS No. 11658362 December 2012
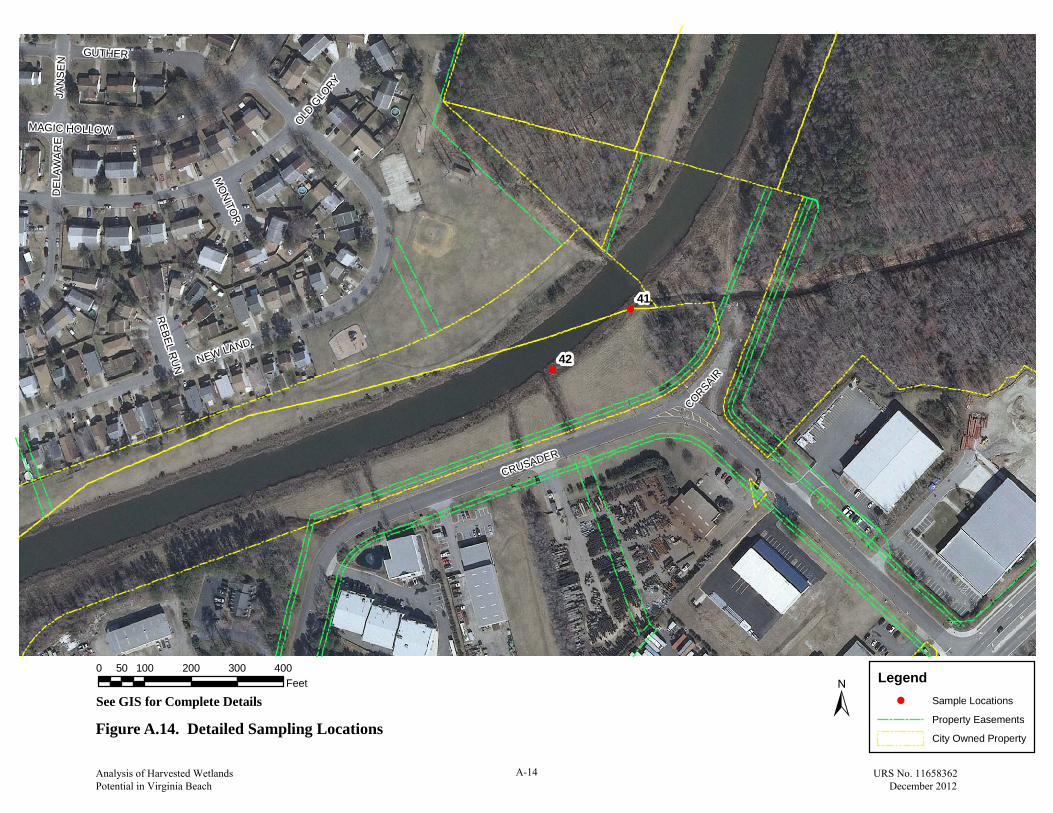
!
!42
41
CRUSADER
NEW LAND
OLD G
LORY
GUTHER
MAGIC HOLLOW
DE
LAW
AR
EJA
NS
EN
CORSAIR
MO
NITO
R
REBEL R
UN
Figure A.14. Detailed Sampling Locations
See GIS for Complete Details ±Legend
! Sample Locations
Property Easements
City Owned Property
0 100 200 300 40050Feet
Analysis of Harvested Wetlands Potential in Virginia Beach
A-14 URS No. 11658362 December 2012

!!
!35
3736
DAM NECK
DR
AKES
MIL
E
SHIPPS CORNER
SHIPPS CORNER
Figure A.15. Detailed Sampling Locations
See GIS for Complete Details ± Legend! Sample Locations
Property Easements
City Owned Property
0 120 240 360 48060Feet
Analysis of Harvested Wetlands Potential in Virginia Beach
A-15 URS No. 11658362 December 2012
!34
LYNN
HAVE
N
CR
EEKSIDE
OLD C
LUBH
OUSE
FERN RIDGE
RIVERBEND
MANOR GLENN
REDGROVE
CLUB HOUSE
Figure A.16. Detailed Sampling Locations
See GIS for Complete Details ± Legend! Sample Locations
Property Easements
City Owned Property
0 80 160 240 32040Feet
Analysis of Harvested Wetlands Potential in Virginia Beach
A-16 URS No. 11658362 December 2012
!08
CA
LVE
RTO
N
WHITE ACRES
KINGS WAY
WIS
HA
RT
LAK
E
Figure A.17. Detailed Sampling Locations
See GIS for Complete Details ±Legend
! Sample Locations
Property Easements
City Owned Property
0 80 160 240 32040Feet
Analysis of Harvested Wetlands Potential in Virginia Beach
A-17 URS No. 11658362 December 2012
!
!12
11
CHESWICK
Figure A.18. Detailed Sampling Locations
See GIS for Complete Details ±Legend
! Sample Locations
Property Easements
City Owned Property
0 80 160 240 32040Feet
Analysis of Harvested Wetlands Potential in Virginia Beach
A-18 URS No. 11658362 December 2012

!26
SUFF
OLK
KINGS GRANT
ATLE
Y
CU
RC
ON
Figure A.19. Detailed Sampling Locations
See GIS for Complete Details ± Legend! Sample Locations
Property Easements
City Owned Property
0 60 120 180 24030Feet
Analysis of Harvested Wetlands Potential in Virginia Beach
A-19 URS No. 11658362 December 2012
!28
HARTON
RO
BE
NS
CATA
LIN
A
VIRGINIUS
ROYAL PALM
SANDY POINT
ROYAL PALM
Figure A.20. Detailed Sampling Locations
See GIS for Complete Details ± Legend! Sample Locations
Property Easements
City Owned Property
0 80 160 240 32040Feet
Analysis of Harvested Wetlands Potential in Virginia Beach
A-20 URS No. 11658362 December 2012
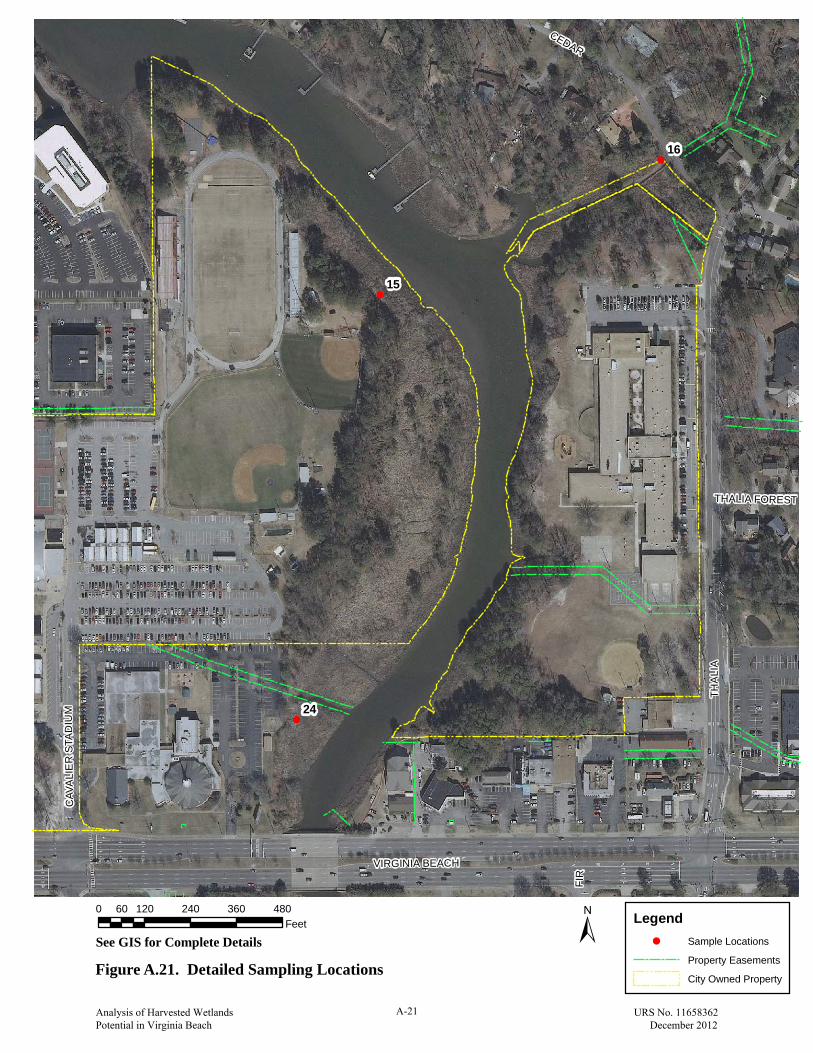
!
!
!16
15
24TH
ALI
A
VIRGINIA BEACH
CEDAR
CAV
ALI
ER
STA
DIU
M
FIR
THALIA FOREST
Figure A.21. Detailed Sampling Locations
See GIS for Complete Details ± Legend! Sample Locations
Property Easements
City Owned Property
0 120 240 360 48060Feet
Analysis of Harvested Wetlands Potential in Virginia Beach
A-21 URS No. 11658362 December 2012
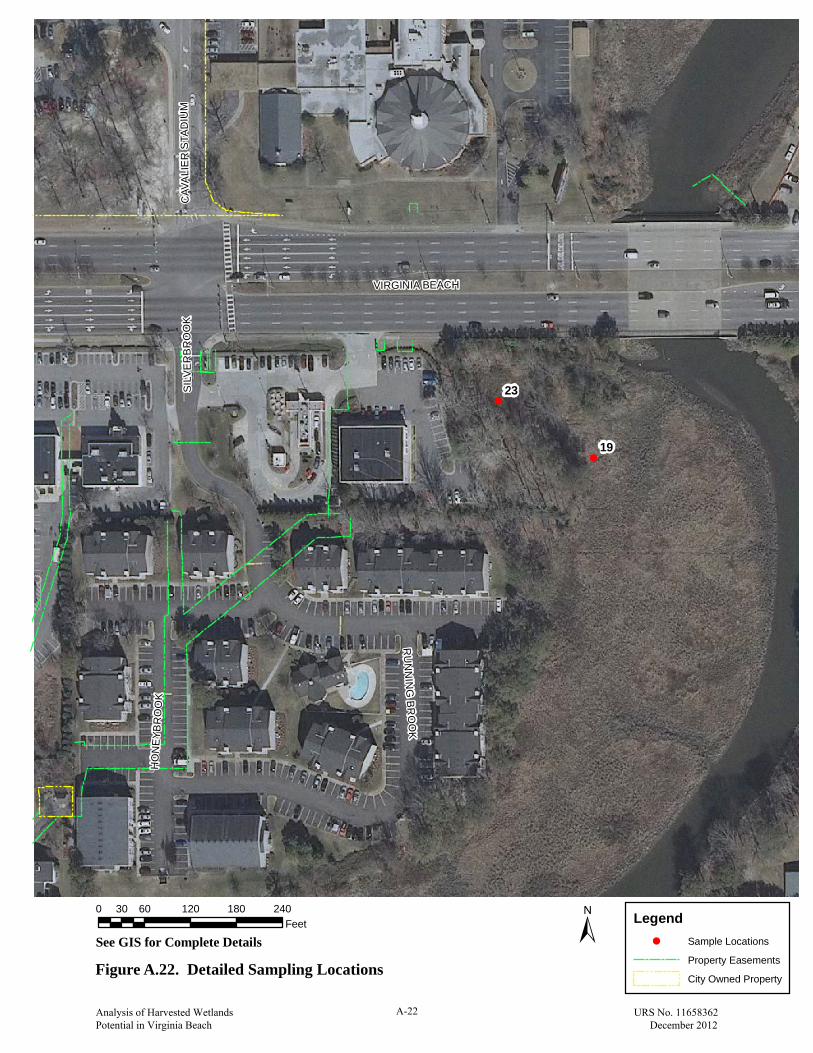
!
!23
19
VIRGINIA BEACH
SIL
VE
RB
RO
OK
HO
NE
YB
RO
OK
RU
NN
ING
BR
OO
K
CAV
ALI
ER
STA
DIU
M
Figure A.22. Detailed Sampling Locations
See GIS for Complete Details ± Legend! Sample Locations
Property Easements
City Owned Property
0 60 120 180 24030Feet
Analysis of Harvested Wetlands Potential in Virginia Beach
A-22 URS No. 11658362 December 2012
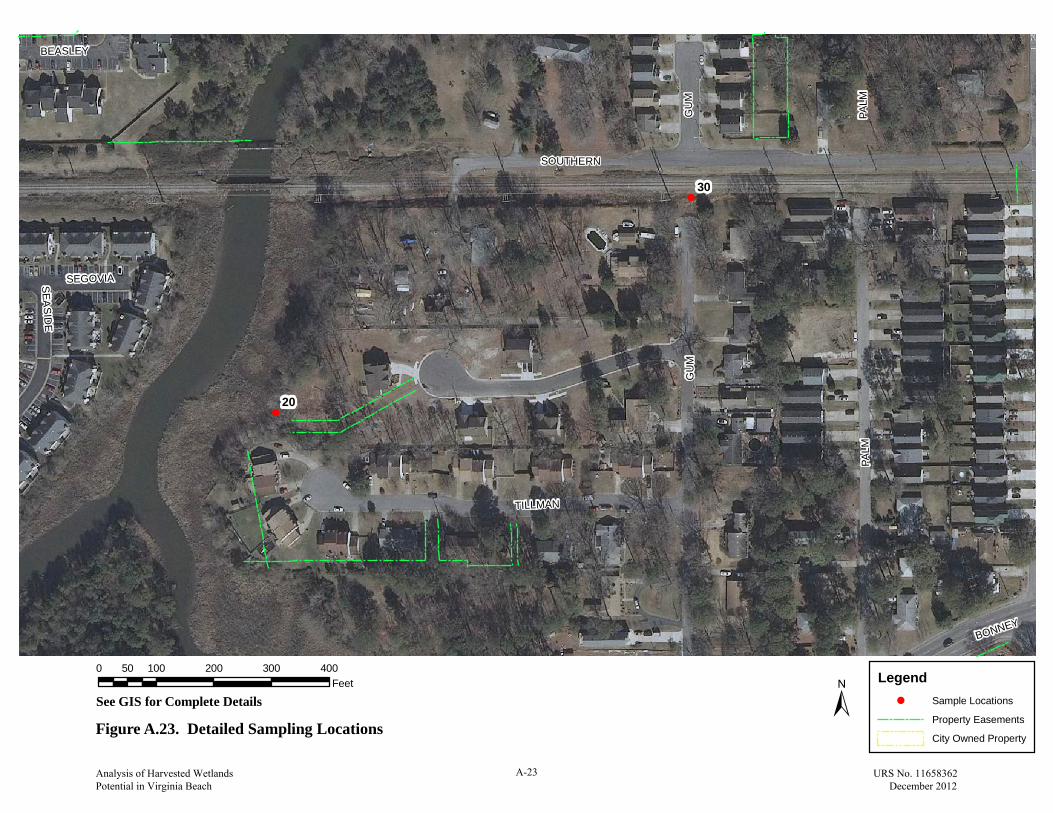
!
!30
20
GU
M
PALM
SOUTHERN
TILLMAN
SE
AS
IDE
BONNEY
SEGOVIA
BEASLEY
GU
M
PALM
Figure A.23. Detailed Sampling Locations
See GIS for Complete Details ±Legend
! Sample Locations
Property Easements
City Owned Property
0 100 200 300 40050Feet
Analysis of Harvested Wetlands Potential in Virginia Beach
A-23 URS No. 11658362 December 2012

!
!31
25
VIRGINIA BEACH
MAJESTIC
THALIA STATION
BO
GG
S
STEP
NEY
Figure A.24. Detailed Sampling Locations
See GIS for Complete Details ± Legend! Sample Locations
Property Easements
City Owned Property
0 80 160 240 32040Feet
Analysis of Harvested Wetlands Potential in Virginia Beach
A-24 URS No. 11658362 December 2012
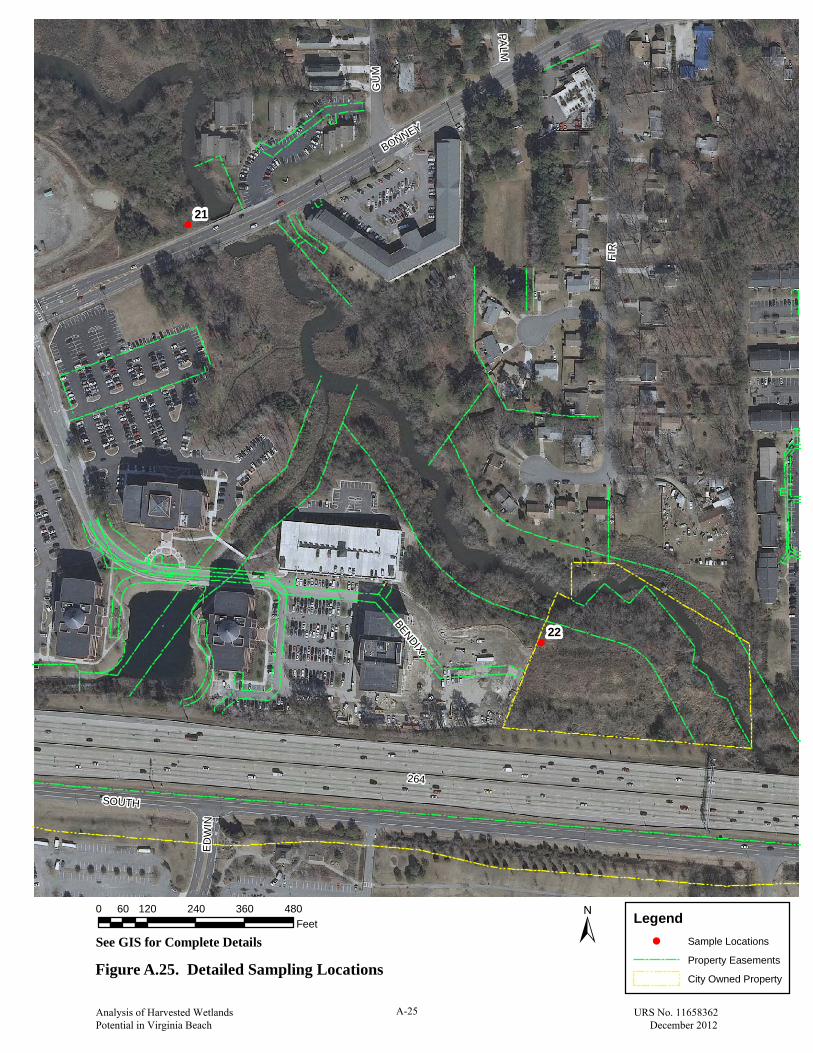
!
!22
21
264
SOUTH
FIR
BONNEY
BENDIX
GU
M
ED
WIN
PALM
Figure A.25. Detailed Sampling Locations
See GIS for Complete Details ± Legend! Sample Locations
Property Easements
City Owned Property
0 120 240 360 48060Feet
Analysis of Harvested Wetlands Potential in Virginia Beach
A-25 URS No. 11658362 December 2012
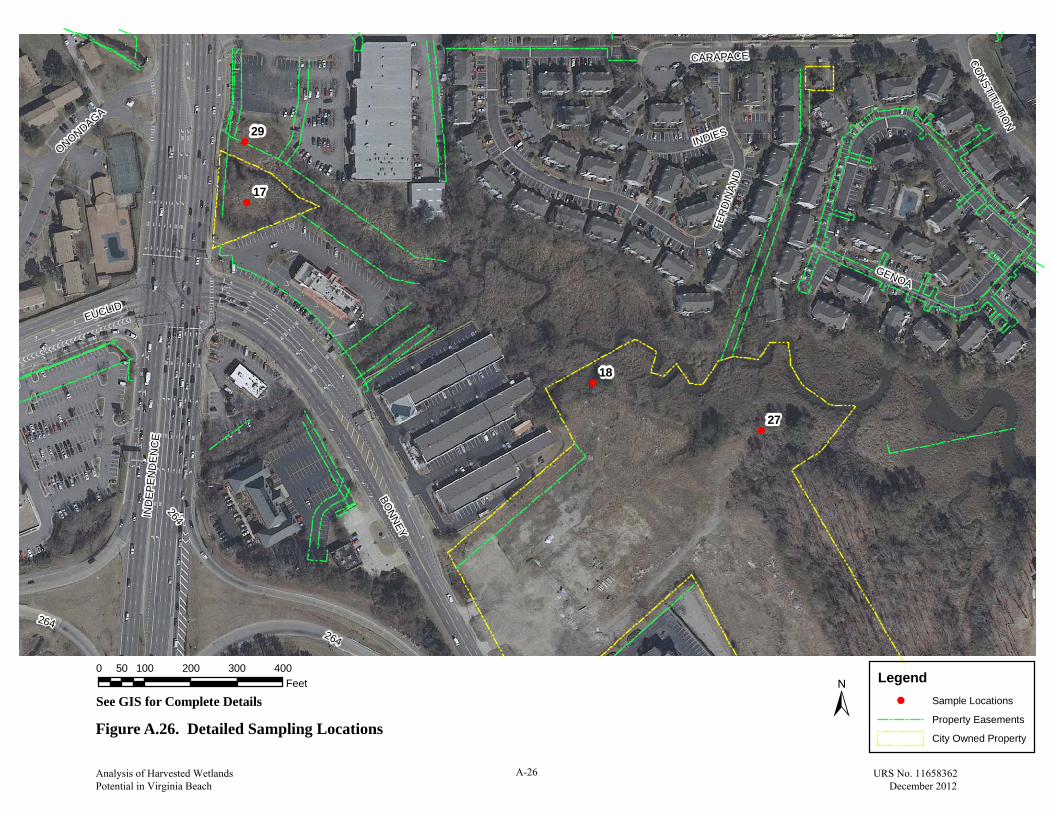
!
!
!
!29
27
18
17
264
BONNEY
IND
EPE
ND
EN
CE
CARAPACE
EUCLID
GENOA
ONONDAGA
FER
DIN
AND
INDIES
CONSTITUTIO
N
264
264
Figure A.26. Detailed Sampling Locations
See GIS for Complete Details ±Legend
! Sample Locations
Property Easements
City Owned Property
0 100 200 300 40050Feet
Analysis of Harvested Wetlands Potential in Virginia Beach
A-26 URS No. 11658362 December 2012
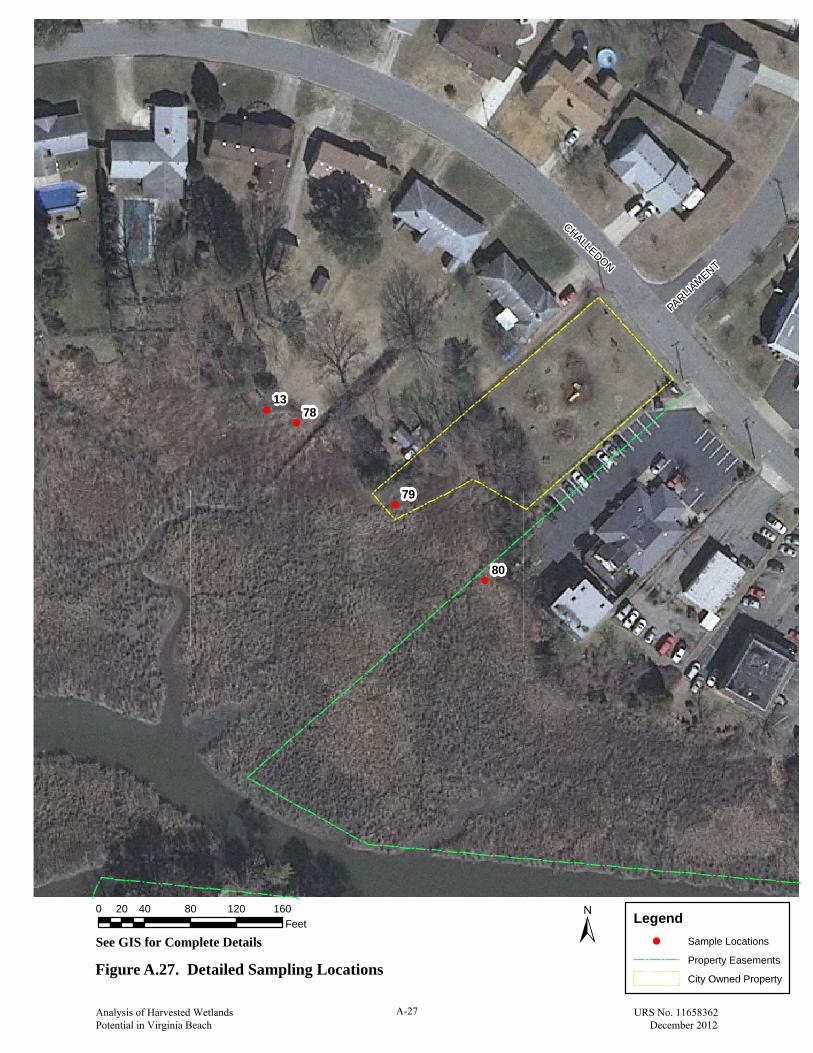
!
!
!
!13
79
78
80
CHALLEDON
PARLIAMENT
Figure A.27. Detailed Sampling Locations
See GIS for Complete Details ± Legend! Sample Locations
Property Easements
City Owned Property
0 40 80 120 16020Feet
Analysis of Harvested Wetlands Potential in Virginia Beach
A-27 URS No. 11658362 December 2012
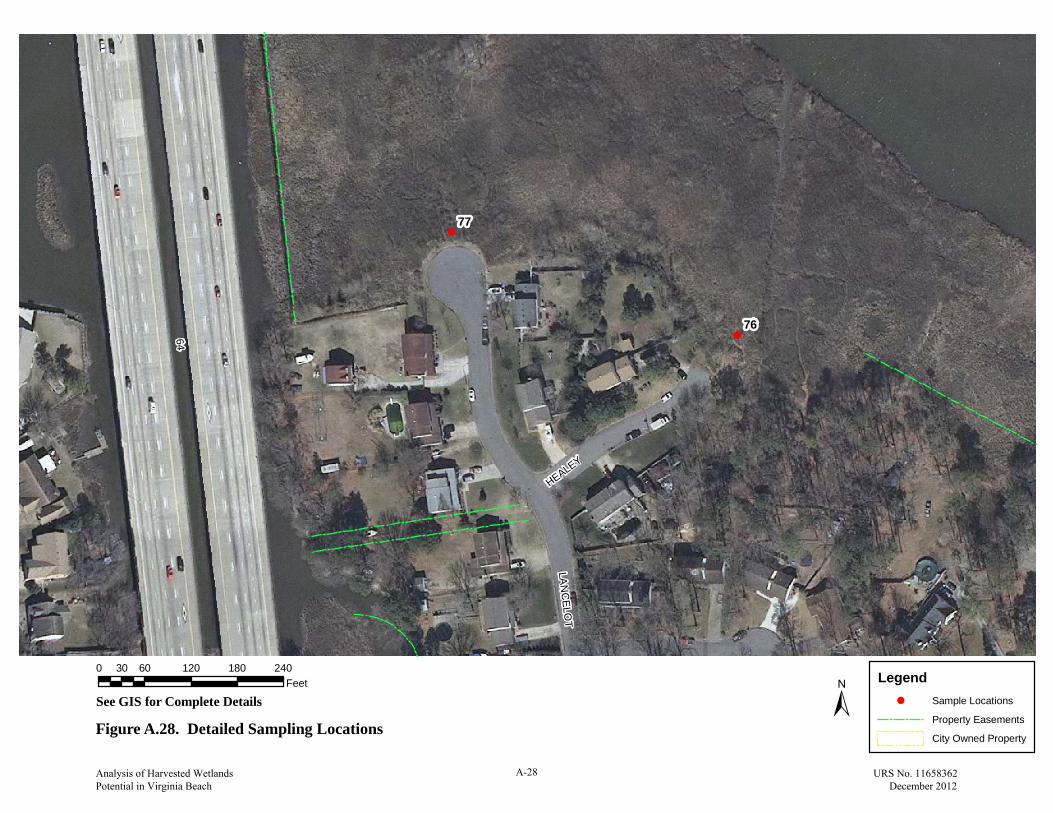
!
!77
76
64
LAN
CE
LOT
HEALEY
Figure A.28. Detailed Sampling Locations
See GIS for Complete Details ±Legend
! Sample Locations
Property Easements
City Owned Property
0 60 120 180 24030Feet
Analysis of Harvested Wetlands Potential in Virginia Beach
A-28 URS No. 11658362 December 2012
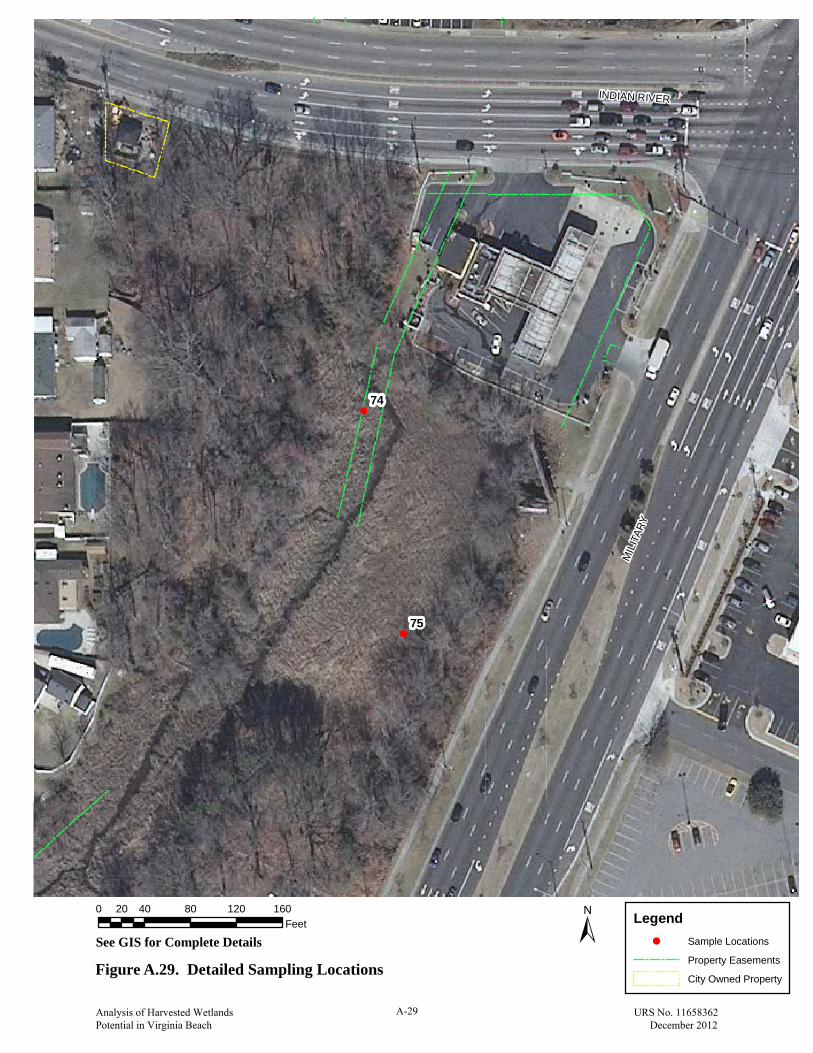
!
!75
74
MIL
ITAR
Y
INDIAN RIVER
Figure A.29. Detailed Sampling Locations
See GIS for Complete Details ± Legend! Sample Locations
Property Easements
City Owned Property
0 40 80 120 16020Feet
Analysis of Harvested Wetlands Potential in Virginia Beach
A-29 URS No. 11658362 December 2012

Appendix B
Photographs

Photo 1. Sample Location 4
Photo 2. Sample Location 4
Photos taken: Oct. & Nov. 2012 By: Bradberry/Hood/Tran/Alger
Analysis of Harvested Wetlands Potential in Virginia Beach
B-1 URS No. 11658362 December 2012

Photo 3. Sample Location 4
Photo 4. Sample Location 5
Photos taken: Oct. & Nov. 2012 By: Bradberry/Hood/Tran/Alger
Analysis of Harvested Wetlands Potential in Virginia Beach
B-2 URS No. 11658362 December 2012
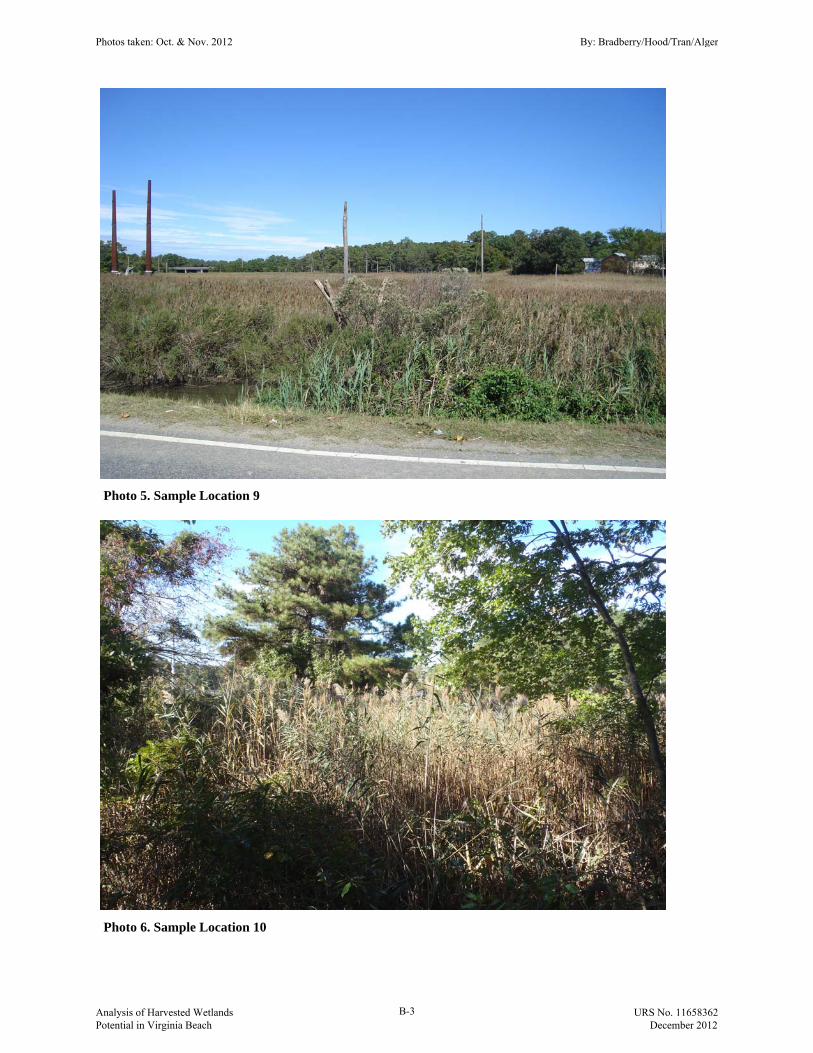
Photo 5. Sample Location 9
Photo 6. Sample Location 10
Photos taken: Oct. & Nov. 2012 By: Bradberry/Hood/Tran/Alger
Analysis of Harvested Wetlands Potential in Virginia Beach
B-3 URS No. 11658362 December 2012

Photo 7. Sample Location 14
Photo 8. Sample Location 17
Photos taken: Oct. & Nov. 2012 By: Bradberry/Hood/Tran/Alger
Analysis of Harvested Wetlands Potential in Virginia Beach
B-4 URS No. 11658362 December 2012
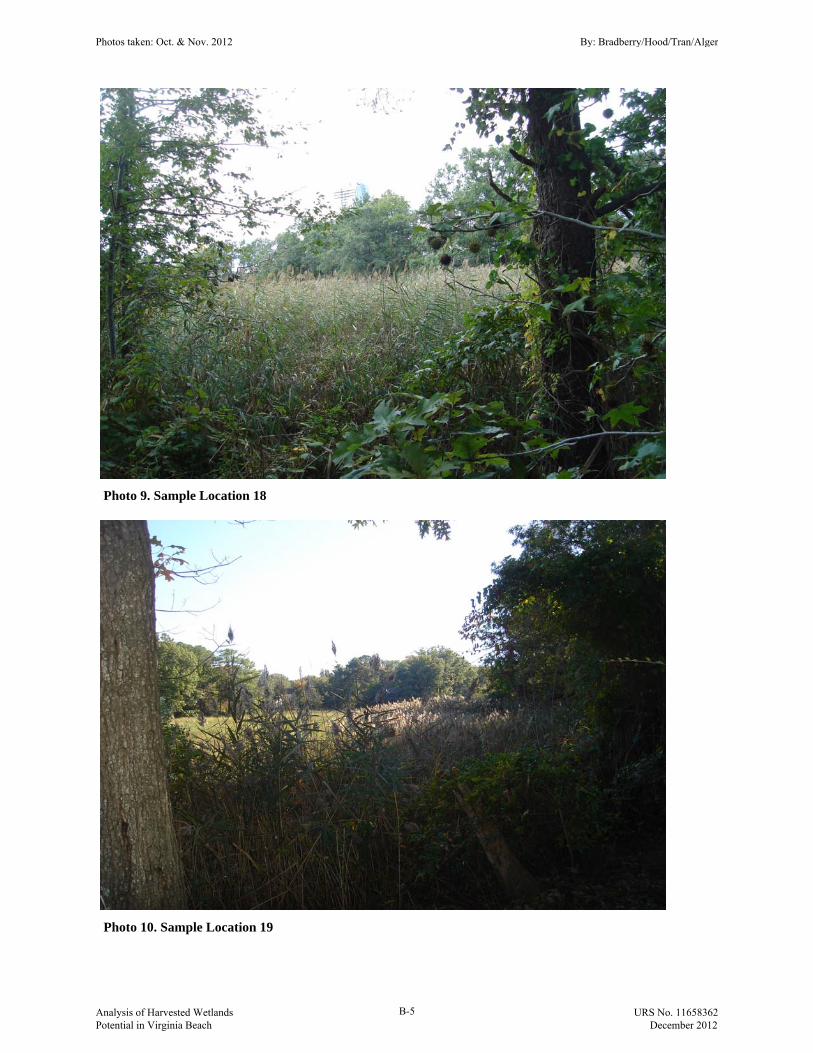
Photo 9. Sample Location 18
Photo 10. Sample Location 19
Photos taken: Oct. & Nov. 2012 By: Bradberry/Hood/Tran/Alger
Analysis of Harvested Wetlands Potential in Virginia Beach
B-5 URS No. 11658362 December 2012
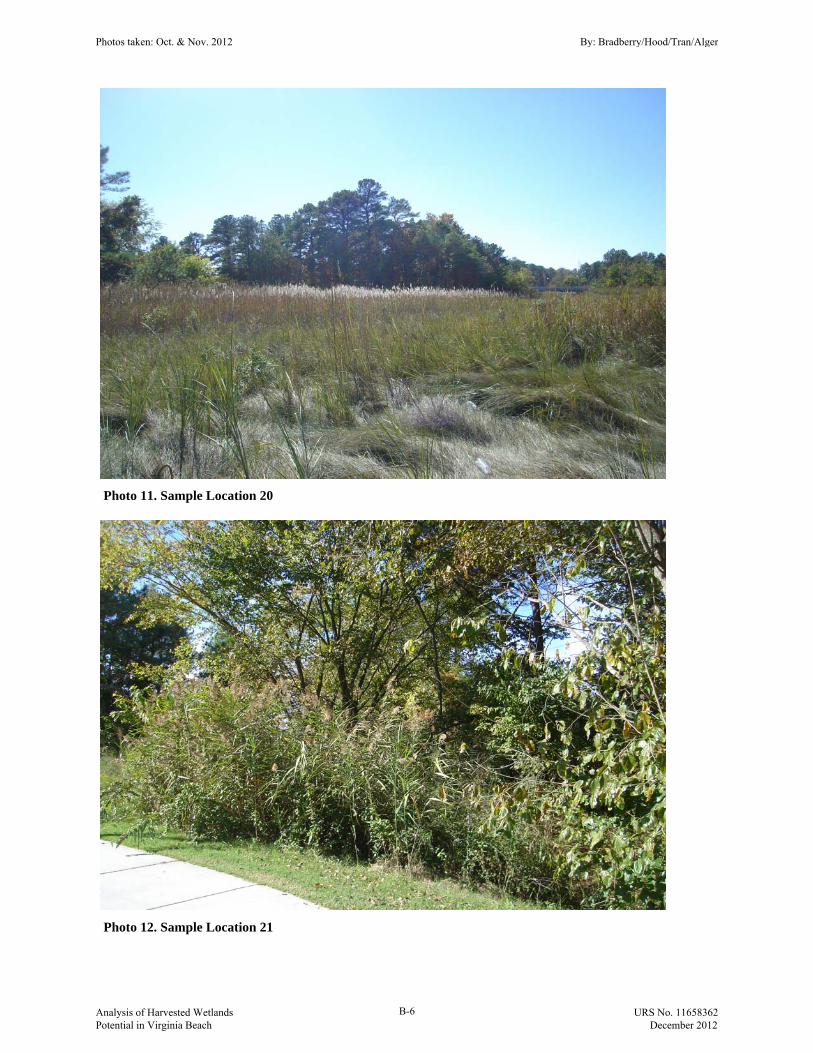
Photo 11. Sample Location 20
Photo 12. Sample Location 21
Photos taken: Oct. & Nov. 2012 By: Bradberry/Hood/Tran/Alger
Analysis of Harvested Wetlands Potential in Virginia Beach
B-6 URS No. 11658362 December 2012

Photo 13. Sample Location 22
Photo 14. Sample Location 23
Photos taken: Oct. & Nov. 2012 By: Bradberry/Hood/Tran/Alger
Analysis of Harvested Wetlands Potential in Virginia Beach
B-7 URS No. 11658362 December 2012

Photo 15. Sample Location 26
Photo 16. Sample Location 28
Photos taken: Oct. & Nov. 2012 By: Bradberry/Hood/Tran/Alger
Analysis of Harvested Wetlands Potential in Virginia Beach
B-8 URS No. 11658362 December 2012
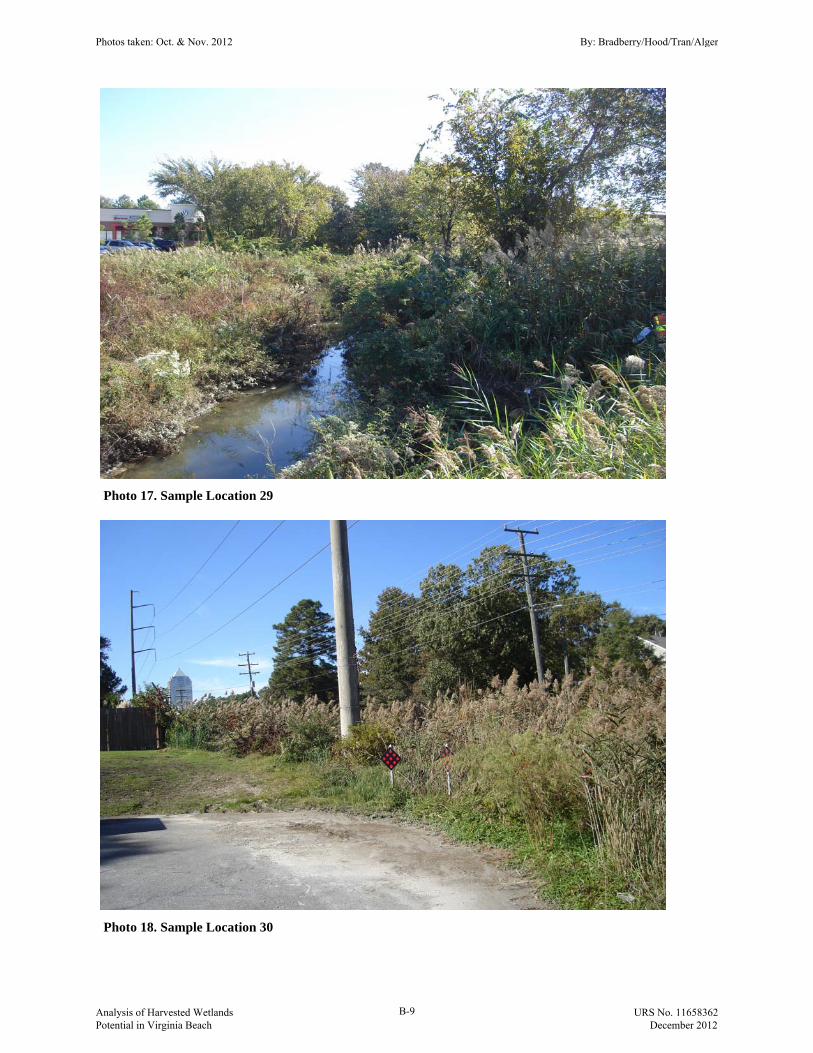
Photo 17. Sample Location 29
Photo 18. Sample Location 30
Photos taken: Oct. & Nov. 2012 By: Bradberry/Hood/Tran/Alger
Analysis of Harvested Wetlands Potential in Virginia Beach
B-9 URS No. 11658362 December 2012
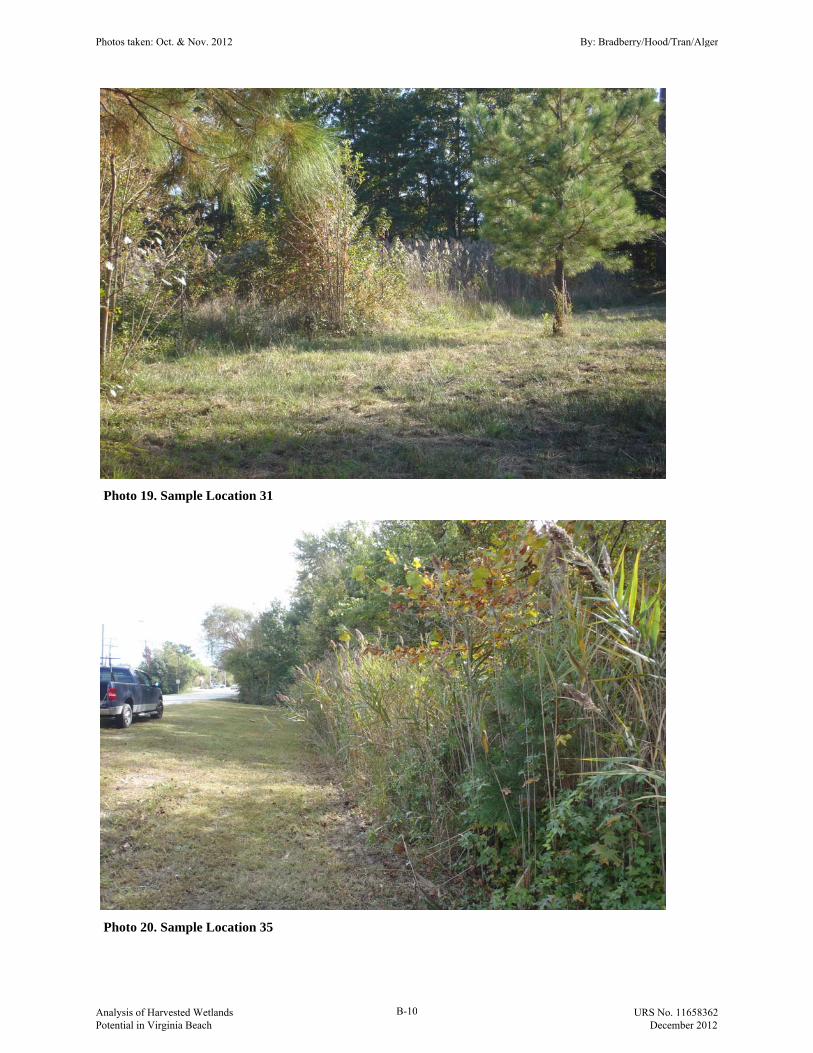
Photo 19. Sample Location 31
Photo 20. Sample Location 35
Photos taken: Oct. & Nov. 2012 By: Bradberry/Hood/Tran/Alger
Analysis of Harvested Wetlands Potential in Virginia Beach
B-10 URS No. 11658362 December 2012
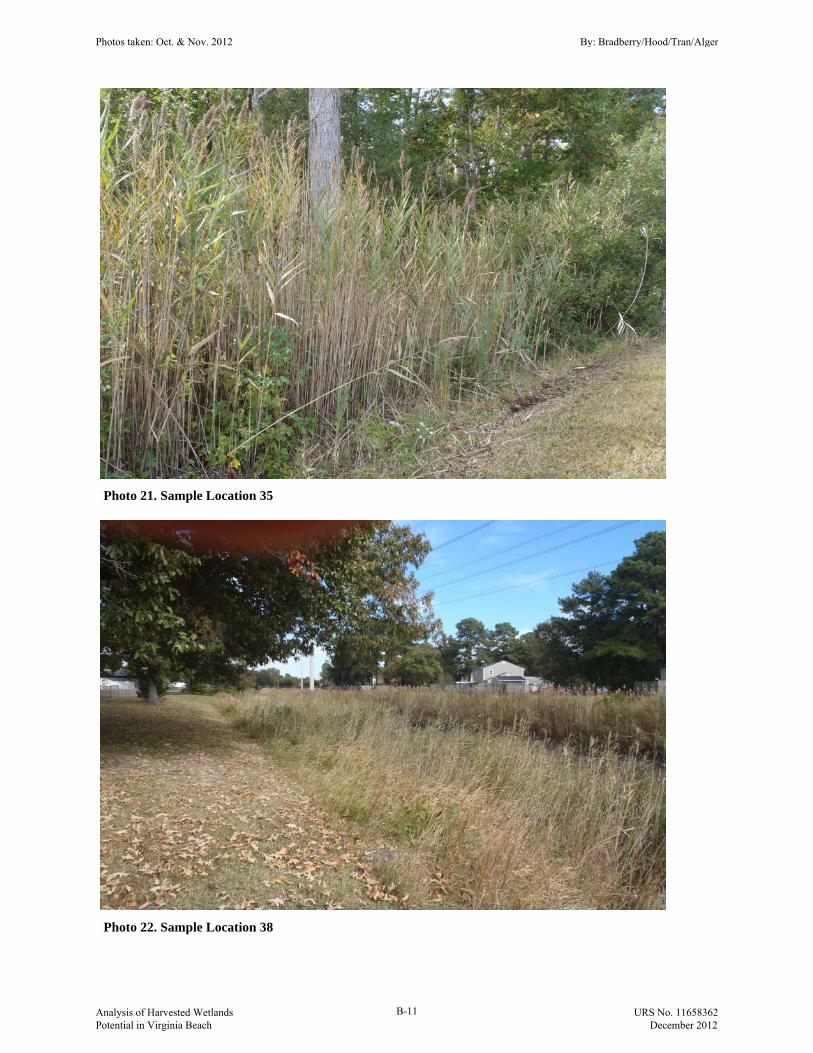
Photo 21. Sample Location 35
Photo 22. Sample Location 38
Photos taken: Oct. & Nov. 2012 By: Bradberry/Hood/Tran/Alger
Analysis of Harvested Wetlands Potential in Virginia Beach
B-11 URS No. 11658362 December 2012

Photo 23. Sample Location 39
Photo 24. Sample Location 39
Photos taken: Oct. & Nov. 2012 By: Bradberry/Hood/Tran/Alger
Analysis of Harvested Wetlands Potential in Virginia Beach
B-12 URS No. 11658362 December 2012

Photo 25. Sample Location 40
Photo 26. Sample Location 40
Photos taken: Oct. & Nov. 2012 By: Bradberry/Hood/Tran/Alger
Analysis of Harvested Wetlands Potential in Virginia Beach
B-13 URS No. 11658362 December 2012

Photo 27. Sample Location 41
Photo 28. Sample Location 46
Photos taken: Oct. & Nov. 2012 By: Bradberry/Hood/Tran/Alger
Analysis of Harvested Wetlands Potential in Virginia Beach
B-14 URS No. 11658362 December 2012

Photo 29. Sample Location 46
Photo 30. Sample Location 49
Photos taken: Oct. & Nov. 2012 By: Bradberry/Hood/Tran/Alger
Analysis of Harvested Wetlands Potential in Virginia Beach
B-15 URS No. 11658362 December 2012

Photo 31. Sample Location 50
Photo 32. Sample Location 51
Photos taken: Oct. & Nov. 2012 By: Bradberry/Hood/Tran/Alger
Analysis of Harvested Wetlands Potential in Virginia Beach
B-16 URS No. 11658362 December 2012

Photo 33. Sample Location 53
Photo 34. Sample Location 54
Photos taken: Oct. & Nov. 2012 By: Bradberry/Hood/Tran/Alger
Analysis of Harvested Wetlands Potential in Virginia Beach
B-17 URS No. 11658362 December 2012

Photo 35. Sample Location 54
Photo 36. Sample Location 54
Photos taken: Oct. & Nov. 2012 By: Bradberry/Hood/Tran/Alger
Analysis of Harvested Wetlands Potential in Virginia Beach
B-18 URS No. 11658362 December 2012
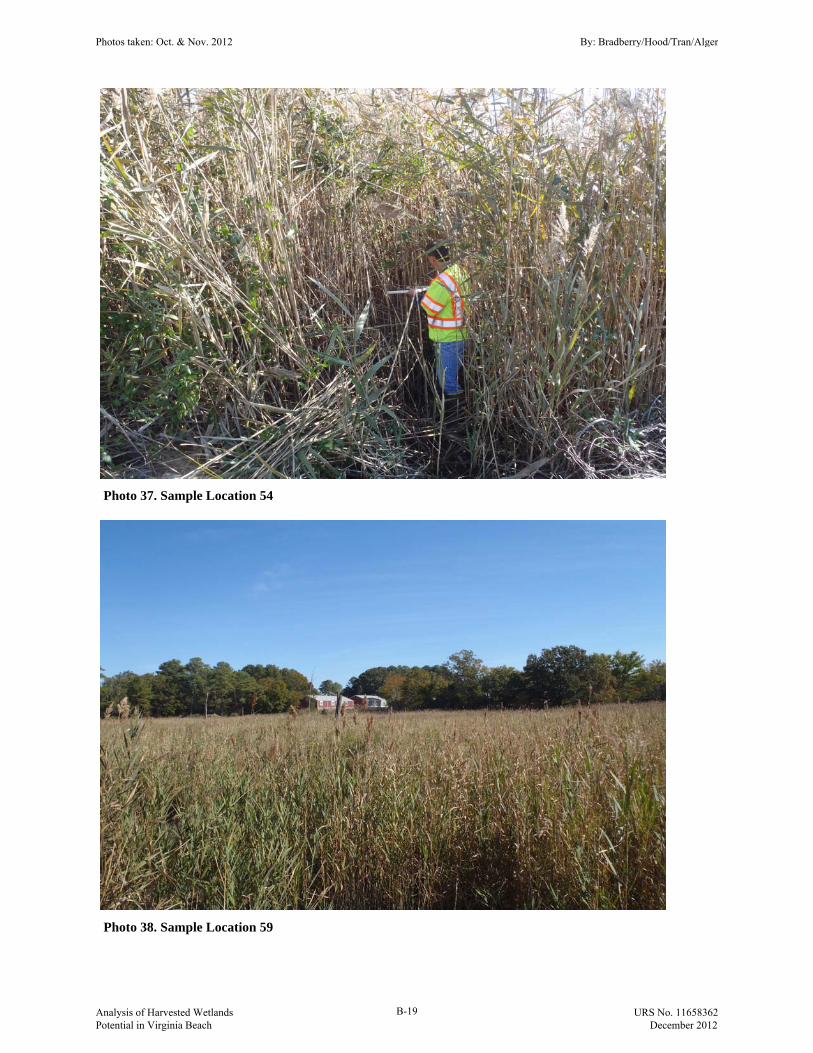
Photo 37. Sample Location 54
Photo 38. Sample Location 59
Photos taken: Oct. & Nov. 2012 By: Bradberry/Hood/Tran/Alger
Analysis of Harvested Wetlands Potential in Virginia Beach
B-19 URS No. 11658362 December 2012

Photo 39. Sample Location 59
Photo 40. Sample Location 62
Photos taken: Oct. & Nov. 2012 By: Bradberry/Hood/Tran/Alger
Analysis of Harvested Wetlands Potential in Virginia Beach
B-20 URS No. 11658362 December 2012
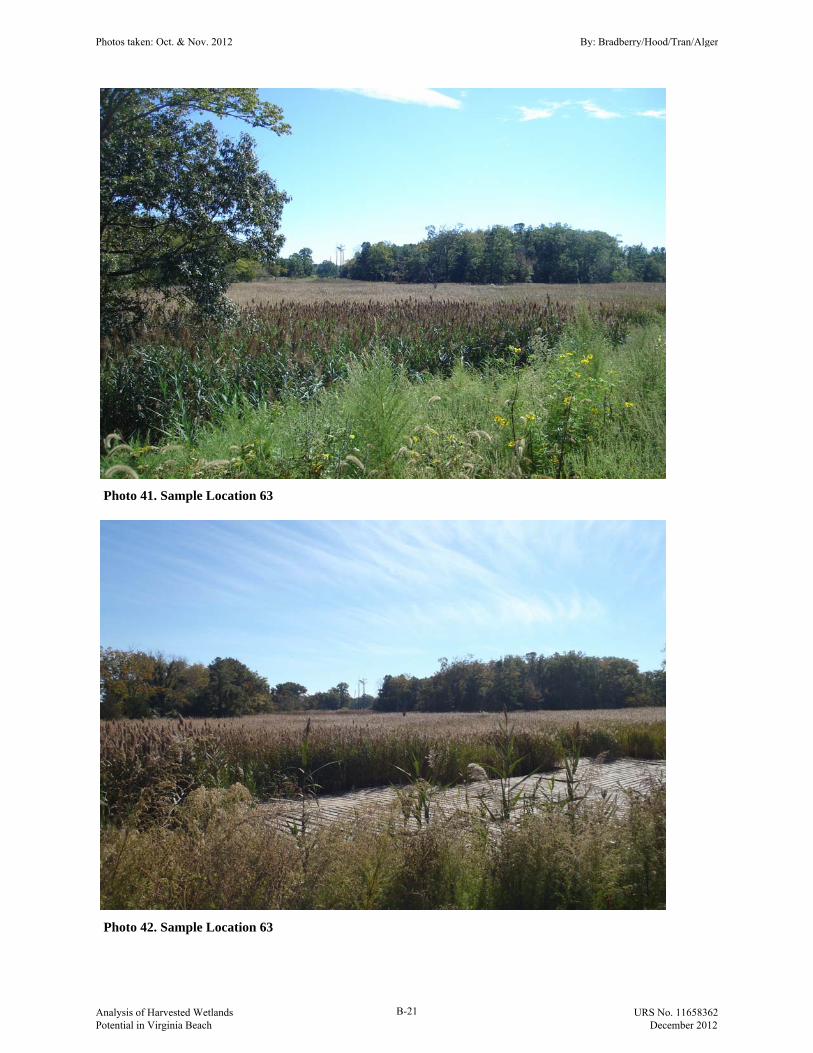
Photo 41. Sample Location 63
Photo 42. Sample Location 63
Photos taken: Oct. & Nov. 2012 By: Bradberry/Hood/Tran/Alger
Analysis of Harvested Wetlands Potential in Virginia Beach
B-21 URS No. 11658362 December 2012
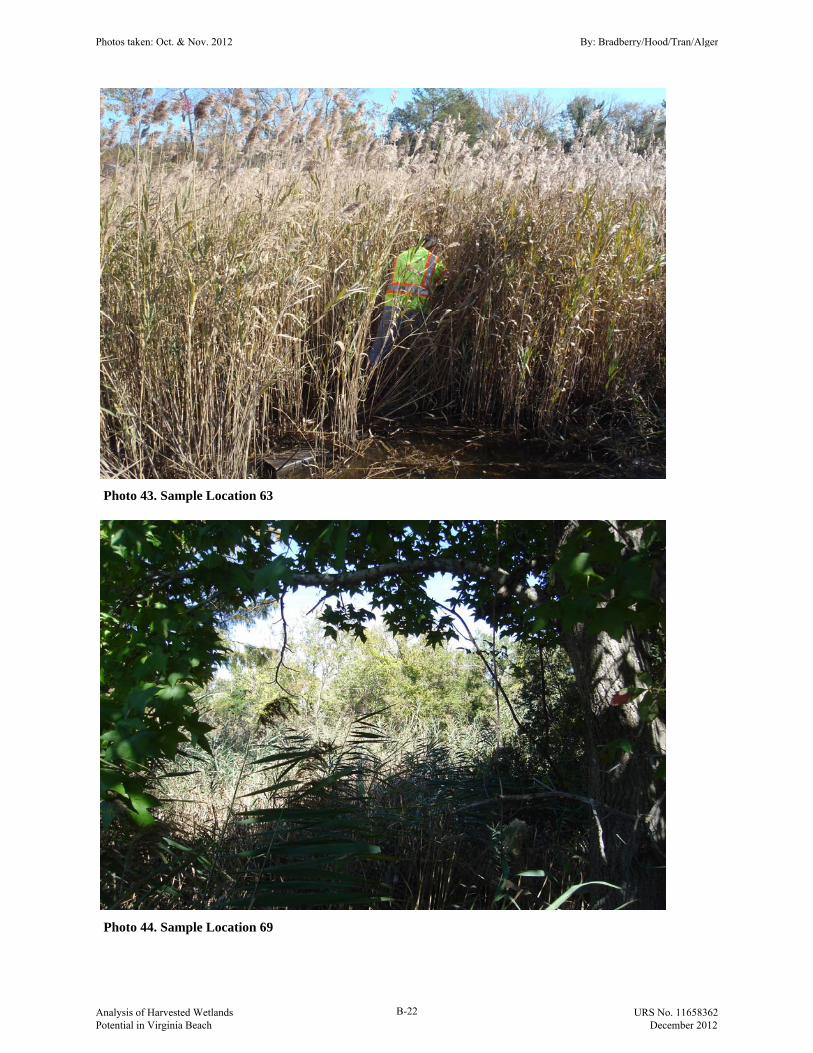
Photo 43. Sample Location 63
Photo 44. Sample Location 69
Photos taken: Oct. & Nov. 2012 By: Bradberry/Hood/Tran/Alger
Analysis of Harvested Wetlands Potential in Virginia Beach
B-22 URS No. 11658362 December 2012

Photo 45. Sample Location 74
Photo 46. Sample Location 76
Photos taken: Oct. & Nov. 2012 By: Bradberry/Hood/Tran/Alger
Analysis of Harvested Wetlands Potential in Virginia Beach
B-23 URS No. 11658362 December 2012

Photo 47. Sample Location 76
Photo 48. Sample Location 77
Photos taken: Oct. & Nov. 2012 By: Bradberry/Hood/Tran/Alger
Analysis of Harvested Wetlands Potential in Virginia Beach
B-24 URS No. 11658362 December 2012

Appendix C
Laboratory Results

Analyzed by Spectrum Analytic Inc.www.spectrumanalytic.com
Report To Prepared For
Tabled Plant Analysis Report
Sample Number Lab Number NitrogenN
PhosphorusP
PotassiumK
CalciumCa
MagnesiumMg
Percent (%)Sulfur
SBoron
BCopper
CuIronFe
ManganeseMn
ZincZn
SodiumNa
Parts Per Million (ppm)Aluminum
Al
HID:4065-0170-7690-0013
URS CORPORATION11832 ROCK LANDING DR STE 306NEWPORT NEWS, VA 23606
Account - 5604URS11832 ROCK LANDING DR STE 306NEWPORT NEWS, VA 23606
SampledTested
10-17-201210-25-2012
001 PL92001 1.71 0.11002 PL92002 1.22 0.09003 PL92003 1.70 0.14004 PL92004 1.40 0.16005 PL92005 1.75 0.13006 PL92006 1.37 0.13007 PL92007 0.94 0.09008 PL92008 0.64 0.08009 PL92009 0.92 0.09010 PL92010 0.84 0.10011 PL92011 0.99 0.07
Sample Number Lab Number Dry Wg
Rec Wg
20.39 27.97001 PL9200116.73 21.12002 PL920028.2 10.47003 PL92003
11.32 16.5004 PL9200414.66 21.31005 PL9200511.34 16.75006 PL9200622.86 34.44007 PL9200716.24 24.23008 PL9200817.11 23.68009 PL9200924.3 35.21010 PL9201022.64 34.8011 PL92011
C-1
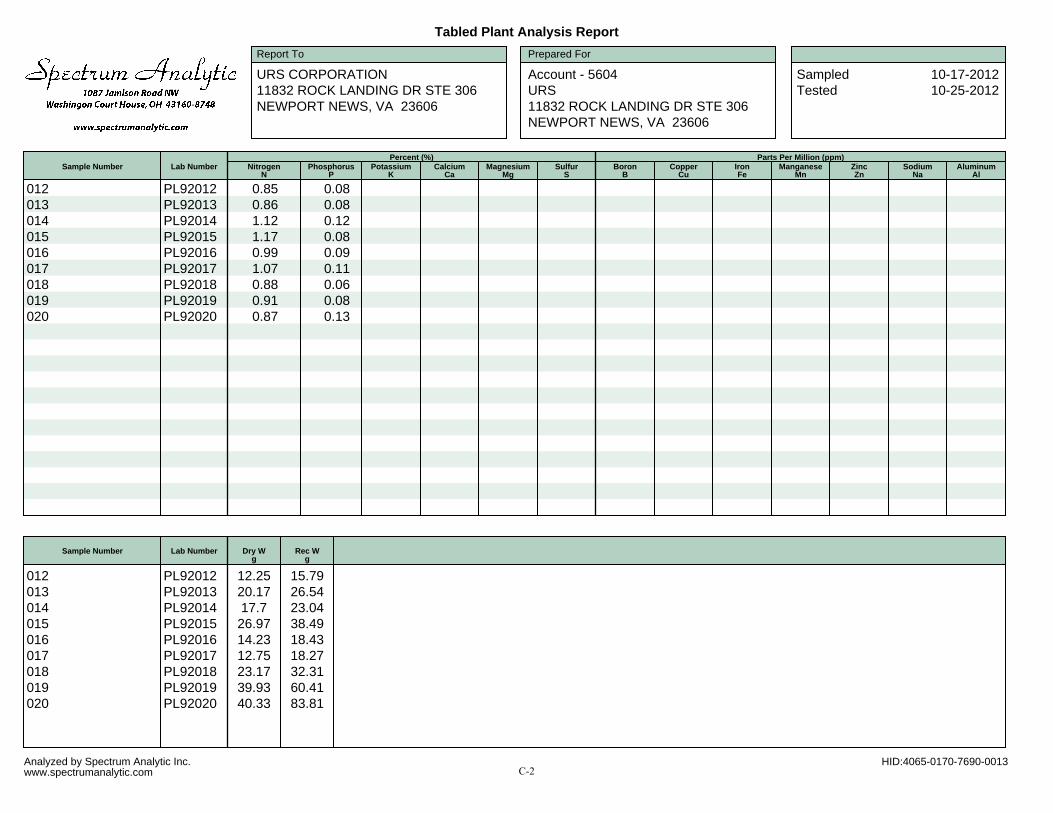
Analyzed by Spectrum Analytic Inc.www.spectrumanalytic.com
Report To Prepared For
Tabled Plant Analysis Report
Sample Number Lab Number NitrogenN
PhosphorusP
PotassiumK
CalciumCa
MagnesiumMg
Percent (%)Sulfur
SBoron
BCopper
CuIronFe
ManganeseMn
ZincZn
SodiumNa
Parts Per Million (ppm)Aluminum
Al
HID:4065-0170-7690-0013
URS CORPORATION11832 ROCK LANDING DR STE 306NEWPORT NEWS, VA 23606
Account - 5604URS11832 ROCK LANDING DR STE 306NEWPORT NEWS, VA 23606
SampledTested
10-17-201210-25-2012
012 PL92012 0.85 0.08013 PL92013 0.86 0.08014 PL92014 1.12 0.12015 PL92015 1.17 0.08016 PL92016 0.99 0.09017 PL92017 1.07 0.11018 PL92018 0.88 0.06019 PL92019 0.91 0.08020 PL92020 0.87 0.13
Sample Number Lab Number Dry Wg
Rec Wg
12.25 15.79012 PL9201220.17 26.54013 PL9201317.7 23.04014 PL9201426.97 38.49015 PL9201514.23 18.43016 PL9201612.75 18.27017 PL9201723.17 32.31018 PL9201839.93 60.41019 PL9201940.33 83.81020 PL92020
C-2

Analyzed by Spectrum Analytic Inc.www.spectrumanalytic.com
Report To Prepared For
Tabled Plant Analysis Report
Sample Number Lab Number NitrogenN
PhosphorusP
PotassiumK
CalciumCa
MagnesiumMg
Percent (%)Sulfur
SBoron
BCopper
CuIronFe
ManganeseMn
ZincZn
SodiumNa
Parts Per Million (ppm)Aluminum
Al
HID:4065-0170-7690-0013
URS CORPORATION11832 ROCK LANDING DR STE 306NEWPORT NEWS, VA 23606
Account - 5604URS11832 ROCK LANDING DR STE 306NEWPORT NEWS, VA 23606
SampledTested
10-17-201210-25-2012
021 PL92021 1.50 0.13022 PL92022 1.24 0.17023 PL92023 0.77 0.12024 PL92024 0.89 0.10025 PL92025 1.03 0.07026 PL92026 1.33 0.09027 PL92027 1.05 0.08028 PL92028 1.12 0.10029 PL92029 0.78 0.04030 PL92030 1.03 0.05031 PL92031 1.24 0.11
Sample Number Lab Number Dry Wg
Rec Wg
46.24 87.5021 PL9202153.6 85.09022 PL9202247.8 72.88023 PL9202350.78 76.95024 PL9202456.64 87.79025 PL9202542.46 72.18026 PL9202651.85 78.72027 PL9202770.32 116.34028 PL9202844.58 62.98029 PL9202944.69 69.87030 PL9203035.31 57.9031 PL92031
C-3

Analyzed by Spectrum Analytic Inc.www.spectrumanalytic.com
Report To Prepared For
Tabled Plant Analysis Report
Sample Number Lab Number NitrogenN
PhosphorusP
PotassiumK
CalciumCa
MagnesiumMg
Percent (%)Sulfur
SBoron
BCopper
CuIronFe
ManganeseMn
ZincZn
SodiumNa
Parts Per Million (ppm)Aluminum
Al
HID:4065-0170-7690-0013
URS CORPORATION11832 ROCK LANDING DR STE 306NEWPORT NEWS, VA 23606
Account - 5604URS11832 ROCK LANDING DR STE 306NEWPORT NEWS, VA 23606
SampledTested
10-17-201210-25-2012
032 PL92032 1.17 0.08033 PL92033 1.61 0.11034 PL92034 1.43 0.09035 PL92035 1.51 0.12036 PL92036 1.15 0.12037 PL92037 1.14 0.10038 PL92038 1.00 0.07039 PL92039 1.97 0.17040 PL92040 1.03 0.09
Sample Number Lab Number Dry Wg
Rec Wg
29.04 48032 PL9203242.05 67.4033 PL9203335.89 62.88034 PL9203430.85 49.41035 PL9203523.21 37036 PL9203647.8 84.51037 PL9203755.16 96.16038 PL9203861.39 102.84039 PL9203953.89 87.72040 PL92040
C-4

Analyzed by Spectrum Analytic Inc.www.spectrumanalytic.com
Report To Prepared For
Tabled Plant Analysis Report
Sample Number Lab Number NitrogenN
PhosphorusP
PotassiumK
CalciumCa
MagnesiumMg
Percent (%)Sulfur
SBoron
BCopper
CuIronFe
ManganeseMn
ZincZn
SodiumNa
Parts Per Million (ppm)Aluminum
Al
HID:4065-0170-7690-0013
URS CORPORATION11832 ROCK LANDING DR STE 306NEWPORT NEWS, VA 23606
Account - 5604URS11832 ROCK LANDING DR STE 306NEWPORT NEWS, VA 23606
SampledTested
10-17-201210-25-2012
041 PL92041 1.15 0.10042 PL92042 1.12 0.08043 PL92043 2.26 0.18044 PL92044 2.59 0.25045 PL92045 1.91 0.19046 PL92046 2.29 0.21047 PL92047 2.41 0.29048 PL92048 2.29 0.21049 PL92049 1.46 0.12050 PL92050 1.92 0.10051 PL92051 1.94 0.12
Sample Number Lab Number Dry Wg
Rec Wg
39.11 73.58041 PL9204155.76 89.32042 PL9204240.34 89.36043 PL9204325.33 72.63044 PL9204441.55 97.57045 PL9204539.49 87.89046 PL9204628.31 83.64047 PL9204745.34 93.06048 PL9204826.4 38.37049 PL9204919.85 29.03050 PL9205021.72 30.85051 PL92051
C-5

Analyzed by Spectrum Analytic Inc.www.spectrumanalytic.com
Report To Prepared For
Tabled Plant Analysis Report
Sample Number Lab Number NitrogenN
PhosphorusP
PotassiumK
CalciumCa
MagnesiumMg
Percent (%)Sulfur
SBoron
BCopper
CuIronFe
ManganeseMn
ZincZn
SodiumNa
Parts Per Million (ppm)Aluminum
Al
HID:4065-0170-7690-0013
URS CORPORATION11832 ROCK LANDING DR STE 306NEWPORT NEWS, VA 23606
Account - 5604URS11832 ROCK LANDING DR STE 306NEWPORT NEWS, VA 23606
SampledTested
10-17-201210-25-2012
052 PL92052 1.86 0.11053 PL92053 1.90 0.12054 PL92054 2.08 0.14055 PL92055 1.15 0.11056 PL92056 1.49 0.12057 PL92057 1.01 0.09058 PL92058 1.63 0.11059 PL92059 0.68 0.05060 PL92060 1.45 0.10
Sample Number Lab Number Dry Wg
Rec Wg
27.74 42.1052 PL9205240.29 63.37053 PL9205330.87 45.7054 PL9205456.48 92.58055 PL9205551.02 83.39056 PL9205663.86 107.33057 PL92057
57 90.12058 PL9205855.01 85.04059 PL9205953.46 85.43060 PL92060
C-6

Analyzed by Spectrum Analytic Inc.www.spectrumanalytic.com
Report To Prepared For
Tabled Plant Analysis Report
Sample Number Lab Number NitrogenN
PhosphorusP
PotassiumK
CalciumCa
MagnesiumMg
Percent (%)Sulfur
SBoron
BCopper
CuIronFe
ManganeseMn
ZincZn
SodiumNa
Parts Per Million (ppm)Aluminum
Al
HID:4065-0170-7690-0013
URS CORPORATION11832 ROCK LANDING DR STE 306NEWPORT NEWS, VA 23606
Account - 5604URS11832 ROCK LANDING DR STE 306NEWPORT NEWS, VA 23606
SampledTested
10-17-201210-25-2012
061 PL92061 1.76 0.11062 PL92062 1.38 0.11063 PL92063 0.93 0.05064 PL92064 1.57 0.10065 PL92065 0.79 0.06066 PL92066 1.43 0.10067 PL92067 1.43 0.10068 PL92068 1.02 0.09069 PL92069 1.14 0.06070 PL92070 0.89 0.07071 PL92071 1.40 0.08
Sample Number Lab Number Dry Wg
Rec Wg
33.65 50.37061 PL9206155.38 88.99062 PL9206245.9 69.11063 PL9206343.22 82.71064 PL9206451.09 75.37065 PL9206557.41 91.64066 PL9206638.41 61.94067 PL9206725.3 37.63068 PL9206844.16 72.88069 PL9206923.4 36.27070 PL9207043.6 66.01071 PL92071
C-7

Analyzed by Spectrum Analytic Inc.www.spectrumanalytic.com
Report To Prepared For
Tabled Plant Analysis Report
Sample Number Lab Number NitrogenN
PhosphorusP
PotassiumK
CalciumCa
MagnesiumMg
Percent (%)Sulfur
SBoron
BCopper
CuIronFe
ManganeseMn
ZincZn
SodiumNa
Parts Per Million (ppm)Aluminum
Al
HID:4065-0170-7690-0013
URS CORPORATION11832 ROCK LANDING DR STE 306NEWPORT NEWS, VA 23606
Account - 5604URS11832 ROCK LANDING DR STE 306NEWPORT NEWS, VA 23606
SampledTested
10-17-201210-25-2012
072 PL92072 1.63 0.10073 PL92073 1.31 0.09074 PL92074 1.61 0.14075 PL92075 0.88 0.06076 PL92076 0.97 0.06077 PL92077 0.96 0.09078 PL92078 1.25 0.18079 PL92079 1.56 0.12080 PL92080 1.33 0.12
Sample Number Lab Number Dry Wg
Rec Wg
45.26 72.57072 PL9207251.54 83.37073 PL9207340.59 66.72074 PL9207440.01 58.94075 PL9207545.2 66.28076 PL9207645.94 73.75077 PL9207743.62 75.03078 PL9207835.54 59.92079 PL9207943.54 74.98080 PL92080
C-8
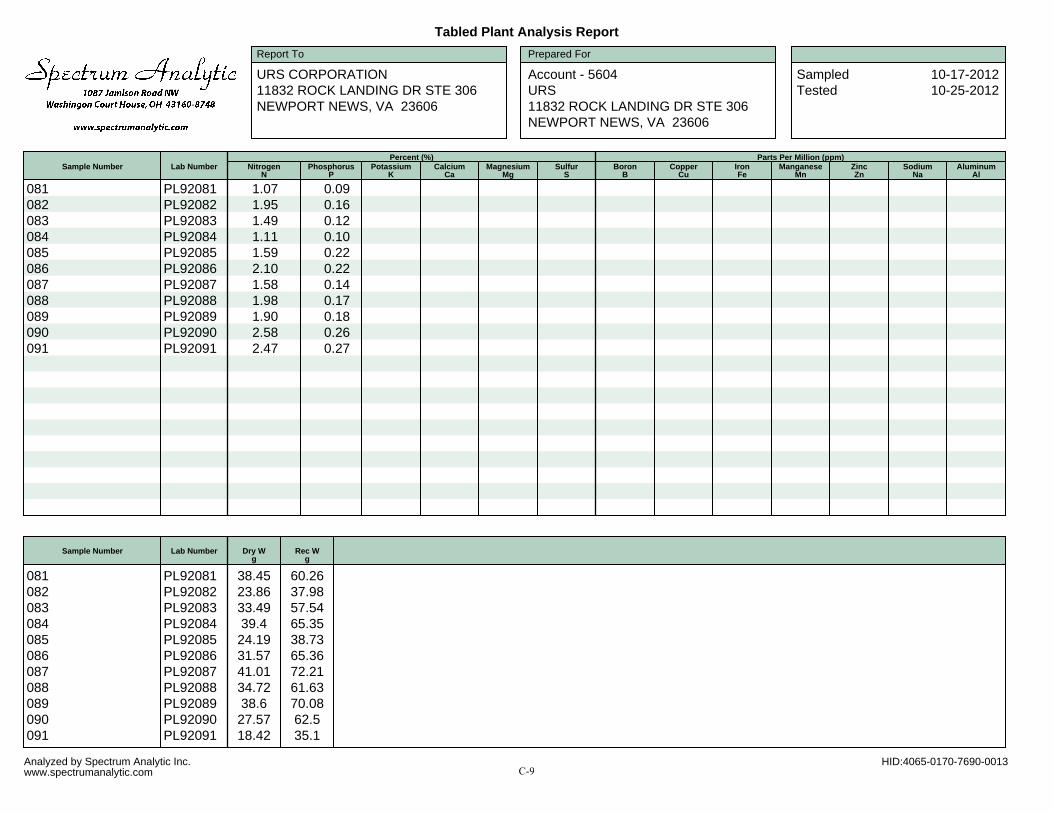
Analyzed by Spectrum Analytic Inc.www.spectrumanalytic.com
Report To Prepared For
Tabled Plant Analysis Report
Sample Number Lab Number NitrogenN
PhosphorusP
PotassiumK
CalciumCa
MagnesiumMg
Percent (%)Sulfur
SBoron
BCopper
CuIronFe
ManganeseMn
ZincZn
SodiumNa
Parts Per Million (ppm)Aluminum
Al
HID:4065-0170-7690-0013
URS CORPORATION11832 ROCK LANDING DR STE 306NEWPORT NEWS, VA 23606
Account - 5604URS11832 ROCK LANDING DR STE 306NEWPORT NEWS, VA 23606
SampledTested
10-17-201210-25-2012
081 PL92081 1.07 0.09082 PL92082 1.95 0.16083 PL92083 1.49 0.12084 PL92084 1.11 0.10085 PL92085 1.59 0.22086 PL92086 2.10 0.22087 PL92087 1.58 0.14088 PL92088 1.98 0.17089 PL92089 1.90 0.18090 PL92090 2.58 0.26091 PL92091 2.47 0.27
Sample Number Lab Number Dry Wg
Rec Wg
38.45 60.26081 PL9208123.86 37.98082 PL9208233.49 57.54083 PL9208339.4 65.35084 PL9208424.19 38.73085 PL9208531.57 65.36086 PL9208641.01 72.21087 PL9208734.72 61.63088 PL9208838.6 70.08089 PL9208927.57 62.5090 PL9209018.42 35.1091 PL92091
C-9

Analyzed by Spectrum Analytic Inc.www.spectrumanalytic.com
Report To Prepared For
Tabled Plant Analysis Report
Sample Number Lab Number NitrogenN
PhosphorusP
PotassiumK
CalciumCa
MagnesiumMg
Percent (%)Sulfur
SBoron
BCopper
CuIronFe
ManganeseMn
ZincZn
SodiumNa
Parts Per Million (ppm)Aluminum
Al
HID:4065-0170-7690-0013
URS CORPORATION11832 ROCK LANDING DR STE 306NEWPORT NEWS, VA 23606
Account - 5604URS11832 ROCK LANDING DR STE 306NEWPORT NEWS, VA 23606
SampledTested
10-17-201210-25-2012
092 PL92092 1.81 0.18093 PL92093 1.57 0.12094 PL92094 1.03 0.08095 PL92095 2.00 0.14096 PL92096 1.75 0.13097 PL92097 2.20 0.23098 PL92098 2.05 0.19099 PL92099 2.51 0.25100 PL92100 1.53 0.15
Sample Number Lab Number Dry Wg
Rec Wg
19.51 30.57092 PL9209235.33 53.9093 PL9209353.41 86.48094 PL9209426.97 38.94095 PL9209535.72 51.8096 PL9209643.44 96.88097 PL9209741.77 81.52098 PL9209845.89 100.96099 PL9209931.47 50.21100 PL92100
C-10

Analyzed by Spectrum Analytic Inc.www.spectrumanalytic.com
Report To Prepared For
Tabled Plant Analysis Report
Sample Number Lab Number NitrogenN
PhosphorusP
PotassiumK
CalciumCa
MagnesiumMg
Percent (%)Sulfur
SBoron
BCopper
CuIronFe
ManganeseMn
ZincZn
SodiumNa
Parts Per Million (ppm)Aluminum
Al
HID:4065-0170-7690-0013
URS CORPORATION11832 ROCK LANDING DR STE 306NEWPORT NEWS, VA 23606
Account - 5604URS11832 ROCK LANDING DR STE 306NEWPORT NEWS, VA 23606
SampledTested
10-17-201210-25-2012
101 PL92101 1.67 0.14102 PL92102 1.40 0.12103 PL92103 1.19 0.12104 PL92104 1.47 0.12105 PL92105 1.76 0.12106 PL92106 1.26 0.11107 PL92107 1.38 0.11108 PL92108 1.28 0.11109 PL92109 1.87 0.16110 PL92110 0.93 0.09111 PL92111 1.28 0.12
Sample Number Lab Number Dry Wg
Rec Wg
23.83 35.52101 PL9210135.06 53.68102 PL9210242.68 67.19103 PL9210326.54 40.46104 PL9210430.08 51105 PL9210542.13 66.34106 PL9210636.1 57.38107 PL9210741.19 68.98108 PL9210841.49 63.06109 PL9210935.44 56.63110 PL9211040.27 60.73111 PL92111
C-11

Analyzed by Spectrum Analytic Inc.www.spectrumanalytic.com
Report To Prepared For
Tabled Plant Analysis Report
Sample Number Lab Number NitrogenN
PhosphorusP
PotassiumK
CalciumCa
MagnesiumMg
Percent (%)Sulfur
SBoron
BCopper
CuIronFe
ManganeseMn
ZincZn
SodiumNa
Parts Per Million (ppm)Aluminum
Al
HID:4065-0170-7690-0013
URS CORPORATION11832 ROCK LANDING DR STE 306NEWPORT NEWS, VA 23606
Account - 5604URS11832 ROCK LANDING DR STE 306NEWPORT NEWS, VA 23606
SampledTested
10-17-201210-25-2012
112 PL92112 1.14 0.08113 PL92113 1.19 0.09114 PL92114 1.38 0.09115 PL92115 2.11 0.24116 PL92116 1.13 0.15117 PL92117 1.35 0.17118 PL92118 1.08 0.14119 PL92119 1.38 0.20120 PL92120 1.54 0.19
Sample Number Lab Number Dry Wg
Rec Wg
30.04 43.51112 PL9211232.1 46.28113 PL9211330.05 43.26114 PL9211440.44 76.36115 PL9211536.66 71.4116 PL9211633.32 57.64117 PL9211735.96 65.07118 PL9211825.3 51.04119 PL9211943.96 84.86120 PL92120
C-12
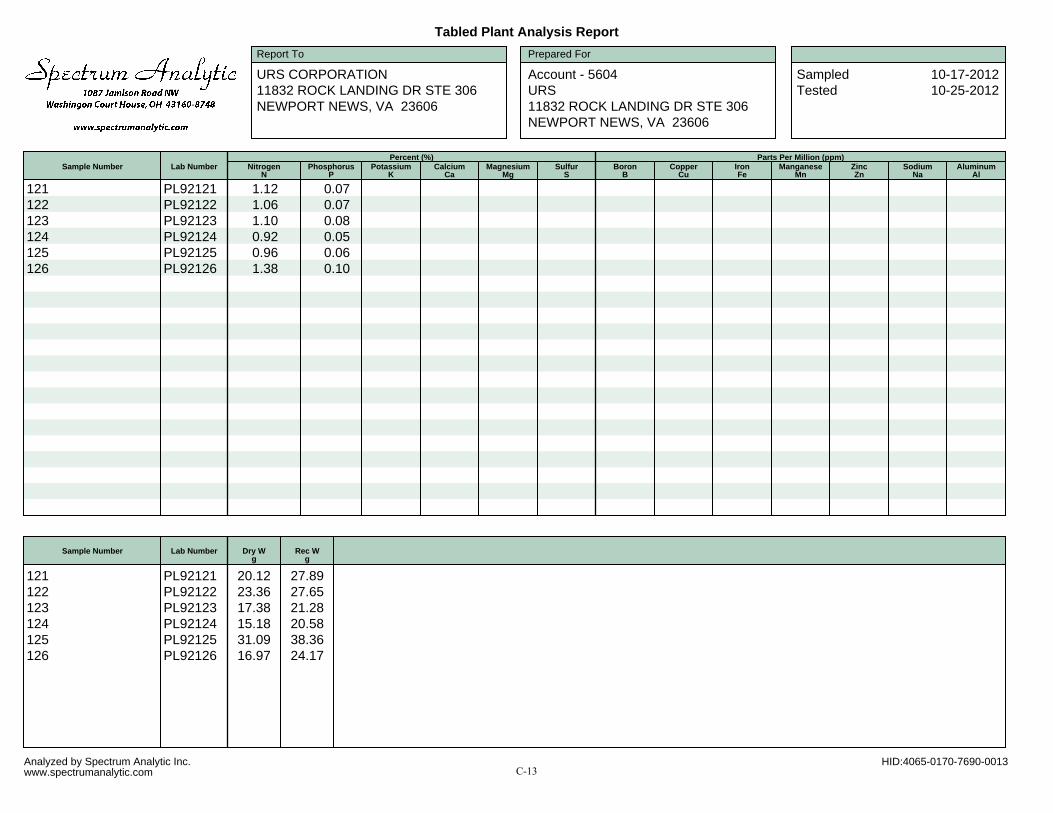
Analyzed by Spectrum Analytic Inc.www.spectrumanalytic.com
Report To Prepared For
Tabled Plant Analysis Report
Sample Number Lab Number NitrogenN
PhosphorusP
PotassiumK
CalciumCa
MagnesiumMg
Percent (%)Sulfur
SBoron
BCopper
CuIronFe
ManganeseMn
ZincZn
SodiumNa
Parts Per Million (ppm)Aluminum
Al
HID:4065-0170-7690-0013
URS CORPORATION11832 ROCK LANDING DR STE 306NEWPORT NEWS, VA 23606
Account - 5604URS11832 ROCK LANDING DR STE 306NEWPORT NEWS, VA 23606
SampledTested
10-17-201210-25-2012
121 PL92121 1.12 0.07122 PL92122 1.06 0.07123 PL92123 1.10 0.08124 PL92124 0.92 0.05125 PL92125 0.96 0.06126 PL92126 1.38 0.10
Sample Number Lab Number Dry Wg
Rec Wg
20.12 27.89121 PL9212123.36 27.65122 PL9212217.38 21.28123 PL9212315.18 20.58124 PL9212431.09 38.36125 PL9212516.97 24.17126 PL92126
C-13

Analyzed by Spectrum Analytic Inc.www.spectrumanalytic.com
Report To Prepared For
Tabled Plant Analysis Report
Sample Number Lab Number NitrogenN
PhosphorusP
PotassiumK
CalciumCa
MagnesiumMg
Percent (%)Sulfur
SBoron
BCopper
CuIronFe
ManganeseMn
ZincZn
SodiumNa
Parts Per Million (ppm)Aluminum
Al
HID:4065-0652-8690-0003
URS CORPORATION11832 ROCK LANDING DR STE 306NEWPORT NEWS, VA 23606
Account - 5604URS11832 ROCK LANDING DR STE 306NEWPORT NEWS, VA 23606
SampledTested
10-17-201210-25-2012
127 PL92196 1.21 0.12128 PL92197 1.78 0.19129 PL92198 1.60 0.07130 PL92199 1.85 0.19131 PL92200 1.61 0.11132 PL92201 1.57 0.14133 PL92202 1.23 0.10134 PL92203 1.47 0.08135 PL92204 1.14 0.08136 PL92205 1.81 0.16137 PL92206 2.08 0.21
Sample Number Lab Number Dry Wg
Rec Wg
34.52 60.49127 PL9219656.97 116.62128 PL9219716.95 19.4129 PL9219824.86 42.24130 PL9219952.07 86.23131 PL9220020.66 34.1132 PL9220120.71 30.03133 PL9220227.14 37.38134 PL9220320.07 30.12135 PL9220416.31 29.3136 PL9220510.43 21.75137 PL92206
C-14

Analyzed by Spectrum Analytic Inc.www.spectrumanalytic.com
Report To Prepared For
Tabled Plant Analysis Report
Sample Number Lab Number NitrogenN
PhosphorusP
PotassiumK
CalciumCa
MagnesiumMg
Percent (%)Sulfur
SBoron
BCopper
CuIronFe
ManganeseMn
ZincZn
SodiumNa
Parts Per Million (ppm)Aluminum
Al
HID:4065-0652-8690-0003
URS CORPORATION11832 ROCK LANDING DR STE 306NEWPORT NEWS, VA 23606
Account - 5604URS11832 ROCK LANDING DR STE 306NEWPORT NEWS, VA 23606
SampledTested
10-17-201210-25-2012
138 PL92207 1.86 0.23139 PL92208 1.63 0.18140 PL92209 1.72 0.15141 PL92210 2.49 0.23142 PL92211 1.81 0.17143 PL92212 1.94 0.22144 PL92213 1.86 0.19145 PL92214 1.32 0.15146 PL92215 1.19 0.15
Sample Number Lab Number Dry Wg
Rec Wg
11.08 19.1138 PL9220714.02 19.02139 PL9220810.7 16.11140 PL9220914.18 27.62141 PL9221019.3 33.99142 PL9221115.57 25.75143 PL9221219.63 31.07144 PL9221333.84 55.9145 PL9221423.35 37.91146 PL92215
C-15

Analyzed by Spectrum Analytic Inc.www.spectrumanalytic.com
Report To Prepared For
Tabled Plant Analysis Report
Sample Number Lab Number NitrogenN
PhosphorusP
PotassiumK
CalciumCa
MagnesiumMg
Percent (%)Sulfur
SBoron
BCopper
CuIronFe
ManganeseMn
ZincZn
SodiumNa
Parts Per Million (ppm)Aluminum
Al
HID:4065-0652-8690-0003
URS CORPORATION11832 ROCK LANDING DR STE 306NEWPORT NEWS, VA 23606
Account - 5604URS11832 ROCK LANDING DR STE 306NEWPORT NEWS, VA 23606
SampledTested
10-17-201210-25-2012
147 PL92216 0.59 0.02148 PL92217 2.56 0.28149 PL92218 3.01 0.33150 PL92219 1.57 0.15151 PL92220 1.55 0.12152 PL92221 1.30 0.10153 PL92222 1.51 0.13154 PL92223 1.46 0.14155 PL92224 1.55 0.23156 PL92225 1.25 0.06157 PL92226 1.28 0.09
Sample Number Lab Number Dry Wg
Rec Wg
23.42 26.98147 PL9221615.82 40.44148 PL9221712.38 32.62149 PL9221840.46 71.92150 PL9221920.66 31.66151 PL9222036.86 63.66152 PL9222133.67 55.36153 PL9222224.92 37.05154 PL9222314.6 19.72155 PL922249.39 10.06156 PL9222561.05 96.65157 PL92226
C-16

Analyzed by Spectrum Analytic Inc.www.spectrumanalytic.com
Report To Prepared For
Tabled Plant Analysis Report
Sample Number Lab Number NitrogenN
PhosphorusP
PotassiumK
CalciumCa
MagnesiumMg
Percent (%)Sulfur
SBoron
BCopper
CuIronFe
ManganeseMn
ZincZn
SodiumNa
Parts Per Million (ppm)Aluminum
Al
HID:4065-0652-8690-0003
URS CORPORATION11832 ROCK LANDING DR STE 306NEWPORT NEWS, VA 23606
Account - 5604URS11832 ROCK LANDING DR STE 306NEWPORT NEWS, VA 23606
SampledTested
10-17-201210-25-2012
158 PL92227 1.32 0.11159 PL92228 0.89 0.06160 PL92229 0.98 0.08161 PL92230 1.26 0.18162 PL92231 1.18 0.08
Sample Number Lab Number Dry Wg
Rec Wg
16.33 22.82158 PL9222710.91 12.72159 PL9222841.84 65.27160 PL9222914.59 22.97161 PL9223040.94 62.49162 PL92231
C-17

Analyzed by Spectrum Analytic Inc.www.spectrumanalytic.com
Report To Prepared For
Tabled Plant Analysis Report
Sample Number Lab Number NitrogenN
PhosphorusP
PotassiumK
CalciumCa
MagnesiumMg
Percent (%)Sulfur
SBoron
BCopper
CuIronFe
ManganeseMn
ZincZn
SodiumNa
Parts Per Million (ppm)Aluminum
Al
HID:4065-0542-9690-0016
URS CORPORATION11832 ROCK LANDING DR STE 306NEWPORT NEWS, VA 23606
Account - 5604URS11832 ROCK LANDING DR STE 306NEWPORT NEWS, VA 23606
SampledTested
10-17-201210-26-2012
163 PL92236 1.41 0.22164 PL92237 1.35 0.12165 PL92238 1.99 0.13166 PL92239 1.72 0.15167 PL92240 1.71 0.12168 PL92241 1.52 0.13169 PL92242 1.22 0.04170 PL92243 1.65 0.13171 PL92244 1.76 0.10172 PL92245 2.39 0.17173 PL92246 1.80 0.15
Sample Number Lab Number Dry Wg
Rec Wg
9.26 11.12163 PL9223624.24 41.98164 PL9223715.54 27.55165 PL9223813.25 23.06166 PL9223921.22 40.12167 PL9224018.5 32.6168 PL9224117.08 19.51169 PL9224226.52 50.18170 PL9224331.62 53.15171 PL9224412.91 20.42172 PL9224520.03 34.11173 PL92246
C-18

Analyzed by Spectrum Analytic Inc.www.spectrumanalytic.com
Report To Prepared For
Tabled Plant Analysis Report
Sample Number Lab Number NitrogenN
PhosphorusP
PotassiumK
CalciumCa
MagnesiumMg
Percent (%)Sulfur
SBoron
BCopper
CuIronFe
ManganeseMn
ZincZn
SodiumNa
Parts Per Million (ppm)Aluminum
Al
HID:4065-0542-9690-0016
URS CORPORATION11832 ROCK LANDING DR STE 306NEWPORT NEWS, VA 23606
Account - 5604URS11832 ROCK LANDING DR STE 306NEWPORT NEWS, VA 23606
SampledTested
10-17-201210-26-2012
174 PL92247 1.43 0.18175 PL92248 1.90 0.14176 PL92249 1.78 0.27177 PL92250 2.53 0.30178 PL92251 1.37 0.12179 PL92252 3.96 0.40180 PL92253 1.41 0.16181 PL92254 1.36 0.09182 PL92255 1.31 0.10
Sample Number Lab Number Dry Wg
Rec Wg
13 21.61174 PL9224776.06 147175 PL9224829.9 78.45176 PL9224916.69 43.16177 PL9225040.86 75.85178 PL9225121.16 69.72179 PL9225247.31 94.03180 PL9225340.3 60.2181 PL9225424.78 42.93182 PL92255
C-19

Analyzed by Spectrum Analytic Inc.www.spectrumanalytic.com
Report To Prepared For
Tabled Plant Analysis Report
Sample Number Lab Number NitrogenN
PhosphorusP
PotassiumK
CalciumCa
MagnesiumMg
Percent (%)Sulfur
SBoron
BCopper
CuIronFe
ManganeseMn
ZincZn
SodiumNa
Parts Per Million (ppm)Aluminum
Al
HID:4065-0542-9690-0016
URS CORPORATION11832 ROCK LANDING DR STE 306NEWPORT NEWS, VA 23606
Account - 5604URS11832 ROCK LANDING DR STE 306NEWPORT NEWS, VA 23606
SampledTested
10-17-201210-26-2012
183 PL92256 1.34 0.10184 PL92257 1.03 0.08185 PL92258 0.93 0.02186 PL92259 1.50 0.10187 PL92260 1.10 0.06188 PL92261 0.91 0.03189 PL92262 1.03 0.04190 PL92263 1.27 0.09191 PL92264 1.43 0.08192 PL92265 1.34 0.12193 PL92266 2.03 0.17
Sample Number Lab Number Dry Wg
Rec Wg
67.92 106.75183 PL9225651.09 77.67184 PL9225724.87 28.22185 PL9225824.84 38.44186 PL9225919.56 25.65187 PL9226014.98 19.09188 PL9226116.3 22.07189 PL9226227.53 46.29190 PL9226321.01 29.07191 PL9226429.26 45.8192 PL9226532.56 67.33193 PL92266
C-20

Analyzed by Spectrum Analytic Inc.www.spectrumanalytic.com
Report To Prepared For
Tabled Plant Analysis Report
Sample Number Lab Number NitrogenN
PhosphorusP
PotassiumK
CalciumCa
MagnesiumMg
Percent (%)Sulfur
SBoron
BCopper
CuIronFe
ManganeseMn
ZincZn
SodiumNa
Parts Per Million (ppm)Aluminum
Al
HID:4065-0542-9690-0016
URS CORPORATION11832 ROCK LANDING DR STE 306NEWPORT NEWS, VA 23606
Account - 5604URS11832 ROCK LANDING DR STE 306NEWPORT NEWS, VA 23606
SampledTested
10-17-201210-26-2012
194 PL92267 0.96 0.02195 PL92268 1.29 0.04196 PL92269 1.73 0.15197 PL92270 1.79 0.17198 PL92271 1.54 0.11199 PL92272 1.92 0.14200 PL92273 0.96 0.04201 PL92274 1.08 0.07202 PL92275 0.94 0.07
Sample Number Lab Number Dry Wg
Rec Wg
34.25 38.74194 PL9226719.99 22.45195 PL9226819.97 25.62196 PL9226943.52 84.88197 PL9227055.67 84.45198 PL9227118.3 30.23199 PL9227213.76 15.83200 PL9227316.92 21.9201 PL9227415.46 20.39202 PL92275
C-21

Analyzed by Spectrum Analytic Inc.www.spectrumanalytic.com
Report To Prepared For
Tabled Plant Analysis Report
Sample Number Lab Number NitrogenN
PhosphorusP
PotassiumK
CalciumCa
MagnesiumMg
Percent (%)Sulfur
SBoron
BCopper
CuIronFe
ManganeseMn
ZincZn
SodiumNa
Parts Per Million (ppm)Aluminum
Al
HID:4065-0542-9690-0016
URS CORPORATION11832 ROCK LANDING DR STE 306NEWPORT NEWS, VA 23606
Account - 5604URS11832 ROCK LANDING DR STE 306NEWPORT NEWS, VA 23606
SampledTested
10-17-201210-26-2012
203 PL92276 1.86 0.15204 PL92277 1.64 0.15205 PL92278 1.91 0.16206 PL92279 1.22 0.10207 PL92280 1.07 0.09208 PL92281 1.67 0.13209 PL92282 0.98 0.08210 PL92283 0.78 0.01211 PL92284 1.48 0.10212 PL92285 1.29 0.04213 PL92286 1.25 0.08
Sample Number Lab Number Dry Wg
Rec Wg
13.77 22.09203 PL9227610.82 16.64204 PL9227714.2 21.93205 PL9227832.3 47206 PL9227929.93 44.36207 PL9228022.2 31.6208 PL9228152.44 76.97209 PL9228217.96 20.08210 PL9228348.31 80.82211 PL9228414.03 15.65212 PL9228531.56 50.9213 PL92286
C-22

Analyzed by Spectrum Analytic Inc.www.spectrumanalytic.com
Report To Prepared For
Tabled Plant Analysis Report
Sample Number Lab Number NitrogenN
PhosphorusP
PotassiumK
CalciumCa
MagnesiumMg
Percent (%)Sulfur
SBoron
BCopper
CuIronFe
ManganeseMn
ZincZn
SodiumNa
Parts Per Million (ppm)Aluminum
Al
HID:4065-0542-9690-0016
URS CORPORATION11832 ROCK LANDING DR STE 306NEWPORT NEWS, VA 23606
Account - 5604URS11832 ROCK LANDING DR STE 306NEWPORT NEWS, VA 23606
SampledTested
10-17-201210-26-2012
214 PL92287 1.65 0.11215 PL92288 1.36 0.09216 PL92289 1.17 0.11217 PL92290 1.60 0.11218 PL92291 1.50 0.11219 PL92292 1.52 0.11220 PL92293 1.85 0.12221 PL92294 1.37 0.11222 PL92295 1.65 0.22
Sample Number Lab Number Dry Wg
Rec Wg
51.9 81.31214 PL9228749.43 65.55215 PL9228829.99 35.22216 PL9228917.68 22.27217 PL9229041.75 62.32218 PL9229125.95 37219 PL9229229.7 44.59220 PL9229346.3 69.78221 PL9229428.75 48.26222 PL92295
C-23

Analyzed by Spectrum Analytic Inc.www.spectrumanalytic.com
Report To Prepared For
Tabled Plant Analysis Report
Sample Number Lab Number NitrogenN
PhosphorusP
PotassiumK
CalciumCa
MagnesiumMg
Percent (%)Sulfur
SBoron
BCopper
CuIronFe
ManganeseMn
ZincZn
SodiumNa
Parts Per Million (ppm)Aluminum
Al
HID:4065-0542-9690-0016
URS CORPORATION11832 ROCK LANDING DR STE 306NEWPORT NEWS, VA 23606
Account - 5604URS11832 ROCK LANDING DR STE 306NEWPORT NEWS, VA 23606
SampledTested
10-17-201210-26-2012
223 PL92296 1.69 0.21224 PL92297 1.41 0.05225 PL92298 1.59 0.13226 PL92299 1.70 0.17227 PL92300 1.44 0.11228 PL92301 1.95 0.22229 PL92302 1.24 0.14230 PL92303 1.06 0.03231 PL92304 1.40 0.13232 PL92305 1.37 0.12233 PL92306 1.28 0.12
Sample Number Lab Number Dry Wg
Rec Wg
25.63 41.37223 PL9229616.95 19.15224 PL9229735.73 58.51225 PL9229854.73 97.69226 PL9229949.92 91.09227 PL9230011.67 18.12228 PL9230128.66 47.05229 PL9230220.89 23.41230 PL9230346.53 77.52231 PL9230432.1 55.82232 PL9230536.41 58.84233 PL92306
C-24
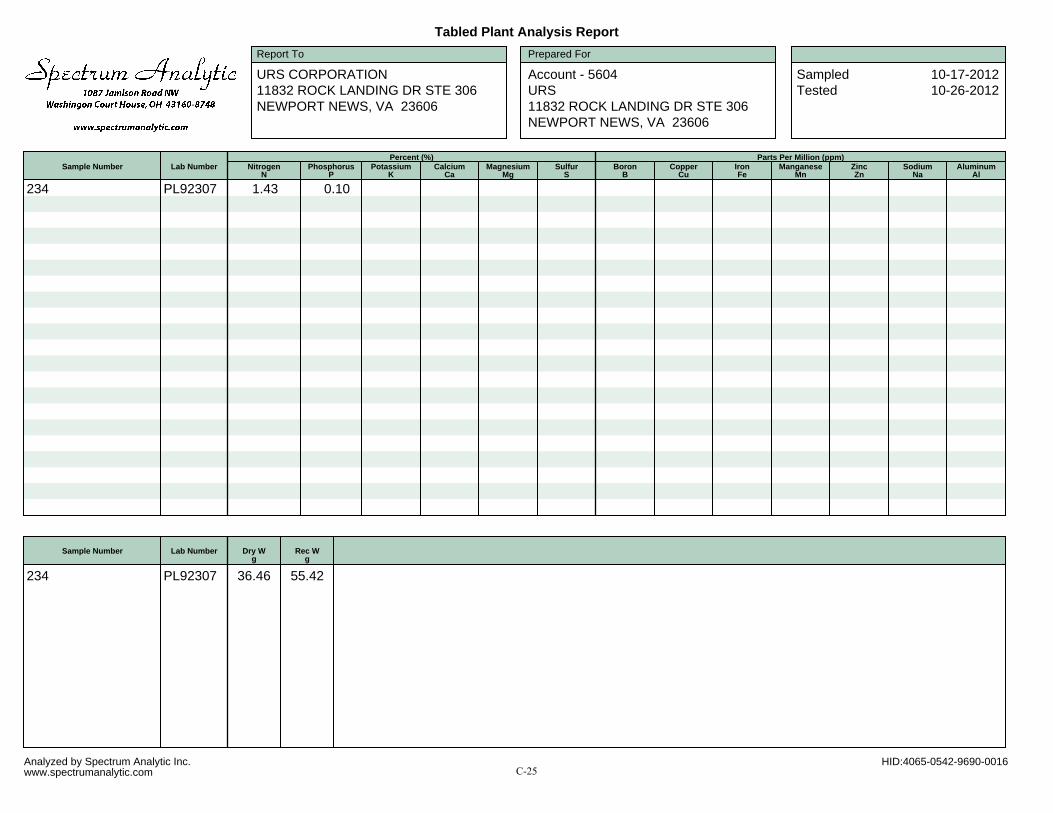
Analyzed by Spectrum Analytic Inc.www.spectrumanalytic.com
Report To Prepared For
Tabled Plant Analysis Report
Sample Number Lab Number NitrogenN
PhosphorusP
PotassiumK
CalciumCa
MagnesiumMg
Percent (%)Sulfur
SBoron
BCopper
CuIronFe
ManganeseMn
ZincZn
SodiumNa
Parts Per Million (ppm)Aluminum
Al
HID:4065-0542-9690-0016
URS CORPORATION11832 ROCK LANDING DR STE 306NEWPORT NEWS, VA 23606
Account - 5604URS11832 ROCK LANDING DR STE 306NEWPORT NEWS, VA 23606
SampledTested
10-17-201210-26-2012
234 PL92307 1.43 0.10
Sample Number Lab Number Dry Wg
Rec Wg
36.46 55.42234 PL92307
C-25

Analyzed by Spectrum Analytic Inc.www.spectrumanalytic.com
Report To Prepared For
Tabled Plant Analysis Report
Sample Number Lab Number NitrogenN
PhosphorusP
PotassiumK
CalciumCa
MagnesiumMg
Percent (%)Sulfur
SBoron
BCopper
CuIronFe
ManganeseMn
ZincZn
SodiumNa
Parts Per Million (ppm)Aluminum
Al
HID:4065-0278-7690-0015
URS CORPORATION11832 ROCK LANDING DR STE 306NEWPORT NEWS, VA 23606
Account - 5604URS11832 ROCK LANDING DR STE 306NEWPORT NEWS, VA 23606
SampledTested
10-23-201210-29-2012
235 PL92320 1.47 0.07236 PL92321 1.36 0.06237 PL92322 1.31 0.04238 PL92323 1.24 0.01239 PL92324 1.41 0.08240 PL92325 1.48 0.08241 PL92326 1.53 0.08242 PL92327 1.54 0.09243 PL92328 1.50 0.08244 PL92329 1.43 0.06245 PL92330 1.49 0.08
Sample Number Lab Number Dry Wg
Rec Wg
38.46 56.46235 PL9232018.56 23.33236 PL9232124.8 41.53237 PL9232212.51 17.69238 PL9232319.74 24.16239 PL9232423.17 35.45240 PL9232519.99 29.15241 PL9232617.36 21.8242 PL9232718.91 24.28243 PL9232830.33 44.77244 PL9232925.88 43.54245 PL92330
C-26

Analyzed by Spectrum Analytic Inc.www.spectrumanalytic.com
Report To Prepared For
Tabled Plant Analysis Report
Sample Number Lab Number NitrogenN
PhosphorusP
PotassiumK
CalciumCa
MagnesiumMg
Percent (%)Sulfur
SBoron
BCopper
CuIronFe
ManganeseMn
ZincZn
SodiumNa
Parts Per Million (ppm)Aluminum
Al
HID:4065-0278-7690-0015
URS CORPORATION11832 ROCK LANDING DR STE 306NEWPORT NEWS, VA 23606
Account - 5604URS11832 ROCK LANDING DR STE 306NEWPORT NEWS, VA 23606
SampledTested
10-23-201210-29-2012
246 PL92331 1.58 0.08247 PL92332 1.68 0.08248 PL92333 1.81 0.12249 PL92334 1.62 0.07250 PL92335 1.89 0.12251 PL92336 1.99 0.13252 PL92337 1.75 0.10253 PL92338 1.65 0.13254 PL92339 1.59 0.20
Sample Number Lab Number Dry Wg
Rec Wg
17.61 27.82246 PL9233131.84 46.7247 PL9233226.11 37.13248 PL9233328.19 44.13249 PL9233425.96 38.97250 PL9233526.77 37.23251 PL9233622.42 31.72252 PL9233724.99 37.15253 PL9233817.53 26.84254 PL92339
C-27
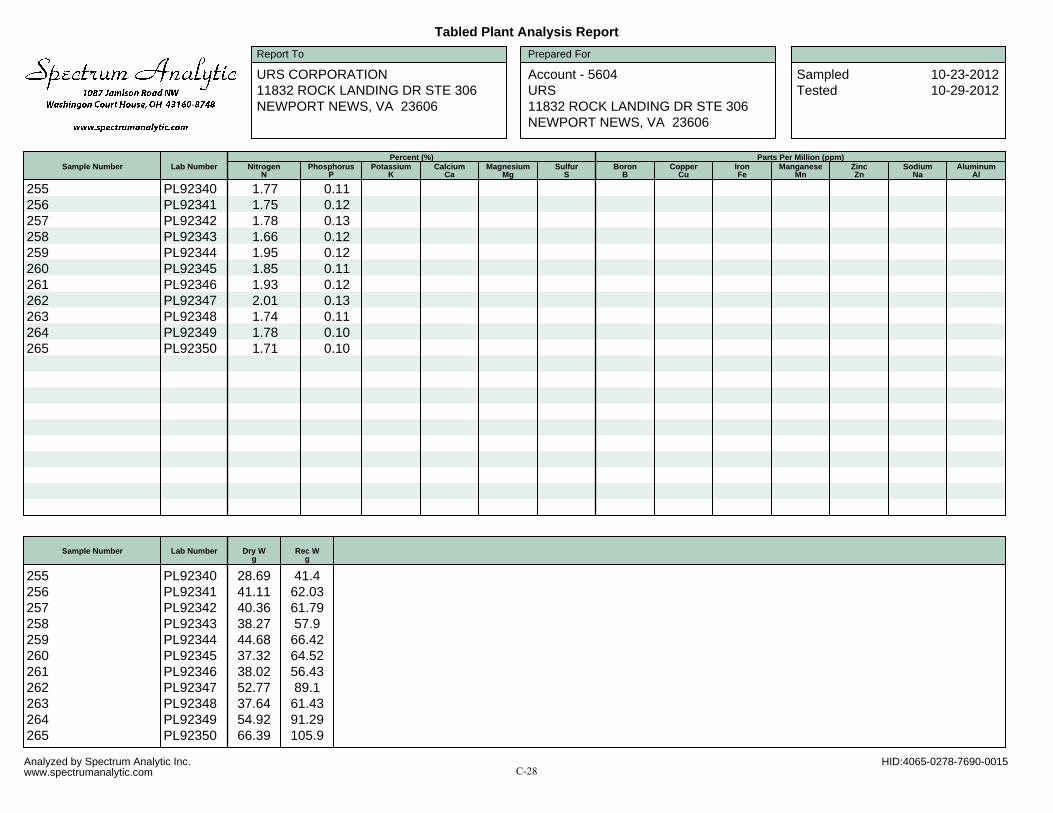
Analyzed by Spectrum Analytic Inc.www.spectrumanalytic.com
Report To Prepared For
Tabled Plant Analysis Report
Sample Number Lab Number NitrogenN
PhosphorusP
PotassiumK
CalciumCa
MagnesiumMg
Percent (%)Sulfur
SBoron
BCopper
CuIronFe
ManganeseMn
ZincZn
SodiumNa
Parts Per Million (ppm)Aluminum
Al
HID:4065-0278-7690-0015
URS CORPORATION11832 ROCK LANDING DR STE 306NEWPORT NEWS, VA 23606
Account - 5604URS11832 ROCK LANDING DR STE 306NEWPORT NEWS, VA 23606
SampledTested
10-23-201210-29-2012
255 PL92340 1.77 0.11256 PL92341 1.75 0.12257 PL92342 1.78 0.13258 PL92343 1.66 0.12259 PL92344 1.95 0.12260 PL92345 1.85 0.11261 PL92346 1.93 0.12262 PL92347 2.01 0.13263 PL92348 1.74 0.11264 PL92349 1.78 0.10265 PL92350 1.71 0.10
Sample Number Lab Number Dry Wg
Rec Wg
28.69 41.4255 PL9234041.11 62.03256 PL9234140.36 61.79257 PL9234238.27 57.9258 PL9234344.68 66.42259 PL9234437.32 64.52260 PL9234538.02 56.43261 PL9234652.77 89.1262 PL9234737.64 61.43263 PL9234854.92 91.29264 PL9234966.39 105.9265 PL92350
C-28

Analyzed by Spectrum Analytic Inc.www.spectrumanalytic.com
Report To Prepared For
Tabled Plant Analysis Report
Sample Number Lab Number NitrogenN
PhosphorusP
PotassiumK
CalciumCa
MagnesiumMg
Percent (%)Sulfur
SBoron
BCopper
CuIronFe
ManganeseMn
ZincZn
SodiumNa
Parts Per Million (ppm)Aluminum
Al
HID:4065-0278-7690-0015
URS CORPORATION11832 ROCK LANDING DR STE 306NEWPORT NEWS, VA 23606
Account - 5604URS11832 ROCK LANDING DR STE 306NEWPORT NEWS, VA 23606
SampledTested
10-23-201210-29-2012
266 PL92351 1.76 0.10267 PL92352 1.64 0.09268 PL92353 1.79 0.10269 PL92354 1.66 0.07270 PL92355 1.67 0.09271 PL92356 1.99 0.22272 PL92357 1.87 0.13273 PL92358 1.90 0.13274 PL92359 1.81 0.12
Sample Number Lab Number Dry Wg
Rec Wg
59.45 97.19266 PL9235151.57 77.99267 PL9235258.08 92.11268 PL9235346.96 71.93269 PL9235465.45 104.14270 PL9235538.62 87.83271 PL9235643.51 92272 PL9235749.25 94.58273 PL9235879.27 152.62274 PL92359
C-29

Analyzed by Spectrum Analytic Inc.www.spectrumanalytic.com
Report To Prepared For
Tabled Plant Analysis Report
Sample Number Lab Number NitrogenN
PhosphorusP
PotassiumK
CalciumCa
MagnesiumMg
Percent (%)Sulfur
SBoron
BCopper
CuIronFe
ManganeseMn
ZincZn
SodiumNa
Parts Per Million (ppm)Aluminum
Al
HID:4065-0278-7690-0015
URS CORPORATION11832 ROCK LANDING DR STE 306NEWPORT NEWS, VA 23606
Account - 5604URS11832 ROCK LANDING DR STE 306NEWPORT NEWS, VA 23606
SampledTested
10-23-201210-29-2012
275 PL92360 1.82 0.13276 PL92361 1.81 0.13277 PL92362 1.43 0.06278 PL92363 1.61 0.08279 PL92364 1.34 0.07280 PL92365 2.13 0.18281 PL92366 2.04 0.15282 PL92367 1.50 0.08283 PL92368 1.76 0.11284 PL92369 1.37 0.08285 PL92370 1.39 0.08
Sample Number Lab Number Dry Wg
Rec Wg
49.11 88.88275 PL9236050.45 87.6276 PL9236124.3 36.5277 PL9236221.94 31.87278 PL9236331.84 47.23279 PL9236424.4 44.8280 PL9236524.04 42.42281 PL9236631.53 46.39282 PL9236712.37 17.55283 PL9236817.74 21.12284 PL9236915.36 18.56285 PL92370
C-30

Analyzed by Spectrum Analytic Inc.www.spectrumanalytic.com
Report To Prepared For
Tabled Plant Analysis Report
Sample Number Lab Number NitrogenN
PhosphorusP
PotassiumK
CalciumCa
MagnesiumMg
Percent (%)Sulfur
SBoron
BCopper
CuIronFe
ManganeseMn
ZincZn
SodiumNa
Parts Per Million (ppm)Aluminum
Al
HID:4065-0278-7690-0015
URS CORPORATION11832 ROCK LANDING DR STE 306NEWPORT NEWS, VA 23606
Account - 5604URS11832 ROCK LANDING DR STE 306NEWPORT NEWS, VA 23606
SampledTested
10-23-201210-29-2012
286 PL92371 1.46 0.09287 PL92372 1.45 0.09288 PL92373 1.56 0.11289 PL92374 1.95 0.12290 PL92375 2.14 0.13291 PL92376 1.90 0.11292 PL92377 2.17 0.15293 PL92378 2.05 0.12294 PL92379 1.87 0.12
Sample Number Lab Number Dry Wg
Rec Wg
14.6 21.76286 PL9237116.26 22.44287 PL9237212.35 17.26288 PL9237328.96 52.84289 PL9237430.57 56.75290 PL9237526.99 43.19291 PL9237622.57 39292 PL9237725.2 38.03293 PL9237817.82 27.96294 PL92379
C-31

Analyzed by Spectrum Analytic Inc.www.spectrumanalytic.com
Report To Prepared For
Tabled Plant Analysis Report
Sample Number Lab Number NitrogenN
PhosphorusP
PotassiumK
CalciumCa
MagnesiumMg
Percent (%)Sulfur
SBoron
BCopper
CuIronFe
ManganeseMn
ZincZn
SodiumNa
Parts Per Million (ppm)Aluminum
Al
HID:4065-0060-0790-0015
URS CORPORATION11832 ROCK LANDING DR STE 306NEWPORT NEWS, VA 23606
Account - 5604URS11832 ROCK LANDING DR STE 306NEWPORT NEWS, VA 23606
SampledTested
10-23-201210-30-2012
295 PL92380 1.69 0.12296 PL92381 1.48 0.09297 PL92382 1.58 0.10298 PL92383 1.81 0.14299 PL92384 1.73 0.11300 PL92385 1.74 0.10301 PL92386 1.41 0.05302 PL92387 1.96 0.12303 PL92388 2.46 0.15304 PL92389 1.77 0.09305 PL92390 1.49 0.04
Sample Number Lab Number Dry Wg
Rec Wg
43.82 62.97295 PL9238044.15 68.16296 PL9238137.44 55.43297 PL9238246.01 69.14298 PL9238342.42 61.01299 PL9238455.09 81.34300 PL9238536.35 48.61301 PL9238625.03 32.73302 PL9238723.81 39.48303 PL9238846.25 68.65304 PL9238931.3 42.79305 PL92390
C-32

Analyzed by Spectrum Analytic Inc.www.spectrumanalytic.com
Report To Prepared For
Tabled Plant Analysis Report
Sample Number Lab Number NitrogenN
PhosphorusP
PotassiumK
CalciumCa
MagnesiumMg
Percent (%)Sulfur
SBoron
BCopper
CuIronFe
ManganeseMn
ZincZn
SodiumNa
Parts Per Million (ppm)Aluminum
Al
HID:4065-0060-0790-0015
URS CORPORATION11832 ROCK LANDING DR STE 306NEWPORT NEWS, VA 23606
Account - 5604URS11832 ROCK LANDING DR STE 306NEWPORT NEWS, VA 23606
SampledTested
10-23-201210-30-2012
306 PL92391 1.66 0.06307 PL92392 1.99 0.11308 PL92393 1.99 0.12309 PL92394 1.99 0.14310 PL92395 1.99 0.09311 PL92396 2.12 0.08312 PL92397 1.98 0.09313 PL92398 2.17 0.13314 PL92399 2.04 0.15
Sample Number Lab Number Dry Wg
Rec Wg
34.07 46.24306 PL9239139.33 52.38307 PL9239238.96 54.09308 PL9239353.27 70.84309 PL9239441.45 54.08310 PL9239552.33 72.18311 PL9239648.42 64.58312 PL9239735.85 54.03313 PL9239830.32 48.98314 PL92399
C-33

Analyzed by Spectrum Analytic Inc.www.spectrumanalytic.com
Report To Prepared For
Tabled Plant Analysis Report
Sample Number Lab Number NitrogenN
PhosphorusP
PotassiumK
CalciumCa
MagnesiumMg
Percent (%)Sulfur
SBoron
BCopper
CuIronFe
ManganeseMn
ZincZn
SodiumNa
Parts Per Million (ppm)Aluminum
Al
HID:4065-0060-0790-0015
URS CORPORATION11832 ROCK LANDING DR STE 306NEWPORT NEWS, VA 23606
Account - 5604URS11832 ROCK LANDING DR STE 306NEWPORT NEWS, VA 23606
SampledTested
10-23-201210-30-2012
315 PL92400 2.03 0.13316 PL92401 2.27 0.18317 PL92402 1.91 0.15318 PL92403 2.05 0.18319 PL92404 2.02 0.17320 PL92405 1.98 0.19321 PL92406 1.80 0.14322 PL92407 1.83 0.15323 PL92408 1.79 0.14324 PL92409 1.65 0.18325 PL92410 1.04 0.03
Sample Number Lab Number Dry Wg
Rec Wg
37.32 57.19315 PL9240045.28 76.58316 PL9240143.8 70.23317 PL9240229.5 39.84318 PL9240333.99 53.85319 PL9240426.11 37.72320 PL9240533.35 46.76321 PL9240631.67 44.98322 PL9240738.84 59.49323 PL9240828.96 45.93324 PL9240949.02 61.09325 PL92410
C-34
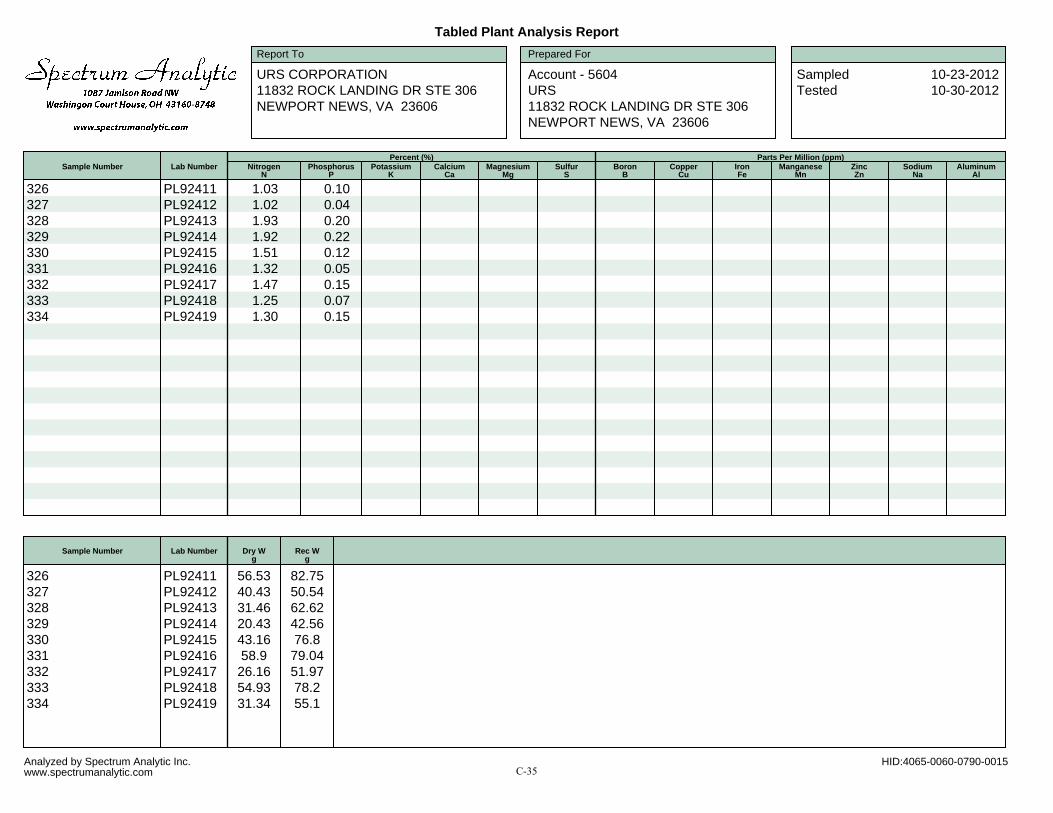
Analyzed by Spectrum Analytic Inc.www.spectrumanalytic.com
Report To Prepared For
Tabled Plant Analysis Report
Sample Number Lab Number NitrogenN
PhosphorusP
PotassiumK
CalciumCa
MagnesiumMg
Percent (%)Sulfur
SBoron
BCopper
CuIronFe
ManganeseMn
ZincZn
SodiumNa
Parts Per Million (ppm)Aluminum
Al
HID:4065-0060-0790-0015
URS CORPORATION11832 ROCK LANDING DR STE 306NEWPORT NEWS, VA 23606
Account - 5604URS11832 ROCK LANDING DR STE 306NEWPORT NEWS, VA 23606
SampledTested
10-23-201210-30-2012
326 PL92411 1.03 0.10327 PL92412 1.02 0.04328 PL92413 1.93 0.20329 PL92414 1.92 0.22330 PL92415 1.51 0.12331 PL92416 1.32 0.05332 PL92417 1.47 0.15333 PL92418 1.25 0.07334 PL92419 1.30 0.15
Sample Number Lab Number Dry Wg
Rec Wg
56.53 82.75326 PL9241140.43 50.54327 PL9241231.46 62.62328 PL9241320.43 42.56329 PL9241443.16 76.8330 PL9241558.9 79.04331 PL9241626.16 51.97332 PL9241754.93 78.2333 PL9241831.34 55.1334 PL92419
C-35

Analyzed by Spectrum Analytic Inc.www.spectrumanalytic.com
Report To Prepared For
Tabled Plant Analysis Report
Sample Number Lab Number NitrogenN
PhosphorusP
PotassiumK
CalciumCa
MagnesiumMg
Percent (%)Sulfur
SBoron
BCopper
CuIronFe
ManganeseMn
ZincZn
SodiumNa
Parts Per Million (ppm)Aluminum
Al
HID:4065-0060-0790-0015
URS CORPORATION11832 ROCK LANDING DR STE 306NEWPORT NEWS, VA 23606
Account - 5604URS11832 ROCK LANDING DR STE 306NEWPORT NEWS, VA 23606
SampledTested
10-23-201210-30-2012
335 PL92420 1.13 0.07336 PL92421 1.32 0.08337 PL92422 1.55 0.10338 PL92423 1.35 0.11339 PL92424 2.01 0.10340 PL92425 1.72 0.15341 PL92426 1.47 0.10342 PL92427 1.52 0.09343 PL92428 1.16 0.06344 PL92429 0.95 0.09345 PL92430 1.17 0.09
Sample Number Lab Number Dry Wg
Rec Wg
29.95 42.69335 PL9242049.97 68.2336 PL9242121.26 29.17337 PL9242231.46 45.69338 PL9242328.85 40.32339 PL9242470.6 97.69340 PL9242539.05 56.49341 PL9242635.09 51.5342 PL9242721.05 27.07343 PL9242833.87 45.76344 PL9242924.66 37.87345 PL92430
C-36

Analyzed by Spectrum Analytic Inc.www.spectrumanalytic.com
Report To Prepared For
Tabled Plant Analysis Report
Sample Number Lab Number NitrogenN
PhosphorusP
PotassiumK
CalciumCa
MagnesiumMg
Percent (%)Sulfur
SBoron
BCopper
CuIronFe
ManganeseMn
ZincZn
SodiumNa
Parts Per Million (ppm)Aluminum
Al
HID:4065-0060-0790-0015
URS CORPORATION11832 ROCK LANDING DR STE 306NEWPORT NEWS, VA 23606
Account - 5604URS11832 ROCK LANDING DR STE 306NEWPORT NEWS, VA 23606
SampledTested
10-23-201210-30-2012
346 PL92431 1.36 0.08347 PL92432 1.32 0.08348 PL92433 1.27 0.10349 PL92434 1.35 0.08350 PL92435 1.20 0.09351 PL92436 1.22 0.09352 PL92437 1.29 0.08353 PL92438 1.17 0.08354 PL92439 1.11 0.07
Sample Number Lab Number Dry Wg
Rec Wg
33.26 47.7346 PL9243129.46 44.78347 PL9243215.64 20.14348 PL9243355.84 81.08349 PL9243437.01 52.7350 PL9243521.41 29.94351 PL9243637.51 47.86352 PL9243737.62 48.58353 PL9243833.28 48.16354 PL92439
C-37

Analyzed by Spectrum Analytic Inc.www.spectrumanalytic.com
Report To Prepared For
Tabled Plant Analysis Report
Sample Number Lab Number NitrogenN
PhosphorusP
PotassiumK
CalciumCa
MagnesiumMg
Percent (%)Sulfur
SBoron
BCopper
CuIronFe
ManganeseMn
ZincZn
SodiumNa
Parts Per Million (ppm)Aluminum
Al
HID:4065-0575-0790-0007
URS CORPORATION11832 ROCK LANDING DR STE 306NEWPORT NEWS, VA 23606
Account - 5604URS11832 ROCK LANDING DR STE 306NEWPORT NEWS, VA 23606
SampledTested
10-23-201210-31-2012
355 PL92442 2.57 0.23356 PL92443 1.41 0.10357 PL92444 1.34 0.08358 PL92445 1.28 0.09359 PL92446 1.00 0.06360 PL92447 1.31 0.08361 PL92448 1.23 0.07362 PL92449 1.21 0.07363 PL92450 1.50 0.11364 PL92451 1.13 0.07365 PL92452 1.17 0.07
Sample Number Lab Number Dry Wg
Rec Wg
12.3 22.68355 PL9244230.86 38.76356 PL9244326.39 33.48357 PL9244424.68 33.81358 PL9244526.43 33.32359 PL9244624.1 34.54360 PL9244715.41 19.33361 PL9244820.16 27.19362 PL9244916.59 21.73363 PL9245026.68 35.74364 PL9245117.53 23.77365 PL92452
C-38
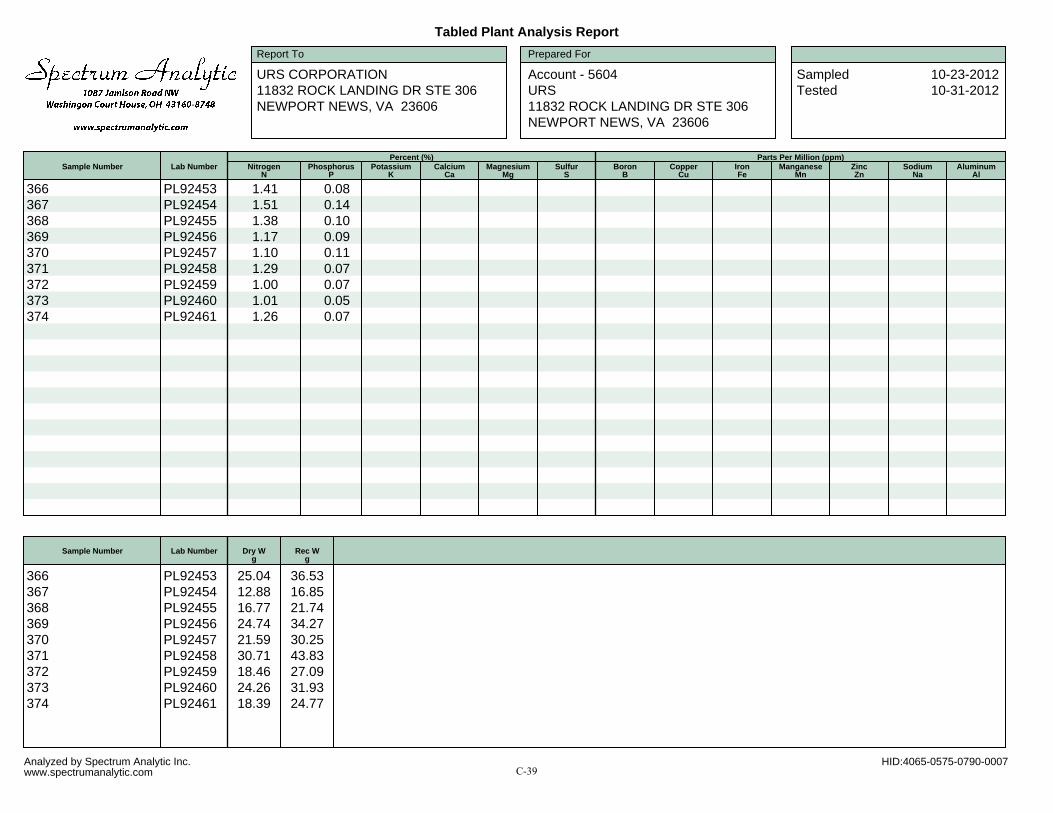
Analyzed by Spectrum Analytic Inc.www.spectrumanalytic.com
Report To Prepared For
Tabled Plant Analysis Report
Sample Number Lab Number NitrogenN
PhosphorusP
PotassiumK
CalciumCa
MagnesiumMg
Percent (%)Sulfur
SBoron
BCopper
CuIronFe
ManganeseMn
ZincZn
SodiumNa
Parts Per Million (ppm)Aluminum
Al
HID:4065-0575-0790-0007
URS CORPORATION11832 ROCK LANDING DR STE 306NEWPORT NEWS, VA 23606
Account - 5604URS11832 ROCK LANDING DR STE 306NEWPORT NEWS, VA 23606
SampledTested
10-23-201210-31-2012
366 PL92453 1.41 0.08367 PL92454 1.51 0.14368 PL92455 1.38 0.10369 PL92456 1.17 0.09370 PL92457 1.10 0.11371 PL92458 1.29 0.07372 PL92459 1.00 0.07373 PL92460 1.01 0.05374 PL92461 1.26 0.07
Sample Number Lab Number Dry Wg
Rec Wg
25.04 36.53366 PL9245312.88 16.85367 PL9245416.77 21.74368 PL9245524.74 34.27369 PL9245621.59 30.25370 PL9245730.71 43.83371 PL9245818.46 27.09372 PL9245924.26 31.93373 PL9246018.39 24.77374 PL92461
C-39

Analyzed by Spectrum Analytic Inc.www.spectrumanalytic.com
Report To Prepared For
Tabled Plant Analysis Report
Sample Number Lab Number NitrogenN
PhosphorusP
PotassiumK
CalciumCa
MagnesiumMg
Percent (%)Sulfur
SBoron
BCopper
CuIronFe
ManganeseMn
ZincZn
SodiumNa
Parts Per Million (ppm)Aluminum
Al
HID:4065-0575-0790-0007
URS CORPORATION11832 ROCK LANDING DR STE 306NEWPORT NEWS, VA 23606
Account - 5604URS11832 ROCK LANDING DR STE 306NEWPORT NEWS, VA 23606
SampledTested
10-23-201210-31-2012
375 PL92462 1.13 0.04376 PL92463 1.36 0.08377 PL92464 1.40 0.08378 PL92465 1.28 0.08379 PL92466 1.21 0.07380 PL92467 1.22 0.07381 PL92468 1.20 0.07382 PL92469 1.20 0.09383 PL92470 1.33 0.08384 PL92471 1.16 0.11385 PL92472 1.09 0.09
Sample Number Lab Number Dry Wg
Rec Wg
41.54 57.31375 PL9246232.38 46.03376 PL9246329.53 39.63377 PL9246417.46 22.38378 PL9246541.81 63.07379 PL9246632.04 45.13380 PL9246732.1 48.7381 PL9246835.3 52.66382 PL9246937.12 54.81383 PL9247026.24 39.39384 PL9247132.19 45.33385 PL92472
C-40

Analyzed by Spectrum Analytic Inc.www.spectrumanalytic.com
Report To Prepared For
Tabled Plant Analysis Report
Sample Number Lab Number NitrogenN
PhosphorusP
PotassiumK
CalciumCa
MagnesiumMg
Percent (%)Sulfur
SBoron
BCopper
CuIronFe
ManganeseMn
ZincZn
SodiumNa
Parts Per Million (ppm)Aluminum
Al
HID:4065-0575-0790-0007
URS CORPORATION11832 ROCK LANDING DR STE 306NEWPORT NEWS, VA 23606
Account - 5604URS11832 ROCK LANDING DR STE 306NEWPORT NEWS, VA 23606
SampledTested
10-23-201210-31-2012
386 PL92473 1.10 0.11387 PL92474 1.10 0.09388 PL92475 1.25 0.09389 PL92476 1.16 0.09390 PL92477 1.26 0.08391 PL92478 1.07 0.04392 PL92479 1.16 0.04393 PL92480 1.08 0.07394 PL92481 1.13 0.05
Sample Number Lab Number Dry Wg
Rec Wg
39.84 58.22386 PL9247337.22 53.2387 PL9247429.8 44.25388 PL9247528.6 40.58389 PL9247649.96 73.39390 PL9247729.96 40.73391 PL9247823.82 32.11392 PL9247919.15 24.53393 PL9248027.55 39.07394 PL92481
C-41

Analyzed by Spectrum Analytic Inc.www.spectrumanalytic.com
Report To Prepared For
Tabled Plant Analysis Report
Sample Number Lab Number NitrogenN
PhosphorusP
PotassiumK
CalciumCa
MagnesiumMg
Percent (%)Sulfur
SBoron
BCopper
CuIronFe
ManganeseMn
ZincZn
SodiumNa
Parts Per Million (ppm)Aluminum
Al
HID:4065-0575-0790-0007
URS CORPORATION11832 ROCK LANDING DR STE 306NEWPORT NEWS, VA 23606
Account - 5604URS11832 ROCK LANDING DR STE 306NEWPORT NEWS, VA 23606
SampledTested
10-23-201210-31-2012
395 PL92482 1.16 0.04396 PL92483 1.22 0.04397 PL92484 1.22 0.06398 PL92485 1.23 0.08399 PL92486 1.49 0.11400 PL92487 1.55 0.11401 PL92488 1.43 0.12402 PL92489 1.42 0.10403 PL92490 1.46 0.08404 PL92491 1.46 0.10405 PL92492 1.20 0.15
Sample Number Lab Number Dry Wg
Rec Wg
24.95 32.98395 PL9248221.36 30.15396 PL9248326.53 36.47397 PL9248427.4 37.53398 PL9248541.73 60.31399 PL9248626.9 35.98400 PL9248719.1 24.36401 PL9248821.35 28.95402 PL9248946.86 68.73403 PL9249030.73 44.39404 PL9249125.06 42.95405 PL92492
C-42

Analyzed by Spectrum Analytic Inc.www.spectrumanalytic.com
Report To Prepared For
Tabled Plant Analysis Report
Sample Number Lab Number NitrogenN
PhosphorusP
PotassiumK
CalciumCa
MagnesiumMg
Percent (%)Sulfur
SBoron
BCopper
CuIronFe
ManganeseMn
ZincZn
SodiumNa
Parts Per Million (ppm)Aluminum
Al
HID:4065-0575-0790-0007
URS CORPORATION11832 ROCK LANDING DR STE 306NEWPORT NEWS, VA 23606
Account - 5604URS11832 ROCK LANDING DR STE 306NEWPORT NEWS, VA 23606
SampledTested
10-23-201210-31-2012
406 PL92493 1.53 0.09407 PL92494 1.49 0.11408 PL92495 1.34 0.11409 PL92496 1.22 0.07410 PL92497 1.33 0.10411 PL92498 1.25 0.07412 PL92499 1.46 0.10413 PL92500 1.27 0.05414 PL92501 1.56 0.10
Sample Number Lab Number Dry Wg
Rec Wg
27.9 43.39406 PL9249323.03 35.65407 PL9249418.78 27.5408 PL9249516.21 21.01409 PL9249619.82 25.7410 PL9249718.68 23.03411 PL9249819.52 26.08412 PL9249930.59 40.23413 PL9250015.57 22.92414 PL92501
C-43

Analyzed by Spectrum Analytic Inc.www.spectrumanalytic.com
Report To Prepared For
Tabled Plant Analysis Report
Sample Number Lab Number NitrogenN
PhosphorusP
PotassiumK
CalciumCa
MagnesiumMg
Percent (%)Sulfur
SBoron
BCopper
CuIronFe
ManganeseMn
ZincZn
SodiumNa
Parts Per Million (ppm)Aluminum
Al
HID:4065-0875-0790-0008
URS CORPORATION11832 ROCK LANDING DR STE 306NEWPORT NEWS, VA 23606
Account - 5604URS11832 ROCK LANDING DR STE 306NEWPORT NEWS, VA 23606
SampledTested
10-23-201210-31-2012
415 PL92517 1.05 0.06416 PL92518 1.19 0.06417 PL92519 1.17 0.07418 PL92520 1.07 0.06419 PL92521 1.06 0.06420 PL92522 1.03 0.05421 PL92523 1.32 0.09422 PL92524 1.37 0.11423 PL92525 1.93 0.11424 PL92526 2.17 0.08425 PL92527 2.04 0.08
Sample Number Lab Number Dry Wg
Rec Wg
12.84 13.83415 PL9251712.96 14.04416 PL9251840.53 47.91417 PL9251929.45 33.65418 PL9252020.29 22.97419 PL9252133.15 39.71420 PL9252215.92 18.69421 PL9252325.25 29.87422 PL9252421.64 25.77423 PL9252513.92 16.01424 PL9252620.28 24.68425 PL92527
C-44

Analyzed by Spectrum Analytic Inc.www.spectrumanalytic.com
Report To Prepared For
Tabled Plant Analysis Report
Sample Number Lab Number NitrogenN
PhosphorusP
PotassiumK
CalciumCa
MagnesiumMg
Percent (%)Sulfur
SBoron
BCopper
CuIronFe
ManganeseMn
ZincZn
SodiumNa
Parts Per Million (ppm)Aluminum
Al
HID:4065-0875-0790-0008
URS CORPORATION11832 ROCK LANDING DR STE 306NEWPORT NEWS, VA 23606
Account - 5604URS11832 ROCK LANDING DR STE 306NEWPORT NEWS, VA 23606
SampledTested
10-23-201210-31-2012
426 PL92528 2.13 0.09427 PL92529 1.96 0.08428 PL92530 1.80 0.09429 PL92531 1.93 0.11430 PL92532 1.68 0.07431 PL92533 1.79 0.10432 PL92534 1.81 0.11433 PL92535 1.74 0.10434 PL92536 1.87 0.09
Sample Number Lab Number Dry Wg
Rec Wg
14.12 16.67426 PL9252836.02 47.58427 PL9252934.57 39.78428 PL9253027.86 31.67429 PL9253126.77 39.27430 PL9253228.56 42.21431 PL9253321.2 28432 PL9253423.06 28.1433 PL9253515.59 18.27434 PL92536
C-45

Analyzed by Spectrum Analytic Inc.www.spectrumanalytic.com
Report To Prepared For
Tabled Plant Analysis Report
Sample Number Lab Number NitrogenN
PhosphorusP
PotassiumK
CalciumCa
MagnesiumMg
Percent (%)Sulfur
SBoron
BCopper
CuIronFe
ManganeseMn
ZincZn
SodiumNa
Parts Per Million (ppm)Aluminum
Al
HID:4065-0875-0790-0008
URS CORPORATION11832 ROCK LANDING DR STE 306NEWPORT NEWS, VA 23606
Account - 5604URS11832 ROCK LANDING DR STE 306NEWPORT NEWS, VA 23606
SampledTested
10-23-201210-31-2012
435 PL92537 1.88 0.07436 PL92538 2.00 0.07437 PL92539 1.58 0.08438 PL92540 1.68 0.08439 PL92541 1.45 0.10440 PL92542 1.57 0.09441 PL92543 1.77 0.14442 PL92544 1.86 0.13443 PL92545 1.53 0.09444 PL92546 1.41 0.07445 PL92547 1.44 0.07
Sample Number Lab Number Dry Wg
Rec Wg
19.88 23.48435 PL9253766.22 97.82436 PL9253812.03 14.5437 PL9253922.06 28.39438 PL9254023.99 32.24439 PL9254155.26 80.02440 PL9254217.8 21.54441 PL9254319.74 25.68442 PL9254451.57 71.47443 PL9254517.82 20.58444 PL9254627.99 36.96445 PL92547
C-46

Analyzed by Spectrum Analytic Inc.www.spectrumanalytic.com
Report To Prepared For
Tabled Plant Analysis Report
Sample Number Lab Number NitrogenN
PhosphorusP
PotassiumK
CalciumCa
MagnesiumMg
Percent (%)Sulfur
SBoron
BCopper
CuIronFe
ManganeseMn
ZincZn
SodiumNa
Parts Per Million (ppm)Aluminum
Al
HID:4065-0875-0790-0008
URS CORPORATION11832 ROCK LANDING DR STE 306NEWPORT NEWS, VA 23606
Account - 5604URS11832 ROCK LANDING DR STE 306NEWPORT NEWS, VA 23606
SampledTested
10-23-201210-31-2012
446 PL92548 1.72 0.12447 PL92549 1.36 0.08448 PL92550 1.57 0.09449 PL92551 1.43 0.08450 PL92552 1.63 0.10451 PL92553 1.93 0.16452 PL92554 1.90 0.17453 PL92555 1.83 0.15454 PL92556 2.02 0.13
Sample Number Lab Number Dry Wg
Rec Wg
17.04 21.2446 PL9254834.74 44.99447 PL9254917.48 22.82448 PL9255029.35 38.36449 PL9255127.86 37.49450 PL9255233.2 46.84451 PL9255344.49 61.92452 PL9255440.03 55.99453 PL9255530.57 42.04454 PL92556
C-47

Analyzed by Spectrum Analytic Inc.www.spectrumanalytic.com
Report To Prepared For
Tabled Plant Analysis Report
Sample Number Lab Number NitrogenN
PhosphorusP
PotassiumK
CalciumCa
MagnesiumMg
Percent (%)Sulfur
SBoron
BCopper
CuIronFe
ManganeseMn
ZincZn
SodiumNa
Parts Per Million (ppm)Aluminum
Al
HID:4065-0875-0790-0008
URS CORPORATION11832 ROCK LANDING DR STE 306NEWPORT NEWS, VA 23606
Account - 5604URS11832 ROCK LANDING DR STE 306NEWPORT NEWS, VA 23606
SampledTested
10-23-201210-31-2012
455 PL92557 2.02 0.21456 PL92558 1.89 0.21457 PL92559 2.09 0.14458 PL92560 2.08 0.16459 PL92561 1.61 0.20460 PL92562 1.86 0.16461 PL92563 1.48 0.12462 PL92564 2.40 0.29463 PL92565 1.78 0.18464 PL92566 1.52 0.17465 PL92567 1.57 0.17
Sample Number Lab Number Dry Wg
Rec Wg
35.56 50.87455 PL9255711.92 13.78456 PL9255830.53 41.86457 PL9255949.74 71.75458 PL9256016.62 22.1459 PL9256140.27 57.87460 PL9256232.75 44.71461 PL9256315.3 25.4462 PL9256442.03 69.8463 PL9256566.89 135.58464 PL9256630.88 49.35465 PL92567
C-48

Analyzed by Spectrum Analytic Inc.www.spectrumanalytic.com
Report To Prepared For
Tabled Plant Analysis Report
Sample Number Lab Number NitrogenN
PhosphorusP
PotassiumK
CalciumCa
MagnesiumMg
Percent (%)Sulfur
SBoron
BCopper
CuIronFe
ManganeseMn
ZincZn
SodiumNa
Parts Per Million (ppm)Aluminum
Al
HID:4065-0875-0790-0008
URS CORPORATION11832 ROCK LANDING DR STE 306NEWPORT NEWS, VA 23606
Account - 5604URS11832 ROCK LANDING DR STE 306NEWPORT NEWS, VA 23606
SampledTested
10-23-201210-31-2012
466 PL92568 1.61 0.15467 PL92569 1.73 0.17468 PL92570 1.56 0.14469 PL92571 1.68 0.14470 PL92572 1.60 0.16471 PL92573 1.71 0.13472 PL92574 1.75 0.15473 PL92575 1.96 0.18474 PL92576 1.58 0.10
Sample Number Lab Number Dry Wg
Rec Wg
32.72 53.65466 PL9256847.56 90.78467 PL9256945.22 80.48468 PL9257022.05 29.14469 PL9257125.28 33.8470 PL9257223.55 28.15471 PL9257348.58 74.81472 PL9257419.53 28.27473 PL9257534.91 51.58474 PL92576
C-49

Analyzed by Spectrum Analytic Inc.www.spectrumanalytic.com
Report To Prepared For
Tabled Plant Analysis Report
Sample Number Lab Number NitrogenN
PhosphorusP
PotassiumK
CalciumCa
MagnesiumMg
Percent (%)Sulfur
SBoron
BCopper
CuIronFe
ManganeseMn
ZincZn
SodiumNa
Parts Per Million (ppm)Aluminum
Al
HID:4065-0875-0790-0008
URS CORPORATION11832 ROCK LANDING DR STE 306NEWPORT NEWS, VA 23606
Account - 5604URS11832 ROCK LANDING DR STE 306NEWPORT NEWS, VA 23606
SampledTested
10-23-201210-31-2012
475 PL92577 1.63 0.07476 PL92578 1.71 0.12477 PL92579 1.92 0.11478 PL92580 1.71 0.13479 PL92581 1.48 0.05480 PL92582 1.86 0.07
Sample Number Lab Number Dry Wg
Rec Wg
39.06 48.48475 PL9257735.18 44.25476 PL9257820.85 25.52477 PL9257925.55 31.75478 PL9258014.49 16.28479 PL9258121.3 25.42480 PL92582
C-50

Appendix D
Article 14 of the Virginia Beach City Zoning Ordinance
(a)(b)(c)
(d)
Virginia Beach, Virginia, Code of Ordinances >> - CODE >> APPENDIX A - ZONING ORDINANCE >> ARTICLE 14. - WETLANDS ZONING ORDINANCE >>
ARTICLE 14. - WETLANDS ZONING ORDINANCE [131]
Sec. 1400. - Intent.Sec. 1401. - Definitions.Sec. 1402. - Uses.Sec. 1403. - Applications for permits.Sec. 1404. - Public inspection of permit applications, maps, etc.Sec. 1405. - Public hearing procedure on permit applications [wetlands permit applications].Sec. 1406. - Action of Board on permit application.Sec. 1407. - Bonding requirements; suspension or revocation of permit.Sec. 1407.1. - Duties of Board.Sec. 1408. - Standards for grant or denial of permit.Sec. 1408.1. - Standards for use and development of wetlands.Sec. 1409. - Permits to be in writing, signed, and notarized.Sec. 1409.1. - Private rights, zoning and land use ordinances not affected.Sec. 1410. - Expiration date and extensions of permit.Sec. 1411. - Emergency sand grading activities on nonvegetated wetlands located on the Atlantic shoreline of Virginia Beach.Sec. 1412. - Conducting activity without permit.Sec. 1413. - Investigations and prosecutions.Sec. 1414. - Reporting, monitoring, site inspections and notice to comply; stop-work orders.Sec. 1415. - Violations; penalty.Sec. 1416. - Injunctions.Sec. 1417. - Reserved.Sec. 1418. - Civil penalties; civil charges.
Sec. 1400. - Intent.
The city council of the City of Virginia Beach, acting pursuant to Chapter 13 (§ 28.2-1300 et seq.) of the Code of Virginia, reordains this article regulating the use and development of wetlands.
(Ord. No. 1804, 8-22-88; Ord. No. 2198, 12-8-92)
Sec. 1401. - Definitions.
For the purposes of this article:
Commission means the Virginia Marine Resources Commission. Commissioner means the commissioner of marine resources. Person means any corporation, association, partnership, individual, company, business, trust, joint venture or other legal entity or any unit of government or agency thereof. Governmental activity means any or all of the services provided by the City of Virginia Beach to its citizens for the purpose of maintaining this city, and shall include, but not be limited to,
Page 1 of 9Municode
11/14/2012Municode
D-1

(e)
(f)
(g)(h)
(i)
such services as constructing, repairing and maintaining roads, providing sewage facilities, supplying and treating water, providing street lights, and constructing public buildings. Vegetated wetlands means lands lying between and contiguous to mean low water and an elevation above mean low water equal to the factor one and one-half (1½) times the mean tide range at the site of the proposed project in the City of Virginia Beach; and upon which is growing any one (1) or more of the following species: saltmarsh cordgrass (Spartina alterniflora), saltmeadow hay (Spartina patens), saltgrass (Distichlis spicata), black needlerush (Juncus roemerianus), saltwort (Salicornia spp.), sea lavender (Limonium spp.), marsh elder (Iva frutescens), groundsel bush (Baccharis halimifolia), wax myrtle (Myrica sp.), sea oxeye (Borrichia frutescens), arrow arum (Peltandra virginica), pickerelweed (Pontederia cordata), big cordgrass (Spartina cynosuroides), rice cutgrass (Leersia oryzoides), wildrice (Zizania aquatica), bulrush (Scirpus validus), spikerush (Eleocharis sp.), sea rocket (Cakile edentula), southern wildrice (Zizaniopsis miliacea), cattails (Typha spp.), three-squares (Scirpus spp.), buttonbush (Cephalanthus occidentalis), bald cypress (Taxodium distichum), black gum (Nyssa sylvatica), tupelo (Nyssa aquatica), dock (Rumex spp.), yellow pond lily (Nuphar sp.), marsh fleabane (Pluchea purpurascens), royal fern (Osmunda regalis), marsh hibiscus (Hibiscus moscheutos), beggar's tick (Bidens sp.), smartweeds (Polygonum sp.), arrowhead (Sagittaria spp.), sweet flag (Acorus calamus), water hemp (Amaranthus cannabinus), reed grass (Phragmites communis), and switch grass (Panicum virgatum). Vegetated wetlands of Back Bay and its tributaries or vegetated wetlands of the North Landing River and its tributaries shall mean all marshes subject to flooding by normal and wind tides, but not hurricane or tropical storm tides, and upon which is growing any of the following species: saltmarsh cordgrass (Spartina alterniflora), saltmeadow hay (Spartina patens), black needlerush (Juncus roemerianus), marsh elder (Iva frutescens), groundsel bush (Baccharis halimifolia), wax myrtle (Myrica sp.), arrow arum (Peltandra virginica), pickerelweed (Pontederia cordata), big cordgrass (Spartina cynosuroides), rice cutgrass (Leersia oryzoides), wildrice (Zizania acquatica), bulrush (Scirpus validus), spikerush (Eleocharis sp.), cattails (Typha spp.), three-squares (Scirpus spp.), dock (Rumex sp.), smartweed (Polygonum sp.), yellow pond lily (Nuphar sp.), royal fern (Osmunda regalis), marsh hibiscus (Hibiscus moscheutos), beggar's tick (Bidens sp.), arrowhead (Sagittaria sp.), water hemp (Amaranthus cannabinus), reed grass (Phragmites communis), and switch grass (Panicum virgatum). Wetlands board or board means the Wetlands Board of the City of Virginia Beach. Back Bay and its tributaries means the following, as shown on the U.S. Geological Survey Quadrangle Sheets for Virginia Beach, North Bay, and Knotts Island: Back Bay north of the Virginia-North Carolina state line; Capsies Creek north of the Virginia-North Carolina state line; Deal Creek; Devil Creek; Nawney Creek; Redhead Bay, Sand Bay, Shipps Bay, North Bay, and the waters connecting them; Beggars Bridge Creek; Muddy Creek; Ashville Bridge Creek; Hells Point Creek; Black Gut; and all coves, ponds and natural waterways adjacent to or connecting with the above-named bodies of water. North Landing River and its tributaries means the following, as shown on United States Geological Survey Quadrangle Sheets for Pleasant Ridge, Creeds, and Fentress: the North Landing River from the Virginia-North Carolina line to Virginia Highway 165 at North Landing Bridge; the Chesapeake and Albemarle Canal from Virginia Highway 165 at North Landing Bridge to the locks at Great Bridge; all named and unnamed streams, creeks and rivers flowing into the North Landing River and the Chesapeake and Albermarle Canal except the following: West Neck Creek north of Indian River Road; Pocaty River west of Blackwater Road; Blackwater Creek west of its forks located at a point approximately six thousand four
Page 2 of 9Municode
11/14/2012Municode
D-2

(j)
(k)(l)
(a)
(b)(c)
(d)
(e)
(f)
(g)
(h)
(i)
(j)
(k)
hundred (6,400) feet due west of the point where the Blackwater Road crosses the Blackwater Creek at the village of Blackwater; and Mill Dam Creek west of Blackwater Road. Nonvegetated wetlands means unvegetated lands lying contiguous to mean low water and between mean low water and mean high water, including those unvegetated areas of Back Bay and its tributaries and the North Landing River and its tributaries subject to flooding by normal and wind tides but not hurricane or tropical storm tides. Wetlands means both vegetated and nonvegetated wetlands. Ordinance means the Wetlands Zoning Ordinance [this article].
(Ord. No. 1804, 8-22-88; Ord. No. 2198, 12-8-92; Ord. No. 2268, 6-14-94)
Sec. 1402. - Uses.
The following uses of and activities in wetlands are authorized, if otherwise permitted by law:
The construction and maintenance of noncommercial catwalks, piers, boathouses, boat shelters, fences, duckblinds, wildlife management shelters, footbridges, observation decks and shelters and other similar structures; provided that such structures are so constructed on pilings as to permit the reasonably unobstructed flow of the tide and preserve the natural contour of the wetlands; The cultivation and harvesting of shellfish, and worms for bait;Noncommercial outdoor recreational activities, including hiking, boating, trapping, hunting, fishing, shellfishing, horseback riding, swimming, skeet and trap shooting, and shooting on shooting preserves; provided that no structure shall be constructed except as permitted in subsection (a) of this section; Grazing, haying, and the cultivation and harvesting of agricultural, forestry or horticultural products; Conservation, repletion and research activities of the commission, the Virginia Institute of Marine Science, the Department of Game and Inland Fisheries and other conservation-related agencies; The construction or maintenance of aids to navigation which are authorized by governmental authority; Emergency measures decreed by any duly appointed health officer of a governmental subdivision acting to protect the public health; The normal maintenance and repair of, or addition to, presently existing roads, highways, railroad beds, or facilities abutting on or crossing wetlands, provided that no waterway is altered and no additional wetlands are covered; Governmental activity on wetlands owned or leased by the commonwealth or a political subdivision thereof; The normal maintenance of manmade drainage ditches, provided that no additional wetlands are covered; and provided further, that this subsection shall not be deemed to authorize construction of any drainage ditch; and Outdoor recreational activities other than those set forth in subsection (c), provided that such activities do not impair the natural functions of the wetlands or alter the natural contour of the wetlands.
(Ord. No. 1804, 8-22-84; Ord. No. 1903, 8-14-89; Ord. No. 2198, 12-8-92)
Sec. 1403. - Applications for permits.
Page 3 of 9Municode
11/14/2012Municode
D-3
(a)
(b)
(c)
Any person who desires to use or develop any wetland within this city, other than for those activities specified in section 1402, shall first file an application for a permit with the Wetlands Board. An application shall be accompanied by plans and other data in reference to the proposed use or development. Plans shall be prepared, stamped and endorsed by such qualified professional licensed to practice in the Commonwealth of Virginia as the planning director may require; provided, however, that this requirement may be waived if, in the judgment of the planning director, the nature of the work to be performed renders it unnecessary. An application shall include the following: The name and address of the applicant; a detailed description of the proposed activity or activities; map, drawn to an appropriate and uniform scale, showing the area of wetland directly affected, with the location of the proposed work thereon, indicating the area of existing and proposed fill and excavation, the location, width, depth and length of any proposed channel the disposal area, and the location of all existing and proposed structures, sewage collection and treatment facilities, utility installations, roadways, and other related appurtenances or facilities, including those on adjacent uplands; a description of the type of equipment to be used and the means of equipment access to the activity site; the names and addresses of owners of record of adjacent land and known claimants of water rights in or adjacent to the wetland of whom the applicant has notice; and estimate of cost; the primary purpose of the project; and secondary purposes of the project, including further projects; the public benefit to be derived from the proposed project; a complete description of measures to be taken during and after the alteration to reduce detrimental off-site effects; the completion date of the proposed work, project, or structure and such additional materials and documentation as the Wetlands Board or planning director may require. A nonrefundable processing fee to cover the cost of processing the application accompany each permit application. Such fee shall be in an amount of two hundred dollars ($200.00) plus the cost of advertisement shall be required. Such fees shall apply to original applications, including after-the-fact applications, and to reapplications. A fee in an amount of one hundred dollars ($100.00) shall berequired for deferral of an application unless waived by the Board for good cause shown.
(Ord. No. 1804, 8-22-88; Ord. No. 1874, 5-15-89; Ord. No. 1883, 6-19-89; Ord. No. 2030, 2-12-91; Ord. No. 2152, 6-23-92; Ord. No. 2198, 12-8-92; Ord. No. 2811, 5-11-04)
Sec. 1404. - Public inspection of permit applications, maps, etc.
All applications, maps, and documents relating thereto shall be open for public inspection at the planning department.
(Ord. No. 1804, 8-22-88; Ord. No. 2152, 6-23-62; Ord. No. 2198, 12-8-92)
Sec. 1405. - Public hearing procedure on permit applications [wetlands permit applications].
Not later than sixty (60) days after receipt of a complete application, the Wetlands Board shall hold a public hearing on such application. The applicant, the city council, the commissioner, the owner of record of any land adjacent to the wetlands in question, known claimants of water rights in or adjacent to the wetlands in question, the Virginia Institute of Marine Science, the Department of Game and Inland Fisheries, the Virginia Water Control Board, the Department of Transportation and any governmental agencies expressing an interest therein shall be notified of the hearing. The Board shall mail such notices not less than twenty (20) days prior to the date set for the hearing. The Board shall also cause notice of the hearing to be published at least once a week for two (2) weeks prior to such hearing in a newspaper of general circulation in the City of Virginia Beach. The published notice shall state that copies of the application may be examined in the planning department. The costs of such publication shall be paid by the applicant. The applicant shall also erect, on the property which is the subject of the hearing, a sign of a
Page 4 of 9Municode
11/14/2012Municode
D-4

(a)
(b)
(c)
(d)
size, type and lettering approved by the board. One such sign shall be posted within ten (10) feet of every public street adjoining the property, and within ten (10) feet of any body of water or waterway less than five hundred (500) feet wide adjoining the property or in such alternate location or locations as may be prescribed by the planning director. Such sign shall be erected not less than thirty (30) days before the Wetlands Board hearing and shall state the nature of the application and date and time of the hearing. Such signs shall be removed no later than five (5) days thereafter. In any case in which the Wetlands Board determines that the requirements of this section have not been met, the application shall be deferred or denied.
(Ord. No. 1804, 8-22-88; Ord. No. 2152, 6-23-92; Ord. No. 2198, 12-8-92; Ord. No. 2683, 1-22-02; Ord. No. 2741, 4-22-03 )
Sec. 1406. - Action of Board on permit application.
In acting on any application for a permit, the Board shall grant the application upon the affirmative vote of note less than four (4) members. If the application receives less than four (4) affirmative votes, the permit shall be denied. The chairperson of the Board, or in his or her absence the acting chairperson, may administer oaths and compel the attendance of witnesses. Any person may appear and testify at the public hearing. Each witness at the hearing may submit a concise written statement of his testimony. The Board shall make a record of the proceeding, which shall include the application, any written statements of witnesses, a summary of statements of all witnesses, the findings and decision of the Board, and the rationale for the decision. The Board shall make its determination within thirty (30) days of the hearing. If the Board fails to take a vote within such time, the application shall be deemed approved. Within forty-eight (48) hours of its determination, the Board shall notify the applicant and the commissioner of such determination. If the Board has not made a determination within such thirty-day period, it shall promptly notify the applicant and the commission that the application is deemed approved. If the Board's decision is reviewed or appealed, the Board shall transmit the record of its hearing to the commissioner. Upon a final determination by the commission, the record shall be returned to the Board. The record shall be open for public inspection at the planning department.
(Ord. No. 1804, 8-22-88; Ord. No. 2152, 6-23-92; Ord. No. 2198, 12-8-92)
Sec. 1407. - Bonding requirements; suspension or revocation of permit.
The Board may require a reasonable bond or letter of credit in an amount and with surety and conditions satisfactory to it, securing to the Commonwealth compliance with the conditions and limitations set forth in the permit. The Board may, after hearing as provided herein, suspend or revoke a permit if the Board finds that the applicant has failed to comply with any of the conditions or limitations set forth in the permit or has exceeded the scope of work described in the application. The Board, after hearing, may suspend a permit if the applicant fails to comply with the terms and conditions set forth in the application.
(Ord. No. 1804, 8-22-88; Ord. No. 2198, 12-8-92)
Sec. 1407.1. - Duties of Board.
In fulfilling its responsibilities under this article, the Board shall preserve, and prevent the despoliation and destruction of, wetlands within its jurisdiction while accommodating necessary economic development in a manner consistent with wetlands preservation.
(Ord. No. 2198, 12-8-92)
Page 5 of 9Municode
11/14/2012Municode
D-5

(a)
(1)(2)(3)
(b)(1)
(2)
(3)
(a)
(1)
(2)
(b)
(c)
Sec. 1408. - Standards for grant or denial of permit.
In making its decision whether to grant, to grant in modified form, or to deny an application for a permit, the Board shall consider the following:
The testimony of any person in support of or in opposition to the permit application.Impact of the development on the public health and welfare; andThe proposed development's conformance with the standards prescribed in section 1408.1 of this ordinance and Code of Virginia, section 28.2-1308 and the guidelines promulgated by the commission pursuant to Code of Virginia, section 28.2-1301.
The Board shall grant the permit if all of the following criteria have been met:The anticipated public and private benefit of the proposed activity exceeds its anticipated public and private detriment; The proposed development conforms with the standards prescribed in section 1408.1 of this ordinance and Code of Virginia, section 28.2-1308 and the guidelines promulgated by the commission pursuant to Code of Virginia, section 28.2-1301; and The proposed activity does not violate the purposes and intent of this article or Code of Virginia, chapter 13 (§ 28.2-1300 et seq.) of Title 28
If the Board finds that any of the criteria set forth in subdivisions (1), (2) and (3) of this subsection are not met, the Board shall deny the permit application with leave to the applicant to resubmit the application in modified form. (Ord. No. 1804, 8-22-88; Ord. No. 2198, 12-8-92)
Sec. 1408.1. - Standards for use and development of wetlands.
The following standards shall apply to the use and development of wetlands and shall be considered by the Board in the determination of whether any permit required by this article should be granted or denied:
Wetlands of primary ecological significance shall not be altered so that the ecological systems in the wetlands are unreasonably disturbed; and To the maximum extent practical, development shall be concentrated in wetlands of lesser ecological significance, in vegetated wetlands which have been irreversibly disturbed before July 1, 1972, in nonvegetated wetlands which have been irreversibly disturbed prior to January 1, 1983, and in areas outside of wetlands.
The provisions of guidelines promulgated by the commission pursuant to Code of Virginia, section 28.2-1301 shall be considered in applying the standards set forth in subsection (a). When any activity authorized by a permit issued pursuant to this article is conditioned upon compensatory mitigation for adverse impacts to wetlands, the applicant may be permitted to satisfy all or part of such mitigation requirements by the purchase of credits from any wetlands mitigation bank that has been approved and is operating in accordance with applicable federal guidance for the establishment, use and operation of mitigation banks as long as: (1) the bank is in the same U.S.G.S. cataloging unit, as defined by the Hydrologic Unit Map of the United States (U.S.G.S. 1980), or an adjacent cataloging unit within the same river watershed, as the impacted site; (2) the bank is ecologically preferable to practicable on-site and off-site individual mitigation options, as defined by federal wetlands regulations; and (3) the banking instrument, if approved after July 1, 1996, has been approved by a process that included public review and comment.
(Ord. No. 2198, 12-8-92; Ord. No. 2428, 10-29-96)
Sec. 1409. - Permits to be in writing, signed, and notarized.
Page 6 of 9Municode
11/14/2012Municode
D-6
The permit shall be in writing, signed by the chairperson of the Board or an authorized representative and notarized. The Board shall transmit a copy of the permit to the commissioner.
(Ord. No. 1804, 8-22-88; Ord. No. 2198, 12-8-92; Ord. No. 2305, 12-13-94)
Sec. 1409.1. - Private rights, zoning and land use ordinances not affected.
No permit granted by the Board shall in any way affect the applicable zoning and land use ordinances of the City of Virginia Beach or the right of any person to seek compensation for any injury in fact incurred by him or her because of the proposed activity.
(Ord. No. 2198, 12-8-92)
Sec. 1410. - Expiration date and extensions of permit.
No permit shall be granted without an expiration date established by the Board; provided, however, that the Board may, upon proper application, extend the permit expiration date.
(Ord. No. 1804, 8-22-88; Ord. No. 2198, 12-8-92)
Sec. 1411. - Emergency sand grading activities on nonvegetated wetlands located on the Atlantic shoreline of Virginia Beach.
Notwithstanding the provisions of sections 1401 through 1410, sand grading activities are permitted on nonvegetated wetlands located on the Atlantic shoreline of the City of Virginia Beach if otherwise permitted by law, and if the city manager has declared an emergency and has issued a permit for this purpose. Such activities may be conducted without advance notice and hearing; however, the city manager, upon request and after reasonable notice as to time and place, shall hold a hearing to affirm, modify, amend, or cancel such emergency permit.
"Emergency," as used in this section, means a sudden and unforeseeable occurrence or condition, either as to its onset or as to its extent, of such disastrous severity or magnitude that governmental action beyond that authorized or contemplated by existing law is required because governmental inaction for the period required to amend the law to meet the exigency would work immediate and irrevocable harm upon the citizens of the commonwealth or some clearly defined portion or portions thereof.
(Ord. No. 2198, 12-8-92)
Sec. 1412. - Conducting activity without permit.
It shall be unlawful for any person to conduct any activity requiring a permit under this article without first having obtained a permit authorizing such activity.
(Ord. No. 2198, 12-8-92)
Sec. 1413. - Investigations and prosecutions.
The Board shall have the authority to investigate all projects, whether proposed or ongoing, which alter wetlands within the City of Virginia Beach. The Board shall have the authority to prosecute violations of its orders, or any violation of any of the provisions of this article.
(Ord. No. 1804, 8-22-88; Ord. No. 2198, 12-8-92)
Page 7 of 9Municode
11/14/2012Municode
D-7
(a)
(b)
(c)
(d)
(e)
Sec. 1414. - Reporting, monitoring, site inspections and notice to comply; stop-work orders.
The Board chairperson may require a permittee to implement monitoring and reporting procedures the chairperson believes are reasonably necessary to ensure compliance with the provisions of the permit and this article. The chairperson may require such on-site inspections as he or she believes are reasonably necessary to determine whether the measures required by the permit are being properly performed, or whether the provisions of this article are being violated. Prior to conducting any such inspections, notice shall be provided by the chairperson to the resident owner, occupier or operator, who shall be given an opportunity to accompany the site inspector. If it is determined that there is a failure to comply with the permit, the chairperson shall serve notice upon the permittee at the address specified in his or her application or by delivery at the site of the permitted activities to the person supervising such activities and designated in the permit to receive the notice. Such notice shall describe the measures needed for compliance and the time within which such measures shall be completed. Failure of such person to comply within the specified period, shall constitute a violation of this section. Upon receipt of a sworn complaint of a substantial violation of this article from the designated enforcement officer of the Board, the Board chairperson may, in conjunction with or subsequent to a notice to comply as specified in subsection (b) of this section, issue an order requiring all or part of the activities on the site to be stopped until the specified corrective measures have been taken. In the case of an activity not authorized by this article, or where the alleged permit noncompliance is causing, or is in imminent danger of causing, significant harm to the wetlands protected by this article, such an order may be issued without regard to whether the person has been issued a notice to comply as specified in subsection (b) of this section. Otherwise, such an order may be issued only after the permittee has failed to comply with a notice to comply. The order shall be served in the same manner as a notice to comply, and shall remain in effect for a period of seven (7) days from the date of service pending application by the enforcing authority, permittee, resident owner, occupier or operator for appropriate relief to the circuit court. Upon completion of corrective action, the order shall immediately be lifted. Nothing in this section shall prevent the Board chairperson from taking any other action specified in section 1413 of this ordinance. Upon receipt of a sworn complaint of a substantial violation of this article from a designated enforcement officer, the Board may order that the affected site be restored to predevelopment conditions if the Board finds that restoration is necessary to recover lost resources or to prevent further damage to resources. The order shall specify the restoration necessary and establish a reasonable time for its completion. The order shall be issued only after a hearing with at least thirty (30) days' notice to the affected person of the hearing's time, place and purpose, and shall become effective immediately upon issuance by the Board. The Board shall require any scientific monitoring plan it believes necessary to ensure the successful reestablishment of wetlands protected by this article and may require that a prepaid contract acceptable to the Board be in effect for the purpose of carrying out the scientific monitoring plan. The Board may also require a reasonable bond or letter of credit in an amount and with surety and conditions satisfactory to it securing to the commonwealth compliance with the conditions set forth in the restoration order. The appropriate court, upon petition by the Board, may enforce such restoration order by injunction, mandamus, or other appropriate remedy. Failure to complete the required restoration is a violation of this article. The duties of the Board chairperson prescribed in this section may be delegated to his or her designees; however, such designees shall not be designated enforcement officers.
(Ord. No. 1804, 8-22-88; Ord. No. 2198, 12-8-92)
Page 8 of 9Municode
11/14/2012Municode
D-8

(a)
(b)
Sec. 1415. - Violations; penalty.
Any person who knowingly, intentionally, or negligently violates any order, rule or regulation of the commission or any provision of this article, or any provision of a permit granted pursuant to Chapter 13 of Title 28.2 of the Code of Virginia or this article shall be guilty of a Class 1 misdemeanor. Following a conviction, every day the violation continues shall constitute a separate offense.
(Ord. No. 1804, 8-22-88; Ord. No. 2198, 12-8-92)
Sec. 1416. - Injunctions.
In addition to and not in lieu of the provisions of sections 1413, 1414, and 1415 of this ordinance, upon petition of the Wetlands Board to the circuit court, the court may enjoin an act which is unlawful under the provisions of this article and may order the defendant to take such steps as are necessary to restore, protect and preserve the wetlands involved.
(Ord. No. 1804, 8-22-88; Ord. No. 2198, 12-8-92)
Sec. 1417. - Reserved.Editor's note—
Section 1417 was repealed by Ord. No. 2198, adopted Dec. 8, 1992. The section was formerly derived from Ord. No. 1804, adopted Aug. 22, 1988, and dealt with exemptions to the provisions of this article.
Sec. 1418. - Civil penalties; civil charges.
Without limiting the remedies which may be obtained under this article, any person who violates any provision of this article or who violates or fails, neglects or refuse to obey any commission or Board notice, order, rule, regulation or permit condition authorized by this article or Chapter 13 of Title 28.2 of the Code of Virginia shall, upon such finding by the circuit court, be assessed a civil penalty not to exceed twenty-five thousand dollars ($25,000.00) for each day of violation. Such civil penalties may, at the discretion of the court, be directed to be paid into the treasury of the city for the purpose of abating environmental damage to or restoring wetlands in the city, in such manner as the court may, by order, direct; except that in the event the city or its agent is the violator, the court shall direct the penalty to be paid into the state treasury. Without limiting the remedies which may be obtained under this article, and with the consent of any person who has violated any provision of this article or Chapter 13 of Title 28.2 of the Code of Virginia, or who has violated or failed, neglected or refused to obey any commission or Board order, rule, regulation or permit condition authorized by this article or Chapter 13 of Title 28.2 of the Code of Virginia, the Board may provide, in an order issued by the Board against such person, for the one-time payment of civil charges for each violation in specific sums, not to exceed ten thousand dollars ($10,000.00) for each violation. Civil charges shall be in lieu of any appropriate civil penalty which could be imposed under subsection (a) of this section. Civil charges may be in addition to the cost of any restoration ordered by the commission or Board.
(Ord. No. 2198, 12-8-92)
FOOTNOTE(S):(131) Cross reference— Southern Watersheds Management ordinance, App. G. (Back)
Page 9 of 9Municode
11/14/2012Municode
D-9
Appendix E
Meeting Notes
Meeting Notes 2012 04 26.doc Page 1 of 2 Unassigned No.
Meeting Notes
Harvested Wetlands Meeting at Norfolk District Corps of Engineers
Unassigned No.
26 April 2012 Mark Mansfield, Norfolk District COE Tom Walker, Norfolk District COE Steve McLaughlin, City of Virginia Beach Rachel Friend, City of Chesapeake John Paine, URS
Meeting to Discuss Potential Permitting for Harvested Wetlands
This meeting was held to initiate a dialog between the Cities of Virginia Beach and Chesapeake and the Corps of Engineers regarding potential future permitting issues for harvested wetlands. Floating and planted wetlands (generally referred to as ‘harvested’ wetlands) have significant potential value as a BMP to help meet Chesapeake Bay TMDL requirements. The State of Virginia and EPA have both recently agreed to accept the use of harvested wetlands as a provisional BMP to meet TMDL requirements. Studies are being contemplated to quantify the pollutant removal value of harvested wetlands and particulars regarding the appropriate species to use, degree of coverage, and limits on contributing watershed area. It is important to discuss the use of harvested wetlands with regulators to gain their input and insight with respect to permitting issues. This meeting was a first attempt in that regard. Tom Walker said that in principle, the Corps supports efforts to clean up runoff, similar to how LID is promoted. The pertinent questions would be where and how the wetlands would be placed, and how long they would be in position. Cut and fill activities in open water are regulated under the Clean Water Act, so floating wetlands may not require a permit. If navigable waters are involved, a permit will be required. There are no design standards yet for harvested wetlands, and details such as how they would be anchored and how much surface coverage would be required have yet to be worked out. Studies are focusing along the lines of five- to ten-percent coverage, but have not been addressed yet in Virginia. Nationwide permits may be useful for some wetland retrofit projects. The Corps is open to considering nationwide permits for certain types of retrofit projects.
E-1

Meeting Notes 2012 04 26.doc Page 2 of 2 Unassigned No.
If an activity, such as cutting the stalks of Phragmites plants one foot above the soil, does not involve cut or fill in the water then a permit is not required. Steve McLaughlin noted that plant stalks typically hold the nitrogen removed from the system, whereas phosphorous is held in the roots. Mark Mansfield suggested that a matrix be developed indicating which regulatory authorities have jurisdiction for these types of activities (e.g. planted wetlands, floating wetlands, pruning of Phragmites, seeding wetlands). The Corps may not take
jurisdiction over stormwater management facilities (such as wet ponds), but it depends on particulars. The matrix should indicate Section 10 of the Rivers and Harbors Act, Section 404 of the Clean Water Act, Local Wetlands Boards, DEQ, DCR, and other jurisdictional agencies and requirements. Mark offered to start the draft of the matrix and circulate it. According to Tom Walker, for planted wetlands, DEQ, Local Wetlands Boards, and the Corps will all have jurisdiction under Section 404 because digging in the water is required. “Seeding” of wetland plants will typically not require a permit.
With respect to Corps Jurisdiction Section 10 Section 404
Planted Wetlands Yes Probably Floating Wetlands Yes Probably Not (depending on
anchoring and harvesting techniques)
The two key questions are 1) Is it in a Section 10 waterway—within reach of the tide, and 2) how will the harvesting be done? Specifications for these projects should indicate that the soil will remain undisturbed. Anything that disturbs the roots would be subject to jurisdiction. We don’t want heavy equipment on the soils. Hip waders may be OK. The Corps can provide feedback on project specifications. Sinking anchors and mats that may be left behind in Section 10 waters must be avoided. Mark Mansfield offered to help facilitate additional conversations with regulators as appropriate. Steve McLaughlin indicated that a discussion with DEQ might be very helpful. “Isolated Wetlands” were discussed, but jurisdictional decisions could be made on project-by-project basis.
E-2

1
Assessment of Harvested Wetlands as a Chesapeake Bay
Total Maximum Daily Load Best Management Practice
IN-PROGRESS REVIEW (IPR #1)
Date: 22 AUGUST 2012 Project: Assessment of Harvested Wetlands as a Chesapeake Bay Total Maximum Daily Load Best Management Practice Sponsor: City of Virginia Beach, VA
Participants (Conference Call):
Steve McLaughlin, City of Virginia Beach Mark Mansfield, Corps of Engineers John Paine, URS Susan Conner, Corps of Engineers Sean Bradberry, URS Cristy Gomez, Corps of Engineers Stephanie Hood, URS
Review Items
1. Does the Contractor have all items needed from the local Sponsor? (Y/N) Yes. 2. Are we on schedule for delivery of final work product on (date)? Yes, 31 DEC 2012. 3. Project report by work task: Project summary by work task provided by John Paine.
General Notes
After a brief introduction of City of Virginia Beach, URS, and Corps of Engineers participants, Steve provided an overview of the City of Virginia Beach needs in support of the Chesapeake Bay Executive Order 13508. Mark provided a study background indicating that this effort has been authorized and funded via Section 22 of the Water Resources Development Act (WRDA) of 1974 (Public Law 93-251), and Section 2013 of WRDA 2007 (Public Law 110-114), as amended, and previously provided the fully executed copy of the cost sharing agreement and signed project management plan to Steve. Mark read excerpts from the Executive Summary of a similar TMDL initiative (nutrient and sediment reduction efforts via oyster sanctuary reef restoration) completed in DEC 2011 for the Lynnhaven River.
E-3
2
The following items were indicated as being important to consider as part of the study effort:
(1) Nutrient reductions (nitrogen and phosphorus) will be considered in this effort.
(2) Total suspended solids will not be considered in this effort.
(3) The growing season and first frost are key determinants in this effort as is the scheduling of laboratory time to perform the spectral analytic evaluations.
(4) John introduced Sean Bradberry who is responsible for the technical part of the report and Stephanie Hood who is responsible for the GIS data. John mentioned that regulatory requirements are being drafted and is expected to be completed in one week.
(5) To make the study recommendation more flexible, it will include not only the harvesting of phragmites but also of cattails. John described the time of harvest in the study to be within two weeks of the first frost or around 2 NOV. Sampling or cutting will start on 18 OCT and lab results will be back by 6 NOV.
Meeting Due-outs (Next Steps/Actionable Outcomes):
(1) The Corps will host a meeting of regulatory agencies (City of Virginia Beach to
provide) on/about 18 SEP 2012 (see item (2) below).
(2) IPR #2 recommended for SEP 2012 and IPR #3 recommended for OCT 2012.
(3) Steve will brief Sam Sawan periodically on the progress of the efforts.
(4) John will determine what work task production will be completed by the end of SEP and provide to Mark (note: this item has been completed)
E-4

3
(Attachment) Assessment of Harvested Wetlands as a Chesapeake Bay
Total Maximum Daily Load Best Management Practice IPR #1
Meeting Agenda 22 August 2012
1. Welcome & Introductions -- Mark Mansfield
2. Study Background – Steve McLaughlin/Mark Mansfield
3. Study Status -- ALL
4. Identification of Issues -- ALL
5. Summary and Next Steps/Actionable Outcomes -- ALL
E-5

1
Assessment of Harvested Wetlands as a Chesapeake Bay
Total Maximum Daily Load Best Management Practice
IN-PROGRESS REVIEW (IPR #2)
Date: 18 SEPTEMBER 2012 Project: Assessment of Harvested Wetlands as a Chesapeake Bay Total Maximum Daily Load Best Management Practice Sponsor: City of Virginia Beach, VA
Participants (See attached):
Review Items
1. Does the Contractor have all items needed from the local Sponsor? (Y/N) Yes. 2. Are we on schedule for delivery of final work product on (date)? Yes, 31 DEC 2012. 3. Project report by work task: Project summary by work task provided by John Paine.
General Notes
A copy of the meeting agenda is attached. After a brief introduction of meeting participants, Steve provided an overview of the City of Virginia Beach needs in support of the Chesapeake Bay Executive Order 13508. Mark provided a study background indicating that this effort has been authorized and funded via Section 22 of the Water Resources Development Act (WRDA) of 1974 (Public Law 93-251), and Section 2013 of WRDA 2007 (Public Law 110-114), as amended, and previously provided the fully executed copy of the cost sharing agreement and signed project management plan to Steve. Mark read excerpts from the Executive Summary of a similar TMDL initiative (nutrient and sediment reduction efforts via oyster sanctuary reef restoration) completed in DEC 2011 for the Lynnhaven River. By way of background, the annual Chesapeake Bay TMDL requirements for the city of Virginia Beach are as follows: Nitrogen – 126,000 pounds Phosphorous – 2,200 pounds Total Suspended Solids – 5,250,000 pounds
E-6

2
The meeting served to receive agencies inputs, guidance, and concerns on the study effort. The following general areas of interest were discussed:
(1) Plant types to be considered (generally Phragmites and cattails)
(2) Definition of “harvesting”
(3) Impacts on vegetated and non-vegetated wetlands
(4) Impacts of the disposition of harvested material
(5) Access issues with private property
(6) Communication strategy. Lynnette Rhodes said there needs to be clear communication with the public—on one hand they are told not to touch wetlands, and on the other the City may be harvesting the plants. Mark Mansfield said a communication strategy should be included in this Study Report.
URS has collected GIS information from VIMS and the City pertaining to Phragmites, cattails, and other wetlands plants, particularly along the Lynnhaven shoreline. Aerial imagery (shown to the group during this meeting) indicates that the Phragmites is spread thinly along private shorelines, and that harvesting these areas will likely prove to be infeasible (too spread out, too patchy, too inaccessible). URS asked the regulators in this meeting if there would be any possibility of using the islands in the mouth of the Lynnhaven estuary for plant harvesting for Chesapeake Bay TMDL purposes. Currently these islands are considered high marsh, largely populated with cordgrass. After a lengthy discussion, the clear consensus of those present was that such harvesting of the high marsh on these islands would not be feasible from a regulatory standpoint. URS was not proposing such harvesting, but needed to ask the question for due diligence reasons. URS will look for suitable wetland plant inventory elsewhere within the Chesapeake Bay watershed in Virginia Beach. Several meeting participants suggested possible sites, including the City-owned borrow pit that receives dredge material from the Lynnhaven. Other potential sites could include areas near Princess Anne High School, Broad Bay, Linkhorn Bay, the Milldam Creek area, and Wolfsnare Creek.
Meeting Due-outs (Next Steps/Actionable Outcomes)
(1) Seek input from agencies not represented in today’s meeting (Virginia Beach
Wetlands Board, VIMS (CCRM), Environmental Protection Agency, Fish & Wildlife Service, National Oceanic and Atmospheric Administration) (Steve McLaughlin/Susan Conner).
(2) Definition of the term “harvesting” (John Paine/URS).
E-7

3
(3) IPR #3 recommended for OCT 2012 (Susan Conner).
(4) Steve McLaughlin will continue to brief Sam Sawan periodically on the progress of the efforts.
(5) The project is on schedule as follows:
a. 2012 10 16 – Begin Sample Collection b. 2012 11 15 – Progress Meeting to Review Initial Results (IPR #3 unless
there is another IPR in October per Item 3 above) c. 2012 12 20 – Progress Meeting (IP #4) to Review Final Delivery d. 2012 12 31 – Project Completion
E-8
4
(Attachment)
Assessment of Harvested Wetlands as a Chesapeake Bay Total Maximum Daily Load Best Management Practice
IPR #2 Meeting Agenda
18 September 2012
1. Welcome & Introductions -- Mark Mansfield
2. Study Status -- Steve McLaughlin/John Paine
3. Identification of Issues – ALL
4. Summary and Next Steps/Actionable Outcomes -- ALL
E-9

Meeting Notes 2012 10 22.doc Page 1 of 2 11658362
Meeting Notes
Harvested Wetlands Meeting at Virginia Institute of Marine Science
11658362
22 October 2012 Emily Egginton, VIMS Carl Hershner, VIMS Kirk Havens, VIMS Mac Sisson, VIMS Justin Worrell, VMRC Dave Schulte, Norfolk District COE Steve McLaughlin, City of Virginia Beach Charles McKennah, City of Virginia Beach Sean Bradberry, URS John Paine, URS
Meeting to Discuss the Potential for Harvested Wetlands
This meeting was held to discuss the potential for harvested wetlands (particularly the harvesting of Phragmites and Cattails) as a BMP to meet Chesapeake Bay TMDL pollutant reduction targets. John Paine gave a PowerPoint presentation on the status of a project being completed for the City of Virginia Beach and the Corps of Engineers (attached). The presentation reviewed the requirements of Executive Order 13508, and the Watershed Implementation Plans (WIPs) that Virginia localities had to submit by 1 February 2012. The TMDL compliance costs are a substantial, and localities are looking for cost-effective BMPs to meet their pollution reduction targets. Steve McLaughlin conceived the possibility of harvesting Phragmites and Cattails, and commissioned the current study through the Corps of Engineers Section 22 program. The study will be completed by 31 December 2012. After this brief presentation on the project status, those present asked questions of the project delivery team, and provided feedback that will be useful in developing harvesting protocols if such harvesting indeed proves to be feasible. These notes summarize what was said during this discussion. Kirk Havens (VIMS)
1. Stay above the Mean High Water line with harvesting operations. 2. Timing is important. Phragmites (Phrag) transfers TN back into the rhizomes on a
seasonal basis. 3. The Virginia Intertidal Wetlands Act allows intertidal harvesting. 4. Cutting Phrag too low will kill the plant. Leaving one foot of plant above the ground
should be OK, but should be monitored carefully. 5. Habitat is an issue (minimize the disruption). 6. Phrag spreads “many, many feet per year” and is very hearty. 7. One way to control Phrag is to dig perimeter ditches deep enough to prevent Phrag
growth.
E-10

Meeting Notes 2012 10 22.doc Page 2 of 2 11658362
8. VIMS is interested in the plant tissue sampling results. 9. 4-6 tons per acre of dry weight is a typical Phrag yield.
Carl Hershner
10. 30% of wetlands in the Lynnhaven River estuary are estimated to be Phrag. 11. There are approximately 170 acres of Phrag in the Lynnhaven. 12. Disturbance of the marsh surface soils will be a key regulatory issue. 13. Watch out for Marsh Wren nesting sites. 14. Look at oil spill recovery operations for ideas on working in marsh conditions. 15. Phrag is currently imported into Virginia (Jamestown Park for thatched roofs). 16. Virginia Natural Heritage (http://www.naturalarea.org/12conference/) just completed a
Phrag symposium. 17. VIMS is interested in the project data to see what the plant sampling results show for
variation between locations (e.g. next to golf courses). 18. Harvesting may be a good solution—after years of failing to eradicate the plant as a
nuisance, maybe harvesting can offer some benefits. Steve McLaughlin (City of Virginia Beach)
19. The City may contemplate jail labor for this type of project. Justin Worrell (VMRC)
20. It is important to stay consistent between public and private property use. If the residents are told to stay away from the Phrag and wetlands, but see the City harvesting in these areas, there will be communications and education issues.
E-11

10/2н/2012
1
HARVESTED WETLANDS
PROJECTSNAPSHOT
22 OCTOBER 2012
JOHN PAINE,SEAN BRADBERRY
URS CORPORATION
Ulcerative Dermatitis Syndrome (UDS)
Credit: MD Department of Natural Resources, Fisheries Service, and University of Maryland, Center for Environmental Science, Horn Point Laboratory
Harmful Algal Blooms (HABs)
Credit: Sarah Dinh, Ph.D.
Chesapeake Bay TMDL
Phase 5.3 Watershed Model (Running)
These pollutants contribute to water quality problems (like algal blooms, dissolved oxygen depletion, fish lesions and mahogany tides) in the Bay.
Putting a WIP Together
Under the Chesapeake Bay TMDL…
localities develop and implement Watershed Implementation Plans (WIPs)
…to reduce their annual discharges of Total Nitrogen (TN), Total Phosphorus (TP), and Total Suspended Solids (TSS or ‘sediment’)to prescribed limits.
Putting a WIP Together
The WIP identifiesBest Management Practices (BMPs) that will be used to reach the goals.
Typical BMPs include:• Erosion & Sediment Control Practices • Street Sweeping• Detention (‘Dry) Ponds• Retention (‘Wet’) Ponds• Nutrient Management Plans• Restrictions on the Use of Fertilizer• Creation of Wetlands• Bioretention• Infiltration Practices• Urban Filtering Practices
Putting a WIP Together
The challenge is to select BMPs that can meet the regulated pollutant reduction levels set by the Chesapeake Bay TMDL at a reasonable cost.
So…How can that be done?
E-12
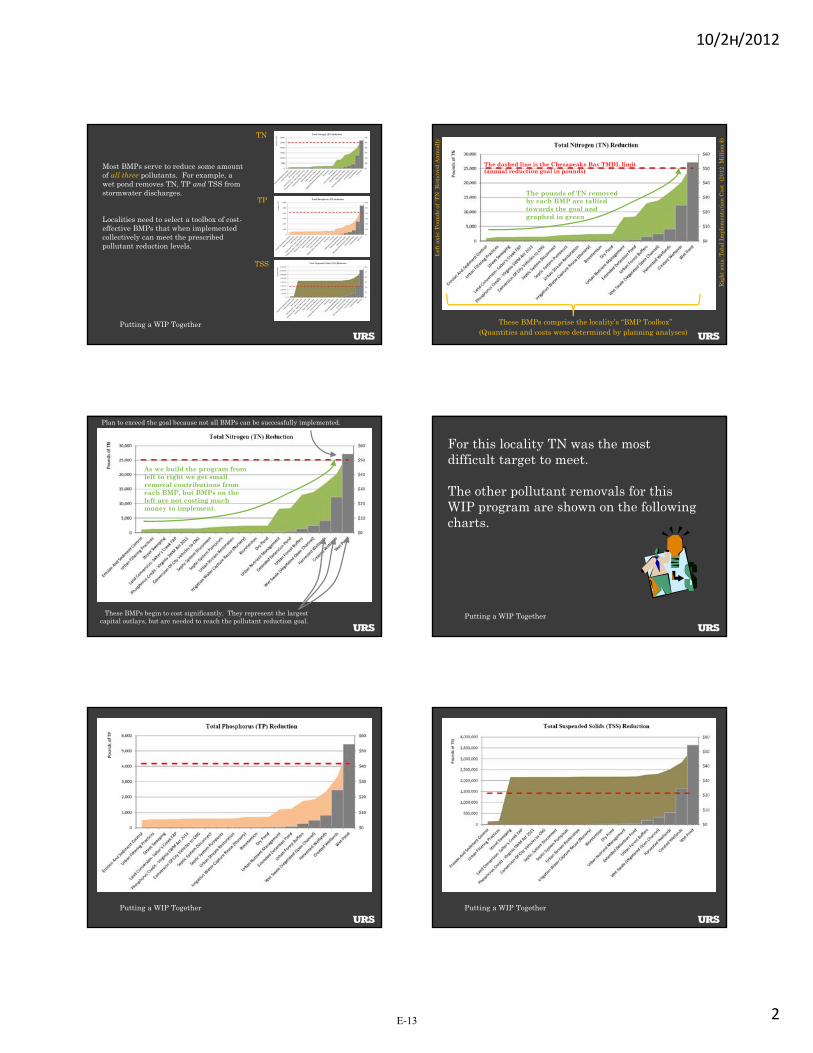
10/2н/2012
2
Most BMPs serve to reduce some amount of all three pollutants. For example, a wet pond removes TN, TP and TSS from stormwater discharges.
Localities need to select a toolbox of cost-effective BMPs that when implemented collectively can meet the prescribed pollutant reduction levels.
Putting a WIP Together
TN
TP
TSS
These BMPs comprise the locality’s “BMP Toolbox”
Lef
t ax
is: P
oun
ds o
f T
N R
emov
ed A
nn
ual
ly
Rig
ht
axis
: Tot
al I
mpl
emen
tati
on C
ost
(20
12 M
illi
on $
)
The dashed line is the Chesapeake Bay TMDL limit (annual reduction goal in pounds)
The pounds of TN removed by each BMP are tallied towards the goal and graphed in green
(Quantities and costs were determined by planning analyses)
As we build the program from left to right we get small removal contributions from each BMP, but BMPs on the left are not costing much money to implement.
These BMPs begin to cost significantly. They represent the largest capital outlays, but are needed to reach the pollutant reduction goal.
Plan to exceed the goal because not all BMPs can be successfully implemented.
For this locality TN was the most difficult target to meet.
The other pollutant removals for this WIP program are shown on the following charts.
Putting a WIP Together
Putting a WIP Together Putting a WIP Together
E-13

10/2н/2012
3
Why Do We Need Harvested Wetlands?
• Need Efficient BMP Retrofits in the toolbox– High Pollutant Removal Efficiencies
• Real Estate and Easement Acquisition takes YEARS– Already have Right-of-Way – Little/no construction required for footprints
• Can be implemented quickly• They Work (why else are we protecting wetlands?)
– Cannot say that for many Chesbay BMPs
Examples of “Harvested Wetlands”
Source: Beemats.com Source: EPA
“Harvested Wetlands” includes Floating Wetlands and Free Water Surface (FWS) Wetlands
Not just floating wetlands!
TN Reduction = 30% TP Reduction = 41%
TSS Reduction = 68%
Drawbacks?
• Provisionally on approved list of BMPs for Chesbay TMDL– BMP Clearinghouse approval process takes years
• Not tested on large-scale implementation in Virginia• Annual maintenance cost could be high to very high• Floating wetlands could have seed stock shortages• Harvest should occur in short time frame• Invasive Species potential• Leaching of nutrients from bed material (floating
wetlands)
E-14
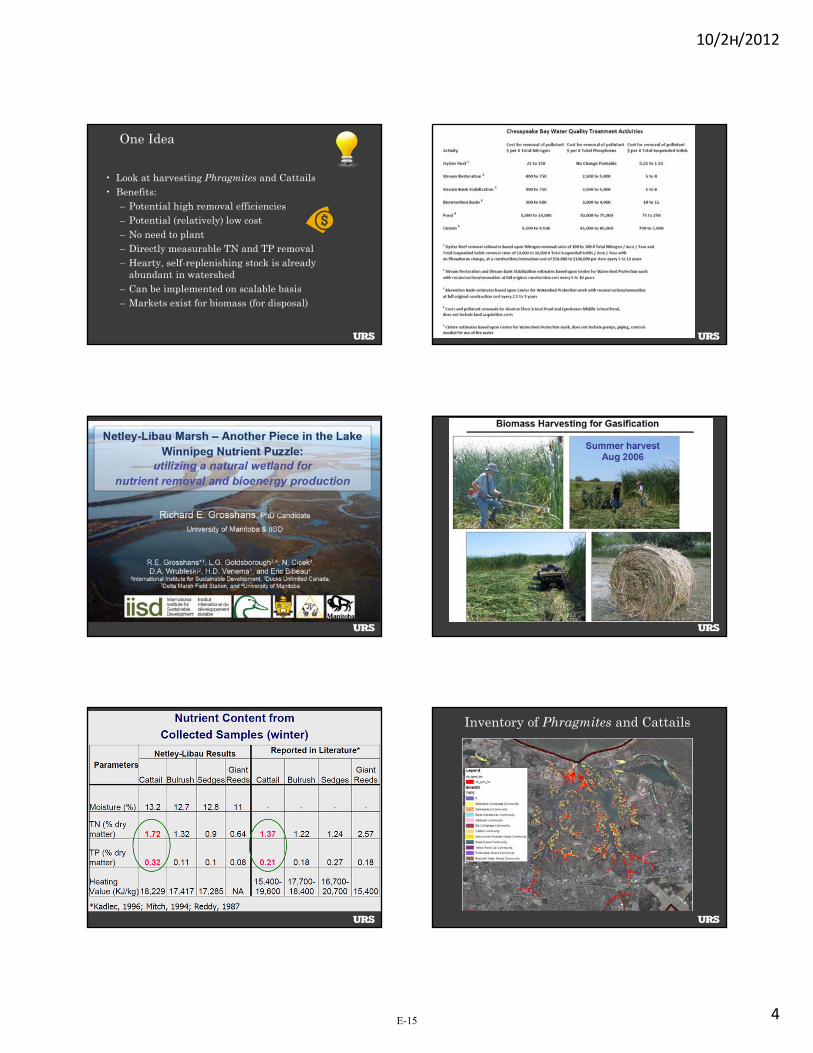
10/2н/2012
4
One Idea
• Look at harvesting Phragmites and Cattails• Benefits:
– Potential high removal efficiencies– Potential (relatively) low cost– No need to plant– Directly measurable TN and TP removal– Hearty, self-replenishing stock is already
abundant in watershed– Can be implemented on scalable basis– Markets exist for biomass (for disposal)
Inventory of Phragmites and Cattails
E-15

10/2н/2012
5
MAPLE STREET BORROW PIT
E-16

10/2н/2012
6E-17

Appendix F
Yield Calculations

Table F-1. Yield Calculations
Sample # Site Loc. #
Plant Species
Density (plants/sf)
Dry Wt. (g) N (lbs) P (lbs) Fraction of
Viable Stalks Dry Wt. (lbs/sf) N (lbs/ac) P (lbs/ac)
001 01 P 22 20.39 0.00077 0.00005002 01 P 22 16.73 0.00045 0.00003003 01 P 22 8.20 0.00031 0.00003004 01 P 22 11.32 0.00035 0.00004005 01 P 22 14.66 0.00057 0.00004006 01 P 22 11.34 0.00034 0.00003
01 82.64 0.00278 0.0002201 13.77 0.00046 0.00004 0.40 0.27 178 14
007 02 P 19 22.86 0.00047 0.00005008 02 P 19 16.24 0.00023 0.00003009 02 P 19 17.11 0.00035 0.00003010 02 P 19 24.30 0.00045 0.00005011 02 P 19 22.64 0.00049 0.00003012 02 P 19 12.25 0.00023 0.00002
02 115.40 0.00222 0.0002202 19.23 0.00037 0.00004 0.45 0.36 138 14
013 03 P 7 20.17 0.00038 0.00004014 03 P 7 17.70 0.00044 0.00005015 03 P 7 26.97 0.00070 0.00005016 03 P 7 14.23 0.00031 0.00003017 03 P 7 12.75 0.00030 0.00003018 03 P 7 23.17 0.00045 0.00003
03 114.99 0.00258 0.0002203 19.17 0.00043 0.00004 0.65 0.19 85 7
019 04 P 28 39.93 0.00080 0.00007020 04 P 28 40.33 0.00077 0.00012021 04 P 28 46.24 0.00153 0.00013022 04 P 28 53.60 0.00147 0.00020023 04 P 28 47.80 0.00081 0.00013024 04 P 28 50.78 0.00100 0.00011
04 278.68 0.00638 0.0007604 46.45 0.00106 0.00013 0.40 1.15 519 62
025 07 P 14 56.64 0.00129 0.00009026 07 P 14 42.46 0.00124 0.00008027 07 P 14 51.85 0.00120 0.00009028 07 P 14 70.32 0.00174 0.00016029 07 P 14 44.58 0.00077 0.00004030 07 P 14 44.69 0.00101 0.00005
07 310.54 0.00725 0.0005107 51.76 0.00121 0.00008 0.60 0.96 442 31
031 06 P 12 35.31 0.00097 0.00009032 06 P 12 29.04 0.00075 0.00005033 06 P 12 42.05 0.00149 0.00010034 06 P 12 35.89 0.00113 0.00007035 06 P 12 30.85 0.00103 0.00008036 06 P 12 23.21 0.00059 0.00006
06 196.35 0.00595 0.0004506 32.73 0.00099 0.00008 0.65 0.56 337 26
037 05 P 11 47.80 0.00120 0.00011038 05 P 11 55.16 0.00122 0.00009039 05 P 11 61.39 0.00267 0.00023040 05 P 11 53.89 0.00122 0.00011041 05 P 11 39.11 0.00099 0.00009042 05 P 11 55.76 0.00138 0.00010
05 313.11 0.00868 0.0007105 52.19 0.00145 0.00012 0.60 0.76 416 34
Laboratory Results
Analysis of Harvested Wetlands Potential in Virginia Beach
F-1 URS No. 11658362 December 2012
Table F-1. Yield Calculations
Sample # Site Loc. #
Plant Species
Density (plants/sf)
Dry Wt. (g) N (lbs) P (lbs) Fraction of
Viable Stalks Dry Wt. (lbs/sf) N (lbs/ac) P (lbs/ac)
Laboratory Results
043 47 P 14 40.34 0.00201 0.00016044 47 P 14 25.33 0.00145 0.00014045 47 P 14 41.55 0.00175 0.00017046 47 P 14 39.49 0.00199 0.00018047 47 P 14 28.31 0.00150 0.00018048 47 P 14 45.34 0.00229 0.00021
47 220.36 0.01099 0.0010547 36.73 0.00183 0.00017 0.60 0.68 670 64
049 46 P 22 26.40 0.00085 0.00007050 46 P 22 19.85 0.00084 0.00004051 46 P 22 21.72 0.00093 0.00006052 46 P 22 27.74 0.00114 0.00007053 46 P 22 40.29 0.00169 0.00011054 46 P 22 30.87 0.00142 0.00010
46 166.87 0.00686 0.0004446 27.81 0.00114 0.00007 0.45 0.61 493 32
055 48 P 17 56.48 0.00143 0.00014056 48 P 17 51.02 0.00168 0.00013057 48 P 17 63.86 0.00142 0.00013058 48 P 17 57.00 0.00205 0.00014059 48 P 17 55.01 0.00082 0.00006060 48 P 17 53.46 0.00171 0.00012
48 336.83 0.00911 0.0007248 56.14 0.00152 0.00012 0.50 1.05 562 44
061 49 P 16 33.65 0.00131 0.00008062 49 P 16 55.38 0.00168 0.00013063 49 P 16 45.90 0.00094 0.00005064 49 P 16 43.22 0.00150 0.00010065 49 P 16 51.09 0.00089 0.00007066 49 P 16 57.41 0.00181 0.00013
49 286.65 0.00813 0.0005649 47.78 0.00135 0.00009 0.50 0.84 472 32
067 68 P 12 38.41 0.00121 0.00008068 68 P 12 25.30 0.00057 0.00005069 68 P 12 44.16 0.00111 0.00006070 68 P 12 23.40 0.00046 0.00004071 68 P 12 43.60 0.00135 0.00008072 68 P 12 45.26 0.00163 0.00010
68 220.13 0.00632 0.0004168 36.69 0.00105 0.00007 0.60 0.58 330 21
073 70 P 12 51.54 0.00149 0.00010074 70 P 12 40.59 0.00144 0.00013075 70 P 12 40.01 0.00078 0.00005076 70 P 12 45.20 0.00097 0.00006077 70 P 12 45.94 0.00097 0.00009078 70 P 12 43.62 0.00120 0.00017
70 266.90 0.00685 0.0006070 44.48 0.00114 0.00010 0.60 0.71 358 32
079 73 P 16 35.54 0.00122 0.00009080 73 P 16 43.54 0.00128 0.00012081 73 P 16 38.45 0.00091 0.00008082 73 P 16 23.86 0.00103 0.00008083 73 P 16 33.49 0.00110 0.00009084 73 P 16 39.40 0.00096 0.00009
73 214.28 0.00650 0.0005573 35.71 0.00108 0.00009 0.50 0.63 377 32
Analysis of Harvested Wetlands Potential in Virginia Beach
F-2 URS No. 11658362 December 2012

Table F-1. Yield Calculations
Sample # Site Loc. #
Plant Species
Density (plants/sf)
Dry Wt. (g) N (lbs) P (lbs) Fraction of
Viable Stalks Dry Wt. (lbs/sf) N (lbs/ac) P (lbs/ac)
Laboratory Results
085 72 P 17 24.19 0.00085 0.00012086 72 P 17 31.57 0.00146 0.00015087 72 P 17 41.01 0.00143 0.00013088 72 P 17 34.72 0.00152 0.00013089 72 P 17 38.60 0.00162 0.00015090 72 P 17 27.57 0.00157 0.00016
72 197.66 0.00844 0.0008472 32.94 0.00141 0.00014 0.50 0.62 521 52
091 69 P 19 18.42 0.00100 0.00011092 69 P 19 19.51 0.00078 0.00008093 69 P 19 35.33 0.00122 0.00009094 69 P 19 53.41 0.00121 0.00009095 69 P 19 26.97 0.00119 0.00008096 69 P 19 35.72 0.00138 0.00010
69 189.36 0.00678 0.0005669 31.56 0.00113 0.00009 0.50 0.66 468 39
097 71 P 7 43.44 0.00211 0.00022098 71 P 7 41.77 0.00189 0.00017099 71 P 7 45.89 0.00254 0.00025100 71 P 7 31.47 0.00106 0.00010101 71 P 7 23.83 0.00088 0.00007102 71 P 7 35.06 0.00108 0.00009
71 221.46 0.00956 0.0009271 36.91 0.00159 0.00015 0.75 0.43 364 35
103 58 P 17 42.68 0.00112 0.00011104 58 P 17 26.54 0.00086 0.00007105 58 P 17 30.08 0.00117 0.00008106 58 P 17 42.13 0.00117 0.00010107 58 P 17 36.10 0.00110 0.00009108 58 P 17 41.19 0.00116 0.00010
58 218.72 0.00658 0.0005558 36.45 0.00110 0.00009 0.50 0.68 406 34
109 57 P 28 41.49 0.00171 0.00015110 57 P 28 35.44 0.00073 0.00007111 57 P 28 40.27 0.00114 0.00011112 57 P 28 30.04 0.00075 0.00005113 57 P 28 32.10 0.00084 0.00006114 57 P 28 30.05 0.00091 0.00006
57 209.39 0.00608 0.0005057 34.90 0.00101 0.00008 0.40 0.86 495 41
115 56 P 7 40.44 0.00188 0.00021116 56 P 7 36.66 0.00091 0.00012117 56 P 7 33.32 0.00099 0.00012118 56 P 7 35.96 0.00086 0.00011119 56 P 7 25.30 0.00077 0.00011120 56 P 7 43.96 0.00149 0.00018
56 215.64 0.00690 0.0008756 35.94 0.00115 0.00014 0.70 0.39 246 31
121 55 P 19 20.12 0.00050 0.00003122 55 P 19 23.36 0.00055 0.00004123 55 P 19 17.38 0.00042 0.00003124 55 P 19 15.18 0.00031 0.00002125 55 P 19 31.09 0.00066 0.00004126 55 P 19 16.97 0.00052 0.00004
55 124.10 0.00295 0.0001955 20.68 0.00049 0.00003 0.60 0.52 244 16
Analysis of Harvested Wetlands Potential in Virginia Beach
F-3 URS No. 11658362 December 2012
Table F-1. Yield Calculations
Sample # Site Loc. #
Plant Species
Density (plants/sf)
Dry Wt. (g) N (lbs) P (lbs) Fraction of
Viable Stalks Dry Wt. (lbs/sf) N (lbs/ac) P (lbs/ac)
Laboratory Results
127 08 P 13 34.52 0.00092 0.00009128 08 P 13 56.97 0.00224 0.00024129 08 P 13 16.95 0.00060 0.00003130 08 P 13 24.86 0.00101 0.00010131 08 P 13 52.07 0.00185 0.00013132 08 P 13 20.66 0.00072 0.00006
08 206.03 0.00733 0.0006508 34.34 0.00122 0.00011 0.50 0.49 346 31
133 12 P 20 20.71 0.00056 0.00005134 12 P 20 27.14 0.00088 0.00005135 12 P 20 20.07 0.00050 0.00004136 12 P 20 16.31 0.00065 0.00006137 12 P 20 10.43 0.00048 0.00005138 12 P 20 11.08 0.00045 0.00006
12 105.74 0.00353 0.0002912 17.62 0.00059 0.00005 0.40 0.31 205 17
139 11 P 7 14.02 0.00050 0.00006140 11 P 7 10.70 0.00041 0.00004141 11 P 7 14.18 0.00078 0.00007142 11 P 7 19.30 0.00077 0.00007143 11 P 7 15.57 0.00067 0.00008144 11 P 7 19.63 0.00080 0.00008
11 93.40 0.00393 0.0003911 15.57 0.00065 0.00007 0.70 0.17 140 14
145 16 P 18 33.84 0.00098 0.00011146 16 P 18 23.35 0.00061 0.00008147 16 P 18 23.42 0.00030 0.00001148 16 P 18 15.82 0.00089 0.00010149 16 P 18 12.38 0.00082 0.00009150 16 P 18 40.46 0.00140 0.00013
16 149.27 0.00502 0.0005216 24.88 0.00084 0.00009 0.50 0.49 328 34
151 15 P 17 20.66 0.00071 0.00005152 15 P 17 36.86 0.00106 0.00008153 15 P 17 33.67 0.00112 0.00010154 15 P 17 24.92 0.00080 0.00008155 15 P 17 14.60 0.00050 0.00007156 15 P 17 9.39 0.00026 0.00001
15 140.10 0.00444 0.0004015 23.35 0.00074 0.00007 0.55 0.48 302 27
157 24 P 19 61.05 0.00172 0.00012158 24 P 19 16.33 0.00048 0.00004159 24 P 19 10.91 0.00021 0.00001160 24 P 19 41.84 0.00090 0.00007161 24 P 19 14.59 0.00041 0.00006162 24 P 19 40.94 0.00107 0.00007
24 185.66 0.00479 0.0003824 30.94 0.00080 0.00006 0.45 0.58 297 24
163 26 P 18 9.26 0.00029 0.00004164 26 P 18 24.24 0.00072 0.00006165 26 P 18 15.54 0.00068 0.00004166 26 P 18 13.25 0.00050 0.00004167 26 P 18 21.22 0.00080 0.00006168 26 P 18 18.50 0.00062 0.00005
26 102.01 0.00361 0.0003126 17.00 0.00060 0.00005 0.50 0.34 236 20
Analysis of Harvested Wetlands Potential in Virginia Beach
F-4 URS No. 11658362 December 2012
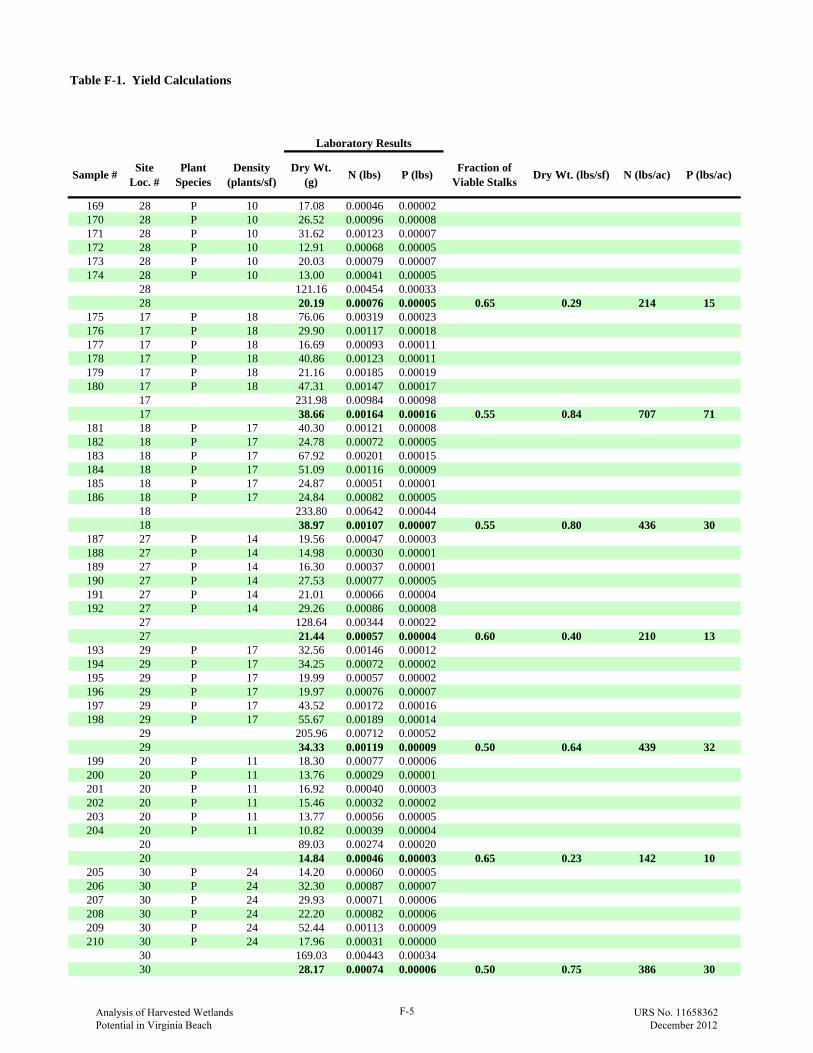
Table F-1. Yield Calculations
Sample # Site Loc. #
Plant Species
Density (plants/sf)
Dry Wt. (g) N (lbs) P (lbs) Fraction of
Viable Stalks Dry Wt. (lbs/sf) N (lbs/ac) P (lbs/ac)
Laboratory Results
169 28 P 10 17.08 0.00046 0.00002170 28 P 10 26.52 0.00096 0.00008171 28 P 10 31.62 0.00123 0.00007172 28 P 10 12.91 0.00068 0.00005173 28 P 10 20.03 0.00079 0.00007174 28 P 10 13.00 0.00041 0.00005
28 121.16 0.00454 0.0003328 20.19 0.00076 0.00005 0.65 0.29 214 15
175 17 P 18 76.06 0.00319 0.00023176 17 P 18 29.90 0.00117 0.00018177 17 P 18 16.69 0.00093 0.00011178 17 P 18 40.86 0.00123 0.00011179 17 P 18 21.16 0.00185 0.00019180 17 P 18 47.31 0.00147 0.00017
17 231.98 0.00984 0.0009817 38.66 0.00164 0.00016 0.55 0.84 707 71
181 18 P 17 40.30 0.00121 0.00008182 18 P 17 24.78 0.00072 0.00005183 18 P 17 67.92 0.00201 0.00015184 18 P 17 51.09 0.00116 0.00009185 18 P 17 24.87 0.00051 0.00001186 18 P 17 24.84 0.00082 0.00005
18 233.80 0.00642 0.0004418 38.97 0.00107 0.00007 0.55 0.80 436 30
187 27 P 14 19.56 0.00047 0.00003188 27 P 14 14.98 0.00030 0.00001189 27 P 14 16.30 0.00037 0.00001190 27 P 14 27.53 0.00077 0.00005191 27 P 14 21.01 0.00066 0.00004192 27 P 14 29.26 0.00086 0.00008
27 128.64 0.00344 0.0002227 21.44 0.00057 0.00004 0.60 0.40 210 13
193 29 P 17 32.56 0.00146 0.00012194 29 P 17 34.25 0.00072 0.00002195 29 P 17 19.99 0.00057 0.00002196 29 P 17 19.97 0.00076 0.00007197 29 P 17 43.52 0.00172 0.00016198 29 P 17 55.67 0.00189 0.00014
29 205.96 0.00712 0.0005229 34.33 0.00119 0.00009 0.50 0.64 439 32
199 20 P 11 18.30 0.00077 0.00006200 20 P 11 13.76 0.00029 0.00001201 20 P 11 16.92 0.00040 0.00003202 20 P 11 15.46 0.00032 0.00002203 20 P 11 13.77 0.00056 0.00005204 20 P 11 10.82 0.00039 0.00004
20 89.03 0.00274 0.0002020 14.84 0.00046 0.00003 0.65 0.23 142 10
205 30 P 24 14.20 0.00060 0.00005206 30 P 24 32.30 0.00087 0.00007207 30 P 24 29.93 0.00071 0.00006208 30 P 24 22.20 0.00082 0.00006209 30 P 24 52.44 0.00113 0.00009210 30 P 24 17.96 0.00031 0.00000
30 169.03 0.00443 0.0003430 28.17 0.00074 0.00006 0.50 0.75 386 30
Analysis of Harvested Wetlands Potential in Virginia Beach
F-5 URS No. 11658362 December 2012
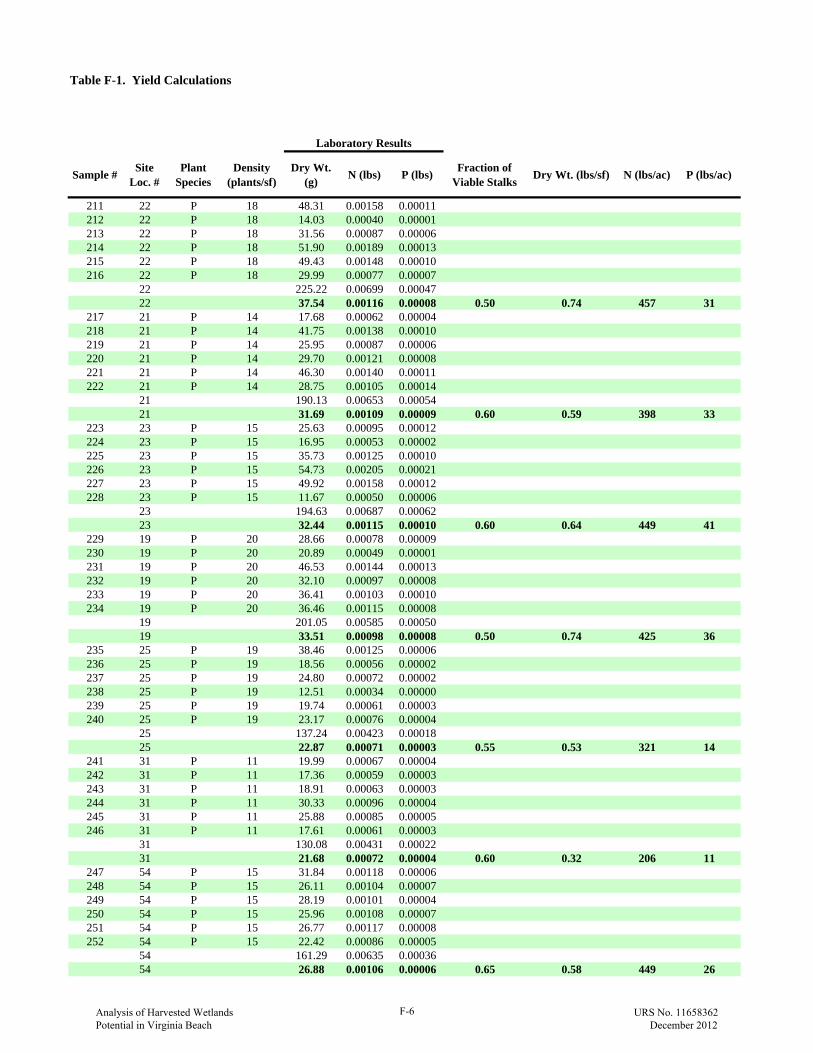
Table F-1. Yield Calculations
Sample # Site Loc. #
Plant Species
Density (plants/sf)
Dry Wt. (g) N (lbs) P (lbs) Fraction of
Viable Stalks Dry Wt. (lbs/sf) N (lbs/ac) P (lbs/ac)
Laboratory Results
211 22 P 18 48.31 0.00158 0.00011212 22 P 18 14.03 0.00040 0.00001213 22 P 18 31.56 0.00087 0.00006214 22 P 18 51.90 0.00189 0.00013215 22 P 18 49.43 0.00148 0.00010216 22 P 18 29.99 0.00077 0.00007
22 225.22 0.00699 0.0004722 37.54 0.00116 0.00008 0.50 0.74 457 31
217 21 P 14 17.68 0.00062 0.00004218 21 P 14 41.75 0.00138 0.00010219 21 P 14 25.95 0.00087 0.00006220 21 P 14 29.70 0.00121 0.00008221 21 P 14 46.30 0.00140 0.00011222 21 P 14 28.75 0.00105 0.00014
21 190.13 0.00653 0.0005421 31.69 0.00109 0.00009 0.60 0.59 398 33
223 23 P 15 25.63 0.00095 0.00012224 23 P 15 16.95 0.00053 0.00002225 23 P 15 35.73 0.00125 0.00010226 23 P 15 54.73 0.00205 0.00021227 23 P 15 49.92 0.00158 0.00012228 23 P 15 11.67 0.00050 0.00006
23 194.63 0.00687 0.0006223 32.44 0.00115 0.00010 0.60 0.64 449 41
229 19 P 20 28.66 0.00078 0.00009230 19 P 20 20.89 0.00049 0.00001231 19 P 20 46.53 0.00144 0.00013232 19 P 20 32.10 0.00097 0.00008233 19 P 20 36.41 0.00103 0.00010234 19 P 20 36.46 0.00115 0.00008
19 201.05 0.00585 0.0005019 33.51 0.00098 0.00008 0.50 0.74 425 36
235 25 P 19 38.46 0.00125 0.00006236 25 P 19 18.56 0.00056 0.00002237 25 P 19 24.80 0.00072 0.00002238 25 P 19 12.51 0.00034 0.00000239 25 P 19 19.74 0.00061 0.00003240 25 P 19 23.17 0.00076 0.00004
25 137.24 0.00423 0.0001825 22.87 0.00071 0.00003 0.55 0.53 321 14
241 31 P 11 19.99 0.00067 0.00004242 31 P 11 17.36 0.00059 0.00003243 31 P 11 18.91 0.00063 0.00003244 31 P 11 30.33 0.00096 0.00004245 31 P 11 25.88 0.00085 0.00005246 31 P 11 17.61 0.00061 0.00003
31 130.08 0.00431 0.0002231 21.68 0.00072 0.00004 0.60 0.32 206 11
247 54 P 15 31.84 0.00118 0.00006248 54 P 15 26.11 0.00104 0.00007249 54 P 15 28.19 0.00101 0.00004250 54 P 15 25.96 0.00108 0.00007251 54 P 15 26.77 0.00117 0.00008252 54 P 15 22.42 0.00086 0.00005
54 161.29 0.00635 0.0003654 26.88 0.00106 0.00006 0.65 0.58 449 26
Analysis of Harvested Wetlands Potential in Virginia Beach
F-6 URS No. 11658362 December 2012
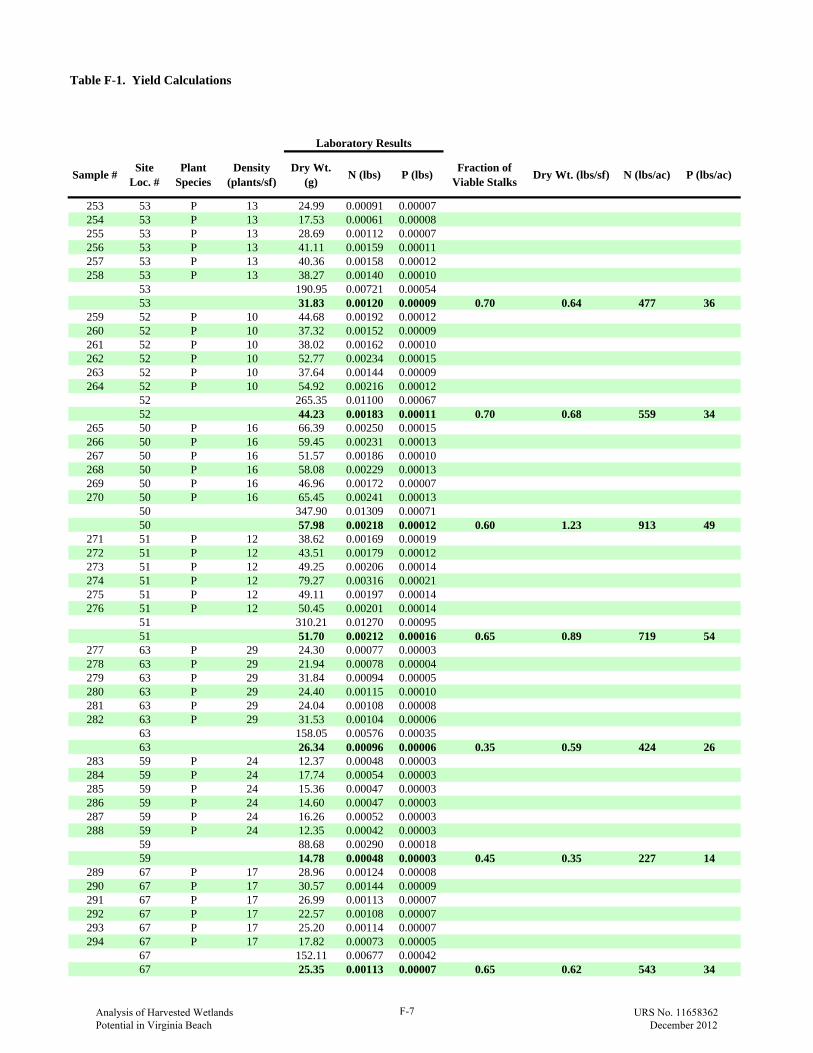
Table F-1. Yield Calculations
Sample # Site Loc. #
Plant Species
Density (plants/sf)
Dry Wt. (g) N (lbs) P (lbs) Fraction of
Viable Stalks Dry Wt. (lbs/sf) N (lbs/ac) P (lbs/ac)
Laboratory Results
253 53 P 13 24.99 0.00091 0.00007254 53 P 13 17.53 0.00061 0.00008255 53 P 13 28.69 0.00112 0.00007256 53 P 13 41.11 0.00159 0.00011257 53 P 13 40.36 0.00158 0.00012258 53 P 13 38.27 0.00140 0.00010
53 190.95 0.00721 0.0005453 31.83 0.00120 0.00009 0.70 0.64 477 36
259 52 P 10 44.68 0.00192 0.00012260 52 P 10 37.32 0.00152 0.00009261 52 P 10 38.02 0.00162 0.00010262 52 P 10 52.77 0.00234 0.00015263 52 P 10 37.64 0.00144 0.00009264 52 P 10 54.92 0.00216 0.00012
52 265.35 0.01100 0.0006752 44.23 0.00183 0.00011 0.70 0.68 559 34
265 50 P 16 66.39 0.00250 0.00015266 50 P 16 59.45 0.00231 0.00013267 50 P 16 51.57 0.00186 0.00010268 50 P 16 58.08 0.00229 0.00013269 50 P 16 46.96 0.00172 0.00007270 50 P 16 65.45 0.00241 0.00013
50 347.90 0.01309 0.0007150 57.98 0.00218 0.00012 0.60 1.23 913 49
271 51 P 12 38.62 0.00169 0.00019272 51 P 12 43.51 0.00179 0.00012273 51 P 12 49.25 0.00206 0.00014274 51 P 12 79.27 0.00316 0.00021275 51 P 12 49.11 0.00197 0.00014276 51 P 12 50.45 0.00201 0.00014
51 310.21 0.01270 0.0009551 51.70 0.00212 0.00016 0.65 0.89 719 54
277 63 P 29 24.30 0.00077 0.00003278 63 P 29 21.94 0.00078 0.00004279 63 P 29 31.84 0.00094 0.00005280 63 P 29 24.40 0.00115 0.00010281 63 P 29 24.04 0.00108 0.00008282 63 P 29 31.53 0.00104 0.00006
63 158.05 0.00576 0.0003563 26.34 0.00096 0.00006 0.35 0.59 424 26
283 59 P 24 12.37 0.00048 0.00003284 59 P 24 17.74 0.00054 0.00003285 59 P 24 15.36 0.00047 0.00003286 59 P 24 14.60 0.00047 0.00003287 59 P 24 16.26 0.00052 0.00003288 59 P 24 12.35 0.00042 0.00003
59 88.68 0.00290 0.0001859 14.78 0.00048 0.00003 0.45 0.35 227 14
289 67 P 17 28.96 0.00124 0.00008290 67 P 17 30.57 0.00144 0.00009291 67 P 17 26.99 0.00113 0.00007292 67 P 17 22.57 0.00108 0.00007293 67 P 17 25.20 0.00114 0.00007294 67 P 17 17.82 0.00073 0.00005
67 152.11 0.00677 0.0004267 25.35 0.00113 0.00007 0.65 0.62 543 34
Analysis of Harvested Wetlands Potential in Virginia Beach
F-7 URS No. 11658362 December 2012
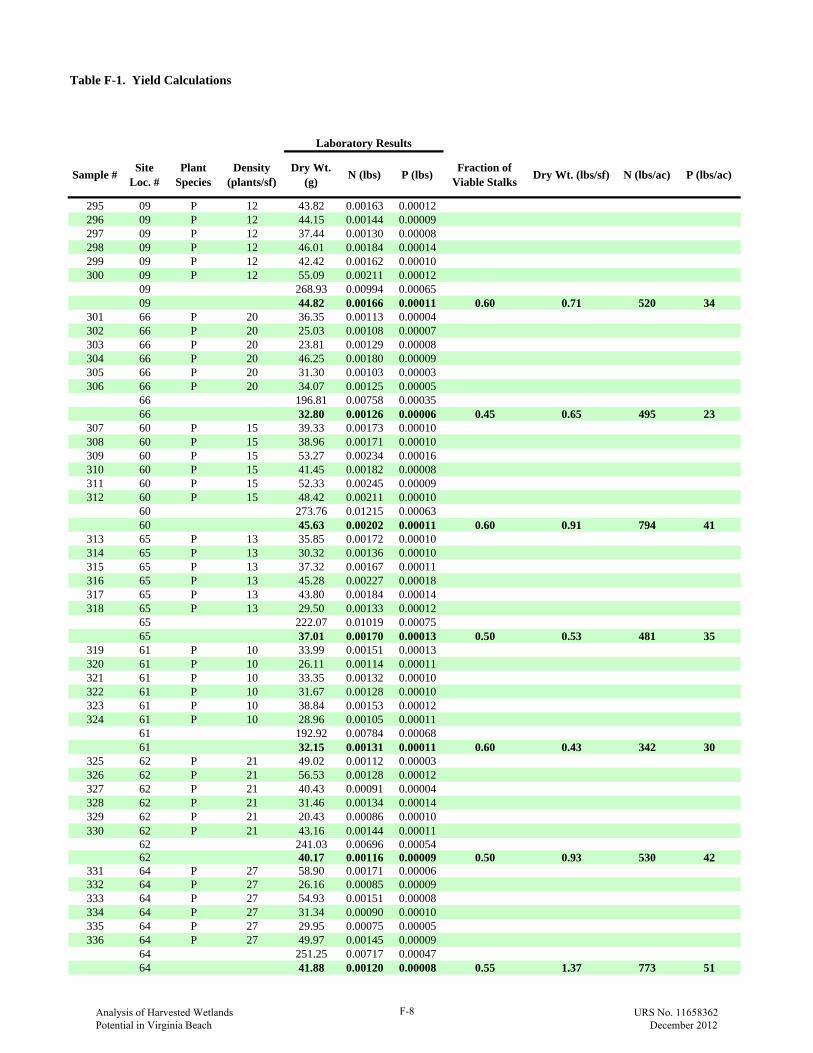
Table F-1. Yield Calculations
Sample # Site Loc. #
Plant Species
Density (plants/sf)
Dry Wt. (g) N (lbs) P (lbs) Fraction of
Viable Stalks Dry Wt. (lbs/sf) N (lbs/ac) P (lbs/ac)
Laboratory Results
295 09 P 12 43.82 0.00163 0.00012296 09 P 12 44.15 0.00144 0.00009297 09 P 12 37.44 0.00130 0.00008298 09 P 12 46.01 0.00184 0.00014299 09 P 12 42.42 0.00162 0.00010300 09 P 12 55.09 0.00211 0.00012
09 268.93 0.00994 0.0006509 44.82 0.00166 0.00011 0.60 0.71 520 34
301 66 P 20 36.35 0.00113 0.00004302 66 P 20 25.03 0.00108 0.00007303 66 P 20 23.81 0.00129 0.00008304 66 P 20 46.25 0.00180 0.00009305 66 P 20 31.30 0.00103 0.00003306 66 P 20 34.07 0.00125 0.00005
66 196.81 0.00758 0.0003566 32.80 0.00126 0.00006 0.45 0.65 495 23
307 60 P 15 39.33 0.00173 0.00010308 60 P 15 38.96 0.00171 0.00010309 60 P 15 53.27 0.00234 0.00016310 60 P 15 41.45 0.00182 0.00008311 60 P 15 52.33 0.00245 0.00009312 60 P 15 48.42 0.00211 0.00010
60 273.76 0.01215 0.0006360 45.63 0.00202 0.00011 0.60 0.91 794 41
313 65 P 13 35.85 0.00172 0.00010314 65 P 13 30.32 0.00136 0.00010315 65 P 13 37.32 0.00167 0.00011316 65 P 13 45.28 0.00227 0.00018317 65 P 13 43.80 0.00184 0.00014318 65 P 13 29.50 0.00133 0.00012
65 222.07 0.01019 0.0007565 37.01 0.00170 0.00013 0.50 0.53 481 35
319 61 P 10 33.99 0.00151 0.00013320 61 P 10 26.11 0.00114 0.00011321 61 P 10 33.35 0.00132 0.00010322 61 P 10 31.67 0.00128 0.00010323 61 P 10 38.84 0.00153 0.00012324 61 P 10 28.96 0.00105 0.00011
61 192.92 0.00784 0.0006861 32.15 0.00131 0.00011 0.60 0.43 342 30
325 62 P 21 49.02 0.00112 0.00003326 62 P 21 56.53 0.00128 0.00012327 62 P 21 40.43 0.00091 0.00004328 62 P 21 31.46 0.00134 0.00014329 62 P 21 20.43 0.00086 0.00010330 62 P 21 43.16 0.00144 0.00011
62 241.03 0.00696 0.0005462 40.17 0.00116 0.00009 0.50 0.93 530 42
331 64 P 27 58.90 0.00171 0.00006332 64 P 27 26.16 0.00085 0.00009333 64 P 27 54.93 0.00151 0.00008334 64 P 27 31.34 0.00090 0.00010335 64 P 27 29.95 0.00075 0.00005336 64 P 27 49.97 0.00145 0.00009
64 251.25 0.00717 0.0004764 41.88 0.00120 0.00008 0.55 1.37 773 51
Analysis of Harvested Wetlands Potential in Virginia Beach
F-8 URS No. 11658362 December 2012

Table F-1. Yield Calculations
Sample # Site Loc. #
Plant Species
Density (plants/sf)
Dry Wt. (g) N (lbs) P (lbs) Fraction of
Viable Stalks Dry Wt. (lbs/sf) N (lbs/ac) P (lbs/ac)
Laboratory Results
337 33 P 7 21.26 0.00073 0.00005338 33 P 7 31.46 0.00094 0.00008339 33 P 7 28.85 0.00128 0.00006340 33 P 7 70.60 0.00268 0.00023341 33 P 7 39.05 0.00127 0.00009342 33 P 7 35.09 0.00118 0.00007
33 226.31 0.00806 0.0005833 37.72 0.00134 0.00010 0.60 0.35 246 18
343 32 P 19 21.05 0.00054 0.00003344 32 P 19 33.87 0.00071 0.00007345 32 P 19 24.66 0.00064 0.00005346 32 P 19 33.26 0.00100 0.00006347 32 P 19 29.46 0.00086 0.00005348 32 P 19 15.64 0.00044 0.00003
32 157.94 0.00418 0.0002932 26.32 0.00070 0.00005 0.40 0.44 230 16
349 10 P 21 55.84 0.00166 0.00010350 10 P 21 37.01 0.00098 0.00007351 10 P 21 21.41 0.00058 0.00004352 10 P 21 37.51 0.00107 0.00007353 10 P 21 37.62 0.00097 0.00007354 10 P 21 33.28 0.00081 0.00005
10 222.67 0.00607 0.0004010 37.11 0.00101 0.00007 0.50 0.86 463 30
355 44 P 15 12.30 0.00070 0.00006356 44 P 15 30.86 0.00096 0.00007357 44 P 15 26.39 0.00078 0.00005358 44 P 15 24.68 0.00070 0.00005359 44 P 15 26.43 0.00058 0.00003360 44 P 15 24.10 0.00070 0.00004
44 144.76 0.00441 0.0003044 24.13 0.00074 0.00005 0.65 0.52 312 21
361 45 p 15 15.41 0.00042 0.00002362 45 P 15 20.16 0.00054 0.00003363 45 P 15 16.59 0.00055 0.00004364 45 P 15 26.68 0.00066 0.00004365 45 P 15 17.53 0.00045 0.00003366 45 P 15 25.04 0.00078 0.00004
45 121.41 0.00340 0.0002145 20.24 0.00057 0.00003 0.60 0.40 222 14
367 41 P 12 12.88 0.00043 0.00004368 41 P 12 16.77 0.00051 0.00004369 41 P 12 24.74 0.00064 0.00005370 41 P 12 21.59 0.00052 0.00005371 41 P 12 30.71 0.00087 0.00005372 41 P 12 18.46 0.00041 0.00003
41 125.15 0.00338 0.0002541 20.86 0.00056 0.00004 0.65 0.36 191 14
373 42 P 12 24.26 0.00054 0.00003374 42 P 12 18.39 0.00051 0.00003375 42 P 12 41.54 0.00103 0.00004376 42 P 12 32.38 0.00097 0.00006377 42 P 12 29.53 0.00091 0.00005378 42 P 12 17.46 0.00049 0.00003
42 163.56 0.00446 0.0002342 27.26 0.00074 0.00004 0.60 0.43 233 12
Analysis of Harvested Wetlands Potential in Virginia Beach
F-9 URS No. 11658362 December 2012

Table F-1. Yield Calculations
Sample # Site Loc. #
Plant Species
Density (plants/sf)
Dry Wt. (g) N (lbs) P (lbs) Fraction of
Viable Stalks Dry Wt. (lbs/sf) N (lbs/ac) P (lbs/ac)
Laboratory Results
379 43 P 18 41.81 0.00112 0.00006380 43 P 18 32.04 0.00086 0.00005381 43 P 18 32.10 0.00085 0.00005382 43 P 18 35.30 0.00093 0.00007383 43 P 18 37.12 0.00109 0.00007384 43 P 18 26.24 0.00067 0.00006
43 204.61 0.00552 0.0003643 34.10 0.00092 0.00006 0.60 0.81 433 28
385 39 P 7 32.19 0.00077 0.00006386 39 P 7 39.84 0.00097 0.00010387 39 P 7 37.22 0.00090 0.00007388 39 P 7 29.80 0.00082 0.00006389 39 P 7 28.60 0.00073 0.00006390 39 P 7 49.96 0.00139 0.00009
39 217.61 0.00558 0.0004439 36.27 0.00093 0.00007 0.75 0.42 213 17
391 40 P 12 29.96 0.00071 0.00003392 40 P 12 23.82 0.00061 0.00002393 40 P 12 19.15 0.00046 0.00003394 40 P 12 27.55 0.00069 0.00003395 40 P 12 24.95 0.00064 0.00002396 40 P 12 21.36 0.00057 0.00002
40 146.79 0.00367 0.0001540 24.47 0.00061 0.00002 0.75 0.49 240 10
397 14 P 14 26.53 0.00071 0.00004398 14 P 14 27.40 0.00074 0.00005399 14 P 14 41.73 0.00137 0.00010400 14 P 14 26.90 0.00092 0.00007401 14 P 14 19.10 0.00060 0.00005402 14 P 14 21.35 0.00067 0.00005
14 163.01 0.00502 0.0003514 27.17 0.00084 0.00006 0.70 0.59 357 25
403 38 P 13 46.86 0.00151 0.00008404 38 P 13 30.73 0.00099 0.00007405 38 P 13 25.06 0.00066 0.00008406 38 P 13 27.90 0.00094 0.00006407 38 P 13 23.03 0.00076 0.00006408 38 P 13 18.78 0.00055 0.00005
38 172.36 0.00541 0.0003938 28.73 0.00090 0.00007 0.65 0.54 332 24
409 34 P 11 16.21 0.00044 0.00003410 34 P 11 19.82 0.00058 0.00004411 34 P 11 18.68 0.00051 0.00003412 34 P 11 19.52 0.00063 0.00004413 34 P 11 30.59 0.00086 0.00003414 34 P 11 15.57 0.00054 0.00003
34 120.39 0.00355 0.0002134 20.07 0.00059 0.00003 0.60 0.29 170 10
415 35 P 12 12.84 0.00030 0.00002416 35 P 12 12.96 0.00034 0.00002417 35 P 12 40.53 0.00105 0.00006418 35 P 12 29.45 0.00069 0.00004419 35 P 12 20.29 0.00047 0.00003420 35 P 12 33.15 0.00075 0.00004
35 149.22 0.00360 0.0002035 24.87 0.00060 0.00003 0.65 0.43 204 11
Analysis of Harvested Wetlands Potential in Virginia Beach
F-10 URS No. 11658362 December 2012

Table F-1. Yield Calculations
Sample # Site Loc. #
Plant Species
Density (plants/sf)
Dry Wt. (g) N (lbs) P (lbs) Fraction of
Viable Stalks Dry Wt. (lbs/sf) N (lbs/ac) P (lbs/ac)
Laboratory Results
421 37 P 21 15.92 0.00046 0.00003422 37 P 21 25.25 0.00076 0.00006423 37 P 21 21.64 0.00092 0.00005424 37 P 21 13.92 0.00067 0.00002425 37 P 21 20.28 0.00091 0.00004426 37 P 21 14.12 0.00066 0.00003
37 111.13 0.00439 0.0002337 18.52 0.00073 0.00004 0.45 0.39 301 16
427 76 P 34 36.02 0.00156 0.00006428 76 P 34 34.57 0.00137 0.00007429 76 P 34 27.86 0.00119 0.00007430 76 P 34 26.77 0.00099 0.00004431 76 P 34 28.56 0.00113 0.00006432 76 P 34 21.20 0.00085 0.00005
76 174.98 0.00708 0.0003676 29.16 0.00118 0.00006 0.35 0.77 612 31
433 77 P 37 23.06 0.00088 0.00005434 77 P 37 15.59 0.00064 0.00003435 77 P 37 19.88 0.00082 0.00003436 77 P 37 66.22 0.00292 0.00010437 77 P 37 12.03 0.00042 0.00002438 77 P 37 22.06 0.00082 0.00004
77 158.84 0.00651 0.0002777 26.47 0.00108 0.00005 0.35 0.76 612 26
439 80 P 20 23.99 0.00077 0.00005440 80 P 20 55.26 0.00191 0.00011441 80 P 20 17.80 0.00069 0.00005442 80 P 20 19.74 0.00081 0.00006443 80 P 20 51.57 0.00174 0.00010444 80 P 20 17.82 0.00055 0.00003
80 186.18 0.00648 0.0004080 31.03 0.00108 0.00007 0.45 0.62 423 26
445 79 P 14 27.99 0.00089 0.00004446 79 P 14 17.04 0.00065 0.00005447 79 P 14 34.74 0.00104 0.00006448 79 P 14 17.48 0.00061 0.00003449 79 P 14 29.35 0.00093 0.00005450 79 P 14 27.86 0.00100 0.00006
79 154.46 0.00511 0.0003079 25.74 0.00085 0.00005 0.60 0.48 311 18
451 78 P 10 33.20 0.00141 0.00012452 78 P 10 44.49 0.00186 0.00017453 78 P 10 40.03 0.00161 0.00013454 78 P 10 30.57 0.00136 0.00009455 78 P 10 35.56 0.00158 0.00016456 78 P 10 11.92 0.00050 0.00006
78 195.77 0.00833 0.0007278 32.63 0.00139 0.00012 0.50 0.36 302 26
457 13 P 10 30.53 0.00141 0.00009458 13 P 10 49.74 0.00228 0.00018459 13 P 10 16.62 0.00059 0.00007460 13 P 10 40.27 0.00165 0.00014461 13 P 10 32.75 0.00107 0.00009462 13 P 10 15.30 0.00081 0.00010
13 185.21 0.00781 0.0006713 30.87 0.00130 0.00011 0.50 0.34 283 24
Analysis of Harvested Wetlands Potential in Virginia Beach
F-11 URS No. 11658362 December 2012

Table F-1. Yield Calculations
Sample # Site Loc. #
Plant Species
Density (plants/sf)
Dry Wt. (g) N (lbs) P (lbs) Fraction of
Viable Stalks Dry Wt. (lbs/sf) N (lbs/ac) P (lbs/ac)
Laboratory Results
463 74 P 12 42.03 0.00165 0.00017464 74 P 12 66.89 0.00224 0.00025465 74 P 12 30.88 0.00107 0.00012466 74 P 12 32.72 0.00116 0.00011467 74 P 12 47.56 0.00181 0.00018468 74 P 12 45.22 0.00156 0.00014
74 265.30 0.00949 0.0009674 44.22 0.00158 0.00016 0.60 0.70 496 50
469 75 P 15 22.05 0.00082 0.00007470 75 P 15 25.28 0.00089 0.00009471 75 P 15 23.55 0.00089 0.00007472 75 P 15 48.58 0.00187 0.00016473 75 P 15 19.53 0.00084 0.00008474 75 P 15 34.91 0.00122 0.00008
75 173.90 0.00653 0.0005475 28.98 0.00109 0.00009 0.60 0.58 427 35
475 36 P 25 39.06 0.00140 0.00006476 36 P 25 35.18 0.00133 0.00009477 36 P 25 20.85 0.00088 0.00005478 36 P 25 25.55 0.00096 0.00007479 36 P 25 14.49 0.00047 0.00002480 36 P 25 21.30 0.00087 0.00003
36 156.43 0.00592 0.0003336 26.07 0.00099 0.00005 0.40 0.57 430 24
Mean = 0.593Standard Deviation = 0.233
Analysis of Harvested Wetlands Potential in Virginia Beach
F-12 URS No. 11658362 December 2012