Fundamental study of small-scale processes in the ...
90
HAL Id: tel-02397930 https://hal.archives-ouvertes.fr/tel-02397930 Submitted on 6 Dec 2019 HAL is a multi-disciplinary open access archive for the deposit and dissemination of sci- entific research documents, whether they are pub- lished or not. The documents may come from teaching and research institutions in France or abroad, or from public or private research centers. L’archive ouverte pluridisciplinaire HAL, est destinée au dépôt et à la diffusion de documents scientifiques de niveau recherche, publiés ou non, émanant des établissements d’enseignement et de recherche français ou étrangers, des laboratoires publics ou privés. Fundamental study of small-scale processes in the atmosphere and in the ocean Caroline Muller To cite this version: Caroline Muller. Fundamental study of small-scale processes in the atmosphere and in the ocean. Ocean, Atmosphere. Sorbonne Universites, UPMC University of Paris 6, 2019. tel-02397930
-
Upload
khangminh22 -
Category
Documents
-
view
1 -
download
0
Transcript of Fundamental study of small-scale processes in the ...
HAL Id: tel-02397930https://hal.archives-ouvertes.fr/tel-02397930
Submitted on 6 Dec 2019
HAL is a multi-disciplinary open accessarchive for the deposit and dissemination of sci-entific research documents, whether they are pub-lished or not. The documents may come fromteaching and research institutions in France orabroad, or from public or private research centers.
L’archive ouverte pluridisciplinaire HAL, estdestinée au dépôt et à la diffusion de documentsscientifiques de niveau recherche, publiés ou non,émanant des établissements d’enseignement et derecherche français ou étrangers, des laboratoirespublics ou privés.
Fundamental study of small-scale processes in theatmosphere and in the ocean
Caroline Muller
To cite this version:Caroline Muller. Fundamental study of small-scale processes in the atmosphere and in the ocean.Ocean, Atmosphere. Sorbonne Universites, UPMC University of Paris 6, 2019. �tel-02397930�

HDR Caroline Muller, Sept. 2019 i
Memoire presente pour obtenir l’Habilitation a Diriger des Recherches HDR
Caroline Muller
Laboratoire de Meteorologie DynamiqueInstitut Pierre-Simon Laplace
Fundamental study of small-scale processes in the atmosphere andin the ocean
Etude fondamentale de processus a petite echelle dansl’atmosphere et dans l’ocean
September 18th, 2019, 2pmEcole Normale Superieure de Paris
Jury:
Chantal Staquet (reviewer) Helene ChepferBjorn Stevens (reviewer) Christopher HollowayFrank Roux (reviewer) Philippe Drobinski

HDR Caroline Muller, Sept. 2019 ii
Acknowledgments
I would first like to thank members of the jury for their time. This work would not have beenpossible without the precious contributions from many talented students, postdoctoral researchers,and collaborators. I learn from them every day, which is what makes this job so exciting andrewarding. I would particularly like to thank my friends and colleagues from LadHyX and LMD,including Oceane Richet, Sara Shamekh, Adrien Lefauve, Keshav Raja, Nicolas Da Silva, Jean-Marc Chomaz, Sandrine Bony, Sabrina Speich, Philippe Drobinski... Our numerous discussions, onscience and on other topics, are invaluable to me and to my research. Finally I would like to thankVenance Journe, Jean-Yves Grandpeix, and Alain Lahellec whom we miss, for allowing me to workin their office when I am in jussieu (aka UPMC aka SU). I thank my family, Emmanuel, Margot,Adele, and the guy who discovered coffee for their support along the way.
I will end with a Shadok proverb, which I have always found quite inspiring:
Shadok proverb: “If there is no solution, then there must be no puzzle.”

HDR Caroline Muller, Sept. 2019 iii
French abstract: “Resume”
De maniere generale, mes activites de recherche portent sur la dynamique des fluides geophysiqueset les fluides stratifies. Je suis particulierement interessee par l’etude des phenomenes aux echellestrop petites pour permettre leur resolution explicite dans les modeles climatiques globaux actuels(GCMs). Deux exemples importants sur lesquels je travaille sont les ondes internes oceaniques, etla convection nuageuse atmospherique. Ces phenomenes aux petites echelles doivent etre parametresdans les GCMs, afin d’ameliorer les previsions climatiques.
Le but de mes recherches est d’utiliser des outils theoriques et numeriques, aussibien les modeles haute resolution en configuration idealisee que les GCMs globaux,pour une meilleure comprehension fondamentale de ces phenomenes, en vue d’ameliorerles previsions climatiques actuelles.
Plus precisement, les questions auxquelles je me suis interessee ces dernieres annees sont :
• Quel est le role de la topographie sous-marine dans la generation d’ondes internes dansl’ocean? Quelle est la contribution de ces ondes au melange oceanique, et quel impact sur lacirculation oceanique grande echelle?Les ondes internes sont omnipresentes dans l’ocean et participent donc du bilan energetiqueglobal des oceans. Mais leurs echelles sont trop petites pour etre explicitement resoluesdans les GCMs. Leur effet sur les masses d’eau et sur la circulation globale doit donc etreparametre. La circulation oceanique n’est pas seulement un sujet fascinant, c’est aussi uningredient essentiel de la prevision climatique. Le but de mes recherches est de clarifier les pro-cessus physiques menant a l’instabilite et au deferlement de ces ondes, ainsi que de quantifierle melange induit par ce deferlement.
• Quelle est la reponse du cycle hydrologique (precipitations moyennes et precipitations extremes)au changement climatique?Comprendre la reponse du cycle hydrologique au rechauffement climatique est une questioncruciale, avec d’importants impacts societaux. De nombreuses etudes, utilisant des modelesregionaux a haute-resolution aussi bien que des modeles globaux a basse resolution, predisentune augmentation de l’intensite des precipitations extremes avec le rechauffement clima-tique. L’origine physique de cette augmentation est bien comprise, grace a de nombreusesetudes theoriques, notamment son lien etroit avec une contrainte thermodynamique (liee al’augmentation de vapeur d’eau atmospherique). Mais si cette contribution thermodynamiqueest bien comprise, des incertitudes persistent concernant les contributions dynamique (liee auxvitesses verticales dans les nuages) et microphysique (liee a l’efficacite des pluies). Mes travauxs’interessent a quantifier ces differentes contributions, dans des simulations idealisees, sans etavec organisation spatiale des nuages.
• Quelle est l’origine physique de l’organisation spatiale des nuages dans les tropiques? L’exemplele plus spectaculaire d’organisation spatiale de la convection nuageuse est sans nul doute lecyclone tropical, avec son oeil entoure d’un mur nuageux abrupt, ou l’on trouve les ventsparmi les plus violents sur notre planete. Il existe d’autres types de convection spatialement

HDR Caroline Muller, Sept. 2019 iv
organisee (convection fait reference aux mouvements de l’air dans lesquels les nuages sontinseres); en effet la convection organisee est omnipresente dans les tropiques. Mais elle estencore mal comprise et mal representee dans les parametrisations convectives des GCMs,malgre son fort impact societal et climatique. Un des buts de mes recherches est de clarifierles processus physiques a l’origine de cette organisation spatiale des nuages, et d’etudier leurreponse au rechauffement climatique.
Ces questions sont aujourd’hui clefs pour mieux comprendre les consequences du changementclimatique et les evenements extremes, tels que les cyclones tropicaux. Elles sont egalement tresimportantes pour comprendre le role des phenomenes petites echelles dans la circulation oceaniquea grande echelle, et donc l’evolution du climat et des ecosystemes. Mon document d’HDR decrit endetail les resultats scientifiques majeurs de mes recherches sur ces trois questions obtenus depuismon arrivee au CNRS en 2012.

Content
Acknowledgments . . . . . . . . . . . . . . . . . . . . . . . . . . . . . . . . . . . . . . . . . ii
French abstract: “Resume” . . . . . . . . . . . . . . . . . . . . . . . . . . . . . . . . . . . iii
I Introduction: general overview, context, and goal of my research activities 1
II Dissipation of internal tides in the abyssal ocean: linear and nonlinear processes 5
II.1 Summary of key results, main collaborations and relevant supervisions . . . . . . . . 6
II.2 Introduction to internal tides induced mixing: what we know, what we dont know . 7
II.2.a What are internal tides? . . . . . . . . . . . . . . . . . . . . . . . . . . . . . . 7
II.2.b Why do we care? . . . . . . . . . . . . . . . . . . . . . . . . . . . . . . . . . . 8
II.2.c Ocean mixing: questions addressed . . . . . . . . . . . . . . . . . . . . . . . . 10
II.3 My research: local dissipation of internal tides via convective instability, results fromlinear theory . . . . . . . . . . . . . . . . . . . . . . . . . . . . . . . . . . . . . . . . 10
II.3.a Wave energy carried by internal tides . . . . . . . . . . . . . . . . . . . . . . 10
II.3.b Local dissipation of internal tides via convective instability . . . . . . . . . . 11
II.4 My research: local dissipation of internal tides via nonlinear effects, catastrophicdissipation via Parametric Subharmonic Instability (PSI)? . . . . . . . . . . . . . . . 12
II.4.a Dissipation by nonlinear wave-wave interactions . . . . . . . . . . . . . . . . . 12
II.4.b Robustness to a mean current . . . . . . . . . . . . . . . . . . . . . . . . . . . 17
IIIPrecipitation extremes and their response to warming 19
III.1 Summary of key results, main collaborations and relevant supervisions . . . . . . . . 20
III.2 Introduction: response of the hydrological cycle to global warming . . . . . . . . . . 21
III.3 Some notes on the methodology: idealized cloud-resolving simulations in radiative-convective equilibrium . . . . . . . . . . . . . . . . . . . . . . . . . . . . . . . . . . . 23
III.3.a Radiative-convective equilibrium . . . . . . . . . . . . . . . . . . . . . . . . . 23
III.3.b Cloud-resolving simulations . . . . . . . . . . . . . . . . . . . . . . . . . . . . 25
III.4 My research: theoretical scaling for the amplification of precipitation extremes withwarming . . . . . . . . . . . . . . . . . . . . . . . . . . . . . . . . . . . . . . . . . . . 26
III.4.a Theoretical scaling . . . . . . . . . . . . . . . . . . . . . . . . . . . . . . . . . 26
III.4.b Comparison with cloud-resolving simulations . . . . . . . . . . . . . . . . . . 29
III.4.c Beyond idealized simulations: scaling applied to observations in the Mediter-ranean region . . . . . . . . . . . . . . . . . . . . . . . . . . . . . . . . . . . . 33
III.5 My research: impact of convective organization and outstanding open questions . . . 34
III.5.a Impact of convective organization on the amplification of precipitation ex-tremes with warming . . . . . . . . . . . . . . . . . . . . . . . . . . . . . . . . 34
v

HDR Caroline Muller, Sept. 2019 vi
III.5.b Discussion and outstanding open questions . . . . . . . . . . . . . . . . . . . 36
IV Self-aggregation of tropical deep convection, and implications 39IV.1 Summary of key results, main collaborations and relevant supervisions . . . . . . . . 40IV.2 Introduction: basics of mesoscale convective organization . . . . . . . . . . . . . . . 41
IV.2.a Definition . . . . . . . . . . . . . . . . . . . . . . . . . . . . . . . . . . . . . . 42IV.2.b Role of vertical shear . . . . . . . . . . . . . . . . . . . . . . . . . . . . . . . . 43IV.2.c Role of gravity waves . . . . . . . . . . . . . . . . . . . . . . . . . . . . . . . . 45IV.2.d Wind-induced surface heat exchange (WISHE) . . . . . . . . . . . . . . . . . 45IV.2.e Convective self-aggregation . . . . . . . . . . . . . . . . . . . . . . . . . . . . 45
IV.3 My research: physical processes responsible for self-aggregation over homogeneoussea-surface temperatures . . . . . . . . . . . . . . . . . . . . . . . . . . . . . . . . . . 47IV.3.a Self-aggregation by radiative feedbacks . . . . . . . . . . . . . . . . . . . . . . 48IV.3.b Self-aggregation by moisture-memory feedback . . . . . . . . . . . . . . . . . 48
IV.4 My research: implications for ocean eddies - convection interaction, and for tropicalcyclogenesis . . . . . . . . . . . . . . . . . . . . . . . . . . . . . . . . . . . . . . . . . 49IV.4.a Impact of ocean temperature inhomogeneities . . . . . . . . . . . . . . . . . . 50IV.4.b Acceleration of tropical cyclogenesis by self-aggregation feedbacks . . . . . . 52
V Perspectives: future research directions 59V.1 Summary: scientific and personal objectives . . . . . . . . . . . . . . . . . . . . . . . 60V.2 Perspectives: towards an improved fundamental understanding of convective orga-
nization . . . . . . . . . . . . . . . . . . . . . . . . . . . . . . . . . . . . . . . . . . . 60V.3 Perspectives: self-aggregation by moisture-memory feedbacks . . . . . . . . . . . . . 61V.4 Perspectives: implications for tropical cyclones and for the tropical energetics . . . . 61
Appendices 63.1 Curriculum vitae . . . . . . . . . . . . . . . . . . . . . . . . . . . . . . . . . . . . . . 64.2 Supervisions . . . . . . . . . . . . . . . . . . . . . . . . . . . . . . . . . . . . . . . . . 69.3 List of publications and talks . . . . . . . . . . . . . . . . . . . . . . . . . . . . . . . 71.4 List of 5 selected publications attached with this document . . . . . . . . . . . . . . 75References . . . . . . . . . . . . . . . . . . . . . . . . . . . . . . . . . . . . . . . . . . . . . 83

Chapter I
Introduction: general overview,context, and goal of my researchactivities
“If we knew what it was we were doing, it would not be called research, would it?”Albert Einstein
1

HDR Caroline Muller, Sept. 2019 2
My research interests lie in the fields of geophysical fluid dynamics and climate science. I amparticularly interested in the study of processes which are too small in space and time to be ex-plicitly resolved in coarse-resolution Global Climate Models (GCMs) used for climate prediction.Important examples that I work on are internal wave breaking in the ocean and cloud processes inthe atmosphere. These small-scale, subgrid processes need to be parametrized in GCMs in orderto improve current model projections of climate change.
The overall goal of my research activities is to use theoretical and numerical models,from idealized high-resolution simulations to global GCMs in realistic configuration,in order to improve our fundamental understanding of these small-scale processes. Myultimate goal is to help guide and improve GCM parameterizations, for better climateprojections.
Geophysical fluid dynamics, climateocean, atmosphere
Small scale processesÞ need theoretical understandingand numerical parameterizations
Theory & high-resolution models Þ improved climate predictions
Atmospheric convection
O(100km)Internal ocean waves
Temperature
O(5km)
Numerical grid of a global climate model
Clouds
CONTEXT
GOAL
Figure I.1: The overall goal of my research activities is to improve our fundamental understandingof climate processes with scales smaller than a typical GCM resolution (tens to hundreds of kilome-ters). Important examples of such subgrid-scale processes that I work on are internal waves in theocean, and convective clouds in the atmosphere.
More specifically, my research activities focus on three main topics:
• What role does the small-scale seafloor topography play in the generation of internal wavesin the abyssal ocean? What is the contribution of those internal waves to ocean mixing, andwhat impact on the ocean large-scale circulation?Internal waves are ubiquitous in the ocean, and contribute significantly to the ocean globalenergetics. But their scales are too small, both in space and time, to be explicitly resolvedin GCMs. Thus their effect on water masses and on the large-scale ocean circulation mustbe parameterized. The goal of my research is to clarify the physical mechanisms leading to

HDR Caroline Muller, Sept. 2019 3
the instability, overturning and breaking of those waves, as well as to quantify the mixinginduced by wave breaking events.
• What is the response of the hydrological cycle (both mean precipitation and extreme precip-itation) to global warming?Understanding the response of precipitation extremes to climate change is a crucial question,with important societal impacts. Numerous studies, using both regional high-resolution mod-els and global coarse-resolution models, predict an increase of the intensity of precipitationextremes with warming. The physical origin of this increase is well understood, thanks to nu-merous theoretical studies, notably its link with a strong thermodynamic constraint (relatedto water vapor). But if the thermodynamic contribution to precipitation extremes is well un-derstood, a large uncertainty remains regarding the dynamic contribution linked to verticalvelocities in updrafts, and the microphysics contribution related to precipitation efficiency.My work aims at quantifying these contributions, in idealized simulations without and withconvective organization.
• What are the physical processes responsible for the organization of tropical clouds?Arguably, the most spectacular example of organized convection is the tropical cyclone, withits eye devoid of deep convection, surrounded by a cloudy eyewall where extreme winds arefound. There are other types of organized convection, (convection refers to the overturningof air within which clouds are embedded). In fact, organized convection is ubiquitous in thetropics. But it is still poorly understood and typically not accounted for in global climatemodels, despite strong societal and climatic impacts. One of the goals of my research is toclarify the physical processes responsible for organizing convection, and to investigate theirresponse to climate change.
These questions have important societal impacts. They are key to improving our understandingof the consequences of climate change, notably on extreme events such as tropical cyclones. Clar-ifying the role of small-scale processes on the large-scale ocean circulation is also crucial to helpdetermine the evolution of ecosystems in our warming climate.
In the following three chapters (II, III and IV), I describe in detail the major scientific outcomesof my research activities in those three topics. Each of these three chapters starts with a summaryof the main scientific results and main collaborations/supervisions of students/postdocs relevantto each topic. This summary is followed by an introduction describing the scientific context andstate-of-the-art, and then by my scientific contributions to the field. Unless otherwise noted, inthis report I will focus on results that were obtained since I joined the CNRS in 2012.
This manuscript ends with a chapter (V) on my perspectives and future research directions, aswell as outstanding open questions.

HDR Caroline Muller, Sept. 2019 4

Chapter II
Dissipation of internal tides in theabyssal ocean: linear and nonlinearprocesses
“How inappropriate to call this planet Earth when it is quite clearly Ocean.”Arthur C. Clarke
5

HDR Caroline Muller, Sept. 2019 6
II.1 Summary of key results, main collaborations and relevantsupervisions
• Key results: linear study
Internal tides are internal waves generated by the interaction of the barotropic tide with theseafloor topography. The breaking of those waves, and the concomitant dissipation of theirenergy, is believed to provide a large part of the power needed to mix the abyssal ocean andsustain the meridional overturning circulation. State-of-the-art topographic products barelyresolve scales smaller than ≈ 10 km in the deep ocean. On these small scales, abyssal hillsdominate ocean floor roughness.
In [Melet et al., 2013b], we use linear wave theory to evaluate the impact of abyssal hillroughness on internal-tide generation. We find that globally, internal tide generation byabyssal hills integrates to ≈ 10% of the energy flux due to larger topographic scales resolvedin standard topographic products. Locally, the abyssal hill contribution to the internal tideenergy flux can exceed 100%, notably above the Mid-Atlantic ridge. Therefore, abyssal hills,unresolved in state-of-the-art topographic products, can have a strong impact on internal tidegeneration, especially over mid-ocean ridges.
This analysis of internal tides generation at small-scale topography, is extended further in[Lefauve et al., 2015], where we use an ad-hoc parameterization of wave breaking devel-oped during my PhD [Muller and Buhler, 2009] to quantify the mixing induced by breakinginternal tides. We show that a large fraction of abyssal-hill generated internal tide energy islocally dissipated over mid-ocean ridges in the southern hemisphere. Significant dissipationoccurs above ridge crests, and, upon rescaling by the local stratification, follows a monotonicexponential decay with height off the bottom, with a nonuniform decay scale.
Overall, these results from linear theory imply stronger internal-tide induced mixing thanpreviously estimated from larger-scale bathymetry. This additional tidal mixing has beenimplemented in a GCM parametrization of ocean mixing [De Lavergne et al., 2016].
• Key results: nonlinear study
Beyond linear predictions, internal tides (and internal waves in general) are known to be sub-ject to nonlinear processes, which can lead to wave instability and overturning, and thus tothe mixing ultimately relevant to the large-scale ocean circulation. Notably, previous numeri-cal studies of the dissipation of internal tides in idealized settings, highlight the importance ofnonlinear transfer of energy to small-scale secondary waves via the parametric subharmonicinstability, or PSI. This triadic instability is favored at a specific resonant latitude, knownin the literature as the critical latitude. Consistently, these numerical studies exhibit a largeenhancement of internal tide dissipation at the critical latitude.
In [Richet et al., 2018], we clarify the physical processes at the origin of this stronglatitudinal dependence of tidal energy dissipation. We find that different mechanisms areinvolved equatorward and poleward of the critical latitude. Triadic resonant instabilitiesare responsible for the dissipation of internal tides equatorward of the critical latitude. Inparticular, a dominant triad involving the primary internal tide and near-inertial waves iskey. At the critical latitude, the peak of energy dissipation is explained by both increasedinstability growth rates, and smaller scales of secondary waves thus more prone to break

HDR Caroline Muller, Sept. 2019 7
and dissipate their energy. Surprisingly, poleward of the critical latitude, the generation ofevanescent waves appears to be crucial. Triadic instabilities have been widely studied, but thetransfer of energy to evanescent waves has received comparatively little attention. Our worksuggests that the nonlinear transfer of energy from the internal tide to evanescent waves,corresponding to the 2f-pump mechanism described by [Young et al., 2008] is an efficientmechanism to dissipate internal tide energy near and poleward of the critical latitude.
Observations instead indicate a more modest enhancement at the critical latitude. We addressthis issue in [Richet et al., 2017] by investigating the impact of a weak background meancurrent in numerical simulations. The dissipation and its variation with latitude without themean current are consistent with earlier studies. But adding a weak mean current has a majorimpact on the latitudinal distribution of dissipation. This behavior can be attributed to theDoppler shift of the internal tides frequency, which hinders the energy transfer to secondarywaves of the unstable triads. Thus, although nonlinear transfers of energy between waves areefficient at dissipating internal tides, the exact location of the dissipation is sensitive to large-scale oceanic conditions, including the presence of large-scale currents or mesoscale eddies,which can impact the propagation and dissipation of internal tides.
• Main collaborations and relevant supervisions
The linear study was performed by Adrien Lefauve during his Masters internship under mysupervision at LadHyX. Adrien is now doing a PhD at the University of Cambridge UK withPaul Linden. This work was also done in collaboration with Angelique Melet, postdoctoralresearcher at LEGOS Toulouse at the time, now researcher at MERCATOR.
The nonlinear study was performed by Oceane Richet during her PhD at LadHyX. ThisPhD was co-supervised by myself and my collaborator Jean-Marc Chomaz, senior re-searcher at LadHyX. Oceane is now doing a three-year postdoc at the University of Tasmaniawith Bernadette Sloyan and Maxim Nikurashin.
In this chapter, we summarize the key results obtained in these studies, with a particular focus onthe nonlinear process study [Richet et al., 2018].
II.2 Introduction to internal tides induced mixing: what we know,what we dont know
II.2.a What are internal tides?
The presence of celestial bodies (in particular the moon and the sun) induces a barotropic currentin the ocean, known as the barotropic tide. Without topography, this flow represents the usualsolution to the tidal equation. In the presence of topography, this barotropic tide interacts with theseafloor resulting in the radiation of internal waves, known as the internal tides (see e.g. [Garrettand Kunze, 2007] for a review).
Internal waves are waves within stably-stratified fluids. In the case of a rotating stratified fluidwith Brunt-Vaisala frequency N (> 0 for stable stratification) and Coriolis parameter f assumedconstant, those waves of the form ∝ ei(k.x−ωt) satisfy the well-known dispersion relation (obtainedfrom the linearized equations under the Boussinesq approximation, see e.g., [Staquet and Sommeria,

HDR Caroline Muller, Sept. 2019 8
sponge layer
Zonal velocity
Depth (m)
x (km)0 10 20 30 40 50 60
1000
2000
3000
4000
5000
Figure II.1: Illustration of internal waves in the high-resolution model used in the nonlinear study(§II.4), namely the MITgcm [Marshall et al., 1997]. The waves are generated as an imposedbarotropic current U(t) = (U0 sinω0t, 0) interacts with the bottom rough bathymetry (adapted from[Richet et al., 2017]). We investigate the generation of internal tides at the seafloor, and thusneglect the effect of waves reflecting at the ocean surface and radiating back down towards thetopography. Thus a sponge layer is imposed in upper levels in order to absorb upward propagatingwaves (following [Nikurashin and Legg, 2011]).
2002, Buhler and Muller, 2007]):
ω2 = N2 cos2 θk + f2 sin2 θk, (II.1)
where θk denotes the angle between the wave vector k = (kx, ky, kz) and the horizontal. Thisdispersion relation yields several interesting properties to internal waves.
First the group velocity and phase velocity have opposite vertical components. In other words,for internal waves, if the phase goes down, the energy goes up, and vice-versa. Second, the frequencyof internal waves has magnitude between f and N . In typical oceanic conditions, |f | < N , so that|f | < |ω| < N . Third, the angle of propagation of the wave depends solely on their frequency - thehigher the frequency, the steeper (more vertical) the slope of the group velocity rays.
Figure II.1 illustrates the generation of internal tides in high-resolution simulations, when animposed barotropic tide U(t) = (U0 sinω0t, 0) interacts with the seafloor topography. In thissimulation, U(t) is the semi-diurnal lunar tide, so that ω0 is the semi-diurnal tidal frequency(approximately twice a day). As predicted by linear theory [Bell, 1975], this interaction generateswaves at this fundamental tidal frequency, as well as harmonics at higher frequency (2ω0, 3ω0...),seen by some steeper rays corresponding to waves with higher frequencies on figure II.1.
II.2.b Why do we care?
The dissipation of internal tides through wave breaking and concomitant three-dimensional turbu-lence contributes to vertical mixing in the deep ocean, and hence plays a role in the large-scaleocean circulation. Indeed, the turbulent mixing associated with breaking waves makes a significantcontribution to the diffusion of fluid particles across density surfaces [Staquet and Sommeria, 2002],which is important for the maintenance of the stratification in the deep ocean (e.g., [Wunsch andFerrari, 2004]).

HDR Caroline Muller, Sept. 2019 9
Figure II.2: Depth-longitude section of diapycnal diffusivity in the Brazil Basin from [Polzin et al.,1997]. There is a clear signal of enhanced vertical mixing over rough topography.
Consistently, greatly elevated values of diapycnal diffusivities are found over the rough bathymetryof the Mid-Atlantic ridge, where bottom values can reach several orders of magnitude higher thanthe pelagic value 0.1 cm2 s−1 (figure II.2). These observed enhanced mixing rates were attributed tothe dissipation of the internal tides, although other mechanisms could also contribute to high bot-tom diffusivities, such as lee waves generated by mesoscale eddies interacting with the bathymetry[Nikurashin et al., 2013, Sommeria et al., 2016], or the hydraulic flow of dense bottom watersthrough constrictive passages at the seafloor [Legg, 2014].
In recent years, the emerging consensus is that this tidally-induced mixing is important for thedynamics of the large-scale ocean circulation in the deep abyssal ocean, below 1500 m depth or so(e.g., [Munk and Wunsch, 1998], [Wunsch, 2000], and the reviews in [Wunsch and Ferrari, 2004]and [Thorpe, 2005]). As schematically depicted in figure II.3, the dense Antarctic bottom water,or AABW, sinks at high latitudes in the southern Ocean. Mixing processes, to which internaltides contribute significantly, lift up deep waters to mid-depths, likely to 1000 - 2000 m abovethe seafloor (the red line indicates maximum height of topographic features below which mixing isstrong). These deep waters return to the surface at these depths via the southern Ocean [Ferrari,2014, Waterhouse et al., 2014].
Numerical models have been shown to be sensitive to diffusivity values, from simple ideal-ized models [Nikurashin and Vallis, 2012] to state-of-the-art GCMs [Melet et al., 2013a]. But asmentioned in the introduction, these internal wave processes are far too small in spatial and/ortemporal scale to be resolved in climate models. Thus theory, high-resolution modeling and ob-servations must be used to parametrize their effects in such models. One of our goals is to get abetter understanding of the role of internal tides dissipation in ocean mixing, and how it relates tothe bathymetry. Of particular interest is the degree of spatial inhomogeneity of the mixing inducedby breaking internal tides. This spatial variability in the mixing, both horizontally and vertically,

HDR Caroline Muller, Sept. 2019 10
Figure II.3: Emerging model of the deep-ocean circulation from models and observations. The redline represents the height of the tallest topographic features below which mixing is strong (adaptedfrom [Ferrari, 2014]).
could imply a radically different interior circulation in models than that obtained with uniformmixing schemes.
II.2.c Ocean mixing: questions addressed
Quantitatively, very large uncertainties remain, notably on the amount of local (near the genera-tion site at the seafloor) versus remote dissipation of internal tides. Observations indicate that thelocal dissipation of internal tides near their generation site could be up to 70 - 100 % in regionswith small-scale rough topography, but is believed to be smaller without small-scale topographicroughness [Waterhouse et al., 2014]. Large uncertainties also remain regarding the remotely dis-sipating internal tides, which could contribute to Antarctic bottom water consumption between1 and 28 Sv depending on the amount and vertical structure of the corresponding wave-inducedmixing [De Lavergne et al., 2016].
In this work, we address the following questions:
• What is the fraction of wave energy dissipated locally near the generation site?
• How is this dissipation distributed spatially?
• What mechanisms lead to internal tides instability, breaking and dissipation (convective in-stability? nonlinear effects?...)?
Our focus is thus on the local dissipation of internal tides near their generation site. Theultimate fate of the remaining fraction of wave energy which propagates away is an importantquestion, but is beyond the scope of this work.
II.3 My research: local dissipation of internal tides via convectiveinstability, results from linear theory
II.3.a Wave energy carried by internal tides
This section is based on the paper

HDR Caroline Muller, Sept. 2019 11
A. Melet, M. Nikurashin, C. Muller, S. Falahat, J. Nycander, P. Timko, B. Arbic, J. GoffInternal tide generation by abyssal hills using analytical theory
J. Geophys. Res. - Oceans, 118 (2013).
We first quantify the amount of energy carried by the internal tides upon generation at small-scale topography. One of the main results of my Ph.D. thesis is that the wave breaking andconcomitant mixing are extremely sensitive to small topographic scales, smaller that 10 km or so[Muller and Buhler, 2009]. These scales are smaller than the current resolution of global bathymetryfrom satellites [Smith and Sandwell, 1997]. We thus need to take a statistical approach to investigatethe contribution from small topographic scales to the generation of internal tides.
Taking this statistical approach to represent the small-scale seafloor (mainly abyssal hills atthose scales), we quantify the energy carried by the internal tides generated at small-scale topog-raphy, using the linear wave theory. Internal tide generation by abyssal hills integrates to 0.1 TWglobally, or 0.03 TW when the energy flux is empirically corrected for supercritical slope (i.e., 10% of the energy flux due to larger topographic scales resolved in standard topographic products inboth cases). The abyssal hill driven energy flux is dominated by mid-ocean ridges, where abyssalhill roughness is large. Focusing on two regions located over the Mid-Atlantic ridge and the EastPacific rise, it is shown that regionally linear theory predicts an increase of the energy flux due toabyssal hills of up to 100 % or 60 % when an empirical correction for supercritical slopes is at-tempted. Therefore, abyssal hills, unresolved in state-of-the-art topographic products, can have astrong impact on internal tide generation, especially over mid-ocean ridges. These results have beenimplemented in an ocean mixing parametrization [De Lavergne et al., 2016], and the variability ofthe mixing that it entails affects the large-scale ocean circulation.
II.3.b Local dissipation of internal tides via convective instability
This section is based on the paper
A. Lefauve, C. Muller, A. MeletA three-dimensional map of tidal dissipation over abyssal hills
J. Geophys. Res. - Oceans, 120 (2015).
Here we investigate the fraction of the internal tide energy which gets dissipated near theirgeneration site at the seafloor by convective instability. Both the fraction of internal tide energythat is dissipated locally and the resulting vertical mixing distribution are crucial for the oceanstate, but remain poorly quantified. Current parameterizations in GCMs typically assume that aconstant fraction of the energy carried by the internal tides is dissipated through wave breaking(for instance 50 % in the parameterization mentioned above [De Lavergne et al., 2016]), and thatthe induced mixing decays exponentially from topography where the waves are generated.
In order to more precisely quantify the fraction of tidal energy dissipated through wave breaking,as well as its vertical distribution over topography, we use a heuristic model for wave breakingdeveloped during my Ph.D. thesis [Muller and Buhler, 2009]. This model uses the wave amplitude(also known as wave steepness in the literature e.g. [Staquet and Sommeria, 2002]) estimated fromlinear theory, to predict regions of convective instability and wave breaking. Combined with anonlinear parameterization for wave breaking, it also yields an estimate of the amount of waveenergy dissipated by the wave breaking events. This heuristic model can be applied to varioustopographies, idealized [Buhler and Muller, 2007] or realistic [Muller and Buhler, 2009], to obtainan estimate of the tidal dissipation.

HDR Caroline Muller, Sept. 2019 12
We extend this model to account for stratification variations within the WentzelKramersBril-louin, or WKB, approximation, and derive the first global map of mixing due to internal tidesgenerated at small-scale abyssal hills (figure II.4). Our estimate is based on quasi-global small-scale abyssal hill bathymetry, stratification, and tidal data. We show that a large fraction ofabyssal-hill generated internal tide energy is locally dissipated over mid-ocean ridges in the south-ern hemisphere. Significant dissipation occurs above ridge crests, and, upon rescaling by the localstratification, follows a monotonic exponential decay with height off the bottom, with a nonuni-form decay scale. We however show that a substantial part of the dissipation occurs over thesmoother flanks of mid-ocean ridges, and exhibits a middepth maximum due to the interplay ofwave amplitude with stratification.
We link the three-dimensional map of dissipation to abyssal hills characteristics, ocean stratifica-tion, and tidal forcing, and discuss its potential implementation in time-evolving parameterizationsfor GCMs. Although linear theory, on which our heuristic model is based, may overestimate theoccurrence of convective instability, we believe that qualitatively the non-homogeneous spatial dis-tribution of wave energy dissipation that it predicts is robust. Our results suggest that the presenceof small-scale, mostly unresolved abyssal hills could significantly enhance the spatial inhomogeneityof tidal mixing, particularly above mid-ocean ridges in the southern hemisphere.
Figure II.4: Fraction (in %) of energy carried by the internal tides generated at small-scale seafloortopography, which is dissipated by wave breaking (from [Lefauve et al., 2015]).
II.4 My research: local dissipation of internal tides via nonlineareffects, catastrophic dissipation via Parametric SubharmonicInstability (PSI)?
II.4.a Dissipation by nonlinear wave-wave interactions
This section is based on the paper
O. Richet, J.-M. Chomaz, C. MullerInternal tide dissipation at topography: triadic resonant instability equatorward and
evanescent waves poleward of the critical latitudeJ. Geophys. Res. - Oceans, 123 (2018).

HDR Caroline Muller, Sept. 2019 13
Beyond the linear evolution of the internal tides investigated in the previous section, vigorousnonlinear interactions can transfer energy from the internal tides into secondary waves. In thissection, we investigate these energy transfers in detail. In the case of internal tides, this transferdepends on latitude in a non trivial way, with a critical latitude where dissipation is maximum (≈30◦ latitude, see figure II.5). This critical latitude corresponds to the latitude where the Coriolisfrequency f matches half the semi-diurnal tidal frequency ω0/2 (without loss of generality, we setthe tidal frequency ω0 > 0 and we place ourselves in the northern hemisphere so that f ≥ 0; thesame applies in the southern hemisphere with |f | = ω0/2). It has thus been suggested that triadicresonant instabilities are responsible for the transfer of energy from the primary internal tide intosmaller-scale secondary waves. More precisely, the parametric subharmonic instability is believedto play a key role.
A triadic resonant instability is an instability leading to energy transfer from a primary wave(frequency ω0, wavenumber vector k0) to secondary waves (with frequencies ω1, ω2 and wavenumbervectors k1, k2) satisfying the resonance condition:
ω0 = ω1 + ω2 (II.2)
k0 = k1 + k2. (II.3)
When both secondary waves have their frequencies equal to ω0/2, we call this specific triadic res-onant instability, the Parametric Subharmonic Instability ([Staquet and Sommeria, 2002, Bourgetet al., 2013, Maurer et al., 2016]). At the critical latitude, where ω0/2 = f , the secondary wavesare near-inertial waves with same frequency ω1 = ω2 = ω0/2 = f . In this study, we investigate indetail the physical process behind this enhanced mixing at the critical latitude, and its link withthe generation of secondary waves.
MethodologyTo that end, we use linear stability analysis and two-dimensional direct numerical simulations withthe model MITgcm, as illustrated in figure II.1. The use of high resolution (dx = 30 m, dz = 10m) allows to resolve waves and overturning, and part of the inertial range. The resolution is notsufficient though to reach dissipative scales, and following [Nikurashin and Legg, 2011] we useslightly enhanced viscosity and diffusivity values (νh = νv = 2 × 10⁻³ m s−1 and κ = 10−4 m s−1
respectively). Results are found to be insensitive to reasonable changes of those values (as long aspart of the inertial range is resolved).
Internal tides are generated by a barotropic flow (at the semi-diurnal frequency ω0) interactingwith an idealized sinusoidal topography. The choice of a simple idealized sinusoidal topographyis motivated by the fact that the dissipation profiles and magnitudes are found to be similar tothose obtained with a realistic topography spectrum, as long as the vertical and horizontal Froudenumbers are the same [Richet et al., 2017]. We therefore use realistic horizontal and vertical Froudenumbers representative of small-scale seafloor bathymetry of the Brazil basin. With this choice,the sensitivity of dissipation to latitude and the physical processes involved in our simulations arerelevant, at least qualitatively, to more realistic conditions representative of the deep ocean in theregion of the Brazil basin. The simulations are repeated at different latitudes, i.e. at differentvalues of the Coriolis frequency f .
Results equatorward of the critical latitudeWe start by analyzing the wave energy frequency distribution as a function of latitude (figureII.6). Equatorward of the critical latitude, we find that dominant frequencies in the domain are ω0,

HDR Caroline Muller, Sept. 2019 14
ω0
latitude29 lat
(a)
(b)
Figure II.5: (a) Numerical simulation of a low vertical mode (i.e. 1/kz comparable to the oceandepth) internal tide at frequency ω0 propagating from low latitudes (blue arrow). Colors show thewave energy dissipation rate at a function of water depth. Enhanced dissipation is seen to occurat a critical latitude of about 30◦ latitude (adapted from [MacKinnon and Winters, 2005]). (b)This enhanced dissipation is confirmed in another set of simulations using the MITgcm for smallscale internal tides (i.e. 1/kz small compared to the ocean depth, simulations similar to the oneshown figure II.1). Shown in black is the wave energy dissipation integrated from 50 m to 2 kmabove the seafloor. Simulations at different Coriolis frequency f , and thus at different latitudes,are performed. Once again enhanced dissipation at the critical latitude is found (adapted from[Nikurashin and Legg, 2011]).
the primary internal tide, but also waves at frequency close to f , i.e., near-inertial waves, and atfrequencies close to (ω0−f). These results suggest that the physical mechanism responsible for theenergy transfer from internal tides to smaller-scale secondary waves is the formation of resonanttriads between the primary internal tide, near-inertial waves and waves at frequencies (ω0 − f).
The growth rate of resonant triadic instabilities as a function of the frequency of secondarywaves ω1 is shown figure II.7. We find that for all f , the growth rate is strictly positive, thusthe dissipation of energy of the primary tidal wave at ω0 is indeed the result of triadic resonantinstabilities. But it does not help explain the leading triad (ω0, f, ω0 − f), as the magnitude of thegrowth rate is not very different (between 1 and 1.5 s−1) for all secondary wave frequencies betweenf and ω0−f , and does not have a maximum at f or ω0−f . We interpret the accumulation of waveenergy at f and ω0−f as being the consequence of the small vertical group velocity of near-inertialwaves. Further analysis of the wave energy spectrum ([Richet et al., 2018]) shows that the leadingorder triad involves downward propagating near-inertial waves and upward propagating waves atfrequency ω0−f , consistent with the accumulation of near-inertial wave energy in the domain nearthe topography.
The enhanced dissipation at the critical latitude can be attributed to changing properties of thesecondary waves as f increases towards ω0/2 (figure II.7). The vertical wavenumber of secondary

HDR Caroline Muller, Sept. 2019 15
Figure II.6: Latitudinal evolution of the kinetic energy density for the leading frequencies in thedomain, including the primary internal tide ω0 (gray dashed), inertial waves f (black plain) andwaves at frequencies (ω0− f) (gray point-dashed) and ω0/2 (black dashed). The vertical purple linematerializes the critical latitude (adapted from [Richet et al., 2018]).
waves increases, yielding smaller and smaller scales more prone to wave breaking and dissipation.The growth rate of the corresponding resonant triad also increases as f approaches the criticallatitude. Both effects lead to enhanced dissipation, consistent with the latitudinal profiles of figureII.5.
Results poleward of the critical latitude
Poleward of the critical latitude, on the other hand, the dominant frequencies in the kinetic energyspectrum (figure II.6) are the primary internal tide at ω0 and evanescent waves at ω0/2 (these areevanescent since ω0/2 < f). This result suggests the transfer of energy to smaller-scale evanescentnear-inertial waves as the dominant physical process leading to the dissipation of the primaryinternal tide poleward of the critical latitude.
Recently, [Young et al., 2008] extended the parametric subharmonic instability poleward of thecritical latitude. In their theory, the dissipation of a primary wave at frequency ω0 = 2f + ε isinvestigated for small positive and negative ε. Briefly, the Boussinesq equations are linearized abouta “pump wave” whose frequency is close to twice the inertial frequency. A multiple-timescales ap-proach yields an amplitude equation describing how this pump wave energizes a vertical continuumof near-inertial oscillations. Qualitatively, in our simulations, the generation of secondary wavesat ω0/2 beyond the critical latitude is consistent with their theoretical expectation. Furthermore,quantitatively, they predict a cut-off latitude beyond which the mechanism halts, correspondingwith our parameter values to f ≈ 0.8, matching the extent of enhanced dissipation (figure II.5b)and ω0/2 secondary waves (figure II.6).
Discussion
Thus, triadic resonant instabilities are found to be a powerful mechanism to extract tidal energy.The increase of energy dissipation from the equator toward the critical latitude is due to increased

HDR Caroline Muller, Sept. 2019 16
0 0.5 1 1.5Secondary wave frequency ω, (s−1)×10-4
0
0.5
1
1.5
Growth
rate
σ,(s
−1)
×10-5(a)
(b) (c)
k z1/k
z0
Figure II.7: (a) Theoretical estimate of the growth rate of resonant triadic instabilities as a functionof the frequency of secondary waves. The computation is performed at different latitudes (i.e.at different values of the Coriolis frequency f). (b) Evolution of the vertical wavenumber of thesecondary wave (normalized by that of the primary wave) as f approaches the critical latitude,for the secondary waves at frequency f , ω0 − f , ω0/2, and frequency of the maximum growth rate(shown with crosses in panel a). (c) Same as panel b but showing the evolution of the growth rateof the corresponding triadic resonant instability (adapted from [Richet et al., 2018]).
instability growth rates, as well as to the smaller and smaller vertical scales of the secondary waves(figure II.7), hence more likely to break and dissipate their energy. Poleward of the critical latitude,the “2f-pump” mechanism described in [Young et al., 2008] seems to be the leading-order mechanismby which internal tides lose energy. In this case, the internal tide transfers energy nonlinearly toevanescent waves at frequencies ω0/2, which dissipate internal tide energy as efficiently as theparametric subharmonic instability equatorward of the critical latitude. In fact, the 2f-pump isan extension of the parametric subharmonic instability poleward of the critical latitude when weconsider near-inertial waves f + ε/2 for small values of ε of both signs. The dissipation polewardof the critical latitude has implications for the possible consumption of Antarctic bottom water.These results suggest that evanescent waves could play a leading-order role in the dissipation oftidal energy in the deep ocean poleward of the critical latitude, and could contribute significantlyto the diapycnal mixing relevant to the large-scale ocean circulation and to water masses.

HDR Caroline Muller, Sept. 2019 17
II.4.b Robustness to a mean current
This section is based on the paperO. Richet, C. Muller, J.-M. Chomaz
Impact of a mean current on the internal tide energy dissipation at the criticallatitude
J. Phys. Oceanog., 47 (2017).
This work investigates the impact of a background mean current on the aforementioned en-hanced dissipation at the critical latitude. Indeed the latter is not clearly confirmed in observations[MacKinnon et al., 2013], which only seem to indicate a modest enhancement at this latitude.For low modes (large-scale waves), the enhanced dissipation found in numerical simulations (figureII.5a) seems to be sensitive to resolution and diffusion, thus potentially explaining this discrepancywith observations. But for the higher modes (smaller scales) discussed in the previous section, theenhanced dissipation (figure II.5b) does not appear to be sensitive to changes in the diffusion orresolution [Nikurashin and Legg, 2011]. Here we investigate whether the presence of a mean currentcould reduce the enhanced dissipation at the critical latitude. Indeed, the ocean is not a quiescentmedium; the presence of large-scale currents or mesoscale eddies can impact the propagation anddissipation of internal tides.
We use high-resolution simulations (figure II.8) similar to the ones used in the previous section,with an additional mean background current αU0, where 0 ≤ α ≤ 1 and U0 is the amplitude of thetidal forcing (figure II.1). The current is only applied above topography, to minimize its impacton the generation of the internal tides at the topography, and instead focus on its impact on thepropagation of those waves.
Figure II.8: Snapshot from a nonlinear high-resolution MITgcm simulation without a mean current(shown is the anomalous horizontal velocity in m s−1). The yellow lines show wave characteristicscomputed from linear wave theory (adapted from [Richet et al., 2017]).
Adding a weak mean current has a major impact on the latitudinal distribution of dissipation.The peak at the critical latitude disappears, and the dissipation is closer to a constant. This disap-pearance results from the Doppler shift of the internal tides frequency (figure II.9), which hindersthe nonlinear transfer of energy to small-scale secondary waves via the parametric subharmonicinstability. The two new weak peaks correspond to the Doppler-shifted critical latitudes of theleft- and right-propagating waves. The results are confirmed in simulations with simple sinusoidaltopography h ∝ sin(ktx), keeping the Froude numbers consistent with realistic deep ocean values.This simple monochromatic topography makes clear the disappearance of the enhanced dissipationat the critical latitude ω0/2, and the appearance of two weaker peaks of dissipation at the Doppler-shifted critical frequencies (ω0 ± U0kt)/2 (figure II.10). Thus, although nonlinear transfers via the

HDR Caroline Muller, Sept. 2019 18
Figure II.9: Same as figure II.8 but with a mean current imposed above topography. The change ofslope of the characteristic lines (yellow lines) helps visualize the Doppler effect on the propagationof the waves (adapted from [Richet et al., 2017]).
parametric subharmonic instability are efficient at dissipating internal tides, the exact location ofthe dissipation is sensitive to large-scale oceanic conditions.
Nonlinearities: catastrophic dissipation via PSI?
With mean current: Doppler shifted max f = (ω� Uk)/2
sinusoidal topography (keeping same Froude) at critical latitudeSnapshots of u(m/s), no mean current Same WITH a mean current
=> no PSI on right-propagating waves
[Richet, Muller, Chomaz 2017]
Without meancurrent: enhanceddissipation at criticallatitude f=ω/2
Figure II.10: Wave energy dissipation in simulations without mean current (blue) and with meancurrent (red) for internal tides generated at sinusoidal topography h ∝ sin(ktx). Without meancurrent, the dissipation integrated from 50 m to 2 km above the seafloor shows a maximum at thecritical latitude ω0/2 consistent with earlier studies (e.g. figure II.5b). With a mean current, thedissipation maxima are weaker and moved to Doppler-shifted latitudes of (ω0 ± U0kt)/2 (adaptedfrom [Richet et al., 2017]).
This suggests that under realistic conditions, where waves are unlikely to propagate througha quiescent ocean, the local dissipation of the internal tide is not a strong function of latitude.The reduced dissipation near the critical latitude implies that more wave energy than previouslythought may propagate away from topography and hence may be available to dissipate in remotelocations. This has implications for the transformation of deep water masses and the abyssalcirculation. Recent estimates of internal waves impact on the overturning circulation point out thelarge uncertainty associated with remote dissipation of tides, which do not dissipate locally neartheir generation site. As mentioned in the introduction, depending on where this dissipation andthe concomitant mixing occur, in particular its vertical structure, such mixing could drive 1 to 28Sv of Antarctic bottom water upwelling [De Lavergne et al., 2016]. More work is desirable to helpbetter constrain estimates of remote internal tide energy propagation and dissipation.

Chapter III
Precipitation extremes and theirresponse to warming
“There was an ocean above us, held in by a thin sac that might rupture and let down a flood at anysecond.”Stephen King
19

HDR Caroline Muller, Sept. 2019 20
III.1 Summary of key results, main collaborations and relevantsupervisions
• Key results: theoretical scaling
In recent decades, there have been important fundamental advances in our understandingof the response of precipitation extremes to warming. GCMs disagree on the amplitude ofthe response of precipitation extremes, especially in the tropics where they largely rely onconvective parameterizations to represent deep cloud dynamics and deep convection [Kharinet al., 2007]. Thus, progress on this question must also rely on observations, theory, and high-resolution numerical simulations which resolve deep convection, instead of parameterizing it.
In [Muller and Takayabu, 2019], a review article invited by the World Climate ResearchProgram, or WCRP, on weather and climate extremes, we review recent advances in ourunderstanding of the response of precipitation extremes to warming from theory and fromidealized cloud-resolving simulations. Notably, a theoretical scaling for precipitation extremeshas been proposed in the past decades, and refined including during my postdoctoral work,allowing to address separately the contributions from the thermodynamics, the dynamics andthe microphysics. In this review, we discuss the theoretical constraints, as well as remaininguncertainties, associated with each of these three contributions to precipitation extremes. No-tably, to leading order, precipitation extremes seem to follow the thermodynamic theoreticalexpectation, i.e. the scaling given by the Clausius-Clapeyron equation. But considerable un-certainty remains regarding the response of the dynamics and of the microphysics to warming.
In [Drobinski et al., 2016a], we use this scaling to analyze the sensitivity of precipitationextremes to temperature using observations and regional modeling in the south of France.The relationship between precipitation extremes and temperature in our current climate hasbeen widely investigated in observations. But difficulties arise when this relationship is ex-trapolated to the relationship between precipitation extremes and temperature changes dueto global warming. Indeed, the response of precipitation extremes to temperature changesdue to climate natural variability is not necessarily the same as the response due to climatechange. In this study, we highlight the importance of strong seasonal effects in the southof France, where strong so-called “Cevenole” events in the fall dominate the precipitationextremes - temperature curve at warm temperatures in our current climate.
In [Drobinski et al., 2016b], this study is extended to the whole Mediterranean region. Wefind that the relationship found in the south of France is robust throughout the Mediterraneanbasin, exhibiting a hook shape with negative slope at high temperatures and a slope followingClausius-Clapeyron scaling at low temperatures. In future climate scenario simulations, thetemperature at which the slope breaks, shifts to higher temperatures by a value which is onaverage the mean regional temperature change due to global warming.
• Key results: impact of organized convection
Convective organization can strongly impact the distribution of precipitation, and a largefraction of precipitation extremes occurs in organized convection.
In [Muller, 2013], we investigate the response of tropical precipitation extremes to a sea-surface temperature increase in a cloud-resolving model with organized convection. Back-ground vertical shear is used to organize the convection into squall lines. The shear is main-

HDR Caroline Muller, Sept. 2019 21
tained throughout the simulations, which are run to radiative-convective equilibrium. Wefind that, despite very different precipitation values with different degrees of convective or-ganizations, the response to warming is similar for a given shear. The highest percentiles ofprecipitation extremes increase at a fractional rate similar to that of surface water vapor.
Convective organization can also arise in the absence of vertical shear, solely due to internalfeedbacks. One such mode of convective organization is convective self-aggregation, which willbe the topic of next chapter (IV). In [Da Silva et al., 2019] (also an article invited by theWorld Climate Research Program on weather and climate extremes) we investigate the impactof convective self-aggregation on precipitation extremes. Precipitation extremes are verysensitive to the degree of convective aggregation, with stronger extremes in the more organizedclimate. When convection is organized, the precipitation is also more localized, leading tomore rainfall accumulation in addition to larger instantaneous rainfall rates. Extreme rainfallintensity, frequency and duration (e.g. instantaneous, hourly or daily extreme rainfall rates)are all important for floods and risks.
• Main collaborations and relevant supervisions
The observational study of the theoretical scaling in the south of France [Drobinski et al.,2016a] and in the Mediterranean region [Drobinski et al., 2016b] was part of a collaborationwith Philippe Drobinski, senior researcher at LMD, and Nicolas Da Silva and BastienAlonzo, who were at the time Masters students under the main supervision Philippe Drobin-ski, project on which I collaborated. Both Nicolas and Bastien then pursued a PhD at LMDwith Philippe Drobinski.
The latest work [Da Silva et al., 2019] was performed as part of a short postdoctoral project(ongoing) by Nicolas Da Silva at the end of his PhD under my supervision, also in collabo-ration with Sara Shamekh, currently doing her PhD at LMD supervised by myself and mycollaborators Fabio D’Andrea and Jean-Philippe Duvel, senior scientists at LMD.
The review on the theoretical scaling [Muller and Takayabu, 2019] is a collaboration withYakari Takayabu senior scientist at the university of Tokyo.
In this chapter, we summarize the key results obtained in these studies, with a particular focus onthe theoretical scaling [Muller and Takayabu, 2019].
We note also that for some aspects of the context and state-of-the-art, we will rely on the chapteron clouds [Muller, 2019] from the book of lecture notes of the graduate school, “Les Houches 2017Summer School: Fundamental Aspects of Turbulent Flows in Climate” - Editors: F. Bouchet, C.Salomon, T. Schneider, A. Venaille.
III.2 Introduction: response of the hydrological cycle to globalwarming
In this section, we address the important question of the response of precipitation extremes toglobal warming. We focus on tropical convection, as tropical precipitation extremes are particularlychallenging for climate models. The “pop-corn” small-scale nature of convection there (comparedthe mid-latitudes where clouds and convection are embedded in large-scale low and high pressurefrontal systems) implies that coarse-resolution GCMs have to rely on convective parameterizationsto represent convective processes in the tropics.

HDR Caroline Muller, Sept. 2019 22
Figure III.1: Mean precipitation climatology (left) and change in mean precipitation with globalwarming (right), illustrating the “rich-get-richer” pattern. High-precipitation regions (tropics andextratropics) have enhanced precipitation, and low-precipitation regions (subtropics) have decreasedprecipitation (after [Muller and O’Gorman, 2011]).
Despite uncertainties in those parameterizations, GCMs robustly predict a pattern of meanprecipitation changes with warming now known as the “rich-get-richet” pattern. Rainy regions(tropics and extratropics figure III.1) become rainier, and regions with little precipitation (sub-tropics figure III.1) receive even less rain. This can be understood via simple thermodynamics[Held and Soden, 2006, Muller and O’Gorman, 2011]. If changes in relative humidity are small,as is the case in climate models, we expect atmospheric water vapor to increase with warmingfollowing the Clausius-Clapeyron equation. Furthermore, if the atmospheric circulation does notchange significantly, to leading order we expect regions with moisture convergence (and thus pre-cipitation) to have increased moisture convergence due to the increased moisture. Similarly, regionswith moisture divergence are expected to have stronger moisture divergence, and hence decreasedprecipitation. (Actually moisture divergence and convergence are linked to precipitation minusevaporation; but the changes in precipitation have considerably more structure than the changesin evaporation, so that the above results on patterns of precipitation changes hold. Note also thatthe large-scale tropical circulation does change, it weakens slightly, see [Held and Soden, 2006] formore details.)
The global mean precipitation does not follow the Clausius-Clapeyron increase though, as itis constrained by global energetics. Atmospheric energy balance implies that the global meanprecipitation must balance the global mean radiative cooling (neglecting changes in the Bowenratio), which increases at a slower rate of about 2% K−1 [Held and Soden, 2006].
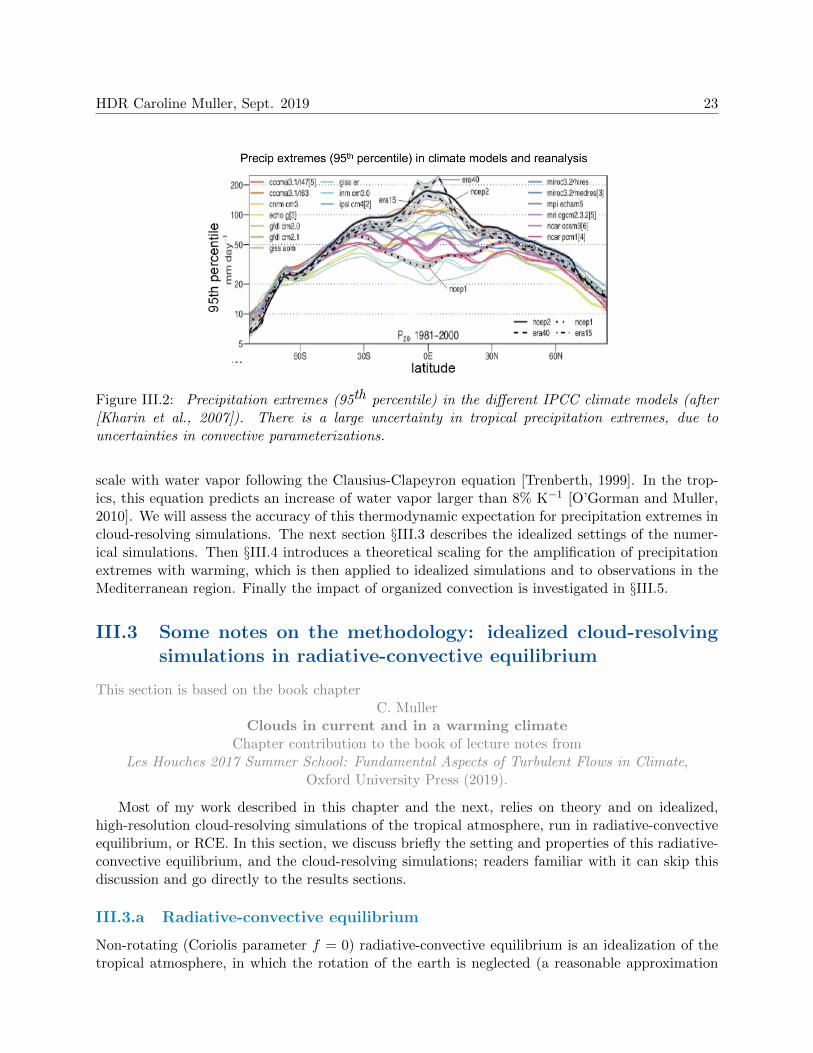
These results for mean precipitation are extremely robust between climate models, and wellunderstood. But large-scale constraints have little direct relevance to precipitation extremes intropical storms, and there is a large uncertainty of precipitation extremes in climate models (figureIII.2, [Kharin et al., 2007]). This uncertainty is largest in the tropics due to uncertainties inconvective parameterizations. Since simulations of tropical precipitation extremes with currentGCMs are unreliable, progress on the problem of changing tropical precipitation extremes mustrely on either theory, observations, or simulations that resolve the convective-scale processes. Herewe will use theory and cloud-resolving simulations to address this question, in disorganized “pop-corn” convection at first, and then assessing the impact of convective organization on the results.
What can we expect for the amplification of precipitation extremes with warming from phys-ical considerations? If the dynamics do not change with warming, precipitation extremes can beexpected to scale with the moisture convergence into deep convective updrafts, which would then
HDR Caroline Muller, Sept. 2019 23
Figure III.2: Precipitation extremes (95th percentile) in the different IPCC climate models (after[Kharin et al., 2007]). There is a large uncertainty in tropical precipitation extremes, due touncertainties in convective parameterizations.
scale with water vapor following the Clausius-Clapeyron equation [Trenberth, 1999]. In the trop-ics, this equation predicts an increase of water vapor larger than 8% K−1 [O’Gorman and Muller,2010]. We will assess the accuracy of this thermodynamic expectation for precipitation extremes incloud-resolving simulations. The next section §III.3 describes the idealized settings of the numer-ical simulations. Then §III.4 introduces a theoretical scaling for the amplification of precipitationextremes with warming, which is then applied to idealized simulations and to observations in theMediterranean region. Finally the impact of organized convection is investigated in §III.5.
III.3 Some notes on the methodology: idealized cloud-resolvingsimulations in radiative-convective equilibrium
This section is based on the book chapterC. Muller
Clouds in current and in a warming climateChapter contribution to the book of lecture notes from
Les Houches 2017 Summer School: Fundamental Aspects of Turbulent Flows in Climate,Oxford University Press (2019).
Most of my work described in this chapter and the next, relies on theory and on idealized,high-resolution cloud-resolving simulations of the tropical atmosphere, run in radiative-convectiveequilibrium, or RCE. In this section, we discuss briefly the setting and properties of this radiative-convective equilibrium, and the cloud-resolving simulations; readers familiar with it can skip thisdiscussion and go directly to the results sections.
III.3.a Radiative-convective equilibrium
Non-rotating (Coriolis parameter f = 0) radiative-convective equilibrium is an idealization of thetropical atmosphere, in which the rotation of the earth is neglected (a reasonable approximation

HDR Caroline Muller, Sept. 2019 24
in the tropics where the Coriolis parameter f is small), and in which the large-scale motion (largerthan the domain) is neglected. Thus there is no import or export of moist-static energy into or outof the domain, and the net atmospheric radiative cooling (top of atmosphere minus surface) mustbalance the input of energy into the atmosphere at the surface, namely latent and sensible heatfluxes.
Over oceans, surface fluxes are largely dominated by the latent heat flux, so that in radiative-convective equilibrium over oceans, the net atmospheric radiative cooling is approximately equal tosurface evaporation. From water conservation, the latter is equal to precipitation. In other words inradiative-convective equilibrium, the net atmospheric radiative cooling is in balance with the latentheating associated with the condensation of water vapor into precipitation by convection. It isthis equilibrium between radiative cooling and convective heating which is referred to as radiative-convective equilibrium. The rest of this section is devoted to describing the fundamental propertiesof the radiative-convective equilibrium in more detail.
Radiative-convective equilibrium is most easily understood by first looking at radiative equilib-rium. Radiative equilibrium is the equilibrium state of the atmosphere and surface in the absenceof non-radiative fluxes. In that case, radiative cooling and heating drive the atmosphere towardsa state of radiative equilibrium. At radiative equilibrium, the incoming shortwave solar heatingπR2S0(1 − a), where R denotes the Earth radius, S0 incoming solar flux, and a albedo, exactlybalances the outgoing longwave radiation 4πR2σT 4
e where σ is the Stefan-Boltzman constant andTe the emission temperature (temperature with which a planet needs to emit in order to achieveenergy balance), yielding:
σT 4e = S0
1− a4
. (III.1)
Figure III.3: Radiative equilibrium without, with one or with two atmospheric levels (three left pan-els). The last panel shows the full calculation of radiative equilibrium (after [Manabe and Strickler,1964]).
In the absence of atmosphere (left panel figure III.3), the surface energy balance implies
σT 4e = σT 4
s = S01− a
4⇒ Ts = Te = 255 K = −18◦ C,
which is much colder that the observed mean surface temperature ≈ 288 K = 15◦ C. This warmersurface temperature is due to the presence of the atmosphere, and can be understood by adding alevel to our simple conceptual model figure III.3. We assume that the atmosphere is transparent tosolar radiation, opaque to infrared radiation, and we assume black-body emission from the surface

HDR Caroline Muller, Sept. 2019 25
and each level (though the computation can easily be extended to account for emissivities smallerthan 1). Energy balance at the surface and level 1 imply
Level 1: 2σT 41 = σT 4
s (III.2)
SFC: σT 4s = σT 4
e + σT 41 , (III.3)
yielding Ts = 21/4Te = 303 K, warmer than before.
If we add an additional atmospheric level (figure III.3),
Level 2: 2σT 42 = σT 4
1 (III.4)
Level 1: 2σT 41 = σT 4
s + σT 42 (III.5)
SFC: σT 4s = σT 4
e + σT 41 , (III.6)
yielding Ts = 31/4Te, even warmer.
The full calculation of radiative equilibrium was done by [Manabe and Strickler, 1964] and yieldsthe temperature profile shown on the right panel of figure III.3. Compared with observations, thisprofile is too hot near the surface, too cold near the tropopause, yielding a lapse rate of temperaturewhich is too large in the troposphere (but the stratosphere temperature is close to the observed).In other words, the radiative equilibrium profile is unstable to moist convection.
The observed temperature profile in the troposphere is closer to a radiative-convective equilib-rium profile. Physically, what happens is that radiation destabilizes the atmosphere by cooling theinterior of the troposphere, thus making the lapse rate steeper. But the radiation time scale ≈ tensof days is much slower than the convective adjustment time scale ≈ minutes for dry and hours formoist convection. Thus in the competition between radiation and convection, convection “wins”,and the observed state is much closer to convective neutrality than to radiative equilibrium. Inother words, the vertical temperature profile is close to neutral to dry convection below the liftedcondensation level (i.e. on a dry adiabat: θ = constant), and close to neutral to moist convection
above (i.e. on a moist adiabat: θe = constant). Here θ = T (p/p0)R/cp denotes potential temper-
ature, variable conserved in dry adiabatic motion, and θe = θ exp (Lvq/(cpT )) denotes equivalentpotential temperature, variable (approximately) conserved in moist adiabatic motion (p0 denotesa constant reference pressure, R the gas constant, cp isobaric heat capacity, Lv latent heat of va-porization, and q specific humidity of water vapor; see [Emanuel, 1994, Muller, 2019] for moredetails).
III.3.b Cloud-resolving simulations
Cloud-resolving models, or CRMs, are models with fine, kilometer-scale resolution, i.e. simulationswith sufficiently high spatial resolution to explicitly resolve the deep convection and deep clouds,instead of parameterizing them. The cloud-resolving model used in most of my work is the Systemfor Atmospheric Modeling, or SAM, see [Khairoutdinov and Randall, 2003] for more details. Briefly,this model solves the anelastic momentum, continuity and scalar conservation equations.
In my work, it is typically run with fixed sea-surface temperature (close to current tropicalvalues, 300 K), on a square domain with doubly periodic geometry. The horizontal resolution ison the order of one or a few kilometers, in order to resolve deep cloud processes. The domainsize varies from tens to a few hundreds of kilometers, with larger domains aimed at allowing themesoscale organization of convection (notably in chapter IV). The vertical resolution is finer, tens

HDR Caroline Muller, Sept. 2019 26
of meters in the low troposphere increasing to 500 m in the mid-troposphere. A sponge layer isadded in the upper third of the domain (18 km to 27 km altitude) in order to absorb gravity waveswhich would otherwise unrealistically fill the domain (see e.g. [Muller and Bony, 2015] for moredetails).
In simulations of radiative-convective equilibrium, illustrated in figure III.4, convection is some-what randomly distributed in space, resembling “pop-corn” convection. Such simulations are oc-casionally referred to as disorganized radiative-convective equilibrium, in contrast with simulationswhere the convection becomes spatially organized (which will be discussed e.g. in §III.5 and chapterIV).
Figure III.4: Illustration of the cloud-resolving simulations used in chapters III and IV. Shownin gray are isosurfaces of condensates indicating clouds, and colors show near-surface tempera-ture (first atmospheric level temperature). The cloud-resolving model used is SAM [Khairoutdinovand Randall, 2003], typically run here in homogeneous, unforced conditions. Such models reachradiative-convective equilibrium in a few tens of days. In this equilibrium, radiative cooling is inbalance with convective heating, and convection is somewhat randomly distributed, resembling “pop-corn” convection, also referred to as disorganized convection (animation available on my websitehttp://www.lmd.ens.fr/muller/).
III.4 My research: theoretical scaling for the amplification of pre-cipitation extremes with warming
This section is based on the paper
C. Muller, Y. TakayabuResponse of precipitation extremes to warming: what have we learned from theory
and idealized cloud-resolving simulations?Environ. Res. Lett., to be submitted (2019).
III.4.a Theoretical scaling
Theory and high-resolution simulations have helped clarify the physics relevant to the change ofprecipitation extremes with warming temperatures. Notably, a theoretical scaling for precipitationextremes has been introduced [Betts and Harshvardhan, 1987, O’Gorman and Schneider, 2009] andrefined to account for microphysics [Muller et al., 2011]. It relates the changes of precipitationextremes to three contributions: a thermodynamic contribution related to water vapor, a dynamic

HDR Caroline Muller, Sept. 2019 27
contribution related to vertical mass flux in extreme updrafts, and a microphysic contributionrelated to precipitation efficiency. The latter is defined as the fraction of the condensation ina convective updraft which eventually reaches the surface as precipitation. It is typically lessthan one as some of the condensates are either advected away as clouds, or evaporate as theyprecipitate through unsaturated air below the cloud before reaching the surface. Each of thesethree contributions is subject to different theoretical constraints, and may respond differently towarming.
In this section, we provide a brief overview of the origin of this theoretical scaling. It can bederived from energetics, or from the water budget. We will review the former approach, and itslink to the water budget. We focus on tropical precipitation extremes, where the disagreementbetween GCMs is largest (figure III.2), due to the small-scale nature of tropical convection. Thefocus on tropical precipitation extremes is also motivated by the fact that it allows comparison withcloud-resolving simulations in non-rotating radiative-convective equilibrium. As we will see, suchidealized simulations have proven extremely useful in improving our understanding of the physicalprocesses at stake.
Derivation of the scaling
A scaling for precipitation extremes can be derived from energetics, using the vertically-integrateddry static energy budget [Muller et al., 2011]. An energy rather than a water budget is used becausean energy budget allows to more easily define a thermodynamic component (no dependence onrelative humidity), and because the weak horizontal temperature gradients in the tropics allow toeliminate the horizontal advection terms. Following [Muller et al., 2011], we use the thermodynamicformulation consistent with the cloud-resolving model SAM (see [Khairoutdinov and Randall, 2003]for a detailed description), and using standard notations this budget becomes:∫
Ds
Dtρ dz = Lv
∫D(qr + qc)
Dtρ dz + Ls
∫D(qs + qg + qi)
Dtρ dz + LvP (III.7)
where s = cpT +gz denotes dry static energy, ρ(z) the mean density profile, P surface precipitation(only involving the liquid phase at typical tropical temperatures) and qr, qc, qs, qg, qi denote themixing ratios of respectively liquid rain, liquid cloud condensates, snow, graupel and cloud ice (thefive species are all the water condensates in SAM). The Lagrangian derivative is given by
D
Dt=
∂
∂t+ ui
∂
∂xi(III.8)
with ui resolved wind speed along the xi direction, 1 ≤ i ≤ 3 (note that the total vertical fluxof condensates includes both the resolved vertical velocity, included in the D/Dt term, and theterminal fall speed of hydrometeors, included in the precipitation term, see [Khairoutdinov andRandall, 2003] for details). The mass weighted integral
∫(...)ρ dz is taken from the surface to the
tropopause.
Note that this is a pointwise energy budget, i.e. at small, convective scales. So the terms aremeant to be evaluated at locations and times of extreme rainfall. The subgrid-scale fluxes andradiative cooling contributions have been neglected in this dry static energy budget, anticipatingthat those terms are negligible compared to the latent heat terms at times and locations of extremerainfall.
Also, at times of extremes, the time rate of change of dry static energy is largely dominated by

HDR Caroline Muller, Sept. 2019 28
the vertical advection (due to both strong updrafts and weak horizontal temperature gradients):
Ds
Dt≈ w∂s
∂z.
If we further neglect the difference between Lv and Ls for the purpose of deriving a simple ap-proximate expression, and if we assume that the tropical atmosphere is close to a moist adiabatds ≈ −Lvdqsat where qsat denotes saturation mixing ratio, then
∂s
∂z≈ −Lv
∂qsat∂z
,
and (III.7) becomes
Pe ≈∫ρw
(−∂qsat
∂z
)dz −
∫ρD(qr + qc + qs + qg + qi)
Dtdz, (III.9)
where the subscript e stands for extremes.This yields the following scaling for precipitation extremes
Pe = ε
∫ρw
(−∂qsat
∂z
)dz, (III.10)
where ε denotes a precipitation efficiency. Although this scaling has been derived from energetics, itresembles a water budget and can be interpreted as such. The first integral on the right hand side of(III.9) represents the total net condensation (and deposition) in the updraft (assumed saturated),including condensation from upward motion as well as evaporation of condensates maintaining amoist adiabat in downdrafts. A fraction ε of this net condensation reaches the surface as precip-itation, thus we refer to ε as precipitation efficiency. In the limit ε = 1, all the net condensatesprecipitate out; in the limit ε = 0, all condensates are advected from or accumulate in the columnover the time scaling in question (second term on the right hand side of (III.9)).
As mentioned earlier, this is a pointwise scaling, i.e. meant to be evaluated at times andlocations of precipitation extremes. One worry then is the potential sensitivity to spatial andtemporal averaging. [Muller et al., 2011] investigate hourly versus daily precipitation extremes(their figure 4, see also figure III.6 below), as well as coarse grained results (from 2km to 24 kmhorizontal extent, their figure 6). The results are extremely robust and the scaling shows excellentagreement with precipitation extremes amplification with warming in all cases. Therefore, althoughthe value of precipitation extremes is sensitive to spatial/temporal averaging, its amplification withwarming seems to be robust and to be well captured by this scaling, at least in idealized radiative-convective equilibrium simulations, as will be discussed in more detail in the next section.
As it involves net condensation (condensation minus evaporation), ε differs slightly from theconventional precipitation efficiency defined as the fraction of total condensation reaching the sur-face as precipitation. Alternatively, if the integration in (III.10) is limited to heights where w > 0as is sometimes the case in the literature, then ε represents the conventional precipitation efficiency.
We note that similar scalings were derived prior to [Muller et al., 2011] for precipitation ex-tremes [Betts and Harshvardhan, 1987, Iribarne and Godson, 1981, O’Gorman and Schneider,2009, Sugiyama et al., 2010], except that in (III.10) w is now at the convective scale, and there isthe additional factor involving precipitation efficiency. We also note that in pressure coordinates,the scaling becomes
Pe = −ε∫ω∂qsat∂p
dp
g(III.11)

HDR Caroline Muller, Sept. 2019 29
where ω denotes pressure vertical velocity (in hPa s−1). In the extratropics, where the atmosphereis not necessarily on a moist adiabat, the scaling can still be extended, replacing the verticalderivative by a derivative along a moist adiabat, i.e. with constant saturation equivalent potentialtemperature θe,sat [O’Gorman, 2015, O’Gorman and Schneider, 2009]
∂qsat∂p
∣∣∣∣θe,sat
. (III.12)
Using the scaling to split precipitation extremes into three contributions
The scaling in (III.10) can be used to relate changes of precipitation extremes, to changes ofthe dynamics through the mass flux ρw, of the thermodynamics through ∂qsat/∂z, and of themicrophysics through ε
δPePe
≈δ(ε∫ρw
(−∂qsat
∂z
)dz)
ε∫ρw
(−∂qsat
∂z
)dz︸ ︷︷ ︸
scaling
(III.13)
≈ δε
ε︸︷︷︸microphysic
+
∫δ(ρw)
(−∂qsat
∂z
)dz∫
ρw(−∂qsat
∂z
)dz︸ ︷︷ ︸
dynamic
+
∫ρw δ
(−∂qsat
∂z
)dz∫
ρw(−∂qsat
∂z
)dz︸ ︷︷ ︸
thermodynamic
, (III.14)
where δ denotes a difference between a warm and a cold climate, and following [Muller, 2013, Mulleret al., 2011] we neglected second-order terms.
Assuming that changes in precipitation efficiency are small with warming, changes in precip-itation extremes can be related to changes in the dynamics and in the thermodynamics (secondand third terms on the right hand side of (III.14)). This simple scaling is found to be in verygood agreement with cloud-resolving simulations in non-rotating radiative-convective equilibrium,as discussed in more detail in the next section.
III.4.b Comparison with cloud-resolving simulations
Numerical results
As mentioned in the introduction of this chapter, if the dynamics do not change with warming, pre-cipitation extremes can be expected to increase with warming following water vapor, thus at a ratelarger than 8% K−1 in the tropics. We will assess the accuracy of this thermodynamic expectationfor precipitation extremes in cloud-resolving simulations, addressing the following questions:
• By how much do precipitation extremes increase with warming?
• How does it compare with the change in water vapor?
• How do vertical velocities in updrafts change, and how does it impact precipitation extremes?
• Can we use the theoretical scaling derived in the previous section to relate changes in precip-itation extremes to mean quantities?

HDR Caroline Muller, Sept. 2019 30
The cloud-resolving model used here is SAM [Khairoutdinov and Randall, 2003]. Two simula-tions are performed, one with a sea-surface temperature of 300 K and another warmer simulationwith a sea-surface temperature of 305 K. The radiative cooling profiles are imposed but are differentfor the two sea-surface temperatures, computed from short small-domain runs with the correspond-ing sea-surface temperatures (see [Muller et al., 2011] for more details). A weak background verticalshear is added, with horizontal wind decreasing from 5 m s−1 at low levels to zero at upper levelsin the x direction. Note that this shear is too deep and too weak to generate a squall line, so thatconvection resembles somewhat randomly distributed pop-corn convection in these simulations.
Figure III.5: Composites in y (left) and x (right) directions around the location of extreme precipi-tation (placed at the origin). The top panels show non-precipitating condensates, the middle panelsvertical velocity, and the bottom panels precipitation (after [Muller et al., 2011]).
Figure III.5 shows composites around the location of extreme precipitation. We see that, asexpected, precipitation is strongest in the dissipating stage of a cloud life cycle, as indicated by thedowndrafts seen below the cloud. Also, as expected, there is preferred upward motion and cloudformation in the direction upshear (see §IV.2.b for more on shear-convection interactions). Theextremes, i.e. high percentiles, of daily precipitation are shown in the left panel of figure III.6.We see that for a given percentile, the corresponding rainfall rate is always larger in the warmersimulation. Consistently, the ratio between the precipitation in the warm and in the cold runs isabove 1. This ratio is shown in the middle panel for daily precipitation, and in the right panel forhourly precipitation. Although the values of precipitation extremes are sensitive to the temporal

HDR Caroline Muller, Sept. 2019 31
average, the ratio is not. In other words, the fractional increase in precipitation extremes is robustto the time scale used. The fractional increase in precipitation extremes is found to asymptote atthe highest percentiles, to ≈ 7 % K−1.
Figure III.6: Values of daily precipitation extremes (i.e. high percentiles, left panel) in the cold(blue) and warm (red) simulations. The ratio between the warm and cold rainfall rates is shownin the middle panel. Similar results are obtained at hourly time scales (right panel, after [Mulleret al., 2011]).
Figure III.7: Increase in high percentiles (black curve) of hourly mean precipitation when thesea-surface temperature is increased from 300 K to 305 K in cloud-resolving simulations, and com-parison with the theoretical scaling (III.14) (blue curve) involving a dynamic and a thermodynamiccontribution. The increase in atmospheric water vapor (wv) and low-tropospheric water vapor (wvsfc) are also shown. The amplification of extremes asymptotes ≈ 7% K−1 at the highest percentiles(ratio of about 1.35, red line, for a 5 K warming, figure after [Muller et al., 2011]).
From figure III.7, this increase is remarkably well captured by the scaling (III.13) neglectingchanges in precipitation efficiency (i.e. only accounting for the thermodynamic and dynamic con-tributions). To first order, the amplification of precipitation extremes is well captured by thethermodynamic scaling, which is close to the low-level water vapor increase, and smaller than theatmospheric water vapor increase. The dynamics play a secondary role, and tend to oppose theamplification of extreme rainfall rates with warming.

HDR Caroline Muller, Sept. 2019 32
Simplified scaling and thermodynamic contributionIf the dynamics of convective updrafts do not change with warming, the thermodynamic con-tribution to precipitation extremes could be expected to scale with the moisture convergenceinto deep convective updrafts, which would then scale with water vapor following the Clausius-Clapeyron equation (assuming small changes in relative humidity). But these numerical resultssuggest that we can instead expect tropical precipitation extremes to follow the low-level watervapor, which increases at a smaller pace than atmospheric water vapor (following boundary-layerClausius-Clapeyron).
The fact that precipitation extremes follow low-tropospheric humidity, and not atmospherichumidity, can be understood using a simplified scaling derived from (III.10) [Muller, 2013]. If weassume that ρw at 500 hPa is a representative value for ρw:
δPe ≈ δ
(∫−∂qsat
∂zwρdz
)(III.15)
≈ δ
((wρ)500hPa
∫−∂qsat
∂zdz
)(III.16)
≈ δ ((wρ)500hPa qsat,BL)︸ ︷︷ ︸simplified scaling
, (III.17)
where qsat,BL denotes the saturation specific humidity in the boundary layer. If changes in relativehumidity are small, the thermodynamic contribution to precipitation extremes is thus expected tofollow low-tropospheric water vapor.
Some remarks and implicationsSimilar increases in precipitation extremes, close to low-tropospheric moisture, have been found inanother study using a different cloud-resolving model [Romps, 2011], thus these results seem to berobust to the model used. In the tropics, GCMs predict an increase of water vapor larger than 8%K−1 [O’Gorman and Muller, 2010]. If instead precipitation extremes follow low-tropospheric watervapor, the rate of increase is significantly reduced, to less than 6% K−1 [O’Gorman and Muller,2010]. Thus to leading order, at least within the limits of these idealized simulations, precipitationextremes follow this low-tropospheric thermodynamic expectation, consistent with the simplifiedscaling introduced above.
The dynamics, via increased vertical mass flux in extreme updrafts, and the microphysics, viaincreased precipitation efficiency, can further amplify the response of precipitation extremes towarming. But without a complete theory for the dynamical and microphysical changes with warm-ing, we can not properly attribute causes for the corresponding contributions to extreme rainfallrates. More work is desirable in particular to clarify the relative roles of convective entrainment[Singh and O’Gorman, 2013], hydrometeor fall speeds [Parodi and Emanuel, 2009] and atmosphericstability [Attema et al., 2014] on the dynamics, as well as the role of cloud-rain autoconversion andrain evaporation [Lutsko and Cronin, 2018] on the microphysics (see also [Muller and Takayabu,2019] for a more in-depth discussion).
A few studies have found amplification of precipitation extremes exceeding significantly thethermodynamic theoretical expectation, when the warming is uniform in height. In the tropics,one expects the atmosphere to warm following a moist adiabat, with larger warming aloft, as wasthe case in the cloud-resolving simulations discussed above. If instead the warming is uniform withheight, a situation more relevant to the mid latitudes, atmospheric instability is enhanced [Lori-aux et al., 2013]. Consistently, faster updrafts contribute positively to the dynamic contribution,

HDR Caroline Muller, Sept. 2019 33
yielding a larger amplification of precipitation extremes with warming than the thermodynamiccontribution would entail [Attema et al., 2014, Singleton and Toumi, 2013]. We note though thatthe link between stability and precipitation extremes is not necessarily straightforward. Differ-ences in atmospheric stability may result in differences in convection, but extremes in precipitationintensity do not necessarily follow the atmospheric stability [Hamada et al., 2015]. Changes in at-mospheric stability associated with sub-daily extreme precipitation events, and the correspondingdynamic contribution to precipitation extremes, deserve more investigation.
Note also that a large uncertainty regarding tropical precipitation extremes and their responseto warming, is related to convective organization and its response to warming. This is the topic of§ III.5 and of the next chapter.
III.4.c Beyond idealized simulations: scaling applied to observations in theMediterranean region
This section is based on the papers
P. Drobinski, N. Da Silva, G. Panthou, S. Bastin, C. Muller, B. Ahrens, M. Borga, D. Conte, G.Fosser, F. Giorgi, I. Guttler, V. Kotroni, L. Li, E. Morin, B. Onol, P. Quintana-Segui, R. Romera
T. Csaba ZsoltScaling precipitation extremes with temperature in the Mediterranean: past climate
assessment and projection in anthropogenic scenariosClim. Dyn. (2016).
P. Drobinski, B. Alonzo, S. Bastin, N. Da Silva, C. MullerScaling of precipitation extremes with temperature in the French Mediterranean
region: what explains the hook shape?J. Geophys. Res. - Atmospheres, 121 (2016).
In earlier sections, within the limit of our idealized simulations over tropical oceans, we find thatthe thermodynamic contribution dominates the response of precipitation extremes to warming, withprecipitation extremes increasing at a rate of about 6-7% K−1 following the low-tropospheric hu-midity. But regional specificity, including orography and/or weak moisture advection from oceans,can enhance the dynamic contribution to precipitation extremes, or weaken the thermodynamiccontribution. Notably in the south of France, strong seasonal events yield extreme rainfall rates inthe fall. These events are known as evenements Cevenoles.
We quantified, using observations and regional simulations, the dynamic and thermodynamiccontributions to extreme precipitation in the south of France. We also analyzed their sensitivityto temperature [Drobinski et al., 2016a]. This allowed us to link precipitation extremes withthe intense dynamical convective events of this region in the fall. The precipitation extremes -temperature relationship is found to have a hook shape, with positive slopes at cold temperaturesconsistent with Clausius-Clapeyron scaling, and negative slope at warm temperatures.
We further analyzed the implications of these results for the response of precipitation extremesto warming in the whole Mediterranean region [Drobinski et al., 2016b], confirming the hook shapedrelationship between precipitation extremes and temperature, with positive slopes at cold temper-atures and negative slope at warm temperatures. In future climate scenario simulations coveringthe 2070-2100 period, the temperature at which the slope breaks, shifts to higher temperatures by

HDR Caroline Muller, Sept. 2019 34
a value which is on average the mean regional temperature change due to global warming. Overall,models predict more intense precipitation extremes in the future.
III.5 My research: impact of convective organization and out-standing open questions
III.5.a Impact of convective organization on the amplification of precipitationextremes with warming
This section is based on the paper
C. MullerImpact of convective organization on the response of tropical precipitation extremes
to warmingJ. Climate, 26 (2013).
Convective organization is ubiquitous in the tropics, and is associated with extreme weatherand strong rainfall rates (as discussed in more detail in the next chapter devoted to convectiveorganization, see for instance §IV.2). A natural question then is how precipitation extremes inorganized convection can be expected to change with warming. In this section, we assess theimpact of organization on the results of the previous section, addressing the following questions:
• How do precipitation extremes in organized systems respond to warming?
• How sensitive is the amplification of precipitation extremes with warming to the degree oforganization?
To that end, we use vertical wind shear to organize the convection into squall lines, usingthe three simulations illustrated in the right panels of figure IV.3: no shear, critical shear, andsupercritical shear. We perform simulations at a control sea-surface temperature value of 300 K,and a warmer simulation at 302 K (see [Muller, 2013] for details). Figure III.8 shows the highpercentiles of precipitation in the various simulations, at cold and warm temperatures. As before,precipitation extremes are found to increase with warming, by about 6-7% K−1.
We also see that for a given temperature, precipitation extremes are sensitive to vertical shearand almost double in the presence of shear, but increasing the shear from critical to supercriticalshear has very little effect on the rainfall rates. This may not be too surprising since in thesupercritical case the squall lines orient themselves so that the line-perpendicular component ofthe shear is critical. Therefore, one would expect rainfall rates similar to the ones obtained withcritical shear as long as the shear is above critical. We will return to this question of the impactof convective organization on precipitation extremes in the next section §III.5.b, but here insteadfocus on the impact of warming on precipitation extremes, for a given degree of organization.
What is perhaps more surprising is that despite very different organizations, the amplificationof precipitation extremes with warming is similar for all shears, though it is slightly larger in thesupercritical shear simulation. This behavior is again well captured by the scaling in equation(III.10), as shown in figure III.9. As before, to leading order, the increase in precipitation ex-tremes is determined by the thermodynamic contribution, and dynamics play a secondary role.But interestingly, the dynamic contribution is not robust to the shear: no shear or critical shearyield a negative contribution, opposing the amplification of precipitation extremes with warming.

HDR Caroline Muller, Sept. 2019 35
Figure III.8: Increase in high percentiles of precipitation, in simulations with different shearstrengths (after [Muller, 2013]).
But supercritical shear yields a positive dynamic contribution, which explains the slightly strongerincrease of precipitation extremes in that case. As in the previous section, the amplification ofprecipitation extremes is found to be closer to low-tropospheric humidity increase than to atmo-spheric humidity increase (not shown). These results thus confirm the conclusions of the previoussection, the only difference being the dynamic contribution which can become positive in the pres-ence of strong shear. The fact that precipitation extremes follow low-tropospheric humidity, andnot atmospheric humidity, is again consistent with the simplified scaling (III.17).
Figure III.9: Increase in high percentiles of precipitation, and comparison with the theoreticalscaling involving a dynamic and a thermodynamic contribution, in simulations with different shearstrengths (after [Muller, 2013]).
The dynamic contribution deserves further investigation, as it is the contribution which issensitive to the shear and thus the organization. Figure III.10 shows the vertical profiles of ρwand of w in the various simulations. We see that the decrease in vertical mass fluxes with warming

HDR Caroline Muller, Sept. 2019 36
at critical and zero shear, is not observed with supercritical shear. Figure III.10 also shows thatthe decrease in convective mass flux occurs despite an increase in the maximum updraft velocity(bottom panels). The former is more relevant to precipitation extremes.
Figure III.10: Change in vertical velocity and vertical mass flux with warming for the differentshears. Despite an increase in vertical velocity, the mass flux decreases with warming (except forthe supercritical shear in red). The latter is more relevant to precipitation extremes, explaining thenegative dynamic contribution except with the strongest shear (figure III.9, after [Muller, 2013]).
III.5.b Discussion and outstanding open questions
This section is based on the paper
N. Da Silva, S. Shamekh, C. MullerImpact of convective self-aggregation on precipitation extremes
Environ. Res. Lett., in preparation (2019).
Note that a large uncertainty regarding tropical precipitation extremes and their response towarming, is related to convective organization and its response to warming. Indeed, in the previoussection we investigated the increase of precipitation extremes with warming for a given degree oforganization. But figure III.8 implies that a change in the degree of organization can lead to up toa doubling of extreme rainfall rates, while, for a given degree of organization precipitation extremesincrease at about 7% K−1 of warming. Thus the increase of precipitation extremes from a changein convective organization is larger than that associated with warming by several degrees.
In recent work [Da Silva et al., 2019], we investigate the impact of convective self-aggregationon precipitation extremes. Self-aggregation is a particular mode of convective organization due

HDR Caroline Muller, Sept. 2019 37
to internal feedbacks (discussed in more detail in the next chapter). We find that when the at-mosphere is more organized into a moist convecting region, and a dry convection-free region, themoister environment of deep convective updrafts, enhances the thermodynamic contribution aswell as the microphysic contribution through larger precipitation efficiency (partly due to reducedevaporation of rain falling through a moister near-cloud environment). The dynamics and durationof precipitating events are also affected, thus the amplification of precipitation extremes could belarger than the thermodynamic theoretical expectation. Our results are qualitatively consistentwith recent results from [Bao and Sherwood, 2019], using a different model WRF, who find thatextreme instantaneous precipitation is more sensitive to microphysical processes while extreme dailyprecipitation is more linked to the degree of aggregation.
A recent observational study [Tan et al., 2015] finds that recent trends in tropical precipitationcan be linked to changes in the frequency of occurrence of organized mesoscale cloud systems.Improved fundamental understanding of convective organization and its sensitivity to warming ishence an area of priority for climate model development to achieve accurate rainfall projections ina warming climate. It is the topic of the next chapter.

HDR Caroline Muller, Sept. 2019 38

Chapter IV
Self-aggregation of tropical deepconvection, and implications
“Clouds suit my mood just fine.”Marie Lu (born Xiwei Lu)
39

HDR Caroline Muller, Sept. 2019 40
IV.1 Summary of key results, main collaborations and relevantsupervisions
• Key results: physical processes responsible for self-aggregation
Self-aggregation refers to the spectacular ability of deep clouds to spontaneously cluster inmodels despite homogeneous boundary conditions and forcing (figure IV.5). More generally,the spatial organization of deep convection at mesoscales, i.e. hundreds of kilometers, isubiquitous in the tropics. Convective organization can be forced by the large scales (largescales refer to scales similar or larger than mesoscale), for instance vertical wind shear orland-ocean contrasts. But organization can also arise from internal feedbacks linked to theinteraction of clouds with their environment. This can lead to the spontaneous inhomogeneousspatial clustering of clouds in otherwise homogeneous unforced environments, e.g. by internal”self-aggregation” feedbacks, still very much an area of active research. This is the topic ofthis chapter.
In [Holloway et al., 2017], we review the observational evidence that have analyzed obser-vations to look specifically for processes related to self-aggregation in models, and motivatethe need for more of this work. Indeed, despite its robust appearance in a hierarchy of models,the relevance of self-aggregation to the real tropics is still debated. Notably, self-aggregationis typically studied in highly idealized settings, including uniform, spatially and temporallyconstant sea-surface temperature.
In [Muller and Bony, 2015], using idealized simulations with homogeneous sea-surface tem-perature, we identify radiative longwave feedbacks as being the diabatic feedback responsiblefor the self-aggregation of convection in cloud-resolving simulations. More precisely, sufficientspatial variability of radiative cooling rates yields a low-level circulation, which induces theupgradient energy transport and radiative-convective instability. In this paper, we also inves-tigate a moisture-memory feedback capable of aggregating convection, even in the absence ofdiabatic feedbacks, when the evaporation of rain in the subcloud layer is suppressed.
This expertise on self-aggregation, along with my earlier postdoctoral work on this topic, ledto the invitation to participate in two review articles: one [Wing et al., 2017] reviewingthe self-aggregation of deep convection in idealized simulations, and one [Zuidema et al.,2017] reviewing the properties of cold pools below precipitating clouds over oceans, andcomparing them with radiatively-driven dry pools, believed to play a crucial role in the onsetof self-aggregation.
• Key results: implications for ocean eddies - convection interaction, and for tropical cyclogen-esis
As mentioned above, most studies on self-aggregation focused on idealized simulations, inparticular radiative-convective equilibrium with homogeneous sea-surface temperature andneglecting Earth’s rotation. These two aspects are addressed here.
In [Shamekh et al., 2019], we investigate the impact of sea-surface temperature inho-mogeneities on self-aggregation. More precisely, we analyze how a circular hot-spot helpsorganize convection, and how self-aggregation feedbacks modulate this organization. Thehot-spot significantly accelerates aggregation, particularly for warmer/larger hot-spots, andextends the range of domain-mean sea-surface temperatures for which aggregation occurs.

HDR Caroline Muller, Sept. 2019 41
This is because convection over the hot-spot brings the atmosphere towards a warmer moistadiabat, consistent with the hot-spot warmer temperatures. The warmer temperatures areimprinted over the whole domain by gravity waves and subsidence warming. This initial tran-sient warming and concomitant subsidence drying suppress convection outside the hot-spot,thus favoring the aggregation of convection and moisture over the hot-spot.
In [Muller and Romps, 2018], we investigate the impact of the background planetaryrotation on self-aggregation and tropical cyclogenesis. Although the prediction of tropicalcyclone tracks has improved in recent years, understanding the mechanisms responsible forthe genesis and intensification of tropical cyclones remains a major scientific challenge. Weshow that self-aggregation plays a leading-order role in the genesis of tropical cyclones incloud-resolving simulations. This suggests that self-aggregation, and the framework developedfor its study, could help shed more light into the physical processes leading to cyclogenesisand cyclone intensification. This study adds to the growing literature on the importance ofthis phenomenon for the tropical atmosphere.
• Main collaborations and relevant supervisions
The hot-spot study [Shamekh et al., 2019] was performed by Sara Shamekh during herPhD at LMD (ongoing), supervised by myself and my collaborators Fabio D’Andrea andJean-Philippe Duvel, senior scientists at LMD.
The process study [Muller and Bony, 2015] resulted from a collaboration with SandrineBony, senior scientist at LMD, and the cyclogenesis study [Muller and Romps, 2018] resultedfrom a collaboration with David Romps, professor at UC Berkely.
The two invited review articles [Wing et al., 2017] and [Zuidema et al., 2017], as well asthe observational paper [Holloway et al., 2017], resulted from a workshop organized by theWorld Climate Research Program on the Grand Challenge “Clouds, Circulation, and ClimateSensitivity”. It is thus the result of a wide international effort (lead organizers for thisGrand Challenge workshop include Sandrine Bony, LMD/IPSL, Robert Pincus, ColoradoUniversity, Bjorn Stevens, Max Planck Institute, David Winker, NASA LRC, Anny Cazenave,ISSI Bern, and Nicolas Champollion, ISSI Bern).
In this chapter, we summarize the key results obtained in these studies, with a particular focus onthe cyclogenesis study [Muller and Romps, 2018].
IV.2 Introduction: basics of mesoscale convective organization
This section is based on the book chapter
C. MullerClouds in current and in a warming climate
Chapter contribution to the book of lecture notes fromLes Houches 2017 Summer School: Fundamental Aspects of Turbulent Flows in Climate,
Oxford University Press (2019).

HDR Caroline Muller, Sept. 2019 42
IV.2.a Definition
Organized convection refers to convection that is long-lived, i.e. that lasts longer than an individualconvective cell (which typically lasts a few hours, < 3 hours), and that grows upscale, i.e. thatcovers an area larger than an individual convective cell (which typically is < 10 km across). Itis well known that clouds often organize at large, planetary and synoptic scales, where they aretightly coupled to the large-scale circulation. In the tropics, there is a clear correlation betweencloud fraction and large-scale upward motion, with deep convection in the intertropical convergencezone, or ITCZ, which corresponds to the rising branch of the Hadley cell (e.g., [Muller, 2019]).Clouds are also embedded within the Walker cell, with deep convection occurring above the warmwaters of the warm pool, corresponding to the rising branch of the Walker cell. At synoptic scale,it is tightly linked to equatorial waves [Wheeler and Kiladis, 1999] (see e.g. the impact on outgoinglongwave radiation of Kelvin waves and equatorial Rossby waves on figure IV.1, as well as that ofthe Madden-Julian Oscillation).
It is also apparent from figure IV.1 that clouds often organize at smaller, mesoscales (hundredsof kilometers), into what are called mesoscale convective systems. The formation of such systemsis still an active area of research, with important societal impacts, as it is associated with extremeweather and strong precipitation. It also has strong climatic impacts, as it affects the large-scaleatmospheric radiation budget, by affecting cloud cover and the large-scale thermodynamic profiles(temperature and humidity, [Bony et al., 2015]). In this chapter, we investigate the mesoscaleorganization of deep convective clouds in the tropics, and review here the basics of mesoscaleconvective organization and the physical processes involved. We then discuss in more detail arecently discovered phenomenon in idealized simulations of the tropical atmosphere, namely theself-aggregation of convection.
Organized convection at mesoscales takes the form of mesoscale convective systems, or MCS.The American Meteorological Society glossary defines a mesoscale convective system as a “cloudsystem that occurs in connection with an ensemble of thunderstorms and produces a contiguousprecipitation area on the order of 100 km or more in horizontal scale in at least one direction”.Mesoscale convective systems include squall lines, mesoscale convective complexes, and tropical cy-clones (figure IV.2). Mesoscale convective complexes, or MCC, are a subset of mesoscale convectivesystems that exhibit a large, circular (eccentricity > 0.7), long-lived (> 6 hours), cold cloud shield.The cloud shield must have an area > 100 000 km2 with infrared temperature colder than -32◦C,and an area > 50 000 km2 with infrared temperature colder than -52◦C. Note that these are notmutually exclusive, in fact tropical cyclones can evolve from mesoscale convective complexes, andsquall lines can be emitted from tropical cyclones and their outward spiraling bands of precipitation.
The leading physical processes for convective organization are an active area of research. Thesephysical processes include:
• Vertical shear;
• Waves;
• Wind-induced surface heat exchange feedbacks;
• Convective self-aggregation feedbacks.
We describe each process in more detail below.

HDR Caroline Muller, Sept. 2019 43
Figure IV.1: Time-longitude (Hovmoller) section of outgoing longwave radiation anomaly averagedfrom 7.5S to 7.5N (time-mean and seasons removed, from ESRL-NOAA, courtesy: Gilles Bellon).Contours are anomalies filtered for the total outgoing longwave radiation for specific regions ofthe wavenumber-frequency domain corresponding to the Madden-Julian Oscillation (blue contours),Kelvin waves (green contours), and equatorial Rossby waves (black contours). Beyond the synopticequatorial waves, we can also note the numerous smaller-scales (hundreds of kilometers) cloudclusters (red contours); these are mesoscale convective systems, and are the topic of this chapter.
IV.2.b Role of vertical shear
The presence of background vertical wind shear is known to favor the formation of squall lines.More precisely, the interaction of the shear with cold pools below precipitating clouds, is believedto be key in the formation of squall lines.
One possible explanation (figure IV.3a) is the advection of cold pools away from the convectiveupdraft. Indeed, in the dissipating stage of clouds, the partial evaporation of the falling raincools the air, creating cold heavy downdrafts, which hit the surface and spread horizontally. Thesepockets of cold air below clouds are known as cold pools, and inhibit further convection. In the casewhere the region with downdrafts and cold pools is advected away from the updrafts, as representedschematically in figure IV.3a, the updraft can persist on the upwind side of the cold pool, leadingto long-lived convective clouds [Garner and Thorpe, 1992].
Another possible explanation is the interaction of the vorticity of the background shear withthe vorticity of the spreading cold pool, which favors the formation of new updrafts and convective

HDR Caroline Muller, Sept. 2019 44
Figure IV.2: Mesoscale convective systems include squall lines (radar image), mesoscale convec-tive complexes (from EUMETSAT Meteosat-8 satellite), or tropical cyclones (from NOAA-GOESsatellite; from [Muller, 2019]).
cells upshear (figure IV.3b). Note that in the previous theoretical explanation, the squall line isa system of long-lived convective cells, while in this case the squall line is a long-lived system ofordinary cells. [Rotunno et al., 1988] argue that the latter is more consistent with observations,though squall lines can occasionally be composed of long-lived supercell thunderstorms.
Consistently, in cloud-resolving simulations (right panels of figure IV.3), imposing a verticalwind shear, at low levels where cold pools are, yields the organization of clouds into arcs. The toppanel shows a simulation without shear, in which the convection is somewhat randomly distributed,resembling “pop-corn” convection. The middle panel shows a simulation with critical shear, definedas the shear yielding squall lines perpendicular to the mean wind (in the x direction in thesesimulations from left to right). This critical shear was empirically determined in these simulations,decreasing from 10 m s−1 at the surface to zero at 1 km. The last panel shows a simulation withsupercritical shear (20 m s−1 at the surface), in which the squall line orients itself at an angle withthe background wind, so that the projection of the shear on the squall line is critical [Muller, 2013].
Figure IV.3: Left: schematic interaction of a vertical wind shear with cold pools below precipitatingclouds, adapted from [Rotunno et al., 1988]. Right: 3D view of cloud-resolving simulations withdifferent wind shear, in which convection organizes into arcs, adapted from [Muller, 2013].

HDR Caroline Muller, Sept. 2019 45
IV.2.c Role of gravity waves
Unlike in mid-latitudes, shear is often weak in the tropics. Thus shear alone can not explain all or-ganized convective systems in the tropics. Additionally, in the tropics, upscale growth is ubiquitousand sometimes rapid, occurring beyond the extent of cold pools, and convective inhibition is smallso that small perturbations can easily initiate new convection. Internal feedbacks, independentlyof a large-scale forcing or a large-scale circulation, are natural candidates to explain the observedorganization of tropical clouds.
[Mapes, 1993] proposed that gravity waves, generated by the convection and propagating hori-zontally away from the convection (located at x = 0 on figure IV.4), can destabilize the near-cloudenvironment and promote new convection nearby. Indeed, the deepest wave which warms andthus stabilizes the atmosphere, propagates the fastest. It is associated with subsidence throughoutthe troposphere (figure IV.4 l = 1 bore). The second mode (l = 2 bore on the figure) is a baro-clinic mode which propagates slower, and with cooling (through adiabatic ascent) at low levels.This lifting in the lower troposphere encourages convection close to the original cloud, allowing forconvection to be “gregarious” [Mapes, 1993].
Figure IV.4: Schematic response to the heating associated with convection and clouds occurring atx = 0. The heating profile Q(z) is the sum of a deep mode with heating at all heights and a maximumat mid level, and of a baroclinic mode with cooling at low levels and heating at upper levels. Thisdistribution of heat excites waves that then propagate away from the convection, yielding adiabaticsubsidence warming (l = 1 bore and l = 2 bore at upper levels) and adiabatic cooling through ascent(l = 2 bore at lower levels, from [Mapes, 1993]).
IV.2.d Wind-induced surface heat exchange (WISHE)
The so-called “wind-induced surface heat exchange”, or WISHE [Emanuel, 1986], is a positivefeedback of convection on itself, related to enhanced surface fluxes in the moist convecting region.This feedback is particularly crucial for tropical cyclones, whose extremely strong surface winds inthe eyewall yield enhanced surface fluxes there (mainly in the form of evaporation from the ocean).Thus the eyewall, which is the most energetic region where moisture and clouds are found, is theplace where the surface fluxes of energy are strongest. In other words, surface fluxes enhance energyin the high-energy region, thus reinforcing energy gradients and yielding a positive feedback on theconvective organization.
IV.2.e Convective self-aggregation
This subsection is based on the paper

HDR Caroline Muller, Sept. 2019 46
C.E. Holloway, A. Wing, S. Bony, C. Muller, H. Masunaga, T. L’Ecuyer, D. Turner, P. ZuidemaObserving convective aggregation
Surv. Geophys., 38 (2017).
An active area of research is linked to the spontaneous self-aggregation of convection. Self-aggregation refers to the spectacular ability of deep clouds to spontaneously cluster in space (seefigure IV.5) despite spatially homogeneous conditions and no large-scale forcing, in high-resolutioncloud-resolving simulations of the tropical atmosphere. As mentioned in chapter III (see notably§III.3), cloud-resolving models are models with fine, kilometer-scale resolution, i.e. simulationswith sufficiently high spatial resolution to explicitly resolve the deep convection and deep clouds,instead of parameterizing them. Self-aggregation was first discovered in idealized settings, namelynon-rotating radiative-convective equilibrium (setting further described in §III.3). Since its dis-covery in cloud-resolving models, the rapidly growing body of literature on self-aggregation con-firmed its occurrence in a hierarchy of models, from two- and three-dimensional cloud-resolvingmodels, to regional models and global climate models with parameterized convection, with super-parameterizations or without convective parameterization [Wing et al., 2017].
Figure IV.5: In models, convective self-aggregation (panel b) emerges spontaneously, increasinglyso with increasing temperatures. It is associated with a large-scale drying of the atmosphere andenhanced large-scale outgoing radiative cooling to space. In observations (panel c, relative humidityprofiles from AIRS satellite measurements) the middle troposphere is drier in an atmosphere inwhich the same amount of precipitation is concentrated in a smaller number of convective clusters(adapted from [Bony et al., 2015]), consistent with modeled aggregation.
From the very first studies describing convective self-aggregation [Held et al., 1993, Tompkins,2001, Bretherton et al., 2005], there has been a recurring question: is this “real”? In other words,is the intriguing clumping behavior representative of actual convective organization in nature, oris it just a model artifact? And, to the extent that the behavior is relevant for understanding realatmospheric convection, what does it tell us about the role of convective organization in weatherand climate?
In [Holloway et al., 2017] we argue that this behavior in models does appear to be relevant toreal-world convection and climate. Notably, there is agreement between models and observationsthat, as convection becomes clumped into fewer moist regions, the subsidence regions become drier,resulting in a drier large-scale mean environment (figure IV.5, see also [Tobin et al., 2012]). This

HDR Caroline Muller, Sept. 2019 47
drying, and a reduction of upper-tropospheric stratiform cloud, leads to larger outgoing longwaveradiation and stronger atmospheric cooling.
There are also some aspects of self-aggregation in models that conflict with observations, andmany aspects that need more observational study. How aggregation and its effects interact withlocal sea-surface temperature on short time scales and with tropics-wide sea-surface temperatureson long time scales is still uncertain in both models and observations. Initiation processes, such asradiatively driven cold pools and related shallow overturning circulations, are one obvious observa-tional target. Maintenance processes may be even easier to study in observations, since they canbe studied in heterogeneous conditions more typical of convection in nature.
Certainly, the study of convective self-aggregation is leading to exciting new insights into pro-cesses that allow convection to interact with its environment in models. There are encouraging signsthat these processes may operate in nature too, and there is a lot of recent progress arising fromthe ability to simulate mesoscale systems, requiring large hundreds of kilometers domains, whileresolving deep convection, requiring fine kilometric resolution. Thus advances in computer powercombined with new discoveries based on idealized frameworks, theory and observational findings,make this the ideal time to determine the fundamental processes governing self-aggregation, andits link to convective organization in nature. In the following sections, we investigate in more detailthe physical processes responsible for self-aggregation, and then assess implications for ocean eddies- convection interactions, and for tropical cyclogenesis.
IV.3 My research: physical processes responsible for self-aggregationover homogeneous sea-surface temperatures
This section is based on the papers
C. Muller, S. BonyWhat favors convective aggregation and why?
Geophys. Res. Lett., 42 (2015).
A. Wing, K. Emanuel, C. Holloway, C. MullerConvective self-aggregation in numerical simulations: a review
Surv. Geophys., 38 (2017).
P. Zuidema, G. Torri, C. Muller, A. ChandraPrecipitation-induced atmospheric cold pools over oceans and their interactions with
the larger-scale environmentSurv. Geophys., 38 (2017).
In simulations of radiative-convective equilibrium, illustrated in figure IV.5a, convection is some-what randomly distributed, resembling “pop-corn” convection. Self-aggregation (figure IV.5b) canbe seen as an instability of radiative-convective equilibrium, in which random pop-corn convectionis replaced by a highly organized state. Convection is confined to a subregion of the domain, andis surrounded by extremely dry air. In this section, we investigate in more detail the physicalprocesses involved. The simulations described here are performed with the cloud-resolving modelSAM (see [Khairoutdinov and Randall, 2003] and §III.3 for more details on the model).

HDR Caroline Muller, Sept. 2019 48
IV.3.a Self-aggregation by radiative feedbacks
From sensitivity experiments, i.e. simulations where the various feedbacks are turned on and off (e.g.surface flux feedbacks, radiative feedbacks...), we now know that longwave radiative feedbacks arecrucial for self-aggregation, at least at current tropical temperatures [Muller and Held, 2012]. Moreprecisely, the longwave radiative cooling from low clouds in dry regions is found to be necessary forthe spontaneous onset of self-aggregation from homogeneous initial conditions. When simulationsare initiated from aggregated conditions though, the clear-sky radiative feedback from dry regionsand the high-cloud radiative feedback from moist regions are also found to be sufficient to maintainthe aggregation.
The importance of longwave radiative feedbacks for convective aggregation can be understoodby considering the moist static energy transport between the dry and the moist regions. Note thatin the tropics, horizontal temperature gradients are small, so that the variability in moist staticenergy is largely dominated by the variability of water vapor. Thus high energy regions correspondto moist regions and vice versa. Figure IV.6 shows the circulation (black streamfunctions) inheight and moisture space [Bretherton et al., 2005, Muller and Bony, 2015]. The top panels showthe circulation along with radiative cooling rates (left) and moist static energy (right). The arrowsshow the direction of the circulation.
The strong radiative cooling in dry regions at low levels, which is largely due to the presence oflow clouds (pink contours top left panel), generates subsidence (blue arrow) in the lowest kilometersof the dry columns. This radiatively-driven subsidence in dry regions further dries those regions,resulting in persistent radiatively-driven “dry pools” [Zuidema et al., 2017], where deep convectionis suppressed. The dry subsidence forces a near-surface flow (black arrow) from dry to moistcolumns. The high moist static energy near the surface (top right panel) is thus exported from thedry regions into the moist regions, yielding an upgradient energy transport. This is the positivefeedback believed to be responsible for the strengthening energy gradient and concomitant self-aggregation of convection.
As mentioned above, even without the longwave radiative feedbacks from low clouds, convectiveaggregation can be maintained from aggregated initial conditions. The bottom panels show thesame circulation, but in a simulation without low cloud longwave radiative contributions. Theclear-sky low-level cooling in dry regions along with radiative warming from high clouds in themoist columns again yield subsidence in dry (blue arrow) and upward motion (red arrow) in moistregions. The near-surface flow associated with this dynamical response to the radiative coolingdistribution (black arrow) again exports energy from dry regions to moist regions, yielding anupgradient energy transport.
In all cases, it is the low-level circulation, forced by differential radiative cooling rates betweendry and moist regions, which is responsible for the upgradient energy transport yielding convectiveaggregation. Note that moist static energy is a strong function of height, thus the altitude of theradiative cooling and heating is important. In fact, [Muller and Bony, 2015] show that imposingenhanced radiative cooling in dry regions in radiative-convective equilibrium simulations can leadto the self-aggregation of convection, if the cooling is applied at low altitudes.
IV.3.b Self-aggregation by moisture-memory feedback
Surprisingly, it is possible to simulate self-aggregation even while suppressing radiation and otherdiabatic feedbacks [Muller and Bony, 2015], a result later confirmed in another model [Holloway

HDR Caroline Muller, Sept. 2019 49
Figure IV.6: Circulation in height and moisture space (black streamfunction) in simulations thataggregate. The top panels show a simulation with full radiation, while the bottom panels show asimulation where the low-cloud longwave radiative feedback is removed (after [Muller and Bony,2015]).
and Woolnough, 2016]. It occurs when the evaporation of falling rain is suppressed in the subcloudlayer (below 1 km or so), thus preventing the formation of strong downdrafts and cold pools. Inother words, it occurs at unrealistically high precipitation efficiency.
The process leading to self-aggregation seen in these simulations has been called “moisture-memory” feedback, since it relies only on intrinsic interactions between clouds and the water vaporaround them to spontaneously organize into clusters. In standard conditions, the cooling associatedwith the evaporation of rain below deep convecting clouds generates downdrafts, which throughtheir thermodynamical effect oppose the upward motion that generated the cloud. This negativefeedback on upward convection suppresses the deep cloud in a few hours. Without the evaporationof rain and the effect of the associated downdrafts, moist areas remain moist (or even get moisterby convergence) and thus become even more favorable to convection. This tends to localize theconvection, as observed in these simulations.
IV.4 My research: implications for ocean eddies - convection in-teraction, and for tropical cyclogenesis

HDR Caroline Muller, Sept. 2019 50
IV.4.a Impact of ocean temperature inhomogeneities
This section is based on the paper
S. Shamekh, C. Muller, J.-P. Duvel, F. D’AndreaHow do ocean warm anomalies favor the aggregation of deep convective clouds?
J. Atmos. Sci., in review (2019).
Because of the idealized settings in which self-aggregation was discovered, its relevance to thereal world is still debated. Notably, the aforementioned studies used spatially and temporallyconstant and uniform sea-surface temperature (SST). Here we investigate the impact of oceanSST inhomogeneities on earlier results. More precisely, we investigate how an idealized warmcircular SST anomaly, referred to as “hot-spot”, helps organize convection, and how self-aggregationfeedbacks modulate this organization.
The impact of SST inhomogeneities on deep convection has been widely studied in the literatureinvestigating the response of convection to different surface forcing [Tompkins, 2001, Kuang, 2012,Ramsay and Sobel, 2011] [Tompkins, 2001] finds that flipping the SST anomaly leads to migrationof the convective clusters over the warm anomaly. The migration of aggregated convective clusterover warm anomaly has been confirmed by other studies which used a slab ocean in order tohave interactive SST [Coppin and Bony, 2017, Grabowski, 2006]. Using a single column modeland a cloud-resolving model, [Ramsay and Sobel, 2011] show that precipitation rate increases overlocal warm SST and is determined by the temperature anomaly rather than mean SST. The SSTanomaly, if large enough, can suppress convection in one column and strengthen it in the warmercolumn. Notably, SST gradients can generate a large-scale circulation that can lead to a migrationof deep convection towards the warmest SST.
Ocean mesoscale eddies [Chelton, 2011] can also be associated with SST anomalies reaching afew degrees in cold core cyclonic eddies or warm core anticyclonic eddies. These persistent oceaneddies have typical radius varying with latitude, from a hundred to a few hundreds of kilometers inthe tropics (± 20◦ latitude), to around 50 km or less in mid-latitudes. As a surface forcing, eddiescan impact the atmosphere locally [Sugimoto et al., 2017] by enhancing low-level convergence andthus convective precipitation. Potentially, the eddies changes the cloudiness and wind field whichcan impact the large scale circulation. Whether and how such persistent SST anomalies, as anexternal forcing, can favor or suppress the aggregation of convection is, to our knowledge, still notwell covered in the literature and is the topic of this section.
We use the cloud-resolving model SAM as before, and impose an idealized circular hot-spot(radius R and temperature anomaly dT ) in the center of the domain (black circle figure IV.7).We find that the presence of a hot-spot significantly accelerates aggregation, particularly for largerdomains (figure IV.7) and warmer/larger hot-spots, and extends the range of SSTs for whichaggregation occurs (figure IV.8). Indeed in this model, over uniform SST (referred to as “ocean”simulations, figure IV.8a), self-aggregation only occurs for SSTs larger than 295 K. But in thepresence of a hot-spot, simulations with domain mean SST as low as 290 K aggregate (figureIV.8b), and the aggregation is significantly faster than warmer constant-SST simulations.
Aggregation even happens without radiative feedbacks for hot-spots sufficiently large/warm[Shamekh et al., 2019]. In that case, the aggregation onset results from a large-scale circulationinduced by the hot-spot. Specifically, it is related to an initial transient warming, as convectionover the hot-spot brings the atmosphere towards a warmer moist adiabat. The warmer tempera-tures are imprinted over the whole domain by gravity waves and subsidence warming. The initial

HDR Caroline Muller, Sept. 2019 51
b)
a)
D288,dT3R30D96,dT3R10
Figure IV.7: Snapshots of near-surface air temperature (colors, K) and cloud water (grey shades)from two simulations with a hot-spot in the center of the domain (circle) for (a) a domain size96×96 km2 and (b) 288×288 km2. (c) Time evolution of the aggregation index (larger for moreorganized states) for those two simulations. Larger domains, and larger/warmer hot-spots favorconvective aggregation (after [Shamekh et al., 2019]).
transient warming and concomitant subsidence drying suppress convection outside the hot-spot,thus strengthening the aggregation of convection and moisture over the hot-spot.
Consistently, during the aggregation onset phase, the strength of aggregation is found to nicelycorrelate with the strength of the large-scale circulation, as measured by the mean subsidencevelocity in dry regions. This large-scale circulation is found to be sensitive to the hot-spot fractionalarea, as can be understood with a simple geometric argument. As the hot-spot becomes larger, thedry region shrinks in our doubly-periodic setting. Therefore stronger compensating subsidence isneeded to compensate the upward mass flux over the hot-spot. This strengthening of the large-scalecirculation is consistent with the faster aggregation with larger hot-spots.
These results highlight the need to use large domains when investigating convection over inho-mogeneous SSTs in similar doubly-periodic geometry, in order to avoid or to control the aggregationof convection over warm temperature anomalies. In reality, with planetary rotation, the scale ofthe large-scale circulation induced by SST anomalies is likely determined by the Rossby radius ofdeformation. Our results suggest that for a large enough fractional area of SST anomalies com-pared to this large-scale circulation, self-aggregation feedbacks could play a role in organizing deep

HDR Caroline Muller, Sept. 2019 52
a
b
Figure IV.8: Time evolution of the aggregation index for simulations with full radiative feedbackfor: (a) simulations with a uniform surface temperature (referred to as “Ocean”; (b) simulationswith a hot-spot of different sizes (radius R) and temperature anomalies (dT , with domain-meanSST equal to 290 or 300 K; after [Shamekh et al., 2019]).
convection over SST anomalies. In the ocean, SST anomalies of the size studied here (O(100 km))are not uncommon, taking the form of mesoscale eddies (Chelton 2011). Their contribution toconvective organization deserves further investigation.
IV.4.b Acceleration of tropical cyclogenesis by self-aggregation feedbacks
This section is based on the paper
C. Muller, D. RompsAcceleration of tropical cyclogenesis by self-aggregation feedbacks
Proc. Natl. Acad. Sci. (2018).
Few geophysical phenomena are as spectacular as Tropical Cyclones (TCs). The cloud-freeeye with weak motion is surrounded by an eyewall with clouds and rotating winds among thestrongest on the planet. Though the prediction of cyclone tracks has improved in recent years,understanding the mechanisms responsible for the genesis and intensification of cyclones remainsa major scientific challenge [DeMaria et al., 2014]. The present study addresses the followingquestions: is self-aggregation relevant to the formation of TCs? Or are the feedbacks identifiedin idealized simulations not robust to planetary rotation? Are they dominated by other processesonce rotation is accounted for?

HDR Caroline Muller, Sept. 2019 53
As mentioned above, most studies of self-aggregation focused on idealized simulations, in par-ticular radiative-convective equilibrium with no large-scale forcing and neglecting Earth’s rotation.Neglecting Earth’s rotation, i.e., setting f = 0 s−1 where f denotes the Coriolis parameter, is areasonable approximation near the equator and at small scales, but becomes questionable when theconvective aggregate reaches mesoscales. At those scales, the effect of the Earth rotation starts tobe appreciable.
Earlier studies of rotating radiative-convective equilibrium, sometimes referred to as a “tropicalcyclone world”, mainly investigated the properties of the mature cyclones (including the size andthe distance between cyclones [Khairoutdinov and Emanuel, 2013, Davis, 2015, Shi and Bretherton,2014, Wing et al., 2016]). Here, instead, we focus on the onset of cyclone formation, and our goalis to compare in detail cyclogenesis with the onset of convective self-aggregation. To that end, weperform a series of sensitivity runs where various feedbacks are turned on or off. More precisely,we focus on the relative role of the following two feedbacks: radiation feedbacks and surface-fluxfeedbacks. Radiation feedbacks include low-cloud, high-cloud and clear-sky feedbacks, which haveall been shown to contribute positively to self-aggregation [Muller and Bony, 2015]. Surface-fluxfeedbacks connect enhanced surface winds to enhanced surface fluxes, and this connection, oftenreferred to as a wind-induced surface heat exchange (WISHE, introduced in §IV.2.d) feedback,plays a key role in maintaining tropical cyclones [Emanuel, 1986].
Our work builds upon the recent work of [Davis, 2015, Wing et al., 2016] who investigate thespontaneous generation of tropical cyclones from homogeneous conditions in rotating radiative-convective equilibrium. In particular, [Wing et al., 2016] suggest that radiative feedbacks, knownto be key for self-aggregation, could accelerate cyclogenesis, a result that we further investigate andquantify here, in rotating doubly-periodic radiative-convective equilibrium simulations.
Results
Figure IV.9: Cyclone evolution in CTRL and sensitivity runs. Top (a-d) Snapshots of∫
MSE atday 100 of the simulations. Bottom (e-h) Time evolution of the standard deviation of
∫MSE, and
of the domain-averaged wind speed near the surface in m s−1 at the first atmospheric level z = 37.5m (from [Muller and Romps, 2018]).
Figure IV.9 shows snapshots from a control simulation and three sensitivity simulations: CTRL

HDR Caroline Muller, Sept. 2019 54
(panel a) with all feedbacks turned on (RAD and SFC); noSFC-noRAD (panel b) with all feedbacksturned off; noRAD (panel c) with interactive radiation turned off; and noSFC (panel d) wherefeedbacks associated with interactive surface fluxes are turned off (in particular WISHE effects areoff). The variable shown is the vertically-integrated moist static energy∫
MSE =
∫ zt
0(cpT + gz + Lvqv) ρ dz, (IV.1)
where zt is the tropopause height, cp the specific heat of air, T temperature, g gravity, Lv latentheat of vaporization, qv water vapor mixing ratio and ρ density.
∫MSE is a useful variable since
it is conserved during moist adiabatic processes in this model (neglecting subgrid-scale fluxes andlatent heat contributions from the ice phase). Hence its mass-weighted vertical integral can only bechanged by radiation, surface fluxes, and advection. In the tropics, where horizontal temperaturegradients are small, its variability is closely related to that of water vapor. Consistently, snapshots ofprecipitable water
∫ zt0 qv ρ dz show a very similar spatial distribution as
∫MSE, the only difference
being that the eye of the cyclone is visible in precipitable water (dry anomaly), while it is notseen in
∫MSE since the dryness in the eye is largely compensated by warmer conditions due to
adiabatic compression. Also shown are the time evolution of the standard deviation of∫
MSE andof the domain-mean wind speed near the surface (first atmospheric level at 37.5 m, panels e-h),both indicative of the TC intensification. Convective organization in general, is associated with anincrease in
∫MSE variance, as moist regions become moister and dry regions become drier [Wing
and Emanuel, 2014, Wing and Cronin, 2016].The CTRL run develops a cyclone in about 25-30 days, with a minimum surface pressure
of about 930 hPa. When all feedbacks are turned off (noSFC-noRAD), no cyclone develops, asexpected, since interactive surface fluxes are believed to be key for TCs (this remains true if we runlonger; no cyclone develops even after 250 days of simulation). Surprisingly, though, if only radiativefeedbacks are removed (noRAD), the cyclogenesis takes about 60 days, which is more than twiceas long as in the CTRL run. This suggests that aggregation feedbacks accelerate the cyclogenesisprocess (at least in the absence of large-scale forcing) by a factor of about two. Perhaps evenmore surprisingly, if just surface-flux feedbacks are removed (noSFC), the simulation still yields aweak “radiative cyclone”. In other words, radiative feedbacks are sufficient to yield a cyclone, evenwithout interactive surface fluxes (i.e., even without WISHE). The TC is still intensifying after100 days of simulations, but remains weaker than in CTRL even if we run longer (Figure IV.9h).Without the wind-induced enhancement of turbulent surface fluxes, the TC can not reach its fullintensity in the mature stage. Yet, the fact that radiative feedbacks on their own are sufficient toinitiate even a weak cyclone is remarkable.
Also note that, once the TC is formed, whether radiative feedbacks are turned on or not,the cyclone intensity is to leading order the same, although there is a slight reduction withoutinteractive radiation (7% reduction between CTRL and noRAD of the high percentiles of thestandard deviation of
∫MSE, and 15% reduction of the high percentiles of surface wind speed;
similar reductions, between 5 and 15%, are found based on high percentiles of precipitable waterand latent heat flux). This is again consistent with our current understanding of TCs, whose mainsource of energy in the mature stage are interactive surface fluxes [Emanuel, 2003]. But we findhere that the radiative feedbacks are responsible for a small but non-negligible contribution to theintensity of the mature cyclone, consistent with an earlier study pointing out the importance ofradiation in the maintenance of a cyclone intensity [Wing et al., 2016].
Before moving on, it is interesting to note that the mature cyclone undergoes three periods of

HDR Caroline Muller, Sept. 2019 55
intensification in CTRL. A similar variability was noted in [Wing et al., 2016]. We hypothesizethat these periods are related to a vertical wind shear which develops as the TC strengthens.
Role of radiative feedbacks on timing of cyclone formation
0 50 100
0
20
40
st. d
ev.
MS
E
(a) CTRL
CTRL IC2
CTRL IC3
CTRL IC4
CTRL IC5
noRAD
noRAD IC2
noRAD IC3
noRAD IC4
noRAD IC5
0 50 100
0
20
40
st. d
ev.
MS
E
(b)
CTRL
noRAD
noRADLW
noRADSW
0 50 100time (d)
0
20
40
st. d
ev.
MS
E
(c)
CTRL
noRADLW-clr
noRADLW-liq
noRADLW-ice
non-rot
Figure IV.10: Time evolution of the standard deviation of∫
MSE (106 J m−2) (a) for differentinitial conditions, (b) in sensitivity runs removing separately the SW and LW interactive radiation,and (c) in sensitivity runs removing the LW liquid cloud, ice cloud and clear-sky contributionsseparately. Open circles in panel c indicate the first 15 days of cyclogenesis and the first 30 daysof non-rotating self aggregation (from [Muller and Romps, 2018]).
Let us now investigate further the impact of radiative feedbacks on the time needed to reacha fully developed cyclone. Both cyclogenesis and self-aggregation have been shown to be sensitiveto initial conditions [Khairoutdinov and Emanuel, 2010, Wing et al., 2016]. We verify that theslow down of cyclone formation without radiative feedbacks is robust to initial conditions (FigureIV.10a), with a factor two or larger for all initial conditions. In fact, for all the initial conditionstried here, the control simulation was faster than any sensitivity simulation (noRAD, noSFC, ornoSFC-noRAD) that we tried. Also, separately removing the shortwave (SW) and LW contributionsto the radiation highlights the key role of LW radiative feedbacks (Figure IV.10b): removing theinteractive SW radiation has little impact, while removing the interactive LW radiation slows downthe cyclone formation even more than noRAD. This suggests a similarity with the non-rotatingself-aggregation process for which LW feedbacks are known to be crucial. Also consistent with self-aggregation is the fact that the three terms in the LW radiative cooling, LW cooling from liquidclouds, ice clouds and clear sky, all contribute positively to the acceleration of the cyclogenesisprocess (Figure IV.10c). Indeed, removing each separately does not account for the overall slowdown of the cyclogenesis.
These results are qualitatively consistent with [Wing et al., 2016] (see their figure 4), who also

HDR Caroline Muller, Sept. 2019 56
find that removing radiative feedbacks delays cyclogenesis. In order to further quantify the impactof radiative feedbacks on the time scale of convective organization, we performed a larger ensembleof CTRL and noRAD simulations, and found that the acceleration of cyclogenesis by radiativefeedbacks was extremely robust. Interestingly, the variability of the time scale of convective orga-nization is smaller in our CTRL simulations than in [Wing et al., 2016]. We hypothesize that thisis due to the different radiation scheme used (RRTM versus CAM here), since their simulationswithout radiative feedbacks yield a smaller variability. Other differences in our settings could alsoplay a role (in particular, they use a warmer sea-surface temperature of 305 K compared to 300 Khere).
Comparison with nonrotating self-aggregation
0
5
10
15
z (
km
)
Qr (colors), (black every 15kg m -2 s-1 day-1),
qn (white every 0.006g kg -1)
(a) CTRL run day 1 to 15 Qr (K
day
-1)-2
-1
0
1
10 20 30 40
rank of MSE (lowest to highest)
0
5
10
15
z (
km
)
(b) Non-rotating day 1 to 30
Qr (K
day
-1)-2
-1
0
1
Figure IV.11: Cyclogenesis versus self-aggregation. Circulation between dry and moist columnsduring (a) the formation of the tropical cyclone in CTRL and (b) the onset of self-aggregation in anon-rotating simulation. The dry columns are on the left (low
∫MSE rank), and the moist columns
are on the right (high rank). Plain black contours indicate counterclockwise circulation, and whitecontours indicate cloud condensates (from [Muller and Romps, 2018]).
Figure IV.11 shows similarities between self-aggregation and cyclogenesis. It shows the radiativecooling rates and streamfunctions, as well as cloud content, in the cyclone (a) and self-aggregation(b) runs, as a function of height and rank of vertically-integrated
∫MSE. We focus on the genesis,
hence we show day 1 to 15 for the cyclone (see blue open circle in Figure IV.10c, day 15 is abouthalf way to the full cyclone) and day 1 to 30 for self-aggregation (see black open circle FigureIV.10c, where similarly day 30 is about half way to the full aggregation). The self-aggregation plotis slightly less noisy since it contains more days. In both cases, though, there is strong low-levelradiative cooling in dry regions (strong cooling between the surface and 2 km in the dry columnsbelow rank 20) from clear-sky and low-level liquid clouds, which promotes aggregation [Muller andBony, 2015]. We also see the mid-level radiative warming in moist convective regions from middleand high clouds (warming in the moistest columns above 5 km) also known to enhance aggregation[Muller and Bony, 2015].
We can compare the circulation with the one expected from radiative cooling rates only, assum-ing that radiative cooling is exactly balanced by subsidence warming. This is expected to be trueoutside of clouds (in cloudy regions however, the latent heat also enters the temperature equation,

HDR Caroline Muller, Sept. 2019 57
and therefore contributes to vertical velocities). Consistently, we find that there is a good agree-ment in the dry regions away from clouds between the circulation expected from radiative coolingrates only, and the actual circulation (not shown, see [Muller and Romps, 2018] for more details).The differential radiative cooling between dry and moist regions is therefore largely responsible forthe low-level subsidence seen in Figure IV.11 below 2 km in the driest columns (up to rank 10 orso). This subsidence is accompanied by a flow from dry to moist columns near the surface (up torank 20), rising above 2 km in the moister columns (rank 20 or higher). This low-level circulationfrom dry to moist regions is crucial since it transports MSE upgradient, from dry to moist regions,favoring aggregation [Bretherton et al., 2005, Muller and Bony, 2015].
These results suggest a close similarity between cyclogenesis and the idealized self-aggregationprocess, which can be quantified further using the moist static energy variance budget to quantifydirect diabatic feedbacks, following [Wing and Emanuel, 2014]. Quantitatively, using this budget,the early times of cyclogenesis in the CTRL simulation resemble accelerated self-aggregation (days1 to 15 for the TC, days 1 to 30 for the self-aggregation), with similar contributions from thevarious feedbacks to the development of organized convection. The simulations then diverge wheninteractive surface fluxes become a strong positive feedback in CTRL, due to strong winds andsurface fluxes in the flow converging into the cyclone, while they become a small negative feedbackin the self-aggregation, due to strong surface latent fluxes in the dry subsidence region, consistentwith [Wing et al., 2016] (not shown, see [Muller and Romps, 2018] for more details).
Summary and discussionThe overall picture that emerges is that the feedbacks identified in idealized settings as leading to thespontaneous self-aggregation of convection play an important role in our cyclogenesis simulations.More precisely, the onset of self-aggregation in non-rotating simulations shares qualitative andquantitative properties with tropical cyclogenesis. Radiative feedbacks are found to accelerate thecyclogenesis by a factor two or larger. The longwave radiative feedback is the key contribution tothose radiative feedbacks, as in self-aggregation. Surprisingly, radiative feedbacks by themselvesare sufficient to yield a cyclone, albeit weak, even in the absence of WISHE effects.
We acknowledge that the simulations used in this study are still idealized, e.g., doubly-periodicand in radiative-convective equilibrium, without large-scale forcing. In the real tropics, the routeto tropical cyclogenesis can be quite different, and is influenced by large-scale environmental condi-tions, such as the passing of an equatorial wave and preexisting favorable moist conditions withina “marsupial pouch” [Dunkerton et al., 2009]. Comparison of the time scale of self-aggregationtendencies investigated here to that of large-scale environmental conditions deserves further in-vestigation using more realistic simulations. Our results suggest that self-aggregation, and theframework developed for its study, can help shed some new light into the physical processes leadingto cyclogenesis and cyclone intensification. In particular, our results point out the importance ofthe longwave radiative cooling at low levels outside the cyclone, and the low-level circulation thatit entails. Further comparison with data, and analysis of simulations in more realistic settings, aredesirable to clarify the precise contribution and location of the longwave radiative feedback.

HDR Caroline Muller, Sept. 2019 58

Chapter V
Perspectives: future researchdirections
“A ship in port is safe, but that’s not what ships are built for.”Grace Hopper
59

HDR Caroline Muller, Sept. 2019 60
V.1 Summary: scientific and personal objectives
The European Research Council (ERC) Starting grant that I just obtained for the period 2019–2024will largely shape my research in the coming 5 to 10 years. The topic of this project is convectiveorganization, and implications for tropical cyclones and for the energetics of the tropics, in currentand in a warming climate. Indeed, despite its strong societal and climatic impacts, the physicalprocesses behind convective organization are still poorly understood, as discussed in chapter IV.In fact, mesoscale convective organization is typically not accounted for in global climate modelsused for climate prediction. One of the goals of this project is to lead to improved fundamentalunderstanding of the physical processes at stake. The specific scientific questions addressed aredescribed in more detail in the coming sections.
One of my personal goals is to broaden both my research areas and methodologies. In pastwork, I have mainly focused on theoretical and idealized numerical tools. In future work, I lookforward to investigating observational evidence for the relevance or not of self-aggregation to theobserved organization of convection, using both satellite and in-situ observations, as initiated in[Holloway et al., 2017]. I am currently pursuing research in this direction with my colleagues atLMD, and with Allison Wing (Florida State University) and Dave Turner (NOAA).
I am also very excited about my new research on tropical cyclones. I recently started a collabo-ration with Olivier Pauluis (New York University) on the role of cold pools and shallow circulationson cyclogenesis. I very much hope to continue research in this field. And I hope to continue myexisting collaborations on ocean waves, notably with Jean-Marc Chomaz (LadHyX).
Many outstanding open questions remain regarding precipitation extremes and their responseto warming. As noted in my recent review paper on precipitation extremes [Muller and Takayabu,2019], recent decades have seen important fundamental advances on this topic. But without acomplete theory for the dynamical and microphysical changes with warming, we can not properlyattribute causes for the corresponding contributions to extreme rainfall rates. I hope to pursueresearch in that theoretical direction as well.
V.2 Perspectives: towards an improved fundamental understand-ing of convective organization
I first plan to study self-aggregation in simulations in the presence of a large-scale circulation, thusrelaxing the radiative-convective equilibrium assumption of earlier work, but still in settings simpleenough to allow for quantitative comparison with simple theoretical models that will be developedwhere possible. The ultimate goal is to derive a simple scaling for the time scale of aggregation, andits dependence on the large-scale circulation and large-scale conditions. Notably, it is well knownthat self-aggregation is favored at warm sea-surface temperatures in models. This is consistentwith theoretical expectations from the effect of clear-sky radiative feedbacks [Emanuel et al., 2014].But given the importance of cloud radiative feedbacks as well, its inclusion in the theory may helpclarify the model behavior.
I also plan to investigate the strength of radiative feedbacks in dry regions in observations. Sincethe [Tobin et al., 2012] seminal study, other groups have started looking at observational evidenceof strong radiative cooling rates in dry regions, but all use satellite data (Hirohiko Masunaga,Sandrine Bony, personal communication). Although this allows to investigate correlations betweenconvective aggregation and radiative cooling rates, the issue with this approach is that the radiative

HDR Caroline Muller, Sept. 2019 61
cooling at low levels is key, and low levels are poorly resolved by satellite.Instead, we propose to use in-situ data, computing radiative cooling rates from observed trop-
ical thermodynamic profiles, which have high resolutions in the lower troposphere. The questionaddressed is whether the differential cooling rates consistent with observed dry and moist pro-files, are sufficient to yield self-aggregation when imposed in numerical simulations. As mentionedearlier, this project is joint work with Allison Wing (Florida State University) and Dave Turner(NOAA). In a second step, we will then correlate the occurrence of strong differential cooling, withthe degree of mesoscale convective organization, derived from satellite, using an index similar to theSCAI index introduced by [Tobin et al., 2012], in collaboration with Addisu Semie and SandrineBony (LMD).
V.3 Perspectives: self-aggregation by moisture-memory feedbacks
Little is known about this feedback, which occurs when the evaporation of rain is artificially sup-pressed in the subcloud layer. It was only recently discovered [Muller and Bony, 2015], and waslater confirmed to occur in another model [Holloway and Woolnough, 2016]. The moisture-memoryfeedback offers a tantalizing framework to investigate the details of the moisture-convection inter-action relevant to the organization of convection. In [Muller and Bony, 2015], we hypothesize thatlow-level moisture is key through its influence on convective available potential energy (hence thebuoyancy of near-surface parcels [Muller et al., 2009]). It has also been argued that it could belinked to mid-tropospheric humidity via its impact on entrainment (organized convection leads toentrainment of moister air surrounding updrafts, hence less dilute plumes, [Holloway and Neelin,2009]). In collaboration with Christopher Holloway (University of Reading), we plan to clarify theatmospheric layer which is key for the moisture-memory interaction, as well as its sensitivity towarming and its interaction with other diabatic feedbacks. We hope in particular to clarify therole of entrainment mixing of rising plumes, known to be a critical parameter in convective param-eterizations in climate models, with far-reaching implications beyond the tropics [Tomassini et al.,2015].
This work will hopefully benefit researchers and model developers working on improving therepresentation of convection and convective organization in models. I will enable these impactsthrough engagement with modeling centers. I already have strong existing interactions with climatemodel developers of the French LMDZ model (Laboratoire de Meteorologie Dynamique Zoom) andat the Centre National de Recherches Meteorologiques (CNRM), and the Met Office in the UK-wideParaCon project.
V.4 Perspectives: implications for tropical cyclones and for thetropical energetics
Another important aspect of my ERC project is an in-depth analysis of the implications of convec-tive organization and its response to warming, for tropical cyclogenesis and rapid intensification,and for the large-scale tropical hydrological cycle (mean and extreme precipitation) and climate(notably top-of-atmosphere radiation).
In [Muller and Romps, 2018], we show that self-aggregation feedbacks can significantly acceleratecyclogenesis. Our recent work [Shamekh et al., 2019] also indicates that self-aggregation couldresonate with a surface hot-spot, i.e. localized warm circular anomalies, with an optimal diameter

HDR Caroline Muller, Sept. 2019 62
around 100 km. Warm anomalies of this size in regions of tropical cyclone formation are notuncommon due to the presence of ocean mesoscale eddies. This work will benefit from an existingcollaboration with Sabrina Speich (LMD), using observations of ocean mesoscale eddies and tropicalcyclones to assess the role of ocean-atmosphere interactions in observations.
As mentioned earlier, self-aggregation is also associated with increased outgoing longwave ra-diation at the top of the atmosphere. Given the enhancement of self-aggregation with warming, itcould be a key missing ingredient in current estimates of climate sensitivity [Mauritsen and Stevens,2015]. This also led to the hypothesis that self-aggregation could be a way for the tropical tem-peratures to regulate themselves [Khairoutdinov and Emanuel, 2010]: increased temperatures yieldincreased aggregation, which in turn yields increased longwave cooling to space which decreasestemperatures, and so on. In observations, [Tobin et al., 2012] confirm that observed aggregation,from satellite brightness temperatures, is correlated with increased top-of-atmosphere longwavecooling. But they also find that this is largely compensated by increased incoming shortwavedue to decreased cloud fraction with organization. Whether this behavior holds in cloud-resolvingmodels, and how it may change with warming, is unknown and is of primary global importance.
Overall, these projects are all part of an international ongoing effort aimed at clarifying theimpact of convective organization in our current, and in a warming climate.

HDR Caroline Muller, Sept. 2019 63
Appendices

HDR Caroline Muller, Sept. 2019 64
.1 Curriculum vitae
Contact Laboratoire de Meteorologie Dynamique
Ecole Normale Superieure 06 50 13 56 4024 rue Lhomond [email protected]
75005 Paris www.lmd.ens.fr/muller/
ResearchTopics
Hydrological cycle (mean and extreme precipitation), spatial organization of tropicalclouds, cyclogenesis, ocean circulation, internal waves.
ResearchExperience
2015–present CNRS, Laboratoire de Meteorologie Dynamique (LMD),Ecole Normale Superieure (ENS) ParisCNRS researcher Chargee de recherche CNRS& joint appointment as ENS lecturer Maıtre de conference attachee a l’ENS
2012–2015 CNRS, Laboratoire d’Hydrodynamique (LadHyX), Ecole Poly-technique, FranceCNRS researcher Chargee de recherche CNRS
2010–2012 Princeton University/GFDL Atmosphere Ocean Science Dept.Associate Research Scholar, with Isaac Held
2008–2010 Massachusetts Institute of Technology (MIT) Earth, Atmosphericand Planetary Sciences Dept.Postdoctoral Associate, with Paul O’Gorman
Summers of 2004, 2005 and 2006 NASA Goddard Institute for Space StudiesSummer research intern, with Vittorio Canuto and Armando Howard
Education Courant Institute of Mathematical Sciences, New York University
PhD Applied Mathematics, May 2008MS Mathematics, May 2005• PhD title: Wave-induced mixing in the abyssal ocean• Advisor: Oliver Buhler
Georgia Institute of Technology
MS Aerospace Engineering, March 2003 - selective dual degree program withSupaero• Master’s thesis topic: A wavelet method for solving optimal control problems• Advisor: Panagiotis Tsiotras
Supaero, Ecole Nationale Superieure de l’Aeronautique et de l’Espace,France
Engineering degree, March 2003• Ranked first on the competitive entrance exam for Supaero, Math major

HDR Caroline Muller, Sept. 2019 65
Distinctions 2019–2024 ERC Starting GrantEuropean Research Council (ERC)
2019 Invited professor - Spring semesterNew York University - Abu Dhabi campus
2012–2017 Director of the graduate summer school “Fluid Dynamics ofSustainability and the Environment” (FDSE): annual summer schoolco-organized by Ecole Polytechnique & the University of Cambridgefdse.org
2016 Invited professor - Spring semesterNew York University - Shanghai campus
2015 Joint appointment as ENS lecturer
Ecole Normale Superieure, Paris2009 Publication selected to be an “Editor’s Highlight”
Geophysical Research Letter2007 “Sandra Bleistein” Prize for notable achievement in applied math
Courant Institute of Mathematical Sciences2007 Nominated for Outstanding Teaching Award
New York University, College of Arts and Sciences2007 Best poster presentation award
AMS 16th Conference on Atmospheric and Oceanic Fluid Dynamics2003–2008 Henry MacCracken Fellowship
New York University Graduate School of Arts and Sciences1999 Ranked first on the entrance exam for Supaero, Math major
Supaero, Ecole Nationale Superieure de l’Aeronautique et de l’Espace
Outreach 2017–present Public seminars on tropical cyclones and on climate change
Les Houches City Hall (2017); L’Institut des Hautes Etudes pour laScience et la Technologie (IHEST, 2018); La Direction Generale del’Armement (2017)
2017–present Appearances in the media on hurricanes and on climate changeTelevision (France Info - France television; BFMTV; LCI television;M6 including their famous scientific TV show E=M6; France O);Radio (AFP; France culture); Written press (Newspaper 20 minutes)
2015–present Scientific popularization participation and scientific presentationsat numerous eventsOpen doors days at ENS; Alumni visits at ENS; High-school studentsdays; science for kids events
Organization of scientific meetings and graduate schools2019 Co-organizer of the ICTP graduate summer school on cloud organi-
zation and climate sensitivity, Trieste Italy (2 week school)2012–present Co-organizer of the graduate summer school FDSE (2 week school)2018 Co-organizer of the graduate summer school ”Cloud Modeling” at
ENS Paris (1 week school)2017 Co-organizer of the conference AMA - “Ateliers de Modelisation de
l’Atmosphere” (1 week workshop)2015 Co-organizer of the conference “NewWave” on internal waves (3 day
workshop)

HDR Caroline Muller, Sept. 2019 66
PhD commit-tees
2019 Member of the PhD committee (reviewer) of Jiawei BaoThe University of New South Wales, Australia; advisor StevenSherwood
2018 Member of the PhD committee of Antoine RenaudENS Lyon, advisor Antoine Venaille
2018 Member of the PhD committee of Maxence LefevreSorbonne Universite, advisor Sebastien Lebonnois
2018 Member of the PhD committee of Grimaud PilletENS Lyon, advisor Thierry Dauxois
2018 Member of the PhD committee of Keshav RajaLEGI, advisor Joel Sommeria
2017 Member of the PhD committee of Jessica LoriauxKNMI, De Bilt, The Netherlands, advisor Pier Siebesma
2017 Member of the PhD committee of David CoppinLMD, advisor Sandrine Bony
2015 Member of the PhD committee of Tamara Beitzel-BarriquandLOCEAN, advisor Pascale Bouruet-Aubertot
Administration 2018–present Editor for the journal Current Climate Change Reports2016–present Elected member of the laboratory committee of LMD2018 Vice-president of the search committee for an assistant pro-
fessor position at ENS Paris2017 Member of the search committee for an assistant professor position,
Universite de la Polynesie Francaise2012–2017 Director of the FDSE graduate summer school2016–2017 Organizer of laboratory (LMD) seminars at ENS
2014–2015 Organizer of laboratory (LadHyX) seminars at Ecole Polytechnique2010–2012 Organizer of the climate dynamics seminar at Princeton University2008–2010 Created and ran a journal club to discuss papers on climate
science MIT2003–present Reviewer for several journals, including Nature, Nature Geo-
science, Nature Climate Change, Proceedings of the NationalAcademy of Sciences, Reviews of Geophysics, Geophysical Re-search Letters, Journal of Geophysical Research - Atmospheres,Journal of Geophysical Research - Oceans, Journal of Climate,Journal of the Atmospheric Sciences, Journal of Physical Oceanog-raphy, Environmental Research Letters, Journal of Advances inModeling Earth Systems, Journal of Fluid Mechanics, QuarterlyJournal of the Royal Meteorological Society

HDR Caroline Muller, Sept. 2019 67
Main fundings & participation in national and international projects2019–2024 PI, ERC Starting Grant, funded by ERC:
organisation of CLoUdS, and implications for Tropical cyclones and for the En-ergetics of the tropics, in current and in a waRming climate
2018–2019 PI, PSL/NYU international collaborative project, funded by PSL (consortium ofFrench universities and research institutions) and NYU (New York University):New perspectives on tropical cyclone formation and intensification
2018–2021 PI, LMD collaborative project, funded by LEFE (French national funding pro-gram from CNRS-INSU):Robustness Of the Self-Aggregation of convection to Large-scale forcing, and im-plications for precipitation over tropical Islands
2017–2018 co-PI, PI: B. Legras, PSL collaborative project, funded by PSL (consortium ofFrench universities and research institutions):Analyse de la croissance et morphologie des amas nuageux par methodes varia-tionnelles d’imagerie et de dynamique des fluides
2017–2019 co-PI, PI: L.Oruba, collaborative project, funded by LEFE (French nationalfunding program from CNRS-INSU):Ocean-Atmosphere interactions: oceanic mesoscale eddies and tropical cyclones
2016–2017 PI, ENS collaborative project, funded by ENS Actions Incitatives:Role of small-scale Ocean dynamics in the large-scale Oceanic and atmosphericCirculation
2016–2017 PI, LadHyX collaborative project, funded by Chaire DDX-EDF (Chair for Sus-tainable Development) at Ecole Polytechnique:Role of ocean Internal waves in the ocean Circulation
2016–2017 PI, France-Berkeley international collaborative project, funded by the France-Berkeley fund:Impact of Self- Aggregation on Cyclogenesis
2015–2016 PI, LadHyX/LMD collaborative project, funded by Chaire DDX-EDF:Modeled Aggregation of Convection And Cyclogenesis
2014–2015 PI, LadHyX/LMD collaborative project, funded by Chaire DDX-EDF:Organization of Convection in the Tropical Atmosphere
2013–2017 PI, PhD funding, funded by Direction Generale de l’Armement (DGA):Dissipation Of Tidal Energy in the Deep Ocean
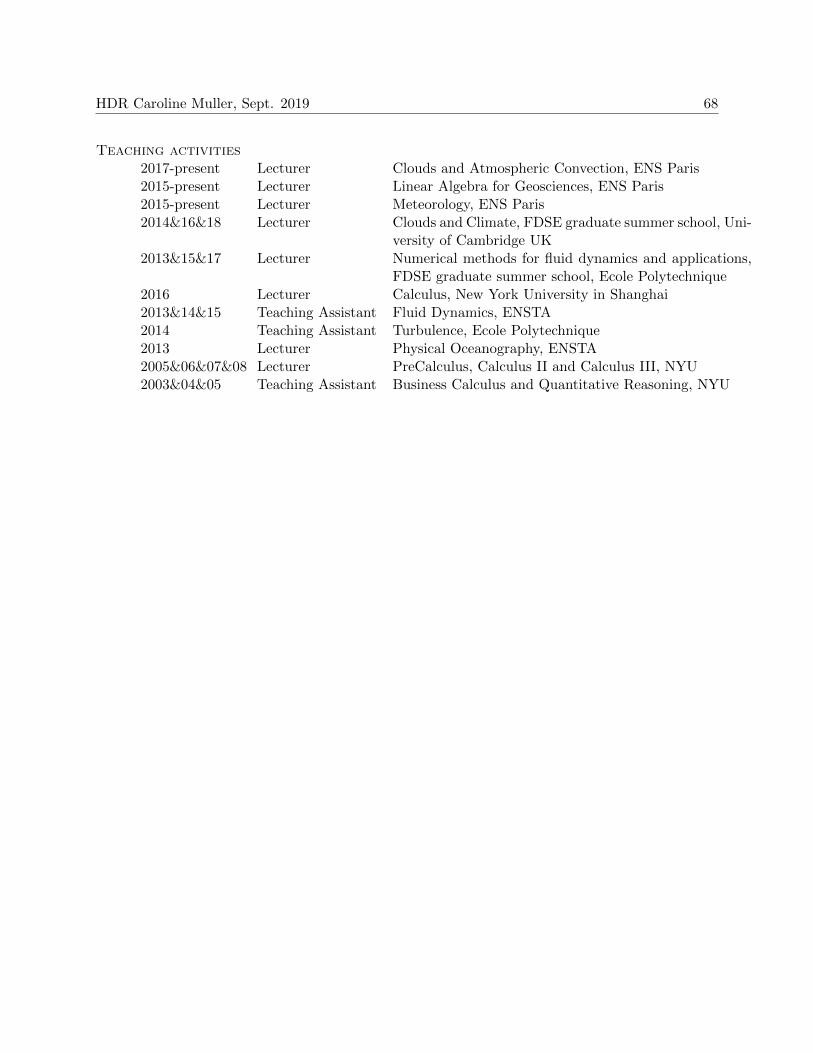
HDR Caroline Muller, Sept. 2019 68
Teaching activities2017-present Lecturer Clouds and Atmospheric Convection, ENS Paris2015-present Lecturer Linear Algebra for Geosciences, ENS Paris2015-present Lecturer Meteorology, ENS Paris2014&16&18 Lecturer Clouds and Climate, FDSE graduate summer school, Uni-
versity of Cambridge UK2013&15&17 Lecturer Numerical methods for fluid dynamics and applications,
FDSE graduate summer school, Ecole Polytechnique2016 Lecturer Calculus, New York University in Shanghai2013&14&15 Teaching Assistant Fluid Dynamics, ENSTA2014 Teaching Assistant Turbulence, Ecole Polytechnique2013 Lecturer Physical Oceanography, ENSTA2005&06&07&08 Lecturer PreCalculus, Calculus II and Calculus III, NYU2003&04&05 Teaching Assistant Business Calculus and Quantitative Reasoning, NYU

HDR Caroline Muller, Sept. 2019 69
.2 Supervisions
The superscript ∗ indicates supervisions with publications, and those publications are listed below.
Postdocs2019 (ongoing) Nicolas Da Silva∗, main supervisor2017–2018 (1 year) Jean-Baptiste Courbot, co-supervisor (main supervisor Bernard Legras
LMD)Now maıtre de conferences at the Universite de Haute Alsace
PhD2017–2020 (ongoing) Sara Shamekh∗, co-supervisor (main supervisor Fabio D’Andrea LMD)2014–2017 (3 years) Oceane Richet∗, main supervisor (co-supervisor Jean-Marc Chomaz Lad-
HyX)Now postdoctoral researcher on a 3-year fellowship at the university of Tas-mania
Masters2017 (2 months) Phuong Nguyen, main supervisor Masters 1 internship2016 (6 months) Marius Guerard, main supervisor Masters 2 internship (co-supervisors
Sandrine Bony and Thomas Dubos LMD)2014 (2 months) Bastien Alonzo∗, co-supervisor Masters 1 internship (main supervisor
Philippe Drobinski LMD)2014 (4 months) Nicolas Da Silva∗, co-supervisor Masters 1 internship (main supervisor
Philippe Drobinski LMD)2014 (6 months) Keshav Raja, main supervisor Masters 2 internship2014 (6 months) Adrien Lefauve∗, main supervisor Masters 2 internship2013 (6 months) Francois Lefeuvre, main supervisor Masters 2 internship (co-supervisor
Jean-Marc Chomaz LadHyX)2013 (6 months) Jonathan Morgan, main supervisor Masters 2 internship (co-supervisor
Jean-Marc Chomaz LadHyX)Licences (undergraduates)
2018 (1 month) Basile Poujol, main supervisor L3 internship2018 (1 month) Victoria Etonno, main supervisor L3 internship2017 (1 month) Octave Tessiot, main supervisor L3 internship2016 (4 months) Hugo Cui, main supervisor L3 research project (one day per week, co-
supervisor Bernard Legras LMD)2014 (3 months) Tom Beucler, main supervisor L3 research project (one day per week)2013 (3 months) Adrien Boch, main supervisor L3 research project (one day per week)
Publications from those supervisions:
1. Da Silva N. ∗, S. Shamekh∗, C. Muller, 2019, Impact of convective self-aggregation on precip-itation extremes, in preparation
2. Shamekh S.∗, C. Muller, J.-P. Duvel, F. D’Andrea, 2019 How do ocean warm anomalies favorthe aggregation of deep convective clouds?, in review
3. Richet O.∗, J.-M. Chomaz, C. Muller, 2018, Internal tide dissipation at topography: triadic

HDR Caroline Muller, Sept. 2019 70
resonant instability equatorward and evanescent waves poleward of the critical latitude J.Geophys. Res. - Oceans, 123
4. Richet O.∗, C. Muller, J.-M. Chomaz, 2017, Impact of a mean current on the internal tideenergy dissipation at the critical latitude J. Phys. Oceanogr., doi: 10.1175/JPO-D-16-0197.1.
5. Drobinski P., N. Da Silva∗, G. Panthou, S. Bastin, C. Muller, B. Ahrens, M. Borga, D.Conte, G. Fosser, F. Giorgi, I. Guttler, V. Kotroni, L. Li, E. Morin, B. Onol, P. Quintana-Segui, R. Romera T. Csaba Zsolt, 2016, Scaling precipitation extremes with temperature inthe Mediterranean: past climate assessment and projection in anthropogenic scenarios Clim.Dyn., doi:10.1007/s00382-016-3083-x
6. Drobinski P., B. Alonzo∗, S. Bastin, N. Da Silva∗, C. Muller, 2016, Scaling of precipitationextremes with temperature in the French Mediterranean region: what explains the hook shape?J. Geophys. Res. - Atmospheres, 121
7. Lefauve∗ A., C. Muller, A. Melet, 2015, A three-dimensional map of tidal dissipation overabyssal hills J. Geophys. Res. - Oceans, 120

HDR Caroline Muller, Sept. 2019 71
.3 List of publications and talks
Peer-reviewed publications(my updated list of publications is available at http://www.lmd.ens.fr/muller/pub.html)
1. Da Silva N., S. Shamekh, C. Muller, 2019, Impact of convective self-aggregation on precipita-tion extremes Environmental Research Letters, in preparation.
2. Muller C., Y. Takayabu, 2019, Response of precipitation extremes to warming: what havewe learned from theory and idealized cloud-resolving simulations? Environmental ResearchLetters, to be submitted.Review paper
3. Shamekh S., C. Muller, J.-P. Duvel, F. D’Andrea, 2019, How do ocean warm anomalies favorthe aggregation of deep convective clouds? in review.
4. Muller C., 2019, Clouds in current and in a warming climate Chapter contribution to the bookof lecture notes, from the Les Houches Summer School: Fundamental Aspects of TurbulentFlows in Climate, Volume 108, August 2017 Oxford University Press, in review.
5. Richet O., J.-M. Chomaz, C. Muller, 2018, Internal tide dissipation at topography: triadicresonant instability equatorward and evanescent waves poleward of the critical latitude Journalof Geophysical Research - Oceans, 123.
6. Muller C., D. Romps, 2018, Amplification of tropical cyclogenesis by self-aggregation feedbacksProceedings of the National Academy of Sciences, 201719967; DOI: 10.1073/pnas.1719967115.
7. Zuidema P., G. Torri, C. Muller, 2017, Precipitation-induced atmospheric cold pools overoceans and their interactions with the larger-scale environment Surveys in Geophysics, 38Review paper
8. Holloway C. , A. Wing, S. Bony, C. Muller, H. Masunaga, T. L’Ecuyer, D. Turner, P. Zuidema,2017, Observing Convective Aggregation Surveys in Geophysics, 38
9. Wing A., K. Emanuel, C. Holloway, C. Muller, 2017, Convective self-aggregation in numericalsimulations : a review Surveys in Geophysics, 38Review paper
10. Richet O., C. Muller, J.-M. Chomaz, 2017, Impact of a mean current on the internal tide en-ergy dissipation at the critical latitude Journal of Physical Oceanography, doi: 10.1175/JPO-D-16-0197.1.
11. Drobinski P., N. Da Silva, G. Panthou, S. Bastin, C. Muller, B. Ahrens, M. Borga, D. Conte,G. Fosser, F. Giorgi, I. Guttler, V. Kotroni, L. Li, E. Morin, B. Onol, P. Quintana-Segui,R. Romera T. Csaba Zsolt, 2016, Scaling precipitation extremes with temperature in theMediterranean: past climate assessment and projection in anthropogenic scenarios ClimateDynamics, doi:10.1007/s00382-016-3083-x
12. Drobinski P., B. Alonzo, S. Bastin, N. Da Silva, C. Muller, 2016, Scaling of precipitationextremes with temperature in the French Mediterranean region: what explains the hook shape?Journal of Geophysical Research - Atmospheres, 121

HDR Caroline Muller, Sept. 2019 72
13. Lefauve A., C. Muller, A. Melet, 2015, A three-dimensional map of tidal dissipation overabyssal hills Journal of Geophysical Research - Oceans, 120
14. Muller C., S. Bony 2015, What favors convective aggregation, and why? Geophysical ResearchLetters, 42
15. Melet A., M. Nikurashin, C. Muller, S. Falahat, J. Nycander, P. Timko, B. Arbic, J. Goff,2013, Internal tide generation by abyssal hills using analytical theory Journal of GeophysicalResearch - Oceans, 118
16. Muller C., 2013, Impact of convective organization on the response of tropical precipitationextremes to warming, Journal of Climate, 26
17. Muller C., I.M. Held, 2012, Detailed investigation of the self-aggregation of convection incloud-resolving simulations Journal of the Atmospheric Sciences, 69
18. Muller C., P.A. O’Gorman, 2011, An energetic perspective on the regional response of precip-itation to climate change Nature Climate Change, 1
19. Muller C., P.A. O’Gorman, L.E. Back, 2011, Intensification of precipitation extremes withwarming in a cloud-resolving model Journal of Climate, 24
20. O’Gorman P.A., C. Muller, 2010, How closely do changes in surface and column water vaporfollow Clausius-Clapeyron scaling in climate-change simulations? Environmental ResearchLetters, 5ERL news article about this paper
21. Canuto V., A.M. Howard, Y. Cheng, C. Muller, A. Leboissetier and S.R. Jayne, 2010, Oceanturbulence III: New GISS vertical mixing scheme Ocean Modelling, 34
22. Muller C., L.E. Back, P.A. O’Gorman, and K.A. Emanuel, 2009, A model for the relationshipbetween tropical precipitation and column water vapor Geophysical Research Letters, 36Chosen to be an editor’s highlight
23. Muller C. and O. Buhler, 2009, Saturation of the internal tides and induced mixing in theabyssal ocean Journal of Physical Oceanography, 39
24. Buhler O. and C. Muller, 2007, Instability and focusing of internal tides in the deep oceanJournal of Fluid Mechanics, 588
Other publications
1. Muller C., S. Bony, 2016, Self-Aggregation of atmospheric convection in idealized simulations,Workshop report, Oberwolfach Workshop Multiscale Interactions in Geophysical Fluids
2. Muller C., 2016, Dynamique des fluides geophysiques, l’experience Chinoise, News article,Journal du Bureau du CNRS en Chine
3. Muller C., A. Lefauve, 2014, A worldwide map of tidal dissipation Scientific contribution forthe exhibition Lost in Fathoms by A. Tondeur & J.M. Chomaz, GV Art gallery London.

HDR Caroline Muller, Sept. 2019 73
4. Muller C., A. Melet, M. Nikurashin, 2013, Abyssal Hill Roughness Impact on Internal TideGeneration: Linear Theory Communication for the workshop OGOA “Ondes de Gravite dansl’Ocean et l’Atmosphere” 23-24 may 2013 ENS Lyon
5. Muller C.J., 2008, Wave-induced mixing above the abyssal seafloor Ph.D. Thesis, New YorkUniversity
6. Muller C.J., 2007. Communications from CFM2007 18e congres francais de mecanique aGrenoble, august 2007 http://irevues.inist.fr/cfm2007
Invited talks(my updated list of talks is available at http://www.lmd.ens.fr/muller/talks.html)
1. Geopolitique du risque seminar series, Oct 2018, ENS Paris
2. Journee Geosciences et Societes for professors of “classes preparatoires”, Oct 2018, ENSParis
3. Workshop on Non-Hydrostatic Ocean Modeling, Oct 2018, Brest
4. WCRP workshop WCRP Grand Challenge on Weather and Climate Extremes/GEWEXGlobal Data and Analysis Panel workshop, Offenbach, Germany, July 2018
5. EGU meeting (European Geophysical Union), Understanding past, present and futurechanges in the hydrological cycle session, Vienna, Austria, Apr 2018
6. University of Cambridge, Fluid Mechanics Seminar - Department of Applied Mathematicsand Theoretical Physics DAMTP, Mar 2018
7. Journee thematique Institut Pierre Simon Laplace IPSL. Seminar Cyclones and cli-mate change, Feb 2018
8. Institut des Hautes Etudes pour la Science et la Technologie (IHEST); Ministerede l’Enseignement superieur, de la Recherche et de l’Innovation, Seminaire et table ronde,Tropical cyclones, Jan 2018
9. Direction Generale de l’Armement (DGA), Seminar, Dans l’oeil du cyclone, Dec 2017
10. Reunion du Groupement De Recherche (GDR) Megha-Tropiques Self-aggregationof atmospheric convection in idealized simulations, Nov 2017
11. Les Houches city hall, public seminar, Le changement climatique vu des nuages, France,Aug 2017
12. Les Houches ecole de physique, graduate-level courses. Fundamental aspects of turbulentflows in climate dynamics, France, Aug 2017
13. Gordon Research Conference on Radiation & Climate, Connecting Observations toGlobal Circulation Modeling Challenges, Portland, USA, July 2017

HDR Caroline Muller, Sept. 2019 74
14. Minisymposium KNMI, Convective extreme precipitation at mid-latitudes, Netherlands,Jan 2017
15. AGU Fall Meeting (American Geophysical Union), San Francisco, USA, Dec 2016
16. Oberwolfach meeting, Multiscale interactions in geophysical fluids, Germany, Aug 2016
17. University of Edinburgh, Trapped Waves and wave radiation in fluid mechanics workshop,Scotland, July 2016
18. Imperial College, Atmospheric Physics Seminar, UK, June 2016
19. ETH Zurich, Workshop Cloud and boundary layer dynamics: the next decade, Switzerland,June 2016
20. Conference on Mathematical Geophysics, Paris, France, June 2016
21. New York University - Shanghai, Partial Differential Equations Seminar, Shanghai,China, May 2016
22. EGU meeting (European Geophysical Union), Hydrological cycle session (invitation de-clinee), Vienna, Austria, Apr 2016
23. International Space Science Institute Workshop, Bern, Switzerland, Feb 2016
24. University of Reading, Meteorology Departmental Seminars, Oct 2015
25. University of Reading, Mathematics of Planet Earth, London Mathematical Society (LMS),Sept 2015
26. UC Berkeley, Atmospheric Sciences Center seminar, USA, Aug 2015
27. ESPCI Paris Bifurcations and Instabilities in Fluid Dynamics, France July 2015
28. Les Houches ecole de physique, Theoretical advances in planetary flows and climatedynamics, France, Mar 2015
29. Geophysical Fluid Dynamics (GFD) summer school, Climate physics and dynamics,Woods Hole MA, USA, Aug 2014
30. Latsis Symposium Atmosphere and Climate Dynamics: From Clouds to Global Circula-tions, Zurich, Switzerland, June 2014
31. Grand Challenge Workshop Clouds, circulation and climate sensitivity, Germany, Mar2014
32. Lorenz center workshop MIT Cambridge MA, USA, Feb 2014
33. Max Planck Institute for Meteorology KlimaCampus Seminar, Hamburg, Germany,Nov 2013
34. National Oceanic & Atmospheric Administration (NOAA) Physical Sciences DivisionSeminar, Boulder CO, USA, Oct 2013
35. Texas Tech University Red Raider Mini-Symposium, Lubbock TX, USA, Oct 2013

HDR Caroline Muller, Sept. 2019 75
.4 List of 5 selected publications attached with this document
1. Richet O., J.-M. Chomaz, C. Muller, 2018, Internal tide dissipation at topography: triadicresonant instability equatorward and evanescent waves poleward of the critical latitude Journalof Geophysical Research - Oceans, 123.
2. Muller C., D. Romps, 2018, Amplification of tropical cyclogenesis by self-aggregation feedbacksProceedings of the National Academy of Sciences, 201719967; DOI: 10.1073/pnas.1719967115.
3. Wing A., K. Emanuel, C. Holloway, C. Muller, 2017, Convective self-aggregation in numericalsimulations : a review Surveys in Geophysics, 38Review paper
4. Muller C., S. Bony 2015, What favors convective aggregation, and why? Geophysical ResearchLetters, 42
5. Muller C., 2013, Impact of convective organization on the response of tropical precipitationextremes to warming, Journal of Climate, 26

HDR Caroline Muller, Sept. 2019 76

Bibliography
[Attema et al., 2014] Attema, J. J., Loriaux, J. M., and Lenderink, G. (2014). Extreme precipita-tion response to climate perturbations in an atmospheric mesoscale model. Environ. Res. Lett.,9(1):014003.
[Bao and Sherwood, 2019] Bao, J. and Sherwood, S. C. (2019). The role of convective self-aggregation in extreme instantaneous versus daily precipitation. J. Adv. Model. Earth Syst.,11(1):19–33.
[Bell, 1975] Bell, T. H. (1975). Lee waves in stratified flows with simple harmonic time dependence.J. Fluid Mech., 67:705–722.
[Betts and Harshvardhan, 1987] Betts, A. K. and Harshvardhan (1987). Thermodynamic con-straint on the cloud liquid water feedback in climate models. J. Geophys. Res., 92(7):8483–8485.
[Bony et al., 2015] Bony, S., Stevens, B., and Coauthors (2015). Clouds, circulation and climatesensitivity. Nature Geosci.
[Bourget et al., 2013] Bourget, B., Dauxois, T., Joubaud, S., and Odier, P. (2013). Experimentalstudy of parametric subharmonic instability for internal plane waves. J. Fluid Mech., 723:1–20.
[Bretherton et al., 2005] Bretherton, C. S., Blossey, P. N., and Khairoutdinov, M. (2005). Anenergy-balance analysis of deep convective self-aggregation above uniform SST. J. Atmos. Sci.,62(12):4273–4292.
[Buhler and Muller, 2007] Buhler, O. and Muller, C. J. (2007). Instability and focusing of internaltides in the deep ocean. J. Fluid Mech., 588:1–28.
[Chelton, 2011] Chelton, D. (2011). Global observations of nonlinear mesoscale eddies. Prog.Oceanogr.
[Coppin and Bony, 2017] Coppin, D. and Bony, S. (2017). Internal variability in a coupled generalcirculation model in radiative-convective equilibrium. Geophys. Res. Lett., 44.
[Da Silva et al., 2019] Da Silva, N., Shamekh, S., and Muller, C. J. (2019). Impact of convectiveself-aggregation on precipitation extremes. Environ. Res. Lett., (to be submitted).
[Davis, 2015] Davis, C. A. (2015). The formation of moist vortices and tropical cyclones in idealizedsimulations. J. Atmos. Sci., 72(9):3499–3516.
77
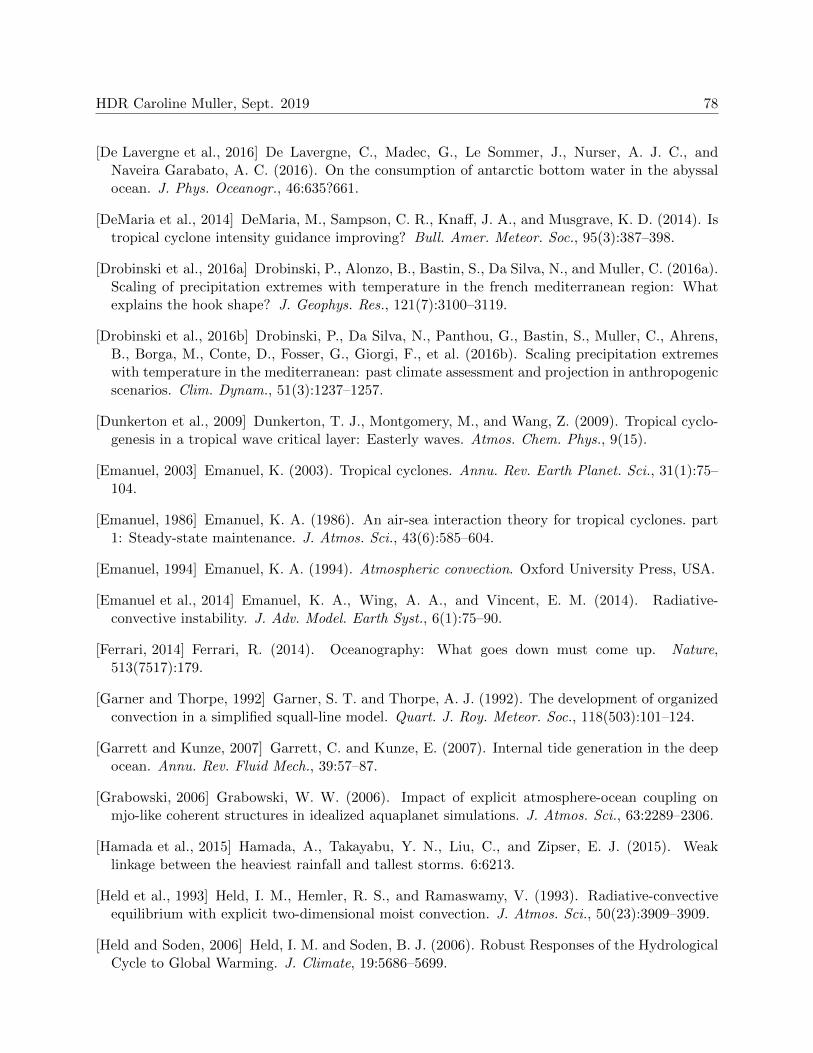
HDR Caroline Muller, Sept. 2019 78
[De Lavergne et al., 2016] De Lavergne, C., Madec, G., Le Sommer, J., Nurser, A. J. C., andNaveira Garabato, A. C. (2016). On the consumption of antarctic bottom water in the abyssalocean. J. Phys. Oceanogr., 46:635?661.
[DeMaria et al., 2014] DeMaria, M., Sampson, C. R., Knaff, J. A., and Musgrave, K. D. (2014). Istropical cyclone intensity guidance improving? Bull. Amer. Meteor. Soc., 95(3):387–398.
[Drobinski et al., 2016a] Drobinski, P., Alonzo, B., Bastin, S., Da Silva, N., and Muller, C. (2016a).Scaling of precipitation extremes with temperature in the french mediterranean region: Whatexplains the hook shape? J. Geophys. Res., 121(7):3100–3119.
[Drobinski et al., 2016b] Drobinski, P., Da Silva, N., Panthou, G., Bastin, S., Muller, C., Ahrens,B., Borga, M., Conte, D., Fosser, G., Giorgi, F., et al. (2016b). Scaling precipitation extremeswith temperature in the mediterranean: past climate assessment and projection in anthropogenicscenarios. Clim. Dynam., 51(3):1237–1257.
[Dunkerton et al., 2009] Dunkerton, T. J., Montgomery, M., and Wang, Z. (2009). Tropical cyclo-genesis in a tropical wave critical layer: Easterly waves. Atmos. Chem. Phys., 9(15).
[Emanuel, 2003] Emanuel, K. (2003). Tropical cyclones. Annu. Rev. Earth Planet. Sci., 31(1):75–104.
[Emanuel, 1986] Emanuel, K. A. (1986). An air-sea interaction theory for tropical cyclones. part1: Steady-state maintenance. J. Atmos. Sci., 43(6):585–604.
[Emanuel, 1994] Emanuel, K. A. (1994). Atmospheric convection. Oxford University Press, USA.
[Emanuel et al., 2014] Emanuel, K. A., Wing, A. A., and Vincent, E. M. (2014). Radiative-convective instability. J. Adv. Model. Earth Syst., 6(1):75–90.
[Ferrari, 2014] Ferrari, R. (2014). Oceanography: What goes down must come up. Nature,513(7517):179.
[Garner and Thorpe, 1992] Garner, S. T. and Thorpe, A. J. (1992). The development of organizedconvection in a simplified squall-line model. Quart. J. Roy. Meteor. Soc., 118(503):101–124.
[Garrett and Kunze, 2007] Garrett, C. and Kunze, E. (2007). Internal tide generation in the deepocean. Annu. Rev. Fluid Mech., 39:57–87.
[Grabowski, 2006] Grabowski, W. W. (2006). Impact of explicit atmosphere-ocean coupling onmjo-like coherent structures in idealized aquaplanet simulations. J. Atmos. Sci., 63:2289–2306.
[Hamada et al., 2015] Hamada, A., Takayabu, Y. N., Liu, C., and Zipser, E. J. (2015). Weaklinkage between the heaviest rainfall and tallest storms. 6:6213.
[Held et al., 1993] Held, I. M., Hemler, R. S., and Ramaswamy, V. (1993). Radiative-convectiveequilibrium with explicit two-dimensional moist convection. J. Atmos. Sci., 50(23):3909–3909.
[Held and Soden, 2006] Held, I. M. and Soden, B. J. (2006). Robust Responses of the HydrologicalCycle to Global Warming. J. Climate, 19:5686–5699.

HDR Caroline Muller, Sept. 2019 79
[Holloway et al., 2017] Holloway, C., Wing, A. A., Bony, S., Muller, C., Masunaga, H., L’Ecuyer,T., Turner, D., and Zuidema, P. (2017). Observing convective aggregation. Surv. Geophys., 38.
[Holloway and Neelin, 2009] Holloway, C. E. and Neelin, J. D. (2009). Moisture vertical structure,column water vapor, and tropical deep convection. J. Atmos. Sci., 66(6):1665–1683.
[Holloway and Woolnough, 2016] Holloway, C. E. and Woolnough, S. J. (2016). The sensitivity ofconvective aggregation to diabatic processes in idealized radiative-convective equilibrium simu-lations. J. Adv. Model. Earth Syst., 8(1):166–195.
[Iribarne and Godson, 1981] Iribarne, J. V. and Godson, W. L. (1981). Atmospheric thermody-namics. Springer. Section 9.14.
[Khairoutdinov and Emanuel, 2013] Khairoutdinov, M. and Emanuel, K. (2013). Rotatingradiative-convective equilibrium simulated by a cloud-resolving model. J. Adv. Model. EarthSyst., 5(4):816–825.
[Khairoutdinov and Emanuel, 2010] Khairoutdinov, M. F. and Emanuel, K. A. (2010). Aggregatedconvection and the regulation of tropical climate. Preprints, 29th conference on Hurricanes andTropical Meteorology, Tucson, AZ, Amer. Meteor. Soc., P2.69.
[Khairoutdinov and Randall, 2003] Khairoutdinov, M. F. and Randall, D. A. (2003). Cloud-resolving modeling of the arm summer 1997 iop: Model formulation, results, uncertainties andsensitivities. J. Atmos. Sci., 60:607–625.
[Kharin et al., 2007] Kharin, V. V., Zwiers, F. W., Zhang, X., and Hegerl, G. C. (2007). Changes intemperature and precipitation extremes in the ipcc ensemble of global coupled model simulations.J. Climate, 20:1419–1444.
[Kuang, 2012] Kuang, Z. (2012). Weakly forced mock walker cells. J. Atmos. Sci., 69:2759–2786.
[Lefauve et al., 2015] Lefauve, A., Muller, C., and Melet, A. (2015). A three-dimensional map oftidal dissipation over abyssal hills. J. Geophys. Res., 120(7):4760–4777.
[Legg, 2014] Legg, S. (2014). Scattering of low-mode internal waves at finite isolated topography.J. Phys. Oceanogr., 44(1):359–383.
[Loriaux et al., 2013] Loriaux, J. M., Lenderink, G., De Roode, S. R., and Siebesma, A. P. (2013).Understanding convective extreme precipitation scaling using observations and an entrainingplume model. J. Atmos. Sci., 70(11):3641–3655.
[Lutsko and Cronin, 2018] Lutsko, N. J. and Cronin, T. W. (2018). Increase in precipitation ef-ficiency with surface warming in radiative-convective equilibrium. J. Adv. Model. Earth Syst.,10(11):2992–3010.
[MacKinnon et al., 2013] MacKinnon, J. A., Alford, M. H., Sun, O., Pinkel, R., Zhao, Z., andKlymak, J. (2013). Parametric subharmonic instability of the internal tide at 29◦N. J. Phys.Oceanogr., 43(1):17–28.
[MacKinnon and Winters, 2005] MacKinnon, J. A. and Winters, K. B. (2005). Subtropical catas-trophe: Significant loss of low-mode tidal energy at 28.9◦N. Geophys. Res. Lett., 32(15).

HDR Caroline Muller, Sept. 2019 80
[Manabe and Strickler, 1964] Manabe, S. and Strickler, R. F. (1964). Thermal equilibrium of theatmosphere with a convective adjustment. J. Atmos. Sci., 21(4):361–385.
[Mapes, 1993] Mapes, B. E. (1993). Gregarious tropical convection. J. Atmos. Sci., 50(13):2026–2037.
[Marshall et al., 1997] Marshall, J., Adcroft, A., Hill, C., Perelman, L., and Heisey, C. (1997). Afinite-volume, incompressible navier stokes model for studies of the ocean on parallel computers.J. Geophys. Res., 102(C3):5753–5766.
[Maurer et al., 2016] Maurer, P., Joubaud, S., and Odier, P. (2016). Generation and stability ofinertia–gravity waves. J. Fluid Mech., 808:539–561.
[Mauritsen and Stevens, 2015] Mauritsen, T. and Stevens, B. (2015). Missing iris effect as a possiblecause of muted hydrological change and high climate sensitivity in models. Nature Geosci.,8(5):346.
[Melet et al., 2013a] Melet, A., Hallberg, R., Legg, S., and Polzin, K. (2013a). Sensitivity ofthe ocean state to the vertical distribution of internal-tide-driven mixing. J. Phys. Oceanogr.,43(3):602–615.
[Melet et al., 2013b] Melet, A., Nikurashin, M., Muller, C., Falahat, S., J., N., G., T. P., K., A. B.,and A., G. J. (2013b). Internal tide generation by abyssal hills using analytical theory. J.Geophys. Res., 118:6303–6318.
[Muller, 2019] Muller, C. (2019). Clouds in current and in a warming climate. Chapter contributionto the book of lecture notes from “Les Houches 2017 Summer School: Fundamental Aspects ofTurbulent Flows in Climate”. Editors: F. Bouchet, C. Salomon, T. Schneider, A. Venaille. OxfordUniversity Press.
[Muller, 2013] Muller, C. J. (2013). Impact of convective organization on the response of tropicalprecipitation extremes to warming. J. Climate, 26:5028–5043.
[Muller et al., 2009] Muller, C. J., Back, L. E., O’Gorman, P. A., and Emanuel, K. A. (2009). Amodel for the relationship between tropical precipitation and column water vapor. Geophys. Res.Lett., 36:L16804.
[Muller and Bony, 2015] Muller, C. J. and Bony, S. (2015). What favors convective aggregationand why? Geophys. Res. Lett., 42.
[Muller and Buhler, 2009] Muller, C. J. and Buhler, O. (2009). Saturation of the internal tides andinduced mixing in the abyssal ocean. J. Phys. Oceanogr., 39:2077–2096.
[Muller and Held, 2012] Muller, C. J. and Held, I. M. (2012). Detailed investigation of the self-aggregation of convection in cloud-resolving simulations. J. Atmos. Sci., 69:2551–2565.
[Muller and O’Gorman, 2011] Muller, C. J. and O’Gorman, P. A. (2011). An energetic perspectiveon the regional response of precipitation to climate change. Nature Climate Change, 1(5):266–271.

HDR Caroline Muller, Sept. 2019 81
[Muller et al., 2011] Muller, C. J., O’Gorman, P. A., and Back, L. E. (2011). Intensification ofprecipitation extremes with warming in a cloud-resolving model. J. Climate, 24(11):2784–2800.
[Muller and Romps, 2018] Muller, C. J. and Romps, D. M. (2018). Acceleration of tropical cyclo-genesis by self-aggregation feedbacks. Proc. Natl. Acad. Sci. (USA), page 201719967.
[Muller and Takayabu, 2019] Muller, C. J. and Takayabu, Y. (2019). Response of precipitation ex-tremes to warming: what have we learned from theory and idealized cloud-resolving simulations?Environ. Res. Lett., (to be submitted).
[Munk and Wunsch, 1998] Munk, W. and Wunsch, C. (1998). Abyssal recipes II: energetics of tidaland wind mixing. Deep-Sea Res. Part I: Oceanogr. Res. Papers, 45:1977–2010.
[Nikurashin and Legg, 2011] Nikurashin, M. and Legg, S. (2011). A mechanism for local dissipationof internal tides generated at rough topography. J. Phys. Oceanogr., 41(2):378–395.
[Nikurashin and Vallis, 2012] Nikurashin, M. and Vallis, G. (2012). A theory of the interhemi-spheric meridional overturning circulation and associated stratification. J. Phys. Oceanogr.,42(10):1652–1667.
[Nikurashin et al., 2013] Nikurashin, M., Vallis, G. K., and Adcroft, A. (2013). Routes to energydissipation for geostrophic flows in the southern ocean. Nature Geosci., 6(1):48.
[O’Gorman, 2015] O’Gorman, P. A. (2015). Precipitation extremes under climate change. Curr.Clim. Change Rep., 1(2):49–59.
[O’Gorman and Muller, 2010] O’Gorman, P. A. and Muller, C. J. (2010). How closely do changes insurface and column water vapor follow Clausius-Clapeyron scaling in climate-change simulations?Environ. Res. Lett., 5:025207.
[O’Gorman and Schneider, 2009] O’Gorman, P. A. and Schneider, T. (2009). The physical basisfor increases in precipitation extremes in simulations of 21st-century climate change. Proc. Natl.Acad. Sci. (USA), 106:14773–14777.
[Parodi and Emanuel, 2009] Parodi, A. and Emanuel, K. A. (2009). A theory for buoyancy andvelocity scales in deep moist convection. J. Atmos. Sci., 66:3449–3463.
[Polzin et al., 1997] Polzin, K. L., Toole, J. M., Ledwell, J. R., and Schmitt, R. W. (1997). Spatialvariability of turbulent mixing in the abyssal ocean. Science, 276(5309):93–96.
[Ramsay and Sobel, 2011] Ramsay, H. A. and Sobel, A. H. (2011). Effects of relative and absolutesea surface temperature on tropical cyclone potential intensity using a single-column model. J.Climate, 24(1):183–193.
[Richet et al., 2018] Richet, O., Chomaz, J.-M., and Muller, C. (2018). Internal tide dissipationat topography: Triadic resonant instability equatorward and evanescent waves poleward of thecritical latitude. J. Geophys. Res., 123(9):6136–6155.
[Richet et al., 2017] Richet, O., Muller, C., and Chomaz, J.-M. (2017). Impact of a mean current onthe internal tide energy dissipation at the critical latitude. J. Phys. Oceanogr., 47(6):1457–1472.

HDR Caroline Muller, Sept. 2019 82
[Romps, 2011] Romps, D. M. (2011). Response of tropical precipitation to global warming. J.Atmos. Sci., 68(1):123–138.
[Rotunno et al., 1988] Rotunno, R., Klemp, J. B., and Weisman, M. L. (1988). A theory for strong,long-lived squall lines. J. Atmos. Sci., 45(3):463–4.
[Shamekh et al., 2019] Shamekh, S., Muller, C., Duvel, J.-P., and D’Andrea, F. (2019). How doocean warm anomalies favor the aggregation of deep convective clouds? J. Atmos. Sci., (inreview).
[Shi and Bretherton, 2014] Shi, X. and Bretherton, C. S. (2014). Large-scale character of an at-mosphere in rotating radiative-convective equilibrium. J. Adv. Model. Earth Syst.
[Singh and O’Gorman, 2013] Singh, M. S. and O’Gorman, P. A. (2013). Influence of entrainmenton the thermal stratification in simulations of radiative-convective equilibrium. Geophys. Res.Lett., 40(16):4398–4403.
[Singleton and Toumi, 2013] Singleton, A. and Toumi, R. (2013). Super clausius–clapeyron scalingof rainfall in a model squall line. Quart. J. Roy. Meteor. Soc., page doi:10.1002/qj.1919.
[Smith and Sandwell, 1997] Smith, W. H. F. and Sandwell, D. T. (1997). Global Sea Floor Topog-raphy from Satellite Altimetry and Ship Depth Soundings. Science, 277:1956–1962.
[Sommeria et al., 2016] Sommeria, J., Ajayi, A.-O., Raja, K., Staquet, C., Viboud, S., and Voisin,B. (2016). Laboratory modelling of momentum transport by internal gravity waves and eddiesin the antarctic circumpolar current. In VIIIth International Symposium on Stratified Flows(ISSF).
[Staquet and Sommeria, 2002] Staquet, C. and Sommeria, J. (2002). Internal gravity waves: frominstabilities to turbulence. Annu. Rev. Fluid Mech., 34(1):559–593.
[Sugimoto et al., 2017] Sugimoto, S., Aono, K., and Fukui, S. (2017). Local atmospheric responseto warm mesoscale ocean eddies in the kuroshio–oyashio confluence region. Scientific reports,7(1):11871.
[Sugiyama et al., 2010] Sugiyama, M., Shiogama, H., and Emori, S. (2010). Precipitation extremechanges exceeding moisture content increases in MIROC and IPCC climate models. Proc. Natl.Acad. Sci. (USA), 107:571–575.
[Tan et al., 2015] Tan, J., Jakob, C., Rossow, W. B., and Tselioudis, G. (2015). Increases in tropicalrainfall driven by changes in frequency of organized deep convection. Nature, 519(7544):451.
[Thorpe, 2005] Thorpe, S. A. (2005). The Turbulent Ocean. Cambridge University Press.
[Tobin et al., 2012] Tobin, I., Bony, S., and Roca, R. (2012). Observational evidence for relation-ships between the degree of aggregation of deep convection, water vapor, surface fluxes, andradiation. J. Climate, 25:6885–6904.
[Tomassini et al., 2015] Tomassini, L., Voigt, A., and Stevens, B. (2015). On the connection be-tween tropical circulation, convective mixing, and climate sensitivity. Quart. J. Roy. Meteor.Soc., 141(689):1404–1416.

HDR Caroline Muller, Sept. 2019 83
[Tompkins, 2001] Tompkins, A. M. (2001). Organization of tropical convection in low vertical windshears: The role of water vapor. J. Atmos. Sci.
[Trenberth, 1999] Trenberth, K. E. (1999). Conceptual framework for changes of extremes of thehydrological cycle with climate change. Climatic Change, 42:327–339.
[Waterhouse et al., 2014] Waterhouse, A. F., MacKinnon, J. A., Nash, J. D., Alford, M. H., Kunze,E., Simmons, H. L., Polzin, K. L., St. Laurent, L. C., Sun, O. M., Pinkel, R., Talley, L. D.,Whalen, C. B., Huussen, T. N., Carter, G. S., Fer, I., Waterman, S., Naveira Garabato, A. C.,Sanford, T. B., and Lee, C. M. (2014). Global patterns of diapycnal mixing from measurementsof the turbulent dissipation rate. J. Phys. Oceanogr., 44:1854–1872.
[Wheeler and Kiladis, 1999] Wheeler, M. and Kiladis, G. N. (1999). Convectively coupled equato-rial waves: Analysis of clouds and temperature in the wavenumber–frequency domain. J. Atmos.Sci., 56(3):374–399.
[Wing et al., 2017] Wing, A., Emanuel, K., Holloway, C., and Muller, C. (2017). Convective self-aggregation in numerical simulations: A review. Surv. Geophys., 38.
[Wing et al., 2016] Wing, A. A., Camargo, S. J., and Sobel, A. H. (2016). Role of radiative–convective feedbacks in spontaneous tropical cyclogenesis in idealized numerical simulations. J.Atmos. Sci., 73(7):2633–2642.
[Wing and Cronin, 2016] Wing, A. A. and Cronin, T. W. (2016). Self-aggregation of convection inlong channel geometry. Quart. J. Roy. Meteor. Soc.
[Wing and Emanuel, 2014] Wing, A. A. and Emanuel, K. A. (2014). Physical mechanisms con-trolling self-aggregation of convection in idealized numerical modeling simulations. Journal ofAdvances in Modeling Earth Systems.
[Wunsch, 2000] Wunsch, C. (2000). Moon, tides and climate. Nature, 405:743–4.
[Wunsch and Ferrari, 2004] Wunsch, C. and Ferrari, R. (2004). Vertical mixing, energy, and thegeneral circulation of the oceans. Annu. Rev. Fluid Mech., 36(1):281–314.
[Young et al., 2008] Young, W. R., Tsang, Y.-K., and Balmforth, N. J. (2008). Near-inertial para-metric subharmonic instability. J. Fluid Mech., 607:25–49.
[Zuidema et al., 2017] Zuidema, P., Torri, G., Muller, C., and Chandra, A. (2017). Precipitation-induced atmospheric cold pools over oceans and their interactions with the larger-scale environ-ment. Surv. Geophys., 38.