Samsung Technical and Fundamental Analysis
25
Merrimack College Merrimack College Merrimack ScholarWorks Merrimack ScholarWorks Honors Program Contracts Honors Program Spring 2017 Samsung Technical and Fundamental Analysis Samsung Technical and Fundamental Analysis Stephen Janeczko Merrimack College, [email protected] Follow this and additional works at: https://scholarworks.merrimack.edu/honors_component Part of the Corporate Finance Commons, and the Finance and Financial Management Commons Recommended Citation Recommended Citation Janeczko, Stephen, "Samsung Technical and Fundamental Analysis" (2017). Honors Program Contracts. 6. https://scholarworks.merrimack.edu/honors_component/6 This Project - Open Access is brought to you for free and open access by the Honors Program at Merrimack ScholarWorks. It has been accepted for inclusion in Honors Program Contracts by an authorized administrator of Merrimack ScholarWorks. For more information, please contact [email protected].
-
Upload
khangminh22 -
Category
Documents
-
view
1 -
download
0
Transcript of Samsung Technical and Fundamental Analysis
Merrimack College Merrimack College
Merrimack ScholarWorks Merrimack ScholarWorks
Honors Program Contracts Honors Program
Spring 2017
Samsung Technical and Fundamental Analysis Samsung Technical and Fundamental Analysis
Stephen Janeczko Merrimack College, [email protected]
Follow this and additional works at: https://scholarworks.merrimack.edu/honors_component
Part of the Corporate Finance Commons, and the Finance and Financial Management Commons
Recommended Citation Recommended Citation Janeczko, Stephen, "Samsung Technical and Fundamental Analysis" (2017). Honors Program Contracts. 6. https://scholarworks.merrimack.edu/honors_component/6
This Project - Open Access is brought to you for free and open access by the Honors Program at Merrimack ScholarWorks. It has been accepted for inclusion in Honors Program Contracts by an authorized administrator of Merrimack ScholarWorks. For more information, please contact [email protected].
Honor Contact: Samsung Technical and Fundamental Analysis
1
Stephen Janeczko
5/11/17
Honors Contract: Samsung Technical
and Fundamental Analysis
Merrimack College
Investments
Author’s Note: This paper was prepared for Investments Section A taught by Professor Chen.
Honor Contact: Samsung Technical and Fundamental Analysis
2
Introduction
The name Samsung is recognizable in all areas of the world. Samsung is on the front of
the televisions, washers, etc. the average person uses, and they sponsor professional sports teams.
In every household in developed economies, you will see a product by Samsung in the living
room, kitchen, or bedroom. Samsung Electronics LTD., founded in South Korea in 1938, is a
leading provider of advanced technology, semiconductors, and other innovations in memory and
system integration. They are the leading electronics company in South Korea. Their line of
commercial products include DVD players, digital TVs, and digital still cameras; computers,
mobile phones, color monitors, LCD panels, and printers. Samsung is in the information
technology sector and the technology hardware and equipment industry. Their competition
includes, including giants like Apple, Panasonic, Sony Corporation and LG Electronics.
Samsung stock trades on the South Korean Stock Exchange in dominations of the Korean won
under ticker 005930:KS.
How Stephen Janeczko Capital Management Can Help
With a large company like Samsung, the average investor may have difficulty financially
evaluating the company. There are so many financial figures, ratios, ratings, betas, etc. that can
be found on the internet, and it can be hard to distinguish what the correct information is. At
Stephen Janeczko Capital Management, we have the tools and knowledge of experienced
analysts to help you with financially evaluating large companies to make your investment
decision process a lot easier. All of the information used in this evaluation of Samsung was
derived from Bloomberg terminal’s and Stephen Janeczko Capital Management’s calculations of
liquidity, growth, etc. ratios, and careful analysis of the company’s most recent annual reports:
Honor Contact: Samsung Technical and Fundamental Analysis
3
balance sheet 2016, income statement 2016, cash flow statement 2016, first quarter earnings
April 21, 2017. In this report, you will find a summary of current events with Samsung, current
events in the South Korean economy, financial statement analysis, ratio analysis for Samsung
and competitors, and stock recommendations based on current trading history. Looking ahead,
we will explain why Stephen Janeczko Capital Management thinks Samsung is not a good
investment at this point in time.
Political Turmoil: Samsung and South Korean Government
The never-ending problems within the executive board at Samsung is a cause for concern
for current and future investors. On February 16, 2017, current Samsung vice-chairman and
future heir of the company, Lee Jae Young, was arrested on charges of bribery with a campaign
leader of former President Park Geun-hye, Choi-Soon—il. Choi Soon-il was responsible for
extorting $69 million from big businessmen in South Korea to financially aide Ms. Park’s
campaign. Ms. Park was also responsible for other acts of fraudulence and political corruption,
which led to her arrest in March and official indictment on April 17, 2017. According to sources,
“Prosecutors allege Lee accepted then-President Park Geun-hye’s request to support equestrian
training for the daughter of a close friend, anticipating it would help secure government support
for business deals” (Kim, 2017, Retrieved from https://www.bloomberg.com/news/articles/2017-
04-19/samsung-heir-s-trial-homes-in-on-five-minutes-with-ex-president). Surprisingly and
disturbingly, Samsung has been the culprit of executive scandal in past years. Before Stephen
Janeczko Capital Management opened its doors, Samsung chairman Lee Kun Hee was indicted
on tax evasion and hiding money in secret stock accounts held by Lee Jae Young, his son, in
2008. At the end of 2009, South Korean President Lee Myung-bak pardoned Lee Kun Hee for
his crimes. According to the press, Lee-Myung-bak did this because he feared for the struggling
Honor Contact: Samsung Technical and Fundamental Analysis
4
South Korean Economy, and also so Lee Kun Hee could remain seated as one of the members of
the International Olympic Committee for the 2018 South Korea Winter Olympic games.
Samsung’s sketchy management control and lack of transparency should alarm investors.
Stephen Janeczko Capital Management believes that on an ethical standpoint, it would be unwise
to invest in Samsung given the past decade of corruption in which they have played a major role
in.
Samsung Galaxy Note Phones
The problems with Samsung are not only present in South Korea, but they are across the
globe as well. The most popular and recent news story that has gotten the most attention is the
exploding batteries and phone cases in the Samsung Galaxy Note 7 phones. In August of 2016,
Samsung began selling the devices across the globe, but shortly after, in September of 2016,
massive recalls began after concerned customers complained about the batteries and cases of the
phones exploding and setting on fire. After being sued from a man in Florida, who was severally
burnt from an exploding battery in his Samsung Galaxy Note 7, Samsung began the process of
recalling up to 96% of the Galaxy Note 7 phones they had sold up to September (Reuters, 2016,
Retrieved from http://finance.yahoo.com/news/timeline-samsung-electronics-galaxy-note-7-
recall-crisis-005434511--finance.html). On January 22, 2017, Samsung issued an expanded
recall on all Samsung Galaxy Note 7 devices. The statement claimed that customers could
exchange their devices for a new device of their choosing. Stephen Janeczko Capital
Management is concerned that future Samsung products, particularly mobile devices, may have
some issues like the Samsung Galaxy Note 7. As shown in the picture below, the battery issues
are not simple but complex. It will take much research and development to find out the problem
with the batteries (See a picture of exploding Samsung Galaxy Note 7 battery below).

Honor Contact: Samsung Technical and Fundamental Analysis
5
In April 2017, Samsung announced the official release of the new Samsung Galaxy Note
8 mobile devices in the second fiscal quarter of 2017. Samsung has much competition in this
area, as companies are planning to release phones around the same time like the Nokia 3310 by
Nokia, the 2017 Blackberry and most importantly, the iPhone 8 by Apple coming out in
September 2017. Unlike its predecessor, the new Samsung Galaxy Note 8 has an Infinity Screen
that allows users to take pictures and film in an expansive display. The phone also features
Bixby, an artificial intelligence device and Gear 360. Given the disaster Samsung had with the
Galaxy Note 7’s it is good that their newest phones have more features and amenities for
customers. However, it is uncertain as to whether the engineers at Samsung have fixed the
problems they had with the batteries in the Samsung Galaxy Note 7’s, the same batteries that are
to be used in the Samsung Galaxy Note 8’s. Investors should be optimistic about the mass sales
of the new Samsung phones come August, but they must be aware of the past. If the Samsung
Galaxy Note 8 phones becomes busts like its predecessor, Samsung could be in huge financial
trouble. (Khan, 2017, Retrieved from https://www.tapscape.com/samsung-galaxy-note-8-release-
date-specifications-design/).
Summary of Current News
Honor Contact: Samsung Technical and Fundamental Analysis
6
Needless to say, the arrest of the vice-president of Samsung, the demise of the Galaxy
Note 7’s, the uncertain future of the Galaxy Note 8’s have brought about discord and confusion
for everyone. Investors wonder if big businessmen like Lee Jae Young are running operations to
benefit themselves with lavish financial and political rewards. They wonder if the leaders of
Samsung have no concern for their customers. In South Korea, people have begun to grow tired
of the white collar crime that has occurred over the past year with Samsung and the South
Korean government. And although the newly inducted South Korean President, Moon Jae-in
promises to create more jobs and boost the growth potential of the economy with a stimulus
package, there is still uncertainty and unrest, meaning Samsung may have difficulties in the
future. Moreover, consumers are becoming more annoyed with having to return their devices to
Samsung.
Earnings Report
Yet shockingly, despite all of the problems and speculation, the stock price of Samsung
has hit new records. 2017 first quarter earnings for Samsung were fantastic and surpassed all
expectations and forecasts. On April 27, in South Korea, Samsung announced that revenue
increased by 0.77 trillion Korean Won from the previous quarter. According to their website, “In
the first quarter, sales for the memory and display businesses increased, owing to high
ASPs and strong sales of premium products. However, revenue from the mobile business
decreased due to a decline in flagship product sales” (Samsung, 2017, Retrieved from
https://news.samsung.com/global/samsung-electronics-announces-first-quarter-results-3).
Even better is the future outlook for Samsung’s second quarter earnings, as Samsung
expects continuous growth in its sectors dedicated to memory research, and they forecast
Honor Contact: Samsung Technical and Fundamental Analysis
7
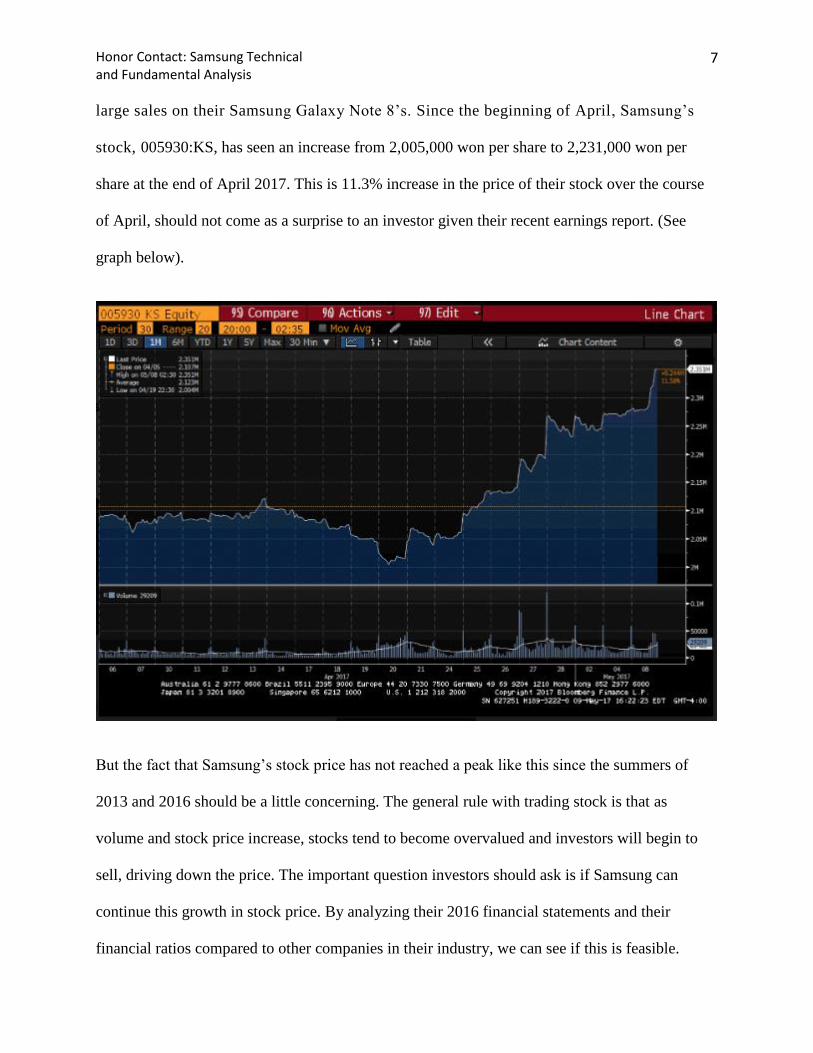
large sales on their Samsung Galaxy Note 8’s. Since the beginning of April, Samsung’s
stock, 005930:KS, has seen an increase from 2,005,000 won per share to 2,231,000 won per
share at the end of April 2017. This is 11.3% increase in the price of their stock over the course
of April, should not come as a surprise to an investor given their recent earnings report. (See
graph below).
But the fact that Samsung’s stock price has not reached a peak like this since the summers of
2013 and 2016 should be a little concerning. The general rule with trading stock is that as
volume and stock price increase, stocks tend to become overvalued and investors will begin to
sell, driving down the price. The important question investors should ask is if Samsung can
continue this growth in stock price. By analyzing their 2016 financial statements and their
financial ratios compared to other companies in their industry, we can see if this is feasible.
Honor Contact: Samsung Technical and Fundamental Analysis
8
(RTT News, 2017, Retrieved from http://www.rttnews.com/2767492/samsung-q1-profit-climbs-
sees-higher-earnings-ahead-stock-up.aspx).
Introduction to Fundamental and Technical Analysis
For the fundamental analysis of Samsung Electronics Co. LTD., Stephen Janeczko
Capital Management will compare financial ratios from the 2016 fiscal year end with four large
companies in the information technology and technology industries across the globe: Apple,
Sony, LG Electronics, and Lenovo LTD. Additionally, the most attention grabbing figures from
Samsung’s financial statements will be incorporated within the comparison of the ratios of the
five companies mentioned above. All information was retrieved from Bloomberg Market
Laboratories and other financial information giants like Morningstar, Reuters, and YAHOO!
Finance.
Current Ratio Analysis
As is standard, investors, especially those who may not be used to foreign investment,
should go top to bottom on the financial statements when deciding to purchase or sell stock. On
the balance sheet, this means looking at a company’s current assets and current liabilities. The
current ratio is one of the most important ratios to consider when evaluating an information
technology company, and it is easy to calculate. In the information technology industry and
technology hardware sector, the current ratio is used to measure the ability of a company to meet
short term obligations. Since technology companies like Samsung rely heavily on investors for
capital rather than assets, the current ratio is an important metric to the financial health of the
company. As of December 31, 2016, Samsung Electronics LTD. has a current ratio of 2.59.
Other competitors have the following current ratios as of December 31, 2016: Lenovo Group
Honor Contact: Samsung Technical and Fundamental Analysis
9
LTD 0.82, Apple 1.35, Sony Corporation 0.83, and LG Electronics 1.08. As one can see,
Samsung’s current ratio is significantly higher than its competitors. Also, this ratio is slightly
above the current information technology industry average of 2.48. The first positive of
Samsung’s current ratio is that it is not below one, which would indicate a negative working
capital. Moreover, the ratio proves that Samsung is able to use their short term assets to meet
their current liabilities. However, just because the current ratio of Samsung is high does not
mean that all of the short term assets that Samsung has are highly liquid. In fact, by looking at
the most recent balance sheet of Samsung, you can see that, trade receivables, marketable
inventory, and short-term financial instruments, account for 75% of Samsung’s current assets in
the year 2016. Additionally, 35% of Samsung’s assets go into property plant and equipment.
More importantly, current assets consists of more than 50% of the total assets of Samsung. This
being the case, how is Samsung trying to fulfill its needs long-term using its assets? Through
data analysis, Stephen Janeczko Capital Management has determined that Samsung, given the
amount of projects it is undertaking, should be investing more in long term assets. Furthermore,
this could potentially stunt the growth in the earning power and stock price of Samsung.
Debt to Equity Analysis
The debt to equity ratio is the most important ratio for determining the long-term
solvency of an information technology company. It measures how these companies use leverage,
or how they used borrowed money to increase the company’s intrinsic value. Along with other
technology companies, Samsung relies on taking up debt and investing in other technology
firms, mainly for purposes of product development. As of 2016, the debt to equity ratio of
Samsung was 7.92 in US dollars. Other companies in the information technology industry had
the following debt to equity ratios: Apple 67.86, Lenovo LTD 107.42, Sony Corporation 38.26,
Honor Contact: Samsung Technical and Fundamental Analysis
10
LG Electronics 64.83. The S&P 500 industry average for debt to equity in the information
technology industry as of April 19, 2017 was 57.45. Compared to top competitors and US
industry averages, Samsung has the smallest of short term debt to equity ratios. As an investor,
there are a few things to consider about these statistics. First off, Samsung’s lower debt to equity
ratio means that they are using less debt and have stronger equity positions. If you were to look
at their total liabilities in 2016, they amounted to $57,294.6 US dollars (in millions), compared to
their shareholder’s equity at $159,738.9. Although this is a positive signal for investment, it is
important to consider that 80% of Samsung’s liabilities used in calculating their debt to equity
ratio were current liabilities. This being the case, it is imperative that investors ask how much
debt is being used to support long-term investments. In 2016, of all of Samsung’s long term
liabilities, 50% of them were deferred tax liabilities, which basically are taxes not paid with the
years that they match. This principle goes back to the basic matching principle. Thus, it is
alarming to Stephen Janeczko Capital Management that difference between deducting tax for
accounting and tax purposes is so high for Samsung, and also that long term debt is not being
used heavily in the company. We believe that this could result in the increase of the debt to
equity ratio in years’ time, and over the next couple of decades, Samsung could become too
reliant on debt financing. Currently though, it an excellent ration compared to its competitors,
and as of now, should be looked at optimistically when it comes to investment decisions.
Gross Profit Margin Analysis
Gross profit margin, the profit margin that measures the gross profit earned on sales, is
another important metric to examine when financially analyzing an information technology
company. The ratio shows the capability of a company to become more profitable in the future,
and gauges how much revenue a company retains after all the direct cost associated with making

Honor Contact: Samsung Technical and Fundamental Analysis
11
a product. Unlike many information technology companies, Samsung produces a variety of
products, so this ratio is effective when determining how much the direct costs/cost of goods sold
factor into the revenue that Samsung makes. In 2016, Samsung had a gross profit margin ratio of
0.6, meaning that Samsung retains 60 cents for each dollar of revenue made. The S&P 500
information technology industry average gross profit margin at the end of 2016 was 0.22.
Clearly, Samsung has a better outlook on its gross profit margin than other major competitors in
its industry. However, as mentioned early, they lack of long-term investment in the financial
statements of Samsung is concerning to Stephen Janeczko Capital Management. We wonder that
because of this, Samsung’s gross profit margin may go down in the near future.
Cost of Debt Analysis
Any rational investor should consider the implications of the cost of debt and the cost of
equity of Samsung at this point in time. Stephen Janeczko calculated the cost of debt for shares
in Samsung by taking the rate of a five year non risky South Korean Government bond, 1.844%,
multiplied it by the current tax rate in South Korea, 24.2%, and multiplying the credit spread of a
5 year bond in Samsung and a 5 year treasury bond in South Korea, 0.17 (Trading Economics,
2017, Retrieved from http://www.tradingeconomics.com/south-korea/corporate-tax-rate). From
these figures, the calculated cost of debt before tax is 1.861% and the after tax cost of debt is
1.41%. Competitors of Samsung had the following cost of debt figures as of April 2017: Lenovo
LTD 4.5%, Sony Corp 0%, LG Electronics 1.2%, and Apple 1.8%. The average cost of debt of
information technology and electronic companies like Samsung is 4.05% as of 2016. Simply put,
this is an incredible number because it shows that compared to the market, Samsung uses less
debt financing to support short term and long term operations. This also explains why Samsung’s
debt to equity ratio is much lower than any of the competitors mentioned in this report. It shows
Honor Contact: Samsung Technical and Fundamental Analysis
12
that Samsung is able to make most of the assets it has to raise capital. The opposite of financing a
company with debt is to issue shares of stock, called equity financing. Companies who typically
use equity financing are either start-ups or companies who are struggling financially. This cost of
debt figure can also explain why Samsung’s bond ratings are A grade.
Cost of Equity Analysis
Cost of equity is figure that represents the compensation the market demands in exchange
for owning the asset and bearing the risk of ownership. Like cost of debt, the cost of equity of
Samsung is important to analyze because helps investors recognize the required rate of return they
should expect from their investment. As of April, the cost of equity of Samsung Electronics is 11.1%.
Competitors of Samsung had the following figures: Lenovo LTD 7.5%, Sony Corp 9.5%, LG
Electronics 9.9%, and Apple 10.9%. Paired with the lowest beta of the five competitors being
benchmarked, the cost to equity figure of Samsung, which is the highest of all of the figures, would
statistically be the most attractive investment.
CAPM Analysis
Another important model to consider is the capital asset pricing model. This metric
measures the expected returns of any stock that would have some level of risk investing in. As
calculated, when finding Samsung’s cost of debt, the risk free rate of Korean treasury bonds is
1.844%. Given that Samsung has the low beta of 0.47, it has lower risk than the market, which is
good for conservative investors. Finally, as of the end of April, the average 1 year return in the
South Korean Stock Exchange is 12.63%. Taking all of these figures into consideration, the
CAPM for Samsung stock is 6.91342% at the end of April. From this, Stephen Janeczko Capital
Management has concluded that the return on Samsung stock is not as high as stocks in the

Honor Contact: Samsung Technical and Fundamental Analysis
13
Korean Stock Exchange or any other U.S. stock markets simply because of the risk. As
mentioned, the beta is half of one basically. This number is great if the stock markets in South
Korea and the U.S. go down because for every 1% the market falls in that country, Samsung will
only fall by 0.5% However, the same cannot be said the other way around. If the market goes up
in South Korea, Samsung will only gain half of what the market is gaining. If you are a risk
tolerant investor who likes to make cash quickly, this is not a good investment, but if you are risk
averse, this return would not bother you as much. On another note, the low number calculated
through the CAPM model could also explain the dramatic decrease of sustainable growth rate at
Samsung. According to Investopedia, sustainable growth rate is “the maximum rate of growth
that a firm can sustain without having to increase financial leverage or look for outside
financing”. Going back to 2013, Samsung had a sustainable growth rate close to 19%, which was
unheard of in the last decade of the company’s history. As of April 2017, the sustainable growth
rate is only at 9%. Stephen Janeczko Capital Management begs to ask if there will be any
expansion of opportunity for Samsung investors in the next 5 to 10 years. With the low after tax
cost of debt, the low CAPM and beta, and the dramatic decrease in the sustainable growth rate
from 2013, Stephen Janeczko Capital Management doesn’t think that Samsung would be a good
investment for those who are looking for high volatility, risk, and reward. Furthermore, all of
these signs indicate a chance of Samsung’s stock price going down.
ROE Analysis
Another ratio that Stephen Janeczko Capital Management finds critical to examine is the
return on equity. Return on equity is a measurement that shows how much profit a company
makes with the investment of shareholders. As of December 31, 2016, Samsung’s return on
equity in US dollars was 10.94. Their competitors had the following ROE figures as of

Honor Contact: Samsung Technical and Fundamental Analysis
14
December 31, 2016: Apple Inc. 36.90, Lenovo -3.62, Sony 2.95, LG Electronics 0.95. The
industry’s average ROE in the year 2016 was 21.09. Although the ROE of a company is not the
end al be all of a company’s attractiveness to investors, this is a potentially significant warning
sign to investors. Samsung does not make as much money off of the investments of shareholders
compared to other companies in their industries, specifically Apple, one of their major
competitors. Like most capital management firms, Stephen Janeczko Capital Management puts a
15-20% ROE as a quality number for an investor. From 2010 to 2013, Samsung had met this
range. There are many theories that Stephen Janeczko Capital Management has as to why the
ROE had decreased 19.82 in 2013 to 10.94 in 2016. High tax rates can cause return on equity to
decrease gradually. From 2010 to 2017 the South Korean corporate tax rate has increased by
2.4% (Trading Economics, 2017, Retrieved from http://www.tradingeconomics.com/south-
korea/corporate-tax-rate). Low asset turnover ratios typically are a sign of operational deficiency
and therefore can have an impact on return on equity. As of 2016, Samsung’s asset turnover ratio
was 0.80. This low ratio means that per asset, Samsung is not generating as much revenue. Less
revenue results in less net income, which lowers return on equity. When looking at the income
statements from previous years at Samsung, Stephen Janeczko Capital Management sees a
steady decline in revenue. Samsung’s 2013 total revenue in US dollars was $209,026.50M.
Samsung’s 2014 total revenue in US dollars was $195,918.1M. Samsung’s 2015 revenue in US
dollars then dropped even further to 177,404.2M and $174,075.6M in 2016. Clearly this 20%
drop in revenue over the course of four years should be a warning sign to investors. For some
reason, Samsung cannot generate as much revenue as it could in previous years, which in
hindsight has lowered their asset turnover and return on equity ratios over the years. Once again,
it is another sign that the future movement of Samsung’s stock could go down.
Honor Contact: Samsung Technical and Fundamental Analysis
15
P/E Ratio Analysis
Price to earnings ratio is another important ratio Stephen Janeczko Capital Management
must compare amongst Samsung and its competitors. Price to earnings ratio or earnings multiple
ratio gives investors an idea of how the market will pay for a company’s earnings by taking the
current stock price and dividing it by earnings per share. As of April 2017, Samsung’s price to
earnings ratio was 14.12. Competitors had the following price to earnings ratios as of April:
Lenovo 11.61, Apple Inc. 17.54, Sony Corp 46.96, LG Electronics 167.54. The average price to
earnings ratio for companies in the information technology industry in April 2017 is 23.85. As of
Samsung is beating the current price to earnings ratio in their industry. Having a strong price to
earnings ratio means a few things for a company like Samsung. First off, a high price to earnings
ratio can show optimism for the future of the stock price. However, Stephen Janeczko Capital
Management questions this for multiple reason. For one, as stated before, their sustainable
growth rate and revenue have been decreasing since 2013. Corporate board corruption has also
led to investors to mistrust the company and their intentions. Additionally, some of Samsung’s
main competitors such as Apple, Sony Corp, LG Electronics have higher price to earnings ratios,
signifying that their stock prices have more room to grow compared to Samsung. Stephen
Janeczko Capital Management advises investors to be warned.
Candlestick Patterns 02/09/17 to 5/09/17 3 Months
Honor Contact: Samsung Technical and Fundamental Analysis
16
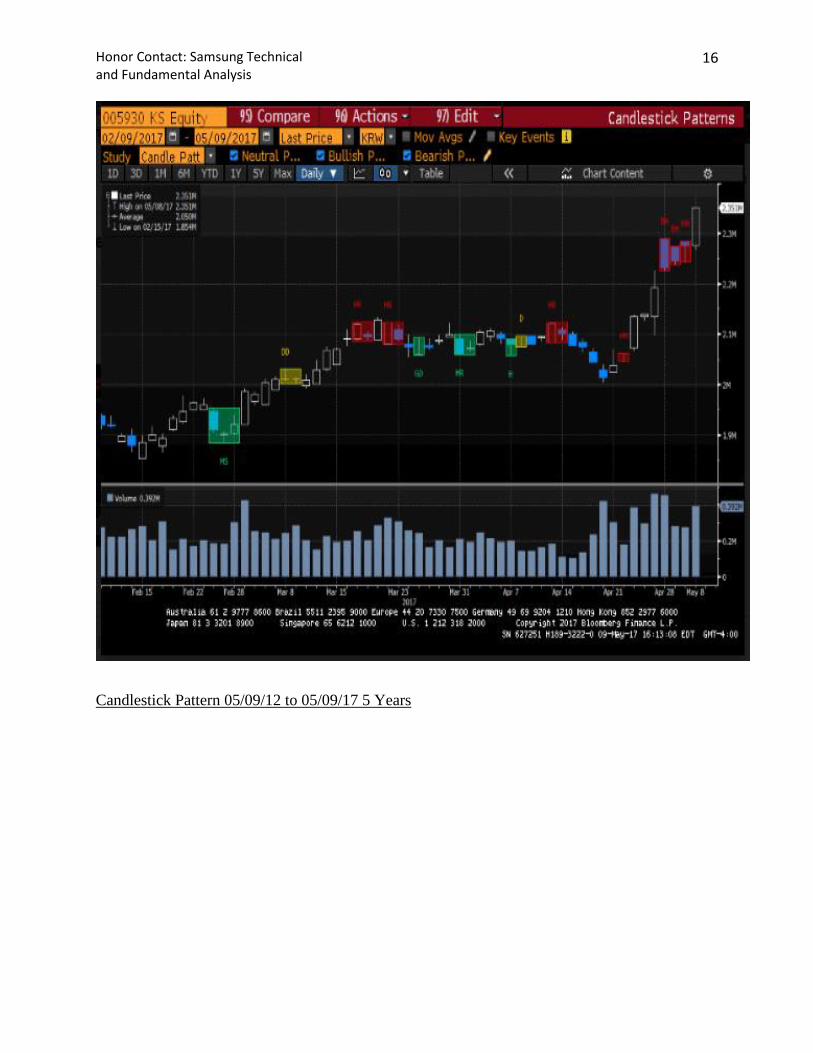
Candlestick Pattern 05/09/12 to 05/09/17 5 Years

Honor Contact: Samsung Technical and Fundamental Analysis
17
Prediction of Stock Price Next 3 Months
₩0.00
₩500,000.00
₩1,000,000.00
₩1,500,000.00
₩2,000,000.00
₩2,500,000.00
₩3,000,000.00
₩3,500,000.00
3 Month Prediction of Stock Price Movement
Honor Contact: Samsung Technical and Fundamental Analysis
18
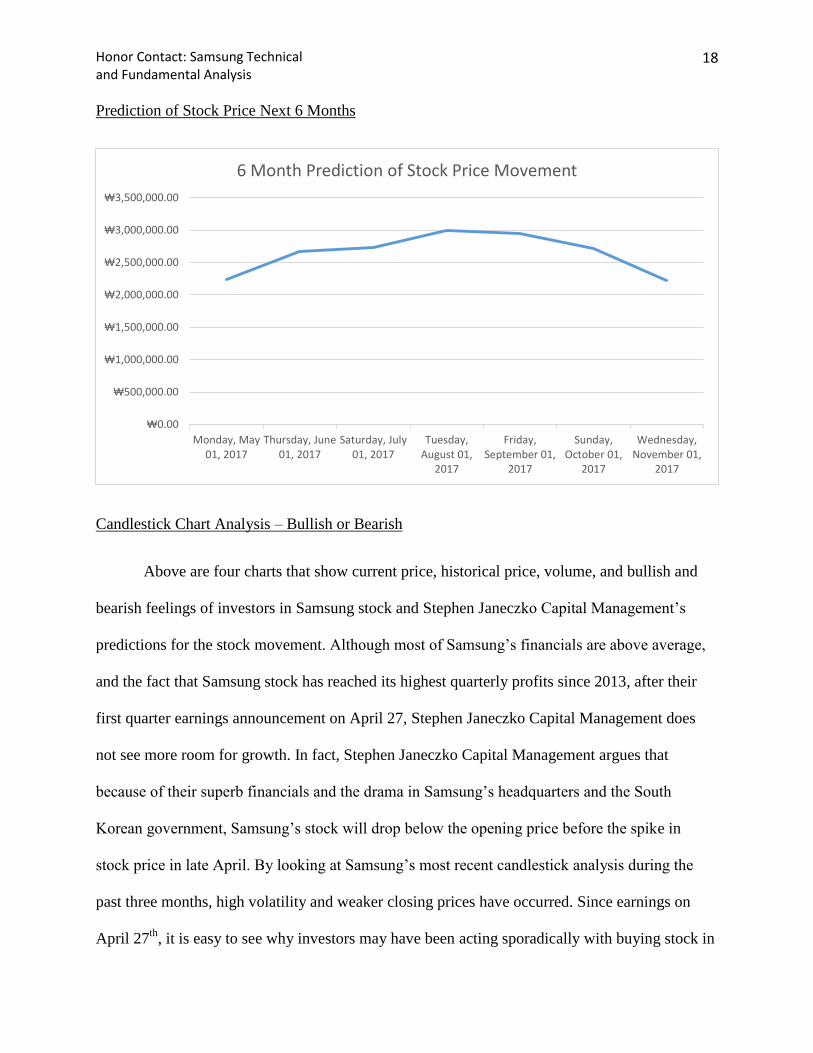
Prediction of Stock Price Next 6 Months
Candlestick Chart Analysis – Bullish or Bearish
Above are four charts that show current price, historical price, volume, and bullish and
bearish feelings of investors in Samsung stock and Stephen Janeczko Capital Management’s
predictions for the stock movement. Although most of Samsung’s financials are above average,
and the fact that Samsung stock has reached its highest quarterly profits since 2013, after their
first quarter earnings announcement on April 27, Stephen Janeczko Capital Management does
not see more room for growth. In fact, Stephen Janeczko Capital Management argues that
because of their superb financials and the drama in Samsung’s headquarters and the South
Korean government, Samsung’s stock will drop below the opening price before the spike in
stock price in late April. By looking at Samsung’s most recent candlestick analysis during the
past three months, high volatility and weaker closing prices have occurred. Since earnings on
April 27th
, it is easy to see why investors may have been acting sporadically with buying stock in
₩0.00
₩500,000.00
₩1,000,000.00
₩1,500,000.00
₩2,000,000.00
₩2,500,000.00
₩3,000,000.00
₩3,500,000.00
Monday, May01, 2017
Thursday, June01, 2017
Saturday, July01, 2017
Tuesday,August 01,
2017
Friday,September 01,
2017
Sunday,October 01,
2017
Wednesday,November 01,
2017
6 Month Prediction of Stock Price Movement
Honor Contact: Samsung Technical and Fundamental Analysis
19
Samsung. Uncertainty of the future leadership of Samsung and anticipation for the Samsung
Galaxy Note 8’s may also explain this high volatility too. Given this, Stephen Janeczko is
predicting a drop in the number of shares (volume) and price in Samsung stock. Our forecasted
figure can be seen above in the excel graphs. Clearly, Stephen Janeczko Capital Management has
bearish feelings towards the stock price of Samsung. We recommend that at this point in time,
investors sell short shares they have before the stock price drops in order to save any gains they
may have had from the earnings spike.
Conclusion
There is no doubt that Samsung, despite the corporate governance and agency problems,
is a great and powerful company. Although financial statements and earnings are above standard,
good things must come to an end at some point. Given the evidence written in this report,
Stephen Janeczko Capital Management does not see how Samsung’s stock can continue to rise
over the next three to six months. The current financial health of Samsung is good, but not
sustainable. It is best investors get out of the situation and keep their gains before losses start to
occur.
Honor Contact: Samsung Technical and Fundamental Analysis
20
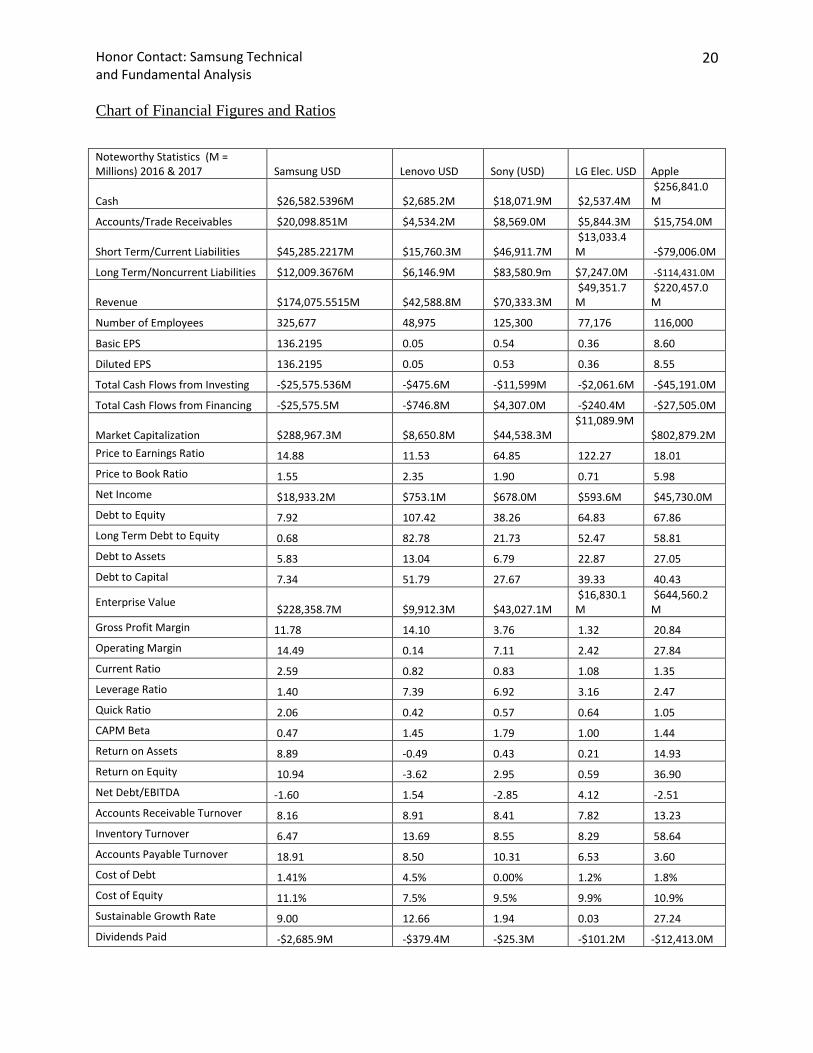
Chart of Financial Figures and Ratios
Noteworthy Statistics (M = Millions) 2016 & 2017 Samsung USD Lenovo USD Sony (USD) LG Elec. USD Apple
Cash $26,582.5396M $2,685.2M $18,071.9M $2,537.4M $256,841.0M
Accounts/Trade Receivables $20,098.851M $4,534.2M $8,569.0M $5,844.3M $15,754.0M
Short Term/Current Liabilities $45,285.2217M $15,760.3M $46,911.7M $13,033.4M -$79,006.0M
Long Term/Noncurrent Liabilities $12,009.3676M $6,146.9M $83,580.9m $7,247.0M -$114,431.0M
Revenue $174,075.5515M $42,588.8M $70,333.3M $49,351.7M
$220,457.0M
Number of Employees 325,677 48,975 125,300 77,176 116,000
Basic EPS 136.2195 0.05 0.54 0.36 8.60
Diluted EPS 136.2195 0.05 0.53 0.36 8.55
Total Cash Flows from Investing -$25,575.536M -$475.6M -$11,599M -$2,061.6M -$45,191.0M
Total Cash Flows from Financing -$25,575.5M -$746.8M $4,307.0M -$240.4M -$27,505.0M
Market Capitalization $288,967.3M $8,650.8M $44,538.3M $11,089.9M $802,879.2M
Price to Earnings Ratio 14.88 11.53 64.85 122.27 18.01
Price to Book Ratio 1.55 2.35 1.90 0.71 5.98
Net Income $18,933.2M $753.1M $678.0M $593.6M $45,730.0M
Debt to Equity 7.92 107.42 38.26 64.83 67.86
Long Term Debt to Equity 0.68 82.78 21.73 52.47 58.81
Debt to Assets 5.83 13.04 6.79 22.87 27.05
Debt to Capital 7.34 51.79 27.67 39.33 40.43
Enterprise Value $228,358.7M $9,912.3M $43,027.1M
$16,830.1M
$644,560.2M
Gross Profit Margin 11.78 14.10 3.76 1.32 20.84
Operating Margin 14.49 0.14 7.11 2.42 27.84
Current Ratio 2.59 0.82 0.83 1.08 1.35
Leverage Ratio 1.40 7.39 6.92 3.16 2.47
Quick Ratio 2.06 0.42 0.57 0.64 1.05
CAPM Beta 0.47 1.45 1.79 1.00 1.44
Return on Assets 8.89 -0.49 0.43 0.21 14.93
Return on Equity 10.94 -3.62 2.95 0.59 36.90
Net Debt/EBITDA -1.60 1.54 -2.85 4.12 -2.51
Accounts Receivable Turnover 8.16 8.91 8.41 7.82 13.23
Inventory Turnover 6.47 13.69 8.55 8.29 58.64
Accounts Payable Turnover 18.91 8.50 10.31 6.53 3.60
Cost of Debt 1.41% 4.5% 0.00% 1.2% 1.8%
Cost of Equity 11.1% 7.5% 9.5% 9.9% 10.9%
Sustainable Growth Rate 9.00 12.66 1.94 0.03 27.24
Dividends Paid -$2,685.9M -$379.4M -$25.3M -$101.2M -$12,413.0M
Honor Contact: Samsung Technical and Fundamental Analysis
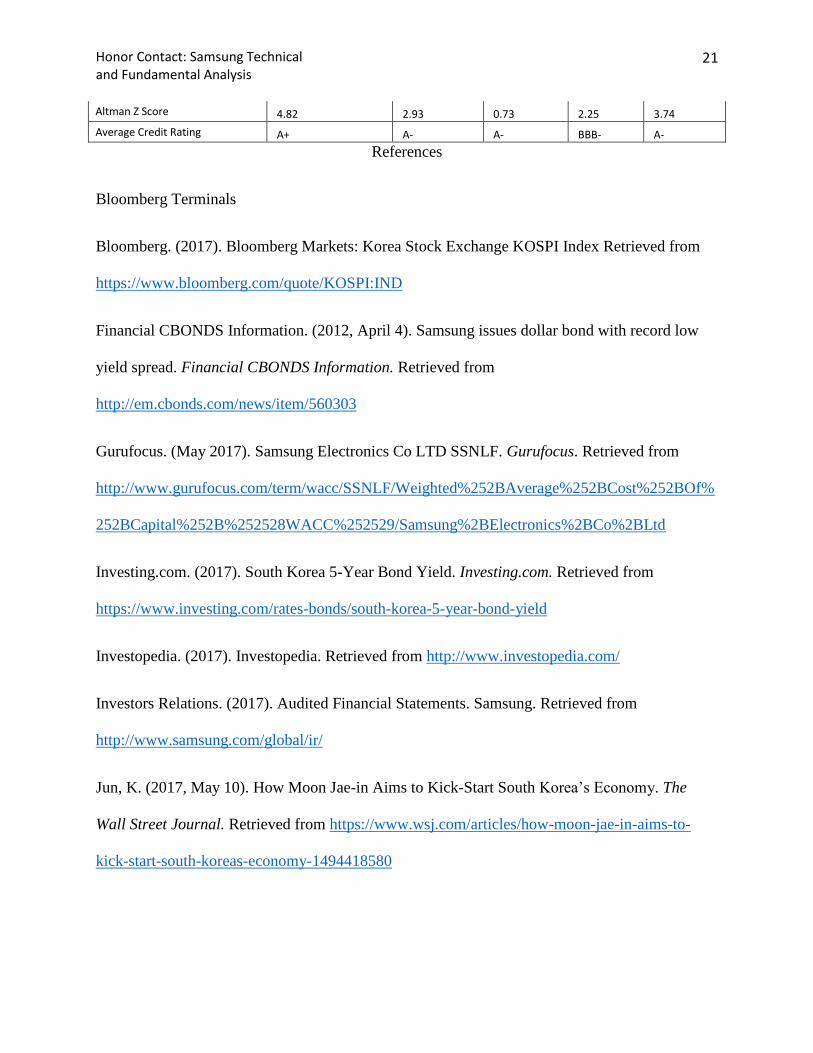
21
Altman Z Score 4.82 2.93 0.73 2.25 3.74
Average Credit Rating A+ A- A- BBB- A-
References
Bloomberg Terminals
Bloomberg. (2017). Bloomberg Markets: Korea Stock Exchange KOSPI Index Retrieved from
https://www.bloomberg.com/quote/KOSPI:IND
Financial CBONDS Information. (2012, April 4). Samsung issues dollar bond with record low
yield spread. Financial CBONDS Information. Retrieved from
http://em.cbonds.com/news/item/560303
Gurufocus. (May 2017). Samsung Electronics Co LTD SSNLF. Gurufocus. Retrieved from
http://www.gurufocus.com/term/wacc/SSNLF/Weighted%252BAverage%252BCost%252BOf%
252BCapital%252B%252528WACC%252529/Samsung%2BElectronics%2BCo%2BLtd
Investing.com. (2017). South Korea 5-Year Bond Yield. Investing.com. Retrieved from
https://www.investing.com/rates-bonds/south-korea-5-year-bond-yield
Investopedia. (2017). Investopedia. Retrieved from http://www.investopedia.com/
Investors Relations. (2017). Audited Financial Statements. Samsung. Retrieved from
http://www.samsung.com/global/ir/
Jun, K. (2017, May 10). How Moon Jae-in Aims to Kick-Start South Korea’s Economy. The
Wall Street Journal. Retrieved from https://www.wsj.com/articles/how-moon-jae-in-aims-to-
kick-start-south-koreas-economy-1494418580
Honor Contact: Samsung Technical and Fundamental Analysis
22
Khan, A. (2017, April 27). Samsung Galaxy Note 8 Release Date, Specifications and Design
(Updated). Tapscape. Retrieved from https://www.tapscape.com/samsung-galaxy-note-8-release-
date-specifications-design/
Kim S., and Hooyeon Kim. (2017, April 19). Korea Bribery Trial Focuses on Samsung Heir
Talks With President. Bloomberg Terminals. Retrieved from
https://www.bloomberg.com/news/articles/2017-04-19/samsung-heir-s-trial-homes-in-on-five-
minutes-with-ex-president
Lee, Se Young. (2017, April 13). As Samsung's profit surges, some investors worry about
peaking growth. YAHOO! Sports. Retrieved from http://sports.yahoo.com/news/samsungs-profit-
surges-investors-worry-peaking-growth-065817828--finance.html
Milton, A. (2016, August 2). How to Read a Candlestick Chart. The Balance. Retrieved from
https://www.thebalance.com/how-to-read-a-candlestick-chart-1031115
Morningstar. (May 2017). Samsung Electronics Co LTD SSNLF. Morningstar. Retrieved from
http://quicktake.morningstar.com/stocknet/bonds.aspx?symbol=ssnlf
Reuters. (2017). Technology Overview. Reuters. Retrieved from
http://www.reuters.com/assets/curtainMainContentLoader?view=RSM-US-Curtain-
MainContent-Sector-Technology
Reuters, (2016, October10). Timeline: Samsung Electronics' Galaxy Note 7 recall crisis.
YAHOO! Finance. Retrieved from http://finance.yahoo.com/news/timeline-samsung-electronics-
galaxy-note-7-recall-crisis-005434511--finance.html
Honor Contact: Samsung Technical and Fundamental Analysis
23
Robertson, T. (2017). How to Improve Return on Equity. Chron. Retrieved from
http://smallbusiness.chron.com/improve-return-equity-59183.html
RTT News. (2017, April 27). Samsung Q1 Profits Climb, See Higher Earnings Ahead; Stock Up.
RTT News Corporate News. Retrieved from http://www.rttnews.com/2767492/samsung-q1-
profit-climbs-sees-higher-earnings-ahead-stock-up.aspx
Samsung. (2017). Samsung Website. Samsung. Retrieved from
http://www.samsung.com/us/aboutsamsung/corporateprofile/history06.html
Samsung. (2017). Investors Relations Stock Chart. Samsung. Retrieved from
http://www.samsung.com/global/ir/stock-info/stock-chart/
Samsung Newsroom. (2017, April 27). Samsung Electronics Announces First Quarter Results.
Samsung. Retrieved from https://news.samsung.com/global/samsung-electronics-announces-
first-quarter-results-3
Sang-Hun, C. (2017, April 17). Park Geun-hye, Ousted President of South Korea, Is Formally
Indicted. The New York Times. Retrieved from
https://www.nytimes.com/2017/04/17/world/asia/park-geun-hye-south-korea-president-
indictment.html
Sang-Hun, C. (2008, April 17). Samsung's chairman is indicted for tax evasion in corruption
case. The New York Times. Retrieved from
http://www.nytimes.com/2008/04/17/business/worldbusiness/17iht-samsung.4.12107507.html
Honor Contact: Samsung Technical and Fundamental Analysis
24
Sang-Hun, C. and Paul Mozar. (2017, March 4). Samsung Bribery Scandal Threatens South
Korea Success Story. The New York Times. Retrieved from
https://www.nytimes.com/2017/03/04/business/south-korea-samsung-bribery-lee.html
Sang-Hun, C. (2016, October 31). Choi Soon-Sil, at Center of Political Scandal in South Korea,
Is Jailed. The New York Times. Retrieved from
https://www.nytimes.com/2016/11/01/world/asia/south-korea-park-geun-hye-choi-soon-sil.html
Sang-Hun, C. (2017, February 16). Lee Jae-Young, Samsung Heir, Is Arrested on Bribery
Charges. The New York Times. Retrieved from
https://www.nytimes.com/2017/02/16/world/asia/korea-samsung-lee-jae-yong.html?_r=0
Tarver, E. (2015, August 26). Key Financial Ratios to Analyze Tech Companies. Investopedia.
Retrieved from http://www.investopedia.com/articles/active-trading/082615/key-financial-ratios-
analyze-tech-companies.asp
Trading Economics. (2017) South Korea Corporate Tax Rate. Trading Economics. Retrieved
from http://www.tradingeconomics.com/south-korea/corporate-tax-rate