ventilation processes from building to city scale
43
ASI 1 ‐ Prof. Janet Barlow 1 The Breathing City – ventilation processes from building to city scale Prof Janet F. Barlow Professor in Environmental Physics Dept. of Meteorology, Uni. of Reading, UK Thanks to: Ewan O’Connor (lidar expertise) Rosy Wilson, John Lally (technical support) Westminster Council (Steve Neville), BT
-
Upload
khangminh22 -
Category
Documents
-
view
2 -
download
0
Transcript of ventilation processes from building to city scale

ASI 1 ‐ Prof. Janet Barlow
1
The Breathing City – ventilation processes from building to city scale
Prof Janet F. BarlowProfessor in Environmental Physics Dept. of Meteorology, Uni. of Reading, UK
Thanks to:Ewan O’Connor (lidar expertise)Rosy Wilson, John Lally (technical support)Westminster Council (Steve Neville), BT
ASI 1 ‐ Prof. Janet Barlow
2
3
Fūjin, Shinto God of The Wind
4
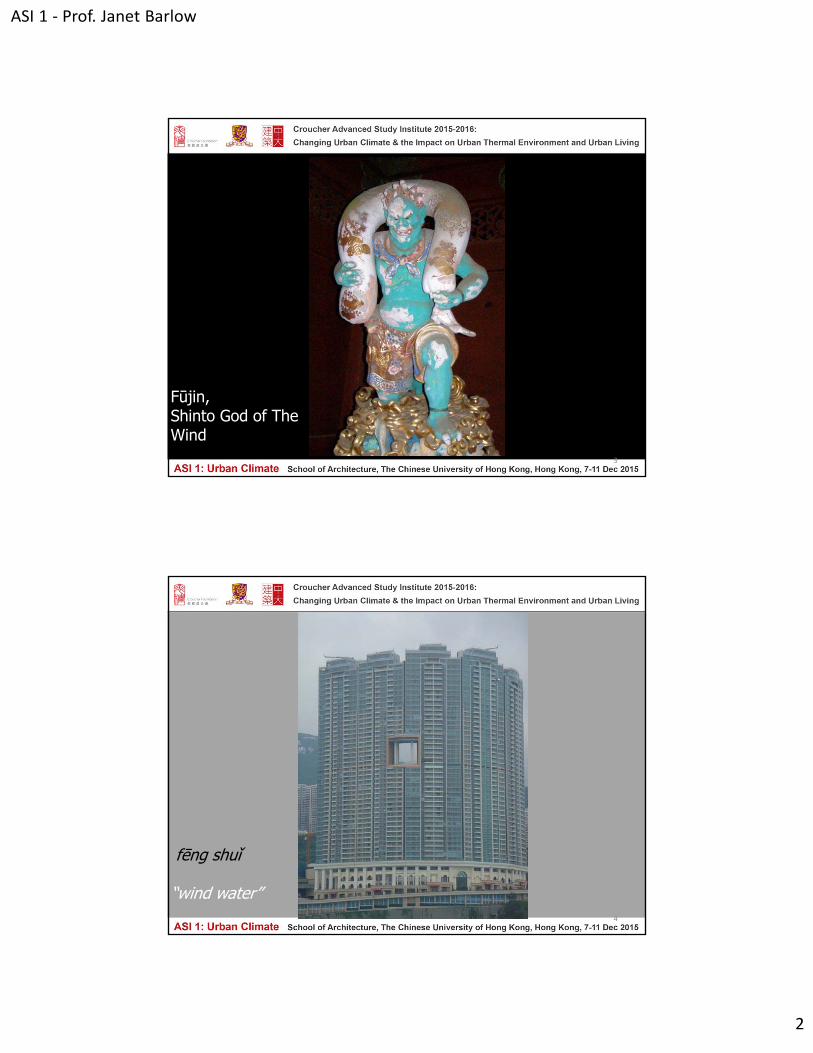
fēng shuǐ
“wind water”

ASI 1 ‐ Prof. Janet Barlow
3
Human ventilation
Building ventilation
Urban microclimates impacting building ventilation
Street to neighbourhood scale pollution dispersion
Urban boundary layer ventilation
Thermally driven flows – river, slope, sea breeze
Overview
London‐based urban research projects
DAPPLE (2002‐2009) – street level dispersion
(REPARTEE (2006‐2007) – vertical pollutant distribution)
ACTUAL (2009‐2014) – building design interactions with urban climate at a range of scales
ClearfLo (2010‐2013) – air quality at city scale
Refresh (2013‐2018) – indoor thermal comfort and human performance
ASI 1 ‐ Prof. Janet Barlow
4
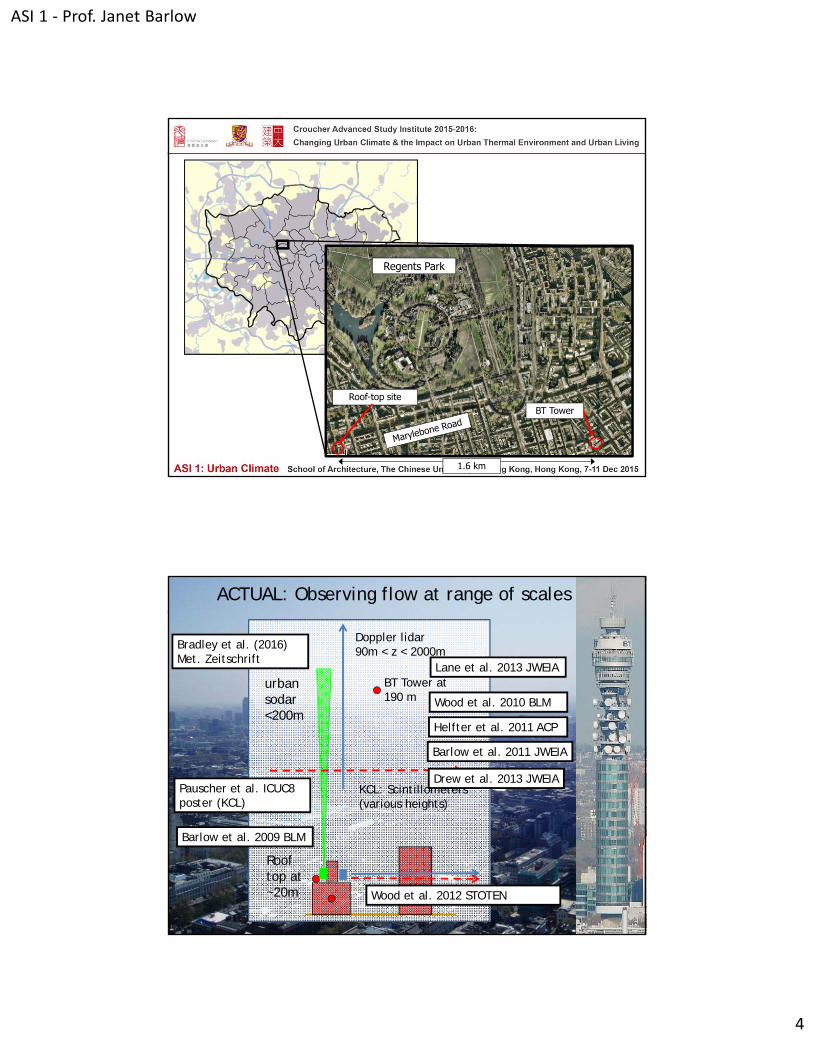
Thanks to Steve Evans, UCL
Regents Park
BT TowerRoof-top site
1.6 km
BT Tower at190 m
Roof top at ~20m
urban sodar<200m
Doppler lidar90m < z < 2000m
ACTUAL: Observing flow at range of scales
Barlow et al. 2009 BLM
Wood et al. 2010 BLM
Helfter et al. 2011 ACP
Barlow et al. 2011 JWEIA
Bradley et al. (2016) Met. Zeitschrift
Wood et al. 2012 STOTEN
Pauscher et al. ICUC8 poster (KCL)
KCL: Scintillometers(various heights)
Lane et al. 2013 JWEIA
Drew et al. 2013 JWEIA
ASI 1 ‐ Prof. Janet Barlow
5
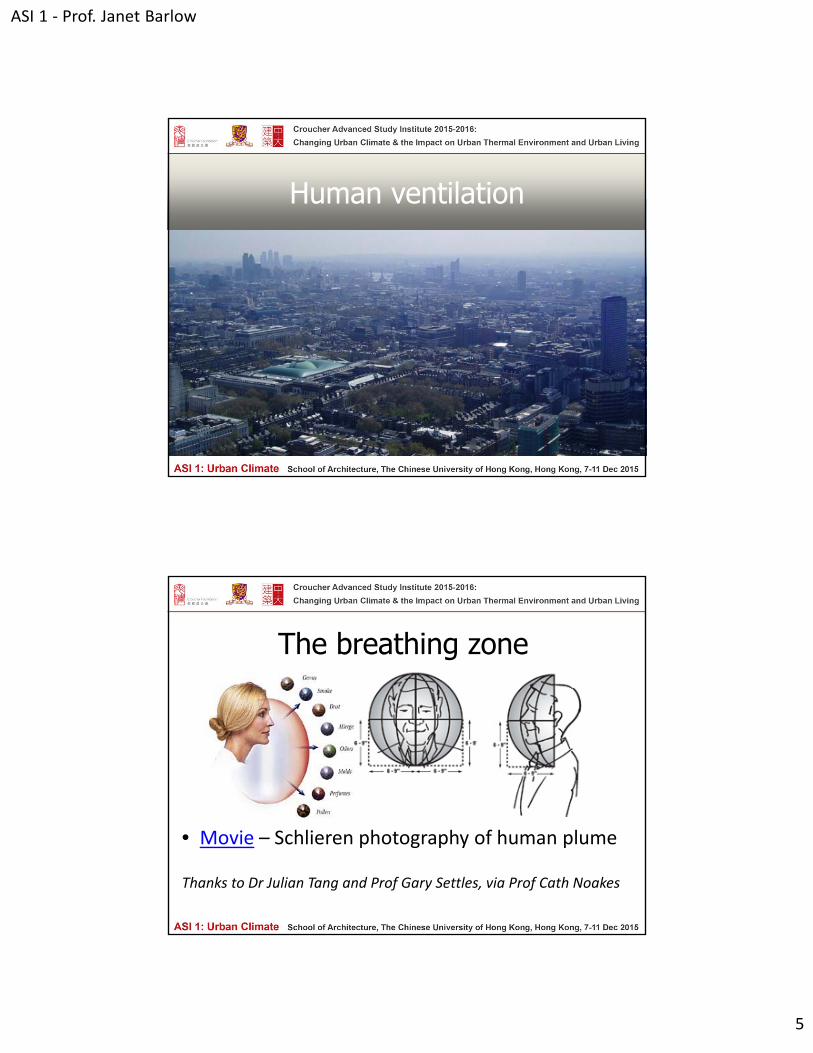
Human ventilation
The breathing zone
• Movie – Schlieren photography of human plume
Thanks to Dr Julian Tang and Prof Gary Settles, via Prof Cath Noakes
ASI 1 ‐ Prof. Janet Barlow
6
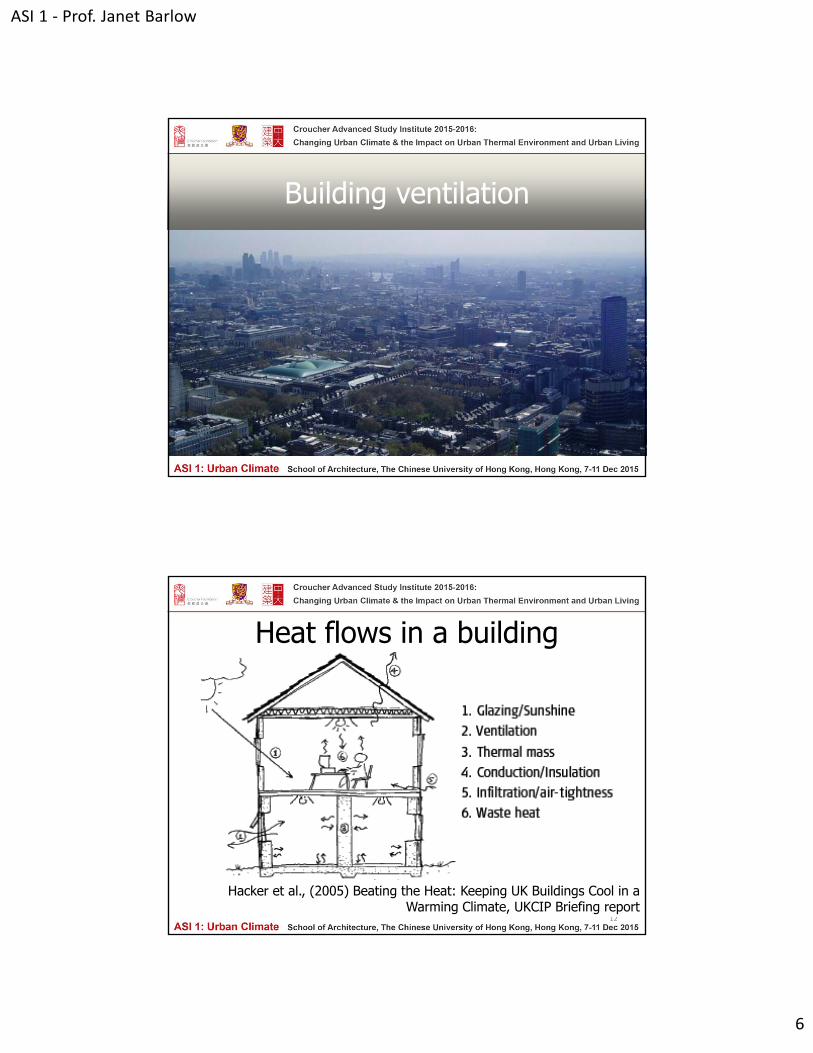
Building ventilation
12
Heat flows in a building
Hacker et al., (2005) Beating the Heat: Keeping UK Buildings Cool in a Warming Climate, UKCIP Briefing report
ASI 1 ‐ Prof. Janet Barlow
7
Types of building ventilation
resaveguide.lbl.gov, Lawrence Berkeley National Lab, US
• Mechanically ventilated
See also Awbi, H. (2003) Ventilation of Buildings
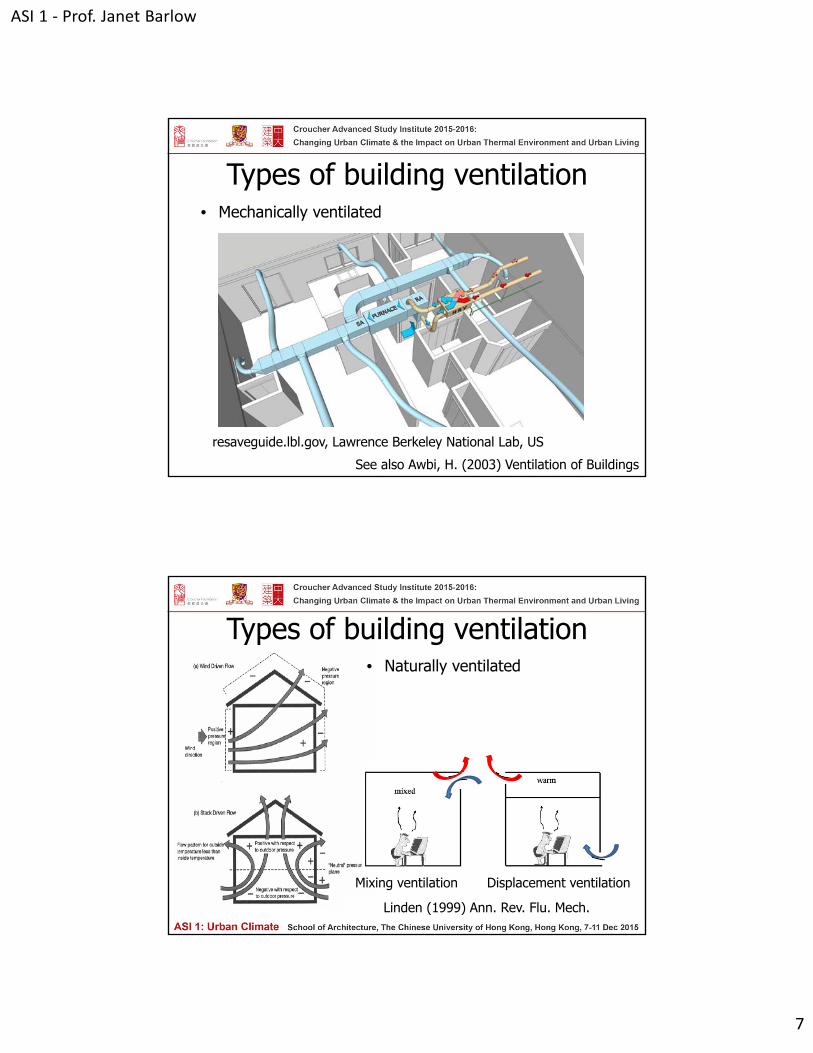
Types of building ventilation
Linden (1999) Ann. Rev. Flu. Mech.
• Naturally ventilated
Mixing ventilation Displacement ventilation
ASI 1 ‐ Prof. Janet Barlow
8
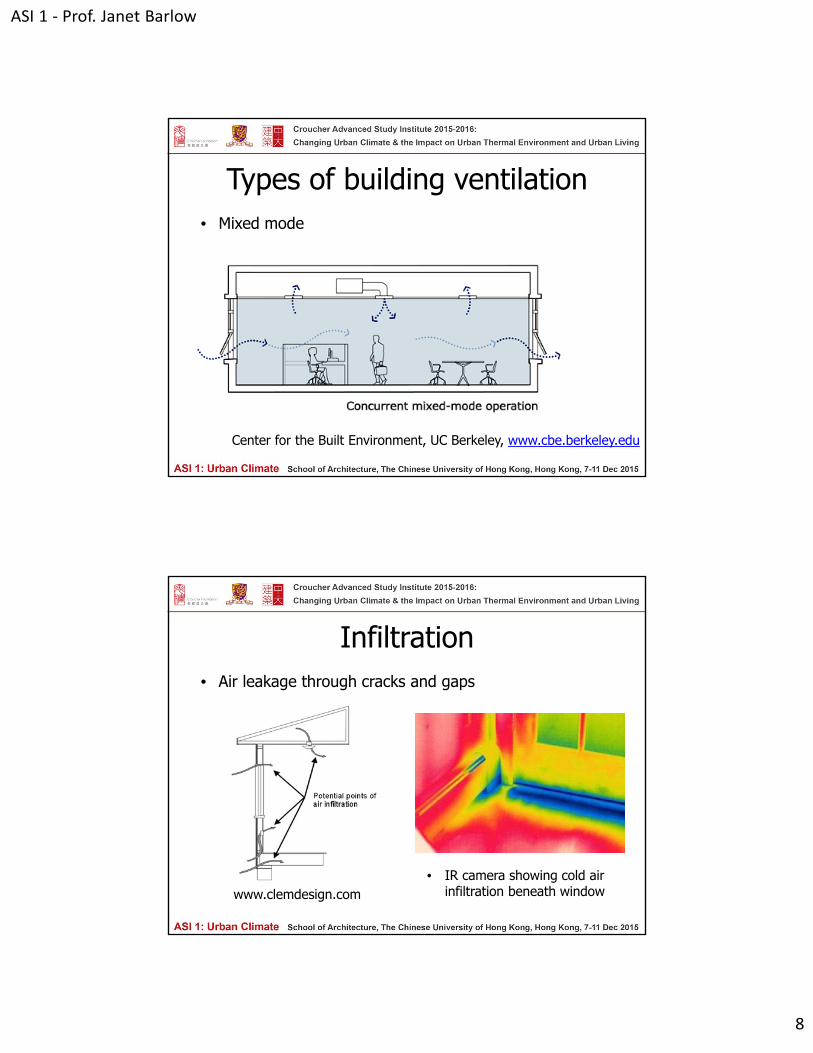
Types of building ventilation
Center for the Built Environment, UC Berkeley, www.cbe.berkeley.edu
• Mixed mode
Infiltration
www.clemdesign.com
• Air leakage through cracks and gaps
• IR camera showing cold air infiltration beneath window

ASI 1 ‐ Prof. Janet Barlow
9
Natural ventilation of urban buildings
• How is ventilation of a building changed by presence of other buildings?- flow pattern, turbulence,temperature, inside and out
?
Wind speed UH
eigh
t z
School of Slavonic and East European Studies, UCL, London
ASI 1 ‐ Prof. Janet Barlow
10
Human breathing penetrates the “thermal plume” that we carry around with us
Building ventilation can be natural, mechanical or mixed mode ventilation
Human plumes can influence room ventilation!
Urban microclimate can change effectiveness of naturally ventilated or mixed mode systems
Insights from research
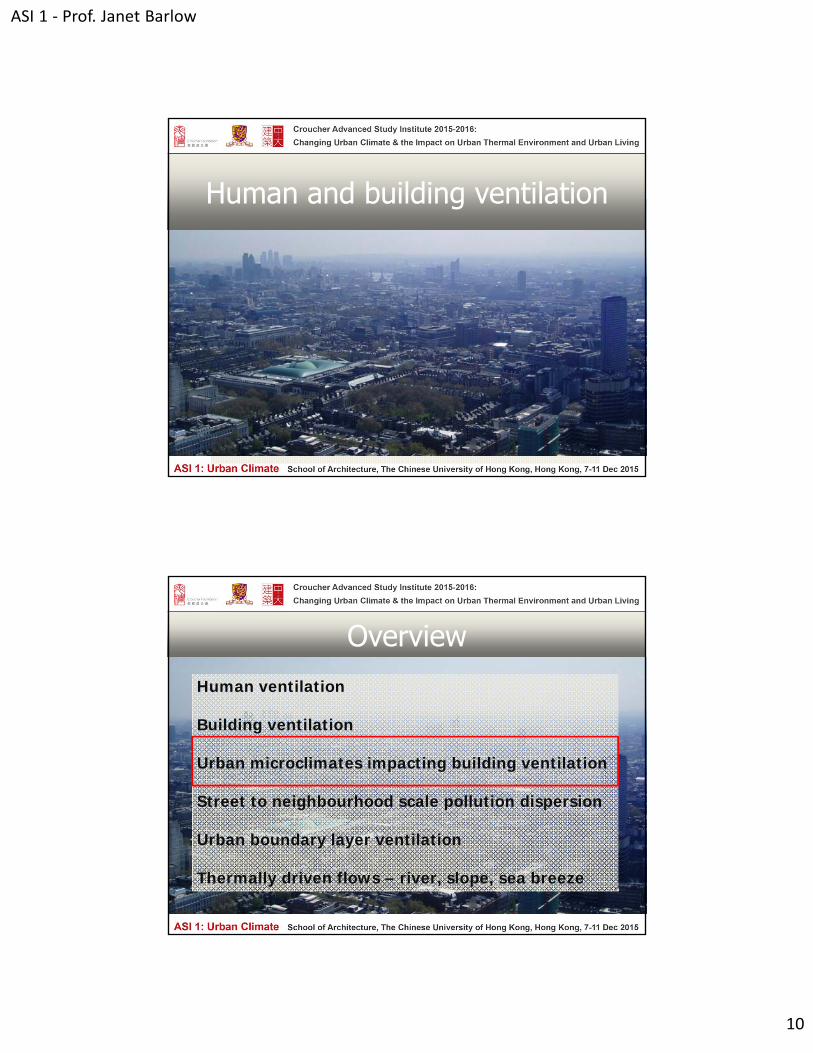
Human and building ventilation
Human ventilation
Building ventilation
Urban microclimates impacting building ventilation
Street to neighbourhood scale pollution dispersion
Urban boundary layer ventilation
Thermally driven flows – river, slope, sea breeze
Overview
ASI 1 ‐ Prof. Janet Barlow
11
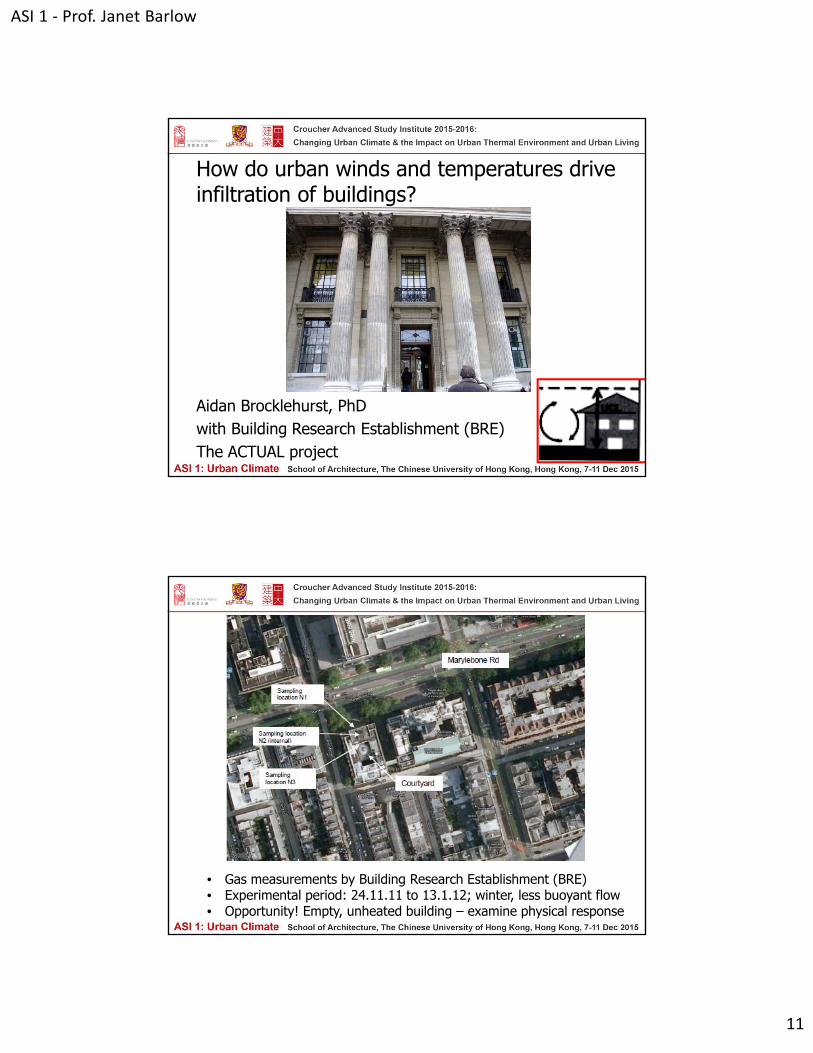
How do urban winds and temperatures drive infiltration of buildings?
Aidan Brocklehurst, PhDwith Building Research Establishment (BRE)The ACTUAL project
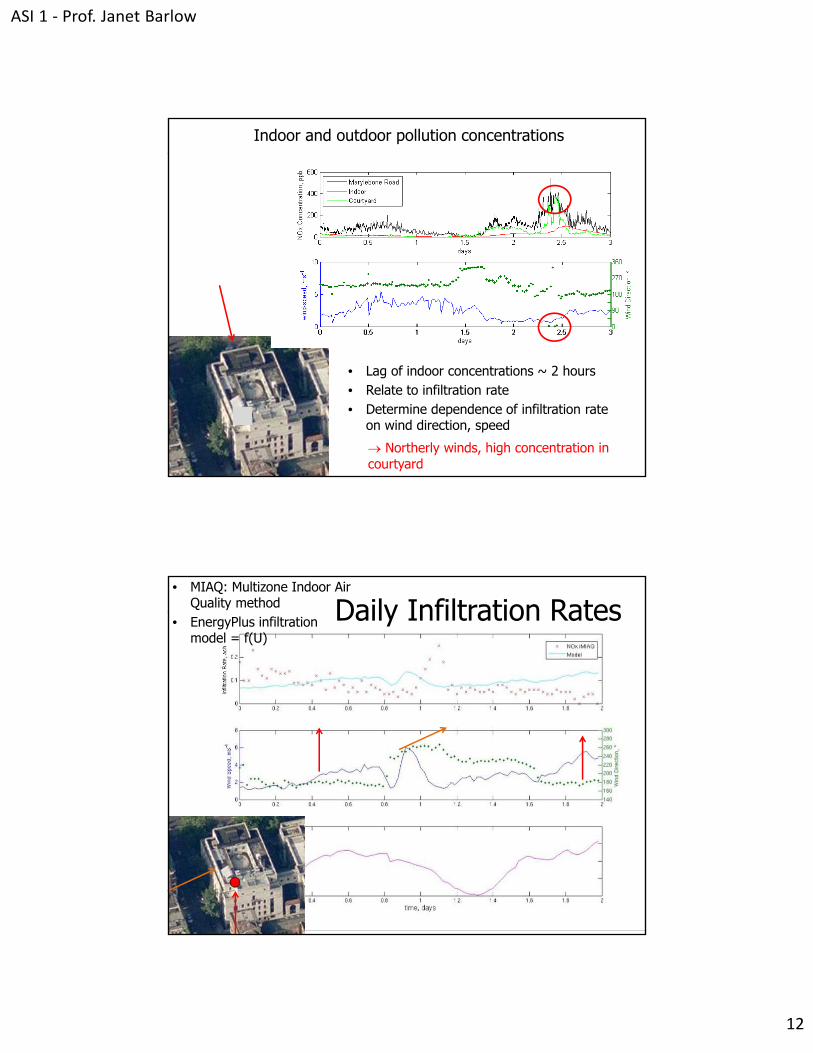
• Gas measurements by Building Research Establishment (BRE)• Experimental period: 24.11.11 to 13.1.12; winter, less buoyant flow• Opportunity! Empty, unheated building – examine physical response
ASI 1 ‐ Prof. Janet Barlow
12
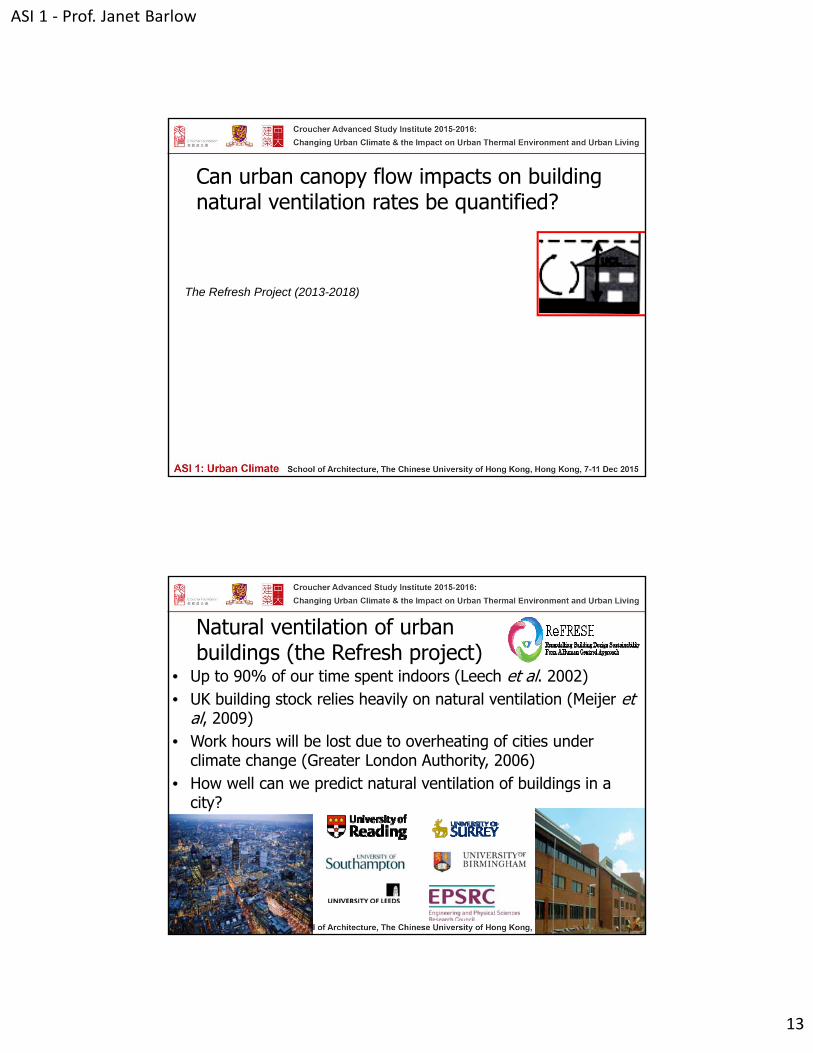
Indoor and outdoor pollution concentrations
• Lag of indoor concentrations ~ 2 hours• Relate to infiltration rate• Determine dependence of infiltration rate
on wind direction, speed
Northerly winds, high concentration in courtyard
Daily Infiltration Rates• MIAQ: Multizone Indoor Air
Quality method• EnergyPlus infiltration
model = f(U)
ASI 1 ‐ Prof. Janet Barlow
13
Can urban canopy flow impacts on building natural ventilation rates be quantified?
The Refresh Project (2013-2018)
Natural ventilation of urban buildings (the Refresh project)
• Up to 90% of our time spent indoors (Leech et al. 2002)• UK building stock relies heavily on natural ventilation (Meijer et
al, 2009)• Work hours will be lost due to overheating of cities under
climate change (Greater London Authority, 2006)• How well can we predict natural ventilation of buildings in a
city?
ASI 1 ‐ Prof. Janet Barlow
14
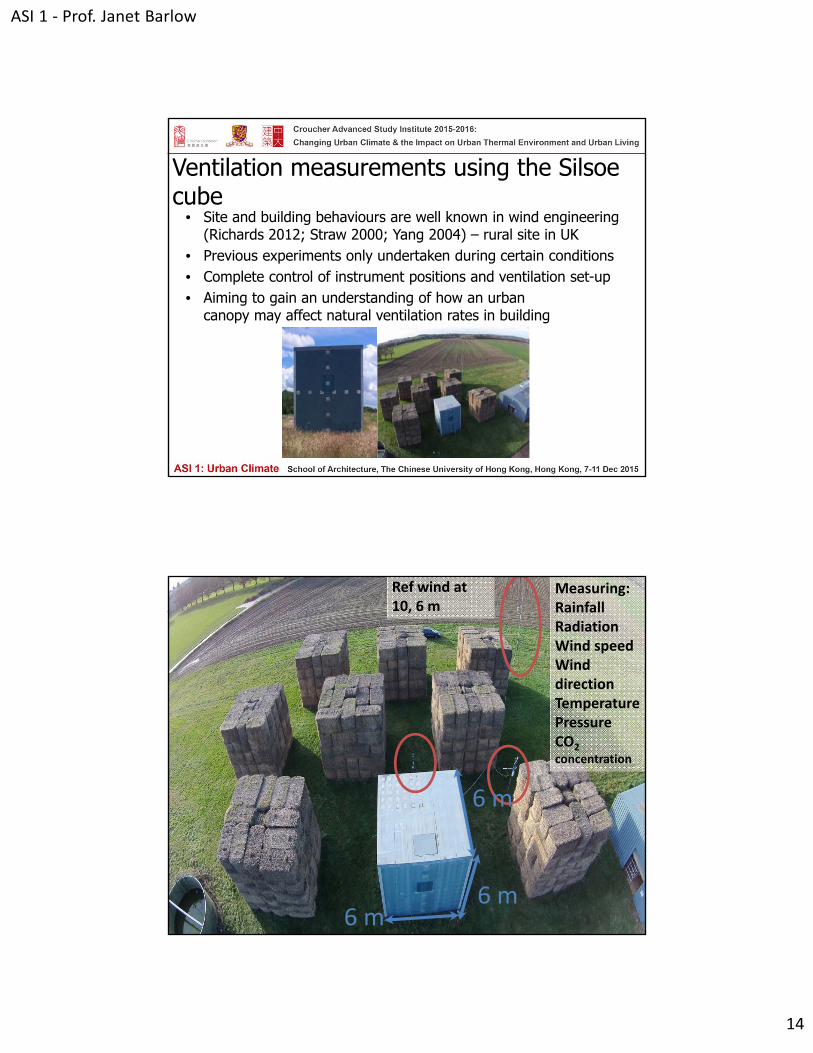
Ventilation measurements using the Silsoecube
• Site and building behaviours are well known in wind engineering (Richards 2012; Straw 2000; Yang 2004) – rural site in UK
• Previous experiments only undertaken during certain conditions• Complete control of instrument positions and ventilation set-up • Aiming to gain an understanding of how an urban
canopy may affect natural ventilation rates in building
286 m6 m
Measuring:RainfallRadiationWind speed Wind directionTemperaturePressureCO2 concentration
6 m
Ref wind at 10, 6 m
ASI 1 ‐ Prof. Janet Barlow
15
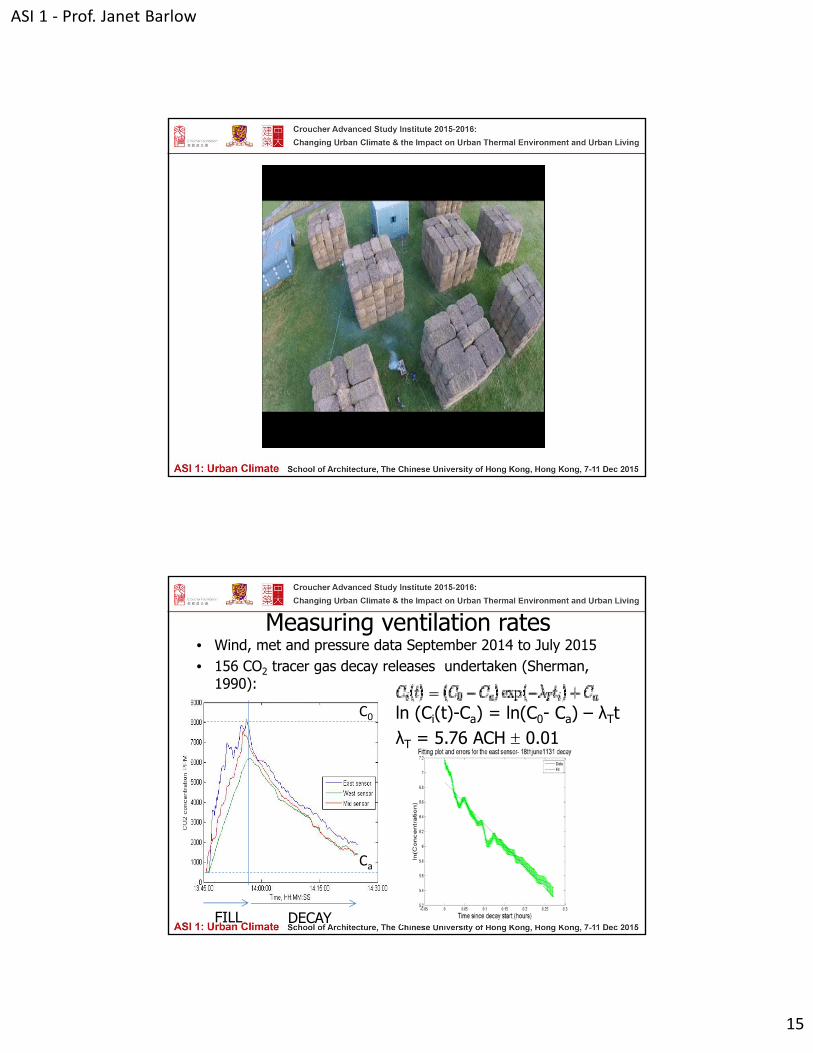
Measuring ventilation rates• Wind, met and pressure data September 2014 to July 2015• 156 CO2 tracer gas decay releases undertaken (Sherman,
1990):
FILL DECAY
ln (Ci(t)-Ca) = ln(C0- Ca) – λTtλT = 5.76 ACH 0.01
C0
Ca
ASI 1 ‐ Prof. Janet Barlow
16
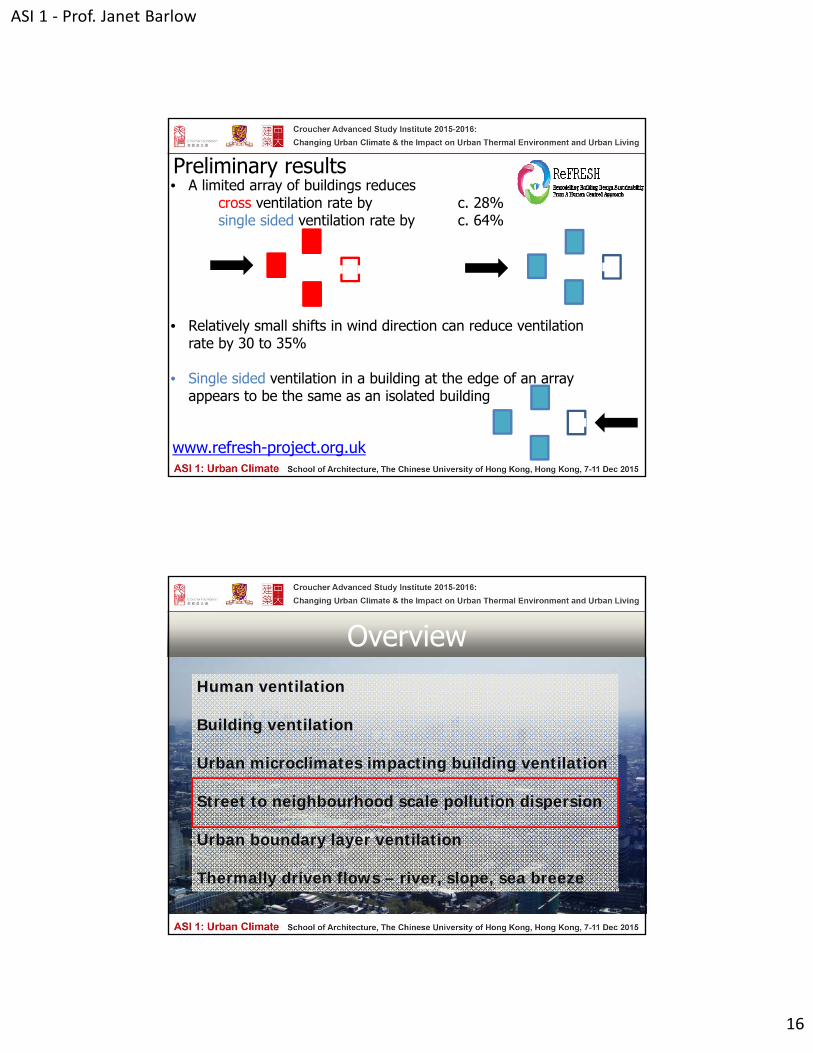
Preliminary results• A limited array of buildings reduces
cross ventilation rate by c. 28% single sided ventilation rate by c. 64%
• Relatively small shifts in wind direction can reduce ventilation rate by 30 to 35%
• Single sided ventilation in a building at the edge of an array appears to be the same as an isolated building
www.refresh-project.org.uk
Human ventilation
Building ventilation
Urban microclimates impacting building ventilation
Street to neighbourhood scale pollution dispersion
Urban boundary layer ventilation
Thermally driven flows – river, slope, sea breeze
Overview
ASI 1 ‐ Prof. Janet Barlow
17
Can the design and layout of buildings improve street-level environmental quality?
Salfex 2002; windtunnel experiments, 2002-2013
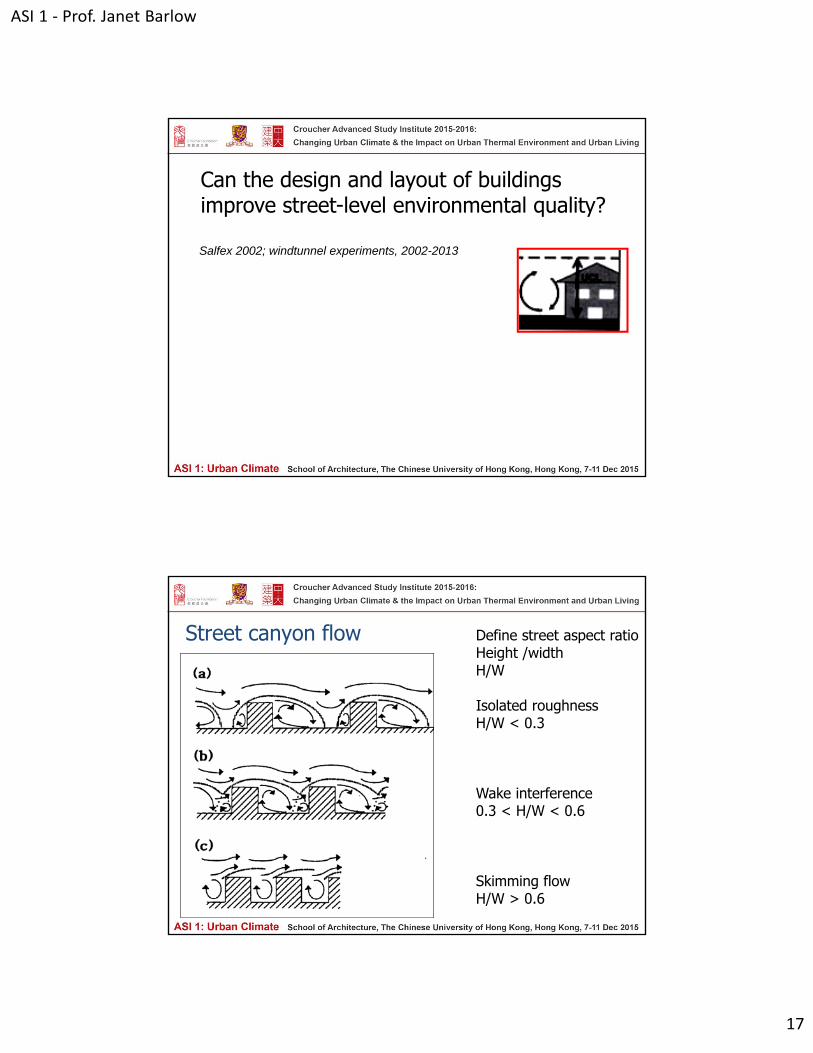
Street canyon flow Define street aspect ratioHeight /widthH/W
Isolated roughnessH/W < 0.3
Wake interference0.3 < H/W < 0.6
Skimming flowH/W > 0.6
ASI 1 ‐ Prof. Janet Barlow
18
Salfex 2002
Salford, Greater Manchester
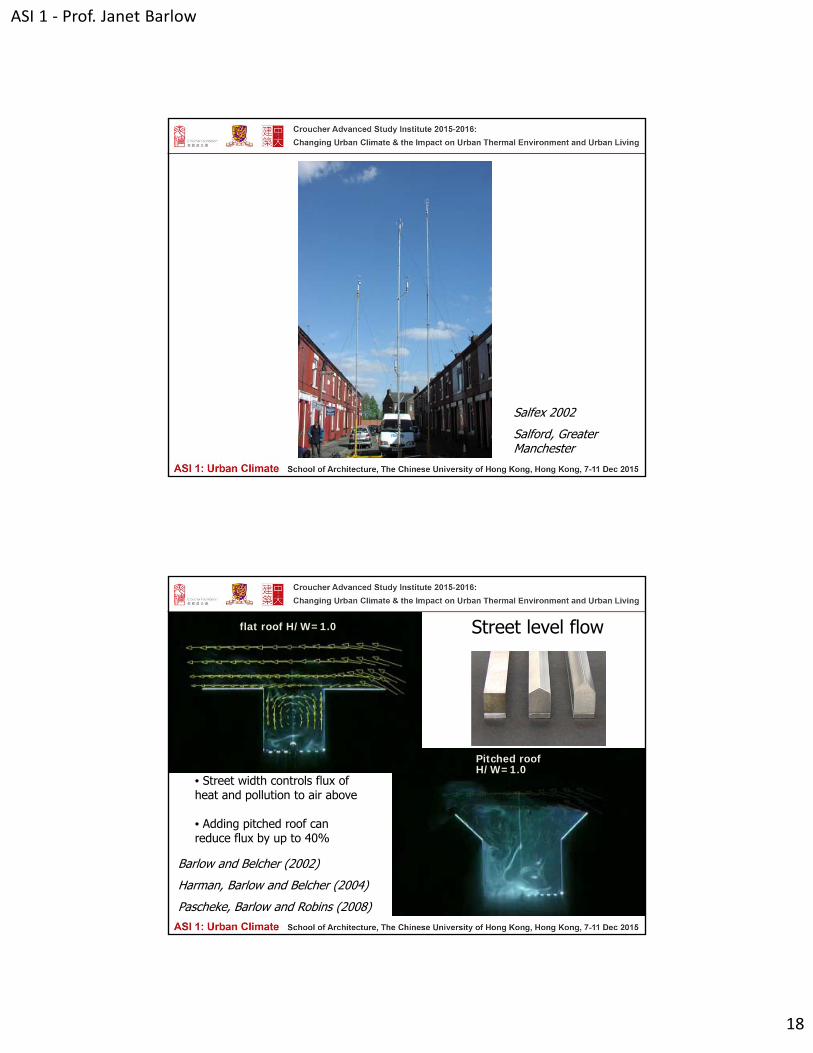
Street level flowflat roof H/W=1.0
Pitched roof H/W=1.0
• Street width controls flux of heat and pollution to air above
• Adding pitched roof can reduce flux by up to 40%
Barlow and Belcher (2002)
Harman, Barlow and Belcher (2004)
Pascheke, Barlow and Robins (2008)
ASI 1 ‐ Prof. Janet Barlow
19
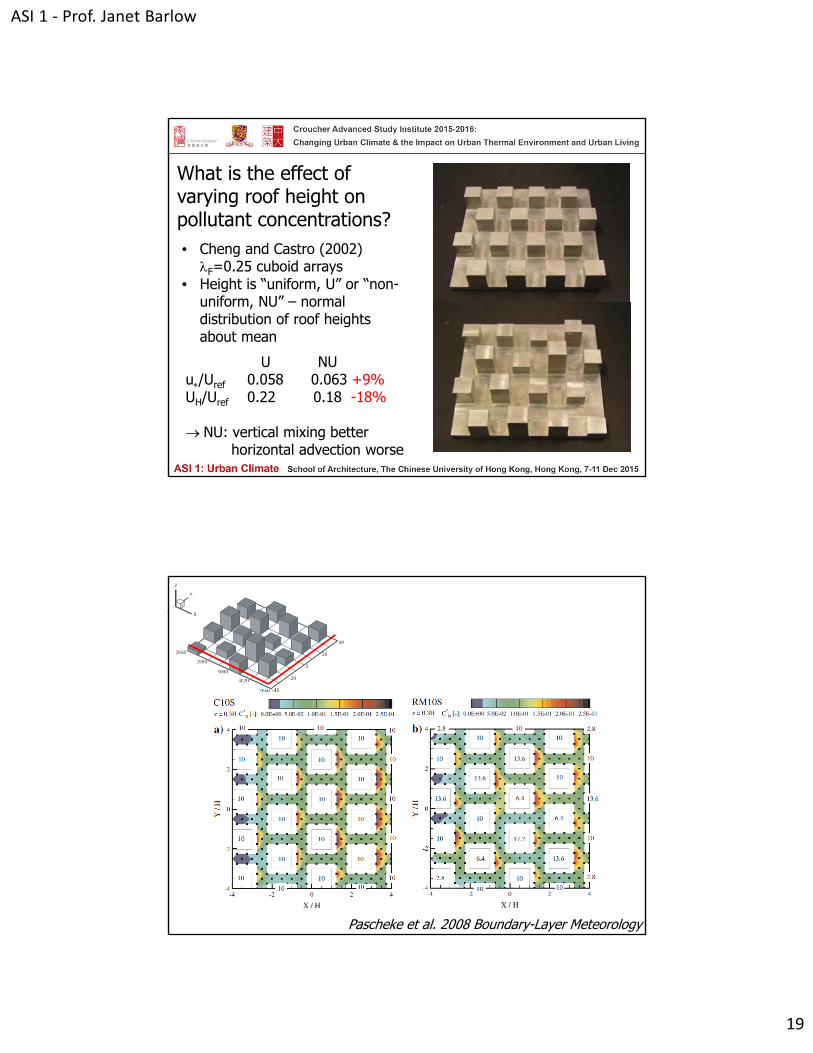
What is the effect of varying roof height on pollutant concentrations?• Cheng and Castro (2002)
F=0.25 cuboid arrays• Height is “uniform, U” or “non-
uniform, NU” – normal distribution of roof heights about mean
U NUu/Uref 0.058 0.063 +9%UH/Uref 0.22 0.18 -18%
NU: vertical mixing betterhorizontal advection worse
Pascheke et al. 2008 Boundary-Layer Meteorology
ASI 1 ‐ Prof. Janet Barlow
20
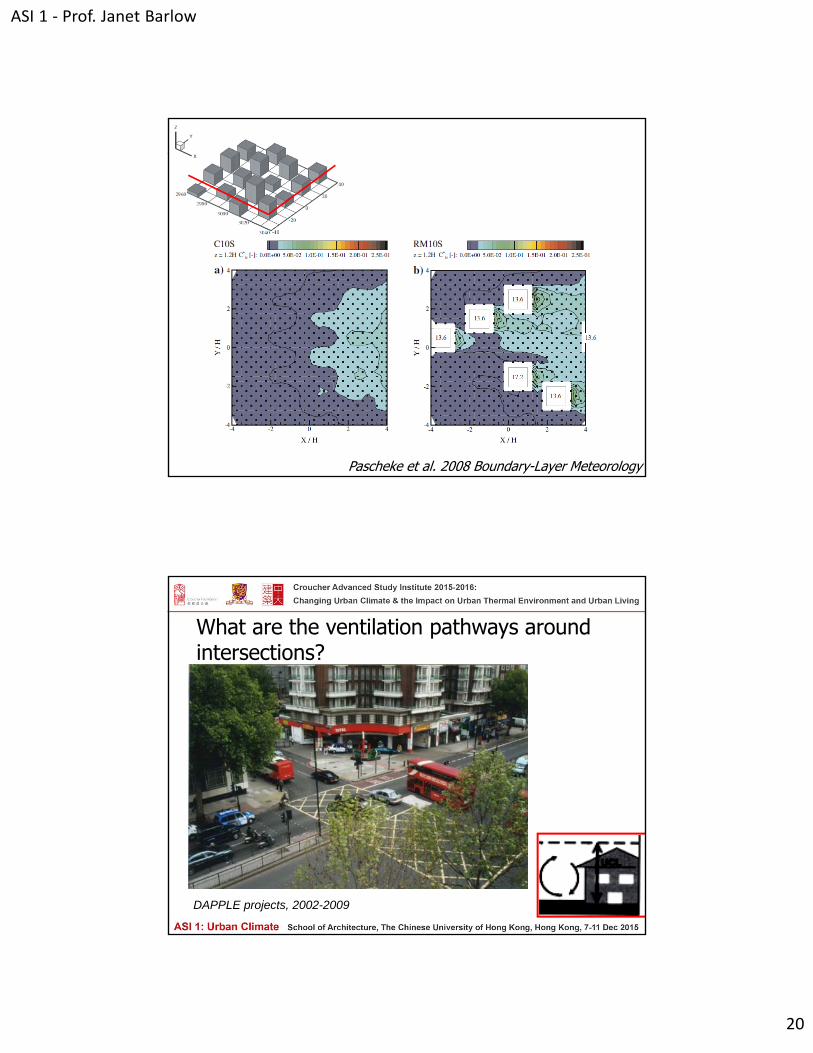
Pascheke et al. 2008 Boundary-Layer Meteorology
What are the ventilation pathways around intersections?
DAPPLE projects, 2002-2009
ASI 1 ‐ Prof. Janet Barlow
21
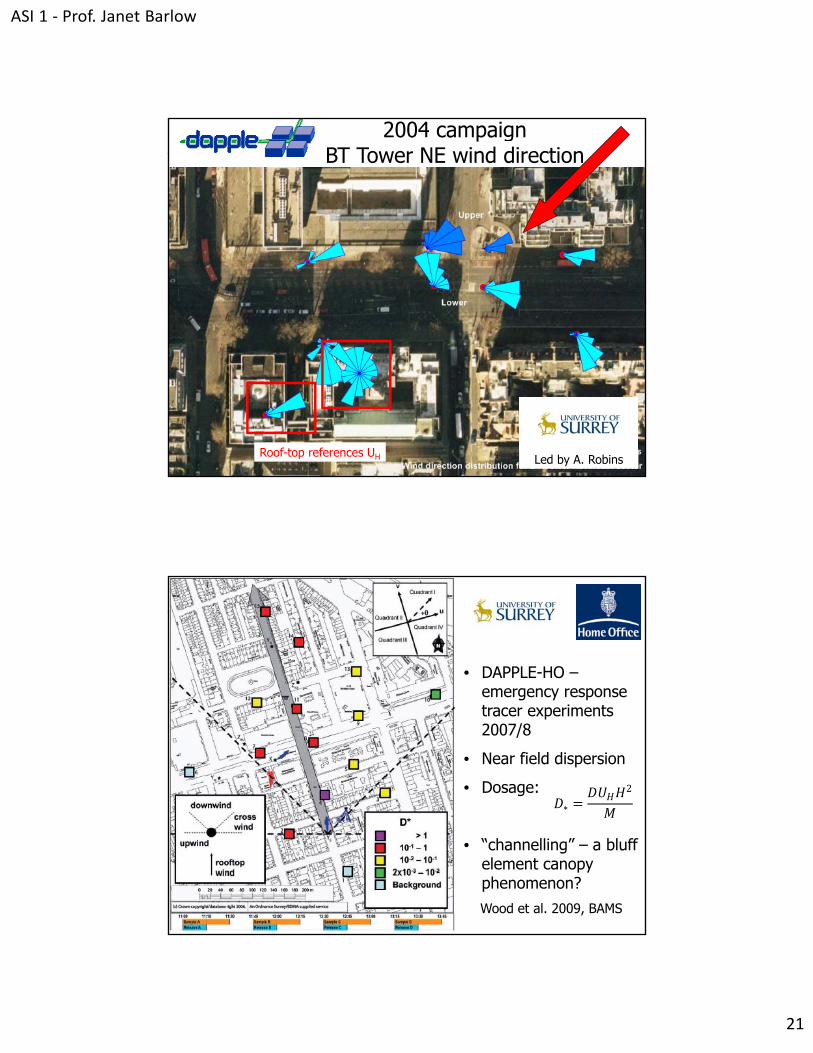
2004 campaign BT Tower NE wind direction
Roof-top references UH Led by A. Robins
• DAPPLE-HO –emergency response tracer experiments 2007/8
• Near field dispersion
• Dosage:
• “channelling” – a bluff element canopy phenomenon?Wood et al. 2009, BAMS
∗
2
ASI 1 ‐ Prof. Janet Barlow
22
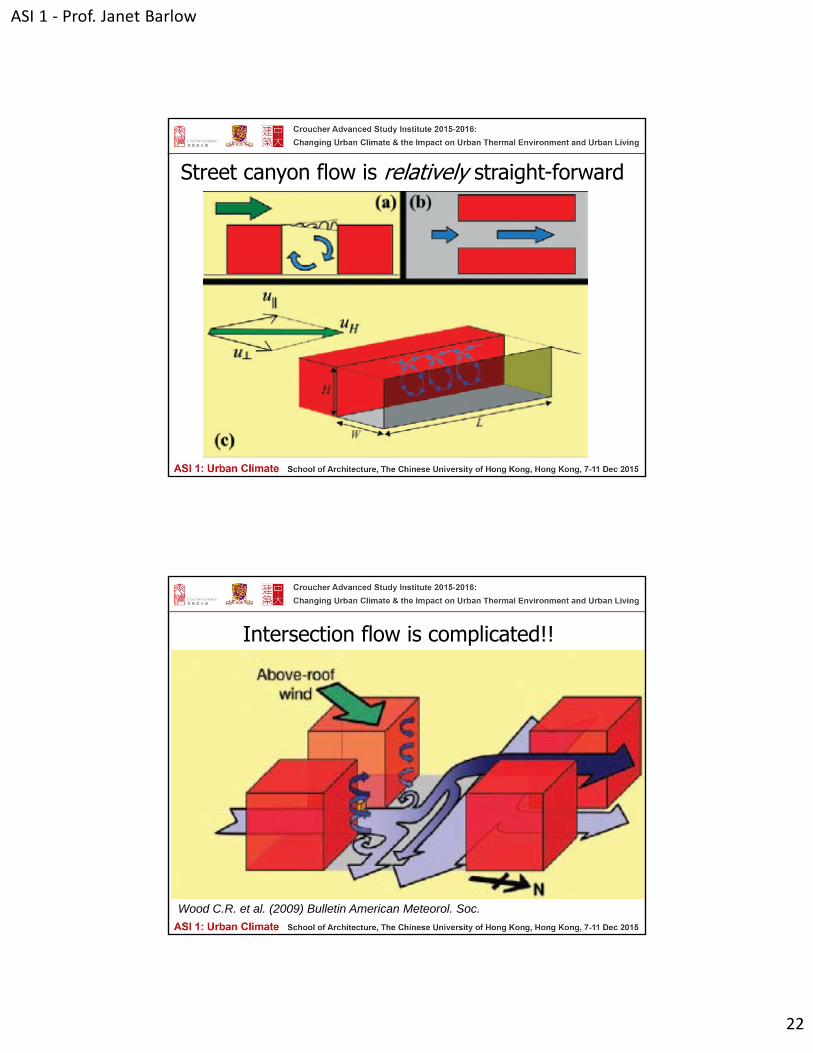
Street canyon flow is relatively straight-forward
Intersection flow is complicated!!
Wood C.R. et al. (2009) Bulletin American Meteorol. Soc.
ASI 1 ‐ Prof. Janet Barlow
23
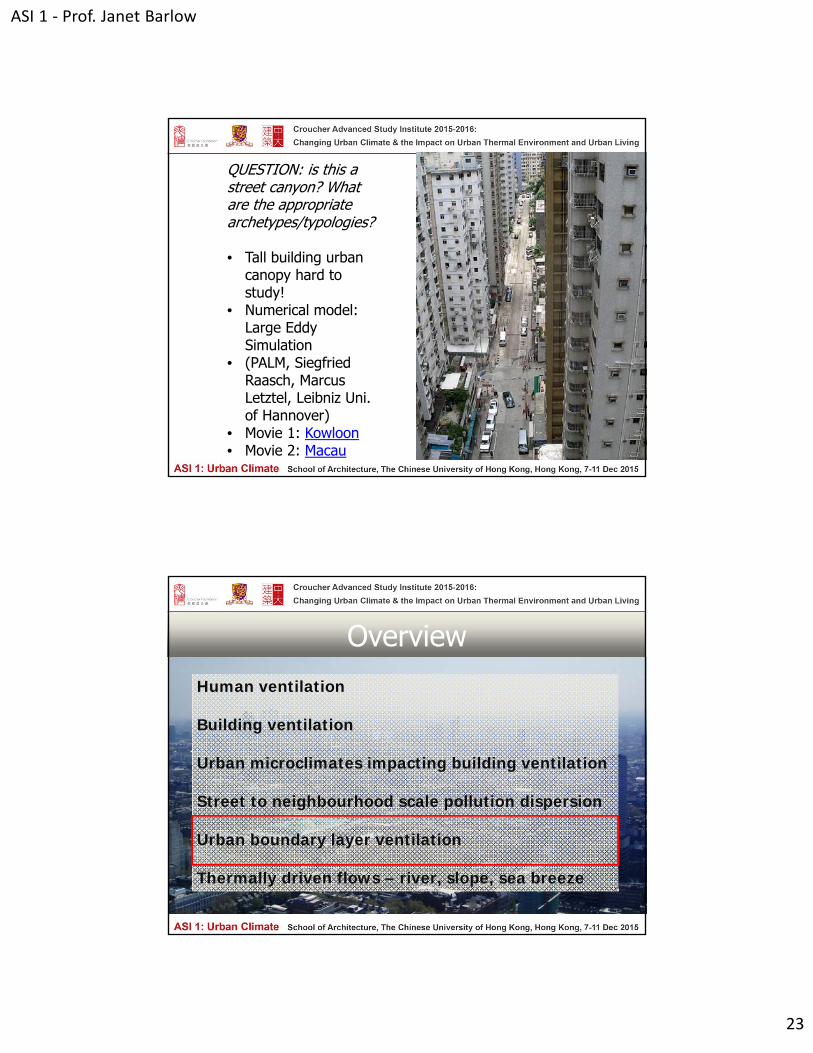
QUESTION: is this a street canyon? What are the appropriate archetypes/typologies?
• Tall building urban canopy hard to study!
• Numerical model: Large Eddy Simulation
• (PALM, Siegfried Raasch, Marcus Letztel, Leibniz Uni. of Hannover)
• Movie 1: Kowloon• Movie 2: Macau
Human ventilation
Building ventilation
Urban microclimates impacting building ventilation
Street to neighbourhood scale pollution dispersion
Urban boundary layer ventilation
Thermally driven flows – river, slope, sea breeze
Overview
ASI 1 ‐ Prof. Janet Barlow
24
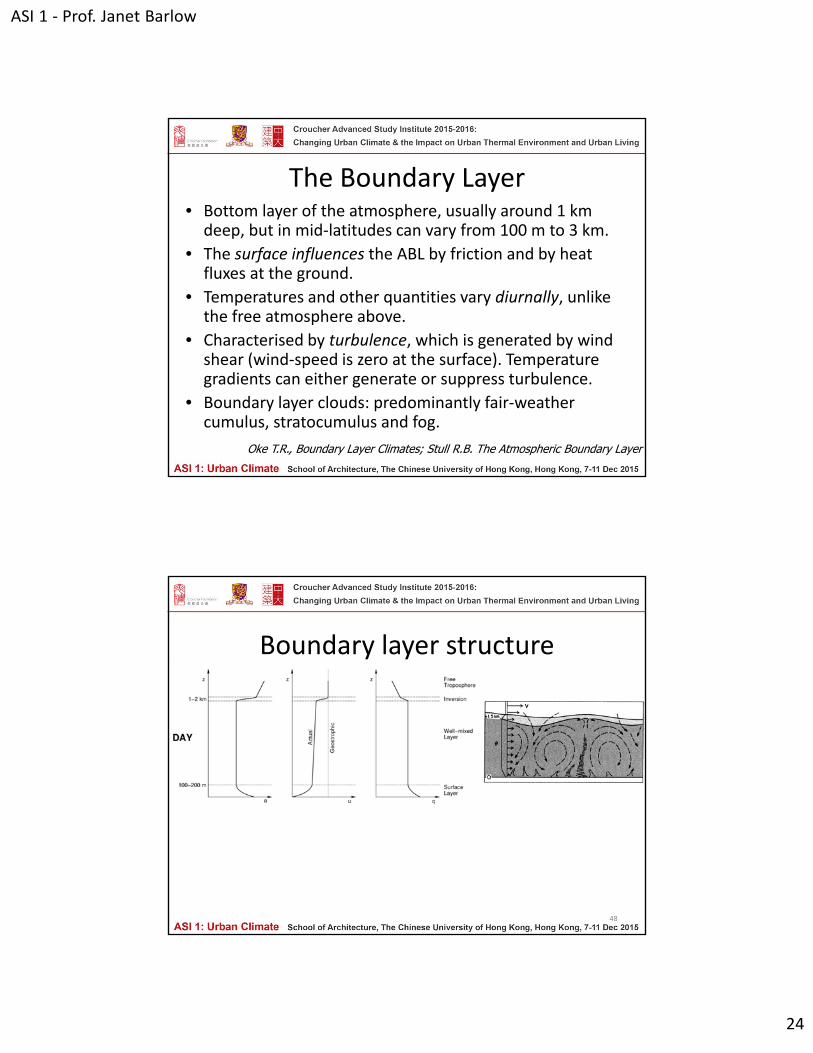
The Boundary Layer• Bottom layer of the atmosphere, usually around 1 km deep, but in mid‐latitudes can vary from 100 m to 3 km.
• The surface influences the ABL by friction and by heat fluxes at the ground.
• Temperatures and other quantities vary diurnally, unlike the free atmosphere above.
• Characterised by turbulence, which is generated by wind shear (wind‐speed is zero at the surface). Temperature gradients can either generate or suppress turbulence.
• Boundary layer clouds: predominantly fair‐weather cumulus, stratocumulus and fog.
Oke T.R., Boundary Layer Climates; Stull R.B. The Atmospheric Boundary Layer
Boundary layer structure
48
ASI 1 ‐ Prof. Janet Barlow
25
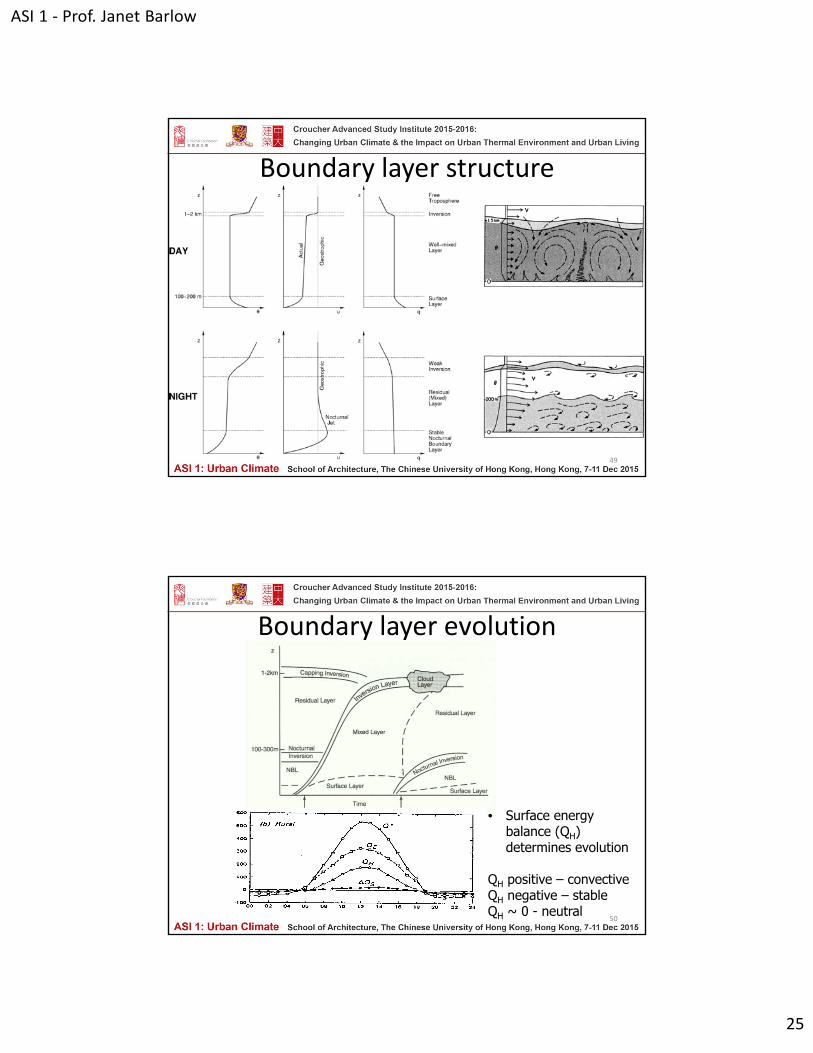
Boundary layer structure
49
Boundary layer evolution
• Surface energy balance (QH) determines evolution
QH positive – convectiveQH negative – stableQH ~ 0 - neutral
50
ASI 1 ‐ Prof. Janet Barlow
26
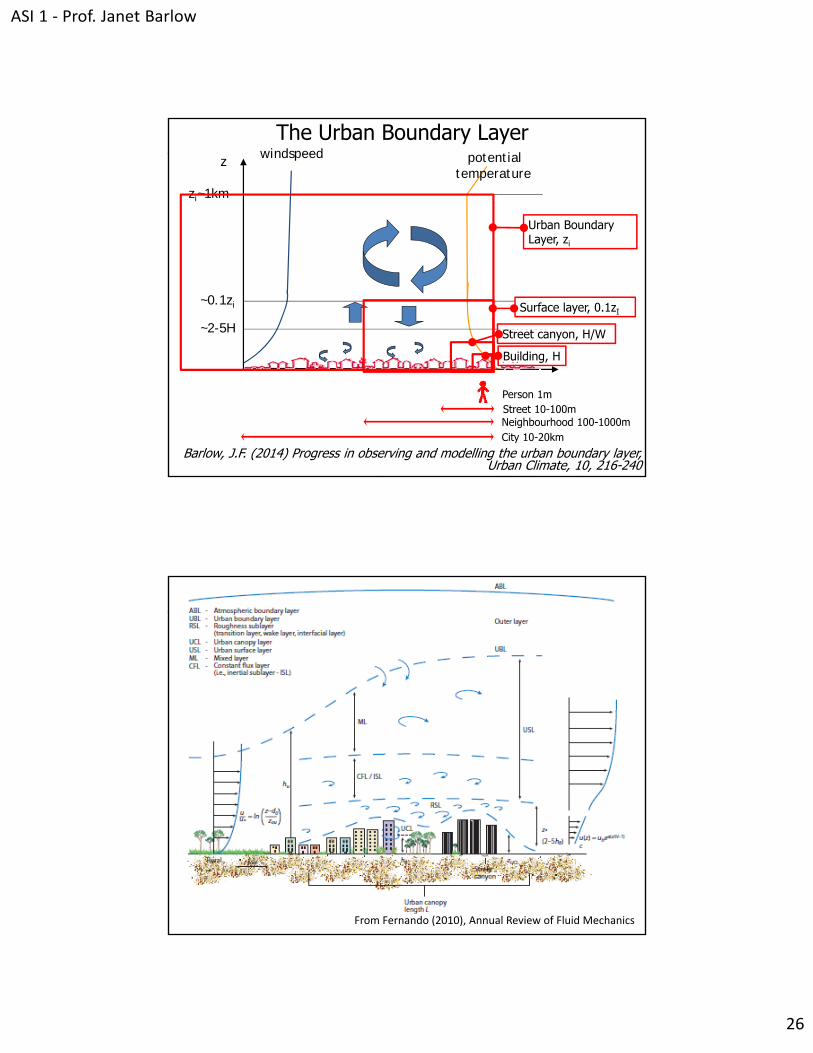
~2-5H
~0.1zi
z
zi~1km
windspeed potentialtemperature
The Urban Boundary Layer
Building, H
Street canyon, H/W
Surface layer, 0.1zI
Urban Boundary Layer, zi
Street 10-100m Neighbourhood 100-1000m City 10-20km
Person 1m
Barlow, J.F. (2014) Progress in observing and modelling the urban boundary layer, Urban Climate, 10, 216-240
From Fernando (2010), Annual Review of Fluid Mechanics
ASI 1 ‐ Prof. Janet Barlow
27
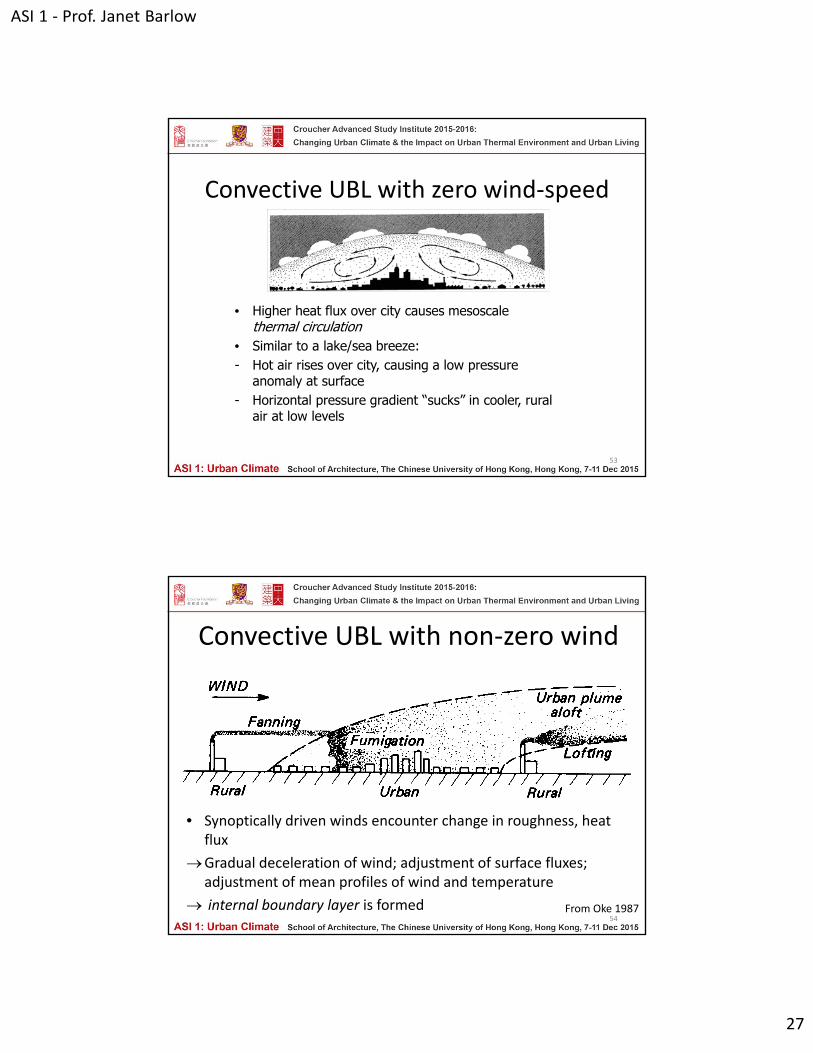
Convective UBL with zero wind‐speed
• Higher heat flux over city causes mesoscalethermal circulation
• Similar to a lake/sea breeze:- Hot air rises over city, causing a low pressure
anomaly at surface- Horizontal pressure gradient “sucks” in cooler, rural
air at low levels
53
Convective UBL with non‐zero wind
From Oke 198754
• Synoptically driven winds encounter change in roughness, heat flux
Gradual deceleration of wind; adjustment of surface fluxes; adjustment of mean profiles of wind and temperature
internal boundary layer is formed
ASI 1 ‐ Prof. Janet Barlow
28
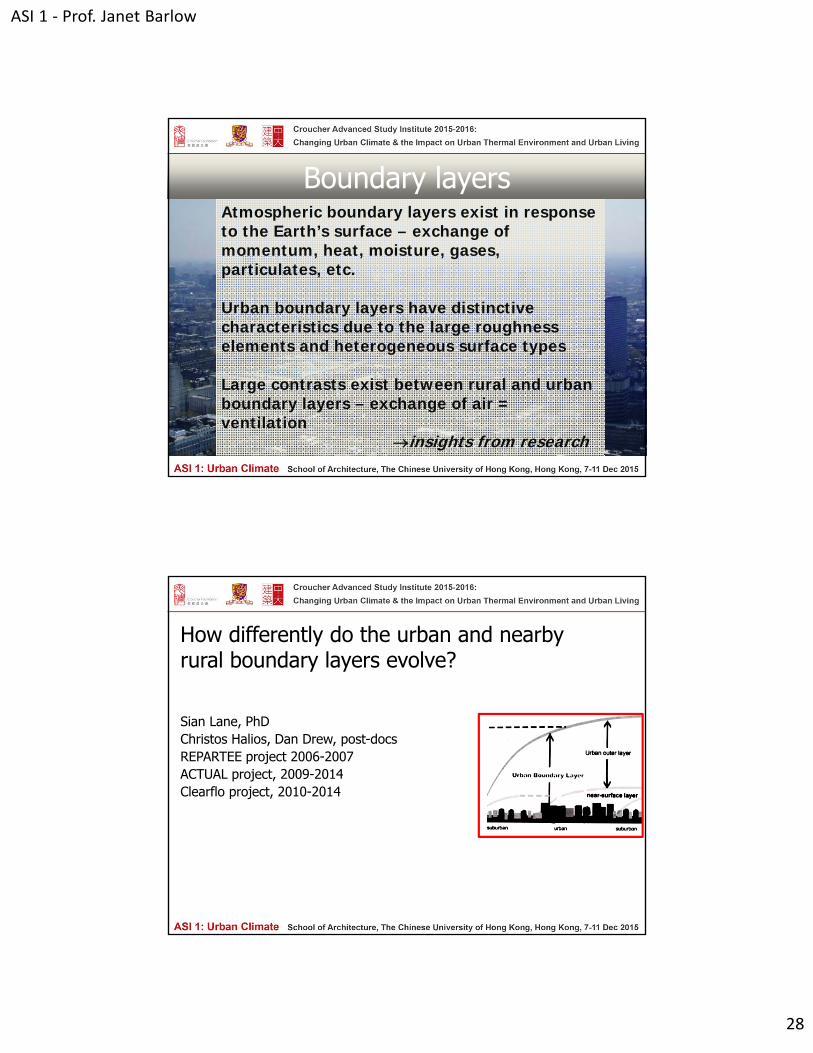
Atmospheric boundary layers exist in response to the Earth’s surface – exchange of momentum, heat, moisture, gases, particulates, etc.
Urban boundary layers have distinctive characteristics due to the large roughness elements and heterogeneous surface types
Large contrasts exist between rural and urban boundary layers – exchange of air = ventilation
insights from research
Boundary layers
How differently do the urban and nearby rural boundary layers evolve?
Sian Lane, PhD Christos Halios, Dan Drew, post-docsREPARTEE project 2006-2007ACTUAL project, 2009-2014Clearflo project, 2010-2014
ASI 1 ‐ Prof. Janet Barlow
29
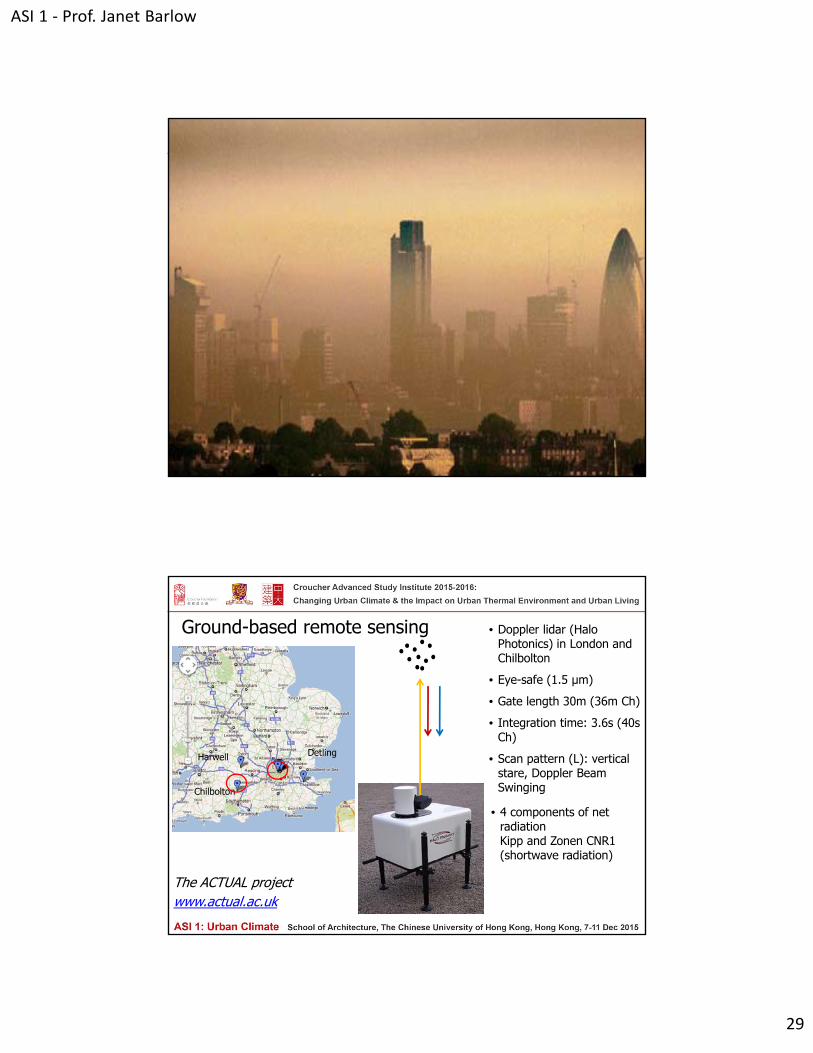
Ground-based remote sensing
The ACTUAL project www.actual.ac.uk
• Doppler lidar (Halo Photonics) in London and Chilbolton
• Eye-safe (1.5 μm)
• Gate length 30m (36m Ch)
• Integration time: 3.6s (40s Ch)
• Scan pattern (L): vertical stare, Doppler Beam Swinging
Harwell
Chilbolton
Detling
• 4 components of net radiation Kipp and Zonen CNR1 (shortwave radiation)
ASI 1 ‐ Prof. Janet Barlow
30
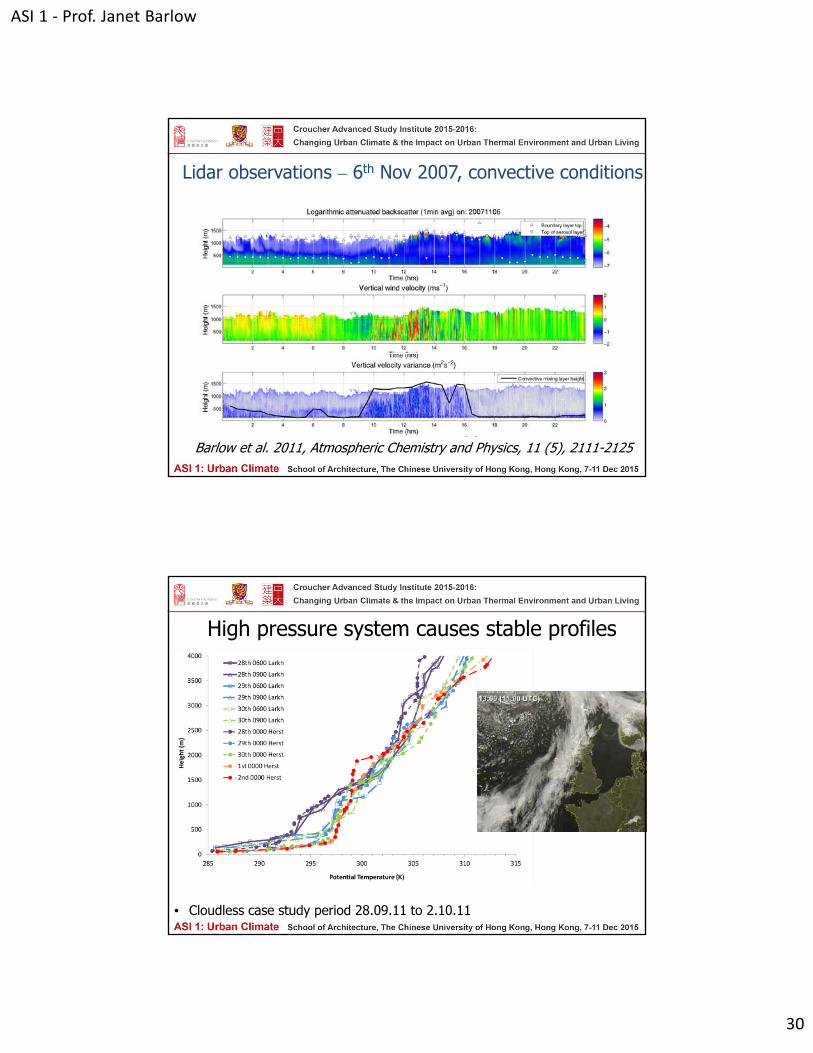
Lidar observations – 6th Nov 2007, convective conditions
Barlow et al. 2011, Atmospheric Chemistry and Physics, 11 (5), 2111-2125
High pressure system causes stable profiles
• Cloudless case study period 28.09.11 to 2.10.11
ASI 1 ‐ Prof. Janet Barlow
31
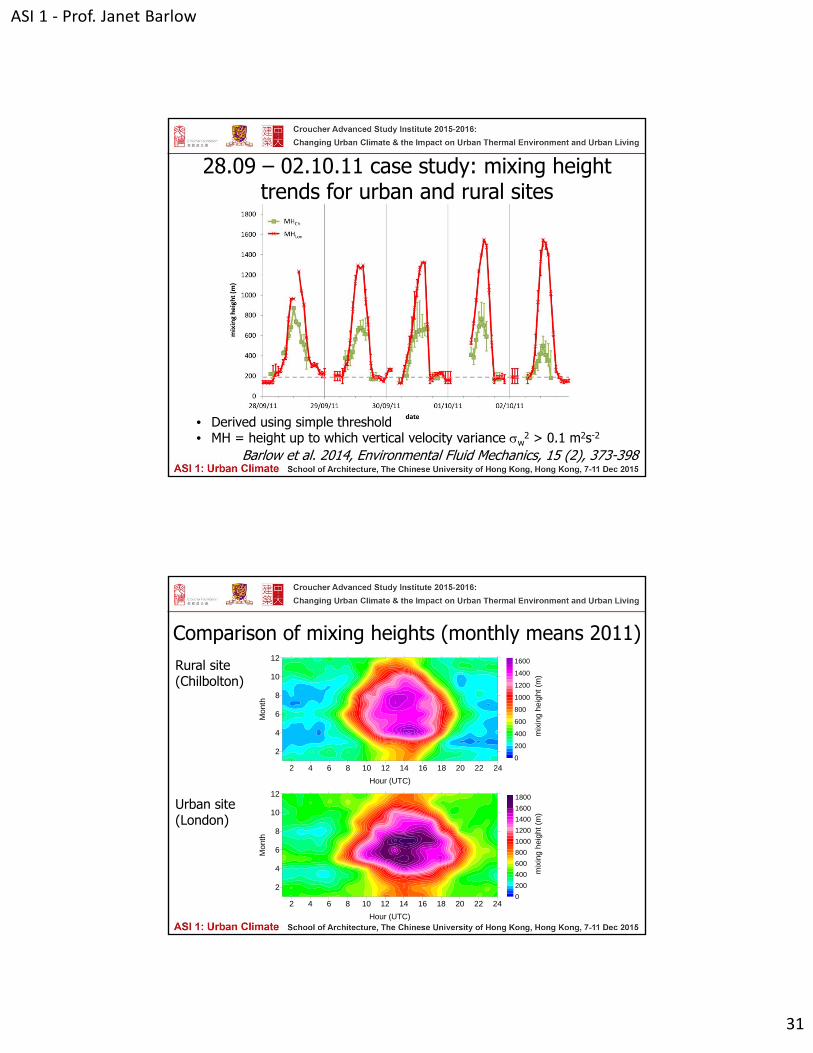
28.09 – 02.10.11 case study: mixing height trends for urban and rural sites
• Derived using simple threshold• MH = height up to which vertical velocity variance w
2 > 0.1 m2s-2
Barlow et al. 2014, Environmental Fluid Mechanics, 15 (2), 373-398
Comparison of mixing heights (monthly means 2011)
2 4 6 8 10 12 14 16 18 20 22 24
Hour (UTC)
2
4
6
8
10
12
Mo
nth
0
200
400
600
800
1000
1200
1400
1600
mix
ing
he
ight
(m
)
2 4 6 8 10 12 14 16 18 20 22 24
Hour (UTC)
2
4
6
8
10
12
Mo
nth
0
200
400
600
800
1000
1200
1400
1600
1800
mix
ing
hei
gh
t (m
)
Rural site (Chilbolton)
Urban site (London)
ASI 1 ‐ Prof. Janet Barlow
32
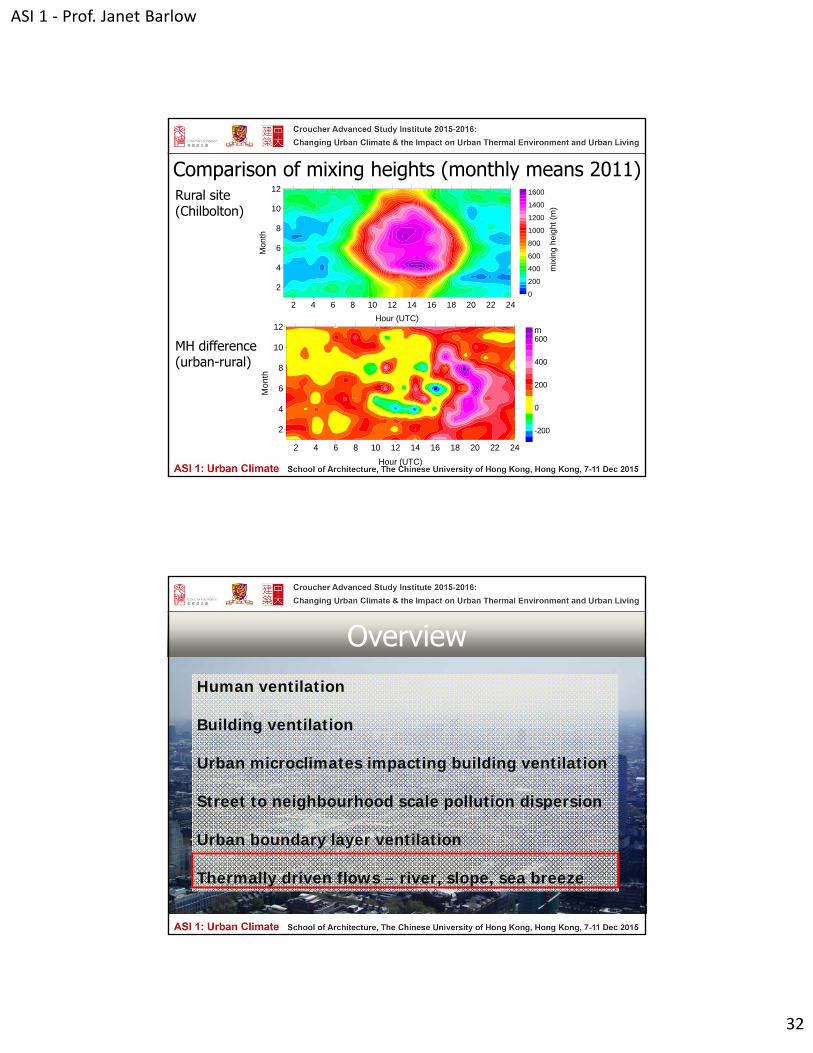
Comparison of mixing heights (monthly means 2011)
2 4 6 8 10 12 14 16 18 20 22 24
Hour (UTC)
2
4
6
8
10
12
Mo
nth
0
200
400
600
800
1000
1200
1400
1600
mix
ing
hei
gh
t (m
)
2 4 6 8 10 12 14 16 18 20 22 24
Hour (UTC)
2
4
6
8
10
12
Mo
nth
-200
0
200
400
600m
Rural site (Chilbolton)
MH difference(urban-rural)
Human ventilation
Building ventilation
Urban microclimates impacting building ventilation
Street to neighbourhood scale pollution dispersion
Urban boundary layer ventilation
Thermally driven flows – river, slope, sea breeze
Overview
ASI 1 ‐ Prof. Janet Barlow
33
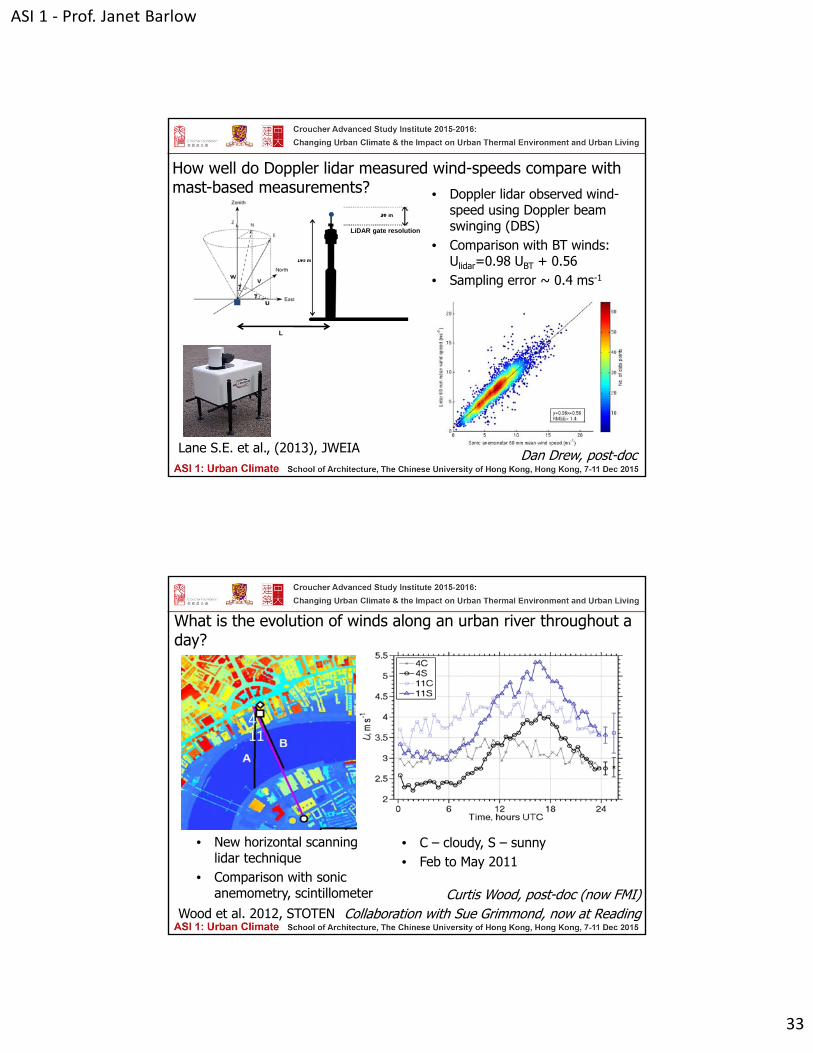
Dan Drew, post-doc
• Doppler lidar observed wind-speed using Doppler beam swinging (DBS)
• Comparison with BT winds: Ulidar=0.98 UBT + 0.56
• Sampling error ~ 0.4 ms-1
L
LiDAR gate resolution
Lane S.E. et al., (2013), JWEIA
How well do Doppler lidar measured wind-speeds compare with mast-based measurements?
What is the evolution of winds along an urban river throughout a day?
Wood et al. 2012, STOTENCurtis Wood, post-doc (now FMI)
Collaboration with Sue Grimmond, now at Reading
• C – cloudy, S – sunny• Feb to May 2011
• New horizontal scanning lidar technique
• Comparison with sonic anemometry, scintillometer
411
ASI 1 ‐ Prof. Janet Barlow
34
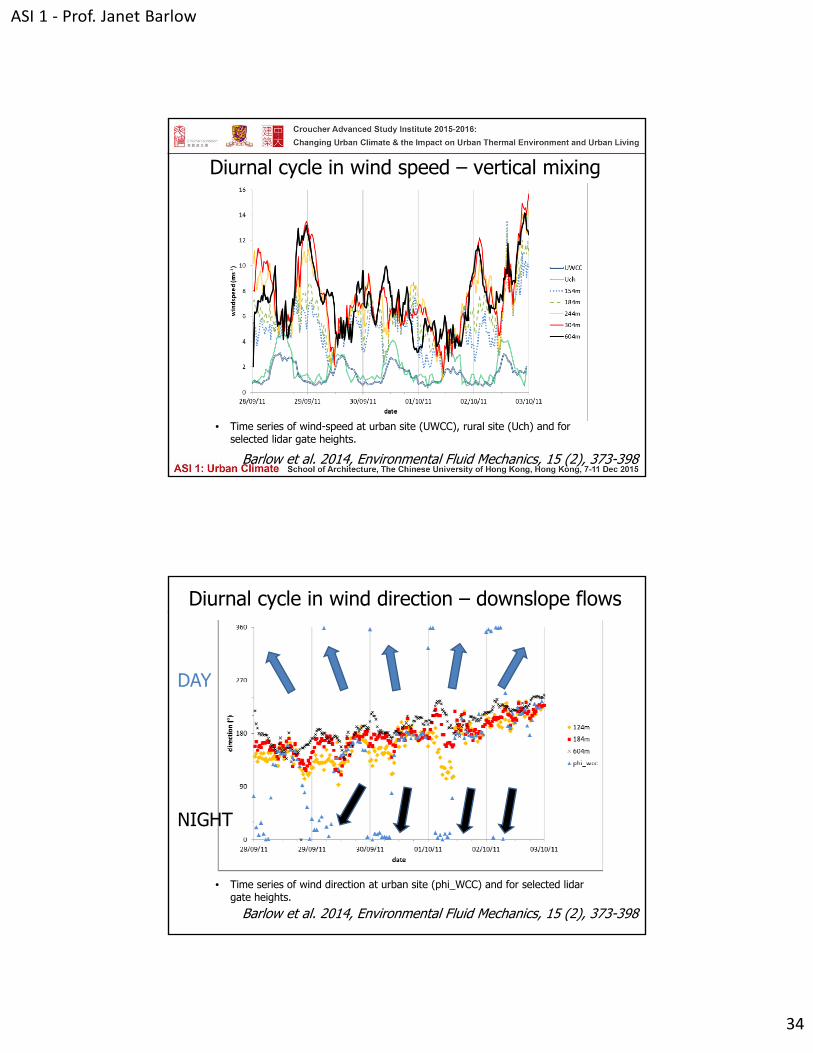
Diurnal cycle in wind speed – vertical mixing
• Time series of wind-speed at urban site (UWCC), rural site (Uch) and for selected lidar gate heights.
Barlow et al. 2014, Environmental Fluid Mechanics, 15 (2), 373-398
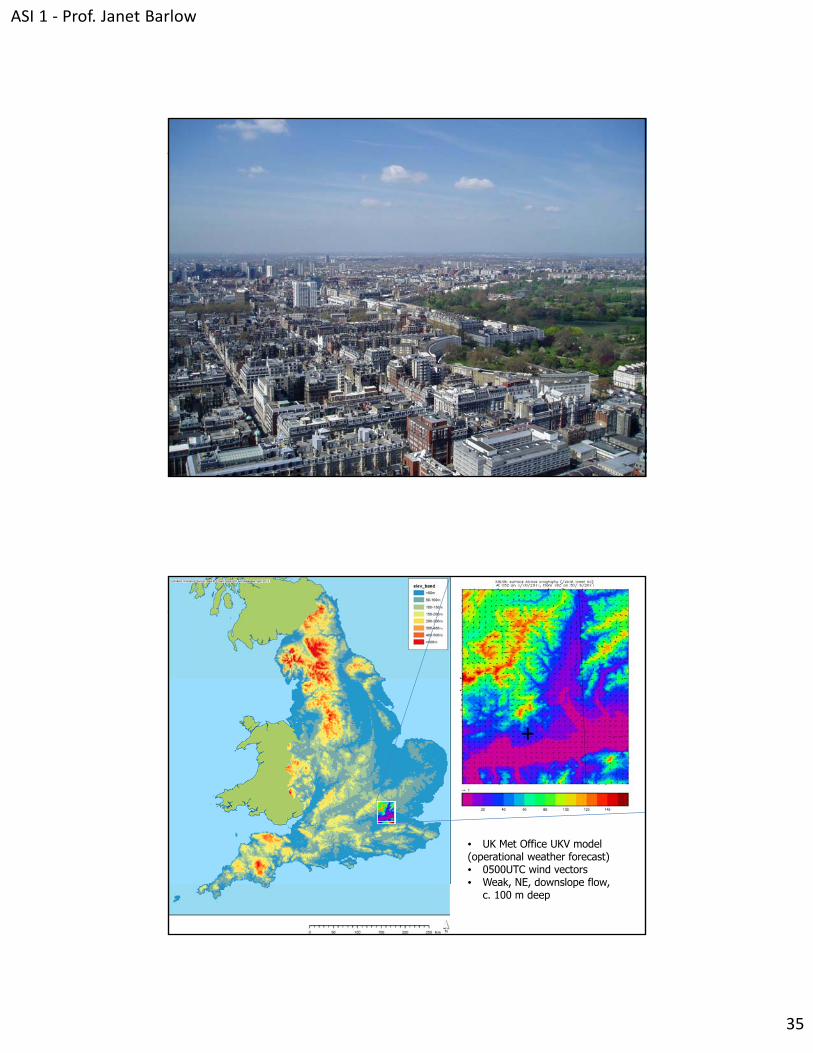
Diurnal cycle in wind direction – downslope flows
• Time series of wind direction at urban site (phi_WCC) and for selected lidargate heights.
Barlow et al. 2014, Environmental Fluid Mechanics, 15 (2), 373-398
DAY
NIGHT
ASI 1 ‐ Prof. Janet Barlow
35
+
• UK Met Office UKV model(operational weather forecast)• 0500UTC wind vectors• Weak, NE, downslope flow,
c. 100 m deep
ASI 1 ‐ Prof. Janet Barlow
36
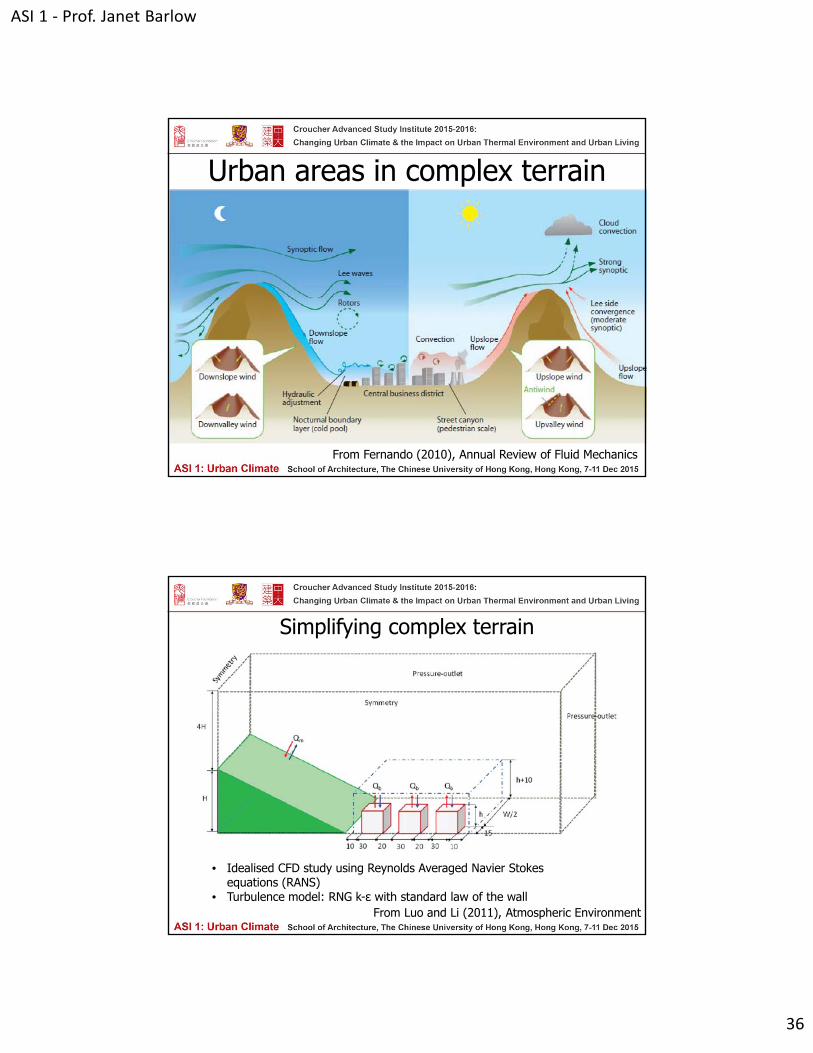
Urban areas in complex terrain
From Fernando (2010), Annual Review of Fluid Mechanics
Simplifying complex terrain
From Luo and Li (2011), Atmospheric Environment
• Idealised CFD study using Reynolds Averaged Navier Stokes equations (RANS)
• Turbulence model: RNG k-ε with standard law of the wall
ASI 1 ‐ Prof. Janet Barlow
37
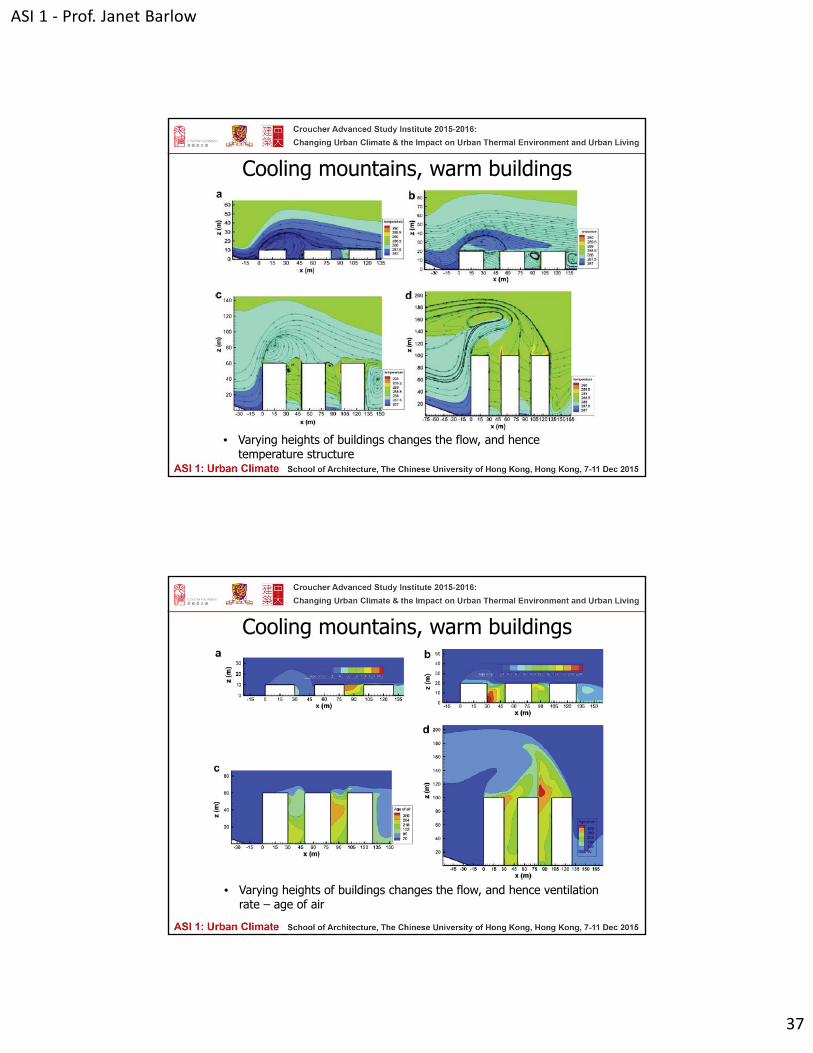
Cooling mountains, warm buildings
• Varying heights of buildings changes the flow, and hence temperature structure
Cooling mountains, warm buildings
• Varying heights of buildings changes the flow, and hence ventilation rate – age of air
ASI 1 ‐ Prof. Janet Barlow
38
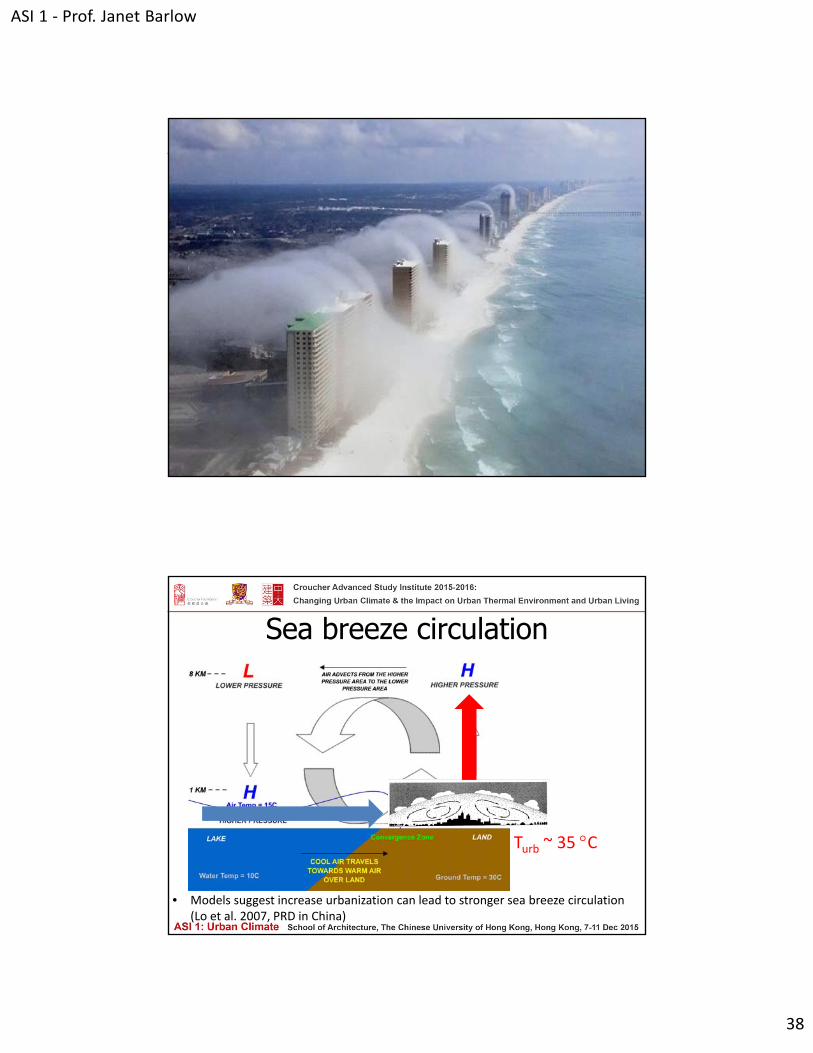
Sea breeze circulation
Turb ~ 35 C
• Models suggest increase urbanization can lead to stronger sea breeze circulation (Lo et al. 2007, PRD in China)
ASI 1 ‐ Prof. Janet Barlow
39
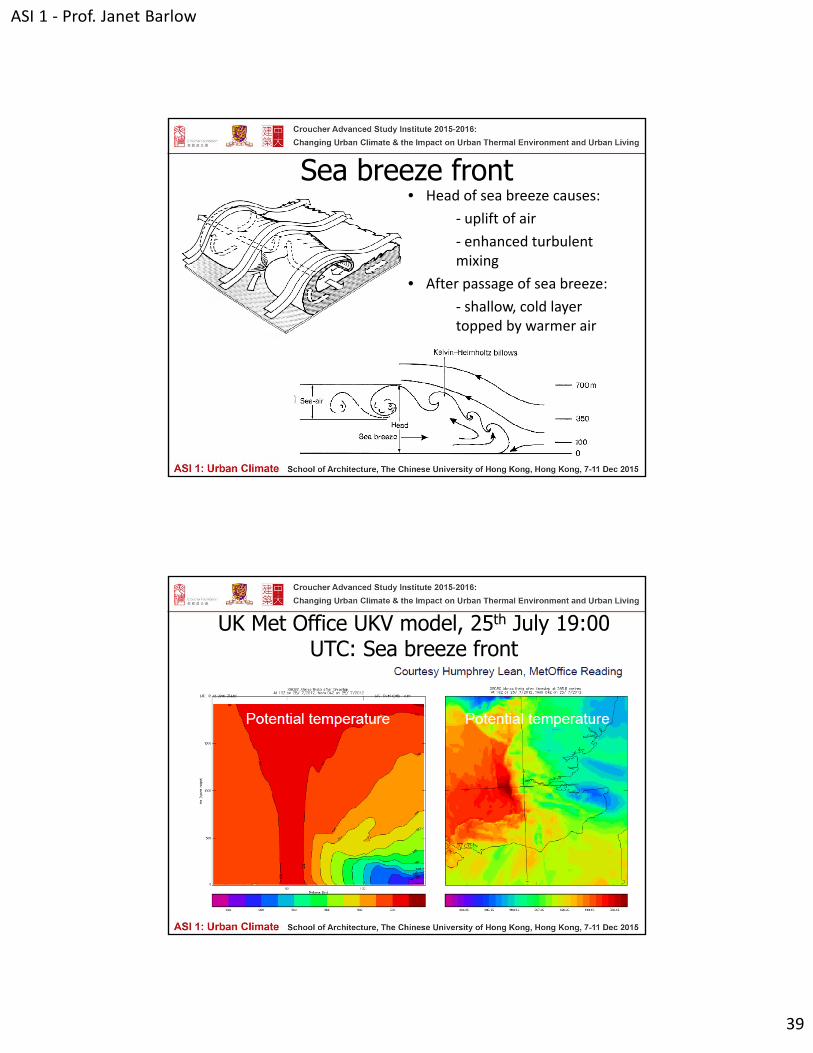
Sea breeze front• Head of sea breeze causes:
‐ uplift of air
‐ enhanced turbulent mixing
• After passage of sea breeze:
‐ shallow, cold layer topped by warmer air
UK Met Office UKV model, 25th July 19:00 UTC: Sea breeze front
ASI 1 ‐ Prof. Janet Barlow
40
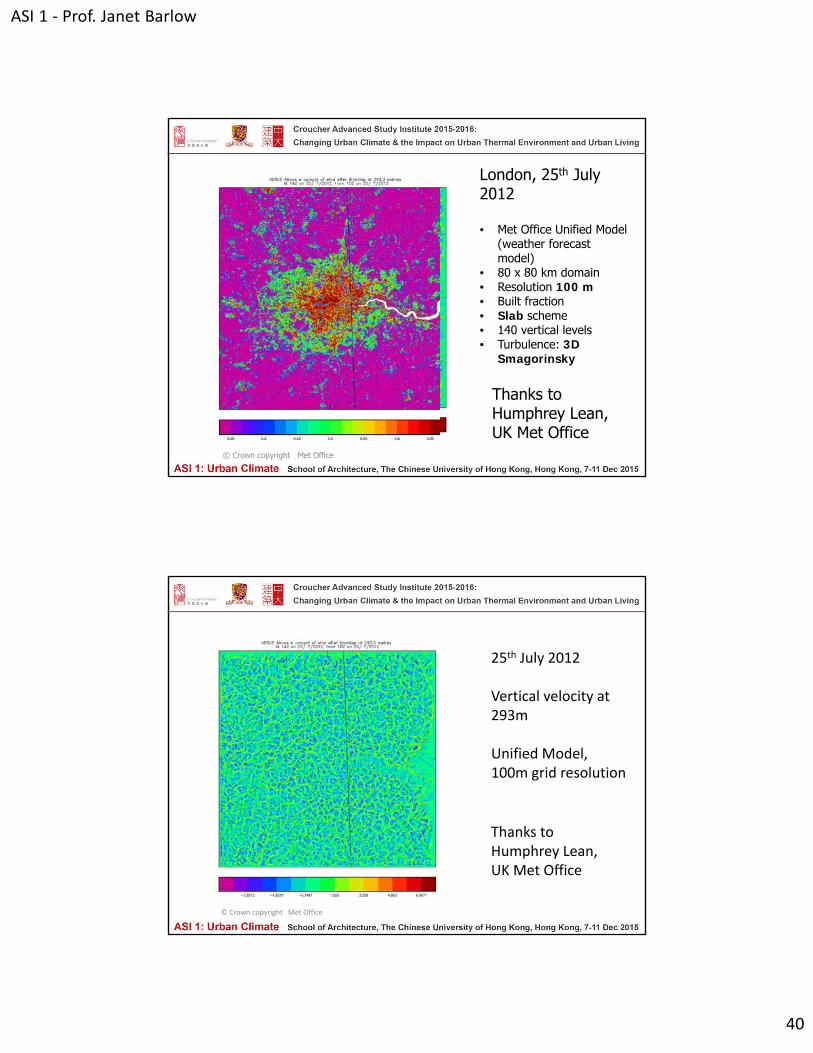
© Crown copyright Met Office
Thanks to Humphrey Lean, UK Met Office
London, 25th July 2012
• Met Office Unified Model (weather forecast model)
• 80 x 80 km domain • Resolution 100 m• Built fraction• Slab scheme• 140 vertical levels• Turbulence: 3D
Smagorinsky
© Crown copyright Met Office
Thanks to Humphrey Lean, UK Met Office
25th July 2012
Vertical velocity at293m
Unified Model, 100m grid resolution
ASI 1 ‐ Prof. Janet Barlow
41
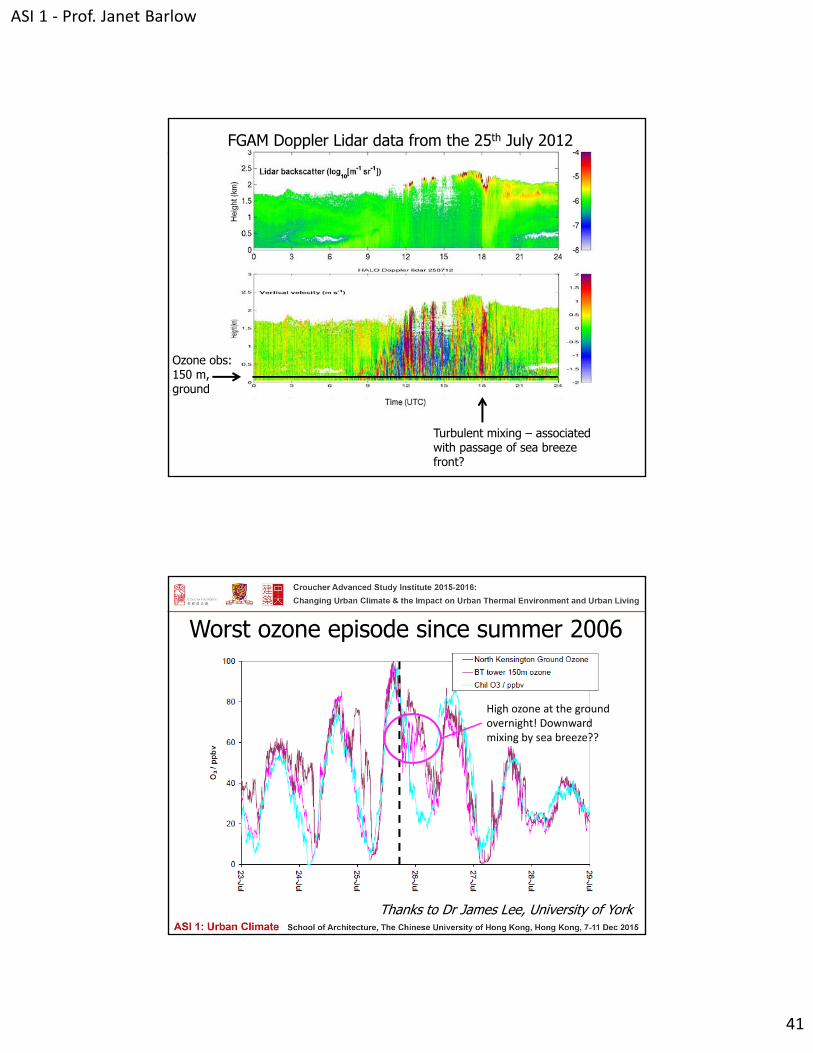
FGAM Doppler Lidar data from the 25th July 2012
Turbulent mixing – associated with passage of sea breeze front?
Ozone obs:150 m,ground
Worst ozone episode since summer 2006
Thanks to Dr James Lee, University of York
High ozone at the ground overnight! Downward mixing by sea breeze??
ASI 1 ‐ Prof. Janet Barlow
42
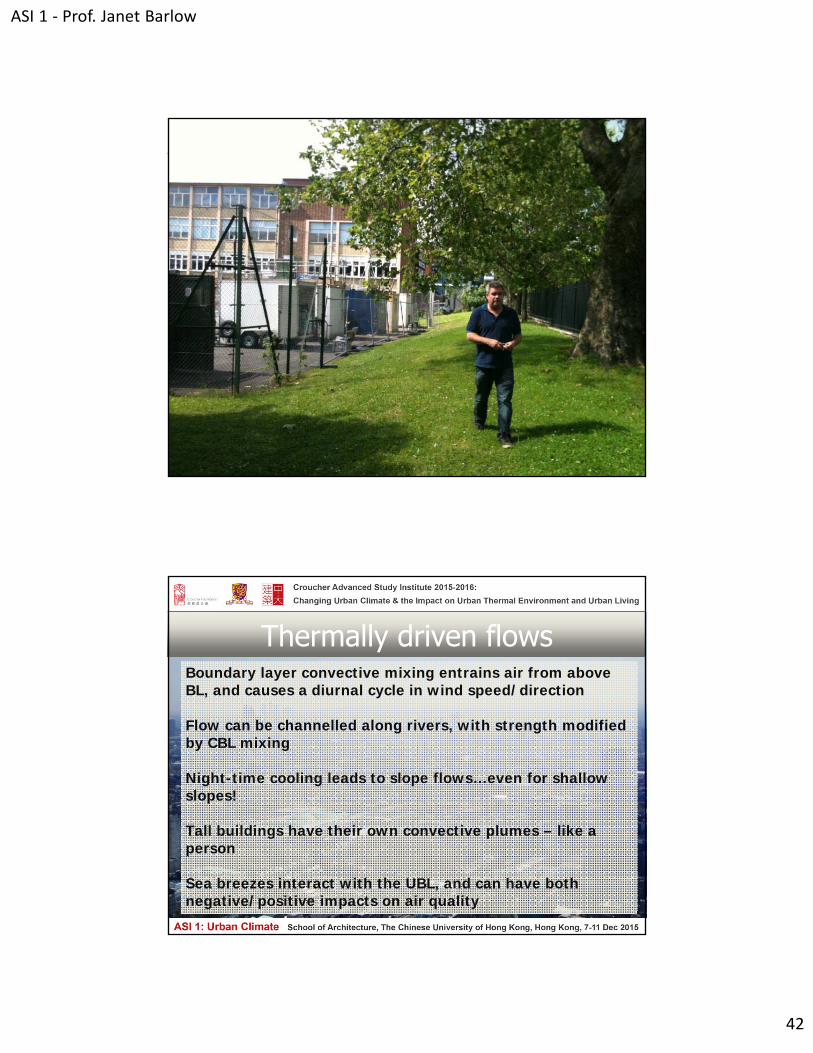
Thermally driven flowsBoundary layer convective mixing entrains air from above BL, and causes a diurnal cycle in wind speed/direction
Flow can be channelled along rivers, with strength modified by CBL mixing
Night-time cooling leads to slope flows…even for shallow slopes!
Tall buildings have their own convective plumes – like a person
Sea breezes interact with the UBL, and can have both negative/positive impacts on air quality
ASI 1 ‐ Prof. Janet Barlow
43
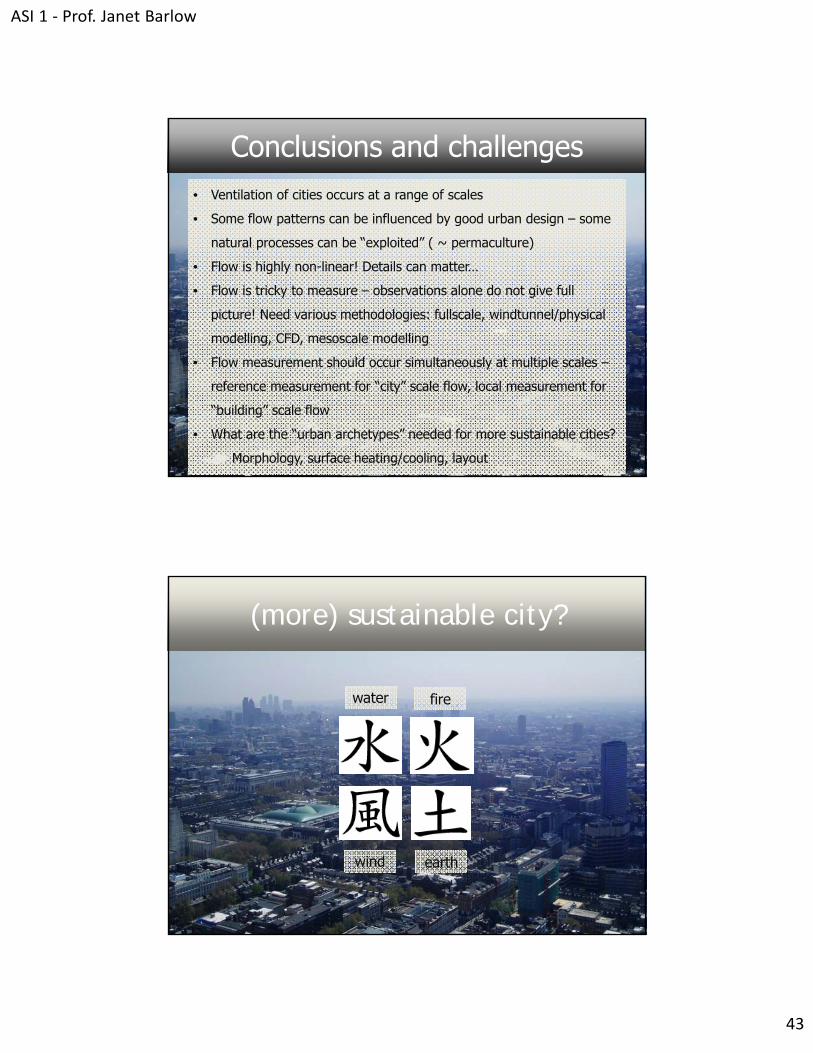
Conclusions and challenges• Ventilation of cities occurs at a range of scales
• Some flow patterns can be influenced by good urban design – some
natural processes can be “exploited” ( ~ permaculture)
• Flow is highly non-linear! Details can matter…
• Flow is tricky to measure – observations alone do not give full
picture! Need various methodologies: fullscale, windtunnel/physical
modelling, CFD, mesoscale modelling
• Flow measurement should occur simultaneously at multiple scales –
reference measurement for “city” scale flow, local measurement for
“building” scale flow
• What are the “urban archetypes” needed for more sustainable cities?
Morphology, surface heating/cooling, layout
(more) sustainable city?
water fire
wind earth