Ventilation measurements - NIST Technical Series Publications
126
NATIONAL BUREAU OF STANDARDS REPORT 23 36 VENTILATION MEASUREMENTS (Project No. ME-14) by C r W. Coblentz M. A. Barron P. R. Achenbach U. S. DEPARTMENT OF COMMERCE NATIONAL BUREAU OF STANDARDS . /
-
Upload
khangminh22 -
Category
Documents
-
view
2 -
download
0
Transcript of Ventilation measurements - NIST Technical Series Publications
NATIONAL BUREAU OF STANDARDS REPORT
23 36
VENTILATION MEASUREMENTS(Project No. ME-14)
by
C r W. CoblentzM. A. BarronP. R. Achenbach
U. S. DEPARTMENT OF COMMERCE
NATIONAL BUREAU OF STANDARDS
. /

U. S. DEPARTMENT OF COMMERCESinclair Weeks, Secretary
NATIONAL BUREAU OF STANDARDSA. V. Astin, Director
THE NATIONAL BUREAU OF STANDARDSThe scope of activities of the National Bureau of Standards is suggested in the following listing ofthe divisions and sections engaged in technical work. In general, each section is engaged in special-
ized research, development, and engineering in the field indicated by its title. A brief description
of the activities, and of the resultant reports and publications, appears on the inside of the backcover of this report.
Electricity. Resistance Measurements. Inductance and Capacitance. Electrical Instruments.Magnetic Measurements. Applied Electricity. Electrochemistry.
Optics and Metrology. Photometry and Colorimetry. Optical Instruments. PhotographicTechnology. Length. Gage.
Heat and Power. Temperature Measurements. Thermodynamics. Cryogenics. Engines andLubrication. Engine Fuels. Cryogenic Engineering.
Atomic and Radiation Physics. Spectroscopy. Radiometry. Mass Spectrometry. Solid StatePhysics. Electron Physics. Atomic Physics. Neutron Measurements. Infrared Spectroscopy.Nuclear Physics. Radioactivity. X-Rays. Betatron. Nucleonic Instrumentation. Radio-logical Equipment. Atomic Energy Commission Instruments Branch.
Chemistry. Organic Coatings. Surface Chemistry. Organic Chemistry. Analytical Chemistry.Inorganic Chemistry. Electrodeposition. Gas Chemistry. Physical Chemistry. Thermo-chemistry. Spectrochemistry. Pure Substances.
Mechanics. Sound. Mechanical Instruments. Aerodynamics. Engineering Mechanics. Hy-draulics. Mass. Capacity, Density, and Fluid Meters.
Organic and Fibrous Materials. Rubber. Textiles. Paper. Leather. Testing and Specifi-
cations. Polymer Structure. Organic Plastics. Dental Research.
Metallurgy. Thermal Metallurgy. Chemical Metallurgy. Mechanical Metallurgy. Corrosion.
Mineral Products. Porcelain and Pottery. Glass. Refractories. Enameled Metals. Con-creting Materials. Constitution and Microstructure. Chemistry of Mineral Products.
Building Technology. Structural Engineering. Fire Protection. Heating and Air Condition-ing. Floor, Roof, and Wall Coverings. Codes and Specifications.
Applied Mathematics. Numerical Analysis. Computation. Statistical Engineering. MachineDevelopment,
Electronics. Engineering Electronics. Electron Tubes. Electronic Computers. Electronic
Instrumentation.
Radio Propagation. Upper Atmosphere Research. Ionospheric Research. Regular Propaga-tion Services. Frequency Utilization Research. Tropospheric Propagation Research. HighFrequency Standards. Microwave Standards.
Ordnance Development. These three divisions are engaged in a broad program of research
Electromechanical Ordnance, and development in advanced ordnance. Activities include
Ordnance Electronics. basic and applied research, engineering, pilot production, field
testing, and evaluation of a wide variety of ordnance materiel. Special skills and facilities of otherNBS divisions also contribute to this program. The activity is sponsored by the Department ofDefense.
Missile Development. Missile research and development: engineering, dynamics, intelligence,
instrumentation, evaluation. Combustion in jet engines. These activities are sponsored by theDepartment of Defense.
• Office of Basic Instrumentation • Office of Weights and Measures.

NATIONAL BUREAU OF STANDARDS REPORTNBS PROJECT NBS REPORT
1003-20-1014 April 3, 1953 2336
VENTILATION MEASUREMENTS(Project No. ME-14)
by
C. W. CoblentzA. Barron
P. R. Achenbach
to
Office of the AdministratorHousing and Home Finance Agency
Washington, D. C.
The publication, reprii Approved for public release by the pa,t',s P rohlbl,ed
unless permission not Director of the National Institute ofiards
'Washlne'°"
25.D.C. Such pern,,Standards and Technology (NIST)
" h3S b68n Sp0Clfi ’
cally prepared If thal _ , _ _'
,rt for Its own use,
on October 9, 2015.


Ventilation Measurement
ABSTRACT
A study was made at the National Bureau of Standardsof the methods for measuring the infiltration of airinto buildings and the natural ventilation of cr&Wlspaces and attics. This research was performed underan agreement with the Office of the Administrator,Housing and Home Finance Agency, authorized underTitle III of the Housing Act of 194$, as amended,and was identified as Project No. 1950-ME-14 "Venti-lation Measurement".
It was found that several tracer gas methods are avail-able for infiltration measurement and that these methodsare probably more accurate and better adapted to fielduse than calorimetric methods or direct air flow measure-ments. The more promising tracer gas methods are be-lieved to be (a) helium gas with a katharometer
,(b)
ethane gas with an interferometer, (c) methane gas withan infrared gas analyzer. The use of either a radio-active gas with an electrometer or a halogenated hydro-carbon gas with a halide photometer is believed to bepotentially practical but these methods involve somehazard to the personnel using them.
The heated thermocouple anemometer was found to be bettersuited to the measurement of very low air velocities inducts and rooms such as those associated with naturalventilation of crawl spaces and attics than any otherknown instrument. A heated thermocouple anemometer anda portable helium katharometer developed at the NationalBureau of Standards are described and their performanceillustrated. Studies were made to determine the accuracyand lag of a commercially-made helium analyzer in measur-ing the absolute helium content in air and to determinethe effects of pressure and sampling rate on the perform-ance of the instrument. Infiltration measurements madesimultaneously with the portable helium katharometer de-veloped at the National Bureau of Standards and a com-mercially-made katharometer differed by amounts rangingfrom 0 to 4 percent.
2
A detailed study of the air exchange between the variousparts of an experimental house and the outside as affect-ed by temperature differences revealed that there wastwo-way flow between the basement and outside and betweenthe living space and outside and one-way flow from atticto outside. In addition there was air movement from base-ment to living space, from basement to attic, and from liv-ing space to attic. All of these air exchanges were inter-dependent and most of them tended to increase as the indooroutdoor temperature difference increased. This experiment-al house fyas enclosed in a larger structure and was not ex-posed to natural wind.
Some data are reported on the natural ventilation of a
basement through foundation openings and by means of a
vertical stack reaching from the basement through theroof.
This investigation reveals broad possibilities for fur-ther study of air movement into buildings and throughbuildings which would probably lead to revised construc-tion for the purpose of better control of the air flow,vapor flow, and heat loss of dwellings and other struc-tures .
I. INTRODUCTION
The computation of the heat loss of a building usually in-cludes an item for the heat carried out of the building as a re-sult of the infiltration of cold air. The computation of the in-filtration heat loss is generally based on the length of crackaround windows and doors, an estimate of the workmanship involved,and a design wind velocity or it is based on a more general esti-mate of the number of complete air changes that will occur in thebuilding per hour under design weather conditions. These methodsare known to be approximations, but they have received wide usagebecause accurate measurements of the air leakage for differentkinds of structures are not available. Unknown heat losses suchas that for infiltration have caused engineers to resort to theuse of safety factors in the selection of heating plapt capacity.
Little is known about the actual infiltration rates in exist-ing buildings or how well the actual values compare with thevalues computed by the previously mentioned methods because therehas been no generally accepted method of proved accuracy for measur-ing the infiltration rate in buildings.
- 3 -
The ventilation of attics and crawl spaces has likewise beenbased on empirical rules developed by trial and error and improvedby experience because the amount of ventilation provided by anygiven arrangement could not readily be determined.
Attic and crawl space construction could be better protectedagainst condensation and deterioration if ventilation rates couldbe more accurately evaluated for different arrangements of louvers,openings, etc. Greater precision in selecting heating equipmentfor houses could be attained if infiltration rates were accurate-ly known and there would be a probable saving of materials andfuels and a greater assurance of comfort for the owner.
— u
The present project was established to investigate variousmethods of measuring infiltration in buildings and to study methodsfor measuring the natural ventilation occurring in attics and crawlspaces with certain duct and louver arrangements. The course ofthe investigation was guided by the availabilities of suitable in-struments for the measurements that were to be made and by the re-sults that were observed as the investigation progressed. Thekathometer used for the major portion of the infiltration measure-ments was loaned to the National Bureau of Standards by the Ameri-can Society of Heating and Ventilating Engineers. Early investi-gation also showed that precise measurements of crawl space venti-lation could not be made until an instrument for measurement ofvery low air velocities was available so a heated thermocoupleanemometer was designed and constructed.
The work done under this project can be divided into fiveparts as follows:
1. Survey of Infiltration Measurement Methods
2. Infiltration Measurements with a Cambridge Katharometerand an Interferometer
3. Design of a Portable Katharometer
4. Measurements of Crawl Space Ventilation
5. Design and Calibration of a Heated-ThermocoupleAnemometer

- 4 -
II. SURVEY OF INFILTRATION MEASUREMENT METHODS
The following nine methods for measuring infiltration rates
were either tried or investigated sufficiently to evaluate theirpracticability;
a. Helium or hydrogen gas with a katharometer
b. Ethane gas with an interferometer
c. Radioactive tracer gas (ethane) with an electrometer
d. Hydrogen gas with RCA Detector tube4
e. Hydrocarbon gas with an infrared gas analyzer
f. Hydrocarbon gas with a sensitive hygrometer tosense changes in the moisture content of samplesafter combustion of the hydrocarbon gas.
g. Halogenated hydrocarbon gas with a photometer.
h. Calorimetric determination based on the amount ofadditional heat required to heat the Test Bungalowwith infiltration as compared to that required withno infiltration for equal temperature differencesbetween indoors and outdoors.
i. Determination on an equivalent crack or orifice?irea by pressurizing the living space with anauxiliary blower and measuring the air flow andthe pressure difference between indoors and out-doors .
The first two methods listed involving the use of a katha-rometer and an interferometer were tried and these methods willbe discussed in detail later.
The use of a radioactive tracer gas^ appeared to be practical,at first. Radioactive carbon has such a long half-life that itcould be considered to be a constant source of electrons for theduration of tests such as these. Ethane gas with radioactivecarbon molecules was obtainable through the Atomic Energy Com-mission; ethane having a' density and diffusion rate closely ap-proximating that of air. An electrometer with sufficient sensi-'tivity to measure electron flow rates equivalent to 10-^5amperes was available as a recently-developed item of one manu-facturer. However, calculation of the concentration of radio-active gas that would be required to produce a measurable cur-rent with this electrometer indicated that the radioactivity

- 5 -
level would be higher than could be tolerated safety by humanbeings . Thus all of the observations would have to be made byremote control and the test space would remain contaminated forsome time after any given test. This method might prove to be apractical one, however, if an instrument were developed that wouldmeasure lower current levels than presently available electrometersare designed for so the test space could safely be occupied by theobservers.
A hydrogen detector tube with a paladium window for the de-tection of hydrogen gas in air was investigated for its usefulnessin infiltration studies. It was found, however, that this detectorapparatus was designed primarily to detect and locate leaks invacuum tubes using hydrogen gas, and does not provide a quantita-tive measurement of the tracer gas.
A commercially made gas analyzer is available for the detec-tion and measurement of carbon dioxide, carbon monoxide, methane,or other hydrocarbon gases in air based on the principle of theabsorption of energy in the infrared region by these gases. Theinstrument uses a source of infrared energy, reflecting mirrors,sampling cells, and two bolometers as two elements in a Wheatstonebridge circuit. The amount of infrared energy absorbed from theoriginal beam is a measure of the concentration of the tracer gasin the sample. The instrument is equipped with a recorder and isused for control and recording of gas concentration in variousindustrial processes.
It can be made sensitive to concentrations of less than onepercent for full scale deflection and provides a printed recordof the change in concentration of tracer gas with time. Theanalyzer is a self-contained cabinet-type unit equipped with asampling system suited to the application. It appears to be well-suited to the purpose of infiltration measurements except for itshigh original cost; the selling price being approximately fourthousand dollars.
2A film of phosphoric acid or sulfuric acid is sensitive to
small changes in the water vapor content of air or other gases.The relative humidity of air can be measured by obtaining equalindications of moisture content for a sample of air with unknownmoisture content and a sample of oxygen under pressure withknown moisture content by passing them over a phosphoric acidfilm on a suitable electrode. This type of hygrometer could beused in conjunction with hydrogen or a hydrocarbon tracer gasfor measuring infiltration rates. The mixture of air and tracergas would be sampled and the tracer gas burned by means of a hotwire element after which the moisture content of the resultinggases could be determined by means of the phosphoric acid hy-grometer. The concentration of tracer gas could be computed

- 6 -
from the relative humidity data. Measurements of relativehumidity of the air in the building would also have to be madewithout combustion of the tracer gas so corrections could bemade in the results obtained from the combustion of the tracergas. This method has some, but not all, of the disadvantagesof using water vapor directly as the tracer gas in that mostatmospheres have some water vapor in them; the exchange ofwater vapor between the materials in a building' and the airinside the building probably seldom attains a steady state,and the presence of observers or other moisture-generatingsources might disturb the water vapor content of any buildingunder observation.
A portable instrument is commercially available to measurelow concentrations of halogenated hydrocarbons in air. Theprinciple of operation of this apparatus is as follows:
The intensity of the blue lines of the copper spectrum,produced in an electric arc between two electrodes, is con-tinuously measured with an electric photometer using a bluesensitive phototube fitted with a blue glass color filter.Halide vapor coming in contacts with the electrodes reacts toform a copper halide, which is carried into the arc. The in-tensity of the blue spectrum is proportional to the concentra-tion of halide vapor present.
Although a full scale deflection of the indicating meteris said to be obtained at a concentration of less than 0.1$of carbon tetrachloride in air, the accuracy of the instrumentis only ±10$. Because of its limited accuracy and the possiblehazards to personnel working continuously in an atmosphere withhalogenated compounds, this method of tracer gas detection wasconsidered impractical.
The possibility of making a calorimetric measurement ofthe heat loss attributable to infiltration and from that aderived value of the quantity of air leakage was investigated.This method would involve the measurement of the heat requiredby the Test Bungalow for a given temperature difference withno infiltration and a comparative value of the heat loss underidentical conditions except that infiltration would be permitted.It was proposed that the inside surface of the entire livingspace would be sprayed with one or more coats of vinal chlorideacetate or polyethylene material that would reduce the air leak-age and vapor transmission to a negligible value. These materialscould be peeled off readily when the tests were completed with-out permanent damage to the interior finish of the structure.

- 7 -
While evaluation of the heat loss due to infiltrationmight be possible by this method the following practical dif-ficulties indicated that it was not the most promising method:
(a) It would be difficult to seal all cracks and fissures inthe structure especially those in the hollow studs spacethat permitted air leakage directly from the basement tothe attic, but which removed heat from the living spaceby transmission through the wall surfaces.
(b) The method could not be applied to existing structuresin the field.
(c) Since more heat would be required when infiltration didexist, it would be difficult, if not impossible, to at-tain the same temperature distribution in the buildingfor the two cases. Consequently, a comparison of heatrequirements for the two cases would probably not be de-void of all influences other than infiltration.
It had been postulated that an equivalent crack or orificearea could be established for any room or building by pressuriz-ing the space with an auxiliary blower that would assure leakagein one direction through all the openings in the enclosing sur-faces. By measuring the air delivery of the blower with a suit-able orifice and determining the indoor-outdoor pressure differ-ence with a sensitive micro-manometer an equivalent aggregatearea of leakage could be computed from the orifice formula,
«* uWrate of air delivery by blower, cu ft/ minindoor-outdoor pressure difference, in W.G.density of air, lb/cu ftequivalent area of all leaks, sq ftcombination of the orifice constant and severalconversion factors for the system of units employed
-"However, it appears that no practical use could be made ofthe equivalent area A after evaluating it because the pressurescausing flow through a building are a combination of wind pressureand chimney effects such that (a) the crack area serving as inletsand outlets for leakage would often be unequal (b) the neutralpressure zone in a building may shift up and down with outdoortemperature, and (c) the wind pressure causes primarily horizon-tal air motion through a building whereas the chimney effect pro-duces primarily vertical movement of air through tire- building.
where Q =
h =
d =
A =
K =

- a -
III. INFILTRATION MEASUREMENTS WITH A CAMBRIDGE. KATHAROMETER AND AN INTERFEROMETER
A*. Description of Ethane - Interferometer Method
Ethane has favorable characteristics as a tracer gas forair infiltration measurements because both its density anddiffusion rate are very nearly equal to that of air. An inter-ferometer provides a simple way to determine low concentrationsof ethane in air 0
An interferometer divides a beam of light into two ormore parts that travel optical paths of different lengths andwhich are later recombined to form interference fringes. Theoptical length of path depends not only on the geometric lengthof path but also the refracture index of the materials throughwhich the light beams pass. The dispersion of the interferencefringes produced by passing two light beams through gases withdifferent refractive indices can be measured by adjusting therelative angularity of identical plane-parallel plates of opti-cal glass placed in the paths of the two beams to compensatefor the dispersion. The changes in position of the opticalplates can be used to evaluate the difference in refractiveindex of the two gases.
The instrument available at the National Bureau of Standardsfor making decay measurements With ethane gas was a portableinterferometer ‘with two 10 cm. chambers through which the air-ethane mixture in the room and the outside air could be passed.Because of the relatively short length of the chambers in thisinstrument the displacement of the fringes was small when com-paring the refractive index of air and an air-ethane mixturecontaining Tes^ than 1 percent ethane. As a result only smalladjustments of the optical plates were necessary for realigningthe interference fringes and the accuracy was limited. A moreelaborate instrument with longer chambers would have providedgreater precision in measurement. The portable interferometerwas used as a check method for comparison with the katharometerin studying infiltration of air in the north bedroom of theTest Bungalow.
B. Description of Helium Katharometer
The measurement of low concentrations of hydrogen or heliumin air can be accomplished easily and with a high degree of ac-curacy by virtue of the difference in thermal conductivity3 ofthese gases and that of air. The thermal conductivity of hydro-gen is approximately 7 times that of air whereas the thermal

- 9 -
conductivity of heliugi is about six times that of air. A
tracer gas tecjinique^ > 5 for studying the infiltration of airin buildings was first described by Marley using a katharom£eter® (a thermal conductivity meter) to evaluate the concen-tration of the tracer gas in air. An instrument of this typemanufactured by the Cambridge Instrument Company for use with
helium as a tracer gas was purchased by the American Societyof Heating and Ventilating Engineers and loaned to the Nation-al Bureau' of Standards for studies of infiltration in the Test
Bungalow. This instrument was equipped with three separatethermal conductivity cells so three samples of helium-airmixture could be drawn simultaneously for concentration de-terminations. A photograph of the Cambridge helium analyzeris shown in Fig. 1.
Each of these thermal conductivity cells contained twoplatinum wires that were heated by a constant electric current.The wires were installed in two cavities drilled in a singlebrass block so that their wall temperatures would always beequal. The wire temperature reaches a steady value when theheat generated by the electric current is equal to that dissi-pated by the wire to its surroundings. One cavity was closedat both ends and the tracer gas-air mixture to be analyzedwas passed through the other cavity. Since the thermal con-ductivity of helium is roughly six times that of air, the wirein the sampler cavity was cooled more than the wire in thereference cavity. This cooling lowered the electrical resist-ance of the platinum wire. The two wires formed two legs ofa Wheatstone bridge circuit and this change in resistance causeda bridge unbalance. The unbalance was indicated on a galva-nometer calibrated directly in percent of helium in air. Theinstrument was equipped with a motor-driven vacuum pump to drawthe helium-air mixture through the sampling cavity and thesesamples were bubbled through three inches of water. The sampleswere bubbled through water because the amount of water vapor inair has a considerable effect upon its thermal conductivity.With this arrangement, the thermal conductivity of the air inthe sealed cavity serving as a reference cell was compared withthe thermal conductivity of the helium-air mixture drawn throughwater and brought -1 to a constant relative humidity approximatingsaturation
.
A selector switch allowed any one of the three units to beconnected to the galvanometer, which was calibrated from zeroto lo6% He and three samples could be measured in quicksuccession.
10
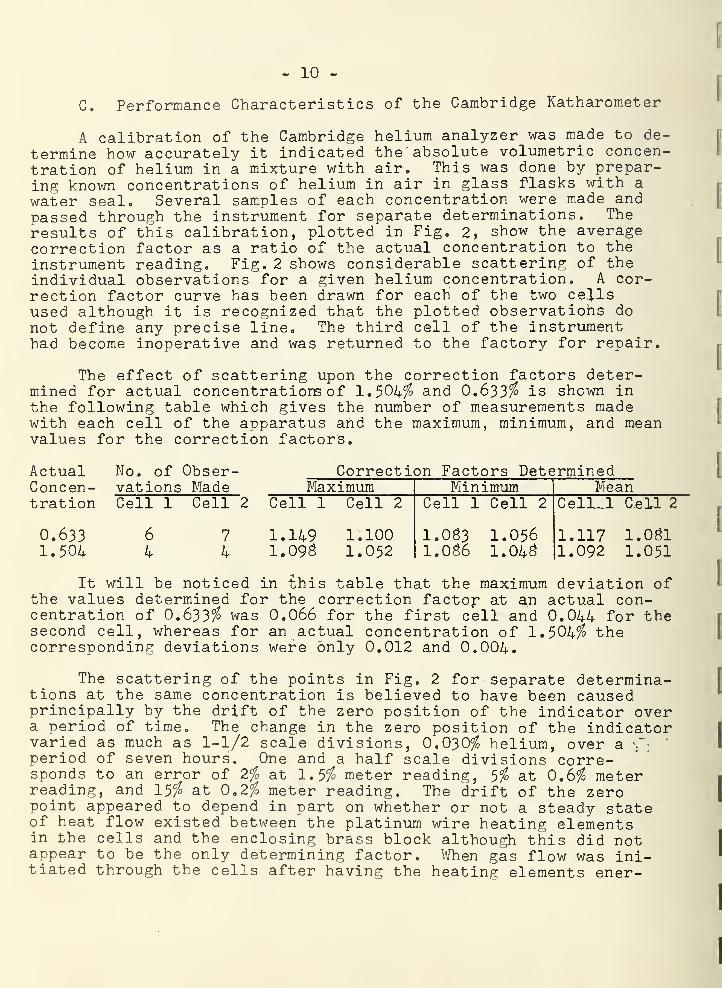
C. Performance Characteristics of the Cambridge Katharometer
A calibration of the Cambridge helium analyzer was made to de-
termine how accurately it indicated the absolute volumetric concen-tration of helium in a mixture with air. This was done by prepar-ing known concentrations of helium in air in glass flasks with a
water seal. Several samples of each concentration were made andpassed through the instrument for separate determinations. Theresults of this calibration, plotted in Fig. 2, show the averagecorrection factor as a ratio of the actual concentration to theinstrument reading. Fig. 2 shows considerable scattering of theindividual observations for a given helium concentration. A cor-rection factor curve has been drawn for each of the two cellsused although it is recognized that the plotted observations donot define any precise line. The third cell of the instrumenthad become inoperative and was returned to the factory for repair.
The effect of scattering upon the correction factors deter-mined for actual concentrations of 1 . 50
4
% and 0 . 633% is shown inthe following table which gives the number of measurements madewith each cell of the apparatus and the maximum, minimum, and meanvalues for the correction factors.
Actual No. of Obser- Correction Factors DeterminedConcen- vations Made Maximum Minimum Meantration Cell 1 Cell 2 Cell 1 Cell 2 Cell 1 Cell 2 Cell-1 C.ell 2
0.633 6 7 1.149 1.100 1.083 1.056 1.117 1.0811.504 4 4 1.098 1.052 1.086 1.048 1.092 1.051
It will be noticed in this table that the maximum deviation ofthe values determined for the correction factop at an actual con-centration of 0 . 633% was 0.066 for the first cell and 0.044 for thesecond cell, whereas for an actual concentration of 1.504% thecorresponding deviations were only 0.012 and 0.004.
The scattering of the points in Fig. 2 for separate determina-tions at the same concentration is believed to have been causedprincipally by the drift of the zero position of the indicator overa period of time. The change in the zero position of the indicatorvaried as much as 1-1/2 scale divisions, 0.030% helium, over a */:
‘
period of seven hours. One and a half scale divisions corre-sponds to an error of 2% at 1.5% meter reading, 5% at 0.6% meterreading, and 15% at 0.2% meter reading. The drift of the zeropoint appeared to depend in part on whether or not a steady stateof heat flow existed between the platinum wire heating elementsin the cells and the enclosing brass block although this did notappear to be the only determining factor. When gas flow was ini-tiated through the cells after having the heating elements ener-


ao^oe^ uot3.oa.iJOD
Actual
Goncentratlon
,
%He


11 -
gized without gas flow overnight, the zero position changedabout one scale division for each cell during the first hourof operation,, During the next six hours the zero position oncell Noo 2 changed an additional half scale division in thesame direction whereas the zero position on cell No. 1 changeda half scale division in the opposite direction.
A horizontal correction factor curve such as that shownin Fig. 2 for cell No. 1 would cause no error in infiltrationmeasurements based on changes in concentration of helium withtime assuming that the error due to scattering was not present.A correction factor curve with the slope shown for cell No. 2
in Fig. 2 would cause infiltration computations to be about4 percent too high if no corrections were made to the observedvalues and there was no error due to scattering. However,the data in Fig. 2 suggest that the error resulting from thevariations in indicated values at any given concentration couldbe greater than that resulting from the average change in cor-rection factor from one end of the scale to the other.
Errors in reading the curved indicator scale caused byparallax are considered to be of the order of one-fourth scaledivision or 0.005% helium. Thus, parallax could cause a 2-1/2percent error in the reading for a concentration of 0.2% helium.
The lag of the Cambridge device was determined by alter-nately introducing a helium-air mixture from a 6-gallon can andpure air into two of the test cells and averaging the readingstaken during five such cycles. The results of these tests withonly 3 ft of tubing between the can and apparatus are shown inFig. 3, whereas Fig. 4 shows the results for a similar test witha sampling line consisting of 30 ft of l/4-in. copper tubing.It will be noticed that a near balance is reached after 3*5minutes with the 3 ft sampling line, whereas with a 30 ft linea balance of the indicator required about 5 minutes.
Some measurements were made to determine the effect of thesampling rate on the indication of the Cambridge instrument.It was found that no appreciable change of the indicator read-ing was noticeable if the sampling rate remained within therange from 100 to 170 cc/min. However, flow rates below100 cc/min caused erroneous results. There was no quantita-tive flow rate indicator on the Cambridge instrument, but anoperator with some experience could determine from the bubblingrate in the saturators when the flow rate was normal. The in-strument was found to be practically insensitive to atmosphericpressure fluctuations or pressure differences that may arisefrom long sampling lines. A test showed that a change in pres-sure at the inlet of the instrument from 36 in. W. G. pressureto 36 in. Wo Go vacuum increased the indicator reading by only0.02% of helium at the middle of the scale.
- 12
The characteristics of the Cambridge katharometer de-scribed above indicate that the following precautions shouldbe taken during use to minimize errors in the results:
(1) Gas should be drawn through the cells for at leastan hour before any measurements are taken,
(2) Helium concentrations in the range from 0,4 to 1.4percent should preferably be used to reduce the importance ofthe error caused by drift in the lower end of the scale andparallax at the two ends of the scale.
(3) The rate of gas flow through the bubblers should benoted to ascertain that it is normal and constant.
(4) The shortest possible sampling lines should be usedand appropriate consideration given to the lag of the instru-ment at the beginning of a test.
(5) Numerous readings of concentration should be takenduring any test so the errors caused by drift and parallax fora given observation would not be of such great significance.
D. Pilot Installation
A pilot installation was made in the north bedroom of theTest Bungalow to study the possibility of stratification of thetracer gas in the room and to furnish information on the best.arrangement of the gas supply and sampling systems for the en-tire building.
Seven stations were chosen in the north bedroom to furnishdata on stratification of the helium gas. These stations werenear the ceiling, near the floor, midway between ceiling andfloor and in upper and lower corners of the room at locationsconsidered most likely to reveal stratification if it occurred.One-quarter inch copper tubing was run from each of these sta-tions through the wall of the room and into the south bedroomwhere the helium analyzer was placed. Flexible tubing was usedat one statidn so that, in conjunction with a pulley arrange-ment, it could be made to scan the wall from floor to ceilingchoosing any point for sampling. An additional copper linewas installed in the north bedroom to introduce the helium intothe room. This line was also used as a sampling line duringthe test. By returning the helium-air mixture to the test, roomafter passing it through the analyzer it was not necessary tocompensate for this volume of air in the infiltration calcula-tions. Later it was determined that the samplers only extract-ed about one cu. ft. of mixture per hour and this was belowthe precision of the infiltration measurements. The tracer

PERCENT
HELIUM
TIME (MINUTES)


3
2
.1
0
9
8
7
6
5
.4
.3
,2
.1
TIME (MINUTES)

[
f
[

- 13 -
gas was taken from compressed-gas cylinders and metered throughan orifice meter 0 A 12 TT propeller type fan was operated in theroom for approximately one minute after the tracer gas had beenintroduced to completely mix the air and helium gas. The com-pressed-gas cylinder and orifice meter are visible at the rightof Figo lo
Tests were made with this pilot installation using both thehelium-katharometer and the ethane-interferometer methods. Ineach case an initial tracer-gas concentration of approximatelyone percent was used. When internal and external conditions ofthe test room remained constant during a test the rate of freshair leakage would be expected to remain constant with time. Onthis premise the graph of the volume of air infiltration versustime should be a straight line passing through the origin. Con-sequently, it should be possible to obtain a reasonably accur-ate value for the air change rate, from the slope of the linewith only a few measurements.
The following formula was used to calculate the air changerate from the observed decay of the tracer gas.
c = concentration of the tracer gas at time t
c 0= initial concentration of the tracer gas at t = o
R = K = number of air changes per unit of timeV
K = volume of air infiltration per unit of time
V = volume of room
Equation (1) is obtained by integrating the following ex-pression for the rate of loss of tracer gas per unit of time:
Figures 5 and 6 show the results of infiltration tests inthe north bedroom with the room closed and with no indoor-outdoortemperature difference using helium and ethane as the tracer gas,respectively. The results obtained by the two methods duringseparate tests under the same conditions agree quite closelyduring the first five and a half hours when observations weremade at half-hour intervals. Based on the first 5 1/2 hours of
c = c 0 e-Rt ( 1 )
where
( 2 )

- 14 -
the test the infiltration rate was 0.129 air changes per houras measured with the katharometer and 0.125 air changes perhour as measured with the interferometer. The - observationstaken with the two instruments on the day following the startof the test after an elapsed time of 22 hours do not agreesatisfactorily. The results obtained with the katharometeris that which would be expected if the rate of infiltrationremained constant throughout the test. The result obtainedwith the interferometer after 22 hours was much lower. Sincea period of about 16 hours elapsed, during which the teststructure was unattended, between the first group of observa-tions and the single observation taken on the next day, it isnot certain that cooling of the structure or entrance by someother person did not change the infiltration into the test room.
The interferometer used for those tests had only 14 scaledivisions for maximum deflection whereas the scale on thekatharometer had $0 divisions for a full scale reading. Con-sequently, the precision of any observation with the inter-ferometer was of a lower order than for the other instrumentand it was especially difficult to read correctly at low inter-ference ratios. For example, if the observed deflection after22 hours had been read as 3 scale divisions instead of 4 inFig. 6, the percent decay would have been 7$«6 and the airchanges 2.2 instead of 1.26. Under these conditions the agree-ment between the two methods after 22 hours would have beenreasonably good. However, for tests of shorter duration thetwo instruments corroborated each other in the determinationof infiltration rates. Because of its greater sensitivity thekatharometer was used for all observations of infiltration afterthis initial comparison. An interferometer with a longer lightpath could be used to attain greater sensitivity than that ofthe instrument used for this comparison.
Studies were made to determine whether or not stratifica-tion of the tracer gas occurred in the north bedroom as air in-filtration progressed in order to assist in the design of anadequate sampling system for the entire Test Bungalow. Fig. 7shows the results of a test made with no difference in tempera-ture between indoors and outdoors, no air circulation outdoors,and with the door and windows of the room closed. A fan in theattic was used to exchange air between the outdoors and theTest Bungalow enclosure by means of the chimney to prevent build-up of the helium concentration in the enclosure. Observationsof the helium concentration were made -near the floor, near theceiling, and at the 3-foot level for 77 minutes without agita-tion of the air in the room. Fig. 7 shows that the tracer gasconcentrations corresponded to leakage rates of 1.#, 0.3$, and0.5 air changes per hour for the first hour at the floor level,3-foot level, and ceiling level, respectively. This stratifi-cation of helium in the room was attributed to the inward leak-


OT\ng®
i
«
<
c
« TIME (hours)


AIRCHANGES
AT
DIFFERENT
ELEVATIONS
DUE
TO
STRATIFICATION
OF
HELIUM.
S30NVHD HIV
CO
TIME
in
Minute

- 15
age of fresh air in the lower part of the room and outward leak-age of contaminated air in the upper part of the room to the atticThe attic fan reduced the pressure in the attic about 0.01 in.Wo G„ This pattern of air infiltration would result in more rapiddilution of the helium gas in the lower part of the room than nearthe ceiling. This conclusion was supported by a test which revealed no stratification of helium in air in a closed vessel as a re-sult of the lower density of helium after the air and helium wereinitially well-mixed.
When a desk fan was turned on after 77 minutes of observa-tions under still air conditions, the concentration at the ceil-ing decreased and that at the floor level increased until bothstations indicated concentrations equal to that at the three-footlevel after the fan had been operating about 15 minutes. The re-sults. in Fig. 7 indicate that -for this particular. building theconcentration at the 3-foot level represented an average for theentire room under conditions that produced stratification of thetracer gas. The difference in infiltration rates shown in Figs.
5
and 6 as compared to Fig. 7 when there was no indoor-outdoortemperature difference in either case, was accounted for by theoperation of the fan in the attic.
Subsequent tests revealed that no measurable stratificationoccurred when heat was being supplied to the test room. This isprobably accounted for by the mixing action caused by the con**
vection from the heater and the downdrafts near the cold wallsof the room.
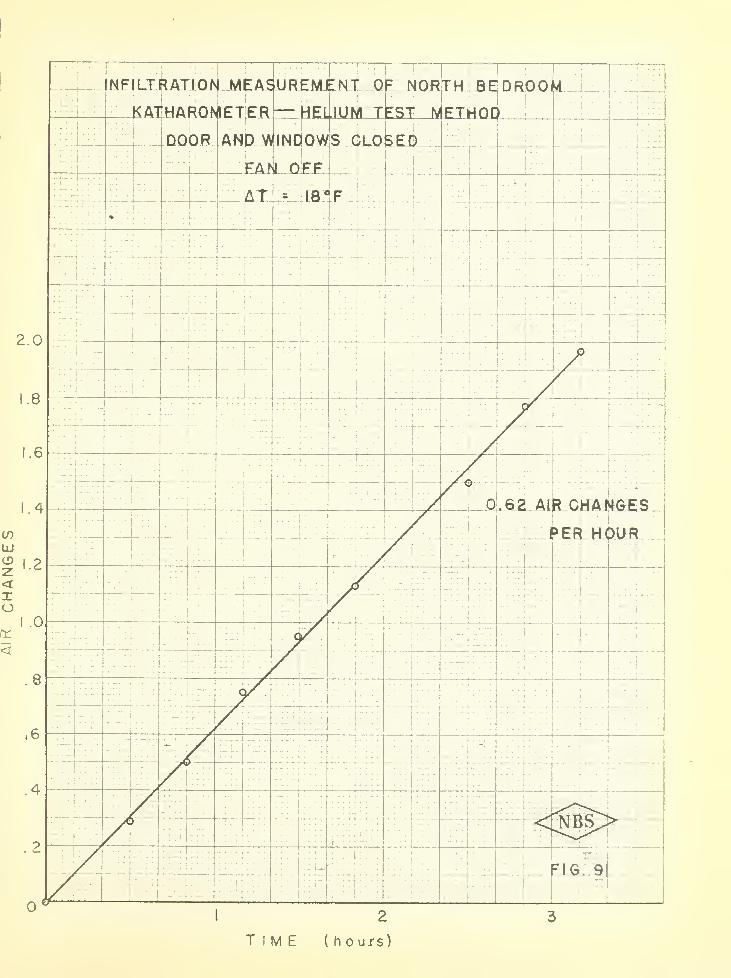
Preliminary tests in the north bedroom with indoor-outdoortemperature differences of 1$°F and 20°F showed that the infil-tration increased markedl}?- with increase in temperature differ-ence. The results shown in Figs. $ and 9 can be compared withthose in Figs. 5 and 6 to indicate that the infiltration with a20 degree temperature difference was about five times as greatas for the condition with no temperature difference between in-doors and outdoors.
Figs. 10 and 11 show the infiltration observed in the northbedroom with no temperature difference between indoors and out-doors when a window was opened 3/$-inch from the bottom and fromthe top, respectively. In each case a desk fan was used to keepthe air and helium gas
1
' mixed during the test. The tests indi-cated an infiltration rate of 0.45 air change per hour with thewindow opened from the bottom and 0.52 air change per hour withthe window opened from the top.
In comparing the -infiltration indicated in Figs. 10 and 11with partially open windows with that indicated in Figs. 5 and 6for a closed room, it should be pointed out that a desk fan wasin steady operation in the north bedroom during the tests with

- 16 -
the open windows whereas the fan was not in operation duringthe other tests. Investigation showed that the infiltrationrate was approximately doubled by the operation of the deskfan inside the north bedroom for otherwise identical conditions.If it is assumed that the observed infiltration rates in Figs.5 and 6 would have been doubled by the operation of a desk fan,it is concluded that the infiltration rate was about twice asgreat with a window opened 3/$-inch from top or bottom as for aclosed room with no indoor-outdoor temperature difference.
E. Infiltration Measurements in a Whole House
After completing the preliminary investigation of infil-tration in the north bedroom a series of tests was plannedusing the entire house. Based on the results obtained in thenorth bedroom a single sampling tube was installed in each roomto withdraw gas samples 3 feet above the floor. This precautionmay have been unnecessary inasmuch as it was found that nomeasurable stratification occurred in the north bedroom when itwas heated.
Fig. 12 is a schematic drawing of the manifold installed inthe south bedroom, which remained the instrument center, sosamples could be taken from any part of the house. The samplingtubes also served as a distribution system for introducing heliuminto the five rooms of the house. The compressor shown in Fig. 12purged the lines of helium after feeding was completed so thekatharometer would not be subjected to extremely high concentra-tions at the start of a test. Sufficient experience was obtainedduring the first few tests to regulate the desired concentrationof tracer gas by controlling the length of time that the valveon the helium cylinder was open. The use of the orifice flowmeter was then discontinued. The introduction of helium was donewith all interior doors open and four fans running at appropri-ate places to mix the helium with the air in all the rooms. Inthis way all the rooms had approximately the same concentrationof helium at the beginning of the test.
The general procedure for a test was as follows: Signswere placed outside the refrigerated enclosure requesting visi-tors not to enter because entrance, even into the enclosure,caused pressure changes that would disrupt the steady state con-ditions. All windows in the house were closed and locked and '
the external doors closed. The fans inside the house were turnedon and operated throughout the feeding time and the time requiredto purge the lines of helium. Then the inside doors were allclosed so the air change rate of each room could be measured in-dividually. (It was later found that the overall air change rateof the house was the same with the inside doors open or closed.)The helium analyzer was turned on and readings commenced. Samplesof gas were drawn from any three stations for five minutes, then


AIR
CHANGES


HARO.MET.ER
A/INDOW 0
R. CHANGES
.05i
j
p
E04
.03
FIG. I
NT OF. NOR'
UM TEST M
BED'RTH ROOM
THOD
3/8 FROM T0
TIME (minutes)


ATTIC
SHELL
K,
Lp
N̂
R
SCHEMATIC
DIAGRAM
OF
HELIUM
ANALYSER
INSTALLATION


- 17 -
from three other stations „ The five-minute interval was usedbecause experiment had shown that it took that long for thethermal conductivity cell to become responsive to the heliumconcentration at a given station,, During the five minutes thegalvanometer needle was moving slowly up or down the scale ad-justing itself to the new sample. The tests lasted, in general,about one hour or until the concentrations were too low to giveaccurate readings. A disadvantage of the analyzer was found tobe the curved face on the galvanometer and the absence of aparallax compensator, so readings below 0.2% and above 1.4%were considered to be less precise than those in the center ofthe scale when the air change rate curves were drawn.
It was planned to determine the air change rate of theTest Bungalow for a range of indoor-outdoor temperature differ-ences so a test was made to find its infiltration with no temper-ature difference and no wind. Fig. 13 shows the results of thistest. Fig. 14 represents the air change rate with no tempera-ture difference but with the refrigeration blowers running andcreating the equivalent of approximately a two mile per hourwind. This was actually the average air motion around the housein a circular pattern in a vertical plane and was constant forall tests since the blowers were operated at constant speed.All of the remaining tests were made with the blowers running.
In Figs. 13 and 14 the air change rate is reported as aweighted average, which was arrived at in the following manner:Since the rooms were of different sizes, it would not be correctto merely calculate the air change rate of each room and averagethe rates of the individual rooms because the small rooms wouldaffect the average air change rate of the entire house dispro-portionately under such a procedure. Therefore, the air changerate of each room was multiplied by its fractional part of theentire volume of the house. The sum of these products was call-ed the "weighted air change rate" of the house and is indicatedby a dotted line in Fig. ]_3o
It will be noted in Figs. 13 and 14 that some of the curvesshowing the relationship between air infiltration and time are notstraight lines whereas in Figs. 5, 6, 3, 9, 10, and 11 this re-lationship is best represented by a straight line. Later observa-tions led to the conclusion that the curvature of the air leakagelines obtained from these early tests using all rooms of thehouse was probably caused by inadequate mixing of the helium andair or inadequate purging of the sampling lines after using themto introduce helium into the rooms.
Before additional infiltration measurements were made it wasfound desirable to modify the basic air change rate formula (1)discussed earlier in this report. It was observed during the testsof the entire Test Bungalow that the concentration of helium in theenclosure increased enough, due to leakage of the contaminated air

- id -
from the house, to affect the results in the house. Becausethe air infiltrating into the house was not pure air, but airwith helium in it, formula (1) no longer described the condi-tions of the test. Since the enclosure surrounding the househad a volume of only about 5 times that of the living quartersof the house the concentrations of helium in the enclosure some-times reached 0 . 25$. Bor this reason the following formula wasderived to represent the actual conditions that prevailed.
If C]_ = helium concentration in the house at time t]_, $
c 2 = tt rr tr tt ft tr rt t2j j
C]. = " " " "enclosure" " t lf %
C 2 = tt rt tr tt tt tt ” t 2 , $
v = volume of the living space, cu. ft.
V = volume of the enclosure, basement and attic, u.ft.
M = total helium in the system, cu. ft.
K = infiltration rate into house, cu. ft/hr
then V <*P- = -K (c - C) (3)dt
M = v c + V C (4)
These formulae could have been combined and integrated, ifM were a constant, and then solved for K. However, the enclosurehad an air change rate with the outside atmosphere £s high as 0.15air changes per hour. Thus M was not a constant and the equationcannot be integrated.
Since the interval between readings of the helium concentra-tion in the enclosure was expected to be ten minutes, the changein helium concentration in the enclosure would be very small dur-ing that interval. If the concentration of helium in the enclo*-sure is considered to be constant between consecutive readingsten minutes apart eouation (3) can be integrated and the definiteintegral used to evaluate K, the infiltration rate of the livingspace, for any short interval with very little error.

S39NVH0 UIV
TIME
(minu
tes)


TIME
(minutes)


- 19
Integrating equation (3)
log (c - C) = “ KtV
or loSj
gl ~ Cl =5 (t 2 - t x )
c;2 - C 2
Where ~ (t 2 - t]_) = infiltration from time tq to time t 2
and 'C1 " C1 = e fd2 - C 2
where t 2 and tq are the times corresponding to two consecutiveobservations of the helium concentration,, Equation (5) can besolved for values of K, which is the number of air changes per
Vhour based on observations taken at ten-minute intervals moreor less® By computing the logarithmic mean value of Cq and C 2 ,
the concentration in the enclosure, during the time intervalunder consideration from katharometer measurements, the computedvalues of K would be quite accurate for short time intervals
.
VThis method of calculation was used for all subsequent tests
.
At first, observations of helium concentration were takenin all five rooms and the infiltration rate for each room com-puted individually as described previously for the weightedaverage method „ However, it was noted that the average of theconcentrations in the north bedroom, living room and bathroomwas, in almost every case, very close to the average of the fiverooms so measurements were made only in these rooms and samplingstations were added in the attic and bAsemeftt„ All the roomswere still contaminated with helium so the exchange of air be-tween rooms would result in representative concentrations in thethree sample rooms as before and give true indications of thetotal air changes,, Under this procedure the actual concentra-tions, in percent helium, of the north bedroom, living room,and bathroom at each time interval, were averaged and then com-puted for air change rate in the manner just described usingequation (5)» The results of this simple method checked wellwith those of the more elaborate method,, For example, Fig„ 15shows the .infiltration computed for each of the five rooms basedon a single sampling station in each room and also the weightedaverage of the five rooms as a dotted line c The infiltrationrates for the north bedroom, living room,: and bath were 0„55,0 o £6, and 0„69 air change per hour, respectively, resulting ina three-room average of 0 o 70 o This three-room average is veryclose to the weighted average of 0„71 for the five rooms.

20
The results of a number of infiltration tests in the TestBungalow for a range of indoor-outdoor temperature differencesare plotted in Fig. 16 to 13, inclusive. Duplicate tests areplotted on Fig. lo, 17, and 13 for indoor-outdoor temperaturedifferences of 20°F, 55°F, and 70°F, respectively, in additionto other test data. The observations for each test are quiteconsistent and all lie very close to a straight line. A singlecurve represents the infiltration for each test because the in-filtration rates for the north bedroom, living room and bathwere averaged to obtain a weighted average in accordance withthe procedure described above. It will be noted in Figs. 16 to13 that the infiltration rates during duplicate tests were veryconsistent in some cases and deviated by as much as 10 percentin other cases. Some of the inconsistencies can be traced di-rectly to differences in the basement temperature during com-parable tests. The effect of basement temperature on infiltra-tion will be discussed in more detail later. The relation ofair change rate in the living quarters to indoor-outdoor temper-ature difference is also summarized in Table 1.
Table 1
AIR CHANGE RATES IN THE LIVING QUARTERS FORA RANGE OF INDOOR-OUTDOOR TEMPERATURE DIFFERENCE
INDOOR-OUTDOOR TEMPERATURE DIFFERENCE
0°F 20°F.
33°F\ 55*F 70°F 35°F 90°F
AIR CHANGES PER HOUR
.245 . 500 .792 1.15 1.31 1.60 1.64
.230 .540 ,730 1.05 1.19 1.62
F. Infiltration in Basement, Attic, and Living Space
It is generally accepted that the infiltration into a build-ing caused by the difference of the indoor and outdoor temperaktures is the result of the chimney effect. In a closed buildingwith the ordinary amount of air leaks suitably distributed, aneutral zone exists at about midheight when the building isheated above the outdoor temperature. At the neutral zone theinternal and external pressures are equal. Below the neutralzone a negative pressure exists in the building and air willleak inward whereas above the neutral zone the internal pressureis positive and the air leakage will be outward. Pressuremeasurements in the Test Bungalow with a sensitive differential

)
'
S39NVH0 yiV
TIME
(minutes)


!
TIME
(minutes)


S39NVH0 UIV
TIME
(minutes)


S39NVH0 dlV
TIME
(minutes)


21
manometer showed that this neutral zone existed somewhere be-tween floor and ceiling of the living quarters for certain testconditions. Based on these pressure measurements it was .as-
sumed that air exchange took place in both directions betweenthe basement and the Bungalow enclosure and that there was noinfiltration from the enclosure to the attic when the atticlouvers were closed, but only exfiltration from the attic tothe enclosure.
With these assumptions the air movement between enclosure;,basement, living space, and attic was determined by the follow-ing procedure:
(a) ' The basement was contaminated with helium and the rateof air flow from the enclosure into the basement wasdetermined ,
(b) The attic was contaminated and its exfiltration to theenclosure was determined,
(c) The living space was contaminated and its total exfiltra-tion to attic and enclosure measured.
(d) The increasing concentration of helium in the attic duringstep (c) was observed. The infiltration rate of the atticfrom the living space was computed taking into account themeasured exfiltration from attic to enclosure.
(e) The difference between the attic exfiltration determinedfrom step (b) and its infiltration from the living spaceis its infiltration from the basement.
(f) The decreasing concentration of helium in the living spaceduring step (c) was observed. The rate of air movementfrom basement to living space was computed from the de-crease in helium in the living space, the known total airmotion from living space to attic and enclosure and themean concentration of helium in the basement and enclosureduring the test.
(g) The difference between the total infiltration into the base-ment measured in step (a) and the sum of the air exchangefrom basement to attic determined in step (e) and the airexchange from basement to living space determined in step (f)is the exfiltration from basement to enclosure.
(h) The difference between the infiltration from basement toliving space determined in step (f) and the total exfil-tration from the living space measured in step (c) is theinfiltration from enclosure to living space.
22
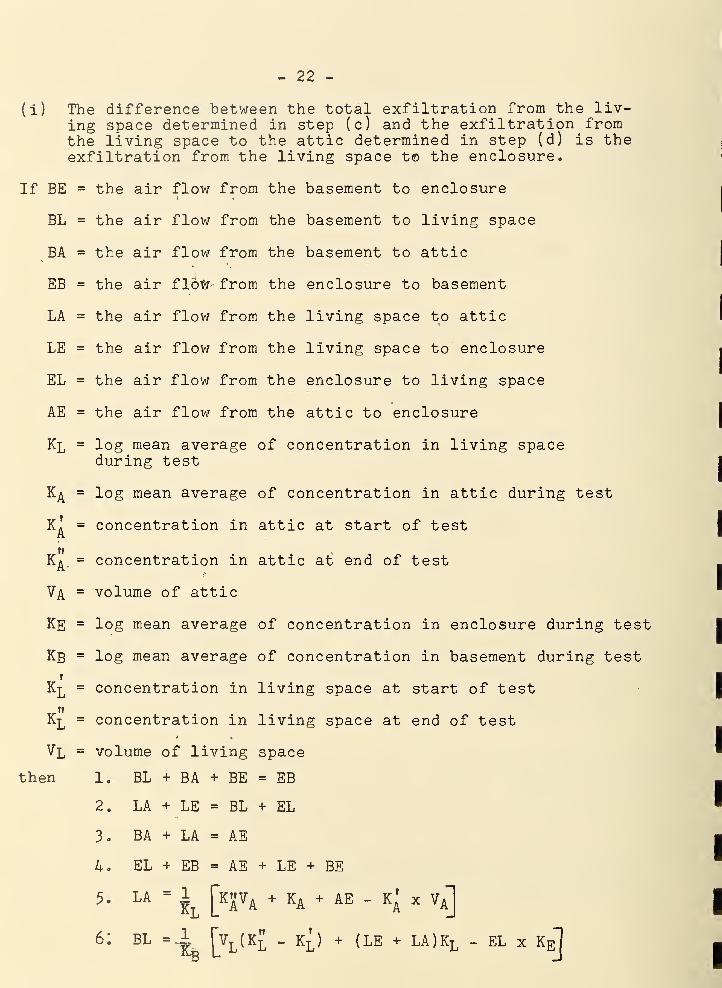
(i) The difference between the total exfiltration from the liv-ing space determined in step (c) and the exfiltration fromthe living space to the attic determined in step (d) is theexfiltration from the living space t© the enclosure.
If BE = the air flow from the basement to enclosurei »
BL = the air flow from the basement to living space
BA = the air flow from the basement to attic
EB = the air flow- from the enclosure to basement
LA = the air flow from the living space to attic
LE = the air flow from the living space to enclosure
EL = the air flow from the enclosure to living space
AE = the air flow from the attic to enclosure
Kp = log mean average of concentration in living spaceduring test
= log mean average of concentration in attic during test
= concentration in attic at start of test
= concentration in attic at end of test
Vj[ = volume of attic
KE = log mean average of concentration in enclosure during test
Kg = log mean average of concentration in basement during test
Kp = concentration in living space at start of test
Kp = concentration in living space at end of test
Vp = volume of living space
then 1. BL + BA + BE = EB
2. LA + LE = BL + EL
3 o BA + LA = AE
4. EL + EB = AE + LE + BE
5

- 23
Formula 5 is derived from the fact that the helium present inthe attic at the start of the test plus that 'flowing into theattic during the test must equal the helium present in the at-tic at the end of the test plus that which leaked into the en-closure during the test. That is,
KAVA+ Kl x LA = K>a + Ka x AE
Formula 6 is derived from the fact that the helium present in theliving space at the start of the test plus that flowing into itfrom the basement and enclosure during the test must equal thehelium in the living ^pace at the end of the test plus that flow-ing from it to the enclosure and attic during the test. That is,
VlK^ + BL x Kb + EL x Ke = Vlk£ + (LE + LA)KL
The quantities EB, AE, .and LA + LE can be determined by con-ducting infiltration tests of the basement, attic, and livingquarters, respectively and
kl ,ka ,
ka ,ka ,
kb ,ke ,
k", kI
will be known by observing concentrations inthe attic, basement,enclosure, and living space during these tests. There will re«main six unknowns in the above six equations which can readilybe determined by computation.
Infiltration tests were made of the attic, basement and liv-ing space at various indoor-outdoor temperature differences sothe patterns of air movement could be determined. These tests re-vealed the aforementioned inconsistency in the original tests ofthe living space. It was found that small changes in the base-ment temperature, when the temperature difference between livingspace and enclosure was constant, had considerable effect on theair change rate of the basement which in turn affected the airchange rate of the living space. Since the basement temperatureswere not too carefully regulated during the original tests of theliving space there were some variations in results for duplicatetests as shown in Figs. 16 to 1$.
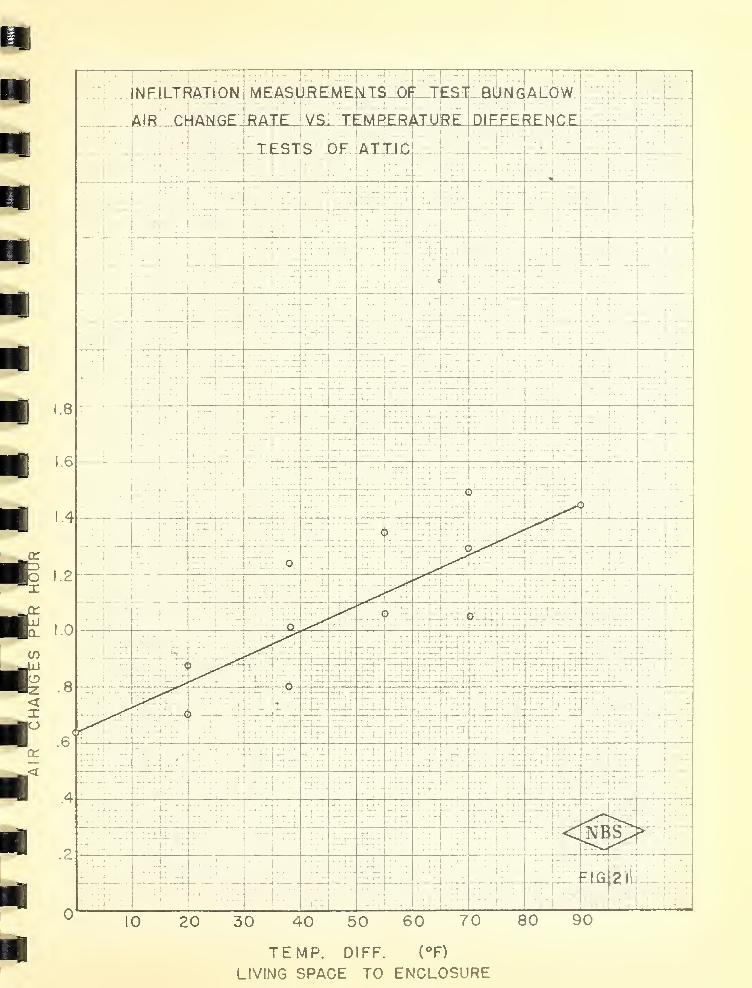
Figs. 19, 20, and 21 show the air change rate vs. temperaturedifference curves for the house, basement, and attic, respectively.These curves are based on actual infiltration tests and form thebasis for the calculations of the air flow patterns in the entirestructure. It is noted that the variation of infiltration in theliving space and attic with temperature difference between indoorsand outdoors is linear whereas the basement infiltration is pro-portional to a power of the temperature difference greater than

- 24 -
one. The relation between infiltration and temperature differencecould not readily be predicted because the chimney effect of theentire structure depends on the temperature differences betweenenclosure and basement and between enclosure and attic as well asthat between the enclosure and living space.
Figs. 22, 23, and 24 are graphical representations of theair flow to and from the living space, to and from the basement,and to and from the attic, respectively, for a range of tempera-ture difference between living space and enclosure from 20 to 90degrees F. The upper curve in each figure
ris plotted from direct
measurements made with the katharometer . The other curves in eachfigure are derived from the relationships in the six simultaneousequations shown earlier.
All of the infiltration curves show consistent trends withvariation of indoor-outdoor temperature difference except curvesF and H in Fig. 22 and curves F and © in Fig. 23 . All of thesefour curves depend on the evaluation of equation 6 of the groupof simultaneous equations and involve several measurements ofhelium concentration in the basement, living space, and enclosureduring a given test. It is believed that the results plotted forthese curves at a temperature difference of 55°F are in error andthat there -.should not be a radical change of curvature at thistemperature difference.
The air exchange rates that involved measurements in the base-ment are not considered as accurate as the other results becauseconsiderable equipment was stored in the basement. This conditionmade the basement volume somewhat indeterminate and hindered goodmixing of the helium and fresh air initially and during the pro-gress of the tests. More reliable data could be obtained in thebasement, if it were empty.’
The leakage indicated from basement to attic presumably oc-curred through the hollow stud spaces in the walls without enter-ing the living space. Filling the stud spaces with insulationwould close this path of air flow.
It is not knbwn whether or not the air movements between theenclosure, basement, living space, and attic that are shown inFigs. 22, 23, and 24 are typical for frame houses of similar con-struction. The Test Bungalow had a plastered ceiling and wasfinished with gypsum wallboard with nailing strips at the jointsof the wall surfaces at the time of these tests. It is probablethat there were some cracks for air leakage between the studspaces and the living space. A number of openings had been madethrough the double wood floor for tests of heating equipmentprior to the infiltration tests, but these were carefully rebuilt,sealed with building paper between sub-flooring and finish floor-ing and caulked at the edges before starting the infiltrationtests
.

TEMP. DIFF. ( ° F )
LIVfNG SPACE TO ENCLOSURE


PcH
Pg
etP>
e
rPo
uP
SUREMENTS OF TEST BUNGALOWNFILT
D1FFELREN C£
T E M P. DIF F. (° F )
LIVING SPACE TO ENCLOSURE

8
.6
.4
2
.0
8
6C
.4
2
0
TEMP. DIFF. (°F)
LIVING SPACE TO ENCLOSURE


TEMP.
DIFFERENCE
(°F)
LIVING
SPACE
TO
ENCLOSURE


TEMP.
DIFFERENCE
(°F
)LIVING
SPACE
TO
ENCLOSURE


000! xHH/£\.d 39NVH0X3 dIV
TEMP.
DIFFERENCE
(°F)
LIVING
SPACE
TO
ENCLOSURE


- 25 -
G. Effects of the Opening of the Attic Louvers
During all the tests previously discussed in this report thelouvers of the attic were packed with insulation to prevent aircirculation., The Test Bungalow was normally kept in this condi-tion for tests of heating equipment. However, since attic venti-lation is often recommended for winter conditions a short seriesof tests was made, for comparison, with the attic louvers open.Figs. 25 and 26 show the results for two of these tests. A com-parison of these results with those summarized in Table 1 indi-cates that opening the attic louvers increased the infiltrationin the living space from 30 to 35 percent. The infiltration wasalso increased in the basement, and of course, the ventilation inthe attic was very much higher when the louvers were open thanwhen they were closed.
H. Door Tests
Tests were also made to determine the amount of air infiltra-tion when a person opens and closes an interior door to enter aroom or an exterior door to enter a house. An opening time of 4seconds and an opening width of 28 inches were found to be repre-sentative values, and these values were used in the followingtests. There was no temperature difference between the spacesconnected by the doors for these tests.
After mixing the room air with about 0.5$ of helium a seriesof concentration measurements was made. The door was then openedand closed as described above ten times at one minute intervalsto obtain a significant change of concentration in the room. Be-fore continuing with the concentration measurements it was neces-sary to thorughly mix the infiltrated air in the room with thehelium-air mixture by operating a circulating fan in the room for30 seconds, after which another series of concentration measure-ments was made. Previous tests had shown that the infiltrationrate of a room was appreciably increased by a forced air movementin the room. Therefore, the fan was operated again for another30 seconds with the door closed before taking a third series ofconcentration measurements to evaluate the effect of the fan oper-ation. The air changes were then calculated and plotted againsttime. As the three groups of measurements were taken with thedoors and windows of the room in the same condition the air changerate should have been constant, i.e., the air change curves shouldbe straight and parallel lines. The vertical distances betweenpairs of curves were a measure of the air changes caused by thedoor openings and fan operation. Fig. 27 shows the test resultsobtained when opening the interior door between the north bedroomand the hall of the Test Bungalow without heating or forced aircirculation around the building. Tests were made under the same
- 26 -
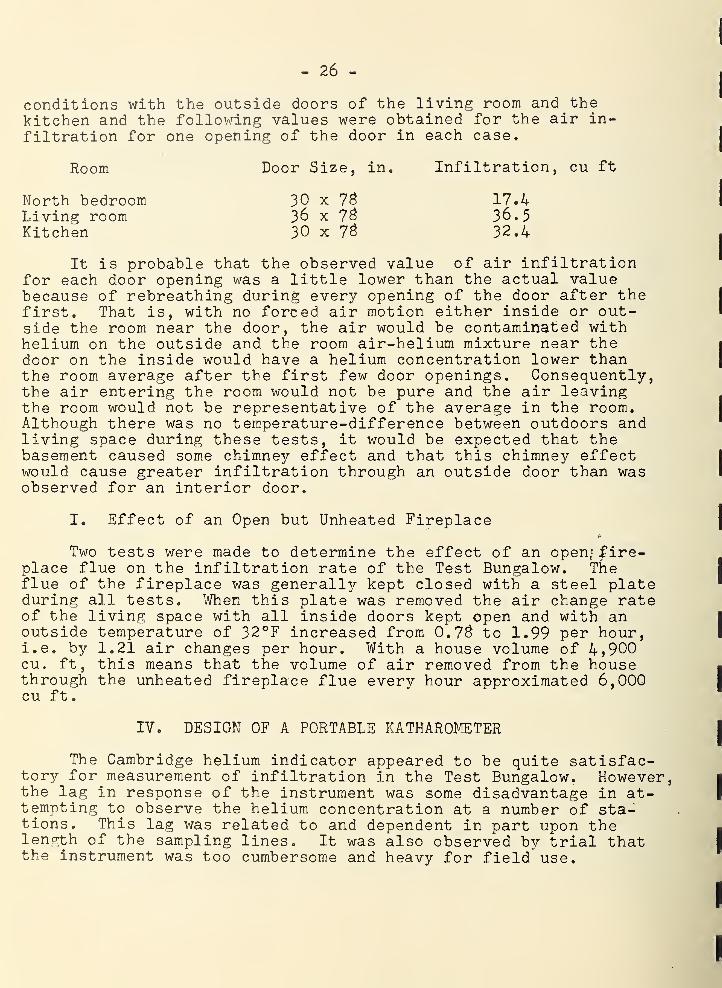
conditions with the outside doors of the living room and thekitchen and the following values were obtained for the air in-filtration for one opening of the door in each case.
Room Door Size, in. Infiltration, cu ft
North bedroomLiving roomKitchen
30 x 7336 x 7330 x 73
17.436.532.4
It is probable that the observed value of air infiltrationfor each door opening was a little lower than the actual valuebecause of rebreathing during every opening of the door after thefirst. That is, with no forced air motion either inside or out-side the room near the door, the air would be contaminated withhelium on the outside and the room air-helium mixture near thedoor on the inside would have a helium concentration lower thanthe room average after the first few door openings. Consequently,the air entering the room would not be pure and the air leavingthe room would not be representative of the average in the room.Although there was no temperature-difference between outdoors andliving space during these tests, it would be expected that thebasement caused some chimney effect and that this chimney effectwould cause greater infiltration through an outside door than wasobserved for an interior door.
I. Effect of an Open but Unheated Fireplace
Two tests were made to determine the effect of an open; fire-place flue on the infiltration rate of the Test Bungalow. Theflue of the fireplace was generally kept closed with a steel plateduring all tests. When this plate was removed the air change rateof the living space with all inside doors kept open and with anoutside temperature of 32°F increased from 0.73 to 1.99 per hour,i.e. by 1.21 air changes per hour. With a house volume of 4,900cu. ft, this means that the volume of air removed from the housethrough the unheated fireplace flue every hour approximated 6,000cu ft.
IV. DESIGN OF A PORTABLE KATHAR0METER
The Cambridge helium indicator appeared to be quite satisfac-tory for measurement of infiltration in the Test Bungalow. However,the lag in response of the instrument was some disadvantage in at-tempting to observe the helium concentration at a number of sta-tions. This lag was related to and dependent in part upon thelength of the sampling lines. It was also observed by trial thatthe instrument was too cumbersome and heavy for field use.

EH
O0
Oj
S3SNVH0 HIV
IME
(MINUTES)


rh::.f
S3DNVH0 HIV
TIME
(MINUTES)

I

i4-
. o
S30NVHD HIV
TIME
IN
MINUTES

- 27 -
Consideration of the operating principle of the helium katha-rometer led to the conclusion that a simpler portable instrumentcould be designed using the same principle, but depending onnatural convection rather than a vacuum pump for sampling the air-tracer-gas mixture. Such an instrument was designed, constructed,and preliminary tests completed. A photograph of the pilot instru-ment is shown in Fig. 2&.
The helium indicator designed at the National Bureau of Stand-ards was comprised of a portable amplifier the size of a smalltable radio and a sensitive cell consisting of a metal block withtwo cylindrical cavities in which thermistors were installed. Thethermistors were arranged in a Wheatstone bridge circuit with thetwo reference resistors placed in the metering box which could beconnected to the cell by a cable of any desired length. For test-ing, the cell was placed in the room whose infiltration was to bedetermined and the operator with the metering box could be in closeproximity or outside the building.
One thermistor cavity was continuously ventilated by a natur-al convection air movement resulting from the heated thermistorand passing through small holes at the top and at the bottom ofthe cavity. The other thermistor cavity was tightly sealed dur-ing the test after having been opened before the tracer gas wasintroduced into the room to assure that the tracer gas itself wasthe only difference between the air in the two cavities. Theequality of the air temperature in the cavities was assured by theenclosing metal block.
The thermistors were heated with alternating current and thebridge circuit was balanced before tracer gas was introduced intothe room. The off-balance potential, resulting from the presenceof tracer gas in only one cavity, was electronically amplified.The output current of the amplifier was adjusted to be directlyproportional to the concentration of the tracer gas. An amplifiergain control made it possible to read either the absolute tracergas concentration, to provide a full scale deflection for anyhelium concentration between 0 . 1+% and 1 , 5% or to observe the con-centrations of any other tracer gas having similar thermal con-ductivity that is convenient for the particular study to be under-taken. By adding a selector switch to the metering box of the in-strument, any number of test cells could be used thus permittingas many observation' "stations during one test as desired.
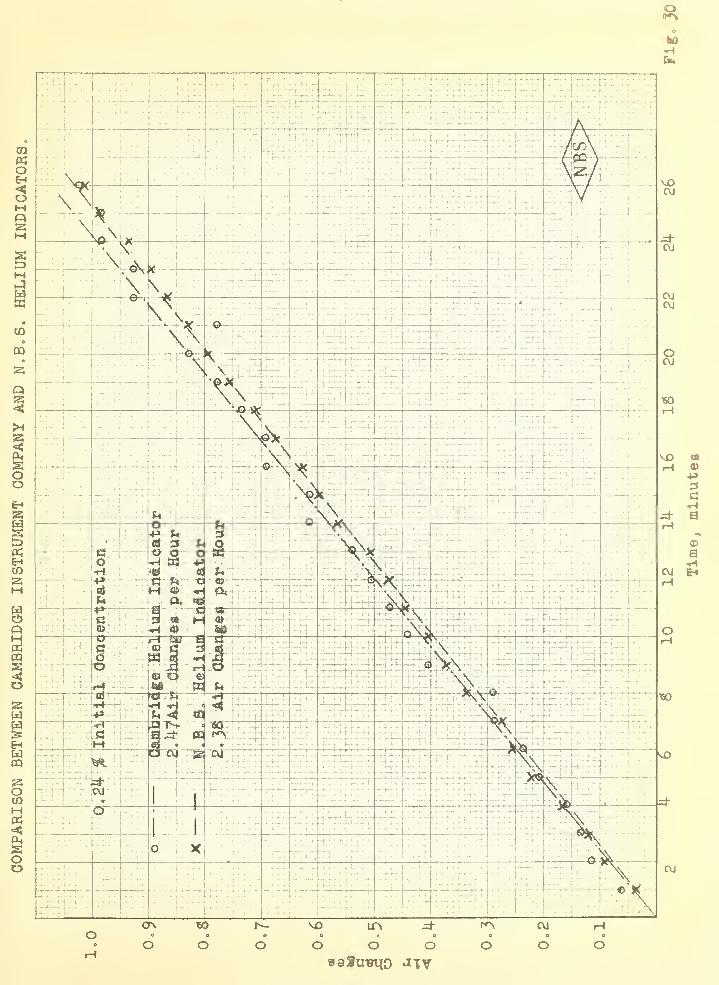
Several comparison tests were made using the new instrumentand the Cambridge helium indicator in the Test Bungalow. Figs. 29and 30 show comparisons between the airchanges calculated fromdecay measurements made at the same time in the same space withthe two analyzers. These curves show substantial agreementbetween the two instruments for infiltration rates of 1.1 and 2.
A
airchanges per hour. There was some small scattering of thepoints for both instruments but the data indicate a straight line

- 28 -
infiltration rate for each. The same line best represents thedata for both instruments in Fig. 29 whereas in Fig. 30 thebest line for each set of points indicates a difference in infil-tration rate of about 4 percent, the Cambridge instrument indi-cating the higher value. The low initial concentration of 0.24$used for the test represented by Fig. 30 was probably disadvan-tageous to the Cambridge instrument because of parallax and drifterrors in reading the lower end of the scale.
When considering the results in Fig. 29 and 30 along withthe correction factors determined for the Cambridge instrumentand shown in Fig. 2, it is concluded that the NBS katharometerindicated infiltration rates that were higher than the truevalues by amounts ranging from 0 to 4 percent. FThe NBS instru-ment was not graduated in percent helium so a calibration ofthis instrument in terms of absolute concentrations could notbe made.
In preparing for the comparison of the performance of thetwo helium indicators the following test procedure was used.
Helium gas was fed into the North Bedroom of the Test Bunga-low for a period of one minute during which the air and heliumwere being mixed by means of a 16-inch desk fan. This mixingcontinued for one pinute after ceasing to inject helium gas intothe room. Separate', -copper tubes were used for injecting thehelium gas into the room and for sampling the mixture, sinceearlier tests revealed some difficulties in purging the heliumfrom such a line promptly after injection.
Following the one-minute injection period the gas mixturewas drawn through the sampling lines for 5 minutes before anyobservations were taken. At the end of this 5-minute periodthe indicator on the Cambridge instrument had reached the maxi-mum, and it was at this time that the decay measurements com-menced as shown in Figs. "29 and 30.
The thermal conductivity cell of the NBS instrument was inthe room to be investigated all during the above procedures withthe ports to the sampling cylinder’ open' 'to the atmosphere in theroom. The zero point on the time scale for the NBS instrumentwas the same clock time as for the other instrument in Figs. 29and 30. The concentrations observed at zero time on both instru-ments were considered 100$ concentration for comparison withlater readings on the same instrument. Thus, the curves shownon the attached figures really represent rates of dilution rela-tive to the concentration that existed at zero time. It isprobable that the absolute concentrations of helium in the thermalconductivity cells of the two instruments were actually a littledifferent at the zero point on the time scale.

FIG.
23


COMPARISON
BETWEEN
CAMBRIDGE
INSTRUMENT
C0
0
AND
NoB»S
0
HELIUM
INDICATORS.
o\CVI
bO
U*
Time,
minutes

COMPARISON
BETWEEN
CAMBRIDGE
INSTRUMENT
COMPANY
AND
N.BoS*
HELIUM
INDICATORS^
8 83utfqo **TV
Time,
minutes


- 29 -
V. MEASUREMENTS OF CRAWL SPACE VENTILATION
A. Ventilation through Foundation Louvers
Prior to the investigation of infiltration by means of atracer gas and the katharometer a study was made of severalmethods of ventilating crawl spaces for dwellings. It is gen-erally accepted that the crawl space of houses should be venti-lated during the summer in most parts of the United States eastof the Mississippi River where high humidity occurs during thesummer to minimize condensation and rot of floor and foundationconstructions. The usual method used is to provide openings inthe foundation wall on all or several sides of a house sonatural convection and wind forces can ventilate the spaceunder the floor. However, very little is known about how muchair exchange occurs through such foundation louvers, probablybecause instruments for measurement of very low air velocitieshave not been available.
Tests were made to determine the amount of ventilation pro-vided for a crawl space beneath a house by openings in thefoundation walls. The Test Bungalow was used for this purposeand observations were made with still air surrounding the houseand with the blowers of the refrigerating units circulating ap-proximately 20,000 cfok around the structure. Observations weretaken for outdoor temperatures of 0°F, 50°F :and #5°F with theindoor temperature being maintained at about 70°F in the livingspace. The area of the foundation ventilators was determinedby the following formula: Area = 2 sq ft per 100 linear feetof perimeter plus 1/300 of the crawl space area. For the TestBungalow the formula indicated a total of 4.17 so ft of venti-lator area.
For the tests six of the panes were removed from the base-ment windows; two each on the east and south exposures and oneeach on the north and west exposures. The total area of the sixopenings was 4. OS sq ft. Metal ducts about two feet in lengthwere installed in the openings to streamline the air flow some-what and facilitate air velocity measurements. For these testsall of the visible cracks and openings in the floor constructionwere sealed and all visible cracks in the subfloor duct systemof the warm air heating plant were sealed to minimize air ex-change between the basement and living space. Observations ofair velocity were made with a pitot tube and differential manom-eter when the blowers were in operation whereas the rate of airmotion was determined by timing the travel of visible smoke inthe metal ducts through the foundation for the still air condi-tion around the house. ‘The latter method was not consideredto be very precise but was used because the delivery of the com-mercial thermocouple-anemometer ordered for this purpose was de-layed several times. The results of these observations areshbwn in Table 2.

- 30 -
The data in Table 2 show that air flowed into the basementthrough a part of the openings and out through others when theblowers were in operation, but the net flow was inward for allthree outdoor temperatures tried. The amount of air flowinginto the basement and out again ranged from 300 to 400 cfm where-as the amount that entered the basement through the foundationventilators and then passed upward through the floor ranged from£6 to 244 cfm. The results indicate that the natural chimneyeffect of the house assisted the flow of air upward through thehouse construction because the net inward flow increased as theoutdoor temperature decreased. Test 3 indicates that the blowersused for circulating air around the Test Bungalow created a lowerpressure at the roof than at the basement level. With the out-door temperature higher than the temperature of either the liv-ing space or the basement as in Test 3 the chimney effect of thehouse should have been reversed and the net flow of ventilatingair should have been from basement to enclosure instead of viceversa. This result was observed in Tests 9-11 when the blowerswere not running. It is apparent that the blowers counteractedthe chimney effect and produced an upward flow through the floorof 36 cfm. A comparison between Test 1 in Table 2 and tests withthe katharometer for the same indoor-outdoor temperature differ-ence shows that the net air leakage into the basement and upthrough the house was about twice as great with the foundationventilators open as when they were closed.
For still air conditions around the house as in Tests 4-11of Table 2 the chimney effect of the house predominated and thedirection of flow of air between basement and outdoors was de-termined by 'the relation between the temperature indoors and theoutside temperature. As the outside' temperature was lowered from' 5CPF
to 0°F the net inward flow of outside air to the basement in-creased from 111 cfm to 366 cfm. For three tests with the out-side air 10 to 15 degrees F warmer than the living space the netflow of air from the basement to outside ranged from 119 cfm to152 cfm. If the Test Bungalow were assumed to have a crawl spacetwo feet high the rates of air exchange reported for still airconditions would range from one air change in eleven minutes forTest 3 to one air change in 3.4 minutes for' Test 5.
An apparent inconsistency is indicated by a comparison ofthe net flow of air into the basement in Test 1 with that ob-served for Tests 4 and 5. This comparison shows greater venti-lation with still air than with forced air circulation aroundthe bungalow for the same outdoor temperature. This would ap-pear to contradict the indication in Test 3 that the blower oper-tion provided an upward air movement through the structure in op-position to the chimney effect. It is quite probable that air

©Oas
£
I©o*no
ao
t>» od Pq
+3a©
co
©*Ha©
<§1
o
43©©EH
'd
©Ou<J
ao•H43©
O(4
Ou•H<•d©OuoFq
43 > d© O s CTvVO25 i—
1
Fq d O 60Fq O CVJ CVJ
d d d
•drH ©aS © >43 i O as cvjd- voo 43 rH Fq © OM-—EH
<3Fq 0 i4-\
iH •daS © >43 © o S vo kv cvj
O > rH Pq d- 0 VOEH d pq O icvvo d-
KH
W> d© d- cr, cvj
•H Ph d- d- cvj
© rH rH rH« d d d
£ £Od rH
© VO tO CTv ©o pq KMOiVO 60•H rH rH rH d43 d d d das PQ•dd d 43
CTv O H wo ip r*"v 1— 1
—
©Pq rH rH rH Eh
d d d.© •dW) C|
© d 3o 55 rH O VO Od 0 Pq VO CO LTV d
H P rH i—1 rH1 1 1
<!
d43 «rt
d d© Hd VOa pq d HN rH© rH CVJ rH rH
I t 1 •rH
o 43s todu r—vo•H CVJ CVJ d"< rH rH
d d 1
©od© o© ©© d«H 43 O irvo 0Vt d O CVJ rH*H © •d pq d 1
£ 43 O© ©o CO 0ft ©e PQ©EH
<•> •
<D gi OOOS' pc* LTV CO
+2 © O3 Eh
43 0
CD O rH CVJ r«-\
©EH
I—VO r^cH r-1 KVCTvCVJ«-HVO CVJ CO rH rH LTVnt^iCVI H H H rl Hd d d d d I I I
0 0 1 1 O Cr'v
KVrH
i"-vo 1 1 rH OrH VO rHf*-\ f<~v 1—
1
h~rH COCTVOVCTVrHVO^t" r-l e~l 1—1 i-l r-i r-1
Td, + + + dll]
w •
I'-co cvj cvj 1—- r— <Tv LTV 43 s
trvirv rH rH rH rH rH © 0d d d d dill © rH
43 <H
©© 54
d'V CVJ £ rH crv r— ovd" © ©KVd rH rH rH rH rH d &d d d d dill 43 43
PCO O©•H
rH VO KVH crv c^veo co u ©r-,co irv^d rH CVJ CVJ CVJ 2 60d d d d d l;: l l rH
©CG
-P ©VO rH rH 60 0 t^VVO CVJ
P*•rH
VO h-VOd cvj cvj cvj r^v rcS 43d d d d dill ©
© fckO
d 243 c
1— CO CVJ 0 r—d- vo r- ©Htrvvo vo icvh ihv r*-vd O >d d d d dill 0
© rH0 <WO© 'd
pH
a ©•rH £
©'© •rH
©> ©
LTV LTV r— CTV O N^vVO rH Pq ©CVJ CVJ rH rH CVJ © 43d d d d 1 t 1 m ©d O
0 •fH
•d© ©© •iH
£
* 6)O •HrH CO
© © a a ©HO O CO O O icvirv a)
d-r©-LTV CO CO CO >» t>
© Hs -H1
H0 CO
d- LTV VO 1— CO OV 0 rHa©
O

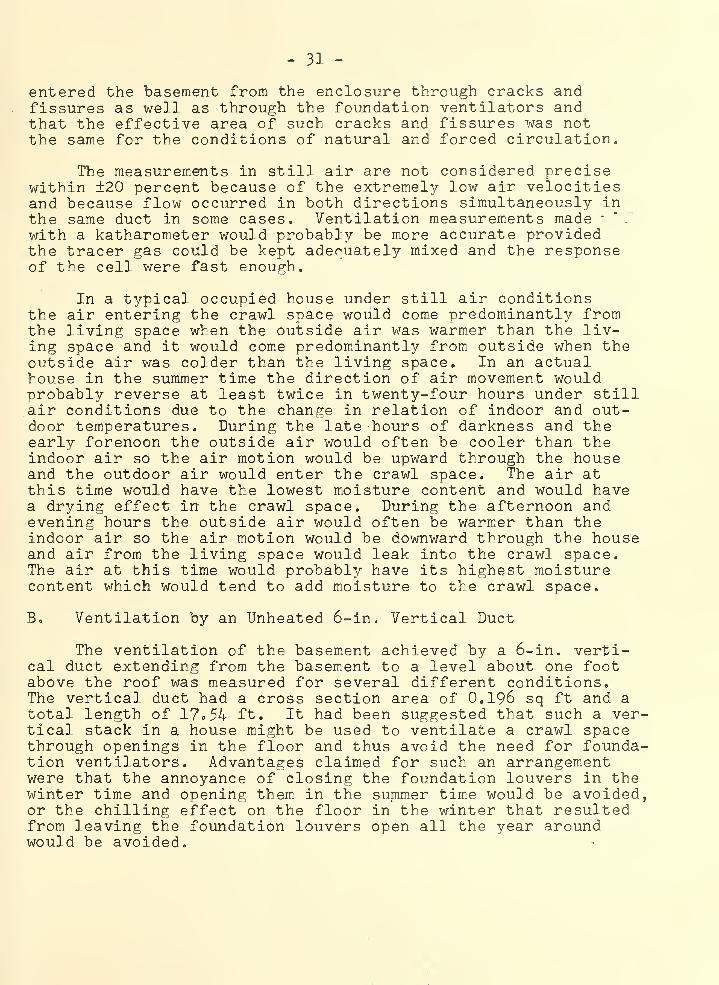
- 31 -
entered the basement from the enclosure through cracks andfissures as well as through the foundation ventilators andthat the effective area of such cracks and fissures was notthe same for the conditions of natural and forced circulation.
The measurements in still air are not considered precisewithin ±20 percent because of the extremely low air velocitiesand because flow occurred in both directions simultaneously inthe same duct in some cases. Ventilation measurements made'with a katharometer would probably be more accurate providedthe tracer gas could be kept adeouately mixed and the responseof the cell were fast enough.
In a typical occupied house under still air conditionsthe air entering the crawl space would come predominantly fromthe living space when the outside air was warmer than the liv-ing space and it would come predominantly from outside when theoutside air was colder than the living space. In an actualhouse in the summer time the direction of air movement wouldprobably reverse at least twice in twenty-four hours under stillair conditions due to the change in relation of indoor and out-door temperatures. During the late hours of darkness and theearly forenoon the outside air would often be cooler than theindoor air so the air motion would be upward through the houseand the outdoor air would enter the crawl space. The air atthis time would have the lowest moisture content and would havea drying effect in the crawl space. During the afternoon andevening hours the outside air would often be warmer than theindoor air so the air motion would be downward through the houseand air from the living space would leak into the crawl space.The air at this time would probably have its highest moisturecontent which would tend to add moisture to the crawl space.
B. Ventilation by an Unheated 6-in. Vertical Duct
The ventilation of the basement achieved by a 6-in. verti-cal duct extending from the basement to a level about one footabove the roof was measured for several different conditions.The vertical duct had a cross section area of 0.196 sq ft and atotal length of 17.54 ft. It had been suggested that such a vertical stack in a house might be used to ventilate a crawl spacethrough openings in the floor and thus avoid the need for foundation ventilators. Advantages claimed for such an arrangementwere that the annoyance of closing the foundation louvers in thewinter time and opening them in the summer time would be avoidedor the chilling effect on the floor in the winter that resultedfrom leaving the foundation louvers open all the year aroundwould be avoided.

- 32 -
For this test the basement windows and basement door weresealed and all visible cracks at the sill of the house were caulk-ed. A 6 by 14 inch register that connected the basement and liv-ing space in each room was left open. For some of the tests theattic was heated to simulate solar effects on the roof.
The results observed with no heat in the 6-in. vertical ductare summarized in Table 3. Tests 1-3 show that the air flow rateup the duct ranged from $ to 14 cfm when the temperature in theliving space was from 12 to 16 degrees warmer than the outdoors.The higher rate was observed when the attic was heated to a tem-'perature 40 to 45 degrees F higher than the outdoors to simulatesolar effects. When the indoor and outdoor temperatures wereabout equal as for Tests 4 and 7, the quantity of air flowing inthe vertical stack was very small, sometimes changed direction,and sometimes was too small to be measured. Heating the attic totemperatures ranging from 11$°F to 12£°F as in Tests 5 and 6created enough chimney effect in the duct to cause an air flowrate of about 5 cfm with no temperature difference between livingspace and outdoors. Table 3 shows that the movement of air"through the floor registers was predominantly upward even thoughthe basement was sealed at all noticeable cracks.
C. Ventilation by a Heated 6-in. Vertical Stack
The ventilation provided in the basement of the Test Bunga-low by a 6-in. vertical stack, heated in a manner simulatingthat which might occur when the flue gases from a gas water heat-er were discharged into the stack, is summarized in Table 4. Forthese observations an electric cone heater was inserted into the6-in. stack about 6 feet above the floor level through the sideoutlet of a tee and the side outlet covered to prevent entry ofair at that place. The voltage on the electric heater was adjust-ed to heat the air to a temperature ranging from 150°F to 200°Fsimulating the flue gas temperature of a gas water heater beyondthe draft diverter.
The ventilation of the basement and the air flow in the stackwere measured for the following two test conditions:
(a) Basement sealed insofar as possible and with the floorregisters that connected the basement and living spaceopen. The attic was heated to simulate solar effects andthe vertical duct was heated to simulate the heat providedby the flue gases from a gas water heater.
(b) Same as (a) except that the foundation ventilators were open.

Crawl
Space
Ventilation
with
a
Vertical
Stajk
(Unheated)
Still
Air
Outdoors
• •net
P
r- r pH i— s—
!
c— r— r q i
r—
i
VO H h-H 60 lf\CO I— CO r-t r—
LT\ rH r^~\r^\CO rH00 C-CO (\J
40 O I— CTv LTvVOco i— r— o i
—
crvvo ir\v0 4d-LT\VO I— O VO
cvi jt o o irveoVO |— 60 O VO
i—
i
rH CVJ CO 40 CM VOvo vo c— r—vo
pq t*» P>h Pho o o o o
CVJ VO ©• o s = - s
Jt r-4 ftcm 0
rpLi
rpP
VO CO a © © ©• # $ B 0 is W
LTV CO ft O 45* pCM 0 « *0 ©
-Pr*
P ©f'-vco © o
• • tees E •rH
irvvo ft >e\J 0
rr~i
* >
rp ^E_, P© g «
rit T*UCfl
%Sh 3
CO <M © o• • > * c r 'P
K>i O ftrH 1— 0 o
-p•P© net
CO VO -P > P• • O P * c s ©
K'v O .S3 © z 3rH 1— m ft
43 0t>
a40 CO o
• • rp pCO CVJ P vi-t
40" © a c sCvO3!
ft 0S3 •H
tvO
0341
a a<H ft
OO «H 1
P
§•
©EH
&©EH §<§<
0o© rp ©-p © pCO •P p
•rH Ck •HW> t> M0 o o a a 3•H p © to o o op ft p
"tib ©a o o rH
© CO o p p Vh•p © 0 +* o rp TP0 -p M 0 O a) Pi © © tH
© o tH P -HW)
0 pq pq ort © 41 W) ©
P iH•H 4j
•H <M
+> >»0 CO -PO *H•H >5 O-P 43 O
©Pi
PO
41 41O -P-P P
O
o p 0 •© «aj O © rH P O<Zi O © rH © O rH
O a © o • •rH > S ft-P rp © W tH ft(0 -P m 0 -p a a P P© 0 © O -P © <D H •HEH 6 pq w <1 eh > <
0 w ia co
S3O•rHPo©P•HP
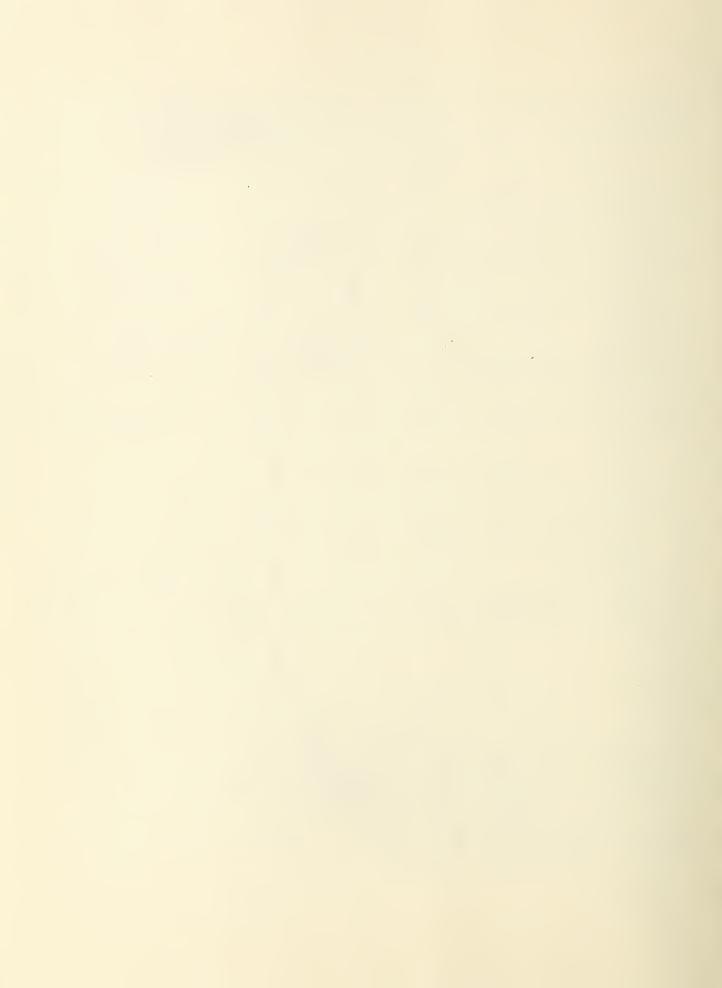
Crawl
Space
Ventilation
with
a
Heated
Vertical
Stack
o VD O CTiK\ I—
^
©(—t vo i— f— o vo r~-
o> ^ o CTM^ i— IT\ os
vo r~- i— o vo t*—
co vo o co aj i—vo ©vo r— i-- q vd n
t— no co w vo vo ©vo h- r— o vo f~—
vo O r— 5 sci
vo r- O vo r—
in r— o co Xr r- co ©vo r— r— o vo r-
jf OVCTvVO f*-\ VD H ovo vo r— o vo so h
rH rl rl
KV CO CXVVD cn h-OVLO.vo vo r— o vo r— <h
c\j co ov vo oj f'-inmvo vo r— o vo^t o
rH tnCO moj VO in invo vo c— o vo O
CO
CD
>>
CD
©
ro
©
oG
TO
©>s
OG
©©
-=}- o G CTi in LTV• • © • • * • COin rH r—
1
O O © &m r-— © -G in 0rH © = S s -5- •
CD 0o o T3 co 0 oj OJ
• • © • • • • f-
—
O m rH VO H IO H Om IT\ © = s s m OJ OJ OJ 0 ©rH © •
W 060 O g G G
• • © © CO © Ocvj e'- rH rH • rH • Oen vo © = = © rH © LTV O © &
rH ©© © © O
fri O G G ino • G © rH © m VOw crv © rH • H • O © &m m rH © OJ © CTv O' rH © = s — © i-n © OJ
© © © OM
N- o G G <T\4 • © © O © &
i*\ OJ a a CO © rH * rH * O1*0 © © e
rH © © OM ©
OJ o 'a LT\ G LT\ 1—
e • © • ® • O © &CT\ OV a a ctf © rH CO rH O OOJ^t © as in
rH © © Ow ra
tn o G £_trv OJ
• » G G vo 0 COin o aS © O 0 0CVJ m £ = s £ rH = S S OO 0^ rH Pi © « • •
G © 0 0 0© •
i— o •
• • Gm rH G © G LTV LTV m 0OJ OJ © G © ITN 0 r— rG
rH > = s o rH E = = OO O 4»
& G © O O 0 ©G © • ® • a
© O O OVO OJ ©
• ' G GO tn Pi © tr\ in OJ 0OJ O © rH .G- 0 CO at 4
rH * = s s © s s = 00 0 co
P. © 0 0 0G CD • « • -G0 0 0 43
co vo G G• • G © m 5c
vo ur\ © — s E rH = = = -G- rH r—rH CO © O O 0 ©
e* © O O 0 rHG CD • • • &
O O 0 ©co w >G +3 u© o • ©43 G cS CO
CD (5 • rO•rH & O
G© o G 43
a Ph •rl ®tH O'Cf P 43 ass a 53© Vl G © Vi Vi Vi Vh “
G G o o o o ©• O G 0 43 .
f*l &H l*i P P I*i P CO > a 44 rH G G G a0 O O O O O O G 0 Vi O Ph 0 © © Vh
O G O © Ph G © a O• • 44 O PG 43 Xi © ra ©p p O G m. co V G ra Oa a © 43 © M G a a Vi 44 0 © CO ©© © • 43 £ 43 O G 0 0 0 G iH O SG pq rHEh EH co
©G©
©+3
•rl GrG
a0
0G
0G
0G
« ©43
1 1
ViOG©
x>©
A G © © G 0 43 G co t>s EH 0 G G ,G ra CO > GPt •H Eh Eh •H G © 43 © G 4» « © © EH w 43 ra ra G G•rl <«5 © © ffl CD O }>» 1-1 G
W)G PQ pq © 1 G G m © ra
Pi U • G m rH t=> •H rO O O © © G © O © W ©• 43 *r\ *rl & 43 43 O •rH G Xi G! ,G 43 Xi •G PG © a O O X> ©O Pi G < < a G G 3 co © rH 4» •H O 43 43 43 43 43 +3 ra © G !>< O a53 O © © W © G rH © O t> 43 G G « G CD G ro O G w 43 ©
O a © O EH 43 © •H > s •rl O 0 0 © O © •rH 0 © 2 4» +3
4» Td © CO *H 43 Vi 43 5c iG 55 CO 3 co > £5 4» m pq O G O 0co 43 co G +» Pi -Jj <4 O CJ G G O © 1—
1
55 £G© G © 0 43 •rH 1—
1
(D •rl •H rH 43©EH O PQ m < <4 m > < <3 Pq CO •


- 33 -
The air flow in the 6-in. duct ranged from 17 to 26 cfmfor the first four tests summarized in Table 4 when the founda-tion ducts were sealed and the basement was sealed up at allvisible cracks. However, the air flow through the open floorregisters was also upward indicating that more air was enteringthe basement from outside than was flowing up the 6-in. stack.The stack reduced the pressure in the basement from 0.007 to0.00$ in W.G. below the outdoor pressure and the living quartersnear the floor were at a pressure just slightly below the base-ment pressure in Tests 1 to 4. The flow of air up the 6-in.stack was from 50% to 100% greater with the stack heated as inTests 1 to 4 of Table 4 than was observed with the stack unheat-ed as in Tests 2 and 3 of Table 3» Operating the blowers in thespace between the Test Bungalow and its enclosure appeared toincrease the flow up the stack slightly.
When the foundation ventilators were open as in Test 5-10of Table 4, the flow of air up the 6-in. stack increased from20 to 40 percent. The flow up the stack was not much differentwhen four ventilators were open than that observed when only twowere open, but the total air flow into the basement was increasedsignificantly. More air entered the foundation ventilators thantraversed the stack by a ratio of 4 to 1 in some cases and ashigh as 6 to 1 in other cases indicating that more air was pass-ing upward through the floor construction than was moving up thestack. Comparing the air movement through the foundation venti-lators in Tests 5 and 6 with that in Tests 7 and $ of Table 4,it will be noted that sealing the floor registers reduced thebasement ventilation appreciably. However, opening all of thefoundation ducts as for Tests 9 and 10 more than offset the ef-fect of sealing the floor registers.
The air flows up the vertical stack for Tests 1 to 4 inTable 4 ranged from l/2 to l/3 that observed as total basementinfiltration for the same indoor-outdoor temperature differencewith the katharometer . This indicates that the vertical ductwas only conveying a part of the total air through the house con-struction .
The infiltration in the basement with the foundation louversopen and with the blowers outside running as in Tests $ and 10of Table 4 ranged from nearly twice to about 5 times that observedwith the katharometer for the same indoor-outdoor temperature dif-ference, but without the louvers open in the basement. However,the attic was not heated and there was no heated vertical duct ex-tending up through the structure for the tests using the katharom-eter.

- 34 -
In no case did the 6-in. stack cause air to move from theliving space through the floor registers into the basement eventhough the windows and the door in the basement were caulkedand the sill plate was sealed. Of course, a full basement wallpresents more area and more joints for air leakage than wouldcrawl space foundation walls, but it is concluded from thesetests that special measures would have to be taken to seal sucha wall sufficiently to ventilate the cr^wl space through floorregisters from the living space above by the use of a verticalstack such as that tried for these experiments.
VI* THE DESIGN AND CALIBRATIONOF A HEATED THERMOCOUPLE ANEMOMETER
A. Introduction. j
,
For investigating the ventilation of house attics, base-ments -and crawl spaces as well as for measuring air motion inthe proximity of heated and cooled walls, windows, grilles,etc., a device was required that would measure air velocitiesas low as 5 ft/min non-directionally and omni-directionallywith reasonable precision and which was easy to operate andwas portable. Since all known commercial apparatus was eitherinaccurate or of too low sensitivity at the desired air flowrate, the design and construction of a suitable instrument wasundertaken.
A study of the literature 9, 10, 11 on this subject indi-cated that the required results were most likely to be achievedwith a heated thermocouple anemometer if reproducible measure-ments could be obtained at temperature differences between thehot thermo- junction and the ambient air low enough to preventself-generated natural convection currents from distorting thereadings at very low air velocities.
The differential electromotive force in a thermocoupleanemometer is provided by one or more electrically-heatedthermo junctions and an equal number of unheated junctions con-nected in series and placed in the same air stream. The magni-tude of this electromotive force can be related to the airvelocity by calibration. It! was found that the heat loss byfree convection, radiation, and conduction from a horizontalwire of 0.004 in. to 0.005 in. diameter heated 3°F aboveroom temperature was about equal in magnitude to the addition-al increment of heat loss caused by a superimposed forced con-vection of 5 ft/min for the same temperature difference.Therefore, to prevent the effects of free convection frombeing predominant or equal to the effect of a forced convec-tion of the order of 5 ft/min it was necessary to design theheated thermojunctions for a temperature rise of less than 3°F#
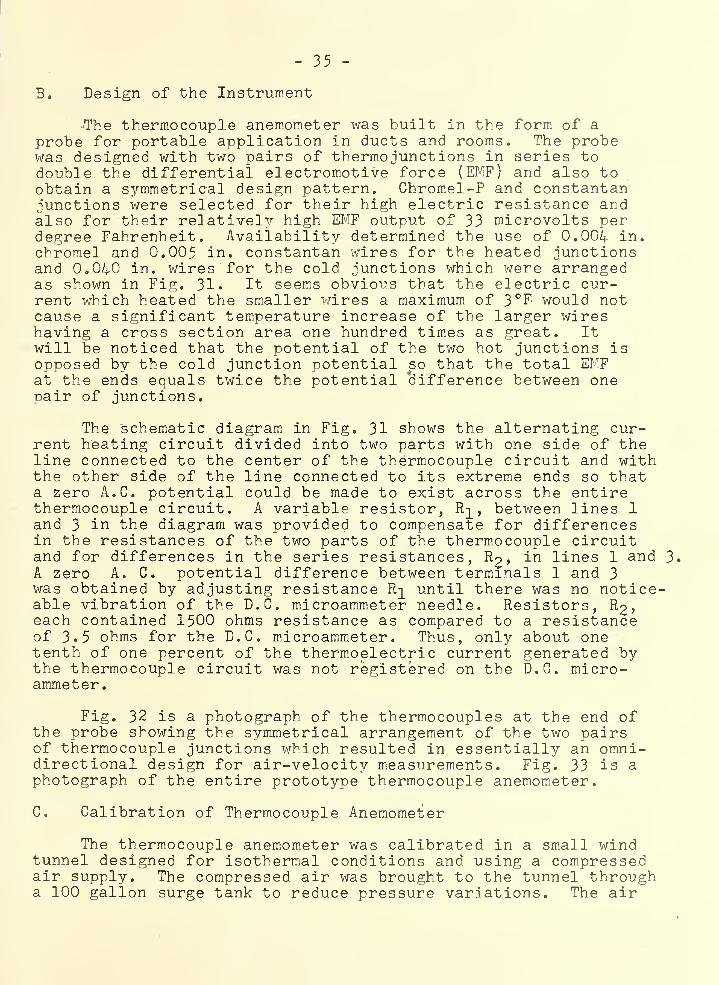
- 35 -
B. Design of the Instrument
The thermocouple anemometer was built in the form of a
probe for portable application in ducts and rooms. The probewas designed with two pairs of thermo junctions in series todouble the differential electromotive force ( EMF ) and also toobtain a symmetrical design pattern. Chromel-P and constantanjunctions were selected for their high electric resistance andalso for their relatively high EMF output of 33 microvolts perdegree Fahrenheit. Availability determined the use of 0.004 in.chromel and 0.005 in. constantan wires for the heated junctionsand 0.040 in. wires for the cold junctions which were arrangedas shown in Fig. 31. It seems obvious that the electric cur-rent which heated the smaller wires a maximum of 3 °F would notcause a significant temperature increase of the larger wireshaving a cross section area one hundred times as great. Itwill be noticed that the potential of the two hot junctions isopposed by the cold junction potential so that the total EMFat the ends equals twice the potential difference between onepair of junctions.
The schematic diagram in Fig. 31 shows the alternating cur-rent heating circuit divided into two parts with one side of theline connected to the center of the thermocouple circuit and withthe other side of the line connected to its extreme ends so thata zero A.C. potential could be made to exist across the entirethermocouple circuit. A variable resistor, Rq
,between lines 1
and 3 in the diagram was provided to compensate for differencesin the resistances of the two parts of the thermocouple circuitand for differences in the series resistances, R^
,in lines 1 and 3.
A zero A. C. potential difference between terminals 1 and 3was obtained by adjusting resistance Rq until there was no notice-able vibration of the D.C. microammeter needle. Resistors, R£
,
each contained 1500 ohms resistance as compared to a resistanceof 3.5 ohms for the D.C. microammeter. Thus, only about onetenth of one percent of the thermoelectric current generated bythe thermocouple circuit was not registered on the D.C. micro-ammeter .
Fig. 32 is a photograph of the thermocouples at the end ofthe probe showing the symmetrical arrangement of the two pairsof thermocouple junctions which resulted in essentially an omni-directional design for air-velocitv measurements. Fig. 33 is aphotograph of the entire prototype thermocouple anemometer.
C. Calibration of Thermocouple Anemometer
The thermocouple anemometer was calibrated in a small windtunnel designed for isothermal conditions and using a compressedair supply. The compressed air was brought to the tunnel througha 100 gallon surge tank to reduce pressure variations. The air

- 36 -
flow rate was measured with an orifice flow meter constructedin accordance with the ASME Research Publication entitled "FluidMeters, Their Theory and Application" Fourth edition and cali-brated with a gas meter for rates below the range covered bythis publication. The pressure drop across the orifice was ob-served on two U-tube manometers, one filled with water and theother with mercury, which permitted the use of the same orificeplate for pressure drops ranging from 1 cm of water to 60 cm ofmercury, corresponding to average air velocities in the windtunnel from 4.# ft/min to 129.? ft /min. A cone-shaped adapterconnected the pipe downstream from the orifice meter and thewind tunnel. A cloth screen was installed at the entrance ofthe wind tunnel to equalize and streamline the air flow overthe full area of the wind tunnel. The probe was attached to theend of a piece of 5/$-inch steel tube and placed in the centerof the tunnel, 12 inches above the cloth screen. The wind tunnelconsisted of an $-inch stainless steel tube, 4 feet long install-ed in a vertical positioij.
During the initial calibration of the prototype instrumenta semi-precision portable potentiometer was used to measure theEMF produced by the thermocouple circuit. The relation betweenthe terminal EMF of the thermocouple circuit and the air flowrate in the wind tunnel is shown in Fig. 34. A heater currentof 75 milliamperes was used for the air velocity range from 0 to35 ft/min and a heater current of 120 milliamperes was used forthe air velocity range from 20 to 130 ft/min. The use of two dif-ferent heater currents- provided greater sensitivity over the en-tire range of air flow rates. The upper part of the curve fora heater current of 75 milliamperes shows a change of only 10microvolts in EMF for the range of flow rates from 21.5 to 33.4ft/min whereas the other curve shows a change of 22 microvolts '
.
in EMF for the same range of flow rates when a heater currentof 120 milliamperes was used. The change in curvature of thecurve for the lower heater current for flow rates below 5 ft/minis believed to have been caused by the increasing effect of freeconvection around the heated thermocouple junctions.
The curves in Fig. 34 apply to air at a temperature of 70°Fand at approximately standard barometric pressure. Tests at highand low values of relative humidity showed that the effect ofhumidity on the electromotive force developed by the heated thermocouple probe could not be detected. The difference in density be-tween dry air and saturated air at 70°F is slightly over 2 percentso the difference in EMF caused by a chanve of relative humidityless than 100 percent could hardly be measured reliably with asemi-precision potentiometer.

cr
LU
LlI
oUJZ<LlI
CLZ>
Ooo
orLUXI-
QLU
I—<LUX
o
<XCD<QO
LUXoU1
rO-o
OJ-o
Z o


inPQZ
FIG.
32

I

FIG.
33


O LfNh-TjQ o p-ririO f^KM^OVQ tT\tt LTirt rftr+CvnM
upD/^j ao^TVq.WOJ.JITLQ J9^9H £/ iOJ. _ .T I
UTGi/4-Jr9^eH ^ou«xty

- 37 -
The heat transfer from a heated wire by convection is ap-proximately proportional to the density of the fluid circulatedover it. That is, for a given total heat transfer rate fromthe wire to ambient air the temperature difference would be in-versely proportional to the density of the air. Thus, for smallvariations in air temperature, the EMF produced by the heatedthermocouple anemometer would be inversely proportional to theair density.
The use of a semi-precision potentiometer for observationsof the EMF of the heated-thermocouple anemometer greatly re-duced its portability so the apparatus was modified to use amicroammeter to observe the thermoelectric current of the probe.A microammeter with a resistance of 3*5 ohms, and a full scaleof 100 microamperes was found to give suitable readings.
The heated-thermocouple anemometer was recalibrated usingthis microammeter and the results are plotted in Fig. 35. Twovalues of heater current were again used to obtain suitablevalues of thermoelectric current for a range of air flow rates.
The results in the wind tunnel were checked by installingthe anemometer on the carriage of the Current Meter Rating tankat this Bureau. By adjusting the velocity of the carriage, thedesired values of air velocity were obtained. These resultsverified those obtained in the wind tunnel.
A computation can be made of the probable thermoelectriccurrent that would flow through the microammeter circuit for anygiven heater current and air flow rate by computing the electricenergy dissipated in the thermocouple wires and the probabletemperature difference required between the hot junctions andthe air to transfer this heat to the air stream.
The total heat dissipated by the heated wires equals theheat input after reaching a steady state condition. The overallresistance of the probe was 2.4 ohms. As the resistance of thesmaller wires was one hundred times that of heavier ones, theresistance of the entire probe was used to compute the heat in-put. The electric energy converted into heat in the thermo-couple wires would be
Qj = I2R x 3.415 Btu/hr (1)
Since the heater current was divided equally between the twohalves of the thermocouple circuit the total heat input wouldbe as follows:
Qj, = 0.01152 Btu/hr
Qj^= 0.0461 Btu/hr
For Ip = 0.075 amp
For Iq = 0.150 amp
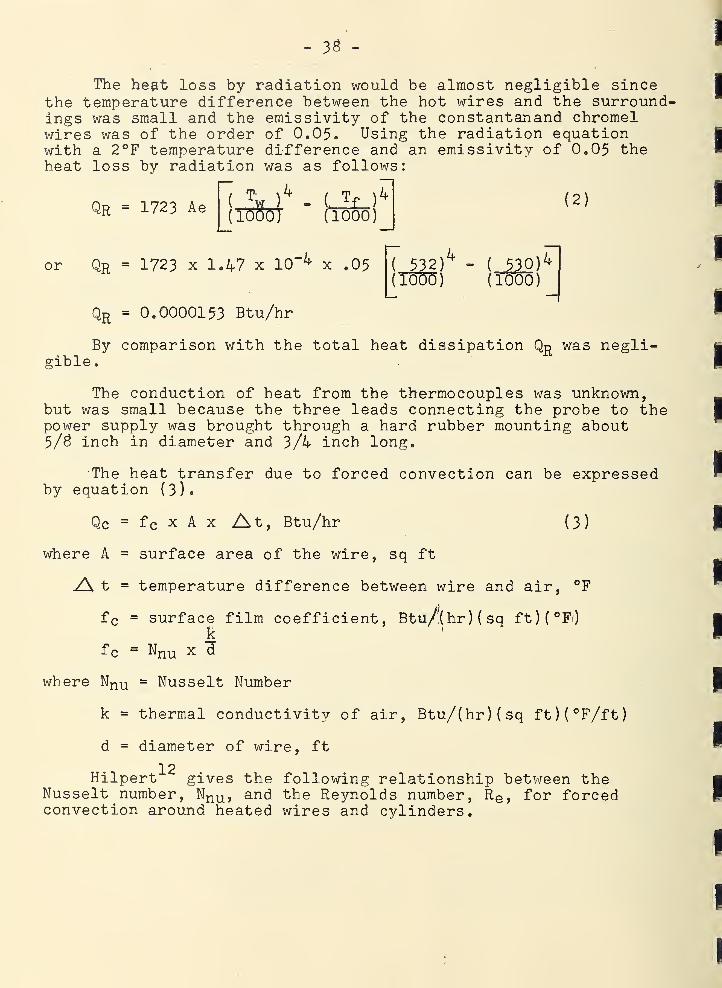
- 33 -
The heat loss by radiation would be almost negligible sincethe temperature difference between the hot wires and the surroundings was small and the emissivity of the constantanand chromelwires was of the order of 0.05. Using the radiation equationwith a 2°F temperature difference and an emissivity of 0.05 theheat loss by radiation was as follows:
Qr= 0.0000153 Btu/hr
By comparison with the total heat dissipation QR was negli-gible.
The conduction of heat from the thermocouples was unknown,but was small because the three leads connecting the probe to thepower supply was brought through a hard rubber mounting about5/3 inch in diameter and 3/4 inch long.
The heat transfer due to forced convection can be expressedby equation ( 3 )
•
Qc = f c x A x At, Btu/hr (3)
where A = surface area of the wire, sq ft
At = temperature difference between wire and air, °F
f c = surface film coefficient, Btu/(hr)(sq ft)(°F')k '
fc = x d
where Nnu = Nusselt Number
k = thermal conductivity of air, Btu/(hr)(sq ft)(°F/ft)
d = diameter of wire, ft
12Hilpert gives the following relationship between theNusselt number, Nnu ,
and the Reynolds number, R e ,for forced
convection around heated wires and cylinders.
Qr = 1723 Ae(1000) (1000)( 1000 )
(
Tw )
4- (.
Tf )>*( 2 )
( 1000 ) ( 1000 )

S3d3dlNV0d3IW ‘_LN3dUnO Oldl03130lNd3Hl


- 39 -
Nnu B Re (4)
where the values of B and n are selected from the following
for the appropriate Reynolds number
„
Re n B
1-4 0.330 0 c $91
4“40 0.3$5 0 o $21
40-4000 0„466 0 o 6l5
4000-40,000 0.61$ 0o 179
40 , 000-2509000 0.$05 0.0239
The Reynolds Number for the air flow was
= V x d x 0 (5)
A"
where: V = air flow rate, ft/sec
d = diameter of wire, ft
^= density of air, lb/ft^
yM = absolute viscosity of air, Ib/ft sec
The thermoelectric current flowing in a circuit of 5»9 ohms
total resistance (
2
0 4 ohms probe resistance plus 3° 5 ohms meter
resistance) with 2 x 33 = 66 microvolts EMF per degree temperature
difference would be
I0 = _^6 x At = ll o 20 x At, microamperes (6)
By solving for At in equation (3) and inserting its value
in equation (6)
ocy
Xocvo
1—1
1—1IIcM (7)
A x f c
I0 = 76,100 x 0
c
1 c($)

- 40 -
Neglecting the heat transfer from the thermocouple wireby radiation and conduction the heat input calculated fromequaltion (1) equals the heat dissipated by the forced con-vection.
Ql = Qc
Therefore, for
Ip = 0.075 amp, I0 = 76,100 x 0.001152 = 375f c ^c
I? = 0.150 amp, I n - 76,100 x 0.0461 - 3500f c
" fc
Table 5 shows the calculated values of the Reynolds andNusselt numbers for a range of air flow rates from 5 ft/minto 130 ft/min and also the resulting values for the coefficientf c . The calculated and the observed values of the thermoelectriccurrent I 0 in microamperes for heater currents of 75 and 150milliamperes are also sliown in Table 5.
Table 5
AirflowRate, fft/min
.
Re
VNnu fc
c.
0OM 75 MA I0 for 150 MA
calcu-' lated observed
calcu-lated observed
5 0.189 0.513 20.1 43.5 3510 0.373 O .646 25.4 34.4 23
,20 0.756 0.313 31.3 27.6 2230 1.134 0.930 36.4 24.1 19 96.2 7650 1.390 1.101 43.2 31.1 6270 2.646 1.229 43.2 72.6 56
130 4.914 1.513 59.6 53.3 45
A comparison of the observed and calculated values of thethermo-electric - current of the heated thermocouple anemometeris shown in Fig.
- 35 for air flow rates from 5 ft/min to 130ft/min. This figure shows that the slopes of the curves forthe observed and calculated currents were very nearly equal forthe same flow rate, but the calculated values were from 23 to31 percent higher than the observed values. This discrepancyis accounted for in part by the radiation and conduction ofheat from the smaller thermocouple wires and by the convectionheat transfer that occurred from the larger wires where theyjoined the smaller wires. That is, the effective area for con-vective heat transfer was somewhat greater than the area of thesmaller wires and this effective area, if it could be evaluated,should have been used in equation (7) for computing the thermo-electric current.

- 41 -
In addition, the values of B and n selected for use inequation (4) may not have been entirely suited to the condi-tions of heat transfer that existed, but appeared to be thebest available in the literature.,
It is expected that the sensitivity of the heated thermo-couple anemometer could be increased by adding a small elec-tronic amplifier to the output „ Operating on the EMF outputof the anemometer, only a small rate of amplification wouldbe required and a less delicate indicator could be usedoAnother advantage of amplification would be that a suitablegain control could be used to obtain a full scale measurementfor both air velocity ranges.
VII. DISCUSSIONS AND CONCLUSIONS
This investigation of the infiltration in the Test Bungalowand of various methods for the measurement of infiltration re-veals first, that the air movement through the various parts ofa frame building are quite complicated and second, that instru-ments are now available for reasonably precise measurement ofair infiltration rates. The present study is considered to beonly a preliminary exploration of the subject of infiltrationbut it reveals broad possibilities for the development of newand reliable information on the air leakage into buildingsunder the influence of wind and temperature difference and howit is affected by building design and construction practices.
The results of the measurements in the Test Bungalow showthat the rate of infiltration increased as the indoor-outdoortemperature difference increased and that under this influencealone a number of interdependent air flows took place betweenattic, living space, and basement and between these spaces andthe outside air. The large amount of basement infiltration inthe Test Bungalow suggests that houses without basements orcrawl spaces would probably have appreciably less infiltration.The air movement through the stud spaces in the Test Bungalowwould not be present in a building with solid walls or one inwhich the stud spaces were filled with granular or fibrous in-sulation. The measurements in the Test Bungalow showed thatopening louvers in the attic increased the ventilation throughthe entire structure and that considerable air leaked into thebasement through the concrete block foundation walls even whenthe basement door and windows and the sill were caulked. Theseobservations indicate that considerable variation in air leak-age' values are to be expected in houses of different con-struction.

- 1+2 -
Before any reliable estimates could be made of the abso-lute values of the infiltration for particular types of con-struction, field surveys of a number of houses of each con-struction would be necessary. Field surveys of this type mightsuggest how building construction could be changed and improvedto provide better control of air movement, vapor movement, andheat loss than is now possible. The exact effects of weatherstripping and storm windows on air leakage could be evaluatedby tracer gas methods of infiltration measurement. A study ofexposure factors and the effect of house orientation on airleakage is also possible.
The use of the heated-thermocouple anemometer and thehelium katharometer or other tracer gas technique togethercould provide valuable information on attic and crawl spaceventilation for condensation control which might result in thedevelopment of construction criteria for the ventilation ofthese spaces.
The investigation of methods of infiltration measurementdescribed in this report indicated that a number of tracer gasmethods are available and that these methods are probably moreaccurate and better adapted to field use than calorimetricmethods or direct air flow measurements. The more promisingtracer gas methods are believed to be (a) helium gas with akatharometer (b) ethane gas with an interferometer, (c) methanegas with an infrared gas analyzer. Suitable measuring tech-niques are possible using either a radioactive gas with anelectrometer or a halogenated hydrocarbon gas with a halidephotometer. However, these latter two methods present somehazard to the personnel using them or to the occupants of thebuilding being tested.
The Cambridge katharometer loaned to the National Bureauof Standards by the American Society of Heating and VentilatingEngineers for this investigation appeared to provide a bettermeans for measuring infiltration rates than other methods pre-viously used for this purpose. A calibration of the instrumentshowed that the indicated values of concentration were subjectto some errors caused by parallax and drift at the zero setting,but that on the average the error in infiltration measurementswould not exceed 4 percent if some precautions were taken inoperating the instrument. The instrument was not sufficientlyportable for field use and it had a lag in response ranging from3.5 minutes with no sampling line to about 5 minutes with asampling line 30 ft long.

43 -
A katharometer based on the same principle as the Cambridgeinstrument was designed and built by the National Bureau ofStandards., It was portable and employed natural convectionrather than a pump for circulating the tracer-gas-air mixturethrough its thermal conductivity cells „ It was shown to havean accuracy equal or slightly better than the Cambridge in-strument o
The heated thermocouple anemometer appeared to be the typeof instrument best suited to measuring air velocities below100 ft/min, It can be made with sufficient sensitivity andaccuracy to measure streamlined air flow rates as low as 5
ft/min, Turbulence in an air stream would probably alter itsaccuracy at the lower end of the velocity range. Such an in-strument seems to be well-suited to measurements of the air flowrates associated with natural ventilation of attics and crawlspaces through Louvered openings.
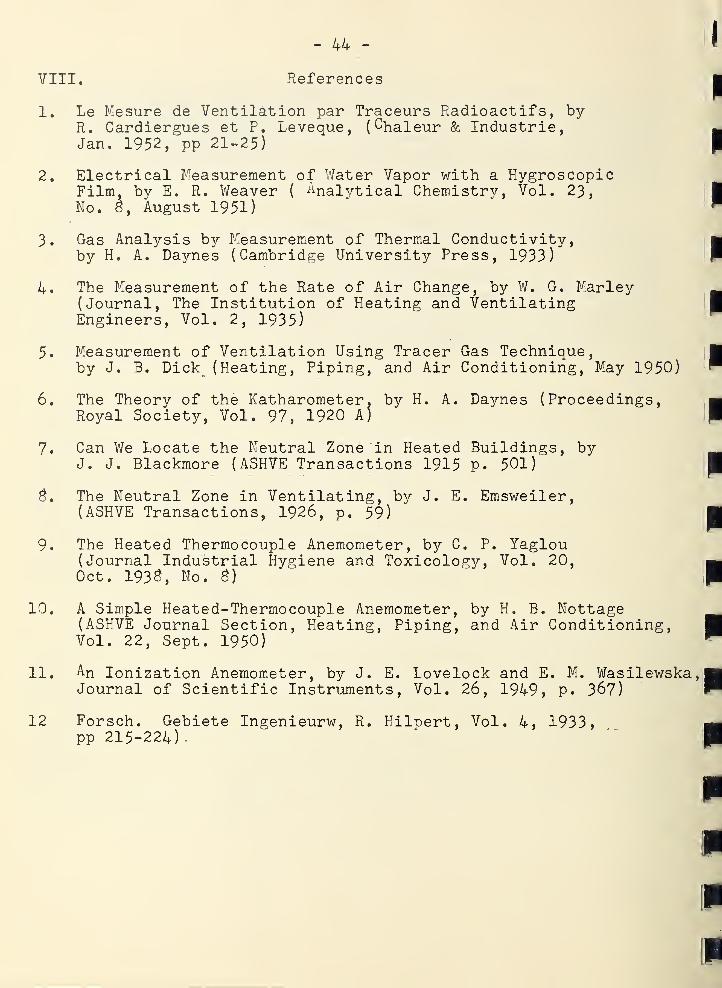
VIII. References
1. Le Mesure de Ventilation par Traceurs Radioactifs, byR. Cardiergues et P. Leveque, (
chaleur & Industrie,Jan. 1952, pp 21-25)
2. Electrical Measurement of Water Vapor with a HygroscopicFilm, by E. R. Weaver (
Analytical Chemistry, Vol. 23,No. 8 ,
August 1951)
3. Gas Analysis by Measurement of Thermal Conductivity,by H. A. Daynes (Cambridge University Press, 1933)
4. The Measurement of the Rate of Air Change, by W. G. Marley(Journal, The Institution of Heating and VentilatingEngineers, Vol. 2, 1935)
5. Measurement of Ventilation Using Tracer Gas Technique,by J. B. Dick (Heating, Piping, and Air Conditioning, May 1950)
6. The Theory of the Katharomet er . by H. A. Daynes (Proceedings,Royal Society, Vol. 97, 1920 A)
7. Can We Locate the Neutral Zone in Heated Buildings, byJ. J. Blackmore (ASHVE Transactions 1915 p. 501)
8 . The Neutral Zone in Ventilating, by J. E. Emsweiler,(ASHVE Transactions, 1926, p. 59)
9. The Heated Thermocouple Anemometer, by C. P. Yaglou(Journal Industrial Hygiene and Toxicology, Vol. 20,Oct. 193 S, No. 8)
10. A Simple Heated-Thermocouple Anemometer, by H. B. Nottage(ASHVE Journal Section, Heating, Piping, and Air Conditioning,Vol. 22, Sept. 1950)
11. An Ionization Anemometer, by J. E. Lovelock and E. M. Wasilewska,Journal of Scientific Instruments, Vol. 26, 1949, p. 367)
Forsch. Gebiete Ineenieurw, R. Hiloert, Vol. 4, 1933,pp 215-224).
12

THE NATIONAL BUREAU OF STANDARDS
Functions and Activities
The functions of the National Bureau of Standards are set forth in the Act of Congress, March
3, 1901, as amended by Congress in Public Law 619, 1950. These include the development and
maintenance of the national standards of measurement and the provision of means and methods
for making measurements consistent with these standards; the determination of physical constants
and properties of materials; the development of methods and instruments for testing materials,
devices, and structures; advisory services to Government Agencies on scientific and technical
problems; invention and development of devices to serve special needs of the Government; and the
development of standard practices, codes, and specifications. The work includes basic and applied
research, development, engineering, instrumentation, testing, evaluation, calibration services, and
various consultation and information services. A major portion of the Bureau’s work is performed
for other Government Agencies, particularly the Department of Defense and the Atomic Energy
Commission. The scope of activities is suggested by the listing of divisions and sections on the
inside of the front cover.
Reports and Publications
The results of the Bureau’s work take the form of either actual equipment and devices or
published papers and reports. Reports are issued to the sponsoring agency of a particular project
or program. Published papers appear either in the Bureau’s own series of publications or in the
journals of professional and scientific societies. The Bureau itself publishes three monthly peri-
odicals, available from the Government Printing Office: The Journal of Research, which presents
complete papers reporting technical investigations; the Technical News Bulletin, which presents
summary and preliminary reports on work in progress; and Basic Radio Propagation Predictions,
which provides data for determining the best frequencies to use for radio communications throughout
the world. There are also five series of nonperiodical publications: The Applied Mathematics
Series, Circulars, Handbooks, Building Materials and Structures Reports, and Miscellaneous
Publications.
Information on the Bureau’s publications can be found in NBS Circular 460, Publications of
the National Bureau of Standards ($1.00). Information on calibration services and fees can be
found in NBS Circular 483, Testing by the National Bureau of Standards (25 cents). Both are
available from the Government Printing Office. Inquiries regarding the Bureau’s reports and
publications should be addressed to the Office of Scientific Publications, National Bureau of Stand-
ards, Washington 25, D. C.