Wind-induced natural ventilation of re-entrant bays in a high-rise building
13
This article appeared in a journal published by Elsevier. The attached copy is furnished to the author for internal non-commercial research and education use, including for instruction at the authors institution and sharing with colleagues. Other uses, including reproduction and distribution, or selling or licensing copies, or posting to personal, institutional or third party websites are prohibited. In most cases authors are permitted to post their version of the article (e.g. in Word or Tex form) to their personal website or institutional repository. Authors requiring further information regarding Elsevier’s archiving and manuscript policies are encouraged to visit: http://www.elsevier.com/copyright
Transcript of Wind-induced natural ventilation of re-entrant bays in a high-rise building

This article appeared in a journal published by Elsevier. The attachedcopy is furnished to the author for internal non-commercial researchand education use, including for instruction at the authors institution
and sharing with colleagues.
Other uses, including reproduction and distribution, or selling orlicensing copies, or posting to personal, institutional or third party
websites are prohibited.
In most cases authors are permitted to post their version of thearticle (e.g. in Word or Tex form) to their personal website orinstitutional repository. Authors requiring further information
regarding Elsevier’s archiving and manuscript policies areencouraged to visit:
http://www.elsevier.com/copyright

Author's personal copy
Wind-induced natural ventilation of re-entrant bays in a high-rise building
C.K.C. Cheng a,n, K.M. Lam b, Y.T.A. Leung a, K. Yang c, H.W. Li Danny a, C.P. Cheung Sherman d
a Department of Building and Construction, City University of Hong Kong, Hong Kong, 83 Tat Chee Avenue, Kowloon, Hong Kongb Department of Civil Engineering, University of Hong Kong, Hong Kongc Laboratory of Tibetan Environment Changes and Land Surface Processes, Institute of Tibetan Plateau Research, Chinese Academy of Sciences, Beijing, PR Chinad School of Aerospace, Mechanical and Manufacturing Engineering, RMIT University, Australia
a r t i c l e i n f o
Article history:
Received 29 June 2010
Received in revised form
7 November 2010
Accepted 17 November 2010Available online 8 December 2010
Keywords:
Natural ventilation
High-rise building
Wind–structure interaction
Micro-climate
CFD simulations
Re-entrant bays
Pollutant dispersion
a b s t r a c t
This paper reports a systematic computational study of wind-induced natural ventilation and pollutant
transport of re-entrant bays on a total of 30 generic building models of different building heights and with
bays of different dimensions. Mean wind flow around each building model and wind-induced flow inside
re-entrant bays are computed. To determine the ventilation efficiency of the bay, the computed flow field
is used to disperse a scalar pollutant initially occupying the entire bay at a uniform concentration. The
subsequent time decay of pollutant concentration inside the bay is studied and the ventilation efficiency
is quantified by the retention time. The results show that wind-induced flow inside the bay, especially on
the building side face, is complex and highly three-dimensional. Air exchange rates through the roof
opening and vertical side opening are analyzed for each bay and their relationship to the ventilation
efficiency is discussed. The bays on the building side faces are much worse ventilated than those on the
windward or leeward building face. The deeper the side bay, the worse is the air exchange and ventilation.
The building height is found to have a governing effect on the ventilation of the windward and leeward
re-entrant bays.
& 2010 Elsevier Ltd. All rights reserved.
1. Introduction
Wind effects play an important role in building ventilation. Windbreezes are always desirable for cooling in warm weathers and forwind-induced dispersion of unwanted emissions from a building.For a low-rise house, wind can often be collected by large scale wideopen features, like atriums or courtyards (Aldawoud and Clark,2008; Rajapaksha et al., 2003; Sharples and Bensalem, 2001).However these architectural features are not easily adopted byhigh-rise buildings. For high-rise multi-apartment residentialbuildings, which are increasing common in metropolitan cities, itis important to optimise between views and ventilation. In order tosatisfy both requirements, these high-rise buildings often adopt anirregular cross-sectional shape with apartments arranged as wingsections extending from a central core. Between adjacent buildingwings are deeply recessed re-entrant bays (recessed cavities) or‘‘light-wells’’ towards which kitchen and bathrooms windows open.Unwanted matters and heat are emitted into the re-entrant bayswhich do not occupy the most important views of the building.
It is essential that these emissions can be dispersed out of the re-entrant spaces effectively by wind-induced natural ventilation.
The measurement results of Higson et al. (1996) showed thatwind-driven pollutant dispersion around a building was dependenton the building shapes. Gomes et al. (2005) and Santos et al. (2005)also found that wind flow around a building behaves interactivelywith the basic geometry of the building. Installation of a re-entrantbay in a building is expected to lead to a particular pattern of windflow around the building and inside the bay, which in turn determineswind-induced ventilation characteristics of the re-entrant bay.
While there have been many studies investigating wind loadsacting on different shaped buildings (Kijewski and Kareem, 1998;Zhou et al., 2003), very few studies provide the essential details ofwind flow information inside a building re-entrant bay. The windloading study of Building Research Establishment (Cook, 1985)suggested that wind flowing around a building with recessedcorners or re-entrant bays intends to skip past a narrow recessedbay and leave an almost stagnant flow inside it but details of flowinformation were not provided. Chow et al. (2002) carried out acomputational fluid dynamics (CFD) study of wind flow around abuilding with a re-entrant bay installed at the mid-width of thebuilding front face. They pointed out that at this normal incidence,some flow might come down the re-entrant bay from its roofopening face if there was no heat discharged into the bay.
In real-life situations, a poorly ventilated re-entrant bay canlead to disastrous consequences in the built environment. In 2003,
Contents lists available at ScienceDirect
journal homepage: www.elsevier.com/locate/jweia
Journal of Wind Engineeringand Industrial Aerodynamics
0167-6105/$ - see front matter & 2010 Elsevier Ltd. All rights reserved.
doi:10.1016/j.jweia.2010.11.002
n Corresponding author. Tel.: +852 2788 7618; fax: +852 2788 9446.
E-mail addresses: [email protected] (C.K.C. Cheng),
[email protected] (K.M. Lam), [email protected] (Y.T.A. Leung),
[email protected] (K. Yang), [email protected] (H.W. Li Danny),
[email protected] (C.P. Cheung Sherman).
J. Wind Eng. Ind. Aerodyn. 99 (2011) 79–90

Author's personal copy
Hong Kong experiences the outbreak of Severe Acute RespiratorySyndrome (SARS) Crises with almost 300 people died (Yeoh, 2003).Many victims lived in Amoy Garden, a group of high-rise multi-apartment buildings. The first patient lived on the 16th floor of a36-storey residential building. The level was about 1/3 times thebuilding height (H) above its podium. After a very short period,there were more than 200 cases found in the same housing butthere were no cases reported at a level below 9th floor (0.15H).A subsequent study by building and medical professionals in HongKong suggested that the SARS virus might be discharged from thebathroom of the infected unit and subsequently spread to the otherrooms through air flow paths inside the re-entrant bay (Hong KongGovernment, 2004). The re-entrant bays of Amoy Garden buildingsare deeply recessed into the building side walls, having a width-to-depth (W/D) ratio of 0.25–0.33. According to Cook (1985), flowinside these deep recessed bays is largely stagnated. And thisstagnant flow condition would prolong a long-time residence ofSARS viruses emitted into the bay and thus increasing the chance oftheir transmission into the connecting apartments through airexchange with the bay (Yu et al., 2004). This event demonstratesthe importance of wind-induced natural ventilation of re-entrantbays in buildings for dispersion of pollutants and matters. Otheradverse consequences of poor natural ventilation of the re-entrantbays include increased risks of environmental health and fire safetyof the building that may arise from poor dispersion of waste gasesor fire smoke discharged into the bay. In warm regions, domestic airconditioners often have their air-cooled condensers installed insidethe re-entrant bays and insufficient ventilation of the bays maylead to increase in energy consumption as a result of built up ofcondensing temperature.
The present paper aims at a systematic investigation of wind-induced flow inside and around generic re-entrant bays of a tallbuilding and the associated ventilation efficiency with CFD simula-tions. The generic building models aim to represent common full-scale tall residential buildings in a metropolitan city such as HongKong. The CFD technique has been successfully applied by theauthors to study wind-induced natural ventilation of a refuge floorwhich is also a large recessed feature of the tall buildings (Chenget al., 2005, 2007, 2008; Cheng, 2009).
2. Test cases of tall buildings and re-entrant bays
The objectives of this study are to determine the wind-inducedventilation flow inside a generic re-entrant bay of varying dimen-sion, and to determine its effects on pollutant dispersion outthe bays.
A tall building with a cross section of an ‘‘H’’ shape is chosen asthe generic building configuration. Two re-entrant bays are thuspresented on two opposite walls of the building. The ‘‘H’’ shapedcross section has a square envelope of breadth B. Nine ‘‘H’’ shapesare studied and their configurations were shown in Table 1. In these‘‘H’’ shapes, the horizontal dimensions of the re-entrant bay vary ina systematic manner which covered three different widths;W/B¼{0.25, 0.5, 0.75}, and three different depths: D/B¼{0.125,0.25, 0.375}. Flow over a square building with no re-entrant bay isalso studied. Three groups of buildings with different buildingheight; H/B¼{4, 6, 8}, are studied. Including the control squarebuildings, wind flow over a total number of 30 buildings arecomputed in this study. In addition, computations are carried outfor each building at two wind incidence angles. At wind angle 01,wind blows normally onto the building face with a re-entrant bay(Table 1). At wind angle 901, the re-entrant bays are on the two sidefaces of the building.
The breadth of the building is targeted at full-scale value ofB¼30 m. The building heights being studied thus vary between 120
and 240 m. These building dimensions are typical of high-riseresidential buildings in Hong Kong.
3. CFD simulations
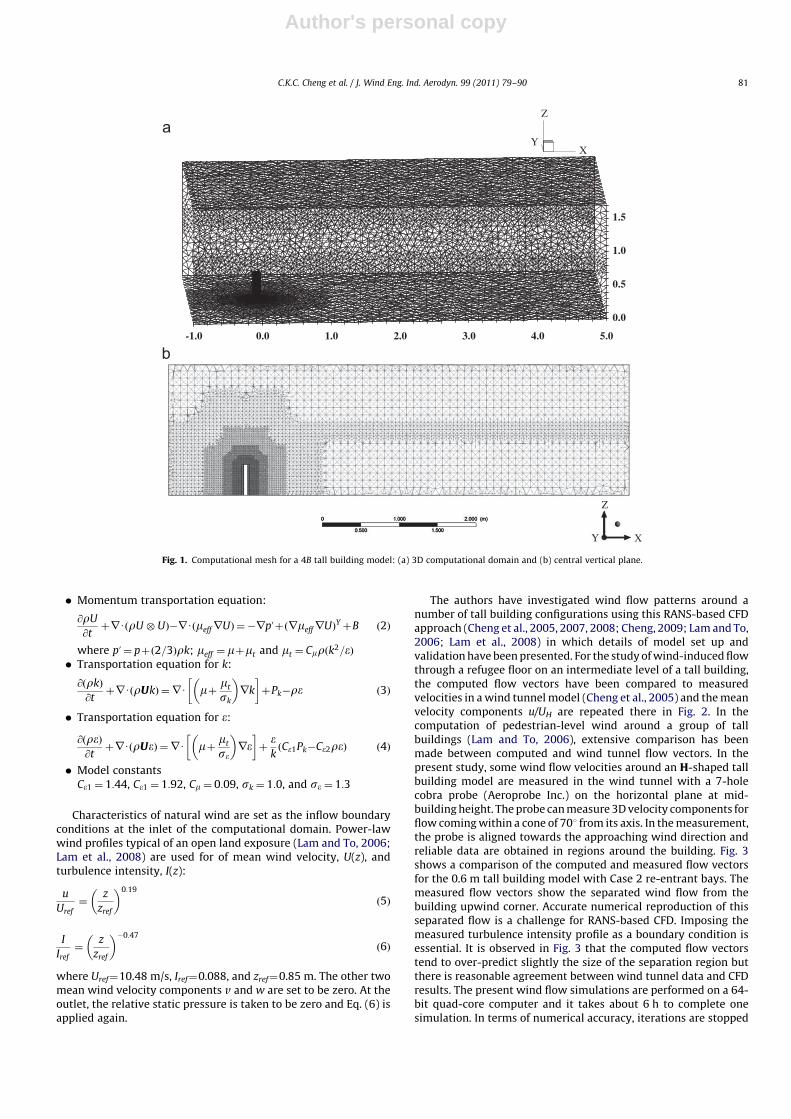
The same CFD technique used by the authors to study wind flowproblems around a tall buildings (Cheng et al., 2005, 2007, 2008;Cheng, 2009) is applied in the present study. Three-dimensional(3D) flow simulations are carried out by ANSYS CFX at a reducedgeometric scale of 1:300, which is also the scale of the accompany-ing wind tunnel tests. The computational domain has a width at3 m and a height at 1.7 m. These values match the cross-sectionaldimensions of the boundary layer wind tunnel of the Department ofCivil Engineering at the University of Hong Kong where some flowmeasurements around models of H-shaped tall buildings arecarried out. The computational domain has a length of 6 m andthe building model is located at 1 m downstream of the inlet planeof the domain. This means that there will be more than 1H distanceupstream the building and at least 6H downstream distancebetween the building and the inlet or outlet plane. The 3Dcomputational domain is discretized into unstructured tetrahedralelements with element sizes stretching progressively outwardsfrom the building walls to the domain boundary walls (Fig. 1). Inregions far from the building, no element has a dimension greaterthan 0.1 m and mesh elements generated close to the buildingwalls are refined to have a minimum dimension of 0.01 m so as tofulfil the application requirements of the wall functions. Thenumbers of computation elements range from 4 to 8 millionsand this mesh resolution complies with the recommended require-ments of AIJ (Tominaga et al., 2008) for computational wind flowstudies of buildings.
The CFD computation seeks a steady solution of the 3Dturbulent flow with the RANS (Reynolds Averaged Navier Stokes)method. Turbulence closure is made with the standard k–e model(Launder and Spalding, 1974). This model applies gradient diffu-sion hypothesis to relate Reynolds stresses to mean velocitygradients and turbulent viscosity. Turbulent viscosity is modelledas the product of turbulent velocity and turbulent length scale.While the turbulence velocity scale is calculated by solving thetransportation equation for turbulent kinetic energy (k), theturbulent length scale is estimated by solving the transportationequations for the k and its dissipation rate (e). The governingequations (Ansys CFX-Solver Theory Guide, 2009) for the simula-tions are listed as follows:
� Continuity equation:
@r@tþrUðrUÞ ¼ 0 ð1Þ
Table 1Building configurations: dimensions and aspect ratio of re-entrant bays.
Case No. Width (W/B)
Depth (D/B)
1 0.25 0.125
2 0.25 0.250
3 0.25 0.375
4 0.50 0.125
5 0.50 0.250
6 0.50 0.375
7 0.75 0.125
8 0.75 0.250
9 0.75 0.375
C.K.C. Cheng et al. / J. Wind Eng. Ind. Aerodyn. 99 (2011) 79–9080
Author's personal copy
� Momentum transportation equation:
@rU
@tþrUðrU � UÞ�rUðmeffrUÞ ¼ �rpuþðrmeffrUÞYþB ð2Þ
where pu¼ pþð2=3Þrk; meff ¼ mþmt and mt ¼ Cmrðk2=eÞ� Transportation equation for k:
@ðrkÞ
@tþrUðrUkÞ ¼rU mþ mt
sk
� �rk
� �þPk�re ð3Þ
� Transportation equation for e:
@ðreÞ@tþrUðrUeÞ ¼rU mþ mt
se
� �re
� �þekðCe1Pk�Ce2reÞ ð4Þ
� Model constantsCe1 ¼ 1:44, Ce1 ¼ 1:92, Cm ¼ 0:09, sk ¼ 1:0, and se ¼ 1:3
Characteristics of natural wind are set as the inflow boundaryconditions at the inlet of the computational domain. Power-lawwind profiles typical of an open land exposure (Lam and To, 2006;Lam et al., 2008) are used for of mean wind velocity, U(z), andturbulence intensity, I(z):
u
Uref¼
z
zref
� �0:19
ð5Þ
I
Iref¼
z
zref
� ��0:47
ð6Þ
where Uref¼10.48 m/s, Iref¼0.088, and zref¼0.85 m. The other twomean wind velocity components v and w are set to be zero. At theoutlet, the relative static pressure is taken to be zero and Eq. (6) isapplied again.
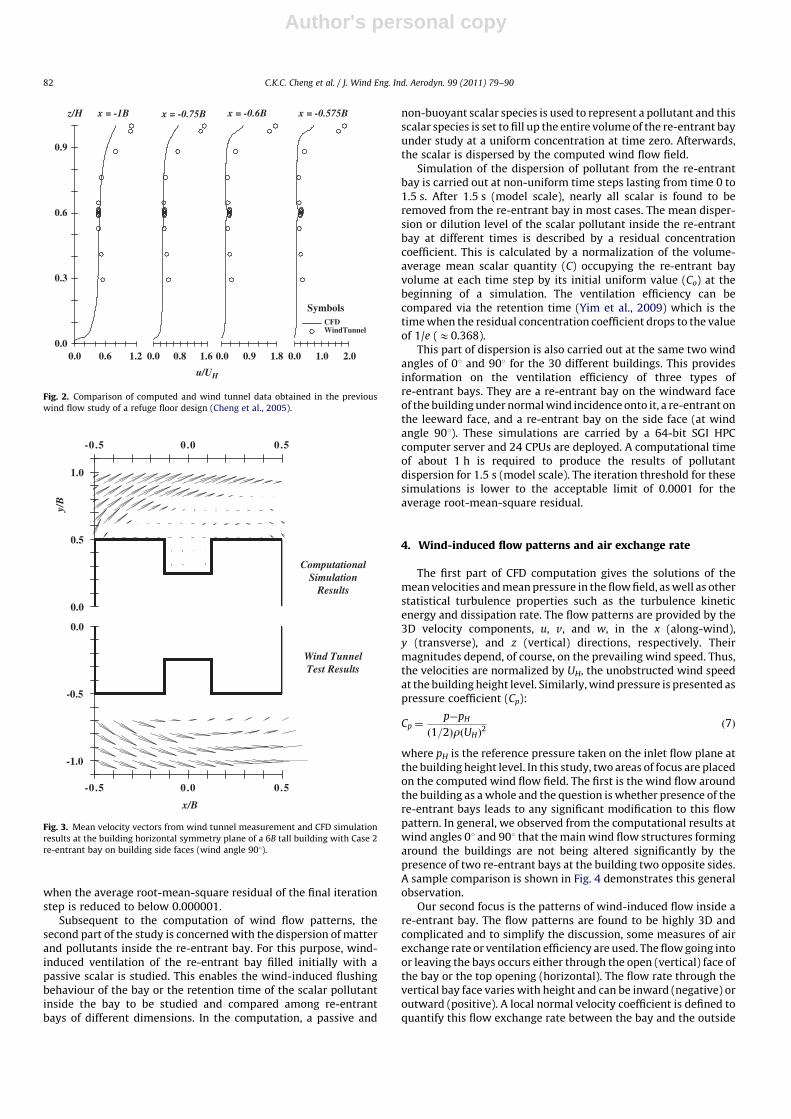
The authors have investigated wind flow patterns around anumber of tall building configurations using this RANS-based CFDapproach (Cheng et al., 2005, 2007, 2008; Cheng, 2009; Lam and To,2006; Lam et al., 2008) in which details of model set up andvalidation have been presented. For the study of wind-induced flowthrough a refugee floor on an intermediate level of a tall building,the computed flow vectors have been compared to measuredvelocities in a wind tunnel model (Cheng et al., 2005) and the meanvelocity components u/UH are repeated there in Fig. 2. In thecomputation of pedestrian-level wind around a group of tallbuildings (Lam and To, 2006), extensive comparison has beenmade between computed and wind tunnel flow vectors. In thepresent study, some wind flow velocities around an H-shaped tallbuilding model are measured in the wind tunnel with a 7-holecobra probe (Aeroprobe Inc.) on the horizontal plane at mid-building height. The probe can measure 3D velocity components forflow coming within a cone of 701 from its axis. In the measurement,the probe is aligned towards the approaching wind direction andreliable data are obtained in regions around the building. Fig. 3shows a comparison of the computed and measured flow vectorsfor the 0.6 m tall building model with Case 2 re-entrant bays. Themeasured flow vectors show the separated wind flow from thebuilding upwind corner. Accurate numerical reproduction of thisseparated flow is a challenge for RANS-based CFD. Imposing themeasured turbulence intensity profile as a boundary condition isessential. It is observed in Fig. 3 that the computed flow vectorstend to over-predict slightly the size of the separation region butthere is reasonable agreement between wind tunnel data and CFDresults. The present wind flow simulations are performed on a 64-bit quad-core computer and it takes about 6 h to complete onesimulation. In terms of numerical accuracy, iterations are stopped
-1.0 0.0 1.0 2.0 3.0 4.0 5.0
0.0
0.5
1.0
1.5
YX
Z
Y X
Z
Fig. 1. Computational mesh for a 4B tall building model: (a) 3D computational domain and (b) central vertical plane.
C.K.C. Cheng et al. / J. Wind Eng. Ind. Aerodyn. 99 (2011) 79–90 81
Author's personal copy
when the average root-mean-square residual of the final iterationstep is reduced to below 0.000001.
Subsequent to the computation of wind flow patterns, thesecond part of the study is concerned with the dispersion of matterand pollutants inside the re-entrant bay. For this purpose, wind-induced ventilation of the re-entrant bay filled initially with apassive scalar is studied. This enables the wind-induced flushingbehaviour of the bay or the retention time of the scalar pollutantinside the bay to be studied and compared among re-entrantbays of different dimensions. In the computation, a passive and
non-buoyant scalar species is used to represent a pollutant and thisscalar species is set to fill up the entire volume of the re-entrant bayunder study at a uniform concentration at time zero. Afterwards,the scalar is dispersed by the computed wind flow field.
Simulation of the dispersion of pollutant from the re-entrantbay is carried out at non-uniform time steps lasting from time 0 to1.5 s. After 1.5 s (model scale), nearly all scalar is found to beremoved from the re-entrant bay in most cases. The mean disper-sion or dilution level of the scalar pollutant inside the re-entrantbay at different times is described by a residual concentrationcoefficient. This is calculated by a normalization of the volume-average mean scalar quantity (C) occupying the re-entrant bayvolume at each time step by its initial uniform value (Co) at thebeginning of a simulation. The ventilation efficiency can becompared via the retention time (Yim et al., 2009) which is thetime when the residual concentration coefficient drops to the valueof 1/e (E0.368).
This part of dispersion is also carried out at the same two windangles of 01 and 901 for the 30 different buildings. This providesinformation on the ventilation efficiency of three types ofre-entrant bays. They are a re-entrant bay on the windward faceof the building under normal wind incidence onto it, a re-entrant onthe leeward face, and a re-entrant bay on the side face (at windangle 901). These simulations are carried by a 64-bit SGI HPCcomputer server and 24 CPUs are deployed. A computational timeof about 1 h is required to produce the results of pollutantdispersion for 1.5 s (model scale). The iteration threshold for thesesimulations is lower to the acceptable limit of 0.0001 for theaverage root-mean-square residual.
4. Wind-induced flow patterns and air exchange rate
The first part of CFD computation gives the solutions of themean velocities and mean pressure in the flow field, as well as otherstatistical turbulence properties such as the turbulence kineticenergy and dissipation rate. The flow patterns are provided by the3D velocity components, u, v, and w, in the x (along-wind),y (transverse), and z (vertical) directions, respectively. Theirmagnitudes depend, of course, on the prevailing wind speed. Thus,the velocities are normalized by UH, the unobstructed wind speedat the building height level. Similarly, wind pressure is presented aspressure coefficient (Cp):
Cp ¼p�pH
ð1=2ÞrðUHÞ2
ð7Þ
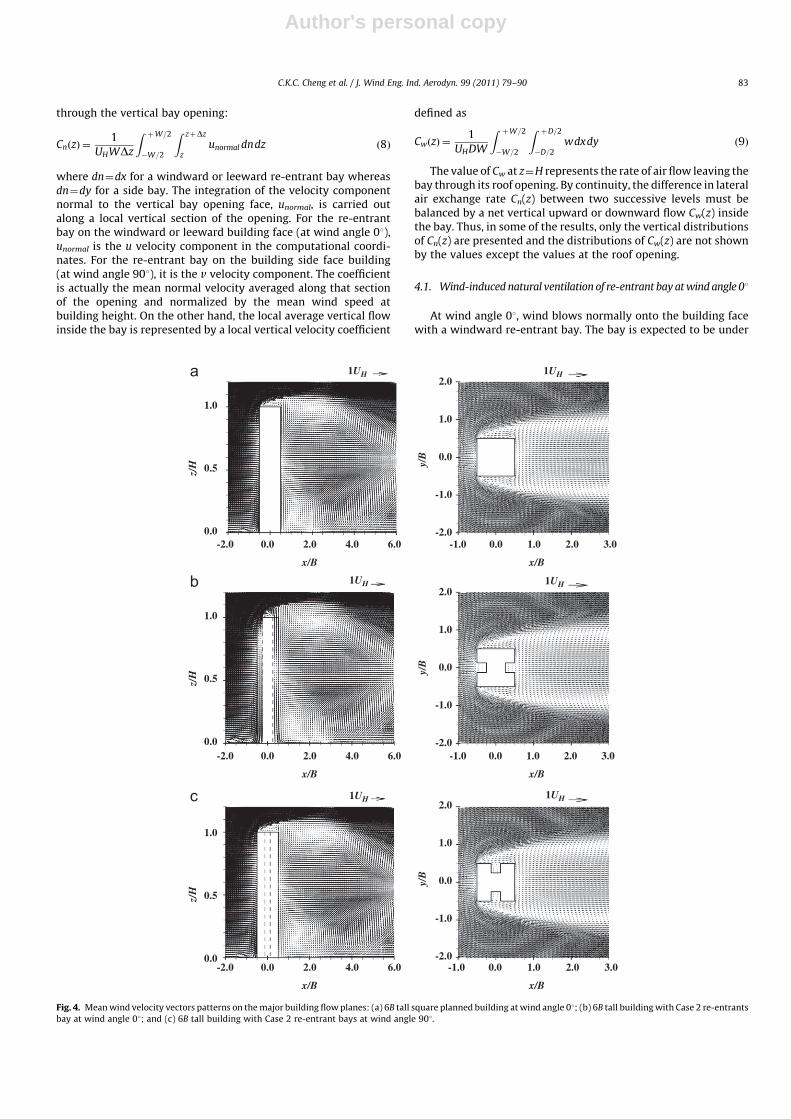
where pH is the reference pressure taken on the inlet flow plane atthe building height level. In this study, two areas of focus are placedon the computed wind flow field. The first is the wind flow aroundthe building as a whole and the question is whether presence of there-entrant bays leads to any significant modification to this flowpattern. In general, we observed from the computational results atwind angles 01 and 901 that the main wind flow structures formingaround the buildings are not being altered significantly by thepresence of two re-entrant bays at the building two opposite sides.A sample comparison is shown in Fig. 4 demonstrates this generalobservation.
Our second focus is the patterns of wind-induced flow inside are-entrant bay. The flow patterns are found to be highly 3D andcomplicated and to simplify the discussion, some measures of airexchange rate or ventilation efficiency are used. The flow going intoor leaving the bays occurs either through the open (vertical) face ofthe bay or the top opening (horizontal). The flow rate through thevertical bay face varies with height and can be inward (negative) oroutward (positive). A local normal velocity coefficient is defined toquantify this flow exchange rate between the bay and the outside
x = -0.75B x = -0.6B
CFDWindTunnel
x = -0.575B
Symbols
0.0
0.3
0.6
0.9
x = -1Bz/H
0.0 0.6 1.2 0.0 0.8 1.6 0.0 0.9 1.8 0.0 1.0 2.0
u/UH
Fig. 2. Comparison of computed and wind tunnel data obtained in the previous
wind flow study of a refuge floor design (Cheng et al., 2005).
-0.5 0.0 0.5
-1.0
-0.5
0.0
x/B
Wind TunnelTest Results
-0.5 0.0 0.5
0.0
0.5
1.0
ComputationalSimulation
Results
y/B
Fig. 3. Mean velocity vectors from wind tunnel measurement and CFD simulation
results at the building horizontal symmetry plane of a 6B tall building with Case 2
re-entrant bay on building side faces (wind angle 901).
C.K.C. Cheng et al. / J. Wind Eng. Ind. Aerodyn. 99 (2011) 79–9082
Author's personal copy
through the vertical bay opening:
CnðzÞ ¼1
UHWDz
Z þW=2
�W=2
Z zþDz
zunormal dndz ð8Þ
where dn¼dx for a windward or leeward re-entrant bay whereasdn¼dy for a side bay. The integration of the velocity componentnormal to the vertical bay opening face, unormal, is carried outalong a local vertical section of the opening. For the re-entrantbay on the windward or leeward building face (at wind angle 01),unormal is the u velocity component in the computational coordi-nates. For the re-entrant bay on the building side face building(at wind angle 901), it is the v velocity component. The coefficientis actually the mean normal velocity averaged along that sectionof the opening and normalized by the mean wind speed atbuilding height. On the other hand, the local average vertical flowinside the bay is represented by a local vertical velocity coefficient
defined as
CwðzÞ ¼1
UHDW
Z þW=2
�W=2
Z þD=2
�D=2wdxdy ð9Þ
The value of Cw at z¼H represents the rate of air flow leaving thebay through its roof opening. By continuity, the difference in lateralair exchange rate Cn(z) between two successive levels must bebalanced by a net vertical upward or downward flow Cw(z) insidethe bay. Thus, in some of the results, only the vertical distributionsof Cn(z) are presented and the distributions of Cw(z) are not shownby the values except the values at the roof opening.
4.1. Wind-induced natural ventilation of re-entrant bay at wind angle 01
At wind angle 01, wind blows normally onto the building facewith a windward re-entrant bay. The bay is expected to be under
a
0.0
0.5
1.0
z/H
z/H
z/H
-2.0
-1.0
0.0
1.0
2.0
y/B
y/B
y/B
b
0.0
0.5
1.0
-2.0
-1.0
0.0
1.0
2.0
c
0.0
0.5
1.0
x/B
-2.0
-1.0
0.0
1.0
2.0
x/B
6.04.02.0-2.0 0.0 -1.0 0.0 1.0 2.0 3.0
x/B x/B
6.04.02.0-2.0 0.0 -1.0 0.0 1.0 2.0 3.0
x/B x/B
6.04.02.0-2.0 0.0 -1.0 0.0 1.0 2.0 3.0
1UH 1UH
1UH1UH
1UH 1UH
Fig. 4. Mean wind velocity vectors patterns on the major building flow planes: (a) 6B tall square planned building at wind angle 01; (b) 6B tall building with Case 2 re-entrants
bay at wind angle 01; and (c) 6B tall building with Case 2 re-entrant bays at wind angle 901.
C.K.C. Cheng et al. / J. Wind Eng. Ind. Aerodyn. 99 (2011) 79–90 83

Author's personal copy
active wind-induced ventilation. On the other hand, the bay on theleeward building face is in the wake of the building and itsventilation relies on flow induced by the pressure distributionaround it.
Fig. 5 shows the results of the selected case of a building ofH/B¼6 with Case 5 bays; i.e. W/B¼0.5 and D/B¼0.25. Horizontalflow vectors of (u, v) are shown at the mid-height level and thegeneral observation is that although wind blows onto the wind-ward building face, little flow enters the re-entrant bay. Windspeeds inside the windward bays often have small magnitudes ascompared with the incident wind speed and wind speeds are foundto be even slower in a taller building. For the control square tallbuilding, our computation results have shown low-speed reversedflow approaching the leeward building face on the mid-heightplane (Fig. 4). The same global flow behaviour is observed on theleeward face of the H-shaped buildings. Similar to the windwardface, only little flow enters into the leeward side re-entrant bays.Another general observation from all the computation results isthat the amount of flow going into the re-entrant bays seemsrelated to the width of the bays while the depth has a minorinfluence. More flow can enter the wider bays, both on thewindward and leeward building faces.
The computed pressure distribution in Fig. 5 shows that theback face of the windward bay is under the stagnation effect in asimilar manner as on the windward face of a building without a bay.
At zE0.8–0.85H, there is a time-average mean stagnation point onthe back face of the bay. A high positive pressure at Cp40.9 is foundaround the stagnation point. Above this height, wind flows into thebay with upward w components to escape through the roofopening. At levels below the height of the stagnation point, windflows with downward w components into the bay, except at levelsnear the ground where air flows out of the bay. Thus, Cp decreases inmagnitude towards the ground. At levels near the ground, thedownward flow hits the ground slab and curves outwards to leavethe bay, leading to a recovery of pressure around the building baselevel. Inside the lower half of a deep re-entrant bay, the downwardw components become very much greater than the along-wind u
components and the flow is primarily wholly in the downwarddirection.
On the leeward side, the pressure coefficients in Fig. 5 are ratheruniform at CpE�0.4 which is a typical situation in the wakebehind a building. The flow around the rear bay occurs mainly inthe reverse direction and with slow speeds. In most cases, thevariation of flow patterns with height is the reverse of that on thewindward side but with much lower speeds. One difference is thatthe stagnation point of the reverse flow occurs at a lower height atzE0.6H. Another difference is that the flow leaves the roof openingwith almost vertical directions.
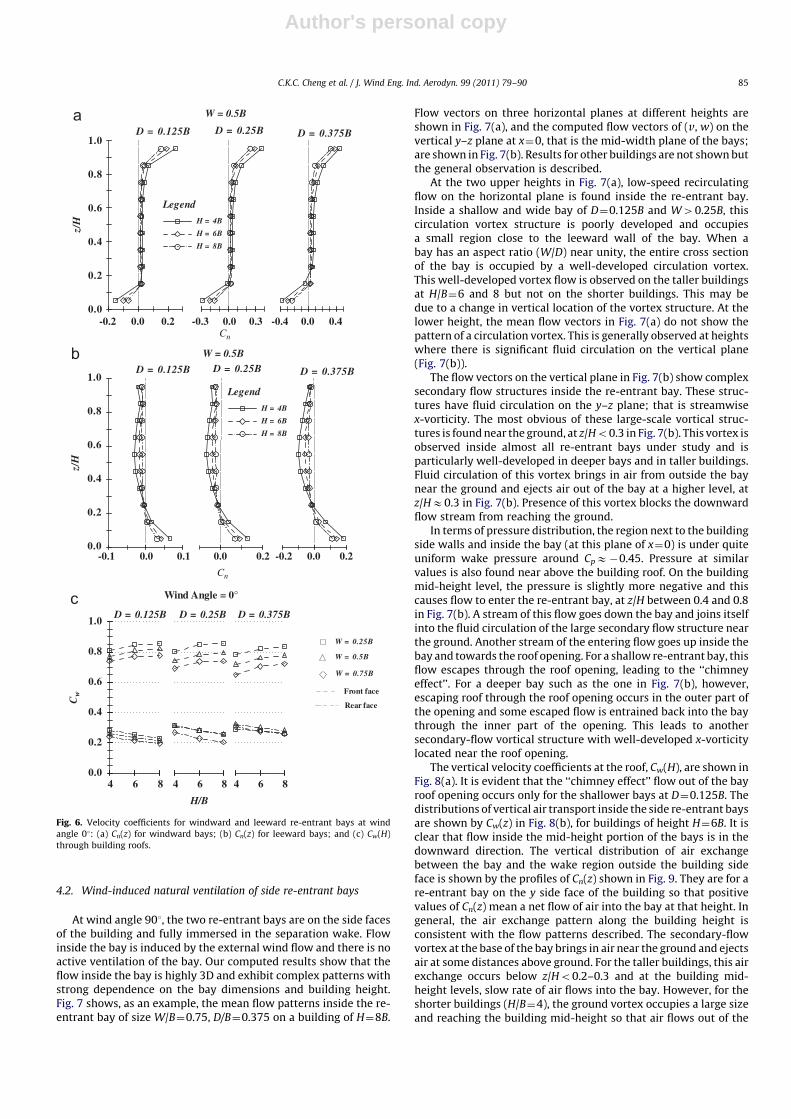
In terms of wind-induced ventilation, the integral rate of flowexchange between the bay and the outside space is more relevant.Fig. 6(a, b) shows the vertical distributions of Cn(z) for, respectively,the windward and leeward re-entrant bays of width W/B¼0.5. Thedistributions for bays of the other two width values are similar andnot shown for brevity. The distributions of Cw(z) are not shown butthe values at the roof opening are presented in Fig. 6(c).
Fig. 6 shows that little air exchange occurs on the middlebuilding levels between the windward bays and their outside. Onlyat and above the stagnation point level that wind causes significantamount of flow to enter the bay. This inflow rate increases towardsthe building top level. One part of this amount of air entering thebay goes up and leaves the bay through the roof opening. The otherpart travels down the bay with little net air exchange with theoutside and leaves the bay at levels near the ground, z/Ho0.2. Thedistributions are similar for bays of different widths or depths, bayor different building heights. The magnitudes of the normal outflowvelocity coefficient near the building top or bottom levels are,however, dependent on those dimensions. A larger peak Cn is foundin deeper bays while the width of the bay has no noticeable effect.The shorter buildings, H/B¼4, have slightly larger values of peak Cn
but this occur over a shorter physical vertical distance (over similarranges of z/H but H is physically smaller) so that the absoluteamount of air inflow rate is not as high as that on a taller building.As a result, the amount of air leaving rate through the roof opening,as measured by Cw(H), increases with the building height (Fig. 6(c)).The dependence of Cw(H) on the bay dimensions is that a higheraverage vertical velocity occurs at the roof opening of a narrowerand shallower bay. The dependence, as shown in Fig. 6(c), is only ata slight degree and the absolute amount of air flow rate (which iscaused by Cw(H) and the bay cross-sectional area) still increaseswith the size of the bay.
For the leeward bay, air flow is passively induced. There is amuch weaker stagnation region and at a lower heights than that onthe windward side. Thus, air is induced to enter the bay throughalmost the entire upper part of the building heights. Only atz/Ho0.2 that air flows out of the bay near the ground (Fig. 6(b)).Compared with the actively ventilated windward bay, a muchsmaller rate of air outflow occurs through the roof opening of theleeward bay. Another difference in Fig. 6(c) is that Cw(H) at the rearface decreases with the building height and increases with D/B. Thismay be because the passively induced flow is heavily affected bythe flow resistance through the bay.
-0.5
0.0
0.5
z=0.5H
y/B
x/B
-0.4
-0.4
-0.1
0.10.0 -0.2
0.5
0.7
-0.4
0.6
-0.4
0.5
0.4
0.5
0.8
0.9
0.3
-0.3
0.2
0.0
0.5
1.0
z/H
x/B
Cp1UH
-1.0 -0.5 0.0 0.5
-0.5 0.0 0.5
1.0
1UH
Fig. 5. Mean wind velocity vectors patterns and Cp contour on the major symmetry
flow planes of the 6B tall building with Case 9 re-entrant bays at wind angle 01:
(a) Horizontal plane at mid-height and (b) central vertical plane (vertical scale
compressed).
C.K.C. Cheng et al. / J. Wind Eng. Ind. Aerodyn. 99 (2011) 79–9084
Author's personal copy
4.2. Wind-induced natural ventilation of side re-entrant bays
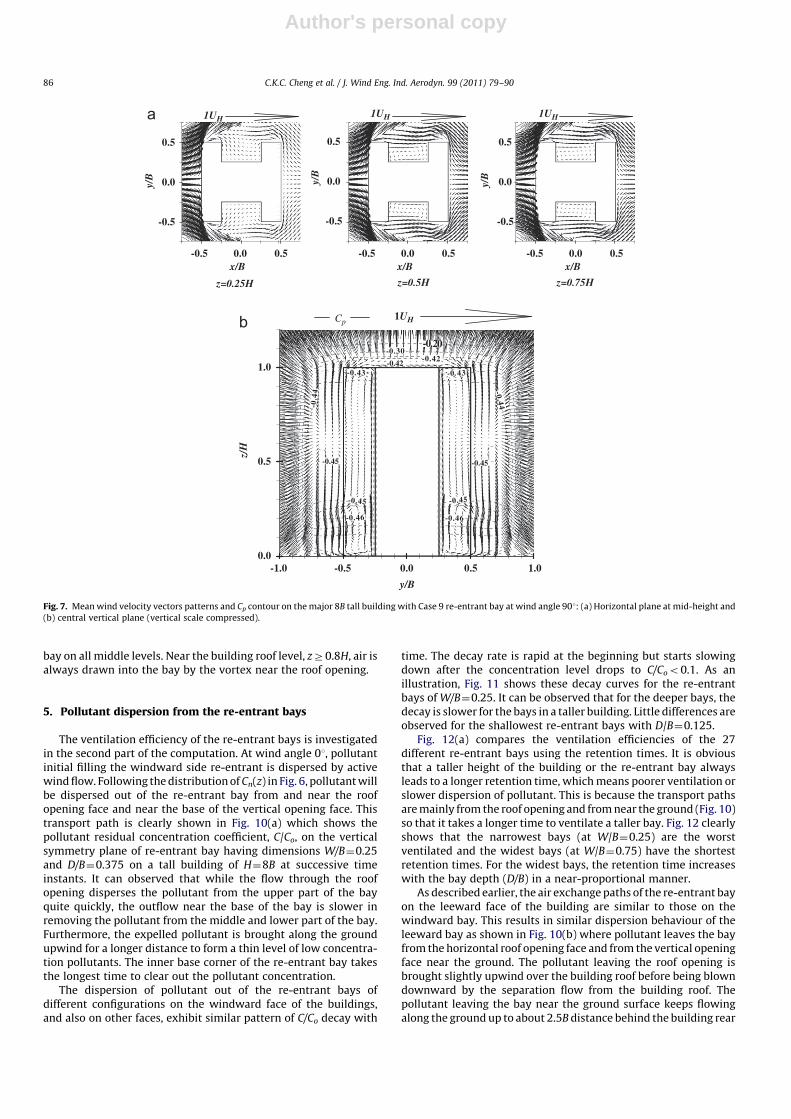
At wind angle 901, the two re-entrant bays are on the side facesof the building and fully immersed in the separation wake. Flowinside the bay is induced by the external wind flow and there is noactive ventilation of the bay. Our computed results show that theflow inside the bay is highly 3D and exhibit complex patterns withstrong dependence on the bay dimensions and building height.Fig. 7 shows, as an example, the mean flow patterns inside the re-entrant bay of size W/B¼0.75, D/B¼0.375 on a building of H¼8B.
Flow vectors on three horizontal planes at different heights areshown in Fig. 7(a), and the computed flow vectors of (v, w) on thevertical y–z plane at x¼0, that is the mid-width plane of the bays;are shown in Fig. 7(b). Results for other buildings are not shown butthe general observation is described.
At the two upper heights in Fig. 7(a), low-speed recirculatingflow on the horizontal plane is found inside the re-entrant bay.Inside a shallow and wide bay of D¼0.125B and W40.25B, thiscirculation vortex structure is poorly developed and occupiesa small region close to the leeward wall of the bay. When abay has an aspect ratio (W/D) near unity, the entire cross sectionof the bay is occupied by a well-developed circulation vortex.This well-developed vortex flow is observed on the taller buildingsat H/B¼6 and 8 but not on the shorter buildings. This may bedue to a change in vertical location of the vortex structure. At thelower height, the mean flow vectors in Fig. 7(a) do not show thepattern of a circulation vortex. This is generally observed at heightswhere there is significant fluid circulation on the vertical plane(Fig. 7(b)).
The flow vectors on the vertical plane in Fig. 7(b) show complexsecondary flow structures inside the re-entrant bay. These struc-tures have fluid circulation on the y–z plane; that is streamwisex-vorticity. The most obvious of these large-scale vortical struc-tures is found near the ground, at z/Ho0.3 in Fig. 7(b). This vortex isobserved inside almost all re-entrant bays under study and isparticularly well-developed in deeper bays and in taller buildings.Fluid circulation of this vortex brings in air from outside the baynear the ground and ejects air out of the bay at a higher level, atz/HE0.3 in Fig. 7(b). Presence of this vortex blocks the downwardflow stream from reaching the ground.
In terms of pressure distribution, the region next to the buildingside walls and inside the bay (at this plane of x¼0) is under quiteuniform wake pressure around CpE�0.45. Pressure at similarvalues is also found near above the building roof. On the buildingmid-height level, the pressure is slightly more negative and thiscauses flow to enter the re-entrant bay, at z/H between 0.4 and 0.8in Fig. 7(b). A stream of this flow goes down the bay and joins itselfinto the fluid circulation of the large secondary flow structure nearthe ground. Another stream of the entering flow goes up inside thebay and towards the roof opening. For a shallow re-entrant bay, thisflow escapes through the roof opening, leading to the ‘‘chimneyeffect’’. For a deeper bay such as the one in Fig. 7(b), however,escaping roof through the roof opening occurs in the outer part ofthe opening and some escaped flow is entrained back into the baythrough the inner part of the opening. This leads to anothersecondary-flow vortical structure with well-developed x-vorticitylocated near the roof opening.
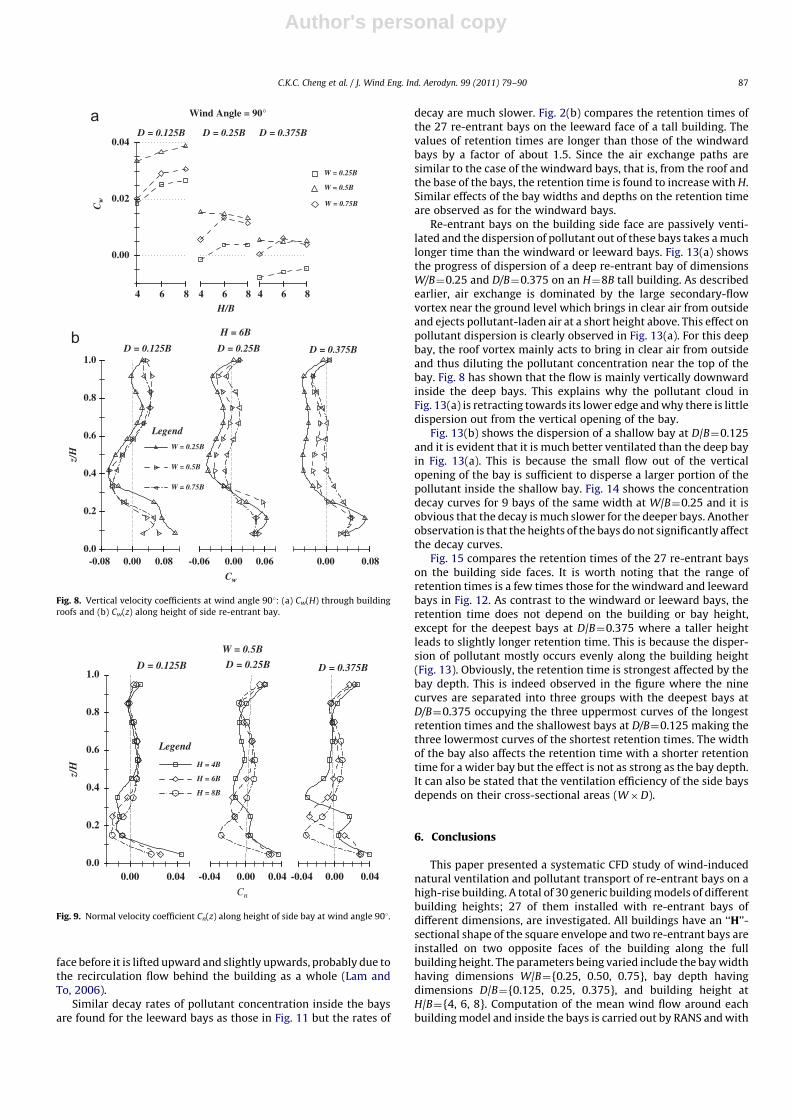
The vertical velocity coefficients at the roof, Cw(H), are shown inFig. 8(a). It is evident that the ‘‘chimney effect’’ flow out of the bayroof opening occurs only for the shallower bays at D¼0.125B. Thedistributions of vertical air transport inside the side re-entrant baysare shown by Cw(z) in Fig. 8(b), for buildings of height H¼6B. It isclear that flow inside the mid-height portion of the bays is in thedownward direction. The vertical distribution of air exchangebetween the bay and the wake region outside the building sideface is shown by the profiles of Cn(z) shown in Fig. 9. They are for are-entrant bay on the y side face of the building so that positivevalues of Cn(z) mean a net flow of air into the bay at that height. Ingeneral, the air exchange pattern along the building height isconsistent with the flow patterns described. The secondary-flowvortex at the base of the bay brings in air near the ground and ejectsair at some distances above ground. For the taller buildings, this airexchange occurs below z/Ho0.2–0.3 and at the building mid-height levels, slow rate of air flows into the bay. However, for theshorter buildings (H/B¼4), the ground vortex occupies a large sizeand reaching the building mid-height so that air flows out of the
0.0
0.2
0.4
0.6
0.8
1.0
z/H H = 4B
H = 6B
H = 8B
Legend
D = 0.125B D = 0.25B D = 0.375B
0.0
0.2
0.4
0.6
0.8
1.0
z/H
H = 4B
H = 6B
H = 8B
Legend
D = 0.125B D = 0.25B D = 0.375B
0.0
0.2
0.4
0.6
0.8
1.0D = 0.125B
H/B
D = 0.25B
4 6 8 4 6 8 4 6 8
D = 0.375B
W = 0.25B
W = 0.5B
W = 0.75B
Front face
Rear face
Cw
Wind Angle = 0°
W = 0.5B
-0.2 0.0 0.2Cn
-0.3 0.0 0.3 0.40.0-0.4
W = 0.5B
-0.1 0.0 0.1
Cn
0.0 0.2 -0.2 0.0 0.2
Fig. 6. Velocity coefficients for windward and leeward re-entrant bays at wind
angle 01: (a) Cn(z) for windward bays; (b) Cn(z) for leeward bays; and (c) Cw(H)
through building roofs.
C.K.C. Cheng et al. / J. Wind Eng. Ind. Aerodyn. 99 (2011) 79–90 85
Author's personal copy
bay on all middle levels. Near the building roof level, zZ0.8H, air isalways drawn into the bay by the vortex near the roof opening.
5. Pollutant dispersion from the re-entrant bays
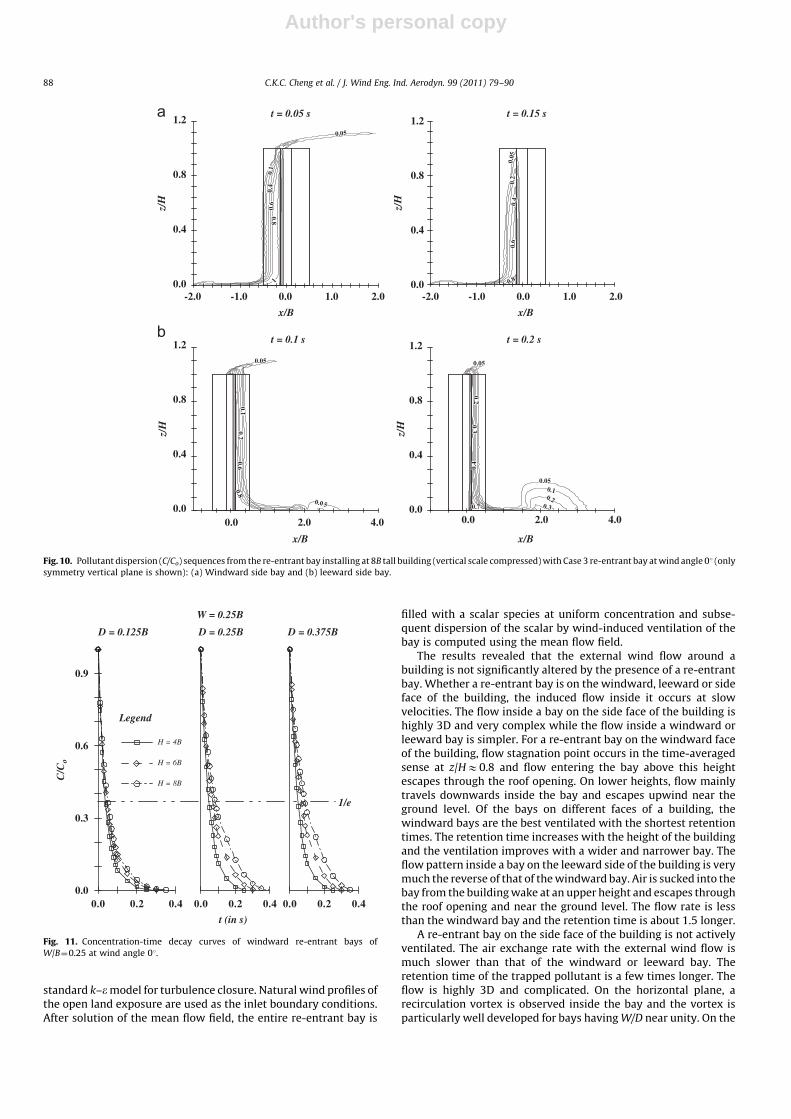
The ventilation efficiency of the re-entrant bays is investigatedin the second part of the computation. At wind angle 01, pollutantinitial filling the windward side re-entrant is dispersed by activewind flow. Following the distribution of Cn(z) in Fig. 6, pollutant willbe dispersed out of the re-entrant bay from and near the roofopening face and near the base of the vertical opening face. Thistransport path is clearly shown in Fig. 10(a) which shows thepollutant residual concentration coefficient, C/Co, on the verticalsymmetry plane of re-entrant bay having dimensions W/B¼0.25and D/B¼0.375 on a tall building of H¼8B at successive timeinstants. It can observed that while the flow through the roofopening disperses the pollutant from the upper part of the bayquite quickly, the outflow near the base of the bay is slower inremoving the pollutant from the middle and lower part of the bay.Furthermore, the expelled pollutant is brought along the groundupwind for a longer distance to form a thin level of low concentra-tion pollutants. The inner base corner of the re-entrant bay takesthe longest time to clear out the pollutant concentration.
The dispersion of pollutant out of the re-entrant bays ofdifferent configurations on the windward face of the buildings,and also on other faces, exhibit similar pattern of C/Co decay with
time. The decay rate is rapid at the beginning but starts slowingdown after the concentration level drops to C/Coo0.1. As anillustration, Fig. 11 shows these decay curves for the re-entrantbays of W/B¼0.25. It can be observed that for the deeper bays, thedecay is slower for the bays in a taller building. Little differences areobserved for the shallowest re-entrant bays with D/B¼0.125.
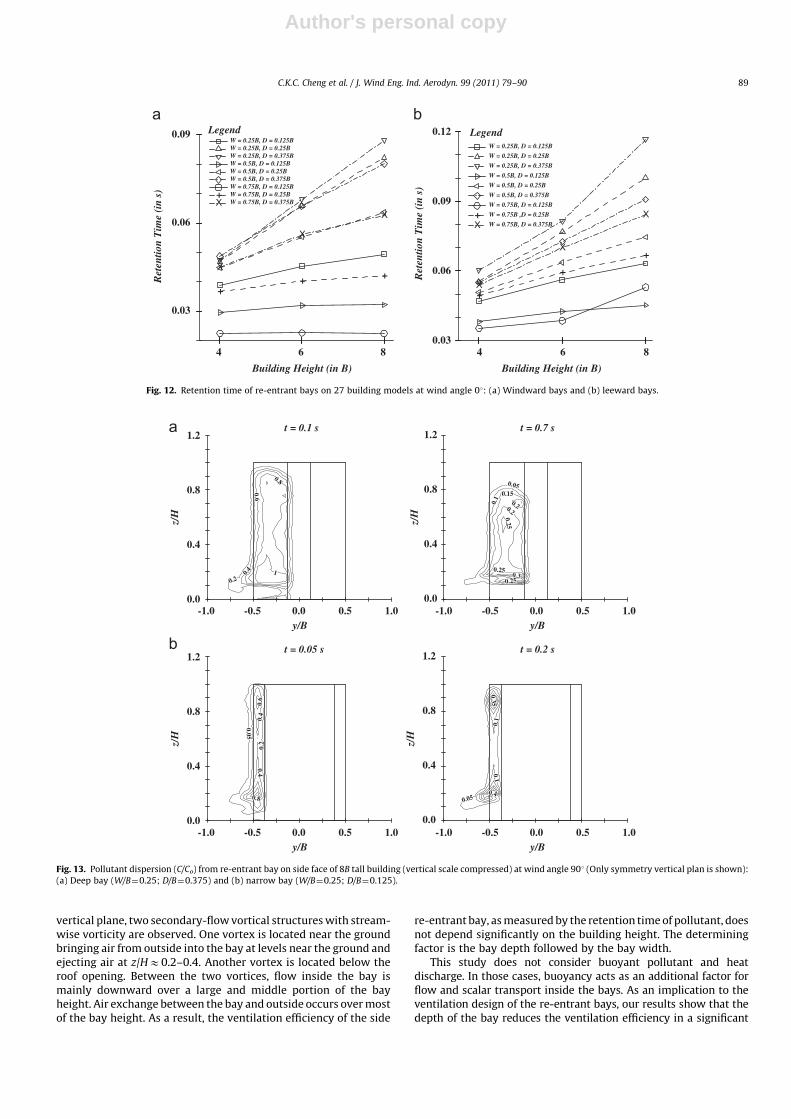
Fig. 12(a) compares the ventilation efficiencies of the 27different re-entrant bays using the retention times. It is obviousthat a taller height of the building or the re-entrant bay alwaysleads to a longer retention time, which means poorer ventilation orslower dispersion of pollutant. This is because the transport pathsare mainly from the roof opening and from near the ground (Fig. 10)so that it takes a longer time to ventilate a taller bay. Fig. 12 clearlyshows that the narrowest bays (at W/B¼0.25) are the worstventilated and the widest bays (at W/B¼0.75) have the shortestretention times. For the widest bays, the retention time increaseswith the bay depth (D/B) in a near-proportional manner.
As described earlier, the air exchange paths of the re-entrant bayon the leeward face of the building are similar to those on thewindward bay. This results in similar dispersion behaviour of theleeward bay as shown in Fig. 10(b) where pollutant leaves the bayfrom the horizontal roof opening face and from the vertical openingface near the ground. The pollutant leaving the roof opening isbrought slightly upwind over the building roof before being blowndownward by the separation flow from the building roof. Thepollutant leaving the bay near the ground surface keeps flowingalong the ground up to about 2.5B distance behind the building rear
-0.5
0.0
0.5
z=0.25H
y/B
x/B
1UH
-0.5
0.0
0.5
z=0.5H
y/B
1UH
-0.5
0.0
0.5
z=0.75H
y/B
1UH
-0.30
-0.43
-0.20
-0.43
-0.4
4
-0.45 -0.45
-0.44
-0.42-0.42
-0.45
-0.46
-0.45
-0.46
-1.0 -0.5 0.0 0.5 1.00.0
0.5
1.0
z/H
y/B
1UHCp
-0.5 0.0 0.5x/B
-0.5 0.0 0.5x/B
-0.5 0.0 0.5
Fig. 7. Mean wind velocity vectors patterns and Cp contour on the major 8B tall building with Case 9 re-entrant bay at wind angle 901: (a) Horizontal plane at mid-height and
(b) central vertical plane (vertical scale compressed).
C.K.C. Cheng et al. / J. Wind Eng. Ind. Aerodyn. 99 (2011) 79–9086
Author's personal copy
face before it is lifted upward and slightly upwards, probably due tothe recirculation flow behind the building as a whole (Lam andTo, 2006).
Similar decay rates of pollutant concentration inside the baysare found for the leeward bays as those in Fig. 11 but the rates of
decay are much slower. Fig. 2(b) compares the retention times ofthe 27 re-entrant bays on the leeward face of a tall building. Thevalues of retention times are longer than those of the windwardbays by a factor of about 1.5. Since the air exchange paths aresimilar to the case of the windward bays, that is, from the roof andthe base of the bays, the retention time is found to increase with H.Similar effects of the bay widths and depths on the retention timeare observed as for the windward bays.
Re-entrant bays on the building side face are passively venti-lated and the dispersion of pollutant out of these bays takes a muchlonger time than the windward or leeward bays. Fig. 13(a) showsthe progress of dispersion of a deep re-entrant bay of dimensionsW/B¼0.25 and D/B¼0.375 on an H¼8B tall building. As describedearlier, air exchange is dominated by the large secondary-flowvortex near the ground level which brings in clear air from outsideand ejects pollutant-laden air at a short height above. This effect onpollutant dispersion is clearly observed in Fig. 13(a). For this deepbay, the roof vortex mainly acts to bring in clear air from outsideand thus diluting the pollutant concentration near the top of thebay. Fig. 8 has shown that the flow is mainly vertically downwardinside the deep bays. This explains why the pollutant cloud inFig. 13(a) is retracting towards its lower edge and why there is littledispersion out from the vertical opening of the bay.
Fig. 13(b) shows the dispersion of a shallow bay at D/B¼0.125and it is evident that it is much better ventilated than the deep bayin Fig. 13(a). This is because the small flow out of the verticalopening of the bay is sufficient to disperse a larger portion of thepollutant inside the shallow bay. Fig. 14 shows the concentrationdecay curves for 9 bays of the same width at W/B¼0.25 and it isobvious that the decay is much slower for the deeper bays. Anotherobservation is that the heights of the bays do not significantly affectthe decay curves.
Fig. 15 compares the retention times of the 27 re-entrant bayson the building side faces. It is worth noting that the range ofretention times is a few times those for the windward and leewardbays in Fig. 12. As contrast to the windward or leeward bays, theretention time does not depend on the building or bay height,except for the deepest bays at D/B¼0.375 where a taller heightleads to slightly longer retention time. This is because the disper-sion of pollutant mostly occurs evenly along the building height(Fig. 13). Obviously, the retention time is strongest affected by thebay depth. This is indeed observed in the figure where the ninecurves are separated into three groups with the deepest bays atD/B¼0.375 occupying the three uppermost curves of the longestretention times and the shallowest bays at D/B¼0.125 making thethree lowermost curves of the shortest retention times. The widthof the bay also affects the retention time with a shorter retentiontime for a wider bay but the effect is not as strong as the bay depth.It can also be stated that the ventilation efficiency of the side baysdepends on their cross-sectional areas (W�D).
6. Conclusions
This paper presented a systematic CFD study of wind-inducednatural ventilation and pollutant transport of re-entrant bays on ahigh-rise building. A total of 30 generic building models of differentbuilding heights; 27 of them installed with re-entrant bays ofdifferent dimensions, are investigated. All buildings have an ‘‘H’’-sectional shape of the square envelope and two re-entrant bays areinstalled on two opposite faces of the building along the fullbuilding height. The parameters being varied include the bay widthhaving dimensions W/B¼{0.25, 0.50, 0.75}, bay depth havingdimensions D/B¼{0.125, 0.25, 0.375}, and building height atH/B¼{4, 6, 8}. Computation of the mean wind flow around eachbuilding model and inside the bays is carried out by RANS and with
0.00
0.02
0.04
Cw
D = 0.125B
H/B
D = 0.25B D = 0.375B
W = 0.25B
W = 0.5B
W = 0.75B
Legend
H = 6B
Cw
0.0
0.2
0.4
0.6
0.8
1.0
z/H
D = 0.125B D = 0.25B
4 6 8 4 6 8 4 6 8
D = 0.375B
W = 0.25B
W = 0.5B
W = 0.75B
-0.08 0.00 0.08 -0.06 0.00 0.06 0.00 0.08
Wind Angle = 90°
Fig. 8. Vertical velocity coefficients at wind angle 901: (a) Cw(H) through building
roofs and (b) Cw(z) along height of side re-entrant bay.
H = 4B
H = 6B
H = 8B
Legend
D = 0.125B D = 0.25B D = 0.375B
0.0
0.2
0.4
0.6
0.8
1.0
z/H
W = 0.5B
Cn
0.00 0.04 -0.04 0.00 0.04 -0.04 0.00 0.04
Fig. 9. Normal velocity coefficient Cn(z) along height of side bay at wind angle 901.
C.K.C. Cheng et al. / J. Wind Eng. Ind. Aerodyn. 99 (2011) 79–90 87
Author's personal copy
standard k–emodel for turbulence closure. Natural wind profiles ofthe open land exposure are used as the inlet boundary conditions.After solution of the mean flow field, the entire re-entrant bay is
filled with a scalar species at uniform concentration and subse-quent dispersion of the scalar by wind-induced ventilation of thebay is computed using the mean flow field.
The results revealed that the external wind flow around abuilding is not significantly altered by the presence of a re-entrantbay. Whether a re-entrant bay is on the windward, leeward or sideface of the building, the induced flow inside it occurs at slowvelocities. The flow inside a bay on the side face of the building ishighly 3D and very complex while the flow inside a windward orleeward bay is simpler. For a re-entrant bay on the windward faceof the building, flow stagnation point occurs in the time-averagedsense at z/HE0.8 and flow entering the bay above this heightescapes through the roof opening. On lower heights, flow mainlytravels downwards inside the bay and escapes upwind near theground level. Of the bays on different faces of a building, thewindward bays are the best ventilated with the shortest retentiontimes. The retention time increases with the height of the buildingand the ventilation improves with a wider and narrower bay. Theflow pattern inside a bay on the leeward side of the building is verymuch the reverse of that of the windward bay. Air is sucked into thebay from the building wake at an upper height and escapes throughthe roof opening and near the ground level. The flow rate is lessthan the windward bay and the retention time is about 1.5 longer.
A re-entrant bay on the side face of the building is not activelyventilated. The air exchange rate with the external wind flow ismuch slower than that of the windward or leeward bay. Theretention time of the trapped pollutant is a few times longer. Theflow is highly 3D and complicated. On the horizontal plane, arecirculation vortex is observed inside the bay and the vortex isparticularly well developed for bays having W/D near unity. On the
0.1
0.4
0.8
10.
6
0.05
0.0
0.4
0.8
1.2
z/H
t = 0.05 s
x/B
0.2
0.4
0.6
0.8
0.05
0.0
0.4
0.8
1.2
z/H
t = 0.15 s
x/B
0.10.8
0.20. 6
0.05
0.050.0
0.4
0.8
1.2
z/H
t = 0.1 s
x/B
0.20. 3
04.
0.05
0.7
0.050.10.2
0.30.0
0.4
0.8
1.2
z/H
t = 0.2 s
x/B
0.0 2.0 4.0 4.02.00.0
-2.0 -1.0 0.0 1.0 2.0 -2.0 -1.0 0.0 1.0 2.0
Fig. 10. Pollutant dispersion (C/Co) sequences from the re-entrant bay installing at 8B tall building (vertical scale compressed) with Case 3 re-entrant bay at wind angle 01 (only
symmetry vertical plane is shown): (a) Windward side bay and (b) leeward side bay.
H = 4B
H = 6B
H = 8B
Legend
1/e
W = 0.25B
t (in s)
D = 0.125B D = 0.25B D = 0.375B
0.0
0.3
0.6
0.9
0.0 0.2 0.4 0.0 0.2 0.4 0.0 0.2 0.4
C/C
o
Fig. 11. Concentration-time decay curves of windward re-entrant bays of
W/B¼0.25 at wind angle 01.
C.K.C. Cheng et al. / J. Wind Eng. Ind. Aerodyn. 99 (2011) 79–9088
Author's personal copy
vertical plane, two secondary-flow vortical structures with stream-wise vorticity are observed. One vortex is located near the groundbringing air from outside into the bay at levels near the ground andejecting air at z/HE0.2–0.4. Another vortex is located below theroof opening. Between the two vortices, flow inside the bay ismainly downward over a large and middle portion of the bayheight. Air exchange between the bay and outside occurs over mostof the bay height. As a result, the ventilation efficiency of the side
re-entrant bay, as measured by the retention time of pollutant, doesnot depend significantly on the building height. The determiningfactor is the bay depth followed by the bay width.
This study does not consider buoyant pollutant and heatdischarge. In those cases, buoyancy acts as an additional factor forflow and scalar transport inside the bays. As an implication to theventilation design of the re-entrant bays, our results show that thedepth of the bay reduces the ventilation efficiency in a significant
++ +
X
X
X
864
0.03
0.06
0.09W = 0.25B, D = 0.125BW = 0.25B, D = 0.25BW = 0.25B, D = 0.375BW = 0.5B, D = 0.125BW = 0.5B, D = 0.25BW = 0.5B, D = 0.375BW = 0.75B, D = 0.125BW = 0.75B, D = 0.25BW = 0.75B, D = 0.375B
+X
Ret
entio
n T
ime
(in
s)
Ret
entio
n T
ime
(in
s)
Building Height (in B) Building Height (in B)
Legend
+
+
+
X
X
X
8640.03
0.06
0.09
0.12W = 0.25B, D = 0.125B
W = 0.25B, D = 0.25B
W = 0.25B, D = 0.375B
W = 0.5B, D = 0.125B
W = 0.5B, D = 0.25B
W = 0.5B, D = 0.375B
W = 0.75B, D = 0.125B
W = 0.75B ,D = 0.25B
W = 0.75B, D = 0.375B+X
Legend
Fig. 12. Retention time of re-entrant bays on 27 building models at wind angle 01: (a) Windward bays and (b) leeward bays.
0.2
0.6
0.8
0.4 1
0.0
0.4
0.8
1.2
z/H
t = 0.1 s
0.050.
10.15
0.20.2
0.25
0.250.3
0.25
0.0
0.4
0.8
1.2
z/H
t = 0.7 s
0.05
0.2
0.4
0.4
0.6
0.8
0.0
0.4
0.8
1.2
z/H
t = 0.05 s
y/B
0.05
0.1
0.1
0.4
0.35
0.0
0.4
0.8
1.2
z/H
t = 0.2 s
-1.0 -0.5 0.0 0.5 1.0y/B
-1.0 -0.5 0.0 0.5 1.0
y/B-1.0 -0.5 0.0 0.5 1.0
y/B-1.0 -0.5 0.0 0.5 1.0
Fig. 13. Pollutant dispersion (C/Co) from re-entrant bay on side face of 8B tall building (vertical scale compressed) at wind angle 901 (Only symmetry vertical plan is shown):
(a) Deep bay (W/B¼0.25; D/B¼0.375) and (b) narrow bay (W/B¼0.25; D/B¼0.125).
C.K.C. Cheng et al. / J. Wind Eng. Ind. Aerodyn. 99 (2011) 79–90 89

Author's personal copy
manner. The bays on the building side face are much worseventilated than the windward or leeward bays but their ventilationefficiency is not affected by the building height which plays agoverning effect on the pollutant dispersion for the later two types ofre-entrant bays. In general, air exchange and pollutant dispersion arethe worst in taller and deeper bays. In these conditions, wind-induced flow by the natural wind might not be able to take awayharmful gaseous discharges or waste heat from the bays. In the worstcase, disastrous events like the Amoy Garden Crises would result.Therefore, it will be suggested that to deploy a shallow recessedre-entrant bay, say depth not larger than 1/8 the building breadth.
Acknowledgements
This investigation was supported by a Grant awarded by theResearch Grants Council of Hong Kong (HKU/713507). The CFDresource is partially supported by the centre of Applied Computingand Interactive Media, City University of Hong Kong.
References
Aldawoud, A., Clark, R., 2008. Comparative analysis of energy performance betweencourtyard and atrium in buildings. Energy and Buildings 40 (3), 209–214.
Ansys CFX-Solver Theory Guide, 2009. Turbulence and wall function, pp. 53–54(Chapter 2).
Cheng, C.K., Yuen, K.K., Lam, K.M., Lo, S.M., 2005. CFD wind tunnel test: field velocitypatterns of wind on a building with a refuge floor. International Journal ofComputational Fluid Dynamics 19 (7), 531–544.
Cheng, C.K., Lam, K.M., Yuen, K.K., Lo, S.M., Liang, J., 2007. A study of naturalventilation in a refuge floor. Building and Environment 42 (9), 3322–3332.
Cheng, C.K., Lam, K.M., Demirbilek, F.N., 2008. Effects of building wall arrangementson wind-induced ventilation through the refuge floor of a tall building. Journal ofWind Engineering and Industrial Aerodynamics 96 (5), 656–664.
Cheng, C.K., 2009. A fire safety of Hong Kong refuge floor building wall layout design.Fire Safety Journal 44 (4), 545–558.
Chow, T.T., Lin, Z., Liu, J.P., 2002. Effect of condensing unit operation on kitchenexhaust at residential tower. Journal of Architectural Science Review 45, 3–12.
Cook, N.J., 1985. The Designer’s Guide to Wind Loading of Building Structure, Part II:Static Structures. Building Research Establishment, Watford.
Gomes, M.G., Rodrigues, A.M., Mendes, P., 2005. Experimental and numerical studyof wind pressures on irregular-plan shapes. Journal of Wind Engineering andIndustrial Aerodynamics 93 (10), 741–756.
Higson, H.L., Griffiths, R.F., Jones, C.D., Hall, D.J., 1996. Flow and dispersion around anisolated building. Atmospheric Environment 30 (16), 2859–2870.
Hong Kong Government, 2004. Outbreak at the Amoy Garden. Report of the SelectCommittee to inquire into the handling of the Severe Acute RespiratorySyndrome outbreak by the Government and the Hospital Authority. Availablefrom: /http://www.legco.gov.hk/yr03-04/english/sc/sc_sars/report/ch8.pdfS.
Kijewski, T., Kareem, A., 1998. Dynamic wind effects: a comparative study ofprovisions in codes and standards with wind tunnel data. Wind and Structures 1(1), 77–109.
Lam, K.M., To, A.P., 2006. Reliability of numerical computation of pedestrian levelwind environment around a row of tall buildings. Wind and Structures 9 (6),473–492.
Lam, K.M., Leung, M.Y.H., Zhao, J.G., 2008. Interference effects on wind loading of arow of closely spaced tall buildings. Journal of Wind Engineering and IndustrialAerodynamics 96 (5), 562–583.
Launder, B.E., Spalding, D.B., 1974. The numerical computation of turbulent flows.Computer Methods in Applied Mechanics and Engineering 3, 269–289.
Rajapaksha, I., Nagai, H., Okumiya, M., 2003. A ventilated courtyard as a passive coolingstrategy in the warm humid tropics. Renewable Energy 28 (11), 1755–1778.
Santos, J.M., Griffiths, R.F., Robert, I.D., Reis Jr., N.C., 2005. A field experiment onturbulent concentration fluctuations of an atmospheric tracer gas in the vicinityof a complex-shaped building. Atmospheric Environment 39 (28), 4999–5012.
Sharples, S., Bensalem, R., 2001. Airflow in courtyard and atrium buildings in theurban environment: a wind tunnel study. Solar Energy 70 (3), 237–244.
Tominaga, Y., Mochida, A., Yoshie, R., Kataoka, H., Nozu, Tsuyoshi, Yoshikawa, M.,2008. AIJ guidelines for practical applications of CFD to pedestrian windenvironment around buildings. Journal of Wind Engineering and IndustrialAerodynamics 96 (10–11), 1749–1761.
Yeoh, E.K., 2003. Severe Acute Respiratory Syndrome: Response from Hong Kong.Hong Kong Government Available from: /http://www.who.int/csr/sars/conference/june_2003/materials/presentations/en/sarshksar17063.pdfS.
Yim, S.H.L., Fung, J.C.H., Lau, A.K.H., Kot, S.C., 2009. Air ventilation impacts of the‘‘wall effect’’ resulting from the alignment of high-rise buildings. AtmosphericEnvironment 43 (32), 2894–2982.
Yu, T.S., Li, Y.G., Wong, T.W., Tam, W., Chan, A.T., Lee, J.H.W., Leung, D.Y.C., Ho, T.,2004. Evidence of airborne transmission of the severe acute respiratorysyndrome virus. New England Journal of Medicine 350 (17), 731–1739.
Zhou, Y., Kijewski, T., Kareem, A., 2003. Aerodynamic loadings: interactive database.Journal of Structural Engineering—ASCE March, 394–404.
H = 4B
H = 6B
H = 8B
Legend
1/e
W = 0.25B
C/C
o
t (in s)
D = 0.125B D = 0.25B D = 0.375B
0.0
0.3
0.6
0.9
0.0 0.2 0.4 0.0 1.0 0.0 1.0
Fig. 14. Concentration-time decay curves of re-entrant bays of W/B¼0.25 on side
faces of buildings at wind angle 901.
+ + +
XX X
864
0.10
0.20
0.30
Ret
entio
n T
ime
(in
s)
Building Height (in B)
W = 0.25B, D = 0.125BW = 0.25B, D = 0.25BW = 0.25B, D = 0.375BW = 0.5B, D = 0.125BW = 0.5B, D = 0.25BW = 0.5B, D = 0.375BW = 0.75B, D = 0.125BW = 0.75B, D = 0.25BW = 0.75B, D = 0.375B
+X
Legend
Fig. 15. Retention time of re-entrant bays on side faces of 27 building models at
wind angle 901.
C.K.C. Cheng et al. / J. Wind Eng. Ind. Aerodyn. 99 (2011) 79–9090