Theoretical and experimental investigation of impinging jet ventilation and comparison with wall...
14
Building and Environment 37 (2002) 1329 – 1342 www.elsevier.com/locate/buildenv Theoretical and experimental investigation of impinging jet ventilation and comparison with wall displacement ventilation T. Karimipanah a , H.B. Awbi b; ∗ a Air Innovation AB, Sweden b Indoor Environment and Energy Research Group, Department of Construction Management and Engineering, The University of Reading, Reading RG6 6AW, UK Received 2 August 2001; received in revised form 1 October 2001; accepted 18 October 2001 Abstract This paper focuses on evaluating the performance of a new impinging jet ventilation system and compares its performance with a wall displacement ventilation system. Experimental data for an impinging jet in a room are presented and non-dimensional expressions for the decay of maximum velocity over the oor are derived. In addition, the ventilation eciency, local mean age of air and other characteristic parameters were experimentally and numerically obtained for a mock-up classroom ventilated with the two systems. The internal heat loads from 25 person-simulators and lighting were used in the measurements and simulations to provide a severe test for the two types of ventilation systems. In addition to a large number of experimental data CFD simulations were used to study certain parameters in more detail. The results presented here are part of a larger research programme to develop alternative and ecient systems for room ventilation. ? 2002 Elsevier Science Ltd. All rights reserved. Keywords: Impinging jet ventilation; Displacement ventilation; Classroom ventilation; Air jets; Room air movement; CFD 1. Introduction Although the traditional mixing systems have poor ventilation eciency and are less energy ecient, they still occupy a large portion of the market. When displacement ventilation (DV) was rst introduced almost three decades ago, it seemed at the time to be a promising ventilation concept due to its high ventilation eciency and strati- cation principle. In DV systems, cool air supplied at low level is entrained by plumes rising from heat sources in the room. To create an eective ventilation system in the occupied zone, there should be a balance between the mo- mentum in the supply air and thermal (buoyancy) forces due to heat sources. In this low momentum displacement ow, the buoyancy forces created by heat sources have a tendency to take over and thus often causing poor venti- lation eciency in some zones of the room [1]. Another disadvantage of a displacement system is that it can only be used for cooling and is not suitable for winter heating. To overcome this problem new systems like ceiling mounted ∗ Corresponding author. Tel.: +44-118-931-6786; fax: 44-118-931- 3856. E-mail address: [email protected] (H.B. Awbi). textile bag supply and down-to-oor impinging supply have been developed, see Ref. [2]. A new method of air distribution known as the Air Queen (AQ) has been developed in Sweden, which is based on im- pinging jet ventilation (IJV) [3]. This method is based on the principle of supplying a jet of air with high momentum downwards onto the oor. As the jet impinges onto the oor it spreads over a large area causing the jet momentum to re- cede but still has a sucient force to reach long distances. Unlike the DV system which “oods” the oor with supply air, the resulting ow from an IJV is a very thin layer of air over the oor. This method has the advantages of both the mixing and displacement ventilation systems without known disadvantages. Impinging jet ventilation has lower momen- tum than mixing and higher momentum than wall displace- ment ventilation (WDV), i.e. when the air terminal unit is wall mounted at low level. Although higher momentum than WDV, IJV produces a similar ow eld and has, therefore, promising applications [2,4]. 2. Properties of impinging jet The impingement of a turbulent jet on a at plate (wall) has been widely studied with dierent congurations. In all 0360-1323/02/$ - see front matter ? 2002 Elsevier Science Ltd. All rights reserved. PII:S0360-1323(01)00117-2
-
Upload
uomustansiriyah -
Category
Documents
-
view
2 -
download
0
Transcript of Theoretical and experimental investigation of impinging jet ventilation and comparison with wall...

Building and Environment 37 (2002) 1329–1342www.elsevier.com/locate/buildenv
Theoretical and experimental investigation of impinging jet ventilationand comparison with wall displacement ventilation
T. Karimipanaha, H.B. Awbib; ∗
aAir Innovation AB, SwedenbIndoor Environment and Energy Research Group, Department of Construction Management and Engineering, The University of Reading,
Reading RG6 6AW, UK
Received 2 August 2001; received in revised form 1 October 2001; accepted 18 October 2001
Abstract
This paper focuses on evaluating the performance of a new impinging jet ventilation system and compares its performance with a walldisplacement ventilation system. Experimental data for an impinging jet in a room are presented and non-dimensional expressions for thedecay of maximum velocity over the 0oor are derived. In addition, the ventilation e2ciency, local mean age of air and other characteristicparameters were experimentally and numerically obtained for a mock-up classroom ventilated with the two systems. The internal heatloads from 25 person-simulators and lighting were used in the measurements and simulations to provide a severe test for the two types ofventilation systems. In addition to a large number of experimental data CFD simulations were used to study certain parameters in moredetail. The results presented here are part of a larger research programme to develop alternative and e2cient systems for room ventilation.? 2002 Elsevier Science Ltd. All rights reserved.
Keywords: Impinging jet ventilation; Displacement ventilation; Classroom ventilation; Air jets; Room air movement; CFD
1. Introduction
Although the traditional mixing systems have poorventilation e2ciency and are less energy e2cient, they stilloccupy a large portion of the market. When displacementventilation (DV) was <rst introduced almost three decadesago, it seemed at the time to be a promising ventilationconcept due to its high ventilation e2ciency and strati<-cation principle. In DV systems, cool air supplied at lowlevel is entrained by plumes rising from heat sources inthe room. To create an e=ective ventilation system in theoccupied zone, there should be a balance between the mo-mentum in the supply air and thermal (buoyancy) forcesdue to heat sources. In this low momentum displacement0ow, the buoyancy forces created by heat sources have atendency to take over and thus often causing poor venti-lation e2ciency in some zones of the room [1]. Anotherdisadvantage of a displacement system is that it can only beused for cooling and is not suitable for winter heating. Toovercome this problem new systems like ceiling mounted
∗ Corresponding author. Tel.: +44-118-931-6786; fax: 44-118-931-3856.E-mail address: [email protected] (H.B. Awbi).
textile bag supply and down-to-0oor impinging supply havebeen developed, see Ref. [2].A new method of air distribution known as the Air Queen
(AQ) has been developed in Sweden, which is based on im-pinging jet ventilation (IJV) [3]. This method is based onthe principle of supplying a jet of air with high momentumdownwards onto the 0oor. As the jet impinges onto the 0oorit spreads over a large area causing the jet momentum to re-cede but still has a su2cient force to reach long distances.Unlike the DV system which “0oods” the 0oor with supplyair, the resulting 0ow from an IJV is a very thin layer of airover the 0oor. This method has the advantages of both themixing and displacement ventilation systems without knowndisadvantages. Impinging jet ventilation has lower momen-tum than mixing and higher momentum than wall displace-ment ventilation (WDV), i.e. when the air terminal unit iswall mounted at low level. Although higher momentum thanWDV, IJV produces a similar 0ow <eld and has, therefore,promising applications [2,4].
2. Properties of impinging jet
The impingement of a turbulent jet on a 0at plate (wall)has been widely studied with di=erent con<gurations. In all
0360-1323/02/$ - see front matter ? 2002 Elsevier Science Ltd. All rights reserved.PII: S0360 -1323(01)00117 -2

1330 T. Karimipanah, H.B. Awbi / Building and Environment 37 (2002) 1329–1342
Nomenclature
(The International system of units (SI) is used through-out this paper)Aout Supply outlet area (m2)Ci Inlet contaminant concentration (ppm)Co Outlet contaminant concentration (ppm)IJV Impinging jet ventilation (dimensionless)To Outlet temperature (◦C)Ti Inlet temperature (◦C)U Air velocity in radial direction (m=s)Uo Air velocity at supply outlet (m=s)Uc Jet centreline velocity (m=s)Umax Maximum air velocity at di=erent positions from
0oor (m=s)WDV Wall displacement ventilation (dimensionless)d Supply outlet diameter (m)h Impingement height from 0oor level (m)
qv Supply air0ow rate (m3=s)x Radial distance from the jet impingement point
to measuring point (m)x0 Radial distance from the jet impingement point
to the virtual origin (m)y Vertical distance from 0oor (m)y1=2 The height from 0oor corresponding to half of
the maximum air velocity (m)�c Ventilation e=ectiveness for contaminant re-
moval (%)�t Ventilation e=ectiveness for heat distribution=
removal (%)DV Displacement ventilationPMV Predicted mean votePPD Predicted percentage of dissatis<ed (%)r Radius of supply outlet (m)
early investigations, the prediction of the momentum 0uxfollows the same procedure as in a classical boundary layer.The impinging jet is an interesting test case due to its di=er-ent 0ow regions (i.e. the potential core region, the free jetregion, the impinging or 0ow de0ection region and the walljet region).Some early and recent investigators have also studied the
free and impinging jet phenomena. Beltaos and Rajaratnam[5] provided detailed results for the impingement region andenlarged the scope of the results which were available inthe free jet and wall jet regions. Gutmark et al. [6] pre-sented an experimental study of the turbulent structure onthe centre-line of a two-dimensional impinging jet. Theypointed out that the impingement of the jet is not a=ectedby the presence of the plate over 75% of the distance be-tween the nozzle and the plate and also the turbulent prop-erties of the jet change from their equilibrium level closeto the impingement region. The impinging jet is somewhatsimilar to a stagnation 0ow in which an in<nite stream im-pinges on a <nite body. In our investigation we used theimpinging jet con<guration shown in Fig. 1. The 0ow <eldis divided into three regions, see also Ref. [5]: (i) a freejet region, (ii) the impingement region and (iii) the walljet region. There are also transitional zones between theseregions.The numerical analysis and development of impinging
0ows have received large attention, not because of theirsimplicity, but due to the presence of di=erent 0ow regions.However, the result from the analysis may depend on theturbulence model used.A jet approaching a plate will at some distance from the
plate begin to “feel” the presence of the plate. For examplethe mean velocity on the centre line is similar to a free jetup to some distance and then decreases (faster) to the zero
value at the impingement point, see Fig. 2. The distancefrom the plate where the centre line velocity starts to deviatefrom the free jet curve is taken as the location of the endof the free jet region and the beginning of the impingementregion. From the <gure one can see that the e=ect of theplate is felt when the distance from the plate is ¡ 0:14h,which is in agreement with the results obtained by Bealtosand Rajaratnam [5].
Fig. 1. Impinging jet con<guration.

T. Karimipanah, H.B. Awbi / Building and Environment 37 (2002) 1329–1342 1331
Fig. 2. Decay of centre line velocity with di=erent impingement heights(d = 25 mm).
3. Impinging jet ventilation system
A test method has been developed for impinging jet sup-ply devices, which is based on the radial impinging jettheory, see Ref. [7]. It was based on the assumption thatthe velocity distributions on the impinging surface have thesame pro<les as the wall jet region illustrated in Fig. 3.Independent tests show that the radial velocity (U ) in they-direction with di=erent radial distances from the origingive a similar velocity pro<le described in dimensionlessform, see Ref. [8].Using these similarity criteria, the following proportion-
ality relation is obtained:
log(UmaxUo
)˙ log
(x√Aout
); (1)
where Umax is the maximum velocity in radial direction fora speci<c point located at horizontal distance x from origin(impingement point), Uo is supply velocity and Aout is thesupply outlet area.
Fig. 3. Radial jet impinging on a 0at plate.
The resulting empirical relation based on the measuredUmax at di=erent distance (x) in the radial direction, can givea basis for use of impinging jet supply system.
3.1. Methodology and test conditions
Velocity <eld measurements were carried out in a testroom (“classroom”) at the Centre fQor Built Environ-ment in GQavle, Sweden. The supply device “Air Queen”model AQ-D54=24 was used in the tests. Two impinge-ment heights of 300 and 950 mm were studied, seeFig. 4(a).The aim of velocity measurements was to establish a ba-
sis of dimensioning physical parameters for design purposesof the impinging jet supply. This was to investigate the vari-ation of the maximum air velocity on the 0oor with thejet outlet velocity and to establish the vertical height abovethe 0oor where this maximum occurs as this will be impor-tant for draught considerations. The tests were also aimedto show the in0uence of impingement height on the 0owpattern over the 0oor.The supply air0ow rate was regulated by a variable
speed fan and the supply temperature was set according tothe cooling load in the test room. The room temperaturewas kept constant by cooling the room walls. The air0owwas measured by an ori<ce plate. During the tests an air-0ow of 150 l=s, supply temperature of 18◦C and a roomtemperature of 21:5◦C were used, see Ref. [7] for furtherdetails.For supply heights of h = 950 and 300 mm, velocities
were conducted at 12 measuring points with di=erent dis-tances (x) and 3 angles from the impingement point, seeFig. 4(b). At each measuring point the traversing for ve-locity was carried out from the 0oor up to 300 mm with10 mm between traversing intervals. At each point in thetraversing interval, 480 samples were recorded for a sam-pling interval of 0:5 s to give the mean velocity at thatpoint.

1332 T. Karimipanah, H.B. Awbi / Building and Environment 37 (2002) 1329–1342
Fig. 4. A plane view of test facility with measuring points. All dimensions in metres.
The following measuring instruments were used in thetests:
• Air velocity measuring instrument of type Swema Air 300with hotwire anemometer of type CTDA.
• Micromanometer of type Alnor MP3 KDS (pressure mea-surement for supply duct).
• Temperature measuring instrument of type Mitec AT30with thermistor.
The measuring errors were estimated to be:
Supply air0ow (ori<ce) ±4%.Room temperature ±0:5 K.Supply temperature ±0:5 K.Air temperature in the jet ±0:2 K.Air velocity ±0:05 m=s.The measured parameters for the two cases considered
were:
Supply height 950 mm
Supply air0ow rate, qv = 0:15 m3=s.Supply outlet area, Aout = 0:094 m2 ⇒ characteristic value√
Aout ≈ 0:30 m.Supply air velocity at outlet, Uo = 1:60 m=s.
Supply height 300 mm
Supply air0ow rate, qv = 0:15 m3=s.Supply outlet area, Aout = 0:117 m2 ⇒ characteristic value√
Aout ≈ 0:34 m.Supply air velocity at outlet, Uo = 1:29 m=s.
The reason for varying the supply outlet area and thevelocity in the two chosen heights was because the extendednoise damping cover of supply duct in the case with supplyheight of 300 mm was missing.
3.2. Test results
The results from these tests are given in Figs. 5–10.The equation in Fig. 6 shows a best line <t through the
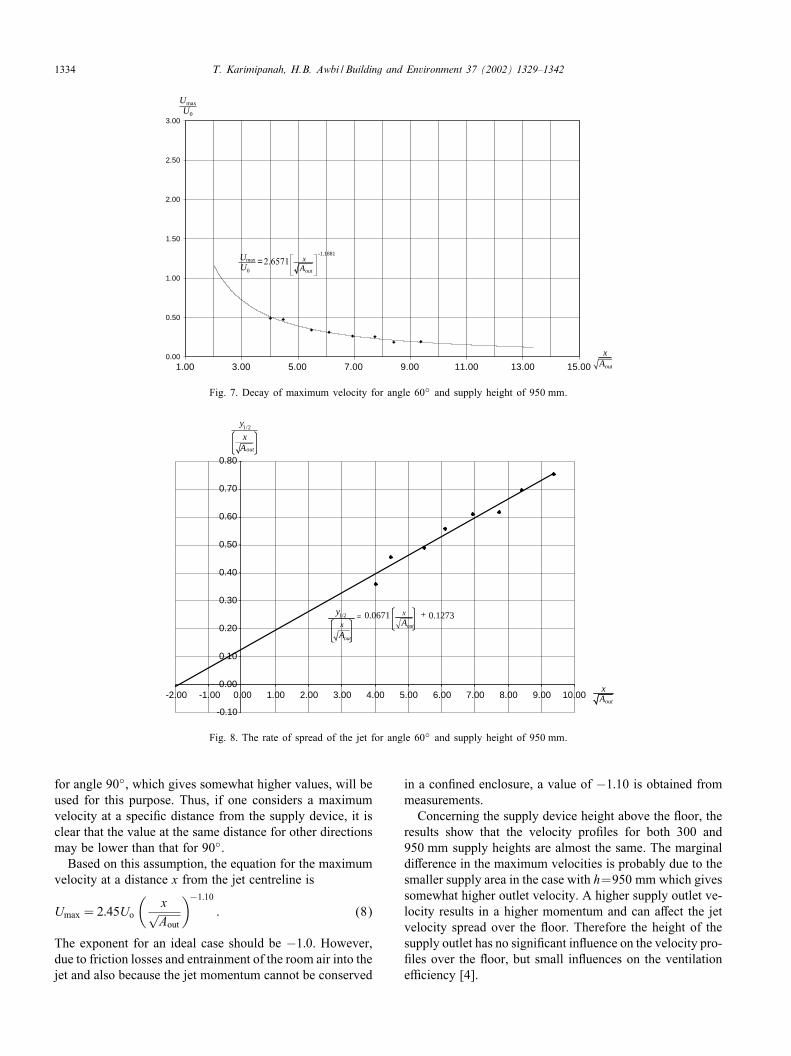
measured values. This is used to calculate the jet spread rate,i.e. 0.081 in the equation and also the virtual origin which is−0:34. The same procedure is repeated for other angles, seeFigs. 8 and 10, which show the di=erence in the jet spreadand the location of virtual origin for the two angles. Thedi=erences obtained are due to the vicinity of the wall andthe entrained air into the jet boundaries for the measuringcases with 30◦ and 90◦ which leads to a higher spread rate,0.081 and 0.074, respectively. These values are very closeto the wall jet spread rate obtained by Karimipanah [3]. Forthe 60◦ case the jet spread rate is as low as 0.067, see Fig.8 and the con<guration in Fig. 4. For the later case, thecon<nement e=ects are less important and the jet seems tobe almost una=ected by the walls.
3.3. Empirical equations
The empirical equations for each angle given below showhow the maximum velocity varies with distance from thesupply device as a function of supply area and outlet veloc-ity. The equations have been derived from the data in Figs.5–10.
Angle 30◦ Umax = 3:38Uo
(x√Aout
)−1:52
; (2)
Angle 60◦ Umax = 2:66Uo
(x√Aout
)−1:19
; (3)
Angle 90◦ Umax = 2:45Uo
(x√Aout
)−1:10
: (4)

T. Karimipanah, H.B. Awbi / Building and Environment 37 (2002) 1329–1342 1333
0
0.5
1
1.5
2
2.5
3
1 11 13 15 out
xA
-1.5202
0
3.3784out
U xU A
=
max
0
UU
max
3 5 7 9
Fig. 5. Decay of maximum velocity for angle 30◦ and supply height of 950 mm.
-0.10
0.00
0.10
0.20
0.30
0.40
0.50
0.60
0.70
0.80
0.90
-1.00 0.00 1.00 2.00 3.00 4.00 5.00 6.00 7.00 8.00 9.00 10.00out
xA
out
out
y1/2
Ax
A
= 0.081
1/2yx
Aout
x + 0.0278
Fig. 6. The rate of spread of the jet for angle 30◦ and supply height of 950 mm.
The absolute values for the distance of the virtual originare also determined from the <gures for each angle. Thefollowing relations show the spread of jet with distancefrom the supply jet centreline and the distance of the virtualorigin for angles of 30◦; 60◦ and 90◦. It is shown in Figs.6, 8 and 10 that the virtual origin is always downstream ofthe jet centreline.
Angle 30◦∣∣∣∣ x0√Aout
∣∣∣∣= |0:34|; (5)
Angle 60◦∣∣∣∣ x0√Aout
∣∣∣∣= |1:90|; (6)
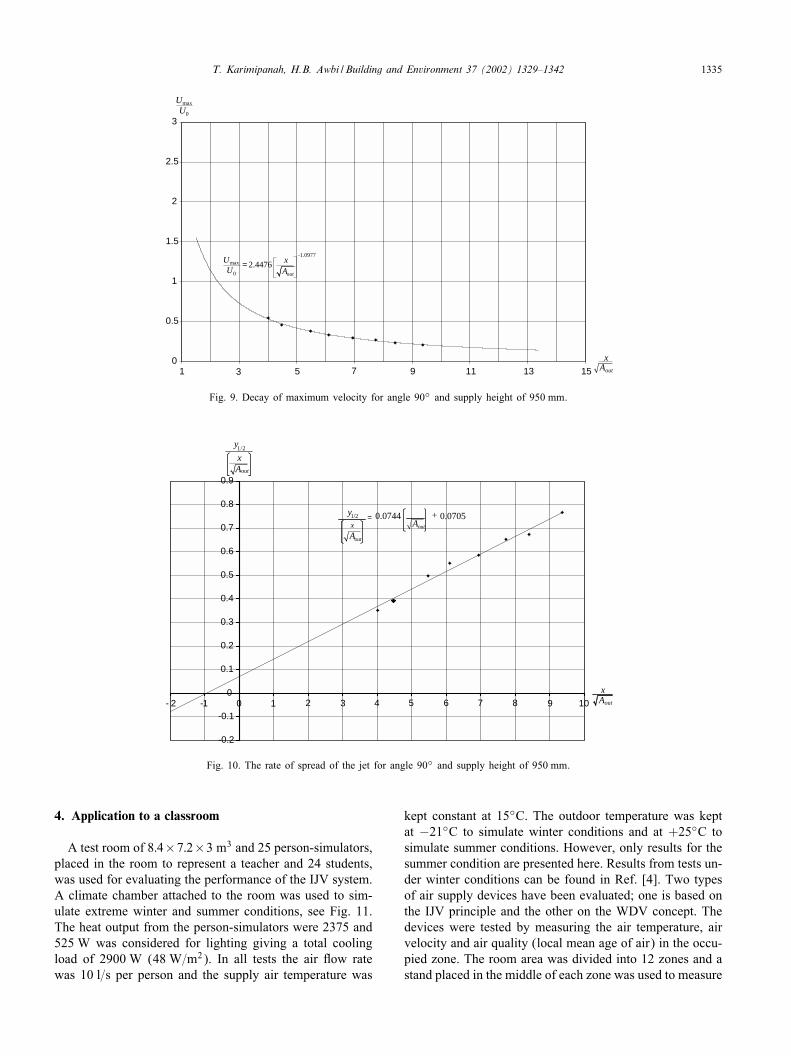
Angle 90◦∣∣∣∣ x0√Aout
∣∣∣∣= |0:95|: (7)
3.4. Discussion of results
The distance (x) form the impingement point up to theactual measuring point gives the best parameter for dimen-sionless representation of the experimental data. The resultsshow that velocities for di=erent angles considered are some-what di=erent. Although the largest velocities occur for an-gles of 60◦ and 90◦, the velocities for these two angles atthe same measuring points are almost the same. The smallvariations are due to measuring errors. The lower velocitiesfor angle 30◦ are due to the damping e=ect of the adjacentwall.Since the aim is to produce dimensionless correlations that
can be used for selecting impinging jet devices the results
1334 T. Karimipanah, H.B. Awbi / Building and Environment 37 (2002) 1329–1342
2.6571
0.00
0.50
1.00
1.50
2.00
2.50
3.00
1.00 3.00 5.00 7.00 9.00 11.00 13.00 15.00 out
xA
max
0
UU
max
0 outU A
-1.1881
=U x
Fig. 7. Decay of maximum velocity for angle 60◦ and supply height of 950 mm.
-0.10
0.00
0.10
0.20
0.30
0.40
0.50
0.60
0.70
0.80
-2.00 -1.00 0.00 1.00 2.00 3.00 4.00 5.00 6.00 7.00 8.00 9.00 10.00
1/2 0.0671 0.1273out
out
yAx
A
=
1/2y
xA
out
xA
+x
out
Fig. 8. The rate of spread of the jet for angle 60◦ and supply height of 950 mm.
for angle 90◦, which gives somewhat higher values, will beused for this purpose. Thus, if one considers a maximumvelocity at a speci<c distance from the supply device, it isclear that the value at the same distance for other directionsmay be lower than that for 90◦.Based on this assumption, the equation for the maximum
velocity at a distance x from the jet centreline is
Umax = 2:45Uo
(x√Aout
)−1:10
: (8)
The exponent for an ideal case should be −1:0. However,due to friction losses and entrainment of the room air into thejet and also because the jet momentum cannot be conserved
in a con<ned enclosure, a value of −1:10 is obtained frommeasurements.Concerning the supply device height above the 0oor, the
results show that the velocity pro<les for both 300 and950 mm supply heights are almost the same. The marginaldi=erence in the maximum velocities is probably due to thesmaller supply area in the case with h=950 mm which givessomewhat higher outlet velocity. A higher supply outlet ve-locity results in a higher momentum and can a=ect the jetvelocity spread over the 0oor. Therefore the height of thesupply outlet has no signi<cant in0uence on the velocity pro-<les over the 0oor, but small in0uences on the ventilatione2ciency [4].
T. Karimipanah, H.B. Awbi / Building and Environment 37 (2002) 1329–1342 1335
0
0.5
1
1.5
2
2.5
3
1 5 9 11 13 15 out
xA
max
0
UU
max
0
2.4476U xU A
=
3 7
out
-1.0977
Fig. 9. Decay of maximum velocity for angle 90◦ and supply height of 950 mm.
-0.2
-0.1
0
0.1
0.2
0.3
0.4
0.5
0.6
0.7
0.8
0.9
- 2 -1 0 4 9 10
1/2y
xA
1/2 0.0744 0.0705out
out
yAx
A
= +
out
xA1 2 3 5 6 7 8
out
Fig. 10. The rate of spread of the jet for angle 90◦ and supply height of 950 mm.
4. Application to a classroom
A test room of 8:4×7:2×3 m3 and 25 person-simulators,placed in the room to represent a teacher and 24 students,was used for evaluating the performance of the IJV system.A climate chamber attached to the room was used to sim-ulate extreme winter and summer conditions, see Fig. 11.The heat output from the person-simulators were 2375 and525 W was considered for lighting giving a total coolingload of 2900 W (48 W=m2). In all tests the air 0ow ratewas 10 l=s per person and the supply air temperature was
kept constant at 15◦C. The outdoor temperature was keptat −21◦C to simulate winter conditions and at +25◦C tosimulate summer conditions. However, only results for thesummer condition are presented here. Results from tests un-der winter conditions can be found in Ref. [4]. Two typesof air supply devices have been evaluated; one is based onthe IJV principle and the other on the WDV concept. Thedevices were tested by measuring the air temperature, airvelocity and air quality (local mean age of air) in the occu-pied zone. The room area was divided into 12 zones and astand placed in the middle of each zone was used to measure

1336 T. Karimipanah, H.B. Awbi / Building and Environment 37 (2002) 1329–1342
Fig. 11. Plan view of the classroom with supply positions. All dimensions in metres.
Fig. 12. Velocity vectors in a horizontal plane 10 cm from 0oor and age of air contours in a vertical plane: (a) wall displacement ventilation;(b) impinging jet ventilation.
the required quantities at di=erent heights. The local meanage of air was measured by using the tracer gas decay tech-nique at 1:2 m above 0oor. Further details can be found inRefs. [2,4].To assess the e=ectiveness of the two ventilation systems
for measurements and CFD simulations, well-known param-eters given below are used [9].
Ventilation e8ectiveness for heat distribution or removal(�t): This is similar to a heat exchanger e=ectiveness and isde<ned by
�t =To − TiRT − Ti
: (9)
Ventilation e8ectiveness for contaminant removal (�c):This is a measure of how e=ective the ventilation system isin removing internally produced contamination. It is de<nedby
�c =Co − CiRC − Ci
: (10)
In Eqs. (9) and (10), T is temperature (◦C), C is the con-taminant concentration in parts per million (ppm), the sub-scripts i and o refer to inlet and outlet, respectively, and(R) represents the mean value for the occupied zone (to aheight of 1:8 m). The values of �t and �c is dependent on themethod of room air distribution, room characteristics, heatand contaminant sources, etc.

T. Karimipanah, H.B. Awbi / Building and Environment 37 (2002) 1329–1342 1337
18
18.5
19
19.5
20
20.5
21
21.5
22
22.5
0.01 0.09 0.42 0.74 0.89 1.19 1.50 2.07 2.38 2.46 2.61 2.85
Height [m]
Tem
prat
ure
[o C]
IJV CFDIJV measuredWDV CFDWDV measured
Fig. 13. Mean temperature pro<les for two ventilation systems.
0
0.05
0.1
0.15
0.2
0.25
0.3
0.01 0.09 0.42 0.74 0.89 1.19 1.5 2.07 2.38 2.46 2.61 2.85
Height [m]
Mea
n ve
loci
ty [m
/s]
IJV CFDIJV measuredWDV CFDWDV measured
Fig. 14. Mean velocity gradients for two ventilation systems.
In addition, expressions for the predicted percentage ofdissatis<ed (PPD) and predicted mean vote (PMV) are usedhere and these are de<ned in Ref. [10].
5. CFD calculations
The CFD program VORTEX [11] has been used to pre-dict the air0ow properties in the classroom. This programhas been developed for the simulation of air0ow, heat trans-fer, mean age of air distribution, PPD and PMV in enclo-sures. The code uses the standard �–� turbulence modeland has been developed for ventilation research, which maybe more suitable for ventilation simulations than the more
general-purpose codes. In the simulations, the measuredmean temperatures of the six room surfaces have been usedas boundary conditions. The number of nodes used were49× 39× 37 giving a resolution of 0:17 m in the horizon-tal plane and 0:081 m in the vertical direction. The distancefrom the 0oor of the impinging jet outlet was 0:90 m in boththe measurements and the CFD simulations.
6. Results from CFD and measurements in classroom
Fig. 12(a) and (b) shows the air 0ow patterns from theCFD results for the two supply methods at a height of10 cm from the 0oor. Although, the air supply velocity of

1338 T. Karimipanah, H.B. Awbi / Building and Environment 37 (2002) 1329–1342
0
0.05
0.1
0.15
0.2
0.25
0.00 1.05 3.15 5.25 7.35 8.00
Distance from window, x[m]
Mea
n ve
loci
ty [m
/s].
IJV measuredIJV CFDWDV measuredWDV CFD
Fig. 15. Predicted and measured mean velocity distribution in a horizontal plane 10 cm above the 0oor for two ventilation systems.
0
5
10
15
20
25
30
0.01 0.09 0.42 0.74 0.89 1.19 1.5 2.07 2.38 2.46 2.61 2.85
Height [m]
PP
D [%
]
IJV CFDWDV CFD
Fig. 16. Predicted PPD pro<les for two ventilation systems.
1:56 ms−1 in the case of IJV was much higher than in thedisplacement ventilation case the velocity close to the 0oordecays very rapidly and it is only quite large at a short dis-tance from the jet impinging point on the 0oor. The spreadof the impinging jet over the 0oor produces a velocity nearthe 0oor which is similar in magnitude to that of the dis-placement ventilation system. However, the 0oor layer inthis case is much thinner than that in the case of the WDV.The temperature gradients for the two cases are shown
in Fig. 13. The agreement between the measurements andCFD simulations are good. The recommended temperaturegradient of 3 K or less is achieved.
The mean velocity gradients are shown in Fig. 14. Ex-cept for heights up to 15 cm above the 0oor the velocitiesare much lower than 0:15 m=s for both cases, indicating acomfortable environment. The velocity distribution over ahorizontal plane 10 cm above the 0oor (see Fig. 11) is plot-ted in Fig. 15. Only the wall displacement system shows atendency for a velocity higher than the recommended max-imum of 0:15 m=s closed to the walls.Fig. 16 shows the PPD. One can see from the <gure
that in a large portion of the room PPD is below 10%for both systems and this is acceptable for such large heatloads [10].
T. Karimipanah, H.B. Awbi / Building and Environment 37 (2002) 1329–1342 1339
0
0.2
0.4
0.6
0.8
1
1.2
1.4
1.6
1.8
1 2 3 4 5 6 7 8 9 10 11 12
Measuring point number
Nor
mal
ised
mea
n ag
e
εi [
-]
WDV measuredWDV CFDIJV measuredIJV CFD
Fig. 17. Predicted and measured normalised local mean age of air pro<les at the breathing zone (1:2 m above 0oor) for two ventilation systems.
19
20
21
22
23
24
25
1 2 3 4 5 6 7 8 9 10 11 12
Measuring point number
Tem
prat
ure
[o C]
WDV measuredWDV CFDIJV measuredIJV CFD
Fig. 18. Predicted and measured local mean temperature pro<les at the breathing zone (1:2 m above the 0oor) for two ventilation systems.
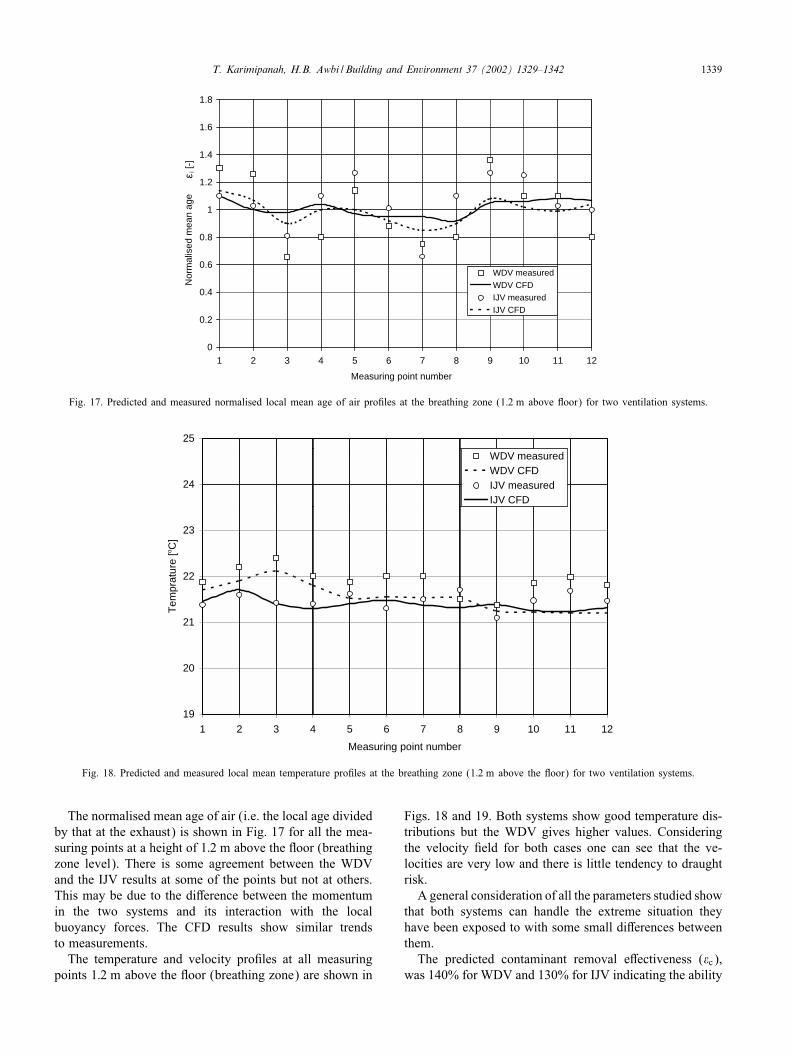
The normalised mean age of air (i.e. the local age dividedby that at the exhaust) is shown in Fig. 17 for all the mea-suring points at a height of 1:2 m above the 0oor (breathingzone level). There is some agreement between the WDVand the IJV results at some of the points but not at others.This may be due to the di=erence between the momentumin the two systems and its interaction with the localbuoyancy forces. The CFD results show similar trendsto measurements.The temperature and velocity pro<les at all measuring
points 1:2 m above the 0oor (breathing zone) are shown in
Figs. 18 and 19. Both systems show good temperature dis-tributions but the WDV gives higher values. Consideringthe velocity <eld for both cases one can see that the ve-locities are very low and there is little tendency to draughtrisk.A general consideration of all the parameters studied show
that both systems can handle the extreme situation theyhave been exposed to with some small di=erences betweenthem.The predicted contaminant removal e=ectiveness (�c),
was 140% for WDV and 130% for IJV indicating the ability
1340 T. Karimipanah, H.B. Awbi / Building and Environment 37 (2002) 1329–1342
0
0.02
0.04
0.06
0.08
0.1
0.12
0.14
0.16
1 2 3 4 5 6 7 8 9 10 11 12
Measuring point number
Mea
n ve
loci
ty [m
/s]
WDV measured
WDV CFD
IJV measured
IJV CFD
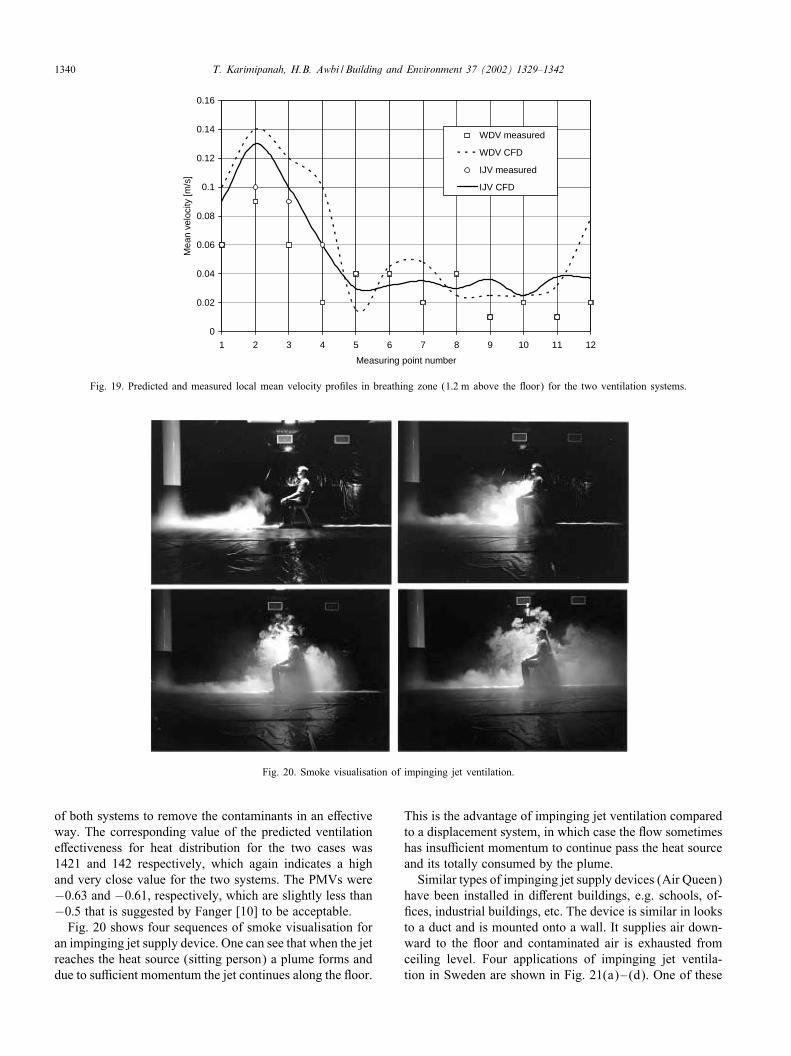
Fig. 19. Predicted and measured local mean velocity pro<les in breathing zone (1:2 m above the 0oor) for the two ventilation systems.
Fig. 20. Smoke visualisation of impinging jet ventilation.
of both systems to remove the contaminants in an e=ectiveway. The corresponding value of the predicted ventilatione=ectiveness for heat distribution for the two cases was1421 and 142 respectively, which again indicates a highand very close value for the two systems. The PMVs were−0:63 and −0:61, respectively, which are slightly less than−0:5 that is suggested by Fanger [10] to be acceptable.Fig. 20 shows four sequences of smoke visualisation for
an impinging jet supply device. One can see that when the jetreaches the heat source (sitting person) a plume forms anddue to su2cient momentum the jet continues along the 0oor.
This is the advantage of impinging jet ventilation comparedto a displacement system, in which case the 0ow sometimeshas insu2cient momentum to continue pass the heat sourceand its totally consumed by the plume.Similar types of impinging jet supply devices (Air Queen)
have been installed in di=erent buildings, e.g. schools, of-<ces, industrial buildings, etc. The device is similar in looksto a duct and is mounted onto a wall. It supplies air down-ward to the 0oor and contaminated air is exhausted fromceiling level. Four applications of impinging jet ventila-tion in Sweden are shown in Fig. 21(a)–(d). One of these
T. Karimipanah, H.B. Awbi / Building and Environment 37 (2002) 1329–1342 1341
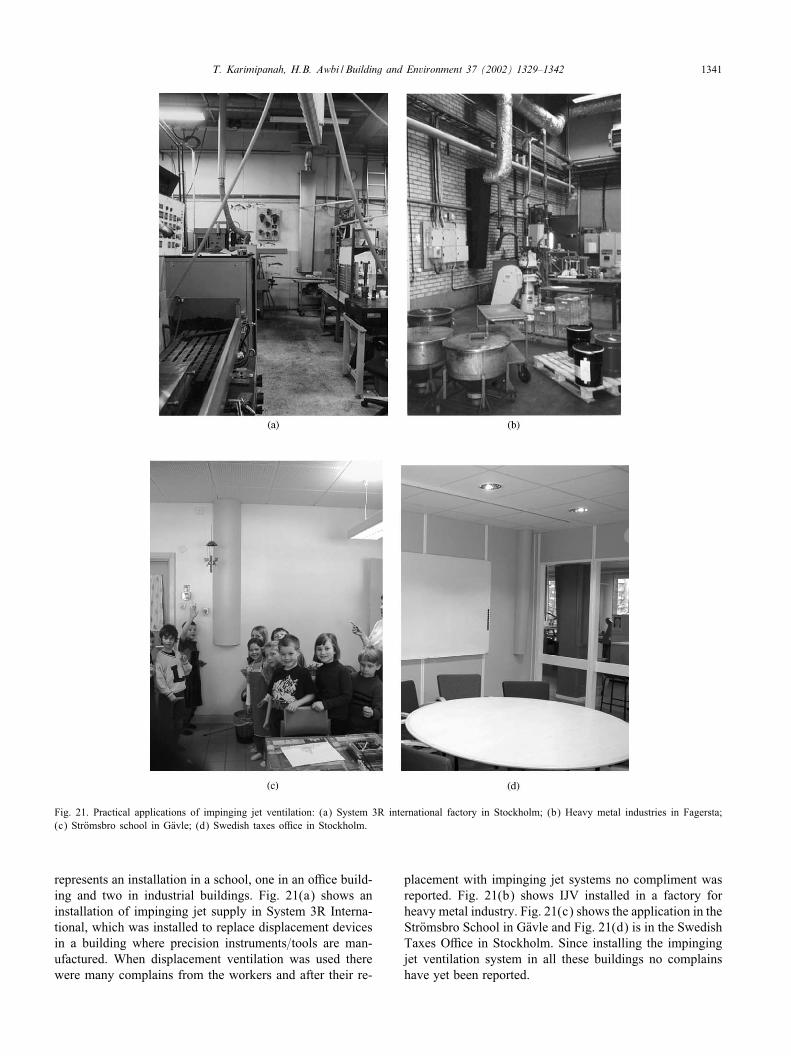
Fig. 21. Practical applications of impinging jet ventilation: (a) System 3R international factory in Stockholm; (b) Heavy metal industries in Fagersta;(c) StrQomsbro school in GQavle; (d) Swedish taxes o2ce in Stockholm.
represents an installation in a school, one in an o2ce build-ing and two in industrial buildings. Fig. 21(a) shows aninstallation of impinging jet supply in System 3R Interna-tional, which was installed to replace displacement devicesin a building where precision instruments=tools are man-ufactured. When displacement ventilation was used therewere many complains from the workers and after their re-
placement with impinging jet systems no compliment wasreported. Fig. 21(b) shows IJV installed in a factory forheavy metal industry. Fig. 21(c) shows the application in theStrQomsbro School in GQavle and Fig. 21(d) is in the SwedishTaxes O2ce in Stockholm. Since installing the impingingjet ventilation system in all these buildings no complainshave yet been reported.

1342 T. Karimipanah, H.B. Awbi / Building and Environment 37 (2002) 1329–1342
Another advantage of impinging jet ventilation is thatthe duct itself has a sound damping e=ect, which reducesaerodynamic noise at the supply terminal.
7. Conclusions
The results presented in this paper have shown that a 0oorlevel air distribution can handle a full room heat load in anacceptable manner. Although both the WDV and the IJVsystems show similar tendencies, some small di=erences intheir performance were observed. Because of the better bal-ance between buoyancy and momentum forces the IJV sys-tem shows slightly better mean age of air and velocitydistributions. The experiments show that after a short dis-tance from the impinging region and due to the dampinge=ect of the 0oor, the jet velocities have decreased to anacceptable level. Furthermore, the IJV system can also beused for both heating and cooling purposes.In this paper we have evaluated the IJV system un-
der certain conditions which are by no means exhaustive.Therefore, this new system may need further studies byventilation researchers and designers to fully understandits performance under various conditions experienced inpractice.
Acknowledgements
The authors gratefully acknowledge Prof. Mats Sandberg,Leif Claesson (in BMG, GQavle), Mr Bengt Svensson and
Lars Berthilson (VVESS Consulting AB, GQavle), Per-JohanOhlsson, Johan Kostakis and QOrjan Josefsson for theirvaluable contribution to this work.
References
[1] Etheridge D, Sandberg M. Building ventilation: theory andmeasurement. UK: Wiley, 1996.
[2] Karimipanah T, Sandberg M, Awbi HB. A comparative study ofdi=erent air distribution systems in a classroom. In: Awbi HB, editor.Air distribution in rooms: ventilation for health and sustainableenvironment. Proceedings of the ROOMVENT 2000, Vol. 2. Oxford:Elsevier, 2000. p. 1013–8.
[3] Karimipanah T. Turbulent jets in con<ned spaces. Ph.D. thesis, RoyalInstitute of Technology, Sweden, 1996.
[4] Kostakis J, Josefsson QO. Thermal comfort and air quality in aclassroom. B.Sc. thesis, University College of GQavle, 1999 (inSwedish).
[5] Beltaos S, Rajaratnam N. Plane turbulent impinging jets. Journal ofHydraulic Research 1973;11:29–59.
[6] Gutmark E, Wolfshtein M, Wygnanski I. The plane turbulentimpinging jet. Journal of Fluid Mechanics 1978;88(Part 4):737–56.
[7] Berthilson L, Ohlsson PJ. Down-to-0oor Impinging Jet supplydevice—air exchange e2ciency. B.Sc. thesis, University College ofGQavle, 1997 (in Swedish).
[8] Rajaratnam N. Turbulent jets. Amsterdam: Elsevier, 1976.[9] Awbi HB. Energy e2cient room air distribution. Renewable Energy
1998;15:293–9.[10] Fanger PO. Thermal comfort. New York: McGraw-Hill, 1972.[11] Gan G, Awbi HB. Numerical simulation of the indoor environment.
Building and Environment 1994;29(4):449–59.