Functional Tomographic Fluorescence Imaging of pH Microenvironments in Microbial Biofilms by Use of...
10
APPLIED AND ENVIRONMENTAL MICROBIOLOGY, Dec. 2009, p. 7426–7435 Vol. 75, No. 23 0099-2240/09/$12.00 doi:10.1128/AEM.01220-09 Copyright © 2009, American Society for Microbiology. All Rights Reserved. Functional Tomographic Fluorescence Imaging of pH Microenvironments in Microbial Biofilms by Use of Silica Nanoparticle Sensors † Gabriela Hidalgo, 1 ‡ Andrew Burns, 2 ‡ Erik Herz, 2 Anthony G. Hay, 3 Paul L. Houston, 4 Ulrich Wiesner, 2 * and Leonard W. Lion 1 * School of Civil and Environmental Engineering, Hollister Hall, Cornell University, Ithaca, New York 14853 1 ; Department of Materials Science and Engineering, 214 Bard Hall, Cornell University, Ithaca, New York 14853 2 ; Department of Microbiology, B35A Wing Hall, Cornell University, Ithaca, New York 14853 3 ; and School of Chemistry and Biochemistry, Administration Building, Georgia Institute of Technology, Atlanta, Georgia 30332 4 Received 28 May 2009/Accepted 27 September 2009 Attached bacterial communities can generate three-dimensional (3D) physicochemical gradients that create microenvironments where local conditions are substantially different from those in the surrounding solution. Given their ubiquity in nature and their impacts on issues ranging from water quality to human health, better tools for understanding biofilms and the gradients they create are needed. Here we demonstrate the use of functional tomographic imaging via confocal fluorescence microscopy of ratiometric core-shell silica nanopar- ticle sensors (C dot sensors) to study the morphology and temporal evolution of pH microenvironments in axenic Escherichia coli PHL628 and mixed-culture wastewater biofilms. Testing of 70-, 30-, and 10-nm-diameter sensor particles reveals a critical size for homogeneous biofilm staining, with only the 10-nm-diameter particles capable of successfully generating high-resolution maps of biofilm pH and distinct local heterogeneities. Our measurements revealed pH values that ranged from 5 to >7, confirming the heterogeneity of the pH profiles within these biofilms. pH was also analyzed following glucose addition to both suspended and attached cultures. In both cases, the pH became more acidic, likely due to glucose metabolism causing the release of tricarboxylic acid cycle acids and CO 2 . These studies demonstrate that the combination of 3D functional fluorescence imaging with well-designed nanoparticle sensors provides a powerful tool for in situ character- ization of chemical microenvironments in complex biofilms. Biofilms are collections of surface-attached microbes en- trapped in a self-produced matrix of extracellular polymeric substances anchored to a surface (17). Their growth is charac- terized by complex three-dimensional (3D) structures includ- ing channels, voids, towers, and mushroom-like protrusions (9). They are common both in biological systems and in near- surface fluid rock systems and may occupy a significant portion of the surface area exposed to fluids in many natural environ- ments, including fresh and saline surface waters, ground wa- ters, deep-sea hydrothermal systems, and deep sedimentary basins (41, 51). The ubiquity of biofilms has a variety of im- portant implications for modern society. Industrially, biofilms are used in a wide array of engineered systems, including treatment of wastewater and hazardous waste, contaminated soils, and oil spills (43). Conversely, biofilms can also contam- inate water distribution systems, foul the hulls of ships, and promote corrosion (30). Medically, biofilms have been impli- cated in lung and chronic wound infections, as well as in cath- eter and implant colonization, in cystic fibrosis, in tuberculosis, in dental caries, and in periodontal diseases (12, 17). One prominent characteristic of biofilms is the development of 3D chemical gradients from the diffusion of nutrients, met- abolic products, and signaling molecules throughout the film. These gradients create microenvironments in which the local physicochemical properties may differ substantially from those in the surrounding solution (48). This gradation of conditions allows, for example, anaerobic bacteria to flourish within bio- films that are growing in an otherwise aerobic environment (23, 36). Another example of the effects of biofilm-generated chemical gradients is dental caries. Following sugar consump- tion, the pH within a dental plaque biofilm drops dramatically (5.5) while the pH of the overlying saliva remains near neu- tral. This acidification leads to demineralization of the tooth enamel and ultimately caries (33, 34). Several techniques have been used to analyze pH gradi- ents in biofilms, and each has its own benefits and limita- tions. Most recently, Beveridge and Hunter (22) used semi- naphthorhodafluor-4F 5(and 6)-carboxylic acid (C-SNARF-4), a ratiometric fluorescent dye, to measure pH microenvironments in Pseudomonas aeruginosa biofilms and observed pH values that ranged from 5.6 to 7.0. This method minimizes perturba- tions of the biofilm, and its spatial resolution is limited only by that of the microscope in use. Unfortunately, free sensor dyes have been demonstrated to interact with biofilm components, potentially altering their sensitivities and perturbing the result- * Corresponding author. Mailing address for Ulrich Wiesner: De- partment of Materials Science & Engineering, Cornell University, 214 Bard Hall, Ithaca, NY 14853. Phone: (607) 255-3487. Fax: (607) 255- 2365. E-mail: [email protected]. Mailing address for Leonard W. Lion: School of Civil and Environmental Engineering, Cornell University, Hollister Hall, Ithaca, NY 14853. Phone: (607) 255-7571. Fax: (607) 255-9004. E-mail: [email protected]. ‡ These authors contributed equally to this work. † Supplemental material for this article may be found at http://aem .asm.org/. Published ahead of print on 2 October 2009. 7426 on September 1, 2016 by guest http://aem.asm.org/ Downloaded from
-
Upload
independent -
Category
Documents
-
view
1 -
download
0
Transcript of Functional Tomographic Fluorescence Imaging of pH Microenvironments in Microbial Biofilms by Use of...

APPLIED AND ENVIRONMENTAL MICROBIOLOGY, Dec. 2009, p. 7426–7435 Vol. 75, No. 230099-2240/09/$12.00 doi:10.1128/AEM.01220-09Copyright © 2009, American Society for Microbiology. All Rights Reserved.
Functional Tomographic Fluorescence Imaging of pHMicroenvironments in Microbial Biofilms by Use
of Silica Nanoparticle Sensors�†Gabriela Hidalgo,1‡ Andrew Burns,2‡ Erik Herz,2 Anthony G. Hay,3 Paul L. Houston,4
Ulrich Wiesner,2* and Leonard W. Lion1*School of Civil and Environmental Engineering, Hollister Hall, Cornell University, Ithaca, New York 148531; Department of
Materials Science and Engineering, 214 Bard Hall, Cornell University, Ithaca, New York 148532; Department ofMicrobiology, B35A Wing Hall, Cornell University, Ithaca, New York 148533; and School of Chemistry and
Biochemistry, Administration Building, Georgia Institute of Technology, Atlanta, Georgia 303324
Received 28 May 2009/Accepted 27 September 2009
Attached bacterial communities can generate three-dimensional (3D) physicochemical gradients that createmicroenvironments where local conditions are substantially different from those in the surrounding solution.Given their ubiquity in nature and their impacts on issues ranging from water quality to human health, bettertools for understanding biofilms and the gradients they create are needed. Here we demonstrate the use offunctional tomographic imaging via confocal fluorescence microscopy of ratiometric core-shell silica nanopar-ticle sensors (C dot sensors) to study the morphology and temporal evolution of pH microenvironments inaxenic Escherichia coli PHL628 and mixed-culture wastewater biofilms. Testing of 70-, 30-, and 10-nm-diametersensor particles reveals a critical size for homogeneous biofilm staining, with only the 10-nm-diameter particlescapable of successfully generating high-resolution maps of biofilm pH and distinct local heterogeneities. Ourmeasurements revealed pH values that ranged from 5 to >7, confirming the heterogeneity of the pH profileswithin these biofilms. pH was also analyzed following glucose addition to both suspended and attachedcultures. In both cases, the pH became more acidic, likely due to glucose metabolism causing the release oftricarboxylic acid cycle acids and CO2. These studies demonstrate that the combination of 3D functionalfluorescence imaging with well-designed nanoparticle sensors provides a powerful tool for in situ character-ization of chemical microenvironments in complex biofilms.
Biofilms are collections of surface-attached microbes en-trapped in a self-produced matrix of extracellular polymericsubstances anchored to a surface (17). Their growth is charac-terized by complex three-dimensional (3D) structures includ-ing channels, voids, towers, and mushroom-like protrusions(9). They are common both in biological systems and in near-surface fluid rock systems and may occupy a significant portionof the surface area exposed to fluids in many natural environ-ments, including fresh and saline surface waters, ground wa-ters, deep-sea hydrothermal systems, and deep sedimentarybasins (41, 51). The ubiquity of biofilms has a variety of im-portant implications for modern society. Industrially, biofilmsare used in a wide array of engineered systems, includingtreatment of wastewater and hazardous waste, contaminatedsoils, and oil spills (43). Conversely, biofilms can also contam-inate water distribution systems, foul the hulls of ships, andpromote corrosion (30). Medically, biofilms have been impli-
cated in lung and chronic wound infections, as well as in cath-eter and implant colonization, in cystic fibrosis, in tuberculosis,in dental caries, and in periodontal diseases (12, 17).
One prominent characteristic of biofilms is the developmentof 3D chemical gradients from the diffusion of nutrients, met-abolic products, and signaling molecules throughout the film.These gradients create microenvironments in which the localphysicochemical properties may differ substantially from thosein the surrounding solution (48). This gradation of conditionsallows, for example, anaerobic bacteria to flourish within bio-films that are growing in an otherwise aerobic environment(23, 36). Another example of the effects of biofilm-generatedchemical gradients is dental caries. Following sugar consump-tion, the pH within a dental plaque biofilm drops dramatically(�5.5) while the pH of the overlying saliva remains near neu-tral. This acidification leads to demineralization of the toothenamel and ultimately caries (33, 34).
Several techniques have been used to analyze pH gradi-ents in biofilms, and each has its own benefits and limita-tions. Most recently, Beveridge and Hunter (22) used semi-naphthorhodafluor-4F 5(and 6)-carboxylic acid (C-SNARF-4), aratiometric fluorescent dye, to measure pH microenvironmentsin Pseudomonas aeruginosa biofilms and observed pH valuesthat ranged from 5.6 to 7.0. This method minimizes perturba-tions of the biofilm, and its spatial resolution is limited only bythat of the microscope in use. Unfortunately, free sensor dyeshave been demonstrated to interact with biofilm components,potentially altering their sensitivities and perturbing the result-
* Corresponding author. Mailing address for Ulrich Wiesner: De-partment of Materials Science & Engineering, Cornell University, 214Bard Hall, Ithaca, NY 14853. Phone: (607) 255-3487. Fax: (607) 255-2365. E-mail: [email protected]. Mailing address for Leonard W.Lion: School of Civil and Environmental Engineering, CornellUniversity, Hollister Hall, Ithaca, NY 14853. Phone: (607) 255-7571.Fax: (607) 255-9004. E-mail: [email protected].
‡ These authors contributed equally to this work.† Supplemental material for this article may be found at http://aem
.asm.org/.� Published ahead of print on 2 October 2009.
7426
on Septem
ber 1, 2016 by guesthttp://aem
.asm.org/
Dow
nloaded from

ing images (22). Further, the penetration of any molecular ornanometer-size probe into the biofilm can be limited by thedecreased diffusion rates within the dense microcolony envi-ronment (55). Finally, as with all free dye molecules, brightnessand photostability are limited and photoexcitation can causecellular toxicity (4). Microelectrode-based techniques havealso been used on a large variety of biological systems (27, 42,49), but the spatial resolution of microelectrode-based tech-niques is limited by the tip size and insertion of the microelec-trode into the biofilm inherently perturbs the local surround-ings. Each data point obtained with a microsensor is a singlemeasurement integrated over a spatial volume covering ap-proximately twice the tip diameter (14), which limits the ulti-mate spatial resolution of the sensor. In addition, a systematicstudy of a common microelectrode system revealed highly vari-able accuracy and precision between different electrodes (29).
Finally, fluorescence lifetime imaging can be used to mea-sure chemical concentrations through the use of appropriatedye molecules. By imaging a sample with a pulsed laser andanalyzing the decay rate of the dyes in the sample as theyfluoresce, Vroom et al. (55) were able to measure pH in amixed culture of oral bacteria. One hour after the biofilmswere exposed to 14 mM sucrose, pH was measured throughoutthe biofilm and values ranged from 7.0 to 5.5 were observed.This technique provides great definition and tissue penetra-tion; however, the equipment needed to perform fluorescencelifetime imaging includes fast detectors and electronics capableof differentiating nanosecond emissions in addition to a pulsedlaser excitation source and is not universally available. De-tailed reviews of this method may be found elsewhere (2, 6).
We implemented 3D (tomographic) fluorescence imagingwith ratiometric silica nanoparticle sensors to study the mor-phology and temporal evolution of pH microenvironments inEscherichia coli PHL628 and mixed-culture wastewater bio-films. Because of the diversity of structure and environments,functional tomographic imaging is of particular interest forinvestigating biofilms in their native state. Tomographic imag-ing techniques such as optical coherence tomography (58), softX-ray microscopy (25), and confocal fluorescence microscopy(38) enable high-resolution structural reconstructions withminimal perturbation of the biofilm. We have chosen the spa-
tial variation of pH within microbial biofilms to test tomo-graphic imaging via confocal fluorescence microscopy as it isan exciting area of research relevant to both the industrial andclinical impacts of biofilms. From a clinical standpoint, non-uniform pH profiles in biofilm infections are important be-cause the degree of physiological heterogeneity, marked by theestablishment of nutrient, dissolved gas, and pH gradients in-creases with time and is positively correlated with the devel-opment of drug resistance (15). Furthermore, it has been wellestablished that the susceptibility of bacterial cells to antibiot-ics and biocides is profoundly affected by their pH, amongother factors (15). The recent emergence of antibiotic-resistantpathogenic bacteria makes this a topic of great interest (11,15, 17).
We employed ratiometric core-shell silica nanoparticle sen-sors, referred to as C dot sensors (5), in order to overcome thelimitations of free ratiometric sensor dyes. As shown schemat-ically in Fig. 1a, incorporating green-emitting, pH-sensitive dyemolecules (fluorescein) in a thin silica shell surrounding a corerich in red-emitting, pH-insensitive dye molecules (Cy5) (5)permits ratiometric quantification of the local pH by compar-ison of sensor and reference dye emission intensities (Fig. 1b).This internally standardized design allows the analyte concen-tration to be measured independently of changes in the sensorconcentration, unlike single-color sensor imaging, which canonly give a qualitative description of the local environment (8,16, 26). Further, the covalent incorporation of dyes into acore-shell silica matrix significantly enhances both dye bright-ness and photostability through increases in the radiative fluo-rescence rate and decreases in the nonradiative fluorescencerate (31). Finally, silica is a highly biocompatible and easilyfunctionalized material for diverse biological applications (4,7). As is demonstrated below, however, only if the C dotsensors are kept below a critical particle size is homogeneousbiofilm staining possible. This discovery enabled, to the best ofour knowledge, the first functional volumetric imaging of pH inprokaryotic systems using ratiometric nanoparticle sensors.
MATERIALS AND METHODS
C dot sensors. C dot sensors with 70-, 30-, and 10-nm diameters were grownvia modified Stober silica nanoparticle syntheses (31, 50). Amination was per-
FIG. 1. Sensor schematic and calibration. (a) Schematic diagram showing the core-shell architecture of a C dot sensor that highlights thereference dye (Cy5) sequestered in the core and coated by a sensor dye (fluorescein) shell. (b) Peak fluorescein emission collected for solutionsof known pH values ranging from 4.5 to 9.0. Also shown is the molecular structure of the dye in its dianionic charge state, where it exhibits aquantum yield of approximately 93%, and in its monoanionic state, where its quantum yield is approximately 37%.
VOL. 75, 2009 IMAGING OF pH MICROENVIRONMENTS IN MICROBIAL BIOFILMS 7427
on Septem
ber 1, 2016 by guesthttp://aem
.asm.org/
Dow
nloaded from
formed by using 3-aminopropyl triethoxysilane as a surface-silanizing agent. The10-nm-diameter bare silica particles which were ultimately used for all of thefunctional 3D reconstructions shown here consist of a particle core covalentlyincorporating Cy5 as an environmentally insensitive reference dye via coupling toa reactive silane, surrounded by a shell covalently incorporating fluorescein dye(fluorescein isothiocyanate [FITC]) through coupling to a reactive silane. FITCwas chosen for its pKa of 6.4, which is within the range of interest for thisbiological system. At pH �9, FITC exists in the dianionic charge state andexhibits a quantum yield of approximately 93%, while at pH �4.5, the dye isprotonated to the monoanionic state with a quantum yield of approximately 37%(Fig. 1b) (18). Cy5 has a quantum yield that is constant within this pH range,making it an ideal internal standard. Additional information on the synthesis andcharacteristics of these particles may be found elsewhere (4, 5, 31).
Culture and media. E. coli PHL628, an adherent K-12 MG1655 derivative, wasused as the test bacterium for the pure-culture experiments. This strain has amutation in the ompR gene that results in overproduction of curli, thin fibrillarpili at the surface of the cells that allow the bacteria to adhere and form sessilecommunities (54). The cultures were grown in a solution of 1 part Luria-Bertani(LB) medium (which contained, per liter, 10 g NaCl, 10 g tryptone, and 5 g yeastextract) and 2 parts water and which was sterilized by autoclaving at 121°C beforeuse. All experiments performed with E. coli PHL628 were supplemented withkanamycin (50 mg/liter). Suspended cultures were grown at 37°C with rotaryshaking at 150 rpm. Attached cultures were grown in 35-mm petri dishes with anuntreated 14-mm Microwell no. 1.5 coverglass at the bottom surface (MatTek,Ashland, MA). After inoculation, the cells were kept at 30°C with rotary shakingat 30 rpm. Every 48 h, the medium was discarded and fresh medium was added.Biofilms were grown for 7 to 8 days. Approximately 9 h prior to imaging, the Cdot sensors were added (to a concentration of 50 nM) and the cultures werecontinuously stirred for 4 h. Approximately 5 h prior to imaging, the biofilmswere washed twice to remove unbound dots and fresh medium was added.
The mixed-culture seed (potentially containing archaeal and eukaryotic mi-croorganisms, e.g., fungi and protozoans, in addition to bacteria) (24) came froma municipal wastewater treatment facility in Ithaca, NY. Biofilms and suspendedmixed cultures were grown by following the protocols described above.
Growth curves. To investigate the biocompatibility and potential toxicity of thecore-shell silica nanoparticles, 10-nm-diameter sensor particles and dye-freenanoparticles of the same size were added to diluted LB medium at variousconcentrations representative of biofilm growth conditions (18 to 50 nM). Thesolutions were then inoculated at 1% volume with either E. coli PHL628 culturesor mixed wastewater cultures. Culture aliquots of 200 �l were placed in sterile,clear 96-well plates, and optical density (OD) at 600 nm was recorded untilstationary phase was reached. OD was measured with a Biotek multidetectionmicroplate reader equipped with Synergy HT and KC4 software. The microplatereader maintained the cultures at 37°C with shaking prior to each measurement,and measurements were performed at 20-min intervals. Each condition wasanalyzed in triplicate. Sterile controls both with and without particles were alsoanalyzed. Reported ODs correspond to the absorbance measured at the bottomof each well through approximately 3 mm of medium; therefore, our OD valuesare not comparable to standard OD measurements with cuvettes with a 1-cmpath length.
pH analysis in suspended cultures. A calibration curve for C dot sensors wasgenerated by mixing the dots with a series of pH-adjusted phosphate-bufferedsaline solutions (pH 4.0 to 8.0) and measuring sensor (green) and reference (red)emission spectra upon excitation at 488 and 633 nm, respectively, on a PTIspectrofluorometer (see Fig. S3a and b in the supplemental material, respec-tively). For each measurement, the peak intensity ratio (Fi � IFITC/ICy5; see Fig.S3c in the supplemental material) was plotted versus pH and analyzed by usingthe equation pH � pKa � log[(Fi � Fmin)/(Fmax � Fi)], a modified Henderson-Hasselbalch equation where Fmin and Fmax are the extreme values of Fi at lowand high pHs, respectively, to determine the pKa and generate a calibrationcurve (see Fig. S3d in the supplemental material).
One-hundred-milliliter volumes of overnight cultures of E. coli PHL628 grownin 1/3 LB medium were spiked with a concentrated glucose solution to achievea final concentration of 90 mM glucose or an equal volume of distilled water(control). For the following 12 h, 700-�l aliquots were retrieved from the spikedflask, as well as the 0 mM glucose control, and placed in cuvettes, where thesuspensions were mixed with C dots to a concentration of 180 nM. Fluorescencein the green and red channels was recorded at the excitation and emissionwavelengths described above. pH was simultaneously recorded with a UP-10Denver Instrument pH meter. The experiment was simultaneously performedwith the mixed wastewater culture. Next, the relationship obtained from thecalibration curve (r2 � 0.99) was used to calculate the pH of the cell suspensions.
Imaging. All biofilm images were collected with a Leica TCS-SP2 confocallaser scanning microscope equipped with argon ion and helium-neon lasers. A40� 0.8 numerical aperture water immersion objective was used for all imaging.TIF images of 512 by 512 pixels were collected at 12-bit color depth in xy mode.Image stacks were generated by sequential imaging in 1-�m steps through thebiofilm.
To determine the spatial distribution of pH microenvironments within thebiofilms, both E. coli PHL628 and mixed-culture films were grown and mixedwith the sensors as described above. The samples were maintained at roomtemperature and under constant shaking at 30 rpm until imaging. The biofilmswere concurrently imaged by using transmitted light and fluorescence with exci-tation at 488 and 633 nm and appropriate emission filter settings. Particle-freebiofilms were similarly imaged to control for background fluorescence. In orderto record pH variations in biofilms following a glucose spike, an initial series ofimages was taken as a baseline, followed by a glucose addition that resulted in afinal concentration equal to that used for the suspended cultures (90 mM). Thesame field was imaged every 30 min for the next 1.5 h. For calibration, aliquotsof phosphate-buffered saline solutions were mixed with particles to a final con-centration of 15 �M and imaged in 96-well plates.
Image analysis. Analysis routine examples are included in the supplementalmaterial as MATLAB code. Briefly, all image files were loaded into MATLAB7.4.0 by using the imread command and background corrected based on averagebackground images taken at each image setting. For the calibrations, replicatesin each channel, at each pH, were median filtered (to remove noise) and aver-aged prior to pixelwise division of the green (sensor) channel by the red (refer-ence) channel to determine Fi(IFITC/ICy5). The mean and standard deviation ofthis ratio were calculated across each image and used as the Fi values in themodified Henderson-Hasselbalch equation described in Materials and Methods.
For the biofilm images, each sensor and reference channel image was dividedpixelwise to generate Fi values throughout the imaging field and the pH wascalculated at each point which contained sufficient reference intensity to beconsidered above the background. The 512-by-512 arrays of pH values werescaled for output as 8-bit grayscale TIFs from MATLAB in the order in whichthey were read, and a pH scale bar was appended. The images were thenimported into the Osirix DICOM image processing software (44). Originallydesigned for magnetic resonance imaging, computed tomography, and positionemission tomography image analysis, the software creates 3D tomographs from2D image stacks in a variety of false-spectrum colors and allows manipulation ofthe data and export to still images (see Fig. 3 to 6), as well as video (see thesupplemental material).
RESULTS
C dot sensor distribution and toxicity. We assayed biofilmswith C dot sensors of various diameters (70, 30, and 10 nm)and both positively charged (aminated) and negatively charged(bare silica) surfaces. The amination process screened the localpH effects on the particle, making sensing difficult, and thuswas not pursued further.
For 70- and 30-nm-diameter bare silica sensors, the particleswere distributed sparsely and heterogeneously in the biofilmsand a majority of the beads were removed during the washingsteps. Furthermore, upon imaging, the biofilm did not overliethe C dots; rather, those dots that remained agglomerated inclusters separate from the bacteria (data not shown). Onlywhen using the smallest, 10-nm-diameter bare C dot sensorswere we able to reproducibly achieve high and homogeneousbiofilm incorporation. The following experiments were all per-formed with the bare 10-nm particles.
Measurements to determine the kinetics of the integrationof the particles into the matrix were not performed. The dotswere assumed to be able to diffuse into the biofilm and anchorto cells or extracellular polysaccharide in the 4 h providedbetween the C dot sensor addition and the washing that elim-inated unbound dots. It is reasonable to assume that an activeequilibrium was reached within this period of time and thatsome of the particles may have been detaching and reattaching
7428 HIDALGO ET AL. APPL. ENVIRON. MICROBIOL.
on Septem
ber 1, 2016 by guesthttp://aem
.asm.org/
Dow
nloaded from

during and after the washing. However, the possibility that theparticles were not all completely immobilized was not consid-ered an issue of concern because, as mentioned earlier, each Cdot sensor has its own internal reference. This implies thateach measurement is an individual determination of the pH inthe surroundings of the particle, regardless of the state of theattachment.
The growth curves presented in Fig. 2a reveal that bacterialgrowth is not affected by the introduction of 10 nm C dotsensor particles or dye-free silica nanoparticles of similar size.The OD reached after 18 h of growth was, on average, 0.33 forthe E. coli PHL628 culture and 0.46 for the wastewater culture,with minimal effect of particle type (Fig. 2a) or concentration(see Fig. S2 in the supplemental material). The OD of sterilecontrols remained constant at approximately 0.0.
pH measurement in suspended cultures. The pH profilesafter glucose addition to E. coli PHL628 cultures and to mixedcommunity wastewater cultures are shown in Fig. 2 panels band c and panels d and e, respectively. The pH was trackedboth with C dots (Fig. 2b and d) and with a pH meter (Fig. 2cand e). For these samples, the trends in pH as measured overtime using C dot sensors and a pH meter are comparable.
Naturally, one would expect a pH electrode to provide mea-surements that are less noisy but also with less spatial local-ization. Conversely, when using C dots for biofilm pH mea-surements, the values are averaged over much smaller volumes,such that each pixel has a specific spatial location and is as-signed a pH value. Hence, anywhere a fluorescent bead may bepresent within a biofilm, i.e., attached to a cell or to extracel-lular polysaccharide or floating inside a pore, the pH corre-sponding to that location may be quantified. This explains how,within a biofilm, pH microenvironments may be observed withthis technique. These results validate our claim that C dots maybe used for real-time tracking of pH in bacterial environments.
Figure 2b and c show that the pH of a suspended E. coliPHL628 culture after glucose addition dropped from 7.0 tonearly 5.5 over �400 min. Over the course of the experiment,the pH did not return to neutral values. We do not believe thisacidification to be the result of fermentation because the cul-tures were stirred continuously to maintain aerobic conditions.
As shown in Fig. 2d and e, the decrease in pH in the mixedculture exposed to 90 mM glucose over the course of theexperiment was minimal. This difference, relative to the be-havior of the E. coli culture, is reasonable given that glucose is
FIG. 2. C dot sensor biocompatibility, solution pH measurements, and calibrations. (a) OD at 600 nm of E. coli PHL628 (middle curves, shownin blue), a mixed wastewater culture (top curves, shown in red), and sterile controls (along the x axis, black) versus time under normal growthconditions (E) and in the presence of 50 nM C dot sensors (�) or 50 nM pure silica nanoparticles of the same size (ƒ). (b to e) pH versus timeafter glucose introduction as measured by silica nanoparticle sensors (b and d) and a pH meter (c and e) in planktonic E. coli (b and c) andwastewater culture (d and e) suspensions. Squares and triangles indicate glucose additions of 0 and 90 mM, respectively. (f and g) pH calibrationgraphs for E. coli biofilm imaging (f) (r2 � 0.99) and wastewater mixed-culture biofilm imaging (g) (r2 � 0.99) based on pixelwise image analysisof confocal microscopy images of particles suspended in pH-calibrated solutions.
VOL. 75, 2009 IMAGING OF pH MICROENVIRONMENTS IN MICROBIAL BIOFILMS 7429
on Septem
ber 1, 2016 by guesthttp://aem
.asm.org/
Dow
nloaded from
the primary energy source for this enteric bacterium, whichconstitutively expresses the necessary enzymes for glucose me-tabolism (40). Therefore, in E. coli, catabolism can begin im-mediately upon glucose exposure, leading to a pH drop asmetabolites accumulate in solution. The mixed wastewater cul-ture, however, includes a wide variety of microorganisms, ofwhich some are unable to consume glucose and others mustundergo an induction process to metabolize glucose, resultingin a pH drop that is both of a smaller magnitude and delayed.
Functional 3D tomographic imaging. In Fig. 2f and g, weshow the image-based pH calibration graphs for the (panel f)E. coli PHL628 biofilm (r2 � 0.99) and (panel g) wastewaterbiofilm (r2 � 0.99) image settings as calculated by the modifiedHenderson-Hasselbalch equation described in Materials andMethods, where Fi � IFITC/ICy5 and Fmin and Fmax are theextreme values of Fi at low and high pHs, respectively. Fmin,Fmax, and Fi were calculated by pixelwise analysis of confocalmicroscopy images of C dot sensors suspended in calibrationbuffers of various pHs as described in Materials and Methods.Based on these calibration curves, we were able to accuratelydetermine pHs ranging from 5.0 to 8.0, which covers the phys-iological range of this system. The two bacterial systems wereanalyzed on separate occasions and thus were analyzed based
on different calibration curves to correct for differences in 488-and 633-nm laser intensity, filter settings for optimal imaging,and solution conditions (Fig. 2f and g).
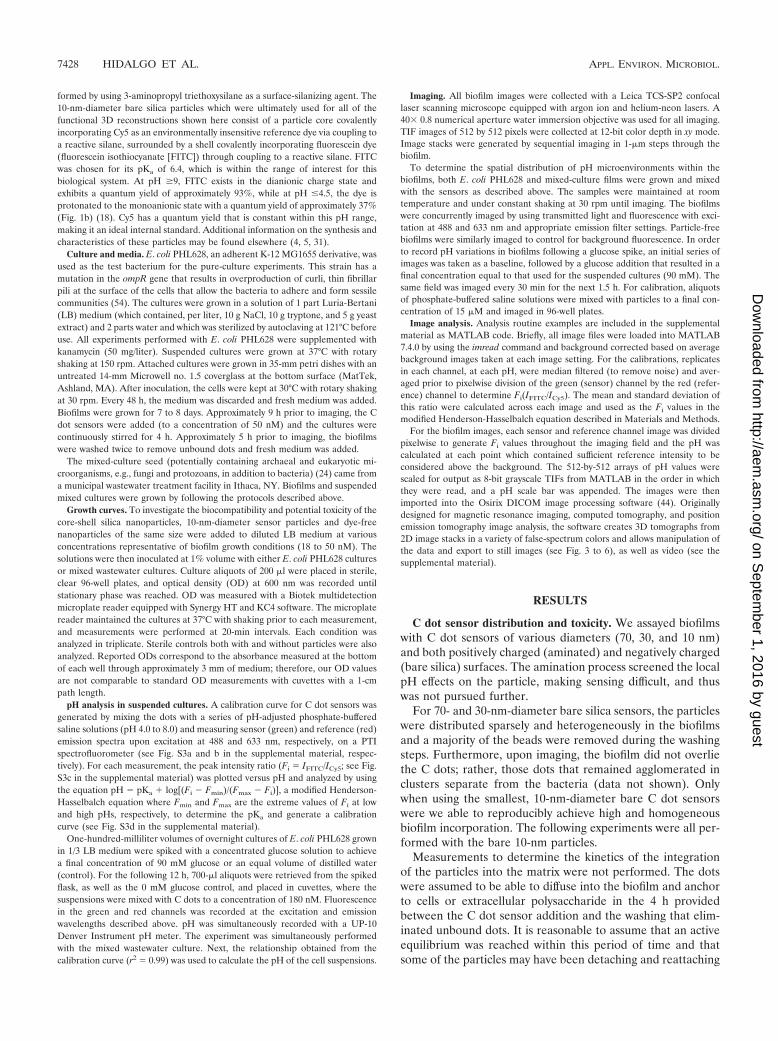
Figure 3a and b show, respectively, the green (sensor dye)channel and the red (reference dye) channel confocal imagesof a typical live, hydrated E. coli PHL628 biofilm at a focalplane 90 �m from the attachment substratum. Figure 3c de-picts the sensor and reference images merged with a bright-field image of the biofilm, demonstrating the incorporation ofthe particles within the film. The greater depth of field of thebright-field image shows the structure of the film above andbelow the confocal image plane, which accounts for the appar-ent mismatch of the fluorescence and bright-field images. Ver-tical scanning of the sample results in registry of particle flu-orescence with the bright-field images of the biofilm over thefull z range of imaging (top maximum intensity projection,Fig. 3e).
The pH was analyzed ratiometrically based on the sensorand reference images and is expressed in pseudocolor (red-yellow) in Fig. 3d overlaid on the bright-field image. The pHscale is shown at the right. Specifically, the pH within the coreof the biofilm is low (red) and increases (orange/yellow) to-ward the periphery of the film, potentially due to low rates of
FIG. 3. E. coli confocal and tomographic pH imaging. (a) Green and (b) red channel confocal images of a typical live, hydrated E. coli PHL628biofilm at a focal plane 90 �m from the substratum. (c) Sensor and reference images superimposed on a bright-field image of the biofilm, showingthe colocalization of the particles in the film. The pH was analyzed ratiometrically based on the sensor and reference images and is expressed asa false spectrum (red-yellow) in panel d overlaid on the bright-field image, with the pH scale shown at the right. (e) Top-down and (f) sidevolumetric projections (smooth opacity, OsiriX) of the reconstructed biofilm pH map show the local variation in pH from the neutral outsidesurface of the film to the acidic core (scales in panels e and f). pH values are shown at a few sites in panels d and f to show the gradients.
7430 HIDALGO ET AL. APPL. ENVIRON. MICROBIOL.
on Septem
ber 1, 2016 by guesthttp://aem
.asm.org/
Dow
nloaded from

diffusion of acidic metabolites into solution or the accumula-tion of fermentation products in oxygen-limited portions of thebiofilm. This region of the biofilm was imaged from the attach-ment substratum up through a depth of 160 �m in 1-�m stepsand volumetrically reconstructed to show the biofilm morphol-ogy, as well as the pH gradients and microenvironments in thex, y, and z directions. Top and side maximum projections arepresented in Fig. 3e and f, respectively. The vertical gradientfrom low pH deep in the film to more neutral pH at the uppersurface observed in the side view (Fig. 3f) correlates well withthe in-plane gradients shown in Fig. 3d. For a “fly-through”movie of the full tomographic reconstruction, see Video S1 inthe supplemental material.
It is worth pointing out that Fig. 3c and 4a show the mergedgreen and red channel images over the bright-field image asviewed on the microscope. Because, when using C dots, theintensity of the red channel is constant and that of the greensignal increases with pH, the images locally appear red, yellow,and green, depending on the local intensity of sensor andreference emission. While these overlaid images provide aqualitative assessment of pH, the on-scope calibrations (Fig. 2fand g) convert the green/red intensity ratio to pH for each
pixel. These data are represented as ratiometric pH maps (Fig.3d to f, 4b to f, 5a to f, and 6b and c) which use a false spectrumto represent the local pH, from red to yellow, as shown in thescale appended to each image or series. These false-color pHmaps were generated with Osirix image processing software byusing a color lookup table.
Figure 4a and b depict the overlay and ratiometric pH im-ages of a mixed-culture biofilm 77 �m from the substratum.The pH is more heterogeneous throughout this mixed culturethan the axenic one, both horizontally and vertically, as re-vealed by the variation in top and side maximum-intensityprojections in Fig. 3e and f and 4c and d. Figure 4e and f showthe distinct pH microenvironments in the 3D pH image of themixed-culture film by presenting projections of the full tomo-graphic reconstruction (500 by 500 by 160 �m). For the cor-responding fly-through video, see Video S2 in the supplemen-tal material. Based on the morphological and chemicaldifferences between microenvironments, it is likely that bacte-ria from different functional groups are coexisting and gener-ating different metabolic by-products.
Investigating specific regions of interest by zooming into thefull tomographic reconstructions and providing various views
FIG. 4. Mixed-culture confocal and tomographic pH images. (a) Sensor and reference confocal images of a live, hydrated wastewater biofilmat a focal plane 77 �m from the substratum superimposed on a bright-field image of the biofilm showing the colocalization of the particles in thefilm. The pH was analyzed ratiometrically based on the sensor and reference images and is expressed as a false spectrum (red-yellow) in panel band overlaid on the bright-field image with the pH scale shown at the right. Top-down (c) and side (d) maximum-intensity projections of thebiofilm. (e and f) Off-axis maximum-intensity projections of the fully reconstructed biofilm pH map (500 by 500 by 160 �m) showing theconsiderable heterogeneity that exists within the mixed-culture film, where a weblike neutral environment exists within the acidic film with towerstructures surrounding and penetrating it.
VOL. 75, 2009 IMAGING OF pH MICROENVIRONMENTS IN MICROBIAL BIOFILMS 7431
on Septem
ber 1, 2016 by guesthttp://aem
.asm.org/
Dow
nloaded from

of the E. coli and mixed-culture biofilms (Fig. 5) demonstratesthe power of nanoparticle sensor-enabled 3D functional imag-ing. Figure 5a to c show in detail the low-to-neutral pH gradi-ent formed from the core of the biofilm to the periphery, aswell as the fine structure with channels and voids of the E. colifilm. Figure 5d to f show the voids formed by the interpene-tration of the low-pH film components and the fibrous neutralregions, as well as the different growth habits of the two, includinga mushroom-like protrusion in the mixed-culture biofilm.
Figure 6a depicts the average pH versus time following aglucose injection (90 mM) for E. coli PHL628 (red) and waste-
water mixed culture (blue) biofilms. Figure 6b and c show thecorresponding confocal ratiometric pH images at t � 0 and 90min, respectively, after glucose addition to the E. coli PHL628biofilm at a focal plane 60 �m from the attachment substratum(for further images, see the supplemental material).
The E. coli biofilm pH drops sharply from 6.3 to 5.2 in thefirst 30 min and then remains constant for the remainder of theexperiment. The wastewater biofilm follows a similar trend,though the magnitude of the pH change is smaller (plateauvalue of 5.6 at 90 min; see the images in the supplementalmaterial). This result is similar to the behavior observed in the
FIG. 5. Magnified views of regions of interest in E. coli and mixed-culture biofilms. (a) Off-axis maximum-intensity projection of thereconstructed E. coli PHL628 biofilm and pH map scale at the left (pHs 4.0 to 8.0, red-yellow). For panels a and d, a region of interest was definedby the white cube (160 by 160 by 160 �m). Panels b and c are top and side views of the region of interest defined by the white cube in panel a,showing the pH heterogeneities, as well as the local structure, of the biofilm. (d) Off-axis volumetric (smooth table) projection of the reconstructedwastewater mixed-culture biofilm and pH map scale at the left (pHs 4.0 to 8.0, red-yellow). (e and f) Top and side views of the cube shown in paneld showing the pH heterogeneities, as well as the local structure, of the biofilm, including voids, channels, and a tower.
FIG. 6. Time-resolved in situ pH measurements in biofilms. (a) Average pH versus time postinjection of 90 mM glucose into biofilms of E. coliPHL628 (in red, mean � standard deviation, n � 3) and mixed wastewater culture (in blue, mean � standard deviation, n � 6). Values aresignificantly different from t � 30 min onward (one-tailed Mann-Whitney U test, P � 0.011). (b and c) Imaging of C dots within an E. coli PHL628biofilm corresponding to the initial (b) and final (c) time points of the graph shown in panel a (the color scale corresponds to pHs of 4 to 8).
7432 HIDALGO ET AL. APPL. ENVIRON. MICROBIOL.
on Septem
ber 1, 2016 by guesthttp://aem
.asm.org/
Dow
nloaded from
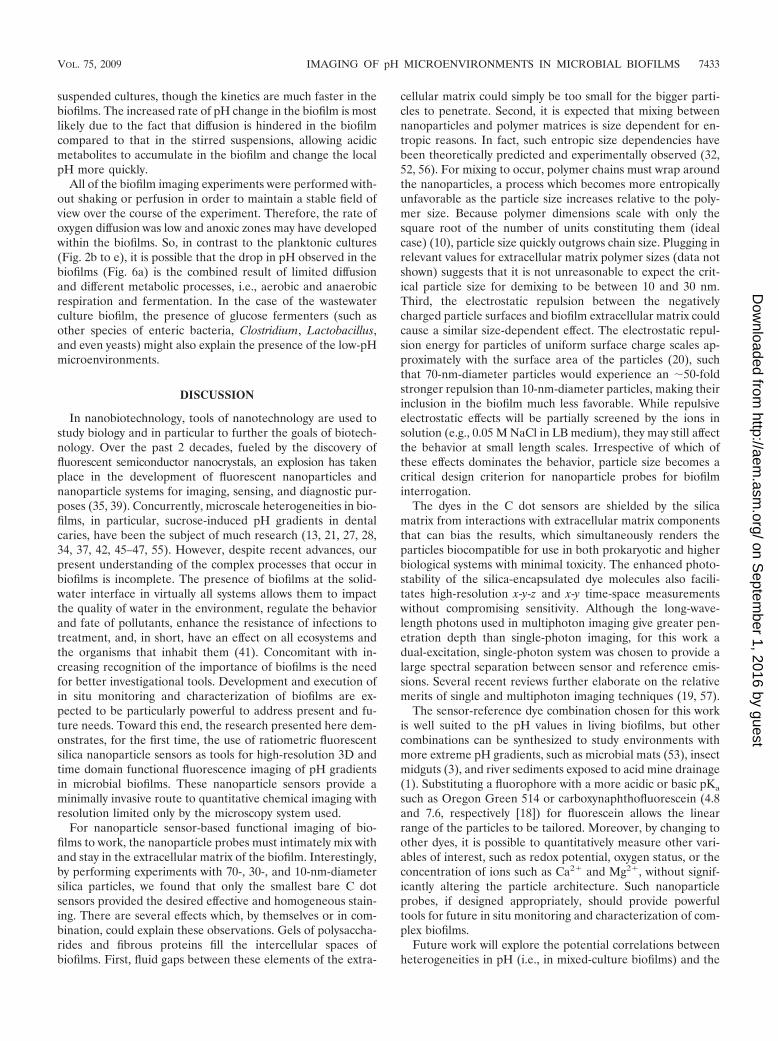
suspended cultures, though the kinetics are much faster in thebiofilms. The increased rate of pH change in the biofilm is mostlikely due to the fact that diffusion is hindered in the biofilmcompared to that in the stirred suspensions, allowing acidicmetabolites to accumulate in the biofilm and change the localpH more quickly.
All of the biofilm imaging experiments were performed with-out shaking or perfusion in order to maintain a stable field ofview over the course of the experiment. Therefore, the rate ofoxygen diffusion was low and anoxic zones may have developedwithin the biofilms. So, in contrast to the planktonic cultures(Fig. 2b to e), it is possible that the drop in pH observed in thebiofilms (Fig. 6a) is the combined result of limited diffusionand different metabolic processes, i.e., aerobic and anaerobicrespiration and fermentation. In the case of the wastewaterculture biofilm, the presence of glucose fermenters (such asother species of enteric bacteria, Clostridium, Lactobacillus,and even yeasts) might also explain the presence of the low-pHmicroenvironments.
DISCUSSION
In nanobiotechnology, tools of nanotechnology are used tostudy biology and in particular to further the goals of biotech-nology. Over the past 2 decades, fueled by the discovery offluorescent semiconductor nanocrystals, an explosion has takenplace in the development of fluorescent nanoparticles andnanoparticle systems for imaging, sensing, and diagnostic pur-poses (35, 39). Concurrently, microscale heterogeneities in bio-films, in particular, sucrose-induced pH gradients in dentalcaries, have been the subject of much research (13, 21, 27, 28,34, 37, 42, 45–47, 55). However, despite recent advances, ourpresent understanding of the complex processes that occur inbiofilms is incomplete. The presence of biofilms at the solid-water interface in virtually all systems allows them to impactthe quality of water in the environment, regulate the behaviorand fate of pollutants, enhance the resistance of infections totreatment, and, in short, have an effect on all ecosystems andthe organisms that inhabit them (41). Concomitant with in-creasing recognition of the importance of biofilms is the needfor better investigational tools. Development and execution ofin situ monitoring and characterization of biofilms are ex-pected to be particularly powerful to address present and fu-ture needs. Toward this end, the research presented here dem-onstrates, for the first time, the use of ratiometric fluorescentsilica nanoparticle sensors as tools for high-resolution 3D andtime domain functional fluorescence imaging of pH gradientsin microbial biofilms. These nanoparticle sensors provide aminimally invasive route to quantitative chemical imaging withresolution limited only by the microscopy system used.
For nanoparticle sensor-based functional imaging of bio-films to work, the nanoparticle probes must intimately mix withand stay in the extracellular matrix of the biofilm. Interestingly,by performing experiments with 70-, 30-, and 10-nm-diametersilica particles, we found that only the smallest bare C dotsensors provided the desired effective and homogeneous stain-ing. There are several effects which, by themselves or in com-bination, could explain these observations. Gels of polysaccha-rides and fibrous proteins fill the intercellular spaces ofbiofilms. First, fluid gaps between these elements of the extra-
cellular matrix could simply be too small for the bigger parti-cles to penetrate. Second, it is expected that mixing betweennanoparticles and polymer matrices is size dependent for en-tropic reasons. In fact, such entropic size dependencies havebeen theoretically predicted and experimentally observed (32,52, 56). For mixing to occur, polymer chains must wrap aroundthe nanoparticles, a process which becomes more entropicallyunfavorable as the particle size increases relative to the poly-mer size. Because polymer dimensions scale with only thesquare root of the number of units constituting them (idealcase) (10), particle size quickly outgrows chain size. Plugging inrelevant values for extracellular matrix polymer sizes (data notshown) suggests that it is not unreasonable to expect the crit-ical particle size for demixing to be between 10 and 30 nm.Third, the electrostatic repulsion between the negativelycharged particle surfaces and biofilm extracellular matrix couldcause a similar size-dependent effect. The electrostatic repul-sion energy for particles of uniform surface charge scales ap-proximately with the surface area of the particles (20), suchthat 70-nm-diameter particles would experience an �50-foldstronger repulsion than 10-nm-diameter particles, making theirinclusion in the biofilm much less favorable. While repulsiveelectrostatic effects will be partially screened by the ions insolution (e.g., 0.05 M NaCl in LB medium), they may still affectthe behavior at small length scales. Irrespective of which ofthese effects dominates the behavior, particle size becomes acritical design criterion for nanoparticle probes for biofilminterrogation.
The dyes in the C dot sensors are shielded by the silicamatrix from interactions with extracellular matrix componentsthat can bias the results, which simultaneously renders theparticles biocompatible for use in both prokaryotic and higherbiological systems with minimal toxicity. The enhanced photo-stability of the silica-encapsulated dye molecules also facili-tates high-resolution x-y-z and x-y time-space measurementswithout compromising sensitivity. Although the long-wave-length photons used in multiphoton imaging give greater pen-etration depth than single-photon imaging, for this work adual-excitation, single-photon system was chosen to provide alarge spectral separation between sensor and reference emis-sions. Several recent reviews further elaborate on the relativemerits of single and multiphoton imaging techniques (19, 57).
The sensor-reference dye combination chosen for this workis well suited to the pH values in living biofilms, but othercombinations can be synthesized to study environments withmore extreme pH gradients, such as microbial mats (53), insectmidguts (3), and river sediments exposed to acid mine drainage(1). Substituting a fluorophore with a more acidic or basic pKa
such as Oregon Green 514 or carboxynaphthofluorescein (4.8and 7.6, respectively [18]) for fluorescein allows the linearrange of the particles to be tailored. Moreover, by changing toother dyes, it is possible to quantitatively measure other vari-ables of interest, such as redox potential, oxygen status, or theconcentration of ions such as Ca2� and Mg2�, without signif-icantly altering the particle architecture. Such nanoparticleprobes, if designed appropriately, should provide powerfultools for future in situ monitoring and characterization of com-plex biofilms.
Future work will explore the potential correlations betweenheterogeneities in pH (i.e., in mixed-culture biofilms) and the
VOL. 75, 2009 IMAGING OF pH MICROENVIRONMENTS IN MICROBIAL BIOFILMS 7433
on Septem
ber 1, 2016 by guesthttp://aem
.asm.org/
Dow
nloaded from

bacterial species present at those locations. This line of re-search can be carried out by fluorescence in situ hybridizationperformed on biofilms colabeled with pH-sensing C dots. Thisobjective might also be pursued by staining of extracellularproducts with fluorescent lectins specific for the polysaccha-rides that are produced by the particular microorganismswhich are being tested, followed by concurrent imaging of thelectins and the sensor particles. The latter approach, althoughindirect, may provide an interesting and so-far-unexplored per-spective.
ACKNOWLEDGMENTS
We appreciate the assistance of Carol Bayles and the Microscopyand Imaging Facility of the Cornell Biotechnology Research Center.
Gabriela Hidalgo was funded through a CONACYT graduate fel-lowship. This work was supported in part by NSF grant EAR-0311767.Andrew Burns was supported by the Cornell Nanobiotechnology Cen-ter (NBTC), an STC center of the NSF, under agreement ECS-9876771.
U.W. has a financial role in a start-up company (Hybrid SilicaTechnologies) in the field of fluorescent nanoparticle development.
REFERENCES
1. Blothe, M., D. M. Akob, J. E. Kostka, K. Goschel, H. L. Drake, and K. Kusel.2008. pH gradient-induced heterogeneity of Fe(III)-reducing microorgan-isms in coal mining-associated lake sediments. Appl. Environ. Microbiol.74:1019–1029.
2. Botvinick, E. L., and J. V. Shah. 2007. Laser-based measurements in cellbiology. Methods Cell Biol. 82:81–109.
3. Brune, A., D. Emerson, and J. A. Breznak. 1995. The termite gut microfloraas an oxygen sink: microelectrode determination of oxygen and pH gradientsin guts of lower and higher termites. Appl. Environ. Microbiol. 61:2681–2687.
4. Burns, A., H. Ow, and U. Wiesner. 2006. Fluorescent core-shell silica nano-particles: towards “Lab on a Particle” architectures for nanobiotechnology.Chem. Soc. Rev. 35:1028–1042.
5. Burns, A., P. Sengupta, T. Zedayko, B. Baird, and U. Wiesner. 2006. Core-shell fluorescent silica nanopartictes for chemical sensing: towards single-particle laboratories. Small 2:723–726.
6. Chang, C. W., D. Sud, and M. A. Mycek. 2007. Fluorescence lifetime imagingmicroscopy. Methods Cell Biol. 81:495–524.
7. Choi, J. H., A. A. Burns, R. M. Williams, Z. X. Zhou, A. Flesken-Nikitin,W. R. Zipfel, U. Wiesner, and A. Y. Nikitin. 2007. Core-shell silica nanopar-ticles as fluorescent labels for nanomedicine. J. Biomed. Opt. 12:064007.doi:10.1117/1.2823149.
8. Clark, H. A., M. Hoyer, M. A. Philbert, and R. Kopelman. 1999. Opticalnanosensors for chemical analysis inside single living cells. 1. Fabrication,characterization, and methods for intracellular delivery of PEBBLE sensors.Anal. Chem. 71:4831–4836.
9. de Beer, D., P. Stoodley, F. Roe, and Z. Lewandowski. 1994. Effects of biofilmstructures on oxygen distribution and mass transport. Biotechnol. Bioeng.43:1131–1138.
10. De Gennes, P.-G. 1979. Scaling concepts in polymer physics. Cornell Uni-versity Press, Ithaca, NY.
11. Dethlefsen, L., M. McFall-Ngai, and D. A. Relman. 2007. An ecological andevolutionary perspective on human-microbe mutualism and disease. Nature449:811–818.
12. Donlan, R. M. 2002. Biofilms: microbial life on surfaces. Emerg. Infect. Dis.8:881–890.
13. Ferris, M. J., T. S. Magnuson, J. A. Fagg, R. Thar, M. Kuhl, K. B. Sheehan,and J. M. Henson. 2003. Microbially mediated sulphide production in athermal, acidic algal mat community in Yellowstone National Park. Environ.Microbiol. 5:954–960.
14. Gieseke, A., S. Tarre, M. Green, and D. de Beer. 2006. Nitrification in abiofilm at low pH values: role of in situ microenvironments and acid toler-ance. Appl. Environ. Microbiol. 72:4283–4292.
15. Gilbert, P., T. Maira-Litran, A. J. McBain, A. H. Rickard, and F. W. Whyte.2002. The physiology and collective recalcitrance of microbial biofilm com-munities. Adv. Microb. Physiol. 46:202–256.
16. Gryczynski, Z., I. Gryczynski, and J. R. Lakowicz. 2003. Fluorescence-sens-ing methods. Methods Enzymol. 360:44–75.
17. Hall-Stoodley, L., J. W. Costerton, and P. Stoodley. 2004. Bacterial biofilms:from the natural environment to infectious diseases. Nat. Rev. Microbiol.2:95–108.
18. Haugland, R. P. 2007. The handbook—a guide to fluorescent probes andlabeling technologies, 10th ed. Molecular Probes, Inc., Eugene, OR.
19. Helmchen, F., and W. Denk. 2005. Deep tissue two-photon microscopy. Nat.Methods 2:932–940.
20. Hermansson, M. 1999. The DLVO theory in microbial adhesion. ColloidsSurf. B Biointerfaces 14:105–119.
21. Hunter, K. S., Y. Wang, and P. Van Cappellen. 1998. Kinetic modeling ofmicrobially-driven redox chemistry of subsurface environments:couplingtransport, microbial metabolism and geochemistry. J. Hydrol. 209:53–80.
22. Hunter, R. C., and T. J. Beveridge. 2005. Application of a pH-sensitivefluoroprobe (C-SNARF-4) for pH microenvironment analysis in Pseudomo-nas aeruginosa biofilms. Appl. Environ. Microbiol. 71:2501–2510.
23. Ito, T., J. L. Nielsen, S. Okabe, Y. Watanabe, and P. H. Nielsen. 2002.Phylogenetic identification and substrate uptake patterns of sulfate-reducingbacteria inhabiting an oxic-anoxic sewer biofilm determined by combiningmicroautoradiography and fluorescent in situ hybridization. Appl. Environ.Microbiol. 68:356–364.
24. Kaewpipat, K., and C. P. Grady, Jr. 2002. Microbial population dynamics inlaboratory-scale activated sludge reactors. Water Sci. Technol. 46:19–27.
25. Kemner, K. M., S. D. Kelly, B. Lai, J. Maser, J. O’Loughlin, E., D. Sholto-Douglas, Z. Cai, M. A. Schneegurt, C. F. Kulpa, Jr., and K. H. Nealson. 2004.Elemental and redox analysis of single bacterial cells by X-ray microbeamanalysis. Science 306:686–687.
26. Koo, Y. E. L., Y. F. Cao, R. Kopelman, S. M. Koo, M. Brasuel, and M. A.Philbert. 2004. Real-time measurements of dissolved oxygen inside live cellsby organically modified silicate fluorescent nanosensors. Anal. Chem. 76:2498–2505.
27. Kuhl, M. 2005. Optical microsensors for analysis of microbial communities.Methods Enzymol. 397:166–199.
28. Kuhl, M., and T. Fenchel. 2000. Bio-optical characteristics and the verticaldistribution of photosynthetic pigments and photosynthesis in an artificialcyanobacterial mat. Microb. Ecol. 40:94–103.
29. Kuseler, A., V. Baelum, O. Fejerskov, and J. Heidmann. 1993. Accuracy andprecision in vitro of Beetrode microelectrodes used for intraoral pH mea-surements. Caries Res. 27:183–190.
30. Lappin-Scott, H. M., and J. W. Costerton. 1989. Bacterial biofilms andsurface fouling. Biofouling 1:323–342.
31. Larson, D. R., H. Ow, H. D. Vishwasrao, A. A. Heikal, U. Wiesner, and W. W.Webb. 2008. Silica nanoparticle architecture determines radiative propertiesof encapsulated fluorophores. Chem. Mater. 20:2677–2684.
32. Mackay, M. E., A. Tuteja, P. M. Duxbury, C. J. Hawker, B. Van Horn, Z. B.Guan, G. H. Chen, and R. S. Krishnan. 2006. General strategies for nano-particle dispersion. Science 311:1740–1743.
33. Marquis, R. E. 1995. Oxygen metabolism, oxidative stress and acid-basephysiology of dental plaque biofilms. J. Ind. Microbiol. 15:198–207.
34. Marsh, P. D., and D. J. Bradshaw. 1995. Dental plaque as a biofilm. J. Ind.Microbiol. 15:169–175.
35. Michalet, X., F. F. Pinaud, L. A. Bentolila, J. M. Tsay, S. Doose, J. J. Li, G.Sundaresan, A. M. Wu, S. S. Gambhir, and S. Weiss. 2005. Quantum dots forlive cells, in vivo imaging, and diagnostics. Science 307:538–544.
36. Okabe, S., T. Itoh, H. Satoh, and Y. Watanabe. 1999. Analyses of spatialdistributions of sulfate-reducing bacteria and their activity in aerobic waste-water biofilms. Appl. Environ. Microbiol. 65:5107–5116.
37. Okabe, S., H. Satoh, and Y. Watanabe. 1999. In situ analysis of nitrifyingbiofilms as determined by in situ hybridization and the use of microelec-trodes. Appl. Environ. Microbiol. 65:3182–3191.
38. Palmer, R. J., Jr., and C. Sternberg. 1999. Modern microscopy in biofilmresearch: confocal microscopy and other approaches. Curr. Opin. Biotech-nol. 10:263–268.
39. Piao, Y., A. Burns, J. Kim, U. Wiesner, and T. Hyeon. 2008. Designedfabrication of silica-based nanostructured particle systems for nanomedicineapplications. Adv. Funct. Mater. 18:3745–3758.
40. Plumbridge, J. 1998. Control of the expression of the manXYZ operon inEscherichia coli: Mlc is a negative regulator of the mannose PTS. Mol.Microbiol. 27:369–380.
41. Potera, C. 1996. Biofilms invade microbiology. Science 273:1795–1797.42. Ramsing, N. B., M. Kuhl, and B. B. Jorgensen. 1993. Distribution of sulfate-
reducing bacteria, O2, and H2S in photosynthetic biofilms determined byoligonucleotide probes and microelectrodes. Appl. Environ. Microbiol. 59:3840–3849.
43. Roeselers, G., M. C. M. van Loosdrecht, and G. Muyzer. 2008. Phototrophicbiofilms and their potential applications. J. Appl. Phycol. 20:227–235.
44. Rosset, A., L. Spadola, and O. Ratib. 2004. OsiriX: an open-source softwarefor navigating in multidimensional DICOM images. J. Digital Imaging 17:205–216.
45. Sissons, C. 1998. Plaque, plaque model systems and pH. N. Z. Dent. J.94:56–60.
46. Sissons, C. H., T. W. Cutress, G. Faulds, and L. Wong. 1992. pH responsesto sucrose and the formation of pH gradients in thick ‘artificial mouth’microcosm plaques. Arch. Oral Biol. 37:913–922.
47. Sissons, C. H., L. Wong, E. M. Hancock, and T. W. Cutress. 1994. pHgradients induced by urea metabolism in ‘artificial mouth’ microcosmplaques. Arch. Oral Biol. 39:507–511.
7434 HIDALGO ET AL. APPL. ENVIRON. MICROBIOL.
on Septem
ber 1, 2016 by guesthttp://aem
.asm.org/
Dow
nloaded from
48. Stewart, P. S., and M. J. Franklin. 2008. Physiological heterogeneity inbiofilms. Nat. Rev. Microbiol. 6:199–210.
49. Stief, P., and G. Eller. 2006. The gut microenvironment of sediment-dwellingChironomus plumosus larvae as characterised with O2, pH, and redox mi-crosensors. J. Comp. Physiol. B 176:673–683.
50. Stober, W., A. Fink, and E. Bohn. 1968. Controlled growth of monodispersesilica spheres in micron size range. J. Colloid Interface Sci. 26:62–69.
51. Stoodley, P., K. Sauer, D. G. Davies, and J. W. Costerton. 2002. Biofilms ascomplex differentiated communities. Annu. Rev. Microbiol. 56:187–209.
52. Thompson, R. B., V. V. Ginzburg, M. W. Matsen, and A. C. Balazs. 2001.Predicting the mesophases of copolymer-nanoparticle composites. Science292:2469–2472.
53. Vasconcelos, C., R. Warthmann, J. A. McKenzie, P. T. Visscher, A. G.Bittermann, and Y. van Lith. 2006. Lithifying microbial mats in LagoaVermelba, Brazil: modern Precambrian relics? Sediment. Geol. 185:175–183.
54. Vidal, O., R. Longin, C. Prigent-Combaret, C. Dorel, M. Hooreman, and P.
Lejeune. 1998. Isolation of an Escherichia coli K-12 mutant strain able toform biofilms on inert surfaces: involvement of a new ompR allele thatincreases curli expression. J. Bacteriol. 180:2442–2449.
55. Vroom, J. M., K. J. De Graw, H. C. Gerritsen, D. J. Bradshaw, P. D. Marsh,K. G. Watson, J. J. Birmingham, and C. Allison. 1999. Depth penetrationand detection of pH gradients in biofilms by two-photon excitation micros-copy. Appl. Environ. Microbiol. 65:3502–3511.
56. Warren, S. C., F. J. Disalvo, and U. Wiesner. 2007. Nanoparticle-tunedassembly and disassembly of mesostructured silica hybrids. Nat. Mater.6:156–161.
57. Williams, R. M., D. W. Piston, and W. W. Webb. 1994. 2-photon molecular-excitation provides intrinsic 3-dimensional resolution for laser-based micros-copy and microphotochemistry. FASEB J. 8:804–813.
58. Xi, C., D. Marks, S. Schlachter, W. Luo, and S. A. Boppart. 2006. High-resolution three-dimensional imaging of biofilm development using opticalcoherence tomography. J. Biomed. Opt. 11:34001.
VOL. 75, 2009 IMAGING OF pH MICROENVIRONMENTS IN MICROBIAL BIOFILMS 7435
on Septem
ber 1, 2016 by guesthttp://aem
.asm.org/
Dow
nloaded from