
Functional genomics of the Glanville fritillary butterfly - CORE
40
FUNCTIONAL GENOMICS OF THE GLANVILLE FRITILLARY BUTTERFLY JOUNI KVIST Metapopulation Research Group Department of Biosciences Faculty of Biological and Environmental Sciences University of Helsinki Finland ACADEMIC DISSERTATION To be presented for public examination with the permission of the Faculty of Biological and Environmental Sciences of the University of Helsinki in Lecture hall 2402 (Telkänpönttö) in Biocenter 3, Viikinkaari 1 on October 24 th 2014 at 12 o’clock noon. Dissertationes Schola Doctoralis Scientiae Circumiectalis, Alimentarie, Biologicae 4/2014 brought to you by CORE View metadata, citation and similar papers at core.ac.uk provided by Helsingin yliopiston digitaalinen arkisto
-
Upload
khangminh22 -
Category
Documents
-
view
1 -
download
0
Transcript of Functional genomics of the Glanville fritillary butterfly - CORE
FUNCTIONAL GENOMICS OF THE GLANVILLE FRITILLARY BUTTERFLY
JOUNI KVIST
Metapopulation Research Group
Department of Biosciences
Faculty of Biological and Environmental Sciences
University of Helsinki
Finland
ACADEMIC DISSERTATION
To be presented for public examination with the permission of the Faculty of Biological andEnvironmental Sciences of the University of Helsinki in Lecture hall 2402 (Telkänpönttö)
in Biocenter 3, Viikinkaari 1 on October 24th 2014 at 12 o’clock noon.
Dissertationes Schola Doctoralis Scientiae Circumiectalis, Alimentarie, Biologicae 4/2014
brought to you by COREView metadata, citation and similar papers at core.ac.uk
provided by Helsingin yliopiston digitaalinen arkisto
Supervised by: Docent Mikko Frilander Institute of Biotechnology University of Helsinki, Finland
Professor Ilkka Hanski Department of Biosciences University of Helsinki, Finland
Reviewed by: Professor Jaakko Kangasjärvi Department of Biosciences University of Helsinki, Finland
Professor Craig Primmer Department of Biology University of Turku, Finland
Examined by: Professor Thomas Flatt Department of Ecology and Evolution University of Lausanne, Switzerland
Custos: Professor Otso Ovaskainen Department of Biosciences University of Helsinki, Finland
ISBN 978-951-51-0246-1 (paperback)ISBN 978-951-51-0247-8 (PDF)ISSN 2342-5423 (paperback)ISSN 2342-5431 (PDF)http://ethesis.helsinki.fi
Cover photo by Pave VäisäsenCover layout by Anita TienhaaraLayout by Emilia Pippola & Jouni KvistHansaprint Oy, Vantaa, Finland 2014

CONTENTS
ABSTRACT .............................................................................................................................................................................................6
TIIVISTELMÄ ..........................................................................................................................................................................................6
1. INTRODUCTION ..............................................................................................................................................................................71.1. Life history traits & trade-offs .............................................................................................................................101.2. Flight & reproduction ..........................................................................................................................................101.3. Juvenile hormone, ecdysone & PTTH .................................................................................................................111.4. Hexamerins (larval serum proteins) .................................................................................................................. 121.5. Hypoxia & SDHD ................................................................................................................................................ 131.6. The innate immune response ............................................................................................................................. 14
2. THE STUDY SPECIES .................................................................................................................................................................... 162.1. The life history syndrome ................................................................................................................................... 162.2. Transcriptome sequencing & custom made microarrays .................................................................................. 172.3. Genome sequencing & RNA-seq analysis .......................................................................................................... 17
3. AIMS OF THE STUDY ................................................................................................................................................................... 183.1. Expression variation affecting colonization (I) ..................................................................................................183.2. Variability & heritability of development traits (II) .......................................................................................... 193.3. Expression variation affecting larval development (II) ..................................................................................... 193.4. Expression variation associated with flight performance (III) ......................................................................... 193.5. The effects of habitat fragmentation on gene expression & SNP variation (IV) ...............................................20
4. RESULTS & DISCUSSION ............................................................................................................................................................ 214.1. Egg development genes are more expressed in new populations (I) ................................................................. 214.2. Breakdown of muscle tissue facilitates higher egg production in new-population females (I) ........................ 214.3. New-population females have altered hypoxia signaling (I) .............................................................................224.4. Differences in hormonal signaling is heritable and determines larval development rate (II) .........................224.5. Microarrays outperform quantitative real-time PCR (II) ..................................................................................234.6. Flight changes the expression hypoxia and immune response genes (III) .......................................................244.7. The sex chromosome is driving higher flight metabolic rate in males (III) ......................................................254.8. The population differences in flight performance result from the same regulatory mechanisms (III) ...........254.9. Populations in fragmented landscapes are more similar to each other compared to continuous populations (IV) ......................................................................................................................................................................274.10. Fragmentation lead to altered hormonal regulation (IV) ................................................................................274.11. Hypoxia signaling changes in fragmented landscapes (IV) ............................................................................28
5. CONCLUSIONS ............................................................................................................................................................................. 29
6. ACKNOWLEDGEMENTS ............................................................................................................................................................. 30
7. REFERENCES .................................................................................................................................................................................. 30
ORIGINAL PUBLICATIONS ............................................................................................................................................................. 41I Functional genomics of life history variation in a butterfly metapopulation ......................................................... 41II Temperature treatments during larval development reveal extensive heritable and plastic variation in gene expression and life history traits. ...........................................................................................................................59III Flight-induced changes in gene expression in the Glanville fritillary butterfly...................................................79IV Transcriptome analysis reveals signature of adaptation to landscape fragmentation ...................................... 101
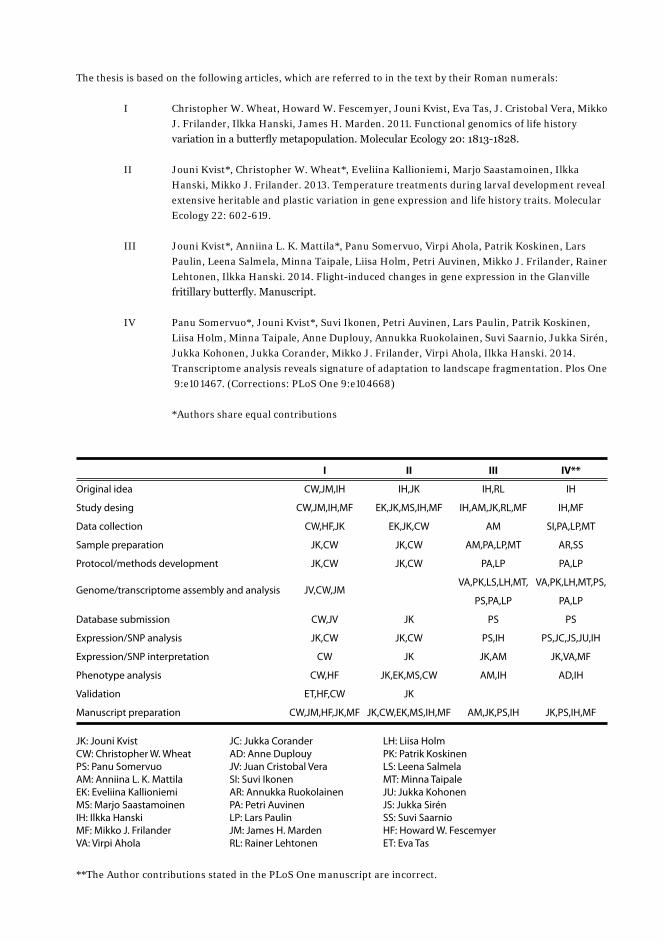
The thesis is based on the following articles, which are referred to in the text by their Roman numerals:
I Christopher W. Wheat, Howard W. Fescemyer, Jouni Kvist, Eva Tas, J. Cristobal Vera, Mikko J. Frilander, Ilkka Hanski, James H. Marden. 2011. Functional genomics of life history variation in a butterfly metapopulation. Molecular Ecology 20: 1813-1828.
II Jouni Kvist*, Christopher W. Wheat*, Eveliina Kallioniemi, Marjo Saastamoinen, Ilkka Hanski, Mikko J. Frilander. 2013. Temperature treatments during larval development reveal extensive heritable and plastic variation in gene expression and life history traits. Molecular Ecology 22: 602-619.
III Jouni Kvist*, Anniina L. K. Mattila*, Panu Somervuo, Virpi Ahola, Patrik Koskinen, Lars Paulin, Leena Salmela, Minna Taipale, Liisa Holm, Petri Auvinen, Mikko J. Frilander, Rainer Lehtonen, Ilkka Hanski. 2014. Flight-induced changes in gene expression in the Glanville fritillary butterfly. Manuscript.
IV Panu Somervuo*, Jouni Kvist*, Suvi Ikonen, Petri Auvinen, Lars Paulin, Patrik Koskinen, Liisa Holm, Minna Taipale, Anne Duplouy, Annukka Ruokolainen, Suvi Saarnio, Jukka Sirén, Jukka Kohonen, Jukka Corander, Mikko J. Frilander, Virpi Ahola, Ilkka Hanski. 2014. Transcriptome analysis reveals signature of adaptation to landscape fragmentation. Plos One 9:e101467. (Corrections: PLoS One 9:e104668)
*Authors share equal contributions
Original idea
Study desing
Data collection
Sample preparation
Protocol/methods development
Genome/transcriptome assembly and analysis
Database submission
Expression/SNP analysis
Expression/SNP interpretation
Phenotype analysis
Validation
Manuscript preparation
I
CW,JM,IH
CW,JM,IH,MF
CW,HF,JK
JK,CW
JK,CW
JV,CW,JM
CW,JV
JK,CW
CW
CW,HF
ET,HF,CW
CW,JM,HF,JK,MF
II
IH,JK
EK,JK,MS,IH,MF
EK,JK,CW
JK,CW
JK,CW
JK
JK,CW
JK
JK,EK,MS,CW
JK
JK,CW,EK,MS,IH,MF
III
IH,RL
IH,AM,JK,RL,MF
AM
AM,PA,LP,MT
PA,LP
VA,PK,LS,LH,MT,
PS,PA,LP
PS
PS,IH
JK,AM
AM,IH
AM,JK,PS,IH
IV**
IH
IH,MF
SI,PA,LP,MT
AR,SS
PA,LP
VA,PK,LH,MT,PS,
PA,LP
PS
PS,JC,JS,JU,IH
JK,VA,MF
AD,IH
JK,PS,IH,MF
JK: Jouni KvistCW: Christopher W. WheatPS: Panu SomervuoAM: Anniina L. K. MattilaEK: Eveliina KallioniemiMS: Marjo SaastamoinenIH: Ilkka HanskiMF: Mikko J. FrilanderVA: Virpi Ahola
JC: Jukka CoranderAD: Anne DuplouyJV: Juan Cristobal VeraSI: Suvi IkonenAR: Annukka RuokolainenPA: Petri AuvinenLP: Lars PaulinJM: James H. MardenRL: Rainer Lehtonen
LH: Liisa HolmPK: Patrik KoskinenLS: Leena SalmelaMT: Minna TaipaleJU: Jukka KohonenJS: Jukka SirénSS: Suvi SaarnioHF: Howard W. FescemyerET: Eva Tas
**The Author contributions stated in the PLoS One manuscript are incorrect.
ABSTRACT
6
ABSTRACT
The Glanville fritillary butterfly is an important eco-logical model species for habitat fragmentation, whose genetics was poorly understood. In order to expand the research of this butterfly species into the realm of functional genomics a lot genetic tools were devel-oped. These tools were used to investigate the genetic basis of phenotypic traits that are important in the wild. Gene expression microarrays based on de novo assembled transcriptome were used to study expres-sion differences between adult butterflies from newly established colonies and older colonies as well as gene expression variation among larval families reared in three thermal regimens during final larval instar. Col-onization and larval development are crucially impor-tant in maintaining the metapopulation structure of Glanville fritillary butterfly in the Åland. We identified gene expression differences than can explain the ob-served variation in the phenotypes in the natural pop-ulation. We sequenced the full genome of the Glanville
fritillary butterfly and used this to do additional gene expression and allelic variation analysis variation from multiple populations around the Baltic Sea using RNA sequencing (RNA-seq). Flight induced gene ex-pression changes were analyzed using butterflies from Åland Islands and the small isolated Pieni tytärsaari (“Daughter Island”) populations in a forced flight ex-periment. Fragmented populations (Åland islands and Uppland) were compared to continuous populations (Saaremaa and Öland) in order to find common sig-natures of selection caused by habitat fragmentation. Together these four full-genome studies have revealed that habitat fragmentation causes selection pressure on an intricately connected set of genes and pathways that leads to a so called “life history syndrome”, where the butterflies that colonize new habitat patches have a distinct set of traits and associated expression differ-ences in these traits that make them more successful in establishing new colonies.
TIIVISTELMÄ
Täpläverkkoperhonen on tärkeä ekologinen mallieläin elinympäristön pirstoutumiselle. Lajin genetiikka on kuitenkin viimeaikoihin saakka ollut puutteellinen. Tutkimuksen laajentaminen genetiikkaan ja toimin-nalliseen genomiikkaan vaati uusien geneettisten työkalujen kehittämistä ja soveltamista. Geneettiset työkalut mahdollistivat pitkään tutkittujen ekologi-sesti merkittävien fenotyyppisten muuttujien analy-soimisen genomisella tasolla. Geeni-ilmentymisen tutkimiseen kehitimme geenisirun de novo koostetus-ta transkriptomista. Geenisiruilla selvitimme geeni-ilmentymisen eroja aikuisista täpläverkkoperhosista, jotka olivat peräisin joko hiljattain kolonisoiduilta tai pitkää asutetuilta kedoilta. Selvitimme myös yksi-lön kehityksen aikana muuttuvaa geeni-ilmentymistä viimeisen toukkavaiheen aikana eri toukkaperheis-tä olevilla yksilöillä, jotka kasvatettiin kolmessa eri lämpökäsittelyssä. Uusien asuinympäristöjen koloni-saatio ja toukan kehitys ovat täpläverkkoperhoselle kriittisiä Ahvenanmaan metapopulaation ylläpitämi-sessä. Löysimme geeni-ilmentymiseroja, jotka voi-vat selittää luonnonpopulaatioissa fenotyyppitasolla
havaittua vaihtelua. Seuraavana sekvensoimme täp-läverkkoperhosen koko genomin ja käytimme sitä hyödyksi geeni-ilmentymisen ja alleelivariaation sel-vittämiseen useista Itämeren täpläverkkoperhospo-pulaatioista, käyttäen RNA sekvensointia (RNA-seq). Metaboliaa mittaavassa lentokokeessa selvitimme lennon seurauksena muuntuneita geeni-ilmentymisiä Ahvenanmaan ja Pienen tytärsaaren populaatioista. Elinympäristön pirstoutumisen vaikutusta geeni-ilmentymiseen ja alleelivariaatioon selvitimme ver-taamalla kahta yhtenäisestä elinympäristöstä olevaa populaatioita (Saarenmaa ja Öölanti) kahteen pirs-toutuneesta elinympäristöstä olevaan populaatioon (Ahvenanmaa ja Uplanti). Havaitsimme, että elinym-päristön pirstoutuminen johtaa monen ominaisuuden samanaikaiseen valintaan, joista lentokyky edustaa yhtä osaa. Yhdessä nämä neljä genominlaajuista tut-kimusta ovat paljastaneet, että täpläverkkoperhosen ekologian kannalta merkittävä fenotyyppinen vaihtelu on geeni-ilmentymisen tasolla kytkeytynyt ja on sa-mojen säätelygeenien ja säätelyreittien ohjaama.
1. INTRODUCTION
7
(Hudson 2008). Thus understanding adaptation at the molecular level is becoming a fundamental topic in modern evolutionary ecology (Stapley et al. 2010). Estimating selection intensity and the genetics basis of phenotypic traits, on which selection is acting on, is now possible at whole transcriptome and genome scale (Stinchcombe and Hoekstra 2008, Ungerer et al. 2008).
The two basic methodologies for investigating the variation of gene expression, used in this thesis, are the gene expression microarrays, and the more recent RNA sequencing. The use of gene expression micro-arrays in ecology has increased rapidly over the past few years (Buddemeier et al. 2003, Held et al. 2004, Brodsky et al. 2005, Bar-Or et al. 2006). Examples of the microarray studies include investigations on the genetic mechanisms underlying species interactions (Kato-Maeda et al. 2001, Schmidt et al. 2005), adapta-tion (Tani et al. 2002, Kalujnaia et al. 2007) and evo-lutionary processes (Tani et al. 2002, Goodisman et al. 2005, Gu et al. 2005). Microarray approaches are high throughput and relatively inexpensive (Kononen et al. 1998). Microarrays can be used to measure si-multaneously the amount of mRNAs transcribed from many genes or all genes in the genome (Schena et al. 1995, DeRisi et al. 1996). Although microarrays have several advantages, they also have limited dynamic range. When expression of a particular gene is very high, the signal from the probe corresponding to that transcript becomes saturated. Also detecting very low expressed genes is difficult due to high background signals, partially due to cross-hybridization of differ-ent transcripts (Okoniewski and Miller 2006). How-ever the biggest limitation for non-model organisms is the fact that one needs to have extensive knowledge of the genome sequence or transcriptome of the organ-ism under study (Wang et al. 2009).
RNA sequencing (RNA-seq) allows for not only the de-termination of the RNA sequence, but is increasingly being used to quantify the abundance of messenger RNA transcripts similar to the microarray approaches. The method allows for an unbiased estimation of gene expression. When applied correctly RNA-seq can pro-vide more precise measurement of levels of transcripts and their isoforms than other methods (Wang et al. 2009). Unlike traditional gene expression microarrays the RNA-seq approach does not require the genome sequence to be known beforehand and can be used for quantifying the abundance of both known and novel RNA transcripts (Marioni et al. 2008, Trapnell et al. 2010, Roberts et al. 2011). RNA-seq doesn’t suffer
1. INTRODUCTION
The study of molecular underpinnings of ecologically and evolutionarily important traits has faced tremen-dous changes in the last few years. This change has been fuelled by the rapid advancement of molecular biology tools and technologies, in particularly DNA sequencing, which have enabled detailed genetic and gene expression analyses with organisms that previ-ously lacked genetic knowledge, but are of crucial im-portance in understanding ecological forces that shape the natural world (Mitchell-Olds et al. 2007). Many of the genetic techniques were originally designed for model organisms, and were dependent on the detailed background work that have been ongoing for decades, making it difficult to apply these to natural popula-tions of non-model organisms (Feder and Mitchell-Olds 2003). Indeed, laboratory model organisms offer many advantages in studying biological problems; the foremost are control, replication and convenience (El-legren and Sheldon 2008).
But these advantages come with a cost when studying fitness variation. Laboratory studies are carried out in stable, uniform, benign environments that are often quite different from the natural environment of the study species. As the model organisms have typically been maintained for a long time (hundreds of genera-tions) in the same conditions, it can be presumed that they have become adapted to this new environment and lost much of the original adaptation that helped them to survive in the wild (Ellegren and Sheldon 2008).
Most genetic variation is thought to have small effects on phenotypic traits (Feder and Mitchell-Olds 2003). In many cases the importance of such variation might only be apparent under specific natural conditions. Furthermore, environmental effects (biotic and abi-otic) interacting with these traits are often unpredict-able, obscure and difficult to monitor. Many of these problems can be overcome when using natural popu-lations under natural conditions (Feder and Mitchell-Olds 2003). One of the most important questions in ecological genomics is whether similar environments favor variation in the same genes (Calboli et al. 2003, Colosimo et al. 2004, Colosimo et al. 2005, Protas et al. 2006) or whether the same phenotype can be ac-quired by using different genetic mechanisms (Hoek-stra and Nachman 2003, Hoekstra et al. 2006). These questions can now be addressed for many life history traits, largely due to the rapidly advancement genom-ics technologies, especially DNA and RNA sequencing
1. INTRODUCTION
8
DNA microarrays
Microarrays are typically fabricated on glass, silicon, or plastic slides. DNA probes are spotted onto the slides with inkjet or microjet techniques in nanoliter or picoliter volumes (Hughes et al. 2001). The probes can be synthetic oligonucleotides, amplicons, or larger DNA/RNA fragments that bind the target DNA/RNA by base-pairing with them during the hybridization (Heller 2002). The probes can also be synthe-sized directly onto the slides. For examples Agilent microarrays are in situ synthetized from nucleotide precursors that are inkjet-printed one layer at a time and then chemically bound (Wolber et al. 2006). The in situ method used in Affymetrix microarrays uses a set of photolithographic mask to determine which positions on the microarray are exposed to ultraviolet light. The prenucleotides in the exposed areas be-come activated and attach covalently to growing nucleotide chain (Singh-Gasson et al. 1999, Aharoni and Vorst 2002).
Microarray analysis involves detecting the signal from target DNA/RNA from the sample of interest by labelling the DNA/RNA (fluorescent, chemiluminescent, colorimetric, radioisotope, etc.). The microarray slide is scanned and the image is converted to intensity measurements. These hybridization intensities are processed and normalized with a variety of bioinformatic tools and ultimately used to analyze expression or SNP differences between samples of interest. Traditionally microarrays were used in basic molecular biology, genomic research and medical applications such as detecting infectious or genetic diseases (for instance cancer diagnostics). (Heller 2002)
454 pyrosequencing
The 454 pyrosequencing (Roche/454 Life Sciences) was the first commercially successful next generation sequencing system. The 454-method uses pyrosequencing instead of the dideoxy terminators employed in the Sanger sequencing method (Sanger et al. 1977). Pyrosequencing relies on the detection of pyroph-osphate, released during nucleotide incorporation. A library of DNA fragments to be sequenced are de-natured into single-stranded form and captured by micrometer sized beads. The DNA is then amplified in an emulsion PCR, where each fragment gets amplified millions of times in a reaction mixture in an oil emulsion that keeps the fragments isolated from each other. The emulsion is then broken and the DNA gets denatured to single-stranded form once again. (Margulies et al. 2005)
from the limited dynamic range of microarrays. There is no upper limit to the expression level that can be de-tected, and if there is sufficient depth in the sequenc-ing (enough sequenced read per transcript) even very low abundant transcripts can be detected (Zwemer et al. 2014). It is now even possible to do whole tran-scriptome RNA-seq analysis from a single cell (Tang et al. 2009). Studies using RNA-seq have already altered the view on the complexity of transcriptomes (Wang et al. 2009). Importantly for ecological model species it is now possible to do full-transcriptome assembly and gene expression measurements using RNA-seq with-out having a reference genome (Collins et al. 2008, Crawford et al. 2010, Nowrousian et al. 2010, Parch-man et al. 2010, Schwartz et al. 2010, Wheat 2010, Feldmeyer et al. 2011, Grabherr et al. 2011, Zeng et al. 2011, Sloan et al. 2012). However allelic variation,
alterative splicing and paralogous gene families pre-sent unique problems for de novo expression analysis (Vijay et al. 2013).
Next-generation sequencing technologies have opened up new possibilities in ecological genetics. It is now possible to develop functional genetic tools and deploy them to study phenotypes of interest at the full-genome level for species that previously have had little or no genetic knowledge available (Kohn et al. 2006, Gilad et al. 2009, Schwarz et al. 2009, Chen et al. 2010, Guo et al. 2010, Parchman et al. 2010, Schwartz et al. 2010). Combining genomic information with in-depth phenotypic and ecological knowledge promises help to solve of the mysteries in life history traits vari-ation (Ekblom and Galindo 2011).
1. INTRODUCTION
9
The beads with the amplified DNA are then deposited onto a picotiter plate with one bead per reaction well. These well get filled up with smaller beads carrying the enzymes needed for the sequencing reaction. Dur-ing the sequencing the whole picotiter plate gets flooded one nucleotide at a time. These nucleotide then incorporate into the template DNA if they base pair and release pyrophosphate, which triggers a release of photos (visible light) by the accompanying enzymes; ATP sulfurylase, luciferase and luciferin. The light signals are recorded by a camera and transformed into sequence information with computer software. Then different nucleotide is added into the reaction system and the pyrosequencing reaction starts over again. (Margulies et al. 2005) The 454 sequencing produces relatively long reads (up to 1 kb), but the throughput is modest (up to 700 Mb) (van Dijk et al. 2014).
Illumina sequencing
Illumina (Illumina, Inc) uses a sequencing by synthesis method in which single-stranded DNA fragments are attached to a solid surface known as a single-molecule array or flow cell, by base-pairing with an adapt-er sequence. The DNA fragments are amplified with solid-phase bridge amplification technique using a special DNA polymerase. The single-molecule DNA template, attached to one adapter, bends over during the amplification/ sequencing step, and hybridizes to another complementary adapter, forming a “bridge”. The DNA amplification step uses reversible terminators that are nucleotides with removable fluorescent moieties that terminate the template extension in a reversible manner. The terminators are labelled with four different fluorescent dyes (a different color for each nucleotide; guanine, adenine, thymine and or cytosine) (Chen et al. 2013). The nucleotides that base-pair with the template DNA sequence emit a color unique to each nucleotide, which is recorded. The sequence of the DNA template is deduced by reading off these colors at each successive nucleotide addition step. Each flow cell has more than 40 million clusters where the amplification/sequencing process occurs simultaneously. (Morozova and Marra 2008) The Illu-mina sequencing has the highest throughput (up to 1800 Gb) of the next generation sequencing methods, with moderately long reads (up to 300 bp) (van Dijk et al. 2014).
SOLiD sequencer
The SOLiD sequencing technology (Applied Biosystems) is a ligation based sequencing method (Valouev et al. 2008). The library preparation uses an emulsion PCR approach similar to 454 sequencing. The ampli-fied DNA fragments are deposited onto a flow cell slide and melted to single stranded form. The sequenc-ing occurs by annealing a primer to an adapter sequence shared by each fragment. A set of fluorescently labeled probes then competes for ligation to the primer. The color of the 8 bp probes is determined by the first two base pairs. After each ligation step the color is detected and part of the ligated probe is cleaved off to remove the fluorophore, followed by a new ligation reaction. Once the whole target DNA fragment has assayed the DNA is denatured to remove the primer and ligated probe sequences. The process is repeated using a new primer that is one nucleotide shorted than the previous one (primer reset), resulting in the in-terrogation of a different set of di-nucleotides. Once the primer reset is completed five times every position in the target DNA fragments will have been interrogated twice, resulting in a two base encoding referred to as color space. The read lengths for SOLiD are typically short (35–75 bp), but the amount of data produced is enormous (up to 320 Gb) (van Dijk et al. 2014).
PacBio sequencing
PacBio (Pacific Biosciences) sequencer uses single-molecule real-time sequencing. It directly observes the amplification/sequencing reaction while it’s occurring. This is made possible by using modified DNA poly-merase attached to a zero-mode waveguide, a small hole in a metal film deposited on a microscope cover-slip that allows detection of dye labelled nucleotides while they are being incorporated into the amplifying DNA template (Levene et al. 2003). The process is massive parallel as millions of zero-mode waveguides can be made on a single coverslip. Importantly this method detects the amplification of a single DNA mol-
1. INTRODUCTION
10
ecule instead of sequencing a pool of simultaneously amplifying template molecules. This eliminates the need for complicated emulsion PCR amplifications and library preparations prior to the sequencing (Timp et al. 2010). The advantage of PacBio is that it can produce extremely long reads (up to 20 kb and longer), which makes it ideal for genome assemblies. However it is still relatively expensive, has a low throughput (500 Mb) compared to the other platforms and has an exceptionally high error rate (up to 14%) (van Dijk et al. 2014).
1.1. LIFE HISTORY TRAITS & TRADE-OFFS
It is generally assumed in life history theory that spe-cific traits are often constrained by trade-offs in other life history traits (Isaksson et al. 2011). Without these constraints each trait would evolve to its maximum ca-pacity and produce a “Darwinian demon”, a hypotheti-cal organism with infinite fitness, able to reproduce at birth, produce infinitely many offspring, and live for-ever (Law 1979).
Often the trade-offs are assumed to be determined en-ergetic constraints (Houston et al. 1993, Doughty and Shine 1997). If two or more life history traits share a common resource pool then the allocation of these resources can lead into conflicts when resources are limited. Whether these conflicts manifest themselves as detectable trade-offs will depend on many factors, such as how many traits share the resource pool and how they are connected, how and when these traits interact and how much the resource pool varies over time (Zera and Harshman 2001).
Trade-off is often assumed for traits that display asso-ciation, with very little information on the functional interactions of these traits (Mole and Zera 1993). Traits can be negatively associated without having any functional interactions, for instance because of genetic linkage (Zera and Cisper 2001). Even when a trade-off does exist it can often be difficult to detect. For exam-ple, variation in resource acquisition can change the magnitude and direction of trait correlations. If there is variation in resource acquisition capability between individuals this might mask trade-off (Mole and Zera 1994). Individuals with poor resource acquisition might show a negative correlation between the traits, while individuals whose resource acquisition capabil-ity exceeds the resource needs could show positive correlation (Van Noordwijk and de Jong 1986).
Research on life history traits requires extensive
background information on the study species and the mechanistic understanding of the negative associa-tions between traits, including physiological, genetic and environmental determinates (Zera and Harshman 2001). Traits do not evolve independent of each other. They are often times connected at the genetic, devel-opmental and physiological level (Flatt et al. 2005). The study of the genetic basis of life history traits is improving substantially with the advent of new ge-netic tools that can be used to illuminate genotype-phenotype relationships in natural populations, and are giving new insight into the genetic architecture of quantitative trait variation (Ellegren and Sheldon 2008).
1.2. FLIGHT & REPRODUCTION
Flight is critical for dispersal, reproduction and feed-ing in many insects (Rauhamäki et al. 2014). Flight is also very costly. The flight muscles in insects have the highest known mass-specific rates of oxygen con-sumption of any locomotory tissue (Dudley 2002). In flying insects several studies have looked at the trade-off between flight performance and various other life-history traits such as reproduction and life-span (Gunn et al. 1989, Werner and Anholt 1993, Langel-lotto et al. 2000). One of the best studies case is the wing-dimorphic cricket species, Gryllus firmus. In this species there are two flightless morphs in addi-tion to one flight-capable morph. The flight-capable morph has fully-developed and functional wings and flight muscles during adulthood, but it has substan-tially lower reproductive output compared to the two flightless morphs (Zera and Denno 1997). One morph emerges as an adult with shortened wings and non-functional flight muscles and is flightless throughout adulthood. The second flightless morph has fully-de-veloped wings and functional flight muscles, but loses flight capability and flight muscles during mid-adult-hood (Zera et al. 1997). The fact that this species has both a genetically determined and a plastic response
1. INTRODUCTION
11
is particularly interesting as it can reveal the genetic control mechanism underlying the differences be-tween the two morphs and the associated life history traits (Vellichirammal et al. 2014).
A full-transcriptome study of Gryllus firmus has shown that in the flight-capable morphs the flight muscles have higher expression of genes required for efficient muscle function; oxidation-reduction, cellular respiration, and electron transport chain, compared to the flightless morphs (Vellichirammal et al. 2014). On the other hand, the flight muscles of the flightless morphs have high levels of expression of genes involved in proteolysis. The proteins from the histolyzed flight muscles are thought to be used for oocyte development in the flightless morph, thus explaining the higher reproductive output compare to the flight-capable morphs (Vellichirammal et al. 2014).
At the same time as the expression changes in the flight muscles are occurring, comparable changes happen in the fat body of this species (Vellichirammal et al. 2014). The expression levels of genes involved in triglyceride biosynthesis, lipid transport, immune function and reproduction are elevated in the morph that loses its flight capability during adulthood (Vel-lichirammal et al. 2014). There is also suggestive evidence for the increased expression level of Angio-tensin converting enzyme (Ace), which has been im-plicated in egg maturation (Ekbote et al. 1999).
The most likely upstream regulator of the plastic change to the short-winged and wingless morphs is high juvenile hormone (JH) titer during some critical stage in their development (Southwood 1961, Wig-glesworth 1961). The elevated JH titer is presumed to block wing and flight muscle development, while simultaneously stimulating development of reproduc-tive organs, which account for the earlier and greater egg production (Roff 1986, Zera and Denno 1997). In terms of trade-offs it has been shown that JH titer is positively correlated with ovarian mass in this species (Cisper et al. 2000).
Together the studies of the Gryllus firmus illustrate of how the relatively simple resource allocation to ei-ther flight-capable insects or to flightless insects can be decided at the developmental stage via a hormo-nal switch, which leads to a multitude of physiologi-cal changes and eventually a higher fecundity. But the cost of this switch is the loss of migration capability.
1.3. JUVENILE HORMONE, ECDYSONE & PTTH
Hormonal regulation and in particular the regulation of juvenile hormone (JH) has been postulated as the mechanistic basis for the variation in many plastic and life history traits in insects (Dingle and Winchell 1997). Juvenile hormones are acyclic sesquiterpenoids secreted by the corpora allata, typically a pair of en-docrine glands located posterior to the brain (Wig-glesworth 1954). The juvenile hormones are involved in the regulation of metamorphosis and reproduction in all insects (Nijhout 1998, Goodman and Granger 2009). Additional known functions of JH include regulation of diapause (Sullivan et al. 2000), behav-ioral changes (Sullivan et al. 2000) and caste deter-mination in Hymenoptera (Wirtz and Beetsma 1972, Penick et al. 2012).
Molting and metamorphosis in insects is regulated by interplay of juvenile hormones and ecdysteroids; ecdysone and 20-hydroxyecdysone (20E), secreted from the prothoracic glands (Gilbert et al. 2002). JH is present throughout larval life and ensures growth while suppressing metamorphosis until proper body size attained (Riddiford 1993). JH suppresses meta-morphosis by inhibiting the secretion prothoracico-tropic hormone (PTTH) from the brain. PTTH acts on the prothoracic glands which synthesizes and releases ecdysone and 20E into the hemolymph (Gilbert et al. 2002). Once the larvae are ready to molt the expres-sion of JH decreases and the expression (PTTH) is activated, which directs the precise timing of the molt (Nijhout 1998). The release of PTTH is regulated by intrinsic factors such as size and extrinsic factors, such as photoperiod and temperature (Nijhout and Wil-liams 1974). In some insects the expression of PTTH is additionally regulated by insulin-like peptides re-leased in response to nutritional signals (Caldwell et al. 2005, Colombani et al. 2005, Mirth et al. 2005).
The ecdysteroids activate an expression cascade of genes that promote metamorphosis. 20E binds to a nuclear hormone receptor, the ecdysone receptor (EcR), which together with Ultraspiracle (USP) forms a dimer that activates the transcription of ecdysone-regulated genes (Riddihough and Pelham 1987, Cherbas et al. 1991, Koelle et al. 1991, Yao et al. 1992, Antoniewski et al. 1994). Many of these genes are tran-scription factors that activate or inactivate genes as-sociated with molting (Schubiger and Truman 2000). The presence of JH during larval stages ensures that the molt produce another immature instar (Wil-
1. INTRODUCTION
12
liams 1961). During the final instar the expression of JH ceases altogether and present JH is metabolized once the larvae have attained a critical size, leading to ecdysteroid secretion and pupation (Riddiford 1994).
Hormonal signaling has major differences between different insect species. For instance in Drosophila exogenous JH does not prevent the larval-pupal transformation, even when given throughout larval life (Ashburner 1970, Riddiford and Ashburner 1991). There are differences also between Lepidopteran species in hormonal signaling. In Bombyx mori the PTTH-signaling is connected with insulin-signaling pathway, similarly to Drosophila (Gu et al. 2009). Insulin-like hormones increase the size of prothoracic glands and ecdysone secretion and functions as a size-sensor during development in Bombyx (Kiriishi et al. 1992). However, in Manduca sexta ecdysone secretion is not stimulated by insulin (Walsh and Smith 2011), making the insulin- and PTTH-signaling distinct from each other in this species (Smith et al. 2014).
In adult insects the expression of JH and 20E re-sumes to regulate reproductive maturation in females (Postlethwait and Handler 1979, Riddiford 1993, Bar-chuk et al. 2002, Jindra et al. 2013). In Drosophila both JH and 20E are important in regulating expres-sion of yolk proteins (Bownes 1994). The yolk proteins (YPs) are expressed and secreted into the hemolymph by the fat body and ovarian follicle cells. The YPs are then taken up by the developing oocytes (Raikhel and Dhadialla 1992). The YP genes contain 20E induc-ible binding sites, and the expression of YPs can be induced by injecting 20E even in males that usually don’t express these genes (Bownes et al. 1996). How-ever the effects of JH and 20E are tissue and stage specific. Both 20E and JH stimulate YP expression in the fat body, but in the ovaries only JH has a stimula-tory effect (Bownes 1986). In fact, 20E induces apo-ptosis and reabsorption of the nurse cells in the egg chambers during early oocyte development (Soller et al. 1999). This effect of 20E can be counteracted by JH (Soller et al. 1999).
1.4. HEXAMERINS (LARVAL SERUM PROTEINS) The fat body is a multifunctional tissue that stores ex-cess nutrients in form of fat and glycogen and releases them depending on the energy demands of the insect. The fat body synthesizes majority of all circulating metabolites including lipids, carbohydrates and wide
range of hemolymph proteins (Law and Wells 1989). The most abundant hemolymph proteins in holome-tabolous insects are hexamerins, also known as larval serum proteins (Scheller et al. 1990).
Hexamerins belong to the hemocyanin superfamily, which contains five classes of proteins, with distinct functions but significant sequence similarity; pheny-loxidases, hemocyanins, cryptocyanins, hexamerins and hexamerin receptors (Burmester 2002). Hemocy-anins are oxygen carrying molecules that evolved from oxygen-consuming phenoloxidases, which probably protected the organism against the toxic oxygen mol-ecules (Terwilliger 1998). Hexamerins diverged from the oxygen carrying hemocyanins around 400 million years ago (Burmester 2002). Unlike hemocyanins the hexamerins contain no oxygen binding copper and are thus colorless and have no capability to carry oxygen, but serve mainly as storage proteins (Beintema et al. 1994). Like hemocyanins these proteins form hexa-meric structures of about 500 kDa, typically made up of the same 70-85 kDa subunits (Telfer and Kunkel 1991).
In actively feeding larvae the fat body synthesizes and released massive quantities of hexamerin proteins haemolymph. Hexamerins can make up to 85% of the hemolymph protein content before pupation (Telfer and Kunkel 1991). Hexamerins in the hemolymph are recaptured by the fat body during pupation, bro-ken down and are used to synthesize new proteins for adult tissues (Telfer and Kunkel 1991). In an experi-ment where one hexamerin was radiolabelled and in-jected into larvae of Calliphora vicina nearly half the radiolabelled amino acids from this hexamerin were incorporated into adult flight muscles, especially actin and myosin (Levenbook and Bauer 1984).
Hexamerins are used also as protein reserves for egg formation (Pan and Telfer 1996, Wheeler et al. 2000, Pan and Telfer 2001). Manduca sexta females retain over 25% of their pupal reserves of methionine rich hexamerins, and use these for vitellogenesis (Telfer and Pan 2003). In some species of insects hexamerin expression resumes during adult stages, although at a lower rate compared to larval expression (Zakharkin et al. 2001, Martins et al. 2008, Martins et al. 2010). Hexamerin may even be expressed and incorporated directly onto maturing ovaries (Martins et al. 2008). Some hexamerins are also incorporated directly into the cuticle as intact protein (Levenbook and Bauer 1984). Given their many functions, it is not surpris-ing that hexamerins have been implicated in having a
1. INTRODUCTION
13
significant role in many life history traits (Hunt et al. 2007, Hahn et al. 2008, Lourenço et al. 2009).
Hexamerins play a crucial role in caste determination in Reticulitermes termites. The worker termites of this genus are temporally arrested juvenile forms that can differentiate into adult soldier- or reproductive-caste phenotypes under specific circumstances (Lainé and Wright 2003).The differentiation from worker to sol-dier has been shown to be determined by juvenile hor-mone titer (Park and Raina 2004, Mao et al. 2005). The level of JH is strongly correlated with the expres-sion pattern of hexamerin genes, and thus with the caste phenotype (Scharf et al. 2003). Silencing hex-amerin expression with RNA interference (RNAi) re-sulted in differentiation from worker to soldier-caste (Zhou et al. 2006a) as well as differential expression in the caste associated genes (Zhou et al. 2007). It ap-pears that in this species the hexamerin expression is dependent on JH titer, but the hexamerins also bind JH and sequester it, thus acting as a buffer in main-taining the caste type (Zhou et al. 2006c).
The increase in hexamerin expression with elevated JH titer might be indirect. JH treated worker termites show elevated expression of Broad-Complex (BR-C) (Tarver et al. 2010), a gene known to be the primary response gene in ecdysteroid signaling (Richards 1997). In fact JH is known to interfere with ecdyster-oid-induced expression of BR-C in other species (Zhou et al. 1998). Although not studied in the context of JH treatment, it is known that both JH and 20E increase in expression in worker termites when isolated from the colony, a condition that infrequently induces caste differentiation (Okot-Kotber et al. 1993). JH treat-ment also changes the expression profile of many cy-tochrome oxidase (Cyp450) genes, some of which are involved in the biosynthesis of JH and 20E (Zhou et al. 2006b).
In most insect species the expression and release of hexamerins from the fat body is shown to be regulated by 20E (Mousseron-Grall et al. 1997, Tungjitwitay-akul et al. 2008, Fu et al. 2009, Martins et al. 2011). In Corcyra cephalonica moth 20E increases and JH decreases the expression of hexamerins in larvae and in isolated fat body tissue grown in vitro (Manohar et al. 2010). Radiolabelled methionine incorpora-tion into newly expressed hexamerin confirms that the increased hexamerin content in the hemolymph is due to elevated expression, not just elevated secre-tion (Manohar et al. 2010). Interestingly 20E also stimulates the uptake of hexamerins back into the fat
body. The uptake of hexamerins during pre-pupal and pupal stages is dependent on tyrosine kinase mediated phosphorylation the hexamerin receptors, which is in-duced by 20E (Arif et al. 2008).
1.5. HYPOXIA & SDHD
Flight metabolism in insects can be 50-200 times higher than resting metabolism (Kammer and Hein-rich 1978). Insect flight is thought to be predominantly or exclusively based on aerobic metabolism (Dudley 2002). In fact, the mass-specific rates of O2 consump-tion during insect flight are higher than in any other animals (Suarez 2000). Majority of this oxygen is used up by the flight muscles in the thorax. The muscles contain more mitochondria with higher surface densi-ties of the cristae, where the aerobic cellular respira-tion reactions take place, than most vertebrate loco-motory muscles (Suarez et al. 1996).
The high rates of metabolism in flight are possible because of the tracheal system in insects is a very ef-ficient oxygen delivery mechanism (Harrison and Lighton 1998). The tracheal system is a set of inter-connected tubes (trachea) leading from external open-ings in the body (spiracles) all the way to close-ended compartments (tracheoles), from which the gases are delivered to the target tissues by diffusion (Ghabrial et al. 2003). Oxygen delivery is considered to be in ex-cess for resting metabolism (Keister and Buck 1964).
However oxygen usage during flight is so extreme that oxygen might become the limiting factor. Teth-ered flight experiments in blowfly Lucilia sericata and the fruitfly Drosophila replete have shown that oxy-gen consumption rates decreases strongly in hypoxic conditions (Chadwick and Gilmour 1940, Davis and Fraenkel 1940). Manipulating the oxygen content of a flight chamber using free-flying dragonflies Ery-themis simplicicollis demonstrated that the metabolic rate was affected by ambient oxygen levels. When at-mospheric oxygen level were below normal (21 kPa) carbon dioxide emissions decreased significantly. Conversely when oxygen level was higher CO2 produc-tion exceeded normal levels, indicating that oxygen is limiting even in normal atmospheric oxygen content (Harrison and Lighton 1998).
A significant fraction of concurrent research in hy-poxia has concentrated on cancer research. Hypoxia is central to the development of many cancers. When a cancerous cell mass becomes large and obscures the
1. INTRODUCTION
14
blood flow, it can no longer receive sufficient nutrient and oxygen from its surrounding tissues and circu-latory system. Cancers can adapt to chronic hypoxia but they can also stimulate neovascularization, the re-growth of blood vessels in the surrounding tissues, in order to receive more oxygen (Harris 2002). Detecting these altered glucose metabolism and cellular adapta-tions to hypoxia are fundamental to the basic biology and treatment of cancer (Zhong et al. 1999).
The hypoxia response is primarily controlled by the hypoxia-inducible transcription factor HIF-1. HIF-1 is a heterodimer comprised of HIF-α and HIF-β subu-nits that activate hypoxia response in cells under low oxygen conditions. Of the two subunits of Hif-1, HIF-α is rapidly degraded in the cytoplasm in normal oxy-gen concentrations (normoxia) by oxygen-dependent prolyl hydroxylases (PHDs). During hypoxia this deg-radation is suppressed and HIF-α accumulates in the cytoplasm, binds to HIF-β and translocates into the nucleus (Wang et al. 1995).
The HIF-1 complex increases expression of genes that function to either increase oxygen availability or adapt the cell metabolism to lower oxygen content. In hu-mans these genes include erythropoietin, transferrin, endothelin-1, nitric oxide synthase, heme oxygenase, VEGF, IGF-2, IGF-binding proteins, glucose trans-porters and glycolytic enzymes (Feldser et al. 1999, Semenza 1999).
In mammals the carotid body plays an important role in acute adaptation to hypoxia. The carotid body is a highly vascular small organ, located at the bifurcation of the common carotid artery in the neck, and senses oxygen levels in the blood. In an oxygen deprived state (hypoxia) it stimulates cardiopulmonary system via the activation of hypoxia-inducible factor-1 (Gonza-lez et al. 1994). Mutations in the Sdhd gene have been shown to cause familial paraganglioma or renal cell carcinoma in humans (Baysal et al. 2000). The tumors most commonly occur in the carotid body (Baysal et al. 2000).
Sdhd encodes for a protein in the mitochondrial res-piratory chain, the small subunit of cytochrome b in succinate-ubiquinone oxidoreductase (CybS). SDHD is an important enzyme in both the citric acid cycle (TCA) and the electron transfer chain (Scheffler 1998). In familial paraganglioma loss of function mutations in Sdhd gene leads to chronic hypoxic stimulation and cellular proliferation of the tumorous tissue (Baysal et al. 2000). In paraganglioma the mutations in Sdhd
in cause a complete loss of SDH activity in the mito-chondrion (Gimenez-Roqueplo et al. 2001). Succinate, the substrate of the SDH complex, accumulates in the cells when SDH activity is down-regulated (Selak et al. 2005).
Succinate acts as an intracellular messenger mov-ing freely between the mitochondria and the cytosol, and links TCA cycle dysfunctions with HIF regulation (Selak et al. 2005). Accumulation of succinate inhibits PDH-catalyzed degradation of HIF-1α (Schofield and Ratcliffe 2005, Selak et al. 2005). This leads elevated HIF-1α protein levels and up-regulation of down-stream hypoxia responsive genes such as vascular endothelial growth factor (VEGF) gene (Selak et al. 2005).
1.6. THE INNATE IMMUNE RESPONSE Invertebrates do not have an adaptive immune re-sponse found in mammals, but instead rely on a di-verse innate immune system to defend themselves against infections. The innate immune system is an ancient defense response found in all metazoan line-ages (Janeway and Medzhitov 2002). The innate im-mune system combats pathogen by a host of defense mechanisms. Pathogens can be encapsulated or en-gulfed (phagocytized) by hemocytes (Strand 2008). Hemocytes can also release a number of defense mole-cules including clotting factors, proteinase inhibitors, lectins, and antimicrobial proteins pathogen (Iwanaga and Lee 2005). Many defense molecules also circu-late freely in the hemolymph, including hemocyanins, lectins and macroglobulins (Iwanaga and Kawabata 1998). Wounding stimulates a coagulation response to prevent the loss of body fluids (Bohn 1986, Theopold et al. 2002).
Infection and wounding also cause melanization, the production and deposition of melanin pigments on the invading pathogens (Marmaras et al. 1996). The melanization process is driven by a proteolytic cascade that is triggered in infections by recognition of micro-bial cell wall components, such as peptidoglycan, β-1,3 glucan, and lipopolysaccharide (LPS) (Ochiai and Ashida 1988, Yu et al. 1999, Ma and Kanost 2000). These components are recognized by a diverse set of pattern-recognition proteins which activate specific protein cleavage events depending on the pathogen (Iwanaga and Lee 2005). The melanization is cata-lyzed by phenoloxidase (PO), which circulate in the hemolymph and are deposited on the cuticles as an
2. THE STUDY SPECIES
15
inactive form of prophenoloxidase (PPO). The PPO is activated into PO by a serine protease known as pro-phenoloxidase-activating enzyme (PPAE). The active PO catalyzes the oxidation of mono- and diphenols to orthoquinones, which then polymerize into melanin. The PPAE also exists as an inactive zymogen that can be activated by other serine proteases (De Gregorio et al. 2002).
The melanization process needs to be tightly regu-lated, since intermediate products of melanin biosyn-thesis are toxic (Cerenius and Söderhäll 2004). Also excessive melanization can cause defects during de-velopment in cuticles and wings, and can even kill the host (De Gregorio et al. 2002). Certain serin protease inhibitors (Serpin), which are regulated by toll-sign-aling pathway, are expressed soon after the immune system is activated (De Gregorio et al. 2002). These Serpins bind to PPAE covalently and block the proteo-lytic cleavage of PPO to PO (De Gregorio et al. 2002) Serpins regulate immune system in insects as well as mammals, but they have many functions as well (Ir-ving et al. 2000).
An additional important immune response is the pro-duction of antimicrobial peptides (AMPs) by the fat body. AMPs are secreted into the hemolymph, where they can directly kill the invading microorganisms. There are several AMPs in with distinct activities di-rected against fungi, Gram-positive bacteria or Gram-negative bacteria. The AMP genes have gone through independent gene duplication events in different in-sect lineages, resulting in species-specific fine-tuning to pathogens (Cheng et al. 2006). In Drosophila 21 AMP genes have been identified, belonging to seven gene families (cecropins, drosocin, attacins, dip-tericins, defensin, drosomycins, and metchnikowin) (Bulet et al. 1999, Irving et al. 2001), while Bombyx mori has 35 AMP genes belonging to six distinct gene families (moricins, cecropins, gloverins, lebocin, en-bocins, attacins). For instance the the moricin and gloverin gene families are apparently unique of Lepi-doptera (Cheng et al. 2006).
The expression of AMP genes is regulated by the Toll and Imd signaling pathways, which share many fea-tures with the mammalian TLR and TNF-R signaling cascades that regulate nuclear factor-kappaB (NF-κB) family (Lemaitre et al. 1996). Members of the NF-κB family are pleiotrophic transcription factors that are rapidly activated by a wide variety of pathogenic sig-nals as well as many other generic stress signals. NF-κB has many roles in development, cell migration,
apoptosis, cancer formation and aging (Dolcet et al. 2005, Salminen et al. 2008). The NF-kB system links together pathogenic and cellular danger signals, and can be considered the master regulator of immunity (Friedman and Hughes 2002). A wide variety of exter-nal and internal danger signals can activate the NF-kB system, such as oxidative stress, hypoxia, and geno-toxic stress (Schreck et al. 1992).
The hypoxia response is linked to the innate immune system by the NF-kB (Nizet and Johnson 2009). De-letion of NF-kB and its regulator IKK-β result in re-duced expression of Hif-1α and the target genes Hif-1α (Rius et al. 2008). In Drosophila, the expression of AMPs is induced by oxygen stress (Zhou et al. 2008a). Selection lines for hypoxia tolerance result in elevated expression of AMPs as well as other genes regulated by the Toll and Imd pathways, as well as Notch pathway (Zhao et al. 2010). Artificially overexpressing AMPs also protects from oxygen stress in hyperoxic condi-tions (Zhao and Haddad 2011).
The insect hormones JH and 20E have opposite ef-fects on the regulation of many immune pathways. In Drosophila the induction of AMP genes is promoted by 20E following immune stimulation, whereas JH suppresses the response (Flatt et al. 2008). Also the melanization process appears to be stimulated by 20E and suppressed by JH. In Anopheles gambiae the phenoloxidase (AgPPO1), the gene responsible for melanization, contains a binding site for the ecdysone receptor complex (Ahmed et al. 1999). The expression level of AgPPO1 can be up -regulated by supplement-ing cell cultures physiological concentrations of 20E, and the up-regulation could be turned off by remov-ing the 20E from the growth media (Ahmed et al. 1999). In Manduca sexta, JH inhibits melanization by suppressing the synthesis of granular phenoloxidase (Hiruma and Riddiford 1988).
As discussed above, the hormonal signaling in insect, particularly JH and 20E, function through multiple, complex and partially overlapping transcriptional pathways to regulate many aspects of insect life, de-velopment, reproduction and immunity. Many life history traits are connected by these shared signaling pathways. The insect hormones can also indirectly im-pacts many other life history traits via connected path-ways such as hypoxia and insulin signaling pathway.
2. THE STUDY SPECIES
16
2. THE STUDY SPECIES The Glanville fritillary butterfly (Melitaea cinxia) has been extensively studied in as a model species for metapopulation biology for over 20 years. The Glan-ville fritillary butterfly, in the Åland Islands, lives in a highly fragmented habitat with a high rate of popu-lation turnover; local populations go extinctions and new populations are established by migratory individ-uals (Hanski 1999). Of the 4000 habitat patches about 500 are occupied in a given year (Hanski 1999, Niem-inen et al. 2004). New colonies are typically estab-lished by a single gravid female (Austin et al. 2011) and females typically mate only once (Kuussaari 1998). The resulting population in these cases is bound to get inbred if no additional migrations to that patch occur (Haikola et al. 2001). Inbreeding depression (Haikola 2003) and stochastic events coupled with the fact that most newly established patches are small and of low quality (Nieminen et al. 2004) drive these populations to extinction at a high risk (Lande 1994, Saccheri et al. 1998).
The Åland Islands is at northern limit of Glanville fritillary butterfly habitat range (Kuussaari 1998). In Åland the butterflies have one generation per year. The female lays (100-200) eggs in large clutches dur-ing the summer (June-July). The larvae feed on two host plants Plantago lanceolata and Veronica spicata (Nieminen et al. 2004), and go through 5 larval instars before the end of the summer. During the fifth instar the larvae spin a conspicuous wintering nest and go into diapause for the winter. When the snow has melt-ed at the end of March, diapause is broken and the lar-vae resume feeding. The larvae go through two more instars before pupating at the beginning of May. The adult butterflies eclose at the beginning of June. Fe-male butterflies emerge with a large number of already chorionated eggs. The rest of the eggs mature within a few days. (Boggs and Nieminen 2004)
Dispersal to new habitat patches is very important in maintaining the metapopulation over time (Niitepõld et al. 2011). Dispersal is affected by a suite of morpho-logical, physiological, and behavioral traits, of which flight capability is of paramount importance (Haag et al. 2005). Allelic variation in the glycolytic gene phos-phoglucose isomerase (Pgi) has been connected with differences in flight metabolism and dispersal (Haag et al. 2005; Niitepõld et al. 2009; Orsini et al. 2009). The allelic variant of Pgi associated with higher flight metabolism is more frequent in newly established populations and the allele frequency increases with
increased distance to the founding population (Haag et al. 2005, Zheng et al. 2009). Polymorphism in Pgi has been linked to many life-history traits in multiple species (Watt 1992; Rank et al. 2007; Saastamoinen et al. 2009; Wheat 2010).
It has been shown that in the Glanville fritillary but-terfly flight metabolic rate and dispersal rate in the field are strongly correlated (Niitepõld et al. 2009). Individuals with higher peak metabolic rate move longer distances in the wild. One-third of the dis-persed distance can be explained by variation in flight metabolic rate (Niitepõld et al. 2009). Heritable vari-ation in flight performance has been observed in the Åland Glanville fritillary butterfly metapopulation (Saastamoinen 2008). Populations that are newly es-tablished and are far apart from the old populations tend to be colonized by more dispersive individuals. The offspring of the colonizers are on average also more dispersive than butterflies from old populations (Hanski 2012; Bonte & Saastamoinen 2012).
2.1. THE LIFE HISTORY SYNDROME
The individuals establishing new colonies are system-atically different however in many phenotypic traits compared to metapopulation as a whole. They are bet-ter fliers, lay more eggs and have larvae that develop faster (Hanski et al. 2006, Saastamoinen 2007b, Saas-tamoinen and Hanski 2008, Niitepõld et al. 2009). Many of these traits have been shown to be highly heritable. For instance higher fecundity is typically observed in newly established populations. Crossing experiments have shown that reproductive age and egg weight are highly heritable (Saastamoinen 2008). Clutch size varies substantially among individuals of the Glanville fritillary butterfly (Kuussaari et al. 2004). The allelic variant of Pgi that is enriched in newly established populations is associated with in-creased clutch size (Saastamoinen 2007a).
In the Glanville fritillary butterfly it appears that there are no obvious trade-off between been flight perfor-mance and other life-history traits. For instance the higher peak metabolic rate found in newly established populations is significantly and positively correlated with life span (Niitepõld and Hanski 2013). There are no negative correlations with dispersal and reproduc-tion; in fact the cumulative number of egg clutches laid by the more dispersive individuals is greater than in the less dispersive individuals (Saastamoinen 2007a). An important question is whether these traits
2. THE STUDY SPECIES
17
are being selected for individually and accumulate in newly colonized populations, or if these traits are controlled by the same underlying mechanism. The fact that many of these traits are highly correlated in-dicates that they could be under the same regulatory network.
2.2. TRANSCRIPTOME SEQUENCING & CUSTOM MADE MICROARRAYS
Until recently there was practically no genetic data available for the Glanville fritillary butterfly. The rapid development of next generation sequencing technologies has enabled full transcriptome sequenc-ing, custom microarray construction, and finally full genome sequencing in a very short time (Vera et al. 2008, Ahola et al. 2014). The original plan was to make cDNA libraries from multiple tissue types, clone individual cDNAs to plasmids and print them to microarray slides, similar to studies on the natu-ral populations of the Studfish (Fundulus) (Oleksiak et al. 2002). The introduction of 454 pyrosequencing changed all of this. It enabled the sequencing and as-sembly of the transcriptome of the Glanville fritillary butterfly within a few years. Instead of using the time consuming and expensive method of creating cDNA libraries from individually cloned transcripts, the 454 technology enabled massively parallel sequencing of the transcriptome without the need for cDNA clones (Vera et al. 2008).
We wanted to analyze as many expressed genes as possible and also to get a representative sample of the genetic diversity for SNP discovery. In order to do this the RNA for the transcriptome sequencing was isolat-ed from multiple individuals (80 samples from eight families) across the main Åland island representing both newly established and old local colonies (Vera et al. 2008). RNA pools extracted from larvae, pupae and adult body parts were normalized (Zhu et al. 2001, Shagin et al. 2002, Zhulidov et al. 2005) and se-quenced using the Roche GS20 sequencer (Margulies et al. 2005, Poinar et al. 2006). The Glanville fritillary butterfly was the first eukaryote transcriptome to be assembled de novo (Vera et al. 2008). The assem-bled transcriptome was annotated with blast searches against existing sequence databases and used to con-struct probes for a custom microarray that covered the entire transcriptome (Vera et al. 2008).
2.3. GENOME SEQUENCING & RNA-SEQ ANALYSIS
We began sequencing the full genome of the Glanville fritillary once it became technically and financially feasible. The genome sequencing used a hybrid ap-proach of multiple techniques including SOLiD, Il-lumina, 454 and PacBio. As there are no inbred lines available and the DNA yield from one individual is insufficient for the entire sequencing project, we used a mixed strategy in which a single individual butter-fly was used to make the initial reference sequence. This sequence was then supplemented with additional sequence from multiple individuals. The reference contigs from a single individual male butterfly were obtained using 454 sequencing. These were then sup-plemented with Illumina paired-end reads from a pool of full-sibs from the same family as the reference sam-ple. For longer mate-pair reads that were used in sub-sequent scaffolding phase the DNA was derived from multiple individuals which were full siblings. The final assembly with an overall coverage of 70X was 393 Mb long, separated into 8,262 scaffolds (N50 = 119 Kb). The relatively short scaffolds were merged into 1,453 superscaffolds (N50=331 Kb) using PacBio reads and long mate-pair 454 reads and information from the genetic crosses. Together the assembled sequences comprised approximately 72% of the genome. The mitochondrial genome (15 kb) was assembled and an-notated separately.
Genes were predicted using ab initio and evidence-based methods in the MAKER software (Cantarel et al. 2008). Protein sequences from other species and de novo assembled transcriptome sequences from the Glanville fritillary butterfly were used as support-ive evidence for the predicted gene models. Based on these gene predictions we found 16,667 gene models, of which 12,410 genes could be annotated using the PANNZER annotation tool (Radivojac et al. 2013). Gene ontology (GO) categories could be assigned to 9,471 genes, and KEGG pathways to 3,685 genes.
The comparison of the Glanville fritillary genome with other fully sequenced Lepidopteran genomes (Bom-byx mori and Heliconius melpomene) revealed un-expected high level of macrosynteny. There are very few chromosomal rearrangements, and practically no interchromosomal translocations. More than 95% of single copy genes can be mapped to orthologous chromosomes. The Glanville fritillary butterfly has the ancestral Lepidopteran karyotype of 31 chromosomes. Comparisons with the other Lepidopera with smaller
3. AIMS OF THE STUDY
18
number of chromosomes revealed that even when chromosomes fuse, they retain most of the gene order.
We developed a custom method for RNA-seq library construction that enabled large-scale sample pro-cessing with relatively low cost. The samples were individually tagged with a “bar code” sequence that enabled post sequencing identification of each indi-vidual butterfly. The libraries were sequenced at the DNA sequencing and Genomics laboratory in Helsinki and at Karolinska High Throughput Center in Sweden using Illumina HiSeq2000 and HiScanSQ (Illumina Inc.,CA, USA). The reads were filtered to include only high confidence base pairs (Phred-score >20), with a 50 bp minimum read length. The quality value, Phred-score (Q), is assigned to each nucleotide during the sequencing, and is logarithmically related to the base-calling error probability (P); Q = -10 log10 P. Thus a Phred-score of 20 equates to an error probability of 1/100 in the base calling (Ewing et al. 1998). The RNA-seq reads were mapped against the draft genome using the software TopHat2. TopHat2 is a fast read mapper that can align RNA-seq reads to large genomes using high-throughput short read aligners Bowtie (Lang-mead et al. 2009) or Bowtie2 (Langmead and Salzberg 2012). Tophat2 can then also identify splice junctions between exons from the mapping results (Kim et al. 2013).
3. AIMS OF THE STUDY
The Glanville fritillary butterfly has been extensively studied as model species for habitat fragmentation and metapopulation dynamics. A characteristic prop-erty of a metapopulation is that while the population as a whole persists over time, the local subpopulations are in a constant state of flux between local extinc-tions and re-colonizations (Hanski 1999). Of particu-lar interest with this species has been the critical rote of flight performance in establishing new colonies (Niitepõld et al. 2011). There is extensive variation in flight performance and much of this variation is herit-able (Saastamoinen 2008). Earlier work on the allelic variation in the phosphoglucose isomerase gene (Pgi) demonstrated that a single gene could explain a sub-stantial fraction of the observed variation in flight per-formance (Haag et al. 2005, Zheng et al. 2009). The involvement of additional genes and regulatory path-ways that could be associated with flight performance and other important heritable traits was hampered by the lack of genetic information.
The use of next-generation sequencing technologies changed the Glanville fritillary butterfly from a purely ecological model organism with no genetic data into an ecological genomics model organism within a few years. The introduction of 454-pyrosequencing was immediately utilized for sequencing the transcrip-tome of the Glanville fritillary butterfly. Using the par-tial transcript sequences as templates, custom gene expression microarrays were constructed (Vera et al. 2008). These enabled gene expression analysis to be carried out at the whole transcriptome level, looking for genes that are associated with important life his-tory traits (I & II).
The continued advancements in sequencing technol-ogy ultimately enabled us to sequence the full genome of the Glanville fritillary butterfly (Ahola et al. 2014). With the genome sequence available we were able to analyze expression and single nucleotide polymor-phism (SNP) in a more unbiased way, relative to the microarrays. We developed a cost effective method for doing large scale RNA sequencing (RNA-seq). We used this method to analyze gene expression variation among multiple populations around the Baltic sea. We analysed the effect of forced flight treatment on gene expression by using butterflies from two contrasting populations the Åland islands and the small isolated Pieni tytärsaari (“Daughter Island”) (III). We also an-alysed the effect of habitat fragmentation by compar-ing expression and SNP variation between two frag-mented populations (Åland islands and Uppland) and continuous populations (Saaremaa and Öland) (IV).
By using these full-genome methods we wanted to find out the genetic basis on important life history traits; larval development, colonization potential and flight performance. We wanted to tie these findings together to genes and pathways leading to the so called “life his-tory syndrome” that results from habitat fragmenta-tion.
3.1. EXPRESSION VARIATION AFFECTING COLONIZATION (I)
The first microarray experiment focused on finding expression differences between adult Glanville fritil-lary butterflies originating from newly colonized (<1 year) patches and old (>5 year) colonies. There can be multiple physiological and behavioral mechanisms that promote the migration and establishment of new colonies (Hanski et al. 1994, Kuussaari et al. 1996).
3. AIMS OF THE STUDY
19
We wanted to know if this is reflected in the gene ex-pression differences between these population types. In other words, are certain genotypes with a distinct expression profile enriched in the newly established populations?
In order to do that, we sampled larvae from multiple colonies, both new and old. They were reared in labo-ratory conditions to adults, crossed and the second generation offspring were reared to adults. These were then sacrificed, and dissected to three parts; head, tho-rax and abdomen. The RNA extracted from these body parts were processed and hybridized to the custom microarrays. The assumption was that the different body parts would display unique expression profiles, and the anticipated differences in expression between the new and old populations in each body part would reflect a different mechanism affecting the migratory behavior. For instance, gene expression differences af-fecting behavior would be presumably located in the head, expression differences affecting flight muscles would be located in the thorax and expression related to reproduction would be located in the abdomen.
3.2. VARIABILITY & HERITABILITY OF DEVELOPMENT TRAITS (II)
In order to get a comprehensive view of the genetic variation affecting larval development, we did a large scale rearing experiment covering most of the Åland islands metapopulation. We analyzed the variability, broad sense heritability and correlation between de-velopment time, weight increase and survival by col-lecting three larvae from each of the 1153 overwinter-ing nest observed in the 2009 field survey, from 436 local populations. The Glanville fritillary butterfly typ-ically only mate once and the larvae in each nest are typically full-sibs (Nieminen et al. 2004). The 5th in-star larvae were reared individually in common garden conditions (+28:15°C; 12:12, L/D). At the beginning of the 6th instar the larvae were randomly assigned to one of the two rearing temperatures (standard: +28:15°C 12:12, L/D; and warm: +32:15°C 12:12, L/D). Once the butterflies emerged from the pupae the samples were sexed, marked, and reared under common conditions (+26:18°C 9:15, L/D) to assess variation in adult lifes-pan. We measured the weight at the beginning of each development stage (larval instars, pupae and adult) and the duration of each development stage. Only the larvae that survived to adulthood (n=2018) and conse-quently had information for all of the life history traits were used in the analysis.
3.3. EXPRESSION VARIATION AFFECTING LARVAL DEVELOPMENT (II)
The second microarray experiment examined varia-tion in gene expression in the Glanville fritillary dur-ing the last stages of larval development. The larvae of Glanville fritillary display a wide range on phenotypic variation particularly in weight, development time and mortality (Kallioniemi and Hanski 2011). Many of these traits are heritable and can be the targets of natural selection (Saastamoinen 2008, Klemme and Hanski 2009). We wanted to assess if any of these phenotypic traits are correlated with gene expres-sion variation and whether the expression changes respond to the temperature treatment. We measured many phenotypic traits during larval development and estimated the heritability of these traits, similar to the large scale field study.
Second generation lab-reared larvae were grown under standard laboratory conditions (+28:15°C; 12:12, L/D) until the last larval molt, and were subsequently reared in three distinct temperature regimes (cold: 20:8°C 8:16, L/D; standard: 28:15°C 14:10, L/D; hot: 35:8°C 12:12, L/D), designed to mimic the natural var-iation in the field. Cold and hot conditions resemble the temperatures during a cool and cloudy spring and a hot and sunny spring, respectively. Standard condi-tion represents the average temperature profile in the Åland Islands (Kuussaari 1998). Larvae from six fami-lies were collected during mid-development of the last instar. Since larvae develop faster at higher tempera-tures, the larvae were collected at different times in the different temperature treatments; after 4, 5 and 6 days, for hot, standard and cold, respectively. The lar-vae were snap-frozen in liquid nitrogen and RNA was extracted for microarray hybridization and qPCR vali-dation. Three larvae from each treatment from three families were families chosen for microarray expres-sion analysis, the rest were used for validation.
3.4. EXPRESSION VARIATION ASSOCIATED WITH FLIGHT PERFORMANCE (III)
Based on the previous microarray analysis we knew that the flight metabolic rate (FMR) could be used as a factor in finding differentially expressed genes that are important for colonization of new habitat patches, and presumably relevant for flight performance in general
3. AIMS OF THE STUDY
20
(I). In the Åland islands FMR is partially confounded with population age. Using FMR as an explanatory variable instead of population age essentially repro-duced the same results but had no more power. In fact we found less significant genes using FMR that just population age (I). Here we wanted to identify the genes which are important for flight capability by using more contrasting samples. To this aim we ana-lyzed expression variation resulting from forced flight in both sexes. Furthermore, we also used two different populations that have drastically different flight per-formance (see below). The rationale for carrying out sex-specific measurements is that the flight capability and behavior are different between the sexes in Glan-ville fritillary butterfly (Niitepõld et al. 2011). Males have much higher mass-corrected peak metabolic rate than females (Mattila et al. 2012). However, it is the females that are typically more dispersive. In contrast, males spend most of their time finding mates within the same population (Niitepõld et al. 2011).
We looked at gene expression variation between two contrasting populations; the Åland island metapo-pulation and the small isolated Pieni tytärsaari (PT, “Daughter Island”) populations in the Baltic Sea. The PT population, which is presumed to have been colo-nized from Estonia, has been in complete isolation for at least 75 years (Mattila et al. 2012). The effective population size in PT is only about 100 individuals, and it shows considerable reduction in many fitness traits. These include adult weight, lifetime reproduc-tive success (cumulative egg production and egg vi-ability) and flight metabolic rate (Mattila et al. 2012). Crossing experiments have shown that the reduced fit-ness is restored in the F1 generation, indicating accu-mulation of recessive deleterious alleles. This is likely due to a founder effect and small population size, which lead to inbreeding depression and genetic drift (Mattila et al. 2012).
Three-day-old adults were randomly assigned to ei-ther flight or control groups. Butterflies in the treat-ment group were forced to fly for 15 min in a metabolic measurement chamber, by shaking the container, during which time the CO2 production was measured (Niitepõld et al. 2009). The control individuals were not forced to fly but otherwise treated the same way. After the treatment the butterflies were returned back to semi-natural conditions (+24:18°C; 10:14 L/D) and fed ad libitum. The butterflies were frozen in liquid ni-trogen either 1 or 20 hours after the (flight or control) treatment. Total-RNA was extracted from the thorax, and RNA-seq libraries were constructed using a cus-
tom method (IV). Although the forced flight treatment may seem excessive it has been shown to adequately represent the natural dispersal tendency. Flight meta-bolic rate measured with similar forced flight treat-ments have been shown to be significantly and posi-tively correlated with dispersal distances measured in the field (Niitepõld et al. 2009).
3.5. THE EFFECTS OF HABITAT FRAGMENTATION ON GENE EXPRESSION & SNP VARIATION (IV)
Habitat fragmentation typically has adverse demo-graphic and genetic consequences (Lande 1988). Some of these effects can be partly compensated by adapting different life history strategies (Ronce 2007). Popula-tions can became more (Hanski 2011) or less (Travis and Dytham 1999) dispersive depending for instance on the cost of dispersal (Hanski and Mononen 2011). The Glanville fritillary butterfly populations in frag-mented landscapes have differences in many impor-tant life history traits when compared to populations in continuous landscapes. These include elevated flight metabolic and dispersal rate, faster growth rate of postdiapause larvae, and higher life-time egg pro-duction (Duplouy et al. 2013).
We wanted to find common signatures of selection caused by habitat fragmentation using gene expres-sion and SNP variation in the transcriptome to com-pare two fragmented and two continuous populations of the Glanville fritillary butterfly around the Baltic Sea. The Åland Islands in Finland and the coastal area of Uppland in Sweden are fragmented landscapes. The typical habitat patches are very small (<<1 ha) and separated by unsuitable habitat. The patches also go frequently extinct (Ojanen et al. 2013). The large is-lands of Öland in Sweden and Saaremaa in Estonia are continuous landscapes, where the habitats are often exceeding 100 ha in area (Helm et al. 2006).
We collected larvae from 50 families from each of the populations, and reared them under common garden conditions (+28:15°C; 12:12, L/D) after diapause. The adult butterflies were frozen in liquid nitrogen three days after eclosion and the thorax samples were used for RNA sequencing. We used the same custom made RNA-seq library preparation method as in the previ-ous study. The read coverage per sample was quite uneven. To minimize the impact of sampling bias we used a balance set of 15 individuals per population for the expression analysis. For the SNP detection from
4. RESULTS & DISCUSSION
21
the RNA-seq data we used custom made software that only considered biallelic SNPs. As there were several low-coverage regions in the transcriptome, we used stringent criteria for SNP calling; the SNPs had to have high quality base calls (Phred > 20), they had to be present in the balanced dataset (4x15 samples) and have a minimiun allele frequency higher than 5% in the total sampleset. We estimated the population genealogy using Bayesian drift models in BANANAS (Sirén et al. 2011).
4. RESULTS & DISCUSSION
4.1. EGG DEVELOPMENT GENES ARE MORE EXPRESSED IN NEW POPULATIONS (I)
Female butterflies from newly established popula-tions mate earlier and produce more egg clutches than butterflies from old populations (Hanski et al. 2006). Microarray expression analysis showed that this is correlated with higher expression of genes related to egg maturation (I Fig. 1). In the abdomen the expres-sion level of hexamerins (also known as larval serum proteins (LSPs), lipid transporters (lipophorins and perilipin), angiotensin converting enzyme (Ace) and vitellogenin (Vg) is consistently higher in females from newly colonized populations (I Fig. 1).The results are consistent with the earlier studies with Lepidop-tera. Hexamerins and lipid transporters are known to be involved in the mobilization and transfer of nu-trients to the developing eggs (Teixeira et al. 2003). Ace is known to regulate regulates ovipositioning in Lepidoptera (Vercruysse et al. 2004). Blocking the activity of the protein ACE in newly emerged adult Spodoptera littoralis with an ACE inhibitor, captopril, significantly reduces ovipositioning. This reduction is attributed to inhibition of ecdysteroid biosynthesis (Vercruysse et al. 2004). This could explain why the elevated level of Ace in butterflies from newly estab-lished populations have also an elevated level of hex-amerin expression.
The expression results validated with qPCR and physi-ological measurements using an independent sam-pleset showed that new-population females had more mature (chorionated) eggs. The level of egg maturation was positively correlated with the total hemolymph protein content (I Fig. 2). Both hemolymph protein content and number of chorionated eggs increases linearly with the age of the butterfly in both new and
old population females. However the level of juvenile hormone (JH III) in the hemolymph is not only higher in new population females but increases substantially faster (I Fig. 2). Both JH and 20E have been shown to stimulate egg development in many insects (Sorge et al. 2000, Parthasarathy et al. 2010). The level of 20E was not measured in this experiment but the higher expression level of hexamerins would indicate that also it is higher in new-population females.
4.2. BREAKDOWN OF MUSCLE TISSUE FACILITATES HIGHER EGG PRODUCTION IN NEW-POPULATION FEMALES (I)
In many nectar-feeding butterflies reproductive po-tential depends on the protein reserves in the body as well as on those received in the spermatophores at mating (Karlsson 1994, 1998). The thorax and abdo-men mass typically decreases with age as the protein reserves are reallocated to reproduction (Stjernholm et al. 2005). The Glanville fritillary butterfly females loose a significant proportion of their body weight during their life in correlation with the number of eggs produced (Norberg and Leimar 2002, Saastamoinen et al. 2009). This includes the breakdown of flight muscles and restructuring the flight muscle struc-tures, to minimize the impact on flight performance. However the loss of thorax and abdomen mass are positively correlated, which might explain why there is no substantial loss in flight performance (Saas-tamoinen et al. 2009). Also the composition of the flight muscles changes with age. The relative ratios of flight muscle protein Troponin-T changes over time, and is affected by reproduction as well as body weight (Marden et al. 2008).
Microarray analysis revealed that the new-population butterflies had higher expression of proteasome genes (core and regulatory particle) in the thorax (I Fig. 3). Consistently, the protease inhibitor genes (Serpins) had lower expression in new-population females (I Fig. 3). Proteasomes regulate the rate of protein turn-over in the flight muscles, and their function is prob-ably related to both protein reallocation to reproduc-tion as well as maintenance of flight muscle functions (Haas et al. 2007). The expression of proteasome and chaperone genes was positively correlated with mass-adjusted peak metabolic rate independent of popula-tion age (I Fig. 3). Overall, the new-population females had a higher peak metabolic rate during flight than old-population females, consistent with previous ob-
4. RESULTS & DISCUSSION
22
servations (Haag et al. 2005).
4.3. NEW-POPULATION FEMALES HAVE ALTERED HYPOXIA SIGNALING (I)
The gene that had the highest variation in transcript abundance and that was associated with population age was succinate dehydrogenase d (Sdhd) in both abdomen and thorax samples (I Fig. 4). The observed variation was not due to gene expression differences, but due to insertion/deletion (indel) variation in the 3’-UTR region of this gene corresponding to the mi-croarray probe. Three distinct alleles (I, M and D) were identified by sequencing the 3’-UTR region of this gene from multiple samples; a large deletion (D) of 54 base pairs, a mini (M) deletion of 4 bp, and the intact/insertion (I) allele. Individuals with the M al-lele, that had perfect match with the microarray probe sequence, had very high hybridization signal (close to saturation), whereas the other alleles had almost no signal (close to global background intensity).
The deletion (D) allele of Sdhd was more frequent in the new populations (I Table S12). Individuals with the deletion allele had higher expression of chorion genes in the abdomen and higher expression of car-bohydrate metabolism genes in the thorax (glycolysis, pyruvate metabolism, and TCA cycle). The individuals carrying deletion allele also had a better flight endur-ance. They were able to maintain a high flight meta-bolic rate over the 10 minute forced flight treatment. This was confirmed with an independent dataset.
In a follow-up study (Marden et al. 2013) it turned out that the indel variation in Sdhd affected flight perfor-mance via hypoxia signaling. Heterozygote individuals carrying both M and I alleles have a much higher tra-cheal elaboration, and can achieve a high peak meta-bolic rate in reduced atmospheric oxygen content. After repeated flight treatments, the individuals with a mini-deletion allele (M) had reduced expression of hypoxia responsive gene Phd. The M allele, especially in combination with D had a lower SDH activity in the mitochondria, which should lead to accumulation of succinate in the cytoplasm and activation of hypoxia signaling (Schofield and Ratcliffe 2005, Selak et al. 2005). The hypoxia signaling is then expected to pro-mote the expression of genes required for tracheal branching (Arquier et al. 2006). Consistently, this was observed when pupae were injected with succinate. (Marden et al. 2013)
A potential mechanistic explanation was suggested by the identification of a putative micro-RNA binding site within the 3’-UTR region containing the indel varia-tion in Sdhd (I Fig.4). An evolutionarily conserved micro-RNA (miR-71), which in Caenorhabditis el-egans has been implicated in life-span variation, via regulation of insulin signaling pathway, through DAF-16/FOXO in the nervous system (Boulias and Horvitz 2012), has some level of sequence homology with the indel variable region. It remains to be determined whether this site is a genuine micro-RNA binding site and whether the observed phenotypic differences can be explained by differential miRNA binding. This will require sequencing of the miRNA population from Glanville fritillary, followed by identification of puta-tive miRNAs binding to this site and preferably direct manipulation of this binding either in Glanville fritil-lary or in an another heterologous system.
4.4. DIFFERENCES IN HORMONAL SIGNALING IS HERITABLE AND DETERMINES LARVAL DEVELOPMENT RATE (II)
The developmental traits (development time and weight gain) varied significantly and showed strong broad-sense heritability among the larval families collected across the Åland islands. The highest broad-sense heritability was observed for development time and body mass during the final larval instar and pupal stages. These traits were negatively correlated, mean-ing that the more massive larvae needed less time to develop. The control of body size in Drosophila is de-termined by insulin-like growth factors and hormonal signaling (Edgar 2006). These pathways are linked in many insects, as disrupting insulin signaling changes also hormonal signaling (Tu et al. 2005). Mutations in the insulin receptor cause slow development, small, infertile and long-lived adults (Tatar et al. 2001). The mutations also cause a decreased expression of ecdys-teroid (Tu et al. 2002) and juvenile hormone (JH). The adult phenotype can be restored with exogenous application of the JH analog methoprene (Tatar et al. 2001). Based on these findings we hoped we might find differences in insulin or hormonal signaling that correlate with differences in the developing larvae in Glanville fritillary butterfly.
We used gene expression microarrays to characterize the expression variation that could explain the herit-able and plastic responses in the larval development
4. RESULTS & DISCUSSION
23
traits. In these experiments we reared final instar lar-vae in three distinct temperature profiles (II Fig. 1) similar to the thermal conditions in the wild (Kuus-saari 1998). At this stage the larvae acquire most of their body mass, and build up the protein and energy reserves needed for adult life. The larvae developed the fastest and survive best in the hot temperature. In fact, all of the butterflies survived to adulthood in this condition. The differences in development rate that was observed in the two other temperature condi-tions standard and cold disappeared in hot. It appears that in the most optimal conditions the larval devel-opment reaches an upper limit, where the genetic differences are no longer important, whereas in the suboptimal conditions these differences are magni-fied. The variation in both mortality and development rate was highest in the least optimal condition cold. Although the genetic differences between the families didn’t manifest themselves in the phenotypic traits in the hot treatment, there was a substantial amount of expression differences observed in the microarray ex-periment. In fact, paradoxically, the expression varied most between the families in the hot treatment, when the phenotypic differences were the smallest.
We observed extensive heritable expression variation among larval families (II Fig.4). More than a third of the microarray probes, covering >8000 genes showed significant expression differences among larval fami-lies (42%). The temperature treatments caused ex-pression changes in roughly equal number of genes (39%). We found substantially fewer genes (18%) displaying genotype by environment interaction. In order to classify such a large number of differentially expressed genes we analyzed the enrichment of gene ontology (GO) and pathways (KEGG) (Al-Shahrour et al. 2005). Many of the differentially expressed genes belong to the same functional categories previously identified as important between newly-established and old local populations in adult female butterflies (I).
As we had hoped, we found significant enrichment of genes that are related to hormonal regulation differ-ences in body size (Zhou et al. 2008b). The hexam-erin genes (larval serum proteins) displayed a pro-gressively increased expression levels with increasing temperatures. Additionally, the expression levels var-ied significant among the larval families. Hexamerin expression correlated with larval development time across the temperatures treatments. It also exhibited the same family-by-treatment interactions observed with the development time (II Fig. 5). The expression
of hexamerins is regulated by 20-hydroxyecdysone (20E) (Burmester et al. 1999). In Manduca sexta there is a peak in 20E expression during mid-devel-opment of the final larval instar, at so called wander-ing stage (Hiruma and Riddiford 2010). The peak in 20E expression coincides with elevated expression of hexamerin genes and decreased expression of cuticle-binding proteins (Hiruma and Riddiford 2010). We checked the possible co-regulation of hexamerins and cuticle-binding proteins in our results and found a sig-nificant correlation between the expressions of each hexamerin gene and a negative correlation between hexamerin and cuticle-binding protein expressions (II Fig. S7).
Another group of genes which might be under the 20E regulation are the small heat shock proteins (HSP). We found a significant enrichment in the GO-category “response to unfolded protein”. The enrichment was mainly due to expression variation in heat shock pro-tein (HSP) genes. The expression of the small HSPs (20–40 kDa) responded to the temperature treatment (increased expression with increased temperature), while the larger HSPs (70 and 90 kDa) were consti-tutively different between families and didn’t respond to the temperature treatment. In Drosophila the small HSP (HSP27) contains a known ecdysone response el-ement (EcRE) (Cherbas et al. 1991).
4.5. MICROARRAYS OUTPERFORM QUANTITATIVE REAL-TIME PCR (II)
We validated the larval microarray results with quan-titative real-time PCR using 14 genes that showed significant expression differences relative to the tem-perature treatment (II Table S1). These genes spanned a wide range of expression levels. The overall corre-spondence between the microarray and qPCR results was good. Majority of the validated genes showed identical expression changes when using independent biological samples. Of the 174 larvae that were sam-pled, we tested the significance and the direction of expression change with multiple subsets as well as the full set of samples. All but two genes showed the same direction of expression change when using a smaller subset of the samples. When all of the samples were used, the direction of expression change was the iden-tical. The expression change in qPCR was statistically significant for most of the genes regardless of what subset of samples was used.
Despite having highly reproducible qPCR results it
4. RESULTS & DISCUSSION
24
turned out that the amount of technical variation in the qPCR was almost twice as high compared to the microarray, which could explain the lower statisti-cal power of the validation results. The coefficient of variation for 95% of the replicated reactions, repeated measurements of the same gene for each individual, was <6.7% in the qPCR compared to 3.4% in the mi-croarray experiment (II Fig. S2). Validation of micro-array results with qPCR has typically been considered “the golden standard” (Mackay et al. 2002, Shi et al. 2005). Based on our findings it seems that from a technical standpoint the microarrays have exceeded the accuracy PCR based expression measurements. Obviously qPCR still has its place when the generality of microarray findings is questioned. It is useful in as-saying a large number of samples for one or few genes, but when the number tested genes is large, qPCR quickly becomes cost prohibitive, and is not very ac-curate.
4.6. FLIGHT CHANGES THE EXPRESSION HYPOXIA AND IMMUNE RESPONSE GENES (III)
Flight metabolic rate (FMR) was higher in butterflies from Åland compared to the small and isolated Pieni tytärsaari (PT) population in both sexes (III Fig.1), as expected from previous findings (Mattila et al. 2012). The FMR was significantly higher in males during the first few minutes of flight, and the differences dimin-ished towards the end. During the last five minutes of flight treatment both sexes became clearly exhausted and the differences disappeared.
Using RNA-seq we were able to measure gene expres-sion for approximately half of the annotated genes (8,221/16,667) in the thorax. Of these, a substantial proportion (3,840 genes) showed significant expres-sion differences between the two populations (III Fig. 2). This is similar in proportion to the expression differences observed between larval families in the previous microarray analysis (II). Given that the two populations must have diverged a long time ago, it is not unexpected to find a large number of expression differences. In fact, it is conceivable that most of the observed differences have nothing to do with flight performance, or any of the phenotypic differences observed between the populations. Similarly, we ob-served a large proportion of genes (1,622) that were differentially expressed between the sexes. Relative to these two major categories, only a small number of expression differences (801 genes) could be attributed
to the flight treatment. We focused on the flight genes (755) that showed significant response to the treat-ment and had no interactions with sex or population. Sampling time itself had no effect on gene expression as the two control groups, samples at 1 and 20 hours after the “treatment”, showed no significant expres-sion differences. The control groups (C1 and C20) were combined for the subsequent analysis.
Most of the expression changes were significant only 20h after the flight treatment. Only 53 genes were sig-nificantly altered in expression 1 hour after the treat-ment. None of these genes had any obvious roles in flight metabolism. They included mainly stress and immune response genes, and genes involved in hormo-nal signaling (Rel2A, cathepsin B, prophenyloxidase, gloverin, sumo ligase, dopa decarboxylase, HSP70). Many other immune response genes also became dif-ferentially expressed after 20 hours, including many antimicrobial peptide (AMP) genes. It appears that the flight treatment triggers a generic immune response. The prophenyloxidase gene is the regulator of the mel-anization process (De Gregorio et al. 2002). Gloverin is a Lepidoptera specific AMP (Cheng et al. 2006), which is regulated by the Toll and Imd pathways (Le-maitre et al. 1996). Both of these immune processes are known to be also regulated by the ecdysteroid hormone 20E (Ahmed et al. 1999, Flatt et al. 2008).
Cathepsin B is a proteinase that in Helicoverpa ar-migera is expressed in the oocytes and adult fat bodies (Yang et al. 2006). Cathepsin B is involved in the deg-radation of yolk proteins during embryonic develop-ment (Zhao et al. 2005) and developmental autophagy of larval fat body (Juhász et al. 2007). Hypoxia signal-ing in human breast cancer also drives the expression of Cathepsin B. Activation of HIF-1α and NF-κB in-duces the loss of Cav-1, a tumor suppressor in fibro-blasts. This in turn increased autophagy and increases Cathepsin B expression (Martinez-Outschoorn et al. 2010). The hypoxia and immune responses are linked by the NF-kB (Nizet and Johnson 2009).
With the discovery that immune and hypoxia response genes became activated after the flight treatment, we did a global enrichment analysis looking at all the flight responsive genes. There were only marginally significant enrichments in the data, partially due to the poor annotation level. There were 86 (P<0.01) gene ontology categories (GO) enriched in the flight response genes, including defense response, response to hypoxia, muscle adaptation and glycolysis. Among the 15 enriched KEGG (P<0.05) pathways were gly-
4. RESULTS & DISCUSSION
25
colysis, citrate cycle (TCA cycle) and mTOR signaling pathway. Among the enriched pathways there were also many linked to human diseases (influenza A, antigen processing and presentation, toxoplasmosis, legionellosis, hepatitis C, Parkinson’s disease, Cha-gas disease), probably because these are the best de-scribed immune response pathways in KEGG.
We focused specifically on the main regulator of hy-poxia signaling Hif-1α. The genome sequence con-tained a substantial number of SNP and insertion/deletion (indel) variation, some of which are prob-ably biological variation and others are assembly errors (Ahola et al. 2014). Because of this variation many gene models had missing or incorrect exons. Some genes were also fused or split into several gene models. The gene model for Hif-1α was split into four separate gene models (MCINX007805-007808). The gene model closest to the 3’-end had the highest read coverage, so we used that to estimate the expression level of Hif-1α. The expression decreased slightly 20 hours after the flight treatment, indicating that the ex-pression level of Hif-1α itself might be regulated. Hy-poxia regulation happens mainly through protein level regulation (see 1.5. for more information) (Semenza 2000), but there are known cases where the mRNA level of Hif-1α is altered. In mouse cell lines (marrow-derived macrophages) lacking IKK-β, which specifi-cally regulates NF-κB activation, Hif-1α mRNA levels are reduced (Rius et al. 2008). Hypoxia also induced by the nuclear translocation of RelA (Rius et al. 2008), which was one of the genes that became differentially expressed 1 hour after the flight treatment.
4.7. THE SEX CHROMOSOME IS DRIVING HIGHER FLIGHT METABOLIC RATE IN MALES (III)
One of the genes in TCA showing significant expres-sion differences between sexes, populations and flight treatment was the citrate synthase (CS) (III Fig. 7B). CS is inhibited by products of the respira-tory chain, and is the rate-limiting enzyme of whole TCA cycle (Cheng et al. 2009). The expression of CS is known to correlate with fatigue resistance (Weston et al. 1999), and the expression level increases with muscle exercise (Leek et al. 2001). With the genome sequence available we discovered that CS is in the Z chromosome in Lepidoptera. We hypothesized that the expression difference in CS might be due to lack of dosage compensation. Lepidoptera are female het-erogametic, meaning that the males have two copies
of Z chromosome, whereas females have only one, and have instead ZW karyotype (Traut and Marec 1997). As no chromosomal silencing (dosage compensation) mechanisms in Lepidoptera has been observed (Zha et al. 2009), it is possible that males by virtue of hav-ing two copies of Z chromosome would also gain two times higher expression of genes in Z chromosome, including CS. We looked at the genes located in the Z chromosome in Glanville fritillary butterfly. About half (347/733) of these were expressed in the tho-rax samples. Males had higher expression for 54.8% of these, which is significantly more than the rest of the genome (46.2%). If we made the selection crite-ria more stringent and only counted those genes with statistically significant expression differences between the sexes the difference was even more pronounced; 72.4% of these genes had higher expression in males.
As CS is known to limit the whole TCA cycle, and males have approximately two fold higher expression of CS compared to females, we also looked at the ex-pression of other genes in TCA and mitochondria in general. All but one gene coding for a component of TCA cycle that had a statistically significant expres-sion difference between the sexes had higher expres-sion in males (14/15). Of all the genes involved in mi-tochondrial functions (GO:0005739 – mitochondria) 64% had higher expression in males (313/485). Much more of these genes (81%) had higher expression in males when we only looked at the genes with a sig-nificant expression difference between the sexes. We speculate that the expression of mitochondrial genes is regulated by CS expression level and activity. This can be analyzed with manipulation CS activity, with inhibitors (Smith and Williamson 1971), and measur-ing the expression level of other genes with mitochon-drial functions. With the high level of chromosomal synteny in Lepidoptera, as revealed by the genome sequencing (Ahola et al. 2014), it is possible that this finding is general in all Lepidoptera. Consistently, CS is also located in the Z chromosome Bombyx mori (BGIBMGA000672) and Heliconius melpomene (HMEL013400).
4.8. THE POPULATION DIFFERENCES IN FLIGHT PERFORMANCE RESULT FROM THE SAME REGULATORY MECHANISMS (III)
We also asked if the genes and pathways that were al-tered due to the flight treatment were also responsible for the observed differences between the contrasting
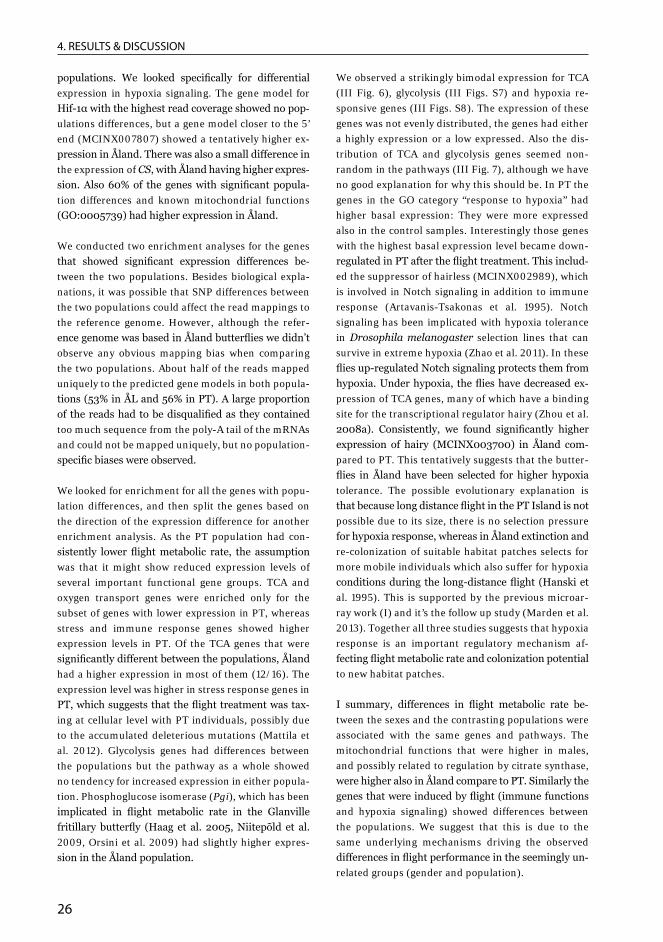
4. RESULTS & DISCUSSION
26
populations. We looked specifically for differential expression in hypoxia signaling. The gene model for Hif-1α with the highest read coverage showed no pop-ulations differences, but a gene model closer to the 5’ end (MCINX007807) showed a tentatively higher ex-pression in Åland. There was also a small difference in the expression of CS, with Åland having higher expres-sion. Also 60% of the genes with significant popula-tion differences and known mitochondrial functions (GO:0005739) had higher expression in Åland.
We conducted two enrichment analyses for the genes that showed significant expression differences be-tween the two populations. Besides biological expla-nations, it was possible that SNP differences between the two populations could affect the read mappings to the reference genome. However, although the refer-ence genome was based in Åland butterflies we didn’t observe any obvious mapping bias when comparing the two populations. About half of the reads mapped uniquely to the predicted gene models in both popula-tions (53% in ÅL and 56% in PT). A large proportion of the reads had to be disqualified as they contained too much sequence from the poly-A tail of the mRNAs and could not be mapped uniquely, but no population-specific biases were observed.
We looked for enrichment for all the genes with popu-lation differences, and then split the genes based on the direction of the expression difference for another enrichment analysis. As the PT population had con-sistently lower flight metabolic rate, the assumption was that it might show reduced expression levels of several important functional gene groups. TCA and oxygen transport genes were enriched only for the subset of genes with lower expression in PT, whereas stress and immune response genes showed higher expression levels in PT. Of the TCA genes that were significantly different between the populations, Åland had a higher expression in most of them (12/16). The expression level was higher in stress response genes in PT, which suggests that the flight treatment was tax-ing at cellular level with PT individuals, possibly due to the accumulated deleterious mutations (Mattila et al. 2012). Glycolysis genes had differences between the populations but the pathway as a whole showed no tendency for increased expression in either popula-tion. Phosphoglucose isomerase (Pgi), which has been implicated in flight metabolic rate in the Glanville fritillary butterfly (Haag et al. 2005, Niitepõld et al. 2009, Orsini et al. 2009) had slightly higher expres-sion in the Åland population.
We observed a strikingly bimodal expression for TCA (III Fig. 6), glycolysis (III Figs. S7) and hypoxia re-sponsive genes (III Figs. S8). The expression of these genes was not evenly distributed, the genes had either a highly expression or a low expressed. Also the dis-tribution of TCA and glycolysis genes seemed non-random in the pathways (III Fig. 7), although we have no good explanation for why this should be. In PT the genes in the GO category “response to hypoxia” had higher basal expression: They were more expressed also in the control samples. Interestingly those genes with the highest basal expression level became down-regulated in PT after the flight treatment. This includ-ed the suppressor of hairless (MCINX002989), which is involved in Notch signaling in addition to immune response (Artavanis-Tsakonas et al. 1995). Notch signaling has been implicated with hypoxia tolerance in Drosophila melanogaster selection lines that can survive in extreme hypoxia (Zhao et al. 2011). In these flies up-regulated Notch signaling protects them from hypoxia. Under hypoxia, the flies have decreased ex-pression of TCA genes, many of which have a binding site for the transcriptional regulator hairy (Zhou et al. 2008a). Consistently, we found significantly higher expression of hairy (MCINX003700) in Åland com-pared to PT. This tentatively suggests that the butter-flies in Åland have been selected for higher hypoxia tolerance. The possible evolutionary explanation is that because long distance flight in the PT Island is not possible due to its size, there is no selection pressure for hypoxia response, whereas in Åland extinction and re-colonization of suitable habitat patches selects for more mobile individuals which also suffer for hypoxia conditions during the long-distance flight (Hanski et al. 1995). This is supported by the previous microar-ray work (I) and it’s the follow up study (Marden et al. 2013). Together all three studies suggests that hypoxia response is an important regulatory mechanism af-fecting flight metabolic rate and colonization potential to new habitat patches.
I summary, differences in flight metabolic rate be-tween the sexes and the contrasting populations were associated with the same genes and pathways. The mitochondrial functions that were higher in males, and possibly related to regulation by citrate synthase, were higher also in Åland compare to PT. Similarly the genes that were induced by flight (immune functions and hypoxia signaling) showed differences between the populations. We suggest that this is due to the same underlying mechanisms driving the observed differences in flight performance in the seemingly un-related groups (gender and population).
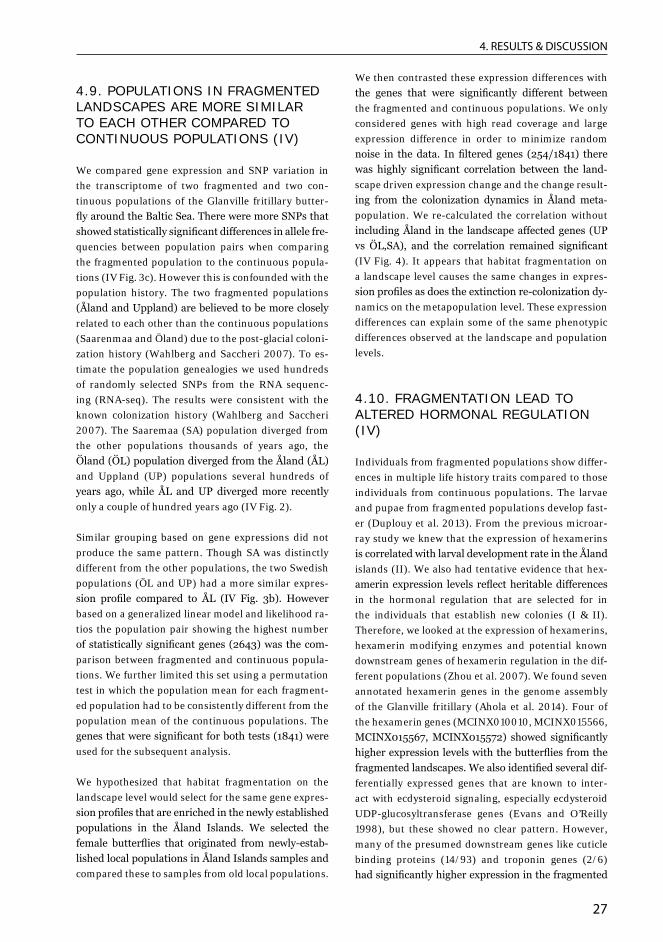
4. RESULTS & DISCUSSION
27
4.9. POPULATIONS IN FRAGMENTED LANDSCAPES ARE MORE SIMILAR TO EACH OTHER COMPARED TO CONTINUOUS POPULATIONS (IV)
We compared gene expression and SNP variation in the transcriptome of two fragmented and two con-tinuous populations of the Glanville fritillary butter-fly around the Baltic Sea. There were more SNPs that showed statistically significant differences in allele fre-quencies between population pairs when comparing the fragmented population to the continuous popula-tions (IV Fig. 3c). However this is confounded with the population history. The two fragmented populations (Åland and Uppland) are believed to be more closely related to each other than the continuous populations (Saarenmaa and Öland) due to the post-glacial coloni-zation history (Wahlberg and Saccheri 2007). To es-timate the population genealogies we used hundreds of randomly selected SNPs from the RNA sequenc-ing (RNA-seq). The results were consistent with the known colonization history (Wahlberg and Saccheri 2007). The Saaremaa (SA) population diverged from the other populations thousands of years ago, the Öland (ÖL) population diverged from the Åland (ÅL) and Uppland (UP) populations several hundreds of years ago, while ÅL and UP diverged more recently only a couple of hundred years ago (IV Fig. 2).
Similar grouping based on gene expressions did not produce the same pattern. Though SA was distinctly different from the other populations, the two Swedish populations (ÖL and UP) had a more similar expres-sion profile compared to ÅL (IV Fig. 3b). However based on a generalized linear model and likelihood ra-tios the population pair showing the highest number of statistically significant genes (2643) was the com-parison between fragmented and continuous popula-tions. We further limited this set using a permutation test in which the population mean for each fragment-ed population had to be consistently different from the population mean of the continuous populations. The genes that were significant for both tests (1841) were used for the subsequent analysis.
We hypothesized that habitat fragmentation on the landscape level would select for the same gene expres-sion profiles that are enriched in the newly established populations in the Åland Islands. We selected the female butterflies that originated from newly-estab-lished local populations in Åland Islands samples and compared these to samples from old local populations.
We then contrasted these expression differences with the genes that were significantly different between the fragmented and continuous populations. We only considered genes with high read coverage and large expression difference in order to minimize random noise in the data. In filtered genes (254/1841) there was highly significant correlation between the land-scape driven expression change and the change result-ing from the colonization dynamics in Åland meta-population. We re-calculated the correlation without including Åland in the landscape affected genes (UP vs ÖL,SA), and the correlation remained significant (IV Fig. 4). It appears that habitat fragmentation on a landscape level causes the same changes in expres-sion profiles as does the extinction re-colonization dy-namics on the metapopulation level. These expression differences can explain some of the same phenotypic differences observed at the landscape and population levels.
4.10. FRAGMENTATION LEAD TO ALTERED HORMONAL REGULATION (IV)
Individuals from fragmented populations show differ-ences in multiple life history traits compared to those individuals from continuous populations. The larvae and pupae from fragmented populations develop fast-er (Duplouy et al. 2013). From the previous microar-ray study we knew that the expression of hexamerins is correlated with larval development rate in the Åland islands (II). We also had tentative evidence that hex-amerin expression levels reflect heritable differences in the hormonal regulation that are selected for in the individuals that establish new colonies (I & II). Therefore, we looked at the expression of hexamerins, hexamerin modifying enzymes and potential known downstream genes of hexamerin regulation in the dif-ferent populations (Zhou et al. 2007). We found seven annotated hexamerin genes in the genome assembly of the Glanville fritillary (Ahola et al. 2014). Four of the hexamerin genes (MCINX010010, MCINX015566, MCINX015567, MCINX015572) showed significantly higher expression levels with the butterflies from the fragmented landscapes. We also identified several dif-ferentially expressed genes that are known to inter-act with ecdysteroid signaling, especially ecdysteroid UDP-glucosyltransferase genes (Evans and O’Reilly 1998), but these showed no clear pattern. However, many of the presumed downstream genes like cuticle binding proteins (14/93) and troponin genes (2/6) had significantly higher expression in the fragmented
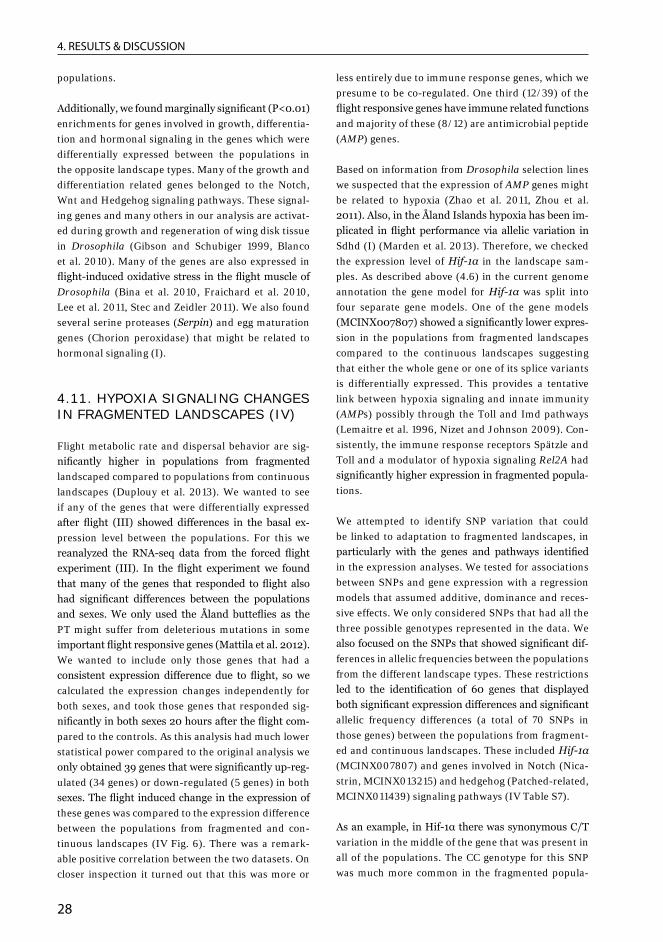
4. RESULTS & DISCUSSION
28
populations.
Additionally, we found marginally significant (P<0.01) enrichments for genes involved in growth, differentia-tion and hormonal signaling in the genes which were differentially expressed between the populations in the opposite landscape types. Many of the growth and differentiation related genes belonged to the Notch, Wnt and Hedgehog signaling pathways. These signal-ing genes and many others in our analysis are activat-ed during growth and regeneration of wing disk tissue in Drosophila (Gibson and Schubiger 1999, Blanco et al. 2010). Many of the genes are also expressed in flight-induced oxidative stress in the flight muscle of Drosophila (Bina et al. 2010, Fraichard et al. 2010, Lee et al. 2011, Stec and Zeidler 2011). We also found several serine proteases (Serpin) and egg maturation genes (Chorion peroxidase) that might be related to hormonal signaling (I).
4.11. HYPOXIA SIGNALING CHANGES IN FRAGMENTED LANDSCAPES (IV)
Flight metabolic rate and dispersal behavior are sig-nificantly higher in populations from fragmented landscaped compared to populations from continuous landscapes (Duplouy et al. 2013). We wanted to see if any of the genes that were differentially expressed after flight (III) showed differences in the basal ex-pression level between the populations. For this we reanalyzed the RNA-seq data from the forced flight experiment (III). In the flight experiment we found that many of the genes that responded to flight also had significant differences between the populations and sexes. We only used the Åland butteflies as the PT might suffer from deleterious mutations in some important flight responsive genes (Mattila et al. 2012). We wanted to include only those genes that had a consistent expression difference due to flight, so we calculated the expression changes independently for both sexes, and took those genes that responded sig-nificantly in both sexes 20 hours after the flight com-pared to the controls. As this analysis had much lower statistical power compared to the original analysis we only obtained 39 genes that were significantly up-reg-ulated (34 genes) or down-regulated (5 genes) in both sexes. The flight induced change in the expression of these genes was compared to the expression difference between the populations from fragmented and con-tinuous landscapes (IV Fig. 6). There was a remark-able positive correlation between the two datasets. On closer inspection it turned out that this was more or
less entirely due to immune response genes, which we presume to be co-regulated. One third (12/39) of the flight responsive genes have immune related functions and majority of these (8/12) are antimicrobial peptide (AMP) genes.
Based on information from Drosophila selection lines we suspected that the expression of AMP genes might be related to hypoxia (Zhao et al. 2011, Zhou et al. 2011). Also, in the Åland Islands hypoxia has been im-plicated in flight performance via allelic variation in Sdhd (I) (Marden et al. 2013). Therefore, we checked the expression level of Hif-1α in the landscape sam-ples. As described above (4.6) in the current genome annotation the gene model for Hif-1α was split into four separate gene models. One of the gene models (MCINX007807) showed a significantly lower expres-sion in the populations from fragmented landscapes compared to the continuous landscapes suggesting that either the whole gene or one of its splice variants is differentially expressed. This provides a tentative link between hypoxia signaling and innate immunity (AMPs) possibly through the Toll and Imd pathways (Lemaitre et al. 1996, Nizet and Johnson 2009). Con-sistently, the immune response receptors Spätzle and Toll and a modulator of hypoxia signaling Rel2A had significantly higher expression in fragmented popula-tions.
We attempted to identify SNP variation that could be linked to adaptation to fragmented landscapes, in particularly with the genes and pathways identified in the expression analyses. We tested for associations between SNPs and gene expression with a regression models that assumed additive, dominance and reces-sive effects. We only considered SNPs that had all the three possible genotypes represented in the data. We also focused on the SNPs that showed significant dif-ferences in allelic frequencies between the populations from the different landscape types. These restrictions led to the identification of 60 genes that displayed both significant expression differences and significant allelic frequency differences (a total of 70 SNPs in those genes) between the populations from fragment-ed and continuous landscapes. These included Hif-1α (MCINX007807) and genes involved in Notch (Nica-strin, MCINX013215) and hedgehog (Patched-related, MCINX011439) signaling pathways (IV Table S7).
As an example, in Hif-1α there was synonymous C/T variation in the middle of the gene that was present in all of the populations. The CC genotype for this SNP was much more common in the fragmented popula-
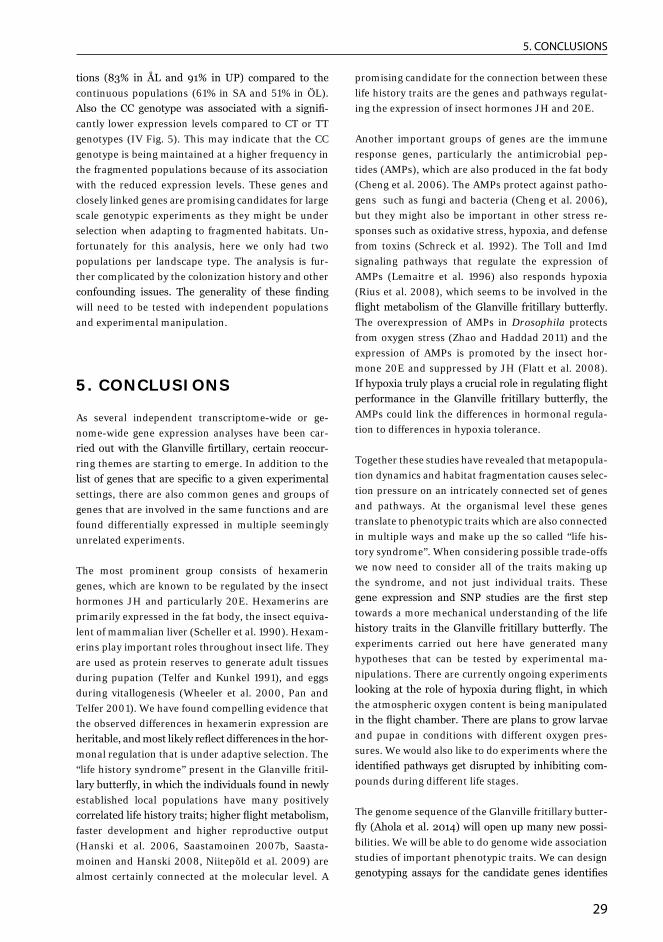
5. CONCLUSIONS
29
tions (83% in ÅL and 91% in UP) compared to the continuous populations (61% in SA and 51% in ÖL). Also the CC genotype was associated with a signifi-cantly lower expression levels compared to CT or TT genotypes (IV Fig. 5). This may indicate that the CC genotype is being maintained at a higher frequency in the fragmented populations because of its association with the reduced expression levels. These genes and closely linked genes are promising candidates for large scale genotypic experiments as they might be under selection when adapting to fragmented habitats. Un-fortunately for this analysis, here we only had two populations per landscape type. The analysis is fur-ther complicated by the colonization history and other confounding issues. The generality of these finding will need to be tested with independent populations and experimental manipulation.
5. CONCLUSIONS As several independent transcriptome-wide or ge-nome-wide gene expression analyses have been car-ried out with the Glanville firtillary, certain reoccur-ring themes are starting to emerge. In addition to the list of genes that are specific to a given experimental settings, there are also common genes and groups of genes that are involved in the same functions and are found differentially expressed in multiple seemingly unrelated experiments.
The most prominent group consists of hexamerin genes, which are known to be regulated by the insect hormones JH and particularly 20E. Hexamerins are primarily expressed in the fat body, the insect equiva-lent of mammalian liver (Scheller et al. 1990). Hexam-erins play important roles throughout insect life. They are used as protein reserves to generate adult tissues during pupation (Telfer and Kunkel 1991), and eggs during vitallogenesis (Wheeler et al. 2000, Pan and Telfer 2001). We have found compelling evidence that the observed differences in hexamerin expression are heritable, and most likely reflect differences in the hor-monal regulation that is under adaptive selection. The “life history syndrome” present in the Glanville fritil-lary butterfly, in which the individuals found in newly established local populations have many positively correlated life history traits; higher flight metabolism, faster development and higher reproductive output (Hanski et al. 2006, Saastamoinen 2007b, Saasta-moinen and Hanski 2008, Niitepõld et al. 2009) are almost certainly connected at the molecular level. A
promising candidate for the connection between these life history traits are the genes and pathways regulat-ing the expression of insect hormones JH and 20E.
Another important groups of genes are the immune response genes, particularly the antimicrobial pep-tides (AMPs), which are also produced in the fat body (Cheng et al. 2006). The AMPs protect against patho-gens such as fungi and bacteria (Cheng et al. 2006), but they might also be important in other stress re-sponses such as oxidative stress, hypoxia, and defense from toxins (Schreck et al. 1992). The Toll and Imd signaling pathways that regulate the expression of AMPs (Lemaitre et al. 1996) also responds hypoxia (Rius et al. 2008), which seems to be involved in the flight metabolism of the Glanville fritillary butterfly. The overexpression of AMPs in Drosophila protects from oxygen stress (Zhao and Haddad 2011) and the expression of AMPs is promoted by the insect hor-mone 20E and suppressed by JH (Flatt et al. 2008). If hypoxia truly plays a crucial role in regulating flight performance in the Glanville fritillary butterfly, the AMPs could link the differences in hormonal regula-tion to differences in hypoxia tolerance.
Together these studies have revealed that metapopula-tion dynamics and habitat fragmentation causes selec-tion pressure on an intricately connected set of genes and pathways. At the organismal level these genes translate to phenotypic traits which are also connected in multiple ways and make up the so called “life his-tory syndrome”. When considering possible trade-offs we now need to consider all of the traits making up the syndrome, and not just individual traits. These gene expression and SNP studies are the first step towards a more mechanical understanding of the life history traits in the Glanville fritillary butterfly. The experiments carried out here have generated many hypotheses that can be tested by experimental ma-nipulations. There are currently ongoing experiments looking at the role of hypoxia during flight, in which the atmospheric oxygen content is being manipulated in the flight chamber. There are plans to grow larvae and pupae in conditions with different oxygen pres-sures. We would also like to do experiments where the identified pathways get disrupted by inhibiting com-pounds during different life stages.
The genome sequence of the Glanville fritillary butter-fly (Ahola et al. 2014) will open up many new possi-bilities. We will be able to do genome wide association studies of important phenotypic traits. We can design genotyping assays for the candidate genes identifies
6. ACKNOWLEDGEMENTS
30
in these experiments, and apply them on large scale surveys. We can look for regulatory regions in these genes, and see if they share common motifs. And we can begin to design experiments to look for post-tran-scriptional regulation (alternative splicing and micro-RNA regulation).
6. ACKNOWLEDGEMENTS
This study was mainly carried out at the Institute of Biotechnology at the University of Helsinki. I would like to thank the Institute of Biotechnology for provid-ing excellent facilities and equipment to conduct the work. I would like to thank my supervisors Docent Mikko Frilander and Professor Ilkka Hanski for giving me the opportunity to work on such a unique study system. The value of this opportunity cannot be ex-pressed in words alone. You have helped me to grow as a scientist and a person, and have given me a whole new appreciation for doing science. Thanks for all the advice and the resources to carry out such bold experi-ments.
I would like to thank Professor Thomas Flatt for agree-ing to be my supervisor. I’m looking forward to our discussions. Thanks for Professors Jaakko Kangas-järvi and Craig Primmer for the pre-examination of the thesis. I hope I have managed improve the thesis based on your comments. Thanks for Professor Otso Ovaskainen for agreeing to be the custos.
A special thanks goes to all the colleagues at the splic-ing lab of Mikko Frilander, past and present. Thanks for providing a warm and welcoming environment to work in. And thank you for providing useful com-ments and critique at our weekly lab meetings. I would also like to thank the Metapopulation Research Group (MRG) for being such a diverse and passion-ate group of scientists. I’m honored to have been a member of such a fine group of people. I have enjoyed our meetings and trips to various locations through-out the years. Thank you for all the coffee and pulla. Also a special thanks goes to Chris Wheat for all the collaboration and lively discussions we have had over the years. The memories of working late at night on the microarray experiments will forever be seared in my mind.
I would also like to thank my family for the support they have given me. Thanks to Emilia and Uoti for giv-ing me a life outside of work.
7. REFERENCES
Aharoni, A. and O. Vorst. 2002. DNA microarrays for func-tional plant genomics. Plant Molecular Biology 48:99-118
Ahmed, A., D. Martin, A. Manetti, S.-J. Han, W.-J. Lee, K. Mathiopoulos, H.-M. Müller, F. Kafatos, A. Raikhel, and P. Brey. 1999. Genomic structure and ecdysone regulation of the prophenoloxidase 1 gene in the malaria vector Anopheles gambiae. Proceedings of the National Academy of Sciences of the United States of America 96:14795-14800.
Ahola, V., R. Lehtonen, P. Somervuo, L. Salmela, P. Koskinen, P. Rastas, N. Välimäki, L. Paulin, J. Kvist, N. Wahlberg, J. Tanskanen, E. A. Hornett, L. C. Ferguson, S. Luo, Z. Cao, M. A. de Jong, A. Duplouy, O.-P. Smolander, H. Vogel, R. C. McCoy, K. Qian, W. S. Chong, Q. Zhang, F. Ahmad, J. K. Haukka, A. Joshi, J. Salojärvi, C. W. Wheat, E. Grosse-Wilde, D. Hughes, R. Katainen, E. Pitkänen, J. Ylinen, R. Waterhouse, M. Tu-runen, A. Vähärautio, A. Sculman, M. Taipale, D. Lawson, E. Ukkonen, V. Mäkinen, M. R. Goldsmith, L. Holm, P. Auvinen, M. J. Frilander, and I. Hanski. 2014. The Glanville fritillary genome retains an ancient karyotype and reveals selective chromosomal fusions in Lepidoptera. Nature Communica-tions 5:4737.
Al-Shahrour, F., R. Díaz-Uriarte, and J. Dopazo. 2005. Dis-covering molecular functions significantly related to pheno-types by combining gene expression data and biological infor-mation. Bioinformatics 21:2988-2993.
Antoniewski, C., M. Laval, A. Dahan, and J.-A. Lepesant. 1994. The ecdysone response enhancer of the Fbp1 gene of Drosoph-ila melanogaster is a direct target for the EcR/USP nuclear receptor. Molecular and Cellular Biology 14:4465-4474.
Arif, A., D. Manohar, D. Gullipalli, and A. Dutta-Gupta. 2008. Regulation of hexamerin receptor phosphorylation by hemo-lymph protein HP19 and 20-hydroxyecdysone directs hex-amerin uptake in the rice moth Corcyra cephalonica. Insect Biochemistry and Molecular Biology 38:307-319.
Arquier, N., P. Vigne, E. Duplan, T. Hsu, P. Therond, C. Frelin, and G. D’angelo. 2006. Analysis of the hypoxia-sensing path-way in Drosophila melanogaster. The Biochemical Journal 393:471-480.
Artavanis-Tsakonas, S., K. Matsuno, and M. Fortini. 1995. Notch signaling. Science 268:225-232.
Ashburner, M. 1970. Effects of juvenile hormone on adult differentiation of Drosophila melanogaster. Nature 227:187-189.
Austin, A., O. Ovaskainen, and I. Hanski. 2011. Size and ge-netic composition of the colonizing propagules in a butterfly metapopulation. Oikos 120:1357-1365.
Bar-Or, C., M. Bar-Eyal, T. Z. Gal, Y. Kapulnik, H. Czosnek, and H. Koltai. 2006. Derivation of species-specific hybridiza-tion-like knowledge out of cross-species hybridization results. BMC Genomics 7:110.
Barchuk, A. R., M. M. G. Bitondi, and Z. L. P. Simões. 2002. Effects of juvenile hormone and ecdysone on the timing of vitellogenin appearance in hemolymph of queen and worker pupae of Apis mellifera. Journal of Insect Science 2:1.
Baysal, B. E., R. E. Ferrell, J. E. Willett-Brozick, E. C. Law-rence, D. Myssiorek, A. Bosch, A. van der Mey, P. E. Taschner, W. S. Rubinstein, and E. N. Myers. 2000. Mutations in SDHD,
7. REFERENCES
31
a mitochondrial complex II gene, in hereditary paraganglio-ma. Science 287:848-851.
Beintema, J. J., W. T. Stam, B. Hazes, and M. P. Smidt. 1994. Evolution of arthropod hemocyanins and insect storage pro-teins (hexamerins). Molecular Biology and Evolution 11:493-503.
Bina, S., V. M. Wright, K. H. Fisher, M. Milo, and M. P. Zei-dler. 2010. Transcriptional targets of Drosophila JAK/STAT pathway signalling as effectors of haematopoietic tumour for-mation. EMBO Reports 11:201-207.
Blanco, E., M. Ruiz-Romero, S. Beltran, M. Bosch, A. Punset, F. Serras, and M. Corominas. 2010. Gene expression following induction of regeneration in Drosophila wing imaginal discs. Expression profile of regenerating wing discs. BMC Develop-mental Biology 10:94.
Boggs, C. L. and M. Nieminen. 2004. Checkerspot reproduc-tive biology. Pages 92-111 in P. R. Ehrlich and I. Hanski, edi-tors. On the wings of checkerspot: a model system for popula-tion biology. Oxford University Press, New York.
Bohn, H. 1986. Hemolymph clotting in insects. Pages 188-207 in M. Brehélin, editor. Immunity in Invertebrates. Springer, Berlin.
Boulias, K. and H. R. Horvitz. 2012. The C. elegans microRNA mir-71 acts in neurons to promote germline-mediated longev-ity through regulation of DAF-16/FOXO. Cell Metabolism 15:439-450.
Bownes, M. 1986. Expression of the genes coding for vitello-genin (yolk protein). Annual Review of Entomology 31:507-531.
Bownes, M. 1994. The regulation of the yolk protein genes, a family of sex differentiation genes in Drosophila mela-nogaster. Bioessays 16:745-752.
Bownes, M., E. Ronaldson, and D. Mauchline. 1996. 20-hy-droxyecdysone, but not juvenile hormone, regulation of yolk protein gene expression can be mapped to cis-acting DNA se-quences. Developmental Biology 173:475-489.
Brodsky, L., J. Jacob-Hirsch, A. Avivi, L. Trakhtenbrot, S. Zeligson, N. Amariglio, A. Paz, A. Korol, M. Band, and G. Rechavi. 2005. Evolutionary regulation of the blind subterra-nean mole rat, Spalax, revealed by genome-wide gene expres-sion. Proceedings of the National Academy of Sciences of the United States of America 102:17047-17052.
Buddemeier, R. W., J. R. Ware, T. A. Gardner, I. Côté, J. A. Gill, A. Grant, and A. Watkinson. 2003. Coral reef decline in the Caribbean. Science 302:391-393.
Bulet, P., C. Hetru, J.-L. Dimarcq, and D. Hoffmann. 1999. Antimicrobial peptides in insects; structure and function. De-velopmental & Comparative Immunology 23:329-344.
Burmester, T. 2002. Origin and evolution of arthropod hemo-cyanins and related proteins. Journal of Comparative Physiol-ogy B 172:95-107.
Burmester, T., C. Antoniewski, and J.-A. Lepesant. 1999. Ecdysone-regulation of synthesis and processing of Fat Body Protein 1, the larval serum protein receptor of Drosophila mel-anogaster. European Journal of Biochemistry 262:49-55.
Calboli, F. C. F., W. J. Kennington, and L. Partridge. 2003. QTL mapping reveals a striking coincidence in the positions of genomic regions associated with adaptive variation in body
size in parallel clines of Drosophila melanogaster on different continents. Evolution 57:2653-2658.
Caldwell, P. E., M. Walkiewicz, and M. Stern. 2005. Ras ac-tivity in the Drosophila prothoracic gland regulates body size and developmental rate via ecdysone release. Current Biology 15:1785-1795.
Cantarel, B. L., I. Korf, S. M. Robb, G. Parra, E. Ross, B. Moore, C. Holt, A. S. Alvarado, and M. Yandell. 2008. MAKER: an easy-to-use annotation pipeline designed for emerging model organism genomes. Genome Research 18:188-196.
Cerenius, L. and K. Söderhäll. 2004. The prophenoloxidase-activating system in invertebrates. Immunological Reviews 198:116-126.
Chadwick, L. E. and D. Gilmour. 1940. Respiration during flight in Drosophila repleta Wollaston: the oxygen consump-tion considered in relation to the wing-rate. Physiological Zo-ology 13:398-410.
Chen, F., M. Dong, M. Ge, L. Zhu, L. Ren, G. Liu, and R. Mu. 2013. The history and advances of reversible terminators used in new generations of sequencing technology. Genomics, Pro-teomics & Bioinformatics 11:34-40.
Chen, S., P. Yang, F. Jiang, Y. Wei, Z. Ma, and L. Kang. 2010. De novo analysis of transcriptome dynamics in the migra-tory locust during the development of phase traits. PLoS ONE 5:e15633.
Cheng, T.-L., C.-C. Liao, W.-H. Tsai, C.-C. Lin, C.-W. Yeh, C.-F. Teng, and W.-T. Chang. 2009. Identification and char-acterization of the mitochondrial targeting sequence and mechanism in human citrate synthase. Journal of Cellular Biochemistry 107:1002-1015.
Cheng, T., P. Zhao, C. Liu, P. Xu, Z. Gao, Q. Xia, and Z. Xiang. 2006. Structures, regulatory regions, and inductive expres-sion patterns of antimicrobial peptide genes in the silkworm Bombyx mori. Genomics 87:356-365.
Cherbas, L., K. Lee, and P. Cherbas. 1991. Identification of ecdysone response elements by analysis of the Drosophila Eip28/29 gene. Genes & Development 5:120-131.
Cisper, G., A. J. Zera, and D. W. Borst. 2000. Juvenile hor-mone titer and morph-specific reproduction in the wing-poly-morphic cricket, Gryllus firmus. Journal of Insect Physiology 46:585-596.
Collins, L. J., P. J. Biggs, C. Voelckel, and S. Joly. 2008. An approach to transcriptome analysis of non-model organisms using short-read sequences. Genome Informatics 21:3-14.
Colombani, J., L. Bianchini, S. Layalle, E. Pondeville, C. Dau-phin-Villemant, C. Antoniewski, C. Carré, S. Noselli, and P. Léopold. 2005. Antagonistic actions of ecdysone and insulins determine final size in Drosophila. Science 310:667-670.
Colosimo, P. F., K. E. Hosemann, S. Balabhadra, G. Villar-real Jr, M. Dickson, J. Grimwood, J. Schmutz, R. M. Myers, D. Schluter, and D. M. Kingsley. 2005. Widespread parallel evolution in sticklebacks by repeated fixation of ectodysplasin alleles. Science 307:1928-1933.
Colosimo, P. F., C. L. Peichel, K. Nereng, B. K. Blackman, M. D. Shapiro, D. Schluter, and D. M. Kingsley. 2004. The genetic architecture of parallel armor plate reduction in threespine sticklebacks. PLoS Biology 2:e109.
Crawford, J. E., W. M. Guelbeogo, A. Sanou, A. Traoré, K. D.
7. REFERENCES
32
Vernick, N. F. Sagnon, and B. P. Lazzaro. 2010. De novo tran-scriptome sequencing in Anopheles funestus using Illumina RNA-seq technology. PLoS ONE 5:e14202.
Davis, R. and G. Fraenkel. 1940. The oxygen consumption of flies during flight. Journal of Experimental Biology 17:402-407.
De Gregorio, E., S.-J. Han, W.-J. Lee, M.-J. Baek, T. Osaki, S.-I. Kawabata, B.-L. Lee, S. Iwanaga, B. Lemaitre, and P. T. Brey. 2002. An immune-responsive Serpin regulates the mel-anization cascade in Drosophila. Developmental Cell 3:581-592.
DeRisi, J., L. Penland, P. O. Brown, M. L. Bittner, P. S. Melt-zer, M. Ray, Y. Chen, Y. A. Su, and J. M. Trent. 1996. Use of a cDNA microarray to analyse gene expression patterns in human cancer. Nature Genetics 14:457-460.
Dingle, H. and R. Winchell. 1997. Juvenile hormone as a me-diator of plasticity in insect life histories. Archives of Insect Biochemistry and Physiology 35:359-373.
Dolcet, X., D. Llobet, J. Pallares, and X. Matias-Guiu. 2005. NF-kB in development and progression of human cancer. Vir-chows Archiv 446:475-482.
Doughty, P. and R. Shine. 1997. Detecting life history trade-offs: measuring energy stores in “capital” breeders reveals costs of reproduction. Oecologia 110:508-513.
Dudley, R. 2002. The biomechanics of insect flight: form, function, evolution. Princeton University Press, New Jersey.
Duplouy, A., S. Ikonen, and I. Hanski. 2013. Life history of the Glanville fritillary butterfly in fragmented versus continuous landscapes. Ecology and Evolution 3:5141-5156.
Edgar, B. A. 2006. How flies get their size: genetics meets physiology. Nature Reviews. Genetics 7:907-916.
Ekblom, R. and J. Galindo. 2011. Applications of next gen-eration sequencing in molecular ecology of non-model organ-isms. Heredity 107:1-15.
Ekbote, U., D. Coates, and R. Isaac. 1999. A mosquito (Anoph-eles stephensi) angiotensin I-converting enzyme (ACE) is induced by a blood meal and accumulates in the developing ovary. FEBS Letters 455:219-222.
Ellegren, H. and B. C. Sheldon. 2008. Genetic basis of fitness differences in natural populations. Nature 452:169-175.
Evans, O. and D. O’Reilly. 1998. Purification and kinetic anal-ysis of a baculovirus ecdysteroid UDP-glucosyltransferase. The Biochemical Journal 330:1265-1270.
Ewing, B., L. Hillier, M. C. Wendl, and P. Green. 1998. Base-calling of automated sequencer traces using Phred. I. Accu-racy assessment. Genome Research 8:175-185.
Feder, M. E. and T. Mitchell-Olds. 2003. Evolutionary and ecological functional genomics. Nature Reviews. Genetics 4:649-655.
Feldmeyer, B., C. W. Wheat, N. Krezdorn, B. Rotter, and M. Pfenninger. 2011. Short read Illumina data for the de novo assembly of a non-model snail species transcriptome (Radix balthica, Basommatophora, Pulmonata), and a comparison of assembler performance. BMC Genomics 12:317.
Feldser, D., F. Agani, N. V. Iyer, B. Pak, G. Ferreira, and G. L. Semenza. 1999. Reciprocal positive regulation of hypoxia-inducible factor 1α and insulin-like growth factor 2. Cancer
Research 59:3915-3918.
Flatt, T., A. Heyland, F. Rus, E. Porpiglia, C. Sherlock, R. Yamamoto, A. Garbuzov, S. R. Palli, M. Tatar, and N. Silver-man. 2008. Hormonal regulation of the humoral innate im-mune response in Drosophila melanogaster. Journal of Ex-perimental Biology 211:2712-2724.
Flatt, T., M.-P. Tu, and M. Tatar. 2005. Hormonal pleiotropy and the juvenile hormone regulation of Drosophila develop-ment and life history. Bioessays 27:999-1010.
Fraichard, S., A.-L. Bougé, T. Kendall, I. Chauvel, H. Bouhin, and T. A. Bunch. 2010. Tenectin is a novel αPS2βPS integrin ligand required for wing morphogenesis and male genital looping in Drosophila. Developmental Biology 340:504-517.
Friedman, R. and A. L. Hughes. 2002. Molecular evolution of the NF-κB signaling system. Immunogenetics 53:964-974.
Fu, Q., P.-C. Liu, J.-X. Wang, Q.-S. Song, and X.-F. Zhao. 2009. Proteomic identification of differentially expressed and phosphorylated proteins in epidermis involved in larval-pupal metamorphosis of Helicoverpa armigera. BMC Genomics 10:600.
Ghabrial, A., S. Luschnig, M. M. Metzstein, and M. A. Kras-now. 2003. Branching morphogenesis of the Drosophila tra-cheal system. Annual Review of Cell and Developmental Biol-ogy 19:623-647.
Gibson, M. C. and G. Schubiger. 1999. Hedgehog is required for activation of engrailed during regeneration of fragmented Drosophila imaginal discs. Development 126:1591-1599.
Gilad, Y., J. K. Pritchard, and K. Thornton. 2009. Characteriz-ing natural variation using next-generation sequencing tech-nologies. Trends in Genetics 25:463-471.
Gilbert, L. I., R. Rybczynski, and J. T. Warren. 2002. Control and biochemical nature of the ecdysteroidogenic pathway. An-nual Review of Entomology 47:883-916.
Gimenez-Roqueplo, A.-P., J. Favier, P. Rustin, J.-J. Mourad, P.-F. Plouin, P. Corvol, A. Rötig, and X. Jeunemaitre. 2001. The R22X mutation of the SDHD gene in hereditary para-ganglioma abolishes the enzymatic activity of complex II in the mitochondrial respiratory chain and activates the hypoxia pathway. The American Journal of Human Genetics 69:1186-1197.
Gonzalez, C., L. Almaraz, A. Obeso, and R. Rigual. 1994. Ca-rotid body chemoreceptors: from natural stimuli to sensory discharges. Physiological Reviews 74:829-898.
Goodisman, M. A., J. Isoe, D. E. Wheeler, and M. A. Wells. 2005. Evolution of insect metamorphosis: A microarray-based study of larval and adult gene expression in the ant Camponotus festinatus. Evolution 59:858-870.
Goodman, W. and N. Granger. 2009. 8. The juvenile hor-mones. Pages 305-395 in L. I. Gilbert, editor. Insect Devel-opment: Morphogenesis, Molting and Metamorphosis. Aca-demic Press, London.
Grabherr, M. G., B. J. Haas, M. Yassour, J. Z. Levin, D. A. Thompson, I. Amit, X. Adiconis, L. Fan, R. Raychowdhury, and Q. Zeng. 2011. Full-length transcriptome assembly from RNA-Seq data without a reference genome. Nature Biotech-nology 29:644-652.
Gu, S.-H., J.-L. Lin, P.-L. Lin, and C.-H. Chen. 2009. Insulin stimulates ecdysteroidogenesis by prothoracic glands in the
7. REFERENCES
33
silkworm Bombyx mori. Insect Biochemistry and Molecular Biology 39:171-179.
Gu, X., Z. Zhang, and W. Huang. 2005. Rapid evolution of ex-pression and regulatory divergences after yeast gene duplica-tion. Proceedings of the National Academy of Sciences of the United States of America 102:707-712.
Gunn, A., A. Gatehouse, and K. Woodrow. 1989. Trade-off be-tween flight and reproduction in the African armyworm moth, Spodoptera exempta. Physiological Entomology 14:419-427.
Guo, S., Y. Zheng, J.-G. Joung, S. Liu, Z. Zhang, O. R. Crasta, B. W. Sobral, Y. Xu, S. Huang, and Z. Fei. 2010. Transcrip-tome sequencing and comparative analysis of cucumber flow-ers with different sex types. BMC Genomics 11:384.
Haag, C. R., M. Saastamoinen, J. H. Marden, and I. Hanski. 2005. A candidate locus for variation in dispersal rate in a butterfly metapopulation. Proceedings of the Royal Society B: Biological Sciences 272:2449-2456.
Haas, K. F., E. Woodruff, and K. Broadie. 2007. Proteasome function is required to maintain muscle cellular architecture. Biology of the Cell 99:615-626.
Hahn, D. A., L. N. James, K. R. Milne, and J. D. Hatle. 2008. Life‐history plasticity after attaining a dietary threshold for reproduction is associated with protein storage in flesh flies. Functional Ecology 22:1081-1090.
Haikola, S. 2003. Effects of inbreeding in the Glanville fritil-lary butterfly (Melitaea cinxia). Annales Zoologici Fennici 40:483-493.
Haikola, S., W. Fortelius, R. B. O’Hara, M. Kuussaari, N. Wahlberg, I. J. Saccheri, M. C. Singer, and I. Hanski. 2001. Inbreeding depression and the maintenance of genetic load in Melitaea cinxia metapopulations. Conservation Genetics 2:325-335.
Hanski, I. 1999. Metapopulation ecology. Oxford University Press, New York.
Hanski, I., M. Kuussaari, and M. Nieminen. 1994. Metapopu-lation structure and migration in the butterfly Melitaea cinx-ia. Ecology 75:747-762.
Hanski, I. and T. Mononen. 2011. Eco-evolutionary dynamics of dispersal in spatially heterogeneous environments. Ecology Letters 14:1025-1034.
Hanski, I., T. Pakkala, M. Kuussaari, and G. Lei. 1995. Meta-population persistence of an endangered butterfly in a frag-mented landscape. Oikos:21-28.
Hanski, I., M. Saastamoinen, and O. Ovaskainen. 2006. Dis-persal-related life-history trade-offs in a butterfly metapopu-lation. Journal of Animal Ecology 75:91-100.
Hanski, I. A. 2011. Eco-evolutionary spatial dynamics in the Glanville fritillary butterfly. Proceedings of the National Acad-emy of Sciences of the United States of America 108:14397-14404.
Harris, A. L. 2002. Hypoxia - a key regulatory factor in tumour growth. Nature Reviews. Cancer 2:38-47.
Harrison, J. and J. Lighton. 1998. Oxygen-sensitive flight me-tabolism in the dragonfly Erythemis simplicicollis. Journal of Experimental Biology 201:1739-1744.
Held, M., K. Gase, and I. Baldwin. 2004. Microarrays in eco-logical research: A case study of a cDNA microarray for plant-
herbivore interactions. BMC Ecology 4:13.
Heller, M. J. 2002. DNA microarray technology: devices, sys-tems, and applications. Annual Review of Biomedical Engi-neering 4:129-153.
Helm, A., I. Hanski, and M. Pärtel. 2006. Slow response of plant species richness to habitat loss and fragmentation. Ecol-ogy Letters 9:72-77.
Hiruma, K. and L. M. Riddiford. 1988. Granular phenoloxi-dase involved in cuticular melanization in the tobacco horn-worm: Regulation of its synthesis in the epidermis by juvenile hormone. Developmental Biology 130:87-97.
Hiruma, K. and L. M. Riddiford. 2010. Developmental ex-pression of mRNAs for epidermal and fat body proteins and hormonally regulated transcription factors in the tobacco hornworm, Manduca sexta. Journal of Insect Physiology 56:1390-1395.
Hoekstra, H. E., R. J. Hirschmann, R. A. Bundey, P. A. Insel, and J. P. Crossland. 2006. A single amino acid mutation contributes to adaptive beach mouse color pattern. Science 313:101-104.
Hoekstra, H. E. and M. W. Nachman. 2003. Different genes underlie adaptive melanism in different populations of rock pocket mice. Molecular Ecology 12:1185-1194.
Houston, A. I., J. M. McNamara, and J. M. C. Hutchinson. 1993. General results concerning the trade-off between gain-ing energy and avoiding predation. Philosophical Transac-tions of the Royal Society of London. Series B: Biological Sci-ences 341:375-397.
Hudson, M. E. 2008. Sequencing breakthroughs for genomic ecology and evolutionary biology. Molecular Ecology Resourc-es 8:3-17.
Hughes, T. R., M. Mao, A. R. Jones, J. Burchard, M. J. Marton, K. W. Shannon, S. M. Lefkowitz, M. Ziman, J. M. Schelter, and M. R. Meyer. 2001. Expression profiling using microarrays fabricated by an ink-jet oligonucleotide synthesizer. Nature Biotechnology 19:342-347.
Hunt, J. H., B. J. Kensinger, J. A. Kossuth, M. T. Henshaw, K. Norberg, F. Wolschin, and G. V. Amdam. 2007. A diapause pathway underlies the gyne phenotype in Polistes wasps, re-vealing an evolutionary route to caste-containing insect socie-ties. Proceedings of the National Academy of Sciences of the United States of America 104:14020-14025.
Irving, J. A., R. N. Pike, A. M. Lesk, and J. C. Whisstock. 2000. Phylogeny of the serpin superfamily: implications of patterns of amino acid conservation for structure and function. Ge-nome Research 10:1845-1864.
Irving, P., L. Troxler, T. S. Heuer, M. Belvin, C. Kopczynski, J.-M. Reichhart, J. A. Hoffmann, and C. Hetru. 2001. A ge-nome-wide analysis of immune responses in Drosophila. Pro-ceedings of the National Academy of Sciences of the United States of America 98:15119-15124.
Isaksson, C., B. C. Sheldon, and T. Uller. 2011. The challenges of integrating oxidative stress into life-history biology. Biosci-ence 61:194-202.
Iwanaga, S. and S.-i. Kawabata. 1998. Evolution and phylog-eny of defense molecules associated with innate immunity in horseshoe crab. Frontiers in Bioscience 3:D973-D984.
Iwanaga, S. and B.-L. Lee. 2005. Recent advances in the in-
7. REFERENCES
34
nate immunity of invertebrate animals. Journal of Biochemis-try and Molecular Biology 38:128-150.
Janeway, C. A. and R. Medzhitov. 2002. Innate immune rec-ognition. Annual Review of Immunology 20:197-216.
Jindra, M., S. R. Palli, and L. M. Riddiford. 2013. The juvenile hormone signaling pathway in insect development. Annual Review of Entomology 58:181-204.
Juhász, G., L. G. Puskás, O. Komonyi, B. Érdi, P. Maróy, T. P. Neufeld, and M. Sass. 2007. Gene expression profiling identi-fies FKBP39 as an inhibitor of autophagy in larval Drosophila fat body. Cell Death & Differentiation 14:1181-1190.
Kallioniemi, E. and I. Hanski. 2011. Interactive effects of Pgi genotype and temperature on larval growth and survival in the Glanville fritillary butterfly. Functional Ecology 25:1032-1039.
Kalujnaia, S., I. McWilliam, V. Zaguinaiko, A. Feilen, J. Ni-cholson, N. Hazon, C. Cutler, R. Balment, A. Cossins, and M. Hughes. 2007. Salinity adaptation and gene profiling analy-sis in the European eel (Anguilla anguilla) using microar-ray technology. General and Comparative Endocrinology 152:274-280.
Kammer, A. E. and B. Heinrich. 1978. Insect flight metabo-lism. Advances in Insect Physiology 13:133-228.
Karlsson, B. 1994. Feeding habits and change of body com-position with age in three nymphalid butterfly species. Oikos:224-230.
Karlsson, B. 1998. Nuptial gifts, resource budgets, and repro-ductive output in a polyandrous butterfly. Ecology 79:2931-2940.
Kato-Maeda, M., Q. Gao, and P. M. Small. 2001. Microarray analysis of pathogens and their interaction with hosts. Cellu-lar Microbiology 3:713-719.
Keister, M. and J. Buck. 1964. Respiration: some exogenous and endogenous effects on rate of respiration. The Physiology of Insecta 3:617-658.
Kim, D., G. Pertea, C. Trapnell, H. Pimentel, R. Kelley, and S. Salzberg. 2013. TopHat2: accurate alignment of transcrip-tomes in the presence of insertions, deletions and gene fu-sions. Genome Biology 14:R36.
Kiriishi, S., H. Nagasawa, H. Kataoka, A. Suzuki, and S. Sakurai. 1992. Comparison of the in vivo and in vitro effects of bombyxin and prothoracicotropic hormone on prothoracic glands of the silkworm, Bombyx mori. Zoological Science 9:149-155.
Klemme, I. and I. Hanski. 2009. Heritability of and strong single gene (Pgi) effects on life-history traits in the Glanville fritillary butterfly. Journal of Evolutionary Biology 22:1944-1953.
Koelle, M. R., W. S. Talbot, W. A. Segraves, M. T. Bender, P. Cherbas, and D. S. Hogness. 1991. The Drosophila EcR gene encodes an ecdysone receptor, a new member of the steroid receptor superfamily. Cell 67:59-77.
Kohn, M. H., W. J. Murphy, E. A. Ostrander, and R. K. Wayne. 2006. Genomics and conservation genetics. Trends in Ecology & Evolution 21:629-637.
Kononen, J., L. Bubendorf, A. Kallioniemi, M. Bärlund, P. Schraml, S. Leighton, J. Torhorst, M. J. Mihatsch, G. Sauter, and O.-P. Kallioniemi. 1998. Tissue microarrays for high-
throughput molecular profiling of tumor specimens. Nature Medicine 4:844-847.
Kuussaari, M. 1998. Biology of the Glanville fritillary butterfly (Melitaea cinxia). PhD thesis. Helsingin Yliopisto (Finland), Finland.
Kuussaari, M., M. Nieminen, and I. Hanski. 1996. An experi-mental study of migration in the Glanville fritillary butterfly Melitaea cinxia. Journal of Animal Ecology 65:791-801.
Kuussaari, M., S. van Nouhuys, J. J. Hellmann, and M. C. Singer. 2004. Larval biology of checkerspots. Pages 138-160 in P. R. Ehrlich and I. Hanski, editors. On the wings of check-erspot: a model system for population biology. Oxford Univer-sity Press, New York.
Lainé, L. and D. Wright. 2003. The life cycle of Reticulitermes spp.(Isoptera: Rhinotermitidae): what do we know? Bulletin of Entomological Research 93:267-278.
Lande, R. 1988. Genetics and demography in biological con-servation. Science 241:1455-1460.
Lande, R. 1994. Risk of population extinction from fixation of new deleterious mutations. Evolution 48:1460-1469.
Langellotto, G. A., R. F. Denno, and J. R. Ott. 2000. A trade-off between flight capability and reproduction in males of a wing-dimorphic insect. Ecology 81:865-875.
Langmead, B. and S. L. Salzberg. 2012. Fast gapped-read alignment with Bowtie 2. Nature Methods 9:357-359.
Langmead, B., C. Trapnell, M. Pop, and S. Salzberg. 2009. Ultrafast and memory-efficient alignment of short DNA se-quences to the human genome. Genome Biology 10:R25.
Law, J. H. and M. A. Wells. 1989. Insects as biochemical mod-els. The Journal of Biological Chemistry 264:16335-16338.
Law, R. 1979. Optimal life histories under age-specific preda-tion. The American Naturalist 114:399-417.
Lee, C. G., C. A. Da Silva, C. S. Dela Cruz, F. Ahangari, B. Ma, M.-J. Kang, C.-H. He, S. Takyar, and J. A. Elias. 2011. Role of chitin and chitinase/chitinase-like proteins in inflammation, tissue remodeling, and injury. Annual Review of Physiology 73:479-501.
Leek, B. T., S. R. D. Mudaliar, R. Henry, O. Mathieu-Costello, and R. S. Richardson. 2001. Effect of acute exercise on citrate synthase activity in untrained and trained human skeletal muscle. American Journal of Physiology - Regulatory, Inte-grative and Comparative Physiology 280:R441-R447.
Lemaitre, B., E. Nicolas, L. Michaut, J.-M. Reichhart, and J. A. Hoffmann. 1996. The dorsoventral regulatory gene cassette spätzle/Toll/cactus controls the potent antifungal response in Drosophila adults. Cell 86:973-983.
Levenbook, L. and A. C. Bauer. 1984. The fate of the larval storage protein calliphorin during adult development of Cal-liphora vicina. Insect Biochemistry 14:77-86.
Levene, M. J., J. Korlach, S. W. Turner, M. Foquet, H. G. Craighead, and W. W. Webb. 2003. Zero-mode waveguides for single-molecule analysis at high concentrations. Science 299:682-686.
Lourenço, A. P., J. R. Martins, M. M. Bitondi, and Z. L. Simões. 2009. Trade‐off between immune stimulation and expression of storage protein genes. Archives of Insect Bio-chemistry and Physiology 71:70-87.
7. REFERENCES
35
Ma, C. and M. R. Kanost. 2000. A β1, 3-glucan recognition protein from an insect, Manduca sexta, agglutinates microor-ganisms and activates the phenoloxidase cascade. The Journal of Biological Chemistry 275:7505-7514.
Mackay, I. M., K. E. Arden, and A. Nitsche. 2002. Real-time PCR in virology. Nucleic Acids Research 30:1292-1305.
Manohar, D., D. Gullipalli, and A. Dutta-Gupta. 2010. Ecdys-teroid-mediated expression of hexamerin (arylphorin) in the rice moth, Corcyra cephalonica. Journal of Insect Physiology 56:1224-1231.
Mao, L., G. Henderson, Y. Liu, and R. A. Laine. 2005. For-mosan subterranean termite (Isoptera: Rhinotermitidae) soldiers regulate juvenile hormone levels and caste differ-entiation in workers. Annals of the Entomological Society of America 98:340-345.
Marden, J. H., H. W. Fescemyer, M. Saastamoinen, S. P. MacFarland, J. C. Vera, M. J. Frilander, and I. Hanski. 2008. Weight and nutrition affect pre-mRNA splicing of a muscle gene associated with performance, energetics and life history. Journal of Experimental Biology 211:3653-3660.
Marden, J. H., H. W. Fescemyer, R. J. Schilder, W. R. Doer-fler, J. C. Vera, and C. W. Wheat. 2013. Genetic variation in HIF signaling underlies quantitative variation in physiologi-cal and life-history traits within lowland butterfly populations. Evolution 67:1105-1115.
Margulies, M., M. Egholm, W. E. Altman, S. Attiya, J. S. Bader, L. A. Bemben, J. Berka, M. S. Braverman, Y.-J. Chen, Z. Chen, S. B. Dewell, L. Du, J. M. Fierro, X. V. Gomes, B. C. Godwin, W. He, S. Helgesen, C. H. Ho, G. P. Irzyk, S. C. Jando, M. L. I. Alenquer, T. P. Jarvie, K. B. Jirage, J.-B. Kim, J. R. Knight, J. R. Lanza, J. H. Leamon, S. M. Lefkowitz, M. Lei, J. Li, K. L. Lohman, H. Lu, V. B. Makhijani, K. E. McDade, M. P. McKenna, E. W. Myers, E. Nickerson, J. R. Nobile, R. Plant, B. P. Puc, M. T. Ronan, G. T. Roth, G. J. Sarkis, J. F. Simons, J. W. Simpson, M. Srinivasan, K. R. Tartaro, A. Tomasz, K. A. Vogt, G. A. Volkmer, S. H. Wang, Y. Wang, M. P. Weiner, P. Yu, R. F. Begley, and J. M. Rothberg. 2005. Genome sequenc-ing in microfabricated high-density picolitre reactors. Nature 437:376-380.
Marioni, J. C., C. E. Mason, S. M. Mane, M. Stephens, and Y. Gilad. 2008. RNA-seq: an assessment of technical reproduc-ibility and comparison with gene expression arrays. Genome Research 18:1509-1517.
Marmaras, V. J., N. D. Charalambidis, and C. G. Zervas. 1996. Immune response in insects: the role of phenoloxidase in de-fense reactions in relation to melanization and sclerotization. Archives of Insect Biochemistry and Physiology 31:119-133.
Martinez-Outschoorn, U. E., C. Trimmer, Z. Lin, D. Whitaker-Menezes, B. Chiavarina, J. Zhou, C. Wang, S. Pavlides, M. P. Martinez-Cantarin, and F. Capozza. 2010. Autophagy in can-cer associated fibroblasts promotes tumor cell survival: Role of hypoxia, HIF1 induction and NFκB activation in the tumor stromal microenvironment. Cell Cycle 9:3515.
Martins, J. R., L. Anhezini, R. P. Dallacqua, Z. L. P. Simões, and M. M. G. Bitondi. 2011. A honey bee hexamerin, HEX 70a, is likely to play an intranuclear role in developing and mature ovarioles and testioles. PLoS ONE 6:e29006.
Martins, J. R., F. Morais Franco Nunes, Z. Luz Paulino Simões, and M. Maria Gentile Bitondi. 2008. A honeybee storage protein gene, hex 70a, expressed in developing gonads and nutritionally regulated in adult fat body. Journal of Insect
Physiology 54:867-877.
Martins, J. R., F. M. Nunes, A. S. Cristino, Z. L. Simões, and M. M. Bitondi. 2010. The four hexamerin genes in the honey bee: structure, molecular evolution and function deduced from expression patterns in queens, workers and drones. BMC Molecular Biology 11:23.
Mattila, A. L. K., A. Duplouy, M. Kirjokangas, R. Lehtonen, P. Rastas, and I. Hanski. 2012. High genetic load in an old isolat-ed butterfly population. Proceedings of the National Academy of Sciences of the United States of America 109:14744-14753.
Mirth, C., J. W. Truman, and L. M. Riddiford. 2005. The role of the prothoracic gland in determining critical weight for metamorphosis in Drosophila melanogaster. Current Biology 15:1796-1807.
Mitchell-Olds, T., J. H. Willis, and D. B. Goldstein. 2007. Which evolutionary processes influence natural genetic vari-ation for phenotypic traits? Nature Reviews. Genetics 8:845-856.
Mole, S. and A. J. Zera. 1993. Differential allocation of re-sources underlies the dispersal-reproduction trade-off in the wing-dimorphic cricket, Gryllus rubens. Oecologia 93:121-127.
Mole, S. and A. J. Zera. 1994. Differential resource consump-tion obviates a potential flight–fecundity trade-off in the sand cricket (Gryllus firmus). Functional Ecology 8:573-580.
Morozova, O. and M. A. Marra. 2008. Applications of next-generation sequencing technologies in functional genomics. Genomics 92:255-264.
Mousseron-Grall, S., J. Kejzlarová-Lepesant, T. Burmester, C. Chihara, M. Barray, E. Delain, R. Pictet, and J.-A. Lepesant. 1997. Sequence, structure and evolution of the ecdysone-in-ducible Lsp-2 gene of Drosophila melanogaster. European Journal of Biochemistry 245:191-198.
Nieminen, M., M. Siljander, and I. Hanski. 2004. Structure and dynamics of Melitaea cinxia metapopulations. Pages 63-91 in P. R. Ehrlich and I. Hanski, editors. On the Wings of Checkerspots: A Model System for Population Biology. Oxford University Press, New York.
Niitepõld, K. and I. Hanski. 2013. A long life in the fast lane: positive association between peak metabolic rate and lifespan in a butterfly. The Journal of Experimental Biology 216:1388-1397.
Niitepõld, K., A. Mattila, P. Harrison, and I. Hanski. 2011. Flight metabolic rate has contrasting effects on dispersal in the two sexes of the Glanville fritillary butterfly. Oecologia 165:847-854.
Niitepõld, K., A. D. Smith, J. L. Osborne, D. R. Reynolds, N. L. Carreck, A. P. Martin, J. H. Marden, O. Ovaskainen, and I. Hanski. 2009. Flight metabolic rate and Pgi genotype in-fluence butterfly dispersal rate in the field. Ecology 90:2223-2232.
Nijhout, H. F. 1998. Insect hormones. Princeton University Press, New Jersey.
Nijhout, H. F. and C. M. Williams. 1974. Control of moult-ing and metamorphosis in the tobacco hornworm, Manduca sexta (L.): cessation of juvenile hormone secretion as a trig-ger for pupation. Journal of Experimental Biology 61:493-501.
Nizet, V. and R. S. Johnson. 2009. Interdependence of hypox-
7. REFERENCES
36
ic and innate immune responses. Nature Reviews. Immunol-ogy 9:609-617.
Norberg, U. L. F. and O. Leimar. 2002. Spatial and temporal variation in flight morphology in the butterfly Melitaea cinxia (Lepidoptera: Nymphalidae). Biological Journal of the Lin-nean Society 77:445-453.
Nowrousian, M., J. E. Stajich, M. Chu, I. Engh, E. Espagne, K. Halliday, J. Kamerewerd, F. Kempken, B. Knab, and H.-C. Kuo. 2010. De novo assembly of a 40 Mb eukaryotic genome from short sequence reads: Sordaria macrospora, a model or-ganism for fungal morphogenesis. PLoS Genetics 6:e1000891.
Ochiai, M. and M. Ashida. 1988. Purification of a beta-1, 3-glu-can recognition protein in the prophenoloxidase activating system from hemolymph of the silkworm, Bombyx mori. The Journal of Biological Chemistry 263:12056-12062.
Ojanen, S. P., M. Nieminen, E. Meyke, J. Pöyry, and I. Han-ski. 2013. Long-term metapopulation study of the Glanville fritillary butterfly (Melitaea cinxia): survey methods, data management, and long-term population trends. Ecology and Evolution 3:3713-3737.
Okoniewski, M. and C. Miller. 2006. Hybridization interac-tions between probesets in short oligo microarrays lead to spurious correlations. BMC Bioinformatics 7:276.
Okot-Kotber, B. M., G. D. Prestwich, A. Strambi, and C. Strambi. 1993. Changes in morphogenetic hormone titers in isolated workers of the termite Reticulitermes flavipes (Kol-lar). General and Comparative Endocrinology 90:290-295.
Oleksiak, M. F., G. A. Churchill, and D. L. Crawford. 2002. Variation in gene expression within and among natural popu-lations. Nature Genetics 32:261-266.
Orsini, L., C. W. Wheat, C. R. Haag, J. Kvist, M. J. Frilander, and I. Hanski. 2009. Fitness differences associated with Pgi SNP genotypes in the Glanville fritillary butterfly (Melitaea cinxia). Journal of Evolutionary Biology 22:367-375.
Pan, M. and W. H. Telfer. 1996. Methionine‐rich hexamerin and arylphorin as precursor reservoirs for reproduction and metamorphosis in female luna moths. Archives of Insect Bio-chemistry and Physiology 33:149-162.
Pan, M. and W. H. Telfer. 2001. Storage hexamer utilization in two Lepidopterans: differences correlated with the timing of egg formation. Journal of Insect Science 1:2.
Parchman, T. L., K. S. Geist, J. A. Grahnen, C. W. Benkman, and C. A. Buerkle. 2010. Transcriptome sequencing in an eco-logically important tree species: assembly, annotation, and marker discovery. BMC Genomics 11:180.
Park, Y. I. and A. K. Raina. 2004. Juvenile hormone III titers and regulation of soldier caste in coptotermes formosanus (Isoptera: Rhinotermitidae). Journal of Insect Physiology 50:561-566.
Parthasarathy, R., Z. Sheng, Z. Sun, and S. R. Palli. 2010. Ecdysteroid regulation of ovarian growth and oocyte matura-tion in the red flour beetle, Tribolium castaneum. Insect Bio-chemistry and Molecular Biology 40:429-439.
Penick, C. A., S. S. Prager, and J. Liebig. 2012. Juvenile hor-mone induces queen development in late-stage larvae of the ant Harpegnathos saltator. Journal of Insect Physiology 58:1643-1649.
Poinar, H. N., C. Schwarz, J. Qi, B. Shapiro, R. D. MacPhee,
B. Buigues, A. Tikhonov, D. H. Huson, L. P. Tomsho, and A. Auch. 2006. Metagenomics to paleogenomics: large-scale se-quencing of mammoth DNA. Science 311:392-394.
Postlethwait, J. and A. Handler. 1979. The roles of juvenile hormone and 20-hydroxy-ecdysone during vitellogenesis in isolated abdomens of Drosophila melanogaster. Journal of Insect Physiology 25:455-460.
Protas, M. E., C. Hersey, D. Kochanek, Y. Zhou, H. Wilkens, W. R. Jeffery, L. I. Zon, R. Borowsky, and C. J. Tabin. 2006. Genetic analysis of cavefish reveals molecular convergence in the evolution of albinism. Nature Genetics 38:107-111.
Radivojac, P., W. T. Clark, T. R. Oron, A. M. Schnoes, T. Witt-kop, A. Sokolov, K. Graim, C. Funk, K. Verspoor, and A. Ben-Hur. 2013. A large-scale evaluation of computational protein function prediction. Nature Methods 10:221-227.
Raikhel, A. S. and T. Dhadialla. 1992. Accumulation of yolk proteins in insect oocytes. Annual Review of Entomology 37:217-251.
Rauhamäki, V., J. Wolfram, E. Jokitalo, I. Hanski, and E. P. Dahlhoff. 2014. Differences in the aerobic capacity of flight muscles between butterfly populations and species with dis-similar flight abilities. PLoS ONE 9:e78069.
Richards, G. 1997. The ecdysone regulatory cascades in Dros-ophila. Advances in Developmental Biology (1992) 5:81-135.
Riddiford, L. M. 1993. Hormones and Drosophila develop-ment. The development of Drosophila melanogaster 2:899-939.
Riddiford, L. M. 1994. Cellular and molecular actions of juve-nile hormone I. General considerations and premetamorphic actions. Advances in Insect Physiology 24:213-274.
Riddiford, L. M. and M. Ashburner. 1991. Effects of juvenile hormone mimics on larval development and metamorphosis of Drosophila melanogaster. General and Comparative Endo-crinology 82:172-183.
Riddihough, G. and H. R. Pelham. 1987. An ecdysone response element in the Drosophila hsp27 promoter. The EMBO Jour-nal 6:3729-3734.
Rius, J., M. Guma, C. Schachtrup, K. Akassoglou, A. S. Zinkernagel, V. Nizet, R. S. Johnson, G. G. Haddad, and M. Karin. 2008. NF-κB links innate immunity to the hypoxic re-sponse through transcriptional regulation of HIF-1α. Nature 453:807-811.
Roberts, A., H. Pimentel, C. Trapnell, and L. Pachter. 2011. Identification of novel transcripts in annotated genomes using RNA-Seq. Bioinformatics 27:2325-2329.
Roff, D. A. 1986. The evolution of wing dimorphism in insects. Evolution 40:1009-1020.
Ronce, O. 2007. How does it feel to be like a rolling stone? Ten questions about dispersal evolution. Annual Review of Ecol-ogy, Evolution, and Systematics 38:231-253.
Saastamoinen, M. 2007a. Life-history, genotypic, and envi-ronmental correlates of clutch size in the Glanville fritillary butterfly. Ecological Entomology 32:235-242.
Saastamoinen, M. 2007b. Mobility and lifetime fecundity in new versus old populations of the Glanville fritillary butterfly. Oecologia 153:569-578.
Saastamoinen, M. 2008. Heritability of dispersal rate and
7. REFERENCES
37
other life history traits in the Glanville fritillary butterfly. He-redity 100:39-46.
Saastamoinen, M. and I. Hanski. 2008. Genotypic and en-vironmental effects on flight activity and oviposition in the Glanville fritillary butterfly. The American Naturalist 171:701-712.
Saastamoinen, M., S. Ikonen, and I. Hanski. 2009. Significant effects of Pgi genotype and body reserves on lifespan in the Glanville fritillary butterfly. Proceedings of the Royal Society B: Biological Sciences 276:1313-1322.
Saccheri, I., M. Kuussaari, M. Kankare, P. Vikman, W. Forte-lius, and I. Hanski. 1998. Inbreeding and extinction in a but-terfly metapopulation. Nature 392:491-494.
Salminen, A., J. Huuskonen, J. Ojala, A. Kauppinen, K. Kaarniranta, and T. Suuronen. 2008. Activation of innate im-munity system during aging: NF-kB signaling is the molecular culprit of inflamm-aging. Ageing Research Reviews 7:83-105.
Sanger, F., S. Nicklen, and A. R. Coulson. 1977. DNA sequenc-ing with chain-terminating inhibitors. Proceedings of the Na-tional Academy of Sciences of the United States of America 74:5463-5467.
Scharf, M. E., D. Wu-Scharf, B. R. Pittendrigh, and G. W. Ben-nett. 2003. Caste- and development-associated gene expres-sion in a lower termite. Genome Biology 4:R62.
Scheffler, I. E. 1998. Molecular genetics of succinate: quinoi oxidoreductase in eukaryotes. Progress in Nucleic Acid Re-search and Molecular Biology 60:267-315.
Scheller, K., B. Fischer, and H. Schenkel. 1990. Molecular properties, functions and developmentally regulated biosyn-thesis of arylphorin in Calliphora vicina. Pages 155-162 in H. H. Hagedorn, J. G. Hildebrand, M. G. Kidwell, and J. H. Law, editors. Molecular Insect Science. Springer, New York.
Schena, M., D. Shalon, R. W. Davis, and P. O. Brown. 1995. Quantitative monitoring of gene expression patterns with a complementary DNA microarray. Science 270:467-470.
Schmidt, D. D., C. Voelckel, M. Hartl, S. Schmidt, and I. T. Baldwin. 2005. Specificity in ecological interactions. Attack from the same Lepidopteran herbivore results in species-spe-cific transcriptional responses in two Solanaceous host plants. Plant Physiology 138:1763-1773.
Schofield, C. J. and P. J. Ratcliffe. 2005. Signalling hypoxia by HIF hydroxylases. Biochemical and Biophysical Research Communications 338:617-626.
Schreck, R., K. Albermann, and P. A. Baeuerle. 1992. Nuclear factor kappa B: an oxidative stress-responsive transcription factor of eukaryotic cells (a review). Free Radical Research 17:221-237.
Schubiger, M. and J. W. Truman. 2000. The RXR ortholog USP suppresses early metamorphic processes in Drosophila in the absence of ecdysteroids. Development 127:1151-1159.
Schwartz, T. S., H. Tae, Y. Yang, K. Mockaitis, J. L. Van Hemert, S. R. Proulx, J.-H. Choi, and A. M. Bronikowski. 2010. A garter snake transcriptome: pyrosequencing, de novo assembly, and sex-specific differences. BMC Genomics 11:694.
Schwarz, D., H. M. Robertson, J. L. Feder, K. Varala, M. E. Hudson, G. J. Ragland, D. A. Hahn, and S. H. Berlocher. 2009. Sympatric ecological speciation meets pyrosequencing: sampling the transcriptome of the apple maggot Rhagoletis
pomonella. BMC Genomics 10:633.
Selak, M. A., S. M. Armour, E. D. MacKenzie, H. Boulahbel, D. G. Watson, K. D. Mansfield, Y. Pan, M. C. Simon, C. B. Thomp-son, and E. Gottlieb. 2005. Succinate links TCA cycle dysfunc-tion to oncogenesis by inhibiting HIF-α prolyl hydroxylase. Cancer Cell 7:77-85.
Semenza, G. L. 1999. Regulation of mammalian O2
homeosta-sis by hypoxia-inducible factor 1. Annual Review of Cell and Developmental Biology 15:551-578.
Semenza, G. L. 2000. HIF-1: mediator of physiological and pathophysiological responses to hypoxia. Journal of Applied Physiology 88:1474-1480.
Shagin, D. A., D. V. Rebrikov, V. B. Kozhemyako, I. M. Alt-shuler, A. S. Shcheglov, P. A. Zhulidov, E. A. Bogdanova, D. B. Staroverov, V. A. Rasskazov, and S. Lukyanov. 2002. A novel method for SNP detection using a new duplex-specific nucle-ase from crab hepatopancreas. Genome Research 12:1935-1942.
Shi, L., W. Tong, H. Fang, U. Scherf, J. Han, R. K. Puri, F. W. Frueh, F. M. Goodsaid, L. Guo, and Z. Su. 2005. Cross-plat-form comparability of microarray technology: intra-platform consistency and appropriate data analysis procedures are es-sential. BMC Bioinformatics 6:S12.
Singh-Gasson, S., R. D. Green, Y. Yue, C. Nelson, F. Blattner, M. R. Sussman, and F. Cerrina. 1999. Maskless fabrication of light-directed oligonucleotide microarrays using a digital mi-cromirror array. Nature Biotechnology 17:974-978.
Sirén, J., P. Marttinen, and J. Corander. 2011. Reconstruct-ing population histories from single nucleotide polymorphism data. Molecular Biology and Evolution 28:673-683.
Sloan, D. B., S. R. Keller, A. E. Berardi, B. J. Sanderson, J. F. Karpovich, and D. R. Taylor. 2012. De novo transcriptome assembly and polymorphism detection in the flowering plant Silene vulgaris (Caryophyllaceae). Molecular Ecology Re-sources 12:333-343.
Smith, C. M. and J. R. Williamson. 1971. Inhibition of citrate synthase by succinyl-CoA and other metabolites. FEBS Letters 18:35-38.
Smith, W. A., A. Lamattina, and M. Collins. 2014. Insulin sign-aling pathways in Lepidopteran ecdysone secretion. Frontiers in physiology 5:1-8.
Soller, M., M. Bownes, and E. Kubli. 1999. Control of Oocyte Maturation in Sexually Mature Drosophila Females. Develop-mental Biology 208:337-351.
Sorge, D., R. Nauen, S. Range, and K. H. Hoffmann. 2000. Regulation of vitellogenesis in the fall armyworm, Spodoptera frugiperda (Lepidoptera: Noctuidae). Journal of Insect Physi-ology 46:969-976.
Southwood, T. 1961. A hormonal theory of the mechanism of wing polymorphism in Heteroptera. Proceedings of the Royal Entomological Society of London. Series A, General Entomol-ogy 36:63-66.
Stapley, J., J. Reger, P. G. D. Feulner, C. Smadja, J. Galindo, R. Ekblom, C. Bennison, A. D. Ball, A. P. Beckerman, and J. Slate. 2010. Adaptation genomics: the next generation. Trends in Ecology & Evolution 25:705-712.
Stec, W. J. and M. P. Zeidler. 2011. Drosophila SOCS Proteins. Journal of Signal Transduction 2011:894510.
7. REFERENCES
38
Stinchcombe, J. and H. Hoekstra. 2008. Combining popula-tion genomics and quantitative genetics: finding the genes un-derlying ecologically important traits. Heredity 100:158-170.
Stjernholm, F., B. Karlsson, and C. L. Boggs. 2005. Age-relat-ed changes in thoracic mass: possible reallocation of resources to reproduction in butterflies. Biological Journal of the Lin-nean Society 86:363-380.
Strand, M. R. 2008. The insect cellular immune response. In-sect Science 15:1-14.
Suarez, R. K. 2000. Energy metabolism during insect flight: Biochemical design and physiological performance. Physi-ological and Biochemical Zoology 73:765-771.
Suarez, R. K., J. R. Lighton, B. Joos, S. P. Roberts, and J. F. Harrison. 1996. Energy metabolism, enzymatic flux capaci-ties, and metabolic flux rates in flying honeybees. Proceedings of the National Academy of Sciences of the United States of America 93:12616-12620.
Sullivan, J. P., O. Jassim, S. E. Fahrbach, and G. E. Robinson. 2000. Juvenile hormone paces behavioral development in the adult worker honey bee. Hormones and Behavior 37:1-14.
Tang, F., C. Barbacioru, Y. Wang, E. Nordman, C. Lee, N. Xu, X. Wang, J. Bodeau, B. B. Tuch, A. Siddiqui, K. Lao, and M. A. Surani. 2009. mRNA-Seq whole-transcriptome analysis of a single cell. Nature Methods 6:377-382.
Tani, T. H., A. Khodursky, R. M. Blumenthal, P. O. Brown, and R. G. Matthews. 2002. Adaptation to famine: a family of stationary-phase genes revealed by microarray analysis. Pro-ceedings of the National Academy of Sciences of the United States of America 99:13471-13476.
Tarver, M. R., X. Zhou, and M. E. Scharf. 2010. Socio-envi-ronmental and endocrine influences on developmental and caste-regulatory gene expression in the eusocial termite Re-ticulitermes flavipes. BMC Molecular Biology 11:28.
Tatar, M., A. Kopelman, D. Epstein, M.-P. Tu, C.-M. Yin, and R. Garofalo. 2001. A mutant Drosophila insulin receptor ho-molog that extends life-span and impairs neuroendocrine function. Science 292:107-110.
Teixeira, L. s., C. Rabouille, P. Rørth, A. Ephrussi, and N. F. Vanzo. 2003. Drosophila Perilipin/ADRP homologue Lsd2 regulates lipid metabolism. Mechanisms of Development 120:1071-1081.
Telfer, W. H. and J. G. Kunkel. 1991. The function and evolu-tion of insect storage hexamers. Annual Review of Entomol-ogy 36:205-228.
Telfer, W. H. and M. Pan. 2003. Storage hexamer utilization in Manduca sexta. Journal of Insect Science 3:26.
Terwilliger, N. B. 1998. Functional adaptations of oxy-gen-transport proteins. Journal of Experimental Biology 201:1085-1098.
Theopold, U., D. Li, M. Fabbri, C. Scherfer, and O. Schmidt. 2002. The coagulation of insect hemolymph. Cellular and Mo-lecular Life Sciences 59:363-372.
Timp, W., U. M. Mirsaidov, D. Wang, J. Comer, A. Aksimen-tiev, and G. Timp. 2010. Nanopore sequencing: electrical measurements of the code of life. IEEE Transactions on Na-notechnology 9:281-294.
Trapnell, C., B. A. Williams, G. Pertea, A. Mortazavi, G. Kwan, M. J. van Baren, S. L. Salzberg, B. J. Wold, and L. Pachter.
2010. Transcript assembly and quantification by RNA-Seq re-veals unannotated transcripts and isoform switching during cell differentiation. Nature Biotechnology 28:511-515.
Traut, W. and F. Marec. 1997. Sex chromosome differentia-tion in some species of Lepidoptera (Insecta). Chromosome Research 5:283-291.
Travis, J. M. and C. Dytham. 1999. Habitat persistence, habi-tat availability and the evolution of dispersal. Proceedings of the Royal Society B: Biological Sciences 266:723-728.
Tu, M.-P., C.-M. Yin, and M. Tatar. 2005. Mutations in insulin signaling pathway alter juvenile hormone synthesis in Dros-ophila melanogaster. General and Comparative Endocrinol-ogy 142:347-356.
Tu, M. P., C. M. Yin, and M. Tatar. 2002. Impaired ovarian ecdysone synthesis of Drosophila melanogaster insulin re-ceptor mutants. Aging Cell 1:158-160.
Tungjitwitayakul, J., T. Singtripop, A. Nettagul, Y. Oda, N. Tatun, T. Sekimoto, and S. Sakurai. 2008. Identification, characterization, and developmental regulation of two storage proteins in the bamboo borer Omphisa fuscidentalis. Journal of Insect Physiology 54:62-76.
Ungerer, M., L. Johnson, and M. Herman. 2008. Ecological genomics: understanding gene and genome function in the natural environment. Heredity 100:178-183.
Valouev, A., J. Ichikawa, T. Tonthat, J. Stuart, S. Ranade, H. Peckham, K. Zeng, J. A. Malek, G. Costa, K. McKernan, A. Sidow, A. Fire, and S. M. Johnson. 2008. A high-resolution, nucleosome position map of C. elegans reveals a lack of uni-versal sequence-dictated positioning. Genome Research 18:1051-1063.
van Dijk, E. L., H. Auger, Y. Jaszczyszyn, and C. Thermes. 2014. Ten years of next-generation sequencing technology. Trends in Genetics 30:418-426.
Van Noordwijk, A. J. and G. de Jong. 1986. Acquisition and allocation of resources: their influence on variation in life his-tory tactics. The American Naturalist 128:137-142.
Vellichirammal, N. N., A. J. Zera, R. J. Schilder, C. Wehrkamp, J.-J. M. Riethoven, and J. A. Brisson. 2014. De novo transcrip-tome assembly from fat body and flight muscles transcripts to identify morph-specific gene expression profiles in Gryllus firmus. PLoS ONE 9:e82129.
Vera, J. C., C. W. Wheat, H. W. Fescemyer, M. J. Frilander, D. L. Crawford, I. Hanski, and J. H. Marden. 2008. Rapid tran-scriptome characterization for a nonmodel organism using 454 pyrosequencing. Molecular Ecology 17:1636-1647.
Vercruysse, L., D. Gelman, E. Raes, B. Hooghe, V. Vermeirs-sen, J. Van Camp, and G. Smagghe. 2004. The angiotensin converting enzyme inhibitor captopril reduces oviposition and ecdysteroid levels in Lepidoptera. Archives of Insect Bio-chemistry and Physiology 57:123-132.
Vijay, N., J. W. Poelstra, A. Künstner, and J. B. W. Wolf. 2013. Challenges and strategies in transcriptome assembly and dif-ferential gene expression quantification. A comprehensive in silico assessment of RNA-seq experiments. Molecular Ecology 22:620-634.
Wahlberg, N. and I. Saccheri. 2007. The effects of Pleistocene glaciations on the phylogeography of Melitaea cinxia (Lepi-doptera: Nymphalidae). European Journal of Entomology 104:675-684.
7. REFERENCES
39
Walsh, A. L. and W. A. Smith. 2011. Nutritional sensitivity of fifth instar prothoracic glands in the tobacco hornworm, Man-duca sexta. Journal of Insect Physiology 57:809-818.
Wang, G. L., B. H. Jiang, E. A. Rue, and G. L. Semenza. 1995. Hypoxia-inducible factor 1 is a basic-helix-loop-helix-PAS heterodimer regulated by cellular O
2 tension. Proceedings
of the National Academy of Sciences of the United States of America 92:5510-5514.
Wang, Z., M. Gerstein, and M. Snyder. 2009. RNA-Seq: a rev-olutionary tool for transcriptomics. Nature Reviews. Genetics 10:57-63.
Werner, E. E. and B. R. Anholt. 1993. Ecological consequences of the trade-off between growth and mortality rates mediated by foraging activity. The American Naturalist 142:242-272.
Weston, A. R., O. Karamizrak, A. Smith, T. D. Noakes, and K. H. Myburgh. 1999. African runners exhibit greater fatigue resistance, lower lactate accumulation, and higher oxidative enzyme activity. Journal of Applied Physiology 86:915-923.
Wheat, C. W. 2010. Rapidly developing functional genomics in ecological model systems via 454 transcriptome sequenc-ing. Genetica 138:433-451.
Wheeler, D. E., I. Tuchinskaya, N. A. Buck, and B. E. Tabash-nik. 2000. Hexameric storage proteins during metamorphosis and egg production in the diamondback moth, Plutella xylos-tella (Lepidoptera). Journal of Insect Physiology 46:951-958.
Wigglesworth, V. 1954. Secretion of juvenile hormone by the corpus allatum of Calliphora. Nature 174:556-556.
Wigglesworth, V. 1961. Insect polymorphism - a tentative syn-thesis. Pages 103-113 in Symposium of the Royal Entomologi-cal Society. Royal Entomological Society, London.
Williams, C. M. 1961. The juvenile hormone. II. Its role in the endocrine control of molting, pupation, and adult devel-opment in the Cecropia silkworm. The Biological Bulletin 121:572-585.
Wirtz, P. and J. Beetsma. 1972. Induction of caste differen-tiation in the honeybee (Apis mellifera) by juvenile hormone. Entomologia Experimentalis et Applicata 15:517-520.
Wolber, P. K., P. J. Collins, A. B. Lucas, A. De Witte, and K. W. Shannon. 2006. 2 The Agilent in situ-synthesized microarray platform. Pages 28-57 in K. Alan and O. Brian, editors. Meth-ods in Enzymology. Academic Press, San Diego.
Yang, X.-M., L.-J. Hou, D.-J. Dong, H.-L. Shao, J.-X. Wang, and X.-F. Zhao. 2006. Cathepsin B-like proteinase is involved in the decomposition of the adult fat body of Helicoverpa ar-migera. Archives of Insect Biochemistry and Physiology 62:1-10.
Yao, T.-P., W. A. Segraves, A. E. Oro, M. McKeown, and R. M. Evans. 1992. Drosophila ultraspiracle modulates ecdysone receptor function via heterodimer formation. Cell 71:63-72.
Yu, X.-Q., H. Gan, and M. R Kanost. 1999. Immulectin, an inducible C-type lectin from an insect, Manduca sexta, stimu-lates activation of plasma prophenol oxidase. Insect Biochem-istry and Molecular Biology 29:585-597.
Zakharkin, S. O., V. V. Headley, N. K. Kumar, N. A. Buck, D. E. Wheeler, and H. Beneš. 2001. Female-specific expression of a hexamerin gene in larvae of an autogenous mosquito. Euro-pean Journal of Biochemistry 268:5713-5722.
Zeng, V., K. E. Villanueva, B. S. Ewen-Campen, F. Alwes, W.
E. Browne, and C. G. Extavour. 2011. De novo assembly and characterization of a maternal and developmental transcrip-tome for the emerging model crustacean Parhyale hawaien-sis. BMC Genomics 12:581.
Zera, A. J. and G. Cisper. 2001. Genetic and diurnal variation in the juvenile hormone titer in a wing-polymorphic cricket: implications for the evolution of life histories and dispersal. Physiological and Biochemical Zoology 74:293-306.
Zera, A. J. and R. F. Denno. 1997. Physiology and ecology of dispersal polymorphism in insects. Annual Review of Ento-mology 42:207-230.
Zera, A. J. and L. G. Harshman. 2001. The physiology of life history trade-offs in animals. Annual Review of Ecology and Systematics 32:95-126.
Zera, A. J., J. Sall, and K. Grudzinski. 1997. Flight-muscle polymorphism in the cricket Gryllus firmus: muscle charac-teristics and their influence on the evolution of flightlessness. Physiological and Biochemical Zoology 70:519-529.
Zha, X., Q. Xia, J. Duan, C. Wang, N. He, and Z. Xiang. 2009. Dosage analysis of Z chromosome genes using microarray in silkworm, Bombyx mori. Insect Biochemistry and Molecular Biology 39:315-321.
Zhao, H. W. and G. G. Haddad. 2011. Review: Hypoxic and oxidative stress resistance in Drosophila melanogaster. Pla-centa 32:S104-S108.
Zhao, H. W., D. Zhou, and G. G. Haddad. 2011. Antimicrobial peptides increase tolerance to oxidant stress in Drosophila melanogaster. The Journal of Biological Chemistry 286:6211-6218.
Zhao, H. W., D. Zhou, V. Nizet, and G. G. Haddad. 2010. Ex-perimental selection for Drosophila survival in extremely high O
2 environments. PLoS ONE 5:e11701.
Zhao, X.-F., X.-M. An, J.-X. Wang, D.-J. Dong, X.-J. Du, S. Sueda, and H. Kondo. 2005. Expression of the Helicoverpa cathepsin b-like proteinase during embryonic development. Archives of Insect Biochemistry and Physiology 58:39-46.
Zheng, C., O. Ovaskainen, and I. Hanski. 2009. Modelling sin-gle nucleotide effects in phosphoglucose isomerase on disper-sal in the Glanville fritillary butterfly: coupling of ecological and evolutionary dynamics. Philosophical Transactions of the Royal Society B: Biological Sciences 364:1519-1532.
Zhong, H., A. M. De Marzo, E. Laughner, M. Lim, D. A. Hilton, D. Zagzag, P. Buechler, W. B. Isaacs, G. L. Semenza, and J. W. Simons. 1999. Overexpression of hypoxia-inducible factor 1α in common human cancers and their metastases. Cancer Research 59:5830-5835.
Zhou, B., K. Hiruma, T. Shinoda, and L. M. Riddiford. 1998. Juvenile hormone prevents ecdysteroid-induced expression of broad complex RNAs in the epidermis of the Tobacco horn-worm, Manduca sexta. Developmental Biology 203:233-244.
Zhou, D., N. Udpa, M. Gersten, D. W. Visk, A. Bashir, J. Xue, K. A. Frazer, J. W. Posakony, S. Subramaniam, V. Bafna, and G. G. Haddad. 2011. Experimental selection of hypoxia-tolerant Drosophila melanogaster. Proceedings of the Na-tional Academy of Sciences of the United States of America 108:2349-2354.
Zhou, D., J. Xue, J. C. K. Lai, N. J. Schork, K. P. White, and G. G. Haddad. 2008a. Mechanisms underlying hypoxia tolerance in Drosophila melanogaster: hairy as a metabolic switch.
7. REFERENCES
40
PLoS Genetics 4:e1000221.
Zhou, X., F. M. Oi, and M. E. Scharf. 2006a. Social exploita-tion of hexamerin: RNAi reveals a major caste-regulatory fac-tor in termites. Proceedings of the National Academy of Sci-ences of the United States of America 103:4499-4504.
Zhou, X., C. Song, T. L. Grzymala, F. M. Oi, and M. E. Scharf. 2006b. Juvenile hormone and colony conditions differentially influence cytochrome P450 gene expression in the termite Reticulitermes flavipes. Insect Molecular Biology 15:749-761.
Zhou, X., M. Tarver, G. Bennett, F. Oi, and M. Scharf. 2006c. Two hexamerin genes from the termite Reticulitermes flavi-pes: Sequence, expression, and proposed functions in caste regulation. Gene 376:47-58.
Zhou, X., M. R. Tarver, and M. E. Scharf. 2007. Hexamerin-based regulation of juvenile hormone-dependent gene expres-sion underlies phenotypic plasticity in a social insect. Devel-opment 134:601-610.
Zhou, X., M. M. Wheeler, F. M. Oi, and M. E. Scharf. 2008b. RNA interference in the termite Reticulitermes flavipes through ingestion of double-stranded RNA. Insect Biochem-istry and Molecular Biology 38:805-815.
Zhu, Y., E. Machleder, A. Chenchik, R. Li, and P. Siebert. 2001. Reverse transcriptase template switching: A SMART™ approach for full-length cDNA library construction. Biotech-niques 30:892-897.
Zhulidov, P., E. Bogdanova, A. Shcheglov, I. Shagina, L. Wag-ner, G. Khazpekov, V. Kozhemyako, S. Lukyanov, and D. Shagin. 2005. A method for the preparation of normalized cDNA libraries enriched with full-length sequences. Russian Journal of Bioorganic Chemistry 31:170-177.
Zwemer, L. M., L. Hui, H. C. Wick, and D. W. Bianchi. 2014. RNA-Seq and expression microarray highlight different as-pects of the fetal amniotic fluid transcriptome. Prenatal Diag-nosis doi:10.1002/pd.4417.