Comparative Functional Genomics of Salt Stress in Related Model and Cultivated Plants Identifies and...
11
Comparative Functional Genomics of Salt Stress in Related Model and Cultivated Plants Identifies and Overcomes Limitations to Translational Genomics Diego H. Sanchez 1¤a , Fernando L. Pieckenstain 2 , Jedrzey Szymanski 1 , Alexander Erban 1 , Mariusz Bromke 1 , Matthew A. Hannah 1¤b , Ute Kraemer 3 , Joachim Kopka 1 , Michael K. Udvardi 4 * 1 Max Planck Institute for Molecular Plant Physiology (MPIMP), Potsdam-Golm, Germany, 2 Instituto Tecnolo ´ gico de Chascomu ´ s (IIB-Intech), Chascomu ´ s, Argentina, 3 Department of Plant Physiology, Ruhr University Bochum, Bochum, Germany, 4 Samuel Roberts Noble Foundation, Ardmore, Oklahoma, United States of America Abstract One of the objectives of plant translational genomics is to use knowledge and genes discovered in model species to improve crops. However, the value of translational genomics to plant breeding, especially for complex traits like abiotic stress tolerance, remains uncertain. Using comparative genomics (ionomics, transcriptomics and metabolomics) we analyzed the responses to salinity of three model and three cultivated species of the legume genus Lotus. At physiological and ionomic levels, models responded to salinity in a similar way to crop species, and changes in the concentration of shoot Cl 2 correlated well with tolerance. Metabolic changes were partially conserved, but divergence was observed amongst the genotypes. Transcriptome analysis showed that about 60% of expressed genes were responsive to salt treatment in one or more species, but less than 1% was responsive in all. Therefore, genotype-specific transcriptional and metabolic changes overshadowed conserved responses to salinity and represent an impediment to simple translational genomics. However, ‘triangulation’ from multiple genotypes enabled the identification of conserved and tolerant-specific responses that may provide durable tolerance across species. Citation: Sanchez DH, Pieckenstain FL, Szymanski J, Erban A, Bromke M, et al. (2011) Comparative Functional Genomics of Salt Stress in Related Model and Cultivated Plants Identifies and Overcomes Limitations to Translational Genomics. PLoS ONE 6(2): e17094. doi:10.1371/journal.pone.0017094 Editor: Nicholas Provart, University of Toronto, Canada Received November 12, 2010; Accepted January 19, 2011; Published February 14, 2011 Copyright: ß 2011 Sanchez et al. This is an open-access article distributed under the terms of the Creative Commons Attribution License, which permits unrestricted use, distribution, and reproduction in any medium, provided the original author and source are credited. Funding: This work was conducted within the framework of the European LOTASSA project (Lotus Adaptation and Sustainability in South America, INCO-CT- 2005-517617). The funders had no role in study design, data collection and analysis, decision to publish, or preparation of the manuscript. Competing Interests: The authors have declared that no competing interests exist. * E-mail: [email protected] ¤a Current address: Division of Biological Sciences, University of California San Diego, La Jolla, California, United States of America ¤b Current address: Bayer Cropscience N.V., Gent, Belgium Introduction Secondary salinization of soils caused by irrigation has become a major concern worldwide (www.fao.org/ag/agl/agll/spush). Salin- ity engenders both hyper-osmotic and hyper-ionic stresses, with plants facing dehydration, ion toxicity, nutritional deficiencies and oxidative stress [1]. Acclimation responses include ion exclusion and tissue tolerance, tight control of water homeostasis and osmotic adjustment, changes in growth and development, and a wide array of underlying biochemical and molecular changes [1–5]. Research on the molecular responses of plants to salinity has focused mostly on model species such as Arabidopsis thaliana, yet the value of model plants in identifying mechanisms that may confer stress tolerance to crops in the field remains to be seen [6]. Although it is known that salt tolerance is a quantitative trait determined by multiple and complex genetic interactions [7–9] and that plant responses to salinity involve changes in the expression of thousands of genes [2– 3,10], we know little about the extent of evolutionary conservation of molecular networks that determine salt tolerance. To understand better the nature of impediments that may stand in the way of translational genomics for salinity tolerance, we carried out a comparative functional genomic study between model and cultivated legumes of the genus Lotus. Legumes are second only to grasses in their importance to agriculture, and provide a rich source of protein, oil, carbohydrate, minerals, and secondary compounds for human and animal nutrition [11]. The genomes of three legumes (Lotus japonicus, Medicago truncatula and Glycine max) have been sequenced, and it is envisioned that genomic discoveries in these species will be translated to crop improvement via breeding programs involving grain and forage legumes [12]. This approach seems reasonable given the high degree of synteny between legumes [13]. However, it remains to be seen whether orthologous genes that have significant effects on a complex, quantitative trait such as salinity tolerance in one species will have a similar effect in another. In this study, we compared the physiological and molecular responses to salt stress of six Lotus species. Three of them, L. japonicus, L. filicaulis, and L. burttii, are in-breeding and have been used as models for legume genetics [14–20]. L. japonicus has been developed as a premier model, with genome sequence and numerous tools for genetics and genomics now available [10,14–19]. L. filicaulis and L. burttii have been developed as crossing partners for genetic studies [20]. The other three species, L. corniculatus, L. glaber and L. uliginosus, are out-breeding and are used in world agriculture as forages. Although related, these species exhibit diversity in their ability to grow in low-fertility soils and under different environmental PLoS ONE | www.plosone.org 1 February 2011 | Volume 6 | Issue 2 | e17094
-
Upload
independent -
Category
Documents
-
view
1 -
download
0
Transcript of Comparative Functional Genomics of Salt Stress in Related Model and Cultivated Plants Identifies and...

Comparative Functional Genomics of Salt Stress inRelated Model and Cultivated Plants Identifies andOvercomes Limitations to Translational GenomicsDiego H. Sanchez1¤a, Fernando L. Pieckenstain2, Jedrzey Szymanski1, Alexander Erban1, Mariusz
Bromke1, Matthew A. Hannah1¤b, Ute Kraemer3, Joachim Kopka1, Michael K. Udvardi4*
1 Max Planck Institute for Molecular Plant Physiology (MPIMP), Potsdam-Golm, Germany, 2 Instituto Tecnologico de Chascomus (IIB-Intech), Chascomus, Argentina,
3 Department of Plant Physiology, Ruhr University Bochum, Bochum, Germany, 4 Samuel Roberts Noble Foundation, Ardmore, Oklahoma, United States of America
Abstract
One of the objectives of plant translational genomics is to use knowledge and genes discovered in model species toimprove crops. However, the value of translational genomics to plant breeding, especially for complex traits like abioticstress tolerance, remains uncertain. Using comparative genomics (ionomics, transcriptomics and metabolomics) weanalyzed the responses to salinity of three model and three cultivated species of the legume genus Lotus. At physiologicaland ionomic levels, models responded to salinity in a similar way to crop species, and changes in the concentration of shootCl2 correlated well with tolerance. Metabolic changes were partially conserved, but divergence was observed amongst thegenotypes. Transcriptome analysis showed that about 60% of expressed genes were responsive to salt treatment in one ormore species, but less than 1% was responsive in all. Therefore, genotype-specific transcriptional and metabolic changesovershadowed conserved responses to salinity and represent an impediment to simple translational genomics. However,‘triangulation’ from multiple genotypes enabled the identification of conserved and tolerant-specific responses that mayprovide durable tolerance across species.
Citation: Sanchez DH, Pieckenstain FL, Szymanski J, Erban A, Bromke M, et al. (2011) Comparative Functional Genomics of Salt Stress in Related Model andCultivated Plants Identifies and Overcomes Limitations to Translational Genomics. PLoS ONE 6(2): e17094. doi:10.1371/journal.pone.0017094
Editor: Nicholas Provart, University of Toronto, Canada
Received November 12, 2010; Accepted January 19, 2011; Published February 14, 2011
Copyright: � 2011 Sanchez et al. This is an open-access article distributed under the terms of the Creative Commons Attribution License, which permitsunrestricted use, distribution, and reproduction in any medium, provided the original author and source are credited.
Funding: This work was conducted within the framework of the European LOTASSA project (Lotus Adaptation and Sustainability in South America, INCO-CT-2005-517617). The funders had no role in study design, data collection and analysis, decision to publish, or preparation of the manuscript.
Competing Interests: The authors have declared that no competing interests exist.
* E-mail: [email protected]
¤a Current address: Division of Biological Sciences, University of California San Diego, La Jolla, California, United States of America¤b Current address: Bayer Cropscience N.V., Gent, Belgium
Introduction
Secondary salinization of soils caused by irrigation has become a
major concern worldwide (www.fao.org/ag/agl/agll/spush). Salin-
ity engenders both hyper-osmotic and hyper-ionic stresses, with
plants facing dehydration, ion toxicity, nutritional deficiencies and
oxidative stress [1]. Acclimation responses include ion exclusion and
tissue tolerance, tight control of water homeostasis and osmotic
adjustment, changes in growth and development, and a wide array
of underlying biochemical and molecular changes [1–5]. Research
on the molecular responses of plants to salinity has focused mostly
on model species such as Arabidopsis thaliana, yet the value of model
plants in identifying mechanisms that may confer stress tolerance to
crops in the field remains to be seen [6]. Although it is known that
salt tolerance is a quantitative trait determined by multiple and
complex genetic interactions [7–9] and that plant responses to
salinity involve changes in the expression of thousands of genes [2–
3,10], we know little about the extent of evolutionary conservation
of molecular networks that determine salt tolerance. To understand
better the nature of impediments that may stand in the way of
translational genomics for salinity tolerance, we carried out a
comparative functional genomic study between model and
cultivated legumes of the genus Lotus.
Legumes are second only to grasses in their importance to
agriculture, and provide a rich source of protein, oil, carbohydrate,
minerals, and secondary compounds for human and animal
nutrition [11]. The genomes of three legumes (Lotus japonicus,
Medicago truncatula and Glycine max) have been sequenced, and it is
envisioned that genomic discoveries in these species will be
translated to crop improvement via breeding programs involving
grain and forage legumes [12]. This approach seems reasonable
given the high degree of synteny between legumes [13]. However,
it remains to be seen whether orthologous genes that have
significant effects on a complex, quantitative trait such as salinity
tolerance in one species will have a similar effect in another.
In this study, we compared the physiological and molecular
responses to salt stress of six Lotus species. Three of them, L. japonicus,
L. filicaulis, and L. burttii, are in-breeding and have been used as
models for legume genetics [14–20]. L. japonicus has been developed
as a premier model, with genome sequence and numerous tools for
genetics and genomics now available [10,14–19]. L. filicaulis and L.
burttii have been developed as crossing partners for genetic studies
[20]. The other three species, L. corniculatus, L. glaber and L. uliginosus,
are out-breeding and are used in world agriculture as forages.
Although related, these species exhibit diversity in their ability to
grow in low-fertility soils and under different environmental
PLoS ONE | www.plosone.org 1 February 2011 | Volume 6 | Issue 2 | e17094

constraints [21–22]. Here, we present the results of comparative
ionomic, transcriptomic and metabolomic analyses of Lotus
genotypes that reveal conserved and divergent system responses to
salinity within this genus. Our work has important implications for
translational genomics approaches that aim to improve salinity
tolerance and other complex traits in plants.
Results
Physiological and nutritional responses to salinity inLotus spp
The relative salt tolerance of Lotus genotypes representing the
six species described above, including two accessions of L. japonicus
(MG20 and Gifu), was determined in two independent survival
experiments in which plants were subjected to long-term step-wise
increases in the level of NaCl up to 300 mM NaCl (Figure 1A and
B). We defined the ‘lethal-dose fifty’ (LD50) as the number of days
at which 50% of plants had died. The resulting ranking from most
to least tolerant genotype was: L. glaber . L. burttii . L. japonicus
var. MG20 . L. filicaulis . L. japonicus var. Gifu , L. uliginosus ,L. corniculatus (Table 1). No separation with respect to survival was
observed between phylogenetically-close and distant genotypes
[23], or between model and forage species [21].
To facilitate systems comparison under salt acclimation a
second treatment regime was applied, which subjected plants to a
long-term sub-lethal level of salt (up to 150 mM NaCl, figure 1A,
Figure 1. Experimental design and physiological assessment of salt tolerance and acclimation in Lotus species. (A) Experimentaldesign for long-term survival (300 mM NaCl) and sub-lethal salt acclimation (150 mM NaCl) experiments. NaCl concentration in the nutrient solutionwas increased by 50 mM every four days (see Materials and methods). i = seed imbibition, t = transplanting, s = start salinization, d = days. (B)Representative experiment for survival of Lotus species under lethal NaCl-stress conditions. The step-wise increase in total NaCl added to each pot isestimated on the right axis. (C) Plant growth evaluated as final shoot biomass (left panel) and relative performance (right panel) under sub-lethal NaCllevels. Data represents the mean 6 SD of 3 independent experiments, and the asterisk indicates a statistically-significant difference in stress-inducedchange in biomass between L. corniculatus and L. filicaulis (Student t-test, p,0.05). Model species are shown to the left. FW = fresh weight. (D) Linearcorrelation between Na+ or Cl2 content of salt-acclimated plants (shoots) and mean LD50 calculated from survival experiments (Table 1).doi:10.1371/journal.pone.0017094.g001
Comparative Genomics of Salt Stress in Legumes
PLoS ONE | www.plosone.org 2 February 2011 | Volume 6 | Issue 2 | e17094
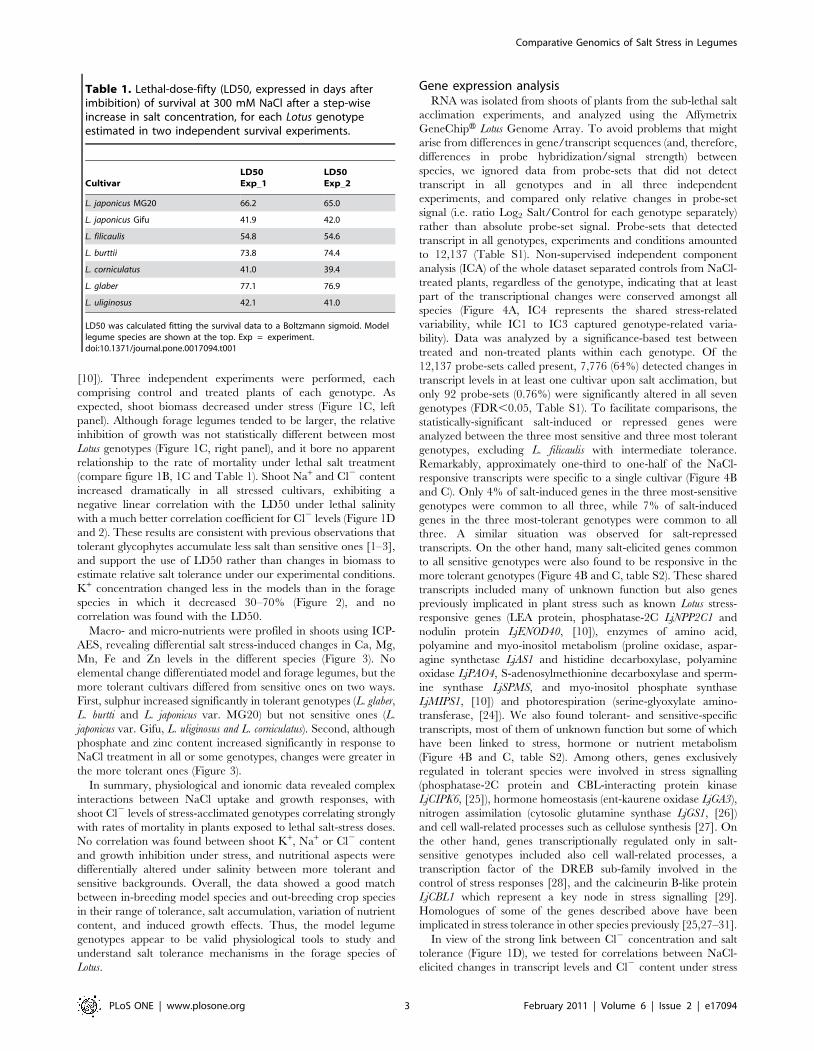
[10]). Three independent experiments were performed, each
comprising control and treated plants of each genotype. As
expected, shoot biomass decreased under stress (Figure 1C, left
panel). Although forage legumes tended to be larger, the relative
inhibition of growth was not statistically different between most
Lotus genotypes (Figure 1C, right panel), and it bore no apparent
relationship to the rate of mortality under lethal salt treatment
(compare figure 1B, 1C and Table 1). Shoot Na+ and Cl2 content
increased dramatically in all stressed cultivars, exhibiting a
negative linear correlation with the LD50 under lethal salinity
with a much better correlation coefficient for Cl2 levels (Figure 1D
and 2). These results are consistent with previous observations that
tolerant glycophytes accumulate less salt than sensitive ones [1–3],
and support the use of LD50 rather than changes in biomass to
estimate relative salt tolerance under our experimental conditions.
K+ concentration changed less in the models than in the forage
species in which it decreased 30–70% (Figure 2), and no
correlation was found with the LD50.
Macro- and micro-nutrients were profiled in shoots using ICP-
AES, revealing differential salt stress-induced changes in Ca, Mg,
Mn, Fe and Zn levels in the different species (Figure 3). No
elemental change differentiated model and forage legumes, but the
more tolerant cultivars differed from sensitive ones on two ways.
First, sulphur increased significantly in tolerant genotypes (L. glaber,
L. burtti and L. japonicus var. MG20) but not sensitive ones (L.
japonicus var. Gifu, L. uliginosus and L. corniculatus). Second, although
phosphate and zinc content increased significantly in response to
NaCl treatment in all or some genotypes, changes were greater in
the more tolerant ones (Figure 3).
In summary, physiological and ionomic data revealed complex
interactions between NaCl uptake and growth responses, with
shoot Cl2 levels of stress-acclimated genotypes correlating strongly
with rates of mortality in plants exposed to lethal salt-stress doses.
No correlation was found between shoot K+, Na+ or Cl2 content
and growth inhibition under stress, and nutritional aspects were
differentially altered under salinity between more tolerant and
sensitive backgrounds. Overall, the data showed a good match
between in-breeding model species and out-breeding crop species
in their range of tolerance, salt accumulation, variation of nutrient
content, and induced growth effects. Thus, the model legume
genotypes appear to be valid physiological tools to study and
understand salt tolerance mechanisms in the forage species of
Lotus.
Gene expression analysisRNA was isolated from shoots of plants from the sub-lethal salt
acclimation experiments, and analyzed using the Affymetrix
GeneChipH Lotus Genome Array. To avoid problems that might
arise from differences in gene/transcript sequences (and, therefore,
differences in probe hybridization/signal strength) between
species, we ignored data from probe-sets that did not detect
transcript in all genotypes and in all three independent
experiments, and compared only relative changes in probe-set
signal (i.e. ratio Log2 Salt/Control for each genotype separately)
rather than absolute probe-set signal. Probe-sets that detected
transcript in all genotypes, experiments and conditions amounted
to 12,137 (Table S1). Non-supervised independent component
analysis (ICA) of the whole dataset separated controls from NaCl-
treated plants, regardless of the genotype, indicating that at least
part of the transcriptional changes were conserved amongst all
species (Figure 4A, IC4 represents the shared stress-related
variability, while IC1 to IC3 captured genotype-related varia-
bility). Data was analyzed by a significance-based test between
treated and non-treated plants within each genotype. Of the
12,137 probe-sets called present, 7,776 (64%) detected changes in
transcript levels in at least one cultivar upon salt acclimation, but
only 92 probe-sets (0.76%) were significantly altered in all seven
genotypes (FDR,0.05, Table S1). To facilitate comparisons, the
statistically-significant salt-induced or repressed genes were
analyzed between the three most sensitive and three most tolerant
genotypes, excluding L. filicaulis with intermediate tolerance.
Remarkably, approximately one-third to one-half of the NaCl-
responsive transcripts were specific to a single cultivar (Figure 4B
and C). Only 4% of salt-induced genes in the three most-sensitive
genotypes were common to all three, while 7% of salt-induced
genes in the three most-tolerant genotypes were common to all
three. A similar situation was observed for salt-repressed
transcripts. On the other hand, many salt-elicited genes common
to all sensitive genotypes were also found to be responsive in the
more tolerant genotypes (Figure 4B and C, table S2). These shared
transcripts included many of unknown function but also genes
previously implicated in plant stress such as known Lotus stress-
responsive genes (LEA protein, phosphatase-2C LjNPP2C1 and
nodulin protein LjENOD40, [10]), enzymes of amino acid,
polyamine and myo-inositol metabolism (proline oxidase, aspar-
agine synthetase LjAS1 and histidine decarboxylase, polyamine
oxidase LjPAO4, S-adenosylmethionine decarboxylase and sperm-
ine synthase LjSPMS, and myo-inositol phosphate synthase
LjMIPS1, [10]) and photorespiration (serine-glyoxylate amino-
transferase, [24]). We also found tolerant- and sensitive-specific
transcripts, most of them of unknown function but some of which
have been linked to stress, hormone or nutrient metabolism
(Figure 4B and C, table S2). Among others, genes exclusively
regulated in tolerant species were involved in stress signalling
(phosphatase-2C protein and CBL-interacting protein kinase
LjCIPK6, [25]), hormone homeostasis (ent-kaurene oxidase LjGA3),
nitrogen assimilation (cytosolic glutamine synthase LjGS1, [26])
and cell wall-related processes such as cellulose synthesis [27]. On
the other hand, genes transcriptionally regulated only in salt-
sensitive genotypes included also cell wall-related processes, a
transcription factor of the DREB sub-family involved in the
control of stress responses [28], and the calcineurin B-like protein
LjCBL1 which represent a key node in stress signalling [29].
Homologues of some of the genes described above have been
implicated in stress tolerance in other species previously [25,27–31].
In view of the strong link between Cl2 concentration and salt
tolerance (Figure 1D), we tested for correlations between NaCl-
elicited changes in transcript levels and Cl2 content under stress
Table 1. Lethal-dose-fifty (LD50, expressed in days afterimbibition) of survival at 300 mM NaCl after a step-wiseincrease in salt concentration, for each Lotus genotypeestimated in two independent survival experiments.
CultivarLD50Exp_1
LD50Exp_2
L. japonicus MG20 66.2 65.0
L. japonicus Gifu 41.9 42.0
L. filicaulis 54.8 54.6
L. burttii 73.8 74.4
L. corniculatus 41.0 39.4
L. glaber 77.1 76.9
L. uliginosus 42.1 41.0
LD50 was calculated fitting the survival data to a Boltzmann sigmoid. Modellegume species are shown at the top. Exp = experiment.doi:10.1371/journal.pone.0017094.t001
Comparative Genomics of Salt Stress in Legumes
PLoS ONE | www.plosone.org 3 February 2011 | Volume 6 | Issue 2 | e17094

for salt-responsive genes shared between all species, and those that
were exclusive to tolerant or sensitive genotypes (Figure S1).
Remarkably, expression changes of transcripts with shared
responses to salinity across species showed little global correlation
to Cl2 levels. On the other hand, as expected considering the link
with survival under lethal salt stress, changes in transcript levels of
tolerant- and sensitive- specific genes correlated better with Cl2
content.
In summary, the results of transcriptome analysis indicated that
a small fraction of the transcriptional responses to salinity were
conserved amongst the Lotus genotypes. The majority of genes
regulated during NaCl acclimation was unique to single genotypes
or confined to just a few, and were neither linked to model or
forage species nor indicative of the degree of salt tolerance.
However, a small sub-set of salt-responsive transcripts were
common to all genotypes or represented markers for more
tolerant or sensitive genetic backgrounds, and these included key
genes involved in stress and metabolism.
Metabolic phenotype analysisThe shoot metabolic phenotypes of the Lotus species under salt
acclimation were determined using non-targeted GC/EI-TOF-
MS. A set of 123 analytes, representing both known and unknown
compounds, were identified in all genotypes and independent
experiments (Table S3). A significance-based analysis was used to
determine which analytes responded to salt stress within each
genotype (Student t-test, p,0.05 adjusted Bonferroni correction).
Many NaCl-induced changes in analytes levels were qualitatively
similar in most genetic backgrounds, although some metabolic
changes were genotype-specific (Figure 5A). Approximately half of
the analytes that accumulated under stress were shared between
sensitive and tolerant genotypes (Figure 5A, Table S3). These
included known L. japonicus salt-responsive metabolites such as
serine, threonine and ononitol ([10]; Figure S2). On the other
hand, levels of organic acids including citric, succinic, malic and
threonic acids, declined in most cultivars under salinity, as
reported before for model species ([32]; Figure S2). Few salt-
induced changes were confined to sensitive genotypes, e.g. increase
in gulonic acid and decrease in aspartic acid; or tolerant
genotypes, i.e. increase in asparagine (Figure 6). Based on
correlation analysis, changes in metabolite levels did not show
stable correlative patterns with changes in ion content or biomass
under stress, which hampered further integrative analysis.
Furthermore, the number of independent microarrays available
for each species was insufficient to build robust metabolite-
transcript correlations.
Changes in metabolism were analyzed further, using a
metabolic network approach based on pairwise correlations
between analyte levels in all genotypes and treatments combined
(see methods). Nine communities (modules) of correlated analytes
were identified in the resulting network using community structure
statistics [33], reflecting conservation of some metabolic modules
between genotypes. However, when individual networks were
constructed for each cultivar using control and treatment data,
clear differences in network architecture were observed, indicating
genotype-specific interactions (Figure 7A). Networks for control
and salt treatments were also built to identify salt-dependent
Figure 2. Changes in shoot Na+, Cl2 and K+ in Lotus speciesunder salt acclimation. Data represents the mean 6 SD of 3independent experiments. Asterisks indicate a statistically-significantdifference (Student t-test with adjusted Bonferroni correction, p,0.05)between salt treatment and control.doi:10.1371/journal.pone.0017094.g002
Comparative Genomics of Salt Stress in Legumes
PLoS ONE | www.plosone.org 4 February 2011 | Volume 6 | Issue 2 | e17094

changes in network architecture that were conserved across
genotypes (Figure 7B). Only some of the NaCl-induced commu-
nities in the network architecture were shared between genotypes,
indicating that some but not all metabolic patterns of response to
salt acclimation are conserved between genotypes (compare
Figure 7A and B).
Figure 3. Changes in shoot macro- and micro-nutrients in Lotus species under salt acclimation. Data represents the mean 6 SD of 3independent experiments. Asterisks indicate a statistically-significant difference (ANOVA, p,E26) in response to treatment.doi:10.1371/journal.pone.0017094.g003
Comparative Genomics of Salt Stress in Legumes
PLoS ONE | www.plosone.org 5 February 2011 | Volume 6 | Issue 2 | e17094

In summary, the results indicated that Lotus species share many
metabolic responses to salinity, and few metabolite markers were
found that distinguish tolerant or sensitive genetic backgrounds.
On the other hand, several qualitative and quantitative changes
under salt-stress, along with some network properties of the
metabolome, were unique to individual genotypes.
Discussion
Previous work has shown that translational genomics can be
used to modify traits of agricultural importance, such as pathogen
resistance, via a candidate gene approach [34]. But what about
complex traits such as tolerance to abiotic stresses, which are
Figure 4. Transcriptional changes in Lotus species during salt acclimation. (A) Independent component analysis (ICA) of changes intranscript levels. A dashed line separates the symbols that indicate control (empty) and salt acclimation (filled) treatments of the three independentsub-lethal acclimation experiments. (B and C) Venn diagrams showing the number of salt-induced (B) and repressed (C) genes at FDR,0.05 commonto more sensitive and/or tolerant genotypes. L. filicaulis, with intermediate tolerance, was excluded (see figure 1 and table S1). Colour code for thedifferent genotypes is as in figure 1.doi:10.1371/journal.pone.0017094.g004
Comparative Genomics of Salt Stress in Legumes
PLoS ONE | www.plosone.org 6 February 2011 | Volume 6 | Issue 2 | e17094

determined by the interdependent action of thousands of genes
that, in turn, are affected by complex interactions with the
environment beyond the stress of interest? We utilised the tools of
ionomics, transcriptomics and metabolomics to determine the
extent to which plant systems responses to salinity are conserved
amongst closely related model and cultivated Lotus species [23].
There were no apparent differences between model and forage
genotypes of Lotus with regard to the range of tolerance/sensitivity,
growth inhibition, salt accumulation and nutrient status under salt
stress (Figures 1 to 3). A strong negative correlation between Cl2
levels in the shoot and tolerance to salinity across species
(Figure 1D) supported the conclusion that Cl2 exclusion from
the shoots represents a key physiological mechanism for salt
tolerance in legumes, similar to the case of Na+ exclusion in other
glycophytes [1–3,35]. Taken together, these results indicate that
Lotus model species respond to salinity in a similar way to crop
species and, therefore, are useful systems for identifying physio-
logical processes required for salt tolerance.
Ionomic analysis revealed a differential increase of phosphate,
sulphur and zinc in more tolerant genotypes in response to salinity
(Figure 3). Presumably, this reflects a differential NaCl-induced
imbalance between uptake and translocation to the shoot of these
nutrients and plant growth. However, no nutrient correlated with
biomass in control or stressed plants. Therefore, the physiological
significance of shoot phosphate, sulphur and zinc concentration in
Lotus shoots during saltinity remains obscure. In fact, these
nutrients were observed to decline in other species under salt
stress, indicating that the influence of salinity on plant nutrition is
variable and dependent on growth conditions, chemical charac-
teristics of the soil and plant genotype [5,36–37].
All Lotus genotypes responded to salt stress with massive changes
in gene expression. More than 60% of the genes monitored in the
shoots of all six species responded to NaCl with significant changes
in transcript level in at least one genotype. However, less than 1%
responded in all genotypes (Figure 2). Comparisons between
salinized root tips of monocot species from different genera
indicate that this phenomenon also occurs at the root level [38].
The lack of conservation in the majority of transcriptional
responses to salinity reflects at least two things. First, most genes
that respond to salinity have little to do with the tolerance of a
genus. Second, the architecture of genetic control networks
governing transcription is highly complex and variable between
genotypes. A similar conclusion was drawn on an expression
quantitative trait loci (eQTL) study of recombinant inbred lines of
A. thaliana, where the majority of eQTL had only small phenotypic
effects [39]. The variability in transcriptional responses may also
reflect differences in the suite of molecular and cellular
mechanisms used to cope with salt accumulation in the shoot,
redundancy within multigene families with different genes in the
same family fulfilling equivalent roles in different species, and
NaCl-responsive genes involved in secondary/pleiotropic respons-
es to stress rather than primary responses required for acclimation.
Clearly, simply relying on transcriptional profiling of a single
model genotype to identify processes that could be translated to
crops would be unwise, in view of the high degree of ‘false
positives’ inferred from the above analyses.
Figure 5. Overview of metabolite profiles of Lotus species during salt acclimation. (A and B) Venn diagrams comparing analytes that wereresponsive to salt stress in tolerant and sensitive genotypes (Student t-test with adjusted Bonferroni correction, p,0.05). L. filicaulis was excludedbecause of its intermediate tolerance (c.f. Figure 1B and table 1). The colour code for the different genotypes is as in figure 1.doi:10.1371/journal.pone.0017094.g005
Comparative Genomics of Salt Stress in Legumes
PLoS ONE | www.plosone.org 7 February 2011 | Volume 6 | Issue 2 | e17094

On the other hand, by ‘triangulating’ data from multiple species
we identified genes that responded in all genotypes, and genes that
responded only in salt-tolerant or only in salt-sensitive cultivars.
Most NaCl-responsive transcripts that were shared across all
genotypes showed little correlation to Cl2 levels (Figure S1),
indicating that they may be involved in ‘general’ physiological
responses such as osmotic stress or growth inhibition [5].
Consistent with this idea, several of these represent key genes of
stress-related metabolism, including amino acid, myo-inositol and
Figure 6. Changes of selected metabolites listed among themarkers for sensitive and tolerant genotypes. Data representsthe mean 6 SD of three independent experiments of the normalizedmetabolite pools size (i.e. detector signals in arbitrary units normalizedto internal standard and sample fresh weight). The asterisks indicate a
Figure 7. Network analysis of metabolite profiles. (A and B)Heat-maps representing the statistical connectivity between metabolicnetwork communities: (A) for each genotype, arising from genotype-specific networks, and (B) for the control network, the salt treatmentnetwork and for the subtraction of the control and the salt treatmentnetworks (i.e. correlations elicited upon salt stress). Lighter colour (fromred to white) represents higher correlation coefficient.doi:10.1371/journal.pone.0017094.g007
statistically-significant difference (Student t-test with adjusted Bonfer-roni correction, p,0.05) in the stress-induced change.doi:10.1371/journal.pone.0017094.g006
Comparative Genomics of Salt Stress in Legumes
PLoS ONE | www.plosone.org 8 February 2011 | Volume 6 | Issue 2 | e17094

polyamines biosynthesis, cell wall modification and photorespira-
tion [24,10,30–31]. Importantly, homologues of at least two of
these genes, AtSPMS and AtMIPS1, contribute to salinity responses
in A. thaliana [30–31]. In contrast to common salt-responsive genes,
changes in transcript levels of genes responding only in tolerant or
sensitive genotypes showed better correlation with Cl2 content
(Figure S1), indicating they may be directly or indirectly involved
in plant responses to ion accumulation or imbalance. These
included homologues of A. thaliana AtCIPK6 and AtCBL1, which
are components of signalling pathways required for salt tolerance
and members of the CBL-CIPK network controlling nutrient and
salt homeostasis [25,29].
Despite dramatic differences observed at the transcriptome
level, about half of the changes in primary metabolism in response
to NaCl were shared by all Lotus species, although qualitative,
quantitative and network analyses revealed several genotype-
specific features (Figures 5 to 7 and S2). Conserved metabolic
changes included increases in the levels of specific amino acids and
polyols and decreases in organic acids, most of them recognized as
salt-responsive metabolites that may act as compatible solutes or to
compensate for ionic imbalance [32]. Changes in gulonic and
aspartic acids were confined to sensitive genotypes (Figure 6). The
former is an intermediate in the uronic acid pathway that
synthesizes the antioxidant ascorbate from myo-inositol [40], and
thus an increased gulonic acid content may reflect higher oxidative
stress and cellular damage in the sensitive cultivars. If involved in
charge balance [32], a decrease in aspartic acid may reflect the
higher Cl2 content of the sensitive genotypes. On the other hand,
asparagine levels increased in the more tolerant genotypes
(Figure 6). This metabolite has a central role in the long-distance
transport of nitrogen in Lotus and it functions at the core of the
GS/GOGAT and the ornithine cycles, which are directly or
indirectly involved in nitrogen assimilation, proline and polya-
mine biosynthesis, and ammonium detoxification from photores-
piration [26,41–42]. Therefore, asparagine may play a pivotal
role in salt tolerance by supporting core nitrogen metabolism.
Further research would be needed to test if the manipulation of
asparagine metabolism may be useful to improve salt tolerance
in legumes.
Although some success has been reported in identifying genes
that confer salt tolerance in model plants under controlled
conditions using simple molecular biological approaches, little
success has been achieved in the field where complex environ-
mental interactions prevail [9,43]. To complicate things, there are
significant differences between plants in how they to cope with
saline soils, with salt exclusion, tissue tolerance, and osmotic
adjustment playing more or less significant roles in different species
[3,6]. We have shown here that transcriptome and metabolome
changes that occur in related model and forage legume species in
response to salinity are not highly conserved, which hampers
simple translational genomics approaches. A similar conclusion
was drawn from Populus genotypes subjected to drought, namely
that it is not possible to draw simple, generalized conclusions about
the stress transcriptome of a genus on the basis of one species [44].
However, a small set of salt-responsive genes were found to be
conserved in all Lotus genotypes studied here, while salt-
responsiveness of other genes was confined to tolerant or sensitive
cultivars. It is likely that some of these genes play integral roles in
acclimation and tolerance to saline soils; in fact homologues of
some have been shown to confer greater salt tolerance in other
species. In conclusion, ‘triangulation’ of transcriptomic and
metabolomic data from multiple related species/genotypes offers
itself as a practical means to eliminate a plethora of false positives
in the hunt for genes and processes determining complex traits.
Materials and Methods
Plant material, growth conditions and experimentaldesigns
Seeds of L. japonicus var. MG20, L. japonicus var. Gifu B129, L.
filicaulis, L. burttii B303, L. corniculatus var. San Gabriel, L. glaber (L.
tenuis) var. La Esmeralda and L. uliginosus var. LE G27 were obtained
from the LOTASSA consortium (www.lotassa.org). Seeds were
germinated in half-strength BD solution [45] agar plates plus 2 mM
KNO3 and 2 mM NH4NO3. Four days after imbibition, seedlings
were transplanted to soil (Einheit, type null) using 10 cm pots
irrigated with the above solution and grown in greenhouse under
16/8 hours day/night, 2362uC and 55–65% RH. Salt stress
treatment started 8 days post-imbibition and the salt content in the
nutrient solution was increased in steps of 4 days till reaching the
desired concentration (300 or 150 mM NaCl) (Figure 1A). Fresh
nutrient solution was prepared every 4 days. Survival experiments
were performed at lethal salt stress doses (300 mM NaCl) and were
repeated twice, measuring the rate of mortality which was scored
when the whole plant or all leafs were wilted or chlorotic. For
salinity acclimation, 3 successive independent sub-lethal salt stress
experiments were performed (150 mM NaCl), each consisting of 14
sample sets comprising control and salt treatments for each of the
genotypes. Each set had 6 independent biological replicate pools of
5 plants. Total time of culture was 32 days and whole shoots,
excluding cotyledons, were harvested in situ into liquid nitrogen in
the middle of the light period. At harvest all plants were in the
vegetative stage, with roots never showing nodules. The exposition
to an identical salt stress dose between the genotypes was confirmed
measuring the soil conductivity [10]. Biomass was estimated by
mean fresh weight of the pooled shoots.
Profiling analysisTranscriptomic, metabolomic and ionomic profiling were
performed as described previously [10]. For the transcriptiome
analysis, sample tissue of all the biological replicates of each
genotype were pooled to obtain 14 representative RNA samples in
each independent experiment. The resulting 42 RNA samples
were labelled and hybridized to the GenechipH Lotus1a520343
(Affymetrix). Element and metabolites and content were deter-
mined in each biological replicate using ICP-AES and GC/EI-
TOF-MS, respectively. For ionomic profiling, 100 mg plant
material was digested with 2 ml HNO3 at 140uC until complete
digestion. 100 ml of a 100 g/L LiCl solution was added as a carrier
and the final volume adjusted with ultra pure water to 10 ml.
Element concentrations were determined with inductively coupled
plasma-atomic emission spectrometry (ICP-AES) using an IRIS
Advantage Duo ER/S (Thermo Fisher). Elemental quantification
was validated using IC-CTA-VTL2 Virginia tobacco leaves as a
certified reference material. Chloride was profiled using ion
chromatography with a Dionex ICS-2000 system (Dionex). For
metabolomic profiling, 60 mg of frozen plant tissue was extracted
with methanol/chloroform, and the polar fraction was prepared
by liquid partitioning into water and derivatized [46]. Gas
chromatography coupled to electron impact ionization-time of
flight-mass spectrometry (GC/EI-TOF-MS) was performed using
an Agilent 6890N24 gas chromatograph with split or splitless
injection mounted to a Pegasus III time-of-flight mass spectrom-
eter (LECO) [47]. Metabolite-features were quantified after mass
spectral deconvolution (ChromaTOF software 1.00, Pegasus
driver 1.61, LECO), and their chemical identification was
manually assessed using the NIST05 software (http://www.nist.
gov/srd/mslist.html) and the mass spectral and retention time
index collection of the Golm Metabolome Database [48].
Comparative Genomics of Salt Stress in Legumes
PLoS ONE | www.plosone.org 9 February 2011 | Volume 6 | Issue 2 | e17094
Statistics, data and network analysesStatistical differences between control and treatments in
element content were assessed with two-way-ANOVA using
‘‘treatment’’ and ‘‘independent experiment’’ as factors at stringent
statistical threshold (p,E26), with the TIGR multiple experiment
viewer software (TMEV_3.1). Microarray data were normalized
by the GC-RMA algorithm using the bioconductor package of R
software. Differential expression was tested for the probesets called
present in all experiments, species and treatments (12,137
probesets, according to the present/absent MAS5 algorithm)
correcting for multiple testing across all genes using the linear step-
up false discovery rate (FDR). Microarray data is MIAME
compliant and the 42 hybridizations were deposited at Array-
Express (www.ebi.ac.uk/arrayexpress, accession number E-
MEXP-2344). Independent component analysis (ICA) was used
as non-supervised clustering algorithm, through the MetaGeneA-
lyse webpage (http://metagenealyse.mpimp-golm.mpg.de). Cor-
relations across experiments and genotypes between the salt-
elicited fold change in gene expression (Log2 Salt/Control) and
Cl2 content under stress were assessed using the Pearson
correlation. Metabolomic profiles were analyzed with the
TagFinder software [49] and filtered for those metabolic-features
represented by 3 or more inter-correlated mass fragments within
each independent experiment [50]. The validity of this analytical
approach to quantify metabolites in plant tissues have been
previously demonstrated [51]. Resulting data was normalized to
internal standard and fresh weight, and each metabolic-feature
was normalized to the median within each experiment and
genotype, and log10 transformed prior to statistical analysis.
Statistical differences were assessed with Student t-test using
TMEV_3.1 (p,0.05 applying the adjusted Bonferroni correction).
Network analysis and operations were performed using R and
Pajek softwares. A stable metabolic backbone network was
reconstructed in two steps [52]. The first step recognized highly
correlated metabolites through the construction of a ‘‘union
network’’ based on a Spearmann rank-order analyte-analyte
correlation in each cultivar for the 123 identified analytes, which
was transformed into binary matrices according to a p,E24
threshold (applying Bonferroni correction) and considered further
if it was significant in at least one cultivar. In the second step, a
homogeneity test of the distributions of the correlations coefficients
(Z-score transformed) was performed for all analyte-analyte
correlations of the union network. Only those with a significant
threshold (p,E26) in a Chi-square test with were considered
stable. As a consequence, the reconstruction of a backbone
network represents statistically stable correlated analytes between
species. Particular networks for each genetic background or for
control and treatment conditions were reconstructed based on this
stable backbone. Tightly connected clusters of metabolites within
the stable network (communities) were detected using Newman’s
algorithm for modularity, establishing an arbitrary number when
modularity gain reached a plateau [33].
Supporting Information
Table S1 Transcriptomic profile data.
(XLS)
Table S2 Salt-elicited genes which were shared between more
sensitive and tolerant genotypes, or were specific for more tolerant
or sensitive backgrounds.
(XLS)
Table S3 Manually identified analytes present in all three
independent non-lethal salt stress acclimation experiments.
(XLS)
Figure S1 Correlation (Pearson coefficients) across experiments
and genotypes between changes in gene expression (Log2 Salt/
Control) and Cl2 content under stress.
(TIF)
Figure S2 Example of metabolites that responded to sub-lethal
salt stress in the different Lotus species.
(TIF)
Acknowledgments
We are grateful for the support of the Directors of the Max Planck Institute
for Molecular Plant Physiology (MPIMP) and technical assistance of Ines
Fehrle (MPIMP) and Janine Specht (University of Heidelberg). We thank
Dr. Bjorn Usadel, Dr. Marc Lohse, Dr. Jan Lisec and Britta Hausmann
(MPIMP), and Dr. Florian Wagner (ATLAS Biolabs, Berlin). FLP is a
member of the Consejo Nacional de Investigaciones Cientıficas y Tecnicas
(Argentina).
Author Contributions
Conceived and designed the experiments: DHS JK MKU. Performed the
experiments: DHS FLP MB. Analyzed the data: DHS JS AE MAH.
Contributed reagents/materials/analysis tools: UK. Wrote the manuscript:
DHS JK MKU. Edited the manuscript: UK.
References
1. Tester M, Davenport R (2003) Na+ tolerance and Na+ transport in plants. Ann
Bot 91: 503–527.
2. Munns R (2005) Genes and salt tolerance: bringing them together, New Phytol
167: 645–663.
3. Munns R, Tester M (2008) Mechanisms of salinity tolerance. Ann Rev Plant Biol
59: 651–681.
4. Achard P, Cheng H, De Grauwe L, Decat J, Schoutteten H, et al. (2006)
Integration of plant responses to environmentally activated phytohormonal
signals. Science 311: 91–94.
5. Sanchez DH, Szymanski J, Erban A, Udvardi MK, Kopka J (2010) Mining
for robust transcriptional and metabolic responses to long-term salt stress:
a case study on the model legume Lotus japonicus. Plant Cell Environm 33:
468–480.
6. Moller IS, Tester M (2007) Salinity tolerance of Arabidopsis: a good model for
cereals? Trends Plant Sci 12: 534–40.
7. Monforte AJ, Asins MJ, Carbonell EA (1997) Salt tolerance in Lycopersicon
species. VI. Genotype-by-salinity interaction in quantitative trait loci detection:
constitutive and response QTLs. Theor Appl Gen 95: 706–713.
8. Foolad MR (2004) Recent advances in genetics of salt tolerance in tomato. Plant
Cell Tiss Org Culture 76: 101–119.
9. Cuartero J, Bolarin MC, Asins MJ, Moreno V (2006) Increasing salt tolerance in
the tomato. J Exp Bot 57: 1045–1058.
10. Sanchez DH, Lippold F, Redestig H, Hannah M, Erban A, et al. (2008)
Integrative functional genomics of salt acclimatization in the model legume
Lotus japonicus. Plant J 53: 973–987.
11. Graham PH, Vance CP (2003) Legumes: importance and constraints to greater
use Plant Physiol 131: 872–877.
12. Young ND, Udvardi MK (2009) Translating Medicago truncatula genomics to crop
legumes. Curr Opin Plant Biol;doi 10.1016/j.pbi.2008.11.005.
13. Cannon SB, Sterck L, Rombauts S, Sato S, Cheung F, et al. (2006) Legume
genome evolution viewed through the Medicago truncatula and Lotus japonicus
genomes. Proc Nat Acad Sci 103: 14959–14964.
14. Perry JA, Wang TL, Welham TJ, Gardner S, Pike JM, et al. (2003) A TILLING
reverse genetics tools and a web-accessible collection of mutants of the legume
Lotus japonicus. Plant Physiol 131: 866–871.
15. Udvardi MK, Tabata S, Parniske M, Stougaard J (2005) Lotus japonicus: legume
research in the fast lane. Trends Plant Sci 10: 222–228.
16. Gondo T, Sato S, Okumura K, Tabata S, Akashi R, et al. (2007) Quantitative
trait locus analysis of multiple agronomic traits in the model legume Lotus
japonicus, Genome 50: 627–637.
Comparative Genomics of Salt Stress in Legumes
PLoS ONE | www.plosone.org 10 February 2011 | Volume 6 | Issue 2 | e17094

17. Sato S, Nakamura N, Kaneko T, Asamizu E, Kato T, et al. (2008) Genome
structure of the legume, Lotus japonicus. DNA Research 15: 227–239.
18. Høgslund N, Radutoiu S, Krusell L, Voroshilova V, X Hannah MA, et al.
(2009) Dissection of symbiosis and organ development by integrated tran-
scriptome analysis of Lotus japonicus mutant and wild-type plants. PLoS One 4:
e6556. doi: 10.1371/journal.pone.0006556.
19. Diaz P, Betti M, Sanchez DH, Udvardi MK, Monza J, et al. (2010) Deficiency in
plastidic glutamine synthetase alters proline metabolism and trasncriptomic
response in Lotus japonicus under drought stress. New Phytol;doi:10.111/j.1469-
8137.2010.03440.x.
20. Kawaguchi M, Pedrosa-Harand A, Yano K, Hayashi M, Murooka Y, et al.
(2005) Lotus burttii takes a position of the third corner in the Lotus molecular
genetics triangle. DNA Research 12: 69–77.
21. Diaz P, Borsani O, Monza J (2005) Lotus-related species and their agronomic
importance. In Lotus japonicus Handbook Marquez A, ed. The Netherlands:
Springer. pp 25–37.
22. Sanchez DH, Cuevas JC, Chiesa MA, Ruiz OA (2005) Free spermidine and
spermine content in Lotus glaber under long-term salt stress. Plant Sci 168:
541–546.
23. Degtjareva GV, Kramina DD, Sokoloff DD, Samigullin TH, Valiejo-
Roman CM, et al. (2006) Phylogeny of the genus Lotus (Leguminoseae, Loteae):
evidence from nrITS sequences and morphology. Can J Bot 84: 813–830.
24. Noctor G, Veljovic-Jovanovic S, Driscoll S, Novitskaya L, Foyer CH (2002)
Drought and oxidative load in the leaves of C3 plants: a predominant role for
photorespiration? Ann Bot 89: 841–850.
25. Tripathi V, Parasuraman B, Laxmi A, Chattopadhyay D (2009) CIPK6, a CBL-
interacting protein kinase is required for development and salt tolerance in
plants. Plant J 58: 778–790.
26. Marquez AJ, Betti M, Garcia-Calderon M, Pal’ove-Balang P, Diaz P, et al.
(2005) Nitrate assimilation in Lotus japonicus. J Exp Bot 56: 1741–1749.
27. Chen ZZ, Hong XH, Zhang HR, Wang YQ, Li X, et al. (2005) Disruption of
the cellulose synthase gene, AtCesA8/IRX1, enhances drought and osmotic
stress tolerance in Arabidopsis. Plant J 43: 273–283.
28. Nakano T, Suzuki K, Fujimura T, Shinshi H (2006) Genome-wide analysis of
ERF gene family in Arabidopsis and Rice. Plant Physiol 140: 411–432.
29. Albrecht V, Weinl S, Blazevic D, D’Angelo C, Batistic O, et al. (2003) The
calcium sensor CBL1 integrates plant responses to abiotic stresses. Plant J 36:
457–470.
30. Yamaguchi K, Takahashi Y, Berberich T, Imai A, Miyazaki A, et al. (2006) The
polyamine spermine protects against high salt stress in Arabidopsis thaliana. FEBS
Lett 30: 6783–6788.
31. Donahue JL, Alford SR, Torabinejad J, Kerwin RE, Nourbakhsh A, et al. (2010)
The Arabidopsis thaliana myo-inositol 1-phosphate synthase1 gene is required for
myo-inositol synthesis and suppression of cell death. Plant Cell doi/10.1105/
tpc.109.071779.
32. Sanchez DH, Siahpoosh MR, Roessner U, Udvardi MK, Kopka J (2008) Plant
metabolomics reveals conserved and divergent metabolic responses to salinity.
Physiol Plant 132: 209–219.
33. Newman MEJ (2006) Modularity and community structure in networks. Proc
Nat Acad Sci 103: 8577–8582.
34. Salentijn EMJ, Pereira A, Angenent GC, Van der Linden GC, Krens F, et al.
(2007) Plant translational genomics: from model species to crops. Mol Breeding20: 1–13.
35. Teakle NL, Tyerman SD (2010) Mechanisms of Cl2 transport contributing to
salt tolerance. Plant Cell Envirom 33: 566–589.36. Marschner H (1995) In Mineral nutrition of higher plants 2nd edn (Academic Press
Limited, London). .37. Grattan SR, Grieve CM (1999) Mineral nutrient acquisition and response by
plants grown in saline environments. Handbook of plant and crop stress 2nd edn
(Pessarakli M, ed.) New York: Marcel Dekker Inc.. pp 203–229.38. Walia H, Wilson C, Ismail AM, Close TJ, Cui X (2009) Comparing genomic
expression patterns across plant species reveals highly diverged transcriptionaldynamics in response to salt stress. BMC Genomics 10: 398.
39. West MAL, Kim K, Kliebenstein DJ, van Leeuwen H, Michelmore RW, et al.(2007) Global eQTL mapping reveals the complex genetic architecture of
transcript-level variation in Arabidopsis. Genetics 175: 1441–1450.
40. Ishikawa T, Dowdle J, Smirnoff N (2006) Progress in manipulating ascorbic acidbiosynthesis and accumulation in plants. Physiol Plant 126: 343–355.
41. Sieciechowicz KA, Joy KW, Ireland RJ (1988) The metabolism of asparagine inplants. Phytochemistry 27: 663–671.
42. Waterhouse RN, Smyth AJ, Massonneau A, Prosser IM, Clarkson DT (1996)
Molecular cloning and characterization of asparagine synthetase from Lotus
japonicus: dynamics of asparagine synthesis in N-sufficient conditions. Plant Mol
Biol 30: 883–897.43. Flowers TJ (2004) Improving crop salt tolerance. J Exp Bot 55: 307–319.
44. Wilkings O, Waldron L, Nahal H, Provart NJ, Campbell MM (2009) Genotypeand time of the day shape the Populus drought response. Plant J 60: 703–715.
45. Broughton WJ, Dilworth MJ (1971) Control of leghaemoglobin synthesis in
snake beans. Biochem J 125: 1075–1080.46. Desbrosses GG, Kopka J, Udvardi MK (2005) Lotus japonicus metabolic profiling.
Development of gas chromatography-mass spectrometry resources for the studyof plant-microbe interactions. Plant Physiol 137: 1302–1318.
47. Wagner C, Sefkow M, Kopka J (2003) Construction and application of a mass
spectral and retention time index database generated from plant GC/EI-TOF-MS metabolite profiles. Phytochemistry 62: 887–900.
48. Kopka J, Schauer N, Krueger S, Birkemeyer C, Usadel B, et al. (2005)[email protected]: the Golm Metabolome Database. Bioinformatics 21:
1635–1638.49. Luedemann A, Strassburg K, Erban A, Kopka J (2008) TagFinder for the
quantitative analysis of gas chromatography-mass spectrometry (GC-MS) based
metabolite profiling experiments. Bioinformatics 24: 732–737.50. Sanchez DH, Redestig H, Kramer U, Udvardi MK, Kopka J (2008c)
Metabolome-ionome-biomass interactions: what can we learn about salt stressby multiparallel phenotyping? Plant Sig Behav 3: 598–600.
51. Allwood JW, Erban A, de Koning S, Dunn WB, Luedemann A, et al. (2009)
Inter-laboratory reproducibility of fast gas chromatography-electron impact-time of flight mass spectrometry (GC-EI-TOF/MS) based plant metabolomics.
Metabolomics 5: 479–496.52. Szymanski J, Jozefczuk S, Nikoloski Z, Selbig J, Nikiforova V, et al. (2009)
Stability of metabolic correlations under changing environmental conditions inEscherichia coli - a systems approach. PLoS One 4: e7441. doi:10.1371/
journal.pone.0007441.
Comparative Genomics of Salt Stress in Legumes
PLoS ONE | www.plosone.org 11 February 2011 | Volume 6 | Issue 2 | e17094