Functional connectivity and coactivation of the nucleus accumbens: a combined functional...
14
Functional Connectivity and Coactivation of the Nucleus Accumbens: A Combined Functional Connectivity and Structure-Based Meta-analysis Franco Cauda 1,2 , Andrea E. Cavanna 3,4 , Federico Dʼagata 1,2,5 , Katiuscia Sacco 1,2 , Sergio Duca 1 , and Giuliano C. Geminiani 1,2 Abstract ■ This article investigates the functional connectivity patterns of the nucleus accumbens (NAcc) in 18 healthy participants using a resting state functional connectivity (rsFC) protocol. Also, a meta-analytic connectivity modeling (MACM) was used to char- acterize patterns of functional coactivations involving NAcc: The results of a structure-based meta-analyses of 57 fMRI and PET stud- ies were submitted to activation likelihood estimation analysis to estimate consistent activation patterns across the different im- aging studies. The results of the combined rsFC and MACM ana- lyses show that spontaneous activity in NAcc predicts activity in regions implicated in reward circuitries, including orbitomedial prefrontal cortex, globus pallidus, thalamus, midbrain, amygdala, and insula. This confirms the key role of NAcc in the mesocorti- colimbic system, which integrates inputs from limbic and cortical regions. We also detected activity in brain regions having few or no direct anatomical connections with NAcc, such as sensori- motor cortex, cerebellum, medial and posterior parietal cortex, and medial/inferior temporal cortex, supporting the view that not all functional connections can be explained by anatomical connections but can also result from connections mediated by third areas. Our rsFC findings are in line with the results of the structure-based meta-analysis: MACM maps are superimpos- able with NAcc rsFC results, and the reward paradigm class is the one that most frequently generates activation in NAcc. Our results overlap considerably with recently proposed schemata of the main neuron systems in the limbic forebrain and in the anterior part of the limbic midbrain in rodents and nonhuman primates. ■ INTRODUCTION The nucleus accumbens (NAcc) is increasingly recognized as a pivotal center within brain systems regulating moti- vation and reward. NAcc is located at the conjunction be- tween the head of the caudate and the anterior portion of the putamen, laterally to the septum pellucidum (Groenewegen, Wright, Beijer, & Voorn, 1999; Groenewegen, Wright, & Beijer, 1996; Heimer, Zahm, & Alheid, 1995); together with the olfactory tubercle, NAcc forms the ventral striatum, a crit- ical element of the mesocorticolimbic system (Heimer & Wilson, 1995). Although NAcc is traditionally described as a collection of neuronal ensembles with different functional and behav- ioral connotations within the BG (Pennartz, Groenewegen, & Lopes da Silva, 1994), it is widely accepted that there are two major functional components, the core and the shell, which are characterized by specific input and output chan- nels (Surmeier, Ding, Day, Wang, & Shen, 2007). Some of the main afferent projections to NAcc are from the cortex, more specifically from the orbitomedial prefrontal cortex (OMPFC), that is, Brodmannʼs areas 11, 13, 24, 25, and 32 (Haber & McFarland, 1999). OMPFC inputs to NAcc are massive and represent the defining feature of separate functional circuits (Goldman-Rakic & Selemon, 1986) involving OFC, ACC (Parkinson, Willoughby, Robbins, & Everitt, 2000), and medial prefrontal cortex (MPFC) (Carmichael & Price, 1994). It has been proposed that OMPFC–NAcc pathways play a key role in the develop- ment of reward-guided behaviors by linking reward expe- riences with their motivational and emotional features (Cummings, 1995). NAcc is also interconnected with several subcortical structures, namely hippocampal region, midline, medial parafascicular, medial dorsal (MDN) and intralaminar tha- lamic nuclei, ventral pallidum, dopaminergic ventral tegmen- tal and retrorubral cell groups, basal amygdaloid complex, dorsal and medial raphe nucleus, and noradrenergic cell group in the nucleus of the solitary tract (Morgane, Galler, & Mokler, 2005; Groenewegen et al., 1996, 1999; Brog, Salyapongse, Deutch, & Zahm, 1993). Of note, the projec- tions of these structures are not restricted to NAcc but ex- tend to the olfactory tubercle, caudate, putamen, and more caudal ventral striatal areas. Therefore, NAcc integrates the limbic and cortical inputs and projects to other BG nuclei, which send feedback projections into the prefrontal cortex 1 Koelliker Hospital, Turin, Italy, 2 University of Turin, 3 University College London, 4 University of Birmingham and BSMHFT, 5 AOU San Giovanni Battista, Turin, Italy © 2011 Massachusetts Institute of Technology Journal of Cognitive Neuroscience 23:10, pp. 2864–2877
Transcript of Functional connectivity and coactivation of the nucleus accumbens: a combined functional...

Functional Connectivity and Coactivation of the NucleusAccumbens: A Combined Functional Connectivity
and Structure-Based Meta-analysis
Franco Cauda1,2, Andrea E. Cavanna3,4, Federico Dʼagata1,2,5,Katiuscia Sacco1,2, Sergio Duca1, and Giuliano C. Geminiani1,2
Abstract
■ This article investigates the functional connectivity patternsof the nucleus accumbens (NAcc) in 18 healthy participantsusing a resting state functional connectivity (rsFC) protocol. Also,a meta-analytic connectivity modeling (MACM) was used to char-acterize patterns of functional coactivations involving NAcc: Theresults of a structure-basedmeta-analyses of 57 fMRI and PET stud-ies were submitted to activation likelihood estimation analysis toestimate consistent activation patterns across the different im-aging studies. The results of the combined rsFC and MACM ana-lyses show that spontaneous activity in NAcc predicts activity inregions implicated in reward circuitries, including orbitomedialprefrontal cortex, globus pallidus, thalamus, midbrain, amygdala,and insula. This confirms the key role of NAcc in the mesocorti-colimbic system, which integrates inputs from limbic and cortical
regions. We also detected activity in brain regions having fewor no direct anatomical connections with NAcc, such as sensori-motor cortex, cerebellum, medial and posterior parietal cortex,and medial/inferior temporal cortex, supporting the view thatnot all functional connections can be explained by anatomicalconnections but can also result from connections mediated bythird areas. Our rsFC findings are in line with the results of thestructure-based meta-analysis: MACM maps are superimpos-able with NAcc rsFC results, and the reward paradigm class isthe one that most frequently generates activation in NAcc. Ourresults overlap considerably with recently proposed schemataof the main neuron systems in the limbic forebrain and in theanterior part of the limbic midbrain in rodents and nonhumanprimates. ■
INTRODUCTION
The nucleus accumbens (NAcc) is increasingly recognizedas a pivotal center within brain systems regulating moti-vation and reward. NAcc is located at the conjunction be-tween theheadof the caudate and the anterior portionof theputamen, laterally to the septumpellucidum (Groenewegen,Wright, Beijer, & Voorn, 1999; Groenewegen, Wright, &Beijer, 1996; Heimer, Zahm, & Alheid, 1995); together withthe olfactory tubercle, NAcc forms the ventral striatum, a crit-ical element of the mesocorticolimbic system (Heimer &Wilson, 1995).
Although NAcc is traditionally described as a collection ofneuronal ensembles with different functional and behav-ioral connotations within the BG (Pennartz, Groenewegen,& Lopes da Silva, 1994), it is widely accepted that there aretwo major functional components, the core and the shell,which are characterized by specific input and output chan-nels (Surmeier, Ding, Day, Wang, & Shen, 2007).
Some of the main afferent projections to NAcc arefrom the cortex, more specifically from the orbitomedial
prefrontal cortex (OMPFC), that is, Brodmannʼs areas 11,13, 24, 25, and 32 (Haber & McFarland, 1999). OMPFCinputs to NAcc are massive and represent the definingfeature of separate functional circuits (Goldman-Rakic &Selemon, 1986) involvingOFC, ACC (Parkinson,Willoughby,Robbins, & Everitt, 2000), and medial prefrontal cortex(MPFC) (Carmichael & Price, 1994). It has been proposedthat OMPFC–NAcc pathways play a key role in the develop-ment of reward-guided behaviors by linking reward expe-riences with their motivational and emotional features(Cummings, 1995).NAcc is also interconnected with several subcortical
structures, namely hippocampal region, midline, medialparafascicular, medial dorsal (MDN) and intralaminar tha-lamic nuclei, ventral pallidum, dopaminergic ventral tegmen-tal and retrorubral cell groups, basal amygdaloid complex,dorsal and medial raphe nucleus, and noradrenergic cellgroup in the nucleus of the solitary tract (Morgane, Galler,& Mokler, 2005; Groenewegen et al., 1996, 1999; Brog,Salyapongse, Deutch, & Zahm, 1993). Of note, the projec-tions of these structures are not restricted to NAcc but ex-tend to the olfactory tubercle, caudate, putamen, andmorecaudal ventral striatal areas. Therefore, NAcc integrates thelimbic and cortical inputs and projects to other BG nuclei,which send feedback projections into the prefrontal cortex
1Koelliker Hospital, Turin, Italy, 2University of Turin, 3UniversityCollege London, 4University of Birmingham and BSMHFT,5AOU San Giovanni Battista, Turin, Italy
© 2011 Massachusetts Institute of Technology Journal of Cognitive Neuroscience 23:10, pp. 2864–2877

via theMDN (Zahm, 1998; OʼDonnell, Lavin, Enquist, Grace,& Card, 1997).The connectivity pattern of NAcc provides support to
the traditional hypothesis that NAcc constitutes the neuralsubstrate for limbic–motor interactions (Mogenson, Jones,& Yim, 1980). More recently, neurochemical studies havesuggested that NAcc plays a prominent role in the rewardand motivation process via dopaminergic innervation(Knutson & Cooper, 2005; Glimcher & Rustichini, 2004;McClure, York, & Montague, 2004; Schultz, 2004). Currentresearch on the behavioral correlates of NAcc focuses onthe role of themesolimbic dopamine system in reward andreinforcement (Wise, Bauco, Carlezon, & Trojniar, 1992)and, to a lesser extent, in response selection and intensi-fication processes (Redgrave, Prescott, & Gurney, 1999;Salamone, Cousins, & Snyder, 1997; Robbins & Everitt,1992) or arousing and preparatory effects of reinforcers(Robbins & Everitt, 1992; Taylor & Robbins, 1984; Koob,Riley, Smith, & Robbins, 1978).NAcc has been found to be recruited in multiple forms of
positive (Burgdorf&Panksepp, 2006) andnegative (Carretie,Albert, Lopez-Martin, & Tapia, 2009) affective states; like-wise, functional neuroimaging studies have found activityin the human accumbens following both rewarding (Mobbs,Greicius, Abdel-Azim, Menon, & Reiss, 2003; Aharon et al.,2001) and aversive stimuli (Gottfried, OʼDoherty, & Dolan,2002; Becerra, Breiter, Wise, Gonzalez, & Borsook, 2001).Moreover, several differential functions within each com-ponent of NAcc have been reported in animal studies(McFarland, Lapish, & Kalivas, 2003; Grill & Coghill, 2002;Zahm, 1999), albeit not in humans. Finally, disturbances atthe level of NAcc have been implicated in drug abuse andschizophrenia, in addition to affective disorders (Kienast &Heinz, 2006; Totterdell, 2006).Despite clear-cut clinical relevance, our knowledge of
NAcc connectivity is mainly based on experimental studiesusing tractographic techniques in animals (Haber, Kim,Mailly, & Calzavara, 2006; Middleton & Strick, 1994, 2002;Ferry, Ongur, An, & Price, 2000; Haber, Fudge, &McFarland,2000; Cavada &Goldman-Rakic, 1991; Selemon&Goldman-Rakic, 1985). The literature in humans has flourished onlyrecently, with 2 diffusion tensor imaging (DTI) studies (Leh,Ptito, Chakravarty, & Strafella, 2007; Lehericy et al., 2004),one on fMRI resting state functional connectivity (rsFC)(Di Martino et al., 2008) and one on meta-analysis of coac-tivation patterns, from 126 fMRI and PET studies (Postuma&Dagher, 2006).However, the primary goal of these studieswas the investigation of BG functional subdivisions and con-nectivity patterns; none of them was specifically targeted atNAcc. Thus, we set out to investigate the connectivity pat-tern of NAcc in 18 healthy volunteers by using an rsFC pro-tocol and comparing our findings with a structure-basedmeta-analysis (Laird, Eickhoff, Kurth, et al., 2009) of 59 fMRIand PET studies.rsFC (Fox & Raichle, 2007; Margulies et al., 2007; Vincent
et al., 2007; Damoiseaux et al., 2006; Fox et al., 2005;Greicius, Krasnow, Reiss, & Menon, 2003; Hampson,
Peterson, Skudlarski, Gatenby, & Gore, 2002) is a recentlydeveloped technique that allows in vivo assessment ofbrain networks by detecting coherent patterns of spon-taneous activity in the resting brain. It has been shownthat correlations in slowly fluctuating spontaneous brainactivity tend to reflect intrinsic functional networks. Rest-ing state networks (RSNs) are localized in the gray matterand are likely related to ongoing neuronal activity, asdemonstrated by aliasing of cardiac and respiratory cycles(De Luca, Beckmann, De Stefano, Matthews, & Smith,2006).Moreover, RSNs are characterizedby changes inBOLDsignals that are comparable with task-related changes (i.e.,up to 3%) and are consistent across individuals and stableacross repeated measurements (Damoiseaux et al., 2006).
Structure-based meta-analyses focus on specific anatom-ical regions and address global coactivation patterns acrossa diverse range of tasks and experimental designs. The con-sistency of coactivation patterns across experiments is inter-preted as a piece of evidence for the functional connectionof groups of regions; this type of functional connectivity hasalso been indicated asmeta-analytic connectivitymodeling(MACM) (Robinson, Laird, Glahn, Lovallo, & Fox, 2009). Infact, two recent meta-analysis studies (Smith et al., 2009;Toro, Fox, & Paus, 2008) demonstrated that the set of ma-jor covarying activation networks identified from large-scale meta-analyses overlaps almost completely with theset of networks that are visualized in the resting brain.These results provide strong evidence that RSNs reflectfunctional neural networks and that these dynamic net-works are engaged even at rest (Fox & Raichle, 2007).Therefore, similar to previous studies (Toro et al., 2008;Postuma & Dagher, 2006; Lancaster, Laird, Fox, Glahn, &Fox, 2005; Koski & Paus, 2000), we used MACM (Laird,Eickhoff, Kurth, et al., 2009) to characterize patterns offunctional coactivations in the human brain and comparedthe emerging patterns with the results of our rsFC analysisto validate each other.
METHODS
Subjects
Eighteen right-handed healthy volunteers (nine women;mean age = 51.2 years, SD = 19.2 years), free of neuro-logical or psychiatric disorders, not taking medicationsknown to alter brain activity, and with no history of drugor alcohol abuse, participated in the study.Written informedconsent was obtained from each subject, in accordance withthe Declaration of Helsinki; the study was approved by ourinstitutional committee on ethical use of human subjects.The fMRI study was performed at the Ospedale Koellikerin Turin.
Task and Image Acquisition
Subjects were instructed to simply keep their eyes closed,to think of nothing in particular, and not to fall asleep.
Cauda et al. 2865

After the scanning session, participants were asked if theyhad fallen asleep during the scan, and data from subjectswith positive or doubtful answers were excluded from thestudy.
Images were gathered on a 1.5-Tesla INTERA scanner(Philips Medical Systems, Andover, MA) with a SENSE high-field, high-resolution (MRIDC) head coil optimized forfunctional imaging. Resting state functional T2*-weightedimageswere acquired using EPI sequences, with a repetitiontime of 2000 msec, an echo time of 50 msec, and a 90° flipangle. The acquisition matrix was 64 × 64, with a 200-mmfield of view. A total of 200 volumeswere acquired,with eachvolume consisting of 19 axial slices parallel to the anterior–posterior (AC–PC) commissure; slice thickness was 4.5 mmwith a 0.5-mm gap. To reach a steady-state magnetizationbefore acquiring the experimental data, two scans wereadded at the beginning of functional scanning: The datafrom these scans were discarded.
Within a single session for each participant, a set ofthree-dimensional high-resolution T1-weighted structuralimages was acquired, using a fast field echo sequence, witha repetition time of 25 msec, an ultrashort echo time, anda 30° flip angle. The acquisition matrix was 256 × 256; thefield of view was 256 mm. The set consisted of 160 con-tiguous sagittal images covering the whole brain. In-planeresolution was 1 × 1 mm, and slice thickness was 1 mm(1 × 1 × 1 mm3 voxels).
Selection of NAcc ROIs
For rsFC analysis, two bilateral anatomical ROIs were drawnaccording to the AFNI brain structure atlas (afni.nimh.nih.gov/afni/doc/misc/afni_ttatlas/ ). Themean ROI volume was143 mm3 (see Figure 1).
For MACM analysis, we used rectangular ROIs, becauseBrainMapdoes not currently allow todraw anatomical ROIs.Therefore, two rectangular ROIs were drawn bilaterally ac-cording to the TalairachDaemonDatabase (Lancaster et al.,2000) around the following coordinates: left, X=−10 Y=8Z = −8; right, X = 12 Y = 7 Z = −8 (see Figures 1 and2). ROIs for activation likelihood estimation (ALE) meta-analysis were bigger than the rsFC ROIs to account forthe nonanatomical ROI shape and the mean “between-template variance” introduced by different normalizationstrategies between different studies (Eickhoff et al., 2009).Theboundaries for the right ROIwere (8, 4,−12) to (16, 14,−5); the boundaries for the left ROI were (−15, 5,−12) to(−7, 13, −5).
DATA ANALYSIS
BOLD imaging data were analyzed using BrainVoyager QXsoftware (Brain Innovation, Maastricht, Holland); an in-house developed Matlab Script has been used to createmasks (see Supplementary Data for a description). Func-tional images were preprocessed as follows to reduce ar-tifacts (Miezin, Maccotta, Ollinger, Petersen, & Buckner,2000): (i) slice scan time correction was performed usinga sinc interpolation algorithm; (ii) 3-D motion correctionwas applied: using a trilinear interpolation algorithm, allvolumes were spatially aligned to the first volume by rigidbody transformations and the rototranslation informationwas saved for subsequent elaborations; (iii) spatial smooth-ingwas performed using aGaussian kernel of 8mmFWHM;(iv) temporal filtering (linear trend removals) and a bandpass filter of 0.01–0.08 Hz was used (as described in Greiciuset al., 2003; Biswal, Yetkin, Haughton, & Hyde, 1995), as ithas been shown that the 0.01- to 0.08-Hz frequency range
Figure 1. Spatial distributionof the ROI used as seed regionsfor rsFC analyses. AnatomicalROIs for functional connectivitywere drawn according with theAFNI data collection. ROIs forALE meta-analysis were drawnusing the subsequent limits: leftNAcc, −15, 5, −12 to −7, 13,−5; right NAcc, 8, 4, −12 to 16,14, −5.
2866 Journal of Cognitive Neuroscience Volume 23, Number 10
had the greatest power in revealing the underlying con-nectivity (Greicius, Supekar, Menon, & Dougherty, 2009;Hagmann et al., 2008; Vincent et al., 2007; Achard, Salvador,Whitcher, Suckling, & Bullmore, 2006; Fransson, 2006;Biswal et al., 1995).Preprocessingwas followedby a series of steps to facilitate
accurate anatomical localization of brain activity and inter-subject averaging. For each subject, the slice-based func-tional scan was coregistered with the 3-D high-resolutionstructural scan, and the 4-D data set was transformed intoTalairach space (Talairach & Tournoux, 1988).The first step to perform all FC analyses was to extract
BOLD time courses from each ROI (defined as describedabove) by averaging over voxels within each region. Severalnuisance covariates were included in our analyses to controlfor the effects of physiological processes (such as fluctua-tions related to cardiac and respiratory cycles) (Bandettini &Bullmore, 2008; Birn, Murphy, & Bandettini, 2008; Napadowet al., 2008) andmotion. Specifically, we included nine addi-tional covariates that modeled nuisance signals from whitematter, global signal (Fox, Zhang, Snyder, & Raichle, 2009),and CSF, as well as six motion parameters.All seed-based predictors were z-normalized; tempo-
ral autocorrelation correction (Woolrich, Ripley, Brady, &Smith, 2001) was used. Seed ROI-driven FC maps werecomputed on a voxel-wise basis for each previously se-lected region. The individual participant multiple regres-sion analysis was carried out using the general linear model(Friston, Ashburner, Kiebel, Nichols, & Penny, 2007) andresulted in a t-based map (SPMt) FDR corrected for mul-tiple comparisons (Genovese, Lazar, & Nichols, 2002;Benjamini & Hochberg, 1995) (q< 0.05, cluster thresholdK > 10 voxels in the native resolution).
Group Statistical Map
Random effect group level analyses, controlling for age andgender effects, were conducted using the BrainVoyager QXANCOVAmodule [ p< .05 FDR corrected (Genovese et al.,
2002; Benjamini & Hochberg, 1995), cluster thresholdK > 10 voxels in the native resolution].
To evaluate the spatial consistency of functional connec-tivity patterns across subjects, we computed spatial prob-abilistic maps. The probability map describes the relativefrequency (expressed in percentage) wherein the samenetwork is represented over different brain areas.
To achieve maximum precision in the location descrip-tion, we developed a Matlab script (see SupplementaryData) that, in case of large blobs, splits the activation in dif-ferent BAs and Gyri that compose the original blob. Whenthe script finds a voxel that does not match the BA maskor the Gyral mask (e.g., white matter voxels), this voxel islabeled as “Out of Gyrus.”
Reliability Test
To evaluate the spatial consistency of functional connec-tivity patterns across subjects, we computed the split halfreliability index: We calculated the reliability coefficientwith the Spearman–Brown (Brown, 1910; Spearman, 1910)formula, rsb ¼ 2rh
1þrh, wherein the term rh, in our case, is the
spatial similarity of the maps obtained by two random se-lected, equally numerous subgroups. The rh term is amea-sure of the intersection of two fuzzy sets, the Sørensenindex (Sorensen, 1948), defined as: QS ¼ 2C
AþB, wherein Aand B are the elements in sample A and B, respectively,and C is the number of elements shared by the two sam-ples (this is equivalent to Dice metric).
Structure-Based Meta-analysis
We followed the workflow indicated by Laird, Eickhoff,Kurth, et al. (2009) for the structure-based meta-analyses,also indicated as MACM (Laird, Eickhoff, Li, et al., 2009;Robinson et al., 2009): (i) we extracted from the BrainMapdatabase (Laird, Lancaster, & Fox, 2005) all the studies in-volving only normal subjects that reported an activation in
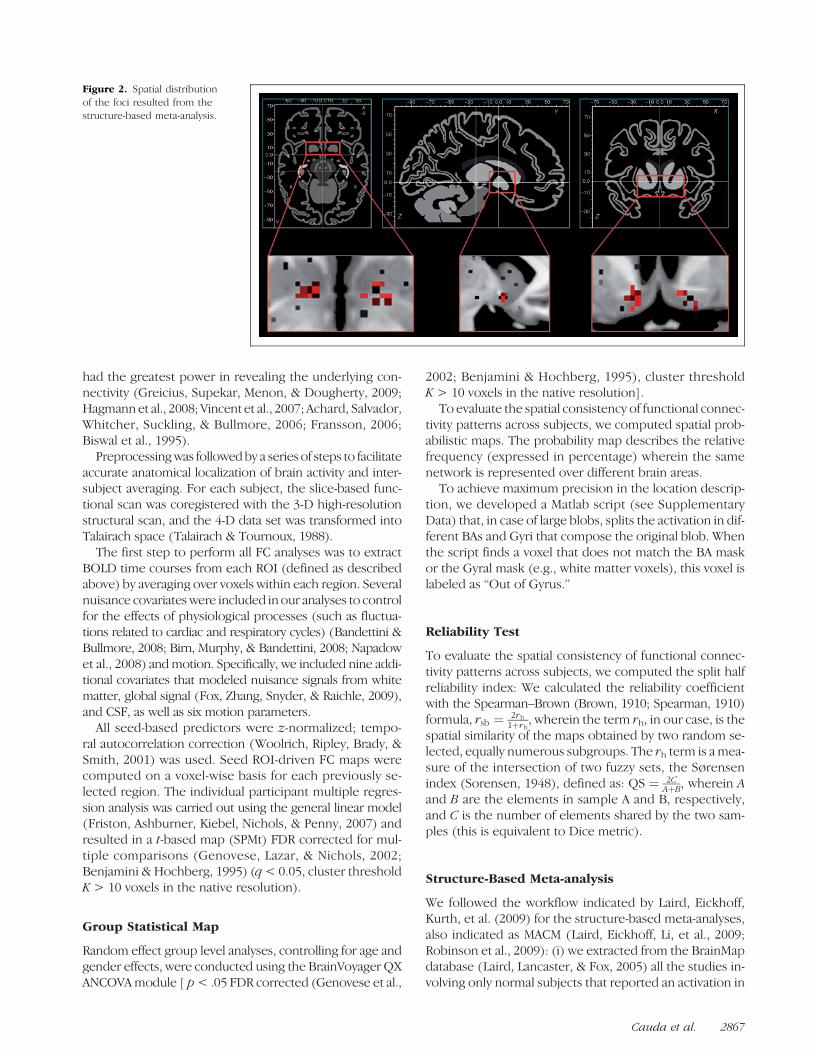
Figure 2. Spatial distributionof the foci resulted from thestructure-based meta-analysis.
Cauda et al. 2867

at least one of the two NAcc ROIs previously described, ir-respective of class or behavioral paradigm that had gener-ated that activation. The specific query was [Diagnosis =Normals] AND [ROIs = “left accumben”, (−15, 5,−12) to(−7, 13,−5) OR “right accumbens”, (8, 4,−12) to (16, 14,−5)] and yielded a total of 42 articles (see SupplementaryTable 1) corresponding to 57 experiments, leading to atotal of 762 foci (see Figure 2).
BrainMap (Laird et al., 2005) is a database of publishedfunctional neuroimaging studies (mainly PET and fMRI)that contains both metadata descriptions of experimentaldesign and activation locations in the form of stereotacticcoordinates. BrainMap contains 1843 neuroimaging publi-cations that describe analyses from 8618 experimental con-trasts using 81 unique paradigm classes, yielding 69,681locations (November 22, 2009).
Activation Likelihood Estimation
An ALE meta-analysis (Laird et al., 2005; Turkeltaub, Eden,Jones, & Zeffiro, 2002) was performed on the sets of coor-dinates identified as coactivated during each ROI acti-vation. Regions of convergence were calculated usingGingerAle 2.0.
The ALE analysis is a quantitative method that can beused to estimate consistent activation across different imag-ing studies (Laird, Eickhoff, Kurth, et al., 2009). ALE mapsof coactivations are derived based on patterns of foci of in-terest, where multiple studies have reported statisticallysignificant peak activation. To limit the intersubject andinterlaboratory variability, we used an algorithm that esti-mates the spatial uncertainty of each focus, taking into ac-count the possible differences among the neuroimagingstudies (Eickhoff et al., 2009). This algorithm was preferredto a prespecified FWHM as in the original ALE approach.The advantage of such an algorithm is that it limits themeta-analysis to an anatomically constrained space speci-fied by a gray matter task. Furthermore, it comprises amethod to calculate the above-chance clustering betweenexperiments (i.e., random effects analysis) rather than be-tween foci (fixed effects analysis; Eickhoff et al., 2009).
The original studies contributing these foci for eachdomain are presented in Supplementary Table 5.
Paradigm Class Profiles
Aside from MACM, we were interested in examining whatmental processes are underpinned by the activation ofour ROI. In BrainMap, metadata are organized under threeexperiment level fields: context, paradigm class, and be-havioral domain. The “context” represents the purposefor which an experiment was designed. Possible contextsinclude normal mapping, age effects, disease effects, etc.The “paradigm class” is the experimental task isolated bythe contrast. For a given experiment, multiple paradigmclasses may apply. Paradigm classes include, among others,action observation, episodic recall, task switching, etc. A
complete list of BrainMapʼs paradigm domains can be ac-cessed at brainmap.org/scribe/.
RESULTS
Both rsFC and MACM techniques revealed a pool of areasthat were connected to NAcc: these included putamen,caudate head, anterior and posterior cingulate, subcallosalgyrus, thalamus (MDNnucleus), medial frontal gyrus, amyg-dala, inferior parietal lobule, insula, caudate body, globuspallidus, parahippocampal gyrus, inferior frontal gyrus,culmen, precuneus, and cerebellum (Figures 3–6).In addition, the rsFC analysis showed functional connec-
tions with the middle temporal gyrus, superior frontalgyrus, superior temporal gyrus, middle frontal gyrus, infe-rior temporal gyrus, supramarginal gyrus, fusiform gyrus,hippocampus, precentral gyrus, angular gyrus, hypotalamus,and pulvinar. Finally, MACM identified connections withthe postcentral gyrus and the inferior occipital gyrus,which were missed by the rsFC technique (Figures 3–6).Overall, the two techniques generally converge, but rsFC
seems to have a better sensibility showing a richer pool ofconnected areas. It has to be considered that these two con-nectivity techniques are based on very different types ofdata: rsFC uses resting state scans, whereas MACM usesactivation paradigms (see Figures 3–5, Supplementary Fig-ures 1 and 2, and Supplementary Tables 1 and 2). A sum-mary image can be seen in Supplementary Figure 8.
Paradigm Class Profiles
The paradigm class profiles, whichmore frequently lead toan activation in NAcc, are the reward tasks. Error detec-tion, lexical decisions, and rest were all associated withweaker activations (see Supplementary Figure 6).
Lateralization
We repeated the FC analysis by usingmonolateral ROIs andby comparing the maps generated by right ROIs with themaps generated by left ROIs for both rsFC and MACM re-sults (two-sample t test, p< .05 FDR corrected, K> 10 vox-els in the native resolution). Lateralization analysis of thersFC findings evidenced that the right NAcc is more con-nected with uncus, subcallosal gyri, insulae, parahippocam-pal gyri, and cerebellum whereas the left NAcc is moreconnected with OMPFC, subgenual, temporal, medial pre-frontal, and posteromedial cortices (Figures 7 and 8, Sup-plementary Figures 3 and 4, and Supplementary Tables 3and 4). Lateralization analysis of theMACM findings showeda similar pattern of lateralization: The insular, thalamic,anterior cingulated, pontine, and cerebellar areas are moreright-lateralized, whereas the subgenual, motor/premotor,prefrontal, and occipital cortices are more left-lateralized(Figures 7 and 8, Supplementary Figures 3 and 4, and Sup-plementary Tables 3 and 4).
2868 Journal of Cognitive Neuroscience Volume 23, Number 10

We assessed possible differences in the paradigm classprofiles activating the left and right NAcc: The right NAccis more activated by emotional paradigms, whereas theleft NAcc is more activated by pain paradigms (see Sup-plementary Figure 7).
Reliability Indexes
The split-half test performed with the Spearman–Brownmethod between each ROI in the two split groups showsour results: rsb = 0.73.
Figure 3. NAcc resting stateconnectivity analysis. Onesample t test, FDR corrected:q < 0.05, cluster thresholdK > 10 voxels in the nativeresolution. Maps projected on amixed 2-D/3-D template withBrainvoyager QX 2.0.
Figure 4. NAcc MACMconnectivity analysis.Results from the activationlikelihood estimation (q < 0.05,K > 100 mm3). ALE mapsgenerated with GingerAle 2.0.Maps projected on a mixed2-D/3-D template withBrainvoyager QX 2.0.
Cauda et al. 2869

Figure 6. Qualitative differences between MACM and rsFC. The graph shows the areas where both rsFC and MACM show connections plusthe areas characterized by significant connections according to rsFC only or MACM only. Yellow area = only MACM; green area = only rsFC;red area = MACM and rsFC.
Figure 5. Quantitativedifferences between MACM andrsFC. The graph shows thequantitative difference inconnectivity between rsFC andMACM in the regions wherestrongest connectivity wasfound. Red line = MACM;blue line = rsFC.
2870 Journal of Cognitive Neuroscience Volume 23, Number 10

Probability maps computed for assessing the spatialconsistency and reproducibility of seed-generated mapsyielded a high level of overlap among specific ROI-relatedrsFC maps for each subject (Figure 8 and SupplementaryFigure S4).
DISCUSSION
To the best of our knowledge, this is the first study com-bining rsFC with MACM to investigate NAcc connectivity.We evaluated the functional network associated withNAcc activity by examining temporally correlated patternsof low-frequency spontaneous activity during rest in agroup of 18 right-handed healthy volunteers and MACMderived from the representative sample of the fMRI andPET literature present in the BrainMap database. Our find-ings are consistent with the results of both animal models(Postuma & Dagher, 2006; Morgane et al., 2005; Haber &McFarland, 1999) and DTI and fMRI investigations in hu-mans (Stoeckel et al., 2009; DiMartino et al., 2008; Postuma& Dagher, 2006; Knutson & Cooper, 2005; Becerra et al.,2001; Breiter & Rosen, 1999). Spontaneous activity in NAccpredicted activity in regions implicated in reward circuitries,including OMPFC, globus pallidus, thalamus, midbrain,amygdala, and insula. Furthermore, we detected activity
in brain regions that are described to have few or no directconnection with NAcc, such as sensorimotor cortex, cere-bellum, medial and posterior parietal cortex, and medial/inferior temporal cortex (Haber &McFarland, 1999). It hasbeen shown that functional connectivity patterns resultnot only from direct connections but also from connec-tions mediated by third areas, thus suggesting that notall functional connections can be explained by anatomicalconnections, although FC overlaps considerably with tracttracing analysis (Damoiseaux & Greicius, 2009). Conse-quently, our FC patterns give a representation of the brainregions working together with NAcc as a coordinate net-work and can be, in great part, explained by indirect con-nections (Damoiseaux & Greicius, 2009). For example,several areas directly connected with NAcc, such as insula(Cauda et al., 2011), dorsal striatum, and thalamus, arecharacterized by strong connections with sensorimotoras well as parietal and cerebellar cortices. These observa-tions are further validated by our MACM results, which es-sentially replicate the rsFC findings with the exception ofthe wider connectivity pattern with the fronto-temporalneocortex.
NAcc is a key element of the mesocorticolimbic system,which integrates inputs from limbic and cortical regions,linking motivation with action (Mogenson et al., 1980).Specifically, NAcc has a well-established role in mediating
Figure 7. NAcc resting stateconnectivity lateralization. Two-sample t test, FDR corrected:q < 0.05, cluster thresholdK > 10 voxels in the nativeresolution. Colors from red toyellow indicate a prevalent rightlateralization. Colors from blueto green indicate a prevalent leftlateralization. Maps projectedon a 2-D template withBrainvoyager QX 2.0.
Cauda et al. 2871

the rewarding effects of drug abuse and fundamental re-wards such as food and sexual behavior (Carlezon&Thomas,2009). Interestingly, our results overlap considerably withrecently proposed schemata of the principal neuron sys-tems in the limbic forebrain and in the anterior part ofthe limbic midbrain in rodents and nonhuman primates(Figure 4) (Morgane et al., 2005; de Olmos & Heimer,1999; Haber & McFarland, 1999). We found that NAcc pos-itively correlated with OMPFC, insulae, MDN, amygdalae,and hippocampi. Of these, OMPFC, insulae, and MDN areknown to be active during reward (Breiter & Rosen, 1999),whereas the strong interconnections between NAcc, amyg-dala (Cardinal, Parkinson, Hall, & Everitt, 2002), and hippo-campus (OʼDonnell & Grace, 1995) are well described inthe modified model of Lawrence, Sahakianb, and Robbins(1998) on corticostriatal circuits.
Our rsFC findings are further confirmed by the resultsof the structure-based meta-analysis: the reward paradigmclass most frequently generates activation in NAcc. TheALE maps of the meta-analytical connectivity modelingare similar to the rsFCmaps (Supplementary Table 5), thusconfirming the validity of the rsFC results. The fact that inthe midbrain we only found substantia nigra to be con-nected with NAcc can be explained by taking into accountthe relative low resolution of our method: Relatively smallstructures like ventral tegmental or dorsal raphe nucleuscan be too small to be detected. Likewise, the small mid-
line thalamic nuclei that are described as interconnectedwith NAcc (Haber & McFarland, 1999) might be underthe threshold of our resolution power; in fact, we detectedonly a significant cluster in the MDN nucleus, one of thelargest thalamic nuclei known to have strong connectionswith several regions in the prefrontal and limbic regions(Cauda et al., 2009; Zhang et al., 2008; Morgane et al., 2005;McFarland&Haber, 2002), including pallido-thalamic fibersbelonging to the ventral striatal or limbic loop (Alexander,DeLong, & Strick, 1986; Haber, Groenewegen, Grove, &Nauta, 1985).Our results are in agreement with most DTI, fMRI, and
meta-analytic (Di Martino et al., 2008; Postuma & Dagher,2006; Breiter & Rosen, 1999) studies in the literature.There are, however, a few differences. For example, ameta-analysis of 126 PET and fMRI studies by Postumaand Dagher (2006) failed to demonstrate connectionswithOFC and left insula, contrary to the present study and aprevious work (Di Martino et al., 2008). Although thismeta-analytic study is of great importance because it firstintroduced the structure-based meta-analysis technique,the use of different ROIs and statistical methods makesits findings only partially comparable with ours.There are also notable differences between our study
and Di Martino et al.ʼs (2008) analysis of the rsFC of thestriatum. Althoughmost of the findings show considerableoverlap, Di Martino et al. described the insulae to be more
Figure 8. NAcc MACMconnectivity lateralization.Colors from red to yellowindicate a prevalent rightlateralization. Colors from blueto green indicate a prevalent leftlateralization. Maps projectedon a 2-D template withBrainvoyager QX 2.0.
2872 Journal of Cognitive Neuroscience Volume 23, Number 10

strongly connected with dorsal striatal ROIs and a numberof deactivations that we failed to find; interestingly, someof those deactivations are in areas where we found smallbut significant positive activations, such as the sensorimotorcortex. The IC has been described by Chikama, McFarland,Amaral, and Haber (1997) to have somatotopic anatomicconnections with the striatum, wherein the dorsal poste-rior insula projects to the dorsal putamen whereas themore anterior and ventral insula projects to the caudatenucleus and ventral striatum. These differences are likelyto be related to ROIs placed in slightly different positionsand multiple regression analyses performed with all thepredictors orthogonalized.The striatum is known to have a ventral-to-dorsal gra-
dient via circuits that spiral from emotional/motivationalto decision making and executive motor control (Haber,2003; Haber et al., 2000). Because of partial volume effectsand smoothing, our ROI time courses may be affected by asmall but significant residual sampling of more dorsal (i.e.,executive/motor) striatal region time courses. However,this bias should also affect MACM, because the results ofthe former are superimposable to rsFC results. This is re-markable, given the independent nature of these two anal-yses on fundamentally different types of data as well as theheterogeneity of data contained in BrainMap due to differ-ences in subjects, scanners, analyses, and paradigms.Therefore, the overall convergence of rsFC and MACM re-sults supports the validity of our functional connectivitymap.Interestingly, in our analysis, the right ROI and the left
ROI generated a different pattern of connectivity, suggest-ing that the right NAcc is more connected with uncus, sub-callosal gyri, insulae, and parahippocampal gyri, whereasthe left NAcc is more connected with OFC, temporal gyri,and PMC. This difference in functional connectivity is con-sistent with the lateralization pattern emerging from studieswith subjects suffering from affective disorders. Converg-ing evidence from neuroimaging, neuropathological andlesion analysis studies revealed predominant involvementof the left MPFC, subgenual ACC, and related limbic andstriato-pallido-thalamic structures in regulating emotionalexpression in cases with recurrent depressive episodes(Drevets, Price, & Furey, 2008; Drevets, Savitz, & Trimble,2008).Resting state functional connectivity analysis has a num-
ber of limitations that merit consideration. First, it hasbeen shown that functional connectivity can change dur-ing task performance (Fransson, 2006; De Luca, Smith,De Stefano, Federico, & Matthews, 2005). Second, restingstate analysis faces the same potential limitations as task-related fMRI studies with regard to interindividual varia-bility in ventral striatum organization and connectivity.However, the patterns of functional differentiation ob-served using our seeding approach were reliable anddetectable at the individual participant level. Third, oursubjects were distributed over a wide age span; however,we attempted to take into account the intersubject varia-
bility using a random effect analysis and to reduce thevariability induced by age and gender differences by con-trolling these factors, inserting age and gender as covari-ates in the statistics. Furthermore, the interpretation ofour findings needs caution, because the networks de-scribed here are detected in the absence of specific func-tional activity. We are inferring functional roles for theventral striatal areas on the basis of their belonging to in-trinsic connectivity networks, whose functional relevanceis reasonably well established in the literature. Althoughthe exact functional significance of temporal correlationsin very low frequency neural fluctuations remains largely un-clear, it has been argued that this basal, task-independent,intrinsic connectivity is important to avoid disuse-relatedpruning of critical synapses (Luo & OʼLeary, 2005) and/orto maintain networks in a primed state, thus improving re-sponse efficiency (Fox & Raichle, 2007). MACM also has lim-itations. A major limitation of MACM is that this techniqueidentifies regions that tend to be coactivated when NAcc isactivated in the absence of a control group. This means thatsome coactivations might be attributable to common taskrequirements or mental states beyond reward processingrather than functional connectivity per se.
A recent fMRI study investigated both regional and in-terregional functional connectivity patterns while subjectsperformed a gambling task featuring unexpectedly highmonetary gains and losses (Camara, Rodriguez-Fornells,& Munte, 2008). The authors found that monetary gainsand losses activated a similar fronto-striato-limbic network,in whichmain activation peaks were observed bilaterally inthe ventral striatum.Our resting state connectivity findingsprovide confirmation to the role of NAcc as a seat formajor“hedonic hotspots” in the widespread pleasure-activatedbrain networks in humans (Kringelbach & Berridge, 2009).Such hedonic hotspots are anatomically distributed (NAccshell and ventral pallidum, other forebrain and limbic cor-tical regions, and deep brainstem regions including theparabrachial nucleus in the pons) but interact to form afunctional integrated circuit, which is sensitive to stimula-tion with opioids, endocannabinoids, and other neuro-chemical modulators. From a clinical perspective, theidentification of this network is essential to the understand-ing of the brainmechanisms underlying reward experiencesand neuropsychiatric conditions such as addiction, impulsecontrol disorders, and obsessive compulsive spectrum disor-ders, in addition to disorders of affect (Camara, Rodriguez-Fornells, Ye, & Münte, 2009). Therefore, our results stressthe importance of studying functional connectivity in addi-tion to standard fMRI analysis in reward-related studies in awide range of neuropsychiatric conditions. Finally, becausean assortment of human behaviors is thought to be drivenby reward-based processes, including novelty seeking, deci-sion making, economic choice, reinforcement learning, andincentivemotivation, future researchwill be able to show theexact contribution of the NAcc system in the different be-havioral contexts to describe both physiological and patho-logical reward mechanisms more appropriately.
Cauda et al. 2873

Methodological Considerations
Movement was assessed by summing the deviations usedto compensate for head motion within the fMRI scanner.The overall quantity of movement was very mild; further-more, we failed to find a correlation between movementand the age of the subject. Hence, we excluded any influ-ence by these confounds.
In the meta-analysis, a possible confound is generatedfrom the fact that different groupsused slightly different tem-plates to transform each subjectʼs MRI or PET image intostereotaxic space. The use of different template brainswouldresult in slight variation in localization of peaks. In particular,depending on the applied normalization procedure, thebetween-subject variances ranged from 11.0 to 12.1 mm(Eickhoff et al., 2009), hence the need of a slightly biggerROIs for the meta-analysis with the respect to the rsFC ROIs.
Our results show good reproducibility: The split half re-liability (rsb = 0.73) and the probabilistic maps (Figure 8)together with the good correspondence observed be-tween the resting state and meta-analytic results lead usto rule out the possibility that the patterns result merelyfrom random fluctuations or that they are due to uninten-tional tasks by the single subject. In addition, our resultsare in agreement with anatomical and functional data ob-tained in previous studies on nonhumans as well as humanprimates.
Acknowledgments
We thank all the subjects who participated in this study. Theresearch has been founded by Piedmont Region, Human andSocial Science 2008, GIRS project “The invisible grammar of so-cial relations.”
Reprint requests should be sent to Franco Cauda, Dipartimentodi Psicologia, Via Po 14, 10123 Turin, Italy, or via e-mail: [email protected].
REFERENCES
Achard, S., Salvador, R., Whitcher, B., Suckling, J., & Bullmore, E.(2006). A resilient, low-frequency, small-world human brainfunctional network with highly connected association corticalhubs. Journal of Neuroscience, 26, 63–72.
Aharon, I., Etcoff, N., Ariely, D., Chabris, C. F., OʼConnor, E., &Breiter, H. C. (2001). Beautiful faces have variable rewardvalue: fMRI and behavioral evidence. Neuron, 32, 537–551.
Alexander, G. E., DeLong, M. R., & Strick, P. L. (1986). Parallelorganization of functionally segregated circuits linking basalganglia and cortex. Annual Review of Neuroscience, 9, 357–381.
Bandettini, P. A., & Bullmore, E. (2008). Endogenousoscillations and networks in functional magnetic resonanceimaging. Human Brain Mapping, 29, 737–739.
Becerra, L., Breiter, H. C.,Wise, R., Gonzalez, R. G., & Borsook, D.(2001). Reward circuitry activation by noxious thermal stimuli.Neuron, 32, 927–946.
Benjamini, Y., & Hochberg, Y. (1995). Controlling the falsediscovery rate: A practical and powerful approach to multipletesting. Royal Statistical Society, Series B, 57, 289–300.
Birn, R. M., Murphy, K., & Bandettini, P. A. (2008). The effect ofrespiration variations on independent component analysis
results of resting state functional connectivity. Human BrainMapping, 29, 740–750.
Biswal, B., Yetkin, F. Z., Haughton, V. M., & Hyde, J. S. (1995).Functional connectivity in the motor cortex of resting humanbrain using echo-planar MRI. Magnetic Resonance inMedicine, 34, 537–541.
Breiter, H. C., & Rosen, B. R. (1999). Functional magneticresonance imaging of brain reward circuitry in thehuman. Annals of the New York Academy of Sciences,877, 523–547.
Brog, J. S., Salyapongse, A., Deutch, A. Y., & Zahm, D. S.(1993). The patterns of afferent innervation of the core andshell in the “accumbens” part of the rat ventral striatum:Immunohistochemical detection of retrogradely transportedfluoro-gold. Journal of Comparative Neurology, 338,255–278.
Brown, W. (1910). Some experimental results in the correlationof mental abilities. British Journal of Psychology, 3, 296–322.
Burgdorf, J., & Panksepp, J. (2006). The neurobiology ofpositive emotions. Neuroscience and BiobehavioralReviews, 30, 173–187.
Camara, E., Rodriguez-Fornells, A., & Munte, T. F. (2008).Functional connectivity of reward processing in the brain.Frontiers in Human Neuroscience, 2, 19.
Camara, E., Rodriguez-Fornells, A., Ye, Z., & Münte, T. F. (2009).Reward networks in the brain as captured by connectivitymeasures. Frontiers in Neuroscience, 3, 350–362.
Cardinal, R. N., Parkinson, J. A., Hall, J., & Everitt, B. J. (2002).Emotion and motivation: The role of the amygdala, ventralstriatum, and prefrontal cortex. Neuroscience andBiobehavioral Reviews, 26, 321–352.
Carlezon, W. A., Jr., & Thomas, M. J. (2009). Biologicalsubstrates of reward and aversion: A nucleus accumbensactivity hypothesis. Neuropharmacology, 56(Suppl. 1),122–132.
Carmichael, S. T., & Price, J. L. (1994). Architectonic subdivisionof the orbital and medial prefrontal cortex in themacaque monkey. Journal of Comparative Neurology,346, 366–402.
Carretie, L., Albert, J., Lopez-Martin, S., & Tapia, M. (2009).Negative brain: An integrative review on the neural processesactivated by unpleasant stimuli. International Journal ofPsychophysiology, 71, 57–63.
Cauda, F., DʼAgata, F., Sacco, K., Duca, S., Geminiani, G., &Vercelli, A. (2011). Functional connectivity of the insula in theresting brain. Neuroimage, 55, 8–23.
Cauda, F., Sacco, K., DʼAgata, F., Duca, S., Cocito, D.,Geminiani, G., et al. (2009). Low-frequency BOLDfluctuations demonstrate altered thalamocortical connectivityin diabetic neuropathic pain. BMC Neuroscience, 10, 138.
Cavada, C., & Goldman-Rakic, P. S. (1991). Topographicsegregation of corticostriatal projections from posteriorparietal subdivisions in the macaque monkey. Neuroscience,42, 683–696.
Chikama, M., McFarland, N. R., Amaral, D. G., & Haber, S. N.(1997). Insular cortical projections to functional regionsof the striatum correlate with cortical cytoarchitectonicorganization in the primate. Journal of Neuroscience,17, 9686–9705.
Cummings, J. L. (1995). Anatomic and behavioral aspects offrontal-subcortical circuits. Annals of the New York Academyof Sciences, 769, 1–13.
Damoiseaux, J. S., & Greicius, M. D. (2009). Greater than thesum of its parts: A review of studies combining structuralconnectivity and resting-state functional connectivity.Brain Structure & Function, 213, 525–533.
Damoiseaux, J. S., Rombouts, S. A., Barkhof, F., Scheltens, P.,Stam, C. J., Smith, S. M., et al. (2006). Consistent resting-state
2874 Journal of Cognitive Neuroscience Volume 23, Number 10

networks across healthy subjects. Proceedings of theNational Academy of Sciences, U.S.A., 103, 13848–13853.
De Luca, M., Beckmann, C. F., De Stefano, N., Matthews, P. M.,& Smith, S. M. (2006). fMRI resting state networks definedistinct modes of long-distance interactions in the humanbrain. Neuroimage, 29, 1359–1367.
De Luca, M., Smith, S., De Stefano, N., Federico, A., &Matthews, P. M. (2005). Blood oxygenation level dependentcontrast resting state networks are relevant to functionalactivity in the neocortical sensorimotor system.Experimental Brain Research, 167, 587–594.
de Olmos, J. S., & Heimer, L. (1999). The concepts of theventral striatopallidal system and extended amygdala.Annals of the New York Academy of Sciences, 877, 1–32.
Di Martino, A., Scheres, A., Margulies, D. S., Kelly, A. M., Uddin,L. Q., Shehzad, Z., et al. (2008). Functional connectivity ofhuman striatum: A resting state fMRI study. Cerebral Cortex,18, 2735–2747.
Drevets, W. C., Price, J. L., & Furey, M. L. (2008). Brainstructural and functional abnormalities in mood disorders:Implications for neurocircuitry models of depression. BrainStructure & Function, 213, 93–118.
Drevets, W. C., Savitz, J., & Trimble, M. (2008). The subgenualanterior cingulate cortex in mood disorders. CNS Spectrums,13, 663–681.
Eickhoff, S. B., Laird, A. R., Grefkes, C., Wang, L. E., Zilles, K.,& Fox, P. T. (2009). Coordinate-based activation likelihoodestimation meta-analysis of neuroimaging data: A random-effects approach based on empirical estimates of spatialuncertainty. Human Brain Mapping, 30, 2907–2926.
Ferry, A. T., Ongur, D., An, X., & Price, J. L. (2000).Prefrontal cortical projections to the striatum in macaquemonkeys: Evidence for an organization related toprefrontal networks. Journal of Comparative Neurology,425, 447–470.
Fox, M. D., & Raichle, M. E. (2007). Spontaneous fluctuations inbrain activity observed with functional magnetic resonanceimaging. Nature Reviews Neuroscience, 8, 700–711.
Fox, M. D., Snyder, A. Z., Vincent, J. L., Corbetta, M., Van Essen,D. C., & Raichle, M. E. (2005). The human brain is intrinsicallyorganized into dynamic, anticorrelated functional networks.Proceedings of the National Academy of Sciences, U.S.A.,102, 9673–9678.
Fox, M. D., Zhang, D., Snyder, A. Z., & Raichle, M. E. (2009).The global signal and observed anticorrelated restingstate brain networks. Journal of Neurophysiology, 101,3270–3283.
Fransson, P. (2006). How default is the default mode of brainfunction? Further evidence from intrinsic BOLD signalfluctuations. Neuropsychologia, 44, 2836–2845.
Friston, K. J., Ashburner, J., Kiebel, S. J., Nichols, T. E., & Penny,W. D. (Eds.). (2007). Statistical parametric mapping: Theanalysis of functional brain images. Philadelphia, PA:Academic Press.
Genovese, C. R., Lazar, N. A., & Nichols, T. (2002). Thresholdingof statistical maps in functional neuroimaging using thefalse discovery rate. Neuroimage, 15, 870–878.
Glimcher, P. W., & Rustichini, A. (2004). Neuroeconomics: Theconsilience of brain and decision. Science, 306, 447–452.
Goldman-Rakic, P. S., & Selemon, L. D. (1986). Topographyof corticostriatal projections in nonhuman primates andimplications for functional parcellation of the neo-striatum.In E. G. Jones & A. Peters (Eds.), Cerebral cortex ( Vol. 5,pp. 447–466). New York: Plenum Publishing Corp.
Gottfried, J. A., OʼDoherty, J., & Dolan, R. J. (2002). Appetitiveand aversive olfactory learning in humans studied usingevent-related functional magnetic resonance imaging.Journal of Neuroscience, 22, 10829–10837.
Greicius, M. D., Krasnow, B., Reiss, A. L., & Menon, V.(2003). Functional connectivity in the resting brain: Anetwork analysis of the default mode hypothesis.Proceedings of the National Academy of Sciences, U.S.A.,100, 253–258.
Greicius, M. D., Supekar, K., Menon, V., & Dougherty, R. F.(2009). Resting-state functional connectivity reflectsstructural connectivity in the default mode network. CerebralCortex, 19, 72–78.
Grill, J. D., & Coghill, R. C. (2002). Transient analgesia evokedby noxious stimulus offset. Journal of Neurophysiology,87, 2205–2208.
Groenewegen, H. J., Wright, C. I., & Beijer, A. V. (1996). Thenucleus accumbens: Gateway for limbic structures to reach themotor system? Progress in Brain Research, 107, 485–511.
Groenewegen, H. J., Wright, C. I., Beijer, A. V., & Voorn, P.(1999). Convergence and segregation of ventral striatal inputsand outputs. Annals of the New York Academy of Sciences,877, 49–63.
Haber, S. N. (2003). The primate basal ganglia: Parallel andintegrative networks. Journal of Chemical Neuroanatomy,26, 317–330.
Haber, S. N., Fudge, J. L., & McFarland, N. R. (2000).Striatonigrostriatal pathways in primates form an ascendingspiral from the shell to the dorsolateral striatum. Journalof Neuroscience, 20, 2369–2382.
Haber, S. N., Groenewegen, H. J., Grove, E. A., & Nauta, W. J.(1985). Efferent connections of the ventral pallidum:Evidence of a dual striato pallidofugal pathway. Journal ofComparative Neurology, 235, 322–335.
Haber, S. N., Kim, K. S., Mailly, P., & Calzavara, R. (2006).Reward-related cortical inputs define a large striatal region inprimates that interface with associative cortical connections,providing a substrate for incentive-based learning. Journalof Neuroscience, 26, 8368–8376.
Haber, S. N., & McFarland, N. R. (1999). The concept ofthe ventral striatum in nonhuman primates. Annals of theNew York Academy of Sciences, 877, 33–48.
Hagmann, P., Cammoun, L., Gigandet, X., Meuli, R., Honey, C. J.,Wedeen, V. J., et al. (2008). Mapping the structural core ofhuman cerebral cortex. PLoS Biology, 6, e159.
Hampson, M., Peterson, B. S., Skudlarski, P., Gatenby, J. C., &Gore, J. C. (2002). Detection of functional connectivity usingtemporal correlations in MR images. Human Brain Mapping,15, 247–262.
Heimer, L., & Wilson, R. D. (1995). The subcortical projectionsof the allocortex: Similarities in the neural associations ofthe hippocampus, the piriform cortex, and the neocortex.In M. Santini (Ed.), Golgi Centennial Symposium: Perspectivesin Neurobiology (pp. 177–193). New York: Raven Press.
Heimer, L., Zahm, D. S., & Alheid, G. F. (1995). Basal ganglia.In G. Paxinos (Ed.), The rat nervous system (2nd ed.,pp. 579–628). San Diego; London: Academic Press.
Kienast, T., & Heinz, A. (2006). Dopamine and the diseasedbrain. CNS & Neurological Disorders - Drug Targets,5, 109–131.
Knutson, B., & Cooper, J. C. (2005). Functional magneticresonance imaging of reward prediction. Current Opinionin Neurology, 18, 411–417.
Koob, G. F., Riley, S. J., Smith, S. C., & Robbins, T. W.(1978). Effects of 6-hydroxydopamine lesions of the nucleusaccumbens septi and olfactory tubercle on feeding, locomotoractivity, and amphetamine anorexia in the rat. Journal ofComparative & Physiological Psychology, 92, 917–927.
Koski, L., & Paus, T. (2000). Functional connectivity of theanterior cingulate cortex within the human frontal lobe: Abrain-mapping meta-analysis. Experimental Brain Research,133, 55–65.
Cauda et al. 2875

Kringelbach, M. L., & Berridge, K. C. (2009). Towards afunctional neuroanatomy of pleasure and happiness. Trendsin Cognitive Sciences, 13, 479–487.
Laird, A. R., Eickhoff, S. B., Kurth, F., Fox, P. M., Uecker, A. M.,Turner, J. A., et al. (2009). ALE meta-analysis workflows viathe Brainmap Database: Progress towards a probabilisticfunctional brain atlas. Frontiers in Neuroinformatics, 3, 23.
Laird, A. R., Eickhoff, S. B., Li, K., Robin, D. A., Glahn, D. C., &Fox, P. T. (2009). Investigating the functional heterogeneityof the default mode network using coordinate-basedmeta-analytic modeling. Journal of Neuroscience, 29,14496–14505.
Laird, A. R., Lancaster, J. L., & Fox, P. T. (2005). BrainMap:The social evolution of a human brain mapping database.Neuroinformatics, 3, 65–78.
Lancaster, J. L., Laird, A. R., Fox, P. M., Glahn, D. E., & Fox,P. T. (2005). Automated analysis of meta-analysis networks.Human Brain Mapping, 25, 174–184.
Lancaster, J. L., Woldorff, M. G., Parsons, L. M., Liotti, M.,Freitas, C. S., Rainey, L., et al. (2000). Automated Talairachatlas labels for functional brain mapping. Human BrainMapping, 10, 120–131.
Lawrence, A. D., Sahakianb, B. J., & Robbins, T. W. (1998).Cognitive functions and corticostriatal circuits: Insightsfrom Huntingtonʼs disease. Trends in Cognitive Sciences,2, 379–388.
Leh, S. E., Ptito, A., Chakravarty, M. M., & Strafella, A. P.(2007). Fronto-striatal connections in the human brain: Aprobabilistic diffusion tractography study. NeuroscienceLetters, 419, 113–118.
Lehericy, S., Ducros, M., Krainik, A., Francois, C., Van deMoortele, P. F., Ugurbil, K., et al. (2004). 3-D diffusiontensor axonal tracking shows distinct SMA and pre-SMAprojections to the human striatum. Cerebral Cortex, 14,1302–1309.
Luo, L., & OʼLeary, D. D. (2005). Axon retraction anddegeneration in development and disease. Annual Reviewof Neuroscience, 28, 127–156.
Margulies, D. S., Kelly, A. M., Uddin, L. Q., Biswal, B. B.,Castellanos, F. X., & Milham, M. P. (2007). Mapping thefunctional connectivity of anterior cingulate cortex.Neuroimage, 37, 579–588.
McClure, S. M., York, M. K., & Montague, P. R. (2004). Theneural substrates of reward processing in humans: Themodern role of fMRI. Neuroscientist, 10, 260–268.
McFarland, K., Lapish, C. C., & Kalivas, P. W. (2003).Prefrontal glutamate release into the core of the nucleusaccumbens mediates cocaine-induced reinstatement ofdrug-seeking behavior. Journal of Neuroscience, 23,3531–3537.
McFarland, N. R., & Haber, S. N. (2002). Thalamic relay nucleiof the basal ganglia form both reciprocal and nonreciprocalcortical connections, linking multiple frontal cortical areas.Journal of Neuroscience, 22, 8117–8132.
Middleton, F. A., & Strick, P. L. (1994). Anatomical evidence forcerebellar and basal ganglia involvement in higher cognitivefunction. Science, 266, 458–461.
Middleton, F. A., & Strick, P. L. (2002). Basal-ganglia “projections”to the prefrontal cortex of the primate. Cerebral Cortex,12, 926–935.
Miezin, F. M., Maccotta, L., Ollinger, J. M., Petersen, S. E., &Buckner, R. L. (2000). Characterizing the hemodynamicresponse: Effects of presentation rate, sampling procedure,and the possibility of ordering brain activity based on relativetiming. Neuroimage, 11, 735–759.
Mobbs, D., Greicius, M. D., Abdel-Azim, E., Menon, V., & Reiss,A. L. (2003). Humor modulates the mesolimbic rewardcenters. Neuron, 40, 1041–1048.
Mogenson, G. J., Jones, D. L., & Yim, C. Y. (1980). Frommotivation to action: Functional interface between the limbicsystem and the motor system. Progress in Neurobiology,14, 69–97.
Morgane, P. J., Galler, J. R., & Mokler, D. J. (2005). A reviewof systems and networks of the limbic forebrain/limbicmidbrain. Progress in Neurobiology, 75, 143–160.
Napadow, V., Dhond, R., Conti, G., Makris, N., Brown, E. N.,& Barbieri, R. (2008). Brain correlates of autonomicmodulation: Combining heart rate variability with fMRI.Neuroimage, 42, 169–177.
OʼDonnell, P., & Grace, A. A. (1995). Synaptic interactionsamong excitatory afferents to nucleus accumbens neurons:Hippocampal gating of prefrontal cortical input. Journalof Neuroscience, 15, 3622–3639.
OʼDonnell, P., Lavin, A., Enquist, L. W., Grace, A. A., & Card, J. P.(1997). Interconnected parallel circuits between rat nucleusaccumbens and thalamus revealed by retrograde transynaptictransport of pseudorabies virus. Journal of Neuroscience,17, 2143–2167.
Parkinson, J. A., Willoughby, P. J., Robbins, T. W., & Everitt, B. J.(2000). Disconnection of the anterior cingulate cortex andnucleus accumbens core impairs Pavlovian approachbehavior: Further evidence for limbic cortical-ventralstriatopallidal systems. Behavioral Neuroscience, 114, 42–63.
Pennartz, C. M., Groenewegen, H. J., & Lopes da Silva, F. H.(1994). The nucleus accumbens as a complex of functionallydistinct neuronal ensembles: An integration of behavioral,electrophysiological and anatomical data. Progress inNeurobiology, 42, 719–761.
Postuma, R. B., & Dagher, A. (2006). Basal ganglia functionalconnectivity based on a meta-analysis of 126 positronemission tomography and functional magnetic resonanceimaging publications. Cerebral Cortex, 16, 1508–1521.
Redgrave, P., Prescott, T. J., & Gurney, K. (1999). The basalganglia: A vertebrate solution to the selection problem?Neuroscience, 89, 1009–1023.
Robbins, T. W., & Everitt, B. J. (1992). Functions of dopaminein the dorsal and ventral striatum. Seminars in Neuroscience,4, 119–127.
Robinson, J. L., Laird, A. R., Glahn, D. C., Lovallo, W. R., &Fox, P. T. (2009). Metaanalytic connectivity modeling:Delineating the functional connectivity of the humanamygdala. Human Brain Mapping, 31, 173–184.
Salamone, J. D., Cousins, M. S., & Snyder, B. J. (1997).Behavioral functions of nucleus accumbens dopamine:Empirical and conceptual problems with the anhedoniahypothesis. Neuroscience and Biobehavioral Reviews,21, 341–359.
Schultz, W. (2004). Neural coding of basic reward terms ofanimal learning theory, game theory, microeconomics andbehavioral ecology. Current Opinion in Neurobiology,14, 139–147.
Selemon, L. D., & Goldman-Rakic, P. S. (1985). Longitudinaltopography and interdigitation of corticostriatal projectionsin the rhesus monkey. Journal of Neuroscience, 5, 776–794.
Smith, S. M., Fox, P. T., Miller, K. L., Glahn, D. C., Fox, P. M.,Mackay, C. E., et al. (2009). Correspondence of the brainʼsfunctional architecture during activation and rest.Proceedings of the National Academy of Sciences, U.S.A.,106, 13040–13045.
Sorensen, T. (1948). A method of establishing groups of equalamplitude in plant sociology based on similarity of speciesand its application to analyses of the vegetation on Danishcommons. Biologiske Skrifter/Kongelige DanskeVidenskabernes Selskab, 5, 1–34.
Spearman, C. (1910). Correlation calculated from faulty data.British Journal of Psychology, 3, 271–295.
2876 Journal of Cognitive Neuroscience Volume 23, Number 10
Stoeckel, L. E., Kim, J., Weller, R. E., Cox, J. E., Cook, E. W., III,& Horwitz, B. (2009). Effective connectivity of a rewardnetwork in obese women. Brain Research Bulletin, 79,388–395.
Surmeier, D. J., Ding, J., Day, M., Wang, Z., & Shen, W. (2007).D1 and D2 dopamine-receptor modulation of striatalglutamatergic signaling in striatal medium spiny neurons.Trends in Neurosciences, 30, 228–235.
Talairach, J., & Tournoux, P. (1988). Co-planar stereotaxicatlas of the human brain: 3-Dimensional proportionalsystem: An approach to cerebral imaging. Stuttgart: Thieme.
Taylor, J. R., & Robbins, T. W. (1984). Enhanced behavioralcontrol by conditioned reinforcers following microinjectionsof d-amphetamine into the nucleus accumbens.Psychopharmacology (Berlin), 84, 405–412.
Toro, R., Fox, P. T., & Paus, T. (2008). Functional coactivationmap of the human brain. Cerebral Cortex, 18, 2553–2559.
Totterdell, S. (2006). The anatomy of co-morbid neuropsychiatricdisorders based on cortico-limbic synaptic interactions.Neurotoxicity Research, 10, 65–85.
Turkeltaub, P. E., Eden, G. F., Jones, K. M., & Zeffiro, T. A.(2002). Meta-analysis of the functional neuroanatomy of
single-word reading: Method and validation. Neuroimage,16, 765–780.
Vincent, J. L., Patel, G. H., Fox, M. D., Snyder, A. Z., Baker,J. T., Van Essen, D. C., et al. (2007). Intrinsic functionalarchitecture in the anaesthetized monkey brain. Nature,447, 83–86.
Wise, R. A., Bauco, P., Carlezon, W. A., Jr., & Trojniar, W. (1992).Self-stimulation and drug reward mechanisms. Annals ofthe New York Academy of Sciences, 654, 192–198.
Woolrich, M. W., Ripley, B. D., Brady, M., & Smith, S. M. (2001).Temporal autocorrelation in univariate linear modeling offMRI data. Neuroimage, 14, 1370–1386.
Zahm, D. S. (1998). Is the caudomedial shell of the nucleusaccumbens part of the extended amygdala? A consideration ofconnections. Critical Reviews in Neurobiology, 12, 245–265.
Zahm, D. S. (1999). Functional-anatomical implications of thenucleus accumbens core and shell subterritories. Annals ofthe New York Academy of Sciences, 877, 113–128.
Zhang, D., Snyder, A. Z., Fox, M. D., Sansbury, M. W., Shimony,J. S., & Raichle, M. E. (2008). Intrinsic functional relationsbetween human cerebral cortex and thalamus. Journal ofNeurophysiology, 100, 1740–1748.
Cauda et al. 2877