Epidemiological Study on Hospital Acquired Infections and ...
DIRECCIÓN DE COMUNICACIÓNNOTA DE PRENSA 27 de julio de 2010
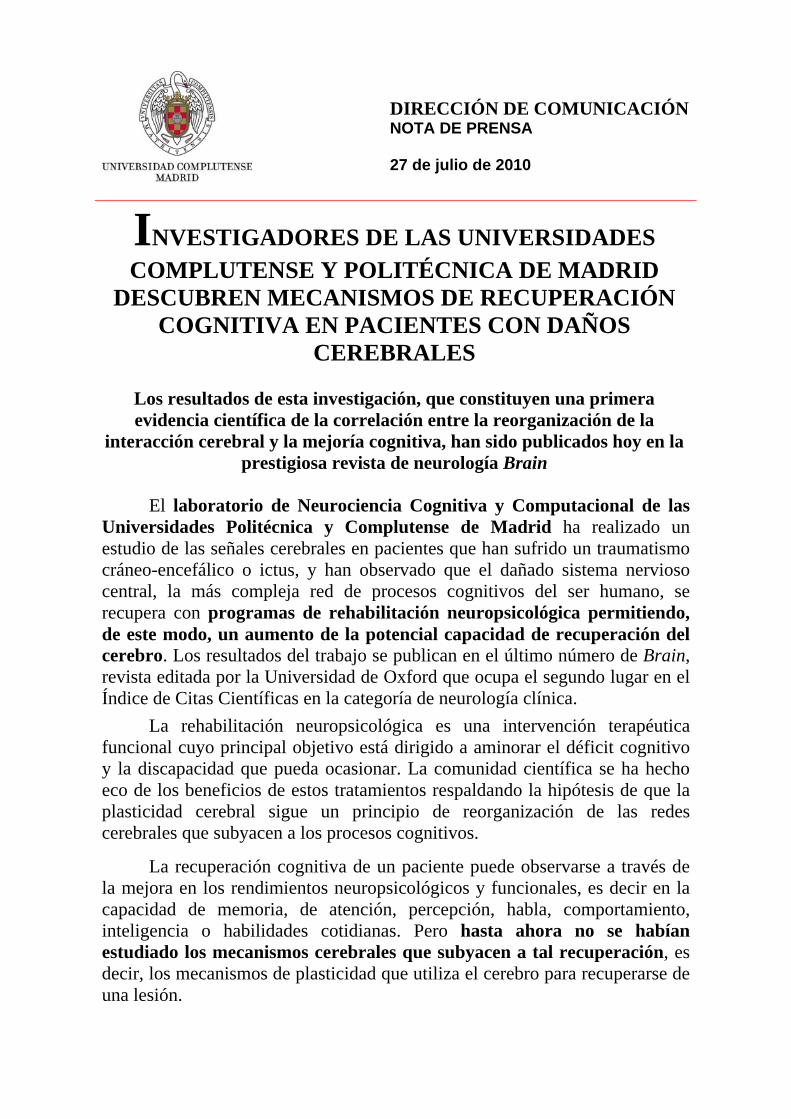
INVESTIGADORES DE LAS UNIVERSIDADES COMPLUTENSE Y POLITÉCNICA DE MADRID
DESCUBREN MECANISMOS DE RECUPERACIÓN COGNITIVA EN PACIENTES CON DAÑOS
CEREBRALES
Los resultados de esta investigación, que constituyen una primera evidencia científica de la correlación entre la reorganización de la
interacción cerebral y la mejoría cognitiva, han sido publicados hoy en la prestigiosa revista de neurología Brain
El laboratorio de Neurociencia Cognitiva y Computacional de las
Universidades Politécnica y Complutense de Madrid ha realizado un estudio de las señales cerebrales en pacientes que han sufrido un traumatismo cráneo-encefálico o ictus, y han observado que el dañado sistema nervioso central, la más compleja red de procesos cognitivos del ser humano, se recupera con programas de rehabilitación neuropsicológica permitiendo, de este modo, un aumento de la potencial capacidad de recuperación del cerebro. Los resultados del trabajo se publican en el último número de Brain, revista editada por la Universidad de Oxford que ocupa el segundo lugar en el Índice de Citas Científicas en la categoría de neurología clínica.
La rehabilitación neuropsicológica es una intervención terapéutica funcional cuyo principal objetivo está dirigido a aminorar el déficit cognitivo y la discapacidad que pueda ocasionar. La comunidad científica se ha hecho eco de los beneficios de estos tratamientos respaldando la hipótesis de que la plasticidad cerebral sigue un principio de reorganización de las redes cerebrales que subyacen a los procesos cognitivos.
La recuperación cognitiva de un paciente puede observarse a través de la mejora en los rendimientos neuropsicológicos y funcionales, es decir en la capacidad de memoria, de atención, percepción, habla, comportamiento, inteligencia o habilidades cotidianas. Pero hasta ahora no se habían estudiado los mecanismos cerebrales que subyacen a tal recuperación, es decir, los mecanismos de plasticidad que utiliza el cerebro para recuperarse de una lesión.
NOT FORPUBLIC RELEASE
K:/oup/brain/awq174.3d [17.6.2010–5:17pm] [1–17] Paper: awq174
Copyedited by: AH MANUSCRIPT CATEGORY: ORIGINAL ARTICLE
BRAINA JOURNAL OF NEUROLOGY
Reorganization of functional connectivity asa correlate of cognitive recovery in acquiredbrain injuryNazareth P. Castellanos,1 Nuria Paul,2 Victoria E. Ordonez,1 Olivier Demuynck,3 Ricardo Bajo,1
5 Pablo Campo,1 Alvaro Bilbao,4 Tomas Ortiz,2 Francisco del-Pozo1 and Fernando Maestu1,5
1 Laboratory of Cognitive and Computational Neuroscience, Centre for Biomedical Technology (CTB), Universidad Politecnica de Madrid,
Madrid, Spain
2 Department of Psychiatric and Medical Psychology, Medicine School, Universidad Complutense de Madrid, Spain
3 Department of Signals, Systems and Radiocomunications, Universidad Politecnica de Madrid, Spain
10 4 National Centre for Brain Injury Treatment (CEADAC) Madrid, Spain
5 Department of Basic Psychology II – Cognitive Process, Universidad Complutense de Madrid, Spain
Correspondence to: Nazareth P. Castellanos,
Laboratory of Cognitive and Computational Neuroscience,
Centre for Biomedical Technology,
15 Campus de Montegancedo 28660,
Universidad Politecnica de Madrid, Spain
E-mail: [email protected]
Cognitive processes require a functional interaction between specialized multiple, local and remote brain regions. Although20 these interactions can be strongly altered by an acquired brain injury, brain plasticity allows network reorganization to be
principally responsible for recovery. The present work evaluates the impact of brain injury on functional connectivity patterns.
Networks were calculated from resting-state magnetoencephalographic recordings from 15 brain injured patients and 14 healthy
controls by means of wavelet coherence in standard frequency bands. We compared the parameters defining the network, such
as number and strength of interactions as well as their topology, in controls and patients for two conditions: following a25 traumatic brain injury and after a rehabilitation treatment. A loss of delta and theta-based connectivity and conversely, an
increase in alpha and beta-band-based connectivity were found. Furthermore, connectivity parameters approached control ones
in all frequency bands, especially in slow-wave bands. A correlation between network reorganization and cognitive recovery was
found: the reduction of delta-band-based connections and the increment of those based on alpha band correlated with Verbal
Fluency scores, as well as Perceptual Organization and Working Memory indexes, respectively. Additionally, changes in con-30 nectivity values based on theta and beta bands correlated with the Patient Competency Rating Scale. The current study provides
new evidence of the neurophysiologic mechanisms underlying neuronal plasticity processes after brain injury, and suggests that
these changes are related with observed changes at the behavioural level.
Keywords: brain injury; functional connectivity; magnetoencephalography; plasticity
35 Abbreviations: MEG = magnetoencephalograhy; PCRS = Patient Competency Rating Scale; WAIS = Wechsler AdultIntelligence Scale III
doi:10.1093/brain/awq174 Brain 2010: Page 1 of 17 | 1
Received March 9, 2010. Revised May 19, 2010. Accepted May 20, 2010.
� The Author (2010). Published by Oxford University Press on behalf of the Guarantors of Brain. All rights reserved.
For Permissions, please email: [email protected]
NOT FORPUBLIC RELEASE
K:/oup/brain/awq174.3d [17.6.2010–5:17pm] [1–17] Paper: awq174
Copyedited by: AH MANUSCRIPT CATEGORY: ORIGINAL ARTICLE
IntroductionBrain plasticity has been described as the brain’s ability to evolve,
an intrinsic property of the nervous system that persists through-
out life and plays an important role in maturity, development and
5 acquisition of new skill processes. Importantly, plasticity becomes
fundamental for functional recovery from a brain injury (Nudo,
1996, 2006; Leocani, 2006), being the mechanism underlying
the potential capability of the brain to compensate for lesions.
Acquired brain injury constitutes one of the leading causes of
10 mortality and disability around the world, leaving motor and cog-
nitive sequels that vary depending on aetiology, extent and sever-
ity of damage (Katz et al., 2006). In particular, cognitive deficits
are the main sources of disability after traumatic brain injury and
stroke, so rehabilitation strategies to promote their recovery and
15 reduce their disability are needed (Cicerone et al., 2000, 2005),
and must be designed to take full advantage of plasticity (Butz
et al., 2009). In order to treat cognitive deficits, neuropsychologic-
al rehabilitation has been developed as a systematic, functionally
oriented therapeutic intervention, based on the assessment and
20 understanding of a patient’s cognitive deficits, emotional or be-
havioural regulation problems and functional disabilities. Currently,
it is possible to find a large amount of literature that supports the
benefits of various types of cognitive interventions with traumatic
brain injury patients (Cicerone et al., 2000; 2005; Halligan and
25 Wade, 2005; Katz et al., 2006; McCabe et al., 2007; Turner-
Stokes, 2008). However, the debate is still open, as it is empha-
sized by Cicerone (Cicerone et al., 2000) and Rholing’s group
(Rholing et al., 2009) in their systematic reviews about the topic.
The study of the cerebral mechanisms underlying brain injury
30 and their plastic changes could boost our knowledge about neural
recovery. Nowadays, the increased use of neuroimaging tech-
niques is enhancing our understanding of brain damage and neur-
onal plasticity (Wilson, 2008). Several works show evidence of
neuronal reorganization following traumatic brain injury and re-
35 covery (for a review see Munoz-Cespedes et al., 2005) but have
also noted the heterogeneity of results from activation measures.
Researchers have used a variety of tasks and techniques and con-
sequently there is a corresponding diversity of results (Kelly et al.,
2006). It is necessary to study this problem from another point of
40 view, probably by means of the changes in the interaction be-
tween brain areas, and not just by measurements of local changes
in activation patterns.
A possible framework to study brain strategies for brain injury
recovery is based on the idea that the brain is a complex network
45 of dynamical systems with abundant interactions between local
and more remote brain areas (Varela et al., 2001). More than a
half century ago Hebb (1949) suggested that neuronal cortical
connections can be remodelled by our experience. Since then,
plasticity in the cerebral cortex has been studied in depth
50 (Bennett et al., 1964; Rosenzweig et al., 1966; Kolb et al.,
1995), for example in learning (Merzenich et al., 1984) and in
response to brain lesions (Jenkins and Merzenich, 1987; Florence
et al., 1998). A focal brain lesion induces changes in adjacent and
other remote, but interconnected, brain regions (Lee and van
55 Donkelaar, 1995; Nudo, 1996; Witte and Stoll, 1997).
A mechanism proposed as responsible for functional remodelling
in local and distant brain regions could be the rewiring of its ana-
tomical connections by retraining, compensating and/or substitut-
ing brain functioning (Wilson, 2008). A new approach is to study
60the impact of a lesion on the brain by means of the functional
interactions (‘functional connectivity’) that take place between
brain regions (Quigley et al., 2001; Stam et al., 2002; Salvador
et al., 2005). In the study of such interactions between brain areas
the concept of functional connectivity has emerged, referring to
65the statistical interdependencies between physiological time series
recorded in various brain areas simultaneously (Aertsen et al.,
1989). Functional connectivity is, probably, an essential tool for
the study of brain functioning (Tononi and Edelman, 1998; Singer,
1999; Bressler, 2002; Varela et al., 2001) and its deviation from
70healthy patterns could be used as an indication of lesion.
Electroencephalographic and magnetoencephalographic (MEG)
recordings have been shown to be reliable techniques for the
study of functional connectivity (Varela et al., 2001; Schnitzler
and Gross, 2005, Guggisberg et al., 2008). For example, function-
75al connectivity from such continuous time series have demon-
strated alterations in functional connectivity of Alzheimer’s
disease (Stam et al., 2002), multiple sclerosis (Cover et al.,
2004, 2006) and patients with brain injury (Bartolomei et al.,
2006a; Douw et al., 2008; Nakamura et al., 2009; Cao and
80Slobounov, 2010).
The present study was developed with the aim of quantifying
functional connectivity changes in patients with traumatic brain
injury, who underwent resting-state MEG recordings following
traumatic brain injury and after a rehabilitation treatment, com-
85pared to control subjects. We calculated, by means of the time
averaged wavelet coherence, the interaction between the whole-
head MEG signals (Fig. 1A–C) in the standard frequency bands. To
quantify differences with respect to those from healthy controls
we proposed a measure of distance-to-control connectivity pat-
90terns that helped us to study how altered these connectivity par-
ameters were following a traumatic brain injury and how, as
expected, they were after recovery. In order to link the neuro-
physiological evaluation of patients with their cognitive ability, we
correlated changes in connectivity parameters with changes in
95neuropsychological test scores. Finally, network architecture in pa-
tients in both conditions were checked to see if they were distin-
guishable or not from control topology by means of a linear
discriminant analysis (Fig. 1C), with the aim of evaluating whether
reorganization of the network occurs during recovery. The current
100study would like to provide, for the first time, evidence of the
neurophysiologic mechanisms underlying the process of neuronal
plasticity after brain injury, and test whether those changes in
functional connectivity at the neurophysiologic level are related
with changes observed at the behavioural level.
105Materials and methods
SubjectsThe dataset was composed of 29 subjects: 15 patients with traumatic
brain injury (recruited from a Rehabilitation Centre where they
2 | Brain 2010: Page 2 of 17 N. P. Castellanos et al.
NOT FORPUBLIC RELEASE
K:/oup/brain/awq174.3d [17.6.2010–5:17pm] [1–17] Paper: awq174
Copyedited by: AH MANUSCRIPT CATEGORY: ORIGINAL ARTICLE
underwent a neurorehabilitation) and 14 healthy controls. Patients had
suffered severe traumatic brain injury, according to the period of
post-traumatic amnesia (Lishman, 1968). All patients showed severe
cognitive impairments in several domains such as attention, memory
5 and executive function. Mean age of the patients was 32.13 years
(18, 51), and the mean level of education was 13.7 years (8, 18).
Mean time since injury at the beginning of the study was
3.8 months (2, 6), and the neurorehabilitation program lasted for an
averaged period of 9.4 months (7, 12). Table 1 summarizes the
10demographic and clinical profile of the patients. Experimental and
healthy control groups were matched for age (31.93), educational
level (15.57) and gender. Exclusion criteria for the selection of all
participants included previous medical history of psychiatric disease
and extended psychoactive drug consumption.
15Patients had MEG recordings and neuropsychological assess-
ments (done close to the day of MEG recording) before and after
the neuropsychological rehabilitation program (hereafter called
‘pre-’ and ‘post-’ rehabilitation). In this study control subjects
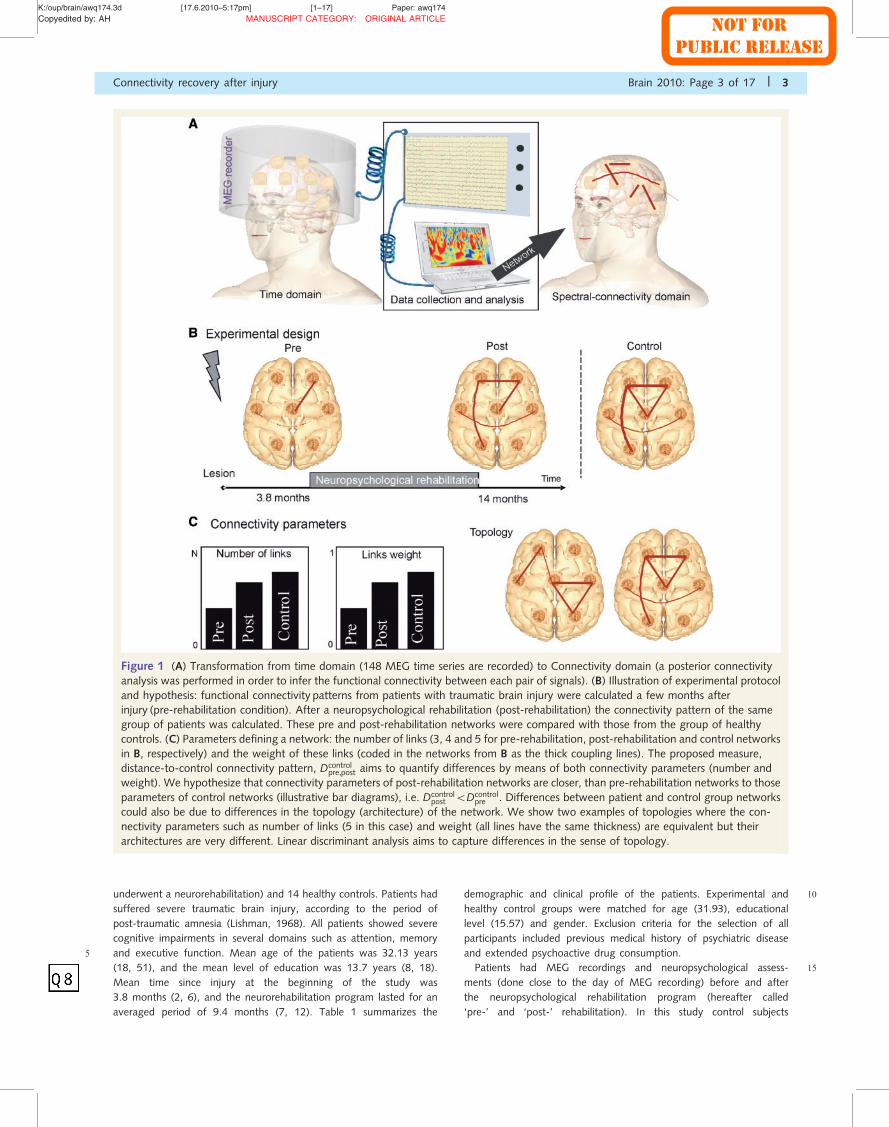
Figure 1 (A) Transformation from time domain (148 MEG time series are recorded) to Connectivity domain (a posterior connectivity
analysis was performed in order to infer the functional connectivity between each pair of signals). (B) Illustration of experimental protocol
and hypothesis: functional connectivity patterns from patients with traumatic brain injury were calculated a few months after
injury (pre-rehabilitation condition). After a neuropsychological rehabilitation (post-rehabilitation) the connectivity pattern of the same
group of patients was calculated. These pre and post-rehabilitation networks were compared with those from the group of healthy
controls. (C) Parameters defining a network: the number of links (3, 4 and 5 for pre-rehabilitation, post-rehabilitation and control networks
in B, respectively) and the weight of these links (coded in the networks from B as the thick coupling lines). The proposed measure,
distance-to-control connectivity pattern, Dcontrolpre,post aims to quantify differences by means of both connectivity parameters (number and
weight). We hypothesize that connectivity parameters of post-rehabilitation networks are closer, than pre-rehabilitation networks to those
parameters of control networks (illustrative bar diagrams), i.e. Dcontrolpost 5Dcontrol
pre . Differences between patient and control group networks
could also be due to differences in the topology (architecture) of the network. We show two examples of topologies where the con-
nectivity parameters such as number of links (5 in this case) and weight (all lines have the same thickness) are equivalent but their
architectures are very different. Linear discriminant analysis aims to capture differences in the sense of topology.
Connectivity recovery after injury Brain 2010: Page 3 of 17 | 3
NOT FORPUBLIC RELEASE
K:/oup/brain/awq174.3d [17.6.2010–5:17pm] [1–17] Paper: awq174
Copyedited by: AH MANUSCRIPT CATEGORY: ORIGINAL ARTICLE
were measured once, assuming that brain networks do not change in
their structure in less than one year, as demonstrated previously in
young (Damoiseaux et al., 2006) and elderly subjects (Beason-Held
et al., 2009).
5 All participants or legal representatives gave their written informed
consent to participate in the study. The study was approved by the
Local Ethics Committee.
Neuropsychological rehabilitationprogram and neuropsychological
10 assessmentAll study patients completed a neurorehabilitation program that was
adapted to each individual’s requirements. This program was con-
ducted in individual sessions attempting to offer an intensive
neuropsychological-based rehabilitation, provided in 1 h sessions for
15 3–4 days a week. In some cases, cognitive intervention was coupled
with other types of neurorehabilitation therapies according to the pa-
tient’s profile (physiotherapy, speech therapy or occupational therapy).
Depending on the severity and deficits features of each case, strategies
of restitution, substitution and/or compensation were applied as well
20 as training in daily living activities, external aids or the application of
behavioural therapy. Patients and controls underwent a neuropsycho-
logical assessment, in order to establish their cognitive status in mul-
tiple cognitive functions (attention, memory, language, executive
functions and visuospatial abilities) as well as their functioning in
25 daily life. All subjects completed the Wechsler Adult Intelligence
Scale III (WAIS-III; Wechsler, 1997), the Wechsler Memory Scale
Revised (Wechsler, 1987), the Brief Test of Attention (Schretlen,
1997), the Trail Making Test (Reitan, 1992), the Stroop Colour
Word Test (Golden, 1978), the Wisconsin Card Sorting Test
30 (Heaton,1991), the Verbal Fluency Test (Gladsojo et al., 1999), the
Tower of Hanoi (Edouard, 1983), the Zoo Map Test (from BADS;
Wilson et al., 1996) and the Patient Competency Rating Scale
(PCRS; Prigatano et al., 1991). This last scale is formed from
30 items related to different daily living activities (basic and instrumen-
35tal activities as well as social skills, cognitive and emotional issues) and
the patient’s level of competency on a five-point Likert scale.
Magnetoencephalographic recordingsMagnetic fields were recorded using a 148-channel whole-head mag-
netometer (4D-MAGNES� 2500 WH, 4-D Neuroimaging) confined in
40a magnetically shielded room. Raw data were collected using a sam-
pling rate of 169.45Hz and band-pass filtered between 0.1 and 50Hz.
MEG data were submitted to an interactive environmental noise re-
duction procedure. Fields were measured during a no task eyes-open
condition. Time-segments containing eye movement or blinks (as indi-
45cated by peak-to-peak amplitudes in the electro-oculograms channels
in excess of 50 mV) or other myogenic or mechanical artefacts were
rejected and time windows not containing artefacts were visually
selected by experienced investigator, up to a segment length of 12 s.
Digitized MEG data were imported into MATLAB Version
507.4 (Mathworks, Natick, MA, USA) for analysis with custom-written
scripts.
Analysis
Wavelet coherence
Wavelet transform can be used as an alternative to Fourier transform
55for the performance of time-spectral analysis when dealing with
non-stationary time series (Mallat, 1998). By using wavelet transform,
we can perform a time-frequency analysis of rhythmic components in
a MEG signal, and hence estimate the wavelet coherence for a pair of
signals, a normalized measure of association between two time series
60(Torrence and Compo, 1998; Grinsted et al., 2004). The global wave-
let coherence, CGxy, can be obtained by time averaging local (time-
dependent) coherence
CGxyðpÞ ¼
1
T
Z T
0Cxy p, zð Þdz
where Cxyðp, zÞ is the wavelet coherence between signals x tð Þ and y tð Þ
65at the p scale and z time-localization, T is the length of the signal
(Percival, 1995) with time-predominant connectivity values. To evalu-
ate the significance level we use a surrogate data test (Theiler et al.,
1992; Schreiber and Schmitz, 2000, Korzeniewska et al., 2003) with
Monte Carlo simulation to establish a 95% confidence interval and
70avoid spurious couplings. Global wavelet coherence, CGxy, was then
averaged in the following frequency bands: � (1–4) Hz, � (4–8) Hz,
� (8–13) Hz and b (13–30) Hz for all combinations of the 148 signals.
Further spatial averaging in whole head was done: in frontal, central,
right and left temporal and occipital regions to obtain local connec-
75tions within a brain area, and long distance connections between two
different brain regions (frontal and central; frontal and right temporal;
frontal and left temporal; frontal and occipital; central and right tem-
poral; central and left temporal; central and occipital; right temporal
and left temporal; occipital and right temporal; occipital and left
80temporal).
To quantify the possible restoration of functional connectivity pat-
terns, we defined a measure of distance between connectivity matrices
of patients and control groups. This measure combines both param-
eters defining the connectivity matrices, the number of connections
85(BC, density of existing links) and their weight (WC). This measure
quantifies the percentage of increase (or decrease) with respect to
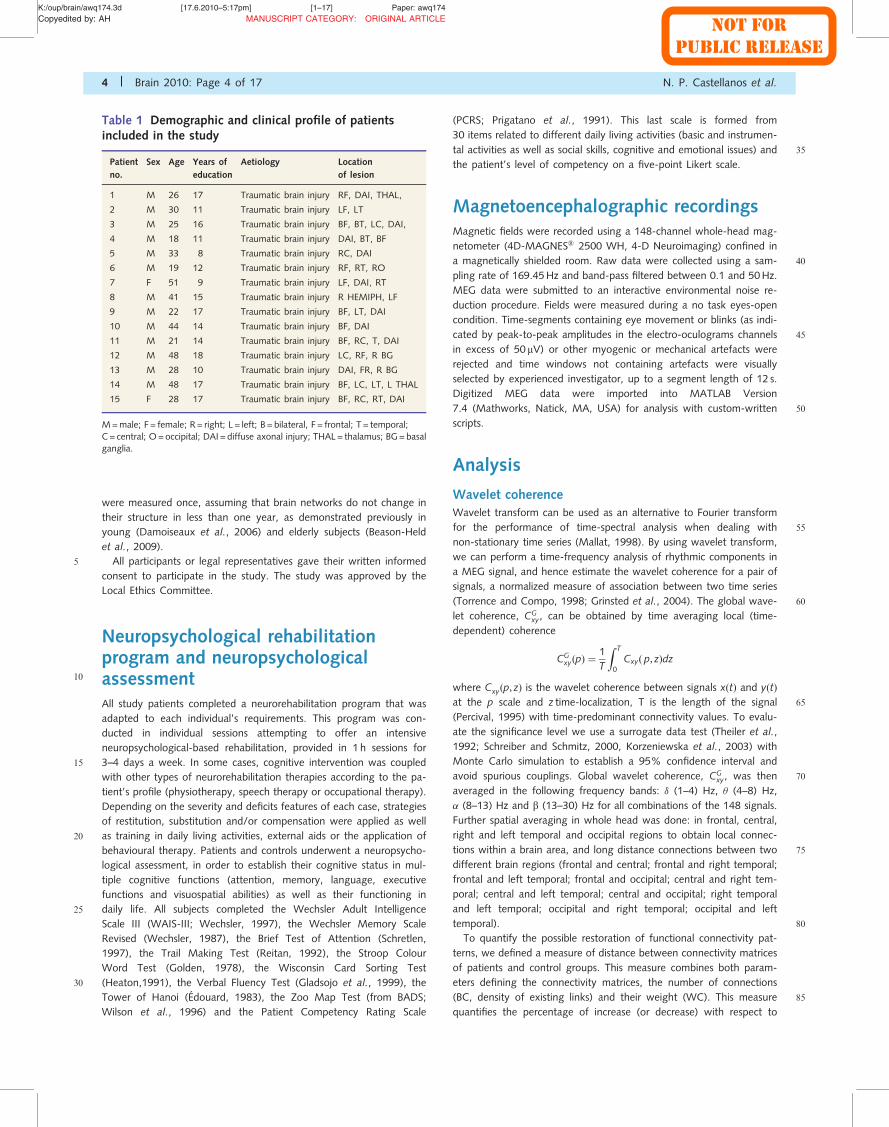
Table 1 Demographic and clinical profile of patientsincluded in the study
Patient
no.
Sex Age Years of
education
Aetiology Location
of lesion
1 M 26 17 Traumatic brain injury RF, DAI, THAL,
2 M 30 11 Traumatic brain injury LF, LT
3 M 25 16 Traumatic brain injury BF, BT, LC, DAI,
4 M 18 11 Traumatic brain injury DAI, BT, BF
5 M 33 8 Traumatic brain injury RC, DAI
6 M 19 12 Traumatic brain injury RF, RT, RO
7 F 51 9 Traumatic brain injury LF, DAI, RT
8 M 41 15 Traumatic brain injury R HEMIPH, LF
9 M 22 17 Traumatic brain injury BF, LT, DAI
10 M 44 14 Traumatic brain injury BF, DAI
11 M 21 14 Traumatic brain injury BF, RC, T, DAI
12 M 48 18 Traumatic brain injury LC, RF, R BG
13 M 28 10 Traumatic brain injury DAI, FR, R BG
14 M 48 17 Traumatic brain injury BF, LC, LT, L THAL
15 F 28 17 Traumatic brain injury BF, RC, RT, DAI
M=male; F = female; R = right; L = left; B = bilateral, F = frontal; T = temporal;C = central; O=occipital; DAI = diffuse axonal injury; THAL= thalamus; BG=basalganglia.
4 | Brain 2010: Page 4 of 17 N. P. Castellanos et al.
NOT FORPUBLIC RELEASE
K:/oup/brain/awq174.3d [17.6.2010–5:17pm] [1–17] Paper: awq174
Copyedited by: AH MANUSCRIPT CATEGORY: ORIGINAL ARTICLE
control connectivity parameters. Distance-to-control connectivity pat-
tern is therefore given by:
Dcontrolpost ¼
BCcontrol � BCpost
BCcontrolþWCcontrol �WCpost
WCcontrol
A similar equation is defined for Dcontrolpre . This measure was calculated
5 separately for each local and long-distance connection and each fre-
quency band. Small values of Dcontrolpre,post indicates that patient’s connect-
ivity pattern parameters were close to those shown by the control
group and hence restoration of functional connectivity had taken
place; whereas large values of Dcontrolpre,post suppose deviation from control
10 parameters. We hypothesize that the connectivity pattern parameters
of post-rehabilitation condition will be closer to the parameters
of healthy controls than those exhibited by patients following a
brain injury, i.e. Dcontrolpost 5Dcontrol
pre . The procedure is illustrated in
Fig. 1B and C.
15 Linear discriminant analysis
Connectivity pattern parameters (such as number of connections
and their weight) could be just one of the causes of differences in
functional connectivity between patients’ conditions and healthy
controls, as quantified above by Dcontrolpre,post. However, there could
20 also be differences related to the network architecture (Fig. 1C).
To study how the network topology reorganizes in both patient
conditions, we utilized a discriminant technique able to identify sub-
jects as separated groups according to the network topology. For this
purpose we proposed to find an information reduction technique that
25 preserved the discriminant data for classification, emerging from
the question of how labelled information can be utilized for finding
informative projections (Ripley, 1996; Jaakkola and Haussler, 1999;
Huan and Ramaswamy, 2004; Maindonald and Braun, 2007;
Lehmanna et al., 2007). The solution of Fisher-discriminant is the elec-
30 tion of a specific direction to project data into one-dimensional space.
As a measure of distance between centres of groups the statistic D2
of Mahalanobis was used, calculated from the variance–covariance
matrix.
Statistical analysis35 In order to increase statistical power and reduce the effect of non-
Gaussian distribution, we normalized connectivity values by means of a
logarithmic transformation (Gasser et al., 1982; Pivik et al., 1993). A
Kruskall–Wallis test was used to compare control, pre and post-
rehabilitation conditions at P50.05 (see Brookes et al., 2005; Kilner
40 et al., 2009; Campo et al., 2010, for a similar statistical approach).
Neuropsychological data were analysed using the statistical program
SPSS 15.0 and ANOVA analysis (P50.05) was used in order to iden-
tify differences among the control group and each stage (pre- and
post-rehabilitation) of the patient group.
45 Results
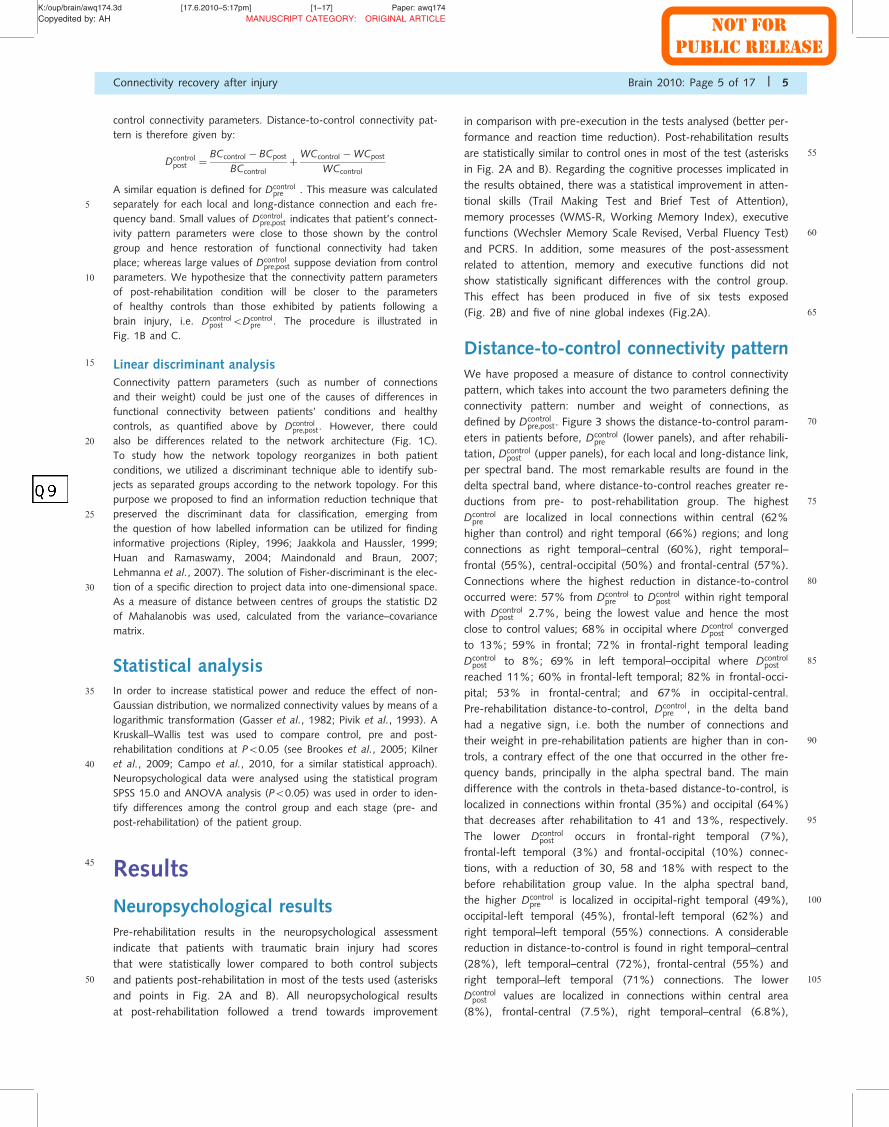
Neuropsychological resultsPre-rehabilitation results in the neuropsychological assessment
indicate that patients with traumatic brain injury had scores
that were statistically lower compared to both control subjects
50 and patients post-rehabilitation in most of the tests used (asterisks
and points in Fig. 2A and B). All neuropsychological results
at post-rehabilitation followed a trend towards improvement
in comparison with pre-execution in the tests analysed (better per-
formance and reaction time reduction). Post-rehabilitation results
55are statistically similar to control ones in most of the test (asterisks
in Fig. 2A and B). Regarding the cognitive processes implicated in
the results obtained, there was a statistical improvement in atten-
tional skills (Trail Making Test and Brief Test of Attention),
memory processes (WMS-R, Working Memory Index), executive
60functions (Wechsler Memory Scale Revised, Verbal Fluency Test)
and PCRS. In addition, some measures of the post-assessment
related to attention, memory and executive functions did not
show statistically significant differences with the control group.
This effect has been produced in five of six tests exposed
65(Fig. 2B) and five of nine global indexes (Fig.2A).
Distance-to-control connectivity patternWe have proposed a measure of distance to control connectivity
pattern, which takes into account the two parameters defining the
connectivity pattern: number and weight of connections, as
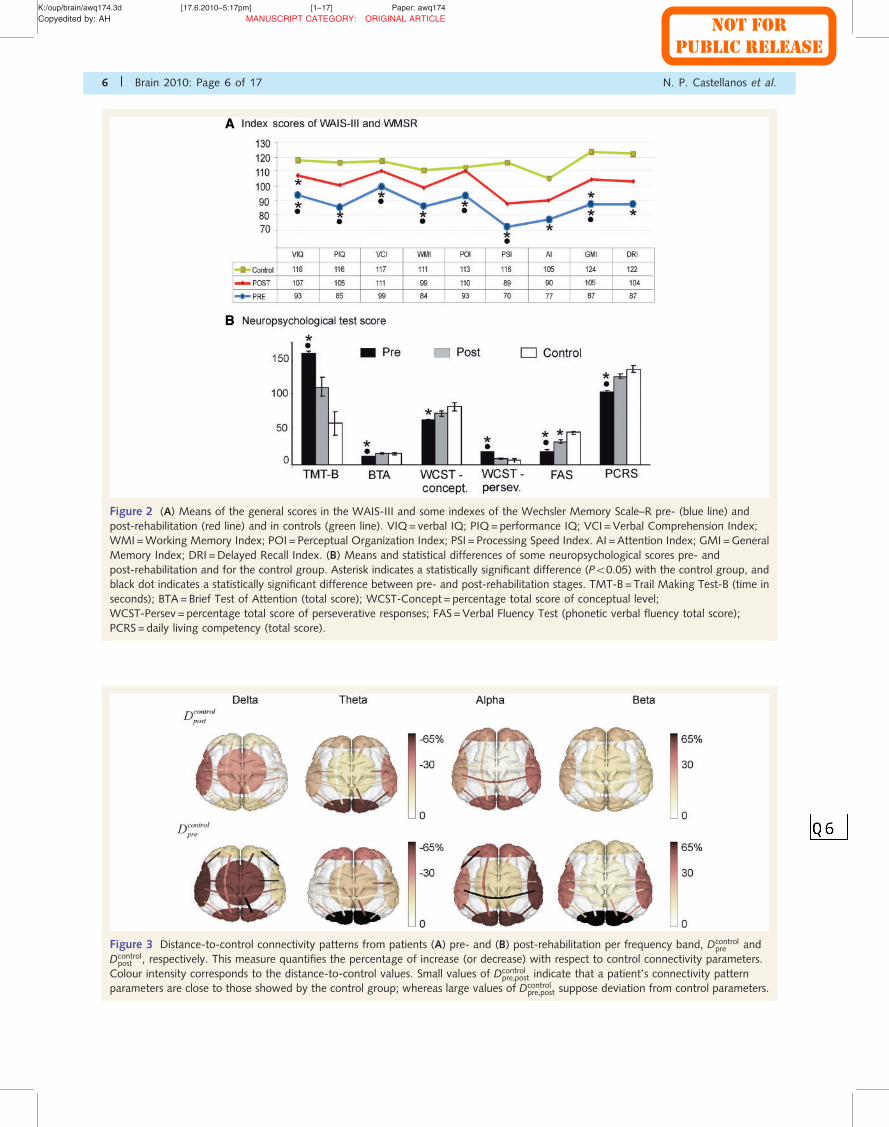
70defined by Dcontrolpre,post. Figure 3 shows the distance-to-control param-
eters in patients before, Dcontrolpre (lower panels), and after rehabili-
tation, Dcontrolpost (upper panels), for each local and long-distance link,
per spectral band. The most remarkable results are found in the
delta spectral band, where distance-to-control reaches greater re-
75ductions from pre- to post-rehabilitation group. The highest
Dcontrolpre are localized in local connections within central (62%
higher than control) and right temporal (66%) regions; and long
connections as right temporal–central (60%), right temporal–
frontal (55%), central-occipital (50%) and frontal-central (57%).
80Connections where the highest reduction in distance-to-control
occurred were: 57% from Dcontrolpre to Dcontrol
post within right temporal
with Dcontrolpost 2.7%, being the lowest value and hence the most
close to control values; 68% in occipital where Dcontrolpost converged
to 13%; 59% in frontal; 72% in frontal-right temporal leading
85Dcontrolpost to 8%; 69% in left temporal–occipital where Dcontrol
post
reached 11%; 60% in frontal-left temporal; 82% in frontal-occi-
pital; 53% in frontal-central; and 67% in occipital-central.
Pre-rehabilitation distance-to-control, Dcontrolpre , in the delta band
had a negative sign, i.e. both the number of connections and
90their weight in pre-rehabilitation patients are higher than in con-
trols, a contrary effect of the one that occurred in the other fre-
quency bands, principally in the alpha spectral band. The main
difference with the controls in theta-based distance-to-control, is
localized in connections within frontal (35%) and occipital (64%)
95that decreases after rehabilitation to 41 and 13%, respectively.
The lower Dcontrolpost occurs in frontal-right temporal (7%),
frontal-left temporal (3%) and frontal-occipital (10%) connec-
tions, with a reduction of 30, 58 and 18% with respect to the
before rehabilitation group value. In the alpha spectral band,
100the higher Dcontrolpre is localized in occipital-right temporal (49%),
occipital-left temporal (45%), frontal-left temporal (62%) and
right temporal–left temporal (55%) connections. A considerable
reduction in distance-to-control is found in right temporal–central
(28%), left temporal–central (72%), frontal-central (55%) and
105right temporal–left temporal (71%) connections. The lower
Dcontrolpost values are localized in connections within central area
(8%), frontal-central (7.5%), right temporal–central (6.8%),
Connectivity recovery after injury Brain 2010: Page 5 of 17 | 5
NOT FORPUBLIC RELEASE
K:/oup/brain/awq174.3d [17.6.2010–5:17pm] [1–17] Paper: awq174
Copyedited by: AH MANUSCRIPT CATEGORY: ORIGINAL ARTICLE
Figure 2 (A) Means of the general scores in the WAIS-III and some indexes of the Wechsler Memory Scale–R pre- (blue line) and
post-rehabilitation (red line) and in controls (green line). VIQ=verbal IQ; PIQ=performance IQ; VCI =Verbal Comprehension Index;
WMI=Working Memory Index; POI = Perceptual Organization Index; PSI = Processing Speed Index. AI =Attention Index; GMI =General
Memory Index; DRI =Delayed Recall Index. (B) Means and statistical differences of some neuropsychological scores pre- and
post-rehabilitation and for the control group. Asterisk indicates a statistically significant difference (P50.05) with the control group, and
black dot indicates a statistically significant difference between pre- and post-rehabilitation stages. TMT-B=Trail Making Test-B (time in
seconds); BTA=Brief Test of Attention (total score); WCST-Concept = percentage total score of conceptual level;
WCST-Persev = percentage total score of perseverative responses; FAS=Verbal Fluency Test (phonetic verbal fluency total score);
PCRS=daily living competency (total score).
Figure 3 Distance-to-control connectivity patterns from patients (A) pre- and (B) post-rehabilitation per frequency band, Dcontrolpre and
Dcontrolpost , respectively. This measure quantifies the percentage of increase (or decrease) with respect to control connectivity parameters.
Colour intensity corresponds to the distance-to-control values. Small values of Dcontrolpre,post indicate that a patient’s connectivity pattern
parameters are close to those showed by the control group; whereas large values of Dcontrolpre,post suppose deviation from control parameters.
6 | Brain 2010: Page 6 of 17 N. P. Castellanos et al.
NOT FORPUBLIC RELEASE
K:/oup/brain/awq174.3d [17.6.2010–5:17pm] [1–17] Paper: awq174
Copyedited by: AH MANUSCRIPT CATEGORY: ORIGINAL ARTICLE
left temporal–central (7.6%) and occipital-central (8.2%). In the
beta spectral band the highest Dcontrolpre value occurs in connections
within frontal (57%), occipital (51%) and frontal-left temporal
(54%) areas. The highest reduction occurs in right temporal–cen-
5 tral (68%) and frontal (48%) connections. Couplings reaching the
lower Dcontrolpost are connections within central (3.6%), frontal-central
(3.4%), right temporal–central (14%), left temporal–central (13%)
and occipital-central (3.5%) areas.
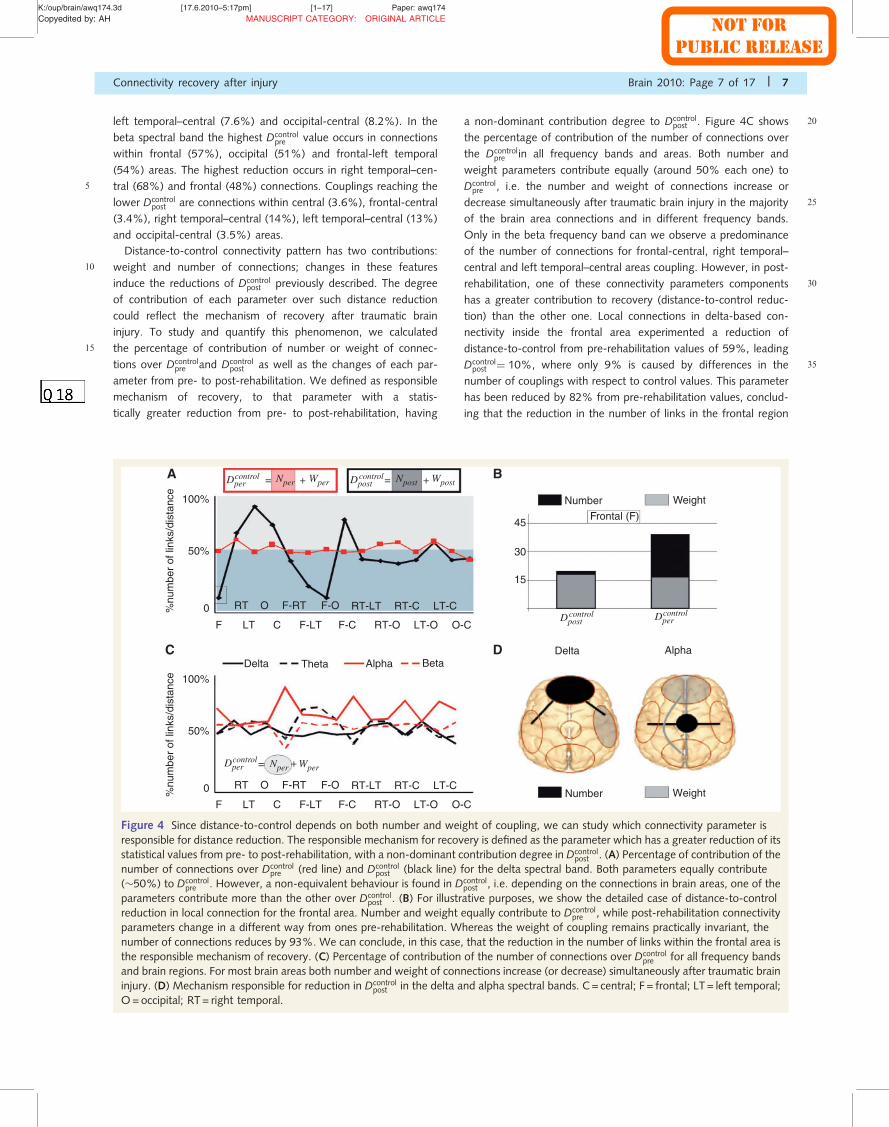
Distance-to-control connectivity pattern has two contributions:
10 weight and number of connections; changes in these features
induce the reductions of Dcontrolpost previously described. The degree
of contribution of each parameter over such distance reduction
could reflect the mechanism of recovery after traumatic brain
injury. To study and quantify this phenomenon, we calculated
15 the percentage of contribution of number or weight of connec-
tions over Dcontrolpre and Dcontrol
post as well as the changes of each par-
ameter from pre- to post-rehabilitation. We defined as responsible
mechanism of recovery, to that parameter with a statis-
tically greater reduction from pre- to post-rehabilitation, having
20a non-dominant contribution degree to Dcontrolpost . Figure 4C shows
the percentage of contribution of the number of connections over
the Dcontrolpre in all frequency bands and areas. Both number and
weight parameters contribute equally (around 50% each one) to
Dcontrolpre , i.e. the number and weight of connections increase or
25decrease simultaneously after traumatic brain injury in the majority
of the brain area connections and in different frequency bands.
Only in the beta frequency band can we observe a predominance
of the number of connections for frontal-central, right temporal–
central and left temporal–central areas coupling. However, in post-
30rehabilitation, one of these connectivity parameters components
has a greater contribution to recovery (distance-to-control reduc-
tion) than the other one. Local connections in delta-based con-
nectivity inside the frontal area experimented a reduction of
distance-to-control from pre-rehabilitation values of 59%, leading
35Dcontrolpost ¼ 10%, where only 9% is caused by differences in the
number of couplings with respect to control values. This parameter
has been reduced by 82% from pre-rehabilitation values, conclud-
ing that the reduction in the number of links in the frontal region
AlphaThetaDelta
F LT C F-LT
F-RTORT F-O RT-LT RT-C LT-C
F-RTORT F-O RT-LT RT-C LT-C
F-C RT-O LT-O O-C
F LT C F-LT F-C RT-O LT-O O-C
0
50%
100%
0
50%
100%
45
30
15
%nu
mbe
r of
link
s/di
stan
ce%
num
ber
of li
nks/
dist
ance
Delta Alpha
Number Weight
Beta
Number Weight
Frontal (F)
Dpercontrol
Dpercontrol
Dpercontrol
Dpostcontrol
Dpostcontrol
Npost Wpost=
=
=Wper+
+
+A B
DC
Nper
Nper Wper
Figure 4 Since distance-to-control depends on both number and weight of coupling, we can study which connectivity parameter is
responsible for distance reduction. The responsible mechanism for recovery is defined as the parameter which has a greater reduction of its
statistical values from pre- to post-rehabilitation, with a non-dominant contribution degree in Dcontrolpost . (A) Percentage of contribution of the
number of connections over Dcontrolpre (red line) and Dcontrol
post (black line) for the delta spectral band. Both parameters equally contribute
(�50%) to Dcontrolpre . However, a non-equivalent behaviour is found in Dcontrol
post , i.e. depending on the connections in brain areas, one of the
parameters contribute more than the other over Dcontrolpost . (B) For illustrative purposes, we show the detailed case of distance-to-control
reduction in local connection for the frontal area. Number and weight equally contribute to Dcontrolpre , while post-rehabilitation connectivity
parameters change in a different way from ones pre-rehabilitation. Whereas the weight of coupling remains practically invariant, the
number of connections reduces by 93%. We can conclude, in this case, that the reduction in the number of links within the frontal area is
the responsible mechanism of recovery. (C) Percentage of contribution of the number of connections over Dcontrolpre for all frequency bands
and brain regions. For most brain areas both number and weight of connections increase (or decrease) simultaneously after traumatic brain
injury. (D) Mechanism responsible for reduction in Dcontrolpost in the delta and alpha spectral bands. C= central; F = frontal; LT = left temporal;
O=occipital; RT= right temporal.
Connectivity recovery after injury Brain 2010: Page 7 of 17 | 7
NOT FORPUBLIC RELEASE
K:/oup/brain/awq174.3d [17.6.2010–5:17pm] [1–17] Paper: awq174
Copyedited by: AH MANUSCRIPT CATEGORY: ORIGINAL ARTICLE
is the responsible phenomenon of distance-to-control reduction
(example illustrated in Fig. 4A and B). Additionally, local connec-
tions in temporal lobes approached to control values with a re-
duction of distance-to-control of 68, 56 and 65% for right
5 temporal, frontal-right temporal and frontal-left temporal, respect-
ively. Dcontrolpost in right temporal local connections are mainly caused
by the number of connections with a 70% of contribution of this
parameter over Dcontrolpost , whereas the number of connections with
the frontal regions, is the one that causes a Dcontrolpost of 65 and
10 82%, respectively. The responsible mechanism of recovery for
right temporal is the reduction in the coupling weight, as opposed
to left and right temporal and frontal interactions for which the
number of links is responsible. In the alpha spectral band, the
number of links reduce the distance-to-control of local connec-
15 tions inside central (this parameter reduces 45%), and right tem-
poral–occipital and left temporal–occipital areas, with a reduction
of 59 and 47%, respectively. Weight is the responsible mechanism
for local connections inside frontal (55% of reduction from pre- to
post-rehabilitation values), while occipital-frontal and occipital-
20 central connections decrease to 48 and 66%, respectively. Figure
4B summarizes the results for the delta and alpha bands. No stat-
istically significant responsible mechanism was found in the theta
frequency band. In the beta spectral interval we just found a re-
duction of the weight of local connections in the central area (not
25 shown).
Statistical test P-values for number and weight couplings are
showed in Table 2.
Correlation between connectivityparameters and neuropsychological
30 test score changesFurther post hoc analyses were performed to explore whether
changes in the neuropsychological test scores of patients were
related to changes in functional connectivity for all frequency
bands. The correlations were computed for changes between
35 pre- to post-rehabilitation connectivity parameters and the neuro-
psychological results of each group. Subsequently, Pearson’s cor-
relation coefficients were calculated and t-tests were performed
(P50.001). For the delta band, significant negative correlations
were found between the Verbal Fluency Test and weight connect-
40 ivity changes between brain areas (Fig. 5A): frontal-right temporal
(R=�0.69), central-left temporal (R=�0.72), central-right tem-
poral (R=�0.72), occipital-right temporal (R=�0.71), frontal-
occipital (R=�0.71), right temporal (R=�0.75). Thus the higher
reduction on delta band based-connectivity, the higher improve-
45 ment at post-rehabilitation. Alternatively, in the theta band, sig-
nificant negative correlations were found between PCRS score and
the number of neural connections (Fig. 5B): frontal-central
(R=�0.81), frontal-central in correlation with weight changes
(R=�0.7), central-left temporal (R=�0.76), central-right tem-
50 poral (R=�0.76), occipital-central (R=�0.70), occipital-central
in correlation with weight changes (R= �0.7) and central
(R=�0.68). For the alpha band, significant positive correlations
were found between the Perceptual Organization Index and the
connectivity parameters in some brain areas (Fig. 6A): frontal-
55central number of connections (R= 0.65), central-left temporal
number of connections (R= 0.81), central-right temporal number
of connections (R= 0.68) and central connection weight
(R= 0.71). The alpha band also showed significant positive correl-
ations between the Working Memory Index (WAIS-III) and the
60number of connections in specific brain areas (Fig. 6B): frontal-left
temporal (R= 0.82), frontal-right temporal (R= 0.7), frontal-
occipital (R= 0.84), frontal-central (R= 0.72), frontal (R= 0.77)
and central (R= 0.7). Finally, regarding the beta band, significant
positive correlations were found between the PCRS score and
65brain area connectivity parameters (Fig. 7): frontal-central connec-
tion weight (R= 0.74), central-left temporal connection weight
(R= 0.79), central-left temporal number of connections
(R= 0.74), central-right temporal connection weight (R= 0.74),
occipital-central connection weight (R= 0.77), occipital-central
70number of connections (R= 0.77) and central connection weight
(R= 0.72).
Topology discriminationThe architecture of the functional connectivity network may be a
discriminant population characteristic. To capture the differences in
75connectivity pattern topology we use linear discriminant analysis as
a dimension reduction technique able to classify each person as
belonging to an identified group. Values of Fisher are checked to
see if they are significantly different, in order to be able to enu-
merate those connecting areas where pre-rehabilitation Fisher
80values are distinguishable from post-rehabilitation and control
Fisher values, but post-rehabilitation Fisher values are indistin-
guishable from control Fisher values (grey line in Fig. 8).
However, we also mark those areas where the recovery phenom-
enon is not complete; pre-rehabilitation Fisher values are distin-
85guishable from post-rehabilitation and control Fisher values, but
post-rehabilitation Fisher values are not indistinguishable from
control Fisher values yet (black line in Fig. 8). Long connections
experience more improvement in the delta frequency band. The
wiring reorganization after treatment makes the topology of
90post-rehabilitation patients’ networks more similar to the control
networks topology when compared to the pre-rehabilitation pa-
tients’ topology within the following areas: right temporal–left
temporal, right temporal–central, frontal-central, frontal-occipital
and right temporal–occipital. In the theta spectral band the
95sub-networks reaching a complete restoration and then becoming
indistinguishable, are those involving the frontal-right temporal,
frontal-occipital, frontal-central, left temporal–central and central
areas. In the alpha frequency band the links between frontal-left
temporal, frontal-occipital and right temporal–central areas reach
100indistinguishable separating values and the network topology
within the central area experiences an incomplete phenomenon.
In the beta spectral band, reorganization leads to restoring topol-
ogies in local networks within frontal and occipital areas, and
frontal-occipital, frontal-right temporal and frontal-left temporal
105areas, whereas reorganization in the right temporal area has an
incomplete recovery.
8 | Brain 2010: Page 8 of 17 N. P. Castellanos et al.
NOT FORPUBLIC RELEASE
K:/o
up/brain/awq174.3d
[17.6.2010–5:17pm]
[1–17]
Paper:awq174
Copyedite
dby:AH
MANUSCRIPTCATEGORY:
ORIG
INALARTICLE
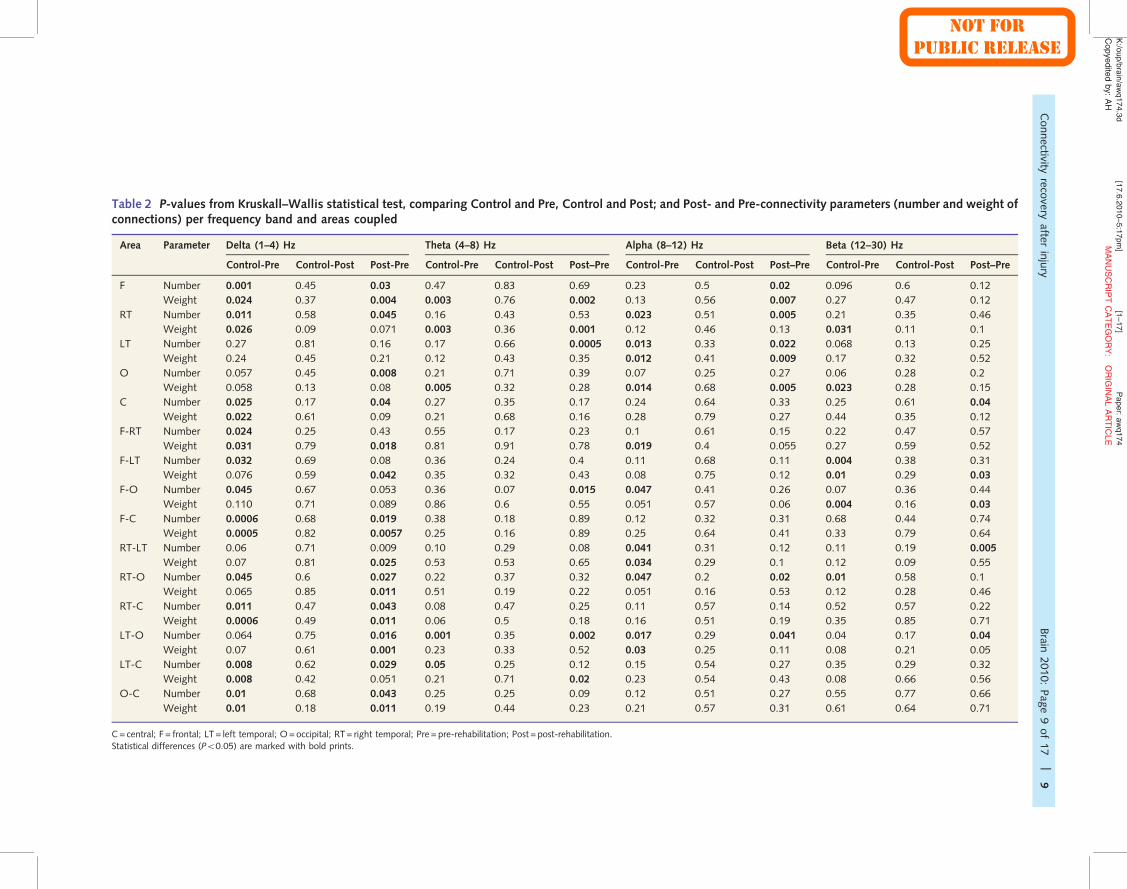
Table 2 P-values from Kruskall–Wallis statistical test, comparing Control and Pre, Control and Post; and Post- and Pre-connectivity parameters (number and weight ofconnections) per frequency band and areas coupled
Area Parameter Delta (1–4) Hz Theta (4–8) Hz Alpha (8–12) Hz Beta (12–30) Hz
Control-Pre Control-Post Post-Pre Control-Pre Control-Post Post–Pre Control-Pre Control-Post Post–Pre Control-Pre Control-Post Post–Pre
F Number 0.001 0.45 0.03 0.47 0.83 0.69 0.23 0.5 0.02 0.096 0.6 0.12
Weight 0.024 0.37 0.004 0.003 0.76 0.002 0.13 0.56 0.007 0.27 0.47 0.12
RT Number 0.011 0.58 0.045 0.16 0.43 0.53 0.023 0.51 0.005 0.21 0.35 0.46
Weight 0.026 0.09 0.071 0.003 0.36 0.001 0.12 0.46 0.13 0.031 0.11 0.1
LT Number 0.27 0.81 0.16 0.17 0.66 0.0005 0.013 0.33 0.022 0.068 0.13 0.25
Weight 0.24 0.45 0.21 0.12 0.43 0.35 0.012 0.41 0.009 0.17 0.32 0.52
O Number 0.057 0.45 0.008 0.21 0.71 0.39 0.07 0.25 0.27 0.06 0.28 0.2
Weight 0.058 0.13 0.08 0.005 0.32 0.28 0.014 0.68 0.005 0.023 0.28 0.15
C Number 0.025 0.17 0.04 0.27 0.35 0.17 0.24 0.64 0.33 0.25 0.61 0.04
Weight 0.022 0.61 0.09 0.21 0.68 0.16 0.28 0.79 0.27 0.44 0.35 0.12
F-RT Number 0.024 0.25 0.43 0.55 0.17 0.23 0.1 0.61 0.15 0.22 0.47 0.57
Weight 0.031 0.79 0.018 0.81 0.91 0.78 0.019 0.4 0.055 0.27 0.59 0.52
F-LT Number 0.032 0.69 0.08 0.36 0.24 0.4 0.11 0.68 0.11 0.004 0.38 0.31
Weight 0.076 0.59 0.042 0.35 0.32 0.43 0.08 0.75 0.12 0.01 0.29 0.03
F-O Number 0.045 0.67 0.053 0.36 0.07 0.015 0.047 0.41 0.26 0.07 0.36 0.44
Weight 0.110 0.71 0.089 0.86 0.6 0.55 0.051 0.57 0.06 0.004 0.16 0.03
F-C Number 0.0006 0.68 0.019 0.38 0.18 0.89 0.12 0.32 0.31 0.68 0.44 0.74
Weight 0.0005 0.82 0.0057 0.25 0.16 0.89 0.25 0.64 0.41 0.33 0.79 0.64
RT-LT Number 0.06 0.71 0.009 0.10 0.29 0.08 0.041 0.31 0.12 0.11 0.19 0.005
Weight 0.07 0.81 0.025 0.53 0.53 0.65 0.034 0.29 0.1 0.12 0.09 0.55
RT-O Number 0.045 0.6 0.027 0.22 0.37 0.32 0.047 0.2 0.02 0.01 0.58 0.1
Weight 0.065 0.85 0.011 0.51 0.19 0.22 0.051 0.16 0.53 0.12 0.28 0.46
RT-C Number 0.011 0.47 0.043 0.08 0.47 0.25 0.11 0.57 0.14 0.52 0.57 0.22
Weight 0.0006 0.49 0.011 0.06 0.5 0.18 0.16 0.51 0.19 0.35 0.85 0.71
LT-O Number 0.064 0.75 0.016 0.001 0.35 0.002 0.017 0.29 0.041 0.04 0.17 0.04
Weight 0.07 0.61 0.001 0.23 0.33 0.52 0.03 0.25 0.11 0.08 0.21 0.05
LT-C Number 0.008 0.62 0.029 0.05 0.25 0.12 0.15 0.54 0.27 0.35 0.29 0.32
Weight 0.008 0.42 0.051 0.21 0.71 0.02 0.23 0.54 0.43 0.08 0.66 0.56
O-C Number 0.01 0.68 0.043 0.25 0.25 0.09 0.12 0.51 0.27 0.55 0.77 0.66
Weight 0.01 0.18 0.011 0.19 0.44 0.23 0.21 0.57 0.31 0.61 0.64 0.71
C= central; F = frontal; LT = left temporal; O=occipital; RT = right temporal; Pre = pre-rehabilitation; Post = post-rehabilitation.Statistical differences (P50.05) are marked with bold prints.
Connectivity
recovery
afterinjury
Brain
2010:Pag
e9of17
|9
NOT FORPUBLIC RELEASE
K:/oup/brain/awq174.3d [17.6.2010–5:17pm] [1–17] Paper: awq174
Copyedited by: AH MANUSCRIPT CATEGORY: ORIGINAL ARTICLE
DiscussionIn this study we were able to add to our knowledge about the
neurophysiological mechanisms underlying brain plasticity that
enable restoration of function after damage. Thus, by recording
5 biomagnetic activity from patients with traumatic brain injury fol-
lowing a traumatic brain injury (pre-rehabilitation) and those after
(post-) rehabilitation, as well as activity from age-matched control
subjects, it was possible to describe changes in functional connect-
ivity at the neurophysiologic level related to changes observed at
10the behavioural level. Connectivity profiles for the control
and post-rehabilitation groups’ connectivity patterns were more
similar in the four frequency bands when compared to the
pre-rehabilitation patterns. Specifically, comparison between
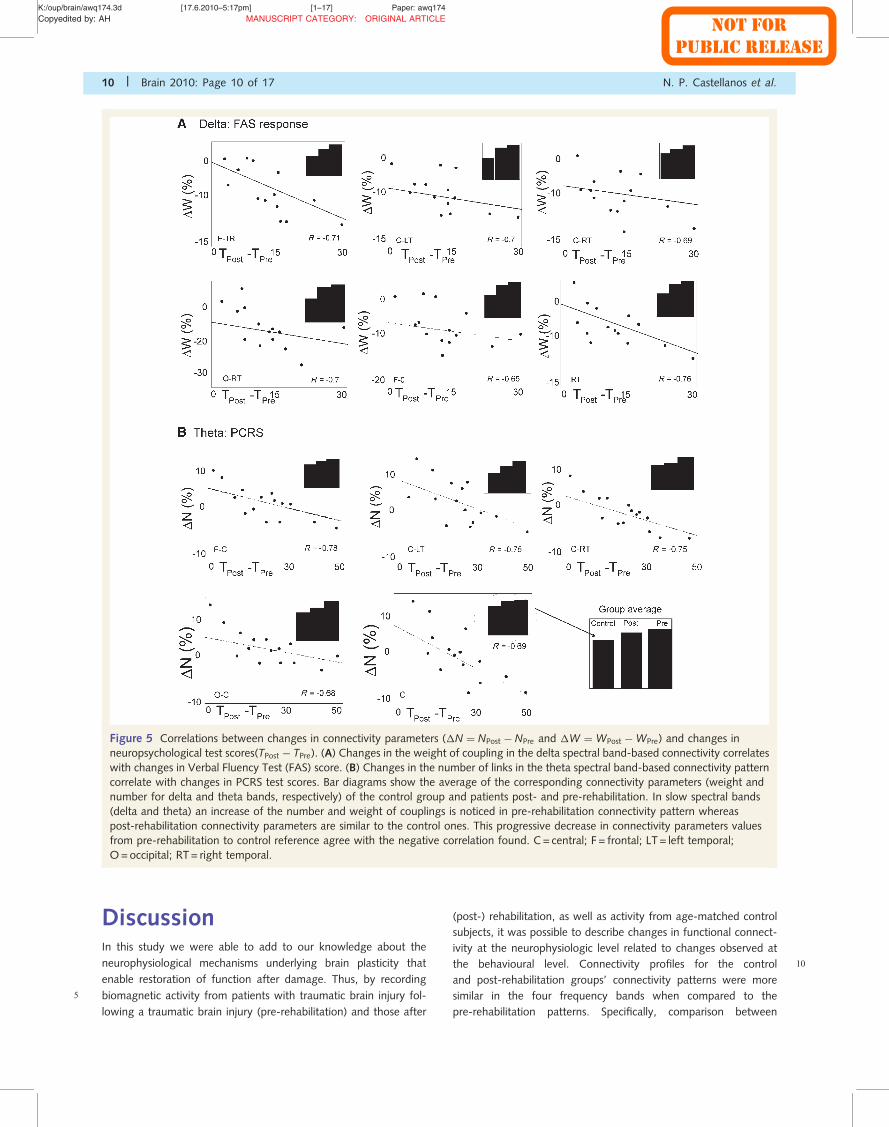
Figure 5 Correlations between changes in connectivity parameters (�N ¼ NPost � NPre and �W ¼ WPost �WPre) and changes in
neuropsychological test scores(TPost � TPre). (A) Changes in the weight of coupling in the delta spectral band-based connectivity correlates
with changes in Verbal Fluency Test (FAS) score. (B) Changes in the number of links in the theta spectral band-based connectivity pattern
correlate with changes in PCRS test scores. Bar diagrams show the average of the corresponding connectivity parameters (weight and
number for delta and theta bands, respectively) of the control group and patients post- and pre-rehabilitation. In slow spectral bands
(delta and theta) an increase of the number and weight of couplings is noticed in pre-rehabilitation connectivity pattern whereas
post-rehabilitation connectivity parameters are similar to the control ones. This progressive decrease in connectivity parameters values
from pre-rehabilitation to control reference agree with the negative correlation found. C= central; F = frontal; LT = left temporal;
O=occipital; RT= right temporal.
10 | Brain 2010: Page 10 of 17 N. P. Castellanos et al.
NOT FORPUBLIC RELEASE
K:/oup/brain/awq174.3d [17.6.2010–5:17pm] [1–17] Paper: awq174
Copyedited by: AH MANUSCRIPT CATEGORY: ORIGINAL ARTICLE
pre- and post-rehabilitation stages revealed a loss of local and
long-distance slow band-based connectivity and an increase in
higher spectral band-based connections. The reduction of
delta-band-based connections and the increment of those based
5 in the alpha band correlates with Verbal Fluency Test scores, as
well as with the Perceptual Organization and Working Memory
indexes of the WAIS-III, respectively. Additionally, changes on
connectivity values based on theta and beta bands correlate
with the PCRS, which reflects a general improvement in a patient’s
10 ability to carry out everyday activities. Finally, network architec-
tures in patients were checked to see if they were distinguishable
from control topology by means of a linear discriminant analysis,
and showed a greater similarity with respect to control topology
in post-rehabilitation patients than those pre-rehabilitation. To
15 our knowledge, the current study is the first to provide some
evidence about the capability of non-invasive connectivity meas-
ures to study the functionality and recovery of brain tissue in
patients with traumatic brain injury compared to healthy subjects,
showing that changes in functional connectivity at the neurophy-
20 siologic level are related to changes observed at the behavioural
level.
Pre–post comparison at theneuropsychological levelThe neuropsychological results reflect improvement, with an ap-
25proach of patients post–rehabilitation to the healthy control group
in terms of most neuropsychological tests scores and when com-
pared to patients pre-rehabilitation. The analyses revealed that
scores post-rehabilitation differed from those obtained by patients
pre-rehabilitation, with higher scores after the cognitive interven-
30tion. Additionally, controls and pre-rehabilitation patients showed
statistically significant differences in most of the cognitive domains
evaluated; while post-rehabilitation those differences between pa-
tients and controls were clearly reduced. Although some punctu-
ations improved significantly in the post-rehabilitation assessment
35(compared with pre-rehabilitation), some other punctuations con-
tinued, showing statistically significant differences with the control
group. This trend can represent a cognitive partial improvement
related to the fact that patients recovered in a significant way but
did not reach full reestablishment of their cognitive processes.
40Nevertheless this is a valuable result with clinically relevant impli-
cations, which serves as an indicator of recovery, showing that
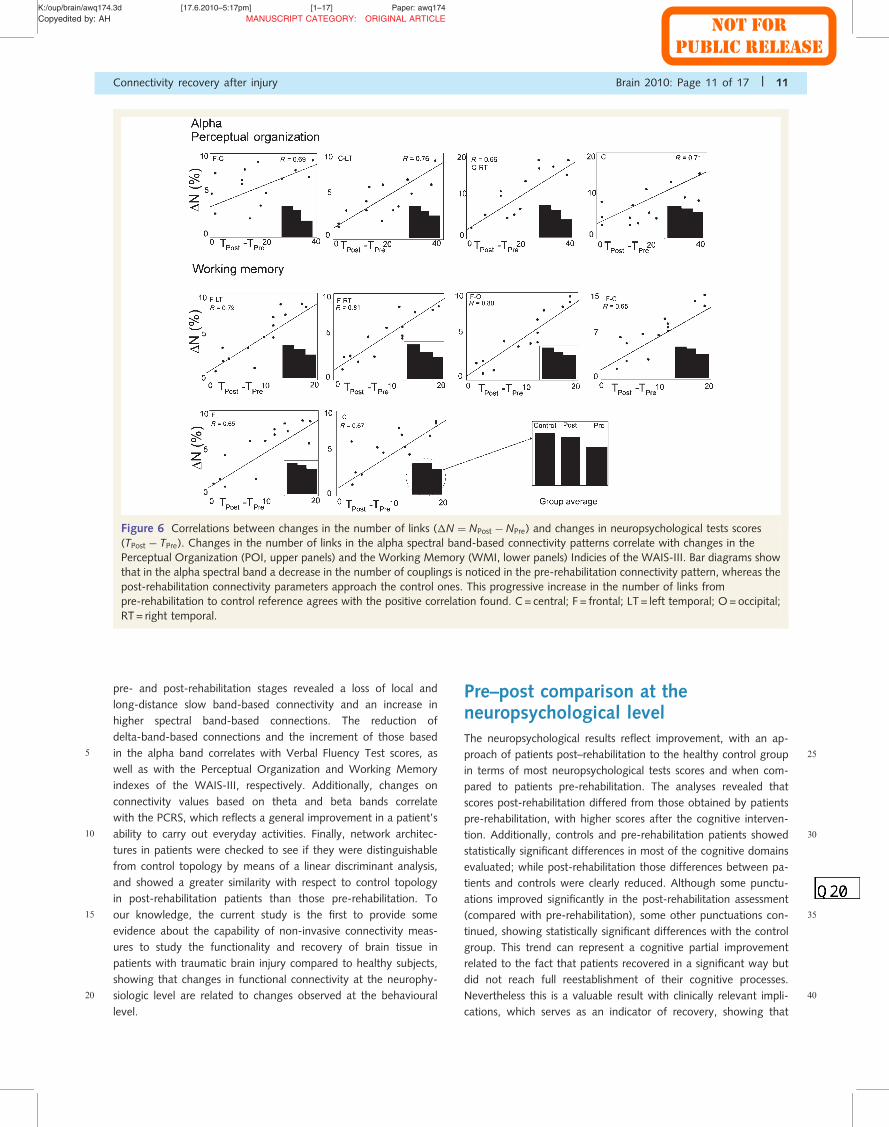
Figure 6 Correlations between changes in the number of links (�N ¼ NPost � NPre) and changes in neuropsychological tests scores
(TPost � TPre). Changes in the number of links in the alpha spectral band-based connectivity patterns correlate with changes in the
Perceptual Organization (POI, upper panels) and the Working Memory (WMI, lower panels) Indicies of the WAIS-III. Bar diagrams show
that in the alpha spectral band a decrease in the number of couplings is noticed in the pre-rehabilitation connectivity pattern, whereas the
post-rehabilitation connectivity parameters approach the control ones. This progressive increase in the number of links from
pre-rehabilitation to control reference agrees with the positive correlation found. C= central; F = frontal; LT = left temporal; O= occipital;
RT = right temporal.
Connectivity recovery after injury Brain 2010: Page 11 of 17 | 11
NOT FORPUBLIC RELEASE
K:/oup/brain/awq174.3d [17.6.2010–5:17pm] [1–17] Paper: awq174
Copyedited by: AH MANUSCRIPT CATEGORY: ORIGINAL ARTICLE
patients improved in several cognitive domains such as attention,
memory and executive functions in agreement with other previous
reports (Cicerone et al., 2005; Rholing et al., 2009).
Pre–post comparison at the5 neurophysiologic level
Whether changes in neuropsychological scores are related or not
to changes at the physiological level has been a matter of debate.
In this work, we tried to describe and compare changes at the
physiological level and changes at the neuropsychological level by
10 means of functional connectivity. Concerning spectral content, a
widespread pattern of statistical differences was revealed when
comparing pre- and post-rehabilitation connectivity profiles in
slow wave bands, as well as with healthy control patterns.
Pre-rehabilitation, patients showed higher generalized delta band
15connectivity values than the control group. Conversely, post-
rehabilitation patients and controls did not differ statistically in
number or weight of their local or long-distance delta band-based
connectivity. Additionally, theta band-based connectivity showed
significant changes in the weight of local connections in frontal
20and right temporal lobes, as well as in bilateral temporoposterior
and centroposterior mid-distance connections. The fact that pa-
tients and controls do not differ in their patterns of slow band
connectivity post-rehabilitation indicates recovery of the
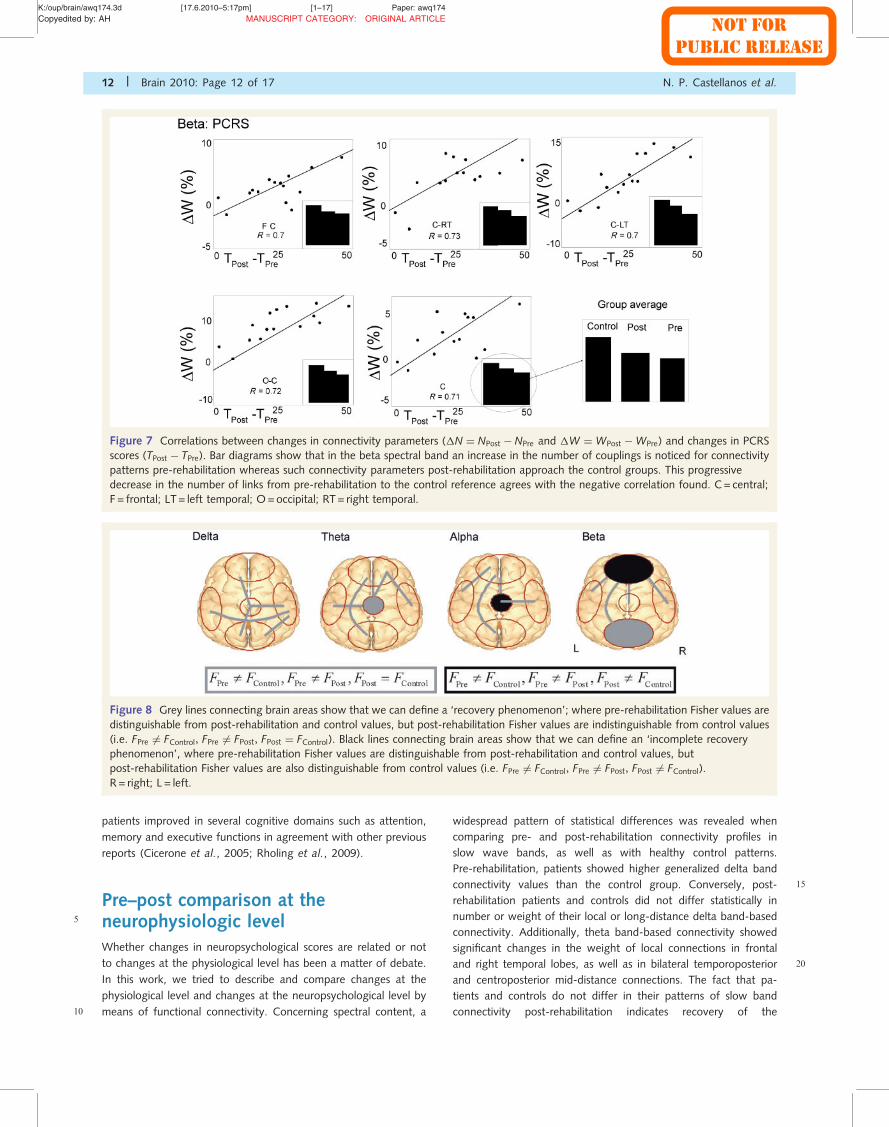
Figure 7 Correlations between changes in connectivity parameters (�N ¼ NPost � NPre and �W ¼ WPost �WPre) and changes in PCRS
scores (TPost � TPre). Bar diagrams show that in the beta spectral band an increase in the number of couplings is noticed for connectivity
patterns pre-rehabilitation whereas such connectivity parameters post-rehabilitation approach the control groups. This progressive
decrease in the number of links from pre-rehabilitation to the control reference agrees with the negative correlation found. C= central;
F = frontal; LT = left temporal; O=occipital; RT= right temporal.
Figure 8 Grey lines connecting brain areas show that we can define a ‘recovery phenomenon’; where pre-rehabilitation Fisher values are
distinguishable from post-rehabilitation and control values, but post-rehabilitation Fisher values are indistinguishable from control values
(i.e. FPre 6¼ FControl, FPre 6¼ FPost, FPost ¼ FControl). Black lines connecting brain areas show that we can define an ‘incomplete recovery
phenomenon’, where pre-rehabilitation Fisher values are distinguishable from post-rehabilitation and control values, but
post-rehabilitation Fisher values are also distinguishable from control values (i.e. FPre 6¼ FControl, FPre 6¼ FPost, FPost 6¼ FControl).
R = right; L = left.
12 | Brain 2010: Page 12 of 17 N. P. Castellanos et al.
NOT FORPUBLIC RELEASE
K:/oup/brain/awq174.3d [17.6.2010–5:17pm] [1–17] Paper: awq174
Copyedited by: AH MANUSCRIPT CATEGORY: ORIGINAL ARTICLE
connectivity profiles related with this frequency band. The patho-
logical increase of slow wave connectivity is widely documented in
literature, for example in tumours and stroke (Bosma et al., 2008,
2009), as well as in traumatic brain injury (Lewine et al., 1999,
5 2007). Concerning connectivity, Bosma et al. (2008, 2009) recent-
ly demonstrated that synchronization in the theta band (as mea-
sured by synchronization likelihood and phase lag index) is
significantly higher in patients with low-grade glioma than in
matched healthy controls, and in patients with brain tumour
10 (Bartolomei et al., 2006a, b; Douw et al., 2008). Thus, from our
results, it seems that the increased delta band coherence in pa-
tients with traumatic brain injury reflects a generalized physiologic-
al malfunctioning that diminishes with cognitive recovery. In fact,
the loss of mid (frontotemporal) and long-distance (frontoocci-
15 pital) frontal connectivity is correlated negatively with the im-
provement on Verbal Fluency Test scores. Those patients with
traumatic brain injury that showed greater improvement in
verbal fluency were those that showed greater loss of delta
band-based functional connectivity. A pathological increase of
20 theta band functional connectivity compared to healthy controls
has also been reported in other patient groups, such as those with
Alzheimer’s (Stam et al., 2006) and depressed (Fingelkurts et al.,
2007) and autistic adults (Murias et al., 2007). The nature of pa-
tients’ brain lesions in all of those studies varied greatly, indicating
25 that there seems to be a very robust effect of brain injury on theta
band activity. The decrease in theta functional connectivity in pa-
tients post-rehabilitation is related to the improvement of cognitive
functioning, as it correlates with PCRS scores. These results dem-
onstrate that traumatic brain injury induces changes in functional
30 connectivity that may contribute to explaining the cognitive def-
icits commonly seen in this pathology (Tucha et al., 2000).
Alpha oscillations have been associated with working memory
(for review see Palva and Palva, 2007) and attentional functions
(Gootjes et al., 2006). Our results show that most of the connec-
35 tions in this band sustained statistically significant changes
post-rehabilitation, based on the number of connections.
Additionally, local frontal and temporal as well as mid- and
long-distance frontocentral and frontooccipital connections chan-
ged their weight. Furthermore, when connectivity profiles were
40 compared with the control group, patients with traumatic brain
injury showed greater differences at the pre-rehabilitation stage,
indicating a lower number and weight of their connections.
However, post-rehabilitation patients showed a clear improve-
ment, having a profile closer to that demonstrated by the control
45 group. Alterations in frontoparietal synchrony could be an import-
ant factor contributing to working memory and executive function
processes, since in normal subjects working memory or direct at-
tentional tasks involve transient synchronization between these
two regions (von Stein and Sarnthein, 2000; Halgren et al.,
50 2002). Our data showed a relationship between alpha band-based
connections and perceptual and working memory functions. Thus,
those patients with greater improvements in the number and
weight of their connections also showed increased scores in the
Working Memory Index and Perceptual Organization Index of the
55 WAIS-III. All these data could be interpreted under the model of
‘global neuronal workspace’ (Dehaene et al., 1998). This model
emphasizes the importance of the relationship between sensory
regions and frontoposterior networks in information processing.
Perceptual organization index involves both sensory and working
60memory abilities, increasing the necessity of information integra-
tion within the brain. Additionally, Palva and Palva (2007) propose
that the alpha band is responsible for the synchronization of work-
ing memory networks. Based on this framework, improvements in
weight and number of alpha band connections between fronto-
65posterior regions could be a physiological sign of cognitive
recovery.
Regarding the beta band, patients showed few changes in the
number of mid-distance connections (between right temporal and
occipital and central regions) when pre- and post-rehabilitation
70stages were compared. However, comparison with the control
group revealed that the local frontal, right temporal and long dis-
tance frontooccipital, as well as right temporal–occipital differ-
ences found pre-rehabilitation were released after rehabilitation.
Again, these changes in the beta band could represent a physio-
75logical effect of the rehabilitation process. The correlation found
between PCRS score and the decrease-increase in connectivity in
the theta and beta frequency bands, respectively, is of great inter-
est. The PCRS reflects a patient’s current ability to adapt to daily
living activities. PCRS scores improve after the rehabilitation pro-
80cess, because patients and relatives ratings became closer. We
found that those patients who decreased theta and increased
beta band connectivity, respectively, between anterior (frontal
and central) and posterior regions (temporal lobes and occipital
region) were those that showed greater improvements in their
85PCRS values. Thus, it seems that changes in anteroposterior con-
nectivity improve their ability to adapt to daily living activities.
Although several changes were found in the between-group
comparison for post-rehabilitation patients and controls, some of
the differences found pre-rehabilitation remained stable across
90time. While statistical differences were lost for the delta and
theta bands, some differences in the alpha and beta bands were
not modified after the rehabilitation process. Those differences
that remain stable after rehabilitation are local and long distance
alpha and beta connections related with the left temporal lobe
95(left temporal–right temporal, left temporal–frontal and left tem-
poral–occipital). It is of interest to highlight that those cognitive
scores that better correlate with patterns of connectivity were also
those related with visuospatial and perceptual functions normally
related to the right hemisphere. In fact, while at pre-rehabilitation
100both verbal and performance IQ were statistically different from
the control group, after treatment only verbal IQ still showed
differences between patients and controls. This could explain
why left temporal lobe connectivity parameters still indicated
statistical differences between patients and controls after
105rehabilitation.
Mathematical and experimentalconsiderationsWe are aware that volume conduction effects could be affecting
the connectivity pattern because of the influence of common
110sources. Nearby MEG sensors have a high probability of capturing
activity from common sources, and therefore show spurious strong
Connectivity recovery after injury Brain 2010: Page 13 of 17 | 13
NOT FORPUBLIC RELEASE
K:/oup/brain/awq174.3d [17.6.2010–5:17pm] [1–17] Paper: awq174
Copyedited by: AH MANUSCRIPT CATEGORY: ORIGINAL ARTICLE
correlation. Several attempts have been proposed to overcome this
problem. The first approach is studying functional connectivity in
source space. However, to date there is no reliable way to choose
the proper model to solve the inverse problem (Hadjipapas et al.,
5 2005; Stam et al., 2009). Another approach is the use of measures
of correlation that are not sensitive to volume conduction, such as
the phase lag index (Stam et al., 2007) or the imaginary part of
the coherency (Nolte et al., 2004). However, we consider that
volume conduction effects could not explain the group differences
10 in the connectivity measures that we found. Our results agree
with previous studies of brain injury. In this work we show that
slow wave based-connectivity increases after a traumatic injury,
and decreases after recovery (even restoring control values). The
pathological increase of slow wave-based connectivity and the
15 increase of higher band-based connectivity have been reported
in studies of tumours (Bartolomei et al., 2006a, b; Bosma et al.,
2009). Moreover, in this study the postoperative decrease of theta
synchronization, using phase lag index, could be interpreted as a
tendency towards a more ‘normal’ state of the theta band after
20 tumour resection, an idea corroborated by the decrease of seizure
frequency. On the other hand, Bosma et al. (2008) reported an
increase of theta band functional connectivity in patients com-
pared to controls, using synchronization likelihood. This agree-
ment, even using different measures of functional connectivity,
25 is interpreted by these authors as a robustness of the results
(Bosma et al., 2008). In a recent work by Stam et al. (2009),
the authors compare phase lag index results with other obtained
with several linear and non-linear measures, displaying a few dif-
ferences but suggesting that ‘Since the phase lag index results are
30 largely in line with the previous studies we can conclude that the
influence of volume conduction may have been smaller than has
sometimes been suggested’. In order to check whether our results
are contaminated by a common source or not, we have calculated
the functional connectivity and hence the distance-to-control for
35 pre- and post-rehabilitation and control subjects in delta band
using phase lag index. As Supplementary Fig. 1 shows, the
distance-to-control (in this case only coupling strengths are
taken into account) is higher pre- than post-rehabilitation. Thus,
a recovery (in terms of approach to control) is also observed with
40 phase lag index as well as with wavelet-coherence. Therefore, we
consider that we can be confident in our results, the pathological
increase of delta ban-based connectivity and the approach to con-
trol values observed in patients post-rehabilitation. Moreover, in
this work we have adopted an alternative approach, analysing
45 functional connectivity in sensor space and then grouping the
sensor pairs in local and long distance couplings. We spatially
averaged sensors in five regions (frontal, right temporal, left tem-
poral, central and occipital). Wavelet-coherence could be influ-
enced by volume conduction; however it is less likely that such
50 effect can explain group differences in functional connectivity be-
tween patients with traumatic brain injury, both pre- and
post-rehabilitation, and controls. Furthermore, our results showed
changes not only in local, but in long distance connections, which
are less likely to be due to volume conduction. Consequently, a
55 general change in these regions must occur to be detected as a
group difference. Another technical limitation could be due to the
influence of power on the connectivity changes. Our results
showed a generalized change in the connectivity pattern in all
frequency bands. However, no significant correlation has been
60found between power and connectivity changes in all frequency
bands (Supplementary Fig. 2 and Supplementary Table 1), sup-
porting the idea that the connectivity changes reported in this
work are not affected by spectral changes. This absence of cor-
relation could also be an argument to support that a common
65source does not alter the functional connectivity, since a
common source could be expected to alter signal power. On the
other hand, because a direct relation between the position of the
sensor and the immediate brain region underneath cannot be fully
assumed we should take into account that the labels describing
70brain regions used to describe profiles of connectivity could be
subjected to some spatial deviations. However to limit this effect
we have clustered the signals in the sensor space into five sensor
groups
The interpretation of our results could be limited because of the
75lack of a patient group that did not receive neuropsychological
rehabilitation. In order to evaluate a general effect of rehabilitation
patients with traumatic brain injury should be included that do not
receive rehabilitation and they should be scanned twice, with a
similar interval to those patients that receive treatment. This is
80necessary to control for spontaneous recovery phenomena. In
this case it would be very important to ensure that patients did
not receive any kind of rehabilitation (i.e. motor, language,
memory) for about 9–14 months, in order to act as a true control
group. However, according to the Declaration of Helsinki, a treat-
85ment that has already demonstrated benefits for a particular popu-
lation of patients should not be denied purely for experimental
reasons. Taking into account this limitation, the current study pro-
vides new evidence for the neurophysiologic mechanisms under-
lying the process of neuronal plasticity after brain injury, but does
90not pretend to be a measure (or test) of effectiveness of rehabili-
tation. Future studies should evaluate whether: (i) these changes
measured during resting state are reproducible during cognitive
task performance; (ii) patients with traumatic brain injury and
stroke show similar profiles of connectivity recovery or not;
95(iii) functional connectivity measures are capable of distinguishing
between differential neuropsychological and functional outcomes;
and (iv) patients at different ages show a differential pattern
of functional connectivity recovery. In this study we did not find
correlation between connectivity changes and age (Supplementary
100Fig. 3). This result may be due to a lack of enough variability in
age to find a statistical correlation.
Our results support the idea of brain functioning as an inte-
grated complex network, in which focal changes can alter the
integrity of the brain as a whole and its functional status. The
105neurophysiological processes underlying brain damage could be
affected by the number of neurons left, but also, and most im-
portantly, by the way they function and the connections they are
able to make. These aspects determine functional outcome. Also
the rewiring, or evolution, of the topology is a characteristic that
110might reflect the global structure of the neural systems. In this
work we use linear discriminant analysis as a tool that captures
the general architecture of the network and is able to discriminate
groups according to their topology. However, an approach that
catches in more detail the interplay between segregation and
14 | Brain 2010: Page 14 of 17 N. P. Castellanos et al.
NOT FORPUBLIC RELEASE
K:/oup/brain/awq174.3d [17.6.2010–5:17pm] [1–17] Paper: awq174
Copyedited by: AH MANUSCRIPT CATEGORY: ORIGINAL ARTICLE
integration mechanisms could be graph theory-based analysis
(Bullmore and Sporns, 2009; Nakamura et al., 2009, Stam,
2010). Future studies should evaluate whether graph theory ana-
lysis could improve the understanding of the mechanisms of neural
5 plasticity induced by the rehabilitation process. Some computa-
tional models study the effect of damage and posterior recovery
of brain networks characteristics after injury (Honey and Sporns,
2008, Rubinov et al., 2009 Alstott et al., 2009; Butz et al.,
2009).These models agree that the area producing the largest
10 and most widespread injury-effects on functional interactions are
those being highly connected. Alstott and colleagues (2009)
demonstrated that the target attack over the frontal lobe induces
a severe disruption of the network. In the current study the ma-
jority of patients showed impairment over the frontal lobe. Thus
15 the lesion on this brain region influences the difference between
controls and patients pre-rehabilitation; and furthermore changes
in the pattern of connectivity of the frontal lobe and other regions
correlates with working memory score changes in the alpha band.
Thus, the improvement of the connectivity in this region correlates
20 with the improvement cognitive changes.
The literature shows several examples of pathological increase
and decrease of functional connectivity, which provide evidence
for the idea that a balance in the level of synchronization in
healthy controls is required for optimal brain functioning. This
25 study supports several ideas: (i) that reorganization of brain net-
works affects and even restores healthy functional connectivity
patterns in patients with traumatic brain injury; (ii) that the re-
organization of a network can be executed by means of different
mechanisms, increasing (or decreasing, when needed) the number
30 or weight of its links, and that these mechanisms are responsible
for composing a network or organizing its topology; and (iii) we
provide evidence that changes in functional connectivity at the
neurophysiological level are related to changes observed at the
behavioural level. These ideas have implications for the under-
35 standing of brain physiology as well as important potential clinical
applications.
AcknowledgementsThe authors are grateful to Dr J. A. Villacorta and S. Moratti for
helpful discussions and S. Aurtenetxte, J. Garcia-Pacios, A. Nevado
40 and D. del Rio for their generous help. The authors would like to
thank Dr Juan Manuel Munoz Cespedes, who lead this study. His
ideas and personality will be always with us.
FundingMADRI.B, Obra Social CajaMadrid, MAPFRE 2009 and IMSERSO
45 (07-2008).
Supplementary materialSupplementary material is available at Brain online
ReferencesAertsen AM, Gerstein GL, Habib MK, Palm G. Dynamics of neuronal
50firing correlation: modulation of ‘‘effective connectivity’’.
J Neurophysiol 1989; 61: 900–17.
Alstott J, Breakspear M, Hagmann P, Cammoun L, Sporns O. Modeling
the impact of lesions in the human brain. PLoS Comput Biol 2009; 5:
e1000408.
55Bartolomei F, Bosma I, Klein M, Baayen JC, Reijneveld JC, Postma TJ,
et al. How do brain tumors alter functional connectivity?
A magnetoencephalography study. Ann Neurol 2006a; 59: 128–38.
Bartolomei F, Bosma I, Klein M, Baayen JC, Reijneveld JC, Postma TJ,
et al. Disturbed functional connectivity in brain tumour patients:
60evaluation by graph analysis of synchronization matrices.
Clin Neurophysiol 2006b; 117: 2039–49.
Beason-Held LL, Kraut MA, Resnick SM. Stability of default-mode net-
work activity in the aging brain. Brain Imaging Behav 2009; 3:
123–31.
65Bennett EL, Diamond MC, Krech D, Rosenzweig MR. Chemical and
anatomical plasticity of brain. Science 1964; 146: 10–19.
Bosma I, Douw L, Bartolomei F, Heimans JJ, van Dijk , Postma TJ, et al.
Synchronizaed brain activity and neurocognitive function in patients
with low-grade glioma: a magnetoencephalography study. Neuro
70Oncol 2008; 10: 734–44.
Bosma I, Reijneveld JC, Klein M, Douw L, van Dijk BW, Heimans JJ, et al.
Disturbed functional brain networks and neurocognitive function
in low-grade glioma patients: a graph theoretical analysis of
resting-state MEG. Nonlinear Biomed Phys 2009; 1: 3–9.
75Bressler S. Understanding cognition through large-scale cortical
networks. Curr Dir Psychol Sci 2002; 11: 58–61.
Brookes MJ, Gibson AM, Hall SD, Furlong PL, Barnes GR, Hillebrand A,
et al. GLM-beamformer method demonstrates stationary field,
alpha ERD and gamma ERS co-localisation with fMRI BOLD
80response in visual cortex. Neuroimage 2005; 26: 302–8.
Bullmore E, Sporns O. Complex brain networks: graph theoretical
analysis of structural and functional systems. Nature Rev Neurosci
2009; 10: 186–98.
Butz M, van Ooyen A, Worgotter F. A model for cortical rewiring
85following deafferentation and foca stroke. Front Comput Neurosci
2009; 3: 10–2.
Campo P, Poch C, Parmentier FBR, Moratti S, Elsley JV, Castellanos NP,
et al. Oscillatory activity in prefrontal and posterior regions
during implicit letter-location binding. NeuroImage 2010; 49:
902807–15.
Cao C, Slobounov S. Alteration of cortical functional connectivity as a
result of traumatic brain injury revealed by graph theory, ICA, and
sLORETA analyses of EEG signals. IEEE Trans Neural Syst Rehabil
Eng 2010; 18: 11–9.
95Cicerone KD, Dahlberg C, Kalmar K, Langenbahn DM, Malec JF,
Bergquist TF, et al. Evidence-based cognitive rehabilitation: recommen-
dations for clinical practice. A. Physical Med Rehab 2000; 81:
1596–615.Cicerone KD, Dahlberg C, Malec JF, Langenbahn DM, Felicetti T,
100Kneipp S, et al. Evidence-based cognitive rehabilitation: Updated
review of the literature from 1998 through 2002. A. Physical Med
Rehab 2005; 86: 1681–92.Cover KS, Stam CJ, van Dijk BW. Detection of very high correlation in
the alpha band between temporal regions of the human brain using
105MEG. Neuroimage 2004; 22: 1432–7.Cover KS, Vrenken H, Geurts JJ, van Oosten BW, Jelles B, Polman CH,
et al. Multiple sclerosis patients show a highly significant decrease in
alpha band interhemispheric synchronization measured using MEG.
Neuroimage 2006; 29: 783–8.
110Damoiseaux JS, Rombouts SA, Barkhof F, Scheltens P, Stam CJ,
Smith SM, et al. Consistent resting-state networks across healthy
subjects. Proc Natl Acad Sci USA 2006; 103: 13848–53.
Connectivity recovery after injury Brain 2010: Page 15 of 17 | 15
NOT FORPUBLIC RELEASE
K:/oup/brain/awq174.3d [17.6.2010–5:17pm] [1–17] Paper: awq174
Copyedited by: AH MANUSCRIPT CATEGORY: ORIGINAL ARTICLE
Dehaene S, Kerszberg M, Changeux JP. A neuronal model of a global
workspace in effortful cognitive tasks. Proc Natl Acad Sci USA 1998;
95: 14529–34.
Douw L, Baayen H, Bosma I, Klein M, Vandertop P, Heimans J, et al.
5 Treatment-related changes in functional connectivity in brain tumor
patients: a magnetoencephalography study. Exp Neurol 2008; 212:
285–90.
Edouard L. Recreations Mathematiques, vol.III, Gauthier-Villars, Paris.
Reprinted several times by Albert Blanchard, Paris 1893.
10 Florence SL, Taub HB, Kaas JH. Large-scale sprouting of cortical
connections after peripheral injury in adult macaque monkeys.
Science 1998; 282: 1117–21.Fingelkurts AA, Fingelkurts AA, Rytsala H, Suominen K, Isometsa E,
Kahkonen S. Impaired functional connectivity at EEG alpha and theta
15 frequency bands in major depression. Hum Brain Mapp 2007; 28:
247–61.
Gasser T, Bacher P, Mocks J. Transformations towards the normal
distribution of broad band spectral parameters of the EEG.
Electroencephalogr Clin Neuropshysiol 1982; 53: 119–24.
20 Gladsojo J, Miller J, Heaton R. Norms for letter and category fluency.
Psychological Assessment Resources, Odessa, FL 1999.Golden CJ. Stroop Colour and Word Test: A Manual for Clinical and
Experimental Uses. Chicago, Illinois: Skoelting; 1978.Gootjes L, Bouma A, Van Strien JW, Scheltens P, Stam CJ. Attention
25 modulates hemispheric differences in functional connectivity: evidence
from MEG recordings. Neuroimage 2006; 30: 245–53.
Grinsted A, Moore JC, Jevrejeva S. Application of the cross wavelet
transform and wavelet coherence to geophysical time series.
Nonlinear Process Geophys 2004; 11: 561–66.
30 Guggisberg AG, Honma SM, Findlay Am, Dalal SS, Kirsch HE, Berger MS,
et al. Mapping functional connectivity in patients with brain lesions.
Ann Neurol 2008; 63: 193–3.
Hadjipapas A, Hillebrand A, Holliday JE, Singh K, Barnes G. Assessing
interactions of linear and nonlinear neuronal sources using MEG beam-
35 formes: a proof of concept. Clin Neurphysiol 2005; 116: 1300–13.
Halgren E, Boujon C, Clarke J, Wang C, Chauvel P. Rapid distributed
fronto-parieto-occipital processing stages during working memory in
humans. Cereb Cortex 2002; 12: 710–28.Halligan PW, Wade DT. The effectiveness of rehabilitation for cognitive
40 deficits. USA: Oxford University Press; 2005.Heaton R, Grant I, Matthews C. Comprehensive norms for an expanded
Halstead–Reitan battery. Odessa, FL: Psychological Assessment
Resources; 1991.
Hebb DO. The organization of behavior. New York, NY: John Wiley and
45 Sons Inc; 1949.
Honey CJ, Sporns O. Dynamical consequences of lesions in cortical net-
works. Hum Brain Mapp 2008; 29: 802–9.
Huan H, Ramaswamy J. Neural network classification of autoregressive
features from electroencephalogram signals for brain–computer inter-
50 face design. J Neural Eng 2004; 1: 142–50.Jaakkola TS, Haussler D. Exploiting generative models in discriminative
classifiers. In: Kearns MS, Solla SA, Cohn DA, editors. Advances in
neural information processing systems. Vol. 11. MIT Press; 1999.
p. 487–3.
55 Jenkins WM, Merzenich MM. Reorganization of neocortical representa-
tions after brain injury: a neurophysiological model of the bases of
recovery from stroke. Progr Brain Res 1987; 71: 249–6.Katz DI, Ashley MJ, O’Shanick GJ, Connors SH. Cognitive rehabilitation:
the evidence, funding and case for advocacy in brain injury. McLean,
60 VA: Brain Injury Association of America; 2006.
Kelly C, Foxe JJ, Garavan H. Patterns of normal human brain plasticity
after practice and their implications for neurorehabilitation. Arch Phys
Med Rehabil 2006; 87: S20–9.
Kilner JM, Marchant JL, Frith CD. Relationship between activity in
65 human primary motor cortex during action observation and the
mirror neuron system. PLoS One 2009; e4925.Kolb B. Brain Plasticity and Behaviour. Hillsdale, NJ: Lawrence Erlboum;
1995.
Korzeniewska A, Manczak M, Kaminski M, Blinowska K, Kasicki S.
70Determination of information flow direction among brain structures
by a modified directed transfer function (dDTF) method. J Neurosc
Meth 2003; 125: 195–7.Lee JH, van Donkelaar. The human dorsal premotor cortex generates on-
line error corrections during sensorimotor adaptation. J Neurosci 2006;
7526: 3330–4.
Lehmanna C, Koenig T, Jelic V, Prichep L, John RE, Wahlund L, et al.
Application and comparison of classification algorithms for recognition
of Alzheimer’s disease in electrical brain activity (EEG). J Neurosc Meth
2007; 161: 342–50.
80Leocani L, Comi G. Electrophysiological studies of brain plasticity of the
motor system. Neurol Sci 2006; 27: 27–9.
Lewine JD, Davis JT, Sloan JH, Kodituwakku PW, Orrison WW Jr.
Neuromagnetic assessment of pathophysiologic brain activity induced
by minor head trauma. AJNR Am J Neuroradiol 1999; 20: 857–6.
85Lewine JD, Davis JT, Bigler ED, Thoma R, Hill D, Funke M, et al.
Objective documentation of traumatic brain injury subsequent to
mild head trauma: multimodal brain imaging with MEG, SPECT, and
MRI. J Head Trauma Rehabil 2007; 22: 141–55.
Lishman WA. Brain damage in relation to psychiatric disability after
90head-injury. Br J Psychiatr, 114: 373–410.
Lowe MJ, Mock BJ, Sorenson JA. Functional connectivity in single and
multislice echoplanar imaging using resting-state fluctuations.
Neuroimage 1968; 7: 119–32.
Maindonald JH, Braun WJ. Data Analysis and Graphics Using R: an
95Example-Based Approach. 2nd edn., Cambridge University Press;
2007.McCabe P, Lippert C, Weiser M, Hilditch M, Hartridge C, Villamere J.
Community reintegration following acquired brain injury. Brain Inj
2007; 21: 231–57.
100Merzenich MM, Nelson RJ, Stryker MP, Cynader MS, Schoppmann A,
Zook JM. Somatosensory cortical map changes following digit
amputation in adult monkeys. J Comp Neurol 1984; 224: 591–605.Munoz-Cespedes JM, Rios-Lago M, Paul N, Maestu F. Functional
neuroimaging studies of cognitive recovery after acquired brain
105damage in adults. Neuropsychol Rev 2005; 15: 169–83.
Murias M, Webb SJ, Greenson J, Dawson G. Resting state cortical con-
nectivity reflected in EEG coherence in individuals with autism. Biol
Psychiatry 2007; 62: 270–3.
Nakamura T, Hillary FG, Biswal BB. Resting network plasticity following
110brain injury. PLoS One 2009; 14: 4–12.
Nolte G, Bai O, Wheaton L, Mari Z, Vorbach S, Hallett M. Identifying
true brain interaction from EEG data using the imaginary part of
coherency. Clin Neurophysiol 2004; 115: 2292–307.Nudo RJ, Wise BM, SiFuentes F, Milliken GW. Neural substrates for the
115effects of rehabilitative training on motor recovery after ischemic
infarct. Science 1996; 272: 1791�4.
Nudo RJ. Mechanisms for recovery of motor function following cortical
damage. Current Opinion Neurobiol 2006; 16: 638–4.
Palva S, Palva JM. New vistas for alpha-frequency band oscillations.
120[Review]. Trends Neurosci 2007; 30: 150–8.
Percival DP. On estimation of the wavelet variance. Biometrika 1995; 82:
619–31.
Pivik RT, Broughton RJ, Coppola R, Davidson RJ, Fox N, Nuwer MR.
Guidelines for the recording and quantitative analysis of electroence-
125phalographic activity in research contexts. Psychophysiol 1993; 30:
547–58.
Prigatano GP, Schacter DL. Awareness of deficits after brain injury: clin-
ical and theoretical issues. NY: Oxford University Press; 1991.
Quigley M, Cordes D, Wendt G, Turski P, Moritz C, Haughton V, et al.
130Effect of focal and nonfocal cerebral lesions on functional connectivity
studied with MR imaging. AJNR Am J Neuroradiol 2001; 22: 294–300.
Reitan RM, Wolfson D. The Halstead–Reitan Neuropsychological
Test Battery: Theory and clinical interpretation. 2nd edn., Tucson,
AZ: Neuropsychology Press; 1992.
135Ripley BD. Pattern Recognition and Neural Networks. Cambridge
University Press; 1996.
16 | Brain 2010: Page 16 of 17 N. P. Castellanos et al.
NOT FORPUBLIC RELEASE
K:/oup/brain/awq174.3d [17.6.2010–5:17pm] [1–17] Paper: awq174
Copyedited by: AH MANUSCRIPT CATEGORY: ORIGINAL ARTICLE
Rholing ML, Faust ME, Beverly B, Demakis G. Effectiveness of cognitiverehabilitation following acquired brain injury: a meta-analytic re-exam-
ination of Cicerone et al.’s (2000, 2005) systematic reviews. [Review].
Neuropsychology 2009; 23: 20–39.
5 Rosenzweig MR. Environmental complexity, cerebral change, andbehavior. Am Psychol 1966; 21: 321–32.
Rubinov M, McIntosh AR, Valenzuela MJ, Brakspear M. Simulation
of neuronal death and network recovery in a computational model
of distributed cortical activity. Am J Geriatr Psychiatry 2009; 17:
10 210–7.
Salvador R, Suckling J, Coleman MR, Pickard JD, Menon D, Bullmore E.
Neurophysiological Architecture of Functional Magnetic ResonanceImages of Human Brain. Cereb Cortex 2005; 15: 1332–42.
Schnitzler A, Gross J. Normal and pathological oscillatory communication
15 in the brain. Nature Rev Neurosci 2005; 6: 285–96.
Schreiber T, Schmitz A. Surrogate time series. Physica D 2000; 142:646–2.
Schretlen D, Brandt J, Bobholz JH. Validation of the brief test of attention
in patients with huntington’s disease and amnesia. Clin Neuropsychol
20 1997; 10: 90–5.Singer W. Neuronal synchrony: a versatile code for the definition of
relations? Neuron 1999; 24: 49–65.
Stam CJ, van Cappellen van Walsum AM, Pijnenburg YA, Berendse HW,
de Munck JC, Scheltens P, et al. Generalized synchronization of MEG
25 recordings in Alzheimer’s Disease: evidence for involvement of the
gamma band. J Clin Neurophysiol 2002; 19: 562–4.
Stam CJ, Jones BF, Manshanden I, van Cappellen van Walsum AM,Montez T, Verbunt JP, et al. Magnetoencephalographic evaluation
of resting-state functional connectivity in Alzheimer’s disease.
30 Neuroimage 2006; 32: 1335–4.
Stam CJ, Nolte G, Daffertshofer A. Phase lag index: Assessment of func-tional connectivity from multi channel EEG and MEG with diminished
bias from common sources. Hum Brain Mapp 2007; 28: 1178–93.
Stam CJ, de Haan W, Daffertshofer A, Jones BF, Manshanden I, van
35 Cappellen van Walsum AM, et al. Graph theoretical analysis of
magnetoencephalographic functional connectivity in Alzheimer’sdisease. Brain 2009; 132: 213–4.
Stam CJ. Use of magnetoencephalography (MEG) to study functional
brain networks in neurodegenerative disorders. J Neurol Sci 2010;
4015; 289: 128–4.Theiler J, Eubank S, longtin A, Galdrikian B, Farmer D. Testing for
nonlinearity in time series: the method of surrogate data. Physica D
1992; 58: 77–94.
Tononi G, Edelman GM. Consciousness and complexity. Science 1998;
45282: 1846–51.
Torrence C, Compo GP. A practical guide to wavelet analysis. Bull Am
Meteorol Soc 1998; 79: 61–78.Tucha O, Smely C, Preier M, Lange KW. Cognitive deficits before
treatment among patients with brain tumors. Neurosurgery 2000;
5047: 324–33.
Turner-Stokes L. Evidence for the effectiveness of multi-disciplinaryrehabilitation following acquired brain injury: a synthesis of two sys-
tematic approaches. J Rehabil Med 2008; 40: 691–1.
Varela F, Lachaux JP, Rodriguez E, Martinerie J. The brainweb: phase
55synchronization and large-scale integration. Nature Rev Neurosci2001; 2: 229–39.
von Stein A, Sarnthein J. Different frequencies for different scales of
cortical integration: from local gamma to long range alpha/theta
synchronization. Int J Psychophysiol 2000; 38: 301–13.
60Wechsler D. Wechsler Memory Scale Revised. The Psychological
Corporation, Harcourt Brace Jovanovich, Inc.; 1987.
Wechsler D. Wechsler Adult Intelligence Scale—3rd edn (WAIS-III) SanAntonio, TX: Harcourt Assessment; 1997.
Wilson B. Case studies in neuropsychological rehabilitation. USA: Oxford
65University Press; 1996.
Wilson BA. Neuropsychological rehabilitation. Annu Rev Clin Psychol2008; 4: 141–62.
Witte OW, Stoll G. Delayed and remote effects of focal cortical
infarctions: secondary damage and reactive plasticity. Adv Neurol
701997; 73: 207�27.
Connectivity recovery after injury Brain 2010: Page 17 of 17 | 17
Las señales cerebrales estudiadas por estos investigadores están basadas
en la magnetoencefalografía, una técnica que permite captar los campos magnéticos del cerebro en casi 150 regiones diferentes y lo hace unas 1.000 veces por segundo. La alta resolución temporal de esta técnica permite saber qué zonas del cerebro están interaccionando entre sí, lo que define la red cerebral.
Los resultados han demostrado que las lesiones cerebrales aumentan el
grado de interacción de actividad lenta, y disminuye las interacciones rápidas o de alta frecuencia. Esta alteración del mapa de interacciones entre regiones del cerebro disminuye la eficacia de la red y por tanto la capacidad para llevar a cabo tareas cognitivas. Sin embargo, cuando los pacientes llevan a cabo un programa de rehabilitación neuropsicológica el grado de interacción se recupera, siendo similar al de personas que nunca han sufrido un daño cerebral. Las interacciones lentas, patológicamente incrementadas, disminuyen a medida que se produce la recuperación y las interacciones rápidas, que habían sido debilitadas, se fortalecen.
Este trabajo representa la primera evidencia científica de la correlación
entre la reorganización de la interacción cerebral y la mejoría cognitiva. Trabajo completo en: http://brain.oxfordjournals.org/
Gabinete de Comunicación UCM Margot Almazán/ Alicia Mosquera/
Teléfono: 91 394 36 06 Fax: 91 394 33 82 [email protected]
Copyright © 2022 FDOKUMEN