
Classifying minimally disabled multiple sclerosis patients from resting state functional...
13
Classifying minimally disabled multiple sclerosis patients from resting state functional connectivity Jonas Richiardi a, b, ⁎, Markus Gschwind c, d, e , Samanta Simioni c , Jean-Marie Annoni d, e, f , Beatrice Greco g , Patric Hagmann h, i , Myriam Schluep c , Patrik Vuilleumier d, e , Dimitri Van De Ville a, b a Department of Radiology and Medical Informatics, University of Geneva, Geneva, Switzerland b Institute of Bioengineering, Ecole Polytechnique Fédérale de Lausanne (EPFL), Lausanne, Switzerland c Department of Clinical Neurosciences, Centre Hospitalier Universitaire Vaudois (CHUV) and University of Lausanne, Lausanne, Switzerland d Department of Neurology, Hopitaux Universitaires de Genève (HUG), Geneva, Switzerland e Department of Neuroscience, University Medical Center (CMU), University of Geneva, Geneva, Switzerland f Neurology unit, University of Fribourg, Fribourg, Switzerland g Merck-Serono, Geneva, Switzerland h Department of Medical Radiology, Centre Hospitalier Universitaire Vaudois (CHUV) and University of Lausanne, Lausanne, Switzerland i Signal Processing Lab 5, Ecole Polytechnique Fédérale de Lausanne (EPFL), Lausanne, Switzerland abstract article info Article history: Accepted 28 May 2012 Available online 5 June 2012 Keywords: Brain decoding Brain networks Classification Functional magnetic resonance imaging Imaging marker Multiple sclerosis (MS), a variable and diffuse disease affecting white and gray matter, is known to cause functional connectivity anomalies in patients. However, related studies published to-date are post hoc; our hypothesis was that such alterations could discriminate between patients and healthy controls in a predictive setting, laying the groundwork for imaging-based prognosis. Using functional magnetic resonance imaging resting state data of 22 minimally disabled MS patients and 14 controls, we developed a predictive model of connectivity alterations in MS: a whole-brain connectivity matrix was built for each subject from the slow oscillations (b 0.11 Hz) of region-averaged time series, and a pattern recognition technique was used to learn a discriminant function indicating which particular functional connections are most affected by dis- ease. Classification performance using strict cross-validation yielded a sensitivity of 82% (above chance at p b 0.005) and specificity of 86% (p b 0.01) to distinguish between MS patients and controls. The most discrim- inative connectivity changes were found in subcortical and temporal regions, and contralateral connections were more discriminative than ipsilateral connections. The pattern of decreased discriminative connections can be summarized post hoc in an index that correlates positively (ρ = 0.61) with white matter lesion load, pos- sibly indicating functional reorganisation to cope with increasing lesion load. These results are consistent with a subtle but widespread impact of lesions in white matter and in gray matter structures serving as high-level in- tegrative hubs. These findings suggest that predictive models of resting state fMRI can reveal specific anomalies due to MS with high sensitivity and specificity, potentially leading to new non-invasive markers. © 2012 Elsevier Inc. All rights reserved. Introduction Multiple sclerosis (MS) is a common neurological disease, especially among the young in northern countries and is characterized by recur- rent or progressive inflammatory events that lead to spatially dissemi- nated demyelination of the central nervous system, followed by subsequent axonal loss (Compston and Coles, 2008). Early treatment is important to avoid permanent damage and might slow or delay pro- gression (Jacobs et al., 2000; Kappos et al., 2007). However, due to the variety of clinical presentations and its large differential diagnosis, early identification of the disease is especially problematic (Rolak and Fleming, 2007; Swanton et al., 2007). In its most common relapsing– remitting form (RRMS), patients present attacks alternating with epi- sodes of clinical improvements, following an unpredictable rhythm (Noseworthy et al., 2000). Current diagnostic workup is based on clini- cal examination together with structural magnetic resonance imaging (MRI) of brain and spine as well as cerebrospinal fluid analysis, seeking for evidence of both dissemination in time and dissemination in space of the inflammatory lesions (Compston and Coles, 2008). The role of MRI, most often relying on T2-weighted and gadolinium-enhanced im- ages to establish the diagnosis, is of growing importance to establish the diagnosis and follow disease progression or remission (Barkhof et al., 2009; Polman et al., 2005, 2011). However, conventional MRI has sever- al recognized limitations; the “hidden” damage known to occur in the normal appearing brain tissue (NABT) (Fu et al., 1998) is not captured; structural lesions are not always specific to MS (Barkhof and Filippi, 2009; multiple sclerosis MRI surrogate); T2 hyperintensities are histologically unspecified since inflammation and demyelination as NeuroImage 62 (2012) 2021–2033 ⁎ Corresponding author at: EPFL/IBI-STI/GRVDV, Station 17, 1015 Lausanne, Switzerland. E-mail address: jonas.richiardi@epfl.ch (J. Richiardi). 1053-8119/$ – see front matter © 2012 Elsevier Inc. All rights reserved. doi:10.1016/j.neuroimage.2012.05.078 Contents lists available at SciVerse ScienceDirect NeuroImage journal homepage: www.elsevier.com/locate/ynimg
Transcript of Classifying minimally disabled multiple sclerosis patients from resting state functional...
Classifying minimally disabled multiple sclerosis patients from resting statefunctional connectivity
Jonas Richiardi a,b,⁎, Markus Gschwind c,d,e, Samanta Simioni c, Jean-Marie Annoni d,e,f, Beatrice Greco g,Patric Hagmann h,i, Myriam Schluep c, Patrik Vuilleumier d,e, Dimitri Van De Ville a,b
a Department of Radiology and Medical Informatics, University of Geneva, Geneva, Switzerlandb Institute of Bioengineering, Ecole Polytechnique Fédérale de Lausanne (EPFL), Lausanne, Switzerlandc Department of Clinical Neurosciences, Centre Hospitalier Universitaire Vaudois (CHUV) and University of Lausanne, Lausanne, Switzerlandd Department of Neurology, Hopitaux Universitaires de Genève (HUG), Geneva, Switzerlande Department of Neuroscience, University Medical Center (CMU), University of Geneva, Geneva, Switzerlandf Neurology unit, University of Fribourg, Fribourg, Switzerlandg Merck-Serono, Geneva, Switzerlandh Department of Medical Radiology, Centre Hospitalier Universitaire Vaudois (CHUV) and University of Lausanne, Lausanne, Switzerlandi Signal Processing Lab 5, Ecole Polytechnique Fédérale de Lausanne (EPFL), Lausanne, Switzerland
a b s t r a c ta r t i c l e i n f o
Article history:Accepted 28 May 2012Available online 5 June 2012
Keywords:Brain decodingBrain networksClassificationFunctional magnetic resonance imagingImaging marker
Multiple sclerosis (MS), a variable and diffuse disease affecting white and gray matter, is known to causefunctional connectivity anomalies in patients. However, related studies published to-date are post hoc; ourhypothesis was that such alterations could discriminate between patients and healthy controls in a predictivesetting, laying the groundwork for imaging-based prognosis. Using functional magnetic resonance imagingresting state data of 22 minimally disabled MS patients and 14 controls, we developed a predictive modelof connectivity alterations in MS: a whole-brain connectivity matrix was built for each subject from theslow oscillations (b0.11 Hz) of region-averaged time series, and a pattern recognition technique was usedto learn a discriminant function indicating which particular functional connections are most affected by dis-ease. Classification performance using strict cross-validation yielded a sensitivity of 82% (above chance atpb0.005) and specificity of 86% (pb0.01) to distinguish between MS patients and controls. The most discrim-inative connectivity changes were found in subcortical and temporal regions, and contralateral connectionswere more discriminative than ipsilateral connections. The pattern of decreased discriminative connectionscan be summarized post hoc in an index that correlates positively (ρ=0.61) with white matter lesion load, pos-sibly indicating functional reorganisation to cope with increasing lesion load. These results are consistent with asubtle but widespread impact of lesions in white matter and in gray matter structures serving as high-level in-tegrative hubs. These findings suggest that predictive models of resting state fMRI can reveal specific anomaliesdue to MS with high sensitivity and specificity, potentially leading to new non-invasive markers.
© 2012 Elsevier Inc. All rights reserved.
Introduction
Multiple sclerosis (MS) is a common neurological disease, especiallyamong the young in northern countries and is characterized by recur-rent or progressive inflammatory events that lead to spatially dissemi-nated demyelination of the central nervous system, followed bysubsequent axonal loss (Compston and Coles, 2008). Early treatmentis important to avoid permanent damage and might slow or delay pro-gression (Jacobs et al., 2000; Kappos et al., 2007). However, due to thevariety of clinical presentations and its large differential diagnosis,early identification of the disease is especially problematic (Rolak andFleming, 2007; Swanton et al., 2007). In its most common relapsing–
remitting form (RRMS), patients present attacks alternating with epi-sodes of clinical improvements, following an unpredictable rhythm(Noseworthy et al., 2000). Current diagnostic workup is based on clini-cal examination together with structural magnetic resonance imaging(MRI) of brain and spine as well as cerebrospinal fluid analysis, seekingfor evidence of both dissemination in time and dissemination in spaceof the inflammatory lesions (Compston and Coles, 2008). The role ofMRI, most often relying on T2-weighted and gadolinium-enhanced im-ages to establish the diagnosis, is of growing importance to establish thediagnosis and follow disease progression or remission (Barkhof et al.,2009; Polman et al., 2005, 2011). However, conventionalMRI has sever-al recognized limitations; the “hidden” damage known to occur in thenormal appearing brain tissue (NABT) (Fu et al., 1998) is not captured;structural lesions are not always specific to MS (Barkhof and Filippi,2009; multiple sclerosis MRI surrogate); T2 hyperintensities arehistologically unspecified since inflammation and demyelination as
NeuroImage 62 (2012) 2021–2033
⁎ Corresponding author at: EPFL/IBI-STI/GRVDV, Station 17, 1015 Lausanne,Switzerland.
E-mail address: [email protected] (J. Richiardi).
1053-8119/$ – see front matter © 2012 Elsevier Inc. All rights reserved.doi:10.1016/j.neuroimage.2012.05.078
Contents lists available at SciVerse ScienceDirect
NeuroImage
j ourna l homepage: www.e lsev ie r .com/ locate /yn img
well as axonal damage and gliosis have similar signal characteristics(Ratchford and Calabresi, 2008); and the correlation of lesion load andclinically significant impairment is poor (Barkhof, 2002; Filippi andAgosta, 2010). Therefore, current radiological signs obtained fromstructural MRI may not reflect the actual disease state.
In this context, interest is growing for alternative MRI modalitiesthat may provide complementary information, with the aim of find-ing additional imaging markers for MS (Filippi and Agosta, 2010).One such modality is diffusion MRI: there is evidence that axial diffu-sion is relatively specific to axonal degeneration (Song et al., 2003),while increased radial diffusion is mainly driven by demyelination(Budde et al., 2009; Zhu et al., 1999. The use of advanced tractographymethods suggests that a connectional framework may lead to im-proved sensitivity and specificity to the disease and its related clinicalimpairment (Ciccarelli et al., 2005; Lin et al., 2005; Dineen et al.,2009).
Another technique that also builds on the connectional frameworkand has potential sensitivity to detect “invisible” lesions is functionalMRI (fMRI). Based on the blood oxygen level dependent (BOLD) sig-nal, this technique gives an indirect measure of aggregate neuronalexcitation-inhibition in gray matter microcircuits (Logothetis, 2008).MS lesions can alter neuronal networks in several ways. SeveralfMRI studies have highlighted brain circuit plasticity and its potential-ly adaptive role in recovery or compensation in response to brain le-sions (Reddy et al., 2000b), for motor (e.g., finger tapping) (Lee et al.,2000; Morgen et al., 2004; Reddy et al., 2000a) as well as cognitivetasks (e.g., working memory and attention tasks) (Mainero et al.,2004; Morgen et al., 2007). While permanent axonal changes alreadyaccompany even early acute inflammatory responses (Trapp et al.,1998), fMRI studies indicate that adaptive plasticity might limit theinitial clinical expression of the disease (Cifelli and Matthews, 2002;Rocca and Filippi, 2007) and that patients can show complete clinicalrecoveries after relapses, explaining the missing link between clinicaland radiological presentation. Pathological functional effects havebeen shown, as for example the loss of interhemispheric inhibition,related to corpus callosum atrophy (Manson et al., 2006, 2008). Anegative effect of disease progression on plasticity has also becomeclear, limiting the potential for adaptive capacity and leading to glob-ally reduced brain connectivity and dysfunction (Cader et al., 2006;Morgen et al., 2004).
Furthermore, beyond local changes in activity, fMRI can provide in-formation on the architecture and interconnectivity ofmore distributedbrain networks, notably by measuring patterns of spontaneous fluctua-tions during resting state (Biswal et al., 1995; Greicius et al., 2003). Rest-ing state connectivity analysis has benefitted from recent advances infMRI methodology allowing to investigate intrinsic (i.e., not task relat-ed) brain activity across the whole brain and to identify the degree offunctional correlation between distant areas (Greicius et al., 2009).Many publications have focused on analyzing the default mode net-work (DMN) (Buckner et al., 2008), a set of regions highly synchronizedduring rest. This methodology has been used in several diseases charac-terized by diffuse lesions (Fox and Greicius, 2010) such as schizophre-nia (Jafri et al., 2008), Alzheimer's disease (Greicius et al., 2004; Li etal., 2002) or depression (Greicius et al., 2007), but investigations inMS are limited to relatively fewer publications. For example, Cover etal. (2006) found decreased inter-hemispheric connectivity in MS pa-tients at rest, using a coherence measure based on magneto-encephalography (MEG). Rocca et al. (2010) found reduction of activityin the anterior cingulate cortex (ACC) at rest in MS patients relative tocontrols and in cognitively impaired MS patients related to cognitivelyintact MS patients.Weaker DMN connectivity in the ACC of MS patientswas also reported by Bonavita et al. (2011) using independent compo-nent analysis of fMRI resting state data. Roosendaal et al. (2010) inves-tigated fMRI resting state networks in patients with clinically isolatedsyndrome (CIS) and patients with RRMS and observed an increasedsynchronization of some resting state networks in CIS patients, which
disappeared in those with RRMS, suggesting initial functional compen-sation that is lost with disease progression. Using ICA and seed correla-tion, Jones et al. (2011) showed significant differences in connectivity atrest between a singleMS patient with an important thalamic lesion anda group of controls, in particular, in the default mode network.
Based on these studies, resting state fMRI offers a promising avenueto further investigate the functional impact of pathology, including atearly stages of MS where long-range connectivity can be altered byboth inflammatory processes and mild axonal damage. However, acomprehensive assessment of altered brain connectivity would needto detect subtle and distributed patterns throughout the brain, in adata-driven and objective manner despite the highly variable locationof lesions in MS. Moreover, for both task-based activity and restingstate connectivity analyses, functional changes and compensatorymechanisms can appear either as increases or decreases, dependingon the task, individual patient, and/or disease state. Given the highnumber of possible connections to test, mass-univariate or summarystatistics have difficulties to find significant differences; e.g., mean con-nectivity between specific regions of interest may show no consistentdifferences between MS and controls (Lowe et al., 2008). Instead, herewepropose the use of predictivemultivariatemodels that can generalizeto unseen subjects (those not used to learn the parameters of a model)and thus potentially lead to a new imaging-basedmarker forMS. Recentwork has highlighted the feasibility of using single structural scans forreliable MS diagnosis (Rovira et al., 2009), the ability of local multivari-ate predictive methods to discriminate between MS patients and con-trols with high accuracy, even when using NABT structural data(Weygandt et al., 2011), and the possibility of using global multivariatemethodswith structural data to distinguish various aspects ofMS sever-ity (Bendfeldt et al., 2012). Accordingly, given the increased use and de-velopment of predictive modeling techniques in fMRI research,originally derived from machine learning or pattern recognition(Ethofer et al., 2009; Kamitani and Tong, 2005; Mourao-Miranda et al.,2005; Shirer et al., 2011; Weil and Rees, 2010), it would appear highlysuitable and advantageous to apply similar techniques to characterizehigh-dimensional fMRI data obtained during resting state (Richiardi etal., 2010, 2011). There has also been a slow concurrent increase in theuse of multivariate predictivemodeling techniques applied to function-al connectivity data of pathological subjects. For example, Craddock etal. (2009) have proposed using the temporal pairwise correlations be-tween 15 expertly selected regions of interest as features for a supportvector machine classifier applied to depressive patients. More recently,Chen et al. (2011) have used a low-dimensional representation of con-nectivity differences obtained from non-parametric hypothesis testingand linear discriminant analysis to classify Alzheimer's disease patients,MCI patients, and normal subjects. To our knowledge, however, nomul-tivariate predictive modeling approach based on functional connectivi-ty has been reported in MS.
Here, we describe a functional connectivity analysis of restingstate data adapted from our recently developed multivariate connec-tivity decoding technique (Richiardi et al., 2011), which we use to dis-criminate between minimally disabled MS patients (median EDSS2.0) and healthy controls, a first step towards the development ofpredictive prognosis models. Our approach exploits whole-braindata rather than restricting the study to a few regions of interestsuch as motor cortices or the DMN. By doing so, we aim at exploringglobal connectivity changes in MS and defining which functional con-nections are particularly affected by the disease. Beyond the data-driven exploration of the functional impact of distributed connectivi-ty damage associated with MS, our method provides a classifiermodel that gives predictive information on individual status (as op-posed to whole-group analysis based on a priori classification). Theability to classify patients based on fMRI connectivity patterns is afirst step towards developing useful tools for improving the diagnos-tic workup and the monitoring and prognosis of MS patients, even inthe absence of overt clinical signs or visible structural lesions.
2022 J. Richiardi et al. / NeuroImage 62 (2012) 2021–2033
Materials and methods
Subjects and task
Twenty-two relapsing–remitting (RR) MS patients according toMcDonald's diagnostic criteria (Polman et al., 2005) were selected fromour outpatient clinic database. The selection criteria were (1) mild tomoderate neurological disability but unimpaired ambulation (ExpandedDisability Status Scale (EDSS)≤2.5 in all cases; Kurtzke, 1983); (2) noclinical relapse and no corticosteroid therapy for at least 6 weeks beforeinclusion in the study; and (3) no other neurological diagnosis,major de-pression, or psychiatric illness according to the DSM-IV criteria. Allunderwent a similar MRI protocol during their follow-up, with all pa-rameters of the imaging sequence equal and with the sameMRI scannerin all subjects, in order to prevent confounding factors in the analysis. Allpatients were only minimally disabled (median EDSS 2, range 1.5–2.5),with five subjects having had a single attack at the time of imaging. Atthe time of scanning, 11 out of 22 patients were receiving disease-modifying therapies (interferon β-1a or 1b in nine cases, glatiramer ace-tate in two cases) for a mean duration of 38.8±37.1 months).
The control group consisted of 14 healthy subjects with no historyof alcohol or drug abuse, major psychiatric disorder (major depres-sion, psychosis, untreated bipolar disorders), head trauma, other neu-rological disorder, or systemic illness.
The characteristics of the study population are summarized inTable 1, and full details are provided in Supplementary Table 1.
The study was approved by the local university ethics committee,and all subjects gave informed consent for their participation in ac-cordance with the Declaration of Helsinki.
Data acquisition
Data was acquired on a Siemens 3 T TrioTIM (VB15) platform, usinga 32-channel head coil. Functional imaging data were acquired in onesession using gradient-echo echo-planar imaging (TR/TE/FA=1.1 s/27 ms/90°, matrix=64×64, voxel size=3.75×3.75×5.63 mm3, 21contiguous transverse slices, 450 volumes). Longitudinal magnetizationwas assumed to reach steady state after approximately 10–11 s, and thefirst 10 scans of each acquisition were discarded. In total, T=440 vol-umeswere kept for analysis. The resting state scanning took 8 min. Par-ticipants were instructed to lie still with their eyes closed to relax andlet their mind wander without doing anything in particular (as is stan-dard practice in resting state fMRI studies; Fox and Raichle, 2007;Mantini et al., 2007; Helekar et al., 2010).
A structural image was also acquired using a high‐resolution three-dimensional T1-weighted MPRAGE sequence (160 slices, TR/TE/FA=2.4 s/2.98 ms/9°, matrix=256×240, voxel size=1×1×1.2 mm3).
In addition, a turbo spin-echo proton density (PD) image (46 slices,TR/FA=2640 ms/150°, matrix=204×256, voxel size=0.98×0.98×3 mm3) was acquired for lesion tracing.
Data processing and construction of the functional connectivity matrix
Lesion masks and lesion load computationLesions were traced manually on the PD image by two indepen-
dent radiologists (Medical Image Analysis Center, University Hospital
Basel, E.W. Radue). Lesion load was calculated by multiplying thetotal number of traced lesion voxels by the voxel volume.
Structural and resting state dataTo extract the resting state functional connectivity matrix, we fol-
low the methodology described in previous work (Achard et al., 2006;Richiardi et al., 2011). Supplementary Section 1 provides an overviewof the processing pipeline.
For each subject, the functional data is spatially realigned andmotion-corrected to the mean image with SPM8 (least square tech-nique with rigid body and quadratic interpolation). Movement pa-rameters are checked for excessive translation and rotation, and thevolumes were inspected visually for intensity spikes, which are dueto the spin-history effect in case of large movement (Friston et al.,1996). One patient (not included in Table 1) was excluded due to ex-cessive movement.
Each subject's structural image is normalized to MNI space andsegmented using the SPM8 (http://www.fil.ion.ucl.ac.uk/spm/) newsegmentation algorithm, an updated version of the unified segmenta-tion algorithm (Ashburner and Friston, 2005). The structural image isco-registered to the mean image of the functional data. An individualbrain atlas containing 90 cortical and sub-cortical regions of interest(ROIs) is then computed with a modified version of the IBASPM tool-box (Alemán-Gómez et al., 2006) and the AAL atlas (Tzourio-Mazoyeret al., 2002). A full list of these regions is provided in SupplementaryTable 2. This structural atlas is then mapped back onto the native res-olution of the functional data, the time series are linearly detrended,and region-averaged time series are obtained. These regional time se-ries are windsorized to the 95th percentile to increase robustness tooutliers. At this stage, each subject's functional data is contained ina 90×T matrix (multivariate time series).
The regional time courses are then filtered into frequency sub-bands using a wavelet transform (cubic orthogonal B-spline wave-lets). The subband of interest for this study contains frequencies inthe 0.06–0.11 Hz range, to focus on resting state activity (Richiardiet al., 2011). While the commonly used frequency band is wider(Biswal et al., 1995; Lowe et al., 1998), the use of wavelet correlation(Achard et al., 2006) relies on a dyadic wavelet decomposition, wherethe influence of boundary conditions becomes more important as wemove to coarser (lower frequency) subbands. Given the available ac-quisition time, the current subband is theoretically a good compro-mise between boundary condition artifacts (getting worse towardslower frequencies because there are fewer independent samples)and signal-to-noise ratio (getting worse towards higher frequenciesbecause of the hemodynamic response acting as a low-pass filter).To further ensure that the time course noise (due to movement orscanning artifacts) does not add a confound and is equal betweencontrol and subject groups, the average standard deviation of the re-gional filtered time courses �σ R is computed for each subject, and aKruskal–Wallis test is conducted on the hypothesis of no differencein median value of �σ R between groups.
After computing pairwise Pearson correlations between all ROIs inthe atlas, a 90×90 correlation matrix is obtained for each subject.Note that for the whole procedure, the data of each subject is notinfluenced by the data of other subjects; e.g., no groupwise registra-tion is used. This will ensure independence later on in the modelingstage and allows a proper deployment of predictive approach.
Modeling and classification of connectivity matrices
The functional connectivity matrix can be considered as the adja-cency matrix of an undirected, weighted, complete graph by removingthe diagonal elements. This defines the connectivity graph, where eachatlas ROI corresponds to a vertex and the strength of functional con-nectivity between two ROIs is encoded in the edge weight (a correla-tion coefficient). To permit the use of machine learning algorithms,
Table 1Demographic information of the study population.
Patients (n=22) Controls (n=14)
Gender (M/F) 8/14 5/9Mean age at inclusion (SD) 36.8 (7.9) 38.4 (6)Median EDSS (range) 2.0 (1.5–2.5) –
Mean years of disease duration (SD) 4.7 (3.5) –
2023J. Richiardi et al. / NeuroImage 62 (2012) 2021–2033
we use the direct graph embedding method (Richiardi et al., 2010), inwhich the upper triangular part of the adjacency matrix is lexico-graphically organized in a vector representation. This provides a flex-ible approach enabling us to model the whole-brain graph, or toexamine a specific hemisphere or lobe, or even to consider connec-tions inside functionally defined networks. These types of sub-graphs can be readily extracted from the full adjacency matrix andrepresented as vectors. It is possible to train the classifier on thewhole graph and then to study the relative discriminative importance(weights, see below) of various subgraphs or to directly train the clas-sifier on subgraphs. In the remainder of this work we focus on the for-mer method. Thus, at this stage, each subject's resting state data isrepresented by a feature vector whose elements are pairwise regionalcorrelation coefficients. We point out that the input features used inCraddock et al. (2009) are equivalent to our direct embedding ap-proach, the difference being the addition of a Fisher R-to-Z transformstep and the lower dimensionality of the feature space generated (15regions lead to 105 edge weights in feature space).
For classification, we use an ensemble of functional trees(Richiardi et al., 2011), a variation on the random forest scheme occa-sionally used in neuroimaging (Langs et al., 2011). This classifieryields a discriminative weight wi for each functional connection inour resting state data. This value represents the relative ability ofeach connection to discriminate between controls and MS patients.Their interpretation is very close to that of regression coefficients, ex-cept that they only make sense as part of a multivariate pattern: con-nections with high discriminative weight are useful in predictingpatient status (they are a good predictor), while connections withlow discriminative weight carry little information. After permutationtesting to remove connections with insignificant discriminativeweights, the set of remaining connections yields what we call a dis-criminative graph. The discriminative weight of each connection canthen be used to compute regional discriminative weights by summingthe discriminative weights of all connections attached to a particularregion. The regions and connections of the discriminative graph canbe represented in MNI space. By visualizing the connections and re-gions that are jointly most discriminative (those fromwhich a predic-tion of the MS status of any new subject can be made), we can obtaina map of all connections driving the classification between patientand control groups. Supplementary Section 1.4 contains more detailsabout the computation of discriminative weights, including the per-mutation testing approach used for statistical control.
In order to evaluate the performance and generalization ability ofthe classifier, we adopt a leave-one-subject-out cross-validation ap-proach, whereby the dataset is split N times into a training set con-taining N−1 subjects and a test set containing one subject. Thetraining set is used for learning the classifier parameters, while theheld-out testing set is used for prediction. We can then measurehowwell the classifier is performing by aggregating prediction resultsacross the cross-validation folds.
We report the classification performance using the familiar mea-sures sensitivity and specificity. Supplementary Section 7 containsmore details about the computation of performance measures.
Summary indices of connectivity alterations
Wecan divide the set of connections C that provide discrimination be-tween controls andMS patients into two distinct, non-overlapping parts:connections that are, on average,weaker in patients than in controls (C−),and those that are stronger (C+). Thus, we have C=C_∪C+ andC_∩C+=∅. Then, we can compute two summary measures per subject,which can serve for post hoc comparison of the results between groups.
For each subject s, the increased connectivity index (ICI) is the sumof correlation values of the connections in C+, denoted ρis, each mul-tiplied by its normalized discriminative weight wi ¼ wi
jjwjj1. Thus, wehave ICIs ¼ ∑j∈Cþ ρ
sj wj. The reduced connectivity index (RCI) is
computed in the same way, but from the set of connections that areweaker in patients, C−; that is for each subject, RCIs ¼ ∑j∈C ρs
j wj.These two different indices can be plotted jointly to provide a simpletwo-dimensional view of discriminative connectivity alterations inMS patients with respect to controls, e.g., subject 4 would be plottedin ℝ2 as (RCI4, ICI4). Fig. 1 of the results section provides an example.
Additionally, for statistical analysis we may want to remove thebias due to total edge strength of the connectivity graph (sum ofedge weights ∑i ρs
i ), which can vary considerably between subjects,and we can compute the normalized RCI, respectively ICI, asnRCIs ¼ 1
∑i ρsiRCIs. This reflects the discriminative importance and
connection strength in the discriminative (sub)graph with respectto the total edge strength of the connectivity graph.
These indices are different from a simple averaging of correlationvalues, because only a discriminative subset of connections is used,and the sum is weighted by the discriminative importance of eachconnection. We should also point out that Chen et al. (2011) havepreviously defined a “decreased connectivity index” and an “in-creased connectivity index”. While related to our ICI and RCI, theseare different from our indices. They are computed from an “increasedconnection set” (respectively decreased), which is the set of connec-tions whose z-scores, obtained from a Wilcoxon rank-sum test be-tween groups, are the n most positive (respectively negative).Within the increased (respectively decreased) connection set, thecorrelation values are averaged, forming the indices. Furthermore,they are used as input features to an LDA classifier in that paper, asopposed to being a post hoc summary measure of a high-dimensional discrimination function in our approach.
Results
Predictive modeling of whole-brain resting state functional connectivitypatterns has high sensitivity for MS
The pattern of correlation coefficients between all pairs of ROIswas calculated for each subject in the MS and control groups and sub-mitted to our multivariate decoding algorithm to determine the mostconsistent differences in the low-frequency functional connectivity inresting state between the two groups.
After cross-validation, 18 out of 22 patients and 12 out of 14 con-trols were classified correctly. These results correspond to a sensitiv-ity of 82% (above chance at pb0.005, Wilson's method for thebinomial distribution) and a specificity of 86% (above chance atpb0.01). Importantly, these classification results are not driven bynoise differences between patients and controls, as indicated by cal-culating the standard deviation of the regional filtered time courses�σ R (p=0.24, Kruskal–Wallis test on the null hypothesis of no differ-ence in median value of �σ R between groups).
When looking at the misclassified patients (details in Supplemen-tary Table 1), it can be seen that two of them had only a single attackpreceding their inclusion in our study and a lesion load in the lowestquartile of our sample (0.39 and 0.51 cm3). The two other mis-classified patients had an EDSS score of 1.5, i.e., the lowest in our da-tabase. This suggests that a potential source of classification errorsmight concern the minimal disability caused by the disease when le-sion load still has little or no impact on global functional connectivity.Regarding patient treatment, it seems to have no effect on the perfor-mance of the classification algorithm, but the sample size is not suffi-cient to assert this with confidence.
Fig. 1 shows the scatterplot of the increased and reduced connec-tivity indices (ICI and RCI) computed post hoc on the whole group(see method described in Section Summary indices of connectivity al-terations). This representation, where each index is based on a dis-tinct sub-network of the discriminative graph, reveals goodseparation between the groups. This suggests that the discriminativegraph can indeed successfully capture a predictive subset of
2024 J. Richiardi et al. / NeuroImage 62 (2012) 2021–2033
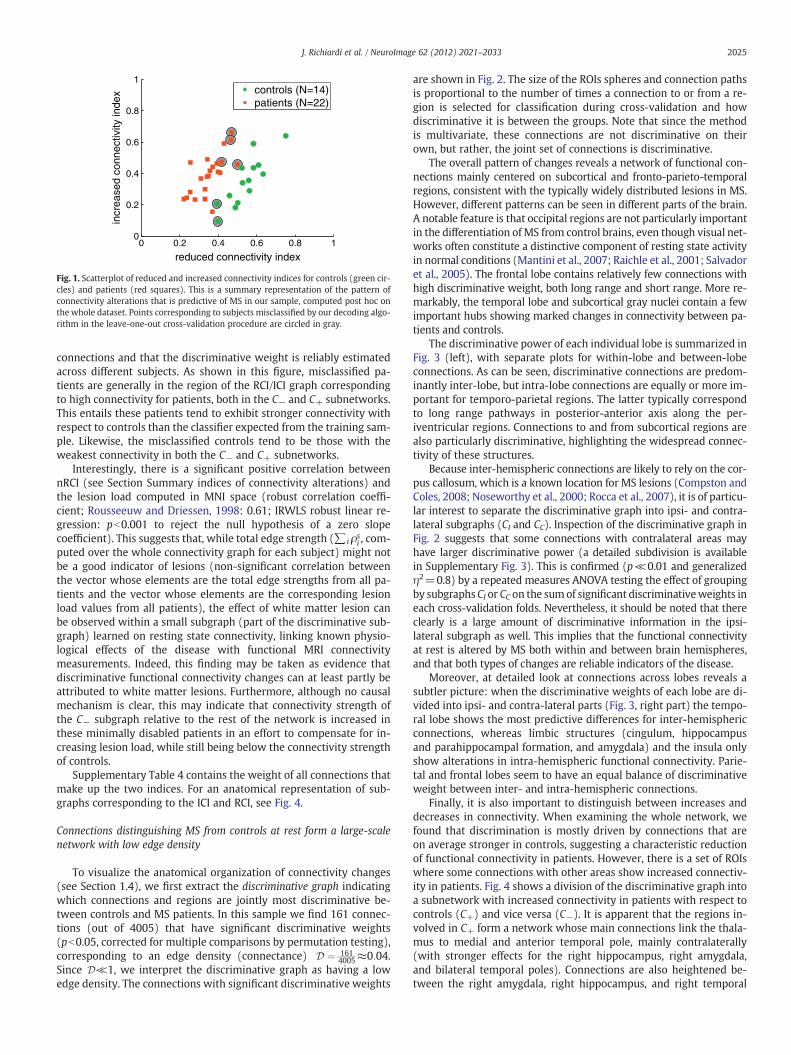
connections and that the discriminative weight is reliably estimatedacross different subjects. As shown in this figure, misclassified pa-tients are generally in the region of the RCI/ICI graph correspondingto high connectivity for patients, both in the C− and C+ subnetworks.This entails these patients tend to exhibit stronger connectivity withrespect to controls than the classifier expected from the training sam-ple. Likewise, the misclassified controls tend to be those with theweakest connectivity in both the C− and C+ subnetworks.
Interestingly, there is a significant positive correlation betweennRCI (see Section Summary indices of connectivity alterations) andthe lesion load computed in MNI space (robust correlation coeffi-cient; Rousseeuw and Driessen, 1998: 0.61; IRWLS robust linear re-gression: pb0.001 to reject the null hypothesis of a zero slopecoefficient). This suggests that, while total edge strength (∑i ρs
i , com-puted over the whole connectivity graph for each subject) might notbe a good indicator of lesions (non-significant correlation betweenthe vector whose elements are the total edge strengths from all pa-tients and the vector whose elements are the corresponding lesionload values from all patients), the effect of white matter lesion canbe observed within a small subgraph (part of the discriminative sub-graph) learned on resting state connectivity, linking known physio-logical effects of the disease with functional MRI connectivitymeasurements. Indeed, this finding may be taken as evidence thatdiscriminative functional connectivity changes can at least partly beattributed to white matter lesions. Furthermore, although no causalmechanism is clear, this may indicate that connectivity strength ofthe C− subgraph relative to the rest of the network is increased inthese minimally disabled patients in an effort to compensate for in-creasing lesion load, while still being below the connectivity strengthof controls.
Supplementary Table 4 contains the weight of all connections thatmake up the two indices. For an anatomical representation of sub-graphs corresponding to the ICI and RCI, see Fig. 4.
Connections distinguishing MS from controls at rest form a large-scalenetwork with low edge density
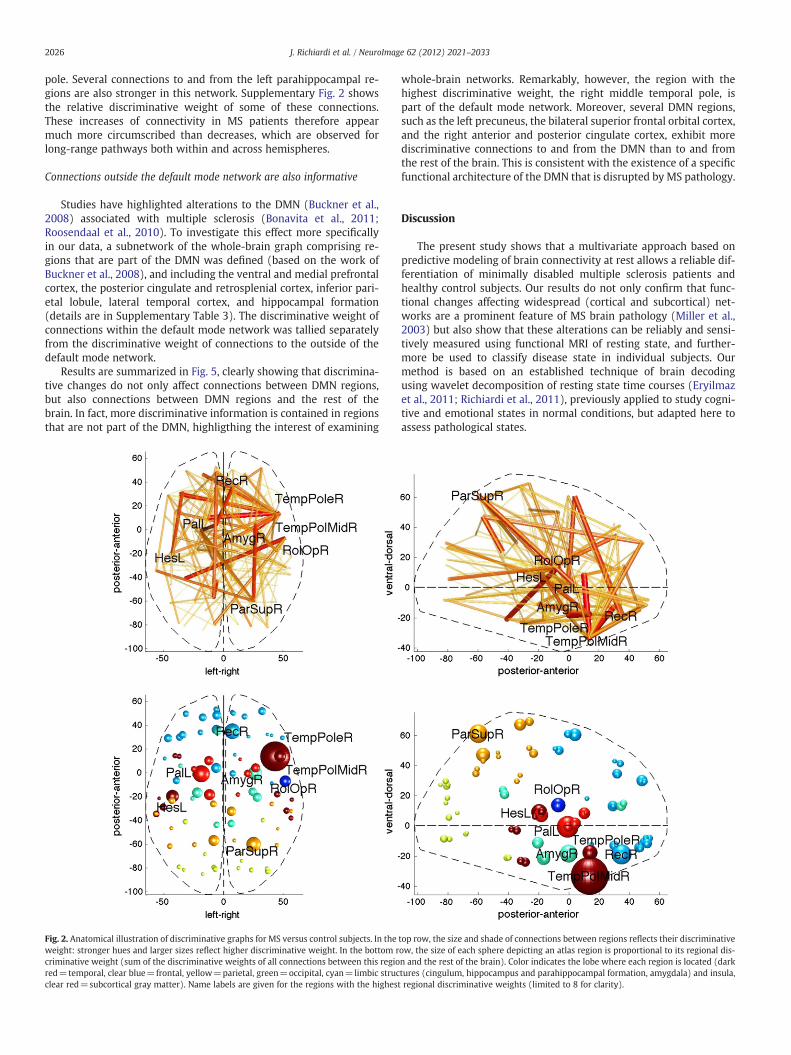
To visualize the anatomical organization of connectivity changes(see Section 1.4), we first extract the discriminative graph indicatingwhich connections and regions are jointly most discriminative be-tween controls and MS patients. In this sample we find 161 connec-tions (out of 4005) that have significant discriminative weights(pb0.05, corrected for multiple comparisons by permutation testing),corresponding to an edge density (connectance) D ¼ 161
4005≈0:04.Since D≪1, we interpret the discriminative graph as having a lowedge density. The connections with significant discriminative weights
are shown in Fig. 2. The size of the ROIs spheres and connection pathsis proportional to the number of times a connection to or from a re-gion is selected for classification during cross-validation and howdiscriminative it is between the groups. Note that since the methodis multivariate, these connections are not discriminative on theirown, but rather, the joint set of connections is discriminative.
The overall pattern of changes reveals a network of functional con-nections mainly centered on subcortical and fronto-parieto-temporalregions, consistent with the typically widely distributed lesions in MS.However, different patterns can be seen in different parts of the brain.A notable feature is that occipital regions are not particularly importantin the differentiation of MS from control brains, even though visual net-works often constitute a distinctive component of resting state activityin normal conditions (Mantini et al., 2007; Raichle et al., 2001; Salvadoret al., 2005). The frontal lobe contains relatively few connections withhigh discriminative weight, both long range and short range. More re-markably, the temporal lobe and subcortical gray nuclei contain a fewimportant hubs showing marked changes in connectivity between pa-tients and controls.
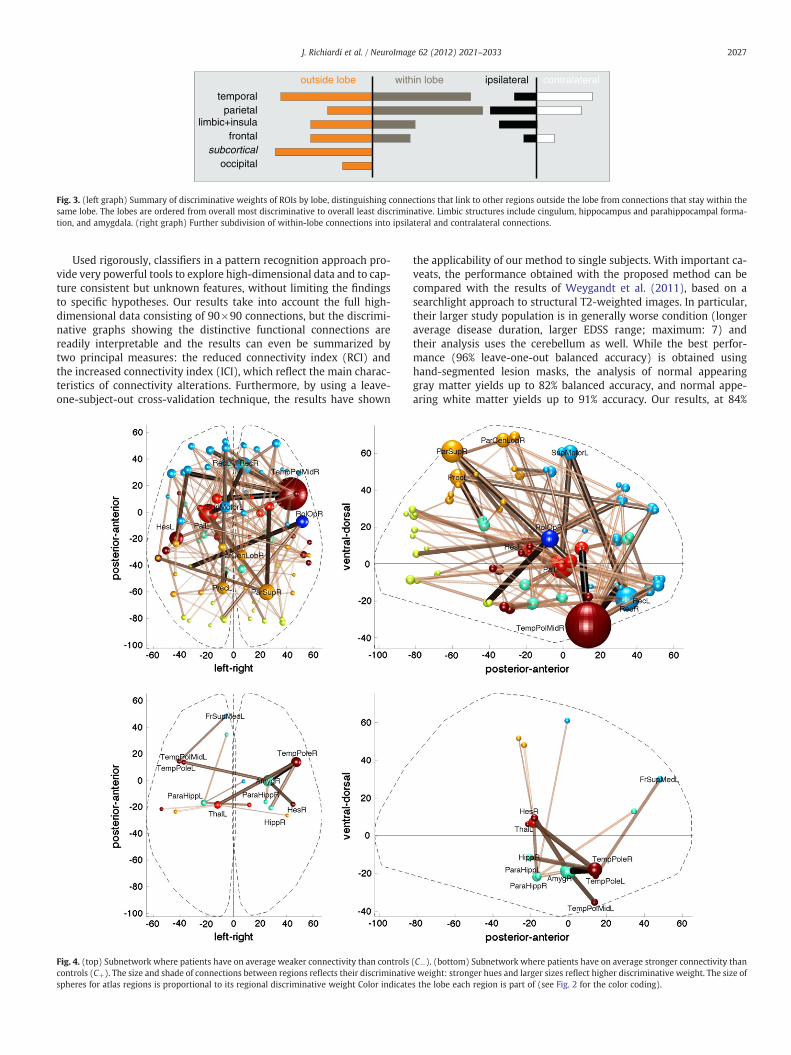
The discriminative power of each individual lobe is summarized inFig. 3 (left), with separate plots for within-lobe and between-lobeconnections. As can be seen, discriminative connections are predom-inantly inter-lobe, but intra-lobe connections are equally or more im-portant for temporo-parietal regions. The latter typically correspondto long range pathways in posterior-anterior axis along the per-iventricular regions. Connections to and from subcortical regions arealso particularly discriminative, highlighting the widespread connec-tivity of these structures.
Because inter-hemispheric connections are likely to rely on the cor-pus callosum, which is a known location for MS lesions (Compston andColes, 2008; Noseworthy et al., 2000; Rocca et al., 2007), it is of particu-lar interest to separate the discriminative graph into ipsi- and contra-lateral subgraphs (CI and CC). Inspection of the discriminative graph inFig. 2 suggests that some connections with contralateral areas mayhave larger discriminative power (a detailed subdivision is availablein Supplementary Fig. 3). This is confirmed (p≪0.01 and generalizedη2=0.8) by a repeated measures ANOVA testing the effect of groupingby subgraphs CI or CC on the sumof significant discriminativeweights ineach cross-validation folds. Nevertheless, it should be noted that thereclearly is a large amount of discriminative information in the ipsi-lateral subgraph as well. This implies that the functional connectivityat rest is altered by MS both within and between brain hemispheres,and that both types of changes are reliable indicators of the disease.
Moreover, at detailed look at connections across lobes reveals asubtler picture: when the discriminative weights of each lobe are di-vided into ipsi- and contra-lateral parts (Fig. 3, right part) the tempo-ral lobe shows the most predictive differences for inter-hemisphericconnections, whereas limbic structures (cingulum, hippocampusand parahippocampal formation, and amygdala) and the insula onlyshow alterations in intra-hemispheric functional connectivity. Parie-tal and frontal lobes seem to have an equal balance of discriminativeweight between inter- and intra-hemispheric connections.
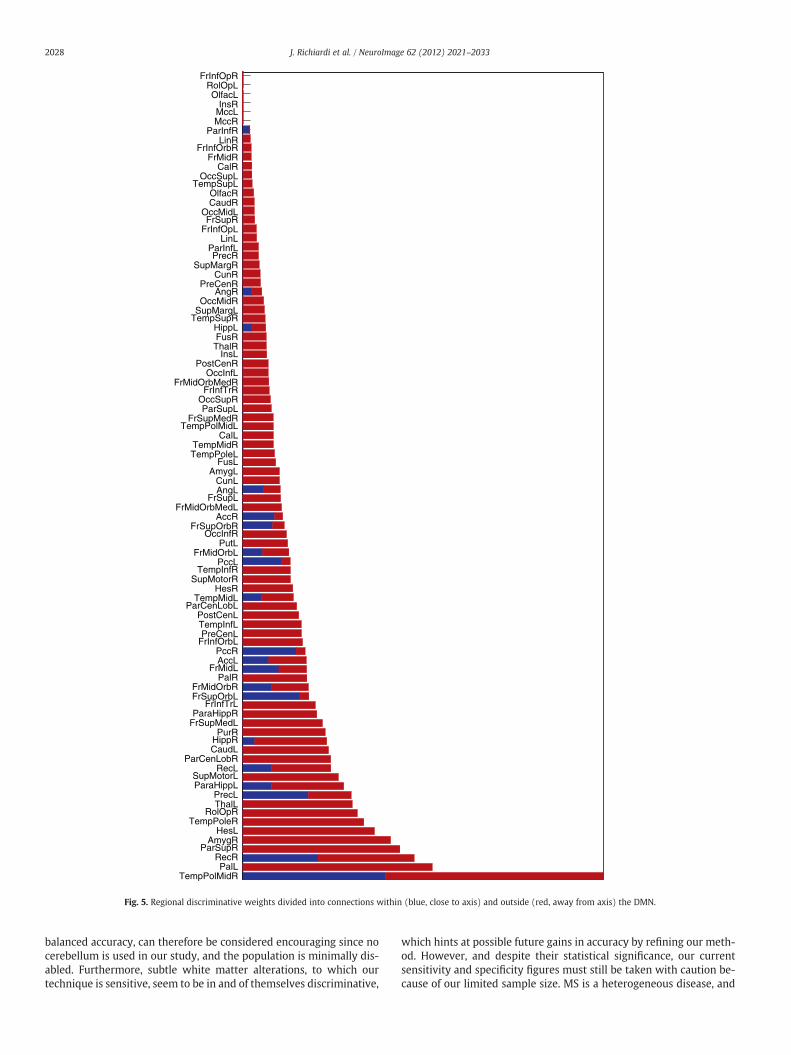
Finally, it is also important to distinguish between increases anddecreases in connectivity. When examining the whole network, wefound that discrimination is mostly driven by connections that areon average stronger in controls, suggesting a characteristic reductionof functional connectivity in patients. However, there is a set of ROIswhere some connections with other areas show increased connectiv-ity in patients. Fig. 4 shows a division of the discriminative graph intoa subnetwork with increased connectivity in patients with respect tocontrols (C+) and vice versa (C−). It is apparent that the regions in-volved in C+ form a network whose main connections link the thala-mus to medial and anterior temporal pole, mainly contralaterally(with stronger effects for the right hippocampus, right amygdala,and bilateral temporal poles). Connections are also heightened be-tween the right amygdala, right hippocampus, and right temporal
0 0.2 0.4 0.6 0.8 10
0.2
0.4
0.6
0.8
1
reduced connectivity index
incr
ease
d co
nnec
tivity
inde
x controls (N=14)patients (N=22)
Fig. 1. Scatterplot of reduced and increased connectivity indices for controls (green cir-cles) and patients (red squares). This is a summary representation of the pattern ofconnectivity alterations that is predictive of MS in our sample, computed post hoc onthe whole dataset. Points corresponding to subjects misclassified by our decoding algo-rithm in the leave-one-out cross-validation procedure are circled in gray.
2025J. Richiardi et al. / NeuroImage 62 (2012) 2021–2033
pole. Several connections to and from the left parahippocampal re-gions are also stronger in this network. Supplementary Fig. 2 showsthe relative discriminative weight of some of these connections.These increases of connectivity in MS patients therefore appearmuch more circumscribed than decreases, which are observed forlong-range pathways both within and across hemispheres.
Connections outside the default mode network are also informative
Studies have highlighted alterations to the DMN (Buckner et al.,2008) associated with multiple sclerosis (Bonavita et al., 2011;Roosendaal et al., 2010). To investigate this effect more specificallyin our data, a subnetwork of the whole-brain graph comprising re-gions that are part of the DMN was defined (based on the work ofBuckner et al., 2008), and including the ventral and medial prefrontalcortex, the posterior cingulate and retrosplenial cortex, inferior pari-etal lobule, lateral temporal cortex, and hippocampal formation(details are in Supplementary Table 3). The discriminative weight ofconnections within the default mode network was tallied separatelyfrom the discriminative weight of connections to the outside of thedefault mode network.
Results are summarized in Fig. 5, clearly showing that discrimina-tive changes do not only affect connections between DMN regions,but also connections between DMN regions and the rest of thebrain. In fact, more discriminative information is contained in regionsthat are not part of the DMN, highligthing the interest of examining
whole-brain networks. Remarkably, however, the region with thehighest discriminative weight, the right middle temporal pole, ispart of the default mode network. Moreover, several DMN regions,such as the left precuneus, the bilateral superior frontal orbital cortex,and the right anterior and posterior cingulate cortex, exhibit morediscriminative connections to and from the DMN than to and fromthe rest of the brain. This is consistent with the existence of a specificfunctional architecture of the DMN that is disrupted by MS pathology.
Discussion
The present study shows that a multivariate approach based onpredictive modeling of brain connectivity at rest allows a reliable dif-ferentiation of minimally disabled multiple sclerosis patients andhealthy control subjects. Our results do not only confirm that func-tional changes affecting widespread (cortical and subcortical) net-works are a prominent feature of MS brain pathology (Miller et al.,2003) but also show that these alterations can be reliably and sensi-tively measured using functional MRI of resting state, and further-more be used to classify disease state in individual subjects. Ourmethod is based on an established technique of brain decodingusing wavelet decomposition of resting state time courses (Eryilmazet al., 2011; Richiardi et al., 2011), previously applied to study cogni-tive and emotional states in normal conditions, but adapted here toassess pathological states.
Fig. 2. Anatomical illustration of discriminative graphs for MS versus control subjects. In the top row, the size and shade of connections between regions reflects their discriminativeweight: stronger hues and larger sizes reflect higher discriminative weight. In the bottom row, the size of each sphere depicting an atlas region is proportional to its regional dis-criminative weight (sum of the discriminative weights of all connections between this region and the rest of the brain). Color indicates the lobe where each region is located (darkred=temporal, clear blue=frontal, yellow=parietal, green=occipital, cyan=limbic structures (cingulum, hippocampus and parahippocampal formation, amygdala) and insula,clear red=subcortical gray matter). Name labels are given for the regions with the highest regional discriminative weights (limited to 8 for clarity).
2026 J. Richiardi et al. / NeuroImage 62 (2012) 2021–2033
Used rigorously, classifiers in a pattern recognition approach pro-vide very powerful tools to explore high-dimensional data and to cap-ture consistent but unknown features, without limiting the findingsto specific hypotheses. Our results take into account the full high-dimensional data consisting of 90×90 connections, but the discrimi-native graphs showing the distinctive functional connections arereadily interpretable and the results can even be summarized bytwo principal measures: the reduced connectivity index (RCI) andthe increased connectivity index (ICI), which reflect the main charac-teristics of connectivity alterations. Furthermore, by using a leave-one-subject-out cross-validation technique, the results have shown
the applicability of our method to single subjects. With important ca-veats, the performance obtained with the proposed method can becompared with the results of Weygandt et al. (2011), based on asearchlight approach to structural T2-weighted images. In particular,their larger study population is in generally worse condition (longeraverage disease duration, larger EDSS range; maximum: 7) andtheir analysis uses the cerebellum as well. While the best perfor-mance (96% leave-one-out balanced accuracy) is obtained usinghand-segmented lesion masks, the analysis of normal appearinggray matter yields up to 82% balanced accuracy, and normal appe-aring white matter yields up to 91% accuracy. Our results, at 84%
outside lobe within lobe
occipitalsubcortical
frontallimbic+insula
parietaltemporal
contralateralipsilateral
Fig. 3. (left graph) Summary of discriminative weights of ROIs by lobe, distinguishing connections that link to other regions outside the lobe from connections that stay within thesame lobe. The lobes are ordered from overall most discriminative to overall least discriminative. Limbic structures include cingulum, hippocampus and parahippocampal forma-tion, and amygdala. (right graph) Further subdivision of within-lobe connections into ipsilateral and contralateral connections.
Fig. 4. (top) Subnetwork where patients have on average weaker connectivity than controls (C−). (bottom) Subnetwork where patients have on average stronger connectivity thancontrols (C+). The size and shade of connections between regions reflects their discriminative weight: stronger hues and larger sizes reflect higher discriminative weight. The size ofspheres for atlas regions is proportional to its regional discriminative weight Color indicates the lobe each region is part of (see Fig. 2 for the color coding).
2027J. Richiardi et al. / NeuroImage 62 (2012) 2021–2033
balanced accuracy, can therefore be considered encouraging since nocerebellum is used in our study, and the population is minimally dis-abled. Furthermore, subtle white matter alterations, to which ourtechnique is sensitive, seem to be in and of themselves discriminative,
which hints at possible future gains in accuracy by refining our meth-od. However, and despite their statistical significance, our currentsensitivity and specificity figures must still be taken with caution be-cause of our limited sample size. MS is a heterogeneous disease, and
FrInfOpRRolOpLOlfacL
InsRMccLMccR
ParInfRLinR
FrInfOrbRFrMidR
CalROccSupL
TempSupLOlfacRCaudR
OccMidLFrSupR
FrInfOpLLinL
ParInfLPrecR
SupMargRCunR
PreCenRAngR
OccMidRSupMargL
TempSupRHippLFusRThalR
InsLPostCenR
OccInfLFrMidOrbMedR
FrInfTrROccSupRParSupL
FrSupMedRTempPolMidL
CalLTempMidRTempPoleL
FusLAmygL
CunLAngL
FrSupLFrMidOrbMedL
AccRFrSupOrbR
OccInfRPutL
FrMidOrbLPccL
TempInfRSupMotorR
HesRTempMidL
ParCenLobLPostCenLTempInfLPreCenL
FrInfOrbLPccRAccL
FrMidLPalR
FrMidOrbRFrSupOrbL
FrInfTrLParaHippR
FrSupMedLPurR
HippRCaudL
ParCenLobRRecL
SupMotorLParaHippL
PrecLThalL
RolOpRTempPoleR
HesLAmygR
ParSupRRecRPalL
TempPolMidR
Fig. 5. Regional discriminative weights divided into connections within (blue, close to axis) and outside (red, away from axis) the DMN.
2028 J. Richiardi et al. / NeuroImage 62 (2012) 2021–2033
our leave-one-out results offer only limited evidence of generaliza-tion ability to a separate cohort.
Many other analyses of resting state in neurological diseases concen-trated on the default mode network (DMN) or focused on a small num-ber of regions, for example, by using univariatemethods to compare thegoodness of fit of patients and controls to a standard DMN template(Greicius et al., 2004) or by measuring the cross-correlation coefficientof activity over time for a single region (Li et al., 2002). InMS, some stud-ies (Lowe et al., 2008) explored functional connectivity only to and frommotor areas and did not find significant whole-group difference be-tween minimally disabled MS patients and healthy controls. Moreover,many of the few studies addressing resting state alterations in MS con-centrated only on the DMN (Bonavita et al., 2011; Rocca et al., 2010).However MS lesions are not restricted to the DMN. Our results showthat the connections within DMN regions are affected but do not repre-sent the only nor the most common ones contributing to correct classi-fication. The major advantages of our multivariate approach, taking intoaccount connectivity across the entire brain, include a greater versatilityand a higher sensitivity, two crucial features for discriminating differentconditions and studying early stages of pathology. Whole-brain analysisusing ICA inMS has indeed been reported to bring out significant differ-ences between groups in various brain networks apart from the DMNRoosendaal et al. (2010). Additionally, the good performance of usingmultivariate methods with whole-brain functional data to derive imag-ingmarkers has also been reported in other pathologies, for example de-pression (see, e.g., Greicius et al., 2007; Craddock et al., 2009) orAlzheimer's disease (see, e.g., Buckner et al., 2009; Chen et al., 2011).
Overall, our data indicate that only about 4% of the total possibleconnections considered in our study (between the 90 ROIs distribut-ed over the entire cortex and subcortical nuclei) are discriminativebetween minimally disabled MS patients and healthy controls. Thus,the large majority (i.e., the remaining 96%) of functional connectionshave non-significant discriminative weights. However, these 4% stillrepresent numerous (161) connectivity pairs. Although there is nosingle pathognomonic path affected by MS (consistent with widelydistributed lesions (Compston and Coles, 2008; Polman et al., 2011),these altered connections are not uniformly distributed across thebrain and specific patterns are visible. Below, we discuss the possiblesignificance of these changes.
Topology of the discriminative connections
The discriminative connections between all ROIs considered werelocated throughout the brain, including in particular the temporallobes (with a predominance for the right temporal pole), the superiorparietal lobes, as well as the frontal lobes and some limbic structures,plus several structures among subcortical gray nuclei. Strikingly, incontrast, the connections concerning the occipital lobe had very lowdiscriminative weight, although clinically MS often presents with vi-sual disturbances (Compston and Coles, 2008; Noseworthy et al.,2000). However, the latter are typically related to an early affectionof optic tracts (Ciccarelli et al., 2005; Dineen et al., 2009; Reich etal., 2009), which was not specifically investigated here.
The discriminative connections were mostly associated with long-range pathways presumably grouped around the ventricles for intra-parietal and intra-temporal pairs or centered on inter-hemisphericpathways for parieto-parietal and temporo-temporal connections.Frontal and limbic connections were also affected but to a lesser extent.This observation converges with the preferential location of MS lesionsin areas of dense venular distributions, i.e., around the lateral ventricles,and at the cortico-subcortical junction (Compston and Coles, 2008). Inaddition, the connectivity of deep gray matter nuclei (thalamus andbasal ganglia) was also markedly affected, which is consistent withthe fact that these subcortical nuclei both receive and project to largeparts of the neocortex and that many of these projections also travelin periventricular white matter (e.g., thalamic radiations).
Notably, among connections with significant discriminative weightacross the whole brain, we found that inter-hemispheric connectionsare more discriminative than intra-hemispheric connections, eventhough the latter still make an important contribution to discriminativepower. This finding is compatible with the well-known preferential af-fection of the corpus callosum inMS (Evangelou, 2000; Gean-Marton etal., 1991; Mesaros et al., 2009; Rocca et al., 2010; Yaldizli et al., 2011)and presumably reflects in part the concentration of all inter-hemispheric connections at a relatively small circumscribed locationin the brain. Our results therefore add to previous studies reporting adecreased inter-hemispheric functional connectivity at rest in MS pa-tients (Cover et al., 2006). However, our data also go beyond these stud-ies by demonstrating that such decreases are not specific to inter-hemispheric connections, since most of the functional connectivitieswith a significant discriminative weight are decreased in patients,both within and between the two hemispheres. As a particular case,we found that inter-hemispheric connections in limbic structures (cin-gulum, hippocampus and parahippocampal formation, and amygdala)and the insula provide no discriminating information about patientsand controls. Taken together, these findings highlight the importanceof considering intra-hemispheric connectionswhen analyzing function-al connectivity in MS, even in resting state conditions. We cannot ex-clude the possibility, however, that the relatively high significance ofintra-hemispheric pathways (compared to inter-hemispheric path-ways) may reflect the minimal disability in our patients, given theknown association between callosal atrophy and disease progression(Pelletier et al., 2001).
Several of the relatively most discriminative connections werecentered around the right temporal pole — including left caudate toright middle temporal pole, right amygdala to right temporal pole,left inferior frontal orbital to right middle temporal pole, and left su-perior frontal orbital to right middle temporal pole. However, it mustbe kept in mind that these pairs represent only the top of 161 dis-criminative connections that all together are responsible for multivar-iate pattern classification and that none of these connections issignificantly discriminative on its own. Looking for a more syntheticview, a region that is part of several discriminative connection pairsbecomes a discriminative region itself. Under this measure, the mostdiscriminative regions were located in the anterior right temporallobe, but also in the bilateral superior parietal lobes, orbitofrontal cor-tex (gyrus rectus), left globus pallidus, and right amygdala. An alter-ation of the underlying structural connectivity (due to white matterinjury) is likely to account for the important impact of MS on a fewspecific regions such as the temporal pole or pallidum, as these re-gions are known to constitute strong hubs in brain connectivity(Haber and Knutson, 2010; Olson et al., 2007). In particular, the tem-poral poles are densely connected to orbito-frontal cortex (via the un-cinate fasciculus), amygdala, temporal and occipital ventral regions(via the inferior longitudinal fasciculus), as wellas the temporo-parietal junction, and as such constitute high-level associative corticalareas integrating deeply processed information from various parts ofthe brain (Olson et al., 2007). By being somewhat at the “top of pro-cessing hierarchy,” these temporal areas might reflect a common im-pact of disrupted connectivity in widespread pathways throughoutthe brain.
We also note that many functional connections highlighted by thepresent approach may not necessarily imply the existence (ordamage to) direct structural connections. In fact, coherent activitybetween distant areas might be subserved by either direct whitematter pathways or more global synchronization processes involvingother nodes in a common networks and/or diffuse projections from sub-cortical (e.g., brainstem) structures (see Golanov and Reis, 1996, for anexample in the rat). These more global influences might account for con-nections found across non-homologous areas between the two hemi-spheres. While our methodology cannot distinguish between structuraland non-structural sources of functional connectivity, it is likely to gain
2029J. Richiardi et al. / NeuroImage 62 (2012) 2021–2033
higher sensitivity bymeasuring the impact of diffuse lesions that may af-fect both types of connections.
Decreased and increased connectivity in MS patients
Most of the significant connectivity changes reflected decreases inpatients compared to controls, consistent with an impaired functionalcoupling between distant brain areas due the presence of MS lesions.However, there were also a few connections showing increasedstrength in MS compared to controls. These connections were foundin a specific subnetwork, roughly consisting of bilateral and inter-hemispheric connections around the thalami, medial temporal areas(para-hippocampal gyrus, amygdalae), and temporal pole. An increasein low-frequency activations (not connectivity) in the thalamus, insula,and superior temporal gyrus has previously been reported inMS (Liu etal., 2011) and interpreted as compensatory plasticity. Here, however,we did not find changes in insula connections allowing a reliablegroup discrimination, but the insula is also known to be connected tothe temporal pole and amygdala (Augustine, 1996).
Note that our method is sensitive to both reduced and increasedconnectivity without any a priori. Increased connectivity (reflected inthe ICI values) by itself is however not a discriminating feature betweenpatients and controls, because information about increased connectivityis significant only together with the concomitant reduction in connec-tivity (reflected in the RCI). Nevertheless, in our data, the strongest dis-tinction between subjects and controls is provided by the RCI, andconsidering only the sum of correlations for reduced connections (pro-jection on the RCI axis of Fig. 1) still shows a reliable separation betweenpatients and controls. This may suggest that the phenomena of de-creased and increased connectivity in distinct subnetworks in MS arelikely to result from concomitant but distinct factors.
The meaning of increased connectivities is not completely clear.Along with the decreased connectivities, these might reflect functionalreorganization to cope with pathological damage, in keeping with re-sults from several imaging studies in MS (Cifelli and Matthews, 2002;Hawellek et al., 2011; Mainero et al., 2004; Morgen et al., 2004, 2007;Reddy et al., 2000a; Rocca and Filippi, 2007; Trapp et al., 1998). Compen-satory activation is often considered as a process arising at early stages,which tends to be lost with disease progression (Bonavita et al., 2011;Roosendaal et al., 2010). Congruent with this hypothesis, the positivenRCI correlation found with lesion loads (see Results section) seems tosuggest that connectivity in the C− subnetwork is increased to copewith lesions. However, our findings of increased connectivity in the C+subnetwork and increasing connectivity with lesion load in C− mightbe specific to minimally disabled MS patients, a possibility that will re-quire further testing in additional patients with more severe disease.
Note that in our study, this C+ subnetwork predominantly con-cerns medio-temporal and orbito-frontal regions, normally associatedwith emotional processing (Kensinger and Schacter, 2008) and couldtherefore possibly reflect latent affective disturbances often associat-ed with MS (Compston and Coles, 2008; Minden and Schiffer, 1990)and/or higher stress levels in patients during an MRI session(Muehlhan et al., 2011). Alternatively, we cannot exclude that the ob-served increases in connectivity might partly reflect stronger coher-ence at low frequencies due to an “idling” state of some networks atrest (Richiardi et al., 2011), subsequent to disconnection lesions inpatients. Again, additional studies in patients with a broader rangeof MS severity will be necessary to disentangle these hypotheses.
Discriminative connections inside and outside the default mode network
Our results confirm that the default mode network (DMN) com-prises many discriminative connections that are affected by MS(Bonavita et al., 2011; Rocca et al., 2010; Roosendaal et al., 2010),but they also highlight a large number of additional discriminativeconnections outside the DMN. Studies of resting state brain activity
often focus on the default mode network because it forms a well-defined set of regions that is observed very reproducibly under differ-ent acquisition paradigms. In fact, the most discriminative ROIs in ouranalysis, the right temporal pole, is also part of the DMN and “consis-tently observed across approaches” (Buckner et al., 2008). We alsofound an important role for the precuneus, another core region ofthe DMN. In addition, we found weaker connectivity in the anteriorcingulate cortex of MS patients, as reported in a previous study ofresting state in MS (Bonavita et al., 2011), but an opposite effect inthe posterior cingulate cortex (decreased rather than increased con-nectivity in patients). Nevertheless, as clearly shown in Fig. 5, manyother regions that are not part of the DMN made a crucial contribu-tion to the discrimination between patients and controls. Therefore,we conclude that resting state data analysis in MS (and other neuro-logical conditions) should certainly comprise default mode networkregions, but need not be restricted to them.
Altered connectivity and gray matter changes
The analysis of functional connectivity is based on temporal corre-lations of activity between gray matter ROIs. In case of decreased con-nectivity, it is in principle not possible to differentiate betweendesynchronization due to loss of white-matter pathways or gray mat-ter pathology in one or more of the connected ROIs. Thus, functionalconnectivity is sensitive to both white matter and gray matter pathol-ogy and permits the investigation of both aspects of MS.
In general, MS lesions are predominantly located in white matterand therefore mainly affect axonal conduction. However, damage tocortical gray matter is also increasingly recognized (Barkhof et al.,2009; Bö et al., 2006; Prinster et al., 2006). Interestingly, our resultsfor regional discriminative weights in different lobes show conver-gent patterns with what is known from anatomical studies on focalgray matter lesions (Filippi and Agosta, 2010). For instance, wefound that the thalamus is involved in a high number of discrimina-tive connections at rest. The thalamus is known to be a site of prefer-ential atrophy in MS (Audoin et al., 2006; Cifelli et al., 2002;Wylezinska et al., 2003), possibly resulting in decreased perfusion(Rashid et al., 2004). In addition, the connections to and from severaldeep nuclei such as the globus pallidus, caudate, and amygdala werealso discriminating between patients and controls. Early and frequentlesions in the thalamus and caudate as well as in the putamen, globuspallidus, or amygdalae have been recently pointed out (Vercellino etal., 2009), and these regions exhibit a rapid atrophy following thefirst clin.
Funding
This work was supported in part by Merck Serono (Merck Serono-EPFL Research Alliance Award), in part by the Swiss National ScienceFoundation (grant number PP00P2‐123438), the Société Académiquede Genève (FOREMANE fund), the Swiss Society for Multiple Sclero-sis; the Center for Biomedical Imaging (CIBM) of the Geneva andLausanne Universities, EPFL, and the Leenaards and Louis‐JeantetFoundations, and the US National Science Foundation (grant numberNSF PHY05‐51164).
Acknowledgments
The authors thank Prof. E.W. Radue for organising the tracing ofthe MS lesions at the Medical Image Analysis Center of the UniversityHospital Basel. We also thank Prof. R. Meuli for the scanning protocolandMichel Dreano for his comments and discussion leading up to thispaper.
2030 J. Richiardi et al. / NeuroImage 62 (2012) 2021–2033
Appendix A. Supplementary Data
Supplementary data to this article can be found online at http://dx.doi.org/10.1016/j.neuroimage.2012.05.078.
References
Achard, S., Salvador, R., Whitcher, B., Suckling, J., Bullmore, E., 2006. A resilient, low-frequency, small-world human brain functional network with highly connectedassociation cortical hubs. J. Neurosci. 26 (1), 63–72 (Jan.).
Alemán-Gómez, Y., Melie-García, L., Valdés-Hernandez, P., 2006. IBASPM: toolbox forautomatic parcellation of brain structures (June) Proc. 12th Annual Meeting ofthe Organization for Human Brain Mapping. Florence, Italy.
Ashburner, J., Friston, K.J., 2005. Unified segmentation (Jul) NeuroImage 26 (3),839–851 (URL http://dx.doi.org/10.1016/j.neuroimage.2005.02.018).
Audoin, B., Davies, G.R., Finisku, L., Chard, D.T., Thompson, A.J., Miller, D.H., 2006. Local-ization of grey matter atrophy in early rrms. J. Neurol. 253 (11), 1495–1501 (URLhttp://dx.doi.org/10.1007/s00415-006-0264-2).
Barkhof, F., 2002. The clinico-radiological paradox in multiple sclerosis revisited. Curr.Opin. Neurol. 15 (3), 239–245 (URL http://journals.lww.com/co-neurology/Fulltext/2002/06000/ The_clinico_radiological_paradox_in_multiple.3.aspx).
Barkhof, F., Filippi, M., 2009. Multiple sclerosis: MRI—the perfect surrogate marker formultiple sclerosis? (Apr.) Nat. Rev. Neurol. 5 (4), 182–183 (URL http://dx.doi.org/10.1038/nrneurol.2009.31).
Barkhof, F., Calabresi, P.A., Miller, D.H., Reingold, S.C., 2009. Imaging outcomes forneuroprotection and repair in multiple sclerosis trials (May) Nat. Rev. Neurol. 5(5), 256–266 (URL http://dx.doi.org/10.1038/nrneurol.2009.41).
Bendfeldt, K., Klöppel, S., Nichols, T.E., Smieskova, R., Kuster, P., Traud, S., Mueller-Lenke, N., Naegelin, Y., Kappos, L., Radue, E.-W., Borgwardt, S.J., 2012. Multivariatepattern classification of gray matter pathology in multiple sclerosis (Mar.)NeuroImage 60 (1), 400–408 (URL http://www.sciencedirect.com/science/article/pii/S1053811911014728).
Biswal, B., Yetkin, F., Haughton, V., Hyde, J., 1995. Functional connectivity in the motorcortex of resting human brain using echo-planar MRI. Magn. Reson. Med. 34 (4),537–541.
Bö, L., Geurts, J., Mörk, S., Van Der Valk, P., 2006. Grey matter pathology in multiplesclerosis. Acta Neurol. Scand. 113 (Suppl. 183), 48–50 (URL http://www.scopus.com/inward/record.url?eid=2-s2. 0-33645533249&partnerID=40&md5=fb17b7b13f009d3cc7f889e03cda4129).
Bonavita, S., Gallo, A., Sacco, R., Corte, M.D., Bisecco, A., Docimo, R., Lavorgna, L., Corbo,D., Costanzo, A.D., Tortora, F., Cirillo, M., Esposito, F., Tedeschi, G., 2011. Distributedchanges in default-mode resting-state connectivity in multiple sclerosis. Mult.Scler. J. 17 (4), 411–422. http://dx.doi.org/10.1177/1352458510394609.
Buckner, R., Andrews-Hanna, J., Schacter, D., 2008. The brain's default network: anatomy,function, and relevance to disease. Ann. N. Y. Acad. Sci. 1124, 1–38 (URL http://www.scopus.com/inward/record.url?eid=2-s2. 0-41949121294&partnerID=40).
Buckner, R.L., Sepulcre, J., Talukdar, T., Krienen, F.M., Liu, H., Hedden, T., Andrews-Hanna, J.R., Sperling, R.A., Johnson, K.A., 2009. Cortical hubs revealed by intrinsicfunctional connectivity: mapping, assessment of stability, and relation toalzheimer's disease. J. Neurosci. 29 (6), 1860–1873.
Budde, M.D., Xie, M., Cross, A.H., Song, S.-K., 2009. Axial diffusivity is the primary cor-relate of axonal injury in the experimental autoimmune encephalomyelitis spinalcord: a quantitative pixelwise analysis. J. Neurosci. 29 (9), 2805–2813 (URLhttp://www.jneurosci.org/content/29/9/2805.abstract).
Cader, S., Cifelli, A., Abu-Omar, Y., Palace, J., Matthews, P.M., 2006. Reduced brain func-tional reserve and altered functional connectivity in patients with multiple sclero-sis (Feb) Brain 129 (Pt 2), 527–537 (URL http://dx.doi.org/10.1093/brain/awh670).
Chen, G., Ward, B.D., Xie, C., Li, W., Wu, Z., Jones, J.L., Franczak, M., Antuono, P., Li, S.-J.,2011. Classification of alzheimer disease, mild cognitive impairment, and normalcognitive status with large-scale network analysis based on resting state functionalmr imaging (Apr) Radiology 259 (1), 213–221 (URL http://dx.doi.org/10.1148/radiol.10100734).
Ciccarelli, O., Toosy, A.T., Hickman, S.J., Parker, G.J.M., Wheeler-Kingshott, C.A.M.,Miller, D.H., Thompson, A.J., 2005. Optic radiation changes after optic neuritisdetected by tractography-based group mapping (Jul) Hum. Brain Mapp. 25 (3),308–316 (URL http://dx.doi.org/10.1002/hbm.20101).
Cifelli, A., Matthews, P.M., 2002. Cerebral plasticity in multiple sclerosis: insights fromfMRI (May) Mult. Scler. 8 (3), 193–199.
Cifelli, A., Arridge, M., Jezzard, P., Esiri, M.M., Palace, J., Matthews, P.M., 2002. Thalamicneurodegeneration in multiple sclerosis. Ann. Neurol. 52 (5), 650–653 (URL http://dx.doi.org/10.1002/ana.10326).
Compston, A., Coles, A., 2008. Multiple sclerosis (Oct) Lancet 372 (9648), 1502–1517(URL http://dx.doi.org/10.1016/S0140-6736(08)61620-7).
Cover, K.S., Vrenken, H., Geurts, Jeroen, J.G., van Oosten, B.W., Jelles, B., Polman, C.H.,Stam, C.J., van Dijk, B.W., 2006. Multiple sclerosis patients show a highly significantdecrease in alpha band interhemispheric synchronization measured using MEG.Neuroimage 29 (3), 783–788. http://dx.doi.org/10.1016/j.neuroimage.2005.08.048(Feb).
Craddock, R.C., Holtzheimer, P.E., Hu, X.P., Mayberg, H.S., 2009. Disease state predictionfrom resting state functional connectivity (Dec) Magn. Reson. Med. 62 (6),1619–1628 (URL http://dx.doi.org/10.1002/mrm.22159).
Dineen, R.A., Vilisaar, J., Hlinka, J., Bradshaw, C.M., Morgan, P.S., Constantinescu, C.S.,Auer, D.P., 2009. Disconnection as a mechanism for cognitive dysfunction in
multiple sclerosis (Jan) Brain 132 (Pt 1), 239–249 (URL http://dx.doi.org/10.1093/brain/awn275).
Eryilmaz, H., Ville, D.V.D., Schwartz, S., Vuilleumier, P., 2011. Impact of transient emo-tions on functional connectivity during subsequent resting state: a wavelet corre-lation approach (Feb) NeuroImage 54 (3), 2481–2491 (URL http://dx.doi.org/10.1016/j.neuroimage.2010.10.021).
Ethofer, T., Van De Ville, D., Scherer, K., Vuilleumier, P., 2009. Decoding of emotional in-formation in voice-sensitive cortices (June 23) Curr. Biol. 19 (12), 1028–1033.
Evangelou, N., Esiri, M.M., Smith, S., Palace, J., Matthews, P.M., 2000. Quantitative patholog-ical evidence for axonal loss in normal appearing white matter in multiple sclerosis.Ann. Neurol. 47 (3), 391–395 (cited By (since 1996) 238. URL http://www.scopus.com/inward/record.url?eid=2-s2. 0-0034104079&partnerID=40&md5=0d5927019c4440e8e7abb1c2cad80da8).
Filippi, M., Agosta, F., 2010. Imaging biomarkers in multiple sclerosis (Apr) J. Magn.Reson. Imaging 31 (4), 770–788 (URL http://dx.doi.org/10.1002/jmri.22102).
Fox, M.D., Greicius, M., 2010. Clinical applications of resting state functional connectiv-ity. Front. Syst. Neurosci. 4, 19 (URL http://dx.doi.org/10.3389/fnsys.2010.00019).
Fox, M.D., Raichle, M.E., 2007. Spontaneous fluctuations in brain activity observed withfunctional magnetic resonance imaging (Sep.) Nat. Rev. Neurosci. 8 (9), 700–711(URL http://dx.doi.org/10.1038/nrn2201).
Friston, K., Williams, S., Howard, R., Frackowiak, R., Turner, R., 1996. Movement-relatedeffects in fMRI time-series. Magn. Reson. Med. 35 (3), 346–355 (URL http://www.scopus.com/inward/record.url?eid=2-s2. 0-0030032333&partnerID=40&md5=957aefc7ca5b34ca21ee30ae9774cdb0).
Fu, L., Matthews, P.M., De Stefano, N., Worsley, K.J., Narayanan, S., Francis, G.S., Antel,J.P., Wolfson, C., Arnold, D.L., 1998. Imaging axonal damage of normal-appearingwhite matter in multiple sclerosis (Jan) Brain 121 (Pt 1), 103–113.
Gean-Marton, A., Vezina, L., Marton, K., Stimac, G., Peyster, R., Taveras, J., Davis, K., 1991.Abnormal corpus callosum: a sensitive and specific indicator ofmultiple sclerosis. Ra-diology 180 (1), 215–221 (URL http://www.scopus.com/inward/record.url?eid=2-s2. 0-0025878670&partnerID=40&md5=6b8eeff2ea08a4641b244e5f0461710e).
Golanov, E.V., Reis, D.J., 1996. Contribution of oxygen-sensitive neurons of the rostralventrolateral medulla to hypoxic cerebral vasodilatation in the rat (Aug) J. Physiol.495 (Pt 1), 201–216.
Greicius, M.D., Krasnow, B., Reiss, A.L., Menon, V., 2003. Functional connectivity in theresting brain: a network analysis of the default mode hypothesis (Jan.) Proc. Natl.Acad. Sci. U. S. A. 100 (1), 253–258 (URL http://www.pnas.org/content/100/1/253.abstract).
Greicius, M.D., Srivastava, G., Reiss, A.L., Menon, V., 2004. Defaultmode network activitydistinguishes alzheimer's disease from healthy aging: evidence from functionalMRI (Mar) Proc. Natl. Acad. Sci. U. S. A. 101 (13), 4637–4642 (URL http://dx.doi.org/10.1073/pnas.0308627101).
Greicius, M.D., Flores, B.H., Menon, V., Glover, G.H., Solvason, H.B., Kenna, H., Reiss, A.L.,Schatzberg, A.F., 2007. Resting-state functional connectivity in major depression:abnormally increased contributions from subgenual cingulate cortex and thalamus(Sep) Biol. Psychiatry 62 (5), 429–437 (URL http://dx.doi.org/10.1016/j.biopsych.2006.09.020).
Greicius, M.D., Supekar, K., Menon, V., Dougherty, R.F., 2009. Restingstate functionalconnectivity reflects structural connectivity in the default mode network (Jan)Cereb. Cortex 19 (1), 72–78 (URL http://dx.doi.org/10.1093/cercor/bhn059).
Haber, S.N., Knutson, B., 2010. The reward circuit: linking primate anatomy and humanimaging (Jan) Neuropsychopharmacology 35 (1), 4–26 (URL http://dx.doi.org/10.1038/npp.2009.129).
Hawellek, D.J., Hipp, J.F., Lewis, C.M., Corbetta, M., Engel, A.K., 2011. Increased function-al connectivity indicates the severity of cognitive impairment in multiple sclerosis.Proc. Natl. Acad.Sci. U. S. A. 108 (47), 19066–19071.
Helekar, S.A., Shin, J.C., Mattson, B.J., Bartley, K., Stosic, M., Saldana-King, T., Montague,P.R., Hutton, G.J., 2010. Functional brain network changes associated with mainte-nance of cognitive function in multiple sclerosis. Front. Hum. Neurosci. 4, 219 (URLhttp://dx.doi.org/10.3389/fnhum.2010.00219).
Jacobs, L.D., Beck, R.W., Simon, J.H., Kinkel, R.P., Brownscheidle, C.M., Murray, T.J.,Simonian, N.A., Slasor, P.J., Sandrock, A.W., 2000. Intramuscular interferon beta-1a therapy initiated during a first demyelinating event in multiple sclerosis(Sep) N. Engl. J. Med. 343 (13), 898–904 (URL http://dx.doi.org/10.1056/NEJM200009283431301).
Jafri, M.J., Pearlson, G.D., Stevens, M., Calhoun, V.D., 2008. A method for functional net-work connectivity among spatially independent resting state components inschizophrenia (Feb) NeuroImage 39 (4), 1666–1681 (URL http://dx.doi.org/10.1016/j.neuroimage.2007.11.001).
Jones, D.T., Mateen, F.J., Lucchinetti, C.F., Jack Jr., C.R., Welker, K.M., 2011. Default modenetwork disruption secondary to a lesion in the anterior thalamus (Feb) Arch. Neu-rol. 68 (2), 242–247 (URL http://dx.doi.org/10.1001/archneurol.2010.259).
Kamitani, Y., Tong, F., 2005. Decoding the visual and subjective contents of the humanbrain. Nat. Neurosci. 8, 679–685.
Kappos, L., Freedman, M.S., Polman, C.H., Edan, G., Hartung, H.-P., Miller, D.H., Montalbán,X., Barkhof, F., Radü, E.-W., Bauer, L., Dahms, S., Lanius, V., Pohl, C., Sandbrink, R., B. E.N. E. F. I. T. Study Group, 2007. Effect of early versus delayed interferon beta-1b treat-ment on disability after a first clinical event suggestive of multiple sclerosis: a 3-yearfollow-up analysis of the BENEFIT study (Aug) Lancet 370 (9585), 389–397.
Kensinger, E.A., Schacter, D.L., 2008. Neural processes supporting young and olderadults’ emotional memories. J. Cogn. Neurosci. 20 (7), 1161–1173 (URL http://www.mitpressjournals.org/doi/abs/10.1162/jocn.2008. 20080).
Kurtzke, J.F., 1983. Rating neurologic impairment in multiple sclerosis: an expandeddisability status scale (EDSS) (Nov) Neurology 33 (11), 1444–1452.
Langs, G., Menze, B.H., Lashkari, D., Golland, P., 2011. Detecting stable distributedpatterns of brain activation using gini contrast. NeuroImage 56 (2), 497–507
2031J. Richiardi et al. / NeuroImage 62 (2012) 2021–2033
(URL http://www.sciencedirect.com/science/article/B6WNP-50S8PM9-1/2/40411edede5ff716c2502fe4bff8dc05).
Lee, M., Reddy, H., Johansen-Berg, H., Pendlebury, S., Jenkinson, M., Smith, S., Palace, J.,Matthews, P.M., 2000. The motor cortex shows adaptive functional changes tobrain injury from multiple sclerosis (May) Ann. Neurol. 47 (5), 606–613.
Li, S.-J., Li, Z., Wu, G., Zhang, M.-J., Franczak, M., Antuono, P.G., 2002. Alzheimer disease:evaluation of a functional MR imaging index as a marker (Oct) Radiology 225 (1),253–259.
Lin, X., Tench, C.R., Morgan, P.S., Niepel, G., Constantinescu, C.S., 2005. importance sam-pling’ in ms: use of diffusion tensor tractography to quantify pathology related tospecific impairment (Oct) J. Neurol. Sci. 237 (1-2), 13–19 (URL http://dx.doi.org/10.1016/j.jns.2005.04.019).
Liu, Y., Liang, P., Duan, Y., Jia, X., Yu, C., Zhang, M., Wang, F., Zhang, M., Dong, H., Ye, J.,Butzkueven, H., Li, K., 2011. Brain plasticity in relapsing-remitting multiple sclero-sis: evidence from resting state fMRI (Feb) J. Neurol. Sci. 304 (1-2), 127–131 (URLhttp://dx.doi.org/10.1016/j.jns.2011.01.023).
Logothetis, N.K., 2008. What we can do and what we cannot do with fMRI (Jun) Nature453 (7197), 869–878 (URL http://dx.doi.org/10.1038/nature06976).
Lowe, M.J., Mock, B.J., Sorenson, J.A., 1998. Functional connectivity in single andmultislice echoplanar imaging using resting state fluctuations (Feb.) NeuroImage7 (2), 119–132 (URL http://www.sciencedirect.com/science/article/B6WNP-45M2Y15-1G/2/88964e40762eb2eadd8376e575d6e198).
Lowe, M.J., Beall, E.B., Sakaie, K.E., Koenig, K.A., Stone, L., Marrie, R.A., Phillips, M.D.,2008. Resting state sensorimotor functional connectivity in multiple sclerosis in-versely correlates with transcallosal motor pathway transverse diffusivity (Jul)Hum. Brain Mapp. 29 (7), 818–827 (URL http://dx.doi.org/10.1002/hbm.20576).
Mainero, C., Caramia, F., Pozzilli, C., Pisani, A., Pestalozza, I., Borriello, G., Bozzao, L.,Pantano, P., 2004. fMRI evidence of brain reorganization during attention andmemory tasks in multiple sclerosis (Mar) NeuroImage 21 (3), 858–867 (URLhttp://dx.doi.org/10.1016/j.neuroimage.2003.10.004).
Manson, S.C., Palace, J., Frank, J.A., Matthews, P.M., 2006. Loss of interhemispheric inhi-bition in patients with multiple sclerosis is related to corpus callosum atrophy(Oct) Exp. Brain Res. 174 (4), 728–733 (URL http://dx.doi.org/10.1007/s00221-006-0517-4).
Manson, S.C., Wegner, C., Filippi, M., Barkhof, F., Beckmann, C., Ciccarelli, O., Stefano, N.D.,Enzinger, C., Fazekas, F., Agosta, F., Gass, A., Hirsch, J., Johansen-Berg, H., Kappos, L.,Korteweg, T., Polman, C., Mancini, L., Manfredonia, F., Marino, S., Miller, D.H.,Montalban, X., Palace, J., Rocca, M., Ropele, S., Rovira, A., Smith, S., Thompson, A.,Thornton, J., Yousry, T., Frank, J.A., Matthews, P.M., 2008. Impairment ofmovementassociated brain deactivation in multiple sclerosis: further evidence for afunctional pathology of interhemispheric neuronal inhibition (May) Exp. Brain Res.187 (1), 25–31 (URL http://dx.doi.org/10.1007/s00221-008-1276-1).
Mantini, D., Perrucci, M.G., Gratta, C.D., Romani, G.L., Corbetta, M., 2007. Electrophysi-ological signatures of resting state networks in the human brain (Aug) Proc. Natl.Acad. Sci. U. S. A. 104 (32), 13170–13175 (URL http://dx.doi.org/10.1073/pnas.0700668104).
Mesaros, S., Rocca, M.A., Riccitelli, G., Pagani, E., Rovaris, M., Caputo, D., Ghezzi, A.,Capra, R., Bertolotto, A., Comi, G., Filippi, M., 2009. Corpus callosum damage andcognitive dysfunction in benign MS (Aug) Hum. Brain Mapp. 30 (8), 2656–2666(URL http://dx.doi.org/10.1002/hbm.20692).
Miller, D.H., Thompson, A.J., Filippi, M., 2003. Magnetic resonance studies of abnormal-ities in the normal appearing white matter and greymatter in multiple sclerosis(Dec) J. Neurol. 250 (12), 1407–1419 (URL http://dx.doi.org/10.1007/s00415-003-0243-9).
Minden, S.L., Schiffer, R.B., 1990. Affective disorders in multiple sclerosis. review andrecommendations for clinical research (Jan) Arch. Neurol. 47 (1), 98–104.
Morgen, K., Kadom, N., Sawaki, L., Tessitore, A., Ohayon, J., McFarland, H., Frank, J.,Martin, R., Cohen, L.G., 2004. Training-dependent plasticity in patients with multi-ple sclerosis (Nov) Brain 127 (Pt 11).
Morgen, K., Sammer, G., Courtney, S.M., Wolters, T., Melchior, H., Blecker, C.R.,Oschmann, P., Kaps, M., Vaitl, D., 2007. Distinct mechanisms of altered brain activa-tion in patients with multiple sclerosis (Sep) NeuroImage 37 (3), 937–946 (URLhttp://dx.doi.org/10.1016/j.neuroimage.2007.05.045).
Mourao-Miranda, J., Bokde, A.L., Born, C., Hampel, H., Stetter, M., 2005. Classifying brainstates and determining the discriminating activation patterns: support vector ma-chine on functional MRI data (Dec.) NeuroImage 28 (4), 980–995 (URL http://www.sciencedirect.com/science/article/B6WNP-4HGM79R-1/2/fcb89095569ad4445086c71d6eb5bfff).
Muehlhan,M., Lueken, U.,Wittchen, H.-U., Kirschbaum, C., 2011. The scanner as a stressor:evidence from subjective and neuroendocrine stress parameters in the time course ofa functional magnetic resonance imaging session (Feb) Int. J. Psychophysiol. 79 (2),118–126 (URL http://dx.doi.org/10.1016/j.ijpsycho.2010.09.009).
Noseworthy, J.H., Lucchinetti, C., Rodriguez, M., Weinshenker, B.G., 2000. Multiple scle-rosis (Sep.) N. Engl. J. Med. 343 (13), 938–952 (URL http://content.nejm.org).
Olson, I.R., Plotzker, A., Ezzyat, Y., 2007. The enigmatic temporal pole: a review of find-ings on social and emotional processing (Jul) Brain 130 (Pt 7), 1718–1731 (URLhttp://dx.doi.org/10.1093/brain/awm052).
Pelletier, J., Suchet, L., Witjas, T., Habib, M., Guttmann, C.R., Salamon, G., Lyon-Caen, O.,Chérif, A.A., 2001. A longitudinal study of callosal atrophy and interhemisphericdysfunction in relapsing-remitting multiple sclerosis Jan Arch. Neurol. 58 (1),105–111.
Polman, C.H., Reingold, S.C., Edan, G., Filippi, M., Hartung, H.-P., Kappos, L., Lublin, F.D.,Metz, L.M., McFarland, H.F., O'Connor, P.W., Sandberg-Wollheim, M., Thompson,A.J., Weinshenker, B.G., Wolinsky, J.S., 2005. Diagnostic criteria for multiple sclero-sis: 2005 revisions to the McDonald criteria. Ann. Neurol. 58 (6), 840–846 (URLhttp://dx.doi.org/10.1002/ana.20703).
Polman, C.H., Reingold, S.C., Banwell, B., Clanet, M., Cohen, J.A., Filippi, M., Fujihara, K.,Havrdova, E., Hutchinson, M., Kappos, L., Lublin, F.D., Montalban, X., O'Connor, P.,Sandberg-Wollheim, M., Thompson, A.J., Waubant, E., Weinshenker, B., Wolinsky,J.S., 2011. Diagnostic criteria for multiple sclerosis: 2010 revisions to the McDonaldcriteria (Feb) Ann. Neurol. 69 (2), 292–302 (URL http://dx.doi.org/10.1002/ana.22366).
Prinster, A., Quarantelli, M., Orefice, G., Lanzillo, R., Brunetti, A., Mollica, C., Salvatore, E.,Brescia Morra, V., Coppola, G., Vacca, G., Alfano, B., Salvatore, M., 2006. Grey matterloss in relapsing–remitting multiple sclerosis: a voxel-based morphometry study.NeuroImage 29, 859–867.
Raichle, M.E., MacLeod, A.M., Snyder, A.Z., Powers, W.J., Gusnard, D.A., Shulman, G.L.,2001. A default mode of brain function (Jan) Proc. Natl. Acad. Sci. U. S. A. 98 (2),676–682 (URL http://dx.doi.org/10.1073/pnas.98.2.676).
Rashid, W., Parkes, L., Ingle, G., Chard, D., Toosy, A., Altmann, D., Symms, M., Tofts, P.,Thompson, A., Miller, D., 2004. Abnormalities of cerebral perfusion in multiple scle-rosis. J. Neurol. Neurosurg. Psychiatry 75 (9), 1288–1293 (URL http://www.scopus.com/inward/record.url?eid=2-s2. 0-4344661629&partnerID=40&md5=f852ccf9dc516189d966445fd6cce419).
Ratchford, J.N., Calabresi, P.A., 2008. The diagnosis of MS: white spots and red flags.Neurology 70 (13 Part 2), 1071–1072 (URL http://www.neurology.org).
Reddy, H., Narayanan, S., Matthews, P.M., Hoge, R.D., Pike, G.B., Duquette, P., Antel, J.,Arnold, D.L., 2000a. Relating axonal injury to functional recovery in ms (Jan) Neu-rology 54 (1), 236–239.
Reddy, H., Narayanan, S., Arnoutelis, R., Jenkinson, M., Antel, J., Matthews, P.M., Arnold,D.L., 2000b. Evidence for adaptive functional changes in the cerebral cortex withaxonal injury from multiple sclerosis Nov Brain 123 (Pt11), 2314–2320.
Reich, D.S., Smith, S.A., Gordon-Lipkin, E.M., Ozturk, A., Caffo, B.S., Balcer, L.J., Calabresi,P.A., 2009. Damage to the optic radiation in multiple sclerosis is associated withretinal injury and visual disability (Aug) Arch. Neurol. 66 (8), 998–1006 (URLhttp://dx.doi.org/10.1001/archneurol.2009 107).
Richiardi, J., Van De Ville, D., Riesen, K., Bunke, H., 2010. Vector space embedding of un-directed graphs with fixed-cardinality vertex sequences for classification. Proc.20th Int. Conf. on Pattern Recognition (ICPR), pp. 902–905.
Richiardi, J., Eryilmaz, H., Schwartz, S., Vuilleumier, P., Van De Ville, D., 2011. Decodingbrain states from fMRI connectivity graphs (May) NeuroImage 56 (2), 616–626(Special Issue on Multivariate Decoding and Brain Reading).
Rocca, M.A., Filippi, M., 2007. Functional MRI in multiple sclerosis (Apr) J. Neuroimag-ing 17 (Suppl. 1), 36S–41S (URL http://dx.doi.org/10.1111/j.1552-6569.2007.00135.x).
Rocca, M.A., Pagani, E., Absinta, M., Valsasina, P., Falini, A., Scotti, G., Comi, G., Filippi, M.,2007. Altered functional and structural connectivities in patients with MS: a 3-Tstudy (Dec) Neurology 69 (23), 2136–2145 (URL http://dx.doi.org/10.1212/01.wnl.0000295504.92020.ca).
Rocca, M.A., Valsasina, P., Absinta, M., Riccitelli, G., Rodegher, M.E., Misci, P., Rossi, P.,Falini, A., Comi, G., Filippi, M., 2010. Default-mode network dysfunction and cogni-tive impairment in progressive MS (Apr) Neurology 74 (16), 1252–1259 (URLhttp://dx.doi.org/10.1212/WNL.0b013e3181d9ed91).
Rolak, L.A., Fleming, J.O., 2007. The differential diagnosis of multiple sclerosis (March)Neurologist 13 (2), 57–72.
Roosendaal, S.D., Schoonheim, M.M., Hulst, H.E., Sanz-Arigita, E.J., Smith, S.M., Geurts,J.J.G., Barkhof, F., 2010. Resting state networks change in clinically isolated syn-drome (Jun) Brain 133 (Pt 6), 1612–1621 (URL http://dx.doi.org/10.1093/brain/awq058).
Rousseeuw, P.J., Driessen, K.V., 1998. A fast algorithm for the minimum covariance de-terminant estimator. Technometrics 41, 212–223.
Rovira, A., Swanton, J., Tintore, M., Huerga, E., Barkhof, F., Filippi, M., Frederiksen, J.L.,Langkilde, A., Miszkiel, K., Polman, C., Rovaris, M., Sastre-Garriga, J., Miller, D.,Montalban, X., 2009. A single, early magnetic resonance imaging study in the diag-nosis of multiple sclerosis (May) Arch. Neurol. 66 (5), 587–592 (URL http://archneur.ama-assn.org/cgi/content/abstract/66/5/587).
Salvador, R., Suckling, J., Coleman, M.R., Pickard, J.D., Menon, D., Bullmore, E., 2005.Neurophysiological architecture of functional magnetic resonance images ofhuman brain (Sep) Cereb. Cortex 15 (9), 1332–1342 (URL http://dx.doi.org/10.1093/cercor/bhi016).
Shirer, W.R., Ryali, S., Rykhlevskaia, E., Menon, V., Greicius, M.D., 2011. Decodingsubject-driven cognitive states with whole-brain connectivity patterns. Cereb.Cortex. http://dx.doi.org/10.1093/cercor/bhr099.
Song, S.-K., Sun, S.-W., Ju, W.-K., Lin, S.-J., Cross, A.H., Neufeld, A.H., 2003. Diffusion ten-sor imaging detects and differentiates axon and myelin degeneration in mouseoptic nerve after retinal ischemia (Nov) NeuroImage 20 (3), 1714–1722.
Swanton, J.K., Rovira, A., Tintore, M., Altmann, D.R., Barkhof, F., Filippi, M., Huerga, E.,Miszkiel, K.A., Plant, G.T., Polman, C., Rovaris, M., Thompson, A.J., Montalban, X.,Miller, D.H., 2007. Mri criteria for multiple sclerosis in patients presenting withclinically isolated syndromes: a multicentre retrospective study (August) LancetNeurol. 6 (8), 677–686 (URL http://dx.doi.org/10.1016/S1474-4422(07)70176-X).
Trapp, B.D., Peterson, J., Ransohoff, R.M., Rudick, R., Mork, S., Bo, L., 1998. Axonal tran-section in the lesions of multiple sclerosis (Jan.) N. Engl. J. Med. 338 (5), 278–285(URL http://content.nejm.org/cgi/content/abstract/338/5/278).
Tzourio-Mazoyer, N., Landeau, B., Papathanassiou, D., Crivello, F., Etard, O., Delcroix, N.,Mazoyer, B., Joliot, M., 2002. Automated anatomical labeling of activations in SPMusing a macroscopic anatomical parcellation of the MNI MRI single-subject brain.NeuroImage 15, 273–289.
Vercellino, M., Masera, S., Lorenzatti, M., Condello, C., Merola, A., Mattioda, A., Tribolo,A., Capello, E., Mancardi, G.L., Mutani, R., Giordana, M.T., Cavalla, P., 2009. Demye-lination, inflammation, and neurodegeneration in multiple sclerosis deep gray
2032 J. Richiardi et al. / NeuroImage 62 (2012) 2021–2033

matter (May) J. Neuropathol. Exp. Neurol. 68 (5), 489–502 (URL http://dx.doi.org/10.1097/NEN.0b013e3181a19a5a).
Weil, R.S., Rees, G., 2010. Decoding the neural correlates of consciousness (Dec) Curr. Opin.Neurol. 23 (6), 649–655 (URL http://dx.doi.org/10.1097/WCO.0b013e32834028c7).
Weygandt, M., Hackmack, K., Pfüller, C., Bellmann–Strobl, J., Paul, F., Zipp, F., Haynes, J., 2011.Mri pattern recognition in multiple sclerosis normalappearing brain areas (Jun.) PLoSOne 6 (6), e21138–e (URL http://dx.doi.org/10.1371%2Fjournal.pone.0021138).
Wylezinska, M., Cifelli, A., Jezzard, P., Palace, J., Alecci, M., Matthews, P.M., 2003.Thalamic neurodegeneration in relapsing-remitting multiple sclerosis.
Neurology 60 (12), 1949–1954 (URL http://www.neurology.org/content/60/12/1949.abstract).
Yaldizli, O., Glassl, S., Sturm, D., Papadopoulou, A., Gass, A., Tettenborn, B., Putzki,N., 2011. Fatigue and progression of corpus callosum atrophy in multiple scle-rosis. J. Neurol. 258 (12), 2199–2205. http://dx.doi.org/10.1007/s00415-011-6091-0 (Dec).
Zhu, B., Moore, G.R., Zwimpfer, T.J., Kastrukoff, L.F., Dyer, J.K., Steeves, J.D., Paty, D.W.,Cynader, M.S., 1999. Axonal cytoskeleton changes in experimental optic neuritis(Apr) Brain Res. 824 (2), 204–217.
2033J. Richiardi et al. / NeuroImage 62 (2012) 2021–2033