Serotonin Related Genes Affect Antidepressant Treatment in Obsessive–Compulsive Disorder

ORIGINAL ARTICLE
Functional and Biochemical Alterations of the MedialFrontal Cortex in Obsessive-Compulsive DisorderMurat Yucel, PhD, MAPS; Ben J. Harrison, PhD; Stephen J. Wood, PhD; Alex Fornito, PhD; Robert M. Wellard, PhD;Jesus Pujol, MD, PhD; Kerrie Clarke, BBSc(Hons); Mary L. Phillips, MD, PhD; Michael Kyrios, PhD;Dennis Velakoulis, MBBS, FRANZCP; Christos Pantelis, MD, MRCPsych, FRANZCP
Context: The medial frontal cortex (MFC), includingthe dorsal anterior cingulate and the supplementary mo-tor area, is critical for adaptive and inhibitory control ofbehavior. Abnormally high MFC activity has been a con-sistent finding in functional neuroimaging studies of ob-sessive-compulsive disorder (OCD). However, the pre-cise regions and the neural alterations associated with thisabnormality remain unclear.
Objective: To examine the functional and biochemi-cal properties of the MFC in patients with OCD.
Design: Cross-sectional study combining volume-localized proton magnetic resonance spectroscopy andfunctional magnetic resonance imaging with a task en-compassing inhibitory control processes (the Multi-Source Interference Task) designed to activate the MFC.
Setting: Healthy control participants and OCD pa-tients recruited from the general community.
Participants: Nineteen OCD patients (10 males and 9females) and 19 age-, sex-, education-, and intelligence-matched control participants recruited from the generalcommunity.
Main Outcome Measures: Psychometric measures ofsymptom severity, Multi-Source Interference Task be-
havioral performance, blood oxygen level–dependent ac-tivation, and proton magnetic resonance spectroscopybrain metabolite concentrations.
Results: Multi-Source Interference Task behavioral per-formance did not differ between OCD patients and con-trol subjects. Reaction time interference and responseerrors were correlated with blood oxygen level–depen-dent activation in the dorsal anterior cingulate region inboth groups. Compared with controls, OCD patients hadgreater relative activation of the supplementary motor areaand deactivation of the rostral anterior cingulate duringhigh- vs low-conflict (incongruent�congruent) trials.Patients with OCD also showed reduced levels of neu-ronal N-acetylaspartate in the dorsal anterior cingulateregion, which was negatively correlated with their bloodoxygen level–dependent activation of the region.
Conclusions: Hyperactivation of the MFC during high-vs low-conflict conditions in patients with OCD may bea compensatory response to a neuronal abnormality inthe region. This relationship may partly explain the na-ture of inhibitory control deficits that are frequently seenin this group and may serve as a focus of future treat-ment studies.
Arch Gen Psychiatry. 2007;64(8):946-955
N EUROBIOLOGIC AND NEU-ropsychologic models ofobsessive-compulsivedisorder (OCD) havelinked obsessive and
compulsive symptoms to deficits of re-sponse control and inhibition.1-9 Such defi-cits putatively reflect a reduced capacityof patients with OCD to inhibit intrusiveor ritualistic cognitions and motor re-sponse tendencies2 and have been linkedto increased volume10 and excessive ac-tivity of some brain regions, including themedial frontal cortex (MFC), ventral fron-tal cortex, and basal ganglia.2,11-17 Recentfunctional magnetic resonance imaging
(fMRI) studies of OCD patients have as-sociated MFC-related hyperactivations inthe dorsal (dAC) and rostral (rAC) ante-rior cingulate regions with specific dimen-sions of inhibitory control, such as re-sponse conflict detection and resolutionand sensitivity to errors.18-21
Although the neural basis of inhibi-tory control deficits in OCD remainslargely unknown, studies using protonmagnetic resonance spectroscopy (1H-MRS) have found specific reductions in AClevels of N-acetylaspartate (NAA) in medi-cated22 and drug-naıve OCD patients.23 N-acetylaspartate is a metabolite found pri-marily in neurons, and reduced levels are
Author Affiliations are listed atthe end of this article.
(REPRINTED) ARCH GEN PSYCHIATRY/ VOL 64 (NO. 8), AUG 2007 WWW.ARCHGENPSYCHIATRY.COM946
©2007 American Medical Association. All rights reserved. on August 6, 2007 www.archgenpsychiatry.comDownloaded from

thought to index neuronal loss, dysfunction, or both.24,25
This suggests that hyperactivation of the MFC, which iscommonly seen in fMRI studies of OCD patients, mayreflect a compensatory response to a primary neuronaldeficit.11,26 However, direct associations between these 2measures have not previously been demonstrated as nostudy to date, to our knowledge, has acquired both func-tional and biochemical indices of neuronal integrity inthe same individual.
In this study, we sought to clarify the nature of MFChyperactivation in OCD patients using a multimodal ap-proach combining fMRI and 1H-MRS. We focused primar-ily on the superior MFC, incorporating the paralimbic com-ponent of the dAC, given strong previous evidence for itsinvolvement in inhibitory control and dysfunction inOCD.11,19,20,27-31 We used a functional paradigm, the Multi-Source Interference Task (MSIT), that has been shown torobustly activate the dAC and the supplementary motorarea (SMA), including the pre-SMA, in individual healthyand neuropsychiatric individuals32-34 and that incorpo-rates elements of inhibitory control (eg, response conflictdetection and resolution) that are relevant for understand-ing the behavioral disturbances seen in patients with OCD.19
Concurrently, we acquired volume-localized 1H-MRS mea-sures from the medial wall region that we expected wouldbe activated by the functional task.
Based on previous work, we hypothesized that pa-tients would show increased activation of this medial wallcomplex during MSIT performance compared with con-trols,27,35,36 that concentrations of NAA would be re-duced in the patient group,22 and that there would be aninverse relationship between concentrations of NAA anddAC activation. Such a relationship would constitute pre-liminary evidence supporting the notion of compensa-tory MFC hyperactivation driven by a neuronal deficit.
METHODS
PARTICIPANTS
We recruited 21 patients with OCD from the general commu-nity through advertisements in local newspapers and commu-nity services. All the patients were required to (1) have a cur-rent IQ greater than 80, (2) be medication free or stable on theirmedication dose for at least 1 month, and (3) have no other cur-rent Axis I psychiatric diagnosis. All participants with a historyof significant head injury (ie, loss of consciousness for �5 min-utes, hospitalization requiring a �1-night stay, or significant post-concussion syndrome), neurologic disease, electroconvulsivetherapy, impaired thyroid function, and corticosteroid use wereexcluded. All the participants gave written informed consent toparticipate in this study, which was approved by the MelbourneHealth Research and Ethics Committee.
One patient with OCD was excluded because of an inciden-tal MRI finding (an infarct in the superior parietal area), and 1was excluded owing to inability to complete the task (1 armbecame numb while in the scanner and the patient could notrespond properly). The remaining OCD patients were casematched based on age, sex, education, and intelligence to asample of 19 controls selected from a larger control sample ob-tained as a part of an ongoing program of research37 such thatthere were no significant group differences on any of these mea-sures (matching was done before any analyses were per-formed) (Table 1). At the time of scanning, the OCD groupreported mild to moderate levels of OCD symptoms (as in-dexed by the Yale-Brown Obsessive-Compulsive Scale), char-acterized predominantly by contamination and checking com-pulsions (indexed using the Padua Inventory), and moderatelevels of cognitive and affective symptoms of depression andphysiologic and psychological symptoms of anxiety (mea-sured using the Beck Depression Inventory and the Beck Anxi-ety Inventory). There were no patients with prominent hoard-ing symptoms. Eleven patients were receiving stable doses of
Table 1. Sample Characteristicsa
CharacteristicOCD
(n = 19)Control(n = 19) F1,36 P Value
Sex, M/F, No. 10/9 10/9 NA NAHandedness, right/left, No. 19/0 19/0 NA NAAge, y 33.7 ± 10.7 30.6 ± 7.2 1.10 .30Education, y 14.6 ± 2.2 15.4 ± 2.6 0.91 .35Intelligence–Verbal Scale 109.3 ± 6.3 112.7 ± 10.1 1.61 .21Intelligence–Performance Scale 109.1 ± 13.9 115.2 ± 11.6 2.16 .15Intelligence–Full Scale 110.2 ± 9.4 115.5 ± 10.3 2.80 .10BDI-II 9.0 ± 6.7 6.3 ± 5.8 1.73 .19BAI 9.7 ± 9.2 5.5 ± 5.7 2.94 .10Duration of illness, y 13.4 ± 11.3 NA NA NAYBOCS–Obsessions 7.7 ± 3.5 NA NA NAYBOCS–Compulsions 8.6 ± 2.9 NA NA NAYBOCS–Total 16.3 ± 5.7 NA NA NAPI–Obsessional Thoughts 5.35 ± 4.90 NA NA NAPI–Obsessional Impulses 1.30 ± 1.78 NA NA NAPI–Contamination Compulsions 11.85 ± 10.45 NA NA NAPI–Checking Compulsions 16.90 ± 13.63 NA NA NAPI–Dressing/Grooming Compulsions 3.80 ± 3.45 NA NA NAPI–Total 39.20 ± 29.48 NA NA NA
Abbreviations: BAI, Beck Anxiety Inventory; BDI, Beck Depression Inventory; NA, not applicable; OCD, obsessive-compulsive disorder; PI, Padua Inventory;YBOCS, Yale-Brown Obsessive-Compulsive Scale.
aData are given as mean ± SD except where indicated otherwise.
(REPRINTED) ARCH GEN PSYCHIATRY/ VOL 64 (NO. 8), AUG 2007 WWW.ARCHGENPSYCHIATRY.COM947
©2007 American Medical Association. All rights reserved. on August 6, 2007 www.archgenpsychiatry.comDownloaded from

medication at the time of scanning (fluoxetine hydrochloride[n=4], fluvoxamine maleate [n=1], citalopram hydrobro-mide [n=2], venlafaxine hydrochloride [n=1], and clomipra-mine hydrochloride [n=3]).
Diagnoses were established using the Structured Clinical In-terview for DSM-IV Axis I disorders (including impulse spec-trum disorders), Patient Edition.38 All the controls also under-went a Structured Clinical Interview for DSM-IV Axis I disorders,Nonpatient Edition. No control subject had an Axis I or II dis-order, and no patient had comorbid Axis I or II disorders. Gen-eral intelligence (IQ) was estimated using the Wechsler Ab-breviated Scale of Intelligence.39
FUNCTIONAL TASK
Full details of the MSIT appear elsewhere.32,33 Briefly, the MSITis a task that encompasses inhibitory control processes de-signed specifically to probe the human MFC, particularly thedAC-SMA complex, in fMRI experiments. The MSIT com-bines sources of interference from a variety of well-known para-digms (ie, the Stroop, Flanker, and Simon tasks) and gener-ates a state of high response conflict by engaging competingresponse tendencies that code correct and incorrect out-comes. During scanning, participants viewed sets of 3 num-bers from 0 to 3, presented in strings of 3, with 1 number al-ways being different from the other 2. Participants wereinstructed to indicate the identity (not the position) of the num-ber that was different by pressing the appropriate button on aresponse box. Responses were made with 1 of 3 fingers: the in-dex finger to indicate 1, the middle finger to indicate 2, andthe ring (fourth) finger to indicate 3. During congruent (C) tasktrials, the number always matched the position on the re-sponse box and was flanked by the number 0. During incon-gruent (I) task trials, the number never matched the responseposition and was flanked by incongruent numbers. Partici-pants were informed that scans would begin and end with fixa-tion for 60 seconds, between which they would see 8 alternat-ing block pairs of C and I trials (ie, 16 blocks) lasting 30 secondsper block (eg, FCICICICIFCICICICIF). Stimulus and inter-stimulus intervals were 2000 and 500 milliseconds, respec-tively. For all the trials, participants were instructed to answer
as quickly and accurately as possible. During the scanning trials,behavioral reaction times (RTs) and percentage error scores wererecorded via a notebook computer. Before scanning, all the par-ticipants completed a practice run of the task consisting of 1block of 12 C trials and 1 block of 12 I trials.
IMAGING ACQUISITION AND PREPROCESSING
All individual MRI sequences were acquired in a single scan-ning session using a 3-T magnetic resonance scanner (GE SignaHorizon LX; GE Healthcare, Milwaukee, Wisconsin). Beforescanning, participants were introduced to a “mock scanner” tofamiliarize them with the MRI environment (for approxi-mately 30 minutes). After the mock session, participants weretaken to the actual scanner and had their head stabilized usinga Velcro strap over the forehead. Scanning sequences con-sisted of a scout localizer, fMRI, T1-weighted anatomical se-quence, and 1H-MRS, in that order. Imaging data were trans-ferred to a Linux 2.4.27 workstation (Debian Sarge) for imagepreprocessing and analysis.
Functional MRI data were acquired as a series of single-shotgradient-recalled echo-echo planar imaging volumes providingT2*-weighted blood oxygen level–dependent (BOLD) contrast.The image acquisition parameters for the functional scans wererepetition time, 3000 milliseconds; echo time, 40 milliseconds;flip angle, 60°; field of view, 24 cm; and a 128�128 matrix, pro-ducing a voxel size of 1.875�1.875�4.0 mm and 25 sectionsfor full-brain coverage. The first 4 images in each run were au-tomatically discarded to allow the magnetization to reach steady-state equilibrium. For each 30-second block in the experiment,10 volumes were acquired, resulting in a total of 80 volumes forthe C condition and 80 volumes for the I condition.
Volume-localized 1H-MRS findings were recorded using ashort-echo point resolved spectroscopy sequence (repetition time,3000 milliseconds; echo time, 30 milliseconds; number of sig-nals acquired, 128; and nominal voxel size, approximately 6.5cm3) from the dAC bilaterally (Figure1). The MRS voxels wereplaced in each hemisphere, separated by the medial wall bound-ary of the frontal lobes, to encompass the dAC. The posteriorboundary of the voxel was approximately 10 mm posterior to avertical line from the anterior commissure orthogonal to the an-
NAA
GlxGlx
Cr
Cho
ml
04.0 3.8 3.6 3.4 3.2 3.0 2.8 2.6 2.4 2.2 2.0 1.8 1.6 1.4 0.4 0.20.60.81.01.2
Chemical Shift, ppm
Sign
al In
tens
ity, I
U
A C
B
Figure 1. Volume-localized proton magnetic resonance spectroscopy (sagittal and axial orientations) shows considerable overlap with the group of activatedclusters in the dorsal anterior cingulate region (displayed at the commonly reported threshold of z�3.0) for controls (A) and patients with obsessive-compulsivedisorder (B). Images are displayed on a canonical structural magnetic resonance image (Montreal Neurological Institute, Talairach brain). C, Sample magneticresonance spectroscopy spectrum from the dorsal anterior cingulate region highlighting the 5 main metabolite peaks: N-acetylaspartate compounds (NAA),creatine�phosphocreatine (Cr), choline compounds (Cho), glutamate�glutamine (Glx), and myoinositol (mI). IU indicates arbitrary institutional units.
(REPRINTED) ARCH GEN PSYCHIATRY/ VOL 64 (NO. 8), AUG 2007 WWW.ARCHGENPSYCHIATRY.COM948
©2007 American Medical Association. All rights reserved. on August 6, 2007 www.archgenpsychiatry.comDownloaded from

terior commissure–posterior commissure line. The inferior bor-der was approximately 5 mm superior to the top edge of the cor-pus callosum, and the medial border was 1 to 2 sections lateralto the parasagittal section on the T1 structural image for eachhemisphere. For volume-localized spectra, absolute levels of NAA,glutamate�glutamine, creatine�phosphocreatine, choline, andmyoinositol were measured.
STATISTICAL ANALYSES
Individual demographic measures of sex, handedness, age, edu-cation, and IQ were compared across groups using univariateanalyses of variance in SPSS version 11.0 (SPSS Inc, Chicago,Illinois). Analyses of behavioral data were conducted using re-peated-measures analysis of variance, with task condition (Cvs I blocks) as the within-subject effect and group (controls vsOCD patients) as the between-subject effect. Response errorswere calculated by summing all commission (eg, responding“1” when the correct answer was “2”) and omission errors(missed responses) across the C and I trials. The response er-ror variable was log10 transformed to ensure normality of dis-tribution.40 Interference effects were calculated by subtractingthe mean RT for the C trials across all blocks from the meanRT of the I trials across all blocks.
Analysis of the fMRI data was performed using FEAT (fMRIExpert Analysis Tool) Version 5.4 (FMRIB Software Library,http://www.fmrib.ox.ac.uk/fsl). The following preprocessing wasapplied before statistical analysis: motion correction usingMCFLIRT,41 nonbrain removal using the BET (Brain Extrac-tion Tool),42 spatial smoothing using a gaussian kernel of fullwidth at half maximum of 5 mm, mean-based intensity nor-malization of all volumes by the same factor, and high-pass tem-poral filtering (gaussian-weighted least squares fit straight linefitting, with sigma=30.0 seconds). Time series statistical analy-sis was performed using FILM (FMRIB Improved Linear Model)with local autocorrelation correction.43 Individual participant z(gaussian-transformed) statistical images were thresholded usingclusters determined by z�2.7 and a whole-brain (corrected) clus-ter significance threshold of P� .05.44 For controls, 16 showedactivation of the dAC-SMA region at this threshold, and 3 con-trols showed activation at a lowered z score of 2.33 (whole-brain clusterwise corrected). For OCD patients, 16 showed ac-tivation of the dAC-SMA region at the higher z�2.7 threshold,2 showed activation at the lower level, and 1 showed no activityabove either threshold. In addition, we extracted a converted per-centage signal change value of the BOLD response (I�C) fromthe dAC cluster maximum of each individual using Featqueryin FSL. We used the peak voxel for each individual in prefer-ence to summing activity over a larger area in a standard space(eg, an area around the peak voxel or the MRS volume of inter-est) to minimize averaging over nonsignificant voxels. Prelimi-nary analyses indicated that an individually tailored voxel is rep-resentative of the overall activated cluster and provides a morereliable association with the behavioral indices of the MSIT.
Group-level analysis was performed using FLAME (FMRIBLocal Analysis of Mixed Effects).45,46 For within-group analy-ses, z (gaussianized T/F) statistical images were determined usinga threshold of z�4.0, P� .05 (whole-brain clusterwise cor-rected).44 To facilitate comparisons with existing litera-ture,18,19 clusters were visually displayed (eg, Figure 2 andFigure 3) at a commonly reported threshold of z�3.0. Forbetween-group comparisons (OCD vs control), z (gaussian-ized T/F) statistical images were determined using a whole-
–10 0 10 20
–10 0 10 20
30
90
90
50
50
40 50 60
30 40 50
12 24 52
60
A
B
C
D
Figure 2. Areas of brain activation during performance of the Multi-SourceInterference Task in controls (A) and patients with obsessive-compulsivedisorder (OCD) (B). Both groups showed robust activation of the medialwalls of the frontal lobes and superior parietal regions. In OCD patients areasof relative hyperactivation are shown, including the putamen, inferior frontal,and supplementary motor area (C), as is apparent hypoactivation in therostral anterior cingulate (D). Images are displayed in radiologic format.Numbers at the top of each row indicate the section number in MontrealNeurological Institute space. Color bars indicate the z score ranges.
80
80
A B
C D
Figure 3. Patterns of task-related activation (hot colors) and deactivation (coldcolors) during high- vs low-conflict trials (incongruent�congruent) in bothgroups. Patterns are shown for controls (A) and patients withobsessive-compulsive disorder (OCD) (B) and for controls (C) and OCD patients(D) with the rostral anterior cingulate cluster differentiating the 2 groupssuperimposed in yellow. It can be seen that this rostral anterior cingulate clusterrepresents a portion of the significant medial frontal cortex deactivation in OCDpatients. Images are displayed in radiologic format. Color bars indicate thez-score ranges (hot colors for activation and cold colors for deactivation).
(REPRINTED) ARCH GEN PSYCHIATRY/ VOL 64 (NO. 8), AUG 2007 WWW.ARCHGENPSYCHIATRY.COM949
©2007 American Medical Association. All rights reserved. on August 6, 2007 www.archgenpsychiatry.comDownloaded from

brain (uncorrected) threshold of z�3.0, P� .0001. Registra-tion to standard space images was performed using FLIRT.41,47
Metabolite concentrations derived from 1H-MRS were de-termined for each region of interest (corrected for estimatedtissue content) using LCModel software.48 This software useda library of reference spectra in a basis set recorded specifi-cally for the scanner and calibrated using the tissue water sig-nal as an internal standard. The LCModel-fitting algorithm usesthe multiple peaks contributing to an individual metabolite spec-trum to estimate the tissue content of each metabolite.48 Theresidual signal corresponds to, and is fitted by, additional broadpeaks representing unknown metabolites and other factors, suchas macromolecular components with short T1 relaxation times.In the analyses, the mean of the left and right hemisphere val-ues for each metabolite was used because the values were highlycorrelated (r=0.45-0.86; P� .05), with no significant differ-ences between them. The MRS parameters used for this studyprovided robust signals for the control and OCD groups, withmean±SD signal-to-noise ratios of 15.94±2.01 and 16.45±2.86,respectively, and a mean±SD full width at half maximum of0.06±0.01 ppm for both groups. All the metabolites showedgood reliability of fit as judged from the mean Cramer-Rao lowerbounds. The mean Cramer-Rao lower bounds values (esti-mates of the SD of the fit) for NAA, creatine�phosphocreatine,choline compounds, myoinositol, and glutamate�glutaminewere 5.2, 5.2, 6.0, 8.4, and 10.3, respectively, for controls and5.0, 4.9, 5.1, 7.2, and 9.1, respectively, for patients with OCD.
Examination of brain behavior–metabolite associations wereconducted using Pearson product moment correlations be-tween the percentage signal change value of the BOLD re-sponse from the dAC cluster maxima of each individual, be-havioral indices of RT interference and response errors, brainmetabolites from 1H-MRS, and symptom severity measures fromthe Yale-Brown Obsessive-Compulsive Scale.
RESULTS
BEHAVIORAL
Both groups had faster mean±SD RTs to the C trials (con-trols: 865 ± 134.99 milliseconds; OCD patients:930±110.62 milliseconds) than to I trials (controls:1203±187.58 milliseconds; OCD patients: 1287±153.39milliseconds; main effect of condition: F1,35=514.50;P�.001). Both groups displayed large and comparablemean±SD RT interference effects (controls: 338±85.31milliseconds; OCD patients: 357±100.57 milliseconds;main effect of group: F1,35=2.52; P=.12; task by groupinteraction: F1,35=0.39; P=.54). Both groups made fewerresponse errors (mean ± SD) to C trials (controls:0.47%±0.77%; OCD patients: 2.0%±2.38%) than to I trials(controls: 4.79%±5.89%; OCD patients: 7.39%±7.18%;main effect of condition: F1,35=20.92; P�.001). There wasno difference in response accuracy between the 2 groups(main effect of group: F1,35=3.13; P=.09; task by groupinteraction: F1,35=0.26; P=.62).
FUNCTIONAL
Within Group
Both groups showed the largest task-related activation(I�C) in the MFC region encompassing the dAC andthe SMA (Table 2 and Figure 2A and B). This medialcluster of activation was primarily in the dAC for con-
Table 2. Medial Frontal Wall Activation and Relative Group Differences During Task Performance in Controls and Patients With OCDa
Group and RegionApproximate
AreabClusterSizec
Maximumz Score
Anatomical Coordinates
x y z
Controls (n = 19)dAC 32/6 357 7.79 0 12 48
32 6.76 −8 16 4632 6.72 4 10 4832 6.56 −2 4 48
Pre-SMA 6 7.09 6 0 586 6.61 4 6 54
OCD (n = 19)dAC/pre-SMA 32/6 747 8.96 2 0 52
32/6 8.94 4 4 5232/6 8.52 −2 8 52
dACd 32 7.81 4 2 46Pre-SMA 6 8.22 6 0 58
6 7.45 0 0 60dACe 32 17 5.15 −12 10 40
OCD � controlSMA 32/6 60 4.67 2 −10 52
Control � OCDrACf 24/32 232 4.95 2 40 26
Abbreviations: dAC, dorsal anterior cingulate; OCD, obsessive-compulsive disorder; rAC, rostral anterior cingulate; SMA, supplementary motor area.aThe first listed entry for each group reflects the cluster maxima, and following entries reflect significant, associated subcluster peaks.bRefers to approximation of Brodmann areas. Some entries have 2 numbers because the exact Brodmann area was difficult to determine based on the peak
location of activation.cRefers to the cluster size in number of activated voxels.dRefers to the right hemisphere.eRefers to the left hemisphere.fThis finding actually reflects greater relative deactivation of this region in patients during high-conflict trials (incongruent � congruent).
(REPRINTED) ARCH GEN PSYCHIATRY/ VOL 64 (NO. 8), AUG 2007 WWW.ARCHGENPSYCHIATRY.COM950
©2007 American Medical Association. All rights reserved. on August 6, 2007 www.archgenpsychiatry.comDownloaded from

trols and was larger and extended more posteriorly intothe pre-SMA and SMA proper for OCD patients.
The MFC activation was part of a larger network ofactivated regions for controls, including 9 other supra-threshold clusters (P�5.87�10−9 to P�1.0�10−3, clus-terwise corrected) in the prefrontal, superior parietal, fu-siform, cerebellar, and caudate/putamen regions. For OCDpatients, 10 suprathreshold clusters were identified(P�2.04�10−14 to P�1.0�10−3) in regions similar tothose displayed by controls, with additional clusters inthe insula and inferior parietal areas (Table 3 andFigure 2A and B).
Between Group
The OCD group showed relative hyperactivation (I�C)in a cluster located in the SMA. Patients also showed rela-tive hypoactivation in the rAC (Table 2 and Figure 2C andD). This latter finding was contrary to expectations andthe results of previous studies, which led us to further in-vestigate patterns of task-related activation and deactiva-tion in both groups. These patterns are displayed in Figure 3together with the rAC cluster that differentiated the 2
groups. As can be seen, the apparent rAC hypoactivationin OCD patients resulted from greater relative deactiva-tion of this region in the patient group during the high-vs low-conflict trials (ie, the I�C contrast revealed greaterrelative rAC deactivation in the OCD group).
The OCD group showed relatively greater activationin 5 other regional clusters (P�1.0�10−3), with the larg-est being in the superior parietal area. Controls showedgreater relative activation in 2 other regional clusters(P�1.0�10−3), including the inferior frontal cortex andfusiform gyrus (Table 3 and Figure 2C and D).
Metabolites
Compared with controls, OCD patients showed signifi-cant (P=.01) decreases in NAA concentrations (a meanreduction of 6.3%) (Table 4). No other group differ-ences were observed for the other metabolites.
Brain-Behavioral Associations
There was no group difference in the mean magnitudeof dAC BOLD signal change (I�C) for each individual
Table 3. Additional Areas of Brain Activation and Relative Group Differences During Task Performancein Patients With OCD and Controlsa
Group and RegionApproximate
AreabClusterSizec
Maximumz Score
Anatomical Coordinates
x y z
Controls (n = 19)Superior parietal/occipital 7/19 243 7.52 24 −76 32Middle frontal gyrus 6 141 7.75 28 −6 60
6 104 7.17 −28 0 566 40 6.20 20 −6 58
Inferior frontal gyrus 45 32 5.48 36 16 22Precentral gyrus 6 28 6.50 50 −4 34Cerebellum NA 28 5.21 36 −62 −26Caudate/putamen NA 25 4.95 −16 4 14Fusiform gyrus 37 22 5.09 34 −58 −14
OCD (n = 19)Superior parietal/occipital 7/19 519 8.69 20 −80 50Middle frontal gyrus 6 451 8.03 20 −10 60Caudate/putamen NA 155 5.94 −16 0 12
NA 104 5.45 18 −4 12NA 35 5.36 34 14 2NA 29 4.96 22 8 12
Precentral gyrus 6 110 6.84 48 −4 264 18 5.41 38 −22 56
Insula NA 24 5.89 −32 20 2Inferior parietal lobe 40 21 4.78 −42 −34 34
OCD � controlSuperior parietal/occipital 7/19 39 4.39 −10 −86 40Precentral gyrus 43 15 4.02 −60 −6 12Middle frontal gyrus 6 14 5.26 24 −14 60Inferior frontal gyrus 47 10 3.73 −34 30 26Putamen NA 10 3.49 −36 −12 4
Control � OCDInferior frontal gyrus 47 11 3.78 −26 26 −14Fusiform gyrus 37 10 3.69 54 −54 −14
Abbreviations: NA, not applicable; OCD, obsessive-compulsive disorder.aThe first listed entry for each group reflects the cluster maxima, and following entries reflect significant, associated subcluster peaks.bRefers to approximation of Brodmann areas.cRefers to the cluster size in number of activated voxels.
(REPRINTED) ARCH GEN PSYCHIATRY/ VOL 64 (NO. 8), AUG 2007 WWW.ARCHGENPSYCHIATRY.COM951
©2007 American Medical Association. All rights reserved. on August 6, 2007 www.archgenpsychiatry.comDownloaded from
participant’s maximal cluster of activation (controls:1.53%; OCD patients: 1.48%; main effect of group:F1,46=0.06; P=.81). For controls, there was a positive cor-relation between dAC BOLD signal change and RT in-terference and total response errors (r=0.68, P=.001;r=0.61, P=.005, respectively). Similarly, OCD patientsalso showed a significant correlation between dAC BOLDsignal change and RT interference and response errors(r=0.46, P=.03; r=0.47, P=.03, respectively).
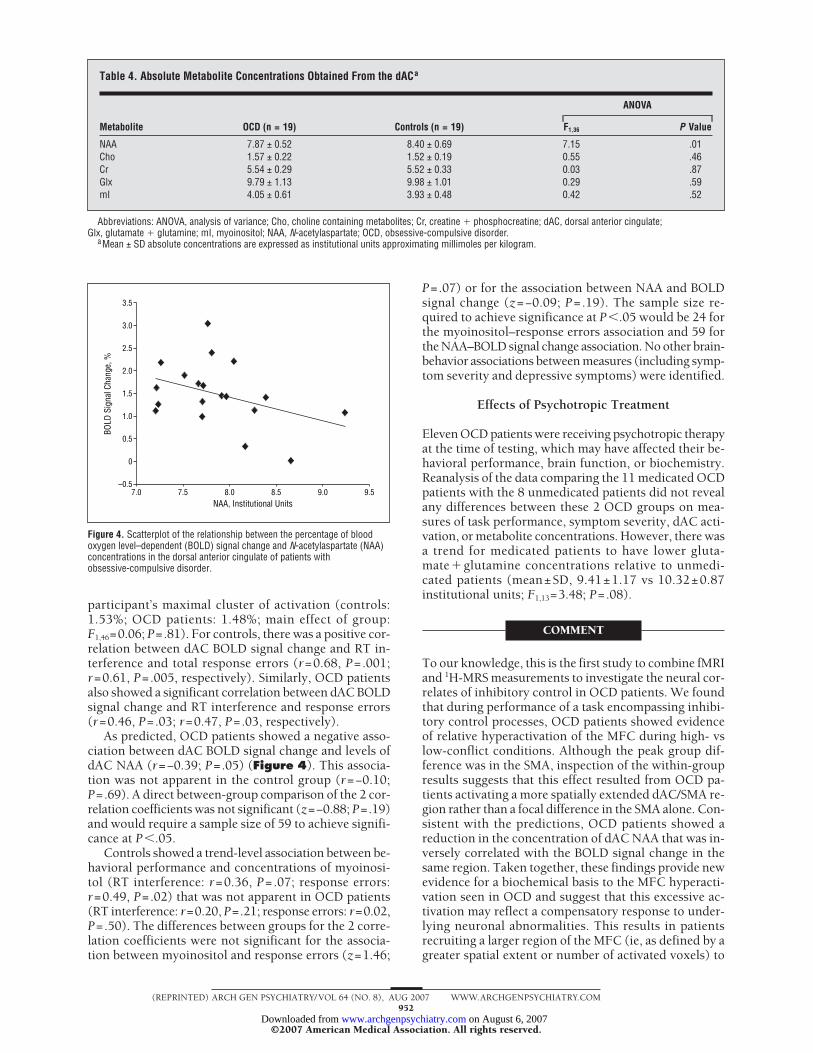
As predicted, OCD patients showed a negative asso-ciation between dAC BOLD signal change and levels ofdAC NAA (r=−0.39; P=.05) (Figure 4). This associa-tion was not apparent in the control group (r=−0.10;P=.69). A direct between-group comparison of the 2 cor-relation coefficients was not significant (z=−0.88; P=.19)and would require a sample size of 59 to achieve signifi-cance at P�.05.
Controls showed a trend-level association between be-havioral performance and concentrations of myoinosi-tol (RT interference: r=0.36, P=.07; response errors:r=0.49, P=.02) that was not apparent in OCD patients(RT interference: r=0.20, P=.21; response errors: r=0.02,P=.50). The differences between groups for the 2 corre-lation coefficients were not significant for the associa-tion between myoinositol and response errors (z=1.46;
P=.07) or for the association between NAA and BOLDsignal change (z=−0.09; P=.19). The sample size re-quired to achieve significance at P�.05 would be 24 forthe myoinositol–response errors association and 59 forthe NAA–BOLD signal change association. No other brain-behavior associations between measures (including symp-tom severity and depressive symptoms) were identified.
Effects of Psychotropic Treatment
Eleven OCD patients were receiving psychotropic therapyat the time of testing, which may have affected their be-havioral performance, brain function, or biochemistry.Reanalysis of the data comparing the 11 medicated OCDpatients with the 8 unmedicated patients did not revealany differences between these 2 OCD groups on mea-sures of task performance, symptom severity, dAC acti-vation, or metabolite concentrations. However, there wasa trend for medicated patients to have lower gluta-mate�glutamine concentrations relative to unmedi-cated patients (mean±SD, 9.41±1.17 vs 10.32±0.87institutional units; F1,13=3.48; P=.08).
COMMENT
To our knowledge, this is the first study to combine fMRIand 1H-MRS measurements to investigate the neural cor-relates of inhibitory control in OCD patients. We foundthat during performance of a task encompassing inhibi-tory control processes, OCD patients showed evidenceof relative hyperactivation of the MFC during high- vslow-conflict conditions. Although the peak group dif-ference was in the SMA, inspection of the within-groupresults suggests that this effect resulted from OCD pa-tients activating a more spatially extended dAC/SMA re-gion rather than a focal difference in the SMA alone. Con-sistent with the predictions, OCD patients showed areduction in the concentration of dAC NAA that was in-versely correlated with the BOLD signal change in thesame region. Taken together, these findings provide newevidence for a biochemical basis to the MFC hyperacti-vation seen in OCD and suggest that this excessive ac-tivation may reflect a compensatory response to under-lying neuronal abnormalities. This results in patientsrecruiting a larger region of the MFC (ie, as defined by agreater spatial extent or number of activated voxels) to
Table 4. Absolute Metabolite Concentrations Obtained From the dACa
Metabolite OCD (n = 19) Controls (n = 19)
ANOVA
F1,36 P Value
NAA 7.87 ± 0.52 8.40 ± 0.69 7.15 .01Cho 1.57 ± 0.22 1.52 ± 0.19 0.55 .46Cr 5.54 ± 0.29 5.52 ± 0.33 0.03 .87Glx 9.79 ± 1.13 9.98 ± 1.01 0.29 .59mI 4.05 ± 0.61 3.93 ± 0.48 0.42 .52
Abbreviations: ANOVA, analysis of variance; Cho, choline containing metabolites; Cr, creatine � phosphocreatine; dAC, dorsal anterior cingulate;Glx, glutamate � glutamine; mI, myoinositol; NAA, N-acetylaspartate; OCD, obsessive-compulsive disorder.
aMean ± SD absolute concentrations are expressed as institutional units approximating millimoles per kilogram.
3.5
1.5
2.0
2.5
3.0
0.5
1.0
0
–0.57.0 7.5 8.0 8.5 9.0 9.5
NAA, Institutional Units
BOLD
Sig
nal C
hang
e, %
Figure 4. Scatterplot of the relationship between the percentage of bloodoxygen level–dependent (BOLD) signal change and N-acetylaspartate (NAA)concentrations in the dorsal anterior cingulate of patients withobsessive-compulsive disorder.
(REPRINTED) ARCH GEN PSYCHIATRY/ VOL 64 (NO. 8), AUG 2007 WWW.ARCHGENPSYCHIATRY.COM952
©2007 American Medical Association. All rights reserved. on August 6, 2007 www.archgenpsychiatry.comDownloaded from

perform at appropriate levels. However, given the mod-est strength of the association between dAC BOLD sig-nal change and dAC levels of NAA, we consider this anovel finding that requires replication.
Similar to other studies33,34 of the MSIT in controls andpsychiatric patients, both groups in this study showedsignificant and robust activation of the dAC and the closelyconnected dorsal premotor regions (pre-SMA/SMA). Therelative hyperactivation of the MFC in OCD patients wasconsistent with the predictions and previous find-ings.11,19,20,31 Overall, the group-level analysis showed thatthe extent of activation (ie, the number of activated vox-els) in OCD patients was approximately twice that in con-trol subjects (747 vs 357 voxels), with no significant groupdifferences in the magnitude of the dAC BOLD re-sponse. When taken together with the present findingsof decreased NAA levels in the dAC of individuals withOCD, 1 possibility is that to achieve adequate task per-formance, the patient group recruited a larger cluster ofmedial wall regions (ie, pre-SMA/SMA) to compensatefor biochemical abnormalities in the region. Alterna-tively, it is possible that the heightened activation of dor-sal premotor regions in patients has primary, rather thancompensatory, relevance to the pathogenesis of OCD. Thiswould be consistent with other studies of premotor cor-tex hyperexcitability in OCD patients,49-52 particularly dur-ing response-generation tasks.26 In either case, it is clearthat further studies are needed to clarify the specificityof functional abnormalities of the MFC in OCD in thecontext of cognitive and psychomotor demands.
The magnitude of this dAC BOLD response was as-sociated with task performance in both groups and wasunrelated to symptom severity in patients. This latter find-ing contrasts with recent studies18,20 that have reportedassociations between the magnitude of increased dAC ac-tivity and severity of illness. The OCD sample was char-acterized by moderate levels of symptom severity, com-parable with these studies, suggesting that differences insymptom severity are unlikely to explain the discrep-ancy in findings. The present findings are consistent withthose of Maltby et al,19 who investigated more severelyill patients using the go/no-go task of inhibitory con-trol. These researchers found hyperactivity in the MFC,which was unrelated to symptom severity. Future stud-ies using similar tasks in the context of symptom provo-cation paradigms or different symptom profiles may elicitpatterns of activation that are more closely related to symp-tom measures.53-57 In addition, studies that focus on spe-cific events (eg, using an event-related fMRI paradigmto model brain activity associated specifically with re-sponse errors) may have greater sensitivity in extractingsuch relationships.18,20
The finding of reduced NAA levels is consistent withthe 2 previous 1H-MRS studies of the AC in OCD.22,23 Weextended this work by demonstrating a negative corre-lation, apparent only in patients, between dAC NAA lev-els and function, as indexed by the BOLD response. N-acetylaspartate is a metabolite produced in neuronalmitochondria and is thought to reflect neuronal densityand functional viability.24,58 It remains unclear whetherreduced levels reflect neuronal loss or a state of (poten-tially reversible) neuronal dysfunction. Whereas Ebert
et al22 interpreted their findings of reduced NAA levelsin OCD patients as evidence of neuronal loss in the ACregion, histopathologic data on this issue are lacking. Morerecently, Jang et al23 found that the baseline NAA reduc-tions in the dAC of drug-naıve OCD patients could bepartly reversed with 12 weeks of citalopram treatment,suggesting that the reduced NAA levels in this study mayreflect neuronal dysfunction rather than loss. More spe-cifically, it has been suggested that NAA concentrationreflects mitochondrial function.59 After its release fromneurons, NAA is taken up and hydrolyzed by oligoden-drocytes60,61 to act as a source of acetyl groups in a varietyof metabolic processes, including myelin synthesis,62
lipid repair/fatty acid synthesis,63 osmotic regulation,64
and anti-inflammatory action.65 Reduced dAC NAA lev-els may, thus, reflect a variety of underlying metabolicand biochemical changes that, when considered in thecontext of the present findings, suggest that OCD pa-tients have fewer healthy neurons in the region, necessi-tating the recruitment of adjacent and other task-relatedbrain regions (eg, the SMA, the lateral premotor, and thesuperior parietal) to perform at levels comparable withcontrols. This finding is supported by increasing evi-dence that NAA is critical for optimal cognitive function-ing (for reviews, see Yeo et al66 and Valenzuela et al67).However, the precise nature of the relationships amongBOLD signal change, neuronal activity levels, and thephysiologic role of NAA in neurons has yet to be fullyelucidated. Further investigations of the exact relation-ship between BOLD signal change (measured by meansof fMRI) and NAA concentration (measured by means of1H-MRS) in controls or patients with focal brain regionsis warranted before more conclusive statements can bemade.
As a secondary finding of this study, the whole-braincomparison of OCD patients and controls also showedsignificantly greater deactivation of the rAC region dur-ing the high- vs low-conflict trials. This pattern of task-related deactivation of the rAC and adjacent MFC is atypical finding in functional neuroimaging experimentsand is thought to reflect a shift from greater self-referential, or self-directed, mental activity (including sub-jective anxiety)68 to focused attention during task per-formance.69 The increased rAC deactivation seen in OCDpatients may reflect abnormally high levels of perfor-mance anxiety, which may form a part of the primary func-tional abnormality of the disorder. However, whether suchactivity relates to task anticipation or performance ap-praisal cannot be determined herein. A focus for futurestudies will be to undertake more detailed characteriza-tions of the baseline default state in OCD patients.
One limitation of the present study was the long du-ration of illness in patients (average illness duration ofapproximately 13 years), which means that the effectsof prolonged illness and treatment on the findings can-not be excluded. However, note that serotonergic anti-depressant medication tends to decrease activation in theMFC of OCD patients,70,71 which is, therefore, unlikelyto account for the finding of hyperactivation of the MFCin patients. A second limitation was the focus on the MFC,particularly the dAC, meaning that we did not acquireMRS data from other brain regions that are also impor-
(REPRINTED) ARCH GEN PSYCHIATRY/ VOL 64 (NO. 8), AUG 2007 WWW.ARCHGENPSYCHIATRY.COM953
©2007 American Medical Association. All rights reserved. on August 6, 2007 www.archgenpsychiatry.comDownloaded from

tant in the inhibitory control network implicated in OCD(eg, the inferior frontal gyrus).2,72 Thus, the anatomicalspecificity of the MRS findings is unclear. Finally, someof the analyses (eg, comparison of medicated vs unmedi-cated patients) may have been underpowered and war-rant more comprehensive examination. Future studiesexamining the relationship between neuronal and func-tional markers of AC integrity in OCD, and how thesevary as a function of symptom profile and treatment his-tory, will represent a useful extension to this study.
Taken together, the behavioral, functional, and bio-chemical measures of the MFC indicate that OCD is as-sociated with increased, presumably compensatory, ac-tivation in this region that may be underpinned by reducedneuronal integrity and viability. Future studies shouldconsider the effects of treatment on brain metabolites anddifferences in brain activation during baseline or con-trol conditions in OCD patients, as these may providecomplementary data about the functional neuropatho-logic features of OCD. Future OCD research should alsouse tasks that encompass other and more specific as-pects of inhibitory control (eg, the stop-signal para-digm)72 and further evaluate the state vs trait nature ofdysfunction (eg, by examining unaffected relatives of af-fected patients).
Submitted for Publication: July 24, 2006; final revisionreceived December 18, 2006; accepted December 24, 2006.Author Affiliations: Melbourne Neuropsychiatry Cen-tre, Department of Psychiatry, The University of Mel-bourne and Melbourne Health (Drs Yucel, Harrison,Wood, Fornito, Velakoulis, and Pantelis and Ms Clarke);Department of Psychology, The University of Mel-bourne (Dr Fornito); ORYGEN Research Centre(Dr Yücel); Howard Florey Institute (Dr Pantelis); BrainResearch Institute (Drs Wood and Wellard); and Swin-burne University of Technology (Dr Kyrios), Mel-bourne, Victoria, Australia; Queensland University ofTechnology, Brisbane, Queensland, Austral ia(Dr Wellard); Institut d’Alta Tecnologia-PRBB, CRC Cor-poracio Sanitària, Barcelona, Spain (Drs Harrison and Pu-jol); and Department of Psychiatry, University of Pitts-burgh, Pittsburgh, Pennsylvania (Dr Phillips).Correspondence: Murat Yucel, PhD, Melbourne Neuro-psychiatry Centre, c/o National Neuroscience Facility, 161Barry St, Carlton South, Victoria 3053, Australia ([email protected]).Financial Disclosure: None reported.Funding/Support: This research was supported by grantsID 236175 and ID 350241 from the National Health andMedical Research Council of Australia, the Colonial Foun-dation, the Ian Potter Foundation, program grant I.D.350241 from the NHMRC (Dr Yucel), training award ID400420 from the NHMRC (Dr Harrison), Clinical Ca-reer Development Award from the NHMRC (Dr Wood),and a NARSAD Young Investigator Award (Dr Wood).Neuroimaging analysis was facilitated by the Neuropsy-chiatry Imaging Laboratory managed by Bridget Soulsby,BBSc, at the Melbourne Neuropsychiatry Centre and sup-ported by Neurosciences Victoria.Additional Contributions: Sunil Bhar, PhD, provided as-sistance with patient recruitment, and the Mental Health
Research Institute provided research and administra-tive support.
REFERENCES
1. Purcell R, Maruff P, Kyrios M, Pantelis C. Neuropsychological deficits in obsessive-compulsive disorder: a comparison with unipolar depression, panic disorder, andnormal controls. Arch Gen Psychiatry. 1998;55(5):415-423.
2. Chamberlain SR, Blackwell AD, Fineberg NA, Robbins TW, Sahakian BJ. The neu-ropsychology of obsessive compulsive disorder: the importance of failures incognitive and behavioural inhibition as candidate endophenotypic markers. Neu-rosci Biobehav Rev. 2005;29(3):399-419.
3. van den Heuvel OA, Veltman DJ, Groenewegen HJ, Witter MP, Merkelbach J, CathDC, van Balkom AJ, van Oppen P, van Dyck R. Disorder-specific neuroanatomi-cal correlates of attentional bias in obsessive-compulsive disorder, panic disor-der, and hypochondriasis. Arch Gen Psychiatry. 2005;62(8):922-933.
4. Galderisi S, Mucci A, Catapano F, D’Amato AC, Maj M. Neuropsychological slow-ness in obsessive-compulsive patients: is it confined to tests involving the fronto-subcortical systems? Br J Psychiatry. 1995;167(3):394-398.
5. Tolin DF, Abramowitz JS, Przeworski A, Foa EB. Thought suppression in obsessive-compulsive disorder. Behav Res Ther. 2002;40(11):1255-1274.
6. Rosenberg DR, Dick EL, O’Hearn KM, Sweeney JA. Response-inhibition deficitsin obsessive-compulsive disorder: an indicator of dysfunction in frontostriatalcircuits. J Psychiatry Neurosci. 1997;22(1):29-38.
7. Rankins D, Bradshaw JL, Georgiou-Karistianis N. The semantic Simon effect inTourette’s syndrome and obsessive-compulsive disorder. Brain Cogn. 2006;61(3):225-234.
8. Bannon S, Gonsalvez CJ, Croft RJ, Boyce PM. Response inhibition deficits in ob-sessive-compulsive disorder. Psychiatry Res. 2002;110(2):165-174.
9. Muller J, Roberts JE. Memory and attention in obsessive-compulsive disorder:a review. J Anxiety Disord. 2005;19(1):1-28.
10. Rosenberg DR, Keshavan MSAE. Bennett Research Award: toward a neurode-velopmental model of obsessive-compulsive disorder. Biol Psychiatry. 1998;43(9):623-640.
11. van den Heuvel OA, Veltman DJ, Groenewegen HJ, Cath DC, van Balkom AJ, vanHartskamp J, Barkhof F, van Dyck R. Frontal-striatal dysfunction during plan-ning in obsessive-compulsive disorder. Arch Gen Psychiatry. 2005;62(3):301-309.
12. Swerdlow NR. Obsessive-compulsive disorder and tic syndromes. Med Clin NorthAm. 2001;85(3):735-755.
13. Saxena S, Brody AL, Schwartz JM, Baxter LR. Neuroimaging and frontal-subcortical circuitry in obsessive-compulsive disorder. Br J Psychiatry Suppl.1998;35:26-37.
14. Stein DJ, Goodman WK, Rauch SL. The cognitive-affective neuroscience of ob-sessive-compulsive disorder. Curr Psychiatry Rep. 2000;2(4):341-346.
15. Graybiel AM, Rauch SL. Toward a neurobiology of obsessive-compulsive disorder.Neuron. 2000;28(2):343-347.
16. Micallef J, Blin O. Neurobiology and clinical pharmacology of obsessive-compulsive disorder. Clin Neuropharmacol. 2001;24(4):191-207.
17. Modell JG, Mountz JM, Curtis GC, Greden JF. Neurophysiologic dysfunction inbasal ganglia/limbic striatal and thalamocortical circuits as a pathogenetic mecha-nism of obsessive-compulsive disorder. J Neuropsychiatry Clin Neurosci. 1989;1(1):27-36.
18. Fitzgerald KD, Welsh RC, Gehring WJ, Abelson JL, Himle JA, Liberzon I, TaylorSF. Error-related hyperactivity of the anterior cingulate cortex in obsessive-compulsive disorder. Biol Psychiatry. 2005;57(3):287-294.
19. Maltby N, Tolin DF, Worhunsky P, O’Keefe TM, Kiehl KA. Dysfunctional actionmonitoring hyperactivates frontal-striatal circuits in obsessive-compulsive dis-order: an event-related fMRI study. Neuroimage. 2005;24(2):495-503.
20. Ursu S, Stenger VA, Shear MK, Jones MR, Carter CS. Overactive action moni-toring in obsessive-compulsive disorder: evidence from functional magnetic reso-nance imaging. Psychol Sci. 2003;14(4):347-353.
21. Gehring WJ, Himle J, Nisenson LG. Action-monitoring dysfunction in obsessive-compulsive disorder. Psychol Sci. 2000;11(1):1-6.
22. Ebert D, Speck O, Konig A, Berger M, Hennig J, Hohagen F. 1H-magnetic reso-nance spectroscopy in obsessive-compulsive disorder: evidence for neuronal lossin the cingulate gyrus and the right striatum. Psychiatry Res. 1997;74(3):173-176.
23. Jang JH, Kwon JS, Jang DP, Moon WJ, Lee JM, Ha TH, Chung EC, Kim IY, KimSI. A proton MRSI study of brain N-acetylaspartate level after 12 weeks of cita-lopram treatment in drug-naive patients with obsessive-compulsive disorder. AmJ Psychiatry. 2006;163(7):1202-1207.
24. Barker PB. N-acetyl aspartate: a neuronal marker? Ann Neurol. 2001;49(4):423-424.
(REPRINTED) ARCH GEN PSYCHIATRY/ VOL 64 (NO. 8), AUG 2007 WWW.ARCHGENPSYCHIATRY.COM954
©2007 American Medical Association. All rights reserved. on August 6, 2007 www.archgenpsychiatry.comDownloaded from

25. Dager SR, Steen RG. Applications of magnetic resonance spectroscopy to theinvestigation of neuropsychiatric disorders. Neuropsychopharmacology. 1992;6(4):249-266.
26. Pujol J, Torres L, Deus J, Cardoner N, Pifarre J, Capdevila A, Vallejo J. Func-tional magnetic resonance imaging study of frontal lobe activation during wordgeneration in obsessive-compulsive disorder. Biol Psychiatry. 1999;45(7):891-897.
27. Pujol J, Soriano-Mas C, Alonso P, Cardoner N, Menchon JM, Deus J, Vallejo J.Mapping structural brain alterations in obsessive-compulsive disorder. Arch GenPsychiatry. 2004;61(7):720-730.
28. Nakao T, Nakagawa A, Yoshiura T, Nakatani E, Nabeyama M, Yoshizato C, Ku-doh A, Tada K, Yoshioka K, Kawamoto M. A functional MRI comparison of pa-tients with obsessive-compulsive disorder and normal controls during a Chi-nese character Stroop task. Psychiatry Res. 2005;139(2):101-114.
29. Nakao T, Nakagawa A, Yoshiura T, Nakatani E, Nabeyama M, Yoshizato C, Ku-doh A, Tada K, Yoshioka K, Kawamoto M, Togao O, Kanba S. Brain activation ofpatients with obsessive-compulsive disorder during neuropsychological and symp-tom provocation tasks before and after symptom improvement: a functional mag-netic resonance imaging study. Biol Psychiatry. 2005;57(8):901-910.
30. Szeszko PR, Ardekani BA, Ashtari M, Malhotra AK, Robinson DG, Bilder RM, LimKO. White matter abnormalities in obsessive-compulsive disorder: a diffusiontensor imaging study. Arch Gen Psychiatry. 2005;62(7):782-790.
31. Harrison BJ, Yucel M, Shaw M, Kyrios M, Maruff P, Brewer WJ, Purcell R, Vela-koulis D, Strother SC, Scott AM, Nathan PJ, Pantelis C. Evaluating brain activityin obsessive-compulsive disorder: preliminary insights from a multivariate analysis.Psychiatry Res. 2006;147(2-3):227-231.
32. Bush G, Shin LM. The Multi-Source Interference Task: an fMRI task that reliablyactivates the cingulo-frontal-parietal cognitive/attention network. Nat Protoc. 2006;1(1):308-313.
33. Bush G, Shin LM, Holmes J, Rosen BR, Vogt BA. The Multi-Source InterferenceTask: validation study with fMRI in individual subjects. Mol Psychiatry. 2003;8(1):60-70.
34. Heckers S, Weiss AP, Deckersbach T, Goff DC, Morecraft RJ, Bush G. Anteriorcingulate cortex activation during cognitive interference in schizophrenia. Am JPsychiatry. 2004;161(4):707-715.
35. Saxena S, Rauch SL. Functional neuroimaging and the neuroanatomy of obsessive-compulsive disorder. Psychiatr Clin North Am. 2000;23(3):563-586.
36. Rauch SL. Neuroimaging and neurocircuitry models pertaining to the neurosur-gical treatment of psychiatric disorders. Neurosurg Clin N Am. 2003;14(2):213-223, vii-viii.
37. Yucel M, Harrison BJ, Wood SJ, Fornito A, Clarke K, Wellard RM, Cotton S, Pan-telis C. State, trait and biochemical influences on human anterior cingulate function.Neuroimage. 2007;34(4):1766-1773.
38. First MB, Spitzer RL, Gibbon M, Williams JB. Structured Clinical Interview forDSM-IV Axis I Disorders. Washington, DC: American Psychiatric Press; 1997.
39. Wechsler D. Wechsler Abbreviated Scale of Intelligence Manual. San Antonio,TX: Psychological Corp; 1999.
40. Tabachnick BG, Fidell LS. Using Multivariate Statistics, Fourth Edition. NeedhamHeights, MA: Allyn & Bacon; 2001.
41. Jenkinson M, Bannister P, Brady M, Smith S. Improved optimization for the ro-bust and accurate linear registration and motion correction of brain images.Neuroimage. 2002;17(2):825-841.
42. Smith SM. Fast robust automated brain extraction. Hum Brain Mapp. 2002;17(3):143-155.
43. Woolrich MW, Ripley BD, Brady M, Smith SM. Temporal autocorrelation in uni-variate linear modeling of fMRI data. Neuroimage. 2001;14(6):1370-1386.
44. Worsley KJ, Evans AC, Marrett S, Neelin P. A three-dimensional statistical analy-sis for CBF activation studies in human brain. J Cereb Blood Flow Metab. 1992;12(6):900-918.
45. Beckmann CF, Jenkinson M, Smith SM. General multilevel linear modeling forgroup analysis in fMRI. Neuroimage. 2003;20(2):1052-1063.
46. Woolrich MW, Behrens TE, Beckmann CF, Jenkinson M, Smith SM. Multilevellinear modelling for fMRI group analysis using Bayesian inference. Neuroimage.2004;21(4):1732-1747.
47. Jenkinson M, Smith S. A global optimisation method for robust affine registra-tion of brain images. Med Image Anal. 2001;5(2):143-156.
48. Provencher SW. Estimation of metabolite concentrations from localized in vivoproton NMR spectra. Magn Reson Med. 1993;30(6):672-679.
49. Gilbert DL, Bansal AS, Sethuraman G, Sallee FR, Zhang J, Lipps T, WassermannEM. Association of cortical disinhibition with tic, ADHD, and OCD severity in To-urette syndrome. Mov Disord. 2004;19(4):416-425.
50. Greenberg BD, Ziemann U, Cora-Locatelli G, Harmon A, Murphy DL, Keel JC,
Wassermann EM. Altered cortical excitability in obsessive-compulsive disorder.Neurology. 2000;54(1):142-147.
51. Mantovani A, Lisanby SH, Pieraccini F, Ulivelli M, Castrogiovanni P, Rossi S.Repetitive transcranial magnetic stimulation (rTMS) in the treatment of obses-sive-compulsive disorder (OCD) and Tourette’s syndrome (TS). Int J Neuro-psychopharmacol. 2006;9(1):95-100.
52. Wassermann EM, Greenberg BD, Nguyen MB, Murphy DL. Motor cortex excit-ability correlates with an anxiety-related personality trait. Biol Psychiatry. 2001;50(5):377-382.
53. Adler CM, McDonough-Ryan P, Sax KW, Holland SK, Arndt S, Strakowski SM.fMRI of neuronal activation with symptom provocation in unmedicated patientswith obsessive compulsive disorder. J Psychiatr Res. 2000;34(4-5):317-324.
54. Mataix-Cols D, van den Heuvel OA. Common and distinct neural correlates ofobsessive-compulsive and related disorders. Psychiatr Clin North Am. 2006;29(2):391-410, viii.
55. Mataix-Cols D, Wooderson S, Lawrence N, Brammer MJ, Speckens A, PhillipsML. Distinct neural correlates of washing, checking, and hoarding symptom di-mensions in obsessive-compulsive disorder. Arch Gen Psychiatry. 2004;61(6):564-576.
56. Rauch SL, Jenike MA, Alpert NM, Baer L, Breiter HC, Savage CR, Fischman AJ.Regional cerebral blood flow measured during symptom provocation in obsessive-compulsive disorder using oxygen 15-labeled carbon dioxide and positron emis-sion tomography. Arch Gen Psychiatry. 1994;51(1):62-70.
57. Shin YW, Kwon JS, Kim JJ, Kang DH, Youn T, Kang KW, Kang E, Lee DS, LeeMC. Altered neural circuit for working memory before and after symptom provo-cation in patients with obsessive-compulsive disorder. Acta Psychiatr Scand. 2006;113(5):420-429.
58. Meyerhoff DJ, MacKay S, Bachman L, Poole N, Dillon WP, Weiner MW, Fein G.Reduced brain N-acetylaspartate suggests neuronal loss in cognitively impairedhuman immunodeficiency virus-seropositive individuals: in vivo 1H magnetic reso-nance spectroscopic imaging. Neurology. 1993;43(3, pt 1):509-515.
59. Petroff OA, Errante LD, Kim JH, Spencer DD. N-acetyl-aspartate, total creatine,and myo-inositol in the epileptogenic human hippocampus. Neurology. 2003;60(10):1646-1651.
60. Baslow MH. N-acetylaspartate in the vertebrate brain: metabolism and function.Neurochem Res. 2003;28(6):941-953.
61. Baslow MH, Suckow RF, Sapirstein V, Hungund BL. Expression of aspartoacyl-ase activity in cultured rat macroglial cells is limited to oligodendrocytes. J MolNeurosci. 1999;13(1-2):47-53.
62. Tallan HH. Studies on the distribution of N-acetyl-L-aspartic acid in brain. J BiolChem. 1957;224(1):41-45.
63. D’Adamo AF Jr, Gidez LI, Yatsu FM. Acetyl transport mechanisms: involvementof N-acetyl aspartic acid in de novo fatty acid biosynthesis in the developing ratbrain. Exp Brain Res. 1968;5(4):267-273.
64. Sager TN, Fink-Jensen A, Hansen AJ. Transient elevation of interstitial N-acetyl-aspartate in reversible global brain ischemia. J Neurochem. 1997;68(2):675-682.
65. Rael LT, Thomas GW, Bar-Or R, Craun ML, Bar-Or D. An anti-inflammatory rolefor N-acetyl aspartate in stimulated human astroglial cells. Biochem Biophys ResCommun. 2004;319(3):847-853.
66. Yeo RA, Brooks WM, Jung RE. NAA and higher cognitive function in humans.Adv Exp Med Biol. 2006;576:215-226.
67. Valenzuela MJ, Sachdev PS, Wen W, Shnier R, Brodaty H, Gillies D. Dual voxelproton magnetic resonance spectroscopy in the healthy elderly: subcortical-frontal axonal N-acetylaspartate levels are correlated with fluid cognitive abili-ties independent of structural brain changes. Neuroimage. 2000;12(6):747-756.
68. Simpson JR Jr, Drevets WC, Snyder AZ, Gusnard DA, Raichle ME. Emotion-induced changes in human medial prefrontal cortex, II: during anticipatory anxiety.Proc Natl Acad Sci U S A. 2001;98(2):688-693.
69. Gusnard DA, Raichle ME, Raichle ME. Searching for a baseline: functional imagingand the resting human brain. Nat Rev Neurosci. 2001;2(10):685-694.
70. Benkelfat C, Nordahl TE, Semple WE, King AC, Murphy DL, Cohen RM. Localcerebral glucose metabolic rates in obsessive-compulsive disorder: patients treatedwith clomipramine. Arch Gen Psychiatry. 1990;47(9):840-848.
71. Swedo SE, Pietrini P, Leonard HL, Schapiro MB, Rettew DC, Goldberger EL, RapoportSI, Rapoport JL, Grady CL. Cerebral glucose metabolism in childhood-onsetobsessive-compulsive disorder: revisualization during pharmacotherapy. ArchGen Psychiatry. 1992;49(9):690-694.
72. Chamberlain SR, Fineberg NA, Blackwell AD, Robbins TW, Sahakian BJ. Motorinhibition and cognitive flexibility in obsessive-compulsive disorder andtrichotillomania. Am J Psychiatry. 2006;163(7):1282-1284.
(REPRINTED) ARCH GEN PSYCHIATRY/ VOL 64 (NO. 8), AUG 2007 WWW.ARCHGENPSYCHIATRY.COM955
©2007 American Medical Association. All rights reserved. on August 6, 2007 www.archgenpsychiatry.comDownloaded from
Copyright © 2022 FDOKUMEN