A magnetic resonance spectroscopy investigation of obsessive–compulsive disorder and anxiety
11
A magnetic resonance spectroscopy investigation of obsessive–compulsive disorder and anxiety Stephen P. Whiteside a, ⁎ , John D. Port b , Brett J. Deacon c , Jonathan S. Abramowitz a a Department of Psychiatry and Psychology, West 11, Mayo Clinic, 200 First St. SW, Rochester, MN 55905, United States b Department of Radiology, Mayo Clinic, Rochester, MN, United States c Department of Psychology, University of Wyoming, Laramie, WY, United States Received 18 August 2005; received in revised form 6 December 2005; accepted 14 December 2005 Abstract The aim of the current study was to use proton magnetic resonance spectroscopy (MRS) to investigate potential irregularities in neurochemical compounds in obsessive–compulsive disorder (OCD) and the extent to which these irregularities are related to state anxiety. Single voxel MRS was used to image the head of the caudate nucleus (HOC) and orbitofrontal white matter (OFWM) bilaterally in adult patients with OCD and a control group. The results indicated that patients with OCD had increased levels of a combined measure of glutamate and glutamine (Glx/Cr) and N-acetyl-l-aspartic acid (NAA/Cr) relative to creatine in the right OFWM and reduced levels of myo-inositol relative to creatine (mI/Cr) in the HOC bilaterally. Correlational analyses indicated that Glx/Cr in the OFWM was related to OCD symptoms, while mI/Cr in the HOC was related to trait and/or state anxiety. Reanalysis of the significant group differences controlling for state anxiety symptoms erased three of the four group differences. These results are discussed in context of the methodological difficulties facing this area of research. © 2006 Elsevier Ireland Ltd. All rights reserved. Keywords: Obsessive–compulsive disorder; Anxiety; Magnetic resonance spectroscopy; Neuroimaging; Caudate; Orbitofrontal white matter 1. Introduction Neuroimaging studies in obsessive–compulsive dis- order (OCD) have the potential to increase our understanding of the connection between the observable symptoms and associated neurobiology, and perhaps lead to improvements in treatment and in matching treatment to patient needs (Rauch, 2000). With respect to neurobiology, brain regions involved in processing threat cues and routine complex motor programing have been implicated in OCD. For instance, the orbitofrontal cortex (OFC) and the caudate nucleus are thought to be involved in the mediation of emotional responses to stimuli associated with biologically based threats, a process that appears to be disrupted in OCD (Saxena et al., 2001). Much of the evidence supporting the presence of OCD-specific dysfunction in the OFC and caudate comes from studies employing positron emission tomography (PET) and single photon emission comput- ed tomography (SPECT) to compare patients with OCD with healthy volunteers. The most consistent differences between patients with OCD and healthy controls identified by this research have been in the orbital gyrus and the head of the caudate nucleus (Saxena et al., 2001; Whiteside et al., 2004). Psychiatry Research: Neuroimaging 146 (2006) 137 – 147 www.elsevier.com/locate/psychresns ⁎ Corresponding author. Tel.: +1 507 284 5849; fax: +1 507 284 4158. E-mail address: [email protected] (S.P. Whiteside). 0925-4927/$ - see front matter © 2006 Elsevier Ireland Ltd. All rights reserved. doi:10.1016/j.pscychresns.2005.12.006
-
Upload
mayoclinic -
Category
Documents
-
view
7 -
download
0
Transcript of A magnetic resonance spectroscopy investigation of obsessive–compulsive disorder and anxiety

aging 146 (2006) 137–147www.elsevier.com/locate/psychresns
Psychiatry Research: Neuroim
A magnetic resonance spectroscopy investigation ofobsessive–compulsive disorder and anxiety
Stephen P. Whiteside a,⁎, John D. Port b, Brett J. Deacon c, Jonathan S. Abramowitz a
aDepartment of Psychiatry and Psychology, West 11, Mayo Clinic, 200 First St. SW, Rochester, MN 55905, United StatesbDepartment of Radiology, Mayo Clinic, Rochester, MN, United States
cDepartment of Psychology, University of Wyoming, Laramie, WY, United States
Received 18 August 2005; received in revised form 6 December 2005; accepted 14 December 2005
Abstract
The aim of the current study was to use proton magnetic resonance spectroscopy (MRS) to investigate potential irregularities inneurochemical compounds in obsessive–compulsive disorder (OCD) and the extent to which these irregularities are related to stateanxiety. Single voxel MRS was used to image the head of the caudate nucleus (HOC) and orbitofrontal white matter (OFWM)bilaterally in adult patients with OCD and a control group. The results indicated that patients with OCD had increased levels of acombined measure of glutamate and glutamine (Glx/Cr) and N-acetyl-l-aspartic acid (NAA/Cr) relative to creatine in the rightOFWM and reduced levels of myo-inositol relative to creatine (mI/Cr) in the HOC bilaterally. Correlational analyses indicated thatGlx/Cr in the OFWM was related to OCD symptoms, while mI/Cr in the HOC was related to trait and/or state anxiety. Reanalysisof the significant group differences controlling for state anxiety symptoms erased three of the four group differences. These resultsare discussed in context of the methodological difficulties facing this area of research.© 2006 Elsevier Ireland Ltd. All rights reserved.
Keywords: Obsessive–compulsive disorder; Anxiety; Magnetic resonance spectroscopy; Neuroimaging; Caudate; Orbitofrontal white matter
1. Introduction
Neuroimaging studies in obsessive–compulsive dis-order (OCD) have the potential to increase ourunderstanding of the connection between the observablesymptoms and associated neurobiology, and perhapslead to improvements in treatment and in matchingtreatment to patient needs (Rauch, 2000). With respectto neurobiology, brain regions involved in processingthreat cues and routine complex motor programing havebeen implicated in OCD. For instance, the orbitofrontal
⁎ Corresponding author. Tel.: +1 507 284 5849; fax: +1 507 284 4158.E-mail address: [email protected] (S.P. Whiteside).
0925-4927/$ - see front matter © 2006 Elsevier Ireland Ltd. All rights resedoi:10.1016/j.pscychresns.2005.12.006
cortex (OFC) and the caudate nucleus are thought to beinvolved in the mediation of emotional responses tostimuli associated with biologically based threats, aprocess that appears to be disrupted in OCD (Saxena etal., 2001). Much of the evidence supporting the presenceof OCD-specific dysfunction in the OFC and caudatecomes from studies employing positron emissiontomography (PET) and single photon emission comput-ed tomography (SPECT) to compare patients with OCDwith healthy volunteers. The most consistent differencesbetween patients with OCD and healthy controlsidentified by this research have been in the orbitalgyrus and the head of the caudate nucleus (Saxena et al.,2001; Whiteside et al., 2004).
rved.
138 S.P. Whiteside et al. / Psychiatry Research: Neuroimaging 146 (2006) 137–147
More recently, researchers (Ebert et al., 1997;Bartha et al., 1998; Ohara et al., 1999; Fitzgerald etal., 2000; Rosenberg et al., 2000; Russell et al., 2003)have begun using magnetic resonance spectroscopy(MRS) to evaluate potential differences in regionalbrain metabolites between patients with OCD andhealthy controls. MRS has been used primarily tomeasure concentrations of metabolites in brain tissuesuch as N-acetyl-l-aspartate (NAA; a marker ofneuronal viability), combined glutamate and glutamine(Glx; a marker for excitatory neurotransmitters),choline (Cho; a marker of cell membrane turnover),myo-inositol (mI: involved in phospholipid metabo-lism), and creatine (Cr; a marker of cellular energetics,commonly used as a reference level).
Findings from the PET and SPECT literature havebegun to be replicated through the use ofMRS. Althoughno studies have found identical results, two haveidentified unilaterally decreased NAA in the striatumof adults with OCD (relative to Cr in the right striatum:Ebert et al., 1997; relative to water in the left striatum:Bartha et al., 1998), and two have identified increasedabsolute concentrations of choline bilaterally in themedial thalami (Rosenberg et al., 2001; Smith et al.,2003) of children with OCD. In addition, Rosenberg etal. (2000) found that elevated levels of Glx concentra-tions relative to water in the left caudate decreased aftersuccessful pharmacotherapy of pediatric OCD. Finally,compared with findings in healthy controls, absolutelevels of NAA have been shown to be increased in theright, but not left, dorsolateral prefrontal cortex (Russellet al., 2003) and the absolute Glx level has been found tobe decreased in the anterior cingulate of children withOCD (Rosenberg et al., 2004).
In the present study, we used MRS to examinelevels of neurochemicals in the head of the caudatenucleus and orbitofrontal white matter (OFWM) inadults with OCD versus a healthy control group. First,we sought to determine whether the previouslyobserved lesser amounts of NAA levels found in thestriatum (Ebert et al., 1997; Bartha et al., 1998) couldbe localized to the head of the caudate and whetherincreased levels of Glx in children (Rosenberg et al.,2000) could be extended to adults. Differences in theseareas would be consistent with the functional neuro-anatomy theory of OCD proposed by Saxena et al.(2001) that implicates the ventromedial caudatenucleus which receives projections from the OFC, aswell as with the results of our meta-analysis, whichfound consistent differences in the head of the caudatenucleus (Whiteside et al., 2004). To our knowledge,MRS has not yet been used to study the head of the
caudate in adult OCD. Second, we sampled theOFWM since, despite frequent findings of abnormal-ities in the orbital gyrus using other imagingtechniques (Saxena et al., 2001), only one study hasused MRS to examine the prefrontal cortex in pediatricOCD (Russell et al., 2003). To our knowledge, nostudies have used MRS to evaluate the prefrontalcortex in adult OCD. Since it is not possible to reliablyimage the orbital gyrus or OFC due to methodologicalconstraints, we sampled the broader OFWM with avoxel that incorporated a large portion of the orbitalgyrus and expected to find increased levels of Glx.Third, we investigated whether increased levels of Choin OCD extended to the head of caudate and OFWM.
One limitation of the existing neuroimaging literatureis that no studies have ruled out the possibility thatobserved differences in brain chemistry between OCDpatients and controls might be related to between-groupdifferences in levels of state (or trait) anxiety, as opposedto the presence of OCD per se. If differences in observedbrain chemistry are associated with general anxiousness,this would suggest that such altered chemistry is a featureof excessive anxiety in general rather than OCDspecifically. Only two studies to date, both utilizingSPECT (Lucey et al., 1995, 1997), have measuredanxiety during the scanning process. One of these studiesfound that the anxiety ratings correlated with whole brainblood flow (Lucey et al., 1997).
Since no OCD studies utilizing MRS have con-trolled for the level of anxiety experienced during theimaging procedure, we included a measure of stateanxiety (the Subjective Units of Distress Scale; SUDS)as a possible mediator of the relationship between OCDand neuroimaging findings. We hypothesized thatdifferences in levels of state anxiety during the scanwould account for decreased levels of NAA in thestriatum and increased levels of Glx in the head ofcaudate and OFWM in OCD patients compared withcontrol values.
2. Methods
2.1. Participants
Thirty Caucasian adults, aged 31–62, participatedin the study, which was approved by the Mayo Clinicinstitutional review board. The clinical group con-sisted of 15 patients with OCD who were screenedafter presenting for treatment at an outpatient anxietydisorders clinic at Mayo Clinic. Fifteen age- and sex-matched healthy controls were recruited through printadvertising. A total of 18 patients with OCD and 17

Table 1Participant demographic and clinical information
Experimental group t-value
OCD(n=15)
Control(n=15)
Age 41.2 (7.1) 41.4 (7.9) 0.07Males 9 (60%) 9 (60%) –Education (years) 16.7 (3.2) 16.14 (4.0) 0.11Y-BOCS
Total 24.13 (3.2) – –Obsessions 11.73 (1.5) – –Compulsions 12.40 (2.5) – –
Sheehan Disability Scale 17.57 (6.1) – –Hamilton Depression Scale 8.8 (4.4) – –Age of onset 18.27 (8.0) – –Duration of symptoms in
years (n=11)23.09 (9.8) – –
Anxiety in scanner 31.36 (14.3) 7.27 (6.9) 5.87 ⁎
STAI-T 49.43 (6.9) 30.43 (9.2) 6.18 ⁎
BDI 13.07 (7.7) 1.08 (1.66) 5.48 ⁎
OCI-R 27.5 (10.3) 1.69 (2.32) 8.85 ⁎
Y-BOCS = Yale-Brown Obsessive Compulsive Inventory; STAI-T =State-Trait Anxiety Inventory-Trait Form; BDI = Beck DepressionInventory; OCI-R = Obsessive–Compulsive Inventory-Revised.⁎ Pb0.001.
139S.P. Whiteside et al. / Psychiatry Research: Neuroimaging 146 (2006) 137–147
potential controls were screened. All participants wereprovided a small stipend as compensation for theirtime.
All participants had a diagnostic interview by atrained doctoral level psychologist using the Struc-tured Clinical Interview for DSM-IV Axis I and IIDisorders (SCID-IV; First et al., 1996). The OCDgroup was also administered the Yale-Brown Obses-sive Compulsive Scale (Y-BOCS). Exclusion criteriawere (a) current substance abuse, (b) major underlyingneurological or medical problems, (c) active psycho-sis, or (d) acute risk for suicide or danger to others.Participants in the OCD group met SCID-IV criteriafor OCD and had a score of 18 or higher on the Y-BOCS, but were excluded if they had a currentdiagnosis of major depression, bipolar disorder,schizophrenia, mental retardation, or substance abuse,or a history of a failed trial of cognitive behaviortherapy for OCD. Finally, as the Expert ConsensusGuidelines for the treatment of OCD (Frances et al.,1997) consider 8 to 13 weeks to be an adequatemedication trial, the eight OCD patients who werereceiving treatment with psychotropic medication wererequired to have been on a stable dose of theirmedication for at least 3 months.1 Of the sevenpatients who were not receiving psychotropic medica-tions, three had received them in the past, and fourwere treatment naïve. Individuals in the healthycontrol group had no current or past history ofpsychiatric diagnoses or psychiatric or psychologicaltreatment. None were taking psychotropic medication.Table 1 presents demographic and clinical informationfor both groups.
2.2. Design and general procedure
The study employed a two-group case–controldesign. Research technicians were blind to diagnosticstatus of participants. Following a review of the studyprocedures and provision of consent, potential partici-pants received the diagnostic interview. Participants whomet the inclusion criteria provided a urine sample toscreen for recreational drug use and received the MRSscan. The MRS technician asked the participants to ratetheir anxiety using the Subjective Unit of Distress Scale(SUDS; described below) at the following times: (a)before entering the scanning room, (b) after being placed
1 Medications included Trazodone, Remeron, Celexa, clomipra-mine, clonazepam, Prozac, Paxil, Ritalin, Anafranil, Wellbutrin, andLuvox.
in the scanner before the first imaging sequence, and (c)following each imaging sequence (11 times) during thescan.
2.3. Assessment
The OCD patients had an interview that included thestructured interview described below. All participantscompleted the self-report measures.
2.3.1. Clinical interviewStructured Clinical Interview for DSM-IV (SCID-IV;
(First et al., 1996): The SCID-IV was used to makediagnoses according to DSM-IV criteria. Both part I (forAxis I disorders) and part II (for personality disorders)were employed.
Yale-Brown Obsessive Compulsive Scale (Y-BOCS;Goodman et al., 1989a,b): The Y-BOCS is a valid andcomprehensive 10-item clinician interview of OCDsymptoms considered to be the “gold standard” severitymeasure. It yields a total score of 0 to 40, has an internalconsistency of 0.91, is sensitive to treatment effects, andhas good convergent validity with other OCD measures(Taylor, 1995).
Hamilton Depression Scale (HAM-D; Hamilton,1960): The HAM-D is a 17-item interview measure ofvegetative symptoms of depression. Interrater reliability

140 S.P. Whiteside et al. / Psychiatry Research: Neuroimaging 146 (2006) 137–147
is high (0.84), and the scale has good convergentvalidity with other depression measures.
2.3.2. Self-report measuresBeck Depression Inventory (BDI; Beck et al., 1961):
This is a 21-item measure that is widely used to assessdepressive symptoms. Scores on the BDI range from 0(no symptoms) to 63 (very severe symptoms). Thesound psychometric properties of the scale aresupported by an extensive literature (Beck et al., 1988).
State-Trait Anxiety Inventory-Trait Version Form Y(STAI-T; Spielberger et al., 1983): The STAI-T is a 20-item inventory that assesses trait anxiety, defined as theenduring tendency to experience anxiety. The STAI-Thas demonstrated high test–retest reliability, internalconsistency, and concurrent validity with other anxietyquestionnaires (Spielberger et al., 1983).
Obsessive–Compulsive Inventory-Revised (OCI-R;Foa et al., 2002): The OCI-R is an 18-item self-reportquestionnaire. Respondents rate the degree to whichthey have been bothered or distressed by 18 common
Fig. 1. Axial (A, C) and coronal reformatted (B, D) images showing the reprright caudate head voxels. C, D: locations of the orbitofrontal cortex voxels
symptoms of OCD in the past month. OCI-R total scoreshave demonstrated excellent psychometric propertiesand validity (Foa et al., 2002).
2.3.3. Assessment during imagingSubjective Units of Distress Scale (SUDS): Partici-
pants were asked to rate their current level of anxietyduring the scan on a scale of 0 to 100, where 0 indicatesthat they feel no anxiety whatsoever and 100 indicatesthat they are extremely anxious, experiencing maxi-mum distress. Anchors were created by having theparticipants identify situations that corresponded to 0,50, and 100. The 12 ratings obtained while the patientwas in the scanner were averaged to produce a singlescore representing overall anxiety experienced duringthe scan.
2.4. Neuroimaging procedures
To eliminate inter-scanner variability, all imaging wasperformed on a single clinical 1.5-Tesla MRI scanner
esentative locations of the MRS voxels. A, B: locations of the left and.

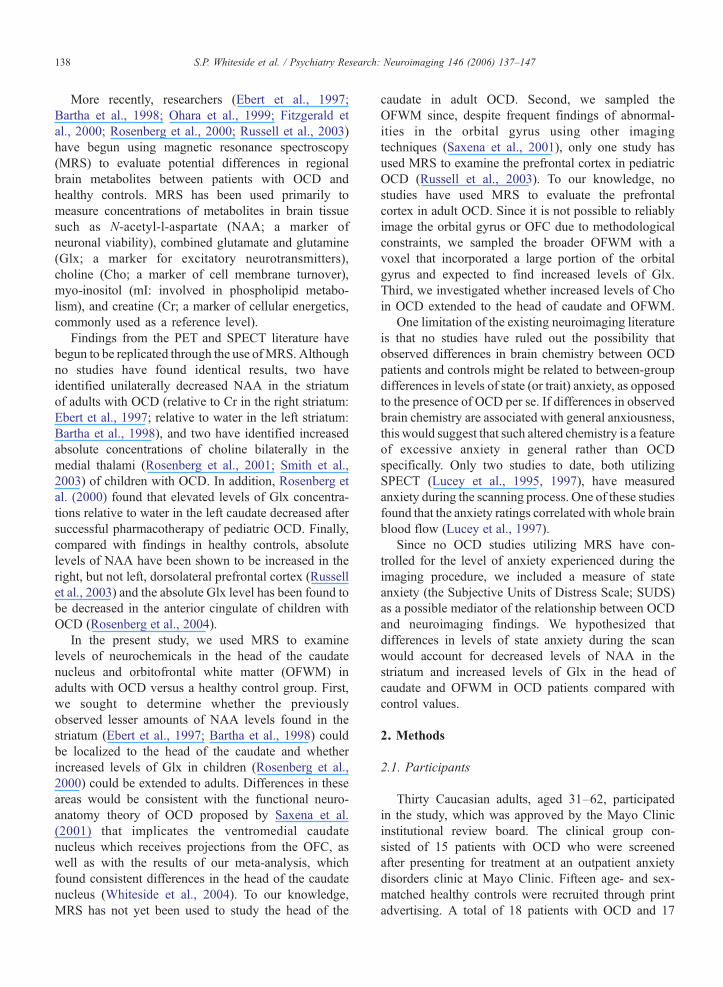
Fig. 2. Typical spectrum as analyzed by LCModel.Note: This spectrum is from a voxel located in the left orbitofrontal white matter of Subject 10. Theconcentrations of the metabolites and their associated Cramer-Rao bounds are listed in the box on the right.
Table 2Percentage of acceptable voxel data by location and metabolite
Region of interest
Head of caudate Orbitofrontalwhite matter
Left Right Left Right
MetaboliteCho/Cr 95 100 90 83mI/Cr 80 90 73 78NAA/Cr 98 100 90 85Glx/Cr 76 88 56 56
141S.P. Whiteside et al. / Psychiatry Research: Neuroimaging 146 (2006) 137–147
(GE Medical Systems, Milwaukee, Wisconsin) at theMayo Clinic. A clinical MR scan was obtained, followedby four single-voxel short-echo-time MRS scans(PROBE-P, TR=2000, TE=35, 128 scans, 2 cm A-P×2 cm R-L×1 cm S-I for a nominal voxel volume of 4cc). Voxels were relatively “flat” to 1) reduce intravoxeldephasing by excluding brain regions affected bysusceptibility artifacts from the adjacent ethmoid sinusesand orbits, and 2) better fit the selected brain structures.The total imaging time was approximately 1 h.
Caudate head voxels were positioned to encompassthe entire caudate head. Unfortunately, given therelatively large size of the voxel as compared with thesize of the caudate head, a small portion of the adjacentanterior horn of the lateral ventricle, the surroundingperiventricular and internal capsule white matter, andthe anterior aspect of the putamen were also included inthe “caudate head” voxel. However, these voxels consistprimarily of caudate head gray matter. OFWM voxelswere positioned to include the lateral aspect of theorbital gyrus in the medial portion of the voxel, and theadjacent orbitofrontal cortex in the lateral portion of thevoxel. Unfortunately, given the severe susceptibility
artifacts from the ethmoid sinuses and orbits, on averagethe OFWM voxels contained a large quantity ofsubcortical white matter adjacent to orbitofrontal cortex.Occasionally these voxels would need to be reposi-tioned to obtain usable spectra, and in several cases nousable spectra could be obtained. Fig. 1 demonstratesrepresentative voxel placement.
Following the scans, participant information wasremoved from the images and a subject numberassigned; the images and spectra were then sent to a

Table 3Relative values of neurochemicals for the experimental groups
Experimental group t-value
OCD Control
N Mean N Mean
Head of caudateLeft
Cho/Cr 14 0.24 (0.030) 15 0.26 (0.043) 1.61mI/Cr 13 0.69 (0.241) 11 1.01 (0.369) 2.56⁎NAA/Cr 14 1.27 (0.113) 15 1.30 (0.314) 0.32Glx/Cr 12 2.03 (0.335) 9 2.24 (0.610) 1.01
RightCho/Cr 14 0.25 (0.028) 14 0.27 (0.032) 1.72t
mI/Cr 14 0.66 (0.179) 12 0.85 (0.219) 2.43⁎NAA/Cr 13 1.17 (0.140) 15 1.24 (0.216) 0.93Glx/Cr 14 1.98 (0.285) 12 2.06 (0.294) 0.69
Orbitofrontalwhite matterLeft
Cho/Cr 14 0.30 (0.070) 13 0.31 (0.076) 0.42mI/Cr 10 1.26 (0.425) 9 1.31 (0.515) 0.22NAA/Cr 14 1.65 (0.365) 13 1.65 (0.345) 0.03Glx/Cr 7 2.95 (0.843) 9 2.67 (1.087) 0.57
RightCho/Cr 12 0.34 (0.066) 10 0.30 (0.033) 1.81t
mI/Cr 11 1.08 (0.328) 12 1.09 (0.278) 0.09NAA/Cr 11 1.65 (0.200) 12 1.43 (0.237) 2.38⁎Glx/Cr 8 2.76 (0.687) 7 2.09 (0.470) 2.17⁎
⁎Pb0.05, results in bold type. tPb0.10, results are italicized.
142 S.P. Whiteside et al. / Psychiatry Research: Neuroimaging 146 (2006) 137–147
board-certified neuroradiologist (JDP) for clinicalinterpretation and further analysis. Single voxel MRSdata were processed using LCModel (Provencher,1993) to quantify the metabolites; a typical LCModelspectrum and fitting are shown in Fig. 2. Thequantitative metabolite data placed into a spreadsheet, provided that 1) the spectrum for a given voxelwas well shaped and free of artifact, and 2) theLCModel Cramer-Rao bounds for a given metabolitewere less than 20%. Metabolite values that did not meetthese criteria were entered as “missing.” Table 2 pre-sents the percentages of acceptable voxel data by lo-cation and metabolite. Overall, data integrity for thecaudate voxels was excellent, while data integrity forthe OFWM voxels was not optimal due to susceptibilityartifacts from the ethmoid sinuses which invalidatedsome of the spectra. The results of the clinicalassessment and group designation were placed into aspread sheet using the assigned subject number. To pre-serve the blinded nature of the study, clinical informa-tion was not revealed until all spectral analysis wascomplete.
The primary outcome variables were the ratios ofNAA (NAA+NAAG data from LCModel), Cho, Glx(Glu+Gln data from LCModel) and mI relative to Cr ineach brain region of interest. NAAG was included inaddition to NAA to reduce the variability in the data.NAAG is the aminated form of NAA, and both areneuronal markers. Ratios to Cr were used to “correct”for the amount of CSF in the voxel; at the time thisanalysis was carried out, formal tissue volume correc-tion software was not available to explicitly compensatefor the CSF volumes in the voxels.
2.5. Overview of the analyses
To test the hypotheses that the OCD patients havelower relative NAA, as well as higher relative Glx andcholine levels, in the head of the caudate and OFWMcompared with controls, we conducted independentsample t-tests comparing these two groups. In addition,we conducted t-tests to look for differences in relativelevels of myo-inositol (mI). To test the hypothesis thatthese compounds are related to OCD symptomatology,we conducted bivariate correlational analyses betweenneurochemical levels and scores on the Y-BOCS. To testthe hypothesis that neuroimaging findings in OCD arerelated to state anxiety, we a) conducted bivariatecorrelations between anxiety and relative levels ofNAA, mI, choline, and Glx; and b) conducted analysesof covariance on any chemical levels for which t-testsindicated significant between-group differences. Before
conducting the above-mentioned analysis, we inspectedthe data for outliers to increase the normality of the datadistribution and to reduce the chance of single subjectsdisproportionately affecting the results. Outliers weredefined as any value greater than two standard deviationsfrom the group (OCD or control) mean. No more thanone data point was removed per group, and removal ofoutliers improved the normality of the variabledistributions.
3. Results
3.1. Preliminary analyses
Preliminary analyses were conducted to determine ifthe OCD and control participants differed on demo-graphic and clinical variables. As expected given ourmatching procedure, the groups did not differ on age,years of education, or gender composition. As expected,we observed significant differences in the level ofdepressive symptoms, trait anxiety, state anxiety in thescanner, and level of OCD symptoms (Table 1). OCDpatients scored higher on these clinical variables relativeto control participants.

143S.P. Whiteside et al. / Psychiatry Research: Neuroimaging 146 (2006) 137–147
3.2. Between-group differences in neurochemicalvariables
Independent sample t-tests were conducted to testwhether relative levels of NAA, Glx, Cho, and mIdiffered between groups. These results are presented inTable 3. As predicted, the level of Glx/Cr in the rightOFWM was significantly greater in OCD patients thanin healthy controls, t (13)=2.17, Pb0.05. In addition,there was a nonsignificant trend for levels of Cho/Cr tobe lower in the right caudate and greater in the rightOFWM in OCD patients compared with healthy controls,t (26)=1.72, P=0.10, and t (20)=1.81, P=0.09,respectively. Contrary to our hypothesis, the level ofNAA/Cr in the right OFWM was greater in patients withOCD than in healthy controls, t (21)=2.38, Pb0.05.Additional analyses indicated that in patients with OCD,the levels of mI/Cr in the left and right caudate weresignificantly less than levels in healthy controls, t (22)=2.56, Pb0.05, and t (24)=2.43, Pb0.05, respectively. Noother between-group differences were detected.
Further analyses were conducted to determine if sub-groups of individuals differed on neuroimaging variablesand thus would need to be accounted for in the overallanalyses. Independent sample t-tests indicated that malesand females did not differ reliably on any of the clinical
Table 4Correlations (sample size) between neurochemical levels and symptomatolo
Y-BOCS obs. Y-BOCS comps. Y-BOCS tota
Head of caudateLeftCho/Cr −0.20 (14) −0.01 (14) −0.09 (14)mI/Cr 0.46 (13) 0.28 (13) 0.40 (13)NAA/Cr −0.18 (14) −0.21 (14) −0.25 (14)Glx/Cr −0.26 (12) −0.21 (12) −0.27 (12)
RightCho/Cr −0.14 (14) 0.19 (14) 0.09 (14)mI/Cr 0.00 (14) 0.50 (14) 0.41 (14)NAA/Cr −0.04 (13) −0.31 (13) −0.26 (13)Glx/Cr 0.26 (14) −0.39 (14) −0.20 (14)
Orbitofrontal white matterLeftCho/Cr 0.38 (14) −0.25 (14) −0.03 (14)mI/Cr 0.14 (10) 0.30 (10) 0.30 (10)NAA/Cr −0.25 (14) 0.05 (14) −0.08 (14)Glx/Cr −0.14 (7) 0.42 (7) 0.24 (7)
RightCho/Cr 0.34 (12) −0.48 (12) −0.25 (12)mI/Cr −0.12 (11) −0.05 (11) −0.09 (11)NAA/Cr −0.86+(11) −0.02 (11) −0.30 (11)Glx/Cr 0.37 (8) 0.46 (8) 0.53 (8)
Y-BOCS = Yale-Brown Obsessive Compulsive Inventory; OCI-R = ObseInventory-Trait Form; SUDS = Subjective Units of Distress Scale, BDI = B⁎Pb0.05. +Pb0.01. Significant results in bold type.
or neuroimaging measures. However, among OCDpatients, the level of NAA/Cr in the left OFWM wasgreater in patients taking medication (M=1.83, S.D.=0.29) than in those not taking medication (M=1.42, S.D.=0.33), t (12)=2.50, Pb0.05, and there was a marginallysignificant trend for patients taking medication to havelower levels of mI/Cr in the right OFWM than patients nottaking medication, t (9)=2.22, P=0.05. As neither sex normedication status had a substantial effect on the dependentvariables, we did not conduct multivariate ANOVAsincluding these variables and neurochemical values.
3.3. Relationships between neurochemical variablesand symptom severity
Correlational analyses were conducted to determine ifneurochemical variables were related to clinical symptoms(Table 4). For measures that were administered to bothexperimental groups, the relative level of Glx in the rightOFWMwas related to OCD symptoms as measured by theOCI-R. Relative levels of mI in the head of the caudatewere negatively related to trait anxiety as measured by theSTAI-T bilaterally, to state anxiety as measured by theSTAI-T bilaterally and to state anxiety as measured by theSUDS on the left side.Within the OCD sample, depressivesymptoms as measured by the HAM-D were related to mI/
gy
l OCI-R STAI-T SUDS BDI HAM-D
−0.23 (26) 0.09 (27) −0.18 (29) 0.01 (27) −0.37 (13)−0.37 (21) −0.44⁎ (22) −0.42⁎ (24) −0.38 (22) 0.29 (12)
0.1 (26) 0.04 (27) −0.06 (27) −0.15 (22) −0.02 (13)−0.20 (18) −0.29 (19) −0.15 (21) −0.27 (19) 0.47 (11)
−0.18 (25) −0.16 (26) −0.17 (28) −0.33 (26) 0.31 (13)−0.31 (23) −0.44⁎ (24) −0.22 (26) −0.30 (24) 0.64⁎ (13)−0.26 (25) −0.21 (26) −0.10 (28) − .017 (26) 0.35 (12)−0.14 (23) −0.11 (24) −0.02 (26) −0.01 (24) 0.32 (13)
0.01 (24) −0.07 (25) −0.20 (27) −0.08 (25) 0.03 (13)−0.11 (18) −0.17 (19) 0.11 (19) −0.19 (18) −0.10 (10)−0.01 (24) 0.04 (25) 0.04 (27) 0.02 (25) 0.37 (13)0.48 (14) 0.20 (15) 0.09 (16) 0.37 (14) 0.27 (7)
0.37 (20) 0.23 (20) −0.02 (22) 0.10 (21) −0.27 (11)0.09 (21) −0.26 (21) −0.07 (23) 0.02 (22) 0.35 (10)0.33 (21) 0.43 (21) 0.41 (23) 0.40 (22) 0.27 (10)
0.58⁎ (14) 0.47 (15) 0.37 (15) 0.51 (14) −0.17 (7)
ssive–Compulsive Inventory-Revised; STAI-T = State-Trait Anxietyeck Depression Inventory; HamD = Hamilton Depression Scale.

144 S.P. Whiteside et al. / Psychiatry Research: Neuroimaging 146 (2006) 137–147
Cr in the right head of the caudate. OCD symptom severityas measured by the Y-BOCS was negatively related to thelevel of NAA/Cr in the right OFWM.
3.4. Between-group differences controlling for anxietylevel
Given that anxiety was related to relative metabolitelevels (principally mI), we conducted analyses ofcovariance (ANCOVA) to determine whether theaforementioned differences between OCD and controlgroups remained after controlling for the amount ofanxiety experienced during the scanning procedure, asmeasured by SUDS scores. These analyses indicatedthat the between-group differences in levels of Glx/Crand NAA/Cr in the right OFWM, and in levels of mI/Cr in the left head of caudate, were no longersignificantly different after controlling for SUDSlevel, PsN0.10. However, the difference in level ofmI/Cr in the right caudate head remained significantafter controlling for SUDS scores, F (1,23)=5.23,Pb0.05.
4. Discussion
Previous research has identified the caudate and OFCas potential areas of the brain involved in OCD (e.g.,Saxena et al., 2001; Whiteside et al., 2004). However,the present study is the first to use MRS to image thehead of the caudate nucleus and the OFC in adult OCDpatients. This study is also the first to thoroughlyexplore the relation of neuroimaging findings to stateanxiety and depressive symptoms in OCD.
We found that within the right OFWM, relative levelsof Glx and NAA were increased in patients with OCDcompared with healthy controls. Moreover, greaterlevels of Glx/Cr were associated with more severeOCD symptoms. Although greater levels of NAA/Crwere found in OCD patients than in controls, NAA/Crwas negatively related to the severity of obsessionswithin the sample of OCD patients. We found that in thehead of the caudate nucleus, relative values of mI weredecreased in OCD patients bilaterally, and that lowerlevels of mI/Cr were associated with greater anxiety, butnot with OCD symptom severity. Of the four significantgroup differences, only the differences in mI/Cr in theright head of the caudate remained significant afterstatistically controlling for state anxiety during thescanning process. We also found that the relative level ofmI in the right head of the caudate was positivelyassociated with depressive symptoms within the OCDsample.
The current findings of elevated Glx/Cr in theOFWM of OCD patients could be consistent with thePET and SPECT literature in finding patient–controldifferences in the orbital gyrus. PET and SPECT arethought to be markers of brain activity; and although it isunknown whether Glx concentrations are also a markerof brain activity, Glx has been found to have a directrelation to glucose metabolism as measured by PET(Pfund et al., 2000). If Glx is indeed a marker of brainactivity, the current results coupled with previousfindings of elevated Glx relative to water in the caudate(Rosenberg et al., 2000) lend support to theorizedoveractivation of the cortico-striato-thalamo-corticalcircuit in OCD (Saxena et al., 2001). This theory wouldbe consistent with positive correlations found betweenactivation in the head of the caudate and the orbital cortexin OCD patients before, but not after, successful treat-ment (Baxter et al., 1992). A similar theory was positedby Rosenberg et al. (2004) to explain decreased absoluteGlx in the anterior cingulate in the context of previousstudies finding increased Glx relative to water in thecaudate.
Although relative levels of Glx in the OFWM werepositively associated with OCD symptoms, state anxietyappears to be an important variable in this relationshipsince the differences between OCD patients and controlsdid not remain significant after controlling for anxiety.Moreover, relative levels of Glx in the right OFWMwere moderately correlated with the severity of anxietyand depressive symptoms, although none of thesereached significance, perhaps due to low statisticalpower. Similarly, the trend toward differences in caudateCho/Cr levels between OCD patients and healthy controlsin the head of the caudate and the OFWM is consistentwith previous studies implicating absolute choline dis-turbances in the thalamus in OCD (Rosenberg et al., 2001),but did not reach significance in this study.
Differences in relative NAA levels were also foundin the right OFWM, but they are more difficult tointerpret. Although relative levels of NAA wereincreased in OCD patients compared with controls,within the OCD sample greater levels of NAA/Cr wereassociated with decreased obsessive symptoms. How-ever, this correlation is based on only 11 patients andthus should be interpreted with caution. In fact,increased levels of NAA/Cr in the right OFWM aresimilar to results found by Russell et al. (2003) thatfound increased absolute NAA in the dorsolateralprefrontal cortex in pediatric OCD. Increased relativelevels of NAA found in the present study may beconsistent with biologically based theories of OCD.Specifically, NAA is thought to be a marker of neuronal

145S.P. Whiteside et al. / Psychiatry Research: Neuroimaging 146 (2006) 137–147
viability, and thus our finding may reflect an overabun-dance of neurons. As such, increased NAA/Cr in theOFWM could be consistent with neurobiologicalmodels of OCD postulating increased activity in thecortex (Saxena et al., 2001) and/or neurodevelopmentaltheories of OCD involving inefficient neuronal pruning(Rosenberg and Keshavan, 1998).
This study represents the first to find differences inrelative mI levels between OCD patients and healthycontrols. However, mI disturbances have been impli-cated in other mental illnesses including bipolardisorder (Davanzo et al., 2001) and attention deficit/hyperactivity disorder (Courvoisie et al., 2004). In thecurrent study, relative levels of mI were related togeneral anxiety rather than to OCD symptoms per se.Specifically, the level of left caudate mI/Cr did notdiffer between groups after controlling for stateanxiety. In addition, although the differences in mI/Cr in the right caudate remained significant aftercontrolling for state anxiety, the relative level of thisneurochemical was significantly correlated with traitanxiety, but not with OCD symptoms. The positivecorrelation between mI/Cr and depression within theOCD group is inconsistent with the finding that theOCD group had relatively greater levels of depression,but lower mI/Cr levels compared with the controlgroup. The possibility that depressive symptoms arerelated to group differences should be entertained asprevious studies with MRS have found differences inthe OFC between controls and depressed patients(Steingard et al., 2000). Again, the present findingshould be interpreted with caution as they may beidiosyncratic to our relatively small sample.
Our results suggest that anxiety is an important (andwe believe understudied) variable in understanding therelationship between neuroimaging findings and OCDsymptoms. Specifically, out of the four group differ-ences we found in neurochemical variables, only oneremained significant after controlling for state anxietyduring the scanning procedure, and levels of thatneurochemical were correlated with anxiety. Thesefindings indicate that the observed group differencesin brain-imaging profiles may be better accounted for bylevels of general anxiety than by OCD per se. Thisnotion challenges neurobiological theories that proposethat particular brain abnormalities specifically produceOCD symptoms. Instead of reflecting aspects of thebrain that are specific to OCD, pathological, and stable,our data raise the possibility that what is being measuredis actually a normal, transient, and nonspecific process.Additional research is, of course, needed to clarify theserelationships.
Related to this issue is the fact that the neuroima-ging literature is often interpreted as demonstratingsignificant progress toward identifying a neurologicaletiology of OCD symptoms (e.g. Saxena et al., 2001).However, the designs of existing neuroimaging studiesare cross-sectional (correlational), and such researchdesigns cannot answer questions regarding cause andeffect. That is, although OCD patients and controlsconsistently show differences associated with neuralactivation in the head of the caudate and the orbitalgyrus, there are three equally plausible explanations forthese findings. First, the alterations in functioning ofcertain brain regions might cause OCD. Second,alterations in functioning in certain brain regionsmight be caused by OCD symptoms. Third, it ispossible that OCD symptoms and observed alterationsin functioning might both be influenced by a separatevariable(s). The results of the present study lend somesupport to the third explanation and raise thepossibility that observed differences in neural func-tioning between OCD patients and healthy individualsfound in the imaging literature reflect the presence ofgreater state (or trait) anxiety among OCD patients. Ifso, it is premature to conclude from results ofneuroimaging studies that observed findings point toa specific neurobiological signature of OCD.
On the basis of our findings, we propose that generalanxiety mediates the relation between OCD and imagingfindings, and that altered functioning or metabolitelevels in the caudate and OFC may not be specific toOCD, but more general to anxiety. Moreover, wesuggest that researchers further examine this importanthypothesis by directly comparing OCD patients to otherpsychiatric groups (e.g., those with other anxietydisorders; Smith et al., 2003) as well as to healthycontrols. In addition, examining the relation of imagingresults to continuous variables, such as the STAI-T,BDI, or Y-BOCS, rather than dichotomous variables,such as diagnostic groups, will capitalize on naturallyoccurring variance and increase our ability to partial outthe contributions of multiple emotional factors. Finally,comparing OCD patients with healthy controls who areexperiencing distress (i.e., using symptom provocationparadigms) could help to determine if neuroimagingfindings are reflecting “abnormalities” or heightenedactivation of normally working circuits. Interestingly,existing symptom-provocation studies (e.g., Cottraux etal., 1996) have reported results that are consistent withour assertion.
Our study has a number of limitations that should beconsidered. First, the small sample size may haverestricted our power to detect differences. However, this

146 S.P. Whiteside et al. / Psychiatry Research: Neuroimaging 146 (2006) 137–147
is a common shortcoming in the field of neuroimaging.For instance, previous OCD MRS studies have typicallyincluded only 12 or 13 patients. Given the expense,equipment, and time required to complete these studies,a potential solution is multi-site collaboration.
A second limitation is the large number of statisticalcomparisons we computed. By examining multiple out-come variables (four compounds in four regions ofinterest), this study and similar ones increase the like-lihood of finding significant differences based on chance.Moreover, these metabolite levels can be quantified innumerous manners, including absolute concentrations,relative levels to creatine, and relative levels to water. Thepotential for these different approaches to yield disparateresults is illustrated in two articles by Rosenberg et al.first identifying decreased levels of NAA relative to Choor to Cr among OCD patients (Fitzgerald et al., 2000) andthen decreased absolute levels of choline in a subsequentreanalysis of this data (Rosenberg et al., 2001). In addition,one of the aims of this study was to localize previousdifferences in NAA found in the striatum to the head of thecaudate. However this extension is complicated by the factthat these studies quantified NAA relative to differentvalues (water: Bartha et al., 1998; Cr: present study andEbert et al., 1997). Without an accepted standard practicefor processing and analyzing data, investigators mustutilize multiple approaches, which increases the chance offinding a significant difference even if there are no truedifferences between the two populations.
Moreover, focusing on the apparent similarity infindings among studies and ignoring the risk of Type Ierror (i.e., spurious statistically significant results) canpotentially lead to complex theories based on nothingmore than a smattering of chance findings. For example,although our current results appear to be consistent withthe theories of OCD and previous research regardingdisturbances in the caudate, there are more inconsis-tencies than consistencies among the studies available todate. Specifically, the current study did not finddifferences in NAA levels in the head of the caudate,although differences in NAA have been found previ-ously in the striatum (Ebert et al., 1997; Bartha et al.,1998). Moreover, Rosenberg et al. (2000) also did notfind differences in NAA in the caudate, but they did finddifferences in Glx, a finding that did not emerge in thecurrent study or the two previous studies of the striatum.Comparing these studies is difficult due to differences inthe size of the region of interest, quantification ofmetabolite levels, and the age of subjects (adults vs.children), but the fact remains that there have been fewreplicated findings in this area. Without replication, thepossibility that results are due to random chance,
idiosyncrasies of small samples, or characteristics ofthe experimental environment rather than true groupdifferences cannot be ruled out. Thus, we believe that itis important to conceptualize these studies as explor-atory, and place an emphasis on replication.
Acknowledgments
Financial support for this project was received from theObsessive Compulsive Foundation. In addition, theauthors thank Sarah Kalsy, Kristina Schmidtknecht,Mandie Maroney-Smith, and Stefanie Schwartz for theircontributions to this project.
References
Bartha, R., Stein, M.B., Williamson, P.C., Drost, D.J., Neufeld, R.W.,Carr, T.J., Canaran, G., Densmore, M., Anderson, G., Siddiqui, A.R.,1998. A short echo 1H spectroscopy and volumetricMRI study of thecorpus striatum in patients with obsessive–compulsive disorder andcomparison subjects. American Journal of Psychiatry 155,1584–1591.
Baxter Jr., L.R., Schwartz, J.M., Bergman, K.S., Szuba, M.P., Guze,B.H., Mazziotta, J.C., Alazraki, A., Selin, C.E., Ferng, H.K.,Munford, P., et al., 1992. Caudate glucose metabolic rate changeswith both drug and behavior therapy for obsessive–compulsivedisorder. American Journal of Psychiatry 49 (9), 1560–1563.
Beck, A.T., Ward, C.H., Mendelson, M., Mock, J., Erbaugh, J., 1961.An inventory for measuring depression. Archives of GeneralPsychiatry 4, 561–571.
Beck, A.T., Steer, R.A., Garbin, M.G., 1988. Psychometric propertiesof the Beck Depression Inventory: twenty-five years of evaluation.Clinical Psychology Review 8, 77–100.
Cottraux, J., Gerard, D., Cinotti, L., Froment, J.C., Deiber, M.P., LeBars, D., Galy, G., Millet, P., Labbé, C., Lavenne, F., Bouvard,M., Mauguière, F., 1996. A controlled positron emissiontomography study of obsessive and neutral auditory stimulationin obsessive–compulsive disorder with checking rituals. PsychiatryResearch: Neuroimaging 60, 101–112.
Courvoisie, H., Hooper, S.R., Fine, C., Kwock, L., Castillo, M., 2004.Neurometabolic functioning and neuropsychological correlates inchildren with ADHD-H: preliminary findings. Journal of Neuro-psychiatry and Clinical Neurosciences 16, 63–69.
Davanzo, P., Thomas, M.A., Yue, K., Oshiro, T., Belin, T., Strober, M.,McCracken, J., 2001. Decreased anterior cingulate myo-inositol/creatine spectroscopy resonance with lithium treatment inchildren with bipolar disorder. Neuropsychopharmacology 24,359–369.
Ebert, D., Speck, O., Konig, A., Berger, M., Hennig, J., Hohagen, F.,1997. 1H-magnetic resonance spectroscopy in obsessive–compul-sive disorder: evidence for neuronal loss in the cingulate gyrus andthe right striatum. Psychiatry Research: Neuroimaging 74,173–176.
First, M.B., Spitzer, R.L., Gibbon, M., Williams, J.B., 1996. StructuredClinical Interview for DSM-IV Axis I Disorders, Patient Edition(SCID-P), version 2. New York State Psychiatric Institute,Biometrics Research, New York.
Fitzgerald, K.D., Moore, G.J., Paulson, L.A., Stewart, C.M.,Rosenberg, D.R., 2000. Proton spectroscopic imaging of the

147S.P. Whiteside et al. / Psychiatry Research: Neuroimaging 146 (2006) 137–147
thalamus in treatment-naive pediatric obsessive–compulsivedisorder (comment) Biological Psychiatry 47, 174–182.
Foa, E.B., Huppert, J.D., Leiberg, S., Langner, R., Kichic, R., Hajcak, G.,Salkovskis, P.M., 2002. The Obsessive–Compulsive Inventory:development and validation of a short version. PsychologicalAssessment 14, 485–496.
Frances, A., Docherty, J.P., Kahn, D.A., 1997. Treatment of obsessive–compulsive disorder. Journal of Clinical Psychiatry 58, 5–72.
Goodman, W.K., Price, L.H., Rasmussen, S.A., Mazure, C., Delgado, P.,Heninger, G.R., Charney, D.S., 1989a. The Yale-Brown ObsessiveCompulsive Scale: II. Validity. Archives of General Psychiatry 46,1012–1016.
Goodman, W.K., Price, L.H., Rasmussen, S.A., Mazure, C.,Fleishmann, R.L., Hill, C.L., Heninger, G.R., Charney, D.S.,1989b. The Yale-Brown Obsessive Compulsive Scale: I. Devel-opment, use, and reliability. Archives of General Psychiatry 46,1006–1011.
Hamilton, M., 1960. A rating scale for depression. Journal ofNeurology, Neurosurgery and Psychiatry 23, 56–62.
Lucey, J.V., Costa, D.C., Blanes, T., Busatto, G.F., Pilowsky, L.S.,Takei, N., Marks, I.M., Ell, P.J., Kerwin, R.W., 1995. Regionalcerebral blood flow in obsessive–compulsive disordered patientsat rest. Differential correlates with obsessive–compulsive andanxious–avoidant dimensions. British Journal of Psychiatry 167,629–634.
Lucey, J.V., Costa, D.C., Adshead, G., Deahl, M., Busatto, G.,Gacinovic, S., Travis, M., Pilowsky, L., Ell, P.J., Marks, I.M.,Kerwin, R.W., 1997. Brain blood flow in anxiety disorders. OCD,panic disorder with agoraphobia, and post-traumatic stress disorderon 99mTcHMPAO single photon emission tomography (SPET).British Journal of Psychiatry 171, 346–350.
Ohara, K., Isoda, H., Suzuki, Y., Takehara, Y., Ochiai, M., Takeda, H.,Igarashi, Y., 1999. Proton magnetic resonance spectroscopy oflenticular nuclei in obsessive–compulsive disorder. PsychiatryResearch: Neuroimaging 92, 83–91.
Pfund, Z., Chugani, D.C., Juhasz, C., Muzik, O., Chugani, H.T., Wilds,I.B., Seraji-Bozorgzad, N., Moore, G.J., 2000. Evidence forcoupling between glucose metabolism and glutamate cycling usingFDG PET and 1H magnetic resonance spectroscopy in patientswith epilepsy. Journal of Cerebral Blood Flow and Metabolism 20,871–878.
Provencher, S.W., 1993. Estimation of metabolite concentrations fromlocalized in vivo proton NMR spectra. Magnetic Resonance inMedicine 30, 672–679.
Rauch, S.L., 2000. Neuroimaging research and the neurobiology ofobsessive–compulsive disorder: where do we go from here?(comment) Biological Psychiatry 47, 168–170.
Rosenberg, D.R., Keshavan, M.S., 1998. A.E. Bennett ResearchAward. Toward a neurodevelopmental model of obsessive–compulsive disorder. Biological Psychiatry 43, 623–640.
Rosenberg, D.R., MacMaster, F.P., Keshavan, M.S., Fitzgerald, K.D., Stewart, C.M., Moore, G.J., 2000. Decrease in caudateglutamatergic concentrations in pediatric obsessive–compulsivedisorder patients taking paroxetine. Journal of the AmericanAcademy of Child and Adolescent Psychiatry 39, 1096–1103.
Rosenberg, D.R., Amponsah, A., Sullivan, A., MacMillan, S., Moore,G.J., 2001. Increased medial thalamic choline in pediatricobsessive–compulsive disorder as detected by quantitative invivo spectroscopic imaging. Journal of Child Neurology 16,636–641.
Rosenberg, D.R., Mirza, Y., Russell, A., Tang, J., Smith, J.M.,Banerjee, S.P., Bhandari, R., Rose, M., Ivey, J., Boyd, C., Moore,G.J., 2004. Reduced anterior cingulate glutamatergic concentra-tions in childhood OCD and major depression versus healthycontrols. Journal of the American Academy of Child andAdolescent Psychiatry 43, 1146–1153.
Russell, A., Cortese, B., Lorch, E., Ivey, J., Banerjee, S.P., Moore, G.J., Rosenberg, D.R., 2003. Localized functional neurochemicalmarker abnormalities in dorsolateral prefrontal cortex in pediatricobsessive–compulsive disorder. Journal of Child and AdolescentPsychopharmacology 13 (Suppl 1), S31–S38.
Saxena, S., Bota, R.G., Brody, A.L., 2001. Brain–behavior relation-ships in obsessive–compulsive disorder. Seminars in ClinicalNeuropsychiatry 6, 82–101.
Smith, E.A., Russell, A., Lorch, E., Banerjee, S.P., Rose, M., Ivey, J.,Bhandari, R., Moore, G.J., Rosenberg, D.R., 2003. Increasedmedial thalamic choline found in pediatric patients with obses-sive–compulsive disorder versus major depression or healthycontrol subjects: a magnetic resonance spectroscopy study.Biological Psychiatry 54, 1399–1405.
Spielberger, C.D., Gorsuch, R.L., Lushene, R.E., Vagg, P.R., Jacobs,G.A., 1983. Revised Manual for the State-Trait Anxiety Inventory.Consulting Psychologists Press, Palo Alto, CA.
Steingard, R.J., Yurgelun-Todd, D.A., Hennen, J., Moore, J.C., Moore,C.M., Vakili, K., Young, A.D., Katic, A., Beardslee, W.R.,Renshaw, P.F., 2000. Increased orbitofrontal cortex levels ofcholine in depressed adolescents as detected by in vivo protonmagnetic resonance spectroscopy. Biological Psychiatry 48,1053–1061.
Taylor, S., 1995. The assessment of obsessions and compulsions:reliability, validity and sensitivity to treatment effects. ClinicalPsychology Review 15, 261–296.
Whiteside, S.P., Port, J.D., Abramowitz, J.S., 2004. A meta-analysis offunctional neuroimaging in obsessive–compulsive disorder. Psy-chiatry Research: Neuroimaging 132, 69–79.