Identifying patients with obsessive–compulsive disorder using whole-brain anatomy
10
Identifying patients with obsessive–compulsive disorder using whole-brain anatomy Carles Soriano-Mas, a, ⁎ Jesús Pujol, a Pino Alonso, b Narcís Cardoner, b José M. Menchón, b Ben J. Harrison, a,c Joan Deus, a,d Julio Vallejo, b and Christian Gaser e a Institut d’Alta Tecnologia (IAT)-PRBB, CRC Corporació Sanitària, Passeig Marítim 25-29, Barcelona 08003, Spain b Department of Psychiatry, Hospital of Bellvitge, University of Barcelona, Spain c Melbourne Neuropsychiatry Centre, Department of Psychiatry, The University of Melbourne, Australia d Department of Clinical and Health Psychology, Autonomous University of Barcelona, Spain e Department of Psychiatry, University of Jena, Germany Received 23 November 2006; revised 12 January 2007; accepted 16 January 2007 Available online 27 January 2007 Structural neuroimaging studies have reported a variety of brain alterations between groups of obsessive–compulsive disorder (OCD) patients and healthy controls. However, the large heterogeneity in discrete anatomical measures that exists among patients prevents a clear discrimination of single patients from healthy subjects. This reduces the potential clinical applicability of structural neuroimaging studies. In the present study we assessed the feasibility of identifying OCD patients on the basis of whole-brain anatomical alterations. Whole-brain magnetic resonance images were collected from two consecutive samples of OCD outpatients (n =72 and n = 30), and control subjects (n =72 and n =30). We computed the whole-brain (voxel-wise) pattern of structural difference between OCD patients and control subjects at the group level. A single expression value of this difference pattern was calculated for each subject, expressing their degree of ‘OCD-like’ anatomical alteration. Accuracy of patient classification based on these expression values was assessed using two validation approaches. Firstly, using a cross-validation method, we obtained a high classification accuracy (average of the sensitivity and specificity indices) of 93.1%. In a second assessment, which classified new groups of OCD patients and control subjects, overall accuracy was lower at 76.6%. Individual expression values for OCD patients were significantly correlated with overall symptom severity as measured by the Y-BOCS scale. Our results suggest that OCD patients can be identified on the basis of whole-brain structural alterations, although the accuracy of our approach may be limited by the inherent variability of psychiatric populations. Nevertheless, the anatomical characterization of individual patients may ultimately provide the psychiatrist with relevant biological information. © 2007 Elsevier Inc. All rights reserved. Introduction Reports of altered brain structure are common in magnetic resonance imaging (MRI) studies of obsessive–compulsive disorder (OCD) (Rauch and Baxter, 1998; Saxena et al., 1998). Although some variability exists among studies focusing on particular regions of interest (ROIs), including several null reports (Aylward et al., 1996; Bartha et al., 1998; Kellner et al., 1991; Riffkin et al., 2005; Stein et al., 1997), significant volumetric alterations have been described in different cortical and subcortical structures, such as the basal ganglia (Giedd et al., 2000; Robinson et al., 1995; Rosenberg et al., 1997; Scarone et al., 1992; Szeszko et al., 2004a), thalamus (Atmaca et al., 2006; Gilbert et al., 2000), orbitofrontal cortex (Atmaca et al., 2006; Choi et al., 2004; Kang et al., 2004; Szeszko et al., 1999), amygdala (Kwon et al., 2003; Szeszko et al., 1999, 2004b), or the cerebellum (Jenike et al., 1996). Importantly, this wide distribution of volumetric changes described by ROI studies has since been confirmed in studies using voxel-based morphometry (VBM) (Kim et al., 2001; Pujol et al., 2004; Valente et al., 2005), a structural MRI analysis technique that permits systematic assessments of the entire brain on a voxel-by- voxel basis (Ashburner and Friston, 2000). Since VBM studies, by virtue of their automated nature, can facilitate assessments of large MRI series of patients and control subjects, they appear to be more suitable for characterizing structural brain anomalies occurring with the highest prevalence in OCD patients (Pujol et al., 2004). Despite the increasing interest in volumetric MRI studies of psychiatric patients, it is important to recognize that neither analysis approach described above, ROI or VBM, is intended as a patient classification or diagnostic tool, as they describe anatomical differences which are suitable for interpretations at the group, or population, level (Friston and Ashburner, 2004). Identification of gross anatomical anomalies in specific patients is uncommon, and typically a large overlap exists between patient and control groups in each discrete (e.g., voxel-by-voxel) anatomical measure (Davatzi- www.elsevier.com/locate/ynimg NeuroImage 35 (2007) 1028 – 1037 ⁎ Corresponding author. Fax: +34 93 221 6818. E-mail address: [email protected] (C. Soriano-Mas). Available online on ScienceDirect (www.sciencedirect.com). 1053-8119/$ - see front matter © 2007 Elsevier Inc. All rights reserved. doi:10.1016/j.neuroimage.2007.01.011
-
Upload
independent -
Category
Documents
-
view
0 -
download
0
Transcript of Identifying patients with obsessive–compulsive disorder using whole-brain anatomy

www.elsevier.com/locate/ynimg
NeuroImage 35 (2007) 1028–1037Identifying patients with obsessive–compulsive disorder usingwhole-brain anatomy
Carles Soriano-Mas,a,⁎ Jesús Pujol,a Pino Alonso,b Narcís Cardoner,b José M. Menchón,b
Ben J. Harrison,a,c Joan Deus,a,d Julio Vallejo,b and Christian Gasere
aInstitut d’Alta Tecnologia (IAT)-PRBB, CRC Corporació Sanitària, Passeig Marítim 25-29, Barcelona 08003, SpainbDepartment of Psychiatry, Hospital of Bellvitge, University of Barcelona, SpaincMelbourne Neuropsychiatry Centre, Department of Psychiatry, The University of Melbourne, AustraliadDepartment of Clinical and Health Psychology, Autonomous University of Barcelona, SpaineDepartment of Psychiatry, University of Jena, Germany
Received 23 November 2006; revised 12 January 2007; accepted 16 January 2007Available online 27 January 2007
Structural neuroimaging studies have reported a variety of brainalterations between groups of obsessive–compulsive disorder (OCD)patients and healthy controls. However, the large heterogeneity indiscrete anatomical measures that exists among patients prevents aclear discrimination of single patients from healthy subjects. Thisreduces the potential clinical applicability of structural neuroimagingstudies. In the present study we assessed the feasibility of identifyingOCD patients on the basis of whole-brain anatomical alterations.Whole-brain magnetic resonance images were collected from twoconsecutive samples of OCD outpatients (n=72 and n=30), andcontrol subjects (n=72 and n=30). We computed the whole-brain(voxel-wise) pattern of structural difference between OCD patientsand control subjects at the group level. A single expression value of thisdifference pattern was calculated for each subject, expressing theirdegree of ‘OCD-like’ anatomical alteration. Accuracy of patientclassification based on these expression values was assessed using twovalidation approaches. Firstly, using a cross-validation method, weobtained a high classification accuracy (average of the sensitivity andspecificity indices) of 93.1%. In a second assessment, which classifiednew groups of OCD patients and control subjects, overall accuracy waslower at 76.6%. Individual expression values for OCD patients weresignificantly correlated with overall symptom severity as measured bythe Y-BOCS scale. Our results suggest that OCD patients can beidentified on the basis of whole-brain structural alterations, althoughthe accuracy of our approach may be limited by the inherentvariability of psychiatric populations. Nevertheless, the anatomicalcharacterization of individual patients may ultimately provide thepsychiatrist with relevant biological information.© 2007 Elsevier Inc. All rights reserved.
⁎ Corresponding author. Fax: +34 93 221 6818.E-mail address: [email protected] (C. Soriano-Mas).Available online on ScienceDirect (www.sciencedirect.com).
1053-8119/$ - see front matter © 2007 Elsevier Inc. All rights reserved.doi:10.1016/j.neuroimage.2007.01.011
Introduction
Reports of altered brain structure are common in magneticresonance imaging (MRI) studies of obsessive–compulsivedisorder (OCD) (Rauch and Baxter, 1998; Saxena et al., 1998).Although some variability exists among studies focusing onparticular regions of interest (ROIs), including several null reports(Aylward et al., 1996; Bartha et al., 1998; Kellner et al., 1991;Riffkin et al., 2005; Stein et al., 1997), significant volumetricalterations have been described in different cortical and subcorticalstructures, such as the basal ganglia (Giedd et al., 2000; Robinsonet al., 1995; Rosenberg et al., 1997; Scarone et al., 1992; Szeszkoet al., 2004a), thalamus (Atmaca et al., 2006; Gilbert et al., 2000),orbitofrontal cortex (Atmaca et al., 2006; Choi et al., 2004; Kang etal., 2004; Szeszko et al., 1999), amygdala (Kwon et al., 2003;Szeszko et al., 1999, 2004b), or the cerebellum (Jenike et al.,1996). Importantly, this wide distribution of volumetric changesdescribed by ROI studies has since been confirmed in studies usingvoxel-based morphometry (VBM) (Kim et al., 2001; Pujol et al.,2004; Valente et al., 2005), a structural MRI analysis technique thatpermits systematic assessments of the entire brain on a voxel-by-voxel basis (Ashburner and Friston, 2000). Since VBM studies, byvirtue of their automated nature, can facilitate assessments of largeMRI series of patients and control subjects, they appear to be moresuitable for characterizing structural brain anomalies occurringwith the highest prevalence in OCD patients (Pujol et al., 2004).
Despite the increasing interest in volumetric MRI studies ofpsychiatric patients, it is important to recognize that neither analysisapproach described above, ROI or VBM, is intended as a patientclassification or diagnostic tool, as they describe anatomicaldifferences which are suitable for interpretations at the group, orpopulation, level (Friston and Ashburner, 2004). Identification ofgross anatomical anomalies in specific patients is uncommon, andtypically a large overlap exists between patient and control groups ineach discrete (e.g., voxel-by-voxel) anatomical measure (Davatzi-

1029C. Soriano-Mas et al. / NeuroImage 35 (2007) 1028–1037
kos, 2004). As a consequence, the information obtained fromneuroimaging studies is rarely used in a clinical context andcontributes little to patient management. Nevertheless, it is possiblethat a clearer discrimination between groups may be obtained ifanalyses were not based on discrete anatomical measurements, butrather, on the whole-brain pattern of abnormalities. Such a methodcould ultimately provide the clinician with the opportunity ofclassifying subjects on the basis of a relevant (anatomicallyinformed) source of information.
The aim of this study was to assess the feasibility of classifyingsingle subject cases of MRI data as OCD patients or healthycontrols using their whole-brain anatomy. Specifically, we soughtto characterize each subject with a single value that reflected theextent of expression of the whole-brain pattern of anatomicalabnormalities depicted by the OCD group. This pattern wascomputed through an optimized VBM analysis of our large MRIseries of OCD patients and matched control subjects (Pujol et al.,2004). The accuracy of this classification approach was thenevaluated by using a cross-validation method, and also with anindependent set of data of newly recruited OCD patients andcontrol subjects.
Materials and methods
Subjects
In total, 204 subjects were included in the study. An initialsample of 72 OCD patients and 72 control subjects was used todevelop the whole-brain classification scheme that will be detailedbelow. This sample, referred to here as the original sample, hasbeen previously described (Pujol et al., 2004), and included OCDpatients and control subjects who were matched for age, genderand handedness. In the current study, we also recruited a second(new) sample of 30 OCD patients and 30 control subjects. Subjectsfrom both OCD subgroups were community outpatients consecu-tively recruited when two psychiatrists (P.A. and J.M.M.), whoindependently assessed the patients, agreed on their diagnosis.Exclusion criteria included a history of relevant medical illness, orany neurological or other psychiatric diseases. No patient met thecriteria for Tourette’s syndrome or had a recent history ofpsychoactive drug use/abuse. Comorbid anxious and depressivesymptoms were not considered as an exclusion criterion, providedthat OCD was the primary clinical diagnosis. Table 1 summarizesthe sociodemographic characteristics of the two study samples, andTable 2 presents the primary clinical features of OCD patients. All
Table 1Sociodemographic characteristics of the study samples
Sociodemographic variable a Original sample
OCD (n=72) Contro
Mean (SD), range Mean (
Age (years) 29.8 (10.5), 18–60 30.1 (1Education (years) 13.2 (3.6), 8–17 14.0 (3
N (%) N (%)
Gender distribution (females) 32 (45.7) 32 (45.Handedness (lefthanders) 11 (15.3) 11 (15.
OCD, obsessive–compulsive disorder.a No significant differences were observed between groups in any of the variab
subjects gave written informed consent to participate in this study,following a complete description of the protocol, which wasapproved by the Institutional Review Board of the UniversityHospital of Bellvitge, Barcelona.
MRI acquisition and processing
A 1.5-T magnet (Signa, GE Medical Systems, Milwaukee, WI)was used to obtain a sixty-slice 3D spoiled gradient-recalledacquisition sequence in the sagittal plane (TR 40 ms, TE 4 ms, pulseangle 30°, field of view 26 cm, matrix size 256×192 pixels, andsection thickness between 2.4 and 2.6 mm). Imaging data were thentransferred and processed on aMicrosoftWindows platform runningMATLAB version 6.5 (The MathWorks Inc., Natick, MA) andStatistical Parametric Mapping software (SPM2; The WellcomeDepartment of Imaging Neuroscience, London, England). Imagepreprocessing was based on the optimized procedure for structuralneuroimaging data (including the creation of a customized template)(Good et al., 2001), which was automated with two freely availableMATLAB scripts (cg_create_template and cg_vbm_optimized, seehttp://www.dbm.neuro.uni-jena.de/vbm/). After tissue segmenta-tion, we focused our whole-brain structural imaging analysis onsubjects’ segmented gray matter volumes, informed by our previousresults (Pujol et al., 2004). Importantly, in order to preservevolumetric information, the last step of the preprocessing consistedin the modulation of voxel values by the Jacobian determinantsderived from the normalization step. All resulting gray mattervolumes were then smoothed with a small isotropic kernel of 4 mm(Salmond et al., 2002). Final voxel values ranged between 0 and 1. Adetailed description of the procedure can be found elsewhere (Pujolet al., 2004).
Statistical analyses
Calculation of the whole-brain pattern of differences andindividual expression values
Neuroimaging studies using whole-brain patterns of between-group differences for patient classification purposes have normallyused multivariate statistical methods based on Singular ValueDecomposition (SVD) for pattern characterization (Kawasaki et al.,2007; Kerrouche et al., 2006; Meyer-Lindenberg et al., 2001;Scarmeas et al., 2004). However, in the case of a single comparisonbetween two groups, as in the present study, the pattern of whole-brain differences characterized with a univariate approach (and itsstatistical significance), is identical to the one obtained with
Newly recruited sample
ls (n=72) OCD (n=30) Controls (n=30)
SD), range Mean (SD), range Mean (SD), range
0.2), 18–57 31.9 (9.3), 18–63 31.8 (10.2), 18–63.1), 8–17 12.2 (2.9), 5–17 13.1 (3.2), 8–17
N (%) N (%)
7) 9 (30.0) 14 (46.7)3) 2 (6.7) 3 (10.0)
les.

Table 2Clinical characteristics of the OCD patients
Clinical variable Original sample (n=72) Newly recruited sample (n=30) Statistical value a
(P value b)Mean (SD), range Mean (SD), range
Age at onset of OCD (years) 17.0 (5.9), 6–40 19.7 (6.1), 7–36 2.35 (0.03)Duration of illness (years) 13.0 (10.5), 1–51 11.3 (9.4), 1–39 −0.99 (0.33)Y-BOCS score (global) 26.7 (7.1), 7–38 21.0 (5.7), 10–32 −5.44 (<0.001)Y-BOCS score (obsessions) 13.7 (3.4), 6–19 10.9 (3.1), 6–17 −5.02 (<0.001)Y-BOCS score (compulsions) 13.0 (4.8), 0–19 10.1 (3.0), 1–16 −5.25 (<0.001)
OCD symptoms c 0 (Absent) 1 (Mild) 2 (Prom) 0 (Absent) 1 (Mild) 2 (Prom)
N (%) N (%) N (%) N (%) N (%) N (%)
Symmetry and ordering 50 (69.4) 12 (16.7) 10 (13.9) 20 (66.7) 1 (3.3) 9 (30.0) 8.84 (0.01)Hoarding 56 (77.8) 11 (15.3) 5 (6.9) 15 (50.0) 10 (33.3) 5 (16.7) 13.50 (0.001)Contamination and cleaning 41 (56.9) 14 (19.4) 17 (23.6) 16 (53.3) 5 (16.7) 9 (30.0) 0.70 (0.70)Aggressive and checking 23 (31.9) 19 (26.4) 30 (41.7) 6 (20.0) 8 (26.7) 16 (53.3) 2.31 (0.32)Sexual and religious obsessions 55 (76.4) 4 (5.6) 13 (18.1) 23 (76.7) 3 (10.0) 4 (13.3) 1.41 (0.49)
Comorbid diagnoses Mean (SD), range Mean (SD), range
HAM-D score at inclusion 12.7 (5.4), 2–26 11.9 (5.1), 4–25 −0.88 (0.39)HAM-A score at inclusion 13.3 (6.6), 0–30 14.5 (4.9), 6–25 1.25 (0.22)
N (%) N (%)
Significant history of depression 26 (36.1) 4 (13.3) 6.74 (0.01)Significant history of anxiety 19 (26.4) 7 (23.3) 0.14 (0.70)
Treatment status Mean (SD), range (median) Mean (SD), range (median)
Cumulative SRIs treatment (months) 41.0 (62.5), 0–396 (24.0) 19.6 (20.5), 0–97 (14.6) −5.73 (<0.001)Previous SRI trials completed N (%) N (%) 1.21 (0.75)
Never treated 5 (6.9) 2 (6.7) …One SRI trial 19 (26.4) 6 (20.0) …Two SRI trials 21 (29.2) 8 (26.7) …Three or more SRIs trials 27 (37.5) 14 (46.7) …
Stable medication at time of the MRI N (%) N (%) 4.05 (0.40)
Medication-free (>4 weeks) 18 (25.0) 4 (13.3) …Clomipramine hydrochloride 25 (34.7) 9 (30.0) …Fluoxetine or fluvoxamine maleate 13 (18.1) 7 (23.3) …Phenelzine sulfate 2 (2.8) 1 (3.3) …Clomipramine with fluoxetine 14 (19.4) 9 (30.0) …
HAM-A, Hamilton Rating Scale for Anxiety.HAM-D, Hamilton Rating Scale for Depression.MRI, magnetic resonance imaging.OCD, obsessive–compulsive disorder.SRI, serotonin reuptake inhibitors.Y-BOCS, Yale–Brown Obsessive–Compulsive Scale.a Newly recruited sample compared to (reference) original sample (one-sample t test for continuous variables, χ2 test for categorical variables).b Two-tailed.c Dimensions from Mataix-Cols et al. (1999). A score of 2 (prominent) was allowed for more than 1 dimension.
1030 C. Soriano-Mas et al. / NeuroImage 35 (2007) 1028–1037
multivariate methods based on SVD (Worsley et al., 1997).Consequently, we performed a voxel-wise univariate statisticalanalysis to characterize the whole-brain pattern of differencesbetween the two study groups.
As depicted in Fig. 1, the method for calculating this whole-brain pattern and individual expression values can be summarizedin two basic analysis steps. Firstly, using SPM2, we calculated awhole-brain image of between-group differences (represented bythe univariate t statistic) by contrasting, voxel-by-voxel, thepreprocessed gray matter volumes of the original sample of 72OCD patients and 72 control subjects (Fig. 1A). In the second step,
this resulting t map was multiplied by the gray matter image ofeach subject to obtain their individual expression values (Fig. 1B).Both analysis steps are explained in more detail below.
Step 1:Within the general linear model framework implementedin SPM2, we calculated a voxel-wise t statistic image whichexpressed the areas of significant regional difference in gray mattervolume between OCD patients and control subjects. This t statisticmap was designed specifically to represent the areas of increase (i.e.,positive t values) and decrease (i.e., negative t values) of regionalgray matter volume in OCD patients versus control subjects. In thecalculation of this difference map, we covaried for subjects’ age as a

Fig. 1. Schematic illustration of the method developed to obtain the expression values of individual subjects. (A) Calculation of the whole-brain pattern ofstructural differences between groups. (B) Calculation of individual expression values.
1031C. Soriano-Mas et al. / NeuroImage 35 (2007) 1028–1037
confounding variable. To control for any global differences in graymatter volume, data were proportionally scaled to a grand mean of100. To assess the global significance of the pattern of differences weused the omnibus mean sum of squares test (Worsley et al., 1995).This can be defined as S=∑t2/N, where the summation of the squareof the t value calculated over all voxels is divided by the total numberof voxels N. This test allowed for the rejection of the null hypothesisthat no significant between-group differences in entire gray mattervolume existed between groups, without localizing such differences.Omnibus significance testing can then be approximated with a χ2
distribution (Worsley et al., 1995).Step 2: To obtain each subject’s individual expression value of
the pattern described above, we individually computed the scalarproduct of the gray matter image by the t map of between-groupdifferences. That is, we multiplied each voxel of the individual graymatter images by the voxel’s relevance in between-groupdiscrimination. These voxel values were then added up, sum-marizing the anatomical features of each subject into a single valuethat represented the extent to which they expressed the pattern ofanatomical differences characterized at the group level. Subjectsshowing a large gray matter volume in voxels with positive valuesin the tmap, and relatively small gray matter volume in voxels withnegative t values (i.e., OCD patients) were expected to displaypositive expression values. Conversely, subjects with the inversepattern of gray matter distribution (i.e., control subjects) wereexpected to display negative expression values.
Because the current analysis strategy that we used to calculategray matter volumes differences between OCD patients and controlsubjects (i.e. Step 1) was similar to our previous VBM study of thesame subjects (Pujol et al., 2004), we expected strong overlap ofthe patterns of volumetric differences described in each study (seeResults section). The major differences between studies withrespect to the new analysis employed here involved the use ofSPM2 normalization and segmentation algorithms (versusSPM99), as well as spatial smoothing with a smaller Gaussiankernel (4 mm versus 12 mm), which increased the number ofindependent elements available for calculating individual expres-sion values. In addition, to satisfy the aims of the new analysis, asingle design matrix was constructed, which specified that global
gray matter volume was accounted for both in the calculation ofvolumetric decreases and increases. In the previous study, twodesign matrices were constructed and global gray matter volumewas only controlled in the description of volumetric increases (seePujol et al., 2004).
Subject classification
To make subject classifications, we first calculated the meanexpression value for the two groups of the original sample, OCDpatients (n=72) and control subjects (n=72). Next, we calculatedthe two distances (Euclidean) between each subject’s individualexpression value and each group’s mean expression value. Thesetwo distances were then converted to complementary probabilitiesof being an OCD patient (P-OCD=1−distance to the OCD mean /distance to the OCD mean + distance to the control mean) or acontrol subject (P-Control=1−distance to the control mean /distance to the OCD mean + distance to the control mean). OCDpatients were considered to be misclassified when P-OCD wassmaller than P-Control, that is, less than 0.5, and vice versa.
We validated our classification approach in two ways. Firstly, weconducted a cross-validation study with the leave-one-out method(a.k.a. jackknife approach). This was performed by omitting onesubject at a time from the original study sample and then computinga new t map (Step 1 above) from the remaining sample (143subjects). The expression value (Step 2) and classification (P-OCDand P-Control) for this left-out-subject were then calculated. Thisprocess was repeated 144 times, accounting for all subjects.
Secondly, we performed an ‘independent set of data’ analysis toevaluate the rate of misclassification of a new sample of OCDpatients (n=30) and control subjects (n=30). The classifications forthis new cohort were obtained by calculating subjects’ individualexpression values (Step 2 above) against the group differencepattern extracted from the original sample (n=144).
In both validation studies, the predictive power of ourclassification tool was determined by calculating the sensitivity(i.e., the conditional probability that a case X was correctlyclassified as an OCD patient) and specificity (i.e., the conditionalprobability that a case X was correctly classified as a control

1032 C. Soriano-Mas et al. / NeuroImage 35 (2007) 1028–1037
subject) values. Overall classification accuracy was then calcu-lated as the average of these two values.
Analysis of sociodemographic and clinical variables
Potential differences in the sociodemographic characteristics ofpatient and control groups of both samples were assessed usingStudent’s t and χ2 tests. Sociodemographic and clinical values ofthe sample of newly recruited subjects were compared with thoseof the original sample by means of the one-sample t and χ2 tests(see Tables 1 and 2).
We also conducted Pearson’s correlation analyses betweensubjects’ individual expression values and the continuous clinicaland sociodemographic variables of interest, including subjects’age, duration of illness, cumulative use of serotonin reuptakeinhibitors (SRI), comorbid anxious and depressive symptoms(Hamilton scores), and OC-symptom severity (Y-BOCS scores).Differences in individual expression values between subgroups ofpatients in terms of gender, major OC-symptom dimensions,previous SRI trials completed, and stable medication use at time ofMRI, were assessed using Student’s t test and one-way ANOVAs.The above analyses were performed using SPSS version 12.0.
Results
Table 1 summarizes the sociodemographic characteristics ofboth study samples. No significant differences were observed in anyof the variables between the groups of OCD patients and controlsubjects in either of the samples. Similarly, sociodemographic
Fig. 2. Illustration of the whole-brain pattern of differences between groups. The n(MNI) space.
characteristics of the newly recruited groups of OCD patients andcontrol subjects did not significantly differ with respect to theoriginal sample. Table 2 summarizes the major clinical character-istics of both groups of OCD patients. It can be seen that the newsample of patients differed significantly from the original cohort on8 of the 17 clinical variables measured (see Table 2 for details).
The omnibus mean sum of squares test (described in Step 1above) indicated that the whole-brain pattern of anatomicaldifferences between the original groups of control subjects andOCD patients was globally significant (S=1.75, P<0.0001). Themost relevant features of this pattern are depicted in Fig. 2. Asanticipated, the primary regions of difference between OCDpatients and control subjects (i.e., gray matter volume increasesand decreases) closely resemble those described in our previousstudy of these subjects (Pujol et al., 2004). To summarize here,significant volumetric decreases in OCD patients were observed inthe medial wall of the prefrontal lobe, the posterior cingulate–precuneus region, the cerebellar tonsils, and the posterior insulabilaterally. Significant volumetric increases in OCD patients wereobserved primarily in subcortical regions, including ventralstriatum bilaterally, the posterior thalamus, the anterior cerebellum,and the medial midbrain.
To test the accuracy of our subject classification pattern, we firstcarried out a cross-validation assessment on the original sample.From this analysis, we obtained a high rate of correct subjectclassification, expressing a sensitivity index of 91.7% and aspecificity index of 94.4%. The overall rate of classificationaccuracy was 93.1% (see Fig. 3). This analysis was repeatedincluding only the most extreme 30% of positive and negative
umbers refer to the x coordinate in standard Montreal Neurological Institute
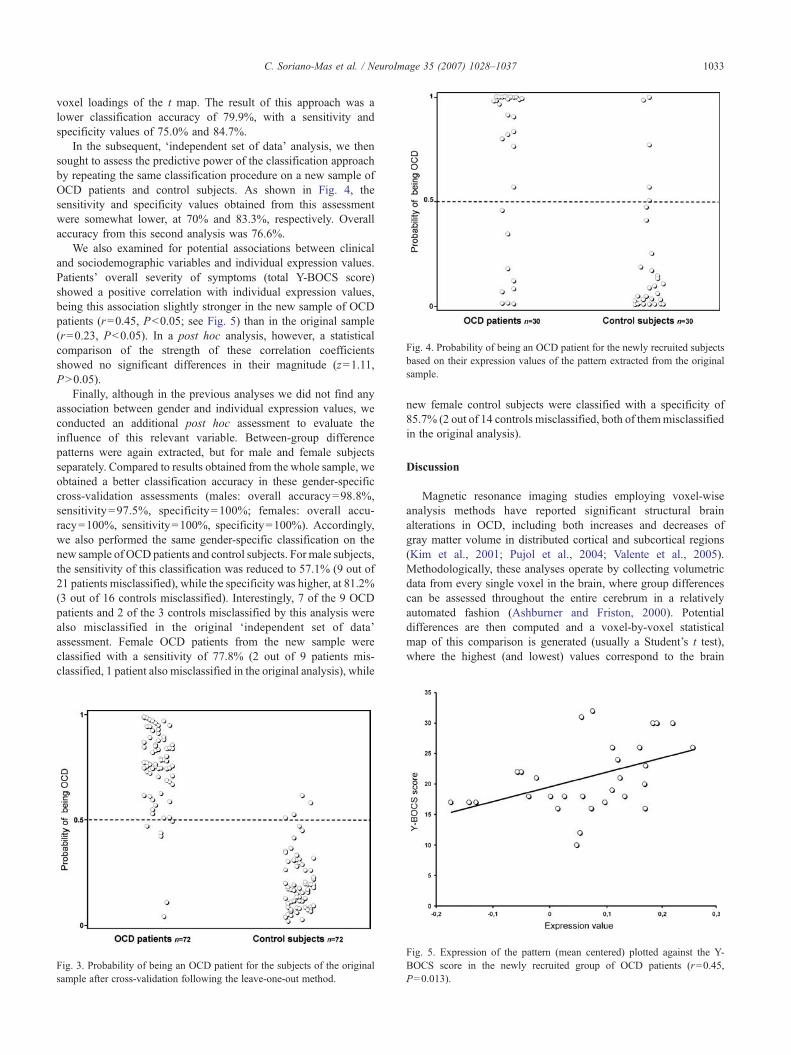
Fig. 4. Probability of being an OCD patient for the newly recruited subjectsbased on their expression values of the pattern extracted from the originalsample.
1033C. Soriano-Mas et al. / NeuroImage 35 (2007) 1028–1037
voxel loadings of the t map. The result of this approach was alower classification accuracy of 79.9%, with a sensitivity andspecificity values of 75.0% and 84.7%.
In the subsequent, ‘independent set of data’ analysis, we thensought to assess the predictive power of the classification approachby repeating the same classification procedure on a new sample ofOCD patients and control subjects. As shown in Fig. 4, thesensitivity and specificity values obtained from this assessmentwere somewhat lower, at 70% and 83.3%, respectively. Overallaccuracy from this second analysis was 76.6%.
We also examined for potential associations between clinicaland sociodemographic variables and individual expression values.Patients’ overall severity of symptoms (total Y-BOCS score)showed a positive correlation with individual expression values,being this association slightly stronger in the new sample of OCDpatients (r=0.45, P<0.05; see Fig. 5) than in the original sample(r=0.23, P<0.05). In a post hoc analysis, however, a statisticalcomparison of the strength of these correlation coefficientsshowed no significant differences in their magnitude (z=1.11,P>0.05).
Finally, although in the previous analyses we did not find anyassociation between gender and individual expression values, weconducted an additional post hoc assessment to evaluate theinfluence of this relevant variable. Between-group differencepatterns were again extracted, but for male and female subjectsseparately. Compared to results obtained from the whole sample, weobtained a better classification accuracy in these gender-specificcross-validation assessments (males: overall accuracy=98.8%,sensitivity=97.5%, specificity=100%; females: overall accu-racy=100%, sensitivity=100%, specificity=100%). Accordingly,we also performed the same gender-specific classification on thenew sample of OCD patients and control subjects. For male subjects,the sensitivity of this classification was reduced to 57.1% (9 out of21 patients misclassified), while the specificity was higher, at 81.2%(3 out of 16 controls misclassified). Interestingly, 7 of the 9 OCDpatients and 2 of the 3 controls misclassified by this analysis werealso misclassified in the original ‘independent set of data’assessment. Female OCD patients from the new sample wereclassified with a sensitivity of 77.8% (2 out of 9 patients mis-classified, 1 patient also misclassified in the original analysis), while
Fig. 3. Probability of being an OCD patient for the subjects of the originalsample after cross-validation following the leave-one-out method.
new female control subjects were classified with a specificity of85.7% (2 out of 14 controls misclassified, both of themmisclassifiedin the original analysis).
Discussion
Magnetic resonance imaging studies employing voxel-wiseanalysis methods have reported significant structural brainalterations in OCD, including both increases and decreases ofgray matter volume in distributed cortical and subcortical regions(Kim et al., 2001; Pujol et al., 2004; Valente et al., 2005).Methodologically, these analyses operate by collecting volumetricdata from every single voxel in the brain, where group differencescan be assessed throughout the entire cerebrum in a relativelyautomated fashion (Ashburner and Friston, 2000). Potentialdifferences are then computed and a voxel-by-voxel statisticalmap of this comparison is generated (usually a Student’s t test),where the highest (and lowest) values correspond to the brain
Fig. 5. Expression of the pattern (mean centered) plotted against the Y-BOCS score in the newly recruited group of OCD patients (r=0.45,P=0.013).

1034 C. Soriano-Mas et al. / NeuroImage 35 (2007) 1028–1037
regions showing most alteration. However, these estimatedvolume values using voxel-wise assessments typically display alarge overlap between groups of patients and control subjects(Davatzikos, 2004), making the identification of single OCDpatients based on discrete voxel measurements rarely feasible.
In this study, contrary to the above notions, we tested thefeasibility (and accuracy) of identifying OCD patients using awhole-brain pattern of anatomical alteration characterized by anoptimized voxel-wise analysis of our large MRI series of patientsand control subjects (Pujol et al., 2004). We calculated a between-group difference image (voxel-wise, t statistic) by comparing thegray matter volumes of an initial group of 72 OCD patients and72 control subjects, and then used this resulting t map ofstructural alterations to obtain individual expression values forthe gray matter volumes of each subject. We use the term“expression value” because this single metric represents theextent to which each individual subject expressed the globalpattern of anatomical differences between groups, that is, thedegree of “OCD-like” anatomical abnormality in a particularsubject. These expression values may ultimately provide thepsychiatrist with relevant biological information, especially whenconsidering the relatively high level of accurate identificationsthat were generated in the validation assessments performed inthe current study.
We validated the accuracy of our approach by performing twovalidation assessments with independent samples of OCD patientsand control subjects. Our initial cross-validation assessment of theoriginal sample yielded a 93.1% accuracy rating, which isencouraging, considering the large variability observed in thevolumetric measures of psychiatric populations in structuralneuroimaging studies. Interestingly, this accuracy was reducedwhen the pattern of alterations was limited to the most relevantvoxels, suggesting that a whole-brain approach may be more optimalfor the anatomical characterization of this disorder. However,because OCD is a clinical heterogeneous condition (Mataix-Colset al., 2005), we also sought to assess how representative ourclassification approach was in a new set of OCD patients. To do so,we performed an ‘independent set of data’ test, which showed areduced overall level of accuracy of individual classifications(76.6%) compared to the cross-validation assessment. This 16.5%decrease in accuracy between the two validations might beexplained by the inherent statistical properties of each approach.The leave-one-out method is a very reliable estimator of thepredictive power of a classifier, whereas the ‘independent set ofdata’ test has greater external and ecological validity, but dependscritically on sample selection, yielding markedly different resultswith different sample selections (Chou and Zhang, 1995). In theclinical research, it is rarely possible to access a full population forrandom selection, and, typically, patients are recruited for researchstudies when they contact the health care system (Aitken et al.,2003). Although in our case the recruitment of OCD patients wasmade by the same psychiatrists using equivalent procedures, theclinical heterogeneity of the disorder and the recruitment of patientsat two separate time points resulted in some differences in theclinical features of the samples (e.g., severity of the disorder, orhistory of depression, see Table 2). One parsimonious interpreta-tion, therefore, is that the clinical differences between the originaland the newly recruited sample may have led to a lowerclassification accuracy in the ‘independent set of data’ test. Toincrease sample homogeneity in future studies, analyses might berestricted to particular subsets of patients, such as severe patients,
or patients without certain comorbidities that may affect brainanatomy (i.e., depression and other anxiety disorders). However,these approaches may ultimately reduce the generalizability offindings.
Gender-specific analyses were found to improve classificationaccuracy in the separate cross-validation assessments of male andfemale sub-groups. To some extent, this may be interpreted as asecondary validation of our classification method. These resultsalso suggest a degree of sexual dimorphism in the anatomicalalterations of OCD, in line with known gender effects that havebeen described in the clinical expression and genetic susceptibilityto this disorder (Arnold et al., 2006; Bogetto et al., 1999; Lensi etal., 1996; Lochner et al., 2004). However, this result should beinterpreted cautiously, as we did not observe any gender-specificanatomical alterations in our previous study of these patients (Pujolet al., 2004). Unlike the original study sample, the classification ofnew subjects did not benefit to the same extent when using suchgender-specific patterns. Most of the subjects misclassified in thewhole-sample analysis were also misclassified in the gender-specific analyses indicating that, in this case, misclassification wasnot attributable to gender differences.
Given the above results, it is important to emphasize that we donot consider that diagnosis of OCD can be made on the basis of astructural MRI examination. It seems that the accuracy of ourclassification approach will be inevitably influenced by differentsources of patient heterogeneity. It is of special relevance, however,that the individual expression values of OCD patients (indicatingrelative severity of brain structural alterations), showed a sig-nificant positive correlation with patients’ symptom severity.Although a greater expression of the pattern cannot be auto-matically associated with a more severe form of OCD, thissuggests that underlying neuroanatomical alterations are indeedrelated to the overt clinical expression of the disorder. Furtherstudies are needed to determine whether the joint use of anatomicaland psychometric data may be useful in classifying particularsubgroups of OCD patients, for example, based on primarysymptom clusters as opposed to overall illness severity.
There are a number of considerations that may enhance theclinical relevance of our approach. For instance, if the progressive(Pujol et al., 2004), reversible (Gilbert et al., 2000), or reactive(Giedd et al., 1996) nature of some of the structural alterations ofOCD was confirmed, pattern classifications could be used as anindicator of disease progression or stabilization. The potentialclinical use of an approach such as ours would also be strengthenedif a degree of discriminant validity with other psychiatric disorderswas demonstrated. Similarly, if images acquired from differentscanners could be analyzed in combination, multi-site clinicalapplications would be possible, facilitating the development ofshared databases. However, site-specific image distortions alsopose a major problem when seeking to make accurate comparisonsof data from different scanners. Although some correction methodsfor these distortions (Jovicich et al., 2006), as well as somesegmentation algorithms invariant to details of image acquisition(Fischl et al., 2002), have been proposed, a reliable method forperforming multi-center VBM studies has not been developed yet.Nevertheless, observations from our laboratory using images of 9OCD patients and 17 control subjects acquired from three differentscanners (with identical parameters) suggest that multi-centerclassification accuracy of our method may be around 70%, i.e., lessaccurate than the ‘independent set of data’ test in the current study,but well above chance levels.

1035C. Soriano-Mas et al. / NeuroImage 35 (2007) 1028–1037
Our method follows the standard preprocessing steps imple-mented in VBM studies and uses a voxel-wise statistical mappingapproach to calculate the pattern of between-group differences.Consequently, in this study, the nature of anatomical differencesclosely resembles the results of our previous VBM study of theoriginal subject sample (Pujol et al., 2004). However, there are someminor differences between the two sets of findings, which are likelyto be explained by the subtle differences in methodology describedearlier. Additionally, our display of the whole-brain anatomicalpattern of differences (Fig. 2) uses an arbitrary threshold of the mostextreme 30% positive and negative voxel loadings, as opposed to athreshold dictated by voxel-wise statistics. As a result, certainregions, including the right posterior insula, the posterior cingulate–precuneus region, and the medial midbrain, now emerged as part ofthe difference pattern, whereas in our previous report they onlyshowed a tendency towards significant alteration (Pujol et al.,2004).
Though largely restricted to neurological disorders, otherapproaches for patient classification with brain MRI have beendeveloped with the intent of extending the clinical utility ofneuroimaging studies. For example, the measurement of selectedROIs has been used to inform the diagnosis and clinical staging ofneurodegenerative diseases (Laakso et al., 2000; Wolf et al., 2001),and VBM studies have characterized individual brains ofneurological patients in relation to a population of reference(Gitelman et al., 2001; Mummery et al., 2000; Wilke et al., 2003;Woermann et al., 1999). However, in general, such classificationsare likely to meet with less success when applied to psychiatricdisorders, considering the high clinical heterogeneity that oftenexists between patients (Mataix-Cols et al., 2005). Similarly, inanatomical terms, structural brain abnormalities are also typicallymore variable and distributed in psychiatric groups, and thus,subtle alterations occurring in one individual patient may not becompelling when compared to a population of reference. Ournotion is that the relevance of such subtle individual alterationscould be enhanced if considered as part of an extended pattern ofcharacteristic abnormality, which is variably expressed acrosssubjects. In methodological terms, the use of high-resolutionimages with small smoothing kernels may be better suited foraccurately characterizing such disease-associated patterns. Con-sidering this, the relatively large slice thickness of images used inthe current analysis may be one limitation of our study.
The use of whole-brain patterns of between-group differencesfor subject classification purposes has been previously reported,although, contrary to the present approach, within a multivariatestatistical framework (Kawasaki et al., 2007; Kerrouche et al.,2006; Meyer-Lindenberg et al., 2001; Scarmeas et al., 2004).However, as discussed in the Materials and methods section,differences between univariate and multivariate approaches basedon Singular Value Decomposition are only likely to arise whenmore than two study groups are involved (Worsley et al., 1997).Nevertheless, when combined with high-dimensional brain map-ping techniques, multivariate statistics may offer the possibility ofanalyzing some morphometrical characteristics, such as shape, thathave been reported to possess greater discriminative power thanvolumetric data (Csernansky et al., 1998; Posener et al., 2003).Davatzikos et al. (2005), for instance, used such an approach and anon-linear discrimination function to anatomically differentiateschizophrenia patients from control subjects, obtaining a classifi-cation ratio quite similar to the one reported here. However, in apractical sense, these methods require significantly more computa-
tional time and effort than the relatively straightforward approachdescribed here.
In summary, we present a method for summarizing brainanatomical alterations of particular patients, demonstrated here inOCD, with regards to a reference pattern of abnormality that existsat the population level. While the application of this method hascurrently been restricted to MRI scans acquired with the samemachine, the possibility of using multi-center image databasesremains open and may further advance the general utility of thisapproach towards a valuable neuroimaging aid for patientmanagement.
Acknowledgments
This study was supported in part by the Fondo de Inves-tigación Sanitaria (Grants No. 00/0226 and PI020102), theFundació La Marató TV3, and the Direcció General de Recercade la Generalitat de Catalunya (Grants No. 1999SGR-328 and2000XT-43). Dr. Harrison is supported by an NHMRC TrainingAward (I.D. 400420). We thank Gerald Fannon, PhD, for revisingthe manuscript.
References
Aitken, L., Gallagher, R., Madronio, C., 2003. Principles of recruitment andretention in clinical trials. Int. J. Nurs. Pract. 9, 338–346.
Arnold, P.D., Sicard, T., Burroughs, E., Richter, M.A., Kennedy, J.L., 2006.Glutamate transporter gene SLC1A1 associated with obsessive–compulsive disorder. Arch. Gen. Psychiatry 63, 769–776.
Ashburner, J., Friston, K.J., 2000. Voxel-based morphometry—Themethods. NeuroImage 11, 805–821.
Atmaca, M., Yildirim, B.H., Ozdemir, B.H., Aydin, B.A., Tezcan, A.E.,Ozler, A.S., 2006. Volumetric MRI assessment of brain regions inpatients with refractory obsessive–compulsive disorder. Prog. Neuro-psychopharmacol. Biol. Psychiatry 30, 1051–1057.
Aylward, E.H., Harris, G.J., Hoehn-Saric, R., Barta, P.E., Machlin, S.R.,Pearlson, G.D., 1996. Normal caudate nucleus in obsessive–compulsivedisorder assessed by quantitative neuroimaging. Arch. Gen. Psychiatry53, 577–584.
Bartha, R., Stein, M.B., Williamson, P.C., Drost, D.J., Neufeld, R.W., Carr,T.J., Canaran, G., Densmore, M., Anderson, G., Siddiqui, A.R., 1998. Ashort echo 1H spectroscopy and volumetric MRI study of the corpusstriatum in patients with obsessive–compulsive disorder and comparisonsubjects. Am. J. Psychiatry 155, 1584–1591.
Bogetto, F., Venturello, S., Albert, U., Maina, G., Ravizza, L., 1999. Gender-related clinical differences in obsessive–compulsive disorder. Eur.Psychiatry 14, 434–441.
Choi, J.S., Kang, D.H., Kim, J.J., Ha, T.H., Lee, J.M., Youn, T., Kim, I.Y.,Kim, S.I., Kwon, J.S., 2004. Left anterior subregion of orbitofrontalcortex volume reduction and impaired organizational strategies inobsessive–compulsive disorder. J. Psychiatr. Res. 38, 193–199.
Chou, K.C., Zhang, C.T., 1995. Prediction of protein structural classes. Crit.Rev. Biochem. Mol. Biol. 30, 275–349.
Csernansky, J.G., Joshi, S., Wang, L., Haller, J.W., Gado, M., Miller, J.P.,Grenander, U., Miller, M.I., 1998. Hippocampal morphometry inschizophrenia by high dimensional brain mapping. Proc. Nat. Acad.Sci. U. S. A. 95, 11406–11411.
Davatzikos, C., 2004. Why voxel-based morphometric analysis should beused with great caution when characterizing group differences. Neuro-Image 23, 17–20.
Davatzikos, C., Shen, D., Gur, R.C., Wu, X., Liu, D., Fan, Y., Hughett, P.,Turetsky, B.I., Gur, R.E., 2005. Whole-brain morphometric study ofschizophrenia revealing a spatially complex set of focal abnormalities.Arch. Gen. Psychiatry 62, 1218–1227.

1036 C. Soriano-Mas et al. / NeuroImage 35 (2007) 1028–1037
Fischl, B., Salat, D.H., Busa, E., Albert, M., Dieterich, M., Haselgrove, C.,van der Kouwe, A., Killiany, R., Kennedy, D., Klaveness, S., Montillo,A., Makris, N., Rosen, B., Dale, A.M., 2002. Whole brain segmentation:automated labeling of neuroanatomical structures in the human brain.Neuron 33, 341–355.
Friston, K.J., Ashburner, J., 2004. Generative and recognition models forneuroanatomy. NeuroImage 23, 21–24.
Giedd, J.N., Rapoport, J.L., Leonard, H.L., Richter, D., Swedo, S.E., 1996.Case study: acute basal ganglia enlargement and obsessive–compulsivesymptoms in an adolescent boy. J. Am. Acad. Child Adolesc. Psych. 35,913–915.
Giedd, J.N., Rapoport, J.L., Garvey, M.A., Perlmutter, S., Swedo, S.E.,2000. MRI assessment of children with obsessive–compulsive disorderor tics associated with streptococcal infection. Am. J. Psychiatry 157,281–283.
Gilbert, A.R., Moore, G.J., Keshavan, M.S., Paulson, L.A., Narula, V.,MacMaster, F.P., Stewart, C.M., Rosenberg, D.R., 2000. Decrease inthalamic volumes of pediatric patients with obsessive–compulsivedisorder who are taking paroxetine. Arch. Gen. Psychiatry 57, 449–456.
Gitelman, D.R., Ashburner, J., Friston, K.J., Tyler, L.K., Price, C.J., 2001.Voxel-based morphometry of herpes simplex encephalitis. NeuroImage13, 623–631.
Good, C.D., Johnsrude, I.S., Ashburner, J., Henson, R.N., Friston, K.J.,Frackowiak, R.S., 2001. Avoxel-based morphometric study of ageing in465 normal adult human brains. NeuroImage 14, 21–36.
Jenike, M.A., Breiter, H.C., Baer, L., Kennedy, D.N., Savage, C.R.,Olivares, M.J., O’Sullivan, R.L., Shera, D.M., Rauch, S.L., Keuthen, N.,Rosen, B.R., Caviness, V.S., Filipek, P.A., 1996. Cerebral structuralabnormalities in obsessive–compulsive disorder. A quantitative mor-phometric magnetic resonance imaging study. Arch. Gen. Psychiatry 53,625–632.
Jovicich, J., Czanner, S., Greve, D., Haley, E., van der Kouwe, A., Gollub,R., Kennedy, D., Schmitt, F., Brown, G., Macfall, J., Fischl, B., Dale, A.,2006. Reliability in multi-site structural MRI studies: effects of gradientnon-linearity correction on phantom and human data. NeuroImage 30,436–443.
Kang, D.H., Kim, J.J., Choi, J.S., Kim, Y.I., Kim, C.W., Youn, T., Han,M.H., Chang, K.H., Kwon, J.S., 2004. Volumetric investigation of thefrontal–subcortical circuitry in patients with obsessive–compulsivedisorder. J. Neuropsychiatry Clin. Neurosci. 16, 342–349.
Kawasaki, Y., Suzuki, M., Kherif, F., Takahashi, T., Zhou, S.Y., Nakamura,K., Matsui, M., Sumiyoshi, T., Seto, H., Kurachi, M., 2007. Multivariatevoxel-based morphometry successfully differentiates schizophreniapatients from healthy controls. NeuroImage 34, 235–242.
Kellner, C.H., Jolley, R.R., Holgate, R.C., Austin, L., Lydiard, R.B., Laraia,M., Ballenger, J.C., 1991. Brain MRI in obsessive–compulsive disorder.Psychiatry Res. 36, 45–49.
Kerrouche, N., Herholz, K., Mielke, R., Holthoff, V., Baron, J.C., 2006. (18)FDG PET in vascular dementia: differentiation from Alzheimer’s diseaseusing voxel-based multivariate analysis. J. Cereb. Blood Flow Metab.26, 1213–1221.
Kim, J.J., Lee, M.C., Kim, J., Kim, I.Y., Kim, S.I., Han, M.H., Chang, K.H.,Kwon, J.S., 2001. Grey matter abnormalities in obsessive–compulsivedisorder: statistical parametric mapping of segmented magneticresonance images. Br. J. Psychiatry 179, 330–334.
Kwon, J.S., Shin, Y.W., Kim, C.W., Kim, Y.I., Youn, T., Han, M.H., Chang,K.H., Kim, J.J., 2003. Similarity and disparity of obsessive–compulsivedisorder and schizophrenia in MR volumetric abnormalities of thehippocampus–amygdala complex. J. Neurol. Neurosurg. Psychiatry 74,962–964.
Laakso, M.P., Hallikainen, M., Hanninen, T., Partanen, K., Soininen, H.,2000. Diagnosis of Alzheimer’s disease: MRI of the hippocampus vsdelayed recall. Neuropsychologia 38, 579–584.
Lensi, P., Cassano, G.B., Correddu, G., Ravagli, S., Kunovac, J.L., Akiskal,H.S., 1996. Obsessive–compulsive disorder. Familial–developmentalhistory, symptomatology, comorbidity and course with special referenceto gender-related differences. Br. J. Psychiatry 169, 101–107.
Lochner, C., Hemmings, S.M., Kinnear, C.J., Moolman-Smook, J.C.,Corfield, V.A., Knowles, J.A., Niehaus, D.J., Stein, D.J., 2004. Genderin obsessive–compulsive disorder: clinical and genetic findings. Eur.Neuropsychopharmacol. 14, 105–113.
Mataix-Cols, D., Rauch, S.L., Manzo, P.A., Jenike, M.A., Baer, L., 1999.Use of factor-analyzed symptom dimensions to predict outcome withserotonin reuptake inhibitors and placebo in the treatment of obsessive–compulsive disorder. Am. J. Psychiatry 156, 1409–1416.
Mataix-Cols, D., Rosario-Campos, M.C., Leckman, J.F., 2005. A multi-dimensional model of obsessive–compulsive disorder. Am. J. Psychiatry162, 228–238.
Meyer-Lindenberg, A., Poline, J.B., Kohn, P.D., Holt, J.L., Egan, M.F.,Weinberger, D.R., Berman, K.F., 2001. Evidence for abnormal corticalfunctional connectivity during working memory in schizophrenia. Am.J. Psychiatry 158, 1809–1817.
Mummery, C.J., Patterson, K., Price, C.J., Ashburner, J., Frackowiak, R.S.,Hodges, J.R., 2000. A voxel-based morphometry study of semanticdementia: relationship between temporal lobe atrophy and semanticmemory. Ann. Neurol. 47, 36–45.
Posener, J.A., Wang, L., Price, J.L., Gado, M.H., Province, M.A., Miller,M.I., Babb, C.M., Csernansky, J.G., 2003. High-dimensional mappingof the hippocampus in depression. Am. J. Psychiatry 160, 83–89.
Pujol, J., Soriano-Mas, C., Alonso, P., Cardoner, N., Menchon, J.M., Deus,J., Vallejo, J., 2004. Mapping structural brain alterations in obsessive–compulsive disorder. Arch. Gen. Psychiatry 61, 720–730.
Rauch, S.L., Baxter Jr., L.R., 1998. Neuroimaging in obsessive–compulsivedisorder and related disorders. In: Jenike, M.A., Baer, L., Minichiello,W.E. (Eds.), Obsessive–compulsive Disorder: Practical Management.Mosby-Year Book Inc., St. Louis, pp. 289–317.
Riffkin, J., Yucel, M., Maruff, P., Wood, S.J., Soulsby, B., Olver, J., Kyrios,M., Velakoulis, D., Pantelis, C., 2005. A manual and automated MRIstudy of anterior cingulate and orbito-frontal cortices, and caudatenucleus in obsessive–compulsive disorder: comparison with healthycontrols and patients with schizophrenia. Psychiatry Res. 138, 99–113.
Robinson, D., Wu, H., Munne, R.A., Ashtari, M., Alvir, J.M., Lerner, G.,Koreen, A., Cole, K., Bogerts, B., 1995. Reduced caudate nucleusvolume in obsessive–compulsive disorder. Arch. Gen. Psychiatry 52,393–398.
Rosenberg, D.R., Keshavan, M.S., O’Hearn, K.M., Dick, E.L., Bagwell,W.W., Seymour, A.B., Montrose, D.M., Pierri, J.N., Birmaher, B., 1997.Frontostriatal measurement in treatment-naive children with obsessive–compulsive disorder. Arch. Gen. Psychiatry 54, 824–830.
Salmond, C.H., Ashburner, J., Vargha-Khadem, F., Connelly, A., Gadian,D.G., Friston, K.J., 2002. Distributional assumptions in voxel-basedmorphometry. NeuroImage 17, 1027–1030.
Saxena, S., Brody, A.L., Schwartz, J.M., Baxter, L.R., 1998. Neuroimagingand frontal–subcortical circuitry in obsessive–compulsive disorder. Br.J. Psychiatr., Suppl. 35, 26–37.
Scarmeas, N., Habeck, C.G., Zarahn, E., Anderson, K.E., Park, A., Hilton,J., Pelton, G.H., Tabert, M.H., Honig, L.S., Moeller, J.R., Devanand,D.P., Stern, Y., 2004. Covariance PET patterns in early Alzheimer’sdisease and subjects with cognitive impairment but no dementia: utilityin group discrimination and correlations with functional performance.NeuroImage 23, 35–45.
Scarone, S., Colombo, C., Livian, S., Abbruzzese, M., Ronchi, P., Locatelli,M., Scotti, G., Smeraldi, E., 1992. Increased right caudate nucleus size inobsessive–compulsive disorder: detection with magnetic resonanceimaging. Psychiatry Res. 45, 115–121.
Stein, D.J., Coetzer, R., Lee, M., Davids, B., Bouwer, C., 1997. Magneticresonance brain imaging in women with obsessive–compulsive disorderand trichotillomania. Psychiatry Res. 74, 177–182.
Szeszko, P.R., Robinson, D., Alvir, J.M., Bilder, R.M., Lencz, T., Ashtari,M., Wu, H., Bogerts, B., 1999. Orbital frontal and amygdala volumereductions in obsessive–compulsive disorder. Arch. Gen. Psychiatry 56,913–919.
Szeszko, P.R., MacMillan, S., McMeniman, M., Chen, S., Baribault, K.,Lim, K.O., Ivey, J., Rose, M., Banerjee, S.P., Bhandari, R., Moore, G.J.,

1037C. Soriano-Mas et al. / NeuroImage 35 (2007) 1028–1037
Rosenberg, D.R., 2004a. Brain structural abnormalities in psychotropicdrug-naive pediatric patients with obsessive–compulsive disorder. Am.J. Psychiatry 161, 1049–1056.
Szeszko, P.R., MacMillan, S., McMeniman, M., Lorch, E., Madden, R.,Ivey, J., Banerjee, S.P., Moore, G.J., Rosenberg, D.R., 2004b. Amygdalavolume reductions in pediatric patients with obsessive–compulsivedisorder treated with paroxetine: preliminary findings. Neuropsycho-pharmacology 29, 826–832.
Valente Jr., A.A., Miguel, E.C., Castro, C.C., Amaro Jr., E., Duran, F.L.,Buchpiguel, C.A., Chitnis, X., McGuire, P.K., Busatto, G.F., 2005.Regional gray matter abnormalities in obsessive–compulsive disorder: avoxel-based morphometry study. Biol. Psychiatry 58, 479–487.
Wilke, M., Kassubek, J., Ziyeh, S., Schulze-Bonhage, A., Huppertz, H.J.,2003. Automated detection of gray matter malformations using
optimized voxel-based morphometry: a systematic approach. Neuro-Image 20, 330–343.
Woermann, F.G., Free, S.L., Koepp, M.J., Sisodiya, S.M., Duncan, J.S.,1999. Abnormal cerebral structure in juvenile myoclonic epilepsydemonstrated with voxel-based analysis of MRI. Brain 122, 2101–2108.
Wolf, H., Grunwald, M., Kruggel, F., Riedel-Heller, S.G., Angerhofer, S.,Hojjatoleslami, A., Hensel, A., Arendt, T., Gertz, H., 2001. Hippocam-pal volume discriminates between normal cognition; questionable andmild dementia in the elderly. Neurobiol. Aging 22, 177–186.
Worsley, K.J., Poline, J.B., Vandal, A.C., Friston, K.J., 1995. Tests fordistributed, nonfocal brain activations. NeuroImage 2, 183–194.
Worsley, K.J., Poline, J.B., Friston, K.J., Evans, A.C., 1997. Characterizingthe response of PET and fMRI data using multivariate linear models.NeuroImage 6, 305–319.