Fully Recyclable Bio-Based Epoxy Formulations Using ... - MDPI
16
polymers Article Fully Recyclable Bio-Based Epoxy Formulations Using Epoxidized Precursors from Waste Flour: Thermal and Mechanical Characterization Francesca Ferrari 1 , Carola Esposito Corcione 1, * , Raffaella Striani 1 , Lorena Saitta 2 , Gianluca Cicala 2 and Antonio Greco 1 Citation: Ferrari, F.; Esposito Corcione, C.; Striani, R.; Saitta, L.; Cicala, G.; Greco, A. Fully Recyclable Bio-Based Epoxy Formulations Using Epoxidized Precursors from Waste Flour: Thermal and Mechanical Characterization. Polymers 2021, 13, 2768. https://doi.org/10.3390/ polym13162768 Academic Editor: Piotr Bulak Received: 26 July 2021 Accepted: 12 August 2021 Published: 18 August 2021 Publisher’s Note: MDPI stays neutral with regard to jurisdictional claims in published maps and institutional affil- iations. Copyright: © 2021 by the authors. Licensee MDPI, Basel, Switzerland. This article is an open access article distributed under the terms and conditions of the Creative Commons Attribution (CC BY) license (https:// creativecommons.org/licenses/by/ 4.0/). 1 Department of Engineering for Innovation, University of Salento, Via Arnesano, 73100 Lecce, Italy; [email protected] (F.F.); [email protected] (R.S.); [email protected] (A.G.) 2 Department of Civil Engineering and Architecture (DICAR), University of Catania, Viale Andrea Doria 6, 95125 Catania, Italy; [email protected] (L.S.); [email protected] (G.C.) * Correspondence: [email protected] Abstract: Organic wastes represent an increasing pollution problem due to the exponential growth of their presence in the waste stream. Among these, waste flour cannot be easily reused by transforming it into high-value-added products. Another major problem is represented by epoxy-based thermosets, which have wide use but also poor recyclability. The object of the present paper is, therefore, to analyze both of these problems and come up with innovative solutions. Indeed, we propose a completely new approach, aimed at reusing the organic waste flour, by converting it into high-value epoxy-based thermosets that could be fully recycled into a reusable plastic matrix when added to the waste epoxy-based thermosets. Throughout the research activity, the organic waste was transformed into an epoxidized prepolymer, which was then mixed with a bio-based monomer cured with a cleavable ammine. The latter reactant was based on Recyclamine™ by Connora Technologies, and in this paper, we demonstrate that this original approach could work with the synthetized epoxy prepolymers derived from the waste flour. The cured epoxies were fully characterized in terms of their thermal, rheological, and flexural properties. The results obtained showed optimal recyclability of the new resin developed. Keywords: epoxidation; thermoset recycling; organic waste 1. Introduction The use of epoxy-based composites is widely accepted in different fields. In the aerospace sector, epoxy resins are used because of its low cost and suitability for producing large structures. Recent studies reported novel technologies for producing enhanced com- posites for the aeronautical field. Zotti et al. [1] developed PDA-coated silica nanoparticles as filler for a common aeronautical epoxy resin, improving the mechanical properties, the damage resistance, and the thermal stability with respect to the neat matrix. Liquid resin infusion of epoxy resins is well established in the transportation and naval sectors. In the civil sector, the use of epoxy composites is widely accepted for semistructural and structural applications. An increasing interest was recently devoted to the epoxy–timber composites in the construction field. Awad et al. [2] studied the effect of calcium sulfate as a UV absorber able to improve the aging of two cured epoxies. However, increased awareness of the environmental impact of thermosets has raised concerns regarding their use and has pressed the industry and academia to develop tailored recycling strategies for epoxy-based composites. An additional environmental limitation of currently used epoxy systems is the use of petroleum-based raw materials for their synthesis. Life cycle analysis (LCA) must be considered to develop resins and composites complying with the cradle-to-cradle strategy [3]. Polymers 2021, 13, 2768. https://doi.org/10.3390/polym13162768 https://www.mdpi.com/journal/polymers
-
Upload
khangminh22 -
Category
Documents
-
view
5 -
download
0
Transcript of Fully Recyclable Bio-Based Epoxy Formulations Using ... - MDPI

polymers
Article
Fully Recyclable Bio-Based Epoxy Formulations UsingEpoxidized Precursors from Waste Flour: Thermal andMechanical Characterization
Francesca Ferrari 1 , Carola Esposito Corcione 1,* , Raffaella Striani 1, Lorena Saitta 2, Gianluca Cicala 2
and Antonio Greco 1
�����������������
Citation: Ferrari, F.; Esposito
Corcione, C.; Striani, R.; Saitta, L.;
Cicala, G.; Greco, A. Fully Recyclable
Bio-Based Epoxy Formulations Using
Epoxidized Precursors from Waste
Flour: Thermal and Mechanical
Characterization. Polymers 2021, 13,
2768. https://doi.org/10.3390/
polym13162768
Academic Editor: Piotr Bulak
Received: 26 July 2021
Accepted: 12 August 2021
Published: 18 August 2021
Publisher’s Note: MDPI stays neutral
with regard to jurisdictional claims in
published maps and institutional affil-
iations.
Copyright: © 2021 by the authors.
Licensee MDPI, Basel, Switzerland.
This article is an open access article
distributed under the terms and
conditions of the Creative Commons
Attribution (CC BY) license (https://
creativecommons.org/licenses/by/
4.0/).
1 Department of Engineering for Innovation, University of Salento, Via Arnesano, 73100 Lecce, Italy;[email protected] (F.F.); [email protected] (R.S.); [email protected] (A.G.)
2 Department of Civil Engineering and Architecture (DICAR), University of Catania, Viale Andrea Doria 6,95125 Catania, Italy; [email protected] (L.S.); [email protected] (G.C.)
* Correspondence: [email protected]
Abstract: Organic wastes represent an increasing pollution problem due to the exponential growth oftheir presence in the waste stream. Among these, waste flour cannot be easily reused by transformingit into high-value-added products. Another major problem is represented by epoxy-based thermosets,which have wide use but also poor recyclability. The object of the present paper is, therefore, toanalyze both of these problems and come up with innovative solutions. Indeed, we propose acompletely new approach, aimed at reusing the organic waste flour, by converting it into high-valueepoxy-based thermosets that could be fully recycled into a reusable plastic matrix when added to thewaste epoxy-based thermosets. Throughout the research activity, the organic waste was transformedinto an epoxidized prepolymer, which was then mixed with a bio-based monomer cured with acleavable ammine. The latter reactant was based on Recyclamine™ by Connora Technologies, andin this paper, we demonstrate that this original approach could work with the synthetized epoxyprepolymers derived from the waste flour. The cured epoxies were fully characterized in terms oftheir thermal, rheological, and flexural properties. The results obtained showed optimal recyclabilityof the new resin developed.
Keywords: epoxidation; thermoset recycling; organic waste
1. Introduction
The use of epoxy-based composites is widely accepted in different fields. In theaerospace sector, epoxy resins are used because of its low cost and suitability for producinglarge structures. Recent studies reported novel technologies for producing enhanced com-posites for the aeronautical field. Zotti et al. [1] developed PDA-coated silica nanoparticlesas filler for a common aeronautical epoxy resin, improving the mechanical properties,the damage resistance, and the thermal stability with respect to the neat matrix. Liquidresin infusion of epoxy resins is well established in the transportation and naval sectors.In the civil sector, the use of epoxy composites is widely accepted for semistructural andstructural applications. An increasing interest was recently devoted to the epoxy–timbercomposites in the construction field. Awad et al. [2] studied the effect of calcium sulfateas a UV absorber able to improve the aging of two cured epoxies. However, increasedawareness of the environmental impact of thermosets has raised concerns regarding theiruse and has pressed the industry and academia to develop tailored recycling strategiesfor epoxy-based composites. An additional environmental limitation of currently usedepoxy systems is the use of petroleum-based raw materials for their synthesis. Life cycleanalysis (LCA) must be considered to develop resins and composites complying with thecradle-to-cradle strategy [3].
Polymers 2021, 13, 2768. https://doi.org/10.3390/polym13162768 https://www.mdpi.com/journal/polymers
Polymers 2021, 13, 2768 2 of 16
Rybicka et al. [4] described the technology readiness level (TRL) of several recyclingtechnologies: Incineration and landfilling were classified as TRL 9; pyrolysis for carbonand glass fiber composites resulted in a TRL 8. The fluidized bed pyrolysis and solvolysisprocess achieved a median TRL of 4. In some recent reviews, the annual capacity of severaltechnologies for recycling carbon-fiber-reinforced composites was discussed [5,6]. Pyrolysiswas confirmed as the approach reaching capacities in the range of 1000–2000 tons. The mainlimitations of thermal and mechanical recycling processes are fibers’ property degradationand that matrices are fully depolymerized with partial recovery in useful forms [7].
Chemical recycling is emerging as a viable approach to recover clean and undamagedreinforcing fibers while allowing for the recovery of monomers or oligomers that canbe reused. Xu et al. [8] presented an approach based on the decomposition of epoxy-based composites in a H2O2/acetone mixed solution heated between 60 and 150 ◦C. Thedegraded products were analyzed, showing mainly bisphenol A and its derivatives, suchas phenol derivatives, which are generated during the decomposition of the epoxy network.Wang et al. [9] developed a recycling approach based on the use of acetic acid to swellthe composites while the weakly coordinating aluminum ions in CH3COOH solutionselectively cleaved the C−N bond, allowing for obtaining oligomers from the epoxyresins. These papers demonstrated the possibility to cleave epoxy networks, but the reusestrategies for the recovered oligomers were not assessed.
Back in 2012, the company Connora Technologies presented a novel class of amminereagents named Recyclamine™, designed to be selectively cleaved in an aqueous solutionwith acetic acid, using mild conditions (i.e., 80 ◦C), thus yielding clean reinforcing fibersand a reusable thermoplastic matrix from the epoxy network. The Recyclamine™ reactantswere characterized in terms of their aging resistance [10], and mixing them with bio-basedepoxy monomers, their properties using high-pressure resin transfer molding [11] andresin infusion [12] were measured. The recycling process of bio-based resin cured byRecyclamine™ was investigated by life cycle analysis (LCA), confirming its potential tooffer a disruptive solution to the end-of-life problem of epoxy-based composites [10,13,14].In a recent study, the benefits of Recyclamine™ in terms of life cycle costing (LCC) wereassessed [13].
The use of petroleum-based raw materials for the synthesis of epoxy monomers is an-other limit of the epoxy-based composites used nowadays. To overcome this limit, severalresearchers developed bio-based epoxy monomers synthetized from vegetable oils [14],natural acids [15,16], lignin [17], and so forth. The procedures for the synthesis of epoxyprecursors from natural renewable resources require, in most of the cases, the use of organicsolvents limiting the development of a truly green approach. In a recent paper, EspositoCorcione et al. [18] presented an innovative approach to obtain epoxidized monomersstarting from waste flours recovered from the processing waste of pasta factories or fromthe organic fraction of municipal solid waste. This approach simply relies on waste’streatment with UV/ozone radiations without the use of any solvents. This treatment is fast,cheap, reliable, and with no toxic emissions. The amount of municipal solid waste globallycollected per year is approximately 1.3 × 10¹² t, and it is expected to rise up to 2.2 × 10¹² tper year by 2025 (EPA (United States Environmental Protection Agency), 2017).
The huge amount of organic waste is becoming an increasing issue for the wastemanagement of modern cities, while the technology developed by Esposito Corcioneet al. [18,19] can turn waste into a high-value-added product. However, avoiding globalnegative impacts when using epoxy monomers is important to develop suitable recyclingapproaches to reuse epoxy resins at their end of life. This approach respects the cradle-to-cradle strategy.
In the present paper, epoxidized monomers synthetized from waste flour were mixedwith bio-based epoxy precursors; then the epoxy blends obtained were cured using acleavable ammine to develop a fully recyclable bio-based epoxy thermoset. The resinswere fully characterized in terms of thermal and mechanical properties to optimize theirfinal performances. The optimized formulation was recycled using only an acidic aqueous
Polymers 2021, 13, 2768 3 of 16
solution under mild conditions to demonstrate the possibility to recover a reusable plasticfrom the cured epoxy resin.
2. Materials and Methods
Polar Bear (R-Concept, Barcelona, Spain), a bio-based epoxy system designed specifi-cally for the composite processing.
Recyclamine R-101 (R-Concept, Barcelona, Spain), is a recyclable epoxy cure agentfor composite manufacturing. Polar Bear and Recyclamine R-101 are both liquid at roomtemperature.
Waste flour (WF) was obtained from the processing waste of the pasta factories. Epox-idized waste flour (EWF) was obtained by contemporary exposure to UV radiations andozone for 5 h following the method reported in a previous work [18] and in a patent appli-cation [20]. A medium-pressure Hg UV lamp (UV HG 200 ULTRA, Jelosil Srl, Vimodrone,Italy), with a radiation intensity on the surface of the samples of 9.60 W/mm2, was usedfor waste flour treatment.
FTIR analysis, performed with an FTIR (6300 Spectrometer, Jasco, Cremella, Italy), wasused to assess the presence of epoxy groups after UV/ozone exposure. Infrared spectrawere recorded in the wavelength range between 400 and 4000 cm−1, 128 scans, and 4 cm−1
of resolution by using a germanium round crystal window. The spectra acquisition wascarried out before and after the UV/ozone and after curing.
As reported in our previous article [20], the epoxy content of the waste flour waschecked by using titration, carried out according to Method A of ASTM D 1652-97 (ASTMD (1652)-97, 1997). The amount of the consumed acid during titration, which is an indexof the epoxy content of the sample, was used to calculate the epoxy content (E) and theequivalent epoxy weight (WPE) of the waste flour.
Different samples were produced by mixing the Polar Bear resin with specific amountsof epoxidized waste flour and Recyclamine R-101. First, different blends were produced byvarying the ratio between Polar Bear and waste flour, keeping a constant amine content(Table 1). The initial amount of amine was chosen by considering the value suggested fromR-Concept for the blend of Polar Bear and Recyclamine R-101, corresponding to 22 phr.
Table 1. Samples at different commercial/epoxidized waste flour ratios and constant amine content.
Sample Name Polar Bear(wt%)
Epoxidized WasteFlour (wt%)
Recyclamine R-101(phr)
P_A22 100 - 22EWF35_A22 65 35 22EWF40_A22 60 40 22EWF50_A22 50 50 22
After choosing the optimal ratio between Polar Bear and waste flour, the amine contentwas varied by adding different phr’s of Recyclamine R-101 (Table 2) in order to optimizethe curing kinetic of the system.
Table 2. Samples at constant commercial/epoxidized waste flour ratio and varying amine contents.
Sample Name Polar Bear(%)
Epoxidized WasteFlourn (%)
Recyclamine R-101(phr)
EWF50_A15 50 50 15EWF50_A20 50 50 20EWF50_A22 50 50 22EWF50_A24 50 50 24EWF50_A26 50 50 26EWF50_A28 50 50 28EWF50_A30 50 50 30

Polymers 2021, 13, 2768 4 of 16
All the mixtures were degassed by applying vacuum at room temperature, thenpouring in silicon molds and curing for 24 h at room temperature. The cure was followedby a postcure process for 2 h in a static oven. The postcure temperature was varied between120, 150, and 160 ◦C, as shown in Figure 1.
Polymers 2021, 13, x FOR PEER REVIEW 4 of 18
Table 2. Samples at constant commercial/epoxidized waste flour ratio and varying amine contents.
Sample Name Polar Bear
(%) Epoxidized Waste
Flourn (%) Recyclamine R-101
(phr) EWF50_A15 50 50 15 EWF50_A20 50 50 20 EWF50_A22 50 50 22 EWF50_A24 50 50 24 EWF50_A26 50 50 26 EWF50_A28 50 50 28 EWF50_A30 50 50 30
All the mixtures were degassed by applying vacuum at room temperature, then pouring in silicon molds and curing for 24 h at room temperature. The cure was followed by a postcure process for 2 h in a static oven. The postcure temperature was varied be-tween 120, 150, and 160 °C, as shown in Figure 1.
Figure 1. Mixing (a), vacuum (b), and pouring in silicon molds (c) cured thermoset samples (d).
2.1. Recycling Procedure RecyclamineTM is an epoxy hardener developed by Connora Technologies that allows
for obtaining a recyclable thermoset that can be converted into a meltable thermoplastic. Its recyclability key factor is based on the presence of amino-acid-cleavable groups that allow the cleavage of the crosslink points of the epoxy-cured network [21].
The resin system selected for the recycling trials was EWF50_A15, which showed the best properties among all the resin systems tested, as it will be shown in the paper. The chemical recycling procedure is schematically drawn in Figure 2.
A sample of 5 g of the epoxy system EWF50_A15 was solubilized in 300 mL of 25 %vol acid acetic solution (CH3COOH) at 80 °C for 1 h. The obtained mixture was roto-evaporated at 60 °C at a pressure ranging between 110 and 60 mbar and at a rotation speed of 3500 rpm. The distilled acetic acid was stocked, being reusable for a new chemical re-cycling treatment, while the concentrated solution obtained (about 75 mL) was neutral-ized in 300 mL of 50 %vol ammonium hydroxide solution. During this phase, a whitish compound started to precipitate, which was the recycled thermoplastic of interest. Then, the solution containing the precipitate was centrifuged for 5 min at 3000 rpm and, at the end, the supernatant removed. The solid phase at the bottom of the test tube was recov-ered and washed in ionized water to remove any residual traces of acetic acid and ammo-nium hydroxide solutions. Eventually, it was dried in a vacuum stove for 24 h at 50 °C. The thermoplastic obtained is a brown compact solid shown in the panel of Figure 2. The recycling process applied previously on bio-based epoxy derived from pine oil and paper byproducts [22] resulted in a white solid. However, in this paper we modified the recy-cling process compared with the one used previously [21] in the following steps: the use of a Rotavapor to concentrate the solution, the replacement of sodium hydroxide with
Figure 1. Mixing (a), vacuum (b), and pouring in silicon molds (c) cured thermoset samples (d).
2.1. Recycling Procedure
RecyclamineTM is an epoxy hardener developed by Connora Technologies that allowsfor obtaining a recyclable thermoset that can be converted into a meltable thermoplastic.Its recyclability key factor is based on the presence of amino-acid-cleavable groups thatallow the cleavage of the crosslink points of the epoxy-cured network [21].
The resin system selected for the recycling trials was EWF50_A15, which showed thebest properties among all the resin systems tested, as it will be shown in the paper. Thechemical recycling procedure is schematically drawn in Figure 2.
Polymers 2021, 13, x FOR PEER REVIEW 5 of 18
ammonium hydroxide in the neutralization phase, and the use of centrifugation in place of filtration.
Figure 2. Chemical recycling process’s main steps.
The recycling process yield was equal to 85%, in the same range of the yields obtained previously [22]. However, the new process was faster and allowed for reusing the ammo-nium hydroxide solution, thus leading to a greener process, which is under evaluation using LCA to quantify the environmental benefits.
2.2. Methods Rheological analyses were carried out with a Rheometrics Ares rheometer. A double
plate geometry was used, setting a gap of 0.3 mm, constant oscillatory amplitude (1%), and frequency (1 Hz). The tests consisted of a temperature ramp from room temperature to 130 °C.
DSC analysis was performed on a Mettler Toledo 622 differential scanning calorime-ter (DSC). Samples were heated from 25 to 250 °C at 20 °C/min in air.
The thermal stability of the films was assessed by TGA, with a TA Instruments SDT Q600 (TA Instruments, New Castle, DE, USA). The samples were heated in an alumina holder from 20 to 600 °C at a heating rate of 10 °C/min under air atmosphere; three meas-urements were performed on each sample.
The flexural properties of each cured sample were measured using a dynamometer, Lloyd LR5K, according to ASTM D790 (ASTM D790-17, 2017) (three points bending with the specimen dimension: 80 mm × 10 mm × 4 mm). Five replicates were performed on each sample.
Dynamic mechanical analysis was carried out on a dynamic mechanical thermal an-alyzer (TRITEC2000 by Triton Technology, Leicestershire, UK) by single cantilever geom-etry. The recycled polymers, after 1 day drying at 40 °C, were tested in their powder form using the pocket DMA approach, a technique used for testing powders in the pharmaceu-tical field [23] and for polymer blends [24] The polymers obtained from recycling were finely micronized in powder with an average dimension of 30 µm. Then 0.35 g of polymer powder was weighted in a standard stainless steel pocket purchased from Triton and
Figure 2. Chemical recycling process’s main steps.
Polymers 2021, 13, 2768 5 of 16
A sample of 5 g of the epoxy system EWF50_A15 was solubilized in 300 mL of 25 %volacid acetic solution (CH3COOH) at 80 ◦C for 1 h. The obtained mixture was rotoevaporatedat 60 ◦C at a pressure ranging between 110 and 60 mbar and at a rotation speed of 3500 rpm.The distilled acetic acid was stocked, being reusable for a new chemical recycling treatment,while the concentrated solution obtained (about 75 mL) was neutralized in 300 mL of50 %vol ammonium hydroxide solution. During this phase, a whitish compound started toprecipitate, which was the recycled thermoplastic of interest. Then, the solution containingthe precipitate was centrifuged for 5 min at 3000 rpm and, at the end, the supernatantremoved. The solid phase at the bottom of the test tube was recovered and washed inionized water to remove any residual traces of acetic acid and ammonium hydroxidesolutions. Eventually, it was dried in a vacuum stove for 24 h at 50 ◦C. The thermoplasticobtained is a brown compact solid shown in the panel of Figure 2. The recycling processapplied previously on bio-based epoxy derived from pine oil and paper byproducts [22]resulted in a white solid. However, in this paper we modified the recycling processcompared with the one used previously [21] in the following steps: the use of a Rotavapor toconcentrate the solution, the replacement of sodium hydroxide with ammonium hydroxidein the neutralization phase, and the use of centrifugation in place of filtration.
The recycling process yield was equal to 85%, in the same range of the yields obtainedpreviously [22]. However, the new process was faster and allowed for reusing the ammo-nium hydroxide solution, thus leading to a greener process, which is under evaluationusing LCA to quantify the environmental benefits.
2.2. Methods
Rheological analyses were carried out with a Rheometrics Ares rheometer. A doubleplate geometry was used, setting a gap of 0.3 mm, constant oscillatory amplitude (1%),and frequency (1 Hz). The tests consisted of a temperature ramp from room temperatureto 130 ◦C.
DSC analysis was performed on a Mettler Toledo 622 differential scanning calorimeter(DSC). Samples were heated from 25 to 250 ◦C at 20 ◦C/min in air.
The thermal stability of the films was assessed by TGA, with a TA Instruments SDTQ600 (TA Instruments, New Castle, DE, USA). The samples were heated in an aluminaholder from 20 to 600 ◦C at a heating rate of 10 ◦C/min under air atmosphere; threemeasurements were performed on each sample.
The flexural properties of each cured sample were measured using a dynamometer,Lloyd LR5K, according to ASTM D790 (ASTM D790-17, 2017) (three points bending withthe specimen dimension: 80 mm × 10 mm × 4 mm). Five replicates were performed oneach sample.
Dynamic mechanical analysis was carried out on a dynamic mechanical thermal ana-lyzer (TRITEC2000 by Triton Technology, Leicestershire, UK) by single cantilever geometry.The recycled polymers, after 1 day drying at 40 ◦C, were tested in their powder form usingthe pocket DMA approach, a technique used for testing powders in the pharmaceuticalfield [23] and for polymer blends [24] The polymers obtained from recycling were finelymicronized in powder with an average dimension of 30 µm. Then 0.35 g of polymer powderwas weighted in a standard stainless steel pocket purchased from Triton and pressed toobtain a uniform thickness. The test was carried out according to the following protocol:the sample was stabilized at 25 ◦C and then heated up to 180 ◦C at 5 ◦C min−1; the sampleswere cooled down naturally and reheated up to 180 ◦C at 5 ◦C min−1. Similar techniqueswere also reported by Carlier et al. [25] for organic polymers under the name supportedDMA. This kind of technique allows for direct evaluation of thermal transitions from E’ andtan d traces. However, the absolute values of E’ and tan δ for the polymer are influenced bythe presence of the metal pocket, and thus, the real values should be analyzed consideringthe assembly as a sandwich material. The tan δ versus temperature was plotted.

Polymers 2021, 13, 2768 6 of 16
2.3. Statistical Analysis
Analysis of variance (ANOVA) was used to highlight the statistical significance ofdifferent parameters, as the different amounts of EWF and Polar resin, on the mechanicproperties. For this purpose, the F value, which is defined as the ratio of the variationbetween sample means to the variation within the samples, was calculated from themeasured data. Then, being “a” the number of levels of the variance factor and “n” thenumber of tests for each level, the critical F value, FCV(a-1, a(n-1), α), can be estimated.FCV represents the value of F distribution with degrees of freedom (a-1) and a(n-1), which,at a confidence level, α, corresponds to the null hypothesis (equivalence of the means).Therefore, F < FCV indicates that the population means are equivalent, whereas F > FCVindicates that the population means are significantly different. Another quantitativemeasure for reporting the result of a test of hypothesis is the p-value. The p-value is theprobability of the test statistic to be at least as extreme as the one observed, given that thenull hypothesis is true. A small p-value is an indication that the null hypothesis is false.It is good practice to decide in advance of the test how small a p-value is required to rejectthe test, that is, to choose a significance level, α, for the test. For example, it can be decidedto reject the null hypothesis if the test statistic exceeds the critical value (for α = 0.05) or,analogously, to reject the null hypothesis if the p-value is smaller than 0.05.
3. Results and Discussion
The FTIR spectra on waste flour are reported in Figure 3; in particular, the FTIRcurve of waste flour (WF) shows the typical peaks of starch: 1412 cm−1 assigned to –CH2bending and –COO stretch, 1075, 1048 cm−1 and 1022 cm−1 assigned to the crystalline andamorphous regions of starch, respectively, and 1164 cm−1 assigned to vibrations of theglucosidic C–O–C bond and the whole glucose ring that can present different modes ofvibrations and bending conformations.
Polymers 2021, 13, x FOR PEER REVIEW 7 of 18
1400 1300 1200 1100 1000 900 8000
5
10
% T
wavenumber (s-1)
Neat flour UV/ozone treated flour cured flour (22 phr of R101, 150 °C)
Figure 3. FTIR spectra of waste flour.
A contemporary exposure of waste flour to UV/ozone radiation involves the appear-ance of the typical signals of the epoxy ring at 1260, 890, and 827 cm−1. This indicates that the treatment allows for obtaining epoxidized waste flour (EWF).
After curing of the waste flour in the presence of the amine, the peaks due to the epoxy rings disappear, confirming epoxy curing reaction. The strong peak at 1075 cm–1 can be again attributed to the bending vibration of residual glucose.
The viscosity curves of the commercial system and its blend with 50% of EWF are reported in Figure 4. The commercial system is characterized by a step increase in viscos-ity of around 95 °C, which is indicative of the reaction with the amine. The addition of waste flour involves a decrease in the onset temperature of reaction, as clearly observed in Figure 4a. This indicates that in the presence of EWF, the crosslinking reaction of the system is accelerated.
(a) (b)
Figure 4. Rheological (a) and DSC (b) analysis of the curing reaction.
Figure 3. FTIR spectra of waste flour.
A contemporary exposure of waste flour to UV/ozone radiation involves the appear-ance of the typical signals of the epoxy ring at 1260, 890, and 827 cm−1. This indicates thatthe treatment allows for obtaining epoxidized waste flour (EWF).

Polymers 2021, 13, 2768 7 of 16
After curing of the waste flour in the presence of the amine, the peaks due to the epoxyrings disappear, confirming epoxy curing reaction. The strong peak at 1075 cm−1 can beagain attributed to the bending vibration of residual glucose.
The viscosity curves of the commercial system and its blend with 50% of EWF arereported in Figure 4. The commercial system is characterized by a step increase in viscosityof around 95 ◦C, which is indicative of the reaction with the amine. The addition ofwaste flour involves a decrease in the onset temperature of reaction, as clearly observedin Figure 4a. This indicates that in the presence of EWF, the crosslinking reaction of thesystem is accelerated.
Polymers 2021, 13, x FOR PEER REVIEW 7 of 18
1400 1300 1200 1100 1000 900 8000
5
10
% T
wavenumber (s-1)
Neat flour UV/ozone treated flour cured flour (22 phr of R101, 150 °C)
Figure 3. FTIR spectra of waste flour.
A contemporary exposure of waste flour to UV/ozone radiation involves the appear-ance of the typical signals of the epoxy ring at 1260, 890, and 827 cm−1. This indicates that the treatment allows for obtaining epoxidized waste flour (EWF).
After curing of the waste flour in the presence of the amine, the peaks due to the epoxy rings disappear, confirming epoxy curing reaction. The strong peak at 1075 cm–1 can be again attributed to the bending vibration of residual glucose.
The viscosity curves of the commercial system and its blend with 50% of EWF are reported in Figure 4. The commercial system is characterized by a step increase in viscos-ity of around 95 °C, which is indicative of the reaction with the amine. The addition of waste flour involves a decrease in the onset temperature of reaction, as clearly observed in Figure 4a. This indicates that in the presence of EWF, the crosslinking reaction of the system is accelerated.
(a) (b)
Figure 4. Rheological (a) and DSC (b) analysis of the curing reaction. Figure 4. Rheological (a) and DSC (b) analysis of the curing reaction.
However, as shown in Figure 4b, the exothermal peak temperature obtained by DSCanalysis is the same for both systems. A comparison between the rheological and DSCcurve of the commercial system shows that viscosity increase occurs around 100 ◦C, where,however, the extent of reaction, as measured by DSC, is still quite low. This indicatesthat the rheological analysis can only provide information at a relatively low degree ofconversion. The lower onset temperature of viscosity increase observed in Figure 4a forthe system with EWF is therefore relative to very low conversions, where probably DSCanalysis is not able to detect the very slow heat release of the reaction.
In order to choose the optimal postcure temperature, DSC scans were carried out onsystems postcured at three different temperatures (120, 150, and 160 ◦C) after the cure atroom temperature for 24 h.
The DSC curves in the temperature range between 30 and 170 ◦C, reported in Figure 5a–cfor the cured systems, show that the postcure temperature has no significant effect on theglass transition of the commercial system, which is, in any case, around 96 ◦C. On the otherhand, two different glass transition signals were detected in the blend with EWF, whichindicates a partial miscibility of the system. Both Tg values were significantly affectedby the postcure temperature. The higher values were found after postcure at 150 ◦C. Thedecrease of the Tg values after further increasing the postcure at 160 ◦C was due to thepoor thermal stability of the EWF, which, from TGA analysis, was found to have an onsettemperature of degradation of around 170 ◦C.

Polymers 2021, 13, 2768 8 of 16
Polymers 2021, 13, x FOR PEER REVIEW 8 of 18
However, as shown in Figure 4b, the exothermal peak temperature obtained by DSC analysis is the same for both systems. A comparison between the rheological and DSC curve of the commercial system shows that viscosity increase occurs around 100 °C, where, however, the extent of reaction, as measured by DSC, is still quite low. This indi-cates that the rheological analysis can only provide information at a relatively low degree of conversion. The lower onset temperature of viscosity increase observed in Figure 4a for the system with EWF is therefore relative to very low conversions, where probably DSC analysis is not able to detect the very slow heat release of the reaction.
In order to choose the optimal postcure temperature, DSC scans were carried out on systems postcured at three different temperatures (120, 150, and 160 °C) after the cure at room temperature for 24 h.
The DSC curves in the temperature range between 30 and 170 °C, reported in Figure 5a–c for the cured systems, show that the postcure temperature has no significant effect on the glass transition of the commercial system, which is, in any case, around 96 °C. On the other hand, two different glass transition signals were detected in the blend with EWF, which indicates a partial miscibility of the system. Both Tg values were significantly af-fected by the postcure temperature. The higher values were found after postcure at 150 °C. The decrease of the Tg values after further increasing the postcure at 160 °C was due to the poor thermal stability of the EWF, which, from TGA analysis, was found to have an onset temperature of degradation of around 170 °C.
Figure 5. DSC analysis of blends postcured at 120 °C (a), 150 °C (b), and 160 °C (c).
With the aim of developing an epoxy system that could find use in different indus-trial applications, a glass transition at around 140–150 °C is high enough to guarantee good performances and stability of properties. On the other hand, the lower Tg represents a limit of the developed system.
Figure 5. DSC analysis of blends postcured at 120 ◦C (a), 150 ◦C (b), and 160 ◦C (c).
With the aim of developing an epoxy system that could find use in different industrialapplications, a glass transition at around 140–150 ◦C is high enough to guarantee goodperformances and stability of properties. On the other hand, the lower Tg represents alimit of the developed system.
Therefore, our further efforts were aimed at increasing the lower Tg signal. In thefollowing analysis, we will only focus on the lower Tg, neglecting potential changes of thehigher Tg.
Figure 6 shows DSC heating scans on samples postcured at 150 ◦C with differentamounts of waste flour. No difference in the lower glass transition temperature was de-tected with increasing EWF content. Therefore, in order to increase the amount of recycledmaterial, we focused our further analysis on the blend at 50% of EWF. Unfortunately, itwas impossible to further increase the amount of EWF since this resulted in a significantincrease in the liquid blend viscosity. However, the Tg value of the blends was much lowerthan that of the neat commercial systems, which required further optimization of the aminecontent in order to increase the glass transition of the system.

Polymers 2021, 13, 2768 9 of 16
Polymers 2021, 13, x FOR PEER REVIEW 9 of 18
Therefore, our further efforts were aimed at increasing the lower Tg signal. In the following analysis, we will only focus on the lower Tg, neglecting potential changes of the higher Tg.
Figure 6 shows DSC heating scans on samples postcured at 150 °C with different amounts of waste flour. No difference in the lower glass transition temperature was de-tected with increasing EWF content. Therefore, in order to increase the amount of recycled material, we focused our further analysis on the blend at 50% of EWF. Unfortunately, it was impossible to further increase the amount of EWF since this resulted in a significant increase in the liquid blend viscosity. However, the Tg value of the blends was much lower than that of the neat commercial systems, which required further optimization of the amine content in order to increase the glass transition of the system.
50 100
-1.0
-0.5
P_A22 EWF50_A22 EWF40_A22 EWF35_A22
Hea
t flo
w (W
/g)
Temperature (°C)
Tg = 91 °CTg = 54 °C
Endo
Figure 6. DSC analysis of postcured blends at different EWF contents.
In Figure 7, the DSC curves of samples at a constant EWF content and varying amine amounts are reported. A lower amine amount allowed for increasing the lower glass tran-sition of the system. This indicates that when the amount of amine was too high, an excess of uncured amine remained in the sample after curing. This amine can effectively act as a plasticizer for the epoxy, significantly reducing the glass transition signal. A similar be-havior was in fact observed for the commercial system at higher amine contents, as re-ported in Figure 8. Additionally, in this case, the excess of unreacted amine caused a plas-ticization effect, which reduced the Tg of the system. According to our analysis, it would be possible to further reduce the amount of amine. However, for the same reason previ-ously discussed, the amount of amine was not further reduced below 15 phr because it resulted in very high viscosities.
Figure 6. DSC analysis of postcured blends at different EWF contents.
In Figure 7, the DSC curves of samples at a constant EWF content and varying amineamounts are reported. A lower amine amount allowed for increasing the lower glasstransition of the system. This indicates that when the amount of amine was too high, anexcess of uncured amine remained in the sample after curing. This amine can effectivelyact as a plasticizer for the epoxy, significantly reducing the glass transition signal. A similarbehavior was in fact observed for the commercial system at higher amine contents, asreported in Figure 8. Additionally, in this case, the excess of unreacted amine caused aplasticization effect, which reduced the Tg of the system. According to our analysis, itwould be possible to further reduce the amount of amine. However, for the same reasonpreviously discussed, the amount of amine was not further reduced below 15 phr becauseit resulted in very high viscosities.
Polymers 2021, 13, x FOR PEER REVIEW 10 of 18
50
-1.2
-1.0
-0.8
-0.6
-0.4
-0.2
EWF50_A15 EWF50_A20 EWF50_A22 EWF50_A24 EWF50_26 EWF50_A28 EWF50_A30
Hea
t flo
w (W
/g)
Temperature (°C)
Tg = 76.5
Tg = 55.6
Tg = 51.2
Tg = 49.7Tg = 45.4ENDO
Figure 7. DSC analysis of postcured blends at different amine contents.
Figure 8. DSC analysis of postcured commercial epoxy at different amine contents.
Thermogravimetric analyses, shown in Figure 9, were performed on EWF without and with the addition of different amounts of Polar resin. The EWF sample showed a first weight loss below 150 °C, mainly attributed to the water evaporation, and a second loss between 150 and 350 °C, due to the degradation of the starch. The addition of Polar resin involved, in any case, a strong decrease in the absorption of water. Additionally, an in-crease in thermal stability was detected in the second stage, between 250 and 350 °C, where the production of a carbonaceous residue at lower temperatures occurred together with the degradation of the flour. In this step, a decrease in weight loss was detected by
Figure 7. DSC analysis of postcured blends at different amine contents.

Polymers 2021, 13, 2768 10 of 16
Polymers 2021, 13, x FOR PEER REVIEW 10 of 18
50
-1.2
-1.0
-0.8
-0.6
-0.4
-0.2
EWF50_A15 EWF50_A20 EWF50_A22 EWF50_A24 EWF50_26 EWF50_A28 EWF50_A30
Hea
t flo
w (W
/g)
Temperature (°C)
Tg = 76.5
Tg = 55.6
Tg = 51.2
Tg = 49.7Tg = 45.4ENDO
Figure 7. DSC analysis of postcured blends at different amine contents.
Figure 8. DSC analysis of postcured commercial epoxy at different amine contents.
Thermogravimetric analyses, shown in Figure 9, were performed on EWF without and with the addition of different amounts of Polar resin. The EWF sample showed a first weight loss below 150 °C, mainly attributed to the water evaporation, and a second loss between 150 and 350 °C, due to the degradation of the starch. The addition of Polar resin involved, in any case, a strong decrease in the absorption of water. Additionally, an in-crease in thermal stability was detected in the second stage, between 250 and 350 °C, where the production of a carbonaceous residue at lower temperatures occurred together with the degradation of the flour. In this step, a decrease in weight loss was detected by
Figure 8. DSC analysis of postcured commercial epoxy at different amine contents.
Thermogravimetric analyses, shown in Figure 9, were performed on EWF withoutand with the addition of different amounts of Polar resin. The EWF sample showed afirst weight loss below 150 ◦C, mainly attributed to the water evaporation, and a secondloss between 150 and 350 ◦C, due to the degradation of the starch. The addition of Polarresin involved, in any case, a strong decrease in the absorption of water. Additionally, anincrease in thermal stability was detected in the second stage, between 250 and 350 ◦C,where the production of a carbonaceous residue at lower temperatures occurred togetherwith the degradation of the flour. In this step, a decrease in weight loss was detected byincreasing the Polar resin content. The second stage was followed by a third degradationstep, characterized by the oxidation of the remaining carbonaceous char; also in this step,the production of a higher final solid residue was detected with higher Polar content.
Polymers 2021, 13, x FOR PEER REVIEW 11 of 18
increasing the Polar resin content. The second stage was followed by a third degradation step, characterized by the oxidation of the remaining carbonaceous char; also in this step, the production of a higher final solid residue was detected with higher Polar content.
100 200 300 400 500 6000
20
40
60
80
100
EWF EWF50_A22 EWF40_A22 EWF35_A22
Wei
ght,
%
Temperature, °C Figure 9. TGA on EWF with different Polar resin contents.
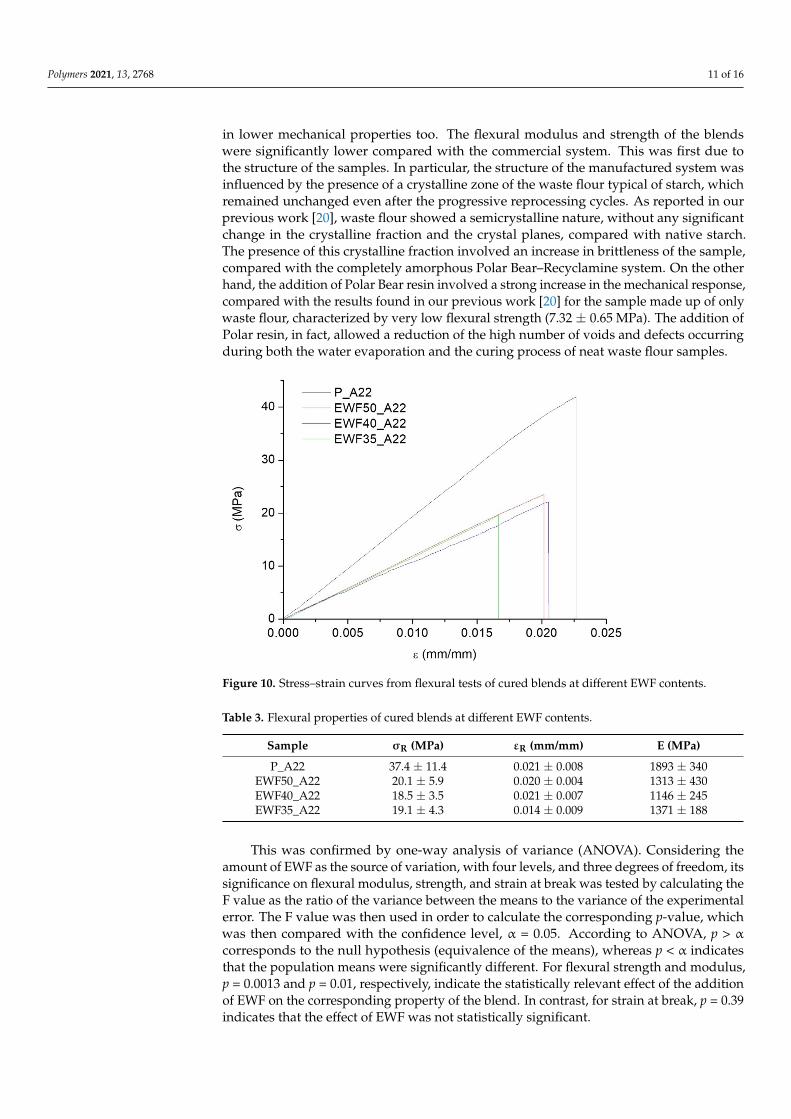
In Figure 10, the stress–strain curves obtained from flexural tests on samples with different EWF contents are reported. Results from flexural tests, and the mechanical prop-erties reported in Table 3, confirmed the results from DSC analysis. The lower Tg found in Figure 6 for the blends, compared with the neat commercial system, resulted in lower mechanical properties too. The flexural modulus and strength of the blends were signifi-cantly lower compared with the commercial system. This was first due to the structure of the samples. In particular, the structure of the manufactured system was influenced by the presence of a crystalline zone of the waste flour typical of starch, which remained unchanged even after the progressive reprocessing cycles. As reported in our previous work [20], waste flour showed a semicrystalline nature, without any significant change in the crystalline fraction and the crystal planes, compared with native starch. The presence of this crystalline fraction involved an increase in brittleness of the sample, compared with the completely amorphous Polar Bear–Recyclamine system. On the other hand, the addi-tion of Polar Bear resin involved a strong increase in the mechanical response, compared with the results found in our previous work [20] for the sample made up of only waste flour, characterized by very low flexural strength (7.32 ± 0.65 MPa). The addition of Polar resin, in fact, allowed a reduction of the high number of voids and defects occurring dur-ing both the water evaporation and the curing process of neat waste flour samples.
Figure 9. TGA on EWF with different Polar resin contents.
In Figure 10, the stress–strain curves obtained from flexural tests on samples withdifferent EWF contents are reported. Results from flexural tests, and the mechanicalproperties reported in Table 3, confirmed the results from DSC analysis. The lower Tgfound in Figure 6 for the blends, compared with the neat commercial system, resulted
Polymers 2021, 13, 2768 11 of 16
in lower mechanical properties too. The flexural modulus and strength of the blendswere significantly lower compared with the commercial system. This was first due tothe structure of the samples. In particular, the structure of the manufactured system wasinfluenced by the presence of a crystalline zone of the waste flour typical of starch, whichremained unchanged even after the progressive reprocessing cycles. As reported in ourprevious work [20], waste flour showed a semicrystalline nature, without any significantchange in the crystalline fraction and the crystal planes, compared with native starch.The presence of this crystalline fraction involved an increase in brittleness of the sample,compared with the completely amorphous Polar Bear–Recyclamine system. On the otherhand, the addition of Polar Bear resin involved a strong increase in the mechanical response,compared with the results found in our previous work [20] for the sample made up of onlywaste flour, characterized by very low flexural strength (7.32 ± 0.65 MPa). The addition ofPolar resin, in fact, allowed a reduction of the high number of voids and defects occurringduring both the water evaporation and the curing process of neat waste flour samples.
Polymers 2021, 13, x FOR PEER REVIEW 12 of 18
Figure 10. Stress–strain curves from flexural tests of cured blends at different EWF contents.
Table 3. Flexural properties of cured blends at different EWF contents.
Sample σR (MPa) εR (mm/mm) E (MPa) P_A22 37.4 ± 11.4 0.021 ± 0.008 1893 ± 340
EWF50_A22 20.1 ± 5.9 0.020 ± 0.004 1313 ± 430 EWF40_A22 18.5 ± 3.5 0.021 ± 0.007 1146 ± 245 EWF35_A22 19.1 ± 4.3 0.014 ± 0.009 1371 ± 188
This was confirmed by one-way analysis of variance (ANOVA). Considering the amount of EWF as the source of variation, with four levels, and three degrees of freedom, its significance on flexural modulus, strength, and strain at break was tested by calculating the F value as the ratio of the variance between the means to the variance of the experi-mental error. The F value was then used in order to calculate the corresponding p-value, which was then compared with the confidence level, α = 0.05. According to ANOVA, p > α corresponds to the null hypothesis (equivalence of the means), whereas p < α indicates that the population means were significantly different. For flexural strength and modulus, p = 0.0013 and p = 0.01, respectively, indicate the statistically relevant effect of the addition of EWF on the corresponding property of the blend. In contrast, for strain at break, p = 0.39 indicates that the effect of EWF was not statistically significant.
On the other hand, limiting the ANOVA to the blends, and therefore neglecting the sample of commercial epoxy, with three levels, and two degrees of freedom, for flexural strength and modulus, p = 0.85 and p = 0.50, respectively, indicates that the corresponding mechanical properties were not influenced by the amount of EWF in the tested range of compositions. This is consistent with the fact that, in Figure 6, the lower Tg signal was independent on the amount of EWF.
In Figure 11, samples with different amine contents are compared. The mechanical properties calculated from the stress–strain curves are reported in Table 4. ANOVA was again used to establish the effect of the amount of amine on the mechanical properties of the sample. Considering the data in Table 4, neglecting the commercial sample, and there-fore considering seven levels, and six degrees of freedom, for flexural strength, modulus, and strain at break, p = 2.1 × 10⁻¹¹, p = 8.3 × 10⁻⁶, and p = 8.2 × 10⁻⁴, respectively, indicate that
Figure 10. Stress–strain curves from flexural tests of cured blends at different EWF contents.
Table 3. Flexural properties of cured blends at different EWF contents.
Sample σR (MPa) εR (mm/mm) E (MPa)
P_A22 37.4 ± 11.4 0.021 ± 0.008 1893 ± 340EWF50_A22 20.1 ± 5.9 0.020 ± 0.004 1313 ± 430EWF40_A22 18.5 ± 3.5 0.021 ± 0.007 1146 ± 245EWF35_A22 19.1 ± 4.3 0.014 ± 0.009 1371 ± 188
This was confirmed by one-way analysis of variance (ANOVA). Considering theamount of EWF as the source of variation, with four levels, and three degrees of freedom, itssignificance on flexural modulus, strength, and strain at break was tested by calculating theF value as the ratio of the variance between the means to the variance of the experimentalerror. The F value was then used in order to calculate the corresponding p-value, whichwas then compared with the confidence level, α = 0.05. According to ANOVA, p > α
corresponds to the null hypothesis (equivalence of the means), whereas p < α indicatesthat the population means were significantly different. For flexural strength and modulus,p = 0.0013 and p = 0.01, respectively, indicate the statistically relevant effect of the additionof EWF on the corresponding property of the blend. In contrast, for strain at break, p = 0.39indicates that the effect of EWF was not statistically significant.
Polymers 2021, 13, 2768 12 of 16
On the other hand, limiting the ANOVA to the blends, and therefore neglecting thesample of commercial epoxy, with three levels, and two degrees of freedom, for flexuralstrength and modulus, p = 0.85 and p = 0.50, respectively, indicates that the correspondingmechanical properties were not influenced by the amount of EWF in the tested range ofcompositions. This is consistent with the fact that, in Figure 6, the lower Tg signal wasindependent on the amount of EWF.
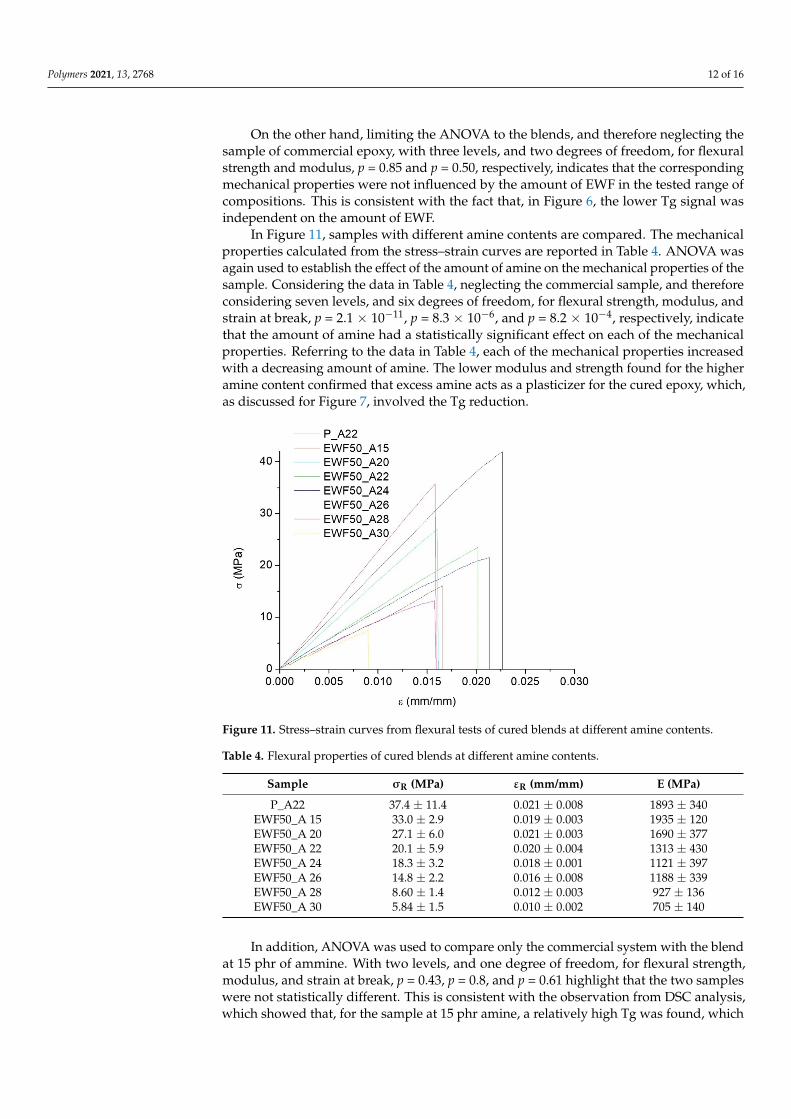
In Figure 11, samples with different amine contents are compared. The mechanicalproperties calculated from the stress–strain curves are reported in Table 4. ANOVA wasagain used to establish the effect of the amount of amine on the mechanical properties of thesample. Considering the data in Table 4, neglecting the commercial sample, and thereforeconsidering seven levels, and six degrees of freedom, for flexural strength, modulus, andstrain at break, p = 2.1 × 10⁻¹¹, p = 8.3 × 10⁻⁶, and p = 8.2 × 10⁻⁴, respectively, indicatethat the amount of amine had a statistically significant effect on each of the mechanicalproperties. Referring to the data in Table 4, each of the mechanical properties increasedwith a decreasing amount of amine. The lower modulus and strength found for the higheramine content confirmed that excess amine acts as a plasticizer for the cured epoxy, which,as discussed for Figure 7, involved the Tg reduction.
Polymers 2021, 13, x FOR PEER REVIEW 13 of 18
the amount of amine had a statistically significant effect on each of the mechanical prop-erties. Referring to the data in Table 4, each of the mechanical properties increased with a decreasing amount of amine. The lower modulus and strength found for the higher amine content confirmed that excess amine acts as a plasticizer for the cured epoxy, which, as discussed for Figure 7, involved the Tg reduction.
Figure 11. Stress–strain curves from flexural tests of cured blends at different amine contents.
Table 4. Flexural properties of cured blends at different amine contents.
Sample σR (MPa) εR (mm/mm) E (MPa) P_A22 37.4 ± 11.4 0.021 ± 0.008 1893 ± 340
EWF50_A 15 33.0 ± 2.9 0.019 ± 0.003 1935 ± 120 EWF50_A 20 27.1 ± 6.0 0.021 ± 0.003 1690 ± 377 EWF50_A 22 20.1 ± 5.9 0.020 ± 0.004 1313 ± 430 EWF50_A 24 18.3 ± 3.2 0.018 ± 0.001 1121 ± 397 EWF50_A 26 14.8 ± 2.2 0.016 ± 0.008 1188 ± 339 EWF50_A 28 8.60 ± 1.4 0.012 ± 0.003 927 ± 136 EWF50_A 30 5.84 ± 1.5 0.010 ± 0.002 705 ± 140
In addition, ANOVA was used to compare only the commercial system with the blend at 15 phr of ammine. With two levels, and one degree of freedom, for flexural strength, modulus, and strain at break, p = 0.43, p = 0.8, and p = 0.61 highlight that the two samples were not statistically different. This is consistent with the observation from DSC analysis, which showed that, for the sample at 15 phr amine, a relatively high Tg was found, which was only 15 °C lower than that of the commercial system. All the ANOVA findings are summarized in Tables 5–8.
Table 5. ANOVA parameters—amount of EWF as the source of variation.
Property Source of Variation SS MS F-Test p-Value
Flexural strength
EWF amount (4 levels) 1244 414 8.48 0.0013
Figure 11. Stress–strain curves from flexural tests of cured blends at different amine contents.
Table 4. Flexural properties of cured blends at different amine contents.
Sample σR (MPa) εR (mm/mm) E (MPa)
P_A22 37.4 ± 11.4 0.021 ± 0.008 1893 ± 340EWF50_A 15 33.0 ± 2.9 0.019 ± 0.003 1935 ± 120EWF50_A 20 27.1 ± 6.0 0.021 ± 0.003 1690 ± 377EWF50_A 22 20.1 ± 5.9 0.020 ± 0.004 1313 ± 430EWF50_A 24 18.3 ± 3.2 0.018 ± 0.001 1121 ± 397EWF50_A 26 14.8 ± 2.2 0.016 ± 0.008 1188 ± 339EWF50_A 28 8.60 ± 1.4 0.012 ± 0.003 927 ± 136EWF50_A 30 5.84 ± 1.5 0.010 ± 0.002 705 ± 140
In addition, ANOVA was used to compare only the commercial system with the blendat 15 phr of ammine. With two levels, and one degree of freedom, for flexural strength,modulus, and strain at break, p = 0.43, p = 0.8, and p = 0.61 highlight that the two sampleswere not statistically different. This is consistent with the observation from DSC analysis,which showed that, for the sample at 15 phr amine, a relatively high Tg was found, which
Polymers 2021, 13, 2768 13 of 16
was only 15 ◦C lower than that of the commercial system. All the ANOVA findings aresummarized in Tables 5–8.
Table 5. ANOVA parameters—amount of EWF as the source of variation.
Property Source of Variation SS MS F-Test p-Value
Flexuralstrength
EWF amount (4 levels) 1244 414 8.48 0.0013
Error 782 48.8
Flexuralmodulus
EWF amount (4 levels) 1.56 × 10⁶ 5.2 × 10⁵ 5.25 0.010
Error 1.58 × 10⁶ 9.89 × 10⁴
Strain atbreak
EWF amount (4 levels) 0.00017 5.7 × 10⁻⁵ 1.08 0.385
Error 0.00084 5.3 × 10⁻⁵
Table 6. ANOVA parameters—amount of EWF as the source of variation, neglecting the sample ofcommercial epoxy.
Property Source of Variation SS MS F-Test p-Value
Flexuralstrength
EWF amount (3 levels) 6.53 3.26 0.149 0.862
Error 262 21.85
Flexuralmodulus
EWF amount (3 levels) 1.36 × 10⁵ 6.82 × 10⁴ 0.73 0.502
Error 1.12 × 10⁶ 9.34 × 10⁴
Strain atbreak
EWF amount (3 levels) 3.3 × 10⁻⁶ 1.7 × 10⁻⁶ 0.0387 0.962
Error 0.00052 4.3 × 10⁻⁵
Table 7. ANOVA parameters—effect of the amount of amine on the mechanical properties.
Property Source of Variation SS MS F-Test p-Value
Flexuralstrength
Amine amount (8 levels) 2791 465 33.1 1.84 × 10⁻¹¹
Error 394 14
Flexuralmodulus
Amine amount (8 levels) 5.43 × 10⁶ 9.05 × 10⁵ 9.71 8.35 × 10⁻⁶
Error 2.61 × 10⁶ 9.31 × 10⁴
Strain atbreak
Amine amount (8 levels) 5.24 × 10⁻⁴ 8.6 × 10⁻⁵ 5.40 8.18 × 10⁻⁴
Error 4.56 × 10⁻⁴ 1.6 × 10⁻⁵
Table 8. ANOVA parameters—effect of the amount of amine on the mechanical properties, neglectingsamples with commercial epoxy.
Property Source of Variation SS MS F-Test p-Value
Flexuralstrength Amine amount (2 levels) 48.4 48.4 0.699 0.427
Error 553 69.2
Flexuralmodulus Amine amount (2 levels) 4410 4410 0.0678 0.801
Error 5.20 × 10⁵ 6.5 × 10⁴
Strain atbreak Amine amount (2 levels) 0.00001 0.00001 0.274 0.615
Error 0.00029 3.7 × 10⁻⁵
Polymers 2021, 13, 2768 14 of 16
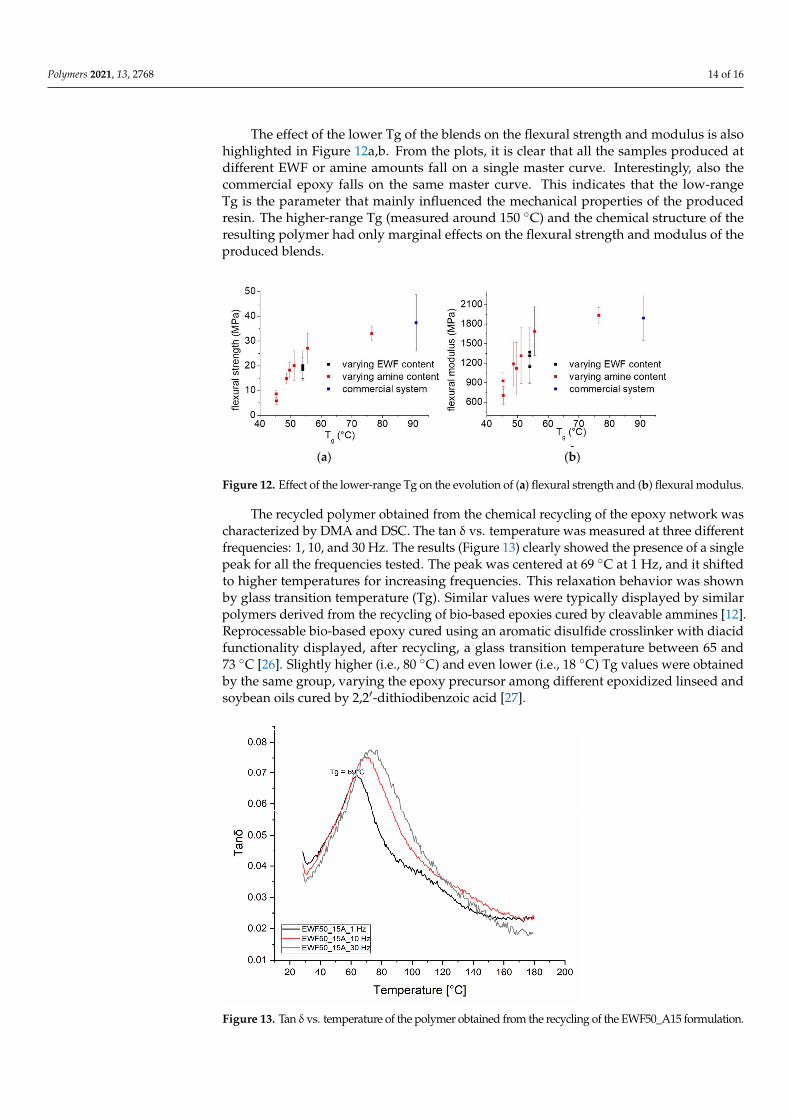
The effect of the lower Tg of the blends on the flexural strength and modulus is alsohighlighted in Figure 12a,b. From the plots, it is clear that all the samples produced atdifferent EWF or amine amounts fall on a single master curve. Interestingly, also thecommercial epoxy falls on the same master curve. This indicates that the low-rangeTg is the parameter that mainly influenced the mechanical properties of the producedresin. The higher-range Tg (measured around 150 ◦C) and the chemical structure of theresulting polymer had only marginal effects on the flexural strength and modulus of theproduced blends.
Polymers 2021, 13, x FOR PEER REVIEW 15 of 18
The effect of the lower Tg of the blends on the flexural strength and modulus is also highlighted in Figure 12a,b. From the plots, it is clear that all the samples produced at different EWF or amine amounts fall on a single master curve. Interestingly, also the com-mercial epoxy falls on the same master curve. This indicates that the low-range Tg is the parameter that mainly influenced the mechanical properties of the produced resin. The higher-range Tg (measured around 150 °C) and the chemical structure of the resulting polymer had only marginal effects on the flexural strength and modulus of the produced blends.
(a) (b)
Figure 12. Effect of the lower-range Tg on the evolution of (a) flexural strength and (b) flexural modulus.
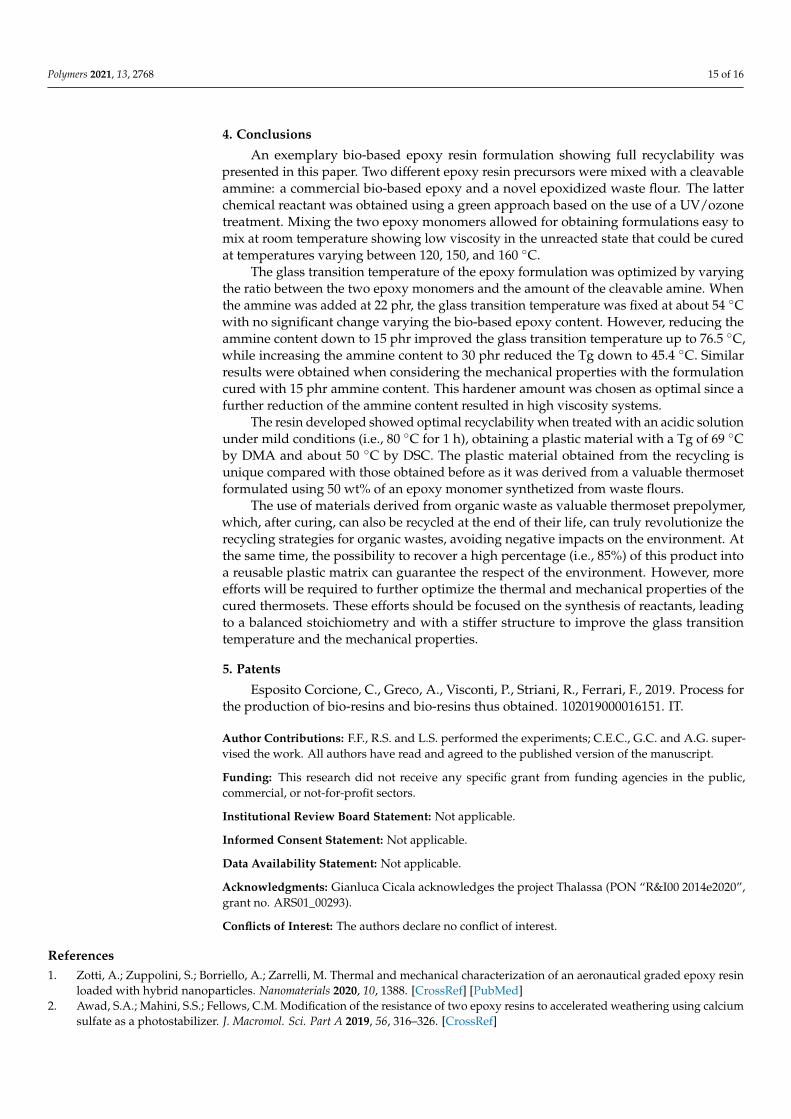
The recycled polymer obtained from the chemical recycling of the epoxy network was characterized by DMA and DSC. The tan δ vs. temperature was measured at three different frequencies: 1, 10, and 30 Hz. The results (Figure 13) clearly showed the presence of a single peak for all the frequencies tested. The peak was centered at 69 °C at 1 Hz, and it shifted to higher temperatures for increasing frequencies. This relaxation behavior was shown by glass transition temperature (Tg). Similar values were typically displayed by similar polymers derived from the recycling of bio-based epoxies cured by cleavable am-mines [12]. Reprocessable bio-based epoxy cured using an aromatic disulfide crosslinker with diacid functionality displayed, after recycling, a glass transition temperature be-tween 65 and 73 °C [26]. Slightly higher (i.e., 80 °C) and even lower (i.e., 18 °C) Tg values were obtained by the same group, varying the epoxy precursor among different epox-idized linseed and soybean oils cured by 2,2′-dithiodibenzoic acid [27].
Figure 12. Effect of the lower-range Tg on the evolution of (a) flexural strength and (b) flexural modulus.
The recycled polymer obtained from the chemical recycling of the epoxy network wascharacterized by DMA and DSC. The tan δ vs. temperature was measured at three differentfrequencies: 1, 10, and 30 Hz. The results (Figure 13) clearly showed the presence of a singlepeak for all the frequencies tested. The peak was centered at 69 ◦C at 1 Hz, and it shiftedto higher temperatures for increasing frequencies. This relaxation behavior was shownby glass transition temperature (Tg). Similar values were typically displayed by similarpolymers derived from the recycling of bio-based epoxies cured by cleavable ammines [12].Reprocessable bio-based epoxy cured using an aromatic disulfide crosslinker with diacidfunctionality displayed, after recycling, a glass transition temperature between 65 and73 ◦C [26]. Slightly higher (i.e., 80 ◦C) and even lower (i.e., 18 ◦C) Tg values were obtainedby the same group, varying the epoxy precursor among different epoxidized linseed andsoybean oils cured by 2,2′-dithiodibenzoic acid [27].
Polymers 2021, 13, x FOR PEER REVIEW 16 of 18
Figure 13. Tan δ vs. temperature of the polymer obtained from the recycling of the EWF50_A15 formulation.
4. Conclusions An exemplary bio-based epoxy resin formulation showing full recyclability was pre-
sented in this paper. Two different epoxy resin precursors were mixed with a cleavable ammine: a commercial bio-based epoxy and a novel epoxidized waste flour. The latter chemical reactant was obtained using a green approach based on the use of a UV/ozone treatment. Mixing the two epoxy monomers allowed for obtaining formulations easy to mix at room temperature showing low viscosity in the unreacted state that could be cured at temperatures varying between 120, 150, and 160 °C.
The glass transition temperature of the epoxy formulation was optimized by varying the ratio between the two epoxy monomers and the amount of the cleavable amine. When the ammine was added at 22 phr, the glass transition temperature was fixed at about 54 °C with no significant change varying the bio-based epoxy content. However, reducing the ammine content down to 15 phr improved the glass transition temperature up to 76.5 °C, while increasing the ammine content to 30 phr reduced the Tg down to 45.4 °C. Similar results were obtained when considering the mechanical properties with the formulation cured with 15 phr ammine content. This hardener amount was chosen as optimal since a further reduction of the ammine content resulted in high viscosity systems.
The resin developed showed optimal recyclability when treated with an acidic solu-tion under mild conditions (i.e., 80 °C for 1 h), obtaining a plastic material with a Tg of 69 °C by DMA and about 50 °C by DSC. The plastic material obtained from the recycling is unique compared with those obtained before as it was derived from a valuable thermoset formulated using 50 wt% of an epoxy monomer synthetized from waste flours.
The use of materials derived from organic waste as valuable thermoset prepolymer, which, after curing, can also be recycled at the end of their life, can truly revolutionize the recycling strategies for organic wastes, avoiding negative impacts on the environment. At the same time, the possibility to recover a high percentage (i.e., 85%) of this product into a reusable plastic matrix can guarantee the respect of the environment. However, more efforts will be required to further optimize the thermal and mechanical properties of the cured thermosets. These efforts should be focused on the synthesis of reactants, leading
Figure 13. Tan δ vs. temperature of the polymer obtained from the recycling of the EWF50_A15 formulation.
Polymers 2021, 13, 2768 15 of 16
4. Conclusions
An exemplary bio-based epoxy resin formulation showing full recyclability waspresented in this paper. Two different epoxy resin precursors were mixed with a cleavableammine: a commercial bio-based epoxy and a novel epoxidized waste flour. The latterchemical reactant was obtained using a green approach based on the use of a UV/ozonetreatment. Mixing the two epoxy monomers allowed for obtaining formulations easy tomix at room temperature showing low viscosity in the unreacted state that could be curedat temperatures varying between 120, 150, and 160 ◦C.
The glass transition temperature of the epoxy formulation was optimized by varyingthe ratio between the two epoxy monomers and the amount of the cleavable amine. Whenthe ammine was added at 22 phr, the glass transition temperature was fixed at about 54 ◦Cwith no significant change varying the bio-based epoxy content. However, reducing theammine content down to 15 phr improved the glass transition temperature up to 76.5 ◦C,while increasing the ammine content to 30 phr reduced the Tg down to 45.4 ◦C. Similarresults were obtained when considering the mechanical properties with the formulationcured with 15 phr ammine content. This hardener amount was chosen as optimal since afurther reduction of the ammine content resulted in high viscosity systems.
The resin developed showed optimal recyclability when treated with an acidic solutionunder mild conditions (i.e., 80 ◦C for 1 h), obtaining a plastic material with a Tg of 69 ◦Cby DMA and about 50 ◦C by DSC. The plastic material obtained from the recycling isunique compared with those obtained before as it was derived from a valuable thermosetformulated using 50 wt% of an epoxy monomer synthetized from waste flours.
The use of materials derived from organic waste as valuable thermoset prepolymer,which, after curing, can also be recycled at the end of their life, can truly revolutionize therecycling strategies for organic wastes, avoiding negative impacts on the environment. Atthe same time, the possibility to recover a high percentage (i.e., 85%) of this product intoa reusable plastic matrix can guarantee the respect of the environment. However, moreefforts will be required to further optimize the thermal and mechanical properties of thecured thermosets. These efforts should be focused on the synthesis of reactants, leadingto a balanced stoichiometry and with a stiffer structure to improve the glass transitiontemperature and the mechanical properties.
5. Patents
Esposito Corcione, C., Greco, A., Visconti, P., Striani, R., Ferrari, F., 2019. Process forthe production of bio-resins and bio-resins thus obtained. 102019000016151. IT.
Author Contributions: F.F., R.S. and L.S. performed the experiments; C.E.C., G.C. and A.G. super-vised the work. All authors have read and agreed to the published version of the manuscript.
Funding: This research did not receive any specific grant from funding agencies in the public,commercial, or not-for-profit sectors.
Institutional Review Board Statement: Not applicable.
Informed Consent Statement: Not applicable.
Data Availability Statement: Not applicable.
Acknowledgments: Gianluca Cicala acknowledges the project Thalassa (PON “R&I00 2014e2020”,grant no. ARS01_00293).
Conflicts of Interest: The authors declare no conflict of interest.
References1. Zotti, A.; Zuppolini, S.; Borriello, A.; Zarrelli, M. Thermal and mechanical characterization of an aeronautical graded epoxy resin
loaded with hybrid nanoparticles. Nanomaterials 2020, 10, 1388. [CrossRef] [PubMed]2. Awad, S.A.; Mahini, S.S.; Fellows, C.M. Modification of the resistance of two epoxy resins to accelerated weathering using calcium
sulfate as a photostabilizer. J. Macromol. Sci. Part A 2019, 56, 316–326. [CrossRef]

Polymers 2021, 13, 2768 16 of 16
3. La Rosa, A.D.; Cicala, G. Handbook of Life Cycle Assessment (LCA) of Textiles and Clothing; Woodhead Publishing Series in Textiles;Muthu, S.S., Ed.; Woodhead Publishing: Sawston, UK, 2015; pp. 301–323. ISBN 9780081001691.
4. Rybicka, J.; Tiwari, A.; Leeke, G.A. Technology readiness level assessment of composites recycling technologies. J. Clean. Prod.2016, 112, 1001–1012. [CrossRef]
5. Giorgini, L.; Benelli, T.; Brancolini, G.; Mazzocchetti, L. Recycling of carbon fiber reinforced composites waste to close their LifeCycle in a Cradle-to-Cradle approach. Curr. Opin. Green Sustain. Chem. 2020, 26, 100368. [CrossRef]
6. Zhang, J.; Chevali, V.S.; Wang, H.; Wang, C.H. Current status of carbon fibre and carbon fibre composites recycling. Compos. PartB Eng. 2020, 193, 108053. [CrossRef]
7. Pimenta, S.; Pinho, S.T. Recycling carbon fibre reinforced polymers for structural applications: Technology review and marketoutlook. Waste Manag. 2011, 31, 378–392. [CrossRef]
8. Li, J.; Xu, P.-L.; Zhu, Y.-K.; Ding, J.-P.; Xue, L.-X.; Wang, Y.-Z. A promising strategy for chemical recycling of carbon fiber/thermosetcomposites: Self-accelerating decomposition in a mild oxidative system. Green Chem. 2012, 3260–3263. [CrossRef]
9. Wang, Y.; Cui, X.; Ge, H.; Yang, Y.; Wang, Y.; Zhang, C.; Li, J.; Deng, T.; Qin, Z.; Hou, X. Chemical Recycling of Carbon FiberReinforced Epoxy Resin Composites via Selective Cleavage of the Carbon–Nitrogen Bond. ACS Sustain. Chem. Eng. 2015, 3,3332–3337. [CrossRef]
10. Cicala, G.; La Rosa, A.D.; Latteri, A.; Banatao, R.; Pastine, S. The use of recyclable epoxy and hybrid lay up for biocomposites:Technical and LCA evaluation. In Proceedings of the CAMX 2016—Composites and Advanced Materials Expo, Anaheim, CA,USA, 26–29 September 2016.
11. Cicala, G.; Mannino, S.; La Rosa, A.D.; Banatao, D.R.; Pastine, S.J.; Kosinski, S.T.; Scarpa, F. Hybrid biobased recyclable epoxycomposites for mass production. Polym. Compos. 2017. [CrossRef]
12. Cicala, G.; Pergolizzi, E.; Piscopo, F.; Carbone, D.; Recca, G. Hybrid composites manufactured by resin infusion with a fullyrecyclable bioepoxy resin. Compos. Part B Eng. 2018, 132, 69–76. [CrossRef]
13. Daniela, A.; Rosa, L.; Greco, S.; Tosto, C.; Cicala, G. LCA and LCC of a chemical recycling process of waste CF-thermosetcomposites for the production of novel CF-thermoplastic composites. Open loop and closed loop scenarios. J. Clean. Prod. 2021,304, 127158.
14. Tan, S.G.; Chow, W.S. Biobased epoxidized vegetable oils and its greener epoxy blends: A review. Polym.-Plast. Technol. Eng. 2010,49, 1581–1590. [CrossRef]
15. Ma, S.; Liu, X.; Jiang, Y.; Tang, Z.; Zhang, C.; Zhu, J. Bio-based epoxy resin from itaconic acid and its thermosets cured withanhydride and comonomers. Green Chem. 2013, 15, 245–254. [CrossRef]
16. Aouf, C.; Nouailhas, H.; Fache, M.; Caillol, S.; Boutevin, B.; Fulcrand, H. Multi-functionalization of gallic acid. Synthesis of anovel bio-based epoxy resin. Eur. Polym. J. 2013, 49, 1185–1195. [CrossRef]
17. Llevot, A.; Grau, E.; Carlotti, S.; Grelier, S.; Cramail, H. From Lignin-derived Aromatic Compounds to Novel Biobased Polymers.Macromol. Rapid Commun. 2016, 37, 9–28. [CrossRef] [PubMed]
18. Esposito Corcione, C.; Ferrari, F.; Striani, R.; Visconti, P.; Greco, A. Recycling of organic fraction of municipal solid waste as aninnovative precursor for the production of bio-based epoxy monomers. Waste Manag. 2020, 109, 212–221. [CrossRef]
19. Ferrari, F.; Striani, R.; Minosi, S.; de Fazio, R.; Visconti, P.; Patrono, L.; Catarinucci, L.; Esposito Corcione, C.; Greco, A. Aninnovative IoT-oriented prototype platform for the management and valorization of the organic fraction of municipal solid waste.J. Clean. Prod. 2020, 247, 119618. [CrossRef]
20. Esposito Corcione, C.; Greco, A.; Visconti, P.; Striani, R.; Ferrari, F. Process for the Production of Bio-Resins and Bio-Resins thusObtained. IT 102019000016151, 2019.
21. La Rosa, A.D.; Banatao, D.R.; Pastine, S.J.; Latteri, A.; Cicala, G. Recycling treatment of carbon fibre/epoxy composites: Materialsrecovery and characterization and environmental impacts through life cycle assessment. Compos. Part B Eng. 2016, 104, 17–25.[CrossRef]
22. Pastine, S.J. Sterically Hindered Aliphatic Polyamine Cross-Linking Agents, Compositions Containing and Uses Thereof. U.S.Patent 9,862,797, 9 January 2018.
23. Mahlin, D.; Wood, J.; Hawkins, N.; Mahey, J.; Royall, P.G. A novel powder sample holder for the determination of glass transitiontemperatures by DMA. Int. J. Pharm. 2009, 371, 120–125. [CrossRef] [PubMed]
24. Cicala, G.; Mamo, A.; Recca, G.; Restuccia, C.L. Synthesis and thermal characterization of some novel ABA block copolymers.Macromol. Mater. Eng. 2007, 292, 588–597. [CrossRef]
25. Carlier, V.; Sclavons, M.; Legras, R. Supported dynamic mechanical thermal analysis: An easy, powerful and very sensitivetechnique to assess thermal properties of polymer, coating and even nanocoating. Polymer (Guildf.) 2001, 42, 5327–5335. [CrossRef]
26. Di Mauro, C.; Genua, A.; Rymarczyk, M.; Dobbels, C.; Malburet, S.; Graillot, A.; Mija, A. Chemical and mechanical reprocessedresins and bio-composites based on five epoxidized vegetable oils thermosets reinforced with flax fibers or PLA woven. Compos.Sci. Technol. 2021, 205, 108678. [CrossRef]
27. Di Mauro, C.; Malburet, S.; Graillot, A.; Mija, A. Recyclable, Repairable, and Reshapable (3R) Thermoset Materials with ShapeMemory Properties from Bio-Based Epoxidized Vegetable Oils. ACS Appl. Bio Mater. 2020, 3, 8094–8104. [CrossRef]