Full Scale Wave Overtopping Measurements on the ... - Lirias
39
* Corresponding author Troch et al., version submitted for Coastal Engineering 1 Full Scale Wave Overtopping Measurements on the Zeebrugge Rubble Mound Breakwater Troch Peter* 1 , Geeraerts Jimmy 1 , Van de Walle Bjorn 1 , De Rouck Julien 1 , Van Damme Luc², Allsop William³, Franco Leopoldo 4 1 Ghent University, Department of Civil Engineering, Technologiepark 904, 9052 Ghent, Belgium. Tel.: +32 9 264 54 89; Fax: +32 9 264 58 37. Email: [email protected] , [email protected] , [email protected] , [email protected] . ² Ministry of the Flemish Community, Coastal Division, Vrijhavenstraat 3, 8400 Oostende, Belgium. Tel.: +32 59 55 42 11; Fax: +32 59 55 42 41. Email: [email protected] . ³ Hydraulic Research Wallingford, Coastal Structures Group, Howbery Park, OX10 8BA Wallingford, United Kingdom. Tel.: +44 149 182 22 30; Fax: +44 149 182 55 39. Email: [email protected] . 4 Modimar Srl., Via Monte Zebio 40, 00195 Roma, Italy. Tel.: +39 06 32 69 46 23; Fax: +39 06 32 69 46 29. Email: [email protected] . Abstract Field measurements of wave overtopping over a rubble mound breakwater have been carried out at Zeebrugge, Belgium, during the period 1999-2003. The overtopping volumes of water are collected in an overtopping tank located on the breakwater crest behind the access road. A short side of the tank is made of a weir allowing the collected water to flow out continuously, and allowing measurements to be made for long duration. Calculation of the inflow discharge is based on the outflow discharge over the weir and the volume in the tank. This calculation requires an accurate measurement of the water depth inside the tank. The water depth is measured indirectly using a pressure sensor near the bottom. The measurement set-up for wave overtopping at the breakwater is described in detail. Eight wave records with wave propagation normal to the breakwater have been used in the analysis of the field data. Wave heights range between 2.6 m and 3.9 m for wave records with a typical duration of 1 to 2
-
Upload
khangminh22 -
Category
Documents
-
view
1 -
download
0
Transcript of Full Scale Wave Overtopping Measurements on the ... - Lirias

* Corresponding author Troch et al., version submitted for Coastal Engineering 1
Full Scale Wave Overtopping Measurements
on the Zeebrugge Rubble Mound Breakwater
Troch Peter*1, Geeraerts Jimmy
1, Van de Walle Bjorn
1, De Rouck Julien
1,
Van Damme Luc², Allsop William³, Franco Leopoldo4
1 Ghent University, Department of Civil Engineering, Technologiepark 904, 9052 Ghent, Belgium. Tel.: +32 9
264 54 89; Fax: +32 9 264 58 37. Email: [email protected], [email protected],
[email protected], [email protected].
² Ministry of the Flemish Community, Coastal Division, Vrijhavenstraat 3, 8400 Oostende, Belgium. Tel.: +32
59 55 42 11; Fax: +32 59 55 42 41. Email: [email protected].
³ Hydraulic Research Wallingford, Coastal Structures Group, Howbery Park, OX10 8BA Wallingford, United
Kingdom. Tel.: +44 149 182 22 30; Fax: +44 149 182 55 39. Email: [email protected].
4 Modimar Srl., Via Monte Zebio 40, 00195 Roma, Italy. Tel.: +39 06 32 69 46 23; Fax: +39 06 32 69 46 29.
Email: [email protected].
Abstract
Field measurements of wave overtopping over a rubble mound breakwater have been carried
out at Zeebrugge, Belgium, during the period 1999-2003. The overtopping volumes of water
are collected in an overtopping tank located on the breakwater crest behind the access road. A
short side of the tank is made of a weir allowing the collected water to flow out continuously,
and allowing measurements to be made for long duration. Calculation of the inflow discharge
is based on the outflow discharge over the weir and the volume in the tank. This calculation
requires an accurate measurement of the water depth inside the tank. The water depth is
measured indirectly using a pressure sensor near the bottom. The measurement set-up for
wave overtopping at the breakwater is described in detail. Eight wave records with wave
propagation normal to the breakwater have been used in the analysis of the field data. Wave
heights range between 2.6 m and 3.9 m for wave records with a typical duration of 1 to 2

Troch et al., version submitted for Coastal Engineering 2
hours. The average overtopping rate has been calculated for all records using 3 methods.
Average overtopping rates from the field data have been compared with predicted values from
prediction formulae by van der Meer et al. [van der Meer, J.W., Tönjes, P., de Waal, H., 1998.
A code for dike height design and examination, Proceedings International Conference on
Coastlines, Structures and Breakwaters, Institution of Civil Engineers, London, Thomas
Telford, London, pp. 5 - 19], Owen [Owen, M.W., 1980. Design of seawalls allowing for
wave overtopping. Hydraulics Research, Wallingford, Report No. EX 924, UK] and Besley
[Besley, P., 1999. Wave overtopping of Seawalls. Design and Assessment Manual.
Hydraulics Research Wallingford. R&D Technical Report W178, ISBN 1 85705 069 X].
Three crest freeboard values have been used in the analysis, corresponding to the maximum
and minimum crest levels and the average crest level in between as the best approximation of
the actual crest level for the specific breakwater crest geometry. The calculated reduction
factor for surface roughness used in the formulae is 0.51. Best agreement is observed for van
der Meer et al.’s (1998) and Besley’s (1999) prediction using the actual average crest level. In
this case, measured average overtopping rates are within the 95 % confidence intervals of
these prediction formulae.
Keywords: wave overtopping; field data; rubble mound breakwater, surface roughness, crest
freeboard

Troch et al., version submitted for Coastal Engineering 3
1 Introduction
A significant portion of today’s population lives in coastal zones as development and
recreational activities in these areas increase continuously. Coastal structures are commonly
built to protect these coastal zones against storm surge and storms that generate large waves.
A combination of storm surge and large waves may cause overtopping of such structures (like
breakwaters, dikes, seawalls, etc…) leading to damage to and flooding of the area behind the
structure. In this respect, the crest elevation of a coastal structure is an important design
parameter as it is directly related to the amount of wave overtopping. Increasing storm
intensity (Carter & Draper, 1988), and increasing relative mean sea level rise due to the
greenhouse effect or lowering in the land level (National Research Council, 1987, Führböter,
1990, ASCE Task Committee, 1992), are two trends that attract the attention even more on
the determination of the crest level of coastal structures, both during design of new structures
and during evaluation of existing structures.
In the design of the crest elevation of a seawall or breakwater, usually a tolerable wave
overtopping rate is applied (Owen, 1980, Goda, 1985, van der Meer, 1994). For many cases it
is sufficient to use the average overtopping rate, or mean discharge, q , expressed as a
discharge per meter structure (m³/s per m), and averaged over the duration 0T of the storm.
Dependent on the function of the structure, different criteria (safety for pedestrians, or damage
to the structure itself or buildings behind it) are used and critical values of q for each of these
criteria have been presented in literature. Those critical values are regarded as rough
approximations, and are still susceptible to improvements. A recent version of tabulated q
values is available e.g. in CEM (2003), and more complete discussions on safety levels for
people are presented by Allsop et al. (2003).

Troch et al., version submitted for Coastal Engineering 4
The prediction of the average overtopping rate for a particular structure geometry, water level,
and wave conditions is based on empirical formulae, fitted to hydraulic model test results.
Goda et al. (1975) presented design diagrams for estimation of the overtopping rate of vertical
revetments and block mound seawalls based on results from small scale model tests.
Takayama et al. (1982) derived an empirical formula from Goda’s design diagrams to predict
the average overtopping rate. Franco & Franco (1999) presented prediction formulae for
overtopping at various types of vertical breakwaters based on extensive 2D and 3D model test
results. For the case of sloping structures, the most widely used empirical formulas to predict
wave overtopping have been published by Owen (1980, 1982) for smooth and rough
impermeable slopes, by Bradbury& Allsop (1988) for rock armoured impermeable slopes
with a crown wall, by Aminti & Franco (1988) for rubble mound breakwaters with a crown
wall and by van der Meer et al. (1998) for smooth and rough impermeable slopes. Each of
these studies make use of a dimensionless crest freeboard parameter which is related to a
dimensionless overtopping parameter. The most complete summary of empirical overtopping
prediction methods is presented by Besley (1999).
Field observations with reported analysis of field data on wave overtopping have been rarely
obtained so far. For the case of seawalls and vertical breakwaters, a number of field studies
have been reported. Fukuda et al. (1974) reported successful measurements of the average
overtopping rates for the case of a seawall covered by 16 ton Tetrapod armour units at Port of
Fukui, Japan, 1971 - 1972. Sakakiyama et al. (1997) carried out additional field
measurements at the same location in 1996, and obtained time series of average overtopping
rates based on storm durations of 2 hours. Comparison of these field data with Takayama et
al.’s (1982) formula showed reasonable agreement according to the authors. Herbert (1996)
measured overtopping at a vertical seawall and at a rather smooth revetment and obtained

Troch et al., version submitted for Coastal Engineering 5
average overtopping rates based on 100 wave sequences. Kimura et al. (1999) commented on
hazards resulting from wave overtopping based on field observations, but did not measure
overtopping volumes.
For the case of sloping rubble mound breakwaters, the authors are not aware of any full scale
overtopping measurements reported in literature. Within the research project CLASH (Crest
Level Assessment of coastal Structures by full scale monitoring, neural network prediction
and Hazard analysis on permissible wave overtopping, 2002-2004, funded by the European
Commission) field measurements on wave overtopping are carried out at three different
locations in Europe: a vertical seawall with rubble mound toe protection at Samphire Hoe,
United Kingdom (Pullen et al., 2003), a rock armoured rubble mound breakwater in shallow
water at Ostia, Italy (Franco et al., 2003) and a rubble mound breakwater armoured with
grooved (Antifer) cubes at Zeebrugge, Belgium.
The objective of the present paper is to describe full scale measurements of wave overtopping
carried out at Zeebrugge rubble mound breakwater during the period 1999 - 2003. First the
measurement site and the specific set-up used for wave overtopping measurements is
described in section 2. Section 3 describes the analysis of the field wave overtopping data and
discusses methods to derive average overtopping rates. Average overtopping rates from the
field data have been compared with predicted values obtained from widely used prediction
formulae available in literature (section 4). Finally conclusions are drawn in section 5.

Troch et al., version submitted for Coastal Engineering 6
2 Full scale set-up and instrumentation for overtopping measurement
2.1 The Zeebrugge breakwater field site
The Zeebrugge breakwater has been used for more than a decade for full scale measurements
of wave interaction with a breakwater. A prototype monitoring system for acquisition of wave
characteristics and induced structural response, has been developed since the early nineties.
Troch et al. (1998) describes the monitoring system, instrumentation and data-acquisition.
The breakwater has been instrumented to measure wave induced pore pressures inside the
breakwater core (Troch, 2000), and wave run-up on the breakwater slope (Van de Walle,
2003). More recently the breakwater has been instrumented to capture and measure wave
overtopping volumes at full scale. In this paper the wave overtopping over the breakwater
crest is analysed.
The Zeebrugge breakwater is a conventional rubble mound breakwater with a relatively low-
crested superstructure. The armour layer is made of grooved (Antifer) concrete cubes (25 ton).
The breakwater core consists of quarry run (2-300 kg). The filter layer is composed of rock
(1-3 ton). An access road behind the wave wall allows access along the breakwater. Design
conditions for the breakwater are: return period pR = 1:500 years, significant wave height
sH = 6.20 m, maximum peak period pT = 9.0 s and still water level SWL = Z + 6.75 (Z +
0.00 is chart datum). A tide cycle lasts for 12 hours and 24 minutes, the tidal range varies
between Z + 4.62 (MHWS) and Z + 0.32 (MLWS).
The cross section of the Zeebrugge breakwater at the location of the wave overtopping tank is
shown in Fig. 1. The actual slope of the armour layer in this section has been determined as 1
: 1.4, and deviating slightly from the design slope 1 : 1.5. The design crest level of the two-

Troch et al., version submitted for Coastal Engineering 7
layer armour layer is Z + 12.40, the top of the crest crown wall is at Z + 10.20, the access road
level is Z + 8.0.
2.2 Wave overtopping measurements
2.2.1 The overtopping tank
An overtopping tank, placed behind the access road (Fig. 2), collects water volumes
overtopping the crest of the breakwater. This location in Fig. 3 was required in order not to
obstruct the traffic on the access road. The section used for construction of the overtopping
tank is located 140 m away from the section with the instrumented jetty, where wave
characteristics are measured. The reclamation fill behind the breakwater at the section with
the instrumented jetty, did not allow space for the tank. The overtopping tank itself is a closed
concrete box, with dimensions 7.40 m x 2.0 m x 2.0 m (length x width x height), Fig. 2. The
tank is open at the top allowing the overtopping water to flow in, and has a weir in a short
side allowing the collected water to flow out of the tank. The inflow discharge in the tank is
denoted inQ , the outflow discharge over the weir is denoted outQ .
2.2.2 Measurement of inflow discharge using the weir
In order to obtain average overtopping rates, the instantaneous inflow discharge in the tank
)t(Qin has to be determined. The weir allows the water to flow out of the tank continuously,
as the tank empties itself. Continuous measurements of the volume in the tank allow
overtopping measurements to be made for long duration. The V-shaped weir controls the
outflow discharge )t(Qout , calculated from the water depth )t(h in front of the weir, defined
as the vertical distance between the bottom opening of the weir and the free water surface

Troch et al., version submitted for Coastal Engineering 8
inside the tank. Applying continuity to the tank, the net mass inflow inside the tank is equal to
the time rate of increase of mass inside the tank:
dt
dhA)t(Q)t(Q outin =− (1)
where 80.14A = m2 is the horizontal tank surface area. By measuring )t(h continuously
inside the tank and calculating )t(Qout over the weir, the instantaneous inflow discharge
)t(Qin is calculated using eq. (1). The calculation method is described in section 3.
Overtopping discharges from wind-generated waves are unevenly distributed in space and
time because the waves are short-crested and the volume per wave varies considerably in
time. In order to have a representative calculation of the discharge per meter crest width, the
length of the tank is increased to 7.40 m. As the volumes per wave that enter the overtopping
tank vary substantially, the weir has to be able to measure both small and large discharges, so
a two-stage weir is used (Fig. 4). The lower part has a very narrow V-shape (width of top
opening 0.04 m, height of lower part 0.40 m) for slow evacuation of the small volumes to
have sufficient measurement accuracy for small discharges. The upper part of the weir has a
top opening of 0.75 m and is 1.35 m high, allowing large outflow volumes (up to 1 m3/s when
the tank is completely filled).
For water depths h smaller than 0.40 m, the active lower part of the weir is a triangular
Thompson weir. In this case, the outflow discharge 40.0houtQ < is proportional to 2
5
h (Vardy,
1990):

Troch et al., version submitted for Coastal Engineering 9
25
hcQ 140.0h
out =< (2)
For water depths h larger than 0.40 m, the weir acts as a compound weir and the relation
between the outflow discharge 40.0houtQ > and the water depth h is composed of the
contributions from a triangular Thompson weir, and a trapezoidal weir (Vardy, 1990):
2
3
2
5
hchcQ 3240.0h
out +=> (3)
Calibration of the weir in the laboratory was carried out by measuring the outflow discharges
for given water depths. The lower part has been calibrated on a scale 1 in 1, the compound
weir on a scale 1 in 2. Using least square fitting of equations (2) and (3) to the calibration
data, the following coefficients have been obtained: 0805.0c1 = , 1691.0c2 −= and
3533.0c3 = .
2.2.3 Determination of the water depth inside the tank
Measuring the water depth in the overtopping tank is critical for accurate overtopping
measurements, as the water depth information is required in both terms of the continuity
equation (1). However, due to the non-stationary conditions inside the tank caused by inflow
of overtopping waves and the wind, the water is sloshing continuously. The idea to place
baffles or porous wave absorbers inside the tank seemed unfeasible. Instead, a spatially
averaged measurement of the water depth is carried out. The water depth in the overtopping
tank is measured indirectly by pressure sensors near the bottom of the tank. A set of 5 plastic
rigid tubes with the same length and diameter is mounted to the bottom. The tubes are open to
the water on one end, and are connected to a closed steel tube on the other end. The open ends
Troch et al., version submitted for Coastal Engineering 10
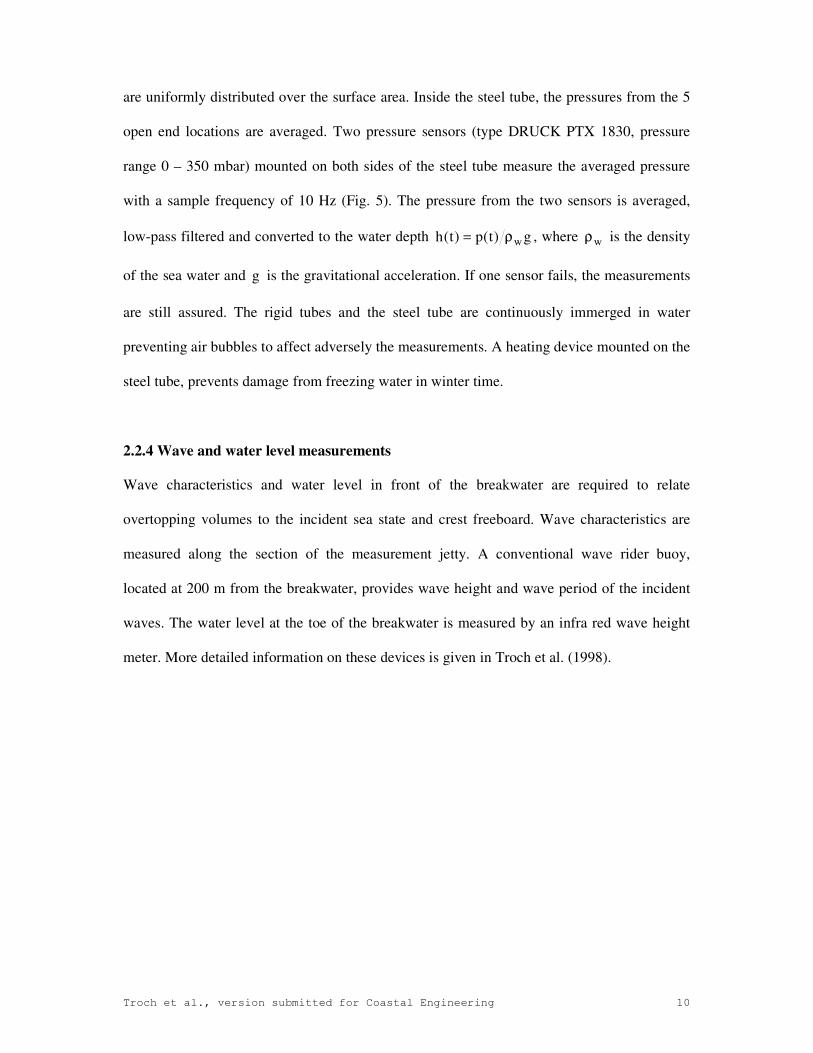
are uniformly distributed over the surface area. Inside the steel tube, the pressures from the 5
open end locations are averaged. Two pressure sensors (type DRUCK PTX 1830, pressure
range 0 – 350 mbar) mounted on both sides of the steel tube measure the averaged pressure
with a sample frequency of 10 Hz (Fig. 5). The pressure from the two sensors is averaged,
low-pass filtered and converted to the water depth g)t(p)t(h wρ= , where wρ is the density
of the sea water and g is the gravitational acceleration. If one sensor fails, the measurements
are still assured. The rigid tubes and the steel tube are continuously immerged in water
preventing air bubbles to affect adversely the measurements. A heating device mounted on the
steel tube, prevents damage from freezing water in winter time.
2.2.4 Wave and water level measurements
Wave characteristics and water level in front of the breakwater are required to relate
overtopping volumes to the incident sea state and crest freeboard. Wave characteristics are
measured along the section of the measurement jetty. A conventional wave rider buoy,
located at 200 m from the breakwater, provides wave height and wave period of the incident
waves. The water level at the toe of the breakwater is measured by an infra red wave height
meter. More detailed information on these devices is given in Troch et al. (1998).

Troch et al., version submitted for Coastal Engineering 11
3 Field data for wave overtopping
3.1 Data sets
Wave overtopping measurements have been carried out on the Zeebrugge breakwater using
the test set-up presented previously since 1999. Up to now, six storms with waves from
North-West (normal to the breakwater section at the overtopping tank) have been measured.
Cases with oblique wave attack are not considered in this paper. Summary of the storms,
including date and duration of the wave records used in the analysis, is given in Table 1.
Incident wave characteristics (significant wave heights 0mH from frequency domain analysis
and sH from time domain analysis, peak wave period pT and mean wave period mT ), the
surf similarity parameter 0,1m−ξ and the water level (SWL) are listed for all storms in Table 2.
Wave characteristics are calculated from the waverider buoy in front of the breakwater. The
water level is the mean value of the surface elevations at the toe of the breakwater measured
using the IR-meter. The surf similarity parameter or breaker parameter 0,1m−ξ is defined as:
20,1m
0m0,1m
gT
H2
tan
−
−π
α=ξ (4)
where 0mH is the significant wave height, α is the breakwater slope angle and 0,1mT − is the
wave period based on the zeroth and first negative spectral moments: 010,1m mmT −− = .
Analysis of wave overtopping in full scale conditions is carried out for sections of wave
records with reasonably constant sea state parameters and water level. The duration of the
storm wave (and overtopping) records chosen was 2 hours around high water for storms 1, 2,

Troch et al., version submitted for Coastal Engineering 12
3, 4 and 6, when the water level in front of the breakwater and the sea state parameters were
assumed constant. Storm 5 was measured during a rising tide, and the water level was
assumed constant over 1 hour only. Therefore, storm 5 is divided into three shorter parts 5a,
5b and 5c for further analysis.
The water level in the 6 storms (or the 8 wave records) ranges between Z + 4.24 (storm 4) and
Z + 5.28 (storm 1), yielding water depths between 13 m and 14 m at the waverider buoy
respectively. The significant wave height 0mH ranges between 2.60 m (storm 2) and 3.86 m
(storm 5b), and the peak wave period pT between 7.34 s (storm 1) and 10.28 s (storm3).
3.2 Example results
As a typical example, Fig. 6 shows the available field data of wave conditions and wave
overtopping, for storm no. 3. Fig. 6.a presents the incident wave field )t(η using surface
elevations measured from the waverider buoy during 2 hours, from where 0mH = 3.47 m and
0,1mT − = 8.41 s are calculated. Water levels from the IR-meter are shown in Fig. 6.b, from
where the mean value is calculated as SWL = Z + 5.01. Finally, Fig. 6.c presents the time
series (during the total duration of the storm) of the measured water depth )t(h inside the
wave overtopping tank. This time series exhibits a typical saw tooth pattern, with a steep
sudden increase in water depth during an overtopping event when water enters the
overtopping tank. The water depth decreases gradually by outflow of the water over the weir
when there is no wave overtopping. The water depth )t(h will be used to derive average
overtopping rates.

Troch et al., version submitted for Coastal Engineering 13
3.3 Methods for calculation of overtopping discharges
3.3.1 Method 1, using the continuity equation
Fig 7.a (repeated from Fig. 6.c) shows the instantaneous water depth )t(h for storm 3. The
instantaneous inflow discharge )t(Q in , Fig. 7.c, is calculated using the continuity equation,
eq. (1). The terms outQ and dt
dhA , Fig. 7.b, are derived from the instantaneous water depth
h(t) inside the overtopping tank. The peaks in the function dt
dhA occur during wave
overtopping events when water enters the tank, and therefore these peaks are visual detectors
of the number of overtopping waves. The average overtopping rate q , per unit crest width,
from here on referred to as ceqq , is finally calculated from )t(Qin , using:
∫=0T
0
in0
ceq dt)t(QT
1
b
1q (5)
where b = 7.40 m is the tank width parallel to the crest, and 0T is the duration of the
analysed wave record cf. Table 1. Fig. 8 shows the time series for storm 5b, similar to Fig. 7
for storm 3, as a second example.
3.3.2 Method 2, using individual overtopping volumes
A modified calculation of the average overtopping rate q is using the peaks of the overtopping
events only from the function )t(Qin and is neglecting the scatter around zero which may
affect adversely the time-averaged overtopping rate ceqq . For a single overtopping event, the

Troch et al., version submitted for Coastal Engineering 14
individual volume iV (per m crest width) of the overtopping wave with number i is calculated
from (Fig. 9):
∫=1
0
t
t
ini dt)t(Qb
1V (6)
where 0t and 1t denote the start and end time of the single overtopping event (typically
60tt 01 ≈− s). The average overtopping rate Viq using this second method is calculated
using:
∑=
=ovN
1i
i0
Vi VT
1q (7)
where ovN is the number of overtopping events during the storm with duration 0T .
3.3.3 Method 3, using water depth jumps
The previous two methods depend on the accuracy of )t(Qout . A third simplified method uses
the water depth )t(h directly to calculate the increase in volume inside the tank. The positive
jumps ih∆ in the water depth signal )t(h are added as individual volumes contributing to the
total volume V inside the tank:
∑∑==
∆+∆=ovov N
1i
i
N
1i
i VhAV (8)

Troch et al., version submitted for Coastal Engineering 15
During a single overtopping event water is already flowing over the weir out of the tank, and
a correction iV∆ has been added :
∫=∆1
0
t
t
outi dt)t(QV (9)
The average overtopping rate hq∆ calculated using this third method is:
VT
1
b
1q
0h =∆ (10)
3.4 Average overtopping rates
The average overtopping rate q has been calculated for all 8 wave records, using the 3
methods described above. The results in Table 3 show average overtopping rates ceqq , Viq
and hq∆ calculated using the method based on the continuity equation; the method based on
the individual overtopping volumes; and the method based on the water depth jumps,
respectively. Table 3 also shows the number of overtopping events ovN , equal to the number
of peaks (with threshold 0.002 m³/s) in the )t(Qin signal with duration 0T . Average
overtopping rates from Table 3 are presented in Fig. 10, and suggest a number of
observations. Storms 1, 2, 4 and 6 have overtopping rates <q 0.1 l/sm, showing very little
wave overtopping during these storms. Storms 3, 5a, 5b and 5c have overtopping rates
between q = 0.3 l/sm (for storm 3) and q = 0.9 l/sm (for storm 5b), indicating more severe
wave overtopping. Storms with small overtopping rates have a smaller number of overtopping

Troch et al., version submitted for Coastal Engineering 16
events ovN ( 10≤ ), whereas the storms with larger overtopping rates have a larger ovN (20
to 30).
In general, the average overtopping rate ceqq , calculated using the first method based on the
continuity equation, is smaller than the two other overtopping rates Viq and hq∆ (except for
storm 2). On average for the storms 1, 2, 4 and 6 with small overtopping rates the deviation
between ceqq and Viq is 28 %, and for storms 3 and 5 with large overtopping rates the
deviation is 19 %. The deviation between ceqq and hq∆ is 17 % and 9 % for the storms with
small overtopping rates and large overtopping rates respectively. In general, Viq is larger
than hq∆ (except storm 3). The deviation between Viq and hq∆ is 16 % and 14 % for the
storms with small overtopping rates and large overtopping rates respectively. From these
observations, the following relationship is obtained:
Vihceq qqq << ∆ (11)
with
Viceq q76.0q ≈ (12)
and
Vih q88.0q ≈∆ (13)

Troch et al., version submitted for Coastal Engineering 17
4 Comparison of field data with empirical formulae
4.1 Empirical formulae from literature
As mentioned in section 1, several empirical formulae for the prediction of wave overtopping
have been derived, in most cases based on small scale model results. The field data on wave
overtopping at the Zeebrugge rubble mound breakwater will be compared to two existing
prediction formulae from literature. The comparison is discussed in the next section 4.2. First
the empirical formulae, applicable for the Zeebrugge breakwater, are given in this section.
The formulae presented by Owen (1980) and van der Meer et al. (1998) are well-known and
widely used for breakwater crest level design. These formulae originally are based on
extensive datasets from model tests with smooth impermeable sloping structures. By applying
a reduction factor for the slope roughness, the formulae are applicable to rock slopes. These
two formulae will be used here for comparison with the field data, and are presented hereafter.
Bradbury et al. (1988) and Aminti and Franco (1988) present empirical formulae based on
model tests with rubble mound breakwaters with a crown wall and are therefore more
restricted, consequently these will not be used here.
The wave overtopping formula presented in van der Meer et al. (1998) is:
γγγγξ−ξγ
α=
β vfbp,00m
cv0b
v
30m
1
H
Rbexp
tan
a
gH
q (14.a)
with a maximum of:

Troch et al., version submitted for Coastal Engineering 18
γγ−=
βf0m
c
30m
1
H
R6.2exp2.0
gH
q (14.b)
where cR is the crest freeboard, defined as the vertical distance between SWL and crest level
of the breakwater. The coefficients 06.0a v = and 2.5bv = are mean values based on the
average of all test data. Reduction factors bγ , fγ , βγ and vγ include effects of a berm,
surface roughness, oblique wave attack, and a vertical wall on top of the slope, respectively.
The breaker parameter p,0ξ used by van der Meer et al. (1998) is calculated using the peak
wave period pT :
2p
0mp,0
gT
H2
tan
π
α=ξ (15)
The Dutch guideline on wave run-up and overtopping on dikes (TAW, 2002) suggests to
replace pT by 0,1mT − (in eq. 15, resulting in eq. 4) at the toe of the structure to account for the
effects of double-peaked wave spectra related to wave transformation and breaking in shallow
foreshores (based on results presented by Van Gent, 2001). In this case, the values for the
coefficients in eq. (14.a) are replaced by 067.0a v = and 75.4bv = .
The wave overtopping formula by Owen (1980) reads:
γ−=
rsm
coo
ms
1
gHT
Rbexpa
TgH
q (16)

Troch et al., version submitted for Coastal Engineering 19
where oa and ob are dimensionless empirically derived coefficients, whose values depend on
the breakwater slope, and rγ is a surface roughness reduction factor.
4.2 Comparison of the Zeebrugge field data with empirical formulae
4.2.1 Crest freeboard for Zeebrugge breakwater
Both empirical formulae, eq. (14) and eq. (16), include the crest freeboard parameter cR ,
defined as the vertical distance between SWL and crest level. For the actual Zeebrugge
breakwater case the crest level of the breakwater is not straightforward, and has to be defined
here. Fig. 11 shows the geometry of the breakwater crest at the location of the overtopping
tank. The photo is taken from the land ward side before the overtopping tank has been
constructed. The actual crest level is located between Z + 10.20 (top of crest wall on service
road), assumed as minimum crest level; and Z + 12.40 (theoretical design crest level for upper
layer of armour units), assumed as theoretical maximum crest level.
The theoretical maximum crest level is not realistic and a more practical maximum crest level
is proposed. The maximum crest level used in the wave overtopping prediction formulae is Z
+ 12.02, determined by calculating the average value of the crest level of all points from the
bold line in Fig. 11, representing the local level of the armour unit faces in front of the
overtopping tank.
Since the armour units of the crest do not have an idealized wall profile with the same wall
height along the crest, the actual crest level experienced by the waves is somewhere in

Troch et al., version submitted for Coastal Engineering 20
between the minimum level Z + 10.20 and maximum level Z + 12.02. For the calculations, the
average level between minimum and maximum level is taken as the best representation of the
actual crest level for wave overtopping: Z + 11.11. The crest freeboard is denoted 1cR for the
maximum crest level Z + 12.02, 2cR for the minimum crest level Z + 10.20, and 3cR for the
actual average crest level Z + 11.11. The crest freeboard 3cR is considered to be the most
accurate estimation with upper limit 1cR and lower limit 2cR .
4.2.2 van der Meer et al. (1998) formula
For the application of eq. (14) to the Zeebrugge breakwater, the reduction factors bγ , βγ and
vγ are set to unity. There is no berm present ( bγ = 1), for the reported storms in Table 1
perpendicular wave attack is assumed ( βγ = 1), and there is no vertical wall on the
breakwater slope ( vγ = 1). The reduction factor for surface roughness, fγ , for the case of the
Zeebrugge breakwater with an armour layer with grooved cubes, is determined using the
following methodology, for lack of more appropriate values for fγ for this armour layer. For
rock slopes with a double layer of rock, van der Meer & Stam (1992) suggest to calculate fγ
as the ratio of the wave run-up level exceeded by two percent of the incoming waves %2uR
on a rough slope to %2uR on a smooth slope for the same 0ξ . The general prediction formula
used for the calculation of the run-up level exceeded by two percent of the incident waves
%2uR is (TAW, 2002):
0,1mfb0m
%2u 75.1H
R−βξγγγ= (17.a)
with a maximum of:

Troch et al., version submitted for Coastal Engineering 21
ξ−γγ=
−β
0,1mf
0m
%2u 6.13.4
H
R (17.b)
Eq. (17) is valid for the range 0.5 < 0,1mb −ξγ < 8 to 10. In case of the Zeebrugge breakwater,
again 1b =γ , and 1=γβ . The average breaker parameter 0,1m−ξ for the field data, calculated
from the values for all storms in Table 2, is 0,1m−ξ = 3.67. For this value, the maximum (eq.
(17.b)) is applicable, resulting in 46.3H
R
0m
%2u = for a smooth slope with 1f =γ . Using the
average value for 0,1m−ξ is justified since 0,1m−ξ varies only in a very small range for the
field storms (3.46 < 0,1m−ξ < 4.03). The dimensionless two percent run-up level for the
Zeebrugge breakwater with a rough slope has been determined based on extensive full scale
measurements of wave run-up, resulting in 76.1H
R
0m
%2u = (Van de Walle et al., 2002). The
reduction factor fγ is calculated using the wave run-up level ratio: 51.046.376.1f ==γ .
This calculated value is compared with other suggested values from literature. De Waal and
van der Meer (1992) suggest to use fγ in the range 0.55 – 0.60 for two or more layers of
rock. Owen suggest to use fγ in the range 0.5 – 0.6 for two or more layers of rubble. Updated
values provided in CEM (2003) estimate fγ in the range 0.50 – 0.55 for two or more layers
of rock. Good agreement is obtained between the calculated reduction factor fγ = 0.51 and
the reduction factors indicated in literature. Consequently, 51.0f =γ is used for the
determination of the predicted average overtopping rates.

Troch et al., version submitted for Coastal Engineering 22
The predicted average overtopping rates vdmq calculated using the van der Meer et al. (1998)
formulae, eq. (14), are summarised in Table 4. Again, the maximum value, eq. (14.b) is
applicable.
4.2.3 Owen (1980) formula
The application of the Owen formula, eq. (16), to the Zeebrugge breakwater requires the
determination of the coefficients oa and ob for the slope 4.11tan =α . Interpolation between
values given by Besley (1999) yields 00866.0a o = and 96.19bo = . Owen suggests to use a
value in the range 0.50 – 0.55 for the surface roughness reduction factor rγ for the case of
rough rock slopes. The range is very similar to the range proposed by De Waal and van der
Meer (1992), and therefore the same value for the reduction factor 51.0r =γ for use in the
Owen formula is maintained. The predicted average overtopping rates owenq calculated using
the Owen (1980) formula, eq. (16), are summarised in Table 5.
4.2.4 Correction for permeable crest berm: Besley (1999) formula
To take account of a permeable crest, Besley (1999) suggests to multiply the predicted
overtopping rate from the Owen (1980) formula, eq. (16), with a reduction factor:
−=
s
wr
H
C5.1exp06.3C (18)
where wC is the crest berm width. For the Zeebrugge breakwater, the permeable crest berm
width is located in front of the access road, and is estimated around 0.5Cw = m. The

Troch et al., version submitted for Coastal Engineering 23
predicted average overtopping rates besleyq calculated using the Besley (1999) reduction
factor, eq. (18), on owenq , are summarised in Table 6.
4.2.5 Comparison and discussion
A comparison between predicted average overtopping rates by Owen (1980) or Besley (1999)
and van der Meer et al. (1998) formulae for all storms is given for the three crest freeboard
values 1cR , 2cR and 3cR in Fig. 12.a, 12.b and 12.c respectively, on a linear scale. For the
Zeebrugge field data, Owen consistently predicts higher average overtopping rates than van
der Meer et al. Application of the reduction factor rC due to the presence of a permeable
crest berm reduces the over prediction significantly and much better agreement is observed
between Besley and van der Meer, especially for the actual average crest level (denoted 3cR )
and for the minimum crest level ( 2cR ) with best agreement.
The measured average overtopping rates from Table 3 have been compared to the predicted
average overtopping rates from van der Meer et al., Owen and Besley, in Fig. 13, for the three
crest levels and associated crest freeboards. The range of the measured q - values obtained
using the three methods (cf. section 3.3) is indicated in Fig. 13 using a vertical bar. Linear
scales have been used in the graphs. For the maximum crest level at Z + 12.02 (using 1cR , cf.
Fig. 13.a), the van der Meer et al. prediction underestimates the measured average
overtopping rates, especially for higher q - values. Owen’s prediction overestimates the
overtopping rates, and the reduction of Besley shows good agreement for smaller q - values
and underestimation for larger q - values. Using the minimum crest level at Z + 10.20 (using
2cR , cf. Fig. 13.b), the predicted average overtopping rates from all formulae overestimate
the measured q - values. The van der Meer et al. and Besley predictions have the same

Troch et al., version submitted for Coastal Engineering 24
magnitude (cf. Fig. 12), and the Owen prediction is twice as large. Finally, using the actual
average crest level at Z + 11.11 (using 3cR , cf. Fig. 13.c), the predicted q - values by van der
Meer et al. and Besley are in good agreement with the measured q - values, and the Owen
prediction still overestimates the measured average overtopping rates. In general best
agreement between measured and predicted overtopping rates is observed using van der Meer
et al.’s and Besley’s prediction formulae for the actual average crest level Z + 11.11 and 3cR .
A more traditional presentation of the prediction formulae is given in Fig. 14, where a
dimensionless overtopping discharge (using a logarithmic scale) is plotted versus a
dimensionless crest freeboard. The thick solid line is the prediction formula itself, the thin
solid lines are the 95 % confidence intervals of the formula (based on variation coefficients
provided by the author of the formula). The measured field data have been plotted in the same
graph using vertical bars to indicate the scatter from using the three calculation methods. Fig.
14.a, 14.b and 14.c show the resulting graphs for van der Meer et al., Owen and Besley,
respectively. For each prediction formula, the graphs are shown for the three crest freeboards.
Obviously, the same observations as from Fig. 13 are made. Using 1cR (with crest level at Z
+ 12.02), the van der Meer et al. and Besley prediction formulae underestimate the measured
overtopping rates, and the Owen prediction formula overestimates the measured average
overtopping rates. Measured overtopping rates are within the 95 % confidence intervals of all
prediction formulae, and therefore reasonable agreement is found between measured and
predicted values.
Using 2cR (Z + 10.20), the previously observed overestimation of the measured overtopping
rates is clearly visible in Fig. 14, where most of the measured overtopping rates are even

Troch et al., version submitted for Coastal Engineering 25
outside the 95 % confidence intervals for Owen and Besley. In this case, bad agreement is
found.
Finally, for the case using 3cR (Z + 11.11), good agreement is observed for the van der Meer
et al. and Besley predictions, with all measured overtopping rates between the 95 %
confidence intervals.
The prediction of van der Meer and Besley finally show better agreement than Owen’s
formula, and best agreement is found using the actual average crest level at Z + 11.11.
Comparing results from the three crest levels used in this analysis, shows that the actual
average crest level and the associated crest freeboard 3cR yield best agreement between
predicted and measured average overtopping rates, whereas the minimum crest level yields
overestimations outside the 95 % confidence intervals.

Troch et al., version submitted for Coastal Engineering 26
5 Conclusions
In this paper, full scale wave overtopping measurements carried out at the Zeebrugge rubble
mound breakwater during 1999 – 2003 have been presented and analysed. The measurement
set-up, using a waverider buoy to measure incident waves and an overtopping tank to catch
the volumes of overtopping water, and equipped with an outflow weir on a short side and
water depth measurements, has been used successfully to obtain reliable field data.
Eight storm records have been used in the analysis of the field data, with duration between 1
and 2 hours, and with significant wave heights ranging between 2.6 m and 3.9 m. Although
the measured storm conditions are considerably lower than the design storm conditions,
average overtopping rates close to 1 l/sm have occurred.
Three methods for deriving the average overtopping rate inside the overtopping tank have
been used, based on measurements of outflow discharge over the weir and instantaneous
water depth inside the overtopping tank. These methods yield results that are in good
agreement, with deviations between 12 % and 24 % on average.
Average overtopping rates from the field data have been compared with predicted values from
the widely used prediction formulae from van der Meer et al. (1998), Owen (1980) and
Besley (1999). For application of these formulae to the case of a rubble mound breakwater,
the value of the reduction factor for the surface roughness of the armour layer has to be
determined. This reduction factor has been calculated according to the methodology reported
in van der Meer & Stam (1992), and the value 0.51 has been used. The actual value for the
crest freeboard parameter cR for the case of the Zeebrugge breakwater is not obvious, and

Troch et al., version submitted for Coastal Engineering 27
therefore a sensitivity analysis has been carried out, varying the crest freeboard between a
maximum value 1cR (with crest level at Z + 12.02), and a minimum value 2cR (with crest
level at Z + 10.20), and the average value 3cR (with crest level Z + 11.11) between maximum
and minimum values.
Using 1cR , the van der Meer et al. and Besley prediction formulae underestimate the
measured overtopping rates, and the Owen prediction formula overestimates the measured
average overtopping rates. Measured overtopping rates are within the 95 % confidence
intervals of all prediction formulae. Using 2cR , all prediction formulae overestimate the
measured average overtopping rates, with values outside the 95 % confidence interval. Best
agreement between measured and predicted values is observed using the average crest level
(with 3cR ) and van der Meer et al’s and Besley’s prediction formulae. In general very good
agreement between the prototype average overtopping rates and the prediction formulae of
van der Meer and Besley is achieved, taking into account the right choice of surface
roughness and crest freeboard parameters.

Troch et al., version submitted for Coastal Engineering 28
Acknowledgements
The Coastal Division of the Flemish Community owns the prototype monitoring system and
provided funds for developments within national and international research projects.
Presented results are obtained partly within the European Community funded project CLASH
(‘Crest Level Assessment of Coastal Structures by full scale monitoring, neural network
prediction and Hazard analysis on permissible wave overtopping’ – contract N°: EVK3-CT-
2001-00058) within the Fifth Framework Programme (2002-2004). The financial support of
the Flemish Community and the European Community is very much acknowledged. The
authors thank Tom Versluys (Ghent University) for his contribution in the design and
installation of the measurement infrastructure.

Troch et al., version submitted for Coastal Engineering 29
References
Allsop N.W.H., Bruce T., Pearson J. Alderson J.S. & Pullen T. (2003). Violent wave
overtopping at the coast, when are we safe? Int. Conf. on Coastal Management 2003, pp 54-
69, ISBN 0 7277 3255 2, publn. Thomas Telford, London.
Aminti, P. and Franco, L., 1988. Wave overtopping on rubble mound breakwaters. Proc. 21st
ICCE, Malaga, Spain. ASCE, 770 - 781.
ASCE Task Committee on Sea Level Rise and Its Effects on Bays and Estuaries, 1992.
Effects of sea level rise on bays and estuaries. Journal of Hydraulic Engineering, ASCE,
118(1), 1-10.
Besley, P., 1999. Wave overtopping of Seawalls. Design and Assessment Manual. Hydraulics
Research Wallingford. R&D Technical Report W178, ISBN 1 85705 069 X.
Bradbury, A.P. and N.W.H. Allsop, 1988. Hydraulic effects of breakwater crown walls.
Proceedings Breakwaters ’88 Conference. Institution of Civil Engineers, Eastbourne, Thomas
Telford, London, 385 – 396.
Carter, D.J.T. and Draper, L., 1988. Has the Northeast Atlantic become rougher? Nature, 332
(6164) 494 – 494.
CEM, 2003. Coastal Engineering Manual, Coastal Engineering Research Center, Waterways
Experiment Station, US Army Corps of Engineers, Vicksburg, USA.

Troch et al., version submitted for Coastal Engineering 30
de Waal, J.P. and van der Meer, J.W., 1992. Wave run-up and overtopping on coastal
structures. Proc. 23rd
ICCE, Venice, Italy. ASCE. pp. 1758 – 1771.
Franco, C. and Franco, L., 1999. Overtopping Formulas for Caisson Breakwaters with
Nonbreaking 3D Waves. Journal of Waterway, Port, Coastal and Ocean Engineering, ASCE
125 (2) 98 – 108.
Franco, L., Bellotti, G., Briganti, R., De Rouck, J., Geeraerts, J., 2003. Field measurement of
wave overtopping at Ostia yacht harbour breakwater. To be published in Proceedings of Proc.
Conf. Coastal Structures '03, Portland, A.A. Balkema, Rotterdam.
Fuhrböter, A., Dette, H.H., Toppe, A., 1990. Recent changes in sea level rise. Journal of
Coastal Research, Special Issue No 9, Proceedings Skagen Symposium, Sept. 2-5, pp. 146 –
159.
Fukuda, N., Uno, T., Irie, I., 1974. Field observations of wave overtopping of
wave absorbing revetment. Coastal Engineering in Japan, Vol 17, pp 117-128,
Japan Society of Civil Engineers, Tokyo.
Goda, Y., Kishira, Y., Kamiyama, Y., 1975. Laboratory investigation on the overtopping rate
of seawalls by irregular waves, Report of Port and Harbour Research Institute, Vol. 14, No. 4,
pp. 3-44 (in Japanese).

Troch et al., version submitted for Coastal Engineering 31
Goda, Y., 1985. Random seas and design of maritime structures, University of Tokyo Press,
Tokyo, Japan.
Herbert, D.M., 1996. The overtopping of seawalls. A comparison between prototype and
physical model data. Hydraulics Research Wallingford, Report No. TR 22, UK.
Kimura, K., Fujiike, T., Kamikubo, K., Abe, R., Ishimoto, K., 1999. Damage to
vehicles on a coastal highway by wave action. Proc. Conf. Coastal Structures
'99, Santander, June 1999, A.A. Balkema, Rotterdam.
National Research Council, 1987. Responding to Changes in Sea Level – Engineering
Implications. Marine Board, National Academy Press, Washington, D.C.
Owen, M.W., 1980. Design of seawalls allowing for wave overtopping. Hydraulics Research,
Wallingford, Report No. EX 924, UK.
Owen M.W. (1982) "The hydraulic design of sea-wall profiles” Proc. ICE Conf. on Shoreline
Protection, September 1982, pp 185-192, publn Thomas Telford, London
Owen M.W. (1982) "Overtopping of sea defences" Proc. Conf. Hydraulic Modelling of Civil
Engineering Structures, BHRA, Coventry, September 1982.
Pullen, T., Allsop, N.W.H, Bruce, T., Geeraerts, J., 2003. Violent wave overtopping: Clash
Field Measurements at Samphire Hoe. To be published in Proceedings of Proc. Conf. Coastal
Structures '03, Portland, A.A. Balkema, Rotterdam.

Troch et al., version submitted for Coastal Engineering 32
Sakakiyama, T., Kajima, R., Imai, S., Shimizu, T., Katayama, H., 1997. Field measurements
of wave overtopping on seawall covered with armour units, Proceedings Waves ’97, ASCE,
pp. 1336 – 1350.
Takayama, T., Nakgai, N., Nishida, K., 1982. Decrease of wave overtopping amount due to
seawall of low crest types, Report of Port and Harbour Research Institute, Vol. 21, No2, pp.
151 – 205 (in Japanese).
TAW, 2002. [Dutch Technical Advisory Committee on Water Defence] Technisch Rapport
Golfoploop en Golfoverslag bij Dijken [Technical Report on Wave Run-up and Wave
overtopping at dikes]. In Dutch. 44pp, Delft, The Netherlands.
Troch, P., De Rouck, J., Van Damme, L., 1998. Instrumentation and prototype measurements
at the Zeebrugge rubble mound breakwater, Coastal Engineering, n° 35, pp. 141-166.
Troch, P., 2000. Experimentele studie en numerieke modellering van golfinteractie met
stortsteengolfbrekers. [ Experimental study and numerical modelling of wave interaction with
rubble mound breakwaters] In Dutch. PhD Thesis, Department of Civil Engineering, Ghent
University.
van der Meer, J.W. and Stam, C.J., 1992. Wave run-up on smooth and rock slopes of coastal
structures, Journal of Waterway, Port, Coastal, and Ocean Engineering, ASCE 118 (5) 534 –
550.

Troch et al., version submitted for Coastal Engineering 33
van der Meer, J.W., 1994. Conceptual design of rubble mound breakwaters. In: P.L.-F. Liu
(editor), Advances in Coastal and Ocean Engineering, Vol. 1. World Scientific, Singapore,
pp. 221-315.
van der Meer, J.W., Tönjes, P., de Waal, H., 1998. A code for dike height design and
examination, Proceedings International Conference on Coastlines, Structures and
Breakwaters, Institution of Civil Engineers, London, Thomas Telford, London, pp. 5 - 19.
Van de Walle, B., De Rouck, J., Van Damme, L., Frigaard, P., Willems, M., 2002. Parameters
influencing wave run-up on a rubble mound breakwater. Proc. 28th
ICCE, Cardiff, UK.
ASCE. pp. 2008 – 2018.
Van de Walle, B., 2003. Wave run-up on rubble mound breakwaters, PhD thesis, Department
of Civil Engineering, Ghent University, Belgium.
Van Gent, M.R.A., 2001. Wave run-up on dikes with shallow foreshore. Journal of
Waterway, Port, Coastal and Ocean Engineering, ASCE 127 (5) 254 – 262.
Vardy, A., 1990. Fluid Principles. Ed. Mc Graw-Hill., New York, USA.

Troch et al., version submitted for Coastal Engineering 34
TABLES
Table 1. Overview of available data sets of full scale wave overtopping measurements, with
storm identification number, date and duration of the wave records.
Storm No.
Date
Time
Duration 0T
(s)
1
6 November 1999
11h30 – 13h30
7200
2 6-7 November 1999 23h45 – 01h45 7200
3 8 November 2001 16h15 – 18h15 7200
4 26 February 2002 12h30 – 14h30 7200
5a 27 October 2002 17h00 – 18h00 3600
5b 27 October 2002 18h00 – 19h00 3600
5c 27 October 2002 19h00 – 20h15 4500
6 29 January 2003 10h00 – 12h00 7200

Troch et al., version submitted for Coastal Engineering 35
Table 2. Wave characteristics, surf similarity parameter and water level for the storms.
Storm No.
0mH
(m)
sH
(m)
0,1mT −
(s)
pT
(s)
mT
(s)
0,1m−ξ
(-)
SWL
(m Z)
1
3.04
2.89
6.88
7.34
5.70
3.52
5.28
2 2.60 2.44 6.93 7.34 5.36 3.84 5.11
3 3.47 3.31 8.41 10.28 6.35 4.03 5.01
4 2.63 2.48 6.49 7.91 5.32 3.57 4.24
5a 3.74 3.61 7.50 8.57 6.21 3.46 4.40
5b 3.86 3.71 7.64 8.57 6.35 3.47 4.60
5c 3.71 3.55 7.98 8.57 6.45 3.70 4.35
6 3.16 3.03 7.28 7.91 5.94 3.66 4.71

Troch et al., version submitted for Coastal Engineering 36
Table 3. Average overtopping rates ceqq , Viq and hq∆ for all storms, calculated using the 3
methods based on the continuity equation, the individual overtopping volumes and the water
depth jumps, respectively, and the number of overtopping events ovN .
Storm No.
ceqq
(l/sm)
Viq
(l/sm)
hq∆
(l/sm)
ovN
(-)
1 3.161E-02 5.709E-02 4.677E-02
10
2 2.299E-02 2.211E-02 1.842E-02 3
3 2.825E-01 3.310E-01 3.588E-01 29
4 3.919E-03 1.010E-02 9.031E-03 1
5a 4.037E-01 5.158E-01 4.404E-01 19
5b 5.919E-01 8.585E-01 5.963E-01 30
5c 6.296E-01 7.036E-01 6.780E-01 31
6 8.479E-02 9.620E-02 8.646E-02 9

Troch et al., version submitted for Coastal Engineering 37
Table 4. Predicted average overtopping rates vdmq calculated using the van der Meer et al. (1998) formula (eq. 22), for all storms, for the
Zeebrugge breakwater with 4.11tan =α , 1b =γ , 51.0f =γ , 1=γβ , 1v =γ . Crest freeboards calculated using crest level Z + 12.02 ( 1cR ), Z +
10.20 ( 2cR ) and Z + 11.11 ( 3cR ), respectively.
Crest level Z + 12.02 Crest level Z + 10.20 Crest level Z + 11.11
Storm
No.
0mH
(m)
SWL
(m Z)
0,1m−ξ
(-)
1cR
(m)
0m1c HR
(-)
1vdmq
(m3/sm)
2cR
(m)
0m2c HR
(-)
2vdmq
(m3/sm)
3cR
(m)
0m3c HR
(-)
3vdmq
(m3/sm)
1
3.04
5.28
3.52
6.74
2.22
4.10E-05
4.92
1.62
8.67E-04
5.83
1.92
1.88E-04
2 2.60 5.11 3.84 6.91 2.66 3.43E-06 5.09 1.96 1.22E-04 6.0 2.31 2.04E-05
3 3.47 5.01 4.03 7.01 2.02 1.36E-04 5.19 1.50 1.98E-03 6.10 1.76 5.19E-04
4 2.63 4.24 3.57 7.78 2.96 7.11E-07 5.99 2.28 2.42E-05 6.90 2.62 4.15E-06
5a 3.74 4.40 3.46 7.62 2.04 1.40E-04 5.80 1.55 1.67E-03 6.71 1.79 4.83E-04
5b 3.86 4.60 3.47 7.42 1.92 2.63E-04 5.60 1.45 2.92E-03 6.51 1.69 8.76E-04
5c 3.71 4.35 3.70 7.67 2.07 1.18E-04 5.85 1.58 1.44E-03 6.76 1.82 4.14E-04
6 3.16 4.71 3.66 7.31 2.31 2.66E-05 5.49 1.74 5.01E-04 6.40 2.03 1.15E-04

Troch et al., version submitted for Coastal Engineering 38
Table 5. Predicted average overtopping rates owenq calculated using Owen (1980) formula (eq. 24), for all storms, for the Zeebrugge breakwater
with 00866.0ao = and 96.19bo = , and 51.0r =γ . Crest freeboards calculated using crest level Z + 12.02 ( 1cR ), Z + 10.20 ( 2cR ) and Z +
11.11 ( 3cR ), respectively.
Crest level Z + 12.02
Crest level Z + 10.20
Crest level Z + 11.11
Storm
No.
sH
(m)
mT
(s)
SWL
(m Z)
1cR
(m) mm
1c
gHT
R
(-)
1owenq
(m3/sm)
2cR
(m) mm
2c
gHT
R
(-)
2owenq
(m3/sm)
3cR
(m) mm
3c
gHT
R
(-)
3owenq
(m3/sm)
1
2.89
5.70
5.28
6.74
0.22
2.32E-04
4.92
0.16
2.44E-03
5.83
0.19
7.52E-04
2 2.44 5.36 5.11 6.91 0.26 3.63E-05 5.09 0.19 5.52E-04 6.0 0.23 1.42E-04
3 3.31 6.35 5.01 7.01 0.19 9.00E-04 5.19 0.14 6.47E-03 6.10 0.17 2.41E-03
4 2.48 5.32 4.24 7.78 0.29 1.36E-05 5.99 0.22 1.92E-04 6.90 0.26 5.11E-05
5a 3.61 6.21 4.40 7.62 0.21 5.89E-04 5.80 0.16 4.06E-03 6.71 0.18 1.55E-03
5b 3.71 6.35 4.60 7.42 0.19 1.01E-03 5.60 0.15 6.51E-03 6.51 0.17 2.57E-03
5c 3.55 6.45 4.35 7.67 0.20 7.23E-04 5.85 0.15 4.71E-03 6.76 0.18 1.85E-03
6 3.03 5.94 4.71 7.31 0.23 2.20E-04 5.49 0.17 1.99E-03 6.40 0.20 6.62E-04

Troch et al., version submitted for Coastal Engineering 39
Table 6. Corrected average overtopping rates besleyq on Owen (1980) formula (eq. 24) for
influence of permeable crest berm, for all storms, for the Zeebrugge breakwater with
0.5Cw = m, using crest level Z + 12.02 ( 1cR ), Z + 10.20 ( 2cR ) and Z + 11.11 ( 3cR ),
respectively.
Storm No.
sH
(m)
mT
(s)
rC
(-)
1besleyq
(m3/sm)
2besleyq
(m3/sm)
3besleyq
(m3/sm)
1
2.89
5.70
0.23
5.30E-05
5.57E-04
1.72E-04
2 2.44 5.36 0.14 5.14E-06 7.81E-05 2.00E-05
3 3.31 6.35 0.32 2.86E-04 2.05E-03 7.66E-04
4 2.48 5.32 0.15 2.02E-06 2.85E-05 7.59E-06
5a 3.61 6.21 0.38 2.26E-04 1.56E-03 5.93E-04
5b 3.71 6.35 0.41 4.10E-04 2.64E-03 1.04E-03
5c 3.55 6.45 0.37 2.67E-04 1.74E-03 6.83E-04
6 3.03 5.94 0.26 5.66E-05 5.13E-04 1.70E-04