FT-NIR microscopy: An advanced spectroscopic approach for the characterisation of paint...
10
FT-NIR microscopy: An advanced spectroscopic approach for the characterisation of paint cross-sections Giorgia Sciutto a, ⁎, Silvia Prati a , Irene Bonacini a , Paolo Oliveri b , Rocco Mazzeo a, ⁎⁎ a Microchemistry and Microscopy Art Diagnostic Laboratory, University of Bologna, Via Guaccimanni, 42 I-48100 Ravenna, Italy b Department of Pharmacy, University of Genova, Via Brigata Salerno, 13 I-16147 Genova, Italy abstract article info Article history: Received 9 August 2013 Accepted 21 September 2013 Available online 1 October 2013 Keywords: FT-NIR microscopy Paint cross-sections Principal component analysis (PCA) Hyperspectral maps Terpenic resins The present research was aimed at exploiting and evaluating the potentialities of FT-NIR microscopy, as a complementary approach to analysis in the MIR region, for the chemical characterisation of paint cross sections. Even if FT-NIR technique is still underutilised in the field of cultural heritage investigations, the integrated use of information recorded in the NIR and in the MIR regions proved to be extremely useful in the molecular investigation of organic and inorganic substances. In fact, combination and overtone bands present in the NIR region, even if weaker and less selective than those in the MIR region, are not distorted by reflection phenomena. Furthermore, NIR spectra can be efficiently used as a spectral fingerprint for the stratigraphic char- acterisation of paint cross sections. The proposed analytical protocol was applied on two historical samples, pre- senting different stratigraphic structures. Suitable chemometric methods were applied for the elaboration of multivariate chemical maps recorded in the range 700–7500 cm -1 . In particular, a comprehensive and efficient procedure based on an interactive brushing approach, which combines the structural information of the score scatter plots with the spatial information of the PC score maps, was used. Interestingly, NIR data allowed a thorough characterisation of paint structures, providing information for the identification of components and suggesting the differentiation among different types of proteins. Moreover, NIR spectra permitted to achieve an efficient distinction of different classes of natural resins, demonstrating that, even working at a microscopic level, the NIR region may support the identification of different terpenoid materials. Multivariate analysis performed on MIR data did not provide satisfactory results, probably due to the distortion of the spectra and overlapping of bands. Nevertheless, MIR outcomes were investigated to support the interpretation of NIR spectra and in attempt to define an integrated protocol for the characterisation of complex paint mixtures. © 2013 Elsevier B.V. All rights reserved. 1. Introduction Infrared microscopy is one of the techniques most widely used for the characterisation of paint components in cross sections. Routinely, polychrome samples have been mainly analysed in the mid-infrared (MIR) region (4000 cm -1 –700 cm -1 ) either in the total reflectance [1–3] or in the attenuated total reflectance (ATR) modes [4]. μATR-FTIR is generally considered as the most appropriate method to analyse cross sections thanks to its high sensitivity (related to the magnification factor of the internal reflection element — IRE) [5] and to its capability to provide spectra similar to those obtained in transmission. However, this setup presents some limitations, mainly related to the need for a good contact between the ATR crystal and the sample surface. In addition, the sample surface may result damaged by the pressure of the crystal and, frequently, the contact may induce displacements of the area to be investigated [6]. Differently, FT-IR microscopy measurements can be carried out in a non-contact mode through a Cassegrain objective. Nevertheless, reflectance spectra obtained in this way are often affected by the presence of a specular component, which produces distorted signals, such as derivative-like and reststrahlen bands. Moreover, broadening and shift of signals may be induced by diffuse reflection, thus hampering a reliable interpretation of spectra [1]. Given the above mentioned hurdles, the present research was aimed at evaluating the use of FT-IR microscopy in the near-infrared region (NIR) in the total reflectance mode, proposing a complementary technique for the characterisation of paint cross-sections. The integrated use of information recorded in the NIR and in the MIR region can be extremely useful in the molecular investigation of both organic and inorganic substances, thanks to the fact that combination and overtone bands present in the NIR region, even if weaker and less selective than those on the MIR region, are not distorted by reflection phenomena. Furthermore, NIR spectra can be efficiently used as a spectral fingerprint for the stratigraphic characterisation of paint cross sections. Microchemical Journal 112 (2014) 87–96 ⁎ Corresponding author. Tel.: +39 0544 937155; fax: +39 0544 937159. ⁎⁎ Corresponding author. Tel.: +39 0544 937150; fax: +39 0544 937159. E-mail addresses: [email protected] (G. Sciutto), [email protected] (R. Mazzeo). 0026-265X/$ – see front matter © 2013 Elsevier B.V. All rights reserved. http://dx.doi.org/10.1016/j.microc.2013.09.021 Contents lists available at ScienceDirect Microchemical Journal journal homepage: www.elsevier.com/locate/microc
-
Upload
independent -
Category
Documents
-
view
4 -
download
0
Transcript of FT-NIR microscopy: An advanced spectroscopic approach for the characterisation of paint...
Microchemical Journal 112 (2014) 87–96
Contents lists available at ScienceDirect
Microchemical Journal
j ourna l homepage: www.e lsev ie r .com/ locate /mic roc
FT-NIR microscopy: An advanced spectroscopic approach for thecharacterisation of paint cross-sections
Giorgia Sciutto a,⁎, Silvia Prati a, Irene Bonacini a, Paolo Oliveri b, Rocco Mazzeo a,⁎⁎a Microchemistry and Microscopy Art Diagnostic Laboratory, University of Bologna, Via Guaccimanni, 42 I-48100 Ravenna, Italyb Department of Pharmacy, University of Genova, Via Brigata Salerno, 13 I-16147 Genova, Italy
⁎ Corresponding author. Tel.: +39 0544 937155; fax: +⁎⁎ Corresponding author. Tel.: +39 0544 937150; fax: +
E-mail addresses: [email protected] (G. Sciutto(R. Mazzeo).
0026-265X/$ – see front matter © 2013 Elsevier B.V. All rhttp://dx.doi.org/10.1016/j.microc.2013.09.021
a b s t r a c t
a r t i c l e i n f oArticle history:Received 9 August 2013Accepted 21 September 2013Available online 1 October 2013
Keywords:FT-NIR microscopyPaint cross-sectionsPrincipal component analysis (PCA)Hyperspectral mapsTerpenic resins
The present research was aimed at exploiting and evaluating the potentialities of FT-NIR microscopy, as acomplementary approach to analysis in the MIR region, for the chemical characterisation of paint cross sections.Even if FT-NIR technique is still underutilised in the field of cultural heritage investigations, the integrated useof information recorded in the NIR and in the MIR regions proved to be extremely useful in the molecularinvestigation of organic and inorganic substances. In fact, combination and overtone bands present in theNIR region, even if weaker and less selective than those in the MIR region, are not distorted by reflectionphenomena. Furthermore, NIR spectra can be efficiently used as a spectral fingerprint for the stratigraphic char-acterisation of paint cross sections. The proposed analytical protocol was applied on two historical samples, pre-senting different stratigraphic structures. Suitable chemometric methods were applied for the elaboration ofmultivariate chemical maps recorded in the range 700–7500 cm−1. In particular, a comprehensive and efficientprocedure based on an interactive brushing approach, which combines the structural information of the scorescatter plots with the spatial information of the PC score maps, was used. Interestingly, NIR data allowed athorough characterisation of paint structures, providing information for the identification of components andsuggesting the differentiation among different types of proteins. Moreover, NIR spectra permitted to achievean efficient distinction of different classes of natural resins, demonstrating that, even working at a microscopiclevel, the NIR region may support the identification of different terpenoid materials. Multivariate analysisperformed on MIR data did not provide satisfactory results, probably due to the distortion of the spectra andoverlapping of bands. Nevertheless, MIR outcomeswere investigated to support the interpretation of NIR spectraand in attempt to define an integrated protocol for the characterisation of complex paint mixtures.
© 2013 Elsevier B.V. All rights reserved.
1. Introduction
Infrared microscopy is one of the techniques most widely used forthe characterisation of paint components in cross sections. Routinely,polychrome samples have been mainly analysed in the mid-infrared(MIR) region (4000 cm−1–700 cm−1) either in the total reflectance[1–3] or in the attenuated total reflectance (ATR) modes [4]. μATR-FTIRis generally considered as the most appropriate method to analysecross sections thanks to its high sensitivity (related to themagnificationfactor of the internal reflection element— IRE) [5] and to its capability toprovide spectra similar to those obtained in transmission. However, thissetup presents some limitations, mainly related to the need for a goodcontact between the ATR crystal and the sample surface. In addition,the sample surface may result damaged by the pressure of the crystal
39 0544 937159.39 0544 937159.
ights reserved.
and, frequently, the contact may induce displacements of the area tobe investigated [6]. Differently, FT-IR microscopy measurements can becarried out in a non-contact mode through a Cassegrain objective.Nevertheless, reflectance spectra obtained in this way are oftenaffected by the presence of a specular component, which producesdistorted signals, such as derivative-like and reststrahlen bands.Moreover, broadening and shift of signals may be induced by diffusereflection, thus hampering a reliable interpretation of spectra [1].
Given the abovementioned hurdles, the present researchwas aimedat evaluating the use of FT-IR microscopy in the near-infrared region(NIR) in the total reflectance mode, proposing a complementarytechnique for the characterisation of paint cross-sections. Theintegrated use of information recorded in the NIR and in the MIRregion can be extremely useful in the molecular investigation ofboth organic and inorganic substances, thanks to the fact thatcombination and overtone bands present in the NIR region, even ifweaker and less selective than those on the MIR region, arenot distorted by reflection phenomena. Furthermore, NIR spectracan be efficiently used as a spectral fingerprint for the stratigraphiccharacterisation of paint cross sections.

88 G. Sciutto et al. / Microchemical Journal 112 (2014) 87–96
The NIR region has been widely exploited in bench or portable sys-tems for the macroscopic analyses of samples in many different fields(mainly pharmaceutical, forensic, polymers and food sciences) [7–10].
In the field of cultural heritage, non-invasive in-situ NIR spectrosco-py investigations have been profitably applied for the identification ofpaintmaterials [11–15] and for the evaluation of the long-term stabilityof historical papers [16]. Recently, Dooley et al. proposed the use of anadvanced NIR reflectance imaging system for the identification oforganic substances in paintings, exploiting the vibrational overtonesand combination bands of fundamental absorptions, which are lessaffected by potential pigment interferences [17].
On the other hand, only very few studies concerning the use of FTIRmicroscopy in the near infrared range for the analysis of artisticmulti-layered samples have been reported in literature [1,2,18].These few papers provided just a preliminary evaluation of thepotentialities of this technique on a microscale, as they discuss thecharacterisation of only few painting materials within a spectralrange never exceeding 5500 cm−1.
On these bases, the present research was aimed at illustrating howthe NIR range may be complementary to theMIR one for the resolutionof chemical composition of paint cross sections, when total reflectionμFTIR is used.
The analytical protocol was experimented on two historicalsamples, presenting different stratigraphic structures, employingsuitable chemometric methods for the elaboration of chemical mapsrecorded in a range up to 7500 and 6500 cm−1, respectively. Thepossibility to extend the acquisition range with respect to the paperspreviously published allowed to better exploit the possibility of thistechnique. Moreover, it was evidenced that results achieved on the
-0.1 -0.08 -0.06 -0.04 -0.02 0 0.02 0.04 0.06 0.08
-0.03
-0.02
-0.01
0
0.01
0.02
0.03
Scores on PC1 (57.2%)
Sco
res
on P
C3
(3.3
%)
100 µm 100 µm
a b
2
10
210
d
0
1
2
c
Fig. 1. Sample Rond25: a) cross-section microphotographs under visible light; b) cross-sectionFTIR mapping analysis; c) score map of PC3: d) PC13 score plot: clusters in blue, red and greenrespectively; e) average spectral profiles extracted from layer 0; f) average spectral profiles ex
microscale were comparable with those achieved with the macro-portable systems.
The evaluation of MIR and NIR data was performed by principalcomponent analysis (PCA). Indeed, it is known that a typical matterthat affects NIR spectra is represented by baseline shifts and globalintensity effects that can be corrected by proper mathematical pre-processing. In addition, previous papers suggested the use of PCAto overcome the problems of distortions of the MIR spectra acquiredin total reflection [1,2].
Hyperspectral data were processed using the so-called brushingprocedure [2,19,20], which is based on the integration of scatter plotsand score maps. Brushing allows the detection of correspondencesbetween clusters of scores and specific areas within a given PC scoremap, by means of an interactive selection procedure. Moreover, theaverage spectral profiles of these points can be analysed, identifyingthe spectral features most involved in defining each investigated areaand providing a consistent chemical interpretation.
For each sample, PCA-mappingwas performedusing theNIR and theMIR region separately.Moreover, FTIR spectra of standard natural resinsand of linseed oil were collected and used as references, in order tocharacterise a layer present in one of the real paint stratigraphies,probably applied as mordant. A previous research work reportedon the application of macro-FT-NIR spectroscopy for the identificationof resins [11]. On these bases, the present research showed that evenworking at a microscopic level, the NIR region may support the iden-tification of different terpenoid materials — which still represent achallenge when working with spectroscopic techniques, so thatchromatographic techniques are usually employed for their identifi-cation [21–23]. In fact, MIR spectra of natural resins do not allow a
76
78
80
82
84
86
88
90
92
94
96
98
100
4257
4371
4340
5700
578669
1166
84
5159
82
8384858687888990919293949596979899
100
4341
4255
5783 57
01
4618
4896
516466
91
84
85
86
87
88
89
90
91
92
93
94
95
96
97
98
99100
4000 4500 5000 5500 6000 6500 7000
6911
4256
4337
5701
5785
5150
4623
4696
e
f
g
Wavenumber (cm-1)
%R
%R
%R
microphotographs under UV illumination. The white boxes indicate the area selected forcorrespond to the points localised within the PC3 score map: layer 0, layer1 and layer 2,
tracted from layer 1; and g) average spectral profiles extracted from layer 2.

93.594.094.595.095.596.096.597.097.598.098.599.099.5
100.0
74767880828486889092949698
95.0
95.5
96.0
96.5
97.0
97.5
98.0
98.5
99.0
99.5
4600 4800 5000 5200 5400 5600 5800 6000 6200
5164
4896 46
18
5163
5159
4900
4863
4611
4611
Wavenumber (cm-1)
%R
%R
%R a
b
c
Fig. 2. Comparison among NIR spectra of: a) spectrum extracted from layer 1 of sampleRond25; b) reference spectrum animal glue; and c) reference standard of whole eggtempera.
89G. Sciutto et al. / Microchemical Journal 112 (2014) 87–96
reliable differentiation among resins belonging to different terpenoidclasses [24,25]. Conversely, far-infrared (FIR) spectroscopy in macro-ATRmodewas reported to be successful in the recognition of terpenoidresins [26]. Nevertheless, microscopic analyses in the FIR region requireexpensive and unusual equipment, such as bolometric detectors cooledby liquid helium, and the spatial resolution achievable – larger than theone obtained in theMIR range – is often not adequate for the analysis oftypical thin paint varnish layers.
2. Materials and methods
2.1. Samples
Two historical samples were investigated, discussing the perfor-mance and the advantages of the μFT-NIR/MIR analysis in combinationwith multivariate statistical treatment. The first sample (Rond25) wascollected from a Renaissance wooden painting (Madonna in Trono conSanti), exhibited at the Museum of the City of Ravenna. The secondsample (Civ6) was collected from a gilded area of the XV century wallpaintings of the Basilica di San Frediano, Lucca (Italy).
Paint cross-sections of real samples were prepared by using theKBr/synthetic resin system described b in a previous research work[27]. Briefly, the micro-fragment was placed in a macro–micro pelletdiewhere a KBr pellet-bed (2 t for 1 min) had been previously preparedand covered with additional KBr and finally pressed (3 t for 2 min).Afterwards, the pellet obtained was reduced in the external part andsubmitted to the polyester-resin embedding procedure. Dry polishingwas carried out using silica abrasive cards (purchased from Micro-Surface Finishing Products Inc., Wilton, IA) with grit from 1000 to12,000, to obtain a high-quality surface in terms of planarity androughness. A polishing sample holder was employed in order to ensurea high level of surface planarity.
All standard natural resins (colophony, copal, sandarac, mastic,dammar, shellac) were purchased from Kremer Pigmente (Aichstetten,Germany). Linseed oil was purchased from Zecchi (Florence, Italy).Resins, previously dissolved in different solvents (turpentine fortriterpenic resins and colophony, ethyl alcohol for sesquiterpenic resinsand sandarac), and linseed oil were applied on glass slide supports andleft drying at room temperature. FTIR total reflection spectra – in themid and near regions – were acquired on powdered resins scraped offfrom these films.
2.2. Optical microscopy
Cross-sections were observed and documented stratigraphically bymeans of dark field observations performedwith the use of an Olympus(Olympus Optical, Tokyo, Japan) BX51 microscope equipped with anOlympus DP70 digital scanner camera. A 100-W halogen projectionlamp andaUshio Electric (USHIO Inc, Tokyo, Japan)USH102Dultraviolet(UV) lamp were employed for the acquisition of visible and UV-fluorescence images, respectively.
2.3. μFT-NIR/MIR analysis
A Thermo Nicolet (Thermo Fisher Scientific, Waltham, MA, USA), iN™10MX imagingmicroscope, fittedwith amercury–cadmium–telluride(MCT) detector cooled by liquid nitrogen, was used for single-point andmapping analyses. Spectra were recorded within the NIR and MIRranges (8000–675 cm−1) in total reflection mode with a spectralresolution of 4 cm−1.
Sample Rond25 was investigated selecting an area of 25 × 90 μm2,with an optical aperture of 50 × 20 μm2 and step size of 25 and 10 μmfor x and y axes respectively. Each spectrum was recorded as theaverage of 4096 scans.
Sample Civ6 was mapped using an aperture of 20 × 50 μm2 and astep of 10 × 25 μm in the x–y direction. The overall area of analysis
was 25 × 90 μm2. Each spectrum was recorded as the average of 2048scans. A dedicated software, OMNIC Picta™ (Thermo Fisher Scientific,Waltham, MA, USA), was applied for the preliminary manipulation ofthe spectral data.
Analyses of powder standard resin samples were performed withan optical aperture of 200 × 200 μm2, collecting 1024 scans for eachspectrum.Nine replicate spectrawere collected for each resin specimen.
2.4. Multivariate chemical mapping
Multivariate data processing and chemicalmappingwere performedby means of in-house Matlab routines (The Mathworks Inc., Natick,USA). A number of common mathematical pre-processing strategieswere applied on the hyperspectral data. The aim of such pre-treatments was the minimisation of unwanted effects – such asbaseline variations and global intensity effects – which commonlyaffect NIR and MIR spectra. In more detail, the standard normal variate(SNV) transform, a linear detrending and Savitzky–Golay derivationwere applied, both singularly and in combination. The SNV transformis able to correct for baseline shifts and global intensity effects,while derivatives enhance details within complex spectral features(e.g. unresolved broad bands) and correct for baseline shifts (firstderivative) and drifts (second derivative).
The MIR range considered was between 4000 and 700 cm−1, whilethe NIR range was investigated between 7500 and 3950 cm−1,for sample Rond25, and in the intervals 6500–5500 cm−1 and5300–3950 cm−1, for sample Civ6. Principal component analysis(PCA) was performed on hyperspectral data and the score valueswere converted into chemical score maps, which represent variationof the score values in the mapped area by a chromatic scale.
2.5. Principal component analysis on single-point spectra of standardnatural resins and linseed oil
PCA on standard resin spectra was performed in order to verify thepossibility of distinguishing between the different resin classes. Spectra

90 G. Sciutto et al. / Microchemical Journal 112 (2014) 87–96
in the NIR range (6400–5500, 5300–4000 cm−1) were pre-processedby the standard normal variate (SNV) transform and the second-orderSavitzky Golay derivative, using third order polynomials and 11datapoint gaps.
3. Results and discussions
3.1. Sample Rond25
The study on the historical sample was part of a project aimed atcharacterising painting materials, to support attribution researchesand the on-going restoration intervention. Micro-FT-NIR/MIR analysiswas carried out on a portion of the paint stratigraphy, containingthree different layers (white boxes in Fig. 1a and b). Over a yellowlayer (layer 0) a translucent brownish layer is superimposed (layer 1)and better recognisable under UV illumination thanks to its brightbluish fluorescence. A pigment layer is also observed (layer 2),characterised by the presence of small blue crystals dispersed withina white and homogeneous matrix.
A multivariate exploratory study was performed on hyperspectralmaps, in order to exploit the most relevant information from spectra.Indeed, PCA combined with a number of common mathematical pre-treatments, was performed on both MIR and NIR data and the resultswere compared. In the case of the NIR region, the outcomes showedthat specific pre-treatments are functional to exploit the extraction ofuseful information from spectral data. In particular, the SNV transformcoupledwith a first derivative was chosen as themost effective strategyto remove slope variations and to correct for baseline shifts and globalintensity effects.
Interestingly, it was possible to observe that the score map of PC3(Fig. 1c) allowed a clear identification of all the three layers present inthe sample. Therefore, the PC13 score scatter plot (Fig. 1d) wasconsidered and brushing was used to understand the correspondences
a b c
d
0
1
2
0
1
2
0
1
2
1.0
1.1
1.2
1.3
1.4
1.5
1.6
1.7
1.8
1.9
2.0
2.1
2.2
2.3
Log(
1/R
)
35004000
Fig. 3. Sample Rond25— PC scoremaps obtained in theMIR range. SNV transform coupledwithPC3 map; and d) MIR spectra. Blue profile: spectrum extracted from the blue layer 2, red profi
between clusters of scores (detectable in the scatter plots) and thecorresponding areas within PC3 score map. In particular, the scoreplot showed a group of points, related to high score values along thePC3, which corresponds to layer 0. The average spectral profile of suchcluster was extracted and examined in attempt to identify all theconstituents of the layer (Fig. 1e). Lead white (2PbCO3·Pb(OH)2) wasrevealed thanks to the broad band at 6911 cm−1 (1st overtone of OHstretching). Furthermore, it was possible to identify peculiar spectralfeatures ascribable to a lipidic substance (such as siccative oil) used asbinding medium (bands at 5701 and 5785 cm−1 corresponding to the1st overtone of CH2 symmetric and antisymmetric stretching, respec-tively; bands at 4339 and 4256 cm−1 corresponding to the combinationof methylenic CH stretching and bending and band at 4056 cm−1
corresponding to the 3rd overtone of CC bending). Very weakbands ascribable to the proteinaceous fraction were observed at4896 and 4623 cm−1 assigned to stretching and bending of NH andto the 1st overtone of carbonyl stretching and of amide II, respectively[11,17]. In spite of the very low intensity of such spectral features, it isnot possible to exclude the contemporary presence of proteins in thesame layer, even if in a limited amount.
Interestingly, the presence of proteinaceous componentswas clearlyidentified in layer 1, well described in the PC3 score map. Indeed,through the examination of the spectral profile (Fig. 1f) extractedfrom the correspondent cluster of scores in the PC13plot, itwaspossibleto localise the presence of the characteristic combination band of the 1stovertone of carbonyl stretching and of amide II at 4618 cm−1, and thevibrational feature assigned to stretching and bending modes of NH at4896 cm−1. In addition, a lipidic component was also identified thanksto the presence of the above mentioned bands at 4341, 4255 cm−1,5701 and 5783 cm−1. This finding has been confirmed by analysesperformed in FTIR microscopy in ATR mode (data not shown).
Concerning the characterisation of the proteinaceous substanceidentified in both layers, it is worth highlighting that, even if all the
10001500200025003000
Wavenumbers (cm-1)
25002410
a first derivative was applied as mathematical pre-treatment: a) PC1map; b) PC2map; c)le: standard reference of lead white, violet profile: standard reference of azurite.
91G. Sciutto et al. / Microchemical Journal 112 (2014) 87–96
different types of proteins commonly used in ancient paintings arecharacterised by similar spectral features in theNIR region, the possibilityto distinguish between animal glue and egg tempera – thanks to the shiftof NH combination bands to higher wavelengths – has been reportedwhen using a macro-NIR imaging system [17]. Indeed, the spectrumextracted from layer 1 was compared with reference spectra obtainedfrom standard substances (Fig. 2). By visual comparison, it was possibleto notice a match with the NH band of animal glue (at around4896 cm−1) — while the marker bands of egg proteins are shiftedto about 4863 cm−1, according to the literature. This outcomewould suggest the presence of a mixture of lipids and proteinaceousmaterials, such as animal glue. However, it is worth remarking thatthe broad shape of the above mentioned band – detected in acomplex and real paint stratigraphy –hampers a definitive identificationof the specific protein.
Finally, in the PC13 score scatter plot, a third group of points,was recognised. This cluster described layer 2 in the PC3 score map,corresponding to the blue pigment layer (Fig. 1g). The average spectralprofile corresponding to layer 2 allowed us to recognise the presence ofazurite (2CuCO3·Cu(OH)2), thanks to the bands at 4253 cm−1 (3rdovertone of CO3), and at 4371 cm−1 (combination bands of OHsymmetric and asymmetric stretching). Moreover, band at 6684 cm−1
was ascribed to 2nd overtone of OH stretching, confirming the identifi-cation of the blue pigment. Despite the fact that hydroxyl and carbonatevibrational modes, partially overlapped with signals of organicmaterials, spectral features of lipidic substances were recognisable
-0.1 -0.08 -0.06 -0.04 -0.02 0 0.02 0.04 0.06 0.08
-0.03
-0.02
-0.01
0
0.01
0.02
0.03
Scores on PC1 (57.2%)
Sco
res
on P
C3
(3.3
%)
50µm
ba
2
1
0
50µm
2
1
0
d
0
1
2
c
Fig. 4. Sample Civ6: a) cross-section microphotographs under visible light; and b) cross-sectionFTIR mapping analysis; c) score map of PC2: d) PC12 score plot: clusters in blue, red and greenrespectively; e) average spectral profiles extracted from layer 0; f) average spectral profiles ex
thanks to bands at 4340 cm−1 and at 5700 and 5781 cm−1. Inaddition, lead white was also localised in the same layer (band at6911 cm−1).
In all of the spectra extracted from paint layers, it was possible toobserve a band in the region between 5150 and 5164 cm−1 ascribableto OH combination stretching and bending. However, such spectralfeatures can neither be univocally attributed to a given componentnor used as diagnostic band, due to their low selectivity. Multivariateanalyses were performed also on spectra recorded in the MIRrange. Although different types of mathematical pre-treatmentswere considered and tested, no satisfactory differentiation amongpaint layers was obtained (Fig. 3a, b, c) in the PC plots. This resultmay be mainly caused by distortion of spectra and overlapping ofbands. Consequently, interpretation of the spectra corresponding tothe different layers of the mapped sample was complicated by thepresence of derivative like and reststrahlen bands. In particular,the identification of the organic binder was uncertain and justfew evidences of the presence of a lipidic material in layer 0 and ofa proteinaceous material in layer 1 were found. Moreover, in layer2 the presence of lead white masked the presence of the lipidic binder(confirmed by NIR spectra). In fact, no diagnostic signal related tothe carbonyl antisymmetric stretching band of oil was observed. Inaddition, it is worth remarking that lead white may present a combina-tion band of symmetric stretching and in-plan bending of CO3
2− at1733 cm−1 for hydrocerussite, overlappedwith the carbonyl stretchingof oil [12]. NIR signals suggested the simultaneous presence of lead
87
88
89
90
91
92
93
94
95
96
97
98
99
100
4000 4500 5000 5500 6000 6500
5209
4257
5208
90.591.091.592.092.593.093.594.094.595.095.596.096.597.097.598.098.599.099.5
100.0
5797
5708
4368
4340
4255
89
90
91
92
93
94
95
96
97
98
99
4048
4263
4345
5204
5799 57
10
e
f
g
Wavenumber (cm-1)
%R
%R
%R
microphotographs under UV illumination. The white boxes indicate the area selected forcorrespond to the points localised within the PC2 score map: layer 0, layer 1 and layer 2,tracted from layer 1; g) average spectral profiles extracted from layer 2.

92 G. Sciutto et al. / Microchemical Journal 112 (2014) 87–96
white and azurite in layer 2 which were both identified in the MIRrange thanks to the presence of weak bands at 2500 and 2410(Fig. 3d) corresponding to combination band of symmetric andantisymmetric stretching of CO3
2− and/or combination of in-planand out-of plan bending of CO3
2− for azurite and cerussite, respectively.Concerning lead white, broad signals at 6911 and 2410 cm−1 werecharacterised by a very low intensity. Indeed, their simultaneouspresence was extremely useful for the characterisation. MIR spectraallowed to identify the presence of calcite in layer 0, whose NIR
83
84
8586
87
8889
90
9192
93
9495
96
9798
99100
4346
4061
4160
5737
5868
86
87
88
89
90
91
92
93
94
95
96
97
98
99100
4048
4204
4261
4344
5200
5702
5788
78
80
82
84
86
88
90
92
94
96
98
100
4500 5000 5500 6000
4052
4211
4263
4343
4683
5200
5704
5794
8485
86
87
88
89
90
91
92
93
94
95
96
97
98
99100
4061
4163
5198
5741
5891
a
b
c
d
Wavenumber (cm-1)
%R
%R
%R
%R
Fig. 5. NIR spectra of standard resins: a) dammar; b) mastic; c
signal at around 4260 cm−1 (3nd overtone of CO stretching) [12]was probably hindered by absorption related to the lipidic binder.
3.2. Sample Civ6
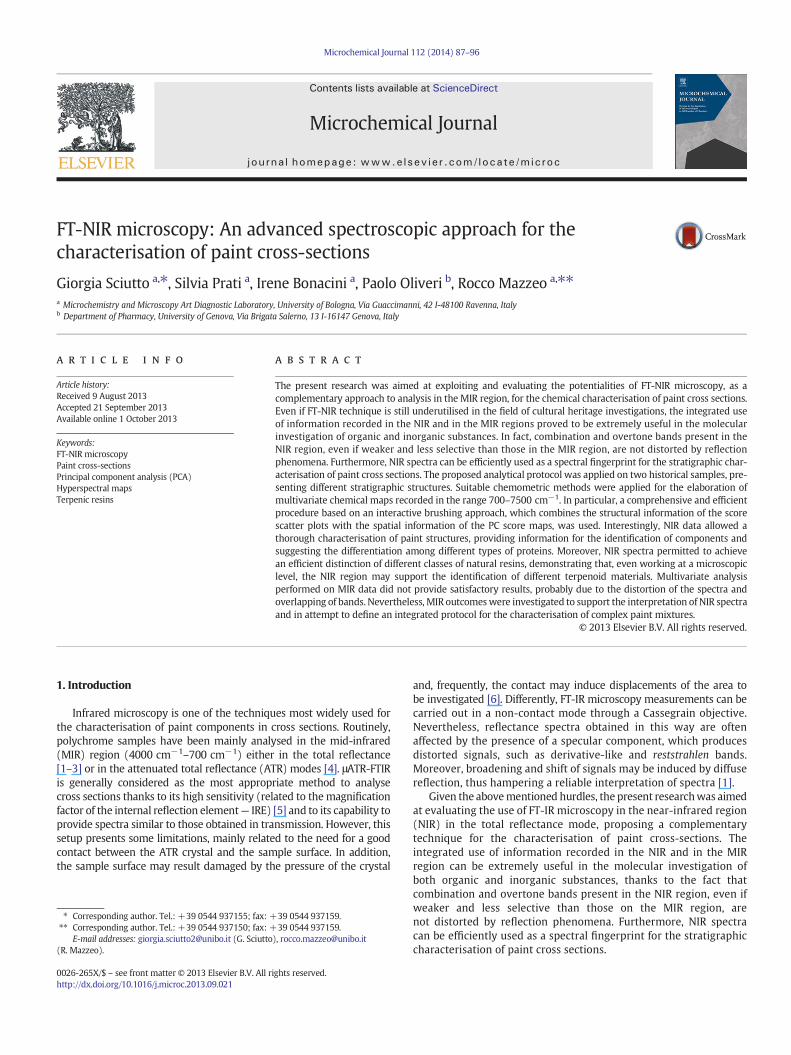
The cross-section of sample Civ6, shown in Fig. 4, was studied in anattempt to achieve information related to the gilding techniqueemployed by the artist, addressing attribution purposes. Indeed,the investigation on the sample was aimed at characterising all the
74
76
78
80
82
84
86
88
90
92
94
96
98
4055
4149
4238
4348
5711
5842
6102
85
86
87
88
89
90
91
92
93
94
95
96
97
98
99100
4063
4250
4292
4349
4615
472852
17
5733
589561
20
88
89
90
91
92
93
94
95
96
97
98
99
4062
4253
4292
4353
4616
472752
12
5731
5820
589161
20
e
f
g
4500 5000 5500 6000
Wavenumber (cm-1)
%R
%R
%R
) shellac; d) oil; e) colophony; f) sandarac; and g) copal.

93G. Sciutto et al. / Microchemical Journal 112 (2014) 87–96
stratigraphic components and, in particular, the organic layer responsiblefor the intense fluorescence detected under UV illumination (Fig. 4b).The hyperspectral map was acquired on a portion of the paintstratigraphy containing three different layers (white boxes inFig. 4a and b). In more detail, over a whitish ground layer (layer 0)it is possible to identify the presence of an irregular blue paintlayer (layer 1), which is covered by a thick brown layer (layer 2),characterised by the peculiar fluorescence emission mentionedabove. This thick layer is probably applied as a mordant for theapplication of a gold leaf, which is no longer present in the fragment.
The hyperspectral data matrix of sample Civ6 was submitted todifferent mathematical pre-treatments. In the case of the MIR spectralregion, no mathematical correction was helpful to provide a thoroughcharacterisation of the entire cross-section by PCA. Conversely, for theNIR range, a first derivative coupled with SNV transform, provided asatisfactory resolution of all the layers of the sample by PCA.
In more detail, PC2 score map allowed the complete differentiationof all the layers (Fig. 4c).
The average spectral profile extracted from points selected fromthe PC12 score scatter plot (Fig. 4d) and related to layer 0, allowedthe characterisation of the ground thanks to the absorption band at4257 cm−1 (Fig. 4e), which can be ascribed, according to the literature[28,29], to the presence of calcite (3rd overtone of CO stretching). It isworth remarking that several studies have been reported concerningthe spectral characterisation of calcium carbonates and their discrimi-nation in the NIR region. In fact, calcium carbonate minerals present adiagnostic band which can vary between 4291 and 4255 cm−1,depending on purity level and mineral composition [12,28–31]. In thecase of sample Civ6, even if the identification can be ambiguous dueto signals arising from the upper layer containing azurite (which havesimilar absorptions in this region) spectral signals in the MIR regionrelated to reststrahlen bands at 1408 and 872 cm−1 (stretching andbending of CO, respectively) confirmed the attribution.
Moreover, calcium carbonate was probably mixed with silicates(5209 cm−1, combination band of OH antisymmetric stretchingand OH bending) [11]. Chemometric analysis permitted to obtain acomplete characterisation discrimination of layer 1 (Fig. 4c), showingthe presence of azurite as blue pigment. Indeed, the bands at4368 cm−1 supported the identification of such pigment (Fig. 4f).Unluckily, the weak band at higher wavenumbers (6684 cm−1)was not detectable, probably due to the low signal-to-noise ratio
Table 1Natural resin signals in the NIR region obtained in total reflection mode.
Colophony Copal Sandarac Mastic
6120 61176102
5893 58915891
58425820
57415711 5733 5731
5217 5198
4728 47274663
4615 46164348 4349 4353 4352
4292 4292
4238 4250 42534241
4149 41634055 4063 4062 4061
affecting such portion of the spectral range in the map. Also in thislayer the presence of silicates (band at 5206 cm−1) was detected.In addition, the shoulder band at 4340 cm−1 suggested the presenceof lipidic materials (probably oil). The detection of the organic com-ponent, probably used as binding medium, allowed us to postulatethe use of the secco painting technique for the mural decoration.
Interpretation of MIR bands provided complementary informationfor chemical characterisation. In fact, the spectra suggested the contem-porary presence of calcite (reststrahlen band at 872 cm−1) and azurite(reststrahlen band at 1497 cm−1), while no information was obtainedon the organic binder (data not shown).
Within the PC12 score plot, it was possible to identify the presence ofa well clustered group of scores, characterised by high values along PC2and corresponding to layer 2. The examination of the average spectrumof points of this layer (Fig. 4g) suggested the presence of a lipidicmaterial, such as shellac or a siccative oil, which show similar spectralfeatures in the NIR region [11]. Indeed, it is known that oil and/orterpenic resins could be employed as mordent. In particular, the use ofshellac has been mentioned as alternative mordent for particularlyporous surfaces, instead of linseed oil [32] and its occurrence wasdated back to the 15th century, when the resin was introduced intoEurope [33].
To tentatively identify the organic material present in this layer,different resins and linseed oil were analysed. Comparing NIR spectra(Fig. 5), it was possible to distinguish the presence of characteristicbands for each category investigated — sesquiterpenic resins(shellac), diterpenic resins containing abietane compounds (colophony),diterpenic resins containing polymerised communic acid (copal,sandarac), triterpenic resins (mastic and dammar) and linseed oil,as reported in Table 1.
Among the other terpenic substances, shellac showed a distinctiveNIR spectrum (Fig. 5c), thanks to the presence of the bands at 4261(CH2 bending and stretching combination band) and 4204 cm−1.However, similar features were present also in siccative oil spectra(Fig. 5d). Diterpenic resins containing polymerised communic acid(Fig. 5f,g) showed peculiar bands at 4250 and a shoulder at4292 cm−1. Moreover, some additional marker spectral featuresare identifiable in copal and sandarac spectra, namely the band ataround 4612 (symmetric CO and CH2 stretching combination band)and 4728 cm−1 (combination band of CO and OH stretching). Onthe other hand, colophony (Fig. 5e) presented a shoulder band at
Dammar Shellac Oil Band assignment [29]
3rd overtone δ(CC)ν(CH2) + δ(CH2)
5868 1st overtone νa(CH2)1st overtone νa(CH2)1st overtone νa(CH2)
5782 5794 1st overtone νa(CH2)5737 1st overtone νs (CH2)
5702 5704 1st overtone νs (CH2)5200 5200 ν(OH) + δ(OH)4819 ν(CO) + ν(OH)
ν(CO) + ν(OH)4670 4683 ν(CO) + ν(CH2)
ν(CO) + ν(CH2)4346 4344 4343 ν(CH2) + δ(CH2)4285
4261 4263 νs (CH2) + δ(CH2)
42044160 νa(CH2) + δ(CH2)4061 4047 4046 3rd overtone δ(CC)

94 G. Sciutto et al. / Microchemical Journal 112 (2014) 87–96
4238 cm−1. Indeed, all the aforementioned bands allowed us todistinguish the two different classes of diterpenic resin, and thesefrom all the other resin specimens analysed.
Some peculiar spectral features were presented also by triterpenicresins (Fig. 5a,b). In particular, band at 4162 cm−1 and at 5868 and5891 cm−1 (1st overtone of CH2 symmetric and antisymmetricstretching) for dammar and mastic, respectively were revealed.
In order to evaluate the importance of these differences in thediscrimination of resins, and the possibility to distinguish shellac and
-50 -40 -30 -20-1
0
1
2
3
4
5
Score
Fre
quen
cy
-0.06 -0.05 -0.04 -0.03 -0.02
-0.03
-0.025
-0.02
-0.015
-0.01
-0.005
0
0.005
0.01
0.015
0.02
LO10-cor
LO1-corLO3-corLO4-cor
LO5-cor
LO7-LO8-corLO9-cor
SH10-corSH11-cor
SH12-corSH1-corSH2-cor
SH3-cor
SH4-cor
SH5-corSH6-cor
SH7-corSH8-cor
SH9-cor
Scores on
Sco
res
on P
C2
(11.
6%)
a
b
Fig. 6. a) PC12 score plot of standard resins; b) histogram of score values of shellac and linseedsample Civ6 is indicated with the black arrow.
linseed oil, PCAwas performed on nine replicas for each resin specimen.Also in this case, several mathematical pre-treatments for the reductionof unwanted spectral variations were applied, evaluating the effective-ness in the extraction of useful information.
For processing the resin spectral data in the NIR region (6400–5500,5300–4000 cm−1), a second derivative coupled with SNV transformwas chosen.
The PC12 score scatter plot obtained from NIR spectra (Fig. 6a)was able to identify 5 cluster of scores related to: diterpenic resins,
-10 0 10 20
s on PC1
-0.01 0 0.01 0.02 0.03
CO10-corCO1-cor
CO2-corCO3-cor
CO4-cor
CO5-corCO6-cor
CO7-cor
CO8-cor
CO9-cor
@@COL3-2
COL1-1COL1-3
COL2-1
COL2-2
COL2-3
COL3-1
COL3-3
DA1-corDA2-corDA3-corDA4-cor
DA5-corDA6-corDA7-cor
DA8-cor
DA9-cor
cor
MA1-corMA2-corMA3-cor
MA4-corMA5-cor
MA6-corMA7-corMA8-cor
MA9-cor
SA1-cor
SA2-cor
SA3-cor
SA4-corSA5-corSA6-cor
SA7-corSA8-cor
SA9-cor
PC1 (61.4%)
CIV6
oil along PC1. The score projection of the average spectral profile extracted from layer 2 of

95G. Sciutto et al. / Microchemical Journal 112 (2014) 87–96
diterpenic resins with a polymerised components and triterpenic resin(mastic and dammar, which seem to be differentiated within the scorespace). However, it was not possible to clearly distinguish shellac fromlinseed oil.
As expected, the average spectral profile, of points of layer 2 of theNIR map, was positioned within the score scatter plot, close to theshellac-linseed oil dispersion area, along PC1.
Subsequently, the focus was put on the separation between shellacand linseed oil, which were therefore analysed separately. PCAperformed on spectra of these two classes – treated in the same wayas in the previous case – showed a clear differentiation, on PC1(Fig. 6b), between shellac (at positive score values) and siccative oil(at negative score values).
An average spectrum from layer 2 of sample Civ6, after analogouspre-treatment, was projected onto PC1: its score clearly falls in theshellac region, suggesting the presence of such terpenic resin in thereal sample, even if the simultaneous presence of oil cannot beexcluded.
The interpretation of the spectramay be supported by the integrationof the two spectral regions investigated. Indeed, considering the MIRregion, it was possible to suppose the presence of a resinous materialthanks to the presence of a derivative like band corresponding tothe C_O stretching at 1710 cm−1. However, by examination of thisregion, it was not possible to selectively identify any particular natu-ral resin.
To confirm the identification of the sesquiterpenic resin, macro-ATR analysis in the FIR range has been performed on the externalsurface of the sample [36]. The spectrum acquired revealed severalanalogies in the position and shape of the bands at 524 cm−1 and216 cm−1, compared with those of standard shellac spectral pro-file (Fig. 7). Probably, signals arising from the blue layer werealso detectable: azurite could be revealed thanks to the bandsat 453 cm−1 and 395 cm−1. Moreover, the broad band at about285 cm−1 could be indicative for the presence of calcium car-bonate [34].
Shellac
525
10
20
30
40
50
60
70
80
90
100
525
CIV6
400500 600 Wavenumbe
453
8990919293949596979899
100
88
%R
%R
Fig. 7. Comparison between spectra obtained by FIR spectroscopy inmacro-ATRmode of: a) sta
4. Conclusions
The present study presents a suitable application of FTIRmicroscopyin the NIR range, using the total reflection mode, able to provide usefulinformation for the characterisation of both organic and inorganicsubstances within complex paint stratigraphies.
Such a type of micro-spectroscopy has been underemployed sofar and its potentialities have not been systematically investigated inprevious researches in the field of cultural heritage.
The outcomes of multivariate exploratory analysis showed that theNIR region was more effective than the MIR one in describing paintstratigraphies, providing information for the identification of bindingmedia and supporting the characterisation of proteinaceous compo-nents at a microscopic level. In fact, MIR data, which were investigatedto support the interpretation of NIR spectra and in attempt to definean integrated protocol, resulted to be more affected by distortion ofspectra and overlapping of bands.
Moreover, NIR spectra allowed to efficiently distinguish differentclasses of natural resins, such as sesquiterpenic, diterpenic, diterpenicwith polymerised communic acid and triterpenic resins. Such anevidence helped in the chemical characterisation of a mordent layerobserved in a real paint stratigraphy, showing that NIR spectroscopymay be extremely useful in an integrated protocol for the recognitionof different terpenoid materials within paint layers.
In conclusion, FT-NIR microscopy can be definitely considered asa valuable complementary tool for the characterisation of complexpaint stratigraphies. Moreover, it is worth remarking that theexploitation of the enlarged spectral range (NIR-MIR) matchedwith PCA represents an efficient exploratory procedure for studieson micro-paint samples.
Acknowledgements
The present work was carried out with the support of the 7° FP(CHARISMA — Cultural heritage Advanced Research Infrastructures:
216
219
200 300 rs (cm-1)
395
285
ndard shellac specimen (blue profile) and b)mordant layers 3 of sample CIV6 (red profile).
96 G. Sciutto et al. / Microchemical Journal 112 (2014) 87–96
Synergy for a Multidisciplinary Approach to Conservation/RestorationProject No. 228330).
References
[1] F. Rosi, A. Federici, B.G. Brunetti, A. Sgamellotti, S. Clementi, C. Miliani, Multivariatechemicalmapping of pigments and binders in easel painting cross-sections bymicroIR reflection spectroscopy, Anal. Bioanal. Chem. 399 (2011) 3133–3145.
[2] S. Prati, F. Rosi, G. Sciutto, P. Oliveri, E. Catelli, B. Brunetti, C. Miliani, R. Mazzeo, C.Miliani, Evaluation of the effect of different paint cross section preparation methodson the performances of Fourier transformed infrared microscopy in total reflectionmode, Microchem. J. 110 (2013) 314–319.
[3] J. Van der Weerd, H. Brammer, J.J. Boon, R.M.A. Heeren, Fourier transform infraredmicroscopic imaging of an embedded paint cross-section, Appl. Spectrosc. 56(2002) 275–283.
[4] S. Prati, E. Joseph, G. Sciutto, R. Mazzeo, New advances in the application of FTIRmicroscopy and spectroscopy for the characterization of artistic materials, Acc.Chem. Res. 43 (2010) 792–801.
[5] E. Joseph, S. Prati, G. Sciutto, M. Ioele, P. Santopadre, R. Mazzeo, Performanceevaluation of mapping and linear imaging FTIR microspectroscopy for thecharacterisation of paint cross sections, Anal. Bioanal. Chem. 396 (2010)899–910.
[6] S. Prati, F. Rosi, G. Sciutto, R. Mazzeo, D. Magrini, S. Sotiropoulou, M. Van Bos,Evaluation of the effect of six different paint cross section preparation methodson the performances of Fourier Transformed Infrared microscopy in attenuatedtotal reflection mode, Microchem. J. 103 (2012) 79–89.
[7] M. Blanco, A. Peguero, Analysis of pharmaceuticals by NIR spectroscopy without areference method, Analyst 29 (2010) 1127–1136.
[8] M. Cruz Sarraguça, J. Almeida Lopez, Quality control of pharmaceuticals with NIR:From lab to process line, Vib. Spectrosc. 42 (2009) 204–210.
[9] L.M. Reid, C.P. O'Donnell, G. Downey, Recent technological advances for the determi-nation of food authenticity, Trends Food Sci. Technol. 17 (2006) 344–353.
[10] G. Lachenal, Dispersive and Fourier transform near-infrared spectroscopy ofpolymeric materials, Vib. Spectrosc. 9 (1995) 93–100.
[11] M. Vagnini, C. Miliani, L. Cartechini, P. Rocchi, B.G. Brunetti, A. Sgamellotti, FT-NIRspectroscopy for non-invasive identification of natural polymers and resins ineasel paintings, Anal. Bioanal. Chem. 395 (2009) 2107–2118.
[12] C. Miliani, F. Rosi, A. Daveri, B.G. Brunetti, Reflection infrared spectroscopy forthe non-invasive in situ study of artists' pigments, Appl. Phys. A 106 (2012)295–307.
[13] F. Rosi, A. Daveri, B. Doherty, S. Nazzareni, B.G. Brunetti, A. Sgamellotti, C. Miliani, Onthe use of overtone and combination bands for the analysis of the CaSO4-H2Osystem by mid-infrared reflection spectroscopy, Appl. Spectrosc. 64 (2010)956–963.
[14] C. Milani, F. Rosi, A. Burnstock, B.G. Brunetti, A. Sgamellotti, Non-invasive in-situinvestigations versus micro-sampling: a comparative study on a Renoirs painting,Appl. Phys. A 89 (2007) 849–856.
[15] F. Rosi, A. Daveri, C. Miliani, G. Verri, P. Benedetti, F. Piqué, B.G. Brunetti, A.Sgamellotti, Non-invasive identification of organic materials in wall paintings byfiber optic reflectance infrared spectroscopy: a statistical multivariate approach,Anal. Bioanal. Chem. 385 (2010) 2097–2106.
[16] T. Trafela, M. Strlicˇ, J. Kolar, D.A. Lichtblau, M. Anders, D. Pucko Mencigar, B. Pihlar,Nondestructive analysis and dating of historical paper based on IR spectroscopy andchemometric data evaluation, Anal. Chem. 79 (2007) 6319–6323.
[17] K.A. Dooley, S. Lomax, J.G. Zeibel, C. Miliani, P. Ricciardi, A. Hoenigswald, M. Loew,J.K. Delaney,Mapping of egg yolk and animal skin glue paint binders in Early Renais-sance paintings using near infrared reflectance imaging spectroscopy, Analyst(2013), http://dx.doi.org/10.1039/C3AN00926B.
[18] T. Poli, O. Chiantore, A. Giovagnoli, A. Piccirillo, FTIR imaging investigation in MIRand in an enlarged MIR-NIR spectral range, Anal. Bioanal. Chem. 402 (2012)2977–2984.
[19] G. Sciutto, P. Oliveri, S. Prati, M. Quaranta, S. Bersani, R. Mazzeo, An advancedmultivariate approach for processing X-ray fluorescence spectral and hyperspectraldata from non-invasive in situ analyses on painted surfaces, Anal. Chim. Acta. 752(2012) 30–38.
[20] G. Sciutto, P. Oliveri, S. Prati, M. Quaranta, S. Lantieri, R. Mazzeo, Analysis of paintcross-sections: a combined multivariate approach for the interpretation ofμATR-FTIR hyperspectral data arrays, Anal. Bioanal. Chem. 405 (2013) 625–633.
[21] A. Andreotti, I. Bonaduce, M.P. Colombini, G. Gautier, F. Modugno, E. Ribechini,Combined GC/MS analytical procedure for the characterization of glycerolipid,waxy, resinous, and proteinaceous materials in a unique paint microsample,Anal. Chem. 78 (2006) 4490–4500.
[22] M.T. Doménech-Carbò, Novel analytical methods for characterising binding mediaand protective coatings in artworks, Anal. Chim. Acta. 621 (2008) 109–139.
[23] G. Chiavari, D. Fabbri, S. Prati, Characterisation of natural resins by pyrolysis–silylation, Chromatographia 55 (2002) 611–616.
[24] A. Nevin, D. Comelli, I. Osticioli, L. Toniolo, G. Valentini, R. Cubeddu, Assessment ofthe ageing of triterpenoid paint varnishes using fluorescence, Raman and FTIRspectroscopy, Anal. Bioanal. Chem. 395 (2009) 2139–2149.
[25] O. Katsibiri, R.F. Howe, Characterisation of the transparent surface coatings onpost-Byzantine icons using microscopic, mass spectrometric and spectroscopictechniques, Microchem. J. 94 (2010) 14–23.
[26] S. Prati, G. Sciutto, R. Mazzeo, C. Torri, D. Fabbri, Application of ATR-far-infraredspectroscopy to the analysis of natural resins, Anal. Bioanal. Chem. 399 (2011)3081–3091.
[27] S. Prati, G. Sciutto, E. Catelli, A. Hashashina, R. Mazzeo, Development of innovativeembedding procedures for the analyses of paint cross sections in ATR FITRmicroscopy, Anal. Bioanal. Chem. 405 (2013) 895–905.
[28] G.R. Hunt, Spectral signatures of particulate minerals in the visible and near infrared,Geophysics 42 (1977) 501–513.
[29] S. Gunasekaran, G. Anbalagan, S. Pandi, Raman and infrared spectra of carbonates ofcalcite structure, J. Raman Spectrosc. 37 (2006) 892–899.
[30] F. van der Meer, Sequential indicator conditional simulation and indicator krigingapplied to discrimination of dolomitization in GER 63-Channel imaging, Nonrenew.Resour. 3 (1994) 146–164.
[31] S.J. Gaffey, Spectral reflectance of carbonate minerals in the visible and near infrared(0.35–2.55 microns): calcite, aragonite, and dolomite, Am. Mineral. 71 (1986)151–162.
[32] R. Mayer, The Artist's Handbook of Materials and Techniques, Faber and Faber,London, 1951.
[33] M.P. Merrifield, Medieval and Renaissance Treatises on the Arts of Painting, DoverPublications, Mineola, New York, 1967.
[34] E.L. Kendix, S. Prati, R. Mazzeo, E. Joseph, G. Sciutto, C. Fagnano, FAR infraredspectroscopy in the field of cultural heritage, e-PS 7 (2010) 8–13.