Fracture analysis of functionally graded materials with U- and V-notches under mode I loading using...
14
doi: 10.1111/j.1460-2695.2011.01655.x Fracture analysis of functionally graded materials with U- and V-notches under mode I loading using the averaged strain-energy density criterion S. MEHRAN 1 , S. ROUHI 1 , B. RAMZANI 1 and E. BARATI 2 1 Department of Mechanical Engineering, Islamic Azad University, Langaroud Branch, Langaroud, Gilan, Iran, 2 Mechanical and Aerospace Engineering Department, Malek-Ashtar University of Technology, Shahinshahr, Esfahan, Iran Received in final form 31 October 2011 ABSTRACT One of the most powerful criteria to predict the critical fracture load in plates with notches is the strain-energy density averaged over a well-defined control volume ahead of the notch tip. Although the averaged strain-energy density (ASED) criterion has been proposed for homogeneous materials, it has been shown in this paper that this criterion can also be applied for non-homogeneous materials, especially for functionally graded materials (FGMs). A numerical method has been used to evaluate the control volume boundary, the averaged strain-energy density over the control volume, and also the critical fracture load in FGMs under mode I loading. A new set of experimental results on fracture of blunt V-notched samples made of austenitic–martensitic functionally graded steel under mode I loading have been provided. Keywords ASED criterion; fracture load; FGM; notches. NOMENCLATURE ASED = averaged strain-energy density a = notch depth B = thickness of the specimen E = Young’s modulus E 1 = strain energy over the control volume F(2α) = a function used in the evaluation of averaged SED for blunt notches F cr = critical fracture load f ij = angular functions defined by Eq. 5 g ij = angular functions defined by Eq. 5 H = a function used for evaluation of averaged SED for blunt notches K IC = material fracture toughness K t = stress concentration factor (SCF) M = martensite layer q = a parameter linked to the V-notch opening angle as defined in Fig. 2 r o = distance between the notch tip and the origin of the polar coordinate system R c = radius of the control volume S = span in 3PB and SENT specimens SED = strain-energy density w = width of the specimen W = averaged strain-energy density Correspondence: S. Mehran. E-mail: [email protected] 614 c 2012 Blackwell Publishing Ltd. Fatigue Fract Engng Mater Struct 35, 614–627
-
Upload
malekeashtar -
Category
Documents
-
view
0 -
download
0
Transcript of Fracture analysis of functionally graded materials with U- and V-notches under mode I loading using...
doi: 10.1111/j.1460-2695.2011.01655.x
Fracture analysis of functionally graded materials with U- andV-notches under mode I loading using the averaged strain-energydensity criterion
S . MEHRAN 1, S . ROUHI 1, B . RAMZANI 1 and E. BARATI 2
1Department of Mechanical Engineering, Islamic Azad University, Langaroud Branch, Langaroud, Gilan, Iran, 2Mechanical and AerospaceEngineering Department, Malek-Ashtar University of Technology, Shahinshahr, Esfahan, Iran
Received in final form 31 October 2011
A B S T R A C T One of the most powerful criteria to predict the critical fracture load in plates with notchesis the strain-energy density averaged over a well-defined control volume ahead of the notchtip. Although the averaged strain-energy density (ASED) criterion has been proposed forhomogeneous materials, it has been shown in this paper that this criterion can alsobe applied for non-homogeneous materials, especially for functionally graded materials(FGMs). A numerical method has been used to evaluate the control volume boundary,the averaged strain-energy density over the control volume, and also the critical fractureload in FGMs under mode I loading. A new set of experimental results on fracture ofblunt V-notched samples made of austenitic–martensitic functionally graded steel undermode I loading have been provided.
Keywords ASED criterion; fracture load; FGM; notches.
N O M E N C L A T U R E ASED = averaged strain-energy densitya = notch depthB = thickness of the specimenE = Young’s modulus
E1 = strain energy over the control volumeF(2α) = a function used in the evaluation of averaged SED for blunt notches
Fcr = critical fracture loadfij = angular functions defined by Eq. 5gij = angular functions defined by Eq. 5H = a function used for evaluation of averaged SED for blunt notches
K IC = material fracture toughnessKt = stress concentration factor (SCF)M = martensite layer
q = a parameter linked to the V-notch opening angle as defined in Fig. 2ro = distance between the notch tip and the origin of the polar coordinate
systemRc = radius of the control volumeS = span in 3PB and SENT specimens
SED = strain-energy densityw = width of the specimen
W = averaged strain-energy density
Correspondence: S. Mehran. E-mail: [email protected]
614 c© 2012 Blackwell Publishing Ltd. Fatigue Fract Engng Mater Struct 35, 614–627
FRACTURE ANALYSIS OF FUNCTIONALLY GRADED MATERIALS 615
Wc = critical strain-energy density2α = notch opening angleαo = original ferritic phase of steelγ = austenite phase
γ o = original austenitic phase of steelν = Poisson’s ratioρ = notch root radius
σ max = maximum principal stress at the notch tipσ u = ultimate tensile strength of the material� = control volume
I N T R O D U C T I O N
Functionally graded materials (FGMs) are multi-phasesystems in which composition varies gradually in somedirections to obtain unique mechanical, thermal, and elec-trical properties that distinguish them from the con-ventional composites which in general are of discrete,piecewise nature with sharp interfaces. Although someexperimental and numerical investigations of fracture ofspecimens made of functionally graded materials withcracks are available in the literature (for example Refs[1–8]), there are a few works about fracture assessment ofFGMs with notches. Barati et al.9 evaluated the J-integralin austenitic–martensitic functionally graded steel withU-notches. Only brittle and quasi-brittle regions of theFG steel can be analysed by their work, neglecting theplastic zone at the notch tip. They also studied the effectof the notch depth on the J-integral and the critical frac-ture load in functionally graded aluminium–silicone car-bide composite with U-notches under bending loading.10
More recently, Barati and Alizadeh11 proposed a numer-ical method for evaluating the J-integral in plates madeof functionally graded materials with sharp and blunt V-notches under mode I loading.
One of the most important researching interests in func-tionally graded materials with notches is to predict the
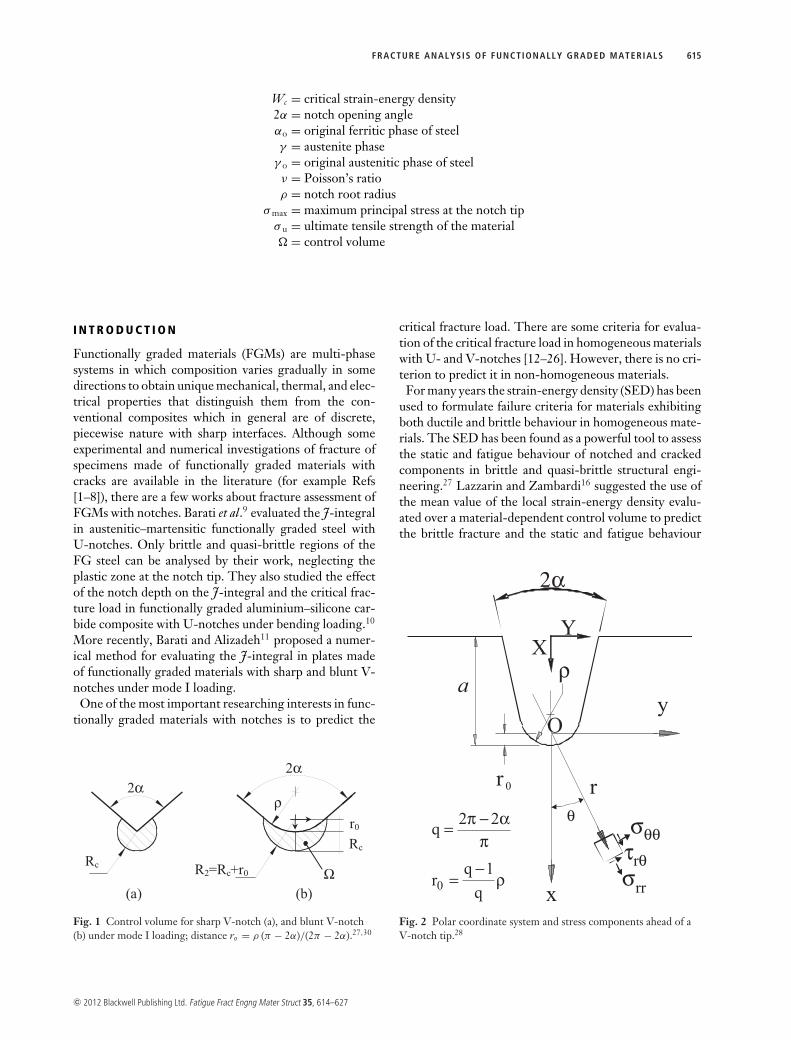
Fig. 1 Control volume for sharp V-notch (a), and blunt V-notch(b) under mode I loading; distance ro = ρ (π − 2α)/(2π − 2α).27,30
critical fracture load. There are some criteria for evalua-tion of the critical fracture load in homogeneous materialswith U- and V-notches [12–26]. However, there is no cri-terion to predict it in non-homogeneous materials.
For many years the strain-energy density (SED) has beenused to formulate failure criteria for materials exhibitingboth ductile and brittle behaviour in homogeneous mate-rials. The SED has been found as a powerful tool to assessthe static and fatigue behaviour of notched and crackedcomponents in brittle and quasi-brittle structural engi-neering.27 Lazzarin and Zambardi16 suggested the use ofthe mean value of the local strain-energy density evalu-ated over a material-dependent control volume to predictthe brittle fracture and the static and fatigue behaviour
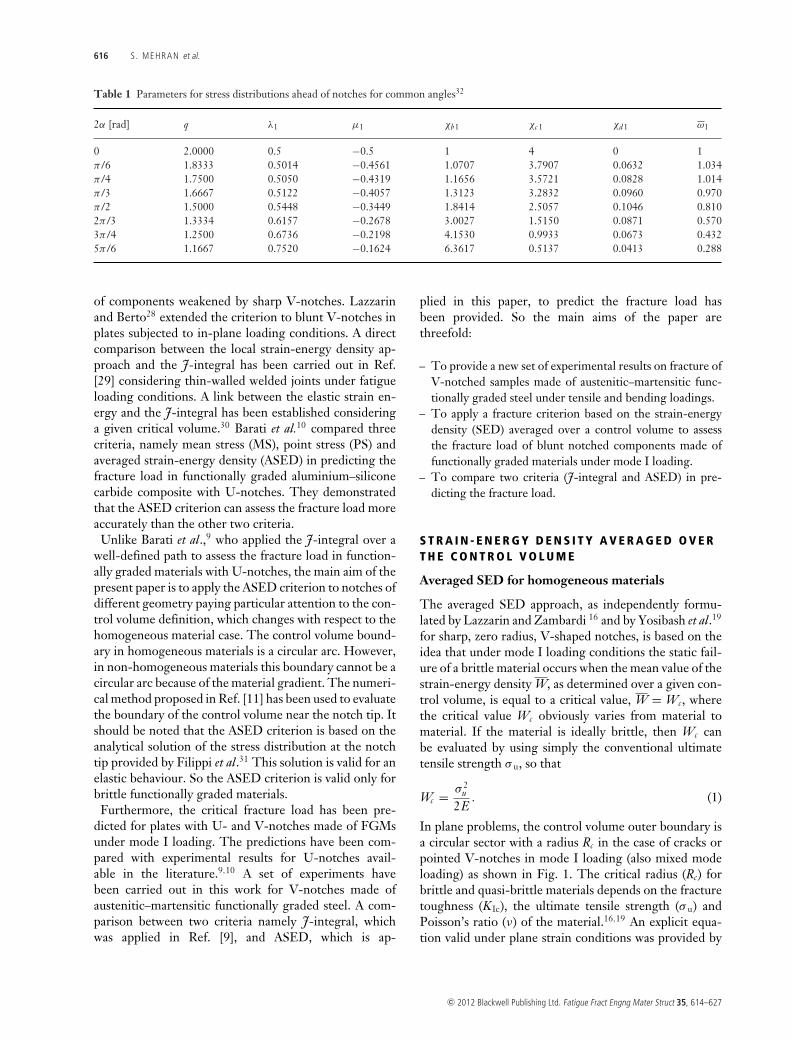
Fig. 2 Polar coordinate system and stress components ahead of aV-notch tip.28
c© 2012 Blackwell Publishing Ltd. Fatigue Fract Engng Mater Struct 35, 614–627
616 S . MEHRAN et al.
Table 1 Parameters for stress distributions ahead of notches for common angles32
2α [rad] q λ1 μ1 χb1 χc 1 χd1 ω1
0 2.0000 0.5 −0.5 1 4 0 1π/6 1.8333 0.5014 −0.4561 1.0707 3.7907 0.0632 1.034π/4 1.7500 0.5050 −0.4319 1.1656 3.5721 0.0828 1.014π/3 1.6667 0.5122 −0.4057 1.3123 3.2832 0.0960 0.970π/2 1.5000 0.5448 −0.3449 1.8414 2.5057 0.1046 0.8102π/3 1.3334 0.6157 −0.2678 3.0027 1.5150 0.0871 0.5703π/4 1.2500 0.6736 −0.2198 4.1530 0.9933 0.0673 0.4325π/6 1.1667 0.7520 −0.1624 6.3617 0.5137 0.0413 0.288
of components weakened by sharp V-notches. Lazzarinand Berto28 extended the criterion to blunt V-notches inplates subjected to in-plane loading conditions. A directcomparison between the local strain-energy density ap-proach and the J-integral has been carried out in Ref.[29] considering thin-walled welded joints under fatigueloading conditions. A link between the elastic strain en-ergy and the J-integral has been established consideringa given critical volume.30 Barati et al.10 compared threecriteria, namely mean stress (MS), point stress (PS) andaveraged strain-energy density (ASED) in predicting thefracture load in functionally graded aluminium–siliconecarbide composite with U-notches. They demonstratedthat the ASED criterion can assess the fracture load moreaccurately than the other two criteria.
Unlike Barati et al.,9 who applied the J-integral over awell-defined path to assess the fracture load in function-ally graded materials with U-notches, the main aim of thepresent paper is to apply the ASED criterion to notches ofdifferent geometry paying particular attention to the con-trol volume definition, which changes with respect to thehomogeneous material case. The control volume bound-ary in homogeneous materials is a circular arc. However,in non-homogeneous materials this boundary cannot be acircular arc because of the material gradient. The numeri-cal method proposed in Ref. [11] has been used to evaluatethe boundary of the control volume near the notch tip. Itshould be noted that the ASED criterion is based on theanalytical solution of the stress distribution at the notchtip provided by Filippi et al.31 This solution is valid for anelastic behaviour. So the ASED criterion is valid only forbrittle functionally graded materials.
Furthermore, the critical fracture load has been pre-dicted for plates with U- and V-notches made of FGMsunder mode I loading. The predictions have been com-pared with experimental results for U-notches avail-able in the literature.9,10 A set of experiments havebeen carried out in this work for V-notches made ofaustenitic–martensitic functionally graded steel. A com-parison between two criteria namely J-integral, whichwas applied in Ref. [9], and ASED, which is ap-
plied in this paper, to predict the fracture load hasbeen provided. So the main aims of the paper arethreefold:
– To provide a new set of experimental results on fracture ofV-notched samples made of austenitic–martensitic func-tionally graded steel under tensile and bending loadings.
– To apply a fracture criterion based on the strain-energydensity (SED) averaged over a control volume to assessthe fracture load of blunt notched components made offunctionally graded materials under mode I loading.
– To compare two criteria (J-integral and ASED) in pre-dicting the fracture load.
S T R A I N - E N E R G Y D E N S I T Y A V E R A G E D O V E RT H E C O N T R O L V O L U M E
Averaged SED for homogeneous materials
The averaged SED approach, as independently formu-lated by Lazzarin and Zambardi 16 and by Yosibash et al.19
for sharp, zero radius, V-shaped notches, is based on theidea that under mode I loading conditions the static fail-ure of a brittle material occurs when the mean value of thestrain-energy density W, as determined over a given con-trol volume, is equal to a critical value, W = Wc, wherethe critical value Wc obviously varies from material tomaterial. If the material is ideally brittle, then Wc canbe evaluated by using simply the conventional ultimatetensile strength σ u, so that
Wc = σ 2u
2E. (1)
In plane problems, the control volume outer boundary isa circular sector with a radius Rc in the case of cracks orpointed V-notches in mode I loading (also mixed modeloading) as shown in Fig. 1. The critical radius (Rc) forbrittle and quasi-brittle materials depends on the fracturetoughness (K Ic), the ultimate tensile strength (σ u) andPoisson’s ratio (ν) of the material.16,19 An explicit equa-tion valid under plane strain conditions was provided by
c© 2012 Blackwell Publishing Ltd. Fatigue Fract Engng Mater Struct 35, 614–627
FRACTURE ANALYSIS OF FUNCTIONALLY GRADED MATERIALS 617
Table 2 H values for notched specimens for some values of Rc/ρ, ν and 2α, under plane strain conditions28
H H2α Rc/ρ v = 0.3 v = 0.35 v = 0.4 2α Rc/ρ v = 0.3 v = 0.35 v = 0.4
0.01 0.5638 0.5432 0.5194 0.01 0.6290 0.6063 0.58010.05 0.5086 0.4884 0.4652 0.05 0.5627 0.5415 0.5172
0 0.1 0.4518 0.4322 0.4099 π/2 0.1 0.4955 0.4759 0.45350.3 0.3069 0.2902 0.2713 0.3 0.3296 0.3144 0.29720.5 0.2276 0.2135 0.1976 0.5 0.2361 0.2246 0.21151 0.1314 0.1217 0.1110 1 0.1328 0.1256 0.11740.01 0.6395 0.6162 0.5894 0.01 0.5017 0.4836 0.46280.05 0.5760 0.5537 0.5280 0.05 0.4465 0.4298 0.4106
π/6 0.1 0.5107 0.4894 0.4651 2π/3 0.1 0.3920 0.3767 0.35910.3 0.3439 0.3264 0.3066 0.3 0.2578 0.2467 0.23390.5 0.2531 0.2386 0.2223 0.5 0.1851 0.1769 0.16761 0.1428 0.1333 0.1226 1 0.1135 0.1079 0.10150.01 0.6678 0.6436 0.6157 0.01 0.4114 0.3966 0.37950.05 0.5998 0.5769 0.5506 0.05 0.3652 0.3516 0.3359
π/3 0.1 0.5302 0.5087 0.4842 3π/4 0.1 0.3206 0.3082 0.29380.3 0.3543 0.3372 0.3179 0.3 0.2082 0.1997 0.19000.5 0.2597 0.2457 0.2301 0.5 0.1572 0.1504 0.14271 0.1435 0.1349 0.1252 1 0.1037 0.0988 0.0932
Yosibash et al.19 with reference to the crack case:
Rc = (1 + ν) (5 − 8ν)4π
(KIC
σu
)2
, (2)
so the control volume is thought of as independent of theloading mode. However, control volume shape dependsnot only on the mechanical properties (K IC, σ u, ν) butalso on the notch root radius. The physical meaning ofthe Rc is a size close to plastic zone.
Equation (2) matches the expressions for the generic V-notch case given in Ref. 16 when the opening angle iszero, Rc = (I1 /π ) (K Ic /σ u)2, with I1 = 0.845 for ν =0.3. The averaged SED approach was later extended byLazzarin and Berto28 to blunt U- and V-notches by usinga crescent shape volume, where Rc was the control volumedepth measured on the notch bisector line (see Fig. 1). Alarge body of experimental data (about 1000 data) fromU- and V-notches in mode I and mixed, I+II, loadingconditions were presented in Ref. 31 in terms of averagedSED as a function of the notch tip radius normalized tocontrol volume radius, ρ/Rc.
With reference to the polar coordinate system shownin Fig. 2, with the origin located at point O, the mode Istress distribution ahead of a V-notch tip is given by thefollowing expressions:32
σi j = a1rλ1−1
[fi j (θ, α) +
(rr0
)μ1−λ1
gi j (θ, α)
](3)
where λ1 > μ1 and the parameter a1 can be expressedeither via the notch stress intensity factor K I in the caseof a sharp, zero radius, V-notch or by means of the elastic
maximum notch stress σ max in the case of blunt V-notches.In Eq. 1, ro is the distance evaluated on the notch bisectorline between the V-notch tip and the origin of the localcoordinate system; ro depends on both the notch rootradius ρ and the opening angle 2α, according to Eq. 4:
ro = ρ
(π − 2α
2π − 2α
)(4)
which gives ro = ρ/2 when 2α = 0 (U-notches). Theangular functions fij and gij are given in Ref. [32]:
⎧⎨⎩
fθθ
frr
frθ
⎫⎬⎭ = 1
1 + λ1 + χb1 (1 − λ1)
×⎡⎣
⎧⎨⎩
(1 + λ1) cos(1 − λ1)θ(3 − λ1) cos(1 − λ1)θ(1 − λ1) sin(1 − λ1)θ
⎫⎬⎭
+ χb1 (1 − λ1)
⎧⎨⎩
cos(1 + λ1)θ− cos(1 + λ1)θsin(1 + λ1)θ
⎫⎬⎭
⎤⎦
⎧⎨⎩
gθθ
grr
grθ
⎫⎬⎭ = q
4(q − 1)[1 + λ1 + χb1 (1 − λ1)]
×⎛⎝χd1
⎧⎨⎩
(1 + μ1) cos(1 − μ1)θ(3 − μ1) cos(1 − μ1)θ(1 − μ1) sin(1 − μ1)θ
⎫⎬⎭
+ χc 1
⎧⎨⎩
cos(1 + μ1)θ− cos(1 + μ1)θsin(1 + μ1)θ
⎫⎬⎭
⎞⎠ .
(5)
c© 2012 Blackwell Publishing Ltd. Fatigue Fract Engng Mater Struct 35, 614–627
618 S . MEHRAN et al.
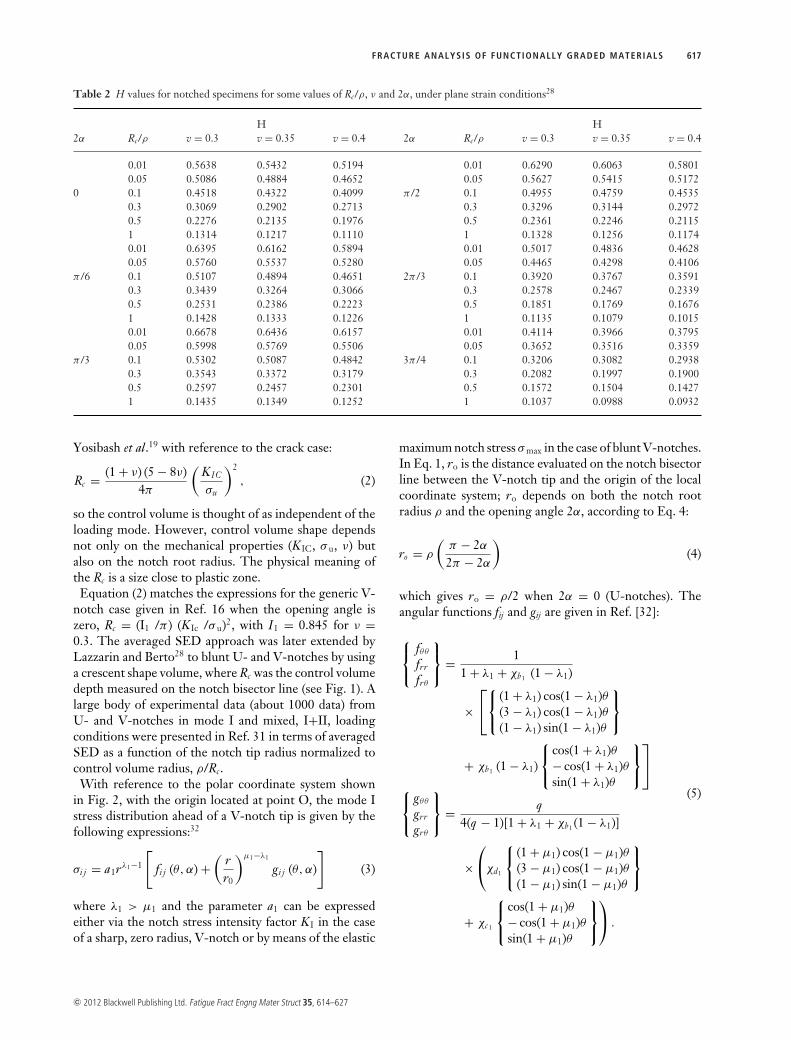
Fig. 3 The parameters in defining the control volume at the notchtip.
All parameters λb1c1and χd1 have closed-form expressions(available in Ref. [32]) but here, for the sake of brevity,only their values related to some notch opening angles arelisted in Table 1.
In the presence of rounded V-notches it is possible tolink the parameter a1 of Eq. 3 to the maximum principalstress present at the notch tip:32
a1 = σmax
rλ1−10
{1 + (1 + μ1) χd1 + χc 1
1 + λ1 + χb1 (1 − λ1)
(q
4 (q − 1)
)}
= σmaxr1−λ10
1 + ω1
(6)
where ω1is the parameter already listed in Table 1. Byusing the elastic maximum notch stress, it is possible todetermine the total strain energy over the area �. Whenthe area embraces only the semicircular edge of the notch(and not its rectilinear flanks), the averaged strain-energydensity (ASED) can be expressed in the following form:30
W = E (e )1
�= F (2α) H(2α,
Rc
ρ) × σ 2
max
E(7)
where F(2α) depends on the previously defined parame-ters:
F (2α) =(
q − 1q
)2(1−λ1)[ √
2π
1 + ω1
]2
(8)
and the function H is listed in Table 2 for some values of2α, Rc/ρ and ν. All the values of Table 2 are valid underplane strain conditions.
Table 3 Chemical composition of alpha and gamma steels(wt.%)9,33
Steel C Si Mn P S Cr Ni
Alpha (αo) 0.2 0.3 0.2 0.05 0.05 – –Gamma (γ o) 0.07 1 2 0.045 0.03 18.15 9.11
In blunt V-notches, the end of the arc and the begin-ning of the rectilinear path occurs in correspondence ofthe angle θ∗. The value of this angle is expressed by thefollowing relationship.28
θ∗ = arctan[
q . cos (α)q . sin (α) − 1
] [q . cos (α)
q . sin (α) − 1
]≥ 0
θ∗ = π − arctan[− q . cos (α)
q . sin (α) − 1
] [q . cos (α)
q . sin (α) − 1
]< 0.
(9)
When θ < θ∗, the notch boundary with reference to thepolar coordinate system (R1(θ )) is given by the followingequation:28
R1 (θ ) = ρ
q
[√cos2 (θ ) + q 2 − 1 − cos (θ )
]. (10)
If the volume embraces also the rectilinear part of thenotch (i.e. θ > θ∗), the boundary becomes28
R1 (θ ) = R1 (θ∗)sin (θ∗) + tan (α) . cos (θ∗)sin (θ ) + tan (α) . cos (θ )
(11)
Averaged SED for functionally graded materials
In functionally graded materials, the control volume outerboundary is not a circular arc because of the gradient char-acterizing the material properties. Therefore, a numericalmethod should be applied to determine the control vol-ume boundary. In this paper, the numerical method pro-posed in Ref. [11] has been used for this purpose. For thesake of clarity, the main steps of the method are brieflysummarized hereafter.
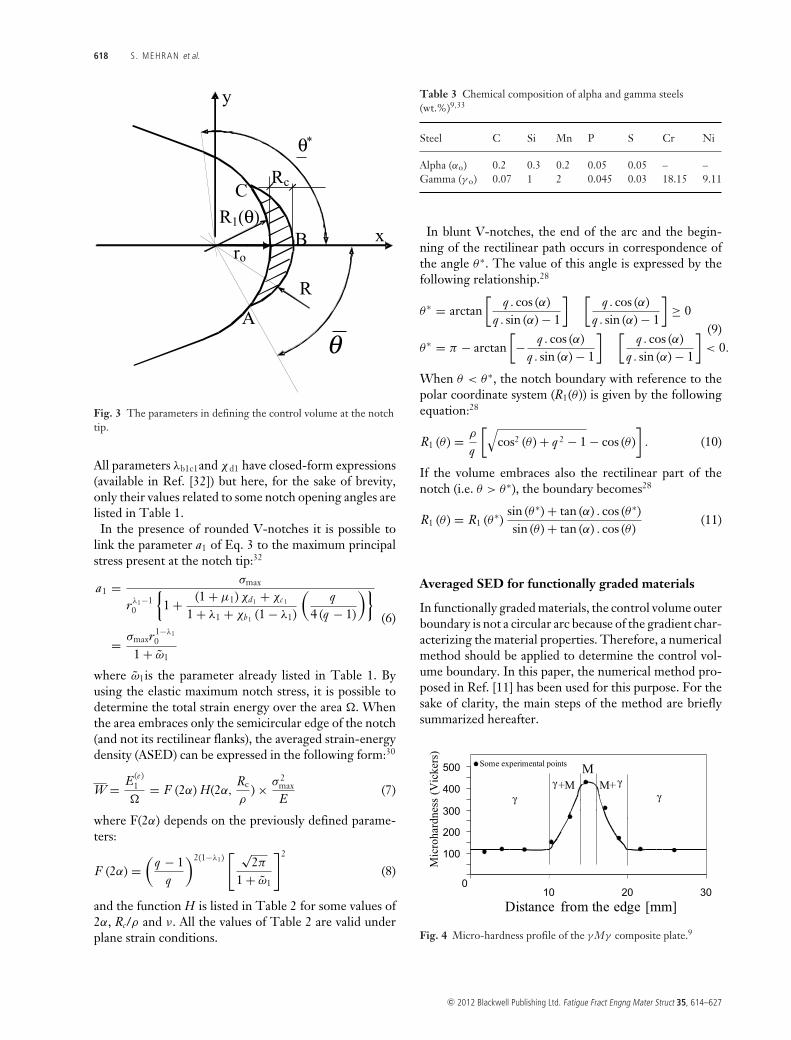
Fig. 4 Micro-hardness profile of the γ Mγ composite plate.9
c© 2012 Blackwell Publishing Ltd. Fatigue Fract Engng Mater Struct 35, 614–627
FRACTURE ANALYSIS OF FUNCTIONALLY GRADED MATERIALS 619
Table 4 Mechanical properties of functionally graded plate madeof austenitic–maretensitic functionally graded steel in austenite andmartensite layer
Property Austenite Martensite
Young’s modulus (GPa) 203 203Poisson’s ratio 0.3 0.3Fracture toughness (MPa m0.5) 107.77 6.09Ultimate tensile strength (MPa) 480 1482Critical radius (RC ) (mm) 13.55 0.0045Critical value of SED (Wc) (MJ/m3) 0.5675 5.4097
The first step to determine the control volume boundaryin FG materials with blunt V- and U-notches is the evalu-ation of the angle θ which gives the intersection betweenthe control volume boundary and the notch boundary(see Fig. 3). The distance between the notch boundaryand the control volume boundary is defined as D wherecan be evaluated by
D = R − R1 (θ ) . (12)
As the distance of the control volume boundary from theorigin of the local coordinate system is always greater thanthat of the notch boundary (except for the last point),the value of D is always positive. Therefore, if D be-comes zero, the control volume boundary meets the notchboundary and the angle θ will be evaluated. In order todefine the control volume boundary, first the angle θ isassumed to be equal to zero and then becomes larger (1◦
in each step). The parameter D is calculated step by step,until D = 0.
For each step, the value of R is first assumed to be equalto the distance between the notch boundary and the originof the local coordinate system (using Eq. 10 or 11), andthen becomes larger (0.001 unit in each step) until thefollowing equations are satisfied:
Xo = R cos (θ ) + a − ro
Yo = R sin (θ )(13)
R = (1 + ν) (5 − 8ν)4π
(KIC (Xo )σu (Xo )
)2
. (14)
In these equations, the parameters Xo and Y o give theposition of a point on the control volume boundary inglobal coordinate system (see Fig. 2). It can be observedthat an implicit equation should be solved to determine Rfor each value of θ .
The stress distribution ahead of a blunt V-notch undermode I loading in functionally graded materials can be
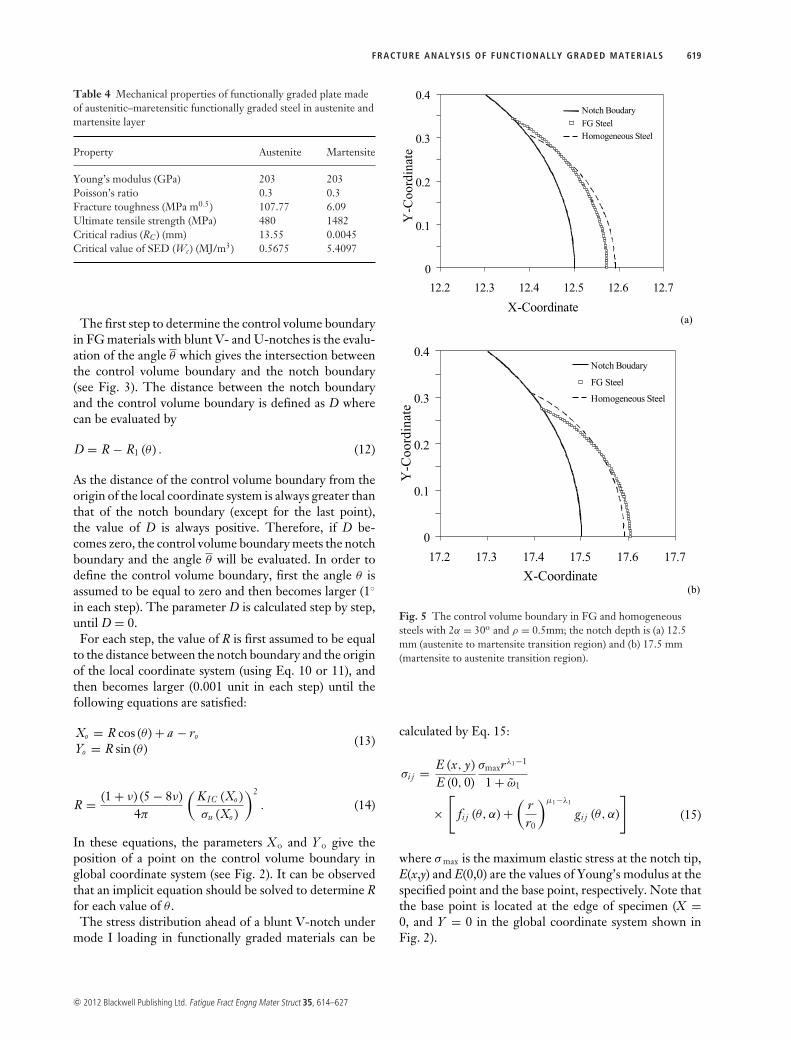
Fig. 5 The control volume boundary in FG and homogeneoussteels with 2α = 30o and ρ = 0.5mm; the notch depth is (a) 12.5mm (austenite to martensite transition region) and (b) 17.5 mm(martensite to austenite transition region).
calculated by Eq. 15:
σi j = E (x, y)E (0, 0)
σmaxrλ1−1
1 + ω1
×[
fi j (θ, α) +(
rr0
)μ1−λ1
gi j (θ, α)
](15)
where σ max is the maximum elastic stress at the notch tip,E(x,y) and E(0,0) are the values of Young’s modulus at thespecified point and the base point, respectively. Note thatthe base point is located at the edge of specimen (X =0, and Y = 0 in the global coordinate system shown inFig. 2).
c© 2012 Blackwell Publishing Ltd. Fatigue Fract Engng Mater Struct 35, 614–627
620 S . MEHRAN et al.
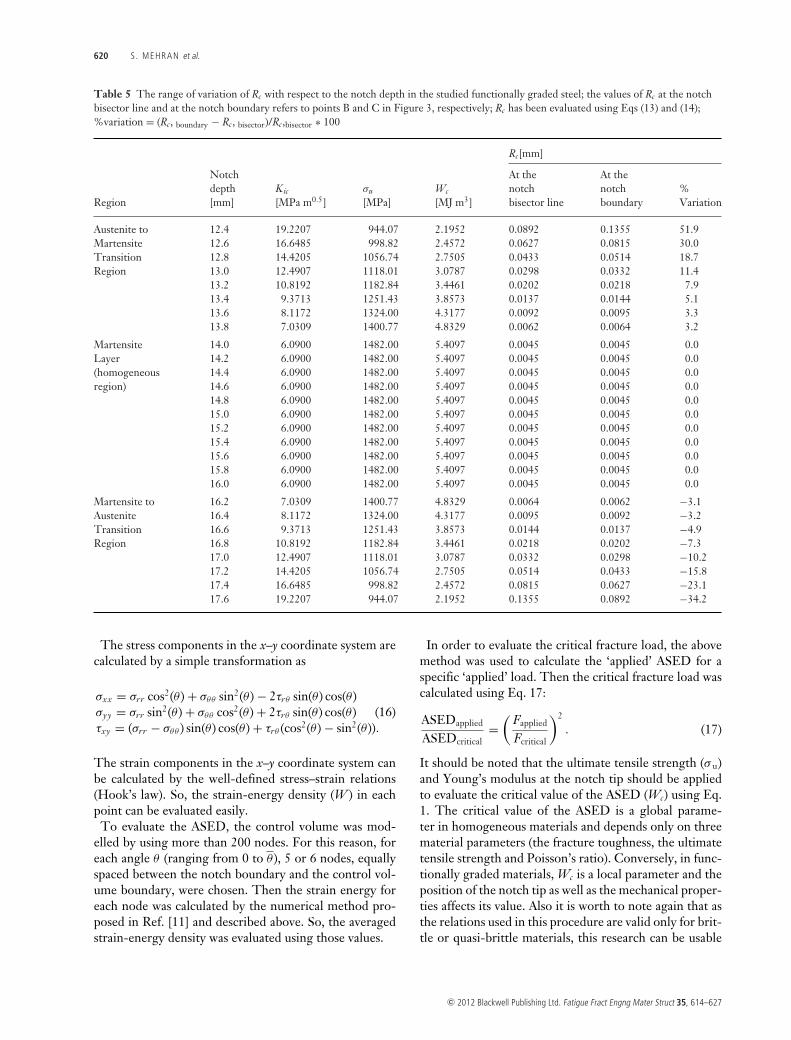
Table 5 The range of variation of Rc with respect to the notch depth in the studied functionally graded steel; the values of Rc at the notchbisector line and at the notch boundary refers to points B and C in Figure 3, respectively; Rc has been evaluated using Eqs (13) and (14);%variation = (Rc, boundary − Rc, bisector)/Rc,bisector ∗ 100
Rc[mm]
Notch At the At thedepth Kic σu Wc notch notch %
Region [mm] [MPa m0.5] [MPa] [MJ m3] bisector line boundary Variation
Austenite to 12.4 19.2207 944.07 2.1952 0.0892 0.1355 51.9Martensite 12.6 16.6485 998.82 2.4572 0.0627 0.0815 30.0Transition 12.8 14.4205 1056.74 2.7505 0.0433 0.0514 18.7Region 13.0 12.4907 1118.01 3.0787 0.0298 0.0332 11.4
13.2 10.8192 1182.84 3.4461 0.0202 0.0218 7.913.4 9.3713 1251.43 3.8573 0.0137 0.0144 5.113.6 8.1172 1324.00 4.3177 0.0092 0.0095 3.313.8 7.0309 1400.77 4.8329 0.0062 0.0064 3.2
Martensite 14.0 6.0900 1482.00 5.4097 0.0045 0.0045 0.0Layer 14.2 6.0900 1482.00 5.4097 0.0045 0.0045 0.0(homogeneous 14.4 6.0900 1482.00 5.4097 0.0045 0.0045 0.0region) 14.6 6.0900 1482.00 5.4097 0.0045 0.0045 0.0
14.8 6.0900 1482.00 5.4097 0.0045 0.0045 0.015.0 6.0900 1482.00 5.4097 0.0045 0.0045 0.015.2 6.0900 1482.00 5.4097 0.0045 0.0045 0.015.4 6.0900 1482.00 5.4097 0.0045 0.0045 0.015.6 6.0900 1482.00 5.4097 0.0045 0.0045 0.015.8 6.0900 1482.00 5.4097 0.0045 0.0045 0.016.0 6.0900 1482.00 5.4097 0.0045 0.0045 0.0
Martensite to 16.2 7.0309 1400.77 4.8329 0.0064 0.0062 −3.1Austenite 16.4 8.1172 1324.00 4.3177 0.0095 0.0092 −3.2Transition 16.6 9.3713 1251.43 3.8573 0.0144 0.0137 −4.9Region 16.8 10.8192 1182.84 3.4461 0.0218 0.0202 −7.3
17.0 12.4907 1118.01 3.0787 0.0332 0.0298 −10.217.2 14.4205 1056.74 2.7505 0.0514 0.0433 −15.817.4 16.6485 998.82 2.4572 0.0815 0.0627 −23.117.6 19.2207 944.07 2.1952 0.1355 0.0892 −34.2
The stress components in the x–y coordinate system arecalculated by a simple transformation as
σxx = σrr cos2(θ ) + σθθ sin2(θ ) − 2τrθ sin(θ ) cos(θ )σyy = σrr sin2(θ ) + σθθ cos2(θ ) + 2τrθ sin(θ ) cos(θ )τxy = (σrr − σθθ ) sin(θ ) cos(θ ) + τrθ (cos2(θ ) − sin2(θ )).
(16)
The strain components in the x–y coordinate system canbe calculated by the well-defined stress–strain relations(Hook’s law). So, the strain-energy density (W ) in eachpoint can be evaluated easily.
To evaluate the ASED, the control volume was mod-elled by using more than 200 nodes. For this reason, foreach angle θ (ranging from 0 to θ ), 5 or 6 nodes, equallyspaced between the notch boundary and the control vol-ume boundary, were chosen. Then the strain energy foreach node was calculated by the numerical method pro-posed in Ref. [11] and described above. So, the averagedstrain-energy density was evaluated using those values.
In order to evaluate the critical fracture load, the abovemethod was used to calculate the ‘applied’ ASED for aspecific ‘applied’ load. Then the critical fracture load wascalculated using Eq. 17:
ASEDapplied
ASEDcritical=
(Fapplied
Fcritical
)2
. (17)
It should be noted that the ultimate tensile strength (σ u)and Young’s modulus at the notch tip should be appliedto evaluate the critical value of the ASED (Wc) using Eq.1. The critical value of the ASED is a global parame-ter in homogeneous materials and depends only on threematerial parameters (the fracture toughness, the ultimatetensile strength and Poisson’s ratio). Conversely, in func-tionally graded materials, Wc is a local parameter and theposition of the notch tip as well as the mechanical proper-ties affects its value. Also it is worth to note again that asthe relations used in this procedure are valid only for brit-tle or quasi-brittle materials, this research can be usable
c© 2012 Blackwell Publishing Ltd. Fatigue Fract Engng Mater Struct 35, 614–627
FRACTURE ANALYSIS OF FUNCTIONALLY GRADED MATERIALS 621
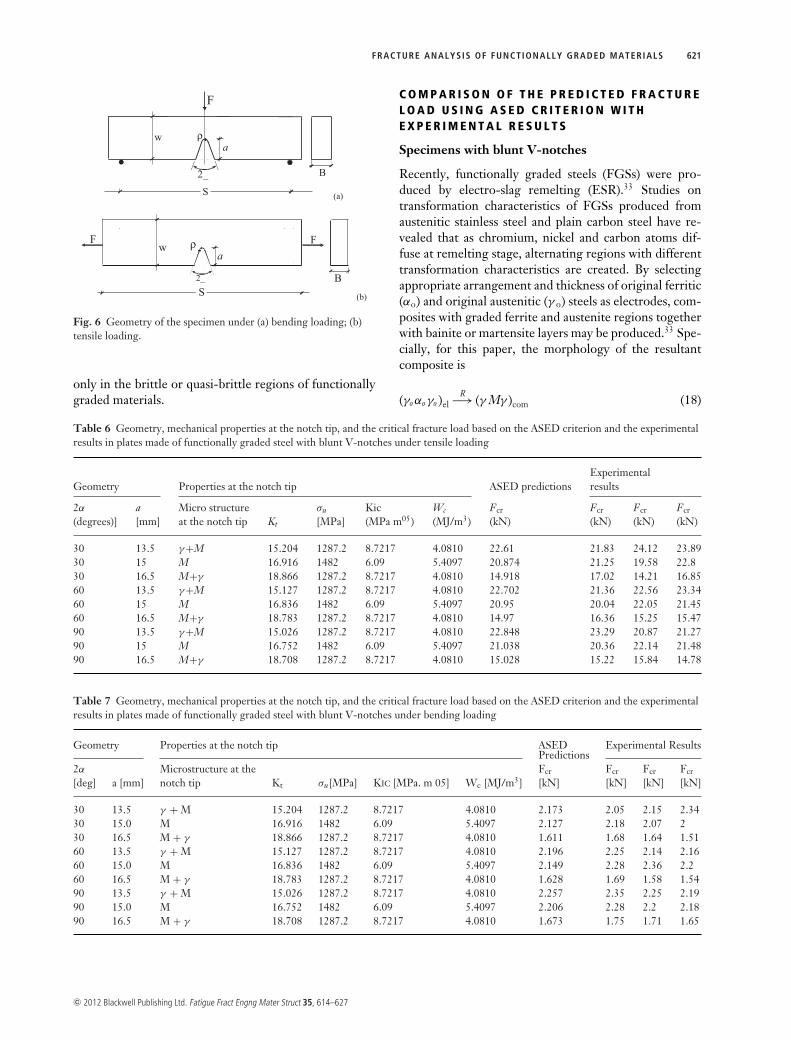
Fig. 6 Geometry of the specimen under (a) bending loading; (b)tensile loading.
only in the brittle or quasi-brittle regions of functionallygraded materials.
C O M P A R I S O N O F T H E P R E D I C T E D F R A C T U R EL O A D U S I N G A S E D C R I T E R I O N W I T HE X P E R I M E N T A L R E S U L T S
Specimens with blunt V-notches
Recently, functionally graded steels (FGSs) were pro-duced by electro-slag remelting (ESR).33 Studies ontransformation characteristics of FGSs produced fromaustenitic stainless steel and plain carbon steel have re-vealed that as chromium, nickel and carbon atoms dif-fuse at remelting stage, alternating regions with differenttransformation characteristics are created. By selectingappropriate arrangement and thickness of original ferritic(αo) and original austenitic (γ o) steels as electrodes, com-posites with graded ferrite and austenite regions togetherwith bainite or martensite layers may be produced.33 Spe-cially, for this paper, the morphology of the resultantcomposite is
(γo αo γo )elR−→ (γ Mγ )com (18)
Table 6 Geometry, mechanical properties at the notch tip, and the critical fracture load based on the ASED criterion and the experimentalresults in plates made of functionally graded steel with blunt V-notches under tensile loading
Geometry Properties at the notch tip ASED predictionsExperimentalresults
2α a Micro structure σu Kic Wc Fcr Fcr Fcr Fcr(degrees)] [mm] at the notch tip Kt [MPa] (MPa m05) (MJ/m3) (kN) (kN) (kN) (kN)
30 13.5 γ+M 15.204 1287.2 8.7217 4.0810 22.61 21.83 24.12 23.8930 15 M 16.916 1482 6.09 5.4097 20.874 21.25 19.58 22.830 16.5 M+γ 18.866 1287.2 8.7217 4.0810 14.918 17.02 14.21 16.8560 13.5 γ+M 15.127 1287.2 8.7217 4.0810 22.702 21.36 22.56 23.3460 15 M 16.836 1482 6.09 5.4097 20.95 20.04 22.05 21.4560 16.5 M+γ 18.783 1287.2 8.7217 4.0810 14.97 16.36 15.25 15.4790 13.5 γ+M 15.026 1287.2 8.7217 4.0810 22.848 23.29 20.87 21.2790 15 M 16.752 1482 6.09 5.4097 21.038 20.36 22.14 21.4890 16.5 M+γ 18.708 1287.2 8.7217 4.0810 15.028 15.22 15.84 14.78
Table 7 Geometry, mechanical properties at the notch tip, and the critical fracture load based on the ASED criterion and the experimentalresults in plates made of functionally graded steel with blunt V-notches under bending loading
Geometry Properties at the notch tip ASED Experimental ResultsPredictions
2α Microstructure at the Fcr Fcr Fcr Fcr[deg] a [mm] notch tip Kt σu[MPa] KIC [MPa. m 05] Wc [MJ/m3] [kN] [kN] [kN] [kN]
30 13.5 γ + M 15.204 1287.2 8.7217 4.0810 2.173 2.05 2.15 2.3430 15.0 M 16.916 1482 6.09 5.4097 2.127 2.18 2.07 230 16.5 M + γ 18.866 1287.2 8.7217 4.0810 1.611 1.68 1.64 1.5160 13.5 γ + M 15.127 1287.2 8.7217 4.0810 2.196 2.25 2.14 2.1660 15.0 M 16.836 1482 6.09 5.4097 2.149 2.28 2.36 2.260 16.5 M + γ 18.783 1287.2 8.7217 4.0810 1.628 1.69 1.58 1.5490 13.5 γ + M 15.026 1287.2 8.7217 4.0810 2.257 2.35 2.25 2.1990 15.0 M 16.752 1482 6.09 5.4097 2.206 2.28 2.2 2.1890 16.5 M + γ 18.708 1287.2 8.7217 4.0810 1.673 1.75 1.71 1.65
c© 2012 Blackwell Publishing Ltd. Fatigue Fract Engng Mater Struct 35, 614–627
622 S . MEHRAN et al.
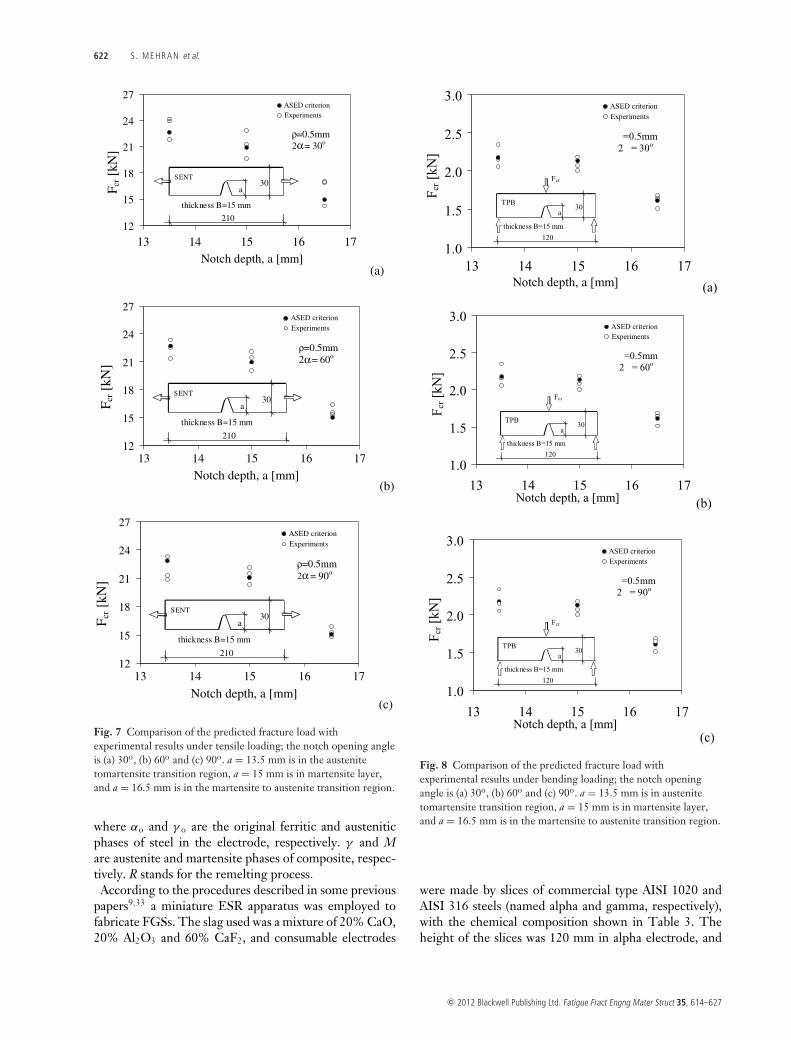
Fig. 7 Comparison of the predicted fracture load withexperimental results under tensile loading; the notch opening angleis (a) 30o, (b) 60o and (c) 90o. a = 13.5 mm is in the austenitetomartensite transition region, a = 15 mm is in martensite layer,and a = 16.5 mm is in the martensite to austenite transition region.
where αo and γ o are the original ferritic and austeniticphases of steel in the electrode, respectively. γ and Mare austenite and martensite phases of composite, respec-tively. R stands for the remelting process.
According to the procedures described in some previouspapers9,33 a miniature ESR apparatus was employed tofabricate FGSs. The slag used was a mixture of 20% CaO,20% Al2O3 and 60% CaF2, and consumable electrodes
Fig. 8 Comparison of the predicted fracture load withexperimental results under bending loading; the notch openingangle is (a) 30o, (b) 60o and (c) 90o. a = 13.5 mm is in austenitetomartensite transition region, a = 15 mm is in martensite layer,and a = 16.5 mm is in the martensite to austenite transition region.
were made by slices of commercial type AISI 1020 andAISI 316 steels (named alpha and gamma, respectively),with the chemical composition shown in Table 3. Theheight of the slices was 120 mm in alpha electrode, and
c© 2012 Blackwell Publishing Ltd. Fatigue Fract Engng Mater Struct 35, 614–627
FRACTURE ANALYSIS OF FUNCTIONALLY GRADED MATERIALS 623
0
400
800
1200
1600
2000
2400
0.0 0.3 0.6 0.9 1.2 1.5
App
lied
Loa
d [k
N]
Load displacement point [mm]
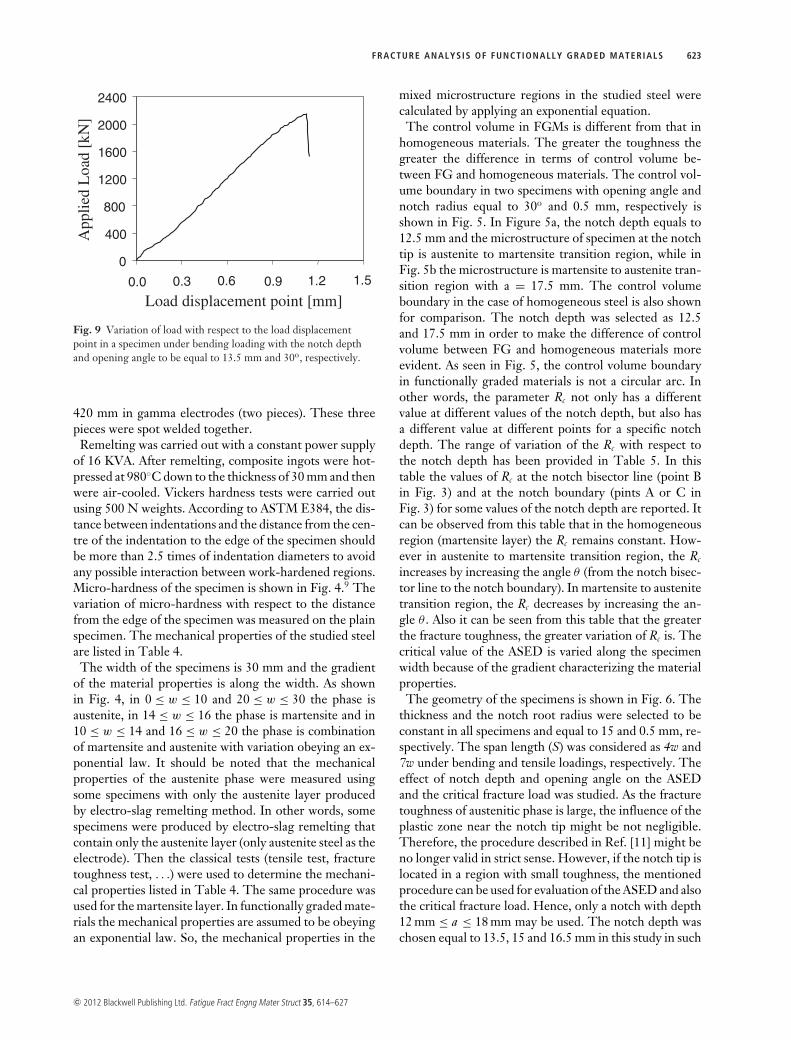
Fig. 9 Variation of load with respect to the load displacementpoint in a specimen under bending loading with the notch depthand opening angle to be equal to 13.5 mm and 30o, respectively.
420 mm in gamma electrodes (two pieces). These threepieces were spot welded together.
Remelting was carried out with a constant power supplyof 16 KVA. After remelting, composite ingots were hot-pressed at 980◦C down to the thickness of 30 mm and thenwere air-cooled. Vickers hardness tests were carried outusing 500 N weights. According to ASTM E384, the dis-tance between indentations and the distance from the cen-tre of the indentation to the edge of the specimen shouldbe more than 2.5 times of indentation diameters to avoidany possible interaction between work-hardened regions.Micro-hardness of the specimen is shown in Fig. 4.9 Thevariation of micro-hardness with respect to the distancefrom the edge of the specimen was measured on the plainspecimen. The mechanical properties of the studied steelare listed in Table 4.
The width of the specimens is 30 mm and the gradientof the material properties is along the width. As shownin Fig. 4, in 0 ≤ w ≤ 10 and 20 ≤ w ≤ 30 the phase isaustenite, in 14 ≤ w ≤ 16 the phase is martensite and in10 ≤ w ≤ 14 and 16 ≤ w ≤ 20 the phase is combinationof martensite and austenite with variation obeying an ex-ponential law. It should be noted that the mechanicalproperties of the austenite phase were measured usingsome specimens with only the austenite layer producedby electro-slag remelting method. In other words, somespecimens were produced by electro-slag remelting thatcontain only the austenite layer (only austenite steel as theelectrode). Then the classical tests (tensile test, fracturetoughness test, . . .) were used to determine the mechani-cal properties listed in Table 4. The same procedure wasused for the martensite layer. In functionally graded mate-rials the mechanical properties are assumed to be obeyingan exponential law. So, the mechanical properties in the
mixed microstructure regions in the studied steel werecalculated by applying an exponential equation.
The control volume in FGMs is different from that inhomogeneous materials. The greater the toughness thegreater the difference in terms of control volume be-tween FG and homogeneous materials. The control vol-ume boundary in two specimens with opening angle andnotch radius equal to 30o and 0.5 mm, respectively isshown in Fig. 5. In Figure 5a, the notch depth equals to12.5 mm and the microstructure of specimen at the notchtip is austenite to martensite transition region, while inFig. 5b the microstructure is martensite to austenite tran-sition region with a = 17.5 mm. The control volumeboundary in the case of homogeneous steel is also shownfor comparison. The notch depth was selected as 12.5and 17.5 mm in order to make the difference of controlvolume between FG and homogeneous materials moreevident. As seen in Fig. 5, the control volume boundaryin functionally graded materials is not a circular arc. Inother words, the parameter Rc not only has a differentvalue at different values of the notch depth, but also hasa different value at different points for a specific notchdepth. The range of variation of the Rc with respect tothe notch depth has been provided in Table 5. In thistable the values of Rc at the notch bisector line (point Bin Fig. 3) and at the notch boundary (pints A or C inFig. 3) for some values of the notch depth are reported. Itcan be observed from this table that in the homogeneousregion (martensite layer) the Rc remains constant. How-ever in austenite to martensite transition region, the Rc
increases by increasing the angle θ (from the notch bisec-tor line to the notch boundary). In martensite to austenitetransition region, the Rc decreases by increasing the an-gle θ . Also it can be seen from this table that the greaterthe fracture toughness, the greater variation of Rc is. Thecritical value of the ASED is varied along the specimenwidth because of the gradient characterizing the materialproperties.
The geometry of the specimens is shown in Fig. 6. Thethickness and the notch root radius were selected to beconstant in all specimens and equal to 15 and 0.5 mm, re-spectively. The span length (S) was considered as 4w and7w under bending and tensile loadings, respectively. Theeffect of notch depth and opening angle on the ASEDand the critical fracture load was studied. As the fracturetoughness of austenitic phase is large, the influence of theplastic zone near the notch tip might be not negligible.Therefore, the procedure described in Ref. [11] might beno longer valid in strict sense. However, if the notch tip islocated in a region with small toughness, the mentionedprocedure can be used for evaluation of the ASED and alsothe critical fracture load. Hence, only a notch with depth12 mm ≤ a ≤ 18 mm may be used. The notch depth waschosen equal to 13.5, 15 and 16.5 mm in this study in such
c© 2012 Blackwell Publishing Ltd. Fatigue Fract Engng Mater Struct 35, 614–627

624 S . MEHRAN et al.
Fig. 10 Microstructure of the fracturedspecimen showing cleavage fracture.
Table 8 Comparison of the predicted fracture load by means of ASED criterion with experimental results in plates made of FG steel withU-notches under bending; the experiments are those reported in [9]
Properties at the notch tip ASEDAveraged value ofExperimental results
Notch depth, a [mm] Kt σu [MPa] KIC [MPa.m0.5] Wc [MJ/m3] Fcr [kN] Fcr [kN]
13.2 4.2071 1183 10.82 3.4461 7.318 7.514.0 4.1400 1482 6.09 5.4097 8.123 8.2515.0 4.0696 1482 6.09 5.4097 7.263 7.4516.0 3.9053 1482 6.09 5.4097 6.594 6.516.8 3.7858 1183 10.82 3.4461 5.028 5.15
a way that the notch tip was located in correspondenceof the austenite to martensite transition region themartensite layer, and the martensite to austenite transi-tion region, respectively. The opening angle was selectedas 2α = 30◦, 60◦, 90◦.
The notches were performed by the wire-cuttingmethod by a CNC machine. During the wire cutting, thehardness increases slightly, but this variation can be ne-glected. For each geometrical configuration the tests wererepeated three times for a total of 54 new experimentalresults (for both tensile and bending loadings). The testswere performed on a servo-controlled INSTRON 8802testing device. An extensometer with ±5 mm nominal dis-placement and ±0.2% error at full scale was used duringthe tests. The load was measured by a 100 kN load cellwith ±0.5% error at full scale. All tests were performedunder displacement control with a constant displacement-rate of 1 mm/min. All tests were carried out at room tem-perature (25◦C).
The geometry of the specimen, the mechanical prop-erties at the notch tip, the critical fracture load basedon the ASED criterion and the experimental results forboth tensile and bending loadings are listed in Tables6 and 7, respectively. Figs 7 and 8 show the results tomake the comparison easier. Note that the nominal stresswas referred to the net area according to the followingequations:
σnom = 3F S2B (w − a)2 Bending
σnom = FB (w − a)
Tension .
(19)
In parallel, the theoretical stress concentration factor (Kt)was determined as
Kt = σmax
σnom(20)
It can be seen from Figures 7 and 8 that the critical frac-ture load presents negligible variation as a function of the
c© 2012 Blackwell Publishing Ltd. Fatigue Fract Engng Mater Struct 35, 614–627
FRACTURE ANALYSIS OF FUNCTIONALLY GRADED MATERIALS 625
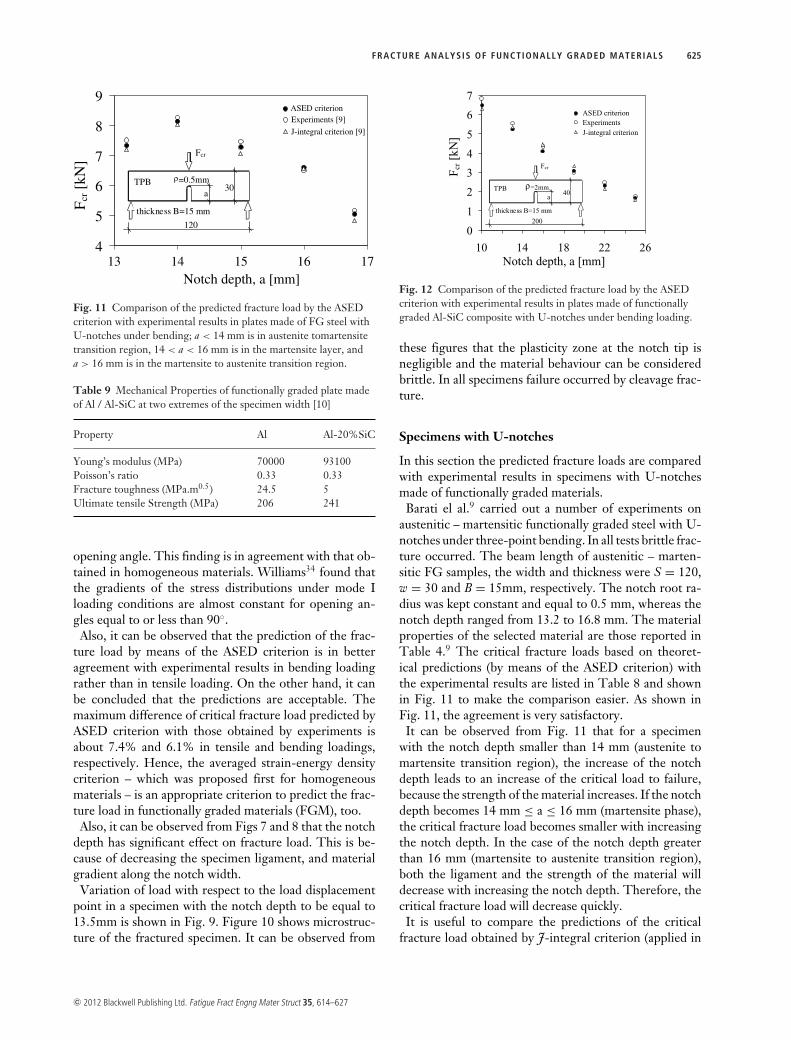
Fig. 11 Comparison of the predicted fracture load by the ASEDcriterion with experimental results in plates made of FG steel withU-notches under bending; a < 14 mm is in austenite tomartensitetransition region, 14 < a < 16 mm is in the martensite layer, anda > 16 mm is in the martensite to austenite transition region.
Table 9 Mechanical Properties of functionally graded plate madeof Al / Al-SiC at two extremes of the specimen width [10]
Property Al Al-20%SiC
Young’s modulus (MPa) 70000 93100Poisson’s ratio 0.33 0.33Fracture toughness (MPa.m0.5) 24.5 5Ultimate tensile Strength (MPa) 206 241
opening angle. This finding is in agreement with that ob-tained in homogeneous materials. Williams34 found thatthe gradients of the stress distributions under mode Iloading conditions are almost constant for opening an-gles equal to or less than 90◦.
Also, it can be observed that the prediction of the frac-ture load by means of the ASED criterion is in betteragreement with experimental results in bending loadingrather than in tensile loading. On the other hand, it canbe concluded that the predictions are acceptable. Themaximum difference of critical fracture load predicted byASED criterion with those obtained by experiments isabout 7.4% and 6.1% in tensile and bending loadings,respectively. Hence, the averaged strain-energy densitycriterion – which was proposed first for homogeneousmaterials – is an appropriate criterion to predict the frac-ture load in functionally graded materials (FGM), too.
Also, it can be observed from Figs 7 and 8 that the notchdepth has significant effect on fracture load. This is be-cause of decreasing the specimen ligament, and materialgradient along the notch width.
Variation of load with respect to the load displacementpoint in a specimen with the notch depth to be equal to13.5mm is shown in Fig. 9. Figure 10 shows microstruc-ture of the fractured specimen. It can be observed from
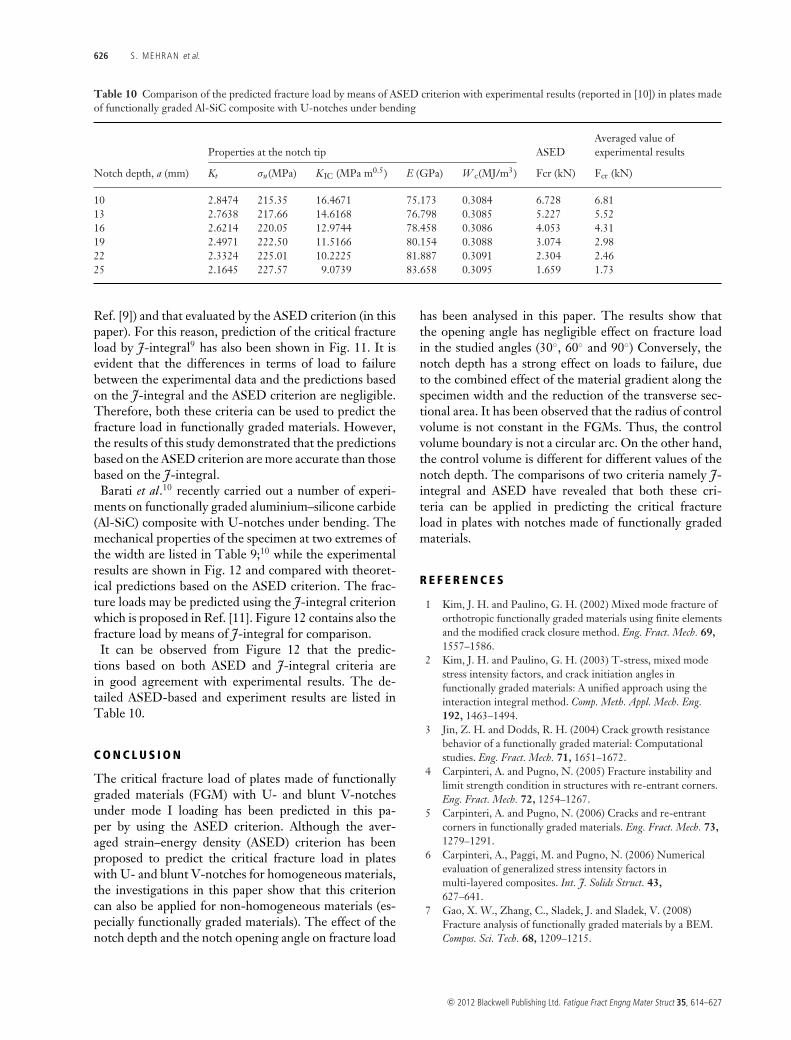
Fig. 12 Comparison of the predicted fracture load by the ASEDcriterion with experimental results in plates made of functionallygraded Al-SiC composite with U-notches under bending loading.
these figures that the plasticity zone at the notch tip isnegligible and the material behaviour can be consideredbrittle. In all specimens failure occurred by cleavage frac-ture.
Specimens with U-notches
In this section the predicted fracture loads are comparedwith experimental results in specimens with U-notchesmade of functionally graded materials.
Barati el al.9 carried out a number of experiments onaustenitic – martensitic functionally graded steel with U-notches under three-point bending. In all tests brittle frac-ture occurred. The beam length of austenitic – marten-sitic FG samples, the width and thickness were S = 120,w = 30 and B = 15mm, respectively. The notch root ra-dius was kept constant and equal to 0.5 mm, whereas thenotch depth ranged from 13.2 to 16.8 mm. The materialproperties of the selected material are those reported inTable 4.9 The critical fracture loads based on theoret-ical predictions (by means of the ASED criterion) withthe experimental results are listed in Table 8 and shownin Fig. 11 to make the comparison easier. As shown inFig. 11, the agreement is very satisfactory.
It can be observed from Fig. 11 that for a specimenwith the notch depth smaller than 14 mm (austenite tomartensite transition region), the increase of the notchdepth leads to an increase of the critical load to failure,because the strength of the material increases. If the notchdepth becomes 14 mm ≤ a ≤ 16 mm (martensite phase),the critical fracture load becomes smaller with increasingthe notch depth. In the case of the notch depth greaterthan 16 mm (martensite to austenite transition region),both the ligament and the strength of the material willdecrease with increasing the notch depth. Therefore, thecritical fracture load will decrease quickly.
It is useful to compare the predictions of the criticalfracture load obtained by J-integral criterion (applied in
c© 2012 Blackwell Publishing Ltd. Fatigue Fract Engng Mater Struct 35, 614–627
626 S . MEHRAN et al.
Table 10 Comparison of the predicted fracture load by means of ASED criterion with experimental results (reported in [10]) in plates madeof functionally graded Al-SiC composite with U-notches under bending
Properties at the notch tip ASEDAveraged value ofexperimental results
Notch depth, a (mm) Kt σu(MPa) K IC (MPa m0.5) E (GPa) W c(MJ/m3) Fcr (kN) Fcr (kN)
10 2.8474 215.35 16.4671 75.173 0.3084 6.728 6.8113 2.7638 217.66 14.6168 76.798 0.3085 5.227 5.5216 2.6214 220.05 12.9744 78.458 0.3086 4.053 4.3119 2.4971 222.50 11.5166 80.154 0.3088 3.074 2.9822 2.3324 225.01 10.2225 81.887 0.3091 2.304 2.4625 2.1645 227.57 9.0739 83.658 0.3095 1.659 1.73
Ref. [9]) and that evaluated by the ASED criterion (in thispaper). For this reason, prediction of the critical fractureload by J-integral9 has also been shown in Fig. 11. It isevident that the differences in terms of load to failurebetween the experimental data and the predictions basedon the J-integral and the ASED criterion are negligible.Therefore, both these criteria can be used to predict thefracture load in functionally graded materials. However,the results of this study demonstrated that the predictionsbased on the ASED criterion are more accurate than thosebased on the J-integral.
Barati et al.10 recently carried out a number of experi-ments on functionally graded aluminium–silicone carbide(Al-SiC) composite with U-notches under bending. Themechanical properties of the specimen at two extremes ofthe width are listed in Table 9;10 while the experimentalresults are shown in Fig. 12 and compared with theoret-ical predictions based on the ASED criterion. The frac-ture loads may be predicted using the J-integral criterionwhich is proposed in Ref. [11]. Figure 12 contains also thefracture load by means of J-integral for comparison.
It can be observed from Figure 12 that the predic-tions based on both ASED and J-integral criteria arein good agreement with experimental results. The de-tailed ASED-based and experiment results are listed inTable 10.
C O N C L U S I O N
The critical fracture load of plates made of functionallygraded materials (FGM) with U- and blunt V-notchesunder mode I loading has been predicted in this pa-per by using the ASED criterion. Although the aver-aged strain–energy density (ASED) criterion has beenproposed to predict the critical fracture load in plateswith U- and blunt V-notches for homogeneous materials,the investigations in this paper show that this criterioncan also be applied for non-homogeneous materials (es-pecially functionally graded materials). The effect of thenotch depth and the notch opening angle on fracture load
has been analysed in this paper. The results show thatthe opening angle has negligible effect on fracture loadin the studied angles (30◦, 60◦ and 90◦) Conversely, thenotch depth has a strong effect on loads to failure, dueto the combined effect of the material gradient along thespecimen width and the reduction of the transverse sec-tional area. It has been observed that the radius of controlvolume is not constant in the FGMs. Thus, the controlvolume boundary is not a circular arc. On the other hand,the control volume is different for different values of thenotch depth. The comparisons of two criteria namely J-integral and ASED have revealed that both these cri-teria can be applied in predicting the critical fractureload in plates with notches made of functionally gradedmaterials.
R E F E R E N C E S
1 Kim, J. H. and Paulino, G. H. (2002) Mixed mode fracture oforthotropic functionally graded materials using finite elementsand the modified crack closure method. Eng. Fract. Mech. 69,1557–1586.
2 Kim, J. H. and Paulino, G. H. (2003) T-stress, mixed modestress intensity factors, and crack initiation angles infunctionally graded materials: A unified approach using theinteraction integral method. Comp. Meth. Appl. Mech. Eng.192, 1463–1494.
3 Jin, Z. H. and Dodds, R. H. (2004) Crack growth resistancebehavior of a functionally graded material: Computationalstudies. Eng. Fract. Mech. 71, 1651–1672.
4 Carpinteri, A. and Pugno, N. (2005) Fracture instability andlimit strength condition in structures with re-entrant corners.Eng. Fract. Mech. 72, 1254–1267.
5 Carpinteri, A. and Pugno, N. (2006) Cracks and re-entrantcorners in functionally graded materials. Eng. Fract. Mech. 73,1279–1291.
6 Carpinteri, A., Paggi, M. and Pugno, N. (2006) Numericalevaluation of generalized stress intensity factors inmulti-layered composites. Int. J. Solids Struct. 43,627–641.
7 Gao, X. W., Zhang, C., Sladek, J. and Sladek, V. (2008)Fracture analysis of functionally graded materials by a BEM.Compos. Sci. Tech. 68, 1209–1215.
c© 2012 Blackwell Publishing Ltd. Fatigue Fract Engng Mater Struct 35, 614–627
FRACTURE ANALYSIS OF FUNCTIONALLY GRADED MATERIALS 627
8 Ayhan, A. O. (2009) Three-dimensional mixed-mode stressintensity factors for cracks in functionally graded materialsusing enriched finite elements. Int. J. Solids Struct. 46,796–810.
9 Barati, E., Alizadeh, Y. and Aghazadeh Mohandesi, J. (2010)J-integral evaluation of austenitic-martensitic functionallygraded steel in plates weakened by U-notches. Eng. Fract.Mech. 77, 3341–3358.
10 Barati, E., Aghazadeh Mohandesi, J. and Alizadeh, Y. (2010)The effect of notch depth on J-integral and critical fractureload in plates made of functionally graded aluminum–siliconecarbide composite with U-notches under bending. Mater. Des.31, 4686–4692.
11 Barati, E. and Alizaedeh, Y. (2011) A numerical method forevaluation of J-integral in plates made of functionally gradedmaterials with sharp and blunt V-notches. Fatigue and Fract.Eng. Mater. Struct. 34, 1041–1052.
12 Carpinteri, A. (1987) Stress singularity and generalizedfracture toughness at the vertex of re-entrant corners. Eng.Fract. Mech. 26, 143–155.
13 Nui, L. S., Chehimi, C. and Pluvinage, G. (1994) Stress fieldnear a large blunted tip V-notch and application of theconcept of the critical notch stress intensity factor to thefracture toughness of very brittle materials. Eng. Fract. Mech.49, 325–335.
14 Seweryn, A. (1994) Brittle fracture criterion for structureswith sharp notches. Eng. Fract. Mech. 47, 673–681.
15 Gomez, F. J., Elices, M. and Valiente, A. (2000) Cracking inPMMA containing U-shaped notches. Fatigue Fract. Eng.Mater. Struct. 23, 795–803.
16 Lazzarin, P. and Zambardi, R. (2001) A finite-volume-energybased approach to predict the static and fatigue behaviour ofcomponents with sharp V-shaped notches. Int. J. Fract. 112,275–298.
17 Gomez, F. J. and Elices, M. (2003) A fracture criterion forsharp V-notched samples. Int. J. Fract. 123, 163–175.
18 Gomez, F. J. and Elices, M. (2004) A fracture criterion forblunted V-notched samples. Int. J. Fract. 127, 239–264.
19 Yosibash, Z., Bussiba, A. and Gilad, I. (2004) Failure criteriafor brittle elastic materials. Int. J. Fract. 125, 307–333.
20 Guinea, G. V., Rojo, F. J. and Elices, M. (2004) Brittle failureof dry spaghetti. Eng. Fail. Anal. 11, 705–714.
21 Moreno, J. and Valiente, A. (2008) Assessment of thereference stress method for J-integral estimation of crackedriveted beams of an old wrought iron. Eng. Fail. Anal. 15, 194–207.
22 Gutierrez-Solana, F. and Cicero, S. (2009) The knowledgeand its application: Materials engineering and structuralintegrity. Brief review of the Spanish case and contributionsfrom Prof. Elices. Eng. Fail. Anal. 16, 2705–2720.
23 Gustavo, V. (2009) Guinea Special issue honouring ProfessorManuel Elices on the occasion of his 70th birthday. Eng. Fail.Anal. 16, 2511–2512.
24 Planas, J. (2009) A note on pseudo-cohesive behaviour inquasi-bidimensional brittle fracture. Eng. Fail. Anal. 16,2513–2520.
25 Meliani, M. H., Matvienko, Y. G. and Pluvinage, G. (2011)Corrosion defect assessment on pipes using limit analysis andnotch fracture mechanics. Eng. Fail. Anal. 18, 271–283.
26 Allouti, M., Jallouf, S., Schmitt, C. and Pluvinage, G. (2011)Comparison between hot surface stress and effective stressacting at notch-like defect tip in a pressure vessel. Eng. Fail.Anal. 18, 846–854.
27 Berto, F. and Lazzarin, P. (2009) A review of the volume-basedstrain-energy density approach applied to V-notches andwelded structures. Theo. Appl. Fract. Mech. 52, 183–194.
28 Lazzarin, P. and Berto, F. (2005) Some expressions for thestrain energy in a finite volume surrounding the root of bluntV-notches. Int. J. Fract. 135, 161–185.
29 Lazzarin, P., Berto, F. and Radaj, D. (2009) Fatigue-relevantstress field parameters of welded lap joints: Pointed slit tipversus keyhole notch. Fatigue Fract. Eng. Mater. Struc. 32,713–735.
30 Berto, F. and Lazzarin, P. (2007) Relationships betweenJ-integral and the strain energy evaluated in a finite volumesurrounding the tip of sharp and blunt V-notches. Int. J. SolidsStruct. 44, 4621–4645.
31 Lazzarin, P., Berto, F., Elices, M. and Gomez, J. (2009) Brittlefailures from U- and V-notches in mode I and mixed, I+II,mode: A synthesis based on the strain energy density averagedon finite size volumes. Fatigue Fract. Eng. Mater. Struct. 32,671–684.
32 Filippi, S., Lazzarin, P. and Tovo, R. (2002) Developments ofsome explicit formulas useful to describe elastic stress fieldsahead of notches in plates. Int. J. Solids Struct. 39, 4543–4565.
33 Aghazadeh Mohandesi, J. and Shahosseini, M. H. (2005)Transformation characteristics of functionally graded steelsproduced by electroslag remelting. Met. Mater. Trans. A. 36,3471–3476.
34 Williams, M. L. (1952) Stress singularities resulting fromvarious boundary conditions in angular corners of plates intension. J. Appl. Mech. 19, 526–528.
c© 2012 Blackwell Publishing Ltd. Fatigue Fract Engng Mater Struct 35, 614–627