Four basic symmetry types in the universal 7-cluster structure of 143 complete bacterial genomic...
14
Four basic symmetry types in the universal 7-cluster structure of 143 complete bacterial genomic sequences Alexander Gorban Centre for Mathematical Modelling, University of Leicester, UK Tatyana Popova Institute of Computational Modelling SB RAS, Krasnoyarsk, Russia Andrey Zinovyev * Institut des Hautes ´ Etudes Scientifiques, Bures-sur-Yvette, France October 31, 2004 Abstract Coding information is the main source of heterogeneity (non-randomness) in the sequences of bacterial genomes. This information can be naturally modeled by analysing cluster structures in the “in-phase” triplet distributions of relatively short genomic fragments (200-400bp). We found a universal 7-cluster structure in all 143 completely sequenced bacterial genomes available in Genbank in August 2004, and explained its properties. The 7-cluster structure is responsible for the main part of sequence heterogeneity in bacterial genomes. In this sense, our 7 clusters is the basic model of bacterial genome sequence. We demonstrated that there are four basic “pure” types of this model, observed in nature: “parallel triangles”, “perpendicular triangles”, degenerated case and the flower-like type. We show that codon usage of bacterial genomes is a multi-linear function of their genomic G+C-content with high accuracy (more precisely, by two similar functions, one for eubacterial genomes and the other one for archaea). All 143 cluster animated 3D-scatters are collected in a database and is made available on our web-site: http://www.ihes.fr/∼zinovyev/7clusters. The finding can be readily introduced into any software for gene prediction, sequence alignment or bacterial genomes classification. 1 Introduction The bacterial genomes are compact genomes: most of the sequence contains coding information. Hence any statistical study of bacterial genomic sequence will detect coding information as the main source of heterogeneity (non-randomness). This is confirmed by mining sequences “from scratch”, without use of any biological information, using entropic or Hidden Markov Modeling (HMM) statistical approaches (for examples, see [1], [2], [3], [18]). All these methods can be seen as specific clustering of relatively short genomic fragments of length in the range 200-400bp comparable to the average length of a coding information piece. Surprisingly, not much is known about the properties of the cluster structure itself, independently on the gene recognition problems, where it is implicitly used since long time ago (see, for example, early paper [5] about famous GENMARK gene-predictor, or [20] about GLIMMER approach). Only recently the structure was described explicitly. In [12], [13], [24] and [25] the structure was visualized in the 64-dimensional space of non-overlapping triplet distributions for several genomes. Also the same dataset was visualized in [14] and [11] using non-linear principal manifolds. In [19] several particular cases of this structure were observed in the context of the Z-curve methodology in the 9-dimensional space of Z-coordinates: it was claimed that the structure has interesting flower-like pattern but can be observed only for GC-rich genomes. This is somehow in contradiction with the results of [24], published before, where the same flower-like picture was demonstrated for AT-rich genome of Helicobacter pylori. This fact shows that this simple and basic structure is far from being completely understood and described. * To whom correspondence should be addressed: [email protected] 1
Transcript of Four basic symmetry types in the universal 7-cluster structure of 143 complete bacterial genomic...

Four basic symmetry types in the universal 7-cluster structure of
143 complete bacterial genomic sequences
Alexander Gorban
Centre for Mathematical Modelling, University of Leicester, UK
Tatyana Popova
Institute of Computational Modelling SB RAS, Krasnoyarsk, Russia
Andrey Zinovyev ∗
Institut des Hautes Etudes Scientifiques, Bures-sur-Yvette, France
October 31, 2004
Abstract
Coding information is the main source of heterogeneity (non-randomness) in the sequences ofbacterial genomes. This information can be naturally modeled by analysing cluster structures inthe “in-phase” triplet distributions of relatively short genomic fragments (200-400bp). We found auniversal 7-cluster structure in all 143 completely sequenced bacterial genomes available in Genbank inAugust 2004, and explained its properties. The 7-cluster structure is responsible for the main part ofsequence heterogeneity in bacterial genomes. In this sense, our 7 clusters is the basic model of bacterialgenome sequence. We demonstrated that there are four basic “pure” types of this model, observed innature: “parallel triangles”, “perpendicular triangles”, degenerated case and the flower-like type. Weshow that codon usage of bacterial genomes is a multi-linear function of their genomic G+C-contentwith high accuracy (more precisely, by two similar functions, one for eubacterial genomes and theother one for archaea).
All 143 cluster animated 3D-scatters are collected in a database and is made available on ourweb-site: http://www.ihes.fr/∼zinovyev/7clusters. The finding can be readily introduced into anysoftware for gene prediction, sequence alignment or bacterial genomes classification.
1 Introduction
The bacterial genomes are compact genomes: most of the sequence contains coding information. Henceany statistical study of bacterial genomic sequence will detect coding information as the main sourceof heterogeneity (non-randomness). This is confirmed by mining sequences “from scratch”, without useof any biological information, using entropic or Hidden Markov Modeling (HMM) statistical approaches(for examples, see [1], [2], [3], [18]). All these methods can be seen as specific clustering of relativelyshort genomic fragments of length in the range 200-400bp comparable to the average length of a codinginformation piece.
Surprisingly, not much is known about the properties of the cluster structure itself, independently onthe gene recognition problems, where it is implicitly used since long time ago (see, for example, earlypaper [5] about famous GENMARK gene-predictor, or [20] about GLIMMER approach). Only recentlythe structure was described explicitly. In [12], [13], [24] and [25] the structure was visualized in the64-dimensional space of non-overlapping triplet distributions for several genomes. Also the same datasetwas visualized in [14] and [11] using non-linear principal manifolds. In [19] several particular cases ofthis structure were observed in the context of the Z-curve methodology in the 9-dimensional space ofZ-coordinates: it was claimed that the structure has interesting flower-like pattern but can be observedonly for GC-rich genomes. This is somehow in contradiction with the results of [24], published before,where the same flower-like picture was demonstrated for AT-rich genome of Helicobacter pylori. This factshows that this simple and basic structure is far from being completely understood and described.
∗To whom correspondence should be addressed: [email protected]
1
The problem can be stated in the following way: there is a set of genomic fragments of length 100-1000bp representing a genome almost uniformly. There are various ways to produce this set, for example, bysliding window with a given step of sliding (in this case sequence assembly is not generally needed), orit might be a full set of ORFs (in this case one needs to know the assembled sequence). We constructa distribution of points in a multidimensional space of statistics calculated on the fragments and studythe cluster structure of this distribution. The following questions arise: What is the number of clusters?What is the character of their mutual locations? Is there a “thin structure” in the clusters? How thestructure depends on the properties of genomic sequence, can we predict it?
Every fragment can be characterized by a “frequency dictionary” of short words (see examples in [8],[9], [10], [15]). For our purposes we use frequencies of non-overlapping triplets, counted from the firstbasepair of a fragment. Thus every fragment is a point in 64-dimensional space of triplet frequencies.This choice is not unique, moreover, we use dimension reduction techniques to simplify this descriptionand take the essential features. The cluster structure we are going to describe is universal in the sensethat it is observed in any bacterial genome and with any type of statistics which takes into account codingphaseshifts. The structure is basic in the sense that it is revealed in the analysis in the first place, servingas the principal source of sequence non-randomness. In [12], [13], [19], [24] it was shown that even simpleclustering methods like K-Means or Fuzzy K-Means give good results in application of the structure togene-finding.
One example of the observed structure is shown on Fig.1. In short, this is a PCA plot of the pointdistribution. Referring for the details of the visualization to the Methods section, we stop now on basicproperties of the structure. First, it consists of 7 clusters.This fact is rather natural. Indeed, we clipfragments only from the forward strand and every fragment can contain 1) piece of coding region from theforward strand, with three possible shifts relatively to the first fragment position; 2) coding informationfrom the backward strand, with three possible frameshifts; 3) non-coding region; 4) mix of coding and non-coding information: these fragments introduce noise in our distribution, but their relative concentrationis not high. Second, the structure is well pronounced, the clusters are separated from each other withvisible gaps. This means that most of learning (and even self-learning) techniques aiming at separationof the clusters from each other will work very well, which is the case for bacterial gene-finders that haveperformance more than 90% in most cases (for recent overview, see [17]). Third, the structure is wellrepresented by a 3D-plot (in this case it is even almost flat, i.e. 2D). Forth, it is indeed has symmetricand appealing flower-like pattern, hinting at there should be a symmetry in our statistics governing thepattern formation.
In this paper we show how the structure depends on very general properties of genomic sequence andshow that it almost uniquely depends on a single parameter: the genomic G+C content. Also, based onanalysis of 143 completely sequenced genomes, available in Genbank in August 2004, we describe four“pure” types of the structure observed in bacterial genomic sequences.
The outline of the paper is the following: first we introduce phaseshift and complementary reverseoperators, helping to describe the structure, then we show that in nature we have almost one-dimensionalset of triplet distributions. After that we explain the properties of the 7-cluster structure and describe four“pure” types of the structures, observed for bacterial genomes. The paper is finalized by the descriptionof the methods utilized and conclusion.
2 Phaseshifts in triplet distributions
Let us denote frequencies of non-overlapping triplets for a given fragment as fijk, where i, j, k ∈ {A,C,G, T},such as fACT , for example, is a relative (normalized) frequency of ACT triplet.
One can introduce such natural operations over frequency distribution as phase shifts P(1) , P(2) andcomplementary reversion CR:
P (1)fijk ≡∑
l,m,n
flijfkmn, P (2)fijk ≡∑
l,m,n
flmifjkn, fijk ≡ CRfijk ≡ fk j i, (1)
where i is complementary to i, i.e., A = T, C = G, etc.The phase-shift operator P (n) calculates a new triplet distribution, counted with a frame-shift on
n positions, in the hypothesis that no correlations exist in the order of triplets in the initial phase.Complementary reversion constructs the distribution of codons from a coding region in the complementarystrand, counted from the forward strand (“shadow” frequency distribution).
2

Figure 1: Seven cluster structure of Pseudomonas aeruginosa genomic sequence (G+C-content 67%). Onthe left pane the PCA plot of data distribution is shown. The colors specify a frameshift, black circlescorrespond to non-coding regions. On the right pane the structure is presented in a schematic way, inthree projections (first and second principal components on the top, first and third in the middle, secondand third in the bottom), with “radii” of the clusters schematically visualized. The diagrams show thecodon position-specific nucleotide frequencies (right top and right bottom) as deviations from the averagenucleotide frequency and codon position-specific G+C-content (left top).
3
Phaseshift operators approximate the shifted triplet frequency as superposition of a phase-specificnucleotide frequency and a diplet frequency. This can be better understood if we rewrite definitions (1)in the following way:
P (1)fijk ≡∑
l
flij
∑
m,n
fkmn ≡ d(right)ij p
(1)k , P (2)fijk ≡
∑
l,m
flmi
∑
n
fjkn ≡ p(3)i d
(left)jk (2)
We introduce the notion of mean-field (or context free) approximation of the triplet distributions inthe following way:
mijk = p(1)i p
(2)j p
(3)k , p
(1)i =
∑
jk
fijk, p(2)j =
∑
ik
fijk, p(3)k =
∑
ij
fijk, (3)
i.e. the mean-field approximation is the distribution constructed from the initial triplet distribution
neglecting all possible correlations in the order of nucleotides. The p(k)i are the frequencies of the ith
nucleotide (i ∈{A,C,G,T}) at the kth position of a codon (k = 1..3). In this way we model the 64frequencies of the triplet distribution using only 12 frequencies of the three position-specific nucleotidedistributions. This approximation is widely used in the literature (see, for example, [3]). All tripletdistributions that can be represented in the form (3) belong to a 12-dimensional curved manifold M,
parametrized by 12 frequencies p(k)i . The manifold is embedded in the 64-dimensional space of all possible
triplet distributions T1.It is easy to understand that any phase-shift for mijk only rotates the upper (position) indexes:
P (1)mijk = p(2)i p
(3)j p
(1)k = mkij , P (2)mijk =
(
P (1))2
mijk = p(3)i p
(1)j p
(2)k = mjki. (4)
Also it is worth noticing that applying the P (1) (or P (2)) operator several times to the initial triplet
distribution we get the (p(1)i p
(2)j p
(3)k ,p
(2)i p
(3)j p
(1)k ,p
(3)i p
(1)j p
(2)k ) triangle:
(
P (1))3
fijk = mijk. (5)
Operator(
P (1))3
acts as a projector operator from full 64-dimensional distribution space T onto the12-dimensional manifold M:
(
P (1))3
: T→M. (6)
On the manifold M of all possible mijk we have P (2) = (P (1))2, therefore, there are only two operators:phaseshift P : Pmijk = mjki and reversion C : Cmijk = mkji. There are following basic equalities:
P 3 = 1, C2 = 1, PCP = C. (7)
Let us consider a point m on M. It corresponds to a set of 12 phase-specific nucleotide frequencies
p(1)i , p
(2)i and p
(3)i , i ∈ {A,C,G, T}. Applying operators P and C in all possible combinations we
obtain an orbit on M, consisting of 6 points: m,Pm,P 2m,Cm,PCm,P 2Cm. Theoretically, some pointscan coincide, but only in such a way that the resulting orbit will consist of 1 (fully degenerated case), 3(partially degenerated case) or 6 (non-degenerated case) points. The fully degenerated case corresponds tothe triplet distribution with the highest possible entropy among all distributions with the same nucleotidecomposition:
fijk = pipjpk, pi =∑
mn
(fimn + fmni + fnim)
3. (8)
This distribution (completely random) is described by 4 nucleotide frequencies, with any informationabout position in the triplet lost. In our T space it is a 3-dimensional (due to normalization equality)simplex on M. For bacterial genomes this distribution can serve as an approximate (zero-order accuracy)model for triplet composition in non-coding regions.
1The normalization equality∑
ijkfijk = 1 makes all distributions to form a standard 63-dimensional simplex in R64.
For M one has 3 independent normalizations:∑
ip(k)i
= 1, k = 1..3, these equalities distinguish a 9-dimensional set
(image of the product of three 3-dimensional standard simplexes) in M, where all normalized distributions are located.
4

Now let us consider triplet distributions corresponding to the codon usage of bacterial genomes, i.e.the subset of naturally occured triplet distributions. It was found that they could be reasonably wellapproximated by their mean-field distributions, i.e. they are located close to M. Moreover, in the nextsection we show that in nature, for 143 completely sequenced bacterial genomes, the mijk distributionsare tightly located along one-dimensional curve on M. The curve can be parametrized by the genomicG+C-content.
3 One-dimensional model of codon usage
Twelve dependencies p(1)i (GC), p
(2)i (GC) and p
(3)i (GC), i ∈ {A,C,G, T}, where GC is genomic G+C-
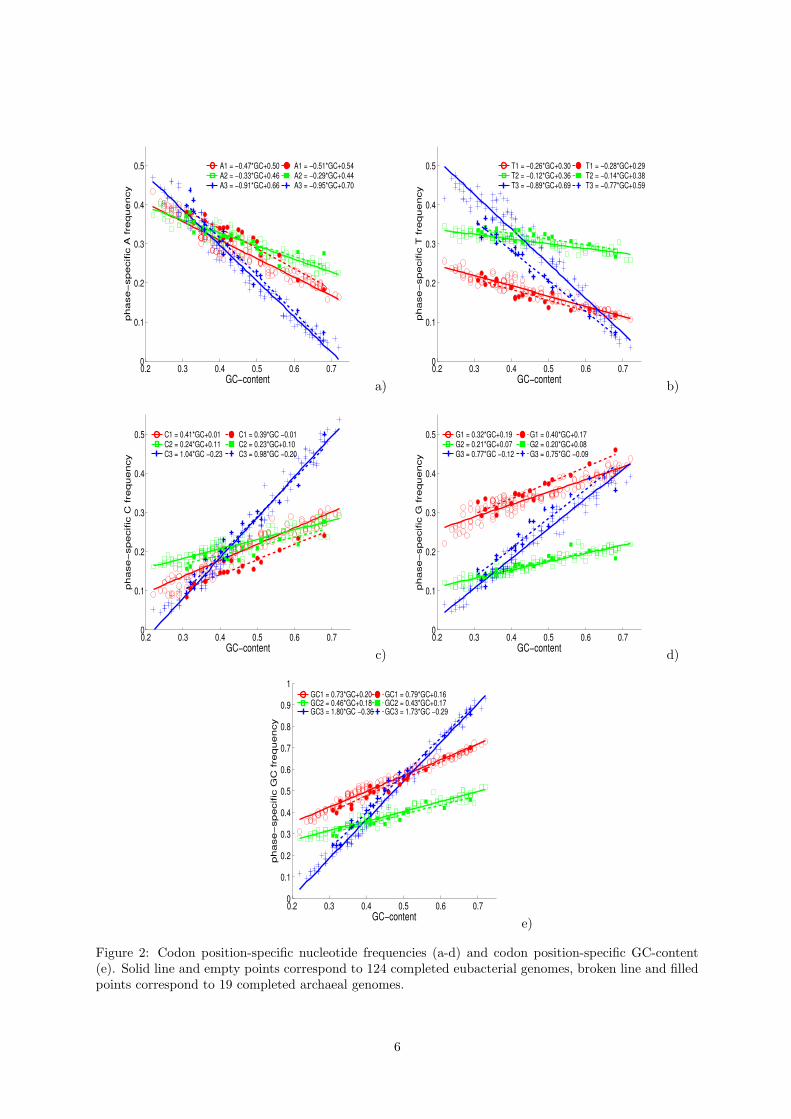
content, are presented on Fig.2(a-d) for 143 fully sequenced bacterial genomes available in Genbank inAugust, 2004. These dependencies are almost linear. This fact, despite it’s simplicity, was not explicitlydemonstrated before. The numerous results on the structure of codon usage described previously inliterature (see, for example, [22],[23],[21]) are in agreement with this picture.
Fig.2e demonstrates that the codon position-specific G+C-content is a linear function of genomicG+C-content, in each position. In [19] analogous results were shown for 33 completed genomes.
For our purposes, it is important to notice that for the genomes with G+C-content higher than ∼ 60%there is the same well-defined structure in their codon usage: the G+C-content in the first codon positionis close to the average of three values, the second is lower than the average and the third is essentiallyhigher than the average. This pattern can be denoted in the form of simple GC-signature: 0−+. In thenext section we develop more complicated signature to classify 7-cluster structures, corresponding to theorbits, generated by P and C operators in a set of genomic fragments of 300-400bp length.
The linear functions, describing codon usage, are slightly different for eubacteria and achaea genomes.
Significant deviations are observed for p(1)A , p
(1)C , p
(3)G , p
(1)G , p
(3)T functions. For the others, the dependencies
are statistically indistinguishable.One surprising conclusion follows from Fig.2: if we take the set of triplet frequencies, occurred in
nature and corresponding to the codon usage of bacterial genomes, then in the 12-dimensional space ofcodon position-specific nucleotide frequencies this set appears almost as a straight line (more precisely,two close lines, one for eubacteria and the other for archaea). If we look at this picture from the 64-dimensional space of triplet frequencies T, then one sees that the distributions are located close to thecurved M manifold of the mean-field approximations, embedded in the space. As a result, when analyzingthe structure of the distribution of bacterial codon usage, one detects that the points are located alongtwo curves. These curves coincide at their AT-rich ends and diverge at GC-rich ends. Moving along thesecurves one meets all bacterial genomes. Genomes with close G+C-content generally have close codonusage. Many evidences for this structure were reported in studies on multivariate analysis of bacterialcodon usage (for example, see Figure 6 from [16]), but here we first explain the most general structure ofthese representations in a clear and formal way.
4 Properties and types of the 7-cluster structure
In the paper [19] the authors claim that the codon position-specific nucleotide frequencies (representedas Z-coordinates) in GC-rich genomes show flower-like cluster structure, and the phenomenon is notobserved in other genomes. Here we explain the phenomenon and demonstrate other types of structuresobserved in genomes and that the type of the structure is related to the pattern of symmetric propertiesof codon usage.
First of all, we point out to the fact that the space used in [19] is a specific projection from 64-dimensional space of triplet frequencies. The 9-dimensional phenomenon is also can be observed in64-dimensional space and in 12-dimensional space of codon position-specific nucleotide frequencies.
Let us consider the context free approximation of codon usage introduced above:
mijk = p(1)i p
(2)j p
(3)k (9)
and consider 3D space with the following coordinates:
x = p(1)G + p
(1)C − fGC , y = p
(2)G + p
(2)C − fGC , z = p
(3)G + p
(3)C − fGC (10)
5
0.2 0.3 0.4 0.5 0.6 0.70
0.1
0.2
0.3
0.4
0.5 A1 = −0.47*GC+0.50A2 = −0.33*GC+0.46A3 = −0.91*GC+0.66
A1 = −0.51*GC+0.54A2 = −0.29*GC+0.44A3 = −0.95*GC+0.70
GC−content
ph
ase
−sp
ecific
A f
req
ue
ncy
a)
0.2 0.3 0.4 0.5 0.6 0.70
0.1
0.2
0.3
0.4
0.5 T1 = −0.26*GC+0.30T2 = −0.12*GC+0.36T3 = −0.89*GC+0.69
T1 = −0.28*GC+0.29T2 = −0.14*GC+0.38T3 = −0.77*GC+0.59
GC−content
ph
ase
−sp
ecific
T f
req
ue
ncy
b)
0.2 0.3 0.4 0.5 0.6 0.70
0.1
0.2
0.3
0.4
0.5 C1 = 0.41*GC+0.01C2 = 0.24*GC+0.11C3 = 1.04*GC −0.23
C1 = 0.39*GC −0.01C2 = 0.23*GC+0.10C3 = 0.98*GC −0.20
GC−content
ph
ase
−sp
ecific
C f
req
ue
ncy
c)
0.2 0.3 0.4 0.5 0.6 0.70
0.1
0.2
0.3
0.4
0.5 G1 = 0.32*GC+0.19G2 = 0.21*GC+0.07G3 = 0.77*GC −0.12
G1 = 0.40*GC+0.17G2 = 0.20*GC+0.08G3 = 0.75*GC −0.09
GC−content
ph
ase
−sp
ecific
G f
req
ue
ncy
d)
0.2 0.3 0.4 0.5 0.6 0.70
0.1
0.2
0.3
0.4
0.5
0.6
0.7
0.8
0.9
1GC1 = 0.73*GC+0.20GC2 = 0.46*GC+0.18GC3 = 1.80*GC −0.36
GC1 = 0.79*GC+0.16GC2 = 0.43*GC+0.17GC3 = 1.73*GC −0.29
GC−content
ph
ase
−sp
ecific
GC
fre
qu
en
cy
e)
Figure 2: Codon position-specific nucleotide frequencies (a-d) and codon position-specific GC-content(e). Solid line and empty points correspond to 124 completed eubacterial genomes, broken line and filledpoints correspond to 19 completed archaeal genomes.
6
+++
0+−
y+0−
−+0
000
−0+
+−0
0−+
x
−−−
z
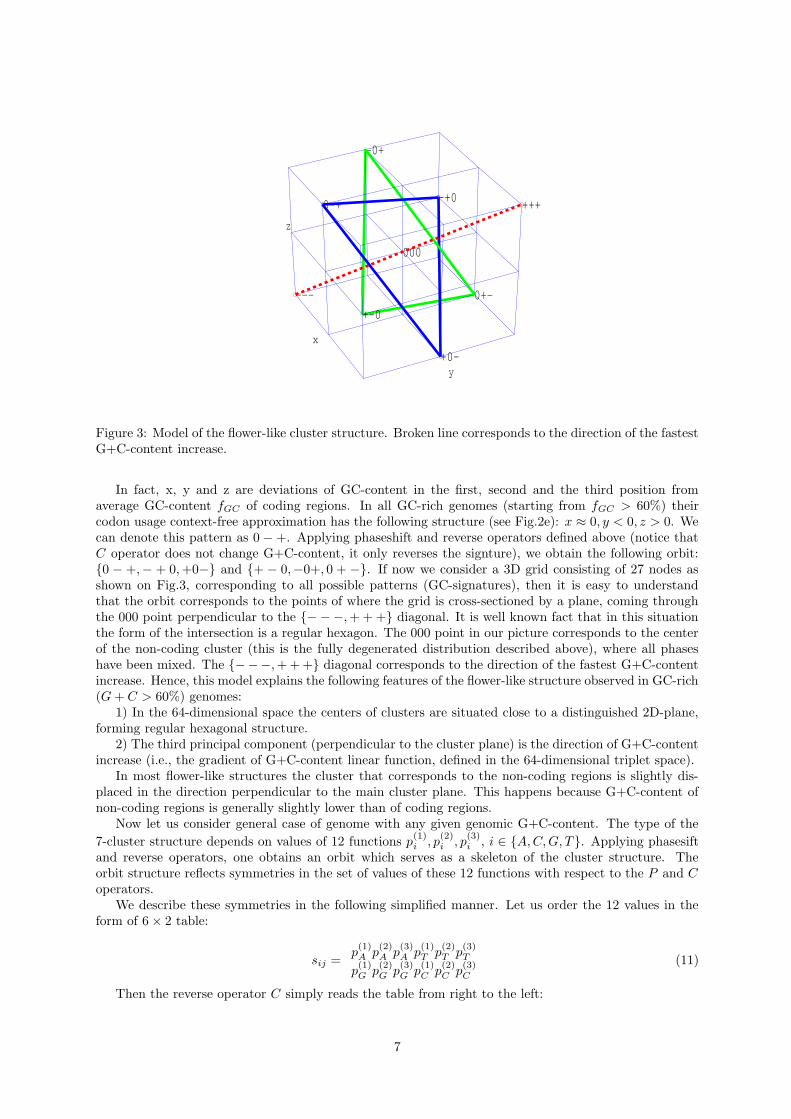
Figure 3: Model of the flower-like cluster structure. Broken line corresponds to the direction of the fastestG+C-content increase.
In fact, x, y and z are deviations of GC-content in the first, second and the third position fromaverage GC-content fGC of coding regions. In all GC-rich genomes (starting from fGC > 60%) theircodon usage context-free approximation has the following structure (see Fig.2e): x ≈ 0, y < 0, z > 0. Wecan denote this pattern as 0 − +. Applying phaseshift and reverse operators defined above (notice thatC operator does not change G+C-content, it only reverses the signture), we obtain the following orbit:{0 − +,− + 0,+0−} and {+ − 0,−0+, 0 + −}. If now we consider a 3D grid consisting of 27 nodes asshown on Fig.3, corresponding to all possible patterns (GC-signatures), then it is easy to understandthat the orbit corresponds to the points of where the grid is cross-sectioned by a plane, coming throughthe 000 point perpendicular to the {− −−,+++} diagonal. It is well known fact that in this situationthe form of the intersection is a regular hexagon. The 000 point in our picture corresponds to the centerof the non-coding cluster (this is the fully degenerated distribution described above), where all phaseshave been mixed. The {−−−,+++} diagonal corresponds to the direction of the fastest G+C-contentincrease. Hence, this model explains the following features of the flower-like structure observed in GC-rich(G + C > 60%) genomes:
1) In the 64-dimensional space the centers of clusters are situated close to a distinguished 2D-plane,forming regular hexagonal structure.
2) The third principal component (perpendicular to the cluster plane) is the direction of G+C-contentincrease (i.e., the gradient of G+C-content linear function, defined in the 64-dimensional triplet space).
In most flower-like structures the cluster that corresponds to the non-coding regions is slightly dis-placed in the direction perpendicular to the main cluster plane. This happens because G+C-content ofnon-coding regions is generally slightly lower than of coding regions.
Now let us consider general case of genome with any given genomic G+C-content. The type of the
7-cluster structure depends on values of 12 functions p(1)i , p
(2)i , p
(3)i , i ∈ {A,C,G, T}. Applying phasesift
and reverse operators, one obtains an orbit which serves as a skeleton of the cluster structure. Theorbit structure reflects symmetries in the set of values of these 12 functions with respect to the P and Coperators.
We describe these symmetries in the following simplified manner. Let us order the 12 values in theform of 6× 2 table:
sij =p(1)A p
(2)A p
(3)A p
(1)T p
(2)T p
(3)T
p(1)G p
(2)G p
(3)G p
(1)C p
(2)C p
(3)C
(11)
Then the reverse operator C simply reads the table from right to the left:
7
--+--+
+--++-[0.200; 0.255)
000-++
+--0+-[0.331; 0.373)
0+--++
+---0+[0.434; 0.482)
--+--+
+--0+-[0.255; 0.265)
0+0-++
+--0+-[0.373; 0.385)
0+--++
+-0-0+[0.482; 0.487)
--+-0+
+--0+-[0.265; 0.289)
0+--++
+--0+-[0.385; 0.388)
0+--++
+-0--+[0.487; 0.502)
-0+-0+
+--0+-[0.289; 0.316)
0+--++
+---+-[0.388; 0.391)
0+--+0
+-0--+[0.502; 0.515)
00+-0+
+--0+-[0.316; 0.326)
0+--++
+---+0[0.391; 0.424)
++--+0
+-0--+[0.515; 0.542)
000-0+
+--0+-[0.326; 0.331)
0+--++
+---00[0.424; 0.434)
++--+0
+-+--+[0.542; 0.545)
++--+-
+-+--+[0.545; 0.800)
Table 1: Nineteen possible signatures for one-dimensional codon usage model
Csij =p(3)T p
(2)T p
(1)T p
(3)A p
(2)A p
(1)A
p(3)C p
(2)C p
(1)C p
(3)G p
(2)G p
(1)G
. (12)
The phaseshift operator P rotates the values in the table by threes, for every letter:
Psij =p(3)A p
(1)A p
(2)A p
(3)T p
(1)T p
(2)T
p(3)G p
(1)G p
(2)G p
(3)C p
(1)C p
(2)C
. (13)
We reduce the description of s in the following way: every entry in the table is substituted by “+”, “−”and “0”, if the corresponding value is bigger then the average over the same letter frequencies, smalleror in the [average − 0.01; average + 0.01] interval respectively. For example, for a set of frequencies
p(1)A = 0.3,p
(2)A = 0.5, p
(3)A = 0.401, we substitute p
(1)A → −, p
(2)A → +, p
(3)A → 0. We call “signature” the
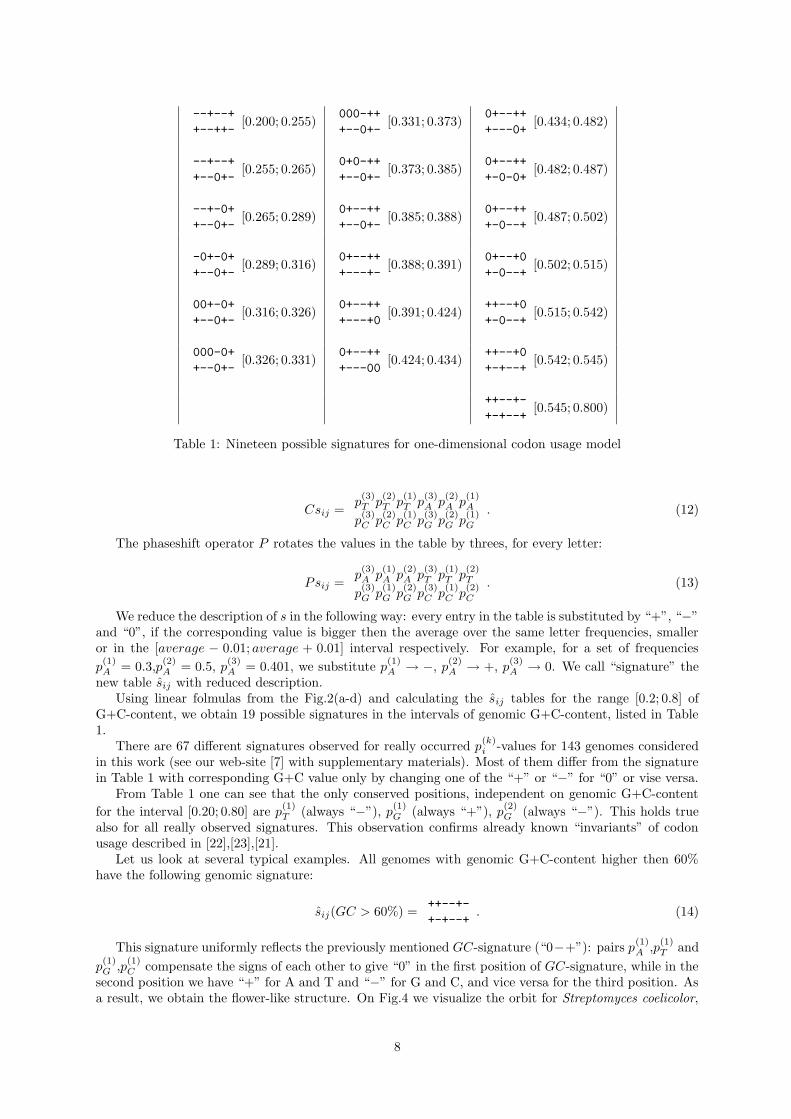
new table sij with reduced description.Using linear folmulas from the Fig.2(a-d) and calculating the sij tables for the range [0.2; 0.8] of
G+C-content, we obtain 19 possible signatures in the intervals of genomic G+C-content, listed in Table1.
There are 67 different signatures observed for really occurred p(k)i -values for 143 genomes considered
in this work (see our web-site [7] with supplementary materials). Most of them differ from the signaturein Table 1 with corresponding G+C value only by changing one of the “+” or “−” for “0” or vise versa.
From Table 1 one can see that the only conserved positions, independent on genomic G+C-content
for the interval [0.20; 0.80] are p(1)T (always “−”), p
(1)G (always “+”), p
(2)G (always “−”). This holds true
also for all really observed signatures. This observation confirms already known “invariants” of codonusage described in [22],[23],[21].
Let us look at several typical examples. All genomes with genomic G+C-content higher then 60%have the following genomic signature:
sij(GC > 60%) =++--+-
+-+--+. (14)
This signature uniformly reflects the previously mentioned GC-signature (“0−+”): pairs p(1)A ,p
(1)T and
p(1)G ,p
(1)C compensate the signs of each other to give “0” in the first position of GC-signature, while in the
second position we have “+” for A and T and “−” for G and C, and vice versa for the third position. Asa result, we obtain the flower-like structure. On Fig.4 we visualize the orbit for Streptomyces coelicolor,
8

B2
F2
F1
S.coelicolor++−−+−+−+−−+
J
B0
B1
F0
F0 F1 F2 B0 B1 B2
B2B1B0F2F1F0
a)
B0
B2
F1
F2
F.nucleatum−−+−0++−−−+−
J
B1
F0
F0 F1 F2 B0 B1 B2
B2B1B0F2F1F0
b)
F0
B2
B0
F1J
B.halodoranus−+−−+++−−000
F2
B1
F0 F1 F2 B0 B1 B2
B2B1B0F2F1F0
c)
B2F2
J
E.coli++−−+++−+0−+
B0F0
F1B1
F0 F1 F2 B0 B1 B2
B2B1B0F2F1F0
d)
Figure 4: Four typical examples of the 7-cluster structure: a) genome of S.coelicolor (GC=72%), flower-like structure; b) genome of F.nucleatum(GC=27%), “parallel triangles”; c) B.halodurans (GC=44%),“perpendicular triangles”; d) E.coli (GC=51%), degenerated case.
genome with high G+C-content: 72%. Together with the orbit we visualize the distance matrix for theskeleton, where the distances are calculated in the full 64-dimensional triplet frequency space T. Blackcolor on the plot corresponds to zero distance, white for the biggest value in the matrix. The mostinformative 3×3 block of the matrix is in the left bottom corner (or top right, by symmetry): it describesmutual distances between the vertexes of two skeleton triangles. The left top and right bottom 3 × 3blocks contain equal values, since the sides of the triangles have the same length.
Our second example is genome of Fusobacterium nucleatum (AT-rich genome, G+C-content is 27%),Fig.4b. The signature is
sij(F.nucleatum) =--+-0+
+---+-. (15)
This pattern, commonly observed in AT-rich genomes, can be called “parallel triangles”. Notice thattwo parallel triangles are rotated with respect to their corresponding phase labels: the F0 vertex is locatedin front of the B1 vertex.
The third example is genome of Bacillus halodurans (G+C-content is 44%):
sij(B.halodurans) =-+--++
+--000. (16)
9

We refer to this pattern as “perpendicular triangles”. Another example of the pattern is genomeof Bacillus subtilis. All non-diagonal distances in the distance matrix have in this case approximatelythe same value. This structure can be easily recognised from it’s signature: the second row has threezeros while the first one is almost palindromic. As we will see in the next example, palindromic rowsin the signature (or such that can be made palindromic applying the phaseshift P operator) make zerocontribution to the diagonal of the “inter-triangle” part of the distance matrix. This is easy to understand,because the reverse operator C reads the signature from right to the left. The rows with three zeros indifferent phase positions (when, for example, the phase specific nucleotide frequencies for one letter areequal to their average, as happened in this case) give approximately equal contribution to every value inthe “inter-triangle” part of the distance matrix. The resulting matrix corresponds to the “perpendiculartriangles” pattern. We should notice that the distance matrix showed on Fig.4c can not be effectivelyrepresented as a distribution of 6 points in 3D. Thus the “perpendicular triangles” structure shown onFig.4c is only an approximate picture, the real configuration is almost 6-dimensional, due to the distancematrix symmetry.
In the region of G+C-content about 51% we observe a group of genomes with almost palindromicsignatures. One typical example is the genome of Escherichia coli:
sij(E.coli) =++--++
+-+0-+. (17)
The resulting pattern is a degenerated case: two triangles are co-located, without phase label rotation(F0 is approximately in the same point as B0). The distance matrix consists of 4 almost identical 3× 3blocks. As a result, we have situation, when 7-cluster structure effectively consists of only 4 clusters, onefor every pair F0-B0, F1-B1, F2-B2 and a non-coding cluster.
The same degenerated case but with rotation of labels (F0-B1,F1-B2,F2-B0) is observed for someAT-rich genomes. For example, for the genome of Wigglesworthia brevipalpis (G+C-content equals 22%)the signature
sij(W.brevipalpis) =0-+-0+
+---+-(18)
becomes a perfect palindrom after applying the phaseshift operator:
P sij(W.brevipalpis) =-+00+-
--++--. (19)
One possible biological consequence (and even explanation) of this degeneracy is existence of overlap-ping genes: in this case the same codons can be used to encode proteins simultaneously in the forwardand backward strands on a regular basis (without frameshift for G+C-content around 50% and with aframeshift for AT-rich genomes), with the same codon usage.
The four patterns are typical for triplet distributions of bacterial genomes observed in nature. Theother ones combine features from these four “pure” types. In general, going along the G+C-content scale,we meet first “parallel triangles” which will transform gradually to “perpendicular triangles”. On thisway one can even meet structures resembling flower-like type in one of the 2D-projections, like for thegenome of Helicobacter pylori (see our web-site [7] and in [24] for the illustration). Then the pattern goesto the degenerated case with genomic G+C-content around 50% and signatures close to palindromic.After the degeneracy disappears, the pairs F0-B0, F1-B1, F2-B2 diverge in the same 2D-plane and after55% threshold in G+C-content we almost exclusively have the flower-like structures. It is possible tobrowse the animated scatters of 7-cluster structures observed for every of 143 genomes on our web-site[7].
5 Web-site on cluster structures in genomic word frequency dis-
tributions
To make the images and graphs of 143 genomes 7-cluster structures available for wide public, we estab-lished a web-site [7] for cluster structures in genomic word frequency distributions.
For the moment our database contains 143 completely sequenced bacterial genomes and two types ofcluster structures: the 7-cluster structure and the gene codon usage cluster structure. When browsing the
10
database, a user can look at animated 3D-representations of these multidimensional cluster structures.For the description of the structures and the methods we refer the reader to the “intro” and “methods”pages of the web-site.
Another possibility which is provided on our web-site is browsing large-scale “maps” of various spaceswhere all 143 genomes can be embedded simultaneously. One example is the codon usage map: one pointon the map is a genome, and close points correspond to the genomes with close codon usage. In fact,this is the same 64-dimensional triplet frequency space, used for construction of the 7-cluster structure,“observed” from a big distance. This gives the following hierarchy of maps: general map of codon usagein 143 genomes, then the 7-cluster structure of in-phase triplet distributions, then the “thin structure”of every coding cluster: gene codon usage map. Clicking on a genome at the first map, the user “zooms”to it’s more detailed representations.
We strongly believe that the information in the database will help to advance existing tools forbacterial genomes analysis. Also it can serve as rich illustrative material for those who study sequencebioinformatics.
6 Methods
For visualization of the 7-cluster structure a data set for every 143 genome2 was prepared in the followingway:
1) A Genbank file with completed genome was downloaded from the Genbank FTP-site. Using BioJavapackage [4] the complete sequence and the annotation was parsed. In the case when the genome had twochromosomes, the sequences of both were concantenated. The short sequences of plasmids were ignored.
2) Let N be length of a given sequence S and Si be a letter in the ith position of S. We define a stepsize p and a fragment size W . For given p, W and k = 1..[N−W
p ] we clip a fragment of length W in the
sequence, centered in i = w/2 + pk. In every fragment we count frequencies of non-overlapping triplets:
count(ci1ci2ci3) =
W/3−1∑
i=0
comp(ci1ci2ci3 , Si∗3+1Si∗3+2Si∗3+3), (20)
where comp(word1, word2) is a string comparison function that has value 1 if word1 equals word2and 0 otherwise. Here ci is a letter from genetic alphabet (c1 = A, c2 = C, c3 = G, c4 = T ).
For every fragment a frequency vector is defined:
Xci1
ci2ci3
i =count(ci1ci2ci3)∑
j1,j2j3cj1cj2cj3
(21)
All words, which contain non-standard letters like N, S, W, are ignored.The data set Xj
i , j = 1..[N−Wp ] is normalized to have unity standard deviation and zero mean.
3) We assign to the fragment a label accordingly to the Genbank annotation of the CDS features(including hypothetical ones) that include the center of the fragment. If the center is inside a CDSfeature then the reading frame and the strand of the CDS feature are determined and the fragment isassigned one of F0,F1,F2,B0,B1,B2 label. In the second case the label is J.
4) Standard PCA-analysis is performed and the first three principal components are calculated. Theyform form a 3D-orthonormal basis in the 64-dimensional space. Every point is projected into the basis,thus we assign three coordinates for every point .
To create a schema of 7-cluster structure (see Fig.1) the following method was utilized. We calculatedthe mean point yL for every subset with a given label L.
For the set of centroids yF0, yF1, yF2, yB0, yB1, yB2 a distance matrix of euclidean distances wascalculated and visualized using classical MDS.
To visualize the “radii” of the subsets, a mean squared distance d(p) to the centroid p was calculated(intraclass dispersion). To visualize the value on 2D plane, we have to introduce dimension correctionfactor, so the radius drawn on the picture equals
r(p) =
√
2
4kd(p) (22)
2We took only different species from GenBank, choosing the first alphabetically available strain in the list.
11
The form of the cluster is not always spherical and often intersection of radii do not reflect realoverlapping of classes in high-dimensional space. To show how good the classes are separated actually,we developed the following method for cluster contour visualization. To create a contour for class p,we calculate averages of all positive and negative projections on the vectors connecting centroid p and 6other centroids i = 1..6.
np
i =yi − yp
||yi − yp||,np
i (Xk ) = (Xk − yp ,np
i ) (23)
f pi =
∑
np
i(Xk )>0 n
pi
∑
np
i(Xk )>0 1
, bpi =
∑
np
i(Xk )<0 n
pi
∑
np
i(Xk )<0 1
(24)
Then, using the 2D MDS plot where every vector (yp)′ has 2 coordinates, we put 12 points tf , tb
analogously.
(np
i )′ =
(yi)′ − (yp)′
||(yi)′ − (yp)′||, (25)
tfi = (yi)′ + fpi (n
pi )
′, tbi = (yi)′ + bpi (n
pi )
′, i = 1..6 (26)
Using a smoothing procedure in polar coordinates we create a smooth contour approximating these12 points.
7 Discussion
In this paper we prove the universal 7-cluster structure in triplet distributions of bacterial genomes.Some hints at this structure appeared long time ago, but only recently it was explicitly demonstratedand studied.
The 7-cluster structure is the main source of sequence heterogeneity (non-randomness) in the bacterialgenomes. In this sense, our 7 clusters is the basic model of bacterial genome sequence. We demonstratedthat there are four basic “pure” types of this model, observed in nature: “parallel triangles”, “perpen-dicular triangles”, degenerated case and the flower-like type (see Fig.4).
To explain the properties and types of the structure, which occur in natural bacterial genomic se-quences, we studied 143 bacterial genomes available in Genbank in August, 2004. We showed that,surprisingly, the codon usage of the genomes can be very closely approximated by a multi-linear functionof their genomic G+C-content (more precisely, by two similar functions, one for eubacterial genomes andthe other one for archaea). In the 64-dimensional space of all possible triplet distributions the bacte-rial codon distributions are close to two curves, coinciding at their AT-rich ends and diverging at theirGC-rich ends. When moving along these curves we meet all naturally occurred 7-cluster structures inthe following order: “parallel triangles” for the AT-rich genomes (G+C-content is around 25%), then“perpendicular triangles” for G+C-content is around 35%, switching gradually to the degenerated casein the regions of GC=50% and, finally, the degeneracy is resolved in one plane leading to the flower-likesymmetric pattern (starting from GC=60%). All these events can be illustrated using the material fromthe web-site we established [7].
The properties of the 7-cluster structure have natural interpretations in the language of Hidden MarkovModels. Locations of clusters in multdimensional space correspond to in-state transition probabilities, theway how clusters touch each other reflects inter-state transition probabilities. Our clustering approach isindependent on the Hidden Markov Modeling, though can serve as a source of information to adjust thelearning parameters.
In our paper we analyzed only triplet distributions. It is easy to generalize our approach for longer(or shorter) words. In-phase hexamers, for example, are characterized by the same 7-cluster structure.However, our experience shows that the most of information is contained in triplets: the correlationsin the order of codons are small and the formulas (1) work reasonably well. Other papers confirm thisobservation (see, for example, [1], [12]).
The subject of the paper has a lot of possible continuations. There are several basic questions:how one can explain the one-dimensional model of codon usage or why the signatures in the middle ofG+C-content scale have palindromic structures? There are questions about how our model is connected
12

with codon bias in translationally biased genomes: the corresponding cluster structure is the secondhierarchical level or the “thin structure” in every cluster of the 7-cluster structure (see, for example,[6]). Also the following question is important: is it possible to detect and use the universal 7-clusterstructure for higher eukaryotic genomes, where this structure also exists (see [24]), but is hidden by thehuge non-coding cluster?
The information about the 7-cluster structure can be readily introduced into existing or new softwarefor gene-prediction, sequence alignment and genome classification.
References
[1] Audic S, Claverie JM. Self-identification of protein-coding regions in microbial genomes. (1998) ProcNatl Acad Sci USA. 95(17):10026-31.
[2] Baldi P. On the convergence of a clustering algorithm for protein-coding regions in microbial genomes.(2000) Bioinformatics. 16(4):367-71.
[3] Bernaola-Galvan, P., Grosse, I., Carpena, P., Oliver, J.L., Roman-Roldan, R., Stanley, H.E. (2000).Finding borders between coding and noncoding DNA regions by an entropic segmentation method.Physical Review Letters 85(6): 1342-1345.
[4] BioJava open-source project. http://www.biojava.org
[5] Borodovsky, M., McIninch, J. (1993). GENMARK: parallel gene recognition for both DNA strands.Comp.Chem 17, 123-133.
[6] Carbone A., Zinovyev A., Kepes F. Codon Adaptation Index as a measure of dominating codon bias.(2003) Bioinformatics. 19, 13, p.2005-2015.
[7] Cluster structures in genomic word frequency distributions. Web-site with supplementary materials.http://www.ihes.fr/∼zinovyev/7clusters/index.htm
[8] Gorban AN, Mirkes EM, Popova TG, Sadovsky MG. A new approach to the investigations of statisticalproperties of genetic texts. (1993) Biofizika 38 (5): 762-767.
[9] Gorban AN, Bugaenko NN, Sadovskii MG. Maximum entropy method in analysis of genetic text andmeasurement of its information content. (1998) Open systems and information dynamics. 5, pp.265-278.
[10] Gorban AN, Popova TG, Sadovsky MG. Classification of symbol sequences over their frequencydictionaries: towards the connection between structure and natural taxonomy. (2000) Open Systemand Information Dynamics, 7:1-17.
[11] Gorban A.N., Zinovyev A.Y., Wunsch D.C. Application of The Method of Elastic Maps In Analysis ofGenetic Texts. (2003) In Proceedings of International Joint Conference on Neural Networks (IJCNN),Portland, Oregon, July 20-24.
[12] Gorban A, Zinovyev A, Popova T. Seven clusters in genomic triplet distributions.(2003) In Silico Biology. V.3, 0039. (e-print: http://arxiv.org/abs/cond-mat/0305681 andhttp://cogprints.ecs.soton.ac.uk/archive/00003077/ )
[13] Gorban A.N., Zinovyev A.Yu., Popova T.G. Statistical approaches to the automated geneidentification without teacher // Institut des Hautes Etudes Scientiques. - IHES Preprint,France. 2001. - M/01/34. Available at http://www.ihes.fr web-site. (See alsow e-print:http://arxiv.org/abs/physics/0108016 )
[14] Gorban A.N., Zinovyev A.Yu. Visualization of data by method of elastic maps and its applicationsin genomics, economics and sociology // Institut des Hautes Etudes Scientiques. - IHES Preprint,France. 2001. - M/01/36. Available at http://www.ihes.fr web-site.
[15] Karlin S. (1998) Global dinucleotide signatures and analysis of genomic heterogeneity. Current opin-ion in microbiology 1(5): 598-610.
13

[16] Lobry JR, Chessel D. (2003) Internal correspondence analysis of codon and amino-acid usage inthermophilic bacteria. J.Appl.Genet. 44(2):235-61.
[17] Mathe C., Sagot M.F., Schiex T., Rouze P. Current methods of gene prediction, their strengths andweaknesses (2002) Nucleic Acids Res. 30(19):4103-4117.
[18] Nicolas P, Bize L, Muri F, Hoebeke M, Rodolphe F, Ehrlich SD, Prum B, Bessieres P. MiningBacillus subtilis chromosome heterogeneities using hidden Markov models. (2002) Nucleic Acids Res.30(6):1418-26.
[19] Ou HY, Guo FB, Zhang CT. Analysis of nucleotide distribution in the genome of Streptomycescoelicolor A3(2) using the Z curve method. (2003) FEBS Lett. Apr 10;540(1-3):188-94.
[20] Salzberg S.L., Delcher A.L., Kasif S., White O. Microbial gene identification using interpolatedMarkov Models. (1998) Nuc. Acids Res. 26(2): 544-548.
[21] Trifonov,E.N. Translation framing code and frame-monitoring mechanism as suggested by the anal-ysis of mRNA and 16S rRNA nucleotide sequences. (1987) J.Mol.Biol. 194,643-652.
[22] Zhang,C.T.and Zhang,R. Analysis of distribution of bases in the coding sequences by a diagrammatictechnique. (1991) Nucleic Acids Res. 19,6313- 6317.
[23] Zhang,C.T.and Chou,K.C. A graphic approach to analyzing codon usage in 1562 Escherichia coliprotein coding sequences. (1994) J.Mol.Biol. 238,1-8.
[24] Zinovyev A. Visualizing the spatial structure of triplet distributions in genetic texts. - IHES Preprint,France. 2002. - M/02/28. Available at http://www.ihes.fr web-site.
[25] Zinovyev A., Gorban A., Popova T. Self-Organizing Approach for Automated Gene Identification.(2003). Open Systems and Information Dynamics 10(4). p.321-333.
14