Transmittance Characteristics of US Army Rotary-Wing Aircraft ...
Upload
independentCategory
view
1download
0
2707
Ecology, 82(10), 2001, pp. 2707–2718q 2001 by the Ecological Society of America
FOREST STRUCTURE, CANOPY ARCHITECTURE, AND LIGHTTRANSMITTANCE IN TROPICAL WET FORESTS
REBECCA A. MONTGOMERY1 AND ROBIN L. CHAZDON
University of Connecticut, Storrs, Connecticut 06269 USA
Abstract. Identifying factors that influence variation in light availability within forestedecosystems represents an important component in our understanding of the complex de-terminants of tree seedling regeneration. We assessed the influence of forest structure andcanopy tree architecture on spatial heterogeneity of understory light availability in threeold-growth and three second-growth forests in lowland Costa Rica. Forest structure andunderstory light availability were measured within forest types using contiguous 10 3 10m quadrats along three 130–160 m transects in each stand. Two 20 3 60 m plots in eachforest type were sampled more intensively, including vertical profiles of light availabilityfrom 1 to 9 m height. Mean diffuse light transmittance increased from 2% at 1 m heightto over 10% at 9 m height and did not differ significantly between forest types at anyheight. However, the relationships among height classes differed between forest types.Second-growth plots showed a negative spatial autocorrelation for light measurementsseparated by vertical distances over 4 m. Differences in the vertical distribution of lightand foliage suggest that old-growth and second-growth stands differ in vertical organizationof the vegetation. The most pronounced structural differences between forest types werefound in trees between 10 and 25 cm in diameter at breast height (dbh). In second-growthstands, trees in the 10–25 cm dbh size class were more abundant and differed in allometry.They were taller for a given stem diameter and had narrower crowns for a given heightthan old-growth trees. Within forest types, we did not find strong relationships betweenmeasures of forest structure and light availability, although the strength of these relation-ships differed between forest types. In both old- and second-growth forest, understory lightavailability at 0.75 m decreased with increased sapling and shrub density, but was notsignificantly influenced by local tree density or basal area. From 1-m to 9-m heights, treedensity was a significant, but weak, predictor of light availability in old-growth plots. Insecond-growth plots, tree density showed little or no influence on light availability at heightsbelow 9 m. Our findings challenge the view that, within a forest, canopy and subcanopyvegetation directly influence light transmittance near the forest floor. Instead, we argue thatspatial patterning of the light environment occurs through complex interactions amongcanopy, subcanopy, and understory vegetation.
Key words: canopy-tree architecture; Costa Rica; crown size; forest dynamics; forest structure;forest succession; light availability; old-growth vs. second-growth tropical rain forests; stand structureand light transmission; tropical rain forest.
INTRODUCTION
Within forest stands, variation in vegetation com-position, structure, and foliage distribution creates spa-tial variation in light transmittance in the understory,affecting growth and mortality of tree seedlings andsaplings. In both temperate and tropical forests, studiesof variation in the understory light environment andits effect on tree regeneration have focused on the per-vasive effects of canopy vegetation and canopy gaps(Hartshorn 1978, Denslow 1980, Brokaw 1982a, Aug-spurger 1984, Chazdon and Fetcher 1984, Hubbell andFoster 1986, Martinez-Ramos et al. 1989, Smith et al.1992, Cornelissen et al. 1994, Sipe and Bazzaz 1995).Yet canopy gaps are ephemeral phenomena, and gap
Manuscript received 3 May 2000; revised 28 September 2000;accepted 2 October 2000; final version received 30 October 2000.
1 Present address: University of Wisconsin, Madison, Wis-consin 53706 USA. E-mail: [email protected]
microsites account for only a small proportion of for-ested areas at any given time (Clark et al. 1996, Connellet al. 1997, Nicotra et al. 1999). Within forest ecosys-tems nearly 75% of the area can be classified as ‘‘non-gap’’ or ‘‘subcanopy gap’’ (sensu Connell et al. 1997).Thus, non-gaps represent the most common micrositesoccupied by canopy-tree seedlings, saplings, and sub-canopy trees (Clark and Clark 1992, Lieberman et al.1995, Clark et al. 1996, Connell et al. 1997).
The strict dichotomy between gaps and closed-can-opy sites oversimplifies the complex three-dimensionalstructure beneath the forest canopy (Pompa et al. 1988,Grubb 1996, Parker and Brown 2000) and emphasizesdirect effects of canopy structure on light transmittancein the understory (Lieberman et al. 1989, Liebermanand Lieberman 1991, De Steven 1994, Jones and Shar-itz 1998). Yet several studies have shown that subcan-opy trees, saplings, palms, ferns, shrubs, and herbs canhave a major influence on light availability and tree-

2708 R. A. MONTGOMERY AND R. L. CHAZDON Ecology, Vol. 82, No. 10
seedling regeneration within the understory (Denslowet al. 1991, Russell et al. 1998, George and Bazzaz1999). Moreover, canopy species composition can sig-nificantly influence light transmittance within andamong stands, in the absence of canopy gaps (Messierand Bellefleur 1988, Canham et al. 1994, Kabakoff andChazdon 1996).
We examined the influence of forest vegetation com-position and structure on spatial variation in diffuselight transmittance in the understory of three matureand three second-growth tropical rain forest stands inthe Caribbean lowlands of Costa Rica. To our knowl-edge, this is the first study to describe detailed rela-tionships between ground-based measures of vegeta-tion structure and within-stand variation in light trans-mittance in both second-growth and old-growth trop-ical wet forests. Recent studies in these standsdemonstrated striking differences in species composi-tion of canopy and subcanopy woody vegetation, withsecond-growth stands showing increased dominance byfewer species in the canopy and decreased abundanceof subcanopy palms (Guariguata et al. 1997). Thesesecond-growth stands also showed lower overall spatialheterogeneity and smaller patch sizes of diffuse lighttransmittance in understory microsites (Nicotra et al.1999). Can differences in forest structure and speciescomposition explain these distinct patterns of light het-erogeneity? Although theoretical studies proposestrong links between canopy architecture, forest struc-ture, and light transmittance (Anderson 1966, Horn1971, Campbell and Norman 1989, Kuuluvainen andPukkala 1989), patterns of understory light availabilitydo not always show a clear dependence on forest struc-ture (Ross et al. 1986, Gleeson and Tilman 1990,Brown and Parker 1994, Denslow and Guzman 2000).
In this paper we begin by describing differences be-tween old-growth and second-growth forests in under-story light availability, tree architecture, and measuresof forest structure such as basal area and density oftrees. We then examine relationships between foreststructure and understory light availability among quad-rats within each forest type. Finally, we compare theserelationships between the two forest types. We considerboth the horizontal and vertical dimensions of spatialvariation in light transmittance and address the follow-ing three questions: (1) Can ground-based measuressuch as tree basal area and stem density predict lightavailability at different heights within the understory?(2) What are the relative contributions of canopy, sub-canopy, and understory woody vegetation to observedvariation in understory light availability? (3) Do pat-terns of understory light transmittance reflect differ-ences in canopy architecture or allometry of dominanttree species?
METHODS
Site selection and history
The study was conducted in the Sarapiquı́ region ofnortheastern Costa Rica. This area is classified in the
Holdridge life-zone system as tropical wet forest andreceives .4000 mm of rain each year (McDade et al.1994). The region is a mosaic of agricultural lands, treeplantations, and second-growth, selectively logged, andold-growth forests (Read et al., in press). We studiedsix stands, three in second-growth and three in old-growth forest (Table 1). Three stands were locatedwithin La Selva Biological Station (owned and oper-ated by the Organization for Tropical Studies) and threewere on private farms. Second-growth stands werecleared for pasture in the early 1970s, grazed for 4–6yr, and then abandoned. Old-growth stands showed noevidence of human disturbance over the past 200 yr(Denslow and Hartshorn 1994). Stands differed in theirdegree of isolation from large tracts of forest. Thesestands were part of a larger study examining how en-vironmental heterogeneity influences the nature and di-versity of woody regeneration during tropical rain for-est succession in northeastern Costa Rica (Kabakoffand Chazdon 1996, Guariguata et al. 1997, Dupuy andChazdon 1998, Chazdon and Coe 1999, Nicotra et al.1999).
Vegetation sampling
We established three parallel 130–160 m transectsspaced ;50 m apart in each stand, on level ground.Basal area and density of woody stems $5 cm in di-ameter at breast height (dbh) were measured in con-tiguous 10 3 10 m quadrats along each transect (13–16 quadrats per transect). Woody shrub and saplingdensity ($1 m tall ,5 cm dbh) was measured in con-tiguous 5 3 5 m plots located in the center of the 103 10 m quadrats (32 quadrats per transect; for detailedmethods see Guariguata et al. [1997]). In addition, weestablished four 20 3 60 m plots, two in one of theold-growth stands (La Selva) and two in one of thesecond-growth stands (Lindero Occidental; Table 1).These 20 3 60 m plots were subdivided into twelve10 3 10 m quadrats. In each quadrat, basal area anddensity were sampled for all woody stems $5 cm dbh.We also counted all woody and nonwoody stems $1m tall but ,5 cm dbh.
Tree architecture and allometry
In three of the 10 3 10 m quadrats per transect (12per site), we measured maximum tree height, height tofirst branching, and crown diameter for trees $5 cmdbh. In the plots, tree height and crown diameter weremeasured for all trees $10 cm dbh. We used a tele-scoping pole for height measurements below 12 m. Fortaller trees, we employed the angle-measure method toestimate tree height (Korning and Thomsen 1994). Thismethod has been recommended in tropical wet forestsystems to avoid difficulties associated with measure-ment of horizontal distance in dense vegetation andobscuration of crowns by neighboring trees. We madetwo measurements of crown diameter, one at the widestpoint and the other perpendicular to first measurement.

October 2001 2709STAND STRUCTURE AND LIGHT TRANSMITTANCE
TABLE 1. Site characteristics of six forest stands in the Caribbean lowlands of northeastern Costa Rica.
Forest type and siteLocation
(latitude; longitude) Recent land-use history
Estimatedtime sincedisturbance
(yr)†
Second-growthLindero Occidental La Selva Biological
Station (108269 N;848019 W)
cleared in 1971–1973; pasture for 6 years;regrowth cleared before pasture abandoned
15–17
Peje La Selva BiologicalStation (108269 N;848029 W)
cleared in 1972–1974; pasture for 5 years;regrowth cleared before pasture abandoned
15–17
La Martita Chilamate (108279 N;848049 W)
cleared in 1971–1972; pasture for 4–5 years,then abandoned
17–20
Old-growthLa Selva La Selva Biological
Station (108259 N;848039 W)
no apparent or recorded human disturbance n.a.
Chilamate Chilamate (108279 N;848049 W)
no apparent or recorded human disturbance n.a.
Cay Rica El Roble (108269 N;848059 W)
no apparent or recorded human disturbance n.a.
† n.a. 5 not applicable.
For each tree’s crown we calculated both area and vol-ume. Crown area was approximated as an ellipse usingthe two perpendicular measures of crown diameter.Crown volume was estimated as an elliptical cylinderby multiplying crown area by depth. This method over-estimates actual crown volume but is a potentially in-formative estimate of the amount of vegetation in theforest canopy (Terborgh and Petren 1991).
Vertical profile of vegetation
Another measure of vertical structure and stratifi-cation of the canopy is the foliage height profile (Mac-Arthur and Horn 1969, Terborgh and Petren 1991). Ev-ery 2 m along each transect (80 per transect) the pres-ence/absence of foliage was determined within inter-vals between 0–1 m and 1–2 m above the forest floor.In addition, every 6 m along each transect (26 pertransect) presence/absence of foliage was recorded inthe following intervals (0–1, 1–2, 2–5, and 5–10 m)using a telescoping pole. We recorded presence of veg-etation if leaves touched the telescoping pole in theinterval of interest. Presence of vegetation above 10 mwas assessed using a telephoto lens mounted on a tripodlocated next to the telescoping pole. Intervals (10–15,15–20, 20–30, and 30–40 m) were sighted through thelens, looking directly above the top of the pole (height5 10 m). If foliage could be focused within an interval,presence was recorded. This method is similar to thatused by Welden et al. (1991), but differs in that ourmethod evaluated foliage presence in intervals through-out the vertical transect and did not simply assess max-imum vertical foliage height.
Light availability
We assessed forest light environments by measuringpercentage transmittance of diffuse photosynthetic
photon flux density (PFD) under overcast sky condi-tions in the center of each 10 3 10 m quadrat. Wemeasured instantaneous below canopy PFD at 0.75 mheight in 1-m intervals along transects using a LI-190quantum sensor (LI-COR, Lincoln, Nebraska). For thisstudy, we averaged the three center readings from me-ters 4, 5, and 6 within each quadrat. In plots, PFD wasmeasured along a vertical profile at a single point inthe center of each 10 3 10 m quadrat at heights of 1,2.1, 4.2, 6.5, and 9 m above the forest floor. The quan-tum sensor was mounted on a small, self-leveling plat-form atop a telescoping pole.
During all light measurements, above-canopy PFDwas measured simultaneously in a nearby clearing us-ing a quantum sensor mounted on a tripod. The sensorwas connected to a LI-2000 datalogger that recordedPFD every 15 s (LI-COR). Below-canopy readingswere paired with the closest-in-time above-canopymeasurements to calculate percentage diffuse trans-mittance (% transmittance 5 [below-canopy PFD/above-canopy PFD] 3 100). All diffuse PFD mea-surements were made under overcast sky conditions,avoiding confounding effects of sun flecks and solarangle. This instantaneous measure of percentage dif-fuse transmittance has been shown to provide a sen-sitive measure of light availability in understory mi-crosites (Messier and Puttonen 1995, Parent and Mess-ier 1996, Nicotra et al. 1999). Due to nonnormal dis-tribution of light, in statistical analyses we used aninverse log transformation to compute optical density,a metric inversely related to percentage diffuse trans-mittance.
Statistical analysis
Spatial structure within ecological data presentsproblems for traditional statistical analysis because
2710 R. A. MONTGOMERY AND R. L. CHAZDON Ecology, Vol. 82, No. 10
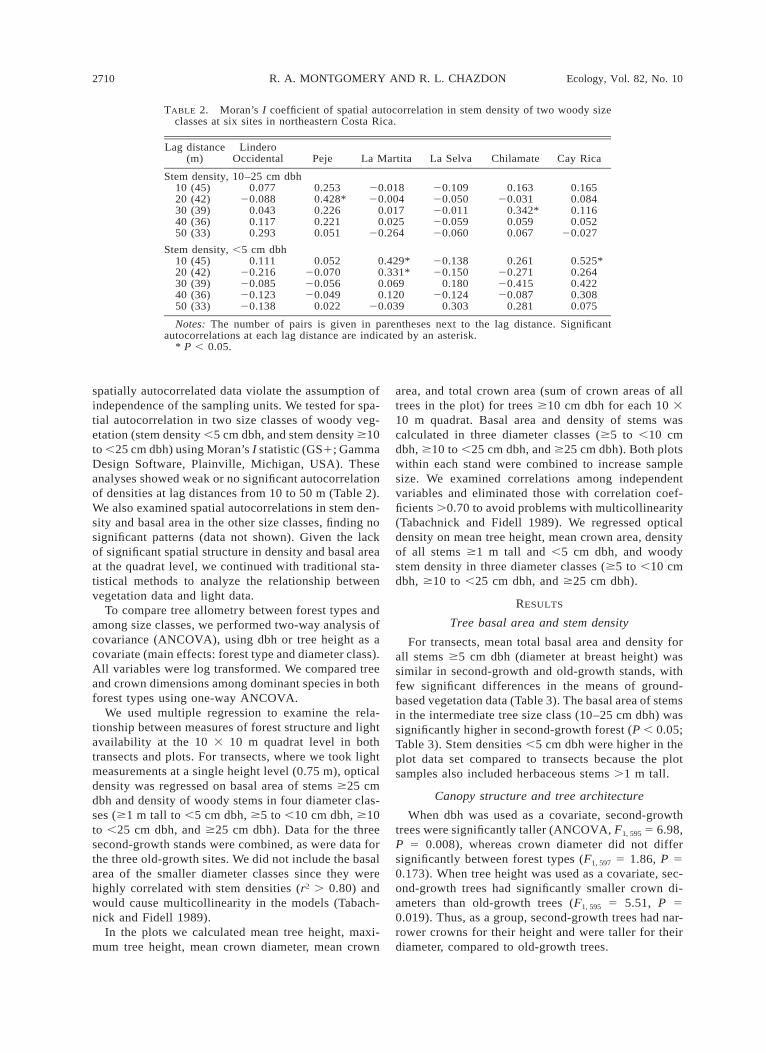
TABLE 2. Moran’s I coefficient of spatial autocorrelation in stem density of two woody sizeclasses at six sites in northeastern Costa Rica.
Lag distance(m)
LinderoOccidental Peje La Martita La Selva Chilamate Cay Rica
Stem density, 10–25 cm dbh10 (45)20 (42)30 (39)40 (36)50 (33)
0.07720.088
0.0430.1170.293
0.2530.428*0.2260.2210.051
20.01820.004
0.0170.025
20.264
20.10920.05020.01120.05920.060
0.16320.031
0.342*0.0590.067
0.1650.0840.1160.052
20.027
Stem density, ,5 cm dbh10 (45)20 (42)30 (39)40 (36)50 (33)
0.11120.21620.08520.12320.138
0.05220.07020.05620.049
0.022
0.429*0.331*0.0690.120
20.039
20.13820.150
0.18020.124
0.303
0.26120.27120.41520.087
0.281
0.525*0.2640.4220.3080.075
Notes: The number of pairs is given in parentheses next to the lag distance. Significantautocorrelations at each lag distance are indicated by an asterisk.
* P , 0.05.
spatially autocorrelated data violate the assumption ofindependence of the sampling units. We tested for spa-tial autocorrelation in two size classes of woody veg-etation (stem density ,5 cm dbh, and stem density $10to ,25 cm dbh) using Moran’s I statistic (GS1; GammaDesign Software, Plainville, Michigan, USA). Theseanalyses showed weak or no significant autocorrelationof densities at lag distances from 10 to 50 m (Table 2).We also examined spatial autocorrelations in stem den-sity and basal area in the other size classes, finding nosignificant patterns (data not shown). Given the lackof significant spatial structure in density and basal areaat the quadrat level, we continued with traditional sta-tistical methods to analyze the relationship betweenvegetation data and light data.
To compare tree allometry between forest types andamong size classes, we performed two-way analysis ofcovariance (ANCOVA), using dbh or tree height as acovariate (main effects: forest type and diameter class).All variables were log transformed. We compared treeand crown dimensions among dominant species in bothforest types using one-way ANCOVA.
We used multiple regression to examine the rela-tionship between measures of forest structure and lightavailability at the 10 3 10 m quadrat level in bothtransects and plots. For transects, where we took lightmeasurements at a single height level (0.75 m), opticaldensity was regressed on basal area of stems $25 cmdbh and density of woody stems in four diameter clas-ses ($1 m tall to ,5 cm dbh, $5 to ,10 cm dbh, $10to ,25 cm dbh, and $25 cm dbh). Data for the threesecond-growth stands were combined, as were data forthe three old-growth sites. We did not include the basalarea of the smaller diameter classes since they werehighly correlated with stem densities (r2 . 0.80) andwould cause multicollinearity in the models (Tabach-nick and Fidell 1989).
In the plots we calculated mean tree height, maxi-mum tree height, mean crown diameter, mean crown
area, and total crown area (sum of crown areas of alltrees in the plot) for trees $10 cm dbh for each 10 310 m quadrat. Basal area and density of stems wascalculated in three diameter classes ($5 to ,10 cmdbh, $10 to ,25 cm dbh, and $25 cm dbh). Both plotswithin each stand were combined to increase samplesize. We examined correlations among independentvariables and eliminated those with correlation coef-ficients .0.70 to avoid problems with multicollinearity(Tabachnick and Fidell 1989). We regressed opticaldensity on mean tree height, mean crown area, densityof all stems $1 m tall and ,5 cm dbh, and woodystem density in three diameter classes ($5 to ,10 cmdbh, $10 to ,25 cm dbh, and $25 cm dbh).
RESULTS
Tree basal area and stem density
For transects, mean total basal area and density forall stems $5 cm dbh (diameter at breast height) wassimilar in second-growth and old-growth stands, withfew significant differences in the means of ground-based vegetation data (Table 3). The basal area of stemsin the intermediate tree size class (10–25 cm dbh) wassignificantly higher in second-growth forest (P , 0.05;Table 3). Stem densities ,5 cm dbh were higher in theplot data set compared to transects because the plotsamples also included herbaceous stems .1 m tall.
Canopy structure and tree architecture
When dbh was used as a covariate, second-growthtrees were significantly taller (ANCOVA, F1, 595 5 6.98,P 5 0.008), whereas crown diameter did not differsignificantly between forest types (F1, 597 5 1.86, P 50.173). When tree height was used as a covariate, sec-ond-growth trees had significantly smaller crown di-ameters than old-growth trees (F1, 595 5 5.51, P 50.019). Thus, as a group, second-growth trees had nar-rower crowns for their height and were taller for theirdiameter, compared to old-growth trees.
October 2001 2711STAND STRUCTURE AND LIGHT TRANSMITTANCE
TABLE 3. Basal area (BA) and density of stems (no./ha) in four diameter classes and diffuse light transmittance alongtransects and in plots. .
Variable
Transect
Old-growth(n 5 3)
Second-growth(n 5 3) P
Plot
Old-growth(n 5 2)
Second-growth(n 5 2) P
Stem $5 to ,10 cm dbhBA (m2/ha)Stem density
(no./ha)
1.69 (0.10)411 (45.7)
1.74 (0.22)456 (54.9)
0.830.28
2.23 (0.03)530 (37.5)
2.13 (0.12)517 (33.5)
0.440.44
Stem $10 to ,25 cm dbhBA (m2/ha)Stem density
(no./ha)
7.49 (0.33)408 (8.13)
9.04 (0.69)488 (52.4)
0.050.28
6.09 (1.88)313 (79.5)
8.46 (0.91)471 (62.5)
0.440.73
Stem $ 25 cm dbhBA (m2/ha)Stem density
(no./ha)
21.39 (1.24)107 (3.81)
19.01 (2.49)170 (47.3)
0.510.13
26.82 (8.5)104 (21)
11.59 (6.0)121 (8.5)
0.120.68
$1 m tall and ,5 cm dbhStem density
(no./ha)6095 (825.6) 6902 (772.73) 0.38 9258 (475) 8863 (1395) 1.00
Diffuse trans-mittance (%)
1.80 (109.44) 1.75 (47.54) 0.88 3.03 (0.05) 3.07 (0.01) 0.68
Notes: Data are means, with 1 SE in parentheses. Along transects, light was measured at 0.75 m in three old-growth andthree second-growth stands. Plot data are from two plots in a second-growth stand (Lindero Occidental) and two plots in anold-growth stand (La Selva). In plots, light was measured at 1 m. P values are for Mann-Whitney U test for differencesbetween forest types.
We also found strong effects of diameter class oncrown dimensions. The two-way ANCOVA of crowndiameter, using dbh as a covariate, revealed a highlysignificant interaction between forest type and diameterclass (F2, 593 5 10.24, P 5 0.00004). Trees 10–25 cmdbh had significantly smaller crown diameters in sec-ond-growth forests (Tukey hsd; P 5 0.002, Fig. 1B).Tree height varied significantly with diameter class inboth forest types, but showed no significant interactionbetween forest type and diameter class (Fig. 1). Trees10–25 cm dbh were significantly taller for a given treediameter in second-growth than in old-growth stands(Tukey hsd; P 5 0.009, Fig. 1B). Height at first branch-ing also varied significantly with both forest type (F1, 591
5 9.29, P 5 0.002) and diameter class (F2, 591 5 9.11,P 5 0.0001) and showed a highly significant interactionwith diameter class (F2, 591 5 4.80, P 5 0.008). Thisinteraction also resulted from differences in trees 10–25 cm dbh, which branched higher in second-growthforest (Tukey hsd; P 5 0.00002, Fig. 1B).
Second-growth trees differed allometrically fromold-growth trees. The most pronounced differenceswere observed in trees in the 10–25 cm dbh class,whose crowns are located in the subcanopy or canopy.Forest-wide differences in tree allometry appear to bedue to strong differences in species composition. In-deed, in the 10–25 cm dbh size class, tree species com-position varied dramatically between the two foresttypes. Casearea arborea (Flacourtiaceae) and Laetiaprocera (Flacourtiaceae) were the most abundant spe-cies in the second-growth, composing 33% of all in-dividuals in this diameter class. These dominant spe-
cies had small mean crown diameters (C. arborea 55.5 m, L. procera 5 4.1 m) that were significantlysmaller for a given height compared to Welfia regia(Arecaceae) and Pentaclethra macroloba (Fabaceae),abundant old-growth dominants (ANCOVA, F4,83 59.81, P , 0.0001; Tukey’s hsd, P , 0.01). In the old-growth stands, the subcanopy palm W. regia was thesingle most abundant species, with a mean crown di-ameter of 7.7 m. In addition, L. procera was signifi-cantly taller than W. regia for a given dbh (ANCOVA,F4, 160 5 16.05, overall P , 0.001; Tukey’s hsd, P ,0.001) and branched at greater heights compared to P.macroloba individuals in the 10–25 cm diameter classin old-growth stands (ANCOVA, F4,83 5 9.81, P ,0.0001; Tukey’s hsd, P , 0.01). The allometric rela-tionship between dbh and height was similar for P.macroloba, C. arborea, L. procera, and Goethalsiameiantha (Fig. 2A), whereas W. regia showed no sig-nificant relationship between dbh and height (data notshown). Species segregated by tree size along the sameallometric line. G. meiantha trees were represented bylarge individuals, while L. procera and C. arborea wereintermediate in size. P. macroloba trees spanned theentire size range (Fig. 2B). Thus, species differencesin absolute tree size influenced overall crown dimen-sions and determined the species composition of dif-ferent tree size classes.
Foliage profiles showed distinct patterns of verticalorganization of vegetation between second-growth andold-growth stands. Second-growth forest had more fo-liage cover at 0–1 m and a lack of foliage above 30 m(Fig. 3A). Whereas foliage uniformly filled much of

2712 R. A. MONTGOMERY AND R. L. CHAZDON Ecology, Vol. 82, No. 10
FIG. 1. Effects of stem diameter class on three growthvariables for trees in second-growth (open bars) and old-growth (solid bars) sites in northeastern Costa Rica. Data aremeans and 1 SE. (A) Trees 5–10 cm dbh; (B) trees 10–25 cmdbh, and (C) trees $25 cm dbh. Asterisks indicate significantdifferences at the 0.05 level based on ANCOVA using dbh(tree and branch height) and tree height (crown diameter) ascovariates.
FIG. 2. Allometric relationships among five common spe-cies in three stands of old-growth forest and three stands of15–20 yr old second-growth forest in the Caribbean lowlandsof northeastern Costa Rica. (A) Regression lines of tree height(in meters) and crown diameter (in meters) for Welfia regia,Pentaclethra macroloba, Casearia arborea, and Laetia pro-cera. (B) Scatterplot of tree diameter (in centimeters) and treeheight (in meters) for individuals of Goethalsia meiantha, P.macroloba, C. arborea, and L. procera. Each point representsa single tree.
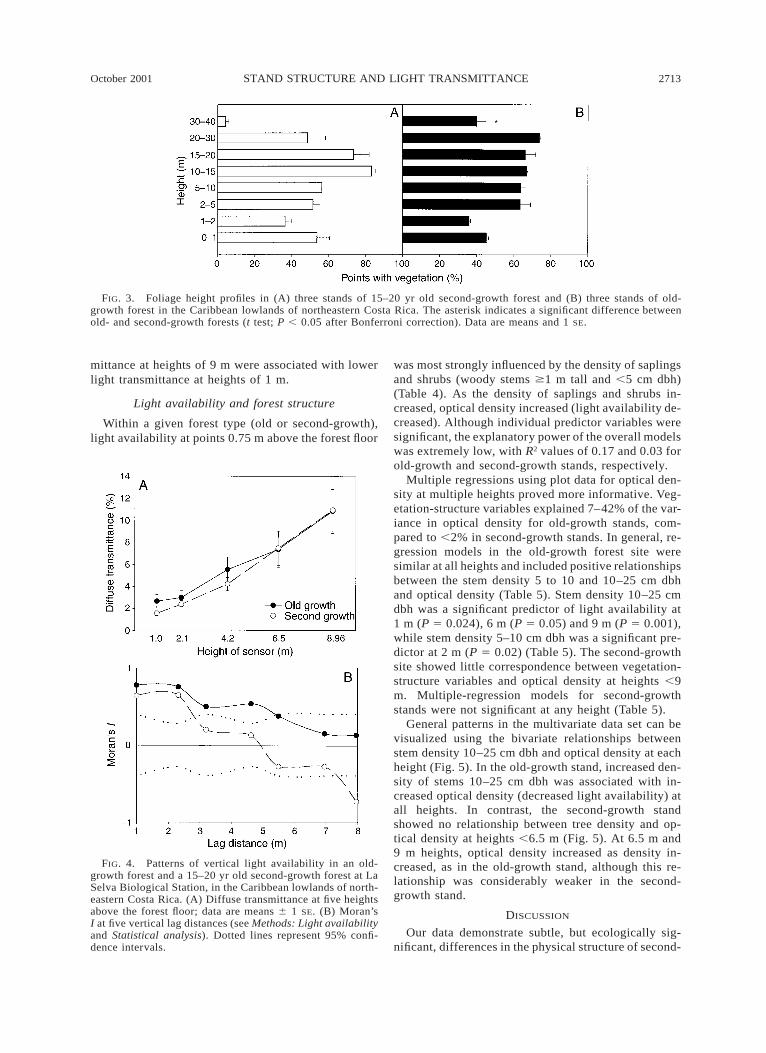
the space above 2 m in old-growth forest (Fig. 3B; Old. Second; t test, F1,3 5 8.47, P , 0.05 after Bonferronicorrection), the second-growth profile showed a grad-ual increase in foliage cover between 1 and 15 m. Thispattern of distribution of foliage differed significantlybetween forests (x2 5 32.48, P , 0.0001).
Vertical patterns of light availability
Along transects, mean light availability at 0.75 mheight did not differ significantly between forest types(Table 3; see also Nicotra et al. 1999). Old-growthstands had a mean of 1.8% diffuse transmittance (%T)and ranged from 0.45–14.93% T; second-growth standsranged between 0.53 and 5.87% T with a mean of1.75% T. Within plots, vertical profiles of diffuse trans-mittance increased from a mean of 2% at 1 m to .10%at 9 m (Fig. 4A). Ranges were similar at 9-m heights,with old-growth stands varying between 1.98 and34.66% T, and second-growth stands between 1.57 and33.57% T. At 1-m height the old-growth stands had a
higher minimum and maximum, ranging between 0.42and 12.99% T; whereas second-growth were 0.29–4.45% T.
Although means did not differ significantly betweenold-growth and second-growth stands (two-way AN-OVA, interaction of main effects (height, forest type),F4, 255 5 0.276, P 5 0.89), the spatial autocorrelationfunction among heights differed markedly (Fig. 4B).In both forest types we observed a significant positiveautocorrelation between points separated by one ver-tical meter (Moran’s I: old-growth 5 0.77, second-growth 5 0.64, P , 0.05). Significant, positive auto-correlations persisted through a lag distance of fourvertical meters in the old-growth plots. In contrast, thesecond-growth plots showed a transition to a signifi-cantly negative autocorrelation as vertical distance be-tween points increased to 9 m (Moran’s I 5 20.73, P, 0.05). These results suggest that for sample pointsin the second-growth plots, higher values of light trans-
October 2001 2713STAND STRUCTURE AND LIGHT TRANSMITTANCE
FIG. 3. Foliage height profiles in (A) three stands of 15–20 yr old second-growth forest and (B) three stands of old-growth forest in the Caribbean lowlands of northeastern Costa Rica. The asterisk indicates a significant difference betweenold- and second-growth forests (t test; P , 0.05 after Bonferroni correction). Data are means and 1 SE.
FIG. 4. Patterns of vertical light availability in an old-growth forest and a 15–20 yr old second-growth forest at LaSelva Biological Station, in the Caribbean lowlands of north-eastern Costa Rica. (A) Diffuse transmittance at five heightsabove the forest floor; data are means 6 1 SE. (B) Moran’sI at five vertical lag distances (see Methods: Light availabilityand Statistical analysis). Dotted lines represent 95% confi-dence intervals.
mittance at heights of 9 m were associated with lowerlight transmittance at heights of 1 m.
Light availability and forest structure
Within a given forest type (old or second-growth),light availability at points 0.75 m above the forest floor
was most strongly influenced by the density of saplingsand shrubs (woody stems $1 m tall and ,5 cm dbh)(Table 4). As the density of saplings and shrubs in-creased, optical density increased (light availability de-creased). Although individual predictor variables weresignificant, the explanatory power of the overall modelswas extremely low, with R2 values of 0.17 and 0.03 forold-growth and second-growth stands, respectively.
Multiple regressions using plot data for optical den-sity at multiple heights proved more informative. Veg-etation-structure variables explained 7–42% of the var-iance in optical density for old-growth stands, com-pared to ,2% in second-growth stands. In general, re-gression models in the old-growth forest site weresimilar at all heights and included positive relationshipsbetween the stem density 5 to 10 and 10–25 cm dbhand optical density (Table 5). Stem density 10–25 cmdbh was a significant predictor of light availability at1 m (P 5 0.024), 6 m (P 5 0.05) and 9 m (P 5 0.001),while stem density 5–10 cm dbh was a significant pre-dictor at 2 m (P 5 0.02) (Table 5). The second-growthsite showed little correspondence between vegetation-structure variables and optical density at heights ,9m. Multiple-regression models for second-growthstands were not significant at any height (Table 5).
General patterns in the multivariate data set can bevisualized using the bivariate relationships betweenstem density 10–25 cm dbh and optical density at eachheight (Fig. 5). In the old-growth stand, increased den-sity of stems 10–25 cm dbh was associated with in-creased optical density (decreased light availability) atall heights. In contrast, the second-growth standshowed no relationship between tree density and op-tical density at heights ,6.5 m (Fig. 5). At 6.5 m and9 m heights, optical density increased as density in-creased, as in the old-growth stand, although this re-lationship was considerably weaker in the second-growth stand.
DISCUSSION
Our data demonstrate subtle, but ecologically sig-nificant, differences in the physical structure of second-

2714 R. A. MONTGOMERY AND R. L. CHAZDON Ecology, Vol. 82, No. 10
TABLE 4. Results from multiple-regression models of the relationship between measures offorest structure (stem density in four size classes: $1 m tall and ,5 cm dbh, 5–10 cm dbh,10–25 cm dbh, and $25 cm dbh; basal area $25 cm dbh) and diffuse light transmiittancefor old-growth and 15-20 yr old second-growth stands in the Caribbean lowlands of north-eastern Costa Rica.
Model df R2 P PredictorPartial
correlation
Old-growth 5, 123 0.170 0.0001 stem density ($1 m talland ,5 cm dbh)
0.414
Second-growth 5, 138 0.027 0.117 stem density ($1 m talland ,5 cm dbh)
0.198
Notes: The dependent variable in all models was optical density, the inverse log of percentagetransmittance. Optical density increases with decreasing light availability; thus a positive co-efficient indicates a negative relationship. Significant predictors (P , 0.05) are shown evenwhen the overall model was not significant.
TABLE 5. Results of multiple-regression models of the relationship between measures of foreststructure and diffuse light transmittance at six heights above the forest floor for one old-growth (La Selva) and one 15–20 yr old second-growth stand (Lindero Occidental) in theCaribbean lowlands of northeastern Costa Rica.
Modelheight
(m) df R2 P PredictorPartial
correlation
Old-growth12.14.26.59
6, 166, 166, 166, 166, 16
0.2520.2460.0710.0840.415
0.0900.1000.3160.2980.019
stem density (10–25 cm dbh)stem density (5–10 cm dbh)no significant predictorsstem density (10–25 cm dbh)stem density (10–25 cm dbh)
0.5290.544
0.4610.738
Second-growth12.14.26.59
2, 212, 212, 212, 212, 21
0.0010.0010.0010.0010.04
0.4720.7330.6080.7190.367
no significant predictorsno significant predictorsno significant predictorsno significant predictorsno significant predictors
Notes: Dependent variable in all models was optical density, the inverse log of percentagetransmittance. Optical density increases with decreasing light availability, thus a positive co-efficient indicates a negative relationship. Significant predictors (P , 0.05) are shown evenwhen the overall model was not significant.
and old-growth forests that influence spatial variationin light transmittance in the understory. These rela-tionships are challenging to detect, given the com-plexity of tropical-forest species composition andstructure. Mid-sized trees (10–25 cm dbh) have higherbasal area in the second-growth forests. These mid-sized stems differ in species composition between for-est types and these species, as a group, possess con-trasting allometry and crown sizes. These character-istics contribute to observed differences in the verticalorganization of vegetation and in the pattern of hori-zontal variation in light transmittance (Nicotra et al.1999). Collectively, the differences in forest physicalstructure influence the strength of the relationship be-tween canopy vegetation and transmittance of light inthe understory. The more homogeneous size distribu-tion and species composition of the second-growth for-est canopy and subcanopy layers are associated withincreased spatial homogeneity of diffuse light trans-mittance within the understory, compared to old-growth stands.
Physical structure: old-growth vs. second-growth
Basal area can recover rapidly in second-growth for-ests after only 15–20 yr of regrowth, while canopyheight and canopy species diversity lag behind (Fig. 3;Guariguata et al. 1997, Guariguata and Ostertag, inpress). Foliage profiles show that second-growth standsare still in a ‘‘building’’ phase of structural develop-ment. Old-growth stands are of higher stature, haveless vegetation near the forest floor, and show a moreeven distribution of foliage vertically (Fig. 3). Our datacorroborate other chronosequence studies in both tem-perate and tropical wet forests that have shown an in-creasing vertical spread of vegetation in the profile asstands develop (Terborgh and Petren 1991, Brown andParker 1994, Denslow and Guzman 2000).
Tree architecture and light transmission
Crown architecture and tree allometry reflect diversespecies-specific solutions to the allocation of limitedbiomass between support structures and the photosyn-

October 2001 2715STAND STRUCTURE AND LIGHT TRANSMITTANCE
FIG. 5. Bivariate relationships between diffuse light trans-mittance at five heights above the forest floor and the densityof stems 10–25 cm dbh in an old-growth (●, solid lines) anda second-growth (C, dashed lines) stand at La Selva BiologicalStation, in the Caribbean lowlands of northeastern Costa Rica.
thetic apparatus (Horn 1971, Givnish 1982, King 1987,1996, Sterck and Bongers 1998). Fast-growing, earlysuccessional tree species tend to grow rapidly in height,forming slender stems and compromising safety for arapid arrival to the canopy. Alternatively, shade-tol-erant trees regenerating beneath an existing canopytend to form wider crowns, efficiently capturing lightand increasing in stem diameter as they gradually ap-proach the canopy (King 1990). Finally, relationshipsamong tree height, stem diameter, and crown diameter,shift as trees increase in overall size and canopy po-sition (King 1996, Sterk and Bongers 1998).
Differences in species composition and tree sizestrongly influence the physical structure of the standsin our study. Differences in tree dimensions are mostpronounced in the 10–25 cm dbh class. Thus, in ad-dition to being more abundant, mid-size stems alsodiverge most in crown architecture between foresttypes (Figs. 2 and 3). Forest-wide differences in crownarchitecture arise, in part, from dominance by particularspecies. While systematic differences in tree size andallometry do play a critical role in the differentiationof the physical structure of old-growth and second-growth forests, can these differences also affect lighttransmission?
The high species richness of trees and the complexvertical structure of tropical rain forests create diffi-culties in assessing the impact of species-specific al-lometry on patterns of light transmittance. In a studyconducted at La Selva Biological Station in second-growth stands dominated by single species, Kabakoffand Chazdon (1996) found species-specific effects onunderstory light availability. That study was conductedin areas of similar history, age, and species compositionto the second-growth stands described here. Dominantcanopy species Goethalsia meiantha and Pentaclethramacroloba diverged strongly in tree allometry, with G.meiantha having taller stems for a given diameter andsmall crowns for a given height (Kabakoff and Chazdon1996, King 1996). In that case, canopy trees indirectlyinfluenced understory light through differential effectson growth of sub-canopy and understory vegetation.G. meiantha’s narrow, globular crown allowed greaterlight penetration below the canopy, increasing the den-sity of understory shrubs and saplings, and ultimatelyleading to lower light availability at 1 m height.
Light transmittance and heterogeneity in relationto forest structure
We observed little or no direct effects of the canopyvegetation on variation of optical density near the forestfloor within old-growth or second-growth forests (Ta-ble 4). In both forest types the only significant predictorof optical density at 0.75 m was the density of woodyshrubs and saplings (stems .1 m tall and ,5 cm dbh,Table 4). Across a tropical moist chronosequence, Den-slow and Guzman (2000) found no relationship be-tween mean stand light levels or coefficient of variation
2716 R. A. MONTGOMERY AND R. L. CHAZDON Ecology, Vol. 82, No. 10
of light levels within stands, despite changes in foreststructure. Similarly, Brown and Parker (1994) foundthat stem-based measurements of trees offered littlepredictive power when examining changes in lightavailability near the forest floor across a chronose-quence in temperate deciduous forest. They suggestedthat crown-based measurements, such as foliage den-sity and leaf-area index, may be more informative ina tropical moist forest sequence. Alternatively, canopyvegetation structure may indirectly influence understo-ry light availability, through impacts on subcanopy andunderstory vegetation (Kabakoff and Chazdon 1996).
The lack of a strong relationship between canopy orsubcanopy vegetation and light transmittance in theunderstory reflects distinct spatial patterning in thesevariables. Although diffuse light transmittance in theseforests is strongly spatially autocorrelated at scales be-low 20 m (Nicotra et al. 1999), we found little or nospatial autocorrelation in vegetation density in any for-est stand (Table 2). In old-growth stands at La Selva,Clark et al. (1996) found that canopy height was sig-nificantly autocorrelated at 2.5-m intervals (smallerthan our sample unit), but even at that scale, correla-tions between canopy height and understory light avail-ability were weak. Thus, light transmittance varies ona fine spatial scale among understory microsites,whereas vegetation structure of canopy and midstorytrees shows little or no spatial patterning at scales be-low 50 m (Table 2). Vegetation composition and struc-ture does show pronounced spatial variation at largerspatial scales due to edaphic factors (Clark et al. 1995,1998, 1999). These landscape-level vegetation patternsmay influence patterns of light transmittance in theunderstory at scales larger than that examined in ourstudy (Clark et al. 1996, Kabakoff and Chazdon 1996).Thus, while forest structure may be an important pre-dictor of light availability at large spatial scales (acrossforest stands that differ in basal area and species com-position), we conclude that it is not a useful predictorof light availability within stands or across stands thatare similar in gross physical structure. At these finerscales, more subtle factors such as tree architecture,species composition, and vertical distribution of foliagemay be more influential.
Vertical patterns of light and forest structure
Assessment of vertical patterns of light availabilityin plots permitted a more detailed analysis of the re-lationship between light transmittance and forest struc-ture (Fig. 4). In vertical as well as horizontal directionswe found that mean light availability inadequatelycharacterizes the complexity of second-growth and old-growth stands, which differed in both variance and spa-tial pattern of light (Fig. 4; Nicotra et al. 1999). Meanlevels of light availability at all heights above the forestfloor mask differences in the spatial relationshipsamong heights in old-growth and second-growthstands. Vertical patterns of light transmission provide
evidence for the existence of recent, complete-canopy-to-forest-floor gaps in old-growth stands and their ab-sence in second-growth stands.
The absence of large treefall gaps in second-growthstands reflects a number of forest dynamic processes,as noted by Brokaw (1982b), Yavitt et al. (1995), andConnell et al. (1997). Treefalls by small-crowned sec-ond-growth trees may not have the volume or size tocreate complete gaps from canopy to forest floor. In-deed, creating large artificial canopy gaps of 350–450m2 in 15–20 yr old second-growth at La Selva, requirescutting at least 15 canopy trees (J. M. Dupuy and R.L. Chazdon, personal communication). Mortality ofmany early successional trees occurs after they becomeovertopped. When these overtopped individuals die, nocanopy gaps are created. Rather, they leave behind anempty space, or a ‘‘sub-canopy gap’’ below the uppercanopy layer (Connell et al. 1997). These second-growth forests can therefore be viewed as having anessentially two-tiered structure—the young, building-phase forest growing beneath a closed canopy of long-lived, fast-growing trees that established early in sec-ondary succession (Guariguata and Ostertag, in press).
What are the causal mechanisms for differences invertical distribution of light and its changing relation-ship to vegetation? We hypothesize that second-growthforests (15–25 yr old) and old-growth forests differ instand dynamics, leading to distinct patterns of verticalorganization of vegetation and vertical distribution oflight. At the stand level, light conditions in the under-story of old-growth forests reflect the constant gap-formation and gap-filling process of old-growth forestdynamics. In mature tropical rain forests, tree falls orbranch falls by canopy or emergent trees with large,spreading crowns cause complete gaps that extend fromthe forest floor to the canopy (Brokaw 1982a, Connellet al. 1997). Spatial-autocorrelation analysis confirmsthat these gaps influence light over horizontal distancestwice as large as that in second-growth forests (Clarket al. 1996, Nicotra et al. 1999).
In contrast, slender trees with small crowns dominatesecond-growth stands. Light penetrates through nu-merous, small, evenly distributed openings throughoutthe canopy hemisphere, with little open sky concen-trated near the zenith (Nicotra et al. 1999). This patternof canopy structure is associated with enhanced overalldiffuse light availability and increased spatial homo-geneity compared to old-growth stands (Nicotra et al.1999). Vertical profiles of foliage and light availabilitysuggest that tree recruitment in second-growth standsinvolves vertical filling of openings created below thecanopy.
Our hypotheses regarding forest development in sec-ond-growth tropical rain forests require a rigorous ex-amination of the relationship between light transmit-tance and the three-dimensional distribution of foliage(Parker and Brown 2000). The questions initially raisedin this paper were left only partially answered by our
October 2001 2717STAND STRUCTURE AND LIGHT TRANSMITTANCE
static measurements of forest structure and light trans-mittance. Long-term studies in larger plots, comparingthe vertical structure of mature and second-growth for-ests, would provide data to explore our hypothesis thatvegetation dynamics in young stands involve recruit-ment in sub-canopy gaps below the canopy. These stud-ies are currently underway in northeastern Costa Rica.The results presented here challenge the view that for-est-dynamic processes are driven by direct effects ofcanopy trees on understory light environments, espe-cially in young, second-growth forests. This expandedview of tropical rain forest dynamics is critical forunderstanding forest regeneration in the land-use mo-saic of today’s tropics.
ACKNOWLEDGMENTS
We thank Julie Denslow for her critical role in overallproject design and development and Manuel Guariguata, JuanManuel Dupuy, Carolina Gonzales, Marcos Molina, JeanettePaniagua, and Carlos Castillo for data collection in the field.Discussions with John Terborgh, David Clark, Deborah Clark,and Adrienne Nicotra contributed to all phases of this researchand analysis. The staff of the Organization for Tropical Stud-ies at Duke, Costa Rican Office, and La Selva provided in-valuable logistic support. This research was supported byNSF grant DEB-9208931, and a grant from the Andrew W.Mellon Foundation. This manuscript was improved by thecomments of four anonymous reviewers.
LITERATURE CITED
Anderson, M. C. 1966. Stand structure and light penetration.II. A theoretical analysis. Journal of Applied Ecology 3:41–54.
Augspurger, C. K. 1984. Seedling survival of tropical treespecies: interactions of dispersal distance, light-gaps, andpathogens. Ecology 65:1705–1712.
Brokaw, N. V. L. 1982a. The definition of a treefall gap andits effect on measures of forest dynamics. Biotropica 14:158–160.
Brokaw, N. V. L. 1982b. Treefalls: frequency, timing, andconsequences. Pages 101–108 in E. J. Leigh, A. Rand, andD. Winsor, editors. The ecology of a tropical forest: sea-sonal rhythms and long-term changes. Smithsonian Insti-tution Press, Washington, D.C., USA.
Brown, M. J., and G. G. Parker. 1994. Canopy light trans-mittance in a chronosequence of mixed-species deciduousforests. Canadian Journal of Forest Research 24:1694–1703.
Campbell, G. S., and J. M. Norman. 1989. The descriptionand measurement of plant canopy structure. Pages 3–19 inG. Russell, B. Marshall, and P. G. Jarvis, editors. Plantcanopies: their growth, form, and function. Cambridge Uni-versity Press, Cambridge, UK.
Canham, C. D., A. C. Finzi, S. W. Pacala, and D. H. Burbank.1994. Causes and consequences of resource heterogeneityin forests: interspecific variation in light transmission bycanopy trees. Canadian Journal of Forest Research 24:337–349.
Chazdon, R. L., and F. G. Coe. 1999. Ethnobotany of woodyspecies in second-growth, old-growth, and selectivelylogged forests of northeastern Costa Rica. ConservationBiology 13:1312–1322.
Chazdon, R. L., and N. Fetcher. 1984. Photosynthetic lightenvironments in a lowland tropical rainforest in Costa Rica.Journal of Ecology 72:553–564.
Clark, D. A., and D. B. Clark. 1992. Life history diversityof canopy and emergent trees in a Neotropical rain forest.Ecological Monographs 62:315–344.
Clark, D. A., D. B. Clark, R. Sandoval M., and M. VinicioCastro C. 1995. Edaphic and human effects on landscape-scale distributions of tropical rain forest palms. Ecology76:2581–2594.
Clark, D. B., D. A. Clark, and J. M. Read. 1998. Edaphicvariation in the mesoscale distribution of tree species in aneotropical rain forest. Journal of Ecology 86:101–112.
Clark, D. B., D. A. Clark, P. M. Rich, S. Weiss, and S. F.Oberbauer. 1996. Landscape-scale evaluation of understo-ry light and canopy structure: methods and application ina neotropical lowland rain forest. Canadian Journal of For-est Research 26:747–757.
Clark, D. B., M. W. Palmer, and D. A. Clark. 1999. Edaphicfactors and the landscape-scale distributions of tropical rainforest trees. Ecology 80:2662–2675.
Connell, J. H., M. D. Lowman, and I. R. Noble. 1997. Sub-canopy gaps in temperate and tropical forests. AustralianJournal of Ecology 22:163–168.
Cornelissen, J. H. C., M. J. A. Werger, and Z. C. Zhong.1994. Effects of canopy gaps on the growth of tree seed-lings from subtropical broad-leaved evergreen forests ofSouthern China. Vegetatio 110:43–54.
Denslow, J. S. 1980. Gap partitioning among tropical rain-forest trees. Biotropica 12(supplement):47–55.
Denslow, J. S., and S. Guzman G. 2000. Variation in standstructure, light, and seedling abundance across a tropicalmoist forest chronosequence, Panama. Journal of Vegeta-tion Science 11:201–212.
Denslow, J. S., and G. S. Hartshorn. 1994. Tree-fall gapenvironments and forest dynamic processes. Pages 120–127 in L. A. McDade, K. S. Bawa, H. A. Hespenheide, andG. S. Hartshorn, editors. La Selva: ecology and naturalhistory of a Neotropical rain forest. University of ChicagoPress, Chicago, Illinois, USA.
Denslow, J. S., E. Newell, and A. M. Ellison. 1991. Theeffect of understory palms and cyclanths on the growth andsurvival of Inga seedlings. Biotropica 23:225–234.
De Steven, D. 1994. Tropical tree seedling dynamics: re-cruitment patterns and their population consequences forthree canopy tree species in Panama. Journal of TropicalEcology 10:369–383.
Dupuy, J. M., and R. L. Chazdon. 1998. Long-term effectsof forest regrowth and selective logging on the seed bankof tropical forests in NE Costa Rica. Biotropica 30:223–237.
George, L. O., and F. A. Bazzaz. 1999. The fern understoryas an ecological filter: emergence and establishment of can-opy-tree seedlings. Ecology 80:833–845.
Givnish, T. J. 1982. On the adaptive significance of leafheight in forest herbs. American Naturalist 120:353–381.
Gleeson, S. K., and D. Tilman. 1990. Allocation and thetransient dynamics of succession on poor soils. Ecology71:1144–1155.
Grubb, P. J. 1996. Rainforest dynamics: the need for newparadigms. Pages 215–233 in D. S. Edwards, W. E. Booth,and S. C. Choy, editors. Tropical rainforest research: cur-rent issues. Kluwer, Dordrecht, The Netherlands.
Guariguata, M. R., R. L. Chazdon, J. S. Denslow, J. M. Du-puy, and L. Anderson. 1997. Structure and floristics ofsecondary and old-growth forest stands in lowland CostaRica. Plant Ecology 132:107–120.
Guariguata, M. R., and R. Ostertag. In press. Neotropicalsecondary forest succession: changes in structural andfunctional characteristics. Forest Ecology and Manage-ment.
Hartshorn, G. S. 1978. Treefalls and tropical forest dynamics.Pages 616–638 in P. B. Tomlinson and M. H. Zimmerman,editors. Tropical trees as living systems. Cambridge Uni-versity Press, Cambridge, UK.

2718 R. A. MONTGOMERY AND R. L. CHAZDON Ecology, Vol. 82, No. 10
Horn, H. S. 1971. The adaptive geometry of trees. PrincetonUniversity Press, Princeton, New Jersey, USA.
Hubbell, S. F., and R. B. Foster. 1986. Canopy gaps and thedynamics of a neotropical forest. Pages 77–96 in M. J.Crawley, editor. Plant ecology. Blackwell Scientific, Ox-ford, UK.
Jones, R. H., and R. R. Sharitz. 1998. Survival and growthof woody plant seedlings in the understorey of floodplainforests in South Carolina. Journal of Ecology 86:574–587.
Kabakoff, R. P., and R. L. Chazdon. 1996. Effects of canopyspecies dominance on understorey light availability in low-elevation secondary forest stands in Costa Rica. Journal ofTropical Ecology 12:779–788.
King, D. A. 1987. Load bearing capacity of understory tree-lets of a tropical wet forest. Bulletin of the Torrey BotanicalClub 114:419–428.
King, D. A. 1990. Allometry of saplings and understoreytrees of a panamanian forest. Functional Ecology 4:27–32.
King, D. A. 1996. Allometry and life history of tropical trees.Journal of Tropical Ecology 12:25–44.
Korning, J., and K. Thomsen. 1994. A new method for mea-suring tree height in tropical rain forest. Journal of Vege-tation Science 5:139–140.
Kuuluvainen, T., and T. Pukkala. 1989. Effect of crown shapeand tree distribution on the spatial distribution of shade.Agricultural and Forest Meteorology 40:215–231.
Lieberman, M., and D. Lieberman. 1991. No matter how youslice it—a reply to Publicover and Vogt. Ecology 72:1900–1902.
Lieberman, M., D. Lieberman, and R. Peralta. 1989. Forestsare not just swiss cheese: canopy stereogeometry of non-gaps in tropical forests. Ecology 70:550–555.
Lieberman, M., D. Lieberman, R. Peralta, and G. S. Harts-horn. 1995. Canopy closure and the distribution of tropicalforest tree species at La Selva, Costa Rica. Journal of Trop-ical Ecology 11:161–178.
MacArthur, R. H., and H. S. Horn. 1969. Foliage profiles byvertical measurements. Ecology 50:802–804.
Martinez-Ramos, M., E. Alvarez-Buylla, and J. Sarukhan.1989. Tree demography and gap dynamics in a tropicalrain forest. Ecology 70:555–558.
McDade, L. A., K. S. Bawa, H. A. Hespenheide, and G. S.Hartshorn, editors. 1994. La Selva: ecology and naturalhistory of a Neotropical rain forest. University of ChicagoPress, Chicago, Illinois, USA.
Messier, C., and P. Bellefleur. 1988. Light quantity and qual-ity on the forest floor of pioneer and climax stages in abirch–beech–sugar maple stand. Canadian Journal of ForestResearch 18:615–622.
Messier, C., and P. Puttonen. 1995. Spatial and temporal var-iation in the light environment of developing Scots pine
stands: the basis for a quick and efficient method of char-acterizing light. Canadian Journal of Forest Research 25:343–354.
Nicotra, A. B., R. L. Chazdon, and S. Iriarte. 1999. Spatialheterogeneity of light and woody seedling regeneration intropical wet forests. Ecology 80:1908–1926.
Parent, S., and C. Messier. 1996. A simple and efficient meth-od to estimate microsite light availability under a forestcanopy. Canadian Journal of Forest Research 26:151–154.
Parker, G. G., and M. J. Brown. 2000. Forest canopy strat-ification—Is it useful? American Naturalist 155:473–484.
Popma, J., F. Bongers, and J. Meave del Castillo. 1988. Pat-terns in the vertical structure of the tropical lowland rainforest of Los Tuxtlas, Mexico. Vegetatio 74:81–91.
Read, J. M., J. S. Denslow, and S. M. Guzman. In press.Documenting land-cover history of a humid tropical en-vironment in northeastern Costa Rica using time-series re-motely sensed data. In A. C. Millington, S. D. Walsh, andP. E. Osborne, editors. Remote sensing and GIS in bioge-ography & ecology. Kluwer, Boston, Massachusetts, USA.
Ross, M. S., L. B. Flanagan, and G. H. LaRoi. 1986. Seasonaland successional changes in light quality and quantity inthe understory of boreal forest ecosystems. Canadian Jour-nal of Botany 64:2792–2799.
Russell, A. E., J. W. Raich, and P. M. Vitousek. 1998. Theecology of the climbing fern, Dicranopteris linearis, onwindward Mauna Loa, Hawaii. Journal of Ecology 86:765–779.
Sipe, T. W., and F. A. Bazzaz. 1995. Gap partitioning amongmaples (Acer) in central New England; survival andgrowth. Ecology 76:1587–1602.
Smith, A. P., K. P. Hogan, and J. R. Idol. 1992. Spatial andtemporal patterns of light and canopy structure in a lowlandtropical moist forest. Biotropica 24:503–511.
Sterk, F. J., and F. Bongers. 1998. Ontogenetic changes insize, allometry, and mechanical design of tropical rain for-est trees. American Journal of Botany 85:266–272.
Tabachnick, B. G., and L. S. Fidell. 1989. Using multivariatestatistics. Harper & Row, New York, New York, USA.
Terborgh, J., and K. Petren. 1991. Development of habitatstructure through succession in an Amazonian floodplainforest. Pages 28–46 in S. S. Bell, E. D. McCoy, and H. R.Mushinsky, editors. Habitat structure: the physical arrange-ments of objects in space. Chapman & Hall, New York,New York, USA.
Welden, C. W., S. W. Hewett, S. P. Hubbell, and R. B. Foster.1991. Sapling survival, growth, and seedling establish-ment: relationship to canopy height in a neotropical forest.Ecology 72:35–50.
Yavitt, J. B., J. J. Battles, G. E. Lang, and D. H. Knight.1995. The canopy gap regime in a secondary Neotropicalforest in Panama. Journal of Tropical Ecology 11:391–402.
Copyright © 2022 FDOKUMEN