Forecasting malaria in a highly endemic country using ...
9
Zinszer et al. Malar J (2015) 14:245 DOI 10.1186/s12936-015-0758-4 RESEARCH Forecasting malaria in a highly endemic country using environmental and clinical predictors Kate Zinszer 1,2* , Ruth Kigozi 3 , Katia Charland 1 , Grant Dorsey 4 , Timothy F Brewer 5 , John S Brownstein 2 , Moses R Kamya 6 and David L Buckeridge 1 Abstract Background: Malaria thrives in poor tropical and subtropical countries where local resources are limited. Accurate disease forecasts can provide public and clinical health services with the information needed to implement targeted approaches for malaria control that make effective use of limited resources. The objective of this study was to deter- mine the relevance of environmental and clinical predictors of malaria across different settings in Uganda. Methods: Forecasting models were based on health facility data collected by the Uganda Malaria Surveillance Project and satellite-derived rainfall, temperature, and vegetation estimates from 2006 to 2013. Facility-specific fore- casting models of confirmed malaria were developed using multivariate autoregressive integrated moving average models and produced weekly forecast horizons over a 52-week forecasting period. Results: The model with the most accurate forecasts varied by site and by forecast horizon. Clinical predictors were retained in the models with the highest predictive power for all facility sites. The average error over the 52 forecasting horizons ranged from 26 to 128% whereas the cumulative burden forecast error ranged from 2 to 22%. Conclusions: Clinical data, such as drug treatment, could be used to improve the accuracy of malaria predictions in endemic settings when coupled with environmental predictors. Further exploration of malaria forecasting is neces- sary to improve its accuracy and value in practice, including examining other environmental and intervention predic- tors, including insecticide-treated nets. Keywords: Malaria, Uganda, Forecasting, Sentinel surveillance, Public health © 2015 Zinszer et al. This article is distributed under the terms of the Creative Commons Attribution 4.0 International License (http://creativecommons.org/licenses/by/4.0/), which permits unrestricted use, distribution, and reproduction in any medium, provided you give appropriate credit to the original author(s) and the source, provide a link to the Creative Commons license, and indicate if changes were made. The Creative Commons Public Domain Dedication waiver (http://creativecommons.org/ publicdomain/zero/1.0/) applies to the data made available in this article, unless otherwise stated. Background Malaria forecasting methods have become more sophis- ticated since Christophers’ early work [1] on forecasting malaria epidemics using rainfall, fever-related deaths, and wheat prices although the intent has remained unchanged: to inform malaria control and prevention by predicting burden or early warning of increasing burden. With the mounting cost of the global fight against malaria [2–4] and the drive towards elimination in many coun- tries, accurate forecasts of malaria could be a valuable tool for public and clinical health services. Accurate dis- ease predictions and early warning signals of an increase in disease burden can provide the information needed to implement targeted approaches for malaria control and prevention that make effective use of limited resources. Malaria forecasting models have been developed in many endemic countries [5–9], although the accuracy of the models is varied and difficult to interpret across studies given the diversity of forecasting methods used, including the way in which models are evaluated [9]. Typically, these models use data on environmental risk factors, such as weather conditions, to forecast malaria for a specific geographic area over a certain interval of time. Clinical predictors, such as anti-malarial treatment, have not been explored in previous forecasting work. Open Access *Correspondence: [email protected] 1 Clinical and Health Informatics Group, McGill University, 1140 Pine Ave West, Montreal, QC H3A 1A3, Canada Full list of author information is available at the end of the article
-
Upload
khangminh22 -
Category
Documents
-
view
5 -
download
0
Transcript of Forecasting malaria in a highly endemic country using ...

Zinszer et al. Malar J (2015) 14:245 DOI 10.1186/s12936-015-0758-4
RESEARCH
Forecasting malaria in a highly endemic country using environmental and clinical predictorsKate Zinszer1,2*, Ruth Kigozi3, Katia Charland1, Grant Dorsey4, Timothy F Brewer5, John S Brownstein2, Moses R Kamya6 and David L Buckeridge1
Abstract
Background: Malaria thrives in poor tropical and subtropical countries where local resources are limited. Accurate disease forecasts can provide public and clinical health services with the information needed to implement targeted approaches for malaria control that make effective use of limited resources. The objective of this study was to deter-mine the relevance of environmental and clinical predictors of malaria across different settings in Uganda.
Methods: Forecasting models were based on health facility data collected by the Uganda Malaria Surveillance Project and satellite-derived rainfall, temperature, and vegetation estimates from 2006 to 2013. Facility-specific fore-casting models of confirmed malaria were developed using multivariate autoregressive integrated moving average models and produced weekly forecast horizons over a 52-week forecasting period.
Results: The model with the most accurate forecasts varied by site and by forecast horizon. Clinical predictors were retained in the models with the highest predictive power for all facility sites. The average error over the 52 forecasting horizons ranged from 26 to 128% whereas the cumulative burden forecast error ranged from 2 to 22%.
Conclusions: Clinical data, such as drug treatment, could be used to improve the accuracy of malaria predictions in endemic settings when coupled with environmental predictors. Further exploration of malaria forecasting is neces-sary to improve its accuracy and value in practice, including examining other environmental and intervention predic-tors, including insecticide-treated nets.
Keywords: Malaria, Uganda, Forecasting, Sentinel surveillance, Public health
© 2015 Zinszer et al. This article is distributed under the terms of the Creative Commons Attribution 4.0 International License (http://creativecommons.org/licenses/by/4.0/), which permits unrestricted use, distribution, and reproduction in any medium, provided you give appropriate credit to the original author(s) and the source, provide a link to the Creative Commons license, and indicate if changes were made. The Creative Commons Public Domain Dedication waiver (http://creativecommons.org/publicdomain/zero/1.0/) applies to the data made available in this article, unless otherwise stated.
BackgroundMalaria forecasting methods have become more sophis-ticated since Christophers’ early work [1] on forecasting malaria epidemics using rainfall, fever-related deaths, and wheat prices although the intent has remained unchanged: to inform malaria control and prevention by predicting burden or early warning of increasing burden. With the mounting cost of the global fight against malaria [2–4] and the drive towards elimination in many coun-tries, accurate forecasts of malaria could be a valuable
tool for public and clinical health services. Accurate dis-ease predictions and early warning signals of an increase in disease burden can provide the information needed to implement targeted approaches for malaria control and prevention that make effective use of limited resources.
Malaria forecasting models have been developed in many endemic countries [5–9], although the accuracy of the models is varied and difficult to interpret across studies given the diversity of forecasting methods used, including the way in which models are evaluated [9]. Typically, these models use data on environmental risk factors, such as weather conditions, to forecast malaria for a specific geographic area over a certain interval of time. Clinical predictors, such as anti-malarial treatment, have not been explored in previous forecasting work.
Open Access
*Correspondence: [email protected] 1 Clinical and Health Informatics Group, McGill University, 1140 Pine Ave West, Montreal, QC H3A 1A3, CanadaFull list of author information is available at the end of the article
Page 2 of 9Zinszer et al. Malar J (2015) 14:245
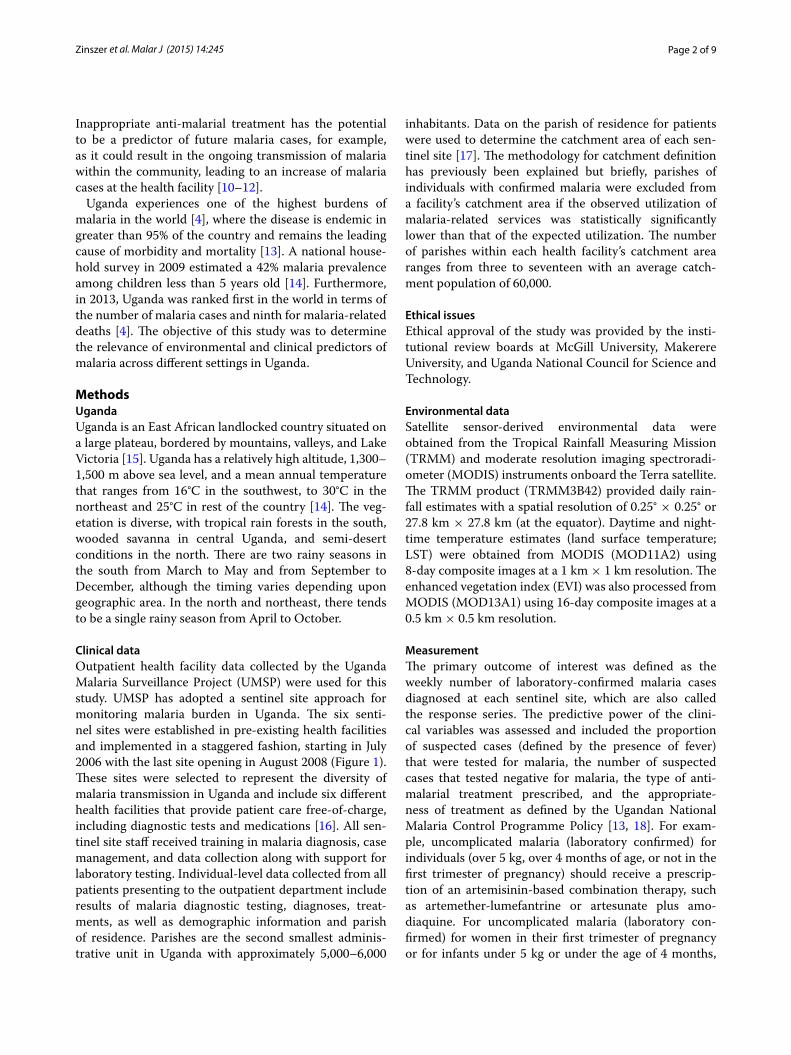
Inappropriate anti-malarial treatment has the potential to be a predictor of future malaria cases, for example, as it could result in the ongoing transmission of malaria within the community, leading to an increase of malaria cases at the health facility [10–12].
Uganda experiences one of the highest burdens of malaria in the world [4], where the disease is endemic in greater than 95% of the country and remains the leading cause of morbidity and mortality [13]. A national house-hold survey in 2009 estimated a 42% malaria prevalence among children less than 5 years old [14]. Furthermore, in 2013, Uganda was ranked first in the world in terms of the number of malaria cases and ninth for malaria-related deaths [4]. The objective of this study was to determine the relevance of environmental and clinical predictors of malaria across different settings in Uganda.
MethodsUgandaUganda is an East African landlocked country situated on a large plateau, bordered by mountains, valleys, and Lake Victoria [15]. Uganda has a relatively high altitude, 1,300–1,500 m above sea level, and a mean annual temperature that ranges from 16°C in the southwest, to 30°C in the northeast and 25°C in rest of the country [14]. The veg-etation is diverse, with tropical rain forests in the south, wooded savanna in central Uganda, and semi-desert conditions in the north. There are two rainy seasons in the south from March to May and from September to December, although the timing varies depending upon geographic area. In the north and northeast, there tends to be a single rainy season from April to October.
Clinical dataOutpatient health facility data collected by the Uganda Malaria Surveillance Project (UMSP) were used for this study. UMSP has adopted a sentinel site approach for monitoring malaria burden in Uganda. The six senti-nel sites were established in pre-existing health facilities and implemented in a staggered fashion, starting in July 2006 with the last site opening in August 2008 (Figure 1). These sites were selected to represent the diversity of malaria transmission in Uganda and include six different health facilities that provide patient care free-of-charge, including diagnostic tests and medications [16]. All sen-tinel site staff received training in malaria diagnosis, case management, and data collection along with support for laboratory testing. Individual-level data collected from all patients presenting to the outpatient department include results of malaria diagnostic testing, diagnoses, treat-ments, as well as demographic information and parish of residence. Parishes are the second smallest adminis-trative unit in Uganda with approximately 5,000–6,000
inhabitants. Data on the parish of residence for patients were used to determine the catchment area of each sen-tinel site [17]. The methodology for catchment definition has previously been explained but briefly, parishes of individuals with confirmed malaria were excluded from a facility’s catchment area if the observed utilization of malaria-related services was statistically significantly lower than that of the expected utilization. The number of parishes within each health facility’s catchment area ranges from three to seventeen with an average catch-ment population of 60,000.
Ethical issuesEthical approval of the study was provided by the insti-tutional review boards at McGill University, Makerere University, and Uganda National Council for Science and Technology.
Environmental dataSatellite sensor-derived environmental data were obtained from the Tropical Rainfall Measuring Mission (TRMM) and moderate resolution imaging spectroradi-ometer (MODIS) instruments onboard the Terra satellite. The TRMM product (TRMM3B42) provided daily rain-fall estimates with a spatial resolution of 0.25° × 0.25° or 27.8 km × 27.8 km (at the equator). Daytime and night-time temperature estimates (land surface temperature; LST) were obtained from MODIS (MOD11A2) using 8-day composite images at a 1 km × 1 km resolution. The enhanced vegetation index (EVI) was also processed from MODIS (MOD13A1) using 16-day composite images at a 0.5 km × 0.5 km resolution.
MeasurementThe primary outcome of interest was defined as the weekly number of laboratory-confirmed malaria cases diagnosed at each sentinel site, which are also called the response series. The predictive power of the clini-cal variables was assessed and included the proportion of suspected cases (defined by the presence of fever) that were tested for malaria, the number of suspected cases that tested negative for malaria, the type of anti-malarial treatment prescribed, and the appropriate-ness of treatment as defined by the Ugandan National Malaria Control Programme Policy [13, 18]. For exam-ple, uncomplicated malaria (laboratory confirmed) for individuals (over 5 kg, over 4 months of age, or not in the first trimester of pregnancy) should receive a prescrip-tion of an artemisinin-based combination therapy, such as artemether-lumefantrine or artesunate plus amo-diaquine. For uncomplicated malaria (laboratory con-firmed) for women in their first trimester of pregnancy or for infants under 5 kg or under the age of 4 months,

Page 3 of 9Zinszer et al. Malar J (2015) 14:245
oral quinine should be prescribed. Each series was based upon the health facility’s catchment area and the individ-ual-level data were aggregated to a weekly frequency.
Mean EVI and mean daytime and nighttime tempera-ture for each catchment area was calculated by overlying the parish boundaries with the raster environmental data (i.e., TRMM and MODIS). The weighted mean pixel or cell value for temperature and EVI for each parish was calculated and based on the proportion of the parish area contained within each pixel [19]. Rainfall for a par-ish was calculated from the pixel that intersected with the center point of the parish polygon as the TRMM pixels were often larger than a parish. Total rainfall was the cumulative total of rainfall over a 1-week period and other measures of rainfall were explored including loga-rithmically transformed total rainfall, maximum weekly rainfall, minimum weekly rainfall, and the weekly rainfall range. EVI and temperature values were interpolated to a weekly temporal resolution, given the different tempo-ral frequencies. A linear spline was used to interpolate EVI and a quadratic spline to interpolate temperature measures. Approximately 9% of the observations were
missing for nighttime temperature, and these values were imputed during the interpolation process using a quad-ratic spline. All polygons (parishes) were projected using the Universal Transverse Mercator system; zone 35 north (UTM35N).
Once weekly time series of environmental predictors were created for each parish, a weekly average across all parishes within a sentinel site’s catchment area was then calculated as a summary measure for each health facil-ity. All environmental and clinical predictor series began from the start of consistent data collection, often coin-ciding with the sentinel surveillance programme’s imple-mentation date, at each site until 31 May 2013. All series are listed in Table 1.
AnalysisARIMA (autoregressive integrated moving average) models are regressions that are designed to account for serial autocorrelation in time series [20]. The ARI-MAX form of ARIMA models was used for this study, which is a multivariate autoregressive integrated mov-ing average model and includes current and past values
Figure 1 Map of the outpatient health facilities of the Uganda Malaria Surveillance Program (UMSP).

Page 4 of 9Zinszer et al. Malar J (2015) 14:245
of independent variables as predictors. The ARIMAX (p,d,q) models were fitted with three components: the autoregressive order (p), differencing order (d), and the moving average order (q). ARIMAX models were devel-oped for each sentinel site with a 52-week forecast hori-zon, resulting in 52 weekly forecasts over the year period of 1 June 2012–31 May 2013. The series were divided into training (site implementation-31 May 2012) and testing (1 June 2012–31 May 2013) series. The training portion of the series was used for model building and the testing series were reserved for assessing the forecast accuracy of the models.
The best possible combination of environmental and clinical covariates was determined by Akaike’s informa-tion criterion (AIC) using the training series. The fit of the training series model was reassessed using the AIC-value, after it was adjusted for the model parameters. Following pre-whitening, the significant lags between the predictor series and the response series were identi-fied and considered in the model building. This would allow the lag between, for example, a rainfall event and the associated response in the malaria series, to be
incorporated into the model. The cross-correlations of predictor and response series (pre-whitened series) were assessed to determine significant lags [21].
Model fit was assessed through inspection of residual autocorrelation diagnostics via the autocorrelation func-tion (ACF), the partial autocorrelation function (PACF), and the Ljung–Box test. Further, histograms of the resid-uals and normal quantile plots were used to assess the distribution of the residuals. The model fit and model building was an iterative process. Each model was used to generate weekly forecasts up to 52 weeks in the future, from 1 June 2012 to 31 May 2013, using the parameters for predictors that were chosen during model selection. The models were implemented in a rolling fashion; after each weekly forecast, the model would be updated to include the observed malaria counts and covariate val-ues that occurred during that week before forecasting the malaria counts for the following week.
The final model for each site analysed for accuracy, by comparing the actual versus forecasted cases for the test-ing period (1 June 2012 until 31 May 2013) for each week or forecast horizon during the 52 weeks of forecasting.
Table 1 Response series (confirmed malaria) and potential clinical and environmental predictors series
a Inappropriate treatment was also a potential predictor which was the opposite of appropriate treatment (e.g., the number of individuals who were not prescribed an ACT when they should have or were prescribed inappropriately).
Series Description
Clinical data
Confirmed malaria Number of individuals with positive microscopy or rapid diagnostic test of malaria
Negative for malaria Number of suspected (presence of fever) tested negative for malaria
Proportion tested Proportion of suspected (presence of malaria) tested for malaria
Appropriate treatmenta Number of individuals who received appropriate anti-malarial prescriptions based upon their malaria status and NMCP treatment guidelines
Artemisinin-based combination therapy (ACT)
Number of ACTs prescriptions
Appropriate ACTa Number of individuals who were appropriately prescribed ACTs according to guidelines and malaria status
Quinine Number of quinine prescriptions
Appropriate quininea Number of individuals who were appropriately prescribed quinine according to guidelines and malaria status
Chloroquine Number of chloroquine prescriptions
Inappropriate chloroquine Number of individuals who were prescribed chloroquine
Environmental data
Daytime temperature Temperature at 3 pm (8-day composite image)
Nighttime temperature Temperature at 3 am (8-day composite image)
Total rainfall Cumulative sum of daily rainfall over a week period
Log total rainfall Log of cumulative sum of daily rainfall over a week period
Mean rainfall Mean daily rainfall over a week period
Minimum rainfall Minimum daily rainfall over a week period
Maximum rainfall Maximum daily rainfall over a week period
Rainfall range Difference between the maximum and minimum rainfall over a week period
Vegetation Enhanced vegetation index (16-day composite image)

Page 5 of 9Zinszer et al. Malar J (2015) 14:245
The symmetric mean absolute percentage error (SMAPE) was used to measure accuracy:
where SMAPEaveh is the average SMAPE value for a hori-zon (h), Yi is the observed value, Yi is the forecasted value, and n is the number of forecasts or observations for that horizon [22]. There were multiple forecasts per forecast horizon, given the rolling implementation of the models. Therefore, a SMAPE value was calculated for each hori-zon, resulting in a total of 52 SMAPE values, one for each forecast horizon. For example, there were 52 forecasts of all 1-week ahead forecasts (horizon one) and the error of these forecasts would be averaged to obtain an overall one-week ahead forecast error. Negative forecast values were set to zero. The upper bound of the SMAPE met-ric is 200%, producing a range of possible values from 0 to 200%. In addition, the percent error of the total fore-casted burden (number of cases) over the 52-week period was compared to the actual burden that occurred from 1 June 2012 to 31 May 2013. The first forecasted obser-vation from each forecast horizon (1 to 52) was used to obtain the cumulative forecasted burden over the fore-casting period.
RStudio v0.93 was used for data management, SAS v9.3 was used for the analyses, ERDAS Imagine v10.1 was used for processing the satellite images, and ArcGIS v10 was used for spatial analyses.
ResultsThere were slightly more females than males with con-firmed malaria at each site and the mean annual tem-peratures were relatively similar with a 2°C difference across the sites (Table 2). Nagongera had the youngest malaria cases in age and generally, there were slightly
SMAPEaveh =1
n
n∑
i=1
∣
∣
∣Yi − Yi
∣
∣
∣
(Yi + Yi)
/
2
× 100
more female than male confirmed malaria cases at each site. On average, Nagongera had the highest daytime temperatures (29.8°C) and received the most rain in 2012 (1.66 m).
The predictors included in the final models varied by sentinel site (Table 3). A commonly included category of predictor was drug treatment, with at least one treat-ment predictor series included in every model. Appropri-ate treatment and the number of courses of ACT were the most frequently included treatment predictors. Total rainfall was the most commonly retained environmen-tal predictor. Kamwezi’s models contained the smallest number of predictors, four, whereas Walukuba contained the most, fourteen. Approximately half the predictor series were lagged, ranging from lags of 1 to 52 weeks. A table of the predictors, parameters, and lags are included in an appendix (See Additional file 1: Table S1).
Seasonality was visually assessed for each model using the ACF and PACF, although none of the models included seasonal terms as non-seasonal parameters and predictors were sufficient to capture any seasonal varia-tion. All models had one order of differencing and a mov-ing average term of one order. However, the orders of the autoregressive (AR) terms ranged from 1 to 43.
The short-term horizons (e.g., 1- to 4-weeks ahead) were better at predicting high-frequency variation in malaria cases compared to longer-term horizons although the short-term horizons predicted the peaks 1 to 4 weeks after they were observed (Figure 2). Kam-wezi had the highest error with an average of 128% across all 52 forecast horizons and Nagongera had the lowest average error at 27% (Table 4). When examining the forecasting accuracy by forecast horizon, horizon one forecasts (i.e., 1-week ahead forecasts), typically resulted in the smallest error. The weekly SMAPE error was highest when the observed counts were low or zero which occurred most often with the Kamwezi site (Figure 3). When examining the ability of models to
Table 2 Characteristics for each UMSP outpatient health facility
a Total number of weeks or time points for the series (training and testing series).
Site Series start (no. of weeks)a
Cumulative number of cases
Average age (years)
% Female Average daytime temperature (°C)
Average nighttime temperature (°C)
Cumulative rainfall for 2012 (m)
Aduku 5 November 2007 (291)
14,963 10.7 59 29.1 17.6 1.29
Kamwezi 8 September 2008 (247)
18,882 15.8 56 27.7 15.8 1.01
Kasambya 10 March 2008 (273) 20,636 13.7 57 27.3 15.4 1.02
Kihihi 9 June 2008 (261) 21,278 20.0 63 27.3 16.5 1.05
Nagongera 16 June 2008 (259) 20,716 8.4 56 29.8 17.5 1.66
Walukuba 28 April 2008 (266) 29,664 15.0 59 28.6 16.9 1.22

Page 6 of 9Zinszer et al. Malar J (2015) 14:245
predict the total number of cases during the forecasting period, Nagongera had the lowest percent error at 2% (Figure 4). The Kihihi model had the largest error with
an overprediction of 22% and the average error was 9% for the 52-week forecasted malaria burden across all six sites.
Table 3 Categories of clinical and environmental predictors included in final forecasting models
Predictor Aduku Kamwezi Kasambya Kihihi Nagongera Walukuba
Rainfall ✓ ✓ ✓ ✓ ✓ ✓Temperature ✓ ✓ ✓ ✓ ✓Vegetation ✓ ✓ ✓ ✓ ✓ ✓Treatment ✓ ✓ ✓ ✓ ✓Suspected ✓ ✓ ✓ ✓ ✓Proportion screened ✓ ✓ ✓ ✓ ✓
Aduku Kamwezi Kasambya Kihihi Nagongera Walukuba
0
50
100
150
200
Jul Oct JanApr Jul Oct JanApr Jul Oct JanApr Jul Oct JanApr Jul Oct JanApr Jul Oct JanApr
Forecasting period
Nu
mb
er o
f co
nfi
rmed
mal
aria
Observed Forecasted
Figure 2 Plot of weekly observed and forecasted malaria counts (horizon 1 forecasts) for each UMSP site from 1 June 2012 to 31 May 2013.
Table 4 Error for selected forecast horizons by UMSP site
a Average error across all forecast horizons (horizons 1–52).
Site Horizon 1 (%) Horizon 4 (%) Horizon 12 (%) Horizon 26 (%) Horizon 52 (%) Average (%)a
Aduku 31.6 43.2 62.1 73.7 99.5 70.7
Kamwezi 57.8 117.0 125.6 147.1 127.0 127.8
Kasambya 31.3 42.8 56.0 42.9 13.5 46.6
Kihihi 20.9 31.1 46.3 31.2 33.4 37.0
Nagongera 19.4 27.8 32.5 31.9 2.0 26.3
Walukuba 22.1 30.7 35.2 37.3 34.6 30.8

Page 7 of 9Zinszer et al. Malar J (2015) 14:245
DiscussionThe Abuja Declaration noted the importance of accurate disease prediction for targeting and evaluating control measures [23]. For forecasting models to be useful for clinical and public health decision-making, models must produce accurate forecasts. This study examined vari-ous predictors across six different settings in Uganda and
consistently found that both environmental and clinical predictors were necessary to achieve the highest possi-ble predictive power. This is the first study that examines clinical predictors, other than malaria cases, in combi-nation with environmental predictors for forecasting malaria. Future forecasting work should consider clinical predictors given the likelihood of their relevance in dif-ferent endemic settings.
Incorporating clinical predictors such as anti-malarial treatment, the proportion of individuals screened for malaria, and the number of malaria negative individuals, produced models with the best predictive power across a range of settings in Uganda and across forecast horizons. In addition, rainfall, temperature, and EVI were also identified as necessary for several of the models in terms of achieving the greatest predictive ability. The accuracy of the models varied widely between the sites, with mod-els at some sites (e.g., Kamwezi) influenced by low and zero counts in the response series, leading to large rela-tive error measures (200%).
It is not known if the observed cases were incident or recrudescent. Inclusion of recrudescent cases in the out-come series would weaken the predictive ability of environ-mental covariates [5], which have a stronger relationship
255075
050
100150200
050
100150
40
80
120
160
4080
120160
5075
100
Aduku
Kam
wezi
Kasam
byaKihihi
Nagongera
Walukuba
Jun Jul Aug Sep Oct Nov Dec Jan Feb Mar Apr May JunForecasting period
Nu
mb
er o
f co
nfi
rmed
mal
aria
Percent error 10 50 100 150 200
Figure 3 Plot of weekly-observed malaria counts sized by SMAPE error for forecast horizon 1 for each UMSP site from 1 June 2012 to 31 May 2013. Each weekly observed count of malaria is sized proportionally to the forecasting error associated with that particular observation.
0
1000
20002000
3000
4000
5000
Aduku Kamwezi Kasambya Kihihi Nagongera Walukuba
Tota
l nu
mb
er o
f co
nfi
rmed
mal
aria
Observed Forecasted
Figure 4 Bar chart of the total observed malaria burden versus bur-den prediction by UMSP site from 1 June 2012 to 31 May 2013.

Page 8 of 9Zinszer et al. Malar J (2015) 14:245
with incident cases, although inclusion of recrudescent cases may strengthen the predictive ability of certain treat-ment predictors [10–12]. There are different ways in which measurement error could have influenced the findings. Remote sensing data was used in lieu of ground observa-tions due to data availability, and these remote sensing observations are subject to measurement error [23–29]. The treatment data were based upon prescriptions and not on dispensed anti-malarial medication or treatment taken by the patient, which may have introduced noise into the series, and facility-level factors likely influenced the accu-racy of the observed counts of confirmed malaria. Finally, incorporate other predictors, such as humidity and inter-vention data (e.g., insecticide-treated nets, indoor residual spraying), were not included which may further improve the forecasting accuracy. The Aduku region, for example, has been subject to rounds of indoor residual spraying [30], which likely accounts for some of the unexplained variation. All of these factors have likely resulted in meas-urement error, increasing the noise of the different series and decreasing their ability to predict malaria.
The models were not developed to explain causal rela-tionships but were developed with the goal of achieving the highest predictive power. Consequently, multicollinearity was present between various predictor series and influ-enced which predictors and respective lags were included in the final models. The biological interpretation of specific lags and combination of predictors is therefore limited.
There are different potential users of malaria forecasts. Health facilities could use the forecasts to plan for patient visits, for example, in ensuring that sufficient diagnostic and treatment materials are available. Policy-makers and those involved with malaria control strategy planning could use the information to understand the burden of malaria in a particular location for the coming year, to inform the procurement of anti-malarials and diagnostic equipment, and also in informing malaria control strategy, such as tar-geting intervention efforts. With the increasing availability of electronic medical records and electronic systems, clini-cal predictors could be collected and analysed in real-time in conjunction with remote sensing data, if meteorological data are not an option. Using malaria forecasting models in practice would also allow us to understand how accurate a model needs to be, in order to be useful. Potential barriers to the utility of the models include the supply chain manage-ment approach, if supply decisions are made at the national level through a national store (‘push’ system) [31] versus at the health-facility level as well as a lack of resources required to guide community-tailored prevention measures.
ConclusionsClinical data such as drug treatment could be used to improve the accuracy of malaria predictions in a highly
endemic setting when coupled with environmental pre-dictors. Future research should consider other non-envi-ronmental predictor series and the practical implications of accuracy should be examined to determine the impact of forecast accuracy on disease control decisions. Accu-rate malaria forecasting models are needed to guide effi-cient allocation of resources for prevention and response; further exploration of malaria forecasting is necessary to improve its value in practice.
AbbreviationsAIC: Akaike’s information criterion; ACF: autocorrelation function; ACT: artemisinin-based combination therapy; AR: autoregressive; ARIMA: autore-gressive integrated moving average; EVI: enhanced vegetation index; MODIS: moderate resolution imaging spectroradiometer; PACF: partial autocorrelation function; SMAPE: symmetric mean absolute percentage error; TRMM: Tropi-cal Rainfall Measuring Mission; UMSP: Uganda Malaria Surveillance Project; UTM35N: Universal Transverse Mercator system zone 35 north.
Authors’ contributionsKZ developed the research question for this paper with conceptual assistance from KC and DB. RK, GD, and MRK assisted with the data acquisition and KZ performed the analysis with guidance from KC. KZ drafted the manuscript and all authors made substantive suggestions for revision prior to journal submis-sion. All authors read and approved the final manuscript.
Author details1 Clinical and Health Informatics Group, McGill University, 1140 Pine Ave West, Montreal, QC H3A 1A3, Canada. 2 Children’s Hospital Informatics Program, Bos-ton Children’s Hospital, Boston, MA, USA. 3 Uganda Malaria Surveillance Project, Kampala, Uganda. 4 School of Medicine, University of California San Francisco, San Francisco, CA, USA. 5 University of California Los Angeles, Los Angeles, CA, USA. 6 College of Health Sciences, Makerere University, Kampala, Uganda.
AcknowledgementsWe would like to thank Will McInnes for his assistance with the remote sensing data and Dr. Okui and colleagues for their support at the National Malaria Control Programme in Uganda. This research was supported by doctoral awards granted by the International Development Research Centre, Fonds de Recherche Santé du Québec, and the McGill University Health Centre Research Institute. Funding was provided to the Uganda Malaria Surveillance Project from the National Institutes of Health as part of the International Centers of Excellence in Malaria Research (ICMER) programme (U19AI089674).
Compliance with ethical guidelines
Competing interestsThe authors declare that they have no competing interests.
Received: 9 March 2015 Accepted: 3 June 2015
References 1. Christophers SR (1911) Epidemic malaria of the Punjab: with a note of
a method of predicting epidemic years. Trans Committee Stud Malaria India 2:17–26
2. Sachs JD (2002) A new global effort to control malaria. Science 298:122–124
Additional file
Additional file 1: Table S1. Description of final models. Table describ-ing the final ARIMA(p,d,q) model, predictors, and associated lags.

Page 9 of 9Zinszer et al. Malar J (2015) 14:245
3. Sachs JD, Malaney P (2002) The economic and social burden of malaria. Nature 415:680–685
4. WHO (2014) World malaria report 2014. World Health Organization, Geneva
5. Briët OJ, Vounatsou P, Gunawardena DM, Galappaththy GN, Amerasinghe PH (2008) Models for short term malaria prediction in Sri Lanka. Malar J 7:76
6. Abeku TA, De Vlas SJ, Borsboom GJJM, Tadege A, Gebreyesus Y, Gebreyo-hannes H et al (2004) Effects of meteorological factors on epidemic malaria in Ethiopia: a statistical modelling approach based on theoretical reasoning. Parasitology 128:585–593
7. Gomez-Elipe A, Otero A, van Herp M, Aguirre-Jaime A (2007) Forecasting malaria incidence based on monthly case reports and environmental factors in Karuzi, Burundi, 1997–2003. Malar J 6:129
8. Medina DC, Findley SE, Guindo B, Doumbia S (2007) Forecasting non-stationary diarrhea, acute respiratory infection, and malaria time-series in Niono, Mali. PLoS One 2:e1181
9. Zinszer K, Verma AD, Charland K, Brewer TF, Brownstein JS, Sun Z et al (2012) A scoping review of malaria forecasting: past work and future directions. BMJ Open 2:e001992
10. Dorsey G, Staedke S, Clark TD, Njama-Meya D, Nzarubara B, Maiteki-Sebu-guzi C et al (2007) Combination therapy for uncomplicated falciparum malaria in Ugandan children. JAMA 297:2210–2219
11. Dorsey G, Gasasira AF, Machekano R, Kamya MR, Staedke SG, Hubbard A (2004) The impact of age, temperature, and parasite density on treatment outcomes from antimalarial clinical trials in Kampala, Uganda. Am J Trop Med Hyg 71:531–536
12. Jagannathan P, Muhindo MK, Kakuru A, Arinaitwe E, Greenhouse B, Tappero J et al (2012) Increasing incidence of malaria in children despite insecticide-treated bed nets and prompt anti-malarial therapy in Tororo, Uganda. Malar J 11:435
13. Malaria Control Programme (2005) Uganda malaria control strategic plan 2005/6–2009/10. Ministry of Health, Kampala
14. Uganda Bureau of Statistics (UBOS), ICF Macro (2010) Uganda malaria indicator survey 2009. UBOS and ICF Macro 2010, Calverton, Maryland
15. Encyclopedia Britannica (2015) Uganda. http://www.britannica.com/EBchecked/topic/612597/Uganda/37601/Plant-and-animal-life. Accessed 29 Jan 2015
16. Sserwanga A, Harris JC, Kigozi R, Menon M, Bukirwa H, Gasasira A et al (2011) Improved malaria case management through the implementa-tion of a health facility-based sentinel site surveillance system in Uganda. PLoS One 6:e16316
17. Zinszer K, Charland K, Kigozi R, Dorsey G, Kamya MR, Buckeridge DL (2014) Determining health-care facility catchment areas in Uganda using data on malaria-related visits. Bull World Health Organ 92:178–186
18. Sears D, Kigozi R, Mpimbaza A, Kakeeto S, Sserwanga A, Staedke SG et al (2013) Anti-malarial prescription practices among outpatients with laboratory-confirmed malaria in the setting of a health facility-based sentinel site surveillance system in Uganda. Malar J 12:252
19. ESRI (2012) ArcGIS Resources. http://resources.arcgis.com/en/help/main/10.1/index.html#//009z000000w7000000. Accessed 4 Dec 2014
20. Shumway RH, Stoffer DS (2006) Time series analysis and its applications: with R examples, 2nd edn. Springer, New York
21. Chatfield C (2004) The analysis of time series: an introduction, 6th edn. Chapman & Hall, London
22. Hyndman RJ, Koehler AB (2006) Another look at measures of forecast accuracy. Int J Forecast 22:679–688
23. Roll Back Malaria Partnership Secretariat (2000) The Abuja declaration and the plan of action. http://www.rollbackmalaria.org/microsites/wmd2011/abuja_declaration_final.html. Accessed 7 Dec 2014
24. Moore SM, Monaghan A, Griffith KS, Apangu T, Mead PS, Eisen RJ (2012) Improvement of disease prediction and modeling through the use of meteorological ensembles: human plague in Uganda. PLoS ONE 7:e44431
25. Trigo I, Monteiro IT, Olesen F, Kabsch E (2008) An assessment of remotely sensed land surface temperature. J Geophys Res Atmos 113:nD17
26. Scharlemann JPW, Benz D, Hay SI, Purse BV, Tatem AJ, Wint GRW et al (2008) Global data for ecology and epidemiology: a novel algorithm for temporal Fourier processing MODIS data. PLoS One 3:e1408
27. Huete AR (2012) Vegetation indices, remote sensing and forest monitor-ing. Geogr Compass 6:513–532
28. Nicholson SE, Some B, McCollum J, Nelkin E, Klotter D, Berte Y et al (2003) Validation of TRMM and other rainfall estimates with a high-density gauge dataset for West Africa. Part II: validation of TRMM rainfall products. J Appl Meteorol 42:1355–1368
29. Adeyewa ZD, Nakamura K (2003) Validation of TRMM radar rainfall data over major climatic regions in Africa. J Appl Meteorol 42:331–347
30. Kigozi R, Baxi SM, Gasasira A, Sserwanga A, Kakeeto S, Nasr SR et al (2012) Indoor residual spraying of insecticide and malaria morbidity in a high transmission intensity area of Uganda. PLoS One 7:e42857
31. United Stated Agency for International Development (2011) Guidelines for managing the malaria supply chain. http://deliver.jsi.com/dlvr_con-tent/resources/allpubs/guidelines/GuidManaMalariaSC.pdf. Accessed 6 Jan 2015
Submit your next manuscript to BioMed Centraland take full advantage of:
• Convenient online submission
• Thorough peer review
• No space constraints or color figure charges
• Immediate publication on acceptance
• Inclusion in PubMed, CAS, Scopus and Google Scholar
• Research which is freely available for redistribution
Submit your manuscript at www.biomedcentral.com/submit