Forces mediating protein–protein interactions: a computational study of p53 “approaching” MDM2
15
REGULAR ARTICLE Forces mediating protein–protein interactions: a computational study of p53 ‘‘approaching’’ MDM2 Shubhra Ghosh Dastidar • Arumugam Madhumalar • Gloria Fuentes • David P. Lane • Chandra S. Verma Received: 15 September 2009 / Accepted: 31 October 2009 / Published online: 22 November 2009 Ó Springer-Verlag 2009 Abstract The protein MDM2 forms a complex with the tumor suppressing protein p53 and targets it for proteolysis in order to down-regulate p53 in normal cells. Inhibition of this interaction is of therapeutic importance. Molecular dynamics simulations of the association between p53 and MDM2 have revealed mutual modulation of the two sur- faces. Analysis of the simulations of the two species approaching each other in solution shows how long range electrostatics steers these two proteins together. The net electrostatics is controlled largely by a few cationic resi- dues that surround the MDM2 binding site. There is an overall separation in electrostatics of MDM2 and p53 that are mutually complementary and drive association. Upon close approach, there is significant energetic strain as the charges are occluded from water (desolvated). However, the complexation is driven by packing interactions that lead to highly favorable van der Waals interactions. Although the complementarity of the electrostatics of the two sur- faces is essential for the two partners to form a complex, steric collisions of Y100 and short ranged van der Waals interactions of F19, W23, L26 of p53 determine the final steps of native complex formation. The electrostatics seem to be evolutionarily conserved, including variations in both partners. Keywords Molecular dynamics Á Electrostatics Á p53 Á MDM2 Á Protein–protein interaction 1 Introduction The ubiquitin ligase MDM2 controls the levels of the tumor suppressor protein p53 in normal cells [1, 2]. In stressed cells (e.g. those suffering from DNA damage) phosphory- lation is known to destabilize the complex between the N-terminus of MDM2 and the N-terminus of p53. This stabilizes p53 which then activates arrest, repair or apop- tosis in these cells [2]. The discovery of tumours with highly upregulated MDM2 has lead to several studies aimed at developing peptides/small inhibitors that can displace p53 from MDM2 [3–7]. Structural data on apo and complexed forms of MDM2 show wide structural heterogeneity (RCSB codes: 1Z1M, 1YCR, 1RV1, 2GV2, 1T4F, 2Z5T, 2AXI), revealing a highly plastic binding pocket of MDM2 (see the movie in the supporting information file M1.ppt). Indeed computational studies have further revealed the extent of this complexity in modulating peptide binding and, sup- ported by experimental evidence, have shown that one of the residues that lines the binding site, Y100, has a major role in modulating this plasticity [8, 9]. This immediately leads to the following questions: at what point does the conformational adjustment take place—is it a part of the binding event (induced fit) or does it occur prior to binding (pre-organized/lock-and-key)? What are the factors that control this modulation? It is known that long range steering [10] couples with short range effects (such as desolvation; Dedicated to Professor Sandor Suhai on the occasion of his 65th birthday and published as part of the Suhai Festschrift Issue. Electronic supplementary material The online version of this article (doi:10.1007/s00214-009-0682-1) contains supplementary material, which is available to authorized users. S. G. Dastidar Á A. Madhumalar Á G. Fuentes Á C. S. Verma (&) Bioinformatics Institute (A*STAR), 30 Biopolis Street, #07-01 Matrix, Singapore 138671, Singapore e-mail: [email protected] D. P. Lane p53 Laboratory (A*STAR), 8A Biomedical Grove, #06-06 Immunos, Singapore 138648, Singapore 123 Theor Chem Acc (2010) 125:621–635 DOI 10.1007/s00214-009-0682-1
Transcript of Forces mediating protein–protein interactions: a computational study of p53 “approaching” MDM2

REGULAR ARTICLE
Forces mediating protein–protein interactions:a computational study of p53 ‘‘approaching’’ MDM2
Shubhra Ghosh Dastidar • Arumugam Madhumalar •
Gloria Fuentes • David P. Lane • Chandra S. Verma
Received: 15 September 2009 / Accepted: 31 October 2009 / Published online: 22 November 2009
� Springer-Verlag 2009
Abstract The protein MDM2 forms a complex with the
tumor suppressing protein p53 and targets it for proteolysis
in order to down-regulate p53 in normal cells. Inhibition of
this interaction is of therapeutic importance. Molecular
dynamics simulations of the association between p53 and
MDM2 have revealed mutual modulation of the two sur-
faces. Analysis of the simulations of the two species
approaching each other in solution shows how long range
electrostatics steers these two proteins together. The net
electrostatics is controlled largely by a few cationic resi-
dues that surround the MDM2 binding site. There is an
overall separation in electrostatics of MDM2 and p53 that
are mutually complementary and drive association. Upon
close approach, there is significant energetic strain as the
charges are occluded from water (desolvated). However,
the complexation is driven by packing interactions that lead
to highly favorable van der Waals interactions. Although
the complementarity of the electrostatics of the two sur-
faces is essential for the two partners to form a complex,
steric collisions of Y100 and short ranged van der Waals
interactions of F19, W23, L26 of p53 determine the final
steps of native complex formation. The electrostatics seem
to be evolutionarily conserved, including variations in both
partners.
Keywords Molecular dynamics � Electrostatics �p53 � MDM2 � Protein–protein interaction
1 Introduction
The ubiquitin ligase MDM2 controls the levels of the tumor
suppressor protein p53 in normal cells [1, 2]. In stressed
cells (e.g. those suffering from DNA damage) phosphory-
lation is known to destabilize the complex between the
N-terminus of MDM2 and the N-terminus of p53. This
stabilizes p53 which then activates arrest, repair or apop-
tosis in these cells [2]. The discovery of tumours with highly
upregulated MDM2 has lead to several studies aimed at
developing peptides/small inhibitors that can displace p53
from MDM2 [3–7]. Structural data on apo and complexed
forms of MDM2 show wide structural heterogeneity (RCSB
codes: 1Z1M, 1YCR, 1RV1, 2GV2, 1T4F, 2Z5T, 2AXI),
revealing a highly plastic binding pocket of MDM2 (see the
movie in the supporting information file M1.ppt). Indeed
computational studies have further revealed the extent of
this complexity in modulating peptide binding and, sup-
ported by experimental evidence, have shown that one of
the residues that lines the binding site, Y100, has a major
role in modulating this plasticity [8, 9]. This immediately
leads to the following questions: at what point does the
conformational adjustment take place—is it a part of the
binding event (induced fit) or does it occur prior to binding
(pre-organized/lock-and-key)? What are the factors that
control this modulation? It is known that long range steering
[10] couples with short range effects (such as desolvation;
Dedicated to Professor Sandor Suhai on the occasion of his 65th
birthday and published as part of the Suhai Festschrift Issue.
Electronic supplementary material The online version of thisarticle (doi:10.1007/s00214-009-0682-1) contains supplementarymaterial, which is available to authorized users.
S. G. Dastidar � A. Madhumalar � G. Fuentes � C. S. Verma (&)
Bioinformatics Institute (A*STAR), 30 Biopolis Street,
#07-01 Matrix, Singapore 138671, Singapore
e-mail: [email protected]
D. P. Lane
p53 Laboratory (A*STAR), 8A Biomedical Grove,
#06-06 Immunos, Singapore 138648, Singapore
123
Theor Chem Acc (2010) 125:621–635
DOI 10.1007/s00214-009-0682-1

ion-pair formation) and associated rearrangements to
maximize intermolecular packing and are the hallmark of
protein–protein interactions [11, 12]. Early studies dem-
onstrated that it was possible using computational models to
show how long range electrostatic steering forces could
account for important biological phenomena such as the
asymmetric polymerizations in actin [13]. Such studies
paved the way for routine applications of these types of
methods in exploring such phenomena, in particular those
involving interactions between molecules such as proteins
or proteins and nucleic acids [14]. These computational
approaches have further been augmented by the represen-
tations of proteins as all atom models and as coarse grained
models [15, 16]. A recent study has shown that in the p53–
MDM2 system, conformational changes occur as p53 and
MDM2 approach each other, such as the Y100 reorienta-
tions [17]. This study has revealed some of the conforma-
tional changes associated with the transition of MDM2 from
uncomplexed (apo) to the complexed state, yielding a
diversity of conformations. In addition, our own work has
shown how the orientations of Y100 modulate the binding
of p53 in different conformations [9, 18]. These simulations
have revealed a rich complexity of interacting surfaces of
p53 and MDM2. The interconversion between conforma-
tional states of MDM2 may be correlated to the binding of
p53, yielding eventually the native structure of the complex.
The probability of successful complexation between p53
and MDM2 is dependent on the dynamics of the confor-
mations of both partners.
Based on available structural data and computational
studies [8, 9, 19], we can classify the conformational states
of MDM2 into the following three broad groups (see
Fig. 1): (i) ‘open’ state, where the Y100 side chain points
away from the p53 binding pocket; (ii) ‘closed’ state,
where the Y100 side chain points towards the binding
pocket resulting in some occlusion of the pocket and (iii)
‘apo’ state—the unliganded state of MDM2, where the
Y100 is deeply buried and the p53 binding pocket is hardly
accessible to a ligand. The ‘open’ state includes the crystal
structure of the N-terminal domain of MDM2 complexed
with a 13 residue fragment of the trans-activation domain
of p53 (RCSB code 1YCR). The ‘closed’ state is revealed
in the complex of MDM2 with the small molecule inhibitor
nutlin (RCSB code 1RV1) and also several other peptide–
MDM2 complexes. The ‘apo’ state is observed in the
ensemble of NMR determined structures of MDM2
(1Z1M; [19]). Transitions between the ‘open’ and ‘closed’
states can occur during the process of mutual modulation of
MDM2 and ligand as they writhe to optimize their inter-
actions with each other, which has been seen in recent
computational studies [9, 20].
Normally, a study of the diffusion of two molecules
towards each other would best be carried out using the
coarse grained method of Brownian dynamics (BD) simu-
lations [21–23] (especially when they are charged overall;
MDM2 has a net charge of ?5e while the p53 fragment
considered here has a net charge of -2e). Elcock et al.
reported protein–protein association rates, calculated from
BD simulations, which closely reproduced the experi-
mentally observed kinetics; as well they suggested the role
of electrostatics and the effect of ionic strength was
underscored [24]. But in BD simulations proteins are
treated as rigid bodies, i.e. conformational changes are not
considered. However, it is clear from our earlier studies [9,
18] and those of others [17] that dynamics of individual
side chains and conformational changes contribute signif-
icantly to the process under investigation. It is also known
that at some stage these electrostatic attractions between
MDM2 and p53 must switch to an interaction dominated
by van der Waals forces, since eventually these are the
forces that leads to a stable complex (see Supporting
information in the references for the components of the
binding free energy [9, 25]). Hence, for our purpose,
analysis of atomistically detailed molecular dynamics is
essential. Further, the exposed binding surface of uncom-
plexed MDM2 is highly hydrophobic in nature, and
demands an explicit treatment of water molecules for
accuracy [26], although recent progress in BD simulation
in implicit solvent mode to study such processes seems
promising [27]. For this reason, we examined in full atomic
detail, the interactions between p53 and MDM2, under the
influence of explicit treatment of waters and now attempt to
extract the underlying noncovalent forces.
In this study, we have considered different sets of
starting conditions each defined by placing the p53 at dif-
ferent distances from the MDM2 surface. For example, the
native structure of the complex was taken and p53 was
translated away from the MDM2 surface along the joining
vector of the centre of masses of the MDM2 and p53 (using
‘coor trans’ command in CHARMM [28]). The magnitude
of the translation characterizes the distance of separation
between MDM2 and p53 in the starting structures (e.g. of
3 A, 6 A etc.) and has been summarized in Table 1. The
crystal structure of the MDM2–p53 complex has the
MDM2 in an ‘open’ conformation; to examine the other
conformations of MDM2 (e.g. ‘closed’ and ‘apo’ states),
the MDM2 structures with these different conformations
were superimposed onto the crystallographic structure.
These were then subject to MD simulations in explicit
water. During the simulations we observed that MDM2 and
p53 approached each other resulting in close encounters
together with mutual modulations. The details of the
structural changes along the trajectory have been reported
elsewhere [18]. From these trajectories, representative
snapshots were extracted and the role of electrostatics on
complex formation has been analyzed.
622 Theor Chem Acc (2010) 125:621–635
123

2 Methods
The crystal structure of the MDM2–p53 complex, con-
sisting of residues 25–109 of MDM2 and 17–29 of p53 was
the starting conformation of the ‘open’ state (RCSB entry
1YCR, resolved at 2.6 A) [29]; the ‘closed’ state of MDM2
(residues 25–109) was obtained from our previous work [9]
and the ‘apo’ state was obtained from the NMR ensemble
(RCSB entry 1Z1M) [19]. The NMR structures have
additional residues, both in the N-terminus (residues 1–24)
and in the C-terminus (residues 110–119), which are absent
in the crystal structure (resolved only residues 25–109).
The starting structures of simulations were prepared by
varying the distance of separation between MDM2 and p53
as described in previous section. The N-terminal region of
MDM2, also referred to as its ‘lid’, consists of residues
1–24 (this region has three anionic residues). It is known to
interact with the p53-binding cleft of MDM2 [30]. To study
the interaction of p53 with the MDM2 binding pocket, we
did not include the lid region in the simulations, while for
the interactions between the lid and the MDM2 binding
pocket we excluded p53 in those simulations. There is no
evidence of the C-terminal region interacting with the p53-
binding region and hence we exclude this region for any
analysis. The protonation states of the titrable groups were
set to mimic neutral pH, i.e., lysine and arginine side chains
were kept at a charge of ?1e each, while glutamic and
aspartic acid side chains were maintained at a charge of
-1e each. Molecular dynamics (MD) simulations in
explicit water (TIP3P) [31] (using periodic boundary
Fig. 1 Three different
conformations of MDM2,
classified according to the shape
of the binding pocket (see text).
a ‘Open’ conformation that
binds the wild type p53 having
the unstructured C-terminus.
b ‘Closed’ conformation that
gives a ‘cozier’ fit to an a-
helical ligand. c The unliganded
(apo) state of MDM2 where the
binding pocked is relatively less
accessible to the solvent. The
NMR determined ‘apo’ state
provides the structure of the
N-terminal flexible lid structure
that covers the binding pocket in
absence of a ligand. The
location of the Y100 has been
pointed for each structure whose
orientation primarily determines
the shape of the binding pocket.
d Superimposed structures a–cshowing the difference of
orientation of Y100: ‘open’
(salmon red), ‘closed’ (yellow)
and ‘apo (purple)
Theor Chem Acc (2010) 125:621–635 623
123

conditions) were carried out using the CHARMM22 force
field [32] and the trajectories have been summarized in
Table 1. The PME algorithm [33] was used to calculate the
long ranged interactions while the short ranged interactions
were truncated at 12 A. SHAKE [34] was applied to freeze
the vibrations of the bonds involving hydrogen atoms,
enabling a 2 fs integration time step. The system was
heated to 300 K followed by equilibration at constant
pressure and temperature (NPT conditions). The produc-
tion run was carried out at constant temperature and vol-
ume (NVT conditions). During the post-processing of the
trajectory, representative snapshots were extracted after
removal of explicit water and counter-ions. The compo-
nents of binding/interaction energy of MDM2 and p53
were calculated following the MM/GBSA protocol using
the GBSW model of implicit solvation [35]. Surface
electrostatics were calculated using APBS [36]. For these,
atomic charges were taken from CHARMM [28] and the
conditions employed included a 0.15 M salt concentration
at 300 K. The dielectric for the protein and solvent was set
at 2 and 80, respectively.
The homology models of MDM2 of mouse, dog and bat
were modeled based on the crystal structure of their human
homologue, 1YCR (sequence identities between each of
them are 92, 98 and 95%, respectively), while the homology
model of Zebra fish was modeled based on that of frog
MDM2, taken from the crystal structure 1YCQ (resolved at
2.3 A, [29], sequence identity 64%). Alignment of the p53
peptide sequences was generated by CLUSTALW [37].
Three dimensional structures of the models were con-
structed using MODELLER [38]. All the figures of the
molecular structures were prepared using PYMOL [39]. The
3D plots were generated using Matlab (Mathworks Inc.).
3 Results and discussion
3.1 The MDM2–p53 complex
The crystallographically determined structure of the com-
plex between MDM2 (residue 25–109) and a small frag-
ment of p53 (residue 17–29) summarizes the essential
features of the interaction between the two proteins [7, 25,
29]. As shown in Fig. 1a, the residues F19 to L25 of the
transactivation domain (TA) of p53 form an a-helical
segment, projecting the three hydrophobic side chains
(F19, W23 and L26) on the same face of the helix. These
residues get embedded in the hydrophobic binding pocket
of MDM2. While these three residues primarily determine
the stability of its complex with MDM2 [29, 40], clearly
residues at other positions are also important, an example
being Y100 that can enable non-crystallographically
observed conformations of the peptide to bind with equal
affinity (see Fig. 1b) [9, 17, 20, 41]. There is a region of
MDM2, referred to as the ‘lid’ (residues 1–24), visible only
in the NMR structure due to its highly dynamic nature that
can easily occlude the binding pocket of MDM2 (see
Fig. 1c) [19, 42]. However, this interaction is thought to be
weak and p53 can easily displace it [30].
3.2 Electrostatics of the crystal structure
of p53–MDM2
The 17–29 region of p53 (17ETFSDLWKLLPEN29) has a
net -2e charge, leading to a strong anionic potential
around it (see Fig. 2) particularly at the C-terminus. In
contrast, MDM2 has a net charge of ?5e and this is
reflected in the potential being largely cationic (see Fig. 2).
The electrostatic complementarity clearly shows why
complex formation takes place. Figures 2 and 3 show that
this cationicity originates largely in 5 residues that lie near
the p53 binding site (K51, R65, K70, K94, R97) although
this is tempered to some extent by E25, E52 and E69. p53
on the other hand is largely anionic, due to E17, D21 and
E28 with K24 providing some cationicity. The MDM2 also
has an N-terminal lid region (residue 1–24) that has total
charge of -1e, contributed by D11. It is clear that the
smaller net negative charge on the lid relative to that on the
p53 peptide explains partly why p53 displaces the lid easily
[30]. This also explains how, upon phosphorylation (or
introduction of an additional 2 units of negative charge) on
S17 of the lid, the interaction with MDM2 will be stronger
relative to p53 and the latter will be displaced, thus
Table 1 List of trajectories
Trajectory
name
MDM2
conformation
Translation
of p53 in the
starting
structure (A)
Length of the
trajectory (ns)
1 Mo3A Open 3 10
2 Mo6A Open 6 10
3 Mc3AT1 Closed 3 20
4 Mc3AT2 Closed 3 20
5 Mc6A Closed 6 40
6 M1n4A Apo, model 1 4 20
7 M1n6A Apo, model 1 6 10
8 M2n119 Apo, model 2
(residue 1–119)
NIL 15
9 M4n119 Apo, model 4
(residue 1–119)
NIL 10
The structures were prepared by translating p53 away from the
binding pocket of MDM2. The magnitude of the translations have
also been listed. Please see the Sects. 1 and 2 for details of the
protocols
624 Theor Chem Acc (2010) 125:621–635
123

stabilizing it against degradation—this is an important
stress-related regulatory mechanism [43].
3.3 Open MDM2, p53 at 3 A
When p53 is placed at 3 A from MDM2 in its open state,
i.e. with Y100 pointing away from the p53 binding site (see
Fig. 1d), rapid complexation occurs leading to a confor-
mation of p53 bound to MDM2 that is very close to the
crystallographic complex (RMSD *1.7 A). The overall
electrostatics of MDM2 and p53 (see Fig. 4) are similar to
the one characteristic of the crystallographic state. This
shows a dipolar distribution across the binding region with
the anionic region complementing the cationic end of p53
(the N-terminal end) and the cationic end dominating
region of MDM2 complementing the anionic C-terminal
half of p53 (see Fig. 2a); this distribution is quite robust to
local fluctuations along the trajectory. Although the bind-
ing pocket is, by consensus, largely hydrophobic, it is clear
that approach to this region is controlled by electrostatic
effects that emanate from the cationic residues that sur-
round the binding pocket. Studies have shown that W23 of
p53 fits into the binding pocket of MDM2 and contributes
to the stability in two ways: a large contribution from van
der Waals interactions because of its larger size and W23
also forms an H-bond with the L54 backbone carbonyl
[29]. It is interesting to note that the W23L mutation
improves the electrostatic contribution to stability of the
complex (data available in the supporting information of
Ref. [9]). This partly arises because this mutation removes
the partial positive charge on the side chain nitrogen of
W23. Although this pocket is largely hydrophobic (as
judged from the nature of the residues that line it), how-
ever, the influence of local partial charges on the protons of
backbone nitrogens and the long range effects of the cat-
ionic residues impart the electrostatic potential in this
region with a cationic character (this becomes apparent in
the electrostatic maps when the charges on some of the side
chains are switched off; see Fig. 3).
Within this largely cationic field of MDM2 that seems to
steer p53, there are two regions of local anionicity (see
Fig. 2). These two regions have been shown to be involved
in modulating p53 binding [9, 20, 25, 37, 44]: one is
localized at Y67/D68/E69 (near the binding site of the N-
terminus of the p53 peptide) and the other at E25/Y100
(forms an H-bond with the C-terminus of the p53 peptide).
It has been hypothesized that the former repels p53 when
T18 is phosphorylated [25] thereby modulating its bio-
logical stability.
3.4 Closed MDM2, p53 at 3 A
Next we retain the distance of p53 from MDM2 at 3 A but
use the conformation of MDM2 which has the Y100
pointing in towards the p53 binding region—the closed
conformation. This results in a state where p53 is bound,
but in two somewhat different conformations represented
by trajectory Mc3AT1 and trajectory Mc3AT2 (see Fig. 5).
In Mc3AT1, Y100 remains pointing inwards but L26 is
never embedded completely. In contrast, in Mc3AT2, L26
does embed in, but now Y100 points outward creating
space for L26. The other key residues in p53, F19 and W23
anchor into the right (native) location (see Fig. 5). But the
orientations of Y100 only marginally affect the overall
electrostatic potentials of the MDM2 surface. This occurs
as a result of the reorientation of the hydroxyl group of the
Y100 side chain. This is also observed in the nature of the
isosurface (see Fig. 5), where most of the regions resemble
the native complex (see for example Fig. 2). Indeed, the
variations of the surfaces over the simulations clearly show
Fig. 2 a Surface electrostatics of MDM2 and p53 taken from their
crystal structure (1YCR). The solid lined arrows point the location of
key residues on the MDM2 surface whereas the dashed arrows point
the contact regions of p53 residues on the MDM2 surface in the
complexed state. The ‘charge’ complementarity of the contact regions
are notable. b shows the isosurface of the same molecules. The color
scale of electrostatics of the MDM2 surface is red (-5 kT/e) to blue
(?5 kT/e). The contour level of the isosurface was set to ±1 kT/e.
The same coloring scheme has been followed throughout the
manuscript, in Figs. 3, 4, 5, 6, 7, 8, 9 and 13
Theor Chem Acc (2010) 125:621–635 625
123
that the overall distribution is conserved. The structural
variations of p53 (stabilized at *3–5 A relative to its
‘‘native’’ conformation) really arise from differences at its
termini. It appears that while the overall diffusion of
MDM2 and p53 is similar in either case, upon binding, the
fine tuning is modulated by the orientation of Y100.
3.5 Open/closed MDM2, p53 at 6 A
We next place p53 at a somewhat larger distance of *6 A
with MDM2 in the ‘closed’ state. Within 2 ns (trajectory
Mc6A), F19 and W23 of p53 get anchored in the binding
pocket of MDM2 (see Movies in Ref. [18]). The initial
steering that enables this encounter complex to form
originates in the electrostatics of native-like MDM2 which
funnels the peptide into the binding pocket. However, the
‘‘closed’’ state of MDM2 precludes the native conforma-
tion of the complex and results in the p53 peptide lying at
an angle that is at *15–20� from the direction of the native
complex (Fig. 6), with an RMSD of *8–10 A from the
wild type orientation. The closed conformations of Y100
preclude the L26 from entering, further aided by reorien-
tations of M50 and L54 which further occlude the binding
pocket. This results in F19 inserting into a hydrophobic
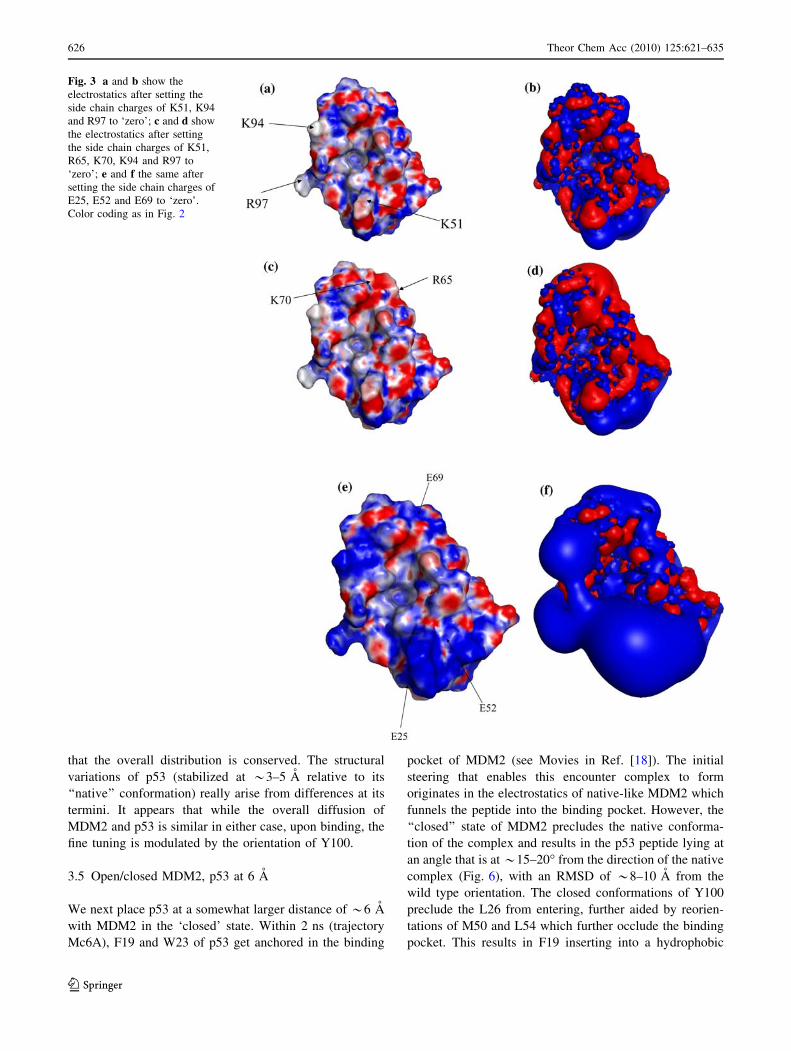
Fig. 3 a and b show the
electrostatics after setting the
side chain charges of K51, K94
and R97 to ‘zero’; c and d show
the electrostatics after setting
the side chain charges of K51,
R65, K70, K94 and R97 to
‘zero’; e and f the same after
setting the side chain charges of
E25, E52 and E69 to ‘zero’.
Color coding as in Fig. 2
626 Theor Chem Acc (2010) 125:621–635
123

pocket formed by L54, L57 and Y100 while W23 stabilizes
against F55. This occurs by 12 ns and the peptide remains
stable in this orientation (see Fig. 6 also see Movies in the
supporting information of Ref. [18]). The major changes in
the electrostatic fields are really only seen at the N-terminal
end where local conformational changes bring R65 and
E69 into salt bridging distance (*4A). While the overall
electrostatic landscape of MDM2 is conserved, the alter-
nate orientation of p53 results in reduced electrostatics and
van der Waals interactions (see Table 2).
When the starting conformation of MDM2 is ‘‘open’’
with the p53 initially located 6 A away, the MDM2
immediately (within *1 ns) reverts to the ‘‘closed’’ state.
3.6 Apo state without lid, p53 at 4 A
We next take a structure from the ensemble of NMR
structures and place p53 at *4 A. In this state, the side-
chain of Y100 is buried inwards (see Figs. 1 and 7). At the
end of 20 ns, the F19 and W23 residues of p53 embed into
the binding pocket of MDM2 but residue L26 remains
exposed on the surface (see Fig. 7). It was clear from our
previous work [18] that Y100 remains stubbornly embed-
ded in the binding site and occludes the binding pocket of
L26. Comparison with the electrostatics of MDM2 after
successful complexation (see Figs. 4, 5) shows that while
there is reorganization of the electrostatic surface, the
overall polarity is conserved. K51, K94 and R97 together
provide the electrostatic force for (also see movie in sup-
porting information) the C-terminal anionic end of p53 but
the fact that L26 cannot embed leads to a different
orientation of the C-terminal end of p53 relative to that
seen in Fig. 1a.
3.7 Apo MDM2: role of the N-terminal lid region
The lid of MDM2 has been hypothesized to behave like a
pseudo-substrate for the p53 binding pocket of MDM2
[42]; how the lid actually regulates the binding of p53
through phosphorylation is still unresolved [30]. We
examine two distinct conformations of the lid that we take
from the ensemble of NMR structures, one conformation
consists of the lid in close contact with the binding surface
and the second conformation consists of the lid pointing
away from the surface. These two conformations represent
the ‘closed’ and ‘open’ states of the lid and are model
numbers 2 and 4, respectively of the NMR ensemble [19].
Fig. 4 Snapshot taken at the end of 10 ns MD of Mo3A (Table 1)
trajectory that reproduces the native structure of the complex. Color
coding as in Fig. 2
Fig. 5 a and b Electrostatic picture of the snapshot taken at the end
of the trajectory of Mc3AT1 and c and d at the end of Mc3AT2
trajectory. e Superimposed snapshots show that the correlation
between Y100 orientation and anchoring of L26 into binding pocket.
Green-MDM2 and red-p53 correspond to Mc3AT1, Cyan-MDM2 and
orange-p53 correspond to Mc3AT2. Color coding as in Fig. 2
Theor Chem Acc (2010) 125:621–635 627
123

Comparison of the electrostatic surfaces of the two states
shows that although there is some difference in the overall
distribution of the potentials, the polarity is conserved (see
Figs. 1, 8). Indeed the closed and open states of MDM2
with lid are characterized by ‘in’ and ‘out’ conformations
of Y100, respectively, which controls the access to the
binding site—a localized event as we have seen in our
earlier studies [18].
3.8 Binding of MDMX
MDMX also binds p53 through a domain that is highly
homologous to the N-terminal domain of MDM2 [45].
Crystallographically determined structures show high
similarity of binding mode with p53 to MDM2 (PDB code
3DAB) [46]. However, in contrast to the net charge of ?5e
in MDM2, MDMX has only a net charge of ?1e (MDM2
has an excess of 3 Lysines and 1 Arginine). As expected,
p53 shows lower affinity for binding to MDMX than it does
with MDM2 [47]. However, the overall distributions of the
electrostatic potentials are similar between MDM2 and
MDMX (see Fig. 9). Like in MDM2, the negatively
charged side chains, E17 and E28 of p53 occupy regions of
MDMX that have cationic character.
3.9 Energetics
Computational studies have shown that the MDM2–p53
complex is driven by van der Waals forces [9, 20, 25, 48].
In the native complex, the gain in electrostatic energy
cannot compensate for the loss of solvation energy and thus
destabilizes binding by *10 kcal/mol (see Table 2).
However, this is offset significantly by the stabilizing van
der Waals energy (*69 kcal/mol). In the various trajec-
tories, we find a strong correlation between the ability to
dock into the native-like state and the underlying energetics
(see Table 2). It is clear from all the simulations that
charge–charge interactions stabilize the complexes but are
offset by the penalty paid for burying the charges (sum of
electrostatic (Eelec) and polar component of solvation
Fig. 6 Electrostatic picture of
the snapshot taken at the end of
Mc6A trajectory. a Molecular
surface electrostatics with
showing the bound p53 and
b isosurface, p53 has not been
shown. Color coding as in
Fig. 2
Table 2 Change of components of molecular mechanical energy upon binding (Dbinding)
Dbinding Native Mo3A Mc3AT1 Mc3AT2 Mo6A Mc6A M1n4A
Eelectrostatic -202.3 -353.0 -309.6 -277.1 -172.6 -182.0 -121.0
EvanderWaals -68.9 -59.7 -65.2 -55.2 -57.9 -44.7 -39.5
Einternal 7.6 7.3 4.3 13.9 8.5 9.6 11.0
EGB 212.5 352.4 319.1 278.2 187.8 184.2 139.4
Eelec?GB 10.2 -0.6 9.5 1.1 15.2 2.2 18.4
Esolv(nonpolar) -3.4 -3.4 -3.5 -3.3 -2.5 -2.2 -0.5
Etotal -54.5 -56.4 -54.9 -43.5 -36.7 -35.1 -10.6
For each trajectory only the change of the values with respect to the values of the uncomplexed states have been shown. The energy values are in
kcal/mol. Data for ‘Native’ was available from our earlier work [9]
628 Theor Chem Acc (2010) 125:621–635
123

(EGB)). The net stabilization that drives complex formation
in all cases originates in packing/van der Waals inter-
actions. The high electrostatic interaction energies (Mo3A,
Mc3AT1, Mc3AT2) are indicative of the orientation of p53
with respect to MDM2 resulting in favorable polar inter-
actions. The somewhat lower (compared to native) van der
Waals energy in Mo3A indicates poorer packing, but has
the highest electrostatic stabilization and smaller desolva-
tion penalty. Mc3AT1 is quite native-like, except for
optimal packing of L26; the similarity of total energies
suggests that the conformation with L26 pointing out may
well be accessible amongst the space explored by the
native complex (see Table 3).
We decided to carry out a simple investigation. For both
MDM2 and MDMX, the p53 peptide was moved away
from the surface of MDM2/MDMX and the complex and
the energetics examined along the pathway (Figs. 10, 11).
To do this, for each complex, the native structure was
optimized using 1000 steps of adopted basis Newton–
Raphson (ABNR) minimizer and then the ligand (p53) was
translated along the vector that connects the centres of
masses of MDM2/MDMX and p53, away from the MDM2/
MDMX surface at *2 A steps, until a separation of
*50 A. Each step of translation was followed by 300 steps
of ABNR minimization and the snapshot was saved. The
energy of binding/interactions between MDM2/MDMX
and p53 was evaluated at each point (see Fig. 10) following
the MM/GBSA protocol, applying the GBSW solvation
model. It is clear that the electrostatics dominates in
steering the two partners together; however, at close range,
there is a switch and the penalty for bringing the charged
residues into close proximity and excluded from solvent
results in a large penalty making the net electrostatic
contribution unfavorable. In parallel, the van der Waals
switches to overwhelming stabilization. The quantitative
profiles will no doubt depend upon the number of steps of
minimization carried out. To examine this, we repeated this
experiment, but with an initial 2000 ABNR step minimi-
zation followed by 600 steps of ABNR minimization after
each step of translation. It is clear that the overall trend is
Fig. 7 a and b are different representations of a snapshot taken
before the MD in the M1n4A trajectory; c and d are different
representations of a snapshot taken at the end of this trajectory. The
trajectory was generated from an unliganded, NMR-derived confor-
mation of MDM2 with the p53 placed near the binding site
Fig. 8 Apo structures of MDM2 having the lid in a, b, e and f open
and c, d, g and h closed situation. a–d are the electrostatics of the
structures before MD simulation and e–h are the for the structure
obtained at the end of MD simulation (trajectory M2n119 and
M4n119 in Table 1)
Theor Chem Acc (2010) 125:621–635 629
123

similar (dashed lines in Fig. 10a) although at larger sepa-
ration there are some changes in the profiles and the overall
curve is smoother. However, at closer separations the
profiles are very similar. Again it is the overall trends that
are important for our current study rather than the absolute
quantities. We see this pattern for both MDM2 and MDMX
and this pattern presumably will be characteristic of such
interactions in general. Overall, the plots of interaction
energies along the trajectories show that the van der Waals
interactions are comparable for all the situations we have
examined, varying between -50 and -70 kcal/mol. This is
because although the location of p53 varies with respect to
the native complex, nevertheless the peptide stays very
close to the surface and makes packing interactions.
However, the exact location of p53 relative to the surface
will clearly lead to largely varying electrostatic energies,
which is what we see in our calculations. Differing starting
conformations lead to different binding modes, some of
which are native-like and some not. In order to further
extend this exploration, after each step of translation, the
p53 peptide was rotated in the plane (orthogonal to the
direction of translation) followed by 300 steps of minimi-
zation and computation of binding/interaction energy. The
corresponding energetics (Fig. 11) show very nicely how
the pattern of Fig. 10 is repeated and how indeed it is at
closer range that most of the binding is driven by van der
Waals interactions. Further, it is clear that at large sepa-
ration, the peptide is driven by electrostatic attractions,
with orientation not playing a significant role. However, as
the peptide approaches MDM2, around 15 A, the ener-
getically optimal orientation of p53 is close to the bound
state and a ‘‘funnel’’ appears that drives binding which is
increasingly driven by van der Waals attractions. This
switch in the nature of interactions is somehow reminiscent
of a phase transition. We know that this reaction is exo-
thermic [41] and this is a thermodynamic signature of a
first order phase transition. Moreover, the dynamics show
clearly that complexation does proceed with some nucle-
ation—in this case some residues anchor each other across
the interface between Mdm2 and p53 initially, following
which the peptide is subsequently embedded completely. In
order to examine the entropic components associated with
these changes, we took six snapshots along the binding
trajectory and computed the vibrational entropy of the
complexes [49]. Although this is a simple approximation,
nevertheless the results of this are in line with the struc-
tural–energetic changes outlined so far. The decrease in
entropy (see Fig. 12) as p53 and MDM2 approach each
other (to within 5 A) can be understood by the fact that as
the two separated molecules approach each other and
influence each other, low frequency global modes with a
higher entropic contribution appear. However, at close
range, specific interactions start forming and hence getting
more directed (due to the formation of electrostatic inter-
actions and packing between p53 and MDM2) and hence
motions start getting frozen. This reduces the low fre-
quency modes of vibration, resulting in the observed
decreases in entropy. A clear change in the density of states
is not apparent as the origin of the entropic change is
distributed across many different modes of vibration.
Fig. 9 Surface electrostatics and isosurface potentials of MDMX
extracted from the crystal structure (PDB code 3DAB) bound to p53.
For each representation the complexed state has been shown for easier
identification of the binding pocket of the surface
Table 3 Description of the movie files
Movie file name Description
Supplementary
material 1
Modulation of the binding pocket of MDM2 to
bind different ligands. MDM2 structures have
been extracted from the PDBs (see the
‘Introduction’ in the main text) and then have
been joined them as a movie. MDM2 is
presented with molecular surface. The
structures of the ligands have been shown
Supplementary
material 2
The variation of the ‘isosurface’ of MDM2 along
the trajectory ‘Mc3AT1’
Supplementary
material 3
The variation of the ‘isosurface’ of MDM2 along
the trajectory ‘Mc3AT2’
Supplementary
material 4
The variation of the ‘isosurface’ of MDM2 along
the trajectory ‘Mc6A’
Supplementary
material 5
The variation of the ‘isosurface’ of MDM2 along
the trajectory ‘M1n4A’
Supplementary
material 6
The variation of the ‘isosurface’ of MDM2 along
the trajectory ‘Mo6A’
630 Theor Chem Acc (2010) 125:621–635
123

Despite the entropic reduction, complexation occurs due to
enthalpic stabilization. A more detailed study of this pro-
cess using dynamical models is currently under progress.
The distribution of key cationic residues (such as K51,
R65, K70, K94, R97) must have evolutionary significance.
MDMX lacks a positive charge at the equivalent position of
R97 in MDM2 which is localized near the C-terminal end of
the p53 peptide and this is partly responsible for the reduced
affinity (manuscript in preparation). But overall the con-
servation of the electrostatic potential and the conservation
of features seen in our simulations suggest a functional
significance. The cationicity is conserved across species
(see Fig. 13) and indeed we see this not only amongst the
higher organisms (92–98% identity) but also with some
variation, in other species too (60–70% identity); there are
of course associated changes in p53 (see Fig. 14). In
general, it appears that electrostatic steering brings the
peptide to the surface after which packing interactions
dominate. This can be followed by rapid sequestration of
F19 and W23 but there is a larger variance in the orientation
of L26 which in turn is correlated with that of Y100. While
the peptide can ‘‘drift’’ over the surface of MDM2, the
overall electrostatic field does act to constrain the peptide in
a ‘‘funnel’’ and restrains it from drifting away (see movie
Fig. 10 Plot of different components of energies of interactions
between MDM2/MDMX and p53, as a function of distance of
separation between backbone ‘O’ atom of L54 of MDM2 (M53 for
MDMX) and side chain ‘N’ atom of W23 of p53. a and b are for
MDM2–p53 complex and c and d are for MDMX–p53 complex. The
‘Ddistance’ along the horizontal axis is the change of distance
(defined above) with respect to the distances in their native
complexes. The p53 was translated away (in *2 A step size) from
the binding pocket of MDM2/MDMX starting from the native
structure of the complex. At each point energy minimization was
followed by calculations of the components of energy, using the
GBSW implicit solvent model. Eelec?GB is the sum of electrostatic
component and GBSW solvation energy; Evdw is the van der Waals
component and Eelec is the electrostatic component. ‘DEnergy’ along
the vertical axis represents the change of energy components upon
complex formation, where the energy minimized uncomplexed
MDM2/MDMX and p53 (extracted from the native structures of the
complex) were considered as reference. The absolute values of
DEnergy components are dependent on the choice of the reference
state and the extent of energy minimization, which is also reflected in
the non vanishing van der Waals interactions at the larger distances.
The dashed lines in a indicates a repetition of the calculation with
different number of steps of minimization (see text)
Theor Chem Acc (2010) 125:621–635 631
123

Fig. 11 Plot of different components of energies of interactions
between MDM2/MDMX and p53 which has been explained in
Fig. 10. In this plot at each distance of separation ‘Ddistance’ (in A)
p53 has been rotated with respect to the axis connecting the centre of
masses of MDM2/MDMX and p53, with an increment of 30� (plotted
along the axis ‘Dangle’ (in degree) and minimized energy was
calculated at each step of rotation. The vertical axis shows the change
of energy (in kcal/mol) upon complex formation (same as is Fig. 10)
632 Theor Chem Acc (2010) 125:621–635
123

M6_Mo6A.mpg). This is in accord with mechanisms
proposed to underlie protein–protein interactions and
protein–ligand interactions [10, 11, 50].
Our studies and the evolution of the two sequences
suggest that electrostatics plays a significant role. How-
ever, this is in contrast to some reports that have found no
evidence of salt dependence on the interactions of p53 with
MDM2, thus suggesting a lack of significant electrostatic
effects [41]. The issue is further complicated by reports in
the same study that shortening the p53 peptide, including
removal of one negative charge (E28), leads to a 2.5-fold
increase in kon. In all the trajectories reported here we find
that the electrostatic interactions fall rapidly when complex
formation occurs (mostly when near-native complexation
occurs). The isosurface of the MDM2 conformations shows
that the complementarity is maintained when p53 approa-
ches the open state of MDM2. This map is perturbed if p53
is displaced into a non-native orientation. This builds upon
our earlier demonstrations [9, 18] as well as our current
findings, that the approach to, and eventual complex for-
mation, are both highly dynamic processes and are char-
acterized by extensive modulation of each others properties
Fig. 12 Plot of variation entropy (DS) of complex formation as a
function of distance of separation of between MDM2 and p53
(Ddistance, as defined in Figs. 10, 11), calculated from normal mode
analysis. The absolute values of entropy of the MDM2–p53 system at
each point have been subtracted from the entropy of the wild type
complex. The DS has been multiplied with temperature (T = 300 K).
The rotational (Srot) and translational (Strans) component of entropy
remains almost unchanged (so two lines are superimposed) whereas
the change in vibrational component determine the change in total
entropy (Stotal)
Fig. 13 Isosurface potentials of
MDM2 of different species
Theor Chem Acc (2010) 125:621–635 633
123
[9, 20]. Hence, it appears as no surprise that changes to the
length of the peptides and/or mutations can indeed signi-
ficantly influence the rates of approach of the two partners
to each other.
4 Conclusions
Recent studies have shown that plasticity of MDM2 has a
large influence in the ligand binding and the conforma-
tional changes at the MDM2-peptide interface and origi-
nates in the mutual modulation of ligand and receptor [9,
20]. This is also reflected in the diverse thermodynamic
origins of complex stability [9]. In our previous work we
have demonstrated that the plasticity of MDM2 and the
binding of ligand is largely influenced by a few residues
(primarily by Y100 [18]). It has been demonstrated that
when p53 approaches the binding pocket of MDM2, the
orientation of Y100 determines binding and thus it acts as a
putative gate-keeper [18]. The orientation of Y100 is rel-
evant when receptor and ligand are close enough to be
influenced by the steric collision of side chains, but it may
not influence the ‘‘approach’’ of p53 at larger separations.
Our present study investigates the factors that influence the
approach of p53 and this study reveals that long range
electrostatics steer p53 and MDM2 towards each other
leading to complex formation. We find how the affinity is
modulated by strong electrostatic attractions that dominate
the energy landscape at long range, while at close range the
attraction undergoes a switch to being dominated by van
der Waals interactions. Once the two proteins interact, the
electrostatic interactions are strongly destabilized as
the charges are occluded from solvent (desolvated). The
packing interactions then drive eventual complex forma-
tion. At large distances, there is an entropic drive that steers
the two molecules together while at short distances, as
specific interactions form, they freeze out degrees of
freedom, leading to entropic destabilization; the final
complexation is driven enthalpically. Non-native confor-
mations of MDM2 exert somewhat altered electrostatics
that in turn correlate with mispacking of p53 on the MDM2
surface. However, the surface electrostatics are strong
enough to restrain the mispacked p53 from drifting away
and the residues which have been observed (from simula-
tion) to have a role in such interactions, have also been
found to be evolutionarily conserved. We are currently
analyzing the role of such evolutionarily conserved resi-
dues in the ‘approach and binding’ of p53 and will be
presented in a separate manuscript elsewhere.
Acknowledgments This work was supported by the Biomedical
Research Council (Agency for Science, Technology and Research),
Singapore. We thank Ivy Law of BII for technical help with Matlab.
References
1. Naski N et al (2009) Cell Cycle 8:31
2. Vogelstein B, Lane D, Levine AJ (2000) Nature 408:307
3. Bottger A et al (1997) Curr Biol 7:860
4. Moll UM, Petrenko O (2003) Mol Cancer Res 1:1001
5. Sakurai K, Schubert C, Kahne D (2006) J Am Chem Soc
128:11000
6. Vassilev LT et al (2004) Science 303:844
7. Zhong H, Carlson HA (2005) Proteins 58:222
8. Buolamwini JK, Addo J, Kamath S, Patil S, Mason D, Ores M
(2005) Curr Cancer Drug Targets 5:57
9. Dastidar SG, Lane DP, Verma CS (2008) J Am Chem Soc
130:3514
10. McCammon JA (2009) Proc Natl Acad Sci USA 106:683
11. Blundell TL, Fernandez-Recio J (2006) Nature 444:279
12. Tang C, Iwahara J, Clore GM (2006) Nature 444:383
13. Sept D, Elcock AH, McCammon JA (1999) J Mol Biol 294:1181
14. Richter S, Wenzell A, Stein M, Gabdoulline RR, Wade RC
(2008) Nucleic Acid Res 36:W276
15. Heath AP, Kavraki LE, Clementi C (2007) Proteins 68:646
16. Knotts TA, Rathore N, Schwartz DC, de Pablo JJ (2007) J Chem
Phys 126:084901
17. Macchiarulo A, Giacche N, Carotti A, Baroni M, Cruciani G,
Pellicciari R (2008) J Chem Inf Model 48:1999
18. Dastidar SG, Lane DP, Verma CS, BMC Bioinformatics
(in press)
19. Uhrinova S, Uhrin D, Powers H, Watt K, Zheleva D, Fischer P,
McInnes C, Barlow PN (2005) J Mol Biol 350:587
20. Madhumalar A, Lee HJ, Brown CJ, Lane DP, Verma C (2009)
Cell Cycle 8:2828
21. Feldman-Salit A, Wirtz M, Hell R, Wade RC (2009) J Mol Biol
386:37
22. Gabdoulline RR, Wade RC (1998) Methods 14:329
23. Gabdoulline RR, Wade RC (2001) J Mol Biol 306:1139
24. Elcock AH, Gabdoulline RR, Wade RC, McCammon JA (1999)
J Mol Biol 291:149
25. Lee HJ, Srinivasan D, Coomber D, Lane DP, Verma CS (2007)
Cell Cycle 6:2604
26. Setny P, Geller M (2006) J Chem Phys 125:144717
27. Gabdoulline RR, Wade RC (2009) J Am Chem Soc 131:9230
28. Brooks BR et al (2009) J Comp Chem 30:1545
29. Kussie PH, Gorina S, Marechal V, Elenbaas B, Moreau J, Levine
AJ, Pavletich NP (1996) Science 274:948
30. Worrall EG, Wawrzynow B, Worrall L, Walkinshaw M, Ball KL,
Hupp TR (2009) J Chem Biol 2:113
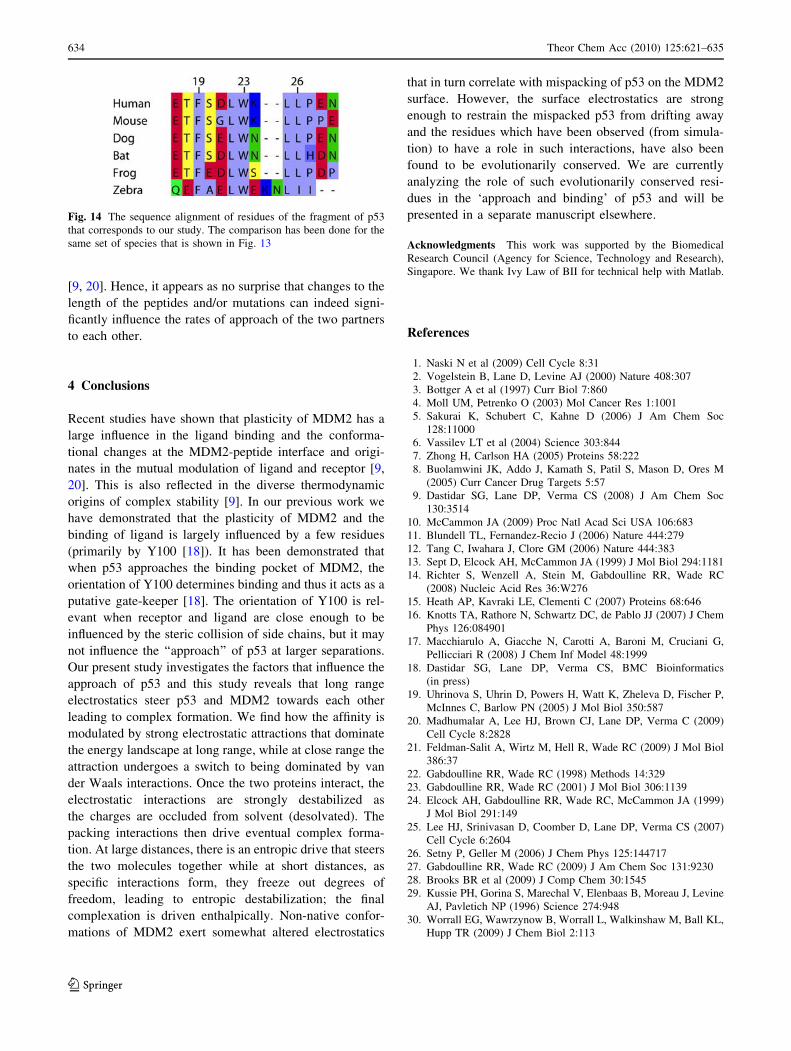
Fig. 14 The sequence alignment of residues of the fragment of p53
that corresponds to our study. The comparison has been done for the
same set of species that is shown in Fig. 13
634 Theor Chem Acc (2010) 125:621–635
123

31. Jorgensen WL, Chandrasekhar J, Madura JD, Impey RW, Klein
ML (1983) J Chem Phys 79:926
32. MacKerell AD Jr et al (1998) J Phys Chem B 102:3586
33. Darden T, York D, Pedersen L (1993) J Chem Phys 98:10089
34. Ryckaert JP, Ciccotti G, Berendsen HTC (1977) J Comp Phys
23:327
35. Im W, Lee MS, Brooks CL 3rd (2003) J Comp Chem 24:1691
36. Baker NA, Sept D, Joseph S, Holst MJ, McCammon JA (2001)
Proc Natl Acad Sci USA 98:10037
37. Thompson JD, Higgins DG, Gibson TJ (1994) Nucleic Acid Res
22:4673
38. Sali A, Blundell TL (1993) J Mol Biol 234:779
39. DeLano WL (2002) The Pymol molecular graphics system.
DeLano Scientific, San Carlos
40. Bottger A, Bottger V, Garcia-Echeverria C, Chene P, Hochkeppel
HK, Sampson W, Ang K, Howard SF, Picksley SM, Lane DP
(1997) J Mol Biol 269:744
41. Schon O, Friedler A, Bycroft M, Freund SM, Fersht AR (2002)
J Mol Biol 323:491
42. Showalter SA, Bruschweiler-Li L, Johnson E, Zhang F,
Bruschweiler R (2008) J Am Chem Soc 130:6472
43. Shimizu H, Hupp TR (2003) Trends Biochem Sci 28:346
44. Freedman DA, Epstein CB, Roth JC, Levine AJ (1997) Mol Med
3:248
45. Czarna A, Popowicz GM, Pecak A, Wolf S, Dubin G, Holak TA
(2009) Cell Cycle 8:1176
46. Popowicz GM, Czarna A, Holak TA (2008) Cell Cycle 7:2441
47. Hu B, Gilkes DM, Chen J (2007) Cancer Res 67:8810
48. Massova I, Kollman PA (1999) J Am Chem Soc 121:8133
49. Van Vlijmen HWT, Karplus M (1999) J Phys Chem B 10:3009
50. Jones S, Thornton JM (1996) Proc Natl Acad Sci USA 93:13
Theor Chem Acc (2010) 125:621–635 635
123