Food resources and vegetation structure mediate climatic effects on species richness of birds
24
RESEARCH PAPER Food resources and vegetation structure mediate climatic effects on species richness of birds Stefan W. Ferger 1,2 *, Matthias Schleuning 1,2 , Andreas Hemp 3 , Kim M. Howell 4 and Katrin Böhning-Gaese 1,2,5 1 Biodiversity and Climate Research Centre (BiK-F), Senckenberganlage 25, Frankfurt am Main 60325, Germany, 2 Senckenberg Gesellschaft für Naturforschung, Senckenberganlage 25, Frankfurt am Main 60325, Germany, 3 Department of Plant Systematics, University of Bayreuth, Universitätsstrasse 30, Bayreuth 95440, Germany, 4 Department of Zoology and Wildlife Conservation, University of Dar es Salaam, PO Box 35064, Dar es Salaam, Tanzania, 5 Institute for Ecology, Evolution and Diversity, Goethe University, Biologicum, Max-von-Laue-Strasse 13, Frankfurt am Main 60439, Germany ABSTRACT Aim Climate is widely recognized as a major predictor of species richness patterns along large-scale environmental gradients. Nevertheless, the mechanisms by which climate influences species richness are still a matter of debate. We disentangle whether climate influences species richness of birds directly via physiological limi- tations or indirectly via vegetation structure or the availability of food resources. Location Mount Kilimanjaro, Tanzania. Methods We recorded bird species richness along an elevational gradient from 870 to 4550 m a.s.l. We quantified local climatic conditions, vegetation structure and the availability of food resources, and applied path analysis to disentangle their direct and indirect effects on species richness of all birds, frugivores and insectivores. Results Overall, we recorded 2945 individuals from 114 bird species. Species richness of all birds was closely correlated with temperature, vegetation structure and invertebrate biomass and both direct and indirect (via vegetation structure and availability of food resources) climatic effects were important for the diversity of the whole, trophically heterogeneous bird community. The species richness of insectivorous birds was linked to vegetation structure and invertebrate biomass, while the richness of frugivores was strongly associated with fruit abundance. Climatic factors influenced bird species richness of both avian feeding guilds exclu- sively indirectly via vegetation structure and availability of food resources. Main conclusions We reveal the importance of trophic interactions for gener- ating species richness patterns along large-scale environmental gradients. Our results challenge the general assumption that temperature and water availability influence species richness mostly directly, and underscore the importance of veg- etation structure and the availability of food resources as principal mediators of climatic effects on species richness patterns on macroecological scales. Keywords Ambient energy hypothesis, elevational gradient, energy–richness hypothesis, habitat heterogeneity hypothesis, path analysis, physiological tolerance hypo- thesis, productivity hypothesis, resource availability hypothesis, species–energy hypothesis, vegetation structure hypothesis. *Correspondence: Stefan W. Ferger, Biodiversity and Climate Research Centre (BiK-F), Senckenberganlage 25, Frankfurt am Main 60325, Germany. E-mail: [email protected] INTRODUCTION Changes in species richness along large-scale environmental gradients, such as latitude and elevation, are among the longest known and most intensively studied patterns in ecology and biogeography (Gaston, 2000). Although a wealth of hypotheses have been formulated to explain species richness gradients, it is widely recognized that current climatic conditions, especially Global Ecology and Biogeography, (Global Ecol. Biogeogr.) (2014) 23, 541–549 © 2014 John Wiley & Sons Ltd DOI: 10.1111/geb.12151 http://wileyonlinelibrary.com/journal/geb 541
-
Upload
independent -
Category
Documents
-
view
2 -
download
0
Transcript of Food resources and vegetation structure mediate climatic effects on species richness of birds
RESEARCHPAPER
Food resources and vegetation structuremediate climatic effects on speciesrichness of birdsStefan W. Ferger1,2*, Matthias Schleuning1,2, Andreas Hemp3, Kim M. Howell4
and Katrin Böhning-Gaese1,2,5
1Biodiversity and Climate Research Centre
(BiK-F), Senckenberganlage 25, Frankfurt am
Main 60325, Germany, 2Senckenberg
Gesellschaft für Naturforschung,
Senckenberganlage 25, Frankfurt am Main
60325, Germany, 3Department of Plant
Systematics, University of Bayreuth,
Universitätsstrasse 30, Bayreuth 95440,
Germany, 4Department of Zoology and
Wildlife Conservation, University of Dar es
Salaam, PO Box 35064, Dar es Salaam,
Tanzania, 5Institute for Ecology, Evolution and
Diversity, Goethe University, Biologicum,
Max-von-Laue-Strasse 13, Frankfurt am Main
60439, Germany
ABSTRACT
Aim Climate is widely recognized as a major predictor of species richness patternsalong large-scale environmental gradients. Nevertheless, the mechanisms by whichclimate influences species richness are still a matter of debate. We disentanglewhether climate influences species richness of birds directly via physiological limi-tations or indirectly via vegetation structure or the availability of food resources.
Location Mount Kilimanjaro, Tanzania.
Methods We recorded bird species richness along an elevational gradient from870 to 4550 m a.s.l. We quantified local climatic conditions, vegetation structureand the availability of food resources, and applied path analysis to disentangletheir direct and indirect effects on species richness of all birds, frugivores andinsectivores.
Results Overall, we recorded 2945 individuals from 114 bird species. Speciesrichness of all birds was closely correlated with temperature, vegetation structureand invertebrate biomass and both direct and indirect (via vegetation structure andavailability of food resources) climatic effects were important for the diversity ofthe whole, trophically heterogeneous bird community. The species richness ofinsectivorous birds was linked to vegetation structure and invertebrate biomass,while the richness of frugivores was strongly associated with fruit abundance.Climatic factors influenced bird species richness of both avian feeding guilds exclu-sively indirectly via vegetation structure and availability of food resources.
Main conclusions We reveal the importance of trophic interactions for gener-ating species richness patterns along large-scale environmental gradients. Ourresults challenge the general assumption that temperature and water availabilityinfluence species richness mostly directly, and underscore the importance of veg-etation structure and the availability of food resources as principal mediators ofclimatic effects on species richness patterns on macroecological scales.
KeywordsAmbient energy hypothesis, elevational gradient, energy–richness hypothesis,habitat heterogeneity hypothesis, path analysis, physiological tolerance hypo-thesis, productivity hypothesis, resource availability hypothesis, species–energyhypothesis, vegetation structure hypothesis.
*Correspondence: Stefan W. Ferger, Biodiversityand Climate Research Centre (BiK-F),Senckenberganlage 25, Frankfurt am Main60325, Germany.E-mail: [email protected]
INTRODUCTION
Changes in species richness along large-scale environmental
gradients, such as latitude and elevation, are among the longest
known and most intensively studied patterns in ecology and
biogeography (Gaston, 2000). Although a wealth of hypotheses
have been formulated to explain species richness gradients, it is
widely recognized that current climatic conditions, especially
bs_bs_banner
Global Ecology and Biogeography, (Global Ecol. Biogeogr.) (2014) 23, 541–549
© 2014 John Wiley & Sons Ltd DOI: 10.1111/geb.12151http://wileyonlinelibrary.com/journal/geb 541

energy and water availability, are strongly correlated with species
richness (Hawkins et al., 2003; Currie et al., 2004; Turner, 2004).
Nevertheless, the mechanisms by which climate influences
species richness are still a matter of debate (Currie et al., 2004;
Evans et al., 2005; Clarke & Gaston, 2006). The ‘physiological
tolerance hypothesis’ proposes a direct effect of climate on
species richness via physiological constraints (Currie et al.,
2004; Buckley et al., 2012). It predicts higher species richness
under warmer and wetter conditions than under colder and
drier conditions, because more species can tolerate more favour-
able environmental conditions. The ‘vegetation structure
hypothesis’ proposes an indirect effect of climate on species rich-
ness via the structural complexity of habitats (Hurlbert, 2004;
Tews et al., 2004). It predicts higher species richness in more
complex habitats that offer more diverse ways to exploit
resources (instead of more resources per se) and can therefore
sustain more specialists. The ‘resource availability hypothesis’
proposes an indirect effect of climate on species richness via
trophic relationships, mediated by the effect of climate on plant
productivity and the subsequent availability of food resources
(Davies et al., 2007; Jetz et al., 2009). It assumes that the species
richness of a specific trophic level is limited by the amount of
energy provided by the next lower trophic level and thus pre-
dicts higher species richness in areas with higher food resource
availability.
All three hypotheses are supported by empirical studies
(Hurlbert, 2004; Kissling et al., 2007; Menéndez et al., 2007;
Mulwa et al., 2013), suggesting that climate–richness relation-
ships cannot be explained by a single hypothesis but that several
direct and indirect effects act in concert (Clarke & Gaston,
2006). Path analysis allows us to test for such direct and indirect
effects simultaneously and has successfully been applied to study
the effects of climate and vegetation structure on species rich-
ness at large-scale environmental gradients (Kissling et al., 2008;
Zhang et al., 2013). However, due to the difficulties in quantify-
ing the availability of food resources over large spatial scales, its
effect has so far only been tested indirectly by using species
richness of food plants as a proxy (Kissling et al., 2007, 2008;
Menéndez et al., 2007).
Tropical mountains provide the opportunity to test all three
hypotheses (physiological tolerance, vegetation structure and
availability of food resources) simultaneously because they con-
stitute large-scale environmental gradients over relatively small
spatial distances and thus allow a field-based quantification of
food resources. Birds are an excellent model system for testing
the three hypotheses as they occur in nearly all the climatic
zones and habitat types of tropical mountains (McCain, 2009).
Because birds occupy a wide range of trophic positions (Kissling
et al., 2012), they offer the opportunity to also test the three
hypotheses with functional subsets of the bird community. For
example, testing the effect of fruit abundance on frugivorous
bird richness yields an additional, more specific way of testing
the ‘resource availability hypothesis’. A recent meta-analysis
found that a combination of temperature and water availability
well explains the elevational patterns in bird species richness
(McCain, 2009). There is also growing evidence that the distri-
bution of vegetation structure along a mountain contributes to
the elevational pattern in bird species richness (Acharya et al.,
2011; Dainese & Poldini, 2012; Jankowski et al., 2013). By con-
trast, there is little and only indirect evidence for an influence of
the availability of food resources on the elevational distribution
of bird species richness (Loiselle & Blake, 1991; Carrascal et al.,
2012).
Here, we used path analysis to simultaneously disentangle the
direct and indirect effects of climate, vegetation structure and
availability of food resources on macroecological bird species
richness patterns. Along a 3700-m elevational gradient on
Mount Kilimanjaro, Tanzania, we tested the following three
predictions.
1. If physiological limitations influence patterns of bird species
richness we expect a positive direct relationship between climatic
factors and bird species richness when accounting for the effects
of vegetation structure and food resources (‘physiological toler-
ance hypothesis’).
2. If vegetation structure influences patterns of bird species
richness we expect a positive direct relationship between vegeta-
tion structure and bird species richness when accounting for
effects of climatic factors and food resources (‘vegetation struc-
ture hypothesis’).
3. If food resource availability influences patterns of bird
species richness we expect a positive direct relationship between
food resources and bird species richness when accounting for
effects of climatic factors and vegetation structure (‘resource
availability hypothesis’).
To analyse the role of guild-specific food resources, we tested
how the availability of different food types (insects, flowers,
fruits) influences the species richness patterns of the entire bird
community and of two feeding guilds (insectivores and
frugivores).
METHODS
Study area
We conducted this study on Mount Kilimanjaro (2°45′–3°25′ S,
37°0′–37°43′ E), Tanzania, the highest free-standing mountain
on earth, which rises from 700 m a.s.l. at the mountain base to
5891 m a.s.l. at Uhuru Peak (Fernandes et al., 2009). Rainfall is
seasonally distributed with long rains from March to May and
short rains around November. While temperature decreases lin-
early with elevation, mean annual precipitation peaks around
2200 m a.s.l and decreases towards lower and higher elevations
(Hemp, 2006; Appendix S1 in Supporting Information).
Plot selection was based on the study plots of the DFG-
Research Unit ‘KiLi – Kilimanjaro ecosystems under global
change: linking biodiversity, biotic interactions and biogeo-
chemical ecosystem processes’. The 60 0.25-ha study plots of the
KiLi project cover six near-natural and six disturbed habitat
types. Each habitat type is covered by five replicate plots, which
are distributed over five transects on the southern slope of
Mount Kilimanjaro. The minimum distance between transects
is 12.2 km on the foothills and 4.6 km in the alpine zone, and the
S. W. Ferger et al.
Global Ecology and Biogeography, 23, 541–549, © 2014 John Wiley & Sons Ltd542
minimum distance between plots is 300 m. We conducted this
study on the 30 KiLi plots that are located within the six near-
natural habitat types, covering an elevational gradient of about
3700 m, a temperature gradient of about 21K°C and a precipi-
tation gradient of about 2100 mm year–1 (Appendices S1 & S2).
Thus, our research plots cover a large-scale environmental gra-
dient ranging from warm tropical lowland to cold Afro-alpine
temperature regimes and from semi-arid to perhumid condi-
tions. Habitat types were savanna (870–1150 m a.s.l.), lower
montane forest (1560–2020 m a.s.l.), Ocotea forest (2120–
2750 m a.s.l.), Podocarpus forest (2720–2970 m a.s.l.), Erica
forest (3500–3880 m a.s.l.) and Helichrysum scrub (3880–
4550 m a.s.l.). All plots were sampled twice between March 2011
and October 2012, once during the warm dry season (December
to March) and once during the cold dry season (July to
October).
Birds
We used audiovisual point counts on eight subplots per plot to
record birds. We established circles with a 20-m radius in
densely vegetated habitats (savanna and all forest habitats) and
35.5 m × 35.5 m squares at Helichrysum plots, covering the same
sampling area in all habitat types. All birds heard or seen in one
subplot were counted for 10 min and identified to species level
(Zimmerman et al., 1999). Point counts started 15 min before
sunrise and were completed before 09:00. All 480 point counts
(30 plots × 8 subplots × 2 seasons) were conducted by the same
observer (S.W.F.) to reduce inter-observer variability (Campbell
& Francis, 2011). We calculated bird species richness as the
cumulative sum of species across all eight subplots per plot, but
excluded birds that were recorded at higher than maximum
canopy height within the respective subplots. We used a data-
base of the diet of all sub-Saharan breeding bird species com-
piled from a detailed literature survey (Kissling et al., 2007) to
classify bird species into feeding guilds according to their major
food items (Appendix S3).
Climatic factors, vegetation structure andfood resources
Mean annual temperature and mean annual precipitation were
interpolated for every plot using a 15-year dataset from a
network of about 70 temperature loggers and rain gauges on
Mount Kilimanjaro (Hemp, 2006). To test the effects of vegeta-
tion structure, we quantified vertical vegetation heterogeneity,
canopy height and canopy closure on every subplot in both
seasons. To obtain vertical vegetation heterogeneity, we first esti-
mated the vegetation cover in layers at 0, 1, 2, 4, 8, 16, 32 and
64 m above ground and then calculated the Shannon–Wiener
diversity index across these eight strata (Bibby et al., 2000).
Canopy height was measured with a laser rangefinder as
maximum canopy height above ground. Canopy closure was
measured as the mean percentage of closed cells from four
spherical canopy densitometer readings taken at the centre of
each subplot in the four cardinal directions. We used the average
vegetation heterogeneity, the average canopy closure and the
maximum canopy height across the eight subplots per plot and
season for analyses. We recorded food resources by estimating
the number of ripe fleshy fruits and open flowers for every
individual fruiting/flowering plant within all subplots on a loga-
rithmic scale, considering woody plant species only, and
summed them per plot and season for analyses. We did not
consider fruits and flowers of herbaceous plants due to their low
abundance and because they are mostly pollinated and dis-
persed by invertebrates (Cain et al., 1998). In addition, we used
100 sweeps with a 30-cm diameter sweep net along two parallel,
permanently marked 50-m transects on the KiLi plots to sample
invertebrate biomass per plot in both seasons. All inver-
tebrates ≥ 1 mm were lumped to one sample per plot and
season, which was immediately weighed to obtain fresh biomass.
Statistical analyses
We conducted all analyses for species richness of all birds and
separately for species richness of frugivorous and insectivorous
birds. To reduce the influence of outliers and to improve nor-
mality of residuals, we log-transformed the richness measures
and food resources, square root-transformed canopy height and
logit-transformed canopy closure. Prior to analyses, all variables
were standardized (mean = 0, SD = 0.5) to obtain standardized
parameter estimates.
To examine how bird species richness was distributed along
the elevational gradient, we compared the fit of linear mixed
effect models (LMMs) with a linear (monotonous increase/
decrease with elevation), a quadratic (accelerating increase/
decrease) and a linear plus a quadratic (unimodal or
accelerating increase/decrease) term of elevation. In all models,
we included plot as a random factor to control for the two
repeated measures at each plot.
We used path analysis to investigate which factors influence
the observed elevational bird species richness pattern. We based
the a priori structure of the path model (Fig. 2a) on the hypoth-
eses that climate influences vegetation structure, that both
jointly influence food resources for birds and that all three
factors are associated with bird species richness. To avoid
collinearity and to increase the sample/parameter ratio of the
path models, we pre-selected predictor variables within groups
(climatic factors, vegetation structure, food resources). Pre-
selection was based on our ecological understanding of the
study system and the strength of the relationship between pre-
dictor variables and overall bird species richness, as estimated by
marginal R2 values (Nakagawa & Schielzeth, 2013) from simple
LMMs with plot as random factor (Appendix S4). We pre-
selected temperature and precipitation as climatic variables
because both were significantly positively related to overall bird
species richness. We did not consider season because only 5% of
the observed bird species were migrants (Appendix S3) and
species richness did not differ between seasons (Appendix S4).
We chose vertical vegetation heterogeneity as a measure of veg-
etation structure as it explained more variance in bird species
richness than canopy closure and canopy height and because the
Climate and bird species richness
Global Ecology and Biogeography, 23, 541–549, © 2014 John Wiley & Sons Ltd 543
three variables were highly collinear. We pre-selected the
number of fruits and the biomass of invertebrates as measures of
food resources and modelled them with correlated errors in the
path model as we assumed the same causal ancestors for both
variables (Fig. 2a). We did not consider the number of flowers
due to its low explanatory power (Appendix S4) and the lack of
strictly nectarivorous bird species in our dataset (Appendix S3).
Within the set of pre-selected predictor variables all variance
inflation factors (VIFs) were below the critical value of 10
(Appendix S4), indicating that collinearity was not a problem
(Dormann et al., 2013).
Based on the a priori structure of the path model (Fig. 2a), we
tested all possible combinations of paths leading to a specific
endogenous variable with LMMs. We fitted LMMs with
maximum likelihood and included plot as a random factor. We
ranked LMMs by the Akaike information criterion with a cor-
rection for small sample size (AICc). We then recalculated the
best-fit LMM (i.e. the one with the lowest AICc value) for each
endogenous variable with restricted maximum likelihood and
checked for multivariate normality using histograms of the
residuals and for spatial autocorrelation by calculating Moran’s
I-values using a permutation approach with 1000 permutations.
We combined the best-fit LMMs according to the a priori struc-
ture of the path model. Paths that were omitted by best-fit
LMMs were not included in the resulting path model. We tested
the overall fit of the path model with Shipley’s generalized d-sep
test for path models with correlated errors (Shipley, 2003, 2009).
If there was no single best-fit LMM (i.e. at least one alternative
LMM with ΔAICc < 2), we used competing LMMs to construct
alternative path models according to the procedure described
above and compared them with the best-fit path model with an
AICc approach for whole path models (Shipley, 2013). All sta-
tistical analysis were performed with R 2.15.2 (R Core Team,
2012). We used the lme4 package to calculate LMMs (Bates
et al., 2012), the MuMIn package to select best-fit LMMs
(Barton, 2012), the car package to calculate VIFs (Fox &
Weisberg, 2011) and the spdep package to calculate Moran’s
I-values (Bivand, 2013).
RESULTS
We recorded 2945 individuals from 114 bird species across all
plots and seasons. Among these were 510 individuals from 19
frugivorous species and 1178 individuals from 55 insectivorous
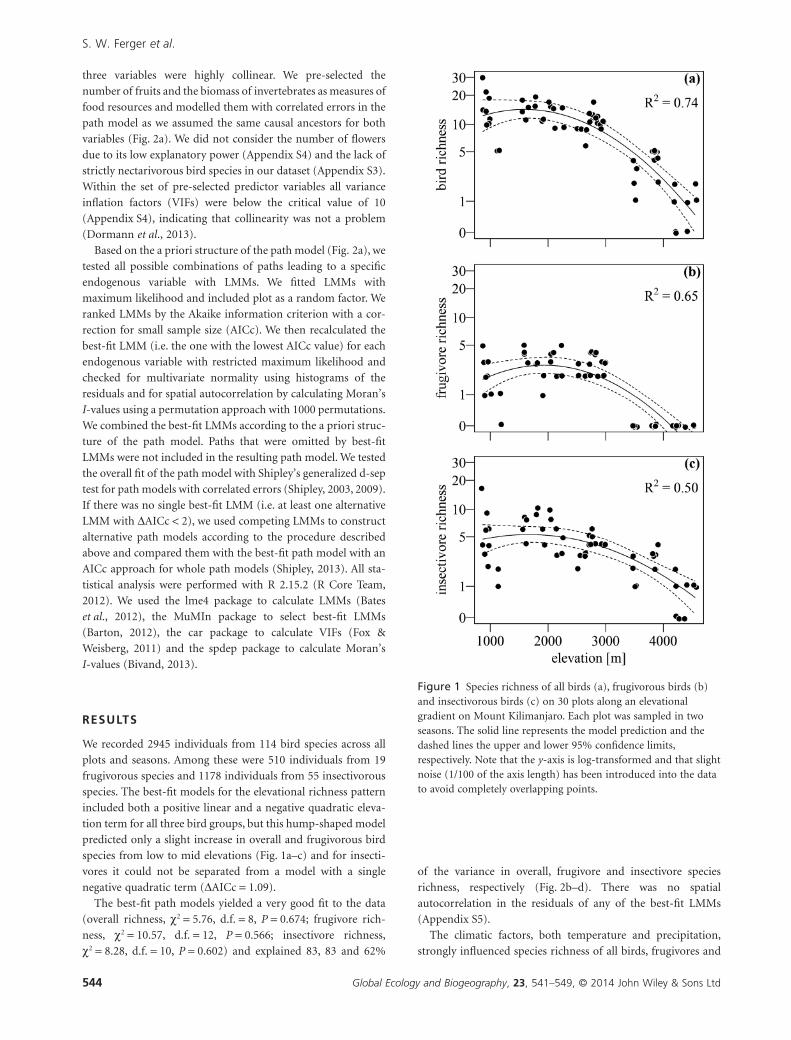
species. The best-fit models for the elevational richness pattern
included both a positive linear and a negative quadratic eleva-
tion term for all three bird groups, but this hump-shaped model
predicted only a slight increase in overall and frugivorous bird
species from low to mid elevations (Fig. 1a–c) and for insecti-
vores it could not be separated from a model with a single
negative quadratic term (ΔAICc = 1.09).
The best-fit path models yielded a very good fit to the data
(overall richness, χ2 = 5.76, d.f. = 8, P = 0.674; frugivore rich-
ness, χ2 = 10.57, d.f. = 12, P = 0.566; insectivore richness,
χ2 = 8.28, d.f. = 10, P = 0.602) and explained 83, 83 and 62%
of the variance in overall, frugivore and insectivore species
richness, respectively (Fig. 2b–d). There was no spatial
autocorrelation in the residuals of any of the best-fit LMMs
(Appendix S5).
The climatic factors, both temperature and precipitation,
strongly influenced species richness of all birds, frugivores and
Figure 1 Species richness of all birds (a), frugivorous birds (b)and insectivorous birds (c) on 30 plots along an elevationalgradient on Mount Kilimanjaro. Each plot was sampled in twoseasons. The solid line represents the model prediction and thedashed lines the upper and lower 95% confidence limits,respectively. Note that the y-axis is log-transformed and that slightnoise (1/100 of the axis length) has been introduced into the datato avoid completely overlapping points.
S. W. Ferger et al.
Global Ecology and Biogeography, 23, 541–549, © 2014 John Wiley & Sons Ltd544

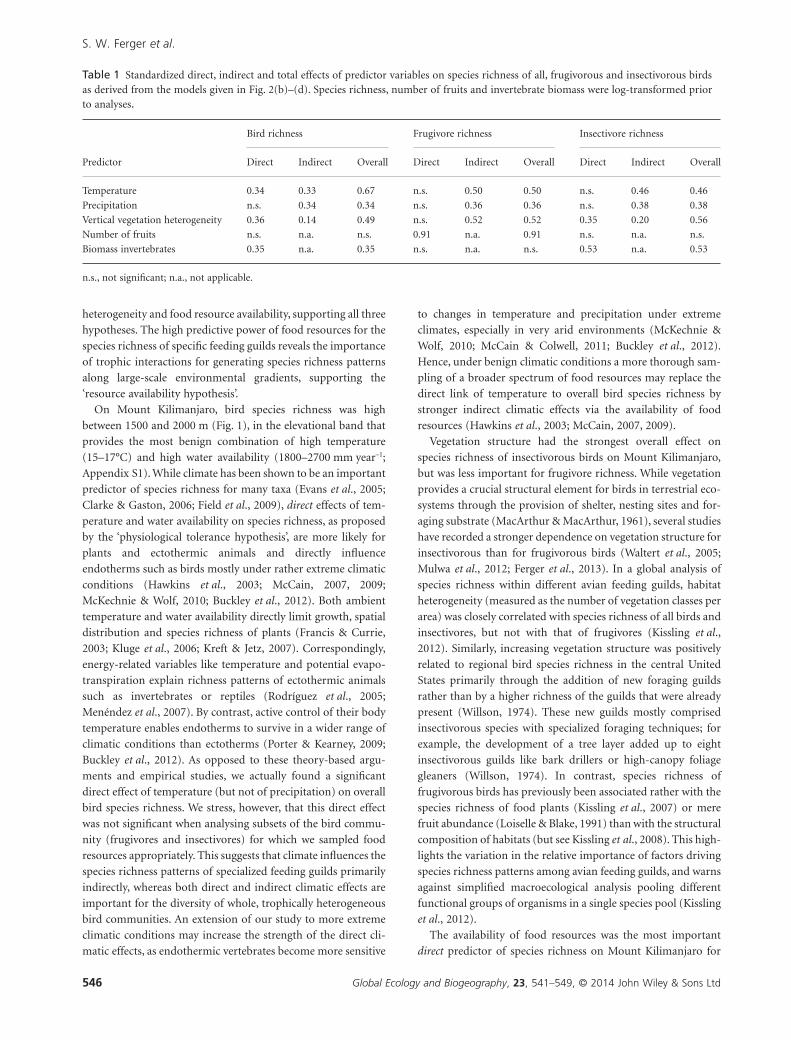
insectivores, and temperature had the strongest overall effect on
species richness of all birds (Table 1). However, both climate
variables acted predominantly indirectly through vegetation
heterogeneity, fruit abundance and invertebrate biomass, except
for a significant direct effect of temperature on overall species
richness (Fig. 2b). Vertical vegetation heterogeneity influenced
species richness of all birds and insectivores directly and indi-
rectly through invertebrate biomass, and richness of frugivores
only indirectly through fruit abundance (Table 1, Fig. 2b–d).
The availability of food resources influenced richness in a guild-
specific way. While invertebrate biomass was correlated with
richness of all birds and insectivores, fruit abundance had a
strong, direct effect on frugivore richness (Fig. 2b–d).
We identified one alternative path model for overall bird
species richness, five alternative models for frugivorous bird
species richness and three alternative models for insectivorous
bird species richness (Appendix S6). None of the additional
paths in the alternative path models was significant and all alter-
native models that affected bird species richness as a response
variable had a significantly worse fit to the data (Appendix S6)
than the best-fit models presented in Fig. 2. Path models that
included only the climatic variables, i.e. annual mean tempera-
ture and precipitation, as sole predictors for overall, frugivore
and insectivore species richness, explained considerably less
variance (68, 60 and 49%, respectively) and had a significantly
worse fit to the data (ΔAICc > 15 in all cases) than the respective
best-fit path models in Fig. 2.
DISCUSSION
The present analysis is the first simultaneous test of the ‘physio-
logical tolerance hypothesis’, the ‘vegetation structure hypoth-
esis’ and the ‘resource availability hypothesis’ in a coherent
analytical framework. By using path analysis, we show that
climate influences overall bird species richness on the one
hand directly and on the other hand indirectly via vegetation
Figure 2 A priori hypothesized causal structure (a) of the relationships among climatic factors (temperature and precipitation), vegetationheterogeneity, food resources (fruits and invertebrates, both log-transformed) and bird species richness (log-transformed); and the best-fitpath models (based on the Akaike information criterion with a correction for small sample sizes, AICc) for all birds (b), frugivorous birds(c) and insectivorous birds (d). The standardized path coefficients, their statistical significance (+P < 0.1, *P < 0.05, **P < 0.01, ***P < 0.001)and the marginal coefficients of determination (R2) are given. Paths that did not contribute to the best-fit models have been deleted in (b),(c) and (d). For clarity, error terms and the correlation of errors of fruits and invertebrates are not shown. Note that alternative models,which include the single, but non-significant, link from precipitation to fruit abundance in (b), (c) and (d), all have a ΔAICc < 2(Appendix S6) and can therefore not be distinguished statistically from the models presented here, but that all alternative models that affectbird species richness as response variable have a significantly worse fit to the data (ΔAICc > 2; Appendix S6).
Climate and bird species richness
Global Ecology and Biogeography, 23, 541–549, © 2014 John Wiley & Sons Ltd 545
heterogeneity and food resource availability, supporting all three
hypotheses. The high predictive power of food resources for the
species richness of specific feeding guilds reveals the importance
of trophic interactions for generating species richness patterns
along large-scale environmental gradients, supporting the
‘resource availability hypothesis’.
On Mount Kilimanjaro, bird species richness was high
between 1500 and 2000 m (Fig. 1), in the elevational band that
provides the most benign combination of high temperature
(15–17°C) and high water availability (1800–2700 mm year–1;
Appendix S1). While climate has been shown to be an important
predictor of species richness for many taxa (Evans et al., 2005;
Clarke & Gaston, 2006; Field et al., 2009), direct effects of tem-
perature and water availability on species richness, as proposed
by the ‘physiological tolerance hypothesis’, are more likely for
plants and ectothermic animals and directly influence
endotherms such as birds mostly under rather extreme climatic
conditions (Hawkins et al., 2003; McCain, 2007, 2009;
McKechnie & Wolf, 2010; Buckley et al., 2012). Both ambient
temperature and water availability directly limit growth, spatial
distribution and species richness of plants (Francis & Currie,
2003; Kluge et al., 2006; Kreft & Jetz, 2007). Correspondingly,
energy-related variables like temperature and potential evapo-
transpiration explain richness patterns of ectothermic animals
such as invertebrates or reptiles (Rodríguez et al., 2005;
Menéndez et al., 2007). By contrast, active control of their body
temperature enables endotherms to survive in a wider range of
climatic conditions than ectotherms (Porter & Kearney, 2009;
Buckley et al., 2012). As opposed to these theory-based argu-
ments and empirical studies, we actually found a significant
direct effect of temperature (but not of precipitation) on overall
bird species richness. We stress, however, that this direct effect
was not significant when analysing subsets of the bird commu-
nity (frugivores and insectivores) for which we sampled food
resources appropriately. This suggests that climate influences the
species richness patterns of specialized feeding guilds primarily
indirectly, whereas both direct and indirect climatic effects are
important for the diversity of whole, trophically heterogeneous
bird communities. An extension of our study to more extreme
climatic conditions may increase the strength of the direct cli-
matic effects, as endothermic vertebrates become more sensitive
to changes in temperature and precipitation under extreme
climates, especially in very arid environments (McKechnie &
Wolf, 2010; McCain & Colwell, 2011; Buckley et al., 2012).
Hence, under benign climatic conditions a more thorough sam-
pling of a broader spectrum of food resources may replace the
direct link of temperature to overall bird species richness by
stronger indirect climatic effects via the availability of food
resources (Hawkins et al., 2003; McCain, 2007, 2009).
Vegetation structure had the strongest overall effect on
species richness of insectivorous birds on Mount Kilimanjaro,
but was less important for frugivore richness. While vegetation
provides a crucial structural element for birds in terrestrial eco-
systems through the provision of shelter, nesting sites and for-
aging substrate (MacArthur & MacArthur, 1961), several studies
have recorded a stronger dependence on vegetation structure for
insectivorous than for frugivorous birds (Waltert et al., 2005;
Mulwa et al., 2012; Ferger et al., 2013). In a global analysis of
species richness within different avian feeding guilds, habitat
heterogeneity (measured as the number of vegetation classes per
area) was closely correlated with species richness of all birds and
insectivores, but not with that of frugivores (Kissling et al.,
2012). Similarly, increasing vegetation structure was positively
related to regional bird species richness in the central United
States primarily through the addition of new foraging guilds
rather than by a higher richness of the guilds that were already
present (Willson, 1974). These new guilds mostly comprised
insectivorous species with specialized foraging techniques; for
example, the development of a tree layer added up to eight
insectivorous guilds like bark drillers or high-canopy foliage
gleaners (Willson, 1974). In contrast, species richness of
frugivorous birds has previously been associated rather with the
species richness of food plants (Kissling et al., 2007) or mere
fruit abundance (Loiselle & Blake, 1991) than with the structural
composition of habitats (but see Kissling et al., 2008). This high-
lights the variation in the relative importance of factors driving
species richness patterns among avian feeding guilds, and warns
against simplified macroecological analysis pooling different
functional groups of organisms in a single species pool (Kissling
et al., 2012).
The availability of food resources was the most important
direct predictor of species richness on Mount Kilimanjaro for
Table 1 Standardized direct, indirect and total effects of predictor variables on species richness of all, frugivorous and insectivorous birdsas derived from the models given in Fig. 2(b)–(d). Species richness, number of fruits and invertebrate biomass were log-transformed priorto analyses.
Predictor
Bird richness Frugivore richness Insectivore richness
Direct Indirect Overall Direct Indirect Overall Direct Indirect Overall
Temperature 0.34 0.33 0.67 n.s. 0.50 0.50 n.s. 0.46 0.46
Precipitation n.s. 0.34 0.34 n.s. 0.36 0.36 n.s. 0.38 0.38
Vertical vegetation heterogeneity 0.36 0.14 0.49 n.s. 0.52 0.52 0.35 0.20 0.56
Number of fruits n.s. n.a. n.s. 0.91 n.a. 0.91 n.s. n.a. n.s.
Biomass invertebrates 0.35 n.a. 0.35 n.s. n.a. n.s. 0.53 n.a. 0.53
n.s., not significant; n.a., not applicable.
S. W. Ferger et al.
Global Ecology and Biogeography, 23, 541–549, © 2014 John Wiley & Sons Ltd546

both feeding guilds, insectivores and frugivores. The importance
of the availability of food resources for bird species richness has
been demonstrated in local studies, which have shown that
species richness of avian feeding guilds responds positively to
seasonal increases in their food resources (Loiselle & Blake,
1991; Mulwa et al., 2013). However, it is difficult to test the
‘resource availability hypothesis‘ on large spatial scales due to
the difficulty in quantifying food resources. Our sampling of
food resources also had some caveats, for example sweep netting
samples invertebrates only up to a height of about 2 m above
ground and the accuracy of estimates of fruit and flower abun-
dance decreases with the number of vegetation strata and the
height of the canopy. However, the large environmental gradient
that we covered made our analyses quite robust to habitat-
specific sampling biases, which is supported by the strong effects
that fruit abundance and invertebrate biomass exhibited on
their respective consumer communities. Many large-scale
studies have used plant species richness as a proxy for the avail-
ability of food resources (Kissling et al., 2007, 2008; Menéndez
et al., 2007) assuming that higher plant richness is linked to
higher food biomass (the ‘resource availability hypothesis’) or to
a higher diversity of resources (the ‘resource specialization
hypothesis’; Abrams, 1995). However, high plant species rich-
ness has been shown to be positively related not only to species
richness of avian primary consumers (e.g. frugivores), but also
to bird species richness across multiple trophic levels (Jetz et al.,
2009). This suggests that positive relationships between plant
and bird species richness are influenced more generally by a
higher availability of food resources and vegetation structure
than by species-specific resource–consumer relationships
(Kissling et al., 2008; Jetz et al., 2009). We tested whether plant
species richness would have been a sufficient proxy for resource
availability in our study system and recalculated the path
models, incorporating the species richness of woody plants
instead of vertical vegetation structure (Appendix S7). Across all
three analysed bird groups, food resources were more important
than woody plant species richness as direct predictors of bird
species richness, showing that woody plant richness was insuf-
ficient to explain bird species richness in our study system. Our
study thus demonstrates that the availability of food resources is
the most important direct predictor of species richness of avian
feeding guilds along a large-scale environmental gradient on
Mount Kilimanjaro.
CONCLUSIONS
Our results confirm the general importance of temperature and
water availability for bird species richness patterns. However,
while both direct and indirect climatic effects were important
for the diversity of the whole, trophically heterogeneous, bird
community, climatic factors influenced bird species richness of
specific avian feeding guilds exclusively indirectly. This contra-
dicts the ‘physiological tolerance hypothesis’, at least for those
feeding guilds. Our analyses show that climate is closely corre-
lated with vegetation structure and the availability of food
resources, and that joint direct effects of vegetation structure and
guild-specific food resources influence patterns of bird species
richness within feeding guilds. This result supports the ‘vegeta-
tion structure hypothesis’ and the ‘resource availability hypoth-
esis’ and points against explanations of species richness patterns
that neglect trophic interactions. While we are aware that path
analyses are correlational analyses, this finding is a step towards
a more mechanistic understanding of the processes that gener-
ate species richness patterns along large-scale environmental
gradients.
ACKNOWLEDGEMENTS
Ramsony Mmary, Raymond Zaria, Furaha Mbilinyi, Leons
Mlawila, Nelson Massam and Maria Helbig-Bonitz provided
help with the field work. We thank Imran Khaliq for insightful
discussions on vertebrate physiology and Cornelia Weist for the
creation of the map of the study area. W. Alice Boyle, Susanne A.
Fritz, Allen H. Hurlbert, Christy M. McCain and an anonymous
referee provided very helpful comments on earlier versions of
this manuscript. COSTECH, TAWIRI, TANAPA and the
Immigration Office of Moshi permitted S.W.F. to conduct field
work in Tanzania and inside Kilimanjaro National Park. This
work was funded by the Deutsche Forschungsgemeinschaft
(FOR 1246; Bo 1221/16-1) and by LOEWE – Landes-Offensive
zur Entwicklung Wissenschaftlich-ökonomischer Exzellenz of
Hesse’s Ministry of Higher Education, Research, and the Arts.
REFERENCES
Abrams, P.A. (1995) Monotonic or unimodal diversity-
productivity gradients: what does competition theory predict?
Ecology, 76, 2019–2027.
Acharya, B.K., Sanders, N.J., Vijayan, L. & Chettri, B. (2011)
Elevational gradients in bird diversity in the eastern Himalaya:
an evaluation of distribution patterns and their underlying
mechanisms. PLoS ONE, 6, e29097.
Barton, K. (2012) MuMIn: multi-model inference. R package
version 1.8.0.
Bates, D., Maechler, M. & Bolker, B. (2012) lme4: linear mixed-
effects models using S4 classes. R package version 0.999999-0.
Bibby, C.J., Burgess, N.D., Hill, D.A. & Mustoe, S. (2000) Bird
census techniques, 2nd edn Academic Press, London.
Bivand, R. (2013) spdep: spatial dependence: weighting
schemes, statistics and models. R package version 0.5-56.
Buckley, L.B., Hurlbert, A.H. & Jetz, W. (2012) Broad-scale eco-
logical implications of ectothermy and endothermy in
changing environments. Global Ecology and Biogeography, 21,
873–885.
Cain, M., Damman, H. & Muir, A. (1998) Seed dispersal and the
Holocene migration of woodland herbs. Ecological Mono-
graphs, 68, 325–347.
Campbell, M. & Francis, C.M. (2011) Using stereo-microphones
to evaluate observer variation in North American breeding
bird survey point counts. The Auk, 128, 303–312.
Carrascal, L.M., Villén-Pérez, S. & Seoane, J. (2012) Thermal,
food and vegetation effects on winter bird species richness of
Mediterranean oakwoods. Ecological Research, 27, 293–302.
Climate and bird species richness
Global Ecology and Biogeography, 23, 541–549, © 2014 John Wiley & Sons Ltd 547

Clarke, A. & Gaston, K.J. (2006) Climate, energy and diversity.
Proceedings of the Royal Society B: Biological Sciences, 273,
2257–2266.
Currie, D.J., Mittelbach, G.G., Cornell, H.V., Field, R., Guegan,
J.-F., Hawkins, B.A., Kaufman, D.M., Kerr, J.T., Oberdorff, T.,
O’Brien, E. & Turner, J.R.G. (2004) Predictions and tests
of climate-based hypotheses of broad-scale variation in
taxonomic richness. Ecology Letters, 7, 1121–1134.
Dainese, M. & Poldini, L. (2012) Plant and animal diver-
sity in a region of the southern Alps: the role of environ-
mental and spatial processes. Landscape Ecology, 27,
417–431.
Davies, R.G., Orme, C.D.L., Storch, D., Olson, V.A., Thomas,
G.H., Ross, S.G., Ding, T.-S., Rasmussen, P.C., Bennett, P.M.,
Owens, I.P.F., Blackburn, T.M. & Gaston, K.J. (2007) Topog-
raphy, energy and the global distribution of bird species rich-
ness. Proceedings of the Royal Society B: Biological Sciences, 274,
1189–1197.
Dormann, C.F., Elith, J., Bacher, S., Buchmann, C., Carl, G.,
Carré, G., Marquéz, J.R.G., Gruber, B., Lafourcade, B., Leitão,
P.J., Münkemüller, T., McClean, C., Osborne, P.E., Reineking,
B., Schröder, B., Skidmore, A.K., Zurell, D. & Lautenbach, S.
(2013) Collinearity: a review of methods to deal with it and a
simulation study evaluating their performance. Ecography, 35,
27–46.
Evans, K.L., Warren, P.H. & Gaston, K.J. (2005) Species–energy
relationships at the macroecological scale: a review of the
mechanisms. Biological Reviews, 80, 1–25.
Ferger, S.W., Böhning-Gaese, K., Wilcke, W., Oelmann, Y. &
Schleuning, M. (2013) Distinct carbon sources indicate strong
differentiation between tropical forest and farmland bird
communities. Oecologia, 171, 473–486.
Fernandes, R., Msemwa, J., Santos, J. & Team KILI2008 (2009)
Precise determination of the orthometric height of Mt. Kili-
manjaro. Surveyors key role in accelerated development, FIG
Working Week 2009, Eilat, Israel.
Field, R., Hawkins, B.A., Cornell, H.V., Currie, D.J., Diniz-Filho,
J.A.F., Guégan, J.-F., Kaufman, D.M., Kerr, J.T., Mittelbach,
G.G., Oberdorff, T., O’Brien, E.M. & Turner, J.R.G. (2009)
Spatial species-richness gradients across scales: a meta-
analysis. Journal of Biogeography, 36, 132–147.
Fox, J. & Weisberg, S. (2011) An R companion to applied regres-
sion, 2nd edn Sage Publications, Thousand Oaks, CA.
Francis, A.P. & Currie, D.J. (2003) A globally consistent
richness–climate relationship for angiosperms. The American
Naturalist, 161, 523–536.
Gaston, K.J. (2000) Global patterns in biodiversity. Nature, 405,
220–227.
Hawkins, B.A., Field, R., Cornell, H.V., Currie, D.J., Guègan, J.-F.,
Kaufman, D.M., Kerr, J.T., Mittelbach, G.G., Oberdorff, T.,
O’Brien, E.M., Porter, E.E. & Turner, J.R.G. (2003) Energy,
water, and broad-scale geographic patterns of species rich-
ness. Ecology, 84, 3105–3117.
Hemp, A. (2006) Continuum or zonation? Altitudinal gradients
in the forest vegetation of Mt. Kilimanjaro. Plant Ecology, 184,
27–42.
Hurlbert, A.H. (2004) Species–energy relationships and
habitat complexity in bird communities. Ecology Letters, 7,
714–720.
Jankowski, J.E., Merkord, C.L., Rios, W.F., Cabrera, K.G., Revilla,
N.S. & Silman, M.R. (2013) The relationship of tropical bird
communities to tree species composition and vegetation
structure along an Andean elevational gradient. Journal of
Biogeography, 40, 950–962.
Jetz, W., Kreft, H., Ceballos, G. & Mutke, J. (2009) Global asso-
ciations between terrestrial producer and vertebrate con-
sumer diversity. Proceedings of the Royal Society B: Biological
Sciences, 276, 269–278.
Kissling, W.D., Rahbek, C. & Böhning-Gaese, K. (2007) Food
plant diversity as broad-scale determinant of avian frugivore
richness. Proceedings of the Royal Society B: Biological Sciences,
274, 799–808.
Kissling, W.D., Field, R. & Böhning-Gaese, K. (2008) Spatial
patterns of woody plant and bird diversity: functional rela-
tionships or environmental effects? Global Ecology and Bioge-
ography, 17, 327–339.
Kissling, W.D., Sekercioglu, C.H. & Jetz, W. (2012) Bird dietary
guild richness across latitudes, environments and biogeo-
graphic regions. Global Ecology and Biogeography, 21, 328–
340.
Kluge, J., Kessler, M. & Dunn, R.R. (2006) What drives
elevational patterns of diversity? A test of geometric con-
straints, climate and species pool effects for pteridophytes on
an elevational gradient in Costa Rica. Global Ecology and Bio-
geography, 15, 358–371.
Kreft, H. & Jetz, W. (2007) Global patterns and determinants of
vascular plant diversity. Proceedings of the National Academy of
Sciences USA, 104, 5925–5930.
Loiselle, B.A. & Blake, J.G. (1991) Temporal variation in birds
and fruits along an elevational gradient in Costa Rica. Ecology,
72, 180–193.
MacArthur, R. & MacArthur, J. (1961) On bird species diversity.
Ecology, 42, 594–598.
McCain, C.M. (2007) Could temperature and water availability
drive elevational species richness patterns? A global case study
for bats. Global Ecology and Biogeography, 16, 1–13.
McCain, C.M. (2009) Global analysis of bird elevational diver-
sity. Global Ecology and Biogeography, 18, 346–360.
McCain, C.M. & Colwell, R.K. (2011) Assessing the threat to
montane biodiversity from discordant shifts in temperature
and precipitation in a changing climate. Ecology Letters, 14,
1236–1245.
McKechnie, A.E. & Wolf, B.O. (2010) Climate change increases
the likelihood of catastrophic avian mortality events during
extreme heat waves. Biology Letters, 6, 253–256.
Menéndez, R., González-Megías, A., Collingham, Y., Fox, R.,
Roy, D.B., Ohlemüller, R. & Thomas, C. (2007) Direct and
indirect effects of climate and habitat factors on butterfly
diversity. Ecology, 88, 605–611.
Mulwa, R.K., Böhning-Gaese, K. & Schleuning, M. (2012) High
bird species diversity in structurally heterogeneous farmland
in western Kenya. Biotropica, 44, 801–809.
S. W. Ferger et al.
Global Ecology and Biogeography, 23, 541–549, © 2014 John Wiley & Sons Ltd548
Mulwa, R.K., Neuschulz, E.L., Böhning-Gaese, K. & Schleuning,
M. (2013) Seasonal fluctuations of resource abundance and
avian feeding guilds across forest–farmland boundaries in
tropical Africa. Oikos, 122, 524–532.
Nakagawa, S. & Schielzeth, H. (2013) A general and simple
method for obtaining R2 from generalized linear mixed-
effects models. Methods in Ecology and Evolution, 4, 133–142.
Porter, W.P. & Kearney, M. (2009) Size, shape, and the thermal
niche of endotherms. Proceedings of the National Academy of
Sciences USA, 106, 19666–19672.
R Core Team (2012) R: a language and environment for statistical
computing. R Foundation for Statistical Computing, Vienna.
Rodríguez, M., Belmontes, J.A. & Hawkins, B.A. (2005) Energy,
water and large-scale patterns of reptile and amphibian
species richness in Europe. Acta Oecologica, 28, 65–70.
Shipley, B. (2003) Testing recursive path models with correlated
errors using d-separation. Structural Equation Modeling, 10,
214–221.
Shipley, B. (2009) Confirmatory path analysis in a generalized
multilevel context. Ecology, 90, 363–368.
Shipley, B. (2013) The AIC model selection method applied to
path analytic models compared using a d-separation tests.
Ecology, 94, 560–564.
Tews, J., Brose, U., Grimm, V., Tielbörger, K., Wichmann, M.C.,
Schwager, M. & Jeltsch, F. (2004) Animal species diversity
driven by habitat heterogeneity/diversity: the importance of
keystone structures. Journal of Biogeography, 31, 79–92.
Turner, J.R.G. (2004) Explaining the global biodiversity gradi-
ent: energy, area, history and natural selection. Basic and
Applied Ecology, 5, 435–448.
Waltert, M., Bobo, K.S., Sainge, N.M., Fermon, H. &
Mühlenberg, M. (2005) From forest to farmland: habitat
effects on Afrotropical forest bird diversity. Ecological Appli-
cations, 15, 1351–1366.
Willson, M. (1974) Avian community organization and habitat
structure. Ecology, 55, 1017–1029.
Zhang, J., Kissling, W.D. & He, F. (2013) Local forest structure,
climate and human disturbance determine regional distribu-
tion of boreal bird species richness in Alberta, Canada. Journal
of Biogeography, 40, 1131–1142.
Zimmerman, D.A., Turner, D.A. & Pearson, D.J. (1999) Birds of
Kenya and northern Tanzania. Christopher Helm, London.
SUPPORTING INFORMATION
Additional supporting information may be found in the online
version of this article at the publisher’s web-site.
Appendix S1 Scatter plots of predictor variables used in the path
models against the elevational gradient.
Appendix S2 Map of the study region.
Appendix S3 List of observed bird species.
Appendix S4 Variable pre-selection and variance inflation
factors.
Appendix S5 Test for spatial autocorrelation.
Appendix S6 Alternative path models and their test statistics.
Appendix S7 Path models with woody plant species richness
instead of vertical vegetation heterogeneity.
BIOSKETCH
Stefan W. Ferger is a PhD student in Katrin
Böhning-Gaese’s lab at the Biodiversity and Climate
Research Centre (BiK-F) in Frankfurt, Germany. He is
interested in the effects of climate and land use on
ecological communities and their ecosystem functions.
To address these topics, his research is focused on
changes in biodiversity and its related ecosystem
functions along land-use and elevation gradients,
mainly using experimental field studies.
Author contributions: K.B.G., M.S. and S.W.F. designed
the study. S.W.F. conducted the field work, assembled
the data, performed the analyses and wrote the first
draft of the manuscript. A.H. contributed climate
and plant richness data. S.W.F., M.S., A.H., K.M.H.
and K.B.G. contributed to the final version of the
manuscript.
Editor: Christy McCain
Climate and bird species richness
Global Ecology and Biogeography, 23, 541–549, © 2014 John Wiley & Sons Ltd 549
SUPPORTING INFORMATION
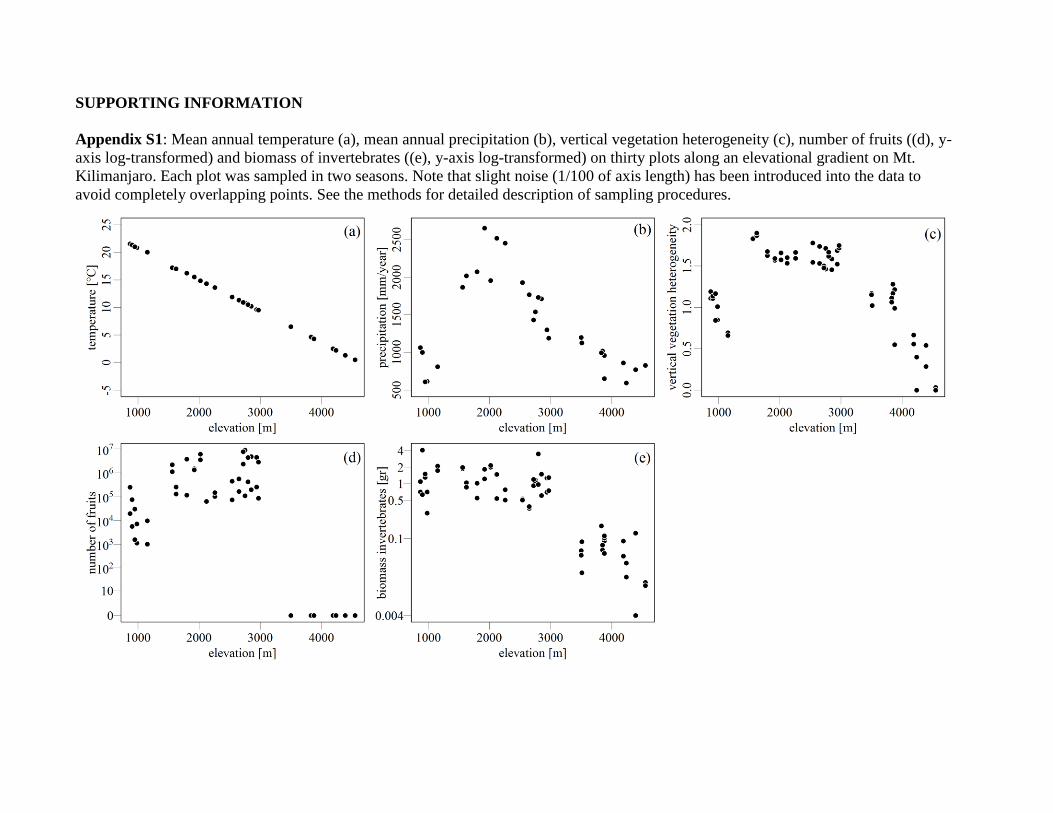
Appendix S1: Mean annual temperature (a), mean annual precipitation (b), vertical vegetation heterogeneity (c), number of fruits ((d), y-
axis log-transformed) and biomass of invertebrates ((e), y-axis log-transformed) on thirty plots along an elevational gradient on Mt.
Kilimanjaro. Each plot was sampled in two seasons. Note that slight noise (1/100 of axis length) has been introduced into the data to
avoid completely overlapping points. See the methods for detailed description of sampling procedures.
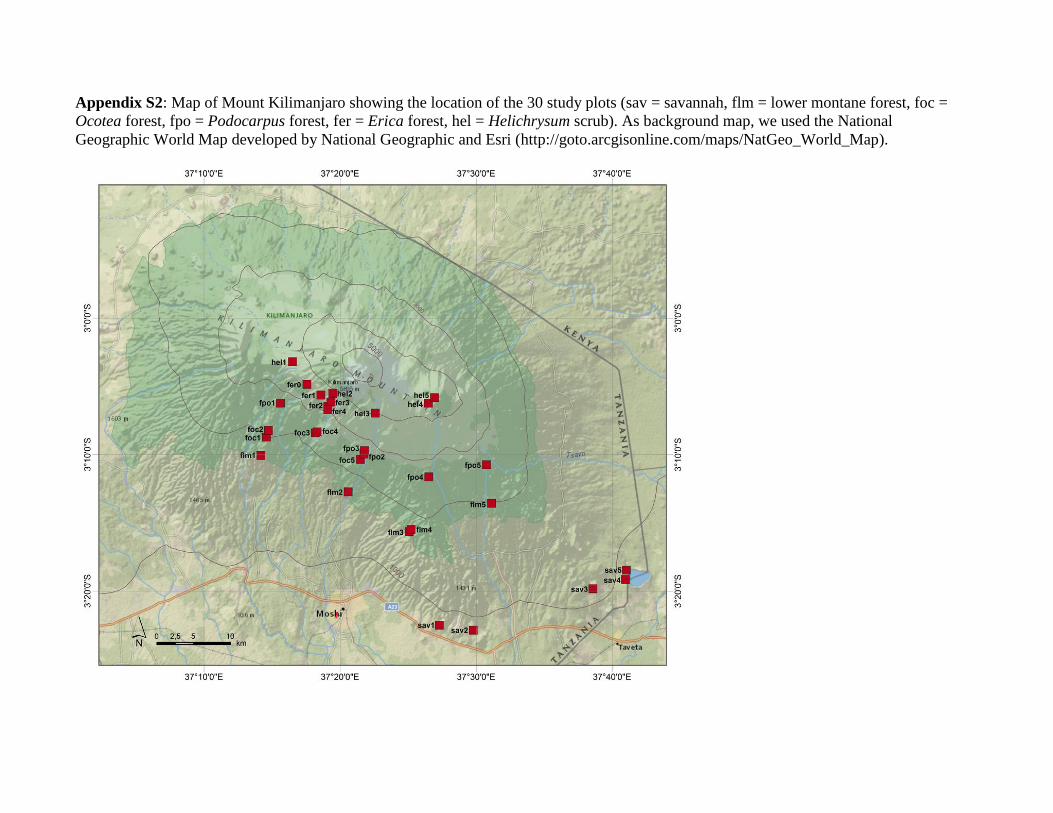
Appendix S2: Map of Mount Kilimanjaro showing the location of the 30 study plots (sav = savannah, flm = lower montane forest, foc =
Ocotea forest, fpo = Podocarpus forest, fer = Erica forest, hel = Helichrysum scrub). As background map, we used the National
Geographic World Map developed by National Geographic and Esri (http://goto.arcgisonline.com/maps/NatGeo_World_Map).

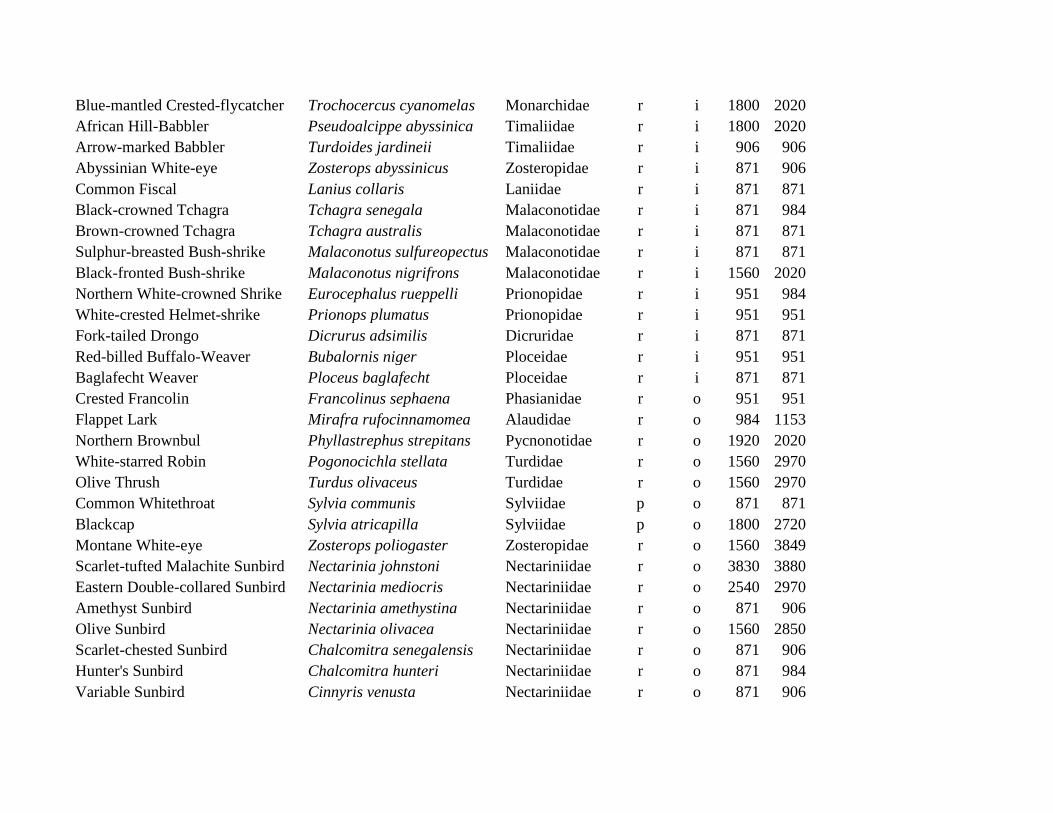
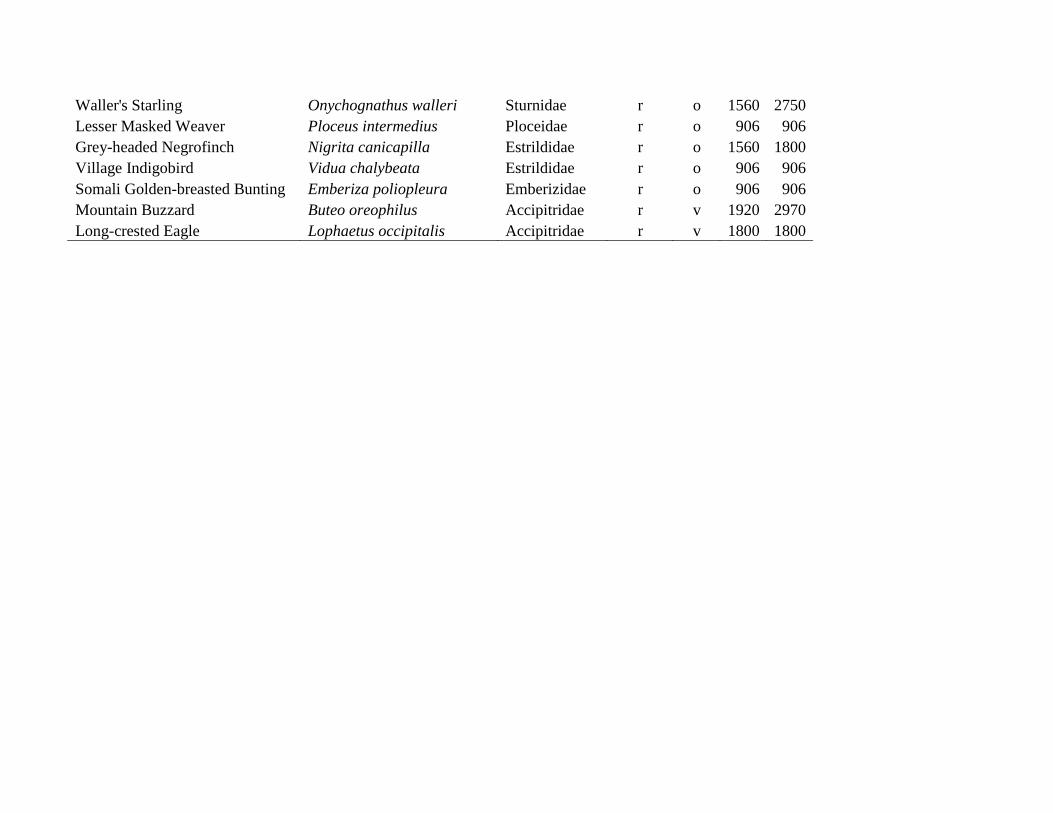
Appendix S3: List of all 114 observed bird species, their migratory status (r = resident, p = Palearctic migrant, a = intra-African migrant),
feeding guild (c = carnivorous [major food items consist of invertebrates + other animal material], f = frugivorous [major food items
fruits; fruits + other plant material], g = granivorous [major food items only seeds; non-fruit plant material + seeds], i = insectivorous
[major food item only invertebrates], o = omnivorous [major food items any animal material + any plant material], v = vertebrates [major
food items only vertebrates and/or carrion], note that no species could be assigned as nectarivorous [major food item only nectar]) and the
elevations of the lowest and highest plot at which the respective species was observed during the point counts. Species are ordered by
feeding guilds first and taxonomy second.
Elevation
Common name Scientific name Family Migrant Food min. max.
Spotted Eagle-Owl Bubo africanus Strigidae r c 871 871
Von der Decken's Hornbill Tockus deckeni Bucerotidae r c 951 984
Scaly Francolin Francolinus squamatus Phasianidae r f 1800 1800
Eastern Bronze-naped Pigeon Columba delegorguei Columbidae r f 2020 2020
Olive Pigeon Columba arquatrix Columbidae r f 1560 2970
Tambourine Dove Turtur tympanistria Columbidae r f 1560 1560
Lemon Dove Aplopelia larvata Columbidae r f 1800 2020
Red-fronted Parrot Poicephalus gulielmi Psittacidae r f 2260 2260
Hartlaub's Turaco Tauraco hartlaubi Musophagidae r f 1560 2970
White-bellied Go-away-bird Corythaixoides leucogaster Musophagidae r f 951 951
Moustached Green Tinkerbird Pogoniulus leucomystax Capitonidae r f 1560 2020
Red-fronted Tinkerbird Pogoniulus pusillus Capitonidae r f 871 871
Spot-flanked Barbet Tricholaema lacrymosa Capitonidae r f 951 951
Common Bulbul Pycnonotus barbatus Pycnonotidae r f 871 1560
Mountain Greenbul Andropadus nigriceps Pycnonotidae r f 1623 2970
Stripe-cheeked Greenbul Andropadus milanjensis Pycnonotidae r f 1560 1920
Zanzibar Sombre Greenbul Andropadus importunus Pycnonotidae r f 871 871
Kenrick's Starling Poeoptera kenricki Sturnidae r f 1560 2260
Violet-backed Starling Cinnyricinclus leucogaster Sturnidae a f 871 906
Abbott's Starling Cinnyricinclus femoralis Sturnidae r f 2120 2970

Yellow-spotted Petronia Petronia pyrgita Passeridae r f 871 984
Emerald-spotted Wood-Dove Turtur chalcospilos Columbidae r g 871 984
Ring-necked Dove Streptopelia capicola Columbidae r g 951 951
Red-eyed Dove Streptopelia semitorquata Columbidae r g 951 951
Laughing Dove Streptopelia senegalensis Columbidae r g 871 951
Dusky Turtle Dove Streptopelia lugens Columbidae r g 2800 3880
Red-billed Quelea Quelea quelea Ploceidae r g 951 984
Abyssinian Crimsonwing Cryptospiza salvadorii Estrildidae r g 1920 1920
Red-cheeked Cordon-bleu Uraeginthus bengalus Estrildidae r g 871 1153
Red-billed Firefinch Lagonosticta senegala Estrildidae r g 871 951
Jameson's Firefinch Lagonosticta rhodopareia Estrildidae r g 906 906
Bronze Mannikin Lonchura cucullata Estrildidae r g 871 906
Yellow-fronted Canary Serinus mozambicus Fringillidae r g 906 1153
Yellow-crowned Canary Serinus canicollis Fringillidae r g 4550 4550
Yellow-rumped Seedeater Serinus reichenowi Fringillidae r g 871 1153
Oriole-Finch Linurgus olivaceus Fringillidae r g 2800 2850
Cinnamon-breasted Rock Bunting Emberiza tahapisi Emberizidae r g 871 1153
African Wood Owl Strix woodfordii Strigidae r i 2020 2020
Alpine Swift Apus melba Apodidae r i 3880 3880
Scarce Swift Schoutedenapus myoptilus Apodidae r i 2120 2120
Bar-tailed Trogon Apaloderma vittatum Trogonidae r i 1800 2970
Little Bee-eater Merops pusillus Meropidae r i 871 871
Red-billed Hornbill Tockus erythrorhynchus Bucerotidae r i 951 951
African Grey Hornbill Tockus nasutus Bucerotidae r i 871 1153
Greater Honeyguide Indicator indicator Indicatoridae r i 1560 1560
Nubian Woodpecker Campethera nubica Picidae r i 871 984
Olive Woodpecker Dendropicos griseocephalus Picidae r i 1560 1800
Rock Martin Hirundo fuligula Hirundinidae r i 906 906
Barn Swallow Hirundo rustica Hirundinidae p i 951 951

Black Saw-wing Psalidoprocne holomelas Hirundinidae r i 1560 2120
Mountain Wagtail Motacilla clara Motacillidae r i 1560 1623
Grassland Pipit Anthus cinnamomeus Motacillidae r i 906 906
Long-billed Pipit Anthus similis Motacillidae r i 906 1153
Cabanis's Greenbul Phyllastrephus cabanisi Pycnonotidae r i 1623 2800
Rüppell's Robin-Chat Cossypha semirufa Turdidae r i 2020 2020
Common Rock-Thrush Monticola saxatilis Turdidae p i 984 984
Spotted Morning-Thrush Cichladusa guttata Turdidae r i 871 906
Alpine Chat Cercomela sordida Turdidae r i 3510 4550
Mountain Yellow Warbler Chloropeta similis Sylviidae r i 2720 2800
Cinnamon Bracken Warbler Bradypterus cinnamomeus Sylviidae r i 1623 2970
Evergreen Forest Warbler Bradypterus lopezi Sylviidae r i 1560 2970
Willow Warbler Phylloscopus trochilus Sylviidae p i 1920 1920
Brown Woodland Warbler Phylloscopus umbrovirens Sylviidae r i 1560 3880
Red-faced Crombec Sylvietta whytii Sylviidae r i 871 984
Winding Cisticola Cisticola galactotes Sylviidae r i 984 984
Hunter's Cisticola Cisticola hunteri Sylviidae r i 3510 4190
Tawny-flanked Prinia Prinia subflava Sylviidae r i 871 871
Grey-backed Camaroptera Camaroptera brachyura Sylviidae r i 1560 1560
Grey Wren-Warbler Calamonastes simplex Sylviidae r i 871 984
Yellow-breasted Apalis Apalis flavida Sylviidae r i 871 906
Black-headed Apalis Apalis melanocephala Sylviidae r i 1560 2020
Bar-throated Apalis Apalis thoracica Sylviidae r i 2020 2020
White-eyed Slaty Flycatcher Melaenornis fischeri Muscicapidae r i 1623 1623
African Grey Flycatcher Bradornis microrhynchus Muscicapidae r i 951 984
African Dusky Flycatcher Muscicapa adusta Muscicapidae r i 1560 2970
Chin-spot Batis Batis molitor Platysteiridae r i 871 1623
Forest Batis Batis mixta Platysteiridae r i 1560 1800
African Paradise-flycatcher Terpsiphone viridis Monarchidae r i 871 2020
Blue-mantled Crested-flycatcher Trochocercus cyanomelas Monarchidae r i 1800 2020
African Hill-Babbler Pseudoalcippe abyssinica Timaliidae r i 1800 2020
Arrow-marked Babbler Turdoides jardineii Timaliidae r i 906 906
Abyssinian White-eye Zosterops abyssinicus Zosteropidae r i 871 906
Common Fiscal Lanius collaris Laniidae r i 871 871
Black-crowned Tchagra Tchagra senegala Malaconotidae r i 871 984
Brown-crowned Tchagra Tchagra australis Malaconotidae r i 871 871
Sulphur-breasted Bush-shrike Malaconotus sulfureopectus Malaconotidae r i 871 871
Black-fronted Bush-shrike Malaconotus nigrifrons Malaconotidae r i 1560 2020
Northern White-crowned Shrike Eurocephalus rueppelli Prionopidae r i 951 984
White-crested Helmet-shrike Prionops plumatus Prionopidae r i 951 951
Fork-tailed Drongo Dicrurus adsimilis Dicruridae r i 871 871
Red-billed Buffalo-Weaver Bubalornis niger Ploceidae r i 951 951
Baglafecht Weaver Ploceus baglafecht Ploceidae r i 871 871
Crested Francolin Francolinus sephaena Phasianidae r o 951 951
Flappet Lark Mirafra rufocinnamomea Alaudidae r o 984 1153
Northern Brownbul Phyllastrephus strepitans Pycnonotidae r o 1920 2020
White-starred Robin Pogonocichla stellata Turdidae r o 1560 2970
Olive Thrush Turdus olivaceus Turdidae r o 1560 2970
Common Whitethroat Sylvia communis Sylviidae p o 871 871
Blackcap Sylvia atricapilla Sylviidae p o 1800 2720
Montane White-eye Zosterops poliogaster Zosteropidae r o 1560 3849
Scarlet-tufted Malachite Sunbird Nectarinia johnstoni Nectariniidae r o 3830 3880
Eastern Double-collared Sunbird Nectarinia mediocris Nectariniidae r o 2540 2970
Amethyst Sunbird Nectarinia amethystina Nectariniidae r o 871 906
Olive Sunbird Nectarinia olivacea Nectariniidae r o 1560 2850
Scarlet-chested Sunbird Chalcomitra senegalensis Nectariniidae r o 871 906
Hunter's Sunbird Chalcomitra hunteri Nectariniidae r o 871 984
Variable Sunbird Cinnyris venusta Nectariniidae r o 871 906
Waller's Starling Onychognathus walleri Sturnidae r o 1560 2750
Lesser Masked Weaver Ploceus intermedius Ploceidae r o 906 906
Grey-headed Negrofinch Nigrita canicapilla Estrildidae r o 1560 1800
Village Indigobird Vidua chalybeata Estrildidae r o 906 906
Somali Golden-breasted Bunting Emberiza poliopleura Emberizidae r o 906 906
Mountain Buzzard Buteo oreophilus Accipitridae r v 1920 2970
Long-crested Eagle Lophaetus occipitalis Accipitridae r v 1800 1800
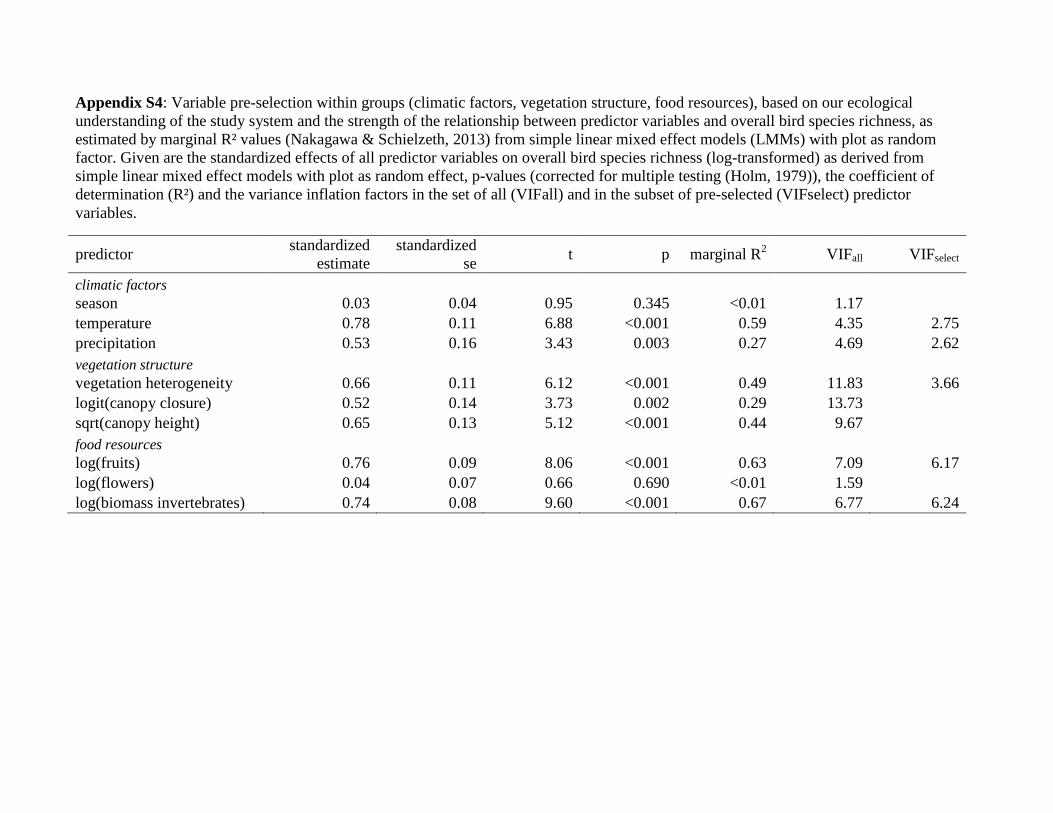
Appendix S4: Variable pre-selection within groups (climatic factors, vegetation structure, food resources), based on our ecological
understanding of the study system and the strength of the relationship between predictor variables and overall bird species richness, as
estimated by marginal R² values (Nakagawa & Schielzeth, 2013) from simple linear mixed effect models (LMMs) with plot as random
factor. Given are the standardized effects of all predictor variables on overall bird species richness (log-transformed) as derived from
simple linear mixed effect models with plot as random effect, p-values (corrected for multiple testing (Holm, 1979)), the coefficient of
determination (R²) and the variance inflation factors in the set of all (VIFall) and in the subset of pre-selected (VIFselect) predictor
variables.
predictor standardized
estimate
standardized
se t p marginal R
2 VIFall VIFselect
climatic factors
season 0.03 0.04 0.95 0.345 <0.01 1.17
temperature 0.78 0.11 6.88 <0.001 0.59 4.35 2.75
precipitation 0.53 0.16 3.43 0.003 0.27 4.69 2.62
vegetation structure
vegetation heterogeneity 0.66 0.11 6.12 <0.001 0.49 11.83 3.66
logit(canopy closure) 0.52 0.14 3.73 0.002 0.29 13.73
sqrt(canopy height) 0.65 0.13 5.12 <0.001 0.44 9.67
food resources
log(fruits) 0.76 0.09 8.06 <0.001 0.63 7.09 6.17
log(flowers) 0.04 0.07 0.66 0.690 <0.01 1.59
log(biomass invertebrates) 0.74 0.08 9.60 <0.001 0.67 6.77 6.24
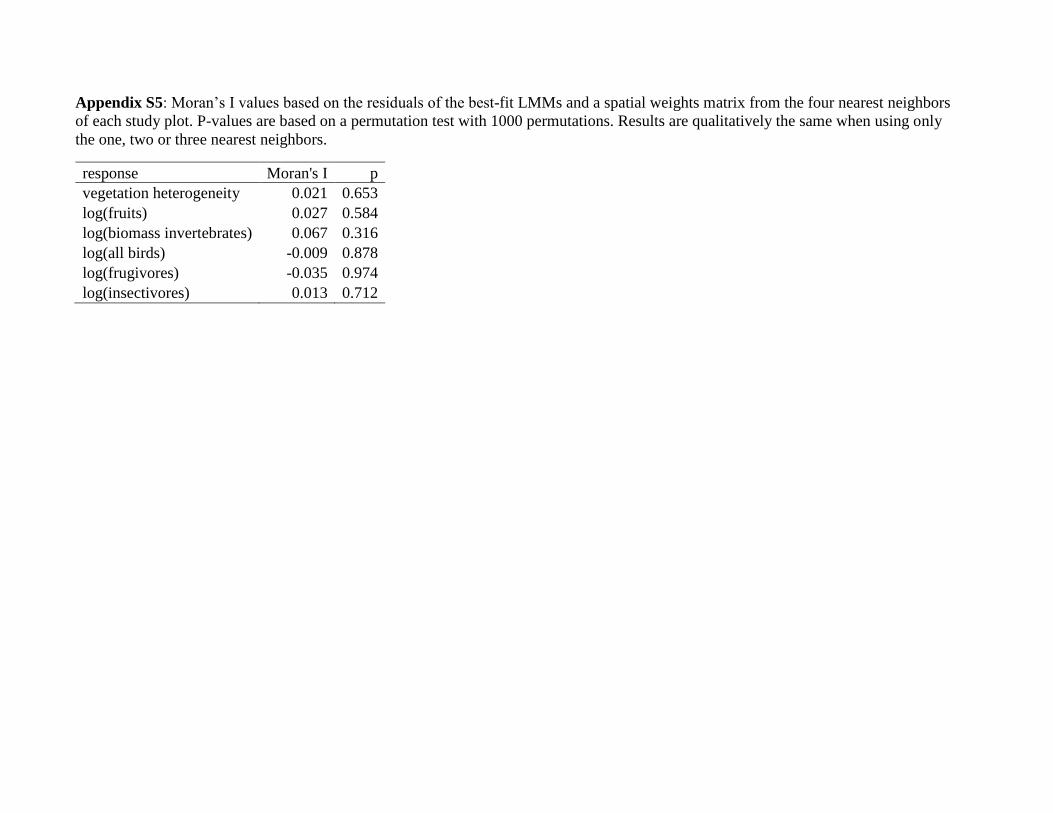
Appendix S5: Moran’s I values based on the residuals of the best-fit LMMs and a spatial weights matrix from the four nearest neighbors
of each study plot. P-values are based on a permutation test with 1000 permutations. Results are qualitatively the same when using only
the one, two or three nearest neighbors.
response Moran's I p
vegetation heterogeneity 0.021 0.653
log(fruits) 0.027 0.584
log(biomass invertebrates) 0.067 0.316
log(all birds) -0.009 0.878
log(frugivores) -0.035 0.974
log(insectivores) 0.013 0.712
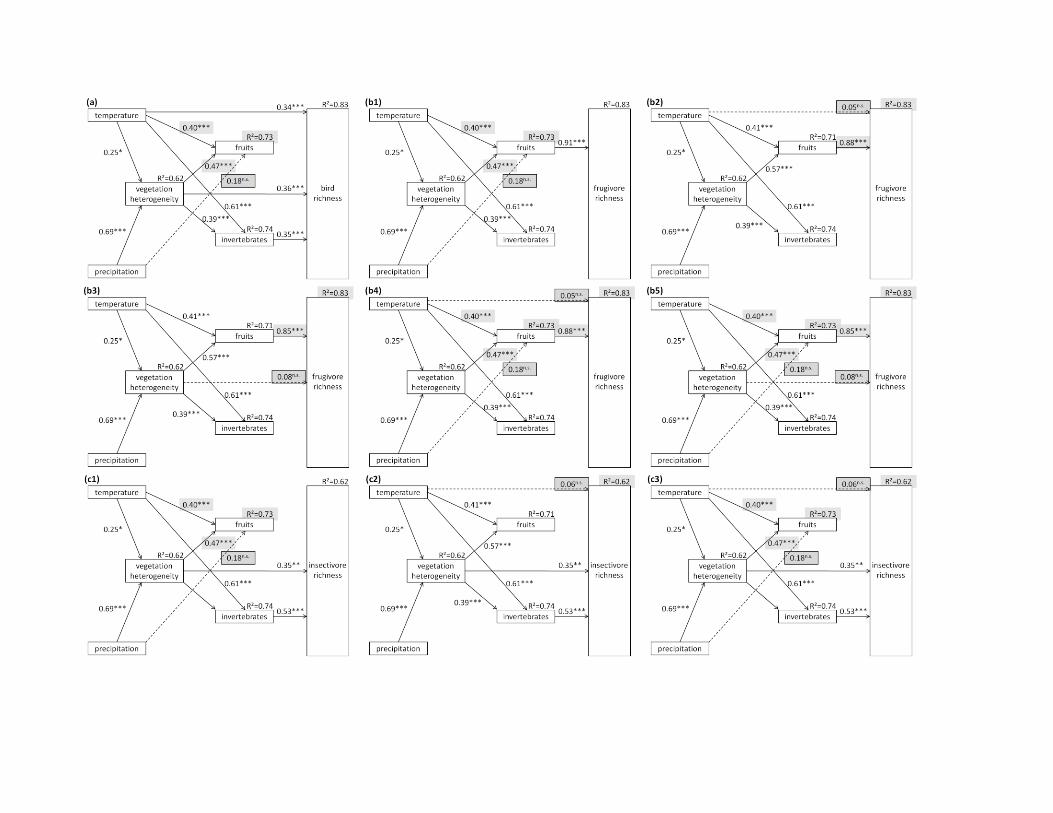
Appendix S6.1: Alternative path models for all birds (a), frugivorous birds (b) and insectivorous birds (c) that consist of LMMs with a Δ
AICc < 2 compared to the best-fit LMMs presented in Fig. 2. Given are standardized path coefficients, their statistical significance (+ p <
0.1, * p < 0.05, ** p < 0.01, *** p < 0.001) and the coefficients of determination (R²). For clarity, error terms and the correlation of errors
of fruits and invertebrates are not shown. Additional paths (compared to the path models in Fig. 2) are dashed and their path coefficients
are presented in a black-framed box with grey shading. Path coefficients and R²-values that have been altered due to the inclusion of
additional paths are presented with grey shading (but no black box). Note that all additional paths of the alternative models are non-
significant and that the explained variance in bird species richness is not higher than in the more parsimonious models in Fig. 2 (changes
in R² are in the 3rd
or 4th
decimal place). All alternative models that affect bird species richness have a significantly worse fit to the data
than the best-fit models in Fig. 2, i.e. the models b2-b5, c2 and c3 (see Appendix S6.2).
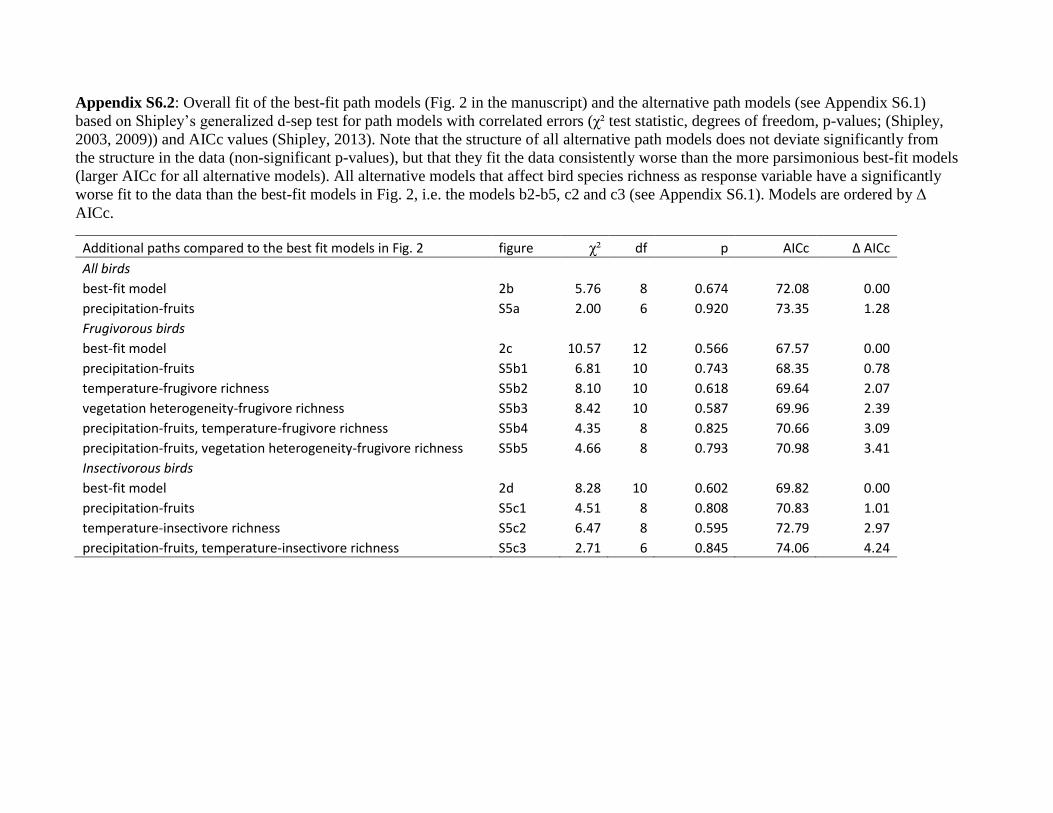
Appendix S6.2: Overall fit of the best-fit path models (Fig. 2 in the manuscript) and the alternative path models (see Appendix S6.1)
based on Shipley’s generalized d-sep test for path models with correlated errors (χ² test statistic, degrees of freedom, p-values; (Shipley,
2003, 2009)) and AICc values (Shipley, 2013). Note that the structure of all alternative path models does not deviate significantly from
the structure in the data (non-significant p-values), but that they fit the data consistently worse than the more parsimonious best-fit models
(larger AICc for all alternative models). All alternative models that affect bird species richness as response variable have a significantly
worse fit to the data than the best-fit models in Fig. 2, i.e. the models b2-b5, c2 and c3 (see Appendix S6.1). Models are ordered by Δ
AICc.
Additional paths compared to the best fit models in Fig. 2 figure χ² df p AICc Δ AICc
All birds best-fit model 2b 5.76 8 0.674 72.08 0.00
precipitation-fruits S5a 2.00 6 0.920 73.35 1.28
Frugivorous birds best-fit model 2c 10.57 12 0.566 67.57 0.00
precipitation-fruits S5b1 6.81 10 0.743 68.35 0.78
temperature-frugivore richness S5b2 8.10 10 0.618 69.64 2.07
vegetation heterogeneity-frugivore richness S5b3 8.42 10 0.587 69.96 2.39
precipitation-fruits, temperature-frugivore richness S5b4 4.35 8 0.825 70.66 3.09
precipitation-fruits, vegetation heterogeneity-frugivore richness S5b5 4.66 8 0.793 70.98 3.41
Insectivorous birds best-fit model 2d 8.28 10 0.602 69.82 0.00
precipitation-fruits S5c1 4.51 8 0.808 70.83 1.01
temperature-insectivore richness S5c2 6.47 8 0.595 72.79 2.97
precipitation-fruits, temperature-insectivore richness S5c3 2.71 6 0.845 74.06 4.24
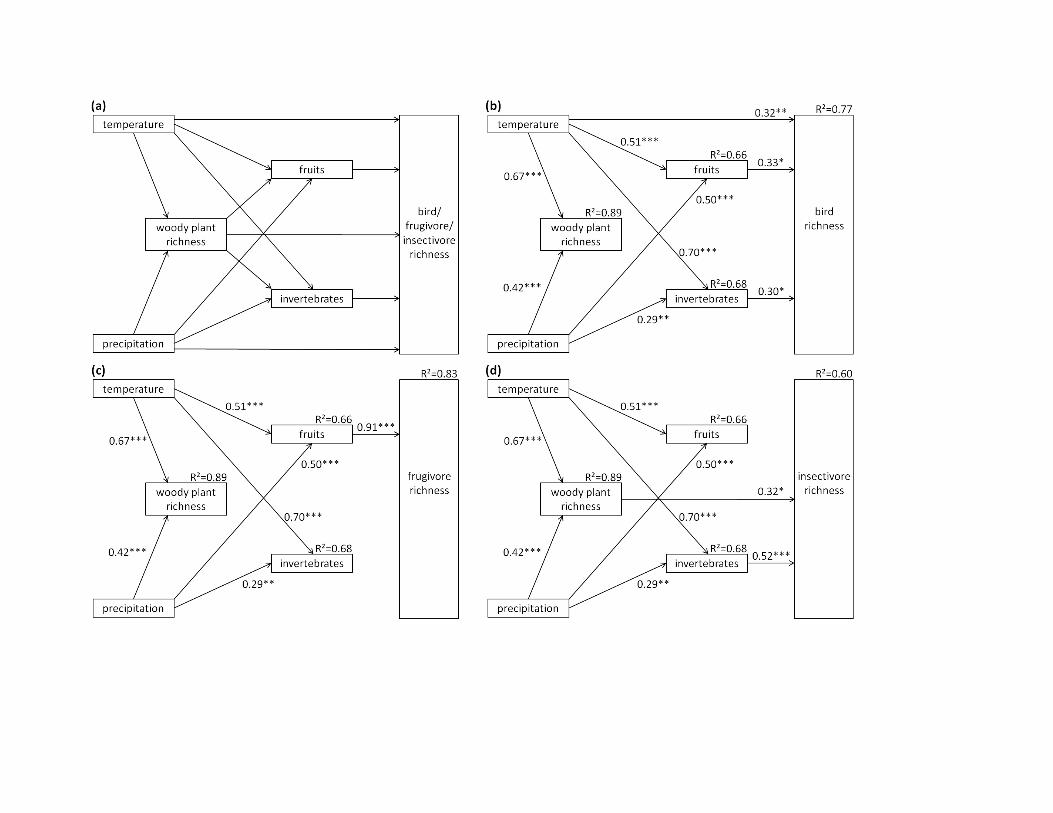
Appendix S7: A priori hypothesized causal structure (a) of the relationships among climatic factors (temperature and precipitation),
woody plant species richness (log-transformed; recorded on the 30 0.25-ha study plots of the KiLi project described in the methods), food
resources (fruits and invertebrates, both log-transformed) and bird species richness (log-transformed); and the best-fit path models (based
on AICc) for all birds (b), frugivorous birds (c) and insectivorous birds (d). Given are standardized path coefficients, their statistical
significance (+ p < 0.1, * p < 0.05, ** p < 0.01, *** p < 0.001) and the coefficients of determination (R²). Paths that did not contribute to
the best-fit models have been deleted in (b), (c) and (d). For clarity, error terms and the correlation of errors of fruits and invertebrates are
not shown. All path models yield a good fit to the data (overall richness: χ² = 7.38, df = 8, p = 0.496; frugivore richness: χ² = 7.64, df =
12, p = 0.813; insectivore richness: χ² = 4.51, df = 10, p = 0.921).

REFERENCES (cited in Supporting Information)
Holm, S. (1979) A simple sequentially rejective multiple test procedure. Scandinavian Journal of Statistics, 6, 65–70.
Nakagawa, S. & Schielzeth, H. (2013) A general and simple method for obtaining R2 from generalized linear mixed-effects models.
Methods in Ecology and Evolution, 4, 133–142.
Shipley, B. (2009) Confirmatory path analysis in a generalized multilevel context. Ecology, 90, 363–368.
Shipley, B. (2003) Testing recursive path models with correlated errors using d-separation. Structural Equation Modeling, 10, 214–221.
Shipley, B. (2013) The AIC model selection method applied to path analytic models compared using a d-separation tests. Ecology, 94,
560–564.