
Food Processing for Increased Quality and Consumption
690
-
Upload
khangminh22 -
Category
Documents
-
view
1 -
download
0
Transcript of Food Processing for Increased Quality and Consumption


Food Processing for IncreasedQuality and Consumption

Handbook of Food Bioengineering,Volume 18
Edited by
Alexandru Mihai Grumezescu
Alina Maria Holban

Table of Contents
Cover
Title page
Copyright
List of Contributors
Foreword
Series Preface
Preface for Volume 18: Food Processing for Increased Quality andConsumption
Chapter 1: Food Processing for Increasing Consumption: The Case ofLegumes
Abstract
1. Food Legumes: A Boon to Human Nutrition
2. Antinutrients in Legumes and Their Removal
3. Processing Techniques to Reduce Antinutritional Factors

4. Food Safety and Quality Issues
5. Significance of Paradigm Shift
6. Pesticides: Types, Application, Environmental Impacts, and Human Health Effects
7. Conclusions
Chapter 2: Emerging Food Processing Technologies
Abstract
1. Introduction
2. Food Consumption
3. Principle of Food Processing
4. Historical Development of Food Preservation
5. The Need for and Benefits of Industrial Food Preservation
6. Principles of Food Preservations
7. Technologies Applied to Food Processing and Preservation
8. Food Waste Management
9. A Few Statistics of Food Consumption in India (MOFPI, 2005)
10. Processed Food Versus Obesity
11. Conclusions
Chapter 3: Food Technology Approaches for Improvement of OrganolepticProperties Through Preservation and Enrichment of Bioactive Compounds
Abstract
1. Introduction
2. Freeze Concentration as an Innovative Food Technology for Preservation ofBioactive Compounds and Flavor
3. Encapsulation
4. Osmotic Dehydration

5. Conclusions and Future Prospects
Acknowledgments
Chapter 4: Cutting Automation in Food Processing
Abstract
1. Introduction
2. Modeling of Biomaterial Cutting
3. Simulation With Changing Parameters
4. Results From Finite Element Modeling
5. Experimental Results and Discussion
6. Design of a New Cutting Device for Chicken Deboning
7. Conclusions
Acknowledgment
Chapter 5: The Perception of Consumers Vis-à-Vis Tracked Fish Measuredvia Electronic Instrument
Abstract
1. Introduction
2. Fish Consumption: Health Benefits
3. Fish: Production Chain Quality
4. Traceability: Concept/Definition
5. Quality and Traceability Systems in the Fish Production Chain
6. Assessment of Fish Consumption Regarding Tracked Fish
7. Conclusions
Chapter 6: High-Pressure Technologies in Dairy Processing: QualityMaintenance and Increase in Consumption

Abstract
1. Introduction
2. High Isostatic Pressure
3. Dynamic High Pressure
4. Effect HIP and DHP on Milk Constituents
5. Industrial Applications
6. Prospects and Acceptance of Processed Products Through High PressureProcessing Technologies
7. Conclusion
Chapter 7: Advances in Nonthermal Processing Technologies for EnhancedMicrobiological Safety and Quality of Fresh Fruit and Juice Products
Abstract
1. Fresh Fruit and Juice Consumption Trends
2. Microbial Contamination of Fresh Fruit and Juices and Related Foodborne IllnessOutbreaks
3. Challenges of the Fresh Produce– and Juice-Processing Industries
4. Potential of Nonthermal Processing Technologies for Safety and Shelf LifeEnhancement of Fresh Fruit and Juice Products
5. Conclusions and Future Directions
Acknowledgments
Chapter 8: Agroindustrial Coproducts as Sources of Novel FunctionalIngredients
Abstract
1. Agroindustrial Coproducts
2. Dietary Fiber From Agroindustrial Coproducts
3. Phenolic Compounds in Agroindustrial Coproducts

4. Prebiotics
5. Future Perspectives for Coproducts Agroindustrials
6. Conclusions
Chapter 9: The Contribution of Bioactive Peptides of Whey to Quality ofFood Products
Abstract
1. Introduction
2. Bioactivity of Whey Protein and Peptide
3. Production of Bioactive Peptide From Whey
4. Functional Properties
5. Bioactive Peptide in Food Industry
6. Conclusions
Chapter 10: Amino Acids: Carriers of Nutritional and Biological ValueFoods
Abstract
1. Introduction
2. General Information
3. Chemistry and Classification of Amino Acids
4. Amino Acids and Proteins Biological Value
5. Amino Acid Analysis of Food Proteins
6. Conclusions
Chapter 11: Strategy for the Prediction, Control, and Optimization of theFunctional Properties of Food Proteins: Using Statistical and ChemometricTools

Abstract
1. Introduction
2. Materials and Methods
3. Results and Discussion
4. Conclusions
Acknowledgments
Chapter 12: Production of Low-Alcohol Beverages: Current Status andPerspectives
Abstract
1. Overview of Alcohol Consumption
2. Dealcoholization of Beverages
3. Techniques for Alcohol Reduction in Wine
4. Techniques for Reducing the Alcohol Level in Beer
5. Sensory Properties and Low-alcohol Beverage Improvements
6. Conclusions and Future Trends
Chapter 13: Dielectric Defrosting of Frozen Foods
Abstract
1. Introduction
2. Frozen Foods and Defrosting
3. The Mechanism of Dielectric Heating
4. DPs of Frozen Foods and Defrosting Applications
5. Mathematical Modeling of Dielectric Defrosting of Frozen Foods
6. Approaches to Uniform Heating
7. Conclusions

Chapter 14: Role for Value Addition in Processing Foods of TraditionalVarieties of Grains
Abstract
1. Introduction
2. Key Limitations in Developing Value Added Products of Traditional Grains
3. Strategies for Value Addition in Traditional Grains
4. Value Addition in Traditional Cereal Grains
5. Value-Added Products in Traditional Wheat Grains
6. Value Addition in Traditional Millet Grains
7. Value Addition in Traditional Pulses
8. Conclusions
Chapter 15: Role of Food Product Development in Increased FoodConsumption and Value Addition
Abstract
1. Food Product Development
2. Value Addition
3. Reasons for Increased Food Consumption and Value Addition
4. Conclusions
Index

Copyright
Academic Press is an imprint of Elsevier125 London Wall, London EC2Y 5AS, United Kingdom525 B Street, Suite 1800, San Diego, CA 92101-4495, United States50 Hampshire Street, 5th Floor, Cambridge, MA 02139, United StatesThe Boulevard, Langford Lane, Kidlington, Oxford OX5 1GB, UnitedKingdom
Copyright © 2018 Elsevier Inc. All rights reserved.
No part of this publication may be reproduced or transmitted in any form orby any means, electronic or mechanical, including photocopying, recording,or any information storage and retrieval system, without permission inwriting from the publisher. Details on how to seek permission, furtherinformation about the Publisher’s permissions policies and ourarrangements with organizations such as the Copyright Clearance Centerand the Copyright Licensing Agency, can be found at our website:www.elsevier.com/permissions.
This book and the individual contributions contained in it are protectedunder copyright by the Publisher (other than as may be noted herein).
NoticesKnowledge and best practice in this field are constantly changing. As newresearch and experience broaden our understanding, changes in researchmethods, professional practices, or medical treatment may becomenecessary.

Practitioners and researchers must always rely on their own experienceand knowledge in evaluating and using any information, methods,compounds, or experiments described herein. In using such informationor methods they should be mindful of their own safety and the safety ofothers, including parties for whom they have a professional responsibility.
To the fullest extent of the law, neither the Publisher nor the authors,contributors, or editors, assume any liability for any injury and/or damageto persons or property as a matter of products liability, negligence orotherwise, or from any use or operation of any methods, products,instructions, or ideas contained in the material herein.
Library of Congress Cataloging-in-Publication DataA catalog record for this book is available from the Library of Congress
British Library Cataloguing-in-Publication DataA catalogue record for this book is available from the British Library
ISBN: 978-0-12-811447-6
For information on all Academic Press publications visit our website athttps://www.elsevier.com/books-and-journals
Publisher: Andre G. WolffAcquisition Editor: Nina Rosa de Araujo BandeiraEditorial Project Manager: Jaclyn A. TruesdellProduction Project Manager: Mohanapriyan Rajendran

Designer: Matthew Limbert
Typeset by Thomson Digital

List of Contributors
Donatella Albanese, University of Salerno, Fisciano, Salerno, Italy
Jing Bai, University of Minnesota, Duluth, MN, United States
Sonia E. BarberisLaboratorio de Bromatología, Facultad de Química, Bioquímica yFarmacia, Universidad Nacional de San Luis, Chacabuco y PederneraConsejo Nacional de Investigaciones Científicas y Técnicas (CCT—SanLuis—CONICET), Instituto de Física Aplicada (INFAP), San Luis,Argentina
Maja Bulatovic, University of Belgrade, Belgrade, Serbia
Fabiola Cerda, Universidad del Bio-Bio, Chillán, Chile
Shivani Chaturvedi, Indian Institute of Technology Delhi, New Delhi,Delhi, India
Marcelo Cristianini, University of Campinas (UNICAMP), Campinas,São Paulo, Brazil
Erika da Silva Maciel, Federal University of Tocantins, Miracema doTocantins, Tocantins, Brazil
Wayne Daley, Georgia Tech Research Institute (GTRI), Georgia Instituteof Technology, Atlanta, GA, United States
Bruna R. de Castro Leite, Jr., University of Campinas (UNICAMP),Campinas, São Paulo, Brazil
Miguel M. de OliveiraUniversity of Campinas (UNICAMP), Campinas, São Paulo

Federal Center of Technological Education Celso Suckow da Fonseca(CEFET-RJ), Valença, Brazil
Marisa Di Matteo, University of Salerno, Fisciano, Salerno, Italy
Laura Folguera, Comisión Nacional de Energía Atómica, CentroAtómico Constituyentes, San Martín, Provincia de Buenos Aires, Argentina
Juliana A. Galvão, University of Sao Paulo, São Paulo, São Paulo,Brazil
Gargi Ghoshal, Dr. S.S. Bhatnagar University Institute of ChemicalEngineering & Technology, Panjab University, Chandigarh, India
María P. Gianelli, Universidad del Bio-Bio, Chillán, Chile
Annel M. Hernández-Alcántara, Autonomous Metropolitan University,Iztapalapa, Mexico City, Mexico
Hellen A. Kato, Embrapa Fishing and Aquaculture, Palmas, Tocantins,Brazil
Geetanjali Kaushik, Mahatma Gandhi Mission’s Jawaharlal NehruEngineering College, Aurangabad, Maharashtra, India
Jeong Un Kim, Yonsei University, Seoul, South Korea
Sun-Hyoung Kim, Yonsei University, Seoul, South Korea
Tanja Krunic, University of Belgrade, Belgrade, Serbia
Loredana Liguori, University of Salerno, Fisciano, Salerno, Italy
Yvan Llave, Tokyo University of Marine Science and Technology,Tokyo, Japan
Jorge F. Magallanes, Comisión Nacional de Energía Atómica, CentroAtómico Constituyentes, San Martín, Provincia de Buenos Aires, Argentina
Gary McMurray, Georgia Tech Research Institute (GTRI), GeorgiaInstitute of Technology, Atlanta, GA, United States
Karla Mella, Universidad del Bio-Bio, Chillán, Chile
Jorge Moreno, Universidad del Bio-Bio, Chillán, Chile

Marília Oetterer, University of Sao Paulo, São Paulo, São Paulo, Brazil
Patricio Orellana-Palma, Universidad del Bio-Bio, Chillán, Chile
Jiyong Park, Yonsei University, Seoul, South Korea
Maria Lourdes Pérez-Chabela, Autonomous Metropolitan University,Iztapalapa, Mexico City, Mexico
Guillermo Petzold, Universidad del Bio-Bio, Chillán, Chile
Fernando R.P. QuaresmaFederal University of Tocantins, PalmasLutheran University Center of Palmas, Palmas, Tocantins, Brazil
Marica Rakin, University of Belgrade, Belgrade, Serbia
Fanny Ribarova, Medical College Yordanka Filaretova, MedicalUniversity Sofia, Sofia, Bulgaria
Paola Russo, Sapienza University of Rome, Rome, Italy
Noboru Sakai, Tokyo University of Marine Science and Technology,Tokyo, Japan
Ammu Sathya, School of Chemical and Biotechnology, SASTRAUniversity, Thanjavur, Tamil Nadu, India
Luciana K. Savay-da-Silva, Federal University of Mato Grosso, Cuiabá,Mato Grosso, Brazil
Faiz-ul-Hassan Shah, National Institute of Food Science & Technology,University of Agriculture, Faisalabad, Pakistan
Hafiz Muhammad ShahbazYonsei University, Seoul, South KoreaUniversity of Veterinary & Animal Sciences, Lahore, Pakistan
Mian K. Sharif, National Institute of Food Science & Technology,University of Agriculture, Faisalabad, Pakistan
Poonam Singhal, Indian Institute of Technology Delhi, New Delhi,Delhi, India

Jaqueline G. Sonati, University of Taubaté, São Paulo, São Paulo,Brazil
Héctor L. Sturniolo, Laboratorio de Bromatología, Facultad deQuímica, Bioquímica y Farmacia, Universidad Nacional de San Luis,Chacabuco y Pedernera, San Luis, Argentina
Shufang Wang, Institute of Mechatronics, Beijing Union University,Beijing, China
Asna Zahid, National Institute of Food Science & Technology,University of Agriculture, Faisalabad, Pakistan
Danica Zaric, IHIS Techno-experts D.o.o., Research DevelopmentCenter, Belgrade, Serbia
Debao Zhou, University of Minnesota, Duluth, MN, United States
Pamela Zúñiga, Universidad del Bio-Bio, Chillán, Chile

Foreword
In the last 50 years an increasing number of modified and alternative foodshave been developed using various tools of science, engineering, andbiotechnology. The result is that today most of the available commercialfood is somehow modified and improved, and made to look better, tastedifferent, and be commercially attractive. These food products have enteredin the domestic first and then the international markets, currentlyrepresenting a great industry in most countries. Sometimes these productsare considered as life-supporting alternatives, neither good nor bad, andsometimes they are just seen as luxury foods. In the context of apermanently growing population, changing climate, and stronganthropological influence, food resources became limited in large parts ofthe Earth. Obtaining a better and more resistant crop quickly and withimproved nutritional value would represent the Holy Grail for the foodindustry. However, such a crop could pose negative effects on theenvironment and consumer health, as most of the current approachesinvolve the use of powerful and broad-spectrum pesticides, geneticengineered plants and animals, or bioelements with unknown and difficult-to-predict effects. Numerous questions have emerged with the introductionof engineered foods, many of them pertaining to their safe use for humanconsumption and ecosystems, long-term expectations, benefits, challengesassociated with their use, and most important, their economic impact.
The progress made in the food industry by the development ofapplicative engineering and biotechnologies is impressive and many of theadvances are oriented to solve the world food crisis in a constantlyincreasing population: from genetic engineering to improved preservativesand advanced materials for innovative food quality control and packaging.In the present era, innovative technologies and state-of-the-art researchprogress has allowed the development of a new and rapidly changing food

industry, able to bottom-up all known and accepted facts in the traditionalfood management. The huge amount of available information, many timesis difficult to validate, and the variety of approaches, which could seemoverwhelming and lead to misunderstandings, is yet a valuable resource ofmanipulation for the population as a whole.
The series entitled Handbook of Food Bioengineering brings together acomprehensive collection of volumes to reveal the most current progressand perspectives in the field of food engineering. The editors have selectedthe most interesting and intriguing topics, and have dissected them in 20thematic volumes, allowing readers to find the description of basicprocesses and also the up-to-date innovations in the field. Although theseries is mainly dedicated to the engineering, research, and biotechnologicalsectors, a wide audience could benefit from this impressive and updatedinformation on the food industry. This is because of the overall style of thebook, outstanding authors of the chapters, numerous illustrations, images,and well-structured chapters, which are easy to understand. Nonetheless,the most novel approaches and technologies could be of a great relevancefor researchers and engineers working in the field of bioengineering.
Current approaches, regulations, safety issues, and the perspective ofinnovative applications are highlighted and thoroughly dissected in thisseries. This work comes as a useful tool to understand where we are andwhere we are heading to in the food industry, while being amazed by thegreat variety of approaches and innovations, which constantly changes theidea of the “food of the future.”
Anton Ficai, PhD (Eng)
Department Science and Engineering of Oxide Materials andNanomaterials, Faculty of Applied Chemistry and Materials Science, Politehnica Universityof Bucharest, Bucharest, Romania

Series Preface
The food sector represents one of the most important industries in terms ofextent, investment, and diversity. In a permanently changing society, dietaryneeds and preferences are widely variable. Along with offering a greattechnological support for innovative and appreciated products, the currentfood industry should also cover the basic needs of an ever-increasingpopulation. In this context, engineering, research, and technology have beencombined to offer sustainable solutions in the food industry for a healthyand satisfied population.
Massive progress is constantly being made in this dynamic field, butmost of the recent information remains poorly revealed to the largepopulation. This series emerged out of our need, and that of many others, tobring together the most relevant and innovative available approaches in theintriguing field of food bioengineering. In this work we present relevantaspects in a pertinent and easy-to-understand sequence, beginning with thebasic aspects of food production and concluding with the most noveltechnologies and approaches for processing, preservation, and packaging.Hot topics, such as genetically modified foods, food additives, andfoodborne diseases, are thoroughly dissected in dedicated volumes, whichreveal the newest trends, current products, and applicable regulations.
While health and well-being are key drivers of the food industry, marketforces strive for innovation throughout the complete food chain, includingraw material/ingredient sourcing, food processing, quality control offinished products, and packaging. Scientists and industry stakeholders havealready identified potential uses of new and highly investigated concepts,such as nanotechnology, in virtually every segment of the food industry,from agriculture (i.e., pesticide production and processing, fertilizer orvaccine delivery, animal and plant pathogen detection, and targeted geneticengineering) to food production and processing (i.e., encapsulation of flavor

or odor enhancers, food textural or quality improvement, and new gelation-or viscosity-enhancing agents), food packaging (i.e., pathogen,physicochemical, and mechanical agents sensors; anticounterfeitingdevices; UV protection; and the design of stronger, more impermeablepolymer films), and nutrient supplements (i.e., nutraceuticals, higherstability and bioavailability of food bioactives, etc.).
The series entitled Handbook of Food Bioengineering comprises 20thematic volumes; each volume presenting focused information on aparticular topic discussed in 15 chapters each. The volumes and approachedtopics of this multivolume series are:
Volume 1: Food BiosynthesisVolume 2: Food BioconversionVolume 3: Soft Chemistry and Food FermentationVolume 4: Ingredients Extraction by Physicochemical Methods in FoodVolume 5: Microbial Production of Food Ingredients and AdditivesVolume 6: Genetically Engineered FoodsVolume 7: Natural and Artificial Flavoring Agents and Food DyesVolume 8: Therapeutic FoodsVolume 9: Food Packaging and PreservationVolume 10: Microbial Contamination and Food DegradationVolume 11: Diet, Microbiome and HealthVolume 12: Impact of Nanoscience in the Food IndustryVolume 13: Food Quality: Balancing Health and DiseaseVolume 14: Advances in Biotechnology for Food IndustryVolume 15: Foodborne DiseasesVolume 16: Food Control and BiosecurityVolume 17: Alternative and Replacement FoodsVolume 18: Food Processing for Increased Quality and ConsumptionVolume 19: Role of Materials Science in Food BioengineeringVolume 20: Biopolymers for Food DesignThe series begins with a volume on Food Biosynthesis, which reveals the
concept of food production through biological processes and also the mainbioelements that could be involved in food production and processing. Thesecond volume, Food Bioconversion, highlights aspects related to foodmodification in a biological manner. A key aspect of this volume isrepresented by waste bioconversion as a supportive approach in the current

waste crisis and massive pollution of the planet Earth. In the third volume,Soft Chemistry and Food Fermentation, we aim to discuss several aspectsregarding not only to the varieties and impacts of fermentative processes,but also the range of chemical processes that mimic some biologicalprocesses in the context of the current and future biofood industry. Volume4, Ingredients Extraction by Physicochemical Methods in Food, brings thereaders into the world of ingredients and the methods that can be applied fortheir extraction and purification. Both traditional and most of the moderntechniques can be found in dedicated chapters of this volume. On the otherhand, in volume 5, Microbial Production of Food Ingredients and Additives,biological methods of ingredient production, emphasizing microbialprocesses, are revealed and discussed. In volume 6, Genetically EngineeredFoods, the delicate subject of genetically engineered plants and animals todevelop modified foods is thoroughly dissected. Further, in volume 7,Natural and Artificial Flavoring Agents and Food Dyes, another hot topicin food industry—flavoring and dyes—is scientifically commented andvaluable examples of natural and artificial compounds are generouslyoffered. Volume 8, Therapeutic Foods, reveals the most utilized andinvestigated foods with therapeutic values. Moreover, basic and futureapproaches for traditional and alternative medicine, utilizing medicinalfoods, are presented here. In volume 9, Food Packaging and Preservation,the most recent, innovative, and interesting technologies and advances infood packaging, novel preservatives, and preservation methods arepresented. On the other hand, important aspects in the field of MicrobialContamination and Food Degradation are shown in volume 10. Highlydebated topics in modern society: Diet, Microbiome and Health aresignificantly discussed in volume 11. Volume 12 highlights the Impact ofNanoscience in the Food Industry, presenting the most recent advances inthe field of applicative nanotechnology with great impacts on the foodindustry. Additionally, volume 13 entitled Food Quality: Balancing Healthand Disease reveals the current knowledge and concerns regarding theinfluence of food quality on the overall health of population and potentialfood-related diseases. In volume 14, Advances in Biotechnology for FoodIndustry, up-to-date information regarding the progress of biotechnology inthe construction of the future food industry is revealed. Improvedtechnologies, new concepts, and perspectives are highlighted in this work.

The topic of Foodborne Diseases is also well documented within this seriesin volume 15. Moreover, Food Control and Biosecurity aspects, as well ascurrent regulations and food safety concerns are discussed in the volume16. In volume 17, Alternative and Replacement Foods, another broad-interest concept is reviewed. The use and research of traditional foodalternatives currently gain increasing terrain and this quick emerging trendhas a significant impact on the food industry. Another related hot topic,Food Processing for Increased Quality and Consumption, is considered involume 18. The final two volumes rely on the massive progress made inmaterial science and the great applicative impacts of this progress on thefood industry. Volume 19, Role of Materials Science in FoodBioengineering, offers a perspective and a scientific introduction in thescience of engineered materials, with important applications in foodresearch and technology. Finally, in volume 20, Biopolymers for FoodDesign, we discuss the advantages and challenges related to thedevelopment of improved and smart biopolymers for the food industry.
All 20 volumes of this comprehensive collection were carefullycomposed not only to offer basic knowledge for facilitating understandingof nonspecialist readers, but also to offer valuable information regarding thenewest trends and advances in food engineering, which is useful forresearchers and specialized readers. Each volume could be treatedindividually as a useful source of knowledge for a particular topic in theextensive field of food engineering or as a dedicated and explicit part of thewhole series.
This series is primarily dedicated to scientists, academicians, engineers,industrial representatives, innovative technology representatives, medicaldoctors, and also to any nonspecialist reader willing to learn about therecent innovations and future perspectives in the dynamic field of foodbioengineering.
Alexandru M. Grumezescu
Politehnica University of Bucharest, Bucharest, Romania
Alina M. Holban
University of Bucharest, Bucharest, Romania

Preface for Volume 18: FoodProcessing for Increased Qualityand Consumption
Food is the basic necessity of life. However, over the last few decades, foodquality and safety issues have caused a serious concern among theconsumers on account of their direct association with the human health. Asto increase production, resistance, quality, and consumption, food industriesare processing foods by various means to provide products able to fulfill therequirements of a varied population. For improving the aspect, size, andresistance to contamination or degradation, food processing sometimesinvolve the use of some physical, chemical, or biological treatments, whichmay become harmful for consumers. The presence of harmful antinutrientsand the pesticide residues in food products limits the bioavailability of theessential nutrients. Current approaches refer to various procedures, such asorganic farming to effectively deal with chemical, physical, and biologicalcontaminants and ensure food safety. Even if important progress was seenin the last few years, it is estimated that this approach would takesignificant time in being adopted worldwide. Meanwhile, processingprocedures are growing diverse to ensure the production of foods withparticular quality standards to support consumption.
The aim of this book was to bring together the most recent progress andtechnologies in the field of food processing for increased quality andconsumption, empathizing on current concerns regarding processingapproaches and also on successful new tools.
The volume contains 15 chapters prepared by outstanding authors fromChina, Serbia, Italy, India, USA, Chile, Korea, Brazil, Bulgaria, Mexico,Japan, and Argentina.

The selected manuscripts are clearly illustrated and contain accessibleinformation for a wide audience, especially food scientists, engineers,biotechnologists, biochemists, industrial companies; and also for any readerinterested in learning about the most interesting and recent advances in thefield of food processing for increased quality and consumption.
Chapter 1, Food Processing for Increasing Consumption: The Case ofLegumes, prepared by Kaushik et al., introduces the readers in the field ofprocessed foods and current technologies to increase consumption in thecase of legumes. In this study, it is concluded that a combination ofprocessing techniques renders food grains safe for human consumption.
In Chapter 2, Emerging Food Processing Technologies, Ghoshaldiscusses the necessity and perspectives of food processing andpreservation, history of food preservation, food spoilage, conventional andmodern methods of food processing and preservation, characterization,critical evaluation, and also industrialization to address food safety issues,food waste management, food security, and response to consumerschanging demand.
Chapter 3, Food Technology Approaches for Improvement ofOrganoleptic Properties Through Preservation and Enrichment of BioactiveCompounds, written by Petzold et al., describes fresh foods of differentorigins, which are valuable products that nature provides and humanthrough diverse technologies and processes transform for their convenienceand overall comfort required by modern life.
In Chapter 4, Cutting Automation in Food Processing, written by Zhouet al., the impact of robot manipulators is dissected in food processing.Authors have developed a mathematical model of blade slicing-compression cutting and studied the influences from the material properties,deformation, and blade properties on the cutting force. These results can bedirectly used in chicken wing-shoulder cutting operations in a poultry-processing factory, which is a task that directly affects the yield of thebreast meat.
Chapter 5, The Perception of Consumers Vis-à-Vis Tracked FishMeasured via Electronic Instrument, prepared by da Silva Maciel et al.,discusses the impact of implementing the tracking technology into fish-production chain and its impact on consumers’ attitude using data collection

through the Internet. Such results provide subsidy for the adoption ofpolicies to implement a traceability system for fish to boost consumption.
In Chapter 6, Effects of Dynamic High Pressure on Biopolymers:Polysaccharides and Proteins, Porto et al. discuss the impact of dynamichigh pressure (DHP) processing in proteins and polysaccharides, as well asthe benefits of the modifications induced by the process in the finalapplication of these biopolymers as ingredients for various food products.
Chapter 7, Advances in Nonthermal Processing Technologies forEnhanced Microbiological Safety and Quality of Fresh Fruit and JuiceProducts, prepared by Shahbaz et al., provides an overview of recentresearch investigations, state of the art microbial inactivation strategies,advances in process and equipment design, and hurdle approaches forprocessing of fresh fruit and juice products using high hydrostatic pressure(HHP), pulsed electric fields (PEF), ultraviolet (UV) light, and UV-assistedTiO2 photocatalysis (TUV) nonthermal technologies. Future directions toenhance the effectiveness and commercial adoption of these nonthermalfood-processing technologies are discussed here.
Chapter 8, Agroindustrial Coproducts as Sources of Novel FunctionalIngredients, was written by Pérez-Chabela and Hernández-Alcántara. Themanuscript reveals the useful role of fruit and vegetal peels, which containimportant bioactive ingredients, such as fiber and antioxidants. The peelfiber can be employed as a prebiotic ingredient, to stimulate the growth ofprobiotic lactic acid bacteria, and to produce an important amount of short-chain fatty acids, mainly butyric. These fruit peels are low cost potentialfood functional ingredients to develop novel functional foods improvingnutritional quality.
In Chapter 9, The Contribution of Bioactive Peptides of Whey to Qualityof Food Products, Krunic et al. describe the biological activity of wheypeptides and practical application in the food products. Whey peptides havewide range of bioactivity (ACE-inhibitory activity, antioxidant activity,antiinflammatory, antimicrobial) so these peptides are more suitable asingredient in functional food than molecules with only one substantialcharacteristic.
In Chapter 10, Amino Acids: Carriers of Nutritional and Biological ValueFoods, Ribarova reveals current tools in the development of amino acids,

emphasizing on the methods for assessing their content in foods, andmethods to establish the biological value of food proteins. The currentstatus of analytical methodology, concerning particularly amino acidanalysis and their participation in biological methods for evaluation of foodproteins is characterized. An option for more correct calculation approachto amino acid content versus total protein in foods is proposed. The analysisof the current scientific information outlines the need to standardize theanalytical methods and calculation approaches implemented in theassessment of amino acid content in food products.
Chapter 11, Strategy for the Prediction, Control, and Optimization of theFunctional Properties of Food Proteins: Using Statistical and ChemometricTools, written by Barberis et al., describes the design of a new strategy topredict, control, and optimize the functional parameters of food proteinshydrolyzed or not, using chemometrics tools. The starting material consistsof proteins whose functional properties are desired to modify. Functionalproperties (e.g., emulsifying and foaming properties) can be simultaneouslyevaluated by an experimental statistical design, response surface graphics,and multiple linear regressions.
In Chapter 12, Production of Low-Alcohol Beverages: Current Status andPerspectives, Liguori et al. describe various techniques for low alcoholbeverage production from wine and beer. Authors also discuss the mainobstacles for the development of this type of beverages, such as taste andquality.
Chapter 13, Dielectric Defrosting of Frozen Foods, prepared by Llaveand Sakai, recently published data on microwave (MW) and radiofrequency(RF) defrosting, including the dielectric properties (DPs) of frozen foodsand frozen-food models in the MW and RF bands, the recent mathematicalmodels developed in this field, and the approaches to uniform heating. Thedata described herein are valuable as a tool for research on the heatingpatterns during defrosting of frozen foods assisted by dielectric heating.
In Chapter 14, Role for Value Addition in Processing Foods ofTraditional Varieties of Grains, Ammu Sathya discusses the role of valueaddition in processing foods of traditional grain varieties into therapeuticproducts, ethnic and functional foods using appropriate technologies intonovel products. The art of fortification and designing options available to

develop functional foods with careful cost economics gives us the choice todecide about whether to proceed with value addition in traditional grains.
Chapter 15, Role of Food Product Development in Increased FoodConsumption and Value Addition, prepared by Sharif et al., concludes theimpact of novel technologies to obtain new, innovative, and value-addedproducts with improved features, such as quality, functionality, packaging,form, and ease of possession. Such products are made to increase revenueand satisfy changing consumers’ demands driven by parameters, such aspopulation growth, lifestyle changes and economic changes, ageingpopulation, and increased awareness about healthy foods.
Alexandru M. Grumezescu
Politehnica University of Bucharest, Bucharest, Romania
Alina M. Holban
University of Bucharest, Bucharest, Romania

C H A P T E R 1
Food Processing for IncreasingConsumption: The Case of LegumesGeetanjali Kaushik*
Poonam Singhal**
Shivani Chaturvedi** * Mahatma Gandhi Mission’s Jawaharlal Nehru Engineering College, Aurangabad, Maharashtra, India ** Indian Institute of Technology Delhi, New Delhi, Delhi, India
AbstractFood is a basic necessity of life. However, over the past few decades food quality and safety issues have caused seriousconcern among consumers on account of their direct association with human health. Unsafe food poses serious risk to thehealth of consumers, particularly in the developing countries where food contamination is high on account ofindiscriminate use of food contaminants and food protectants. The presence of harmful antinutrients and pesticide residuesin legumes limits the bioavailability of the essential nutrients. Organic farming and other approaches are effective indealing with pesticide contamination, but it would take significant time for them to be adopted worldwide. Therefore, asimple, as well as effective solution in the transitional phase is offered by domestic processing techniques. Domestic foodprocessing methods, such as washing, cooking, milling, parboiling, and storage, may provide a simple and effectivesolution in this context. The nature of the processing operation (viz., physical, chemical, or thermal) plays an importantrole in this; usually, the processes that utilize the higher temperatures have greater effects on dissipation of antinutrientsand pesticide residues. It is concluded that a combination of processing techniques renders food grains safe for humanconsumption.
Keywords
food safetyantinutrientspesticideshuman healthprocessing techniques
1. Food Legumes: A Boon to Human NutritionLegumes are important sources of protein for the human diet (Kaushik et al., 2010;Tharanathan and Mahadevamma, 2003). There are more than 13,000 species of legumes, but

only 20 are eaten by mankind. The major legumes used as foods include peas, beans, lentils,peanuts, and soybeans. The structure of peas and beans consists of a seed coat (hull),hypocotyl–radicle axis, plummule, and two cotyledons. The seed coat works as a protectivebarrier during storage and handling. The most consumed varieties of legumes include chickpeas(Cicer arietinum), peas (field or smooth pea and wrinkled pea), broad beans (Vicia faba or fieldbean), lentils (Lens esculenta), and beans (Phaseolus vulgaris, Phaseolus lunatus, Phaseolusaureus, and Phaseolus mungo) (Fabbri and Crosby, 2016). The nutritional composition oflegumes can provide a high proportion of proteins, fats, carbohydrates, dietary fibers, B-groupvitamins (thiamin, riboflavin, and niacin), and minerals (Prodanov et al., 2004). Thiscomposition can vary according to cultivar, location of growth, climate, environmental factors,and soil type in which legumes are grown (Satya et al., 2010). Starch is the major constituent ofavailable carbohydrates of peas and beans. Lipids consist primarily of triacylglycerol plus di-and monoacyglycerol, free fatty acids, sterols, sterol esters, phospholipids, and glycolipids.Peas and beans are very poor sources of fat-soluble vitamins and rich sources of water-solublevitamins, as well as excellent sources of minerals, such as calcium, phosphorus, potassium,sodium, manganese, iron, magnesium, copper, cobalt, sulfur, zinc, and fluorine (Karmas andHarris, 1988). In some countries, various terms are often substituted for “legume.” The term“pulse” is commonly used for legumes having a low-fat content, such as beans, broad beans,peas, and lentils. Soybeans and peanuts are sometimes referred to as leguminous oil seeds(Kaushik et al., 2010).
Legumes form the main sources of human and animal nutrition, especially in developingcountries because of their high nutritive value (Tharanathan and Mahadevamma, 2003). Theyare increasingly being used in therapeutic formulations in the treatment and prevention ofdiabetes, cardiovascular diseases, and cancer of the colon (Singhal et al., 2014).
Nevertheless, apart from having high nutritional value, plant foods are often associated witha series of compounds known as antinutrients, which generally interfere with the assimilationof some nutrients. The effects of these substances may be regarded as positive, negative, orboth. In some cases, these can cause undesirable physiological effects, such as flatulence andhence can prove to be toxic (Kaushik et al., 2010). However, recent epidemiological studieshave demonstrated that many antinutrients may be beneficial in the prevention of diseases, suchas cancer and coronary diseases (Messina, 2014). For this reason they are now termednonnutritive or bioactive compounds, as they are not always harmful even if they may lacknutritive value (Muzquiz et al., 2000). Several antinutritional factors (ANFs), such as α-galactosides, trypsin and chymotrypsin inhibitors, phytates, lectins, and polyphenols (Satya et al., 2010; Srivastava and Srivastava, 2003), impede the availability of nutrients(Fereidoon, 2014).
2. Antinutrients in Legumes and Their RemovalANFs are chemical compounds present naturally in food and/or feedstuffs of plant origin andcan interfere with the optimum utilization or metabolism of nutrients (Gemede and Ratta, 2014; Soetan and Oyewole, 2009). These are also known as “secondary metabolites” in plantsand are highly biologically active. One major factor that restricts the wider utilization of manytropical plants as food is the presence of these ANFs, which are capable of producingdeleterious health consequences in man and animals (Shanthakumari et al., 2008; Singh et al.,

2015; Ugwu and Oranye, 2006). These are the compounds evolved by plants for their owndefense through metabolism and other biological functions. Hence they reduce the maximumutilization of nutrients, especially proteins, vitamins, and minerals, thus preventing optimalexploitation of the nutrients present in a food and decreasing the nutritive value. These ANFscan be divided into protein and nonprotein types. Nonprotein ANFs include alkaloids, tannins,phytic acid, saponins, and phenolics, while protein ANFs include trypsin inhibitors,chymotrypsin inhibitors, lectins, and antifungal peptides (Fereidoon, 2014).
2.1. Enzyme InhibitorsEnzyme inhibitors are proteinaceous compounds present in pulses and inhibit the hydrolases ofenzymes, such as proteases, amylases, lipases, glycosidases, and phosphatases. These caneasily be denatured and inactivated by heat treatment.
2.1.1. α-AmylasesThey occur in starch and related compounds, and are endoamylases that catalyze the hydrolysisof α-D-(1,4)-glycosidic linkages playing a major role in the carbohydrate metabolism. Amylaseinhibitors reduce amylase activity and digestion of starch in the gut. This kind of activity isbeneficial in lowering postprandial glucose and thus may also prove to be useful in thetreatments of obesity or diabetes mellitus (Singh et al., 2015).
2.1.2. Trypsin inhibitorsThey cause pancreatic enlargement and growth depression, inhibiting the metabolism of thetrypsin enzyme. Trypsin/chymotrypsin inhibitors from red kidney bean, Brazilian pink bean,lima bean, and soybean are closely related with high homology (Satya et al., 2010).
2.1.3. Protease inhibitorsThey are of two types: (1) Kunitz type, single-chain polypeptides that inhibit the enzymeactivity of only trypsin but not chymotrypsin, and (2) Bowman–Birk inhibitors, which are alsosingle-chain polypeptides but of different molecular weight, and that inhibit the enzymeactivity of both trypsin and chymotrypsin. They interfere with the digestion of trypsin andchymotrypsin in the human digestive tract by irreversible binding. They are resistant to thedigestive enzyme pepsin and the stomach’s acidic pH (Kaushik et al., 2010).
2.2. Cyanogenic GlucosidesThe cyanogenic glycosides are products of secondary metabolism present in the naturalproducts of plants. These compounds are found in various legumes, and C. arietinum is one ofthem (Champ, 2002). Cyanogenic glucosides (α-hydroxynitrile glucosides) are derived fromfive protein amino acids (Val, Ile, Leu, Phe, and Tyr) and from the nonproteinogenic aminoacid cyclopentenyl glycine. A number of plant species produce hydrogen cyanide (HCN) fromcyanogenic glycosides when they are consumed. These cyanogens are glycosides of a sugar,often glucose, which are combined with a cyanide containing aglycone. Cyanogenic glucosidesare classified as phytoanticipins because they defend the plant from herbivore and pathogen

attack, as on hydrolysis they yield toxic hydrocyanic acid (aqueous solution of HCN) (Golden,2009). When the plant product is consumed without proper processing, the cyanide ions inhibitseveral enzyme systems; they depress growth through interference with certain essential aminoacids and utilization of associated nutrients. They also cause acute toxicity, neuropathy, anddeath in extreme cases.
2.3. LectinsLectins are glycoproteins widely distributed in legumes and some oil seeds (includingsoybeans), which possess an affinity for binding with specific sugar molecules and arecharacterized by their ability to combine with carbohydrate membrane receptors(Fereidoon, 2014). Lectins have the capability to directly bind to the intestinal muscosa,interacting with the enterocytes and interfering with the absorption and transportation of 0.01%free gossypol within some low-gossypol cotton nutrients (particularly carbohydrates) duringdigestion and causing epithelial lesions within the intestine. Although lectins are heat labile,their stability varies between different plant species. Many lectins, being resistant toinactivation by dry heat, require moist heat for complete destruction (Boehm and Huck, 2009).They function both as allergens and as hemagglutinins (agglutinate red blood cells) and arepresent in small amounts in whole-grain food. Lectins have also shown in vivo effects whenconsumed in excess by sensitive individuals, causing severe intestinal damage, disrupteddigestion, and nutrient deficiencies. They can provoke IgG and IgM antibodies, causing foodallergies and other immune responses (Boehm and Huck, 2009), and they can bind toerythrocytes, simultaneously with immune factors, causing hemagglutination and anemia. Ofthe 119 known dietary lectins, about half are panhemagglutinins, clumping all blood types.
2.4. TanninsTannins are polyphenolic compounds of intermediate-to-high molecular weight that areastringent and bitter in taste that either bind or precipitate proteins and various other organiccompounds, including amino acids and alkaloids (Redden et al., 2005). They are divided intotwo groups based on their ability to fractionate hydrolytically (with acid, alkali, hot water, orenzymatic action): (1) hydrolyzable tannins (including gallotannins and ellagitannins) moreresponsible for the color of legume seed coats as in chickpeas or (2) condensed tannins.Tannins are heat stable, and they decrease protein digestibility in animals and humans, probablyby either making partially unavailable or inhibiting digestive enzymes and increasing fecalnitrogen. Tannins are known to be present in food products; inhibit the activities of trypsin,chymotrypsin, amylase, and lipase; decrease the protein quality of foods; and interfere withdietary iron absorption (Felix and Mello, 2000). The condensed tannins (proanthocyanidins) areknown to bind enzymes and other proteins and to form insoluble tannin–protein complexes thatare not readily digestible. Due to this, tannin becomes astringent (in tea and some vegetablesand fruits) and thus decreases the palatability. Tannins are known to be responsible fordecreased feed intake, growth rate, feed efficiency, and protein digestibility in experimentalanimals. If tannin concentration in the diet becomes too high, microbial enzyme activities,including cellulose and intestinal digestion, may be depressed. Tannins also form insoluble

complexes with proteins, and the tannin–protein complexes may be responsible for theantinutritional effects of tannin-containing foods (Kyriazakis and Whittenmore, 2006).
2.5. OxalatesOxalates bind minerals, such as calcium and magnesium, and interfere with their metabolism.The insoluble calcium oxalate has the tendency to precipitate (or solidify) in the urinary tractand form calcium oxalate crystals with sharp edges, leading to the formation of kidney stoneswhen the levels are high enough (Nachbar et al., 2000). Oxalate is an antinutrient that undernormal conditions is confined to separate compartments, but when it is processed and/ordigested it comes into contact with the nutrients in the gastrointestinal tract (Noonan andSavage, 1999). When released, it binds with nutrients, rendering them unavailable to the body.If food with excessive amounts of oxalic acid is consumed regularly, nutritional deficiencies, aswell as severe irritation to the lining of the gut, are likely to occur (Liebman and Al-Wahsh,2011).
2.6. PhytatesPhytates, also known as inositol hexakisphosphates (InsP6), are the salt form of phytic acid,and are found in plants, animals, and soil. Phytic acid is a major phosphorus storage form inplants, and it regulates various cellular functions, such as DNA repair, chromatin remodeling,endocytosis, nuclear messenger RNA export, and potentially hormone signaling that isimportant for plant and seed development. The most abundant InsP6 accounts for 77% inchickpeas (Campos-Vega et al., 2009). It has a high ability to chelate multivalent metal ions,especially Zn, Ca, and Fe, forming insoluble complexes and making them unavailable forabsorption and utilization in the small intestine (Gemede, 2014; Jukanti et al., 2012).
Phytic acid also makes complexes with proteins, decreasing protein solubility and thereforeits presence in food; this has a negative impact on enzyme activity, such as lipase, α-amylase,pepsin, trypsin, and chymotrypsin. It also binds with starch through phosphate linkages.However, it also exhibits a beneficial role in anticancer (preventive, as well as therapeutic)properties. It reduces cell proliferation and increases differentiation of malignant cells. It alsodelays postprandial glucose absorption (Campos-Vega et al., 2009).
2.7. SaponinsSaponins are secondary compounds that are generally nonvolatile and surface active; they arewidely distributed in nature, occurring primarily in the plant origin. The name “saponin” isderived from the Latin word sapo, which means “soap,” because saponin molecules form soap-like foams when shaken with water. They are structurally diverse molecules that are chemicallyreferred to as triterpene and steroid glycosides. They consist of nonpolar aglycones coupledwith one or more monosaccharide moieties. This combination of polar and nonpolar structuralelements in their molecules explains their soap-like behavior in aqueous solutions.
Due to the presence of one or more lipid-soluble aglycone and water-soluble sugar chains intheir structure (amphiphilic nature), saponins are surface-active compounds with detergent,wetting, emulsifying, and foaming properties and have found wide applications in beverages

and confectionery, as well as in cosmetics and pharmaceutical products (Shanthakumariet al., 2008). Saponins were treated as toxic compounds to fish and cold-blooded animalspossessing strong hemolytic activity. In high concentrations, saponins impart a bitter taste andastringency in dietary plants. The bitter taste of saponin is the major factor that limits its use. Inthe past, saponins were recognized as antinutrient constituents, due to their adverse effects,such as growth impairment and throat-irritating activity due to their bitterness. In addition, theyalso reduce the bioavailability of nutrients by inhibiting various digestive enzymes, such astrypsin and chymotrypsin (Liener, 2003). Recent studies suggest that legume saponins maypossess anticancer activity and be beneficial for hyperlipidemia. They are also known to reducethe risk of heart diseases in humans (Campos-Vega, 2009).
2.8. AlkaloidsAlkaloids are diverse compounds that consist of a heterocycle with a nitrogen atom within thecycle. They are mainly present in lupins (Champ, 2002). Alkaloids cause gastrointestinal andneurological disorders. They are also reported to cause fetal malformation, and some plantalkaloids are reported to cause infertility (Soetan and Oyewole, 2009).
Alkaloids are one of the largest groups of chemical compounds synthesized by plants andgenerally are found as salts of plant acids, such as oxalic, malic, tartaric, or citric acid. They aresynthesized by plants from amino acids (Felix and Mello, 2000).
Alkaloids are considered to be antinutrients because they cause gastrointestinal andneurological disorders. For instance, consumption of high tropane alkaloids will cause rapidheartbeat and paralysis, and, in fatal cases, lead to death (Fernando et al., 2012).
3. Processing Techniques to Reduce AntinutritionalFactorsProcessing techniques bring about changes in the biochemical, nutritional, and sensorycharacteristics in legumes that enhance their nutritional value by increasing essential aminoacids, protein digestibility, amino acid availability, and certain B vitamins. The nutritionalprofile of legumes is generally improved from approximately 40% up to 98% (El-Adawy,2002). It also proves beneficial in reducing some antinutritional compounds that otherwisewould cause interference in the metabolism of certain essential nutrients. Most ANFs can beeasily destroyed with heat, such as α-galactosides, protease inhibitors, and lectins, so cookingwould eliminate the ill effects of these nonnutrient compounds before consumption. Tannins,saponins, and phytic acids are more heat stable, but can be reduced by dehulling, soaking, orgermination (Schoeninger et al., 2014). Various processing techniques used as a tool forreducing the ANFs are listed in Table 1.1.

Table 1.1
Processing techniques for reducing antinutritional factors (ANFs).
S.No.
ProcessingTechniques
DetailedMethods
Effects onAntinutrients Reasons References
1. Soaking Soaking 12 h Phytic acid contentshowed loss of20% due tosoaking
El-Tinay et al.(1989)
Soaking for 9 h Decreases in α-galactosides;27% (distilledwater), 17%(citricacid),16%(NaHCO3)
Frias et al. (2000)
2. Boiling 19 h soakingfollowed by 90-min boiling
Decrease amountingto 99% in phyticacid and 82.27%in TIA
The losses in vitamins wereprobably due to a combinationof leaching and chemicaldestruction
Alajaji and El-Adawy(2006)
4 h soakingfollowed by 90-min boiling
Decreases in TIA,tannins, andphytatesamounted to 36,30, and 23%
Sharma (2006)
12 h soaked seedswere cooked
Possible hydrolysis of starch andoligosaccharides tomonosaccharides on cookingresulting in increasedconcentration of sugars incooked legumes; cooking maycause rupturing of starchgranules followed byamylolysis that leads to adecreased amount of starch
Jood et al. (1988)
Soaking (9 h) incitric acid,distilled water,or 0.07%sodiumbicarbonatesolutionfollowed byboiling for35 min
Losses in αgalactosides
Completeeliminationof TIA
Frias et al.(2000)
Prodanovet al.(2004)
Soaking (12 h)followed byboiling in waterfor 60 min
30% loss in phyticacid
El-Tinay et al.(1989)

S.No.
ProcessingTechniques
DetailedMethods
Effects onAntinutrients Reasons References
Soaking in 0.03%EDTA for 16 hfollowed bycooking(40 minchickpeas)
Reduction inphytic acid53%chickpeas
Reduction inTIA 68%chickpeas
Greater reduction in phytic acid inchickpeas as these wereprocessed without skin;decrease in phytic acid due toleaching during soaking andcooking; thermal treatment waseffective in reducing TIAcontent
Estevez et al.(1991)
Cooking chickpeasin water
Trypsin inhibitors, tannins, andoligosaccharide contents wereobserved to be reduced
Wang et al.(2010)
3. Pressurecooking
Pressure cooking(120°C/5 min)
Polyphenol contentreduced by 50%
Clemente et al.(1998)
12 h soakedfollowed byautoclaving(121°C/35 min)
41% reductionin phyticacid, 50%reduction intannins
84% reductionin TIA
The losses in vitamins wereprobably due to a combinationof leaching and chemicaldestruction
Alajaji and El-Adawy(2006)
4 h soakingfollowed bypressurecooking for20 min
Decreases in TIA,tannins, andphytatesamounted to 58,63, and 18%
Sharma (2006)
4. Microwavecooking
12 h soakingfollowed bymicrowavecooking on highfor 15 min
Reduction in TIAby 81%, tannins49%, and phyticacid 38%
The increase in crude fiber due toprotein–fiber complexesformed after chemicalmodification induced bysoaking and cooking of dryseeds; improvement in vitaminretention in microwave-cookedseeds due to shorter cookingtime compared to boiling andautoclaving
Alajaji and El-Adawy(2006);Bressani(1993)
5. Germination 72-h germination Completeelimination ofraffinose andstachyose
Tewari (2002)
12-h soakingfollowed bygermination for3 days
Phytic acid reducedby 56% and TIAby 34%
The reductions were due tohydrolysis of these componentsto monosaccharides that areused as an energy sourceduring germination; theincrease in crude protein wasdue to use of seed componentsand degradation of protein tosimple peptides duringgermination; the reduction inphytic acid was due to phytaseactivity during the process
El-Adawy (2002)

S.No.
ProcessingTechniques
DetailedMethods
Effects onAntinutrients Reasons References
12-h soakingfollowed bygermination for2 days
Decreases in TIA,tannins, andphytateamounted to 62,23, and 45%
Sharma (2006)
Seeds were soakedfor 24 h andthen germinatedfor 0, 24, 48,72, and 96 h
Germination timeup to 48 hsignificantlyreduced thephytic acidcontent from1.01% to 0.6%and phenolsdecreased after120-hgermination
There is an increase of phytaseactivities, which makes thephytates soluble and releasessoluble protein and minerals
Khattak et al.(2007)
Seeds wereexposed to heattreatment andthen germinated
The amylaseinhibitor activitydecreased withincreasinggerminationdays andbecamenegligible onthe 6th day
6. Irradiation Chickpeas wereexposed toirradiation(dose levels of5, 7.5, and10 kGy)
Reduced levels ofphytic acid andtannins
El-Niely (2007)
Seeds wereirradiated(0.05–0.20 kGy)followinggermination
Maximumdestruction(43.8%) of TIAoccurred ongermination for120 h of 0.20-kGy sample
Sattar et al.(1989)
Seeds wereexposed toirradiation andsoaked atambienttemperatures(25–35°C)
Maximum decrease(30.7%) in TIAoccurred duringsoaking for 12 hof 1.00-kGysample
Sattar et al.(1989)

S.No.
ProcessingTechniques
DetailedMethods
Effects onAntinutrients Reasons References
7. Dehydration Seeds were soakedfor 16 h at 20°Cand cooked byboiling for70 min; soaked-cooked seedsweredehydrated in aforced-airtunnel at75 ± 3°C for6 h
A decline of phyticacid wasobserved duringdehydrationprocess
8. Roasting Seeds were roastedon sand bath at180°C for20 min
Decrease inpolyphenolcontent from315.9 mg/100 gin raw to218 mg/100 g inroasted seeds
Daur et al. (2008)
EDTA, ethylenediaminetetraacetic acid; TIA, trypsin inhibitor activity.
Legumes were usually processed by two ways: nonheat or heat processing.
3.1. Nonheat Processing3.1.1. SoakingThis is the first step, followed by a number of subsequent treatments, such as cooking,germination, and fermentation. It consists of hydrating the seeds in water, usually until theyreach maximum weight. The medium in which they are hydrated can be discarded or retained,depending on the subsequent procedure. Several studies indicate that soaking can reduce thelevels of total sugars, α-galactosides, minerals, phytic acid, and proteolytic enzyme inhibitorsdue to metabolic processes taking place that usually affect the soluble carbohydrate metabolicprocesses and riboflavin contents (Satya et al., 2010).
3.1.2. Germination/sproutingGerminated legumes are consumed in many parts of the world owing to their enhancednutritional value. Germination causes important changes in the biochemical, nutritional, andsensory characteristics of legumes. It is generally carried out by soaking the legume seeds inwater. The water is drained out, and the soaked seeds are then tied in a muslin cloth and hungfor 1–2 days, depending upon the ambient temperature. The legume seeds are left as such torespire and synthesize new cell constituents of the developing embryo during germination(Schoeninger et al., 2014; Vidal-Valverde et al., 2002). Germination/sprouting has beenreported to increase certain vitamins and minerals and the availability of proteins and todecrease certain antinutrients, such as phytic acid and trypsin inhibitor.
3.1.3. Fermentation

It improves the flavor, color, and texture of legumes. The process increases the digestibility ofplant proteins and reduces the ANFs, such as phytate. Fermented legumes are consumed ascondiments, such as fermented locust bean (Subuola et al., 2012).
3.2. Heat Processes3.2.1. CookingCooking is probably the oldest treatment for making legumes edible. Usually it includes a priorsoaking of the seeds and subsequent cooking in boiling water until they become tender.Addition of mineral salts to the soaking and/or cooking medium can produce a reduction in thecooking time. In general, cooking brings about denaturation of proteins, inactivation of heat-sensitive factors, such as trypsin inhibitors, and decreases of phytic acid and α-galactosidecontents. Generally the legumes are cooked in tap water on a hot plate or cooking stove for 15–120 min or more until they become tender. This is the most common practice in rural habitats.Food legumes are often cooked in a pressure cooker involving both high temperature and highpressure to save time in urban settings. This enhances the digestibility and palatability oflegumes considerably (Lemos et al., 2015; Satya et al., 2010).
3.2.2. RoastingRoasting of legumes is done in an open frying pan in the presence or absence of salts or ash.Roasting improves the taste and flavor of legumes and thus increases their sensory appeal. Italso helps in reducing and eliminating ANFs (Subuola et al., 2012).
3.3. Modern Methods, Including Radiation-BasedTechnology3.3.1. Microwave cookingIt is a popular means of cooking in urban areas for saving both energy and time. This form ofcooking is even faster than pressure cooking, but in developing countries it is limited to thehigher strata of society due to the high cost of the microwave oven and the requirement ofelectricity for it to work. Presoaked legumes are immersed in water and then cooked in amicrowave oven for 4–10 min until tender. As a result of cooking, there is an overall asignificant decrease in fat, total ash, carbohydrate fractions (decrease in reducing sugars,sucrose, raffinose, and stachyose, while verbascose is completely eliminated after cookingtreatments), and ANFs (trypsin inhibitor, tannins, saponins, and phytic acid) (Bongoni et al., 2014; Satya et al., 2010).
3.3.2. IrradiationThis process involves exposing food to ionizing radiations, such as gamma rays emitted fromradioisotopes 60 Co and 137 Cs, or high-energy electrons and X-rays produced by machinesources. Gamma irradiation has been recognized as a reliable and safe method for improvingthe inactivation of certain ANFs in foods (Taghinejad et al., 2009).

It is clear from the Table 1.1 that heat, as well as nonheat treatments, such as soaking,boiling, and microwave cooking, help in reduction of the ANF of legumes. Losses inantinutrients are directly proportional to the duration of treatment and their structure. Forexample, lentils with a soft seed coat require a smaller cooking time than those with a hard seedcoat.
Soaking results in a decrease in phytic acid due to leaching (El-Tinay et al., 1989). In arecent study it also resulted in decreases in α-galactosides (Frias et al., 2000). Thermaltreatment, such as cooking is effective in reducing the trypsin inhibitor activity (TIA) content,phytic acid, and tannins. Cooking treatment has been accompanied by soaking seeds for aspecific duration and then subjecting them to boiling for different periods of duration bydifferent researchers. Pressure cooking also resulted in the decrease of the TIA content, phyticacid, and tannins and was performed on presoaked seeds for different durations. Microwavecooking resulted in a faster degradation of antinutrients as compared to simple cooking andpressure cooking. The losses are mainly due to leaching and destruction of the biggermolecules. Germination also leads to reduction of the ANFs. Increase in phytase activity duringgermination is responsible for decrease in phytic acid content. Decrease in TIA could be due totheir utilization as source of energy during early stages of germination. Loss of tannins iscaused by leaching into soak water and is a result of enzymatic hydrolysis by polyphenolaseduring germination. Irradiation also brought a reduction in the tannins, TIA, and phytic acidwhen seeds were exposed to different levels of a radiation dose. Roasting seeds on a sand bathat 180°C for 20 min also reduced the polyphenol content (Daur et al., 2008).
4. Food Safety and Quality IssuesIn the past few decades safety and quality issues associated with food have receivedconsiderable attention from consumers owing to their serious impacts on human health.Recently the incidences of food contamination with harmful pesticide residues, preservatives,synthetic colors, toxins, and the like have increased and have caused significant mortality andmorbidity in populations, especially in the developing countries. Therefore, against thisbackground it is important to discuss the concept of food safety (Anzene et al., 2014).
“Food safety” refers to a complete absence of or acceptable, as well as safe levels ofcontaminants or adulterants, which are either naturally prevalent toxins or other syntheticsubstances that might make the food harmful for health in an acute or chronic manner. Foodsafety hence is associated with the presence of microbiological elements and differentchemicals in food. Within the microbiological elements are included foodborne pathogens, suchas Salmonella, Escherichia coli O157, Campylobacter, protozoa, Cryptosporidium, rotavirus,and the fungal mycotoxins that result in instances of food poisoning. Chemical foodcontaminants include the heavy metals (such as Hg and Pb), residues of pesticides, and thedifferent food preservatives, as well as synthetic colors. In addition, food may contain othercontaminants, such as genetically modified organisms and veterinary residues (Sharma, 2006).Widespread food contamination with harmful chemicals and toxins has highlighted theimportance of safe food products that have high nutritional value (Peri, 2006; Satya et al., 2010). Unintended food contamination may occur as a result of direct exposure (e.g., pesticideapplication for pest control at various stages in crop production) or indirect exposure (e.g.,utilization of pesticides or chemicals while in storage or during food processing) to toxic

chemical compounds (Bai et al., 2006). Therefore, a sustainable alternative to this currentsituation of unsafe, as well as inferior-quality, food is presented by a paradigm shift within ourmind-set (Malinowska et al., 2015; Satya et al., 2007).
5. Significance of Paradigm ShiftFrom the various dietary surveys it is evident that cereal and legume grains form a majorproportion of the diet of a majority of the population of developing nations. Cereals usuallylack an essential amino acid, lysine; however, they are rich in sulfur-containing amino acids,whereas legumes are a rich source of lysine but are poor in sulfur-containing amino acids.Clearly the cereals and legumes exhibit nutritionally complementary behavior toward eachother. Hence, the combination diet comprising around 65% cereals and 35% legumes would beideal with regard to nutrition. This kind of supplementation enhances the overall nutritive statusand also helps in dealing with protein–energy malnutrition (PEM), which is widely prevalent inthese countries. Legumes having high dietary fiber have the benefits of lowering the glycemicindex in diabetics, offering prevention from cancer, and providing protection againstcardiovascular diseases (Kaushik et al., 2010; Satya et al., 2010). Indiscriminate and rampantuse of chemical fertilizers and pesticides—the two inseparable yet key components of themodern system of agriculture (termed the green revolution)—are mainly responsible for thecontamination of the “soil–water–food” matrix. It is evident that modern agriculture clearly hasproven to be unsustainable across all fronts (such as, environment, energy, health,socioeconomic aspects, etc).
In the case of India, agriculture is a way to sustain life and not just business to earn income;therefore, it solicits a holistic perspective in the search for a pragmatic but sustainable solution.The alternatives should be able to clearly explain the intrinsic interrelationships between manand nature. In view of these concerns, several alternative agriculture systems that are moresustainable, such as permaculture, organic farming, and so on (Arya, 1995), have beenpromoted worldwide. Pesticide residues contaminating food grains are a grave threat to foodsafety. Since pesticide contamination has serious consequences for both the environment andhuman health, it is pertinent to understand the pattern of pesticide consumption, variouspathways of intake, and the adverse environmental impacts.
6. Pesticides: Types, Application, EnvironmentalImpacts, and Human Health Effects6.1. Pesticides: Types and ApplicationChemical pesticides have increased agricultural yields by controlling pests and diseases inplants and have contributed toward better human health and longevity by checking variousinsectborne, diseases, such as malaria, encephalitis, filariasis, and dengue, among others(Rekha et al., 2006). It is necessary to increase food production because of the rapidly growingworld population (Agoramoorthy, 2008). One key strategy to increase crop productivity isthrough effective pest management, as almost 25%–30% of produce is attacked by pests(Kaushik et al., 2009). In tropical countries, various pesticides are inevitably applied on cropplants for combating pests and vectorborne diseases, as severe crop losses occur due to the high

temperature and humidity providing a favorable environment for rapid pest propagation(Abhilash and Singh, 2009; Kannan et al., 1992; Malinowska et al., 2015).
The major classes of pesticides that are commonly used in crop production includeorganophosphates (such as malathion and chlorpyrifos), organochlorines (lindane, endosulfan,aldrin, and dieldrin), the synthetic pyrethroids (cypermethrin, deltamethrin, and bifenthrin), andfinally the carbamates (bendiocarb and carbaryl) (Raghvani and Poshiya, 2006). For the storageof grains, mainly pyrethroids (cypermethrin, deltamethrin, and bioresmethrin) andorganophosphates (malathion and chlorpyrifos) are used (Athanassiou et al., 2004; Lal andDikshit, 2000; Lalah and Wandiga, 2002; Mada et al., 2014; Malinowska et al., 2015).
6.2. Environmental Impacts of PesticidesThe widespread use of synthetic pesticides has resulted in significant consequences not justwith regard to public health but also for food quality, leading to an impact on our environmentand thus the development of pest resistance. The rampant and indiscriminate use of thesepesticides not only increases the cost of crop production, but also leads to adverseenvironmental, as well as health, consequences. Inappropriate pesticide application affects theentire ecosystem, as the residues enter the food chain and also pollute the air, soil, groundwater,and surface water (Agnihotri, 1999; Mada and Hussein, 2013; UN/DESA, 2002).
Pesticide pollution in the local environment also adversely affects the health and survival ofwildlife, birds, domestic animals, livestock, and fish. Another adverse impact of application ofunprescribed pesticides often in inappropriate doses not only disturbs the soil conditions, butalso destroys the healthy reservoir of natural biocontrol agents that usually coexist along withthe vegetation. These agents are the best friends of agriculture and therefore need to becarefully nurtured, cared for, and also developed by minimizing reliance on the use ofagrochemicals within agriculture (GoI, 2008; Malinowska et al., 2015).
6.3. Health Impacts of PesticidesHumans are exposed to pesticides (found in environmental mediums, such as soil, water, air,and food) by different routes of exposure, such as inhalation, ingestion, and dermal contact(Rekha et al., 2006). Exposure to pesticides results in acute and chronic health problems.Pesticides used in agriculture remain in the environment and come into human contact directlyor indirectly (Bhatnagar, 2001). Increasing incidences of cancer, chronic kidney diseases,suppression of the immune system, sterility among males and females, endocrine disorders, andneurological and behavioral disorders, especially among children, have been attributed tochronic pesticide poisoning. The intensity of health hazards varies with the extent of exposure.Moderate human health hazards from the nonjudicious application of pesticides include mildheadache, flu, skin rashes, blurred vision, and other neurological disorders, whereas rare butsevere human health hazards include paralysis, blindness, and even death (Agnihotri, 1999).
6.4. Not-to-Be-Used PesticidesOrganochlorine insecticides, such as DDT, hexachlorocyclohexane (HCH), aldrin, and dieldrin,are among the most commonly used pesticides in the developing countries of Asia because of

their low cost and versatility against various pests (Gupta, 2004). Nevertheless, because of theirpotential for bioaccumulation and biological effects, these compounds were banned indeveloped nations almost 2.5 decades ago (Rotterdam Convention, 2004). Their resistance todegradation has resulted in contamination universally found in many environmental segments.Such residues may consist of many substances, which include any specified derivatives, such asdegradation products, metabolites, and congeners that are considered to be of toxicologicalsignificance.
According to the Food and Agriculture Organization (FAO) inventory (FAO, 2001), morethan 500,000 tons of unused and obsolete pesticides are fatal to the environment and publichealth in many countries. Public concern over pesticide residues has been increasing during thepast decade. Recovering from the euphoria of the green revolution, India is also now battlingthe residual effects of extensively used chemical pesticides, such as HCH, DDT, endosulfan,and phorate, especially in the groundwater and food matrix (Abhilash and Singh, 2009;Agoramoorthy, 2008; Rekha et al., 2006). Hence, on account of their widespread usage in cropprotection and their persistence in the environment, the presence of pesticide residues in foodcannot be ruled out.
6.5. Pesticide Residues in FoodAs previously mentioned, pesticides are chemical substances extensively used across the worldin agriculture and public health. Indiscriminate usage of pesticides, along with their highbiological activity and also their persistence in some cases, might result in the presence ofpesticide residues within food and feed, as well as dairy products. The widespreadorganochlorine contamination has been a result of the insecticides’ direct application or moreon account of their industrial emissions in the environment (Abou-Arab, 2002). In India mostof the tested edible grain samples revealed the presence of DDT residues even in the year 1966at Pantnagar in Uttarakhand (Tripathi, 1966). Ever since then, several reports have confirmedextensive pesticide contamination within food (Agnihotri, 1999).
An important study carried out by the Indian Council for Agricultural Research (ICAR)found that market samples belonging to wheat grains and pulses were greatly contaminatedwith pesticides, such as β-hexachlorocyclohexane (BHC) (63 ppm) and DDT (83 ppm) (ICAR,1967). In a similar manner it was reported that the seed grains of bajra, maize, sorghum, andwheat showed alarmingly high levels of the pesticides BHC, captan, and DDT (Majumdar,1973). It may therefore be concluded that grains kept in storage may get polluted withpesticides, as they are left in stockpiles that are periodically sprayed with pesticides forcontrolling pest infestation. A comprehensive review concerning pesticide residues present ingrains almost 91% of wheat samples investigated by the US Food and Drug Administration(FDA) revealed pesticide contamination (Haas, 1997; Ogah et al., 2012). Even commodities,such as wheat flour have shown the presence of residues. During the storage of contaminatedgrains the pesticide dissipation has been found to be low. Even after long storage duration thegrains chemically treated with pesticides showed the presence of bound residues in them. Theirpresence might contribute toward dietary intake of the harmful pesticides (Lalah and Wandiga,2002). Food contamination with pesticides, particularly in the legume grains, has been reported.The large-scale contamination of pulses is a result of extensive pesticide application for

controlling pests, as pulses are highly vulnerable to pest attack beginning with crop productionand continuing to its storage (Lozowicka et al., 2014; Sharma, 2006).
With regard to the discussed hazards associated with chemical pesticides, it is important toassess simple but cost-effective strategies for enhancing food safety from the harmful pesticidesfor poor populaces. The processing of food at both the domestic level, as well as the industriallevel, might offer a feasible means for tackling the present situation of unsafe food.
6.6. Sustainable Methodology for Food Safety Within theTransitional PhaseAlternative systems of agriculture, such as biodynamic agriculture, organic farming, pesticide-free farming, permaculture, and others (Satya et al., 2007), have been reported as sustainable,as well as pragmatic, solutions for tackling food safety and quality issues the world over.Hence, simple and economical solutions for satisfying the aforementioned concerns within thetransitional phase are urgently warranted.
The provision of sufficient nutrients or good-quality proteins from animal sources is difficultand costly and might not be acceptable in some sociocultural scenarios. Therefore, it isimperative to provide an alternative source of proteins from plants for improving the nutritivestatus of the population. Food legumes are a significant part of our vegetarian diet owing totheir high nutritional value. However, various antinutrients, such as phytic acid, trypsin,chymotrypsin inhibitors, and lectins, interfere with the nutrients’ availability and therefore limitlegume consumption. However, processing is an effective means for enhancing the nutritionalvalue of legumes through the reduction of antinutrient content and improvement of protein andstarch digestibility (Prodanov et al., 2004). In a similar manner, domestic processing might behelpful in pesticide residue dissipation within the raw food (Abou-Arab, 1999; Kaushiket al., 2010).
6.7. Domestic Processing Techniques and Food Safety(Pesticide Residues)Pesticides (insecticides, rodenticides, fungicides, etc.) are globally used for food protection anddefense of human habitats from insect or other pest infestation. However, the overuse or misuseof these synthetic chemicals, particularly within developing countries, along with their volatilenature and transport for long distances, ultimately results in extensive environmentalcontamination. Further, many older, often nonpatented pesticide formulations with potentiallygreater toxicity and environmental persistence, being inexpensive, have more widespread use inthe developing countries (Lozowicka et al., 2014). The application of such chemicals createsserious health problems along with the local, as well as worldwide environmental impacts(Ecobichon, 2001).
In addition, though noteworthy progress has been undertaken in the development of morepotent pesticides, the fact is that actually a very small portion of the applied pesticides isprecisely involved within the pesticidal mechanism. This means that a majority of thepesticides that are applied become “residues” in the environment and ultimately enter withinthe terrestrial, as well as the aquatic food chains, wherein they are accumulated, thereby

exerting potentially adverse health effects over a long term (Guler et al., 2010; Winteringham,1971).
6.8. Food ProcessingFood processing at both the household level and the industrial level offers an effective meansfor tackling the present situation of unsafe food. Food-processing techniques are a set ofprocedures and techniques that are used for transforming raw constituents into food or fortransforming food into various other forms intended for human or animal consumption either atthe household level or at the industrial level (Kaushik et al., 2009). Unit operations that areusually utilized in the processing of food crops decrease or completely remove the insecticideor pesticide residues present in them. These processing operations, such as washing, peeling,juicing, blanching, parboiling, cooking, and so on, play a significant role in pesticide residuereduction (Elkins, 1989). Every operation bears a cumulative impact on the dissipation of thepesticides residues (Dos Reis et al., 2015; Geisman et al., 1975).
Washing is capable of removing loose residues that are superficial. It also removes majorquantities of polar compounds, such as the pesticide carbaryl. Hot-water blanching enhancesthe elimination of pesticides and also might hydrolyze significant nonpersistent fractions(Farrow et al., 1969). Data have been compiled on the basis of studies reported in the literature.Table 1.2 presents a summary of the effects of chosen domestic-level processing techniques onthe harmful pesticide residue dissipation in food grains.

Table 1.2
Effect of household processing on pesticide residue dissipation in grains.
S.No. Processing Commodities Pesticides
ResidueDissipation(%) Reasons References
1. Bread making Wheat flour EndosulfanDeltamethrinMalathionPropiconazoleChlorpyrifosHexaconazole
706360525146
Bread makinginvolvesyeast-mediatedfermentationand baking,causingpesticidedegradation
Sharma et al.(2006)
2. Milling andstorage for1 year
Wheat Phoxim methyl 8–10 During milling,residuesaccumulationoccurs in branfractions andreduction inwhite flour
Alnaji andKadoum(1979)
3. Milling Whole grain Deltamethrin 42.39 Marei et al. (1995)
4. Milling Wheat Malathion 95 Uygun et al.(2005)
5. Parboiling IR 20 paddy Ekalux 25 EC0.05%
Dursban 25 EC0.05%
Lebaycid 100EC 0.05%
495168
Reduction due toinactivationordegradationof thepesticides athightemperature
KrishnamurthyandSreeramulu(1982)
6. Parboiling Rough rice Malathion 99 Cogburn et al.(1990)

S.No. Processing Commodities Pesticides
ResidueDissipation(%) Reasons References
7. Storage for6 months at26.7°C
WheatMaize
sorghum
Malathion 85% of totalresidueremainedon outsideof grainafter 24 h,residuesincreasedinside thegrain anddecreasedmarkedlyon theoutsideduring thefirst month,andresiduesdisappearedmorerapidlyfrom theoutsidethan fromthe insideduring theremainingstoragetime
Kadoum andLaHue (1974)
8. 12 months ofstorage inan openbasket
Maize grainsBeans
Malathion 6447
High losses duetovolatilizationand possiblesettling ofpesticide dustformulation tothe bottomand on thesides ofbasket duringstorage in theopen andwindytropicallaboratory
Lalah andWandiga(2002)
9. Milling andstorage for4 and 36weeks,respectively
Wheat grain Chlorpyrifosmethyl
EtrimfosFenitrothionMalathionMethacrifosPirimiphos
methyl
2.70.0863.33505032.35
Wilkin andFishwick(1981)

S.No. Processing Commodities Pesticides
ResidueDissipation(%) Reasons References
10. Storage around6 months
Barley Malathion 65–72 Uygun et al.(2007)
11. Cookingwithout andwith NaCl
Maize grainsBeans
Malathion 56.7 and69.7
64.2 and75
Lalah andWandiga(2002)
12. Washing(twice)
Soybeans DichlorvosMalathionChlorpyrifosCaptan
80–90 Sprayedpesticidesremain asmicroparticleson soybeansand are easilyremoved bymechanicalstirring inwater
Miyahara andSaito (1994)
Source: From Kaushik, G., Satya, S., Naik, S.N., 2009. Food processing a tool to pesticide residue dissipation–areview. Food Res. Int. 42 (1), 26–40.
6.9. Cooking Process: Impact on Pesticide ResiduesAs discussed previously, cooking is the activity by which food is prepared for consumptionthrough heat application (either dry heat or moist heat). It involves a wide range of methodsbased on various customs and traditions, ease of resource availability, and affordability.Literature has numerous studies reporting the impact of cooking processes on pesticide residuedissipation within the fruits and vegetables matrix; however, there is a dearth of such studies infood grains (Ferreira et al., 2014; Kaushik et al., 2012).
Mustard samples containing initial concentrations of 0.081–1.3 ppm and 0.020–0.070 ppm offenvalerate and dimethoate, respectively, were boiled in water for 10 min, which reduced thedimethoate concentrations by almost 50% (Watanabe et al., 1988). Maize grains and beansstored for 12 months left residues of 2.79 and 4.10 ppm, respectively. The process of cookingwithout and with the use of NaCl removed about 56.7 and 69.7% of residues from the maizegrains and 64.2 and 75% of residues from the beans, respectively. It was noticed that althoughthe pesticide malathion, as well as its polar metabolites (namely malathion A and malathion Bmonocarboxylic acids) were completely removed by boiling, malaoxon was found to be presentin large concentrations within the extracts of processed beans and maize (Lalah and Wandiga,2002). Elimination of pesticide residues from the boiled extract might be on account ofdegradation through heat and stronger pesticide adsorption onto the plant tissues (Abou-Araband Abou-Donia, 2001; Ali, 1983). Therefore, the processes involving heat reduce the residuelevels through enhanced hydrolysis, volatilization, or other processes of chemical degradation(Holland et al., 1994). It was found that even after 6 months following pesticide treatmentabout 22%–23% of deltamethrin residues existed within the grains. Culinary applications, suchas washing and steaming, were able to dislodge almost 40%–60% of residues from the storedchickpea grains. Steeping grains in water followed by deskinning also reduced the residues to

about 37% but was unable to reduce it to safer levels (Lal and Dikshit, 2000). In a similarstudy, it was revealed that the decontamination processes of washing followed by cookingmade chickpea pods safe from fenpropathrin residues for edible purposes (Ferreira et al., 2014; Kaushik and Handa, 1993).
6.10. Other Processing Methods Resulting in PesticideResidue DissipationOther processing methods, such as bread making, infusion, milling, and washing, have alsobeen investigated as causing significant dissipation of pesticide residues. Commerciallymanufactured bread forms an important part of the daily diet in various countries. Bread ismanufactured from wheat flour spiked with different types of pesticides, such as chlorpyrifos,deltamethrin, endosulfan, hexaconazole, malathion, and propiconazole (spiked atconcentrations in the range of 1–4 ppm). It was reported in one of the studies that at the highestlevel of spiking at 4 ppm, the pesticide is degraded as a result of yeast-mediated fermentationand high-temperature baking. The degradation of pesticides was chlorpyrifos (51%),deltamethrin (63%), endosulfan (70%), hexaconazole (46%), malathion (60%), andpropiconazole (52%) (Sharma et al., 2006).
Milling of grains is a processing step commonly done to make flour and has also been foundto substantially remove the residues. Usually the major portions of residues accumulate withinthe outer layers of the grains; consequently, often the residue levels in bran are significantlyhigher than in wheat (almost 2–6 times). Even for those pesticides that enter the grain bytranslocation, residues are found to be greater in the bran portion than within the flour (Hollandet al., 1994). In laboratory experiments, the application of pirimiphos methyl to wheat grainswas done at concentrations of 7.3 and 14.6 ppm, respectively. At the lower level, residueswithin the milling fractions (after 24 h and 12 months of treatment) accounted for more than83.46 and 81.8%, respectively, of the level of residues that were initially found on the wholegrain. For the higher spiking level at 14.6 ppm, the residues accounted for almost 82.7 and79.01%, respectively, of the initial levels present on the grains (Kadoum et al., 1978). Incontrast, a study found almost 95% reduction in the malathion residues (initial level was8.89 ppm) within the wheat through the process of milling to flour (Uygun et al., 2005).
Parboiling is a process that involves the precooking of rice right within its husk. This processfirst includes hydrating of paddy, which is followed by heating for cooking the rice, and thenthe rice is dried. In a study, rough rice was treated with chlorpyrifos methyl (technically Reldanat 6 ppm) and malathion (14 ppm). Malathion residues within the nonparboiled rice averaged0.016 ppm whereas the concentration was 0.013 ppm in parboiled rice. The concentration ofReldan residues in nonparboiled rice averaged 0.05 ppm, and the levels were 0.065 ppm withinparboiled rice (Cogburn et al., 1990).
The most simple and preliminary step within both domestic and commercial processinginvolves washing with water. Different forms of washing processes effectively dislodge theloosely held pesticide residues (Street, 1969). Rice grains were spiked at 456 and 3.4 ppb,respectively, with the pesticide chlorpyrifos and its metabolite [chemically 3,5,6-trichloro-2-pyridinol (TCP)]. Washing of the grains helped in removing almost 60% of chlorpyrifosresidues (Lee et al., 1991). Washing with water removed almost the entire permethrin content

present in rice, which was initially at 19 ppm (Fukuhara et al., 1994). In another study, whensoybeans containing pesticides captan (2.87 ppm), chlorpyrifos (11.2 ppm), dichlorvos(5.01 ppm), and malathion (7.9 ppm) were washed twice with water, pesticides content wasreduced by almost 80%–90% of their initial levels, suggesting that the pesticides exist asmicroparticles over the soybean surface and can be easily eliminated by mechanically stirringin the water (Miyahara and Saito, 1994).
6.11. Grain Storage and Pesticide Residue DissipationTo reduce the losses resulting from pests, various pesticides and insecticides are applied onfood grains when they are stored for long periods (in the range of 3–36 months) at ambienttemperatures within bulk silos (Holland et al., 1994). On account of this, the grains and foodsbased on them potentially serve as major sources of pesticide residues in the human diet.Studies concerning the postharvest treatment of food grains with pesticides have revealed thatthe concentrations of residues decline over a period of time (Holland et al., 1994; Snelson,1987). Residues belonging to greater lipophilic materials remain confined to the seed coat,though a small portion may reach through to bran, as well as germ that contain high triglyceridecontent (Anderegg and Madisen, 1983; Holland et al., 1994). In a study during a storage periodof 32 weeks at ambient temperature 20°C and relative humidity in the range of 50%–70%, theresidues showed little decline, whereas at 30°C temperature residues of malathion declined byaround 30%–40% while the pirimiphos methyl residues stayed constant. The residues oforganochlorines and synthetic pyrethroid were also quite stable under the conditions prevalentwithin the silo (Holland et al., 1994; Rowlands, 1975). With the assistance of radiotracertechniques various countries have studied insecticide persistence in stored beans and grains(Holland et al., 1994; International Atomic Energy Agency, 1990). Even after storage periodsof 3–9 months the residues of parent pesticide maldison were extracted from the matrix withinthe range of 16%–65% of the initially applied doses. Significant concentrations of thehydrolysis products were also found, and the bound residues (which were unextractable by thesolvent used) also made up almost 52% of the initially applied dose. In terms of persistence, thepesticides chlorpyrifos methyl, pirimiphos methyl, and fenvalerate were observed to be morepersistent than malathion (Holland et al., 1994). The degradation, as well as penetrationkinetics, of the pesticide malathion (10 ppm) applied to maize, sorghum, and wheat grainsunder storage conditions for a period of 6 months at the ambient temperature of 26.7°C wasinvestigated. The results revealed a similar trend for all the grain types; it was found thatgreater than 85% of the total residues were superficially present on the outer side of the graineven after 24 hours. In the first month of grain storage, the residues penetrated and increased inconcentration within the grain and there was a marked decrease in the residues on the outerside. In the storage duration that remained, the decline of residues was quicker from the outersurface than from within the grain (Kadoum and LaHue, 1974). Wheat grains were treated witha variety of pesticides, namely chlorpyrifos methyl, etrimfos, fenitrothion, malathion,methacrifos, pirimiphos methyl (treatment at 3.7, 5.0, 6.8, 8.2, 2.6, and 3.4 ppm, respectively)and were stored for a duration of 4–36 weeks. Flour showed residue levels of 3.6, 4.6, 3.0, 4.1,1.3, and 2.3 ppm, respectively (Wilkin and Fishwick, 1981). A storage period of 12 monthswithin an open basket resulted in respective declines of 64% and 47% within the malathionresidues from maize grains and beans from the initial concentrations of 7.73 and 7.52 ppm,

respectively. The high losses in malathion were supposed to be due to the process ofvolatilization and the probable settling of the pesticide formulation dust to the lower portionand the side of the basket during storage in an open, as well as windy, laboratory in the tropics(Lalah and Wandiga, 2002). The impact of storage was investigated on malathion degradation(initial level 10.2 ppm) in the 5.5-month period of storage. Significant malathion andisomalathion degradation was observed in barley (65%–72%), and the metabolite malaoxonwas extensively (85%) degraded within the storage duration (Uygun et al., 2007).
7. ConclusionsLegume seeds have made a significant contribution to the human diet, as they are inexpensivesources of dietary proteins, carbohydrates, vitamins, and minerals. However, they also containlarge amounts of ANFs (e.g., trypsin inhibitors, phytic acid, and α-galactosides) at the sametime that need to be eliminated or reduced by processing, such as soaking, germination,cooking, fermentation, and extrusion, so as to enhance digestibility and nutritive value. Foodcontamination can occur inadvertently as a result of direct or indirect exposure to toxicchemicals. Widespread contamination of food commodities with harmful chemical compoundshas shown negative impacts on human health and degraded the environment, and thus hasreaffirmed the significance of safe and high-quality food products. Hence, a sustainablesolution to this scenario of unsafe and poor-quality food warrants a paradigm shift in thecurrent mind-set.
In view of these concerns, several alternative agriculture systems, such as organic farming,permaculture, and biodynamic farming, have been proven to tackle existing agriculturalproblems the world over. However, for several inherent sociotechnical and socioculturalreasons, especially in some developing countries, diffusion and acceptance of these alternativesmay be quite difficult and slow. Domestic processing may help in the dissipation of pesticideresidues in raw food during this transitional phase. Unit operations normally employed inprocessing food crops reduce or remove residues of insecticides and other pesticides that arepresent in the crops. These operations, such as washing, peeling, blanching, and cooking, play avital role in the reduction of residues. Each operation has a cumulative effect on the reductionof the pesticides present. Therefore, a combination of processing techniques would render foodgrains safe for human consumption. In addition, it is necessary to optimize the cooking processto maximize nutrient content and minimize antinutrients, so that it can be recommended to themasses for good health.
ReferencesAbhilash PC, Singh N. Pesticide use and application: an Indian scenario. J. Hazard. Mater.. 2009;165:1–12.Abou-Arab AAK. Behavior of pesticides in tomatoes during commercial and home preparation. Food Chem.. 1999;65:509–
514.Abou-Arab AAK. Degradation of organochlorine pesticides by meat starter in liquid media and fermented product. Food
Chem. Toxicol.. 2002;40:33–41.Abou-Arab AAK, Abou-Donia MA. Pesticide residues in some Egyptian spices and medicinal plants as affected by processing.
Food Chem.. 2001;72:439–445.Agnihotri NP. Pesticide Safety and Monitoring, All India Coordinated Research Project on Pesticides Residues. New Delhi,
India: Indian Council of Agricultural Research; 1999.Agoramoorthy G. Can India meet the increasing food demand by 2020? Futures. 2008;40:503–506.

Alajaji SA, El- Adawy TA. Nutritional composition of chickpea (Cicer arietinum L.) as affected by microwave cooking andother traditional cooking methods. J. Food Compost. Anal.. 2006;19:806–812.
Ali SL. Bestimmung der pestiziden Ruckstande und anderer bedenklicher veruntreinigungen—wie toxische Metallspuren inArzneipflanzen1. Mitt: Pestizid—Ruckstande in Arzneidrofen. Pharm. Industrial. 1983;45:1154–1156.
Alnaji LK, Kadoum AM. Residues on methyl phoxim in wheat and milling fractions. Journal of Agricultural Food Chemistry.1979;27(3):583–584.
Anderegg BM, Madisen LG. Journal of Economic Entomology. 1983;76:733–736.Anzene JS, Tyohemba RL, Ahile UJ, Emezi KSA. Organochlorine pesticide residues analysis of postharvest cereal grains in
Nasarawa State, Nigeria. Int. J. Agron. Agr. Res.. 2014;5(5):59–64.Arya RS. Synergetic Agriculture System & Development. New Delhi, India: Centre for Rural Development & Technology,
Indian Institute of Technology Delhi; 1995: PhD Thesis.Athanassiou CG, Papagregorioub AS, Buchelos C. Insecticidal and residual effect of three pyrethroids against Sitophilus
oryzae (L.) (Coleoptera:Curculionidae) on stored wheat. Journal of Stored Products Research. 2004;40:289–297.Bai Y, Zhou L, Wang J. Organophosphorus pesticide residues in market foods in Shaanxi area, China. Food Chem..
2006;98(2):240–242.Bhatnagar VK. Pesticides pollution: trends and perspectives. Indian J. Med. Res.. 2001;31:87–88.Boehm S, Huck S. Presynaptic inhibition by concanavalin: are alphalatrotoxin receptors involved in action potential-dependent
transmitter release? J. Neurochem.. 2009;71:2421–2430.Bongoni R, Verkerk R, Steenbekkers B, Dekker M, Stieger M. Evaluation of different cooking conditions on broccoli (Brassica
oleracea var. italica) to improve the nutritional value and consumer acceptance. Plant Food. Hum. Nutr.. 2014;69(3):228–234.
Bressani T. Grain quality of common beans. Food Rev Int. 1993;9:237–297.Campos-Vega R, Reynoso-Camacho R, Pedraza-Aboytes G, Acosta-Gallegos JA, Guzman-Maldonado SH, Paredes-Lopez O,
Oomah BD, Loarca-Piña G. Chemical composition and in vitro polysaccharide fermentation of different beans (Phaseolusvulgaris L.). J. Food Sci.. 2009;74(7).
Champ MMJ. Non-nutrient bioactive substances of pulses. Br. J. Nutr.. 2002;88(S3):307–319.Cogburn RR, Simonaitis RA, Webb BD. Fate of malathion and chlorpyriphos methyl in rough rice and milling fractions before
and after parboiling and cooking. J. Econ. Entomol.. 1990;83(4):1636–1639.Clemente A, Sanchez-Vieque R, Vioque J, Bautista J, Millon F. Effect of cooking on protein quality of chickpea (Cicer
arietinum) seeds. Food Chem. 1998;62(1):1–6.Daur I, Sepetoglu H, Marwarth KB, Hassan G, Khan IA. Effect of different levels of nitrogen on dry matter and grain yield of
faba bean. Pak. J. Bot.. 2008;40(6):2453–2459.Dos Reis LCR, de Oliveira VR, Hagen MEK, Jablonski A, Flôres SH, de Oliveira Rios A. Effect of cooking on the
concentration of bioactive compounds in broccoli (Brassica oleracea var Avenger) and cauliflower (Brassica oleracea var.Alphina F1) grown in an organic system. Food Chem.. 2015;172:770–777.
Ecobichon DJ. Pesticide use in developing countries. Toxicology. 2001;160(1–3):27–33.El-Adawy TA. Nutritional composition and antinutritional factors of chickpeas (Cicer arietinum L.) undergoing different
cooking methods and germination. Plant Foods for Human Nutrition. 2002;57(1):83–97.Elkins ER. Effect of commercial processing on pesticide residues in selected fruits and vegetables. J. Assoc. Off. Anal. Chem..
1989;72(3):533–535.El-Niely HFG. Effect of radiation processing on antinutrients, in-vitro protein digestibilityand protein efficiency ratio bioassay
of legume seeds. Radiat. Phys. Chem.. 2007;76:1050–1057: 2007.El-Tinay AH, Mahgoub SO, Mohamed BE, Hamad MA. Proximate composition and mineral and phytate contents of legumes
grown in Sudan. J. Food Compos Anal.. 1989;2:69–78.Estevez AM, Castillo E, Figuerola F, Yanez E. Effect of processing on some chemical and nutritional characteristics of pre-
cooked and dehydrated legumes. Plants Foods Hum. Nutr.. 1991;41:193–201.Fabbri ADT, Crosby GA. A review of the impact of preparation and cooking on the nutritional quality of vegetables and
legumes. Int. J. Gastron. Food Sci.. 2016;3:2–11.FAO/UNEP/OECD/SIB, 2001. Baseline Study on the Problem of Obsolete Pesticides Stocks, Rome.Farrow RP, Elkins ER, Rose WW, Lamb FC, Ralls JW, Mercer WA. Canning operations that reduce insecticide levels in
prepared foods and in solid food wastes. Residues Rev.. 1969;29:73–87.Felix JP, Mello D. Farm Animal Metabolism and Nutrition. United Kingdom: CABI; 2000.Fernando R, Pinto MDP, Pathmeswaran A. Goitrogenic food and prevalence of goitre in Sri Lanka. J. Food Sci..
2012;41:1076–1081.

Fereidoon S. Beneficial health effects and drawbacks of antinutrients and phytochemicals in foods. Appl. Microbiol.Biotechnol.. 2014;97:45–55.
Ferreira AST, Naozuka J, Kelmer GAR, Oliveira PV. Effects of the domestic cooking on elemental chemical composition ofbeans species (Phaseolus vulgaris L.). J. Food Process.. 2014;2014:6.
Frias J, Vidal-Valverde C, Sotomayor C, Diaz-Pollan C, Urbano G. Influence of processing on available carbohydrate contentand antinutritional factors of chickpeas. Eur. Food Res. Technol.. 2000;210:340–345.
Fukuhara K, Katsumura R, Takasaka N, Uchiyama S, Shimamura S. Permethrin residues in foods and tableware afterfumigation. J. Food Hyg. Soc. Japan. 1994;35(5):504–509.
Geisman, J.R., Gunther, F.A., Gunther, J.D. (Eds.). 1975. Reduction of pesticide residues in food crops by processing. Residuereviews. Residues of pesticides and other contaminants in the total environment, vol. 54. Springer, New York, NY, pp. 43–54.
Gemede HF. Potential health benefits and adverse effects associated with phytate in foods: a review. Global J. Med. Res..2014;14(3-K):284–289.
Gemede HF, Ratta N. Antinutritional factors in plant foods: potential health benefits and adverse effects. Int. J. Nutr. Food Sci..2014;3(4):284–289.
Government of India, Eleventh Five-Year Plan: 2008–2012, Planning Commission of India, New Delhi, 2008. Available from:http://planningcommission.nic.in/plans/planrel/fiveyr/welcome.html.
Golden M. Nutrient requirements of moderately malnourished populations of children. Food Nutr. Bull. 2009.Guler GO, Cakmak YS, Dagli Z, Aktumsek A, Ozparlak H. Organochlorine pesticide residues in wheat from Konya region,
Turkey. Food Chem. Toxicol.. 2010;48:1218–1221.Gupta PK. Pesticide exposure—Indian scene. Toxicology. 2004;198:83–90.Haas E. Ten Healing Foods: To Buy Organic, adapted from the Staying Healthy shopper’s Guide. Feed Your Family Safely;
1997.Holland PT, Hamilton D, Ohlin B, Skidmore MW. Effects of storage and processing on pesticide residues in plant products.
IUPAC Reports on Pesticides (31). Pure Appl. Chem.. 1994;66(2):335–356.International Atomic Energy Agency. 1990. Studies of the magnitude and nature of pesticide residues in stored products, using
radiotracer techniques. Vienna.Indian Council of Agricultural Research Report of the Special Committee on Harmful Effects of Pesticides. New Delhi: ICAR;
1967: pp. 78.Jood S, Chauhan BM, Kapoor AC. Contents and Digestibility of carbohydrates of chickpea and black gram as affected by
domestic processing and cooking. Food Chem.. 1988;30:113–127.Jukanti, A.K., Gaur, P.M., Gowda, C.L., Chibbar, R.N., 2012. Nutritional quality and health benefits of chickpea (Cicer
arietinum L.): a review. Br. J. Nutr. 108 (S1), S11–S26.Kadoum AM, LaHue DW. Penetration of malathion in stored corn, wheat, and sorghum grain. J. Econ. Entomol..
1974;67(4):477–478.Kadoum AM, LaHue DW, Alnaji L. Efficacy and fate of pirimiphosmethyl residue applied at two dosage rates to wheat for
milling. J. Econ. Entomol.. 1978;71(1):50–52.Kannan K, Tanabe S, Ramesh A, Subramanian A, Tatsukawa R. Persistent organochlorine residues in food stuffs from India
and their implications on human dietary exposure. J. Agric. Food Chem.. 1992;40:518–524.Karmas E, Harris RS. Nutritional Evaluation of Food Processing. 3rd edn New York: Van Nostrand Reinhold Co; 1988.Kaushik N, Handa SK. Use of fluvalinate and fenpropathrin for the protection of chickpea pods from damage by pod borer
(Heliothis armigera HB) and their effect on the growth attributing character. Pestology. 1993;22(3):27–30.Kaushik G, Satya S, Naik SN. Food processing a tool to pesticide residue dissipation—a review. Food Res. Int..
2009;42(1):26–40.Kaushik G, Satya S, Naik SN. Effect of domestic processing techniques on the nutritional quality of the soybean. Mediterr. J.
Nutr. Metab.. 2010;3(1):39–46.Kaushik G, Naik SN, Satya S. Effect of domestic processing on nutrients and pesticide residues in chickpea. Mediterr. J. Nutr.
Metab.. 2012;5(1):21–30.Khattak AB, Zeb A, Bibi N, Khalil SA, Khattak MS. Influence of germination techniques on phytic acid and polyphenols
content of chickpea (Cicerarietinum L.) sprouts. Food Chem.. 2007;104:1074–1079.Krishnamurthy VV, Sreeramulu US. Studies on rice bran and rice bran oil. VI. Pesticides accumulation in the rice bran.
Madras Agric. J.. 1982;69(12):820–821.Kyriazakis I, Whittenmore CT. Whittenmore’s Science and Practice of Pig Production. Oxford: Wiley-Blackwell; 2006.Lal AK, Dikshit AK. Persistence of deltamethrin on chickpea and its decontamination. Pesticide Res. J.. 2000;12(1):74–79.

Lalah JO, Wandiga SO. The effect of boiling on the removal of persistent malathion residues from stored grains. J. Stored Prod.Res.. 2002;38:1–10.
Lee SR, Mourer CR, Shibamoto T. Analysis before and after cooking processes of a trace chlorpyrifos spiked in polished rice.J. Agric. Food Chem.. 1991;39(5):906–908.
Lemos MA, Aliyu MM, Hungerford G. Influence of cooking on the levels of bioactive compounds in Purple Majesty potatoobserved via chemical and spectroscopic means. Food Chem.. 2015;173:462–467.
Liebman M, Al-Wahsh IA. Probiotics and other key determinants of dietary oxalate absorption. Adv. Nutr.. 2011;2:254–260.Liener IE. Phytohemagglutinins: their nutritional significance. J. Agric. Food Chem.. 2003;22:17.Lozowicka B, Kaczynski P, Paritova AE, Kuzembekova GB, Abzhalieva AB, Sarsembayeva NB, Alihan K. Pesticide residues
in grain from Kazakhstan and potential health risks associated with exposure to detected pesticides. Food Chem. Toxicol..2014;64:238–248.
Mada DA, Hussein ID. Investigation into the effect of pesticide application on soil and environment with crop protectionmachine in southern Adamawa State, Nigeria. Int. J. Eng. Sci.. 2013;2(12):71–76.
Mada DA, Mahai S, Adamu IG, Girei MM. Toxicity study of pesticide on storage of cereal, legume and oil seed with regard tostorage structures in Ganye, southern Adamawa State, Nigeria. Int. J. Eng. Res. Dev.. 2014;10(3):33–39.
Majumdar, S.K., 1973. Proc. SPRA, pp.10–32.Malinowska E, Jankowski K, Sosnowski J, Wiśniewska-Kadżajan B. Pesticide residues in cereal crop grains in Poland in 2013.
Environ. Monit. Assess.. 2015;187:329.Marei AE, Khattab MM, Mansee AH, Youssef MM, Montasser MR. Analysis and dissipation of deltamethrin in stored wheat
and milled fractions. Alexandria J. Agric. Res.. 1995;16(2):275–291.Messina V. Nutritional and health benefits of dried beans. Am. J. Clin. Nutr.. 2014;100:437S–442S.Miyahara M, Saito Y. Effects of the processing steps in tofu production on pesticide residues. J. Agric. Food Chem..
1994;42(2):369–373.Muzquiz M, Burbano C, Cuadrado C, Martin M. Analytical methods for determination of compounds with no nutritive value.
Handbook on Common Bean Related Laboratory Methods. Spain: Misión Biológica de Galicia, Galicia, Cordova; 2000:11–26.
Nachbar MS, Oppenheim JD, Thomas JO. Lectins in the US diet: Isolation and characterization of a lectin from the tomato(Lycopersicon). J. Biol. Chem.. 2000;255:2056.
Noonan SC, Savage GP. Oxalic acid and its effects on humans. Asia Pac. J. Clin. Nutr.. 1999;8:64–74.Ogah CO, Tettey J, Coker HB, Adepoju-Bello AA. Analysis of organochlorine pesticide residues in beans from markets in
Lagos State, Nigeria. W. Afr. J. Pharm.. 2012;23(1):60–68.Peri C. The universe of food quality. Food Qual. Prefer.. 2006;17:3–8.Prodanov M, Sierra I, Vidal-Valverde C. Influence of soaking and cooking on the thiamin, riboflavin and niacin contents of
legumes. Food Chem.. 2004;84(2):271–277.Raghvani BR, Poshiya VK. Field efficacy of newer molecules of insecticides against pod borer (Helicoperva armigera HUB.)
in chickpea. Pestology. 2006;30(4):18–20.Redden RJ, Chen W, Sharma B. Chickpea Breeding and Management. United Kingdom: CABI; 2005.Rekha, Naik SN, Prasad R. Pesticide residue in organic and conventional food–risk analysis. Chem. Health Safety. 2006;13:12–
19.Rotterdam Convention, 2004. Rotterdam Convention Secretariat, Guideline on the Development of National Laws to
Implement the Rotterdam Convention, Rome, Geneva.Rowlands DG. Metabolism of insecticides on gains. Residue Rev.. 1975;58:113–155.Sattar A, Durrani SK, Mahmood F, Ahmad A, Khan I. Effect of soaking and germination temperatures on selected nutrient and
anti nutrients of mung bean. Food Chem.. 1989;34:111–120.Satya, S., Kaushik, G., Naik, S.N., Malik, A., 2007. Enhancing food quality and safety in a rural habitat––a holistic perspective.
Tropentag, Witzenhausen, Germany.Satya S, Kaushik G, Naik SN. Processing of food legumes: a boon to human nutrition. Mediterr. J. Nutr. Metab..
2010;3(3):183–195.Schoeninger V, Coelho SRM, Christ D, Sampaio SC. Processing parameter optimization for obtaining dry beans with reduced
cooking time. LWT Food Sci. Technol.. 2014;56(1):49–57.Shanthakumari S, Mohan V, Britto J. Nutritional evaluation and elimination of toxic principles in wild yam (Dioscorea spp.).
Trop. Subtrop. Agroecosyst.. 2008;(8):319–325.Sharma, J., 2006. Effect of processing methods on the quality of cereal and legume products. PhD Thesis, Centre for Rural
Development & Technology, Indian Institute of Technology Delhi, New Delhi, India.

Sharma J, Satya S, Kumar V, Tewary DK. Dissipation of pesticides during bread making. J. Chem. Health Food Safety. 2005;17–22.
Singh PK, Shrivastava N, Sharma B, Bhagyawant SS. Effect of domestic processes on chickpea seeds for antinutritionalcontents and their divergence. Am. J. Food Sci. Technol.. 2015;3(4):111–117.
Singhal P, Kaushik G, Mathur P. Antidiabetic potential of commonly consumed legumes: a review. Crit. Rev. Food Sci. Nutr..2014;54(5):655–672.
Snelson, J.T., 1987. Grain protectants. ACIAR monograph series (Australia), vol. 3. Australian Centre for InternationalAgricultural Research. Antidiabetic potential of commonly consumed legumes: a review, Canberra, Australia, 448 p.
Soetan K, Oyewole O. The need for adequate processing to reduce the antinutritional factors in plants used as human foods andanimal feeds: a review. Afr. J. Food Sci.. 2009;3(9):223–232.
Srivastava RP, Srivastava GK. Nutritional value of Pulses. Indian J. Agric. Biochem.. 2003;16:57–65.Street JC. Methods of removal of pesticide residues. Can. Med. Assoc. J.. 1969;100:154–160.Subuola F, Widodo Y, Kehinde T. Processing and utilization of legumes in the tropics. In: Eissa AA, ed. Trends in Vital Food
and Control Engineering. InTech; 2012: Available from: http://www.intechopen.com/books/trends-in-vital-food-and-controlengineering/processing-and-utilization-of-legumes-in-the-tropics.
Taghinejad M, Nikkhah A, Sadeghi AA, Raisali G, Chamani M. Effects of gamma irradiation on chemical composition,antinutritional factors, ruminal degradation and in vitro protein digestibility of full-fat soybean. Asian-Aust. J. Anim. Sci..2009;22(4):534–541.
Tewari L. Removal of the flatulence factors (Alpha-galactooligosaccharides) from chickpea (Cicer arietinum) by germinationand Mold fermentation. J. Food Sci. Technol.. 2002;39:458–462.
Tharanathan RN, Mahadevamma S. Grain legumes a boon to human nutrition. Trends Food Sci. Technol.. 2003;14:507–518.Tripathi, H.C., 1966. M. Sc. Thesis. U.P. Agricultural University, Pantnagar. India.UN/DESA, 2002. (Chapter III).Changing Unsustainable Patterns of Consumption and Production, Johannesburg Plan on
Implementation of the World summit on Sustainable Development, Johannesburg.Ugwu FM, Oranye NA. Effects of some processing methods on the toxic components of African breadfruit (Treculia africana).
Afr. J. Biotechnol.. 2006;5:2329–2333.Uygun U, Koksel H, Atli A. Residue levels of malathion and its metabolites and fenitrothion in post-harvest treated wheat
during storage, milling and baking. Food Chem.. 2005;92:643–647.Uygun U, Ozkara R, Ozbey A, Koksel H. Residue levels of malathion and fenitrothion and their metabolites in post harvest
treated barley during storage and malting. Food Chem.. 2007;100:1165–1169.Vidal-Valverde C, Frias J, Sierra I, Blazquez I, Lambein F, Kuo YH. New functional legume foods by germination: effect on
the nutritive value of beans, lentils and peas. Eur. Food Res. Technol.. 2002;215(6):472–477.Wang N, Hatcher DW, Tyler RT, Toews R, Gawalko EJ. Effect of cooking on the composition of beans (Phaseolus vulgaris L.)
and chickpeas (Cicer arietinum L.). Food Res. Int.. 2010;43:589–594.Watanabe S, Watanabe S, Ito K. Residue of synthetic pyrethroid insecticide fenvalerate in vegetables and its fate in the process
of cooking. Kanagawa-ken Eisei Kenkyusho Kenkyu Hokoku. 1988;18:43–45.Wilkin, D.R., Fishwick, F.B., 1981. Residues of organophosphorous pesticides in wholemeal flour and bread produced from
treated wheat. In: 11th British crop protection conference—pests and diseases, proceedings, vol. 1. pp. 183–187.Winteringham FPW. Some global aspects of pesticide residue problems. Isr. J. Entomol.. 1971;6(2):171–181.
Further ReadingMahdavian SE, Somashekar RK. Dietary intake of insecticides from food in Karnataka, India. Adv. Res. Biol. Sci..
2013;1(2):24–30.Podbielska M, Szpyrka E, Matyaszek A, Kurdziel A, Rupar J, Słowik-Borowiec M. Estimation of the dietary exposure
associated with pesticide residues in vegetables grown under covers in 2010–2012. Prog. Plant Protect.. 2013;53(2):391–396: (in Polish).
Tiwari U, Cummins E. Factors influencing levels of phytochemicals in selected fruit and vegetables during pre- and post-harvest food processing operations. Food Res. Int.. 2013;50(2):497–506.

C H A P T E R 2
Emerging Food Processing TechnologiesGargi Ghoshal Dr. S.S. Bhatnagar University Institute of Chemical Engineering & Technology, Panjab University, Chandigarh, India
AbstractFood processing is a series of unit operations to convert unprocessed food-to-foodstuffs with prolonged shelf life and enable storage that abolishesor reduces time or effort spent in culinary procedures for increased consumption. The principle of food processing in the majority of developingcountries helps to modify taste, aroma, and texture to enhance shelf life and aesthetic properties and to improve the nutritional value of foods. High-quality foods in greatest demand are also highly perishable foods. Fortunately most perishable foods can be preserved by the judicious use ofpresent technology. With the successful application of commercial food preservation technologies, the availability of perishable foods can beextended, thereby contributing to human welfare. In spite of increasing demand for new processed products, the basic principles of food processingremain the same for sustainable availability during scarcity. The processed food industries struggle to accomplish consumer expectations for makingnutritious, enjoyable, convenient, safe, easily available, and affordable supreme quality various food items. The objectives of this chapter are todiscuss the necessity and perspectives of food processing and preservation, history of food preservation, food spoilage, conventional and modernmethods of food processing and preservation, characterization, its evaluation, industrialization to address food safety issues, food wastemanagement, food security, and response to consumers changing demand and so forth.
Keywords
food processingfood analysisfood safetyfood securityfood engineering
1. IntroductionWhen an edible plant or animal body part can be transformed into a marketable, nutritious food product with betterphysicochemical properties, that is an enjoyable and palatable product, the process is termed food processing. Foodprocessing also includes marketable food materials that can be prepared easily and consumed after minimalprocessing or in their present form. Food processing is a combination of several unit operations such as cleaning,peeling, grading, size reduction, drying, freezing, grinding, cutting, filtration, evaporation, liquefaction, emulsionformation, cooking, baking, roasting, toasting, frying, boiling, broiling, grilling sterilization, pasteurization,canning, packaging, and so forth. The purpose is to introduce a food product with better color, better flavor, andmore nutritious, and extended shelf life food. Sometimes food processing also causes alterations to the eatingquality of foods, which may be intentionally caused in controlled way. It is also connected with the creative,innovative potential of the processor, which adds an interesting variety to food. Without processing, it would notbe possible to satisfy the needs of modern urban populations: during harvesting, food can be wasted due to lack ofprocessing. Without food preservation, the availability of particular crop/agricultural product will be limitedseasonally.
Food processing is not new. Since ancient times, primitive people have preserved food through fermentation,sun-drying, smoking, roasting, and so forth. These basic food preservation processes include physical, chemical,and enzymatic changes to the original structure of foods in their basic forms, as well as served to develop a barrieragainst surface microbial activity that causes fast deterioration. Until the introduction of canning technology,preservation by salting was especially common for foods. Archaeological evidence from Asia, Europe, and theAmericas, and written evidence from Greek, Chaldean, Egyptian, and Roman sources prove the existence of thesebasic preservation methods.

Processed foods are safe and long lasting, have better flavor and better nutritional value, are more appealing, aresupplemented with essential micronutrients, vitamins, and minerals, are free of pathogens, are tastier, fulfillconsumers’ desires, and therefore we can say that optimally processed foods are superior to and more convenientthan fresh produce, which is prone to deterioration. Its consumption is also what makes it more popular.
As indicated above, food materials (cereals, pulses, oilseeds, fruits, and vegetables), are perishable in nature,and therefore care should be taken from firm to fork in each and every processing step to deliver thebest qualityproduct in terms of nutrition, better health, and wellness of customer.
For human health amount, as well as quality of food is essential for human health, in terms of challenges likefrightening autoimmune and inflammatory bowel diseases, scary scenario for diabetes, cardiovascular diseases,and cancer like chronic diseases. A rising alarm in basic therapeutic and epidemiological study authenticated thatfood and diet is most essential basic part implicated as the preventive of these and other chronic diseases, and thatdietetic model have a tremendous significances on the vulnerability for chronic diseases. (Anand et al., 2008)reported that environmental life style hazardous issues such as sun exposure, diet, obesity, and physical calmnesssubjected badly to chronic diseases like cancer and established that cancer could be avoided if it is detected at anearly stage and also if important lifestyle changes are accomplished. As a result, food is associated intimately tohuman nutrition and happiness irrespective of food security or nutrient scarcity and protection from illness. Dietaryguidelines are initiated to entail the outstanding diet practice, which maintain health and lessen the hazard formajor chronic diseases. According to the 2005 Dietary Guidelines for Americans, increasing consumption of fruits,vegetables, cereal, and low-fat milk, and curbing the consumption of saturated fats, trans fats, cholesterol, as wellas sodium reduce health risks. These recommendations have been adopted by several companies (ASM, 2005).Nowadays, many companies are manufacturing whole-grain and high-fiber cereal products. Demand for carrotsdoubled after baby carrots were made available in the market. The introduction of colorful, attractive packagingfor milk attracted school and college students, ages 10–20 years, and consequently increased milk consumption byteenagers. Initiative has been taken to redesign the food product with diminished trans fat content, and manycompanies have made food products with reduced sodium content. Novel baby foods made from miscellaneouswhole grains, dairy products, fruits, and vegetables, are very convenient and accessible. Single-serve packaginghas been introduced in the market for a variety of food products, offering the desired amount of calories.
In developed countries, overweight and obesity can be a major health issue. In the past three decades,overweight and obesity in children has increased three times and related diseases, such as metabolic syndrome anddiabetes (Ogden et al., 2000), increased significantly. According to Harrington et al. (2010) childhood obesity canbe diagnosed at the age of two. The investigation report of Harris (1990) authenticated and advocated the formertheory, which holds that body weight is synchronized at a prearranged or preferential altitude following a feedbackcontrol method.
Recently major recognized problem of the globe is rising food security gap. Owing to the lack of appropriateselection of raw material, manufacturing conditions, wrapping and covering, transportation systems, 50% of thefood crop harvested never gets utilized and this is the main reason in developed or developing country. Even in theUnited States, hunger and malnutrition caused by lack of proteins, vitamins, minerals, and total calories are stillcommon. Eventually expansion in crop management, supply chain management, and innovative exploration infood science and technology are essential to diminish the hunger gap. Devoid of any compromise of our naturalexpensive resources, guard of resources and power is becoming progressively more important. Offering adequatefood to everyone, agricultural production and manufacturing system must turn into most efficient in a responsibleand environmentally sustainable manner by using minimum energy, producing minimum waste, and manufacturingfood with extended shelf life. With the advancement of scientific and hi-tech achievements in the current decadesmade it promising to determine food scarcity, deal with food security and nutritional superiority, which nourishapproximately 7 billion people, additional enhancements are prerequisite for the determination of confrontation ofsustainably nourishing the rising upcoming populations and future generations in both developed and emergentnations. In fact, to guarantee the requirements of the future, it is essential that scientific and technologicaladvancements be hastened and used in the agricultural production and food processing sectors (Floros et al., 2010).
2. Food ConsumptionConsumption of food can be categorized as follows:
• Cereal and pulse products
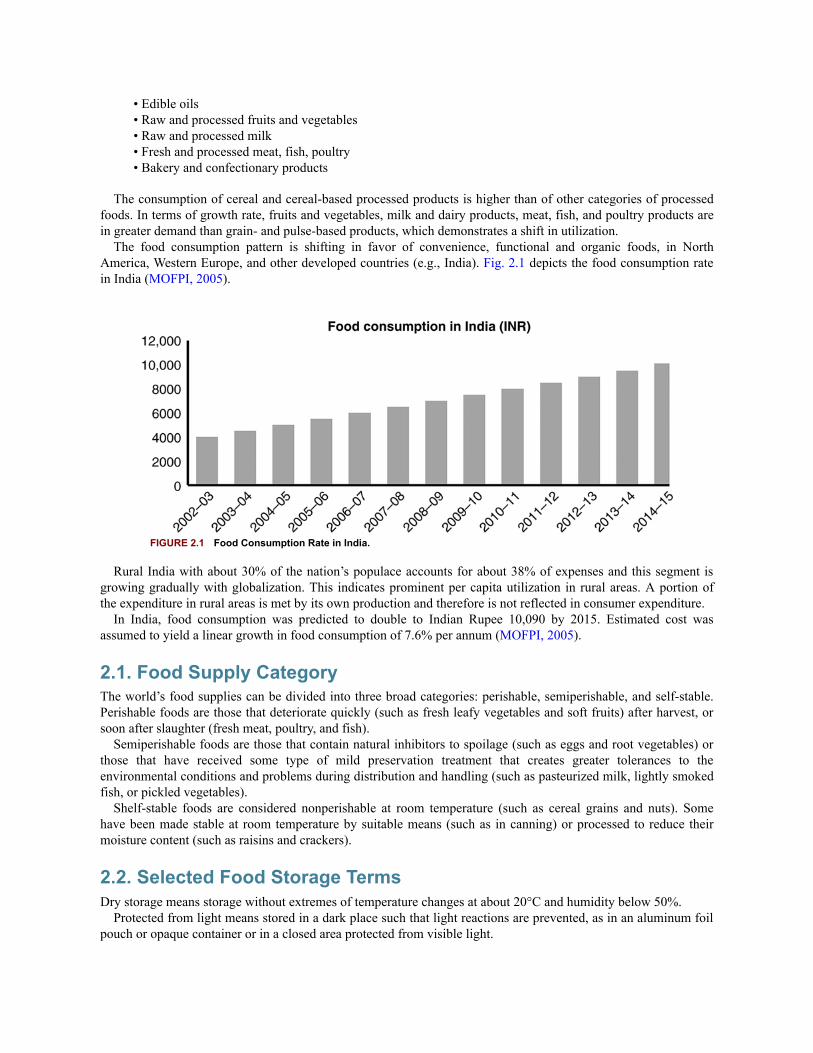
• Edible oils• Raw and processed fruits and vegetables• Raw and processed milk• Fresh and processed meat, fish, poultry• Bakery and confectionary products
The consumption of cereal and cereal-based processed products is higher than of other categories of processedfoods. In terms of growth rate, fruits and vegetables, milk and dairy products, meat, fish, and poultry products arein greater demand than grain- and pulse-based products, which demonstrates a shift in utilization.
The food consumption pattern is shifting in favor of convenience, functional and organic foods, in NorthAmerica, Western Europe, and other developed countries (e.g., India). Fig. 2.1 depicts the food consumption ratein India (MOFPI, 2005).
FIGURE 2.1 Food Consumption Rate in India.
Rural India with about 30% of the nation’s populace accounts for about 38% of expenses and this segment isgrowing gradually with globalization. This indicates prominent per capita utilization in rural areas. A portion ofthe expenditure in rural areas is met by its own production and therefore is not reflected in consumer expenditure.
In India, food consumption was predicted to double to Indian Rupee 10,090 by 2015. Estimated cost wasassumed to yield a linear growth in food consumption of 7.6% per annum (MOFPI, 2005).
2.1. Food Supply CategoryThe world’s food supplies can be divided into three broad categories: perishable, semiperishable, and self-stable.Perishable foods are those that deteriorate quickly (such as fresh leafy vegetables and soft fruits) after harvest, orsoon after slaughter (fresh meat, poultry, and fish).
Semiperishable foods are those that contain natural inhibitors to spoilage (such as eggs and root vegetables) orthose that have received some type of mild preservation treatment that creates greater tolerances to theenvironmental conditions and problems during distribution and handling (such as pasteurized milk, lightly smokedfish, or pickled vegetables).
Shelf-stable foods are considered nonperishable at room temperature (such as cereal grains and nuts). Somehave been made stable at room temperature by suitable means (such as in canning) or processed to reduce theirmoisture content (such as raisins and crackers).
2.2. Selected Food Storage TermsDry storage means storage without extremes of temperature changes at about 20°C and humidity below 50%.
Protected from light means stored in a dark place such that light reactions are prevented, as in an aluminum foilpouch or opaque container or in a closed area protected from visible light.

Cold storage means to store at a temperature below about 12°C, as in a refrigerated chamber or underground.Refrigerated storage means to store at temperature below those normally available throughout the year, andbetween 0° to 8°C. Freezer storage means storage at temperature below 0°C and preferably below –23°C. Freezercompartment in a refrigerator storage means storage at temperatures of about 0°C.
The storage temperature of foods directly influences and controls the storage life of foods. As a rule of thumb,reducing the temperature of a preserved food to 10°C results in the enhancement of shelf life two-fold and viceversa. The temperature of a storage compartment is imperative in maintaining the superiority of a food, forlengthening the period of time during which the nutrition is maintained.
Shelf life means the period between the production and the retail purchase and use of the product by theconsumer. Throughout this restricted episode the produce is in a condition of acceptable quality in terms ofnutrition, dietary status, taste, consistency, appeal to consumer, and its end use.
For any new innovative product development study, the shelf life study of that particular product is an integralpart of each product assessment program (whether new product, product improvement, or simply a change in typeor specification). The processor or manufacturer attempts to provide the longest possible shelf life, consistent withcosts and the patterns of handling used by distributors, retailers, and consumers.
All foods have a useful storage life and this period can be prolonged or shortened depending on the conditionsof storage and the physical exploitation the food products receive prior to, during, and following storage. In overallanalysis, the cool storage of all foods, fresh or preserved, is beneficial to the retention of quality.
3. Principle of Food ProcessingThe aim of food processing is to give food a longer shelf life before spoilage occurs. Ancient civilizations usedmethods like salting meats, fermentation of milk to cheese or yogurt, and pickling of vegetables. The discovery ofcanning by Nicolas Appert introduced an additional method of perserving food, and pasteurization discovered byLouis Pasteur utilizes a restricted quantity of heat to destroy the microorganisms and to increase the shelf life ofmilk, juice, and other products. Preservation is the foremost crucial requirement to develop or produce food toprohibit illness; otherwise, unprocessed or short processing can result death at the end by consuming spoiled foods.The life span of fresh food products can be extended and therefore customers can get advantage from themthroughout the year after pretreatment, suppliers can transport products over longer distances, and retailers canstore foods for longer time periods.
3.1. Food SafetyAfter appropriate processing and cooking for a required period of time, foods are made safer for eating byremoving toxins, killing pathogens, and inactivating enzymes. Preservation techniques such as low temperaturestorage, freezing, fermentation, drying, and preservation by the addition of salt or sugar can hinder thedevelopment of pathogens. Heating such as pasteurization, sterilization, and cooking can eradicate pathogens.These techniques safeguard consumers from foodborne pathogen contamination in raw fruits, vegetables, andanimal products.
Pretreatment followed by heating and cooling are relevant processing steps for particular crops; for example,manioc must be crushed and soaked followed by being fragmented, heated, and finally subjected to acid treatmentto eliminate hydrogen cyanide during the making of edible starch (tapioca) for safe consumption.
3.2. VarietyWith some modifications to the color, flavor, aroma, textures, and uniformity of foods, food-manufacturingtechnologies can produce greater variety in our daily diet. A current market survey revealed that a huge range ofbreakfast cereal products are manufactured from wheat, rice, corn, and numerous other grains. Breakfast cerealmanufacturers accomplish this diversity by adding flavors, changing cooking times, drying times, and toastingtemperatures, and supplementing with vitamins and minerals by applying a coating on the exterior. The shapes ofbreakfast cereal grains are changed by processing like shredding, flattening by roller, puffing, or expanding themwith pressure and extrusion processing at high temperatures and pressures by forcing the slurry of grains through asmall hole or extruder die. Altering the properties of foods in manufacturing process principle by changingtemperature and pressure of processing or changing in shape and size of products can make products more

appealing to some customers. Nearly 20,000 varieties of unique cereal products launch in the world every year butfew survive in the long term.
3.3. ConvenienceNowadays consumers are health conscious as well as showing a preference for foods that requires less time tocook or already cooked foods. Pemmican, dried buffalo meat strips, is the example of the first processedconvenience food. Some contemporary examples are canned foods, frozen foods, instant noodles, bottled juices,and ready-to-serve foods, cakes, cookies, pizzas, and pies. Fast food provides another form of processed, ready-to-eat calories for working people and busy eaters. American food habit they eat small meal calories at home andmore at office and fast-food centers. These fashions may replicate a growing challenge amongst working womenor single and busy customers for suitable food, for example, frozen or refrigerated food product is offered to theconsumer in a form ready to eat after microwave heating. Snack foods are also ready to eat without any processingwhen served to the consumer.
3.4. Enrichment and Fortification to Maintain Nutritional LevelsEnrichment and fortification are two techniques in processing to maintain or enhance a particular nutrient in aprocessed food. Enrichment means the preserving of some of the nutrients that are deteriorated during any of theprocessing stages. Fortification adds an additional step; it means accumulation of a particular nutrient above thequantity that naturally occurs in a food. The term fortification is also used in general to refer to any additionalsupplementation of a nutrient to a food. Fortification was designed to overcome lack of a particular nutrient in thecommon masses.
In recent decades, numerous foods have commonly been fortified in various countries including the UnitedStates, including salt (fortified with iodine), milk (vitamin D), and grain products (vitamins like thiamin, niacin,riboflavin, iron, and folic acid). These additions have provided needed nutrients in the U.S. diet, but foodproducers sometimes use fortification as a promotion for foods of dubious dietary attributes, such as candy, snacksand sugar-coated breakfast cereals. Several researches also imply that artificial vitamins may not offer the samevaluable outcomes that are available with pure foods.
3.5. Quality AttributesContinuous improvement and sustainable innovation are the essential tools to ensure the distribution of nutrient offoods and beverages with the best quality features to the consumer. Quality characteristics comprise taste, aroma,texture, color, and the existence of other nutrients. Generally quality characteristics of raw food material or cropbegin to deteriorate immediately after harvesting. The aim of innovations is to ensure that the deterioration ofquality attributes is diminished. First blanching and then freezing of vegetables instantaneously after harvestingassures that the nutrients are present at their highest quantity. In some cases, the quality attributes become superiorafter pretreatment or processing. During processing pretreatment of soybeans, flavor is significantly modified.
3.6. Availability of Raw MaterialFood processing assures that the end user has access to an extensive range of raw food crops and other foodconstituents at any time (in off season), counting those which support to improve and preserve the qualitycharacteristics from harvesting, till delivery of the product to the customer, for example, in control atmospherestorage for apples and other fruits by changing the gas composition of the outside atmosphere leads to maintainfresh till delivery of the product.
3.7. SustainabilityFood processing also confirms that the resources required for manufacturing of a particular product from raw foodcrops as well as required additives for manufacturing are utilized most efficiently with respect to the goals ofsustainability during all stages from production to consumption. To enhance the translation of raw materials toconsumer goods, efforts begin at the manufacturing stage to diminish postharvest losses and improved use of by-

products. Efforts of improvement continue, throughout the production of food products and during storage, whichensure that energy, water, and other resources are utilized most competently and environmental influences arediminished.
4. Historical Development of Food PreservationThough it is impossible to date the beginning of human awareness of the incidence and role of microorganisms infoods, it is clear that this led to bacteriology or microbiology as a science. In 1837, Louis Pasteur, known as thefather of pasteurization, was the first person to recognize the existence and function of microorganisms in food. Heshowed that the souring of milk was caused by microorganisms, and in about 1860, he applied heat for the firsttime to inactivate objectionable organisms in wine and beer, in a process now known as pasteurization. Selectedimportant actions with time in the history of food preservation, food spoilage, food poisoning, and foodlegislations are listed below.
Chronological development of food preservation (Gupta et al., 2015)
1782—A Swedish chemist introduced vinegar canning1810—Nicolas Appert patented canning in France1825—A US patent was granted to T. Kensett and E. Daggett for preserving food in tin cans1835—For manufacturing condensed milk a patent was granted to Newton in England1837—Corncob canning was first introduced by Winslow1839—Tin cans came into wide use in the United States1840—Canning of fruit and fish was introduced1842—For freezing foods by immersion in an ice and salt brine, a patent was issued to H. Benjamin in
England1843—Sterilization by steam was first attempted by I. Winslow in Maine1845—Canning was introduced to Australia by S. Elliott1853—For sterilization of food by autoclaving, R. Chevallier-Appert obtained a patent1855—Grim wade in England was the first to produce powdered milk1856—A patent for the manufacture of unsweetened condensed milk was granted in United States1865—The artificial freezing of fish on a commercial scale was begun in the United States1867–68—Heating to remove undesirable organisms from wine was introduced commercially1874—Steam pressure cookers or retorts were introduced1878—The first successful cargo of frozen meat went from Australia to England1882—The first cargo of frozen meat from New Zealand to England was sent1880—In Germany pasteurization of milk was begun1882—Krukowitsch discovered the destructive effects of ozone on spoilage bacteria1886—A mechanical process of drying of fruits and vegetables was carried out by an American, A.F. Spawn1890—Commercial pasteurization of milk was begun in the United States1890—Mechanical refrigeration for fruit storage was begun in Chicago1893—The Certified Milk movement was begun by H.L. Coit in New Jersey1895—The first bacteriological study of canning was made by Russell1907—E. Metchnikoff et al., isolated and named one of the yogurt bacteria, Lactobacillus bulgaricus1907—The role of acetic acid bacteria in cider production was noted by B.T.P. Barker1908—Sodium benzoate as a chemical preservative was given official sanction for use in certain foods in
United States1916—Quick freezing of foods was invented in Germany by R. Plank, E. Ehrenbaum, and K. Reuter1917—Freezing of foods for the retail trade Clarence Birdseye in the United States began working1917—Franks was issued a patent for preserving fruits and vegetables under CO2
1920—The general method for calculating thermal processes, spore heat resistance above 212°F waspublished by Bigelow, Bohart, Richardson, and Ball; the method was simplified by C.O. Ball in 1923
1922—Esty and Meyer established z = 18°F for Clostridium botulinum spores in phosphate buffer1928—The first commercial use of controlled atmosphere storage of apples was made in Europe (first used
in New York in 1940)1929—A patent proposed the use of high-energy radiation for food processing issued in France

1929—Birdseye frozen foods were placed in retail markets1943—B.E. Proctor was the first to employ the use of ionizing radiation to preserve hamburger in United
States1950—The D value concept came into general use1954—The antibiotic nisin was patented in England for use in certain processed cheeses to control
Clostridial defects1955—Sorbic acid was approved for use as a food preservative1955—Chlortetracycline was approved for use in fresh poultry1967—The first commercial facility designed to irradiate foods was planned and designed in United States1988—Nisin accorded GRAS (generally regarded as safe) status in the United States1990—Irradiation of poultry was approved in United States1992—The second commercial facility designed to irradiate foods became operational in Florida1997—The irradiation of fresh beef was approved using dosage up to a maximum level of 4.5 kGy and for
frozen beef up to 7.0 kGy in United States1997—Food and Drug Administration, United States approved Ozone as GRAS for food use
5. The Need for and Benefits of Industrial Food PreservationThe principal crisis facing all nations is that the majority of people around the globe live with a low level ofindustrialization whereas preserved foods are established as a considerable constituent of the diet of populations inhighly industrialized countries. Currently, most nations are in the process of encouraging industrialization andfurther urbanization. As a consequence, people are moving into regions where industrial opportunities and thepromise of a better life exist. This dislocation of population means that improved methods of food production,storage, and distribution are required to feed not only the already located urban population but also to feed thosewithdrawing from farming occupations who formerly were at least producing their own foods. Tied with thisdevelopment is the explosive increase in human populations on Earth. This increase is also concentrating in themetropolitan areas of the globe.
The current scenario reflects the fact that a great number of people in the world is experiencing better standardsof living than ever before and are demanding higher quality foods. The kind of food they are demanding resultsfrom the successful combination of the most advanced methods of food production technology with the existingmethods of food storage and distribution technologies of the present day.
The highly perishable foods are also the high quality foods it has greatest demand. Fortunately by the carefulapplication of present technology most perishable foods can be made stable and acceptable. With the successfuluse of food preservation techniques, the accessibility of perishable foods can be extended, thereby contributingusefully to human welfare.
Commercial food preservation develops food supplies in other ways as well. It encourages and/or initiatesintensive food production practices and at the same time reduces losses due to spoilage and decay in harvestedfoods. Together these increase food supplies and eventually lower unit food costs.
Only 10% of the world’s populace is presently consuming stored processed foods frequently as vital constituentsin diets, and therefore the potential for the growth of the agricultural and food preservation industry is enormous.This growth is clearly recognized at this time and is urgently needed.
6. Principles of Food PreservationsThe modern method of preservation of fruits and vegetables and preservation of other food products in particularmay be broadly classified as shown in Table 2.1 (Girdhari et al., 1998).

Table 2.1
Food preservation methods.
Methods Preservation TechniquesPhysical methods
By heat removal (preservation bycold)
RefrigerationFreezing preservationDehydro freezing preservationCarbonation
By heat addition (thermalprocessing)
Stationary pasteurizationAgitating pasteurization/sterilizationFlash pasteurization/HTST processing, and so on.
By water removal (evaporation ordehydration)
1. Sun drying2. Dehydration3. Low temperature evaporation or concentration4. Freeze drying5. Accelerated freeze-drying6. Foam mat drying7. Puff drying, and so on.
By irradiation Dosing with U.V. or ionizing radiation etc.
Chemical methods
By addition of acid, such asvinegar and lactic acid
Pickled vegetables, fish, and meat
By salting or brining Vegetable/fruit pickles, salted fish, and so on; salt-cured meat and pork, and so on.
By addition of sugar and heating Fruit preserves, jam, jellies, marmalades, and so on.
By addition of sugar and heating 1. Using water soluble salts of sulphur dioxide, benzoic acid, sorbic acid, and a few like hydrogen peroxide,and so on, which are permitted as harmless in foods.
2. By means of substances of bacterial origin, such as tylosin, resin, and so on, which are permitted to alimited extent, in some cases as harmless additives.
By fermentation Alcoholic and acetous fermentation as in case of fruit wines, apple cider, fruit vinegar, and so on.
By other methods A judicious combination of one or more of the methods mentioned above for synergistic preservation.
Various conversion unit operations (Sivasankar, 2013) are used in food processing and preservation. The variousconversion operations commonly carried out in the food industry include size reduction and screening of solids,mixing, emulsification, filtration, membrane separation, centrifugation, extraction, and crystallization.
1. Size reduction and screeening of solidsSize reduction is carried out by applying:
a. compressive forces employed for crushing hard materials, such as nuts in roller crusher,b. impact forces used in hammer mills for coarse, medium and fine grinding operations, andc. shear or attrition forces in disc attrition mills and ball mills used for fine grinding of softer,
nonabrasive materials.The term reduction ratio indicates the ratio of the average size of the feed to that of the product.2. Disintegration of fibrous materials3. Screening4. Mixing5. Emulsification6. Filtration7. Membrane separation8. Centrifugation9. Extraction
10. Expression11. Crystallization
a. Crystallization of ice in foodsb. Lactose crystallization

c. Fat crystallization12. Heat processing
a. Infrared heatingb. Dielectric heatingc. Microwave heating
7. Technologies Applied to Food Processing and PreservationTo manufacture foods and beverages, following mechanical operations, methodologies, and technologies aretypically used (Potter and Hotchkiss, 1995).
7.1. Mechanical OperationsFood manufacturing systems are based on combinations of various mechanical operations intended to alter thesubstances by using physical methods. The majority of these processes have been functional in food production fordecades. One example is cocoa bean processing, from harvesting to making cocoa liquor and finally to pressing toseparate cocoa powder from cocoa butter. Bakery products as well as breakfast cereals also require mechanicalprocesses. Unit operations are used to manufacture one or more of the raw food ingredients that are importantessential ingredients in the consumer products. Oil is extracted from oilseeds either by mechanical expeller or bysolvent extraction method and requires numerous pretreatments involving many mechanical operations beforeextraction. In most cases, these unit operations are a part of the sequences essential to the most efficient utilizationof the oilseeds, including the recovery of by-products for customers to consume. An alternative exceptionalmechanical operation is dry or wet mixing, relating to blending of numerous raw materials to ensure the consistentand uniform sharing of the mixture of raw materials before the final manufacturing step.
7.2. Application of HeatPreservation of raw food ingredients or processed foods by the application of thermal energy is the most popularand extensively used technology since antiquity. Nicolas Appert and others studied the cooking of foods in cans,and learned that recontamination does not occur instantly from the atmosphere. Increasing the temperature at anappropriate level and holding at that level for an optimum time period is dependent on the nutrients present infood, the purpose of the step, the quantity of pathogenic or spoilage microorganisms present, and the extent towhich they are reduced significantly in quantity or destroyed completely. The influence of heat on the structureand nutrient content of food during thermal processing also occurs during cooking and can cause off-flavors andalteration of texture, as well as some losses of heat-sensitive essential nutritious components. On the contrary,several foods with long shelf life are obtained as a result of heating. Relatively less vigorous thermal processes,such as pasteurization, also assure that milk and milk products as well as fruit juices are secure. In combinationwith chemistry, physics, mathematics, and biology, food science has developed principles of optimization ofapplication of heat to foods for the purpose of expanding their shelf life and to improve their edibility based on thecharacteristics of, for example, texture, flavor, appearance, sensory properties, and has led to the manufacturing ofapparatus using updated novel techniques for thermal processing. Thermal processing broadly can be categorizedinto three classes: blanching, pasteurization, and canning.
7.3. BlanchingBlanching is a pretreatment of food before any unit operation, for example, canning, freezing, or drying, and isgenerally achieved at temperatures less than the boiling temperature of water for 2–3 min or less. Blanching iscarried out by immersing the food in boiling or hot water, by applying steam, or by microwave heating. The aim ofblanching is to deactivate the enzyme activity in foods which catalyzes changes in flavor, texture, and color offood. Other advantages include exclusion of air from the foodstuff to diminish the severity of oxidation reaction,softening of the plant tissue for comfortable packing into packages, and deactivation of anti-nutritional factors(such as trypsin inhibitor in soybeans, a protein decomposing agent that exists in gut). The treatment is relativelygentle. Therefore a minor effect on nutrients is observed and a small quantity of hydrophilic nutrients is leachedinto the water when water blanching is done.

7.4. PasteurizationPasteur observed that application of gentle heat treatment to milk, wine, and beer enhances the storage period byremoving or inactivating microorganisms; the process of mild treatment to the above mentioned products is knownas Pasteurization. According to the regulation declared by U.S. Public Health Service/FDA’s Pasteurized MilkOrdinances, when heat is applied to liquids at a temperature between 60 and 100°C for less than 1 min to kill thecontamination-causing pathogenic microorganisms. Mostly direct heating is given where the liquid was heatedinside the container, but in modern continuous processes, an advanced food engineering process is followed byheat transfer to flowing liquids, using heat exchangers to transfer heat from a hot fluid to a colder one. As thepathogenic organisms are inactivated, but not all spoilage organisms, pasteurized liquid is poured into sterilepackages that are stored in refrigeration conditions to enhance shelf life.
7.5. CanningIn canning, foods are processed thermally to remove one targeted organism, C. botulinum, and other food spoilagemicroorganisms are also inactivated, but not all. Therefore canning is considered as commercially aseptic but notabsolutely aseptic. Canning is commonly achieved by maintaining the food at 121°C for 15 min. In canning, foodis thermally processed after it has been sealed hygienically into a tin-coated steel can, and processing is done inoptimized conditions for maximum retention of nutrients and better quality of canned product for its committedshelf life in terms of taste, flavor, and color. The success of this technique of food preservation by eliminatingdiseases, which cause due to nutrient deficiency can be minimized, for example, in canned fruits and vegetablesbeing a source of vitamin C independent of seasons.
7.6. Refrigeration and FreezingFood preservation by refrigeration has beens well known for centuries. Ice is used to reduce the temperature offoods to prevent spoilage. Refrigerators are significantly used in every home in developing countries. Microbialpopulations cannot be inactivated at low temperatures; it only diminishes the severity or rate of growth adequatelyto stop the spoilage in food products and to increase the shelf life of most perishables. Fruits and vegetables arestored in refrigerators to retain freshness of perishable items by arresting enzymatic reaction, eventually preventingthe spoilage of quality of food and beverages, and resulting in foods with prolonged shelf life (Heldman andHartel, 1997). Though heat application during pretreatment inactivates enzymes and destroy microorganisms,refrigeration is also required to control the growth of spores that begin to cause spoilage in later stages. Pasteurizedmilk is a suitable example, which is first pasteurized followed by refrigeration.
In refrigeration the temperature of a food is reduced to a point below the freezing temperature of water whichresults in the phase change of the liquid water to ice. Freezing of food products at lower temperatures (−0.4 to−14°F), causes diminution of the rates of spoilage and quality attributes of the product are retained, and microbialgrowth is reduced to negligible levels. It is a typical practice for frozen fruits, vegetables, and meat products tosafeguard quality features for up to 1 year in frozen foods. Frozen desserts like ice cream are prepared by freezingprocess by keeping most nutrients unaffected or minimally affected and maintaining more apparent qualityattributes. During the enlargement of ice crystals within the tissues of a plant or animal food, a series of reactionstakes place with probable impacts on flow behavior or deformation and consequently on sensory properties. Thus,precise manipulation of time and temperature of freezing and the size of ice crystals of any product at the time ofdelivery and storage is most noteworthy to sustain the best quality characteristics (Erickson and Hung, 1997).Freezing of fruits and vegetables in small pieces occurs very rapidly, and uniform distribution of small tiny icecrystals is observed. In the case of large structured products like beef, slow freezing is carried out, which results inbigger ice crystals distributed nonhomogenously in the product. The quality attributes of refrigerated and frozenfoods are comparable with fresh foods (Mallet, 1993).
7.7. DehydrationDehydration arrests the growth of microorganisms and most chemical reactions. Elimination of water causes areduction in volume and weight of food products, which offers an advantage in making liquid into powder withlonger shelf life, for example, instant coffee or a vegetable soup mix. Because dehydration is the oldest, cheapest,

and most energy-conserving preservation technique, this method is extensively used worldwide (King, 1968;Saravacos, 1965; Thijssen 1979; Von Loesecke, 1943). Dehydration is generally done by evaporation,vaporization, or sublimation (during freeze drying), following a successive procedure of heat, mass, andmomentum transfer (Whitaker, 1977). This process takes place principally by intra and inter transfer of masswithin the food itself and between the food and the drying medium, and guarantees diminution of moisture.Elimination of water and dehydration contribute to preventing nonenzymatic browning, caramelization of sugar,denaturation of proteins, and pyrolysis dehydration. During dehydration the features of the original product changeabsolutely, along with evaporation of volatile notes, gelatinization of starches, and finally alteration of structure offood materials (Viollaz and Alzamora, 2005). The following types of dryers are commonly used:
• Tray dryer• Fluidized bed dryer• Drum dryer• Vacuum dryer• Spray dryer
Innovative light-driven refractance-window dryers are used for a very broad variety of foods. Sun drying is thetraditional method and is still widely used today. With constant technological improvement in diverse fields,drying is relentlessly evolving to recommend superior quality and innovative products. For design of novel dryersand unique drying techniques, mathematical modeling and process simulation have played a major function in thegrowth of this very complex process. Combining of either two or more dehydration processes or one dehydrationmethod in combination with another processing method is being implemented to optimize cost, food quality, andsafety. Combined microwave and vacuum drying, ultrasound-assisted air-drying, and encapsulation of flavor andflavor impregnation to improve quality can be accomplished by these methods.
7.8. AcidificationRaw fruits, vegetables, and processed foods and beverages differ extensively in acidity level. Higher pH level infoods causes them to be prone to microbial contamination and thus more degradable. In this century the intentionalcontrol of pH level in food has been considered as a preservation method, in making pickles. The basic standard ofthis method depends on the interference of growth of various contaminating microorganisms and pathogens at anelevated quantity of acid. By changing the acidity, the multiplication of microorganisms will be prohibited thatfacilitate to expand the shelf life of the product, and keeping most of its features. Acidification technique can beaccomplished by regulating the acid level to control the total acidity level of a specific product, or by using thefermentation process. Adjusting the acidity is generally used together with other techniques such as heating,addition of additives, or refrigeration to accomplish maintenance and protection, as acid alone may not besufficient to preserve the product entirely.
7.9. FermentationFermentation is a very old preservation technique that is popular worldwide. Fermentation is a process wheremicroorganisms convert fresh foods in to a chemically different more nutritious food having better taste withlonger shelf life food product which can be stored without refrigerator. Although some microorganisms preventfood spoilage and many types of microorganisms cause food poisoning, a few microorganisms can supportattractive changes in foods leads to unattractive or hazardous foods. In fermentation, before the unwantedmicroorganism grows and hampers the product safety as well as quality, the desirable microorganisms grows andchanges the chemical structure of the product. Desirable microorganisms produce lactic acids and pH of themedium will decrease and acidity will increase, carbon dioxide will be produced, oxygen content will decrease,and ethanol will be produced, as well as act as a preservative by preventing the growth of unwantedmicroorganisms. Yeasts generate carbon dioxide to expand the volume of bread dough to provide a spongyconsistency. Yeast is extensively used to manufacture alcoholic beverage and is exclusively accountable for themaking of ethanol. Other very well known examples of fermented dairy products are yogurt and ripened cheeses.Different regions of the world enjoy unique fermented products, for example, injera is one of the famous Ethiopianindigenous product, kimchi is an indigenous fermented product of Korea made from cabbage, and another famous

fermented product is salami, famous in Italy and Germany. In Northern Europe the fermented product sauerkrauthas become famous all over the world. Cocoa beans undergo fermentation after harvesting prior to cleaning androasting, to impart the most desired color, flavor, and sensory properties to all varieties of chocolate products.
7.10. Water Activity (aW)Water activity (aW) is a very essential and most convenient means to manipulate the quality attributes of foodproducts, such as hygiene and security. The perception of aW was first established in 1950s, when researchersproved that water activity is a most crucial factor that affects the growth rate of microorganisms. During the 1960s,researchers confirmed that aW is essential to manipulate the chemical and biochemical reactions rates that causerotting of foods, and in the 1980s it was also established that consistency or crispness of dry foods and caking ofpowders, for example, for instant coffee, spices, powders, and so forth is also affected by water activity. Wateractivity, aW, is not the measure of direct moisture content of a sample, or does not indicate the free or bound waterof a food product. aW has been modeled by many researchers and has been applied in food product development tolaunch new products that are nutritious, tasty, and more secure to prevent food poisoning. Changes in productconsistency and texture, for example, loss of crispness, depends on aW values between 0.3 and 0.65, whiledevelopment of stickiness, hardening, lump formation, and so forth, indicates aW values at 0.85 or above, which issuitable for maximum pathogenic bacterial growth. The Code of Federal Regulations established the conditions fordry mixes, nuts, intermediate moisture foods, and dehydrated foods that depend on the manipulation of aW todisrupt the microbial growth that will be processed to maintain a safe moisture level. It can be accomplished byvarious methods, such as (1) scrutinizing the aW of raw material and finished product, (2) optimization of thesoluble solids to water ratio during processing of end product, or (3) inhibiting moisture pickup in end produce sothat aW does not rise to a risky level. In addition, aW is the essential factor to control the enzymatic and chemicalreactions, like lipid oxidation and other chemical and biochemical reactions that have an effect on sensoryproperties, especially on appearance and quality, such as modification in color, flavor, aroma, and loss of vitamins(Labuza et al., 1970). Correlations between free or bound water in food and aW of higher as well as intermediatemoisture food also represent essential information for selecting particular ingredients to fabricate and to retain asafe aW, that is, below 0.85. To manipulate and control the textural changes and stability of the quality attributes ofingredients and end product, it is also essential to know the range of aW for a food product. Food-grade acidulatesand preservatives such as citric, acetic, lactic acid and benzoate, sorbate, metabisulfite are added to preventmicrobial growth to maintain the quality of food products. Sometimes for meat, fish and poultry products anadditional smoking step is also incorporated. The efficient control of aW during product formulation ensures thehighest quality and shelf life of dry and intermediate moisture foods (Labuza et al., 1970). Traditional foods likebeef snacks, dry fruits, and granola bars are easily obtainable and offer superior quality attributes. Preservation bysimple addition of salt or sugar to preserve meat or plant food has been prevalent from time immemorial.
7.11. SmokingSmoking is an ancient process of food preservation. Although it was discovered by primitive cave dwellers whenthey began cooking using fire and realized that after smoking the taste of meat and other perishable products isenhanced with a distinctive and pleasant aroma and taste with enhanced shelf life. For cheese, meat, fish, poultry,and other perishable food items, preservation with smoking is extensively used. A traditional meat snack, jerky, isproduced by smoking followed by dehydration and have now altered into a new variety of salty and spicy snackfoods. The smoking method has been scientifically designed to an extremely controlled process to get themaximum advantage. Smoking offers four advantages to get safe and delicious foods:
1. Food safety: Smoking inactivates the surface bacteria and others. Smoking is considered one of the mostfundamental food preservation techniques. Though smoking is less widespread nowadays, it is proved tobe effective to control bacteria in smoked food items.
2. Acids and alcohols are produced at the time of ignition of wood, and assembled on the outer surface of theproduct, which acts as an antibacterial agent. Moreover, smoking techniques are used along with heatsimultaneously, to prevent spoilage and contamination by pathogenic bacteria. As smoking results in

surface dehydration of the product, therefore it causes the cessation of microbial count during an extendedperiod of storage.
3. Quality–flavor and aroma: Smoking imparts a unique, very gratifying, and satisfactory aroma and flavor toa smoked food. Nowadays consumers look for a variety of taste and eating experiences. Scented woods areused to generate smoke, in combination with chicory, apple, and other flavorful foods, to accomplish arange of tastes.
4. Quality–visual appeal: Smoking provides a highly impressive, unique surface color in smoked meats. Thedark mahogany color provide strong appeal to a smoked ham therefore it is definitely accepted bycustomer. It interacts, supports, and delivers the associated desirable aroma and flavor to a smoked ham.Smoke acts as an antioxidant and flavor protector.
In spite of the merits of smoking, three demerits have intermittently been established for the use of smoke forfood preservation.: (1) because of the burningof wood during smoking, atmospheric emissions result; (2) somefood nutrients deteriorate in smoke; and (3) ignition of wood generates unfavorable toxic and/or carcinogenicpolycyclic hydrocarbon compounds. Smoke accumulation entirely appears on the exterior of the product to athickness of 1.4–1.2 in., with very minute diffusion below the surface. Liquid smoke, a condensed mixture ofnatural wood smoke, can also be used for smoke application. Liquid smoke is equivalent to natural smoke andprovides the same outcome on color, flavor, and microbial control, but liquid smoke is more consistent, withoutany atmospheric emissions, and more easily reproduced. Smoking imparts a uniform smoked flavor in the productbut unwanted toxic/carcinogens are removed from the extract. The level of smoked product process should bementioned. Normally by dipping, soaking, spraying, or dispensing process, liquid smoke can be employed using ofsmoke-permeable sausage casing results in collection of smoke on the external surface of the food withcomparable product effects formed by the outer surface treatment of natural smoke.
7.12. IrradiationIn the past 4 decades ionizing radiation has been applied commercially in food preservation to inactivate bacteriaand to stop insect infestation in food. Radioactive isotopes such as cobalt-60 or cesium-137 and electron beamsfrom linear accelerators are commonly used for irradiation of foods. The radiation dose is optimized based on thechemical constituent, physicochemical properties, microbial load, and the presence of enzymes in the food.
The radiation dosage required for most of the foods has been established taking spores of C. botulinum as themost heat-resistant species. The DM value indicates dose requirement to reduce 90% spores, and in the case ofbeef, it was estimated to be 0.4 Mrad. A 12 DM value (4.8 Mrad) of radiation dosage provides completesterilization of the food. Where 100 Mrad = 1 MGy; Mrad is typical tolerance of radiation-hardened microchips.
Natural enzymes present in the food have higher resistance to radiation compared to the spores of C. botulinum.The given DE values for enzyme destruction (radiation dose necessary to decrease the enzyme activity by 90%) arein the range of 4–5 Mrad. The radiation dosage required for total destruction of enzyme activity would be at least 4DE values, that is, 20 Mrad, which would destroy the food constituents and thus impair the safety of the fooditself.
The radiation treatment given to foods can be classified as (1) radappertization, (2) radicidation, and (3)radurization.
Radappertization is equivalent to radiation sterilization, which achieves commercial sterility as practiced in thecanning industry where the typical levels of radiation are 30–40 kGy. C. botulinum type E spores with radiation Dvalues of the order of 0.12–0.17 Mrad are most radiation sensitive, while spores of types A and B have higher Dvalues on the order of 0.279 and 0.238 Mrad, respectively. In general, radiation resistance of microorganismsincreases at lower temperatures. To achieve 12D treatments of meat products at about 30°C, irradiation is appliedusing 41.2–42.7 kGy for beef and chicken, 43.7 kGy for pork, and 31.4–31.7 kGy for ham and codfish cake. Theuse of radiation of 12D values for C. botulinum in meat products would not kill all the viruses and hence thesemust be destroyed by heating or other means prior to irradiation (Sivasankar, 2013).
The disadvantage of radappertization is that the food product which undergoes color changes and produce theoff-flavors cannot be irradiated. Radappertization is applied to decrease the nitrosamines in bacon containingsodium nitrite. Addition of sodium ascorbate prior to irradiation is necessary to reduce nitrosamines.

Radicidation uses 2.5–10 kGy and is equivalent to pasteurization of milk. It reduces a number of nonsporeforming nonviral pathogens. Fresh poultry, cod and red fish, spices and condiments have been approved forradicidation in some countries.
Radurization may be considered as equivalent to pasteurization. It enhances the keeping quality of foods byreducing the numbers of spoilage microbes. The range of dosage levels used is 0.75–2.5 kGy for fresh meats,poultry, seafood, fruits, vegetables, and cereal grains.
7.13. ExtrusionExtrusion technology is well known as extrusion cooking in food industry. It is used to prepare so-calledengineered food or special animal feeds. With application of shear energy, produced by the rotating screw, and dueto additional heating of the extruder barrel, the food material will reach to its melting point or plasticizing pointconsequently the rheological properties will change. In this changed rheological status the food is conveyed underhigh pressure through a die or a series of die and the product expands at the final end as it releases pressure.Physical and chemical properties of extruded products are completely different from the raw materials.
In extrusion-cooking, due to sudden release of pressure and temperature at the end of the die, the food materialexpands rapidly and the extrudates are structurally similar to a honeycomb, shaped by the bundles of moltenprotein fibers. In this case, a simple, single-screw food extruder is used to manufacture various types of products,different in shape, color, taste, and texture (Guy, 2001; Moscicki et al., 2007; Van Zuilichem, 1992). Thetechnology for each of them requires an appropriate distribution of temperature, pressure, and moisture content ofthe material during processing. As the thermal process is essential in the design and construction of moderncooking extruders, the main task is to obtain good-quality extrudates, flexibility, and precise control. More often,the method for the production of particular foodstuffs has to be developed empirically.
Exceptionally important are the issues related to the consumption of energy of extrusion-cooking of fruits orvegetable raw materials. Measurements of energy consumption in single-screw food extruders are in the range of0.1–0.2 kWh kg–1 (excluding the costs of material preparation, that is, the grinding and conditioning) (Moscickiand Zuilichem, 2011). This demonstrates that extrusion-cooking is highly competitive in comparison with theconventional methods of thermal processing of vegetable material. Of course, this does not mean that extrusion-cooking is ideal for all applications. It is a substitute and, in many cases, competitive in relation to other methodsof food and feed manufacture.
From the foregoing it can be stated that a food extruder may be considered as a reactor in which viscosity is thedependent parameter for optimization of temperature, mixing speed and contact time are the other importantparameters. Quality parameters such as the texture are also often dependent on the viscosity. The influence ofvarious extruder variables like screw speed, die geometry, screw geometry and barrel temperature on the producedquality has been described by numerous authors for many products (Bruin et al., 1978; Harper, 1981; Mercier et al., 1989; Moscicki and Pylls, 1993). It is the general opinion that extruded products are secure to consume, anddevoid of any harmful consequences.
7.14. Preservation by CA/MAThe shelf life of numerous fresh foods has been elongated by altering the gas composition inside the container indirect contact with the food. For short shelf-life products vulnerable to chemical or enzymatic degradation, forexample, oxidation, extended shelf life products can be obtained by evacuating oxygen from the packet(Floros, 1990). The freshness of fruits and vegetables can be extended by manipulating the oxygen and carbondioxide ratio in the packet.
7.15. AdditivesFood additives are the optional ingredients in food processing that provide appearance, richness, and appeal to theproduct by incorporating color, flavor, and taste, and enhancing the shelf life of a particular food product bypreventing or destroying microflora in food. Many food additives are added to enhance safety, provide enrichednutrients, and make foods more attractive, cheaper, and user friendly in the current food delivery system. Foodadditives can be defined as any material incorporated to food in minute quantity to achieve a particularphysicochemical effect. They develop the new variety and make the product palatable by employing a

comparatively new food processes available, and they make the processes user friendly and economical. In icecream a manufacturing additive like stabilizer is added, which makes the ice crystal smooth; otherwise small icecrystals coalesce into larger crystals, which makes a gritty texture. For flour and spice powders, lumping isprevented by the spraying of fumigants during storage. Iodate-fortified salt prevents rickets and goiter. As naturalcolors are unstable, artificial food-grade synthetic colors are extensively used to make food products moreattractive. People with diabetes cannot use sweetened beverages, desserts, and confections and therefore highcalorie sweeteners are replaced with nonnutritive sweeteners in diabetic beverages and confectionary products, forexample, Diet Coke. Preservatives, enzymes, anti-caking agents, emulsifiers (to enable retention of stable oil inwater mixture), and humectants (which disable moisture transfer) are examples of food additives. Acidulants,antioxidants, emulsifiers, leavening agents, micronutrients, and nonnutritive sweeteners and so forth, are the foodadditives among 32 categories of additives identified by the Code of Federal Regulations. It is a general rule ofthumb that when an ingredient is used at less than 1%, then it is called an additive.
7.16. PackagingFood packaging protects food materials from chemical and biological hazards, provides convenience, and impartsinformation of its composition, consistency, size, shelf life, and so forth (Brody et al., 2008; Paine 1991;Robertson 1993; Yam et al., 2005). Raw or processed food products are served to the customer in some form ofcontainer and correctly packaged to confirm that attributes of the products are improved by that particular process.Immediately after washing and cleaning, fresh produce is packed. Packaging provides a vital sector of foodsecurity by removing infectious pathogenic bacteria. Additionally packaging lengthens the shelf life of the foodproduct by providing a physical barrier and protecting a product from atmospheric gases including oxygen,moisture, light, and other degrading agents. Packaging also conveys the crucial information to the user in terms ofthe tag, containing information about type of product, source of raw material, quantity used, final composition ofthe product, nutrient content, manufacturing and expiry date, batch no, manufacturer address and so forth. Typicalfood packaging materials are glass, paper, metal, and plastic, and microwave-protected packages. Some emergenttechniques such as active and intelligent packaging are recently used for food packaging (Brody et al., 2008;Floros et al., 1997; 1998; Han and Floros, 2007; Ozdemir and Floros, 2004; Suppakul et al., 2003; Yam et al., 2005). Aseptic packaging is an emerging technique in which the food and packaging materials are sterilizedseparately and packed and sealed in aseptic conditions. This process permits considerable up-gradation of qualityattributes of the end product as very gentle heating is needed as compared to the extreme heating applied intraditional techniques (Floros, 1993). With a combination with commercial scale aseptic storage andtransportation, a high percentage decrease of postharvest losses has been observed. Consistent advancement innovel food packaging research signifies that it will respond to new, challenging food structures and the need formore nutrient-rich functional food products.
7.17. Emerging Novel ProcessesThe past 2–3 decades have witnessed the advancement of several nontraditional food processing and preservationtechniques to develop safer nutrients rich functional foods. These are (1) microwave and Ohmic heating, a type ofthermal processing that is also faster and provides extended shelf life to food as compared to traditional canning;and (2) other nonthermal processing methods that reduce microbial load to a negligible quantity, such as ultra-highpressure (UHP), pulsed electric fields, ultrasonic waves, high-intensity pulsed light, cold plasma processing, and soforth. The objectives of all the newer techniques are reduction of processing time temperature with better qualityattributes and extended shelf life in foods, to replace traditional techniques.
7.17.1. Microwave heatingThis method of heating of already cooked ready to eat foods and beverages as well cooking of raw foods is well-accepted and extensively used worldwide, but this process is still limited to only a small scale. The FDA approvedthe microwave sterilization for canning of low-acid foods in (1) continuous process for aseptically packaged sweetpotato puree in sterile flexible pouches, and (2) for a semicontinuous process for prepackaged food.
7.17.2. Ohmic heating

Ohmic heating comprises transmission of electrical charges from foods via electrodes. It is a tremendouslyefficient to produce protein-rich heat-sensitive foods (Ramaswamy et al., 2005). Ohmic heating uses fast andconsistent electrical energy by permitting improved features in food. Cut or whole fruits and liquid eggs aresterilized extensively by Ohmic heating. In the future, other food products also will be treated by Ohmic heatingfor sterilization.
7.17.3. High-pressure processingIn the current decades, the most popular emerging technique is UHP or high-hydrostatic-pressure processing, it isconsidered as a robust, potential future technique for food preservation. In this process, without significantelevation of temperature, microbial populations are reduced. The application of pressures up to 100,000 psi andholding at that pressure for a particular time produces food with fresh food characteristics in terms of sensoryproperties, consistency, considering food safety with excellent quality and longer shelf life. In addition to UHP,high temperatures are applied to destroy spores. The UHP is faster and causes negligible deterioration of qualityattributes of food compared to conventional sterilization. In this case, pressure is applied and the temperature ofpackaging material is increased very fast inside a pressure vessel until a suitable final temperature is reached, afterholding for a few minutes pressure is released and the product is returned to its initial temperature by cooling.
7.17.4. Pulsed electric fieldsElectric pulse of very high voltage (>20 kV) is used for few microsecond, which can reduce microbial load withoutelevating the temperature of food; therefore, it has the potential to pasteurize liquid food products, for example,fruit juices and so forth. To optimize the process, additional information is needed to evaluate the effect of theprocess condition on quality as well as nutrient retention in food products and microbial load reduction (Sanchez-Moreno et al., 2009).
Modern research revealed that few of these novel emerging techniques produce products of excellent qualityattributes with highly nutritious food material with negligible chemical deterioration of nutrient as compared totraditional thermal processing. Approval from regulatory authorities and finally from consumers, comprises acomplete assessment of any novel technique.
8. Food Waste ManagementAbout one-third of total production of raw food crops get wasted from firm to fork. The causes and quantities oflosses are different for developing countries compared to developed countries (Godfray et al., 2010). Chiefly dueto infrastructure deficiency and lack of information regarding preservation, losses take place from spoilage andinfestation due to rodents, pests, molds, and other microorganism’s results in the emergent countries. Losses takeplace during developing, harvesting, and postharvest storage period. On the other hand, in urbanized countriesactual losses of food grains are observed during retailing, in storage of service organizations and in the home. Thelosses in developed countries are caused by lack of proper storage infrastructure that can prevent wastage and offermore economical foods (Godfray et al., 2010). There are remarkable economic advances to reduce waste in foodmanufacturing practice, which assure the utilization of the latest or changed manufacturing steps, in-planthandling, and recycling (Hang, 2004). Many animal feeds are manufactured using food processing waste(Hudson, 1971), and techniques have been designed to utilize food processing waste and to convert into biofuels,biomaterials, food additives, and other edible valuable ingredients (Hang, 2004). These waste-managementpractices are believed to be part of the improvement in the life-cycle assessment of the environmental impact ofthe whole food chain (Ohlsson, 2004). The objective of this assessment is to identify the level in the food chainthat has the maximum ecological effect. Effect of such evaluation is the source for selecting the alternativecomposition of raw ingredients, packaging constituents, and other processing condition, and a completemodification in waste-management approach for environment for human being (Ohlsson, 2004). Life-cycleevaluation provides a supplementary predefined comprehension for energy consumption and waste generation(Mattsson and Sonesson, 2003).
The food or beverage processing consists of a range of techniques and processing steps to alter unprocessedfood crops to processed food products with high retention of quality attributes into products and available year-round and worldwide to assist with food security. The processed foods and beverages can have definite beneficialeffects on nutrients beyond those of the unprocessed or home-cooked products. Retention of nutrient varies,

depending on commodity or type of food product, composition (for example, whether the nutrients are sensitive toheat treatment or oxidation, and whether it is soluble in water) region of cultivation, time of harvesting, storageenvironment, and processing conditions and so forth. Considering these variables, processed foods are made extranutritious by enriching with vitamins and enhancing their bioavailability as compared to fresh produce (Rickmanet al., 2007a,b). Expenditures on food, in terms of household expenditures (%) are shown in Table 2.2(ERS, 2008). Price is an exceptionally significant attribute for most customers, chiefly for low-income groupsduring purchases. When consumers enjoy the taste, consistency, and mouth feel and have find desirable qualityfeatures only then do they procure and eat. Consumers have a genuine role in our food supply, but the share shouldnot be exceptionally large.
Table 2.2
Share of food expenditure in total expenditure (%).
Country Share of Food Expenditure in Total Expenditure (%)United States 5.6
Canada 9.1
Germany 11.4
Japan 14.9
UK 16.4
Brazil 22.7
Mexico 24.1
Indonesia 50.6
India 53
Bangladesh 56
Nutrient levels in certain foods can be maintained using some forms of preservation. After harvesting of fruitsand vegetables, senescence begins and they begin to lose nutritional qualities. Freezing or canning can preservelevels of certain nutrients. It is a general belief that canned foods are as nutritious as their fresh or frozencounterparts. Factors such as harvested time, storage period, and manufacturing conditions determine whether thefresh, frozen, or canned version of a food is the most nutritious choice. Highly processed foods are healthy, butmany foods in this category are high in added sugar, sodium, saturated fats, or trans fats, and contain little dietaryfiber and therefore are not suitable for patients with diabetes.
9. A Few Statistics of Food Consumption in India (MOFPI, 2005)9.1. Level of Food ProcessingManufacturing of food products differs across sectors. As compared to other countries the amount of fresh foodprocessing is lower in India. Fruits and vegetables processing in India is less than 2%. On the demand side,accessibility of a range of fresh produce all around the country and a consumer preference for freshly cooked foodhas transformed into limited demand for fruit- and vegetable-based processed products. On the supply side, thedisintegration across the sequence results in considerable wastage, which diminishes the accessibility of freshproduce and its impact on amenability at the time of making the product. For milk, the degree of processing isdifferent in different processing sectors, for example, in unorganized sectors the degree of processing is 15% andin organized sectors it is 22% (Table 2.3).

Table 2.3
Level of processing of perishable foods.
ProductsLevel of Processing (%)
Unorganized Organized TotalFruits and vegetables 0.5 1.2 1.7
Milk and dairy products 22 15 37
Fish 21 21
Processed meat 6 6
Shrimps 1 0.4 1.4
Marine fisheries 9 1.7 10.7
Few nonperishable crops (such as cereals and pulses), the degree of processing is more than 90%, but aconsiderable quantity is primarily processed by grading, sorting, and milling.
9.2. Consumption of Processed FoodIt is estimated that in India, total food consumption for the year 2003–04 was approximately Indian Rupee8600 billion at current prices, but the market size of processed foods at current prices is calculated at Indian Rupee5300 billion, about 60% of total food consumption. Primary processed products constitute as much as 63% ofprocessed foods, and value-added products represent the balance of 37% (Table 2.4).
Table 2.4
Food consumption (Indian Rupee).
Total food consumption a 8600
Processed foods 5300
Primary processed food (includes packed fruits and vegetables, packed milk, edible oil, milled rice, flour, tea, coffee, sugar, pulses, spices, andsalt)
3300
Value-added foods (includes processed fruits and vegetables, such as juices, jams, pickles, squashes, concentrate; processed dairy products,such as ghee, paneer, cheese, butter, ethnic Indian products; processed meat, poultry, and marine products; confectionery and chocolates;alcoholic beverages, such as beer, spirits, wine, aerated beverages, and malted beverages) and food services for away-from-homeconsumption
2000
Share of value-added products in processed food consumption 37%
Share of value-added products in food consumption 16%
a Excluding consumption of alcoholic beverages and out of home consumption.
Requirements for processed foods in India are reliant on following factors:
1. Low earnings2. Socioeconomic factors3. Raw material sources and price4. Lack of measuring unit5. Existence of mediator6. Expenditure on packing7. Price and quality attributes distribution8. Tax configuration
9.2.1. Overall low incomeTotal spending on food and beverages by Indian consumers is approximately 49%. Low per-capita income andhigh share of food in the utilization basket leads to higher price sensitivity and higher income elasticity in relation

to food expenditures (i.e., with every additional dollar of income, India spends $0.41 on food, USA spends US$0.1 on food, Brazil spends US$ 0.62 on food, while Bangladesh spends US$ 0.73 on food).
9.2.2. Socioeconomic factorsAs fresh fruits and vegetables are easily available, Indians prefer freshly cooked products over packaged products,and it has been considered as nutritious, and these ideas are being justified by medical research, which emphasizesthe merits of utilization of certain products, for example, raw fruits and vegetables, which provide high fiber andvitamin content and antioxidant properties.
A considerable variation in food practices and cooking techniques around the country converts into the choicefor making foods at home along with relatively easy availability of domestic help, which facilitates mealpreparation at home, and has consequently led to low growth in demand for processed products. Though thepercentage of working women in the society is increasing, it is still less than 10% only, including socioeconomicclasses and in metropolitan cities.
Raw ingredients essential for making food at home are definitely accessible, whereas wide varieties of rawingredients are not easily available in other countries in raw form , that is, milk in Thailand, fresh produce in theMiddle East, and so forth.
From statistical reports, it is clear that Indian customers prefer home-cooked foods. Outside the home, foodintake is approximately 5% of the total food consumed and it is estimated at Indian Rupee 350 billion. In UK,outside home food consumption is about one third of total food consumption, but in the United States, it is 50%.
9.2.3. Raw material sources and priceDemand of processed food is also dependent on supply factors, such as the cost of raw ingredients (determined bylow productivity and poor agronomic practices), lack of scale, presence of mediators, high packing andtransportation costs, and poor quality of distribution.
9.2.3.1. Cost of raw material (farm produce)The cost of fresh ingredient is high due to less competence and lack of knowledge of farmers about efficient cropmanagement procedures. A comparison of crop yield of India with developed and developing countries for keyagricultural products is described in Table 2.5.
Table 2.5
A comparison of productivity (kg ha−1).
Country Cereals Coarse Grains Pulses Fruits Vegetables SugarcaneWorld 3,078 2,980 793 9,563 16,846 65,293
China 4,849 4,399 1,507 8,214 19,158 69,556
India 2,356 1,179 552 11,811 12,898 62,859
Pakistan 2,302 1,008 465 8,590 13,426 47,934
Brazil 3,364 3,568 802 14,232 18,758 72,289
Philippines 2,813 1,802 723 11,650 8,481 67,104
Thailand 2,584 3,702 900 9,219 8,878 66,400
United Kingdom 7,030 5,906 3,638 11,794 21,770
United States 6,033 7,843 1,803 22,934 27,099 77,515
Differential in productivity: India and world average −23% −60% −30% 24 −23% −4%
Differential in productivity: India and United States −61% −85% −69% −49% −52% −19%
The incident of low productivity is originated by numerous aspects like:
• Limited information available to farmers about appropriate varieties to be cultivated, which leads to loweryields.

• Lack of precision approach in crop management practices, such as optimal quantity of usage of fertilizersto be useful in various stages of growth cycles of a particular crop, optimal water usage, harvestingtechniques, crop rotation, usage of micronutrients, and so forth.
• Unavailability of appropriate quality and required quantity of various agricultural inputs, propelled byinferior delivery channels, which leads to poor outcome.
9.2.4. Lack of measuring unitGlobally, the growth policy of various food businesses has led to a trend of fusions, procurement, andcollaboration, consequently in the enlarged scale of financial strategy, thus dropping the cost of processed foods.The globally recognized biggest food manufacturers are distinct, with commercial interests in and aroundmultisectors (Table 2.6).
Table 2.6
Scale of operation of a few Indian and international companies.
Company
TotalSales(inUS$billion)
FoodandAgriSales(inUS$billion
Semifinished/IndustrialProducts Bakery Beverages
DairyIceCreams
Meat,Fish
PreparedFoods,Snacks
Edibleoil
Top Five International Food Companies
1. Nestle(CH)
65.4 54.3 a b b c c
2. Cargill(US)
59.9 53.9 b c
3. KraftFoods(US)
31.0 31.0 c c b a b a
4. ADM(CH)
30.7 30.7 b
5. Unilever(GB/NL)
48.6 27.2 a c a c b b
Top Five Indian Food Companies
1. GCMMF 0.6 0.6 b
2. Nestle 0.5 0.5 a b b c
3. HLL 2.2 0.4 c b a a
4. Tata Tea 0.16 0.16 b
5. UB Group 0.14 0.14 b
Lowercase alphabets (a, b and c) indicate the relative importance of the particular segment in the company's business portfolio. a,Important; b, more important; c, most important, or the extent of importance c > b > a.
In contrast, for Indian companies, the size of the business is small and limited to a few products. The lack of ameasuring system is due to an amalgamation of supply-related factors, such as regulatory limitations as well asmarket demand associated factors. Consequently, it leads to higher cost of manufacturing and a low level of globalcompetitiveness. Given these economic factors, it is difficult to reinvest in attributes as well as brand/marketdevelopment.
9.2.5. Existence of mediatorIn the supply chain of fresh produce, from farm to fork, there exist several mediators. The mediators play a majorrole during the shipping of produce to short-term storage, and multilevel manual controls of this system along with

unsuitable facilities for storing and shipping contribute to higher costs and ultimately to higher cost of product. Asan illustration, the key issues in the fresh produce supply chain are listed in Table 2.7.
Table 2.7
Supply chain for fruits and vegetables and issues.
SupplyChain Farmer
VillageComm.Agent
DistrictComm.Agent Wholesaler Subwholesaler Retailer Consumer
Margin (%share offinalprice)
35% 15% 10% 10% 10% 20%
Issues Nontransparent pricing, limitedfinancial capability, primitivecleaning sorting, and gradingfacilities
Waste rampant, lack of quality and hygiene consciousness, lop-sided pricing,opportunistic profiteering
High prices,limitedchoices
The long supply chain leads to deficiency of communication between the farmers and the manufacturers, andeventually there are differences between demand and supply, and lack of information on the farmers’ side tends toresult in higher prices. For example, dealings in mandis for fresh produce are undertaken by commission agents ormediators, using the hatha system. Therefore, if the farmers do not visit the mandis themselves, they are not paidthe genuine worth fetched by their produce by the mediators.
9.2.6. Expenditure on packingPackaging costs account for a major share of the price of the processed and packaged foods. This diminishessignificantly affordability for the consumers. The reason for the high price of packaging includes the cost ofpacking materials including taxes (on material), the cost of packaging equipment, and sometimes the need for aninfrastructure required for packing (Table 2.8).
Table 2.8
Share of packaging cost in consumer prices.
Product Share of Packaging Cost (%)Potato chips 20
Fruit juice 19
Jam 12
Chicken nuggets 8
Branded atta 6
A considerable portion of food is purchased in small packs, which ultimately leads to a higher portion ofpackaging costs as a part of total costs.
9.2.7. Cost and quality of distributionGlobally, the trade of food through organized retail venues has been a growing trend in recent years. Currenttechnology has made large-scale retailing maintained by controlled temperature possible, in support oftransportation from farm to shelf. Procurement synergies have created bigger merchants which carry broadvarieties of goods at reasonable prices. Retail sales of foods by way of structured formats account for 72% of foodconsumption around the world. This segment is less than 1 percent in India (Table 2.9).There are approximately 12million retail venues in India, which occupy about 2 billion sq ft total space. Food and food products occupy about5 million of these outlets in retailing. The extent of food waste is much greater among food retailers as comparedto nonfood retailers. The greater part of fresh produce is sold by peddlers in push carts. Meat, poultry, and marine

foodstuffs are mainly marketed by minor traders in wet markets. As a result, these products are linked with inferiorproduct attributes, lack of diversity, and low sanitation conditions.
Table 2.9
A comparison of the top five international and Indian food retailers highlights the significantdifference in scale of operations.
S. No. International Retailers (US$ billion) Indian Retailers (US$ billion)1. Walmart (USA) 112 Margin free 0.11
2. Carrefour (France) 62 Food world 0.1
3. Ahold (The Netherlands) 53 Subhiksha 0.04
4. Kroger (USA) 38 Safal 0.01
5. Tesco (UK) 38 Nilgiris 0.01
The organized food-vending sector can play a significant role in the advancement of utilization of processedfood items (Fig. 2.2). The phase of growth of retail influences the utilization patterns of end users. The utilizationof processed food has a significant relationship with the growth of retail foods in organized sectors (Fig. 2.2).
FIGURE 2.2 Impact of Retail Development.
In the organized retail sector, as the number of intermediaries has been reduced, the transaction costs arelowered, too. It offers more options and a better shopping experience for the consumer, in comparison to wetmarkets. In addition, it enables manufacturers to check efficiently the market status for their products.
9.2.8. Tax configurationThe structure of taxation on food is higher in India compared to other countries that restrict the affordability ofprocessed foods. Central and state tax duties together increase costs by as much as 30%–40%. Except for liquors,there is zero taxation on food and beverages in several countries, such as UK, Ireland, Malaysia, and so forth, withthe objective to ensure the affordability of these products to consumers (Table 2.10).

Table 2.10
Structure taxes on food in different countries.
Country Excise SaleIndia 0–24 5–20
United Kingdom — —
Ireland — —
Thailand — 7
United States — —
Malaysia — —
9.3. Demand DriversThere are a few factors that drive the demand for processed foods. The key growth drivers are listed in thefollowing list.
1. Changing age profileA growing share of the populace, ages 15–59 years, is a major segment that comprises the active workforce,
and promises the growth of food utilization. This group has the eagerness as well as the capability to buyprocessed foods. In contrast to many developed countries, the population is aging with a growing share ofthe 60+ segment.
2. Increasing incomeThe increasing mobility of income classes is possibly posing challenges to the supply of processed foods, as
has already been established in Europe, the United States, and, more recently, numerous countries inSoutheast Asia. Therefore the middle and upper-middle-income groups in India, are growing faster thanthe low income groups.
The rate of development of food consumption in developed countries is directly proportional to the growthof population, but there is no direct correlation with increase in income. In growing countries, the effect ofincreasing income is two-fold: a major share of extra income is used up on food due to larger incomeflexibility, which supports replacement of staples with greater demand for animal protein and processedfoods.
3. Emergence of organized food retailSales through organized structure have exhibited faster development, even if through a small firm, more than
40% per annum.4. Lifestyle factors
a. Increasing health consciousnessRising health awareness and increasing anxiety about ecological issues with altering lifestyles
will further constrain the development of products that are safe and nourishing. Anincreasing number of producers of fruit juices, edible oils, and dairy products are adoptingthe nutrition related issues as the foundation for the promotion of their product.
The consumption pattern has been significantly influenced by customers’ apprehensionsregarding health-related issues. The frozen processed red-meat sector has been affected dueto customer and vendor reactions to disease outbreaks. BSE as well foot-and-mouth crisespresented challenges for nutritious nonred meat substitute in Europe. Frozen processed fish,poultry, and seafood’s benefit significantly from this move in customer preferences. Thissector is predictably growing its share in the future.
Low-calorie single serve meals are gaining popularity in Western Europe, tapping into theconcern of customers with health and personality. Ready-to-eat meal processors areresponding to this demand by introducing precisely perceived products aimed at a particularconsumer class.
b. Need for convenience

It is one aspect significantly concerned with lifestyle, which comprises convenience duringpurchase as well as convenience in shipping and handling, cooking, and eating. Single-servepacks and handiness are increasing trends to meet the need to eat-where-you-are.Convenience, along with health awareness, has played a significant job in growth ofproducts such as mineral water and packed fruit juices.
Customers’ altering lifestyles will compel food manufacturers to adopt high-quality standards.This implies additional investment required by processors in developing and maintainingsafety and quality standards. Increasingly, product innovations will be concentrated on moreaffordable and high-shelf life products.
10. Processed Food Versus ObesityPublished reports on processed foods recently have tried to establish that the food scientists, technologists,engineers, and food industries have used the skills of food science and food engineering inefficiently to designprocessed foods. Instead of making highly nutritious low-calorie foods, some junk foods with excessive calorieshave been developed that cause poor dietary habits and result in obesity in children and finally chronic illness. Onthe contrary, some groups have claimed that processed foods have been fabricated using the facts of chemistry andbiology of food ingredients, which makes healthier, tastier processed foods that result in overconsumption. Due tothis, the majority of people reject home cooked foods and eventually obesity develops. Actually such allegationsare false, because the decision of what to eat and how much to consume is a personal choice, individuals choice,own willpower in determining their lifestyle factors. There are no established correlations between processed foodsand obesity.
11. ConclusionsCurrently production-to-consumption processing of food is complex, and our food is tasty, nutritious, plentiful,miscellaneous, safe, suitable, economical, and more widely available than in previous times. Advanced knowledgeof food science combined with the success of current food processing methods and the knowledge of biology,chemistry, physics, chemical engineering, material science, microbiology, nutrition, toxicology, biotechnology,genomics, computer science, and many other disciplines are employed to elucidate complex problems, such asidentifying nutrient scarcity and to enhance food safety. The achievement of current food processing methods arerelevant in today’s food distribution technique. The quality of food and food safety has been enhanced. Bioactivenutrients susceptible to heat and light deterioration can be preserved, essential vitamins and minerals can besupplemented, toxins and antinutritional factors (e.g., phytates that limit bioavailability of nutrients) can beinactivated, and novel foods can be designed with respect to human health by reducing hazards that enhance risksfor diseases. Wastage and product loss can be minimized, and the supply of food throughout the world can bemade efficient to allow consistent accessibility of numerous foods. Processing can make food better nutritionallyand enhance the bioavailability of nutrients present in foods. Processing steps, for example, refining and separationof the antinutritional factors is the best process for improving the food nutritionally, add importance to manyfoodstuffs, especially of vegetable origin, for example, processing of fresh tomatoes to make ketchup thatimproves the bioavailability of the carotenoids and lycopenes.
A number of processed food products are positively designed to improve health and wellness that concentrate onmany current designs necessary for specific and having unique raw material and several techniques to producepreferred product features. Many products are enriched with vitamins and minerals (like orange juice orconcentrated milk enriched with calcium for bone health) and other nutrients (like margarine enriched with plantstanols and sterols for heart, rice enriched with carotene) in response to the defined nutritional needs of consumers.Those products are frequently called functional foods, which also deliver the flavor, texture, and other sensoryproperties that fulfill the consumers’ desire.
ReferencesAnand P, Kunnumakara AB, Sundaram C, Harikumar KB, Tharakan ST, Lai OS, Sung B, Aggarwal BB. Cancer is a preventable disease that requires
major lifestyle changes. Pharm. Res.. 2008;25:2097–2116.ASM Systems microbiology: beyond microbial genomics. In: Buckley MR, ed. American Academy of Microbiology, American Society for Microbiology.
Washington, DC: ASM Press; 2005: p. 15.

Brody AL, Bugusu B, Han JH, Sand CK, McHugh T. Scientific status summary: innovative food packaging solutions. J. Food Sci.. 2008;73(8):107–116:A publication of the Institute of Food Technologies.
Bruin S, van Zuilichem DJ, Stolp W. A review of fundamental and engineering aspects of extrusion of biopolymers in a single screw extruder. J. FoodProc. Eng.. 1978;2:1–37.
Erickson MC, Hung Y-C. Quality in Frozen Food. London, United Kingdom: Chapman & Hall; 1997: p. 454.ERS Food CPI and expenditures: 2008, Table 97. Briefing Rooms. Economic Research Service. U.S. Dept. of Agriculture. 2008;1:2010: Available from:
http://www.ers.usda.gov/Briefing/CPIFoodAndExpenditures/Data/Table_97/2008table97.htm.Floros JD. Controlled and modified atmospheres in food packaging and storage. Chem. Eng. Progress. 1990;86:25–32.Floros JD. Aseptic packaging technology. In: Chambers JV, Nelson PE, eds. Principles of aseptic processing and packaging. second ed. Washington,
DC, United States: Food Processing Institute; 1993:115–148.Floros JD, Dock LL, Han JH. Active packaging technologies and applications. Food Cosmet. Drug Packag.. 1997;20:10–17.Floros JD, Ozdemir M, Nelson PE. Trends in aseptic packaging and bulk storage. Food Cosmet. Drug Packag.. 1998;21:236–239.Floros JD, Newsome R, Fisher W, Barbosa Ćanovas GV, Chen H, Dunne CP, Bruce German J, Hall RL, Heldman DR, Karwe MV, Kanbel SJ, Labuza
TP, Lund DB, McGloughlin MN, Robinson JL, Sebranek JG, Shewfelt RL, Tracy WF, Weaver CM, Ziegler GR. Feeding the world today andtomorrow: the importance of food science and technology. Comp. Rev. Food Sci. Food Safe.. 2010;9:572–599.
Girdhari, L., Siddappa, G.S., Tandon, G.L., 1998. Preservation of Fruits and Vegetables. Publications and Information Division, Indian Council ofAgricultural Research, New Delhi, India, pp. 283–307.
Godfray HCJ, Beddington JR, Crute IR, Haddad L, Lawrence D, Muir JF, Pretty J, Robinson S, Thomas SM, Toulmin C. Food security: the challenge offeeding 9 billion people. Science. 2010;327:812–818.
Gupta, R., Ghoshal, G., Shivhare, U.S., 2015. Food Biotechnology: Review In Biotechnology Progress & Prospects. Studium Press, Houston, Texas,United States, pp. 636–669.
Guy R. Extrusion Cooking Technologies and Applications. Boca Ration, FL: CRC Press; 2001.Han JH, Floros JD. Active packaging: a non-thermal process. In: Tewari G, Juneja VK, eds. Advances in thermal and non-thermal food preservation.
Ames, IA, United States: Blackwell Publishing; 2007:167–183.Hang YD. Management and utilization of food processing wastes. J. Food Sci.. 2004;69:104–107.Harper JM. Extrusion of Foods. Boca Raton, Florida: CRC Press; 1981.Harrington JW, Nguyen VQ, Paulson JF, Garland R, Pasquinelli L, Lewis D. Identifying the “tipping point” age for overweight pediatric patients. Clin
Pediatr.. 2010;49:638–643.Harris RBS. Role of set-point theory in regulation of body weight. FASEB J.. 1990;4:3310–3318.Heldman DR, Hartel RW. Principles of Food Processing. New York, NY, United Sates: Chapman & Hall; 1997: 288.Hudson HT. Solid waste management in the food processing industry. In: Proceedings of the 2nd National Symposium on Food Processing Wastes.
Corvallis, OR, United States: Oregon State University; 1971.King CJ. Rates of sorption and desorption in porous, dried foodstuffs. Food Technol.. 1968;22:165–171: 509.Labuza T, Tannenbaum P, Karel SRM. Water content and stability of low moisture and intermediate moisture foods. Food Technol.. 1970;24:543–550.Mallet CP. Frozen Food Technology. New York, NY, United States: Chapman & Hall; 1993: 339.Mattsson B, Sonesson U. Environmentally Friendly Food Processing. Cambridge, United Kingdom: Woodhead Publishing; 2003: 337.MOFPI, 2005. MOFPI Vision, Strategy, and Action Plan for Food Processing Industry in India. Volume I, Robo Indian Finance Pvt, Ltd. Ministry of
Food Processing Industries, Govt. of India.Moscicki L, Mitrus M, Wojtowicz A. Technikaekstruzjiwprzetw orstwie rolno-spo_zywczym. Warsaw, Poland: PWRiL; 2007.Mercier C, Linko P, Harper JM. Extrusion Cooking. St. Paul, MN, United States: American Association of Cereal Chemists; 1989.Moscicki L, Pylls D. Bębny uszlachetniające ekstrudaty typu 01IZ1, Postępy Techniki. Przetwórstwa Spożywczego. 1993;2:31–33.Moscicki, L., Zuilichem, D.J.V., 2011. Extrusion-cooking and related technique. In: Leszek Moscicki (Eds.), Extrusion-Cooking Techniques:
Applications, Theory and Sustainability. WILEY-VCH Verlag GmbH & Co. KGaA, pp.1–24.Ogden CL, Flegal KM, Carroll MD, Johnson CL. Prevalence and trends in overweight among US children and adolescents. J. Amer. Med. Assn..
2000;288:2245–2250.Ohlsson T. Food waste management by life cycle assessment of the food chain. J. Food Sci.. 2004;69(3):107–109.Ozdemir M, Floros JD. Active food packaging technologies. CRC Crit. Rev. Food Sci. Nutr.. 2004;44(3):185–193.Paine FA. The Packaging User’s Handbook. New York, NY, United States: AVI, Van Nostrand Reinhold; 1991: 158.Potter NN, Hotchkiss JH. Food Science. fifth ed. New York, NY, United States: Chapman & Hall; 1995:608.Ramaswamy, R., Balasubramaniam, V.M., Sastry, S.K., 2005. Ohmic heating of foods: fact sheet for food processors. Extension Fact Sheet. The Ohio
State University. Available from: http://fst.osu.edu/Ohmicfactsheet.pdf.Rickman JC, Barrett DM, Bruhn CM. Review: nutritional comparison of fresh, frozen and canned fruits and vegetables. Part 1. Vitamins C and B and
phenolic compounds. J. Sci. Food Agric.. 2007;87:930–944.Rickman JC, Bruhn CM, Barrett DM. Review: nutritional comparison of fresh, frozen, and canned fruits and vegetables II. Vitamin A and carotenoids,
vitamin E, minerals, and fiber. J. Sci. Food Agric.. 2007;87:1185–1196.Robertson GL. Food packaging: principles and practice. New York, NY, United States: Marcel Dekker; 1993: 686.Sanchez-Moreno C, De Ancos B, Plaza L, Elez-Martinez P, Cano MP. Nutritional approaches and health-related properties of plant foods processed by
high pressure and pulsed electric fields. Crit. Rev. Food Sci. Nutri.. 2009;49:552–576.Saravacos GD. Freeze-drying rates and water sorption of model food gels. Food Technol.. 1965;19:193–197.Sivasankar B. Food Processing and Preservation. first ed. Delhi, India: PHI Private limited; 2013:247.Suppakul P, Miltz J, Sonneveld K, Biger SW. Active packaging technologies with an emphasis on antimicrobial packaging and its applications. J. Food
Sci.. 2003;68(2):408–420.Thijssen HAC. Optimization of process conditions during drying with regard to quality factors. Lebensm-Wiss u-Technol. 1979;12:308–317.

Van Zuilichem DJ. Extrusion Cooking: Craft or Science? PhD thesis. Netherlands: Wageningen University; 1992.Viollaz PE, Alzamora SM. Food dehydration. In: Barbosa-Ćanovas GV, ed. Food Engineering: Encylcopedia of Life Support Systems. Paris, France:
UNESCO; 2005:461–477.Von Loesecke. Drying and Dehydration of Foods. New York, NY, United States: Reinhold; 1943: 302.Whitaker S. Simultaneous heat, mass, and momentum transfer in porous media: a theory of drying. In: Hartnett JP, Irvine TF Jr, eds. Advances in Heat
Transfer. New York, NY, United States: Academic Press; 1977:198.Yam KL, Takhistov PT, Miltz J. Intelligent packaging: concepts and applications. J. Food Sci.. 2005;70(1):1–10.
Further ReadingFloros JD, Matsos KI. Introduction to modified atmosphere packaging. In: Han JH, ed. Innovations in Food Packaging. London, United Kingdom:
Elsevier Ltd; 2005:159–172.National Center for Food Safety and Technology (NCFST), 2009. NCFST receives regulatory acceptance of novel food sterilization process. National
Center for Food Safety and Technology, February 27, 2009. Available from: https://web.iit.edu/mediaroom/press-releases/2009/feb/26/ncfst-receives-regulatory-acceptance-novel-food-sterilization.

C H A P T E R 3
Food Technology Approaches forImprovement of OrganolepticProperties Through Preservationand Enrichment of BioactiveCompoundsGuillermo Petzold
Jorge Moreno
María P. Gianelli
Fabiola Cerda
Karla Mella
Pamela Zúñiga
Patricio Orellana-Palma Universidad del Bio-Bio, Chillán, Chile
AbstractFresh foods of different origins are valuable products that nature provides and that humansthrough diverse technologies and processes transform for the convenience and overall comfort

required by modern life. Consumers are demanding processed foods that meet morerequirements, such as that they are rich in bioactive compounds that can help in different waysto promote health, but also that they include attractive organoleptic property. Bioactivecompounds are very popular among consumers, and they are widely distributed in nature,highlighting the polyphenols, vitamins, and probiotic microorganisms. There are innovativetechnologies for preservation and/or enrichment of bioactive compounds in a food matrix, suchas freeze concentration, encapsulation, osmotic dehydration, vacuum impregnation, and ohmicheating. The industrial application of these innovative technologies should be considered formaintaining the organoleptic properties of foods because in addition to their expected healthbenefits they must generate organoleptically food products that are appealing to consumers intexture, flavor, and aroma profile.
Keywords
bioactive compoundsorganoleptic propertiesfreeze concentrationencapsulationosmotic dehydration
1. IntroductionFruits and vegetables represent the simplest form of functional foods andcan be good sources of bioactive compounds. Bioactive compounds areextranutritional constituents that typically occur in small quantities in foods;several studies have reported that they have a beneficial effect on health(Oomah and Mazza, 2000). These compounds, among many others, areused as ingredients in the manufacturing of functional foods andnutraceuticals. Consumption of fruits and vegetables has increasingimportance due to the growing recognition of their nutritional andtherapeutic value. The bioactive compounds vary widely in chemicalstructure and function and are grouped accordingly. Phenolic compounds,including their subcategory flavonoids, are present in all plants and havebeen studied extensively in cereals, legumes, nuts, olive oil, vegetables,fruits, tea, and red wine (Kris-Etherton et al., 2002). Selection anddevelopment of an appropriate food vehicle that maintains the active

molecular form until the time of consumption and delivery of this form tothe physiological target site within the organism are keys to the ultimatesuccess of functional foods. The food industry should be aware that it is notenough to produce healthy, fresh food and bring it directly to theconsumer’s table because the consumer demand for food properties andattributes requires extra effort of the industry. In this context, consumers areincreasingly willing to pay for foods that have been called functional thatare sensorially more attractive as well. The development of functional foodsby the incorporation of bioactive compounds has many technologicalchallenges. One challenge is that the food industry should not provide foodstotally artificially that are very strange and different from natural foods;consumers want food to be as close to natural as possible but also haveadditional properties beyond those of fresh food.
In recent years, innovative technologies have been developed that areavailable to process diverse raw foods, which, together with the traditionalaspects of preservation and transformation of the food, allow one topreserve or to enrich to a certain level the bioactive compounds in rawfoods. These technologies, called emerging technologies, allowimprovement of the organoleptic properties of the raw foods and of sensoryattributes, as consumers prefer processed food that is attractive in flavor,color, texture, and so on; all attributes that can make a the difference in thepreferences of consumption over other products without these desiredattributes.
These innovative technologies (Fig. 3.1) sometimes still have technicalaspects and costs of investment to improve them for industryimplementation (as in the case of freeze concentration), and in other casesthere is an enormous variety of applications in the pharmaceutical andnutraceutical industry (encapsulation); little by little these are being carriedout in the food industry, with multiple possibilities of bioactive compoundsand food matrices in which it is possible to apply them. Severalmicroencapsulation technologies have been developed for utilization in thefood industry, and they offer promise for the yield of functional foods.

FIGURE 3.1 Innovative Technologies: Benefits, Applications,and Some Problems to Solve.
Osmotic dehydration (OD) is a technology that has already had importantdevelopment in the industry, although it still has challenges to be overcometo produce large-scale foods of vegetable origin impregnated with powerfulantioxidant or other bioactive components and that possess verifiedproperties of acting as functional food, with all the benefits for a worldpopulation consuming fewer fruits and fresh vegetables and a sedentarypopulation increasingly beset with pathologies associated with excessweight and obesity. Osmotic drying could be beneficial from twostandpoints: (1) a large percentage of water loss by nonthermal methods and(2) a solute, such as salt or sugar, added to a vegetal tissue to enhance themarket quality of the raw material (e.g., sweetened cranberries, such asraisins or salted dried tomatoes) (Grabowski and Marcotte, 2003).
It is very important to consider a definition of the term “bioactivecompounds”; in this case, they are extra nutritional constituents thattypically occur in small quantities in foods. They are being intensivelystudied to evaluate their effects on health. These compounds vary widely in

chemical structure and function and are grouped accordingly (Kris-Ethertonet al., 2002). Polyphenols, vitamins, and probiotic microorganisms areincluded in this group of bioactive compounds.
Polyphenols are chemical compounds synthesized in plants; they haveantioxidant effects and possess a molecular structure with one or morehydroxyl groups directly attached to an aromatic benzoic ring. Polyphenolsare generally found as esters or glycosides and not as free compounds. Aspolyphenols comprise a large number of molecules, they can be classifiedaccording to their different chemical structures (Moreno et al., 2016b).Phenolic compounds are secondary plant metabolites and are widespread inall vegetables (Panico et al., 2009). Depending on their structure, phenoliccompounds are divided into flavonoids and nonflavonoids, which give riseto other compounds of interest through their antioxidant capacity.
In general terms, there are >8000 phenolic structures that have beenidentified that vary structurally from being simple molecules (e.g., phenolicacids with a C6 ring structure) to being highly polymerized compounds(i.e., tannins). More than 10 classes of polyphenols have been defined onthe basis of chemical structure, and the flavonoids are the most commonpolyphenolic compounds present in plant food. Although polyphenols arepresent in virtually all plant foods, their levels vary enormously dependingon the type and quantity of the plant food. For example, some plant foodsand beverages that are particularly rich in polyphenols are red wine, applejuice, orange juice, and legumes. There also can be marked variability in thepolyphenolic compounds within a food; polyphenolic compounds insorghum can vary by approximately sixfold. The variability is influencedlargely by genetic factors and environmental conditions (Kris-Ethertonet al., 2002).
Vitamins are defined as a complex group of micronutrients of biologicalorigin with different structures and functions; they are present in food insmall amounts (traces) and can be classified as water-soluble and fat-soluble vitamins. These compounds are necessary for normal functioning ofthe body because they are involved in metabolic reactions; therefore,vitamin deficiency can cause a number of pathologies or even death(Moreno et al., 2016b).
In the case of probiotics, there are beneficial microorganisms widely usedin the production of fermented dairy foods with important evidence of their

healthy effects on humans and animals (De Prisco and Mauriello, 2016).This chapter focuses on the review of research work relating to an
approach to food technologies for preservation and enrichment of bioactivecompounds and improving their organoleptic properties. The emergingtechnologies [freeze concentration, encapsulation, OD, pulsed vacuum(PV), and ohmic heating (OH)] are presented in separate sections. The mainfactors affecting food preservation and enrichment are also discussed.
2. Freeze Concentration as an InnovativeFood Technology for Preservation ofBioactive Compounds and Flavor2.1. Fundamentals of FreezeConcentrationThe concentration of liquid food, such as tomato juice, orange juice, or anyfruit juice, is an important food industry operation. This industrial unitoperation has the main objective of water removal and increasing solids tomaintain the shelf life by microbial stability. In addition, concentratedproducts occupy less volume and weight, and food manufacturers canpotentially save costs of transportation, warehousing, and handling ofmaterials required for their products (Ramaswamy and Marcotte, 2006).
In general terms, the concentration of liquid foods and other solutionscan be performed through three methods: (1) evaporation, (2) freezeconcentration, and (3) reverse osmosis (or other membrane technique).Although concentration by evaporation (high temperatures) is widelyapplied in the industry, it creates important problems in the foodcomponents as a result of the heat treatment. Thus, when usingtemperatures between 40 and 70°C, enzymatic reactions may alter theorganoleptic properties of some liquid foods, such as natural fruit juices(Deshpande et al., 1982).
The principle of freeze concentration is based on the crystallization ofwater. When an ice nucleus appears and grows from an aqueous solution,the ice crystal expels impurities to build up pure crystal during the freezingprocess. Thus, the impurities or solutes become segregated on the frozen

interphase to increase their concentration compared to that in the originalsolution. This exclusion phenomenon of ice is common not only to asolution (including both inorganic and organic), but also to suspensions, andthat is a major principle of the freeze concentration techniques (Nakagawaet al., 2010b).
In practice, crystallization of water involves three phenomena: (1)nucleation or the formation of a minuscule crystalline lattice structure fromthe solution; (2) crystal growth, which corresponds to a subsequent growthfrom nuclei until a crystal in equilibrium is attained; and (3)recrystallization or the reorganization of the crystalline structure to a lowerenergy state (Hartel, 2001). Before the crystallization process occurs at theequilibrium freezing point (melting point of ice), a significant energybarrier must be surmounted by generating a large driving force. Theexistence of an energy barrier is demonstrated by the continuous withdrawalof sensible heat below 0°C without the occurrence of a phase change. Thisprocess, called undercooling or supercooling, results in athermodynamically unstable state until submicron water aggregates form,leading to a suitable interface (nucleus, embryo, or seed) necessary for amassive liquid-to-solid transformation. The degree of undercooling isdictated by the onset of ice nucleation. Without a stable nucleus, phasechange is not possible, as molecules of liquid do not easily align themselvesin the configuration of a crystal. Therefore, nucleation serves as the initialprocess of freezing and can be considered the critical step precedingcomplete solidification. In general, the nucleation involves creating a stableinterface via a foreign particle (heterogeneous nucleation) or through aprocess by which enough water molecules become ordered spontaneouslydue to intrinsic fluctuations (homogeneous nucleation) (Sahagian andGoff, 1996).
Cryoconcentration or freeze concentration has long been one of the bestconcentration methods. As compared to evaporation and membranetechnology, freeze concentration has some advantages for producing aconcentrate with high quality because the unit operation occurs at lowtemperatures of the process where no vapor–liquid interface exists,resulting in minimal loss of volatiles (Morison and Hartel, 2007). Inaddition, the energy needs of freeze concentration are lower than the needsof evaporation due to the lower latent heat of water solidification than that

of vaporization (0.33 and 2.26 kJ/g, respectively) (Ramaswamy andMarcotte, 2006). Conversely, an important advantage of evaporation overfreeze concentration methods is the level of the final concentration.Evaporation can easily concentrate most liquid feeds of any dilution up to50% solids (Schwartzberg, 1989). On the other hand, usually in freezeconcentration the practical final concentrations are only in the 45%–55%range because in general an increase in solute concentration produces anincrease in nucleation and a decrease in the growth velocity of the icecrystals and in the mean diameter of the crystal, and, at criticalconcentration, solutes may solidify along with ice and are difficult toseparate (Welti-Chanes et al., 2006).
Therefore, the priority of freeze concentration over other concentrationmethods (in particular the heating process of evaporation) is explained bythe quality of concentrate products. In general, the quality of theconcentrated final products is excellent because the aroma, as well as theflavor, remains in the liquid foods (Petzold et al., 2016b).
The freeze concentration process is an effective method capable ofremoving water by freezing it out from a liquid food or solution as icecrystals (ideally the ice crystals are totally free of solutes). First, thesolution is partially frozen, the ice crystals are physically separated from theresidual solution (concentrated solution), and then the ice is melted to formthe water. Ice crystals formed under the appropriate conditions can be verypure (Rahman et al., 2007). Freeze concentration is a concentration methodthat involves lowering the temperature of a liquid food or solutionsufficiently to partially freeze the water, resulting in (the traditional methodof freeze concentration) ice crystals slurry dispersed in a concentratedsolution (Hartel, 1992).
The freeze concentration elemental system consists of two stages:freezing (crystallization) and separation (obtaining ice and concentrate; e.g.,a concentrate fruit juice). In freezing, the ice growth in a solution iscontrolled by the rate of latent heat released during the phase change, aswell as by the rate of mass transfer. The rate of crystal growth (G) is also afunction of the supercooling (∆Ts) reached by the specimen according to thephenomenological expression (Zaritzky, 2006):

(3.1)
(3.2)
where β and n are experimental constants.Furthermore, in the mentioned second stage of freeze concentration
(separation), increasing the concentrate concentration obviously increasesthe viscosity; thus an important factor is the viscosity of the concentratebecause the capacity of ice separators is inversely proportional to theviscosity and directly proportional to the square of the mean diameter of thecrystals, as expressed by:
where Q is the draining rate from the crystal bed (cm3/cm2 s); ∆P is thepressure difference exerted over the bed by compression or by centrifugalor pressure drop of the filtrate (kg/cm2); de is the diameter of the crystals(cm); μ is the viscosity of the liquid (poise); l is the thickness of the bed(cm); g is the gravity acceleration (cm/s2); and ɛ is the volume fraction ofpores in the bed filled by the liquid phase (Welti-Chanes et al., 2004).
This redistribution of solute during crystallization of water ispredominantly determined by the solubility of the solute in the solid phaseand the ability of the solute to diffuse away from the interface before it isovergrown. At very low crystal growth speeds, the solute is expected todiffuse away from the growing crystal (unless it possesses crystallographicsimilarities with the growing crystal that favor adsorption), leading to apure crystal and highly enriched solution (the case of no soluteincorporation). At high crystal growth speeds, the solute is unable to diffuseaway from the growing crystal and is completely engulfed, leading to animpure crystal and no enrichment of the solution (the case of completesolute incorporation). At intermediate crystal growth speeds, which covermany practical circumstances, some solute is incorporated into the crystaland some is rejected, leading to enrichment of the solution phase (the case

of partial solute incorporation) (Butler, 2002). Other authors confirmed theimportance of crystal growth speed (or freezing rate) in the freezeconcentration process in this context. Nakagawa et al. (2010a) and Morenoet al. (2014) reported that for velocities higher than 8 μm/s, the freezing wastoo fast to expect a considerable separation of the concentrated solutionphase because in this condition the ice occluded solutes during the freezingstage.
In freeze concentration it is very important to obtain large andsymmetrical crystals. Large crystals can be more easily separated from theconcentrated solution. Large crystals also reduce the loss of solutes due toocclusion and adherence to the small crystals. During crystallization, twokinetic processes take place: the formation of nuclei and the growth ofcrystals. Nucleation is the association of molecules (at some degree ofsubcooling) into a small particle that serves as a site for crystal growth.Once a nucleus is formed, crystal growth is simply the enlargement of thatnucleus. Nucleation and growth of crystals are dependent on soluteconcentration, bulk supercooling, residence time of the crystals in thecrystallizer, freezing rate, molecular diffusion coefficient of water, and heattransfer conditions. These factors should be carefully controlled to regulatecrystal formation (Welti-Chanes et al., 2004).
In suspension crystallization freeze concentration (SCFC), research hasfocused on how to control the crystallization step to obtain ice crystals aslarge as possible. Large ice crystals are favorable for easing the separationof ice crystals from the concentrated mother solution (Miyawaki, 2001).These crystals, preferably of uniform size, present a low specific surface(i.e., low surface area per unit mass), and therefore losses of entrained juiceconcentrate are minimized (Deshpande et al., 1982). An efficient way tocontrol crystallization in SCFC is the use of low levels of subcooling. It hasbeen reported that, for sugar solutions and liquid foods and at low levels ofsubcooling (about 0.1K), the growth of ice crystals takes the form of disks,in contrast to the dendrites produced at higher degrees of subcooling(Huige, 1972; Omran and King, 1974; Stocking and King, 1976). Thischange in morphology is in itself a sufficient reason to operate at lowersubcooling since the surface-to-volume ratio of the crystals is muchimproved (Petzold and Aguilera, 2009).

As mentioned previously, the low temperature and high concentrationobtained by this method lead to high viscosity in liquid foods, which canlimit the maximum concentration attainable in freeze concentration. In thiscontext, concentrations of 40%–50% are typically the highest attainable infreeze concentration of foods, and to reduce viscosity during freezeconcentration, pretreatment of the feed may be necessary. Pulp removal bycentrifugation prior to freeze concentration of fruit juices results in greaterefficiency of separation and lower solute losses due to decreased viscosity.Ultrafiltration to remove macromolecules (proteins, starches, etc.) prior tofreeze concentration has also been suggested as a means of enhancing theefficiency of freeze concentration. High viscosity also affects icecrystallization through concentration of components that inhibit crystalformation and growth. The higher solute concentrations found in freezeconcentration result in greater inhibition and slower crystallization, whichalso affect the maximum concentration attainable (Morison andHartel, 2007).
Of course, freeze concentration is not a new process. Before the 1800s,the native people of North America made maple syrup from sap taken frommaple trees. They used shallow vessels made of bark, which they filled withwater and maple sap. Vessels were left to freeze overnight, and in themorning the ice was broken off and thrown away, concentrating theunfrozen sugar. The process was repeated several times until the endproduct became the concentrated maple syrup (Ramaswamy andMarcotte, 2006).
Another point of view in the freeze concentration process considers theice as the final product and not the concentrate; this is the case indesalination of water. In these conditions, the fundaments are very similar;only the final product is different (water from ice without or with only aminor concentration of impurities). In this context, the Danish physicianThomas Bartholinus (1616–80) was apparently the first to report that waterobtained by the melting of ice formed in seawater was fresh. Almost at thesame time, Robert Boyle (1627–91) reported the same observation,foreseeing the phenomenon as a source of freshwater, and the JesuitAthanasius Kircher (1602–80) discussed the reason why ice formed in thesea is fresh. The reason behind getting freshwater from ice is due to therejection of salts at the interface. More recently, at the end of the 18th

century, the Italian scientist Anton Maria Lorgna (1735–96) described amethod to purify seawater and impure waters by freezing them and then themelting the ice. In 1786 Lorgna published his first paper on waterdesalination by freezing, wondering why nobody had previously applied anartificial process initiating what nature does so well and easily in the coldseas: producing blocks of freshwater ice from seawater (Rahmanet al., 2007).
2.2. Applications of Freeze Concentration inPreservation of Bioactive Compounds andOrganoleptic Properties Retention of FreshSamplesThere are several applications and practical examples of freezeconcentration in the preservation or retention of bioactive compounds (e.g.,total polyphenols or vitamins) and organoleptic (or sensory) propertiesretention of liquid food samples, principally in fruit juice and extracts (e.g.,extracts from coffee or yerba mate infusions). Thus, Liu et al. (1999)described in tomato juice samples that were freeze concentrated andreconstituted (by dilution with water of concentrated sample) showed nodifferences in color and vitamin C in comparison with fresh tomatosamples. Dette and Jansen (2010) used black currant juice to prove that acryoconcentrated and diluted sample is similar to a fresh sample in severalquality criteria. The results showed that the reconstituted juice wasequivalent to a fresh sample in all aspects of quality. In conclusion, theoverall quality of the freeze-concentrated juice is excellent and the taste hasto be better than evaporative concentrates because the aroma (including thevolatile compounds that characterize freshly squeezed juice), color, andflavor as well remain in the concentrated sample. Similar results werereported by Gunathilake et al. (2014) to concentrated coffee extract andpear (La France) juice flavor condensate by progressive freezeconcentration, reverse osmosis, and vacuum evaporation at 50°C. Freezeconcentration showed the best overall quality after concentration andreconstitution, with the flavor distribution balance closest to the originalsample before concentration for both liquid foods.

Ramos et al. (2005) reported the application of progressive freezeconcentration (PFC) in the pulp of the Andes berry (Rubus glaucus Benth).The results indicated that there were no changes in the volatile compoundsprofile; an expected increase in the volatiles was observed in theconcentrated pulp. However, in some esters (e.g., ethyl butanoate, methyl,etc.), a decreased concentration in the concentrated pulp was observed.Finally, in sensorial properties, the results indicated no significantdifferences with any of the characteristics studied (taste, color, aroma, andoverall quality). Miyawaki et al. (2016) applied PFC to concentrated applejuice in the range of 13.7–25.5 °Bx. These authors compared the volatilecompounds present in the headspace samples processed by PFC; allcompounds subjected to the freeze concentration process increased theirrelative areas of volatile compounds. This juice was reconstituted, and,when taste and flavor were analyzed by electronic sensors, no significantdifferences between the original apple juices and reconstituted ones wereobserved.
On the other hand, Aider and Halleux (2008), using the technique ofblock cryoconcentration in cherry and apricot juices, showed that the bestresults were those of the cryoconcentrated juice in comparison with heat-processed juices (evaporated). In addition, when this technique was used toconcentrate the samples, no significant degradation of vitamin C wasobserved, and volatile compounds were preserved in the cryoconcentratedsamples because this technology did not allow them to be lost byevaporation.
Moreno et al. (2014), using block freeze concentration applied to coffeeextract, found important bioactive compounds and functional properties(specifically, an important antioxidant activity, caffeine contents, andchlorogenic acid) in the concentrated samples. The antioxidant activity wasincreased over the cryoconcentrate cycles, and the researchers concludedthat this technique is an effective method to preserve the bioactivecompounds and functional properties of coffee extracts.
In addition, Moreno et al. (2015) concluded that the freeze concentrationincreased the bioactive compound concentration and the antioxidant activityof the coffee extract, preserving volatile compounds and some sensoryattributes. The main volatile compounds were identified, for example,pentanal, furfural, and furfuryl alcohol. In addition, most of the sensory

attributes in the concentrate (liquid) and ice fractions were not significantlydifferent from those evaluated in the original sample. Finally, theresearchers concluded that freeze concentration was an effective method toretain the sensory quality of coffee extract.
Boaventura et al. (2013) demonstrated that it is possible to enhance thecontent of bioactive components and the antioxidant activity of yerba mateinfusion (a beverage largely consumed in several South Americancountries) extracts through progressive freeze concentration. Also,Boaventura et al. (2015) showed that yerba mate infusion obtained byfreeze concentration technology was able to promote additionalimprovement in the antioxidant status of healthy individuals whencompared to the traditional mate infusion. Petzold et al. (2016a), usingblock freeze concentration assisted by vacuum applied to a red wine,reported interesting physicochemical characteristics of cryoconcentratesamples, showing a significant increase of polyphenol content in theconcentrated wine (50% of concentrate) compared to the original wine.
3. EncapsulationA feature of bioactive food components is that they suffer rapid degradationor inactivation. Many bioactive food components would benefit from anencapsulation procedure that slows down the degradation processes and/orprevents degradation until the product is delivered at the sites whereadsorption is desired. None of the numerous encapsulation methods can beconsidered a universally applicable procedure for bioactive foodcomponents (De Vos et al., 2010). The reason for this is that each bioactivecomponent has a characteristic and unique molecular structure, such asmolecular weight, solubility, polarity, and so forth. These individualcharacteristics require applying different encapsulation methods in order tomeet the biochemical, physicochemical, and molecular requirements of thebioactive component of interest (Augustin and Hemar, 2009). An importantrequirement is that an encapsulation system must maintain fully functionalbioactive components, avoiding chemical degradation by, for example,hydrolysis or oxidation.
Two main types of encapsulates might be distinguished: the reservoirtype and the matrix type. The reservoir type has a shell around the active

agent. This type is also called capsule, single-core, monocore, or core–shelltype. Application of pressure can lead to breakage of the reservoir type ofencapsulate and thus the release of its contents. Poly- or multiple-coreencapsulates with several reservoir chambers in one particle also exist. Theactive agent in the matrix type is much more dispersed over the carriermaterial; it can be in the form of relatively small droplets or morehomogeneously distributed over the encapsulate. Active agents in thematrix type of encapsulates are in general also present at the surface (unlessthey have an additional coating), in contrast to those in the reservoir type(Zuidam and Shimoni, 2010).
Of course the size, shape, and homogeneity of capsules depend on thematerials and methods used to prepare them. For the materials, alginate isvery popular in the encapsulation process because alginate has beenapproved as a coating material by the US Food and Drug Administrationand the European Food Safety Authority. In this context, alginates haveincreasingly found use in numerous encapsulation applications, such asencapsulation of probiotics, flavors, and functional food oils. In theseapplications, the mild setting conditions of alginates are of particularbenefit, as sensitive products may be encapsulated without deterioration andthere exist a number of possible encapsulation techniques to be used withinthe food area; commonly used techniques for alginates are extrusion,emulsification, and coating (Helgerud et al., 2010).
3.1. Encapsulation of ProbioticsEncapsulation is considered a versatile technology used in a variety ofindustries, such as the pharmaceutical, chemical, agricultural, and foodindustries. The objective for using encapsulation technology is the additiveor ingredient protection, which is to avoid possible degradation resultingfrom exposure to environmental factors, such as oxygen, water, heat, andlight (Sobel et al., 2014).
Encapsulation is a process to entrap one product or substance withinanother, thereby producing solid particles with different diameters(nanometers to millimeters). The product or substance that is encapsulatedis the core material. The substance that is encapsulating may be called thecoating, carrier material, or matrix. In food products, the carrier material of

encapsulates or processes used should be food grade and able to form abarrier for the active agent and its surroundings (Zuidam andShimoni, 2010).
Some interesting benefits of the encapsulation technique applied in foodprocessing could be active agent immobility in food systems, superiorhandling of the active agent, improved stability in final food product andduring processing (i.e., no degradation or reaction with other components inthe food and/or less evaporation of volatile active agent), off-taste masking,and controlled release (differentiation, release by the right stimulus). Ofcourse, such mentioned benefits should overcome some possible negativeeffects, such as additional costs, increased complexity of production processand/or supply chain, undesirable consumer notice (visual or touch) of theencapsulates in final food products, and stability challenges of encapsulatesduring processing and storage of the product (Zuidam and Shimoni, 2010).
From a technological point of view, an efficient system for theencapsulation and delivery of bioactive compounds to be suitable forincorporation into a food product must comply with the following fivecharacteristics: (1) it must be formulated with food-grade, possibly naturalingredients using solvent-free production methods; (2) it should be able toincorporate bioactive compounds into food matrices with highphysicochemical stability and minimal impact on the organolepticproperties of the product; (3) it should be able to protect the encapsulatedcompounds from interaction with other food ingredients and fromdegradation due to temperature, light, or pH; (4) it should maximize theuptake of encapsulated compounds upon consumption and ensurecontrolled release in response to a specific environmental stimulus; and (5)it should be easily scalable to industrial production. Such a broad spectrumof requirements to be achieved by delivery systems has triggered thedevelopment of various encapsulation techniques. Among numerousencapsulation techniques, some are already established and employed inindustrial production (such as spray drying), while the performance andapplicability of some other techniques have been evaluated only recently(e.g., encapsulation based on the precipitation with supercritical fluids)(Dorđević et al., 2015; McClements et al., 2007).
As defined by the US Food and Agriculture Organization (FAO)/WorldHealth Organization (WHO) in 2001, probiotics are live microorganisms

that, when administered in adequate amounts, confer health benefits on thehost. Belonging mainly to lactic acid bacteria (LABs), probiotics werewidely used in the production of fermented dairy foods, when importantscientific evidence of their healthy effects led to attention of probioticfunctional properties (De Prisco and Mauriello, 2016). Recognition of therelationship between human disease and gut health may be traced back toHippocrates (460–370 BC), who stated that all diseases begin in the gut.Research in the modern era began with Theodor Escherich, who in 1886described the relationship of digestion physiology in infants with theintestinal bacteria. In 1892, Ludwig Doderlein suggested that lactobacillicould be used to treat vaginal infections. Eli Metchnikoff is considered thefather of the probiotic concept. In his 1907 book The Prolongation of Life,he proposed that colonic bacteria played a role in aging and adverse healthin adults. He postulated that the body was slowly poisoned(autointoxicated) by toxins produced by proteolytic microbes in theintestine that were responsible for aging. He further hypothesized that agingcould be prevented by modifying the gut flora with useful microbesobtained from sour milk and lactic acid–producing bacteria (Mizock, 2015).
Probiotics are microorganisms considered to be generally recognized assafe (GRAS) for human use and include a large range of bacteria and someyeasts. Strains of LABs are the most important probiotics known and usedin foods (e.g., strains of genera Lactobacillus, Bifidobacterium,Enterococcus, Streptococcus, Lactococcus, and Carnobacterium, amongothers) and some types of yeast (e.g., Saccharomyces cerevisiae,Saccharomyces boulardii, and Escherichia coli strain Nissle are consideredas probiotics (Burgain et al., 2011).
Most of the probiotic food products are categorized as functional foodsand make up between 60% and 70% of the total functional food market(Tripathy and Giri, 2014). As dairy products have pioneered theintroduction of probiotics, dairy products remain the most popular form offood with probiotics (Sánchez et al., 2012). Other types of foods withprobiotics, such as fruit juices and chocolate-based products, are available,but they still represent only a small portion of the total market. In recentyears, healthcare professionals, websites, and advertisements havepromoted the administration of products containing probiotics, increasingthe consumer’s information about probiotic benefits (De Prisco and

Mauriello, 2016). In this sense, a number of efforts have been made toimprove the robustness and then the biological viability of probiotics (andthe functional effect) in an important variety of foods. Among theseattempts, encapsulation is an emerging technology that could improve thefunctionality of these living microorganisms to be incorporated in otherfood matrices (different from dairy products).
Probiotics in general have a low survival rate and little resistance todifferent processing techniques and environmental and gastrointestinalconditions, such as oxygen, moisture content, temperature, pH, bile salt,and bacteriophages, among others. According to the definition, to bebeneficial functional foods, the probiotic bacteria should survive passagethrough the stomach and reach their site of action in adequate amounts.However, one of the problems of probiotics encapsulation technology is thebacterial size (typically 1–5 μm diameter), which immediately excludesnanotechnologies (Champagne and Fustier, 2007); there is a minimal sizerange that is possible for capsules to reach, which limits their possibleapplications. The encapsulated bacteria will be typically between tens ofmicrons (namely powder of probiotics) and millimeter size. Capsules over1 mm are considered large and can produce a coarseness of texture in livemicrobial feed supplements, and the sizes less than 100 μm do notsignificantly protect the probiotics in adverse conditions. The size ofcapsules can be considered an important factor in their degradation, walldeposition, particle stickiness, residence time, and controlled release inprobiotics capsules.
In general terms, for microencapsulation of microbial cells, it is essentialthat the encapsulation process is performed under relatively mild conditionsto ensure high viability of the encapsulated cells. It is also necessary for themicrospheres to possess good mechanical stability so as to support thegrowth and long-term culture of the microbial cells. Various techniques formicroencapsulation of microbial cells have been investigated over the pastfew years for the protection and viability enhancement of microorganismswith varying degrees of success. Some of the common techniques usedinclude extrusion, coacervation, spray drying, and emulsification. Eachmethodology has its own characteristic features, and the selection of anyparticular method is based on the application of the microspheres (Rathoreet al., 2013). For example, microspheres containing probiotic cells are

required to be smaller than 100 μm to avoid a gritty sensation whenconsumed (Heidebach et al., 2012). Similarly, microspheres containingfermenting microorganisms for use in bioreactors need to be mechanicallystrong to withstand harsh mechanical and physical conditions, such as shearforces, acidic environments, and exposure to fermentation gases andsolvents.
Thus, the appropriate selected method of cell encapsulation (in this caseprobiotic cells) should be able to produce microspheres with the necessaryphysical and chemical attributes while causing minimal damage to cellintegrity and viability, and be easy to scale up with acceptable processingcosts. In this context, the purpose of microencapsulation is to preserve theviability of encapsulated microbial cells against detrimental environmentalfeatures, such as changes in pH, damaging metabolic products, osmoticstress, and changes in temperature, as well as to improve storage stability ofthe microencapsulated cells (Rathore et al., 2013). However, there is loss ofcell viability during the processing steps of microencapsulation itself. Forexample, microencapsulation by spray drying is known to adversely affectcells’ viability owing to the high temperatures during processing steps.Spray drying encapsulation of Lactobacillus acidophilus reduced theviability by about 100 times compared to before encapsulation owing to thehigh temperature used in the process (Zhao et al., 2008).
Other microencapsulation techniques have been found to be less harsh tomicrobial cells in comparison to the spray drying technique, such asmicroencapsulation by the spray chilling method, a microfluidic device, theextrusion method, and emulsification, among others (Rathore et al., 2013).
Microencapsulation techniques have allowed concentration of probioticbacteria and improved their survival during passage through thegastrointestinal tract (Cook et al., 2012). Several encapsulating agents, suchas polysaccharides and proteins, among others, have been used to protectprobiotics from physical and chemical damage to extend their biologicalviability. Both agent and encapsulation techniques affect the size andresistance of capsules. The size of capsules has been reported to beassociated with encapsulation techniques. Emulsification allows a smallersize of probiotics capsules to be obtained with a range of 0.1–8000 μm, forspray coating a range of 5–5000 μm, and for spray drying a narrow range ofapproximately 10–120 μm. The biggest capsule would be obtained by

coextrusion with a range of 120–9000 μm (Burgain et al., 2011). However,the resistance, shelf life, and storage of capsules associated with theprobiotic viability are a continuing challenge.
In general terms, the encapsulation of bacterial cells has been describedas the protection of the cells under the difficult gastrointestinal conditions(with enzymes present and very low pH) (Sohail et al., 2011). Anotherchallenge of encapsulation is to protect probiotic cells in food systemsusually not considered their vehicle (e.g., bakery products) (Malmoet al., 2013). Encapsulation, apart to the aforementioned effects, could offermany important advantages in enhancing the handling of probiotic cultures,as well as the masking of taste and aroma given by the production ofdifferent metabolic compounds (e.g., acetic acid) produced duringfermentation in foods where they are not required. An additional importantaspect is the effectiveness of encapsulation technology in improvingprobiotic biological survival after their insertion in a powdered formulawhere there is the detrimental effect of oxygen exposure and low wateractivity (Weinbreck et al., 2010).
Some benefits of microencapsulation of probiotics cells includeprotection from bacteriophages and environmental factors, therebyincreasing survival during food processing, storage, and gastrointestinalpassage (Cook et al., 2012). Different technological methods forencapsulation and their advantages for probiotics cells are reported(Champagne and Fustier, 2007; Mitropoulou et al., 2013) (Fig. 3.2).

FIGURE 3.2 Encapsulation of Probiotics as Technology forApplication to Improve Effects in Different Matrices of Foods.
Holkem et al. (2017) in their report about the production of probioticsmicrocapsules by emulsification technique, conclude that this techniqueused provided effective protection of probiotics during the passage throughsimulated gastrointestinal fluids and buffer solutions at pH 4.5. Thetechnique also conferred probiotic viability during approximately 120 daysof frozen storage (−18°C).
A recent report showed the use of an innovative agent for encapsulationand modification or combination encapsulation techniques. In this way,Pitigraisorn et al. (2017) reported the survival of the heat-sensitive probioticbacteria and its thermal improve after encapsulation in multilayeredmicrocapsules obtain via a technique that combined electrospraying andfluidized bed.
However, and despite the possibilities of probiotic applications in foodproducts, at this moment few types of research have reported the effectivefunctionality of probiotic microcapsules in protecting cells during theirapplication in some food systems (e.g., fermented meat and bakery

products). Therefore, nondairy foods still represent only a potential niche inthe market of probiotic foods (De Prisco and Mauriello, 2016).
3.2. Encapsulation of FlavorsEncapsulation of flavors and fragrances, as well as other active compounds(nutraceuticals and bioactive food components, pesticides, dyes, enzymes),is a domain that is still in expansion due to the increasing consumer demandfor better quality from the raw materials to the final products (Castroet al., 2016).
Flavors and flavorings play an important role in consumer satisfactionand influence further consumption. Foods and flavor encapsulation could beaccomplished by several methods. One of the major industrial processes isdripping spray drying (Madene et al., 2006). Encapsulation of flavors viadripping in glassy carbohydrate matrices has been used for volatile andunstable flavors. The principal advantage of the dripping method is thestability of the flavor against oxidation. Carbohydrate matrices have verygood barrier properties, and dripping is a convenient process enabling theencapsulation of flavors (Gouin, 2004).
The most recurrent flavors used in the food industry and reported in theliterature are diacetyl; terpenes, such as D-limonene; terpene alcohols, suchas geraniol, menthol, and thymol; terpene ketones, such as camphor andmenthone; short-chain esters, such as ethyl propionate and isoamylbutyrate; aldehydes, such as acetaldehyde and hexanal; lactones, such asheptalactone andnonalactone; sulfur-containing ingredients, such as 3-methylthiohexanol, thiolactones, and the like; and nitrogen and nitrogen–sulfur heterocycles, such as pyrazines and thiazoles. Flavor (and perfume)ingredients are, therefore, characterized by a broad range ofphysicochemical properties, whereas the most relevant of these propertiesas far as encapsulation is concerned is the presence of chemical functions,molecular weight, steric hindrance, vapor pressure, and relative solubility inboth oil and matrix phase (Castro et al., 2016).
In some situations, flavorings applied to foods have important advantagescompared to the traditional process, for example, the use of liquid smokecompared to the traditional and contaminant smoking process: uniformity ofthe product, ease of application, speed, reproducibility of the final

characteristics obtained in the smoked food, cleanliness of application, anda decrease of the content of certain polycyclic aromatic hydrocarbons(Simon et al., 2005). However, in general, the food chain influences theflavor of food products: manufacturing and storage processes, packagingmaterials, and ingredients in foods often cause modifications in overallflavor by reducing aroma compound intensity or producing off-flavorcomponents. Therefore, to limit aroma degradation or loss duringprocessing and storage, it is beneficial to encapsulate volatile ingredientsprior to use in foods or beverages (Madene et al., 2006). In this context,Petzold et al. (2014) reported the application of the dripping technique forliquid smoke encapsulation. The results show that the efficiency ofencapsulation (load capacity) of liquid smoke reached values above 96%,and the heated liquid smoke capsules released several volatile compoundsin the headspace (the researchers could identify 66 compounds). Amongthese volatile compounds, phenols derivatives (e.g., eugenol, p-ethylguaiacol, cresol, and dimethyl phenol) can be considered sensorydescriptors to contribute to the specific flavor of smoke. Finally, theresearchers concluded that the dripping technique is highly efficient toencapsulate liquid smoke and releases several volatile compounds withsensory impact.
4. Osmotic DehydrationOD is a technique widely used in fruit and vegetable products and isconsidered to be a minimal process technology. The process is performedby immersing fruits or vegetables in concentrated solutions. This techniqueremoves part of their water content by immersion of the matrix into ahypertonic solution, where the water in the food cells passes into theosmotic solution through the cell membrane due to the high osmoticpressure and low water activity of the osmotic solution, to obtain a productof intermediate moisture, with the advantage of preserving freshnesscharacteristics of fruits and vegetables, due to their aroma, color, firmness,nutritional constituents, and flavor compound retention value (Yadav andSingh, 2014). As the cell membrane is semipermeable, OD is a process ofdiffusion of water and solutes simultaneously but in opposite directions.

This partial dehydration is performed by immersion of the fruit orvegetable material in a concentrated aqueous solution, where there are twomajor simultaneous countercurrent flows: one flow of solutes from thesolution into the food matrix of water and another from the food into theosmotic solution (principally water). The driving force of the process is thedifference in the osmotic pressure of solutions on both sides of thesemipermeable cell membrane. These flows are in dynamic equilibriumwith each other and significantly influence the final product in terms ofnutrition, preservation, and sensory properties (Tortoe, 2010). Also, alongwith water some solutes present in the cells, such as organic acids, reducingsugars, minerals, flavors, and pigment compounds, can be leached into theosmotic solution, as the cell membrane is not completely selective (Rastogiet al., 2014).
It has been reported that flavor precursors, volatile compounds, andpigments are transferred from the vegetable or fruit to the osmotic solution.Thus, it is possible to suggest that osmotic solutions can be applied asnatural additives in the food industry (Osorio et al., 2007). This techniqueusually is effective at low or moderate temperatures of the process, whichprotects thermosensitive compounds, such as flavors, pigments, andvitamins, and reduces undesirable thermal effects on sensory attributes(texture, color, and flavor). This is in contrast to other food preservationprocesses, such as convective drying or freezing, as the water removal isconducted without phase change; thus nutritional and sensory properties ofthe final products are enhanced. Furthermore, as it prevents food fromgetting in contact with air, oxidation reactions and loss of volatilecompounds are reduced (Rodriguez et al., 2015). The phenomenon ofaroma retention can be explained by the adsorption of volatiles onto theinfused food matrix, microregional encapsulation in which volatilecomponents are immobilized in cages formed by the association ofdissolved solids, and color retention and physicochemical interactionbetween volatiles and other substances (Tortoe, 2010).
The reduction of water activity of the product by OD increases itsapplication as a pretreatment to many other food preservation processes,including air drying (Kumar et al., 2012; Lombard et al., 2008),microwave drying (Torringa et al., 2001), freeze drying (Agnieszka andAndrzej, 2010), vacuum drying (Grabowski et al., 2002), and freezing

(Zhao et al., 2014), to ensure storage stability of the final product andprevent spoilage, improving the quality of fruits and vegetables withsubstantial energy cost savings.
Besides being an effective emerging technique to remove water fromfruit and vegetable tissues, OD could be used simultaneously to introducesolutes of interest, such as bioactive compounds, from the osmotic solutioninto the food matrix, to enhance its nutritional or functional characteristics.To accelerate the efficiency of mass transfer and nutrient uptake, a PVcould be applied at the beginning of OD process.
Water loss and solid gain are mainly controlled by the raw materialcharacteristics. Large variability of the osmotic process between differentfruits has been observed, which is mainly due to the characteristics of thetissue (compactness), solids content (soluble and insoluble), presence ofgas, intracellular space, enzymatic activity, and relationship betweensoluble pectin water and protopectin.
4.1. Pulsed VacuumPV is a technology that applies pressure gradients to introduce moreeffectively an impregnating solution into a high-porosity food matrix(generally fruit and vegetables) (Moreno et al., 2011a). This technologyimplies two main steps: First is the vacuum step, characterized by theimmersion of the vegetable tissue (generally cut in pieces havinghomogeneous shape and size) in a solution; its exposure to subatmosphericpressure promotes the expansion and outflow of internal gas occluded in theintercellular spaces. In the second step, the impregnation step, theatmospheric pressure is restored and the external solution penetrates intothe food’s porous space, compressing the residual gas until pressureequilibrium is reached because two phenomena—hydrodynamicmechanism (HDM) and deformation–relaxation phenomenon (DRP)—areused to explain and model mass transfer that occurs during pulsed vacuumosmotic dehydration (PVOD) (Neri et al., 2016; Radziejewska-Kubzdelaet al., 2014).
In the past decade, PV has grown significantly in popularity because ithas been proving to be a useful technique to enrich fruit and vegetabletissue with specific components (e.g., vitamins, minerals, probiotics,

flavors, cryoprotectants, and firming and antioxidant agents); it is able tostabilize and/or improve the sensory and/or the functional properties of foodproducts without substantially modifying their original sensory properties(Barrera et al., 2004; Betoret et al., 2003; Castagnini et al., 2015). WhenPV is applied at the beginning of OD the process, it is named PVOD, whichhas been widely studied by many researchers (Adsare et al., 2016; Anet al., 2013; Atarés et al., 2008; Barrera et al., 2004; Castelló et al., 2006;Corrêa et al., 2016). The application of PVOD treatment increases the rateof water loss and solid gain, which accelerates the process time and allowsa reduction in energy during the process (Şahin and Öztürk, 2016).
4.2. Ohmic HeatingOH is another emerging food technology and is also named electroheating,Joule heating, electrical resistance heating, direct electrical resistanceheating, or electroconductive heating. In addition, OH is considered to be ahigh-temperature, short-time method in which thermal energy is generatedinside the product by the passage of an alternating electrical current throughit, causing a temperature rise. It is a process that occurs quickly anduniformly because it is not dependent on heat transfer or passing throughthe solid–liquid interface. Heating occurs by transformation of electricenergy into heat within the food matrix (Knirsch et al., 2010). In the foodindustry it is usually applied as a preservation technique, includingblanching, cooking, drying/concentration, pasteurization, and sterilization(Ramaswamy et al., 2014). OH is better than the conventional heatingprocess, as it provides rapid and uniform heating that reduces process timeand decreases thermal damage to vitamins, antioxidants, and otherelements; therefore, this technology improves the quality of food productswith minimal organoleptic changes. All the methods where heat isgenerated directly inside the food and that are characterized by highefficiency are called novel thermal processing technologies. OH is differentfrom other electrical and thermal processing technologies because theelectrodes are in contact with the food matrix, whereas inductive andmicrowave heating does not have electrodes and applies a higher frequencyrange (Kaur and Singh, 2016).

4.2.1. Influencing factors in ohmic heatingMany factors affect the OH process, and it is possible to separate them intotwo different groups. The first group is the product parameters, such as thecharacteristics of the food matrix with regard to size and shape, texture,viscosity, moisture content, and others. In the second group are the systemparameters, such as electrical conductivity, temperature, voltage gradientand waveform, electrical field strength, ionic concentration, residence time,and electrodes (Ramaswamy et al., 2014). These parameters can influencethrough the effective conductivity of the mixture (σeff), which is theconcentration and particle size, or they can directly influence the heatingrate of the different constituents, which involves the geometry of particlesand orientation (Kaur and Singh, 2016).
Electrical conductivity is a key parameter that controls the OH rate. Itrefers to the ability of a material like a food matrix to transport an electriccharge. In a food matrix, the salts and acids present are an electrolyticcomponent that allows the passage of an electric charge through them(Knirsch et al., 2010). It has been reported that OH efficiency increaseswith salt concentration, which determines its heating rates (Marcotteet al., 2000). It is important to identify for each material its thermophysicalproperties, such as electrical conductivity, heat capacity, thermalconductivity, and thermal diffusivity. These properties could be variedunder different conditions, especially for biological materials, includingfoodstuffs (Ramaswamy et al., 2014). The advancement in technology ofelectrode production and the power supply contributes to the renaissance ofOH technology in food preservation areas. The desired electric current fromthe source to the food is transmitted by metal electrodes, which aredesigned for that specific purpose (Kaur and Singh, 2016). As there is verylimited experience in OH on an industrial scale, all the parameters thatcould be involved must be considered in the process design.
Also, the application of an electric field has important thermal effects onvegetable cells, as it affects the integrity of biological tissues by solubilizingpectic substances that form the cellular wall, which causes changes inphysical properties and alters the permeability of vegetable cells, such aspores formation, known as electropermeabilization or electroporation of thecell membranes. This effect has received increasing attention because it

manipulates cells and tissues, increasing the diffusion of food processescontrolled by mass transfers (Allali et al., 2009).
4.2.2. Application of ohmic heating on bioactivecompoundsThe real success of OH technology has been in fruit and vegetableprocessing, especially in some fruits whereby the natural levels of acidityallow stable final food products. Strawberries and certain vegetables benefitfrom a volumetric heating technology in which the particulate can be forcedto heat preferentially to the carrier liquid. The result is a variety ofprocessed fruit and vegetable products of high quality that are unique to OH(Ramaswamy et al., 2014). Different studies have reported that OHtechnology improves processes, such as OD, which simultaneously can becombined with PV to accelerate the diffusion of molecules, reducingprocess time and loss of bioactive compounds. In Fig. 3.3 we observe ageneral scheme of the application of these three techniques in theprocessing of a vegetable raw material.

FIGURE 3.3 Schematic Diagram of Osmotic DehydrationProcess Combined With Pulsed Vacuum (PV) and OhmicHeating (OH).

The application of these three treatments in different food products hasbeen investigated to enhance the final quality or drying rates. For example,Allali et al. (2010) studied PV and OH pretreatments in osmodehydratedapples, and determined that OH is fast and provokes deep changes in thefruit structure, increasing water and sugar mass transfer during immersionin the osmotic solution. Moreover, the application of OH promotes thepreservation of bioactive compounds, such as antioxidants by inactivatingpolyphenol oxidase enzyme activity in apple cubes processed at 50°C andstored for 4 weeks at 5°C, preserving their freshness characteristics(Moreno et al., 2013). Other studies in strawberries and pear cubes confirmthe synergistic effect of OH (13 V/cm), OD (65 °Bx), and PV (5 kPa for5 min) combination, showing similar results, in which the OH effectexplains the acceleration of mass transfer and process time reduction,obtaining the best processing conditions for dehydrating fruits (Moreno et al., 2011b, 2012).
Besides, PV has the potential to protect bioactive compounds within thefood matrix, even more when it is combined with OH because thecomponents are introduced into the fruit cells due to the electroporation.These emerging technologies can be applied together for the developmentof new products, such as apple snacks enriched with folic acid (Morenoet al., 2016a). Therefore, in addition to improving the process, theapplication of PV and OH in OD treatments provides that added value tothe raw material plant.
5. Conclusions and Future ProspectsThe food industry must make the link between consumer demands and theavailable technologies. To do this, the industry needs to apply innovativetechnologies, such as freeze concentration, OD, vacuum impregnation, andOH. These technologies, also called emerging technologies, often havesome technical or investment cost problems that must be solved to achieveindustrial-scale implementation. The latter aspects should lead the industryto consider working together with research groups to shortenimplementation of industrial-scale innovations that can give an appropriate

response to the growing demand for high-quality food in macro- andmicronutritional composition along with attractive sensory properties.
AcknowledgmentsAuthor Guillermo Petzold and Jorge Moreno are grateful for the financialsupport provided by CONICYT through FONDECYT Project No.11140747 and Project No. 1160761, respectively. Author Patricio Orellana-Palma is grateful for the financial support provided by CONICYT-Chilethrough the Human Capital Formation Advanced Program NationalDoctoral Fellowship 2016 (Folio21160514).
ReferencesAdsare SR, Bellary AN, Sowbhagya HB, Baskaran R, Prakash M, Rastogi NK. Osmotic treatment
for the impregnation of anthocyanin in candies from Indian gooseberry (Emblica officinalis). J.Food Eng.. 2016;175:24–32.
Agnieszka C, Andrzej L. Rehydration and sorption properties of osmotically pretreated freeze-driedstrawberries. J. Food Eng.. 2010;97(2):267–274.
Aider M, Halleux D. Production of concentrated cherry and apricot juices by cryoconcentrationtechnology. LWT Food Sci. Technol.. 2008;41(10):1768–1775.
Allali H, Marchal L, Vorobiev E. Effect of blanching by ohmic heating on the osmotic dehydrationbehavior of apple cubes. Dry. Technol.. 2009;27(6):739–746.
Allali H, Marchal L, Vorobiev E. Effects of vacuum impregnation and ohmic heating with citric acidon the behaviour of osmotic dehydration and structural changes of apple fruit. Biosyst. Eng..2010;106(1):6–13.
An K, Li H, Zhao D, Ding S, Tao H, Wang Z. Effect of osmotic dehydration with pulsed vacuum onhot-air drying kinetics and quality attributes of cherry tomatoes. Dry. Technol.. 2013;31(6):698–706.
Atarés L, Chiralt A, González-Martínez C. Effect of solute on osmotic dehydration and rehydrationof vacuum impregnated apple cylinders (cv. Granny Smith). J. Food Eng.. 2008;89(1):49–56.
Augustin MA, Hemar Y. Nano- and micro-structured assemblies for encapsulation of foodingredients. Chem. Soc. Rev.. 2009;38:902–912.
Barrera C, Betoret N, Fito P. Ca2+ and Fe2+ influence on the osmotic dehydration kinetics of appleslices (var. Granny Smith). J. Food Eng.. 2004;65(1):9–14.
Betoret N, Puente L, Díaz MJ, Pagán MJ, García MJ, Gras ML, Martínez-Monzo J, Fito P.Development of probiotic-enriched dried fruits by vacuum impregnation. J. Food Eng..2003;56(2–3):273–277.
Boaventura BCB, da Silva EL, Liu RH, Prudêncio ES, di Prieto PF, Becker AM, Castanho RD.Effect of yerba mate (Ilex paraguariensis A. St. Hil.) infusion obtained by freeze concentration

technology on antioxidant status of healthy individuals. LWT Food Sci. Technol.. 2015;62(2):948–954.
Boaventura BCB, Murakami ANN, Prudêncio ES, Maraschin M, Murakami FS, Amante ER,Castanho RD. Enhancement of bioactive compounds content and antioxidant activity of aqueousextract of mate (Ilex paraguariensis A. St. Hil.) through freeze concentration technology. FoodRes. Int.. 2013;53(2):686–692.
Burgain J, Gaiani C, Linder M, Scher J. Encapsulation of probiotic living cells: from laboratory scaleto industrial applications. J. Food Eng.. 2011;104:467–483.
Butler MF. Freeze concentration of solutes at the ice/solution interface studied by opticalinterferometry. Cryst. Growth Des.. 2002;2(6):541–548.
Castagnini JM, Betoret N, Betoret E, Fito P. Vacuum impregnation and air drying temperature effecton individual anthocyanins and antiradical capacity of blueberry juice included into an applematrix. LWT Food Sci. Technol.. 2015;64(2):1289–1296.
Castelló ML, Fito PJ, Chiralt A. Effect of osmotic dehydration and vacuum impregnation onrespiration rate of cut strawberries. LWT Food Sci. Technol.. 2006;39(10):1171–1179.
Castro N, Durrieu V, Raynaud C, Rouilly A, Rigal L, Quellet C. Melt extrusion encapsulation offlavors: a review. Polym. Rev.. 2016;56(1):137–186.
Champagne C, Fustier P. Microencapsulation for the improved delivery of bioactive compounds intofoods. Curr. Opin. Biotechnol.. 2007;18:184–190.
Cook MT, Tzortzis G, Charalampopoulos D, Khutoryanskiy VV. Microencapsulation of probioticsfor gastrointestinal delivery. J. Control. Rel.. 2012;162(1):56–67.
Corrêa JLG, Ernesto DB, de Mendonça KS. Pulsed vacuum osmotic dehydration of tomatoes:sodium incorporation reduction and kinetics modeling. LWT Food Sci. Technol.. 2016;71:17–24.
De Prisco A, Mauriello G. Probiotication of foods: a focus on microencapsulation tool. Trends FoodSci. Technol.. 2016;48:27–39.
De Vos P, Faas M, Spasojevic M, Sikkema J. Encapsulation for preservation of functionality andtargeted delivery of bioactive food components. Int. Dairy J.. 2010;20:292–302.
Deshpande SS, Bolin HR, Salunkhe DK. Freeze concentration of fruit juices. Food Technol..1982;36(5):68–82.
Dette SS, Jansen H. Freeze concentration of black currant juice. Chem. Eng. Technol..2010;33(5):762–766.
Dorđević V, Balanč B, Belščak-Cvitanović A, Lević S, Trifković K, Kalušević A, Kostić I, KomesD, Bugarski B, Nedović V. Trends in encapsulation technologies for delivery of food bioactivecompounds. Food Eng. Rev.. 2015;7(4):452–490.
Gouin S. Microencapulation: industrial appraisal of existing technologies and trends. Trends FoodSci. Technol.. 2004;15:330–347.
Grabowski S, Marcotte M. Pretreatment efficiency in osmotic dehydration of cranberries. In: Welti-Chanes J, Velez-Ruiz F, Barbosa-Cánovas GV, eds. Transport Phenomena in Food Processing.New York, NY: CRC Press; 2003:83–94.
Grabowski S, Marcotte M, Poirier M, Kudra T. Drying characteristics of osmotically pretreatedcranberries—energy and quality aspects. Dry. Technol.. 2002;20(10):1989–2004.
Gunathilake M, Shimmura K, Dozen M, Miyawaki O. Flavor retention in progressive freeze-concentration of coffee extract and pear (La France) juice flavor condensate. Food Sci. Technol.Res.. 2014;20(3):547–554.

Hartel RW. Evaporation and freeze concentration. In: Heldman DR, Lund DB, eds. Handbook ofFood Engineering. New York, NY: Marcel Dekker; 1992:341–392.
Hartel RW. Crystallization in Foods. New York, NY: Aspen; 2001.Heidebach T, Först P, Kulozik U. Microencapsulation of probiotic cells for food applications. Crit.
Rev. Food Sci. Nutr.. 2012;52(4):291–311.Helgerud, Gaserød O, Fjæreide T, Andersen PO, Larsen CK. Alginates. In: Imeson A, ed. Food
Stabilizers, Thickeners and Gelling Agents. Iowa, USA: Wiley-Blackwell; 2010:50–56.Holkem A, Raddatz G, Barin J, Moraes E, Muller E, Codevilla C, Jacob-Lopes E, Ferreira C, de
Menezes C. Production of microcapsules containing Bifidobacterium BB-12 byemulsification/internal gelation. LWT Food Sci. Technol.. 2017;76:216–221.
Huige, N.J.J., 1972. Nucleation and Growth of Ice Crystals From Water and Sugar Solutions inContinuous Stirred Tank Crystallizers. PhD dissertation. TU Eindhoven, Netherlands.
Kaur N, Singh AK. Ohmic heating: concept and applications—a review. Crit. Rev. Food Sci. Nutr..2016;56:2338–2351.
Knirsch CM, dos Santos CA, Vicente AAM, Penna TCV. Ohmic heating—a review. Trends FoodSci. Technol.. 2010;21:436–441.
Kris-Etherton PM, Hecker KD, Bonanome AB, Coval SM, Binkoski AE, Hilpert K, et al. Bioactivecompounds in foods: their role in the prevention of cardiovascular disease and cancer. Am. J.Med.. 2002;113(9B):71–88.
Kumar V, Kumar G, Sharma PD. Osmotic dehydration of litchi pulp as a pretreatment for dryingprocesses. Agr. Eng. Int.. 2012;14(3):146–151.
Liu L, Miyawaki O, Hayakawa K. Progressive freeze-concentration of tomato juice. Food Sci.Technol. Res.. 1999;5(1):108–112.
Lombard GE, Oliveira JC, Fito P, Andrés A. Osmotic dehydration of pineapple as a pre-treatment forfurther drying. J. Food Eng.. 2008;85(2):277–284.
Madene A, Jacquot M, Scher J, Desobry S. Flavour encapsulation and controlled release—a review.Int. J. Food Sci. Technol.. 2006;41:1–21.
Malmo C, La Storia A, Mauriello G. Microencapsulation of Lactobacillus reuteri DSM 17938 cellscoated in alginate beads with chitosan by spray drying to use as a probiotic cell in a chocolatesouffle. Food Bioprocess Technol.. 2013;6:795–805.
Marcotte M, Trigui M, Ramaswamy HS. Effect of salt and citric acid on electrical conductivities andohmic heating of viscous liquids. J. Food Process. Preserv.. 2000;24:389–406.
McClements DJ, Decker EA, Weiss J. Emulsion-based delivery systems for lipophilic bioactivecomponents. J. Food Sci.. 2007;72:109–124.
Mitropoulou G, Nedovic V, Goyal A, Kourkoutas Y. Immobilization technologies in probiotic foodproduction. J. Nutr. Metab.. 2013;2013:716861.
Miyawaki O. Analysis and control of ice crystal structure in frozen food and their application to foodprocessing. Food Sci. Technol. Res.. 2001;7:1–7.
Miyawaki O, Gunathilake M, Omote C, Koyanagi T, Sasaki T, Take H, Matsuda A, Ishisaki K, MiwaS, Kitano S. Progressive freeze concentration of apple juice and its application to produce a newtype apple wine. J. Food Eng.. 2016;171:153–158.
Mizock BA. Probiotics. Dis. Mon.. 2015;61:259–290.

Moreno J, Espinoza C, Simpson R, Petzold G, Nuñez H, Gianelli MP. Application of ohmicheating/vacuum impregnation treatments and air drying to develop an apple snack enriched infolic acid. Innov. Food Sci. Emerg. Technol.. 2016;33:381–386.
Moreno FL, Quintanilla-Carvajal MX, Sotelo LI, Osorio C, Raventós M, Hernández E, Ruiz Y.Volatile compounds, sensory quality and ice morphology in falling-film and block freezeconcentration of coffee extract. J. Food Eng.. 2015;166:64–71.
Moreno FL, Raventós M, Hernández E, Ruiz Y. Block freeze-concentration of coffee extract: effectof freezing and thawing stages on solute recovery and bioactive compounds. J. Food Eng..2014;120:158–166.
Moreno J, Simpson R, Baeza A, Morales J, Muñoz C, Sastry S, Almonacid S. Effect of ohmicheating and vacuum impregnation on the osmodehydration kinetics and microstructure ofstrawberries (cv. Camarosa). LWT Food Sci. Technol.. 2012;45(2):148–154.
Moreno J, Simpson R, Estrada D, Lorenzen S, Moraga D, Almonacid S. Effect of pulsed-vacuum andohmic heating on the osmodehydration kinetics, physical properties and microstructure of apples(cv. Granny Smith). Innov. Food Sci. Emerg. Technol.. 2011;12(4):562–568.
Moreno J, Simpson R, Pizarro N, Pavez C, Dorvil F, Petzold G, Bugueño G. Influence of ohmicheating/osmotic dehydration treatments on polyphenoloxidase inactivation, physical propertiesand microbial stability of apples (cv. Granny Smith). Innov. Food Sci. Emerg. Technol..2013;20:198–207.
Moreno J, Simpson R, Sayas M, Segura I, Aldana O, Almonacid S. Influence of ohmic heating andvacuum impregnation on the osmotic dehydration kinetics and microstructure of pears (cv.Packham’s Triumph). J. Food Eng.. 2011;104(4):621–627.
Moreno J, Zúñiga P, Jara E, Gianelli MP, Mella K, Petzold G. Ohmic heating and bioactivecompounds. In: Moreno JJ, ed. Innovative Processing Technologies for Foods With BioactiveCompounds. Boca Raton, FL: CRC Press; 2016:32–60.
Morison KR, Hartel RW. Evaporation and freeze concentration. In: Heldman DR, Lund DB, eds.Handbook of Food Engineering. New York, NY: CRC Press; 2007:495–552.
Nakagawa K, Maebashi S, Maeda K. Freezing and thawing as a path to concentrate aqueous solution.Sep. Purif. Technol.. 2010;73:403–408.
Nakagawa K, Nagahama H, Maebashi S, Maeda K. Usefulness of solute elution from frozen matrixfor freeze-concentration technique. Chem. Eng. Res. Des.. 2010;88(5):718–724.
Neri L, Di Biase L, Sacchetti G, Di Mattia C, Santarelli V, Mastrocola D, Pittia P. Use of vacuumimpregnation for the production of high quality fresh-like apple products. J. Food Eng..2016;179:98–108.
Omran AM, King CJ. Kinetics of ice crystallization in sugar solutions and fruit juices. AIChE J..1974;20:795–803.
Oomah BD, Mazza G, Functional foods. Encyclopedia of Food Science and Technology, vol. 2. NewYork, NY: Wiley; 2000:1176–1182.
Osorio C, Franco M, Castaño MP, González-Miret ML, Heredia F, Morales A. Colour and flavourchanges during osmotic dehydration of fruits. Innov. Food Sci. Emerg. Technol.. 2007;8:353–359.
Panico AM, Garufi E, Nitto S, Di Mauro R, Longhitano RC, Magri G, Catalfo A, Serrentino ME, DeGuidi G. Antioxidant activity and phenolic content of strawberry genotypes from Fragaria xananassa. Pharm. Biol.. 2009;47(3):203–208.

Petzold G, Aguilera JM. Ice morphology: fundamentals and technological applications in foods.Food Biophys.. 2009;4:378–396.
Petzold G, Gianelli MP, Bugueño G, Celan R, Pavez C, Orellana P. Encapsulation of liquid smokeflavoring in Ca-alginate and Ca-alginate-chitosan beads. J. Food Sci. Technol.. 2014;51(1):183–190.
Petzold G, Orellana P, Moreno J, Cerda E, Parra P. Vacuum-assisted block freeze concentrationapplied to wine. Innov. Food Sci. Emerg. Technol.. 2016;36:330–335.
Petzold G, Orellana P, Moreno J, Junod J, Bugueño G. Freeze concentration as a technique to protectvaluable heat-labile components of foods. In: Moreno JJ, ed. Innovative Processing Technologiesfor Foods With Bioactive Compounds. Boca Raton, FL: CRC Press; 2016:183–194.
Pitigraisorn P, Srichaisupakit K, Wongpadungkiat N, Wongsasulak S. Encapsulation of Lactobacillusacidophilus in moist-heat-resistant multilayered microcapsules. J. Food Eng.. 2017;192:11–18.
Radziejewska-Kubzdela E, Bieganska-Marecik R, Kidon M. Applicability of vacuum impregnationto modify physico-chemical, sensory and nutritive characteristics of plant origin products—areview. Int. J. Mol. Sci.. 2014;15(9):16577–16610.
Rahman MS, Ahmed M, Chen XD. Freezing–melting process in liquid food concentration.Handbook of Food Preservation. second ed. Boca Raton, FL: CRC Press; 2007:667–686.
Ramaswamy H, Marcotte M. Food Processing: Principles and Applications. Boca Raton, FL: Taylor& Francis; 2006.
Ramaswamy HS, Marcotte M, Sastry S, Abdelrahim K. Ohmic Heating in Food Processing. BocaRaton, FL: CRC Press; 2014.
Ramos FA, Delgado JL, Bautista E, Morales AL, Duque C. Changes in volatiles with the applicationof progressive freeze-concentration to Andes berry (Rubus glaucus Benth). J. Food Eng..2005;69(3):291–297.
Rastogi NK, Raghavarao KSMS, Niranjan K. Recent developments in osmotic dehydration. In: SunDW, ed. Emerging Technologies for Food Processing,. second ed. San Diego, CA: AcademicPress; 2014:181–212.
Rathore S, Desai PM, Liew CV, Chan LW, Heng PWS. Microencapsulation of microbial cells. J.Food Eng.. 2013;116:369–381.
Rodriguez A, Rodriguez MM, Mascheroni RH. Characteristic process variables during the osmoticdehydration of stone fruits: experimental values and correlations between components content. J.Food Process Eng.. 2015;38(5):415–425.
Sahagian ME, Goff HD. Fundamental aspects of the freezing process. In: Jeremiah LE, ed. FreezingEffects on Food Quality. New York, NY: Marcel Dekker; 1996:1–12.
Şahin U, Öztürk HK. Effects of pulsed vacuum osmotic dehydration (PVOD) on drying kinetics offigs (Ficus carica L). Innov. Food Sci. Emerg. Technol.. 2016;36:104–111.
Sánchez B, Ruiz L, Guidemond M, Ruas-Madiedo P, Margolles A. Toward improving technologicaland functional properties of probiotics in foods. Trends Food Sci. Technol.. 2012;26:56–63.
Schwartzberg HG. Food property effects in evaporation. In: Singh RP, Medina AG, eds. FoodProperties and Computer-Aided Engineering of Food Processing Systems. Boston, MA: NATOASI Series; 1989:443–470.
Simon R, de la Calle B, Palme S, Meier D, Anklam E. Composition and analysis of liquid smokeflavouring primary products. J. Sep. Sci.. 2005;28:871–882.

Sobel R, Versic R, Gaonkar AG. Introduction to microencapsulation and controlled delivery in foods.In: Gaonkar AG, Vasisht N, Khare A, Sobel R, eds. Microencapsulation in the Food Industry: APractical Implementation Guide. San Diego, CA: Academic Press; 2014:3–12.
Sohail A, Turner MS, Coombes A, Bostom T, Bhandari B. Survivability of probiotics encapsulatedin alginate gel microbeads using a novel impinging aerosols method. Int. J. Food Microbiol..2011;145:162–168.
Stocking JH, King CJ. Secondary nucleation of ice in sugar solutions and fruit juices. AIChE J..1976;22:131–140.
Torringa E, Esveld E, Scheewe I, van den Berg R, Bartels P. Osmotic dehydration as a pre-treatmentbefore combined microwave–hot-air drying of mushrooms. J. Food Eng.. 2001;49(2–3):185–191.
Tortoe C. A review of osmodehydration for the food industry. Afr. J. Food Sci.. 2010;4(6):303–324.Tripathy MK, Giri SK. Probiotic functional foods: survival of probiotics during processing and
storage. J. Funct. Foods. 2014;9:225–241.Weinbreck F, Bodnar I, Marco ML. Can encapsulation lengthen the shelf-life of probiotic bacteria in
dry products? Int. J. Food Microbiol.. 2010;136:364–367.Welti-Chanes J, Bermúdez D, Valdes-Fragoso A, Mujica-Paz H, Alzamora SM. Principles of freeze-
concentration and freeze-drying. In: Murrell KD, Hui YH, Nip WK, Lim MH, Legarreta IG,Cornillon P, eds. Handbook of Frozen Foods. New York, NY: Marcel Dekker; 2004:13–17:(Chapter 2).
Welti-Chanes J, Bermúdez D, Valdes-Fragoso A, Mujica-Paz H, Alzamora SM, Principles andapplications of freeze concentration and freeze-drying. Hui YH, ed. Handbook of Food Science,Technology, and Engineering, vol. 3. Boca Raton, FL: CRC Press; 2006:106-2–1106-8: (Chapter106).
Yadav AK, Singh SV. Osmotic dehydration of fruits and vegetables: a review. J. Food Sci. Technol..2014;51(9):1654–1673.
Zaritzky N. Physical–chemical principles in freezing. Handbook of Frozen Food Processing,Packaging. Boca Raton, FL: CRC Press; 2006:3–31.
Zhao JH, Hu R, Xiao HW, Yang Y, Liu F, Gan ZL, Ni YY. Osmotic dehydration pretreatment forimproving the quality attributes of frozen mango: effects of different osmotic solutes andconcentrations on the samples. Int. J. Food Sci. Technol.. 2014;49(4):960–968.
Zhao R, Sun J, Torley P, Wang D, Niu S. Measurement of particle diameter of Lactobacillusacidophilus microcapsule by spray drying and analysis on its microstructure. World J. Microbiol.Biotechnol.. 2008;24(8):1349–1354.
Zuidam JN, Shimoni E. Overview of microencapsulation for use in food products or processes andmethods. In: Nedovics VA, Zuidam JN, eds. Encapsulation Technologies for Active FoodIngredients and Food Processing. New York, NY: Springer; 2010:1–6.

C H A P T E R 4
Cutting Automation in FoodProcessingDebao Zhou*
Gary McMurray**
Wayne Daley**
Jing Bai*
Shufang Wang† * University of Minnesota, Duluth, MN, United States ** Georgia Tech Research Institute (GTRI), Georgia Institute of Technology, Atlanta, GA, United States † Institute of Mechatronics, Beijing Union University, Beijing, China
AbstractRobot manipulators have been used in many fields relating to human life. One of the examplesis food processing. Compared to traditional industry, such as car assembly, these tasks are moredifficult for a robot to finish, because of change in size during food cutting or the difficulty ofdeveloping automated devices to perform cutting operations on parts with unknown sizes. Tosuccessfully conduct such tasks, we need a better understanding of the cutting principle. This isthe main goal of this research article. We first developed a mathematical model of blade slicing-compression cutting. Next, we studied the influences from the perspectives of materialproperties, deformation, and blade properties on the cutting force. Based on these studies, wecan develop a method to categorize the sharpness levels of a blade. The required force toachieve a slicing-compression cut can be predicted. This provides the reference force to modifythe trajectory for cutting automation. These results can be directly used in chicken wing-shoulder cutting operations in a poultry-processing factory, which is a task that directly affectsthe yield of the breast meat.

Keywords
slicing and compression cutautomationsharpnessrobotic device
1. IntroductionIn food processing, cutting is one of the main operations. One of theexamples is the poultry deboning procedure as shown in Fig. 4.1. A birdwith a marked front half is shown in Fig. 4.1A and Fig. 4.1B shows theprocedure to manually harvest butterflies and a butterfly is shown inFig. 4.1D. These butterflies are harvested from front halves in a poultryplant. During the procedure, the first step is to cut a front half away from abird and then the front half is put on a cone for deboning. Next, the workershave to sever the joint connections. Then, as illustrated in Fig. 4.1C, thewing and breast meat are pulled away from the carcass. Since roughly morethan 300,000 chickens have to be manually processed each day to supportthe demand for chicken breast meat, the workers have to work day andnight with the same movements. Thus this procedure is very onerous to theworkers. Obviously, automating this procedure will be very useful.However, this automation is very difficult due to the naturally differentbodies, size differences, and the possibility of hard bone chips in meat. Onecommercial solution is available from the automation deboning lines at theStork Poultry Processing (Marel, 2016). However, this method is still afixed automation because the cutting trajectories have to be preset and thusthey cannot deal with the problem of changing sizes in the actualapplications. Then a new cutting device was developed by Meyn (2016).This cutting device has only one fixed motion for the deboning of all fronthalves. A reference-point method was developed by Daley et al. (1999) toestimate the locations of the cutting trajectories to adapt to different chickensizes. Through the analysis of the computer images, they obtained thereference points. Using a similar method, a water-jet cutting method is

proposed by Owens (2010) to cut chicken breast muscle to obtain certainshapes. The research has been further developed beyond chicken processingto, for example, pork or beef. These kinds of work have been presented byITEC (2016) and Scott (2016). Their pork and beef deboning method is tocut through everything including hard bones, while chicken deboningmethods try to avoid cutting hard bones in order to obtain high-qualitybutterflies.
FIGURE 4.1 Illustration of the Harvesting of Chicken Butterfly. (A) Whole bird with indicated front half, (B) joint cut and butterflyharvesting, (C) carcass on cone, (D) harvested chicken breast meat.
With the development of the robotics technology, replacing manualworkers with robotic devices has shown some promise for the automationwith the capability to adapt to changes in size and body deformation. It iswell known that in cutting due to the deformation of the biomaterial, thedesired force trajectory in this control loop plays an important role andthere is no way to realize the automation using only the position control.

This work focused on the development of the principles to facilitate designof automated cutting strategies. In order to accomplish this, a thoroughunderstanding of the science behind cutting of biomaterials is required.
In biomaterial cutting, the friction force against the knife has beenconsiderably reduced when compared to metal cutting. Thus energy methodhas been used to formulate the food-cutting problem. One of the mostpopular ones is the fracture toughness concept proposed by Ranganathanaet al. (2016). Another method is the potential function method studied byOstadhossein et al. (2015). This method has been widely used to derive theclosed form solution. In this method, in terms of the space derivatives ofcertain airy stress functions that satisfy biharmonic equations (Freddiet al., 2015), the components of the displacement and the stress tensor areformulated. Xu (1996) provided a closed form expression of the stressdistribution for a point force. As described by Love (1929), the solution to aload applied is normal to an infinite half-space was given by Boussinesq(1885). In addition, Cerruti applied the reciprocal Theorem to obtain thesolution tangential to the surface. The problem modeled by Cerruti is aboutthe sliding of two cylindrical surfaces rotating around its axis and the twoaxes are parallel with each other. Since the two cylindrical surfaces slidealong the axis direction, it is fundamentally different from the cuttingproblem. Based on the derivation of the integral of the point force airyfunctions, Love (1927) provided the integral for a rectangular area withconstant normal pressure. Alic and Persson (2016) has used the samemethod as Love to get the solution for a first-order polynomial load whenapplied to a rectangular surface. The explicit solution for normal deflectiondue to a polynomial distribution of normal and tangential pressure acting ona triangular region has also been given by Svec and Gladwell (1971) andDydo and Busby (1995), respectively. Poritsky and Schenectady (1950)considered stress and deflections of cylindrical bodies in contact withapplications of gears and locomotive wheels.
During cutting, in the amount of energy required to result in cutting, theformation of the chips (or offcuts) plays a major role. Plastically deformedoffcuts was created during metal cutting and the offcuts permanently storeenergy while the elastically deformed food offcuts (in materials, such ascheese, fruit, etc.) did not permanently store energy. The food cuttingproblems have been formulated by many resarchers using the energy

method through the application of the fracture toughness concept(Ranganathana et al., 2016); among them, the relationship between thecutting force and cut depth during deformation, cutting, and rupture by Yimet al. (2015) and “why there is smaller cutting force requirement whenpressing and slicing compared to pressing only” was answered by Williamset al. (2016). Orlowski et al. (2013) provided experimentally determinedvalues for fracture toughness of several biomaterials. Starting from theenergy perspective, the stress and force distribution in cheese cutting wasformulated by Kamyab et al. (1998).
We can use another method to explain the cutting process based oninternal stress. The shearing properties of wood using the stress analysismethod were studied by O’Loinsigh et al. (2012). They mainly consideredaverage shear stresses. Some of the material properties, such as shearmodulus and shear strength, were obtained through an in-plane shear test ofa thin specimen.
It is well known that blade sharpness affects the required cutting forces.So it is an important factor that needs to be considered during the cuttingoperations. It is also known that it is an area between the contact of thecutting object and the blade. This claim can be proved using themicrostructure of a knife, which has been documented by Sandvik MaterialsTechnology (Sandvik, 2016). During wire cheese-cutter cutting, Kamyabet al. (1998) studied the force per unit length with various wire diametersand cutting speeds. Cutting moments and the grip forces applied by anoperator are also directly influenced by the blade sharpness. McGorry et al.(2014) studied the magnitude of the grip force and moment using threekinds of blades with different sharpness; namely polished, smooth, andcoarse knife. The results they obtained support that a finely polished knifesignificantly reduced mean grip force and cutting moment during thecutting operation. A procedure to establish knife-steeling schedules hasbeen developed by Szabo et al. (2001) based on the increased force due toknife dullness from repetitive use to minimize operator exertions andphysical stress associated with work-related musculoskeletal disorders. Thecutting area when the blade cut to a carrageenan target is used to quantifythe absolute sharpness.
In this research, starting from a point force, we used the integration of thestress solution to get the stress distribution on a surface. In this work, we

first provide the analytical solutions for both the constant and linear forceintensity. We then evaluate those results using a graphical method. Thesesolutions build a foundation to explain the initialization of cutting fractureand can be used to evaluate cutting force. Thus internal stresses are used todescribe the cutting mechanics and the sharpness of a set of blades. Fromthese results, we can have a better understanding of the mechanism thatinitializes the cutting facture and continues the cuts. This provides theanalytical expression for the relative sharpness factor. At the same time, wealso systematically analyzed other influencing factors, that is, edge widthand shape. These formulations have also been verified using Finite ElementAnalysis results.
In the following sections, the modeling of the cutting interaction isspecified in Section 2 first. Simulation results are explained in Section 3.The model is verified using FEM method, which is shown in Section 4. Theexperimental results have further proved the modeling as shown inSection 4. The experimental results, as shown in Section 5, have furtherproved the correctness of the theoretical modeling. Finally, the cutting testof a chick shoulder is illustrated in Section 6. Conclusions are drawn inSection 7.
2. Modeling of Biomaterial CuttingIn this work, as shown in Fig. 4.2, the cutting of biomaterials is simplifiedto a distributed force intensity acting on the surface of a semiinfinitebiomaterial body. We fixed the coordinate frame xyz on a predeformedbody. In Fig. 4.2, the x- and y-axes are on the boundary, the x-axis pointstoward the direction of the horizontal force and the x-, y-, and z-axes followthe right-hand rule. The area that the total force (with magnitude P) actsupon is (–∞,∞) in the x direction, and [y1, y2] in the y direction. In Fig. 4.2,Ppv and Pph are the magnitude of the point forces acting in the z and xdirections, respectively.

FIGURE 4.2 Simplified Cutting Forces Acting on the Boundaryof a Semiinfinite Body.
This analysis is built on the following assumptions (Zhou andMcMurray, 2011):
1. We assume the biomaterial is isotropic and we can apply theelasticity theory.
2. The blade moves translationally relative to the biomaterials. Theknife speed is slow and we can apply quasi-static cutting.
3. The force is constant along any line parallel to the x-axis. Thecutting force intensity is zero at the edge of the contact area.
4. The offcuts generated during cutting will move away from the bladeand we assume there is no friction force on the knife. Once theknife comes in close contact with the biomaterials, there is nochange between the contact areas of the blade edge with thebiomaterials.

(4.1a)
(4.1b)
(4.1c)
Using the principle of superposition, the area force distribution wasobtained through the integral of the point force to line force, and the lineforce was integrated to obtain the area force. The formulation is discussedin detail in the following sections.
2.1. Stress Generated by Point Force2.1.1. Formulation of the stress distribution when thereis only normal point forceFor a normal force Ppv with the condition at s = 0, Boussinesq (1885)provided the solutions for the stress distribution. For certain material, thestress distribution at point A(x, y, z) has been provided by Qu and Zhang(2013), and Xu (1996) as follows:
where

(4.1d)
(4.1f–4.1g)
(4.1e)
(4.2a)
In Eq. (4.1), superscript v′ denotes values related to Ppv; and R and r arethe distances of A from the point at which the cutting force acts.
2.1.2. Formulation of the stress distribution when thereis only tangential point forceWhere there is only Pph at s = 0, the solution is shown in Eq. (4.2).
Where

(4.2b)
(4.2c)
(4.2d)
(4.2e–g)2.2. Stress Generated by Line ForceThe relationship between the line force (plv or plh) and the point force is asfollows:
2.2.1. Formulation of the stress distribution when thereis only normal line forceWhen there is a line force acting along a line of length ds, the stress at pointA can be expressed as

(4.3)
(4.4)
In Eq. (4.3), ds is an infinitesimal distance. So Eq. (4.3) still can be usedfor the stress formulation at point A. Using the Superposition Theorem, wecan calculate the stress distribution for the given force acting on the linesegment [x1, x2] along the x-axis. We have the following relationship:
where v denotes that the stress is due to the segment line forcebetween [x1, x2]. Then, the stresses at any point in the semiinfinite bodygenerated by line force acting along (x1, x2) can be found in Eq. (4.5).

(4.5)
(4.6)
When x1 → −∞ and x2 → ∞, the stress distribution is
In Eq. (4.6), v∞ denotes that the results are obtained from aninfinite-long line force. We can find a similar answer from Xu (1996) but
only are not always zero and the otherstress components are uniformly zero. However, the above deduction shows
that is not always zero. When the force intensity plv results in adeformation along the x direction, the normal stress σx prevents thisdeformation (due to a semiinfinite plane). We can also interpret this as aplane stress problem. For such a problem to be true, it has to meet the

(4.7)
following two constraints: (1) the strain in x direction must be zero and (2)σx = μ(σy + σz). We can see that Eq. (4.5) and Eq. (4.6) satisfy the secondconstraint. If the Poisson’s ratio μ is zero, σx will be equal to 0, that is, nodeformation happens in x direction and we can satisfy the first condition.
2.2.2. Formulation of the stress distribution when thereis only tangential line forceSimilarly, we can obtain the formulation of the stress when there is onlytangential line force on the area [x1, x2] as shown in Eq. (4.7).
where

(4.9)
(4.8)
As x1 and x2 → –∞ and ∞, respectively, this problem is the same as thatof a line force acting on the boundary of a semiinfinite body. The stress canbe obtained as:
2.3. Stress Generated by Area ForceWe can express an area force with intensity pv or ph on the area of length at2a (a > 0) in y direction as follows:
In the plane that is parallel to the oyz plane, we assume the distribution ofthe area force is in the profile as shown in Fig. 4.3. The distribution of theforce is 0 at y ≤ −a and y ≥ a and the magnitude of the constant force is qv
and qh at [−w, w] in the y direction. pv (ph) is used to denote the forcedistribution at any point between [−a, a] and qv (qh) is used to denote themagnitude of the constant force distribution between [−w, w].

(4.10b)
(4.11)
(4.10a)
(4.10c)
FIGURE 4.3 Force Distribution Profile for the CombinationCase.
We can seen that the formulation shown in Eq. (4.10) can be used toexpress the relationship between pv (ph) and qv (qh).
We can use Eq. (4.11) to express the relationships between qv,qh, plv, and plh,

2.3.1. Formulation of the stress distribution when thereis only normal area forceAt any point (x, y, z), the stress generated by the normal force intensitybetween [−a, −w] can be obtained as
where and
.The stress generated by the normal force intensity between [−w, w] can
be obtained as

The stress generated by the normal force intensity between [w, a] can beobtained as

2.3.2. Formulation of the stress distribution when thereis only tangential area forceThe stress distribution when there is a tangential area force acting in thearea between [−a, −w] is formulated as

The stress between [–w, w] can be formulated as
The stress between [w, a] is formulated as

(4.12a)
(4.12b)
(4.12c)
We then have:

(4.12d)
(4.12e)
(4.12f)
(4.13)
Since , , weshould have:
where fi (i = 1, …, 6) are functions of the ultimate stress τu a, l,and s. When only tangential force acts on the boundary of the semiinfinitebody, that is, α = 90°, there are only τxy and τxz, which are not zero. Whenthere is only normal force, that is, α = 0°, τxy and τxz go to zero.
The principle stresses (σ1, σ2, σ3) can be obtained by solving the followingEigen-value problem:

(4.14)
(4.15)
(4.17)
(4.16)
σ1, σ2, and σ3 and their directions x correspond to the eigenvalues andeigenvectors, respectively. We can then calculate the maximum shear stressusing the following formula:
where m and n are 1, 2, or 3.
2.3.2.1. Fracture InitializationThe initialization of the cutting fracture can be quantified using Tresca’sfracture criterion from reference (Hellan, 1984). The criteria are illustratedusing the following formula,
where τu and Ks are the ultimate shear strength, and the notchstress concentration factor, respectively. For a given biomaterial, τu, is aconstant. There are two cutting fractures, that is, pre- and postfractures,during the cutting of a biomaterial:
1. Prefracture: As the stresses in the biomaterial are due todeformation, the notch stress concentration factor is 1, that is,Ks = 1.
2. Postfracture: Once the stress reaches the failure criterion given inEq. (4.16), the criterion Ks = 1 is no longer valid and the stressconcentration factor is determined by:

(4.18)
(4.19)
where τu, and τo are the ultimate stresses of the pre- and postfractures,respectively. Since we can obtain the following formulation from Eq.(4.13):
where the function f7mn( ) can be explicitly expressed using f1 to f6.Consider the fracture that initiates at the location (yu, zu), the required forceis obtained by substituting Eq. (4.18) into Eq. (4.17):
where function f8( ) can be explicitly expressed using Eq. (4.18). If therelative position between the knife and te material remains unchanged, theposition where τmax occurs does not change. In this case, P can be expressedusing α, thus we can know the relationship between cutting force andcutting angle, which is the goal of this research.
2.4. Definition of Relative Blade SharpnessFactorIn industry, the term sharpness of a blade is an estimation of the cuttingforce Pu during cutting in a condition, that is, with the specific parametersof ultimate shear stress τu, the contact length between the knife and theblade l, and the slicing angle α. Although it is possible to explicitly expressthe relationship between these parameters and the external force using Eq.(4.19), it is often impractical to get the exact value of these parameters. A

(4.20)
(4.21)
(4.22)
(4.23)
relative sharpness factor η can be specified using the following formula atcertain slicing angle αc:
So, there is:
In practice, we can obtain the relative sharpness factor using thefollowing method:
First, we should use a knife that provides a good cutting quality as anominal one and we specify its cutting force as Pu0 when cutting amaterial.
Then the following formula is used to define this blade sharpness:
Next, the relative sharpness of other knives for cutting the samebiomaterial at a similar condition can be calculated as:
Suppose the ultimate cutting force Puf that can initiate the cuttingfracture, the dullest sharpness can be formulated as:

(4.24)
(4.25)
Thus we define another parameter, the knife relative sharpness level κ,which is expressed as:
where, n is an integer that defined by the user to categorize the sharpnesslevel of a knife; and int(#), which rounds the calculation results expressedby # to the nearest integer. Thus the sharpness of a blade can be specifiedinto n-levels; level 1 is the relative sharpness level in which η0 = 1.
3. Simulation With Changing ParametersIn this simulation, we want to give an explanation of the influences of theparameters y, a, sp (sn), and z. This provides the visualization of the stresschange in the material under different conditions for further cuttingprinciple study. For convenience, we normalized the length parametersusing the half width of the blade, that is, the value of a and all theparameters related to forces have been normalized using p.
3.1. Results of the Stress Distribution With zat Different y When q = 1The stress distribution for different y and z coordinates for a constant forceis shown in Fig. 4.4. In Fig. 4.4, the x-axis is the z coordinate from 0 to 10normalized by a and the y-coordinate is the stress distribution normalizedby q, that is, q = qv = qh = 1 for both the computations of the stress in z andx coordinates. Every line in each figure expresses the change of the stress

with different z in a constant y coordinate. We summarized the change ofthe stress in Table 4.1.
FIGURE 4.4 Stress Tensor Changes Along z Coordinate forDifferent y (y Changes at Step of 0.1) at a = 1, sp = –sn = 0.65,and q = 1. (A) σx. (B) σy. (C) σz. (D) τxy. (E) τyz. (F) τxz.

Table 4.1
Maximum and minimum stress (w = 0.65, q = 1).
ItemMaximum Stress
Minimum Stress (0) LocationMagnitude Locationabs(σ
x )0.6 y ∈ (−w, w) and
z = 0(1) y ∈(−∞, −a) ∪ (a, ∞) and z = 0, or (2)
y = ± ∞, or (3) z = ∞
abs(σx )
1 y ∈ (−w, w) andz = 0
(1) y ∈(−∞, −a) ∪ (a, ∞) and z = 0, or (2)y = ± ∞, or (3) z = ∞
abs(σx )
1 y ∈ (−w, w) andz = 0
(1) y ∈(−∞, −a) ∪ (a, ∞) and z = 0, or (2)y = ± ∞, or (3) z = ∞
abs(τxy )
0.987 y ≈ −w or w, andz = 0
(1) y = ± ∞ and 0 or (2) z = ∞
abs(τyz )
0.275 y = −w or w, andz≈ 0.37
(1) z = 0, or (2) y = ± ∞, or (3) z = ∞
abs(τxz )
1 y ∈ (−w, w) andz = 0
(1) y ∈(−∞, −a) ∪ (a, ∞) and z = 0, or (2)y = ± ∞, or (3) z = ∞
We can also see that (τxy)max becomes larger as sp changes larger (from 0to a). When sp = a, we have the value of (τxy)max at infinite, which is the casewhen there is a constant force acting along y ∈ [−a, a].
3.2. Results About the Stress DistributionWith y at Different z When p = 1To understand the exact change of the stress distribution with y and z, weget another group of results. In the following, the abscissa is the ycoordinate around [−a, a] region. The results are also normalized with p,that is, p = pv = ph = 1. The ordinate is the cutting force. The stress tensor isdrawn in each graph with a different z coordinate. Each line in the followingfigures corresponds to one z coordinate, z ∈ (0, 1] with step 0.2. For thesake of clarity, the different stress components are expressed in differentline styles. For example, solid lines in Fig. 4.4 show the stress componentτxy, and dotted + solid lines show σy, and so forth.

The change of the stress distribution with different combinations of theconstant and linearly distributed force intensity are shown in Fig. 4.4,namely, the constant case, the combined case, and the linear case as shownin A, B, and C, respectively. The results are also summarized in Tables 4.2–4.4, respectively.
Table 4.2
Maximum stress at constant intensity (Fig. 4.4A).
σ x σ y σ z τ yz τ xy τ xzy = a, z = 0 ∞
y = a, z = 0.37 0.158
y = 0, z = 0 0.3 0.5 0.5 0.5
Table 4.3
Maximum stress (combined case: s p = 0.85a).
σ x σ y σ z τ yz τ xy τ xzy = 0.84a, z = 0 0.625
y = 0.84a, z = 0.37a 0.171
y = 0, z = 0 0.37 0.61 0.61 0.61
Table 4.4
Maximum stress (linear case, Fig. 4.4C).
σ x σ y σ z τ yz τ xy τ xzy = 0.7a, z = 0 0.56
y = a, z = 0.37a 0.185
y = 0, z = 0 0.6 1 1 1

Tables 4.2–4.4 also show the locations of the maximum stress locations.All the stresses, except τyz, have their maximum values on the surface forthe half-infinite plane and reduce as z becomes bigger. The location of themaximum τyz is below the surface of the material. The biggest values of σy,σz, and τxz are the same q. The maximum magnitude of σx is related to thePoisson’s ratio of the material, as well as the stresses of σy and σz. The largerthe percentage of the constant force intensity is for the force distribution,the bigger τxy. τxy reaches infinity when p is entirely constant force intensity.
From Fig. 4.5, it can be seen that the fracture of the material, which is aresult of the contact between the blade edge and the material, depends notonly on the shape of a blade but also the material’s mechanical properties.

FIGURE 4.5 Comparison of the Normalized Tensor for DifferentCombination of the Constant Distribution and the LinearDistribution at a = 1. (A) sp = 1 (constant intensity), (B) sp = 0.85 (combined intensity), (C)sp = 0 (linear intensity).
3.3. Relationship Between Fracture Forceand Slicing AngleAnother set of computations was conducted to check the influence of theslicing angle. For this computation, the variables are set as follows: a = 1,w = 0.85, and P/l = 1. The computation results for α = 0° and 90° areillustrated in Fig. 4.6.

FIGURE 4.6 Stress Distribution Along y at Different z(Normalized With P/l). (A) a = 1, w = −w = 0.85a at z = 0; (B) a = 1, w = −w = 0.85a atz = 0.37.
From Fig. 4.6, it is seen that the biggest stress distribution occurs at fourlocationsl which are expressed in (y/a, z/a) and shown in Table 4.5 as (i) to(iv). Note that the position coordinates (x/a, y/a, z/a) in this paper arenormalized using a.
Table 4.5
Locations and values of the possible maximum stresses.
Location (y/a, z/a) σ x σ y σ z τ xy τ yz τ xz(i) (0.00, 0.00) −0.32 −0.54 −0.54 0 0 0.54
(ii) (−0.85, 0.00) −0.32 −0.54 −0.54 0.60 0 0.54
(iii) (−0.93, 0.00) −0.15 −0.25 −0.25 0.72 0 0.25
(iv) (−0.93, 0.37) −0.14 −0.25 −0.25 0.28 −0.16 0.23

The changes of the biggest stress distribution, principle stress andmaximum shear stress with the slicing angle are illustrated in Fig. 4.7A–C,respectively. For clarity, only the stresses at location (ii) are shown inFig. 4.7. Other cases have similar trends, so they are not shown in thisexplanation. As the slicing angle α changes from 0° to 90° at the location(y/a = –0.85, z/a = 0.00), τxy and τxz change from 0 to its biggest value, τxy
keeps at zero, and σx, σy, and σz change from their biggest value to 0. Theprinciple stresses change from (−0.31, −0.55, −0.55) to (0.80, 0, −0.80).The maximum shear stresses change from (0.11, 0, 0.11) to (0.81, 0.4, 0.4).Using Tresca’s fracture criterion (Hellan, 1984) and Eq. (4.9) with Ks = 1,(τ31)max = τu and l = 1, the simulated external force P is shown in Fig. 4.7D.Similar results for the other conditions are presented in Table 4.5.
FIGURE 4.7 Stresses and External Forces Change With SlicingAngle.
In Fig. 4.8A, (i)–(iv) show the location of the biggest shear stress andtheir corresponding fracture force. It is observed that they are the same

expression as shown in Fig. 4.7D. For more information, the maximumshear stresses and the corresponding force P are shown in the same linestyle in Fig. 4.8A.
FIGURE 4.8 Maximum Shear Stresses and Required MinimumCutting Force.
Because P was calculated using the same τu, the smallest one among allthe P at the four locations (i) to (iv) will initialize the fracture. It can beobserved that, when α changes from 0 to 10°, location (iv) will initializefracture and when α changes from 10 to 90°, location (ii) will initializefracture. To express this more clearly, the biggest maximum shear stress andits required smallest external force are reillustrated in Fig. 4.8B. It can beseen that as the slicing angle changes the required external force willchange along the solid black line marked as P.
The total force distribution and its components in the x and z directionhave been presented in Fig. 4.9. It is noticed that the fracture from 0 to 10°is because of τyz, which is just beneath the surface (z ≠ 0). It is the mode IIfracture, edge-sliding fracture as shown in Fig. 4.10A. The fracture from 10to 90° is because of τxy and τxz, which is just on the surface (z = 0). It is themode III fracture, out-of-plane tearing, as shown in Fig. 4.10B.

FIGURE 4.9 Total Force and the Force Components in x and zDirection, Respectively.
FIGURE 4.10 Fracture Modes During Cutting. (A) Shearing mode (KII), (B) tearing mode (KIII).
By observing the profile shown in Fig. 4.9, the effect of slicing anglescan be clearly observed. The required force to cut by compression only isfar larger than the force required by compression and slicing cut. Note also

that force Ph does not change greatly in mode III fracture and its value isequal to the total force.
3.4. Fracture Force via Blade ShapeThe edge shape of a blade can be described by l, a, w, and w. The effect of l(cutting length) and a (edge width) can be figured out using a microscope.If we make l and a bigger, the external force intensity will be smaller. Toachieve certain cutting fracture, larger external force has to be used. Theeffect of the edge width is w. With the formula shown before, the magnitudeof the stress for different values of the blade shape parameter w on thesurface is presented in Fig. 4.11. From Fig. 4.11, it can be seen that by notchanging the magnitude of the external force, when the force distributionchanges from constant to linear distribution, the maximum of all theinduced stresses increases. This brings an increase in the magnitude of themaximum induced shear stress (by using the same external force). Thus, ifwe suppose that τu is constant for certain material, the cutting force torealize fracture is smaller, that is, the knife sharpness is increased.

FIGURE 4.11 Stress Changes With w.
4. Results From Finite Element ModelingIn the following, we will show the results for using both finite elementmethod and experimental results to verify the stress distribution obtained inprevious sections. Using the results in simulation and the cutting force withslicing angle at about 90°, the theoretical cutting force is predicted and wecan then compare these forces with the experimental results.
A software package called ANSYS has been used to compute numericalresults and get verification. The material properties we used in thesimulation are Young’s modular at 93,259 psi and Poisson’s ratio at 0.25. Alarge cubic box was used to represent a half semiinfinite body fixed on itsbase. A cutting force was added over the middle of the surface.

The stresses for two special cases with the slicing angle at 0 and 90° arepresented in Fig. 4.12 and Fig. 4.13, respectively. As shown in Fig. 4.12A–D, when there is only force from the z direction, τxy and τxz are always zeroand the others are not zero. The distribution of stress τyz in the yz plane isshown in Fig. 4.12E. When there is only x direction force, τxy, and τxz are notzero, as shown in Fig. 4.13.


FIGURE 4.12 Numerical Results of the Stress Distribution WithPv Only.
FIGURE 4.13 Numerical Results of the Stress Distribution WithPh Only.
5. Experimental Results and DiscussionFor the experimental testing, we used baking potatoes and chicken breast asthe testing materials. This selection was based on the facts that theproperties of a potato, such as its fracture toughness are available fromliterature (Orlowski et al., 2013). These data were then adopted to verify theexperimental results.
The setup used in this work can be seen in Fig. 4.14. The setup consistsof an ABB robot (ABB, 2016) for motion control and distancemeasurement, and an ATI force/torque sensor (ATI, 2016) to measure thecutting force. The robot is controlled at a very low speed (0.3 mm/s) forcutting. The force data is then saved.

FIGURE 4.14 Experimental Setup.
5.1. Equivalent Fracture ForceOur No. 1 test was conducted to find the relationship between the appliedforce and the generated displacement, as well as the relationship betweenthe fracture force and the cutting length. In this test, different sizes ofpotatoes were used to get different contact lengths. The obtained cuttingforces are shown in Fig. 4.15, where the ordinate is the compression forcein lbs and the abscissa is blade moving distance (cut depth) in mm.

FIGURE 4.15 Force Changes With Time.
The results obtained from chicken breast cut are shown in Fig. 4.16.During both the chicken meat cutting and potato cutting, it is observed thatthe cutting force increases during cutting as shown in Figs. 4.15 and 4.16.When the cutting force reaches certain level, fracture occurs. The force inpotato cutting is 2.2 lbs with contact length 24 mm and 2.35 lbs in chickenbreast cut with a contact length of 15 mm. Then the cutting force drops to alower value, such as 1.45 lbs in potato and 1.60 lbs in chicken breast meatcut, and remains at that value with small variations due to the non-homogeneous material properties throughout the potato/chicken breastmeat. This drop of the cutting force is because of the stress concentration atthe tip of the cut edge. Similar cutting results have been obtained whencutting chicken breast meat and potato. Therefore a complete analysis usingcompression cutting from a potato is applicable to chicken meat and otherbiological materials.

FIGURE 4.16 Cutting of Chicken Meat.
From the relationship between the cutting force and the cut depth of aknife, Young’s modulus for the chicken breast meat and the potato can beobtained using Hertzian Method, as shown by Srivastava et al. (2014).
The relationship between the fracture force and the contact length inpotato cuts is shown in Fig. 4.17, where the abscissa is contact length inmm and the ordinate is the fracture force in lbs. The fracture force and thethickness forms a line with linearity R2 = 0.985 and slope ξu = –0.087.

FIGURE 4.17 Fracture Force and Contact Length.
When the prefracture cutting force before fracture is normalized usingthe contact length, it can be observed that the slope of the curves,prefracture, is about –0.087 lbs/mm as shown in Fig. 4.17. The physicalmeaning of the slope is the relationship of the force and deformationexpressed by Kmax. From Fig. 4.17, the fracture force changes with thethickness at the same rate, –0.087 lbs/mm. This illustrate that for the potatofracture in an elastic state, there is only very small plastic deformationduring cutting.
Figs. 4.18 and 4.19 show the variation of the cutting force for differentcutting contact length. During cutting, the force looks like white noise,which comes from the inhomogeneity of the biomaterials throughout theentire cut process. Although variation exists, the average forms a line withslope at 0.0555.

FIGURE 4.18 Normalized Cutting Force With Contact Length.

FIGURE 4.19 Relationship of Cutting Forces and ContactLength.
Atkins and Mai (1985) have provided the fracture toughness of potato at0.2 KJ/m2. From our experiments, the relationship between the appliedforce and contact length is 0.0555 lbs/mm which is 0.2447 KJ/m2 and it isvery similar to Atkins and Mai’s observation. This proves the applicabilityof our experiments.
Fig. 4.20 shows the values of Ks for various contact widths for a potatocut through many experimental measurements. The Ks are obtained throughfour cuts at different contact length at 5, 13, 16, 20.5, and 24 mm, andanother two cuts at a contact length at 7.5 mm. We can observe that thevalue of Ks is almost constant for any contact length.

FIGURE 4.20 Determination of Ks in Potato Cuts.
5.2. Relative Blade Sharpness FactorReferring to the experiments explained earlier, blades with differentsharpness are studied in this section experimentally in order to determinethe relationship between the blade sharpness and cutting forces.
We prepared several blades with different sharpness. The procedure toverify the relative blade sharpness factor is as follows: (1) Using a new,sharp blade to measure its cutting force (Blade A) and manually makinganother knife dull and calling it Blade E to get ηf by setting η0 = 1. The dullknife is obtained by dulling on sandpaper by cutting at least 10 times. (2)Setting n = 5, which means that we define 5 relative sharpness levels. (3)Determining the sharpness levels of other blades. The blades wereprocessed as follows: (1) we used the sharpest blade to cut a cardboard30 times and then the blade was called blade B; (2) Blade B was used to cutwood 50 times and the blade was then called blade C, (3) blade C wasdulled on aluminum by rubbing 30 times and then the blade was calledblade D. The results obtained from this procedure are shown in Fig. 4.21.

FIGURE 4.21 Cutting Results Using Different SharpnessBlades.
The results have been shown in Table 4.6. In Table 4.4, the first 4columns show the fracture forces. Column 5 shows the average fractureforce. η and κ are computed using Eqs. (4.23) and (4.25). From the lastcolumn in Table 4.6, we can observe that blades B, C, and D are in the 2nd,3rd, and 4th sharpness level, respectively.
Table 4.6
Blade relative sharpness level.
Blade # Force at Fracture (lbs) Average η κA 1.17 1.46 1.43 1.5 1.39 1 1
B 1.77 1.61 1.78 1.75 1.73 1.24 2
C 2.30 2.17 2.29 2.42 2.29 1.65 3
D 2.70 2.51 2.73 2.60 2.64 1.89 4
E 3.55 3.54 3.66 3.45 3.55 2.55 5
By adopting the method described in this section, we can assign anyblade a sharpness level. If the cutting force increases to a certain level thatis not useable for a cutting operation, the blade needs to be resharpened.

5.3. Discussion About the Influence ofSlicing Angle on Cutting ForceThe data from the cuts with different slicing angles on potatoes are shownin Fig. 4.22. Based on the maximum external force when slicing angle isabout 90°, the ultimate shear stresses during the cutting of this specificmaterial can be quantified. The data from both experiments and theoreticalcalculation are shown in Fig. 4.22 for comparison. We can observe that thetwo sets of data agree well with each other in both normal and tangentialcutting direction. Using the results shown in Fig. 4.22, the theoretical forcescan then be used as the desired force in a force control loop for automatingrobotic biomaterial cutting operations using robotic type devices.
FIGURE 4.22 Experimental Data and Theoretical Estimation ofthe Cutting Forces in Pressing and Slicing Cut on Potatoes.
6. Design of a New Cutting Device forChicken Deboning

6.1. Anatomy Structure of Chicken FrontHalvesThe work to harvest chicken breast meat is to sever the ligaments and meatthat connect the chicken wing and main body. However, we cannot cut theconnection between the breast muscle and the wings since they are used asa handle to pull off the chicken breast meat. Before designing cuttingtrajectory, we need to understand the anatomic structures because they willdefine where the blade goes. Fig. 4.1A shows the skeleton of a chickenfront half. Riddell (2011) has conducted research to show its structure.However, we cannot use the results from that study to the cutting trajectoryidentification for the device design in this research work.
The shoulder bone girdle is formed by the connection of the scapula,coracoid, and clavicle. The two girdles connect to the vertebrae throughsome ribs. The coracoids connect together through the keel bone. In freshchickens, the wishbones (clavicles) connect with the keel bone throughsome soft tissues. Compared with Fig. 4.23, the location and orientation ofthe humerus and breast muscle relative to the skeleton is shown inFig. 4.24. The area below the breast muscle under line AB and betweencoracoid and humerus is the starting potion of the tender muscle. Theconnection between humerus and the carcass includes ligaments, tendons,muscle, and skin, which form a ball-socket shoulder joint. When the wingof a fresh front half is pulled, a small gap (about 2–5 mm) is createdbetween the humerus and the shoulder bone girdle. This gap provides thespace for a blade to enter the joint. The gap increases when the top ligamentthat connects the humerus to the carcass is cut.

FIGURE 4.23 Front Half Skeleton.
FIGURE 4.24 Skeleton and Muscle Positions.
There are five main ligaments/tendons connecting the humerus to thecarcass, as shown in Fig. 4.25 as stated by Zhou et al. (2007). Three of them

connect the humerus with the coracoid, one tendon connects the breastmuscle with the humerus through a hole in the middle of the coracoid, andone ligament connects the scapula with the humerus. The structure underBC is a thin layer of muscle (about 5 mm), the gap between the humerusand the coracoid (gap of the ball and socket of the shoulder joint), and theconnecting ligaments/tendons. Fig. 4.26 shows the top view of a front half.In order to describe the cutting trajectory, a frame system oxyz on thechicken is defined. The upward direction of the cone is the positivedirection of the z-axis. Two points are identified as reference points: in the zdirection, the highest coracoid points on the left and right sides. The x-axisdirection is formed by connecting these two points and the positivedirection is from left to right. The y-axis is then defined using the right-hand rule. Point A is a point on the clavicle where the clavicle connects tothe coracoid; G is the middle point of the gap between humerus andcoracoid; BC is the joint gap location. The locations of lines AB and BC arethe cutting lines.

FIGURE 4.25 Humerus and Ligaments.

FIGURE 4.26 Cutting Area Top View.
The “must cut part” (cuts that must be performed in order to safely andefficiently remove the butterfly) under BC is shown in Fig. 4.27A as theshaded area BB’C’C when viewed along the wing direction (Fig. 4.24) andfrom the wing to the body direction with the wing being removed. Note thatthe ligaments and tendons occupy about 3/4 of a circle perimeter around thejoint and leave about 1/4 joint near the neck empty [dark gray arc (green inthe web version) in Fig. 4.27A]. The “must cut part” under AB is shown inFig. 4.27B when viewed along the positive y-axis, where the shadow partshows the breast muscle under AB and the part below AB’ is the tendermuscle and keel bone. Note that the dimensions shown in Fig. 4.27 are theaverage length. They were obtained from the measurement using FARO(2016). For different-size chickens, the above dimensions are different. Thecutting device should have the ability to adapt to the dimension changes.

FIGURE 4.27 Front Half Cutting Area Identification. (A) Side view for BC cut, (B) front view for AB cut.
In this work, the cutting trajectory following BB’C’C is called the jointcut, and the cutting trajectory following ABB’M is called the clavicle cut.Additional area must be cut (MB’B) in order to account for the entering ofthe blade into the muscle.
6.2. Cutting Area and Cutting TrajectoryOne of the design requirements is that the front half translates at 10 in/s,which is the speed of the conveyor in this part of the plant. Based on theaverage dimension of the front halves, the cutting trajectories are specifiedin Tables 4.7 and 4.8. Note that (Xc, Zc) and (Xj, Zj) are the coordinatesmeasured in the frames shown in Fig. 4.27A, B, respectively.
Table 4.7
Clavicle cut trajectory.
Motion Position (X c , Z c ) in Inches Time (s)Origin (0, 0) 0
Size adaptation motion (1, 0) 0.5
Height adjustment motion (1, 1) 0.2
Pushing in motion (1, 1.5) 0.025
Clavicle cutting motion (1, 1) 0.1
Back to origin (0, 0) 0.375
Total time 1.2

Table 4.8
Joint cut trajectory.
Motion Position (X j , Z j ) in Inches Time (s)Origin (0, 0) 0
Size adaptation motion (1, 0) 0.2
Height adjustment motion (1,1) 0.2
Joint cut motion (1, 2.8) 0.2
Back to origin (0, 0) 0.6
Total time 1.2
It is assumed that front halves are fixed on cones and the cones can movetogether with the chain when the cones are fixed on tables. According to thecurrent cone design technology, it is also assumed that the cones canprovide all the required roll, yaw, and pitch motions or a robot can provideall the motion for the cut. The other requirements for the cutting device are(1) the “must cut” trajectory must be followed, (2) the device must adapt tovariation in bird size, (3) cutting force must be small enough such that thecutting cannot damage the carcass and clavicle (Fig. 4.28), and (4) thedeformation is small such that the shoulder joint can be cut by following thedesired cutting trajectory.
FIGURE 4.28 Illustration of a Force Control Diagram forPossible Biomaterial Cutting Operation Control.
In this project, an ABB manipulator with 6 degrees of freedom and a 6-axis force/torque sensor is used for the cutting as shown in Fig. 4.14 and

Fig. 4.29A. The setup of the system is shown in Fig. 4.29A. The control ofthe system is through a C++ program in a computer that is also connected tothe ABB robot controller. The computer gets the force data from theforce/torque sensor to realize the force control. Fig. 4.29B shows thestarting point of the cutting. Fig. 4.29C, J shows the cutting procedure.Fig. 4.29K, L shows the cutting results. It can be observed that the chickenis cut without bone chips.


FIGURE 4.29 Chicken Front Half Automatic Cutting Procedure.
7. ConclusionsIn this research, first we investigated the principles of biomaterial cutting.The question, why a smaller force is required when cutting at larger slicingangles, was answered. The relationships between slicing angle, blade edgegeometry, contact length, the fracture force, and material properties and theapplied force were discussed. Experiments were carried out to validate theformulation and the cutting procedure. The following conclusions aredrawn: (1) the relationship between the cutting force and internal stress isestablished. (2) At the initialization of the cutting fracture, the cutting force(P) is proportional to the contact length (l). (3) At the initialization offracture, the cutting force (P) is not simply proportional to the width of theblade edge (a). Edge shape and edge width have the combined influence onfracture force. For the same edge width, the external force is proportional tothe maximum force intensity, which the edge shape can generate. (4) Forsmaller slicing angles, the cutting fracture is due to shear force τyz (ModeII). For larger slicing angles, the cutting fracture is due to shear force τxy
andτxz (Mode III). Type III fracture requires considerably less force thanType II fracture. (5) By using the relative sharpness factor concept, bladesharpness can be quantified at certain slicing angles. (6) Based on thematerial properties, the knife sharpness properties and the interactionbetween the blade and the material, the required force to realize cutting canbe predicted. The deboning related to chicken shoulder anatomy was

described. The simple cutting trajectories were identified in order to realizeboth easy deboning and chicken size adaptation with good yield. Byproviding the extra moving distance, the system has the ability to adapt tothe dimension change. The force/torque sensor on a robot has been used.Good cutting results with high yield have been realized. This proved thecapability of force control in realizing intelligent cutting.
AcknowledgmentThis project is supported by the State of Georgia through the AgricultureTechnology Research Program at the Georgia Tech Research Institute.
ReferencesABB (ASEA Brown Boveri) Group, Abb.com, 2016. Available from:
http://new.abb.com/products/robotics/industrial-robots/irb-140.Alic V, Persson K. Form finding with dynamic relaxation and isogeometric membrane elements.
Comput. Meth. Appl. Mech. Eng.. 2016;300:734–747.ATI.com, 2016. ATI Industrial Automation. Available from: http://www.ati-ia.com/index.aspx.Atkins A, Mai Y. Elastic and Plastic Fracture: Metals, Polymers, Ceramics, Composites: Biological
Materials. Chichester, United Kingdom: Ellis Horwood; 1985: Halsted Press, New York.Boussinesq J. Application des Potentiels a I’Etude de l’Euqilibre et du Mouvement des Solides
Elastiques. Paris, France: Gauthier-Villars; 1885.Daley, W., He, T., Lee, K., Sandlin M., 1999. Modeling of the natural product deboning process using
biological and human models. In: Proceedings of 1999 IEEE/ASME International Conference onAdvanced Intelligent Mechatronics, pp. 49–54.
Dydo J, Busby H. Elasticity solutions for constant and linearly varying load applied to a rectangularsurface patch on the elastic half-space. J. Elastic.. 1995;38:153–163.
FARO Technologies (Faro.com), 2016. Available from: http://www.faro.com/en-us/home/.Freddi, A., Olmi, G., Cristofolini, L., 2015. Static stress models. Experimental Stress Analysis for
Materials and Structures. Springer Series in Solid and Structural Mechanics, vol. 4, Springer,International Publishing, pp. 217–257. ISBN-13: 9783319060859.
Hellan K. Introduction to Fracture Mechanics. New York, NY, United States: McGraw-Hill; 1984.ITEC Food Techonology (Itec.de), 2016. ITEC GmbH Food Technology official website. Available
from: http://www.itec.de/index.php/fully-automatic-primal-cutting-of-pork.html.Kamyab I, Chalranarti S, Williams J. Cutting cheese with wire. J. Mater. Sci.. 1998;33:2763–2770.Love AEH. A Treatise on the Mathematical Theory of Elasticity. fourth ed. Cambridge, United
Kingdom: Cambridge University Press; 1927.Love AEH. The stress produced in a semi-infinite solid by pressure on part of the boundary. Phil.
Trans. R. Soc. Lond. A.. 1929;667:377–420.

Marel (Marel.com), 2016. Marel poultry. Available from: http://marel.com/poultry-processing.McGorry R, Fallentin N, Andersen J, Keir P, Hansen T, Pransky G, Lin J. Effect of grip type, wrist
motion, and resistance level on pressures within the carpal tunnel of normal wrists. J. Orthoped.Res.. 2014;32(4):524–530.
Meyn Food Processing Technology (Meyn.com), 2016. Available from: https://www.meyn.com/.O’Loinsigh C, Oudjene M, Shotton E, Pizzi A, Fanning P. Mechanical behaviour and 3D stress
analysis of multi-layered wooden beams made with welded-through wood dowels. Comp. Struct..2012;94(2):313–321.
Orlowski K, Ochrymiuk T, Atkins A, Chuchala D. Application of fracture mechanics for energeticeffects predictions while wood sawing. Wood Sci. Technol.. 2013;47(5):949–963.
Ostadhossein A, Cubuk E, Tritsaris G, Kaxiras E, Zhang S, van Duin A. Stress effects on the initiallithiation of crystalline silicon nanowires: reactive molecular dynamics simulations using Reaxff.Phys. Chem. Chem. Phys.. 2015;17:3832–3840.
Owens C. Poultry Meat Processing. second ed. Boca Raton, FL, United States: CRC Press; 2010.Poritsky H, Schenectady N. Stresses and deflections of cylindrical bodies in contact with application
to contact of gears and of locomotive wheels. J. Appl. Mechan.. 1950;17:191–201.Qu, R., Zhang, Z., 2013. A universal fracture criterion for high-strength materials. Sci. Rep. 3,
Article no. 1117.Ranganathana N, Oksmana K, Nayakc S, Saina M. Structure property relation of hybrid
biocomposites based on jute, viscose, and polypropylene: the effect of the fiber content and thelength on the fracture toughness and the fatigue properties. Compos. A. 2016;83:169–175.
Riddell, C., 2011. Comparative anatomy, histology, and physiology of the chicken. Department ofPathology, Western College of Veterinary Medicine, University of Saskatchewan, Saskatoon,Saskatchewan, Canada.
Sandvik Materials Technology (Sandvik.com), 2016. Available from:http://smt.sandvik.com/en/products/strip-steel/strip-products/knife-steel/knife-steel-knowledge/important-factors/microstructure/.
Scott Technology NZ Limited (Scott.co.nz), 2016. Available from: http://www.scott.co.nz/meat-processing/lamb/automated-boning-room-systems.
Srivastava J, Sarkar P, Ranjan V. Contact stress analysis in wheel–rail by Hertzian method and finiteelement method. J. Instit. Eng. (India) Ser. C. 2014;95(4):319–325.
Svec O, Gladwell G. An explicit boussinesq solution for a polynomial distribution of pressure over atriangular region. J. Elastic.. 1971;1(2):167–170.
Szabo R, Radwin R, Henderson C. The influence of knife dullness on poultry processing operatorexertions and the effectiveness of periodic knife steeling. Am. Indust. Hygiene Assoc. J..2001;62(4):428–433.
Williams J, Atkins A, Charalambides M, Lucas P. Cutting science in biology and engineering.Interface Focus. 2016;6(3):20160021.
Xu Z. Elasticity Mechanics (Tan Xing Li Xue). fifth ed. Higher-level Education Publication; 1996: (inChinese).
Yim, S., Joen, S., Choi S., 2015. Data-driven haptic modeling and rendering of deformable objectsincluding sliding friction. IEEE World Haptics Conference (WHC), Evanston, IL, United States,pp. 305–312.

Zhou D, McMurray G. Slicing cuts on food materials using robotic-controlled razor blade, modellingand simulation in engineering. Model. Simul. Eng.. 2011;2011:17.
Zhou, D., Holmes, J., Holcombe, W., Lee, K., McMurray, G., 2007. Automation of bird front halfdeboning procedure: design and analysis. 12th IFToMM World Congress, Besançon, France.

C H A P T E R 5
The Perception of Consumers Vis-à-VisTracked Fish Measured via ElectronicInstrumentErika da Silva Maciel*
Juliana A. Galvão**
Luciana K. Savay-da-Silva†
Hellen A. Kato‡
Fernando R.P. Quaresma§,¶
Jaqueline G. Sonati††
Marília Oetterer** * Federal University of Tocantins, Miracema do Tocantins, Tocantins, Brazil ** University of Sao Paulo, São Paulo, São Paulo, Brazil † Federal University of Mato Grosso, Cuiabá, Mato Grosso, Brazil ‡ Embrapa Fishing and Aquaculture, Palmas, Tocantins, Brazil § Federal University of Tocantins, Palmas, Tocantins, Brazil ¶ Lutheran University Center of Palmas, Palmas, Tocantins, Brazil †† University of Taubaté, São Paulo, São Paulo, Brazil
AbstractFood traceability has been used to monitor production processes, and provide identification and information aboutsources and processes through computer technology. Technology also allows the recall of suspecting productsidentifying potential failures during their production. In this chapter, we discuss the impact of implementing thetracking technology into the Brazilian and Portuguese fish production chain and its impact on consumers’ attitudesusing data collection through the Internet. The data collected allowed evaluating the initiative to track fish. The resultsshowed that for 73.23% of participants, fish tracking was good and very good, and of this total, 82.19% are willing topay more for a product with origin guarantee, which may indicate a market trend in search of a product with originguarantee. The results also provided subsidies for the adoption of policies to implement a traceability system for fish toboost consumption.

Keywords
fish consumptionfish productive chainfish traceabilityperception on consumerinternet data collection
1. IntroductionThe technological development in the fields of food production and marketing has ensuredbetter conditions for the conservation and distribution of foods, which reflects qualitystandards and sensory aspects.
On the other hand, consumers are increasingly demanding quality, practicality, andhealthfulness of foods. Consumers are looking for products that provide pleasure and well-being, besides satiety, and meet their health and nutritional needs.
Technology has helped to produce foods on a large scale; however, the food industry mustmeet the expectations of customers, offering quality, diversity, and healthiness in products.
Therefore, reducing the distance between the extremes of the food production chain, usingconsumer-focused production technology, is an alternative to be considered because itensures food quality and promotes food consumption.
Consumption of fish and fish-derived products is primarily related to health aspectsbecause fish has nutritional qualities that are not found in other sources of animal proteinand/or vegetables.
However, as it has high activity in water and components of high biological value, fish isvery perishable. Fish can also suffer contamination by environmental conditions where it isproduced (rivers, seas, and lakes), in addition to the constant and recurrent improperprocedures in supply management and marketing.
Technological tools can be used to trace and document important information regardingproduction and other processes relevant to the product.
Traceability per se does not improve product quality; however, it allows monitoring andrecording pertinent information on raw material and processes. It enables it to follow thesteps in the production chain and commercialization of food, promoting the recall of theproduct when needed, which facilitates correction of methods and techniques throughout theprocess.
Traceability must be linked to compulsory procedures that assist in the rejection orremoval of products with safety problems.
Similarly, not only does traceability strengthen consumption, but it also acts as asupporting role in this process, once the main barriers to consumption are linked to productquality. Therefore, showing to the consumer the concern to ensure quality enhances the trustrelation with the brand and, consequently, encourages consumption.

In this sense, traceability is understood as part of a process, when used in synergy withother quality tools that ensure food quality and safety, boosting consumption.
Over the past few years, some studies have been published on barriers of fish consumptionin Brazil and in Portugal and traceability acceptance (Table 5.1).

Table 5.1
Fish consumption perception and vision on traceability systems.
Publications Samples
Those WhoDo NotConsume (%)
Reasons Not toConsume Traceability
Similarities anddistinctions offish consumptionin Brazil andPortugalmeasuredthrough anelectronic survey(Macielet al., 2016)
Brazilians:1295
Portuguese:174
Brazilians: 1.8Portuguese: 1.1
Taste/lack ofhabit/price/spines
Willing to paymore for aproduct withguarantee oforigin:
Brazil = 32.2%Portugal = 40.2%Of which, 23.4
and 29.9%,Brazil andPortugal,respectively,would pay upto 10% more
Fish qualityattributes relatedto consumptionin Corumbá, MS(Macielet al., 2015)
105 Brazilians,Mato Grosso
1.9 Price/taste —
Comparison of fishconsumptionamong studentsand its relation toindexes of healthand life quality(Guimarãeset al., 2015)
31 Students; 14- to17-year-oldBrazilians,Tocantins
12.9 Price —
Label designing forminimallyprocessed tilapiaaiming thetraceability ofthe productivechain (Macielet al., 2014b)
162 Potentialconsumers
— — Acceptance by fishpackaging withtraceability codeand acceptance of97% ofrespondents

Publications Samples
Those WhoDo NotConsume (%)
Reasons Not toConsume Traceability
Relationshipbetween theprice of fish andits qualityattributes: astudy within acommunity at theUniversity ofSão Paulo, Brazil(Macielet al., 2013)
1966 Brazilians ofthe universitycommunity
— — Significantassociationbetween pricespaid for the fishand attributesrelated to productquality
Profile ofrespondents of aBrazilianuniversityregarding fishconsumption(Maciel et al.,2012b)
1966 Brazilians ofthe universitycommunity
5.13 Habit/preparation/availability —
Survey on fishconsumptionduringcommemorativefestival FishWeek in a city inSão Paulo state(Macielet al., 2009)
232 People 7 — —
Based on the information presented in Table 5.1, fish consumption in Brazil is clearlyhampered by the lack of habit and fish price, but the former may be a consequence of thelatter.
Consumers also highlight few options available in the market and difficulties in findingfresh quality product. However, despite these difficulties, interest in fish consumption is onthe rise (Maciel et al., 2012a).
Importantly, these studies were carried out mostly in the southeastern region of Brazil,which has increased population demographics, but lower fish consumption, considering theaverage of the country (Maciel et al., 2014a).
In addition, there is a consensus that more than 95% of the participants in the studiesrecognize fish is a food source that promotes health.
Thus, in Brazil, there is a market niche that could be explored with measurements toimprove product quality and, consequently, increase consumption.
A report carried out in 60 countries indicated that 25% of respondents plan to consumemore fish (Nielsen, 2015).
The challenge then is to integrate traceability as an alternative to boost consumption.Thus, in this chapter, the benefits of fish consumption are discussed. Moreover, we list themain obstacles in the production chain, report the traceability concept and its application in

the production chain, and present the research results on consumers’ perception on trackedfish.
2. Fish Consumption: Health BenefitsChronic noncommunicable diseases (NCDs) are an issue worldwide and a threat to humanhealth. Their major modifiable risk factors involve physical inactivity, smoking, alcoholism,and inadequate diet (Schmidt et al., 1961).
According to the World Health Organization, NCDs accounted for 63% of global deathsmainly due to cardiovascular diseases, diabetes, cancer, and chronic respiratory diseases. Thelow intake of fruit and vegetables, along with high consumption of foods rich in saturatedand trans-fats, salt, and sugar, has been reported as the primary cause of a considerable deathrates associated with NCDs (WHO, 2014).
Therefore, a healthy diet not only provides the necessary nutrients to meet the bodydemands, but it can also offer compounds capable of modulating the organic functions andpreventing diseases.
For this reason, the interest in fish in recent years has been highlighted, as its nutritionalvalue and its association with health benefits have been emphasized in populations that adopta fish-based diet.
Fish consumption has been associated with the protective effect against cardiovasculardiseases, mainly due to its composition in polyunsaturated fatty acids, such as omega 3bonds, and nutrients, such as vitamin D. Fish has high-quality protein, vitamin B12,selenium, and iodine, nutrients that may contribute to health to promote positive implicationson the metabolic syndrome (Tørris et al., 2016).
Studies conducted in Croatia, Finland, France, Iceland, Iran, South Korea, and the UnitedStates have shown associations between fish consumption and metabolic syndrome, whichsuggests that fish consumption can prevent or improve metabolism, playing a protective rolein preventing metabolic syndrome (Tørris et al., 2014). These evidences support the currentdietary recommendations for regular fish consumption to prevent cardiovascular disease(Tørris et al., 2014; Zaribaf et al., 2014).
Regular fish consumption was associated with lower risk of metabolic syndrome in astudy involving 12,981 adults in Norway, especially lean fish (Tørris et al., 2016).
Frequent fish consumption was inversely related to the risk of strokes, mainly ischemicstroke, in metaanalysis conducted in a cohort study (He et al., 2004a).
High fish consumption has also been associated with a lower probability of developingdepressive symptoms among adult Chinese (>55 years in age) in Singapore (Wu et al., 2016).
There is a hypothesis, not yet clarified, that fish consumption could be associated toprotection against the development of type II diabetes; however, in a recent metaanalysisstudy, this relationship was not demonstrated; although the cardioprotective effect has beenclarified (Xun and He, 2012).
As shown in a study on metaanalysis, including 13 cohorts where fish consumption, oncea week or more, was inversely related to the risk of coronary heart disease (He et al., 2004b).
There is evidence that consumption of fish rich in fatty acids with omega 3–type bondsprotects against cancer development, mainly breast cancer, according to a systematic review

in 1985–2009 publications about eating habits (Tyrovolas and Panagiotakos, 2010).Another study on metaanalysis with 27 prospective cohort studies assessed fish
consumption and its relation to gastrointestinal cancer. It was observed that fish consumptionmay reduce the total incidence of gastrointestinal cancer (Yu et al., 2014).
Based on its consumption, it is observed that fish constitutes a crucial nutritionalcomponent in several regions worldwide, accounting for 16.7% of the animal protein intakefor the world’s population and with a tendency of expansion, mainly in developing countries(FAO, 2014).
There are countries that depend on fish as a protein source to their populations, such asBangladesh and Indonesia. Moreover, fishing and aquaculture activities represent an incomesource and improvement of life conditions in many regions (Khan et al., 2016).
3. Fish: Production Chain QualityMonitoring parameters for water quality of fisheries or capture is the starting point in thesearch for quality of fish products because these parameters reflect the microbiological andphysical–chemical quality of the environment, influencing fish quality as raw material.
Dissolved oxygen, pH, turbidity, temperature, ammonia salinity, and nitrite, among others,need to be monitored because they interfere in productivity of systems.
At the time of fish trawl or harvest, the methodology used exerts great influence on fishquality affecting its shelf life and quality of its products. If the fish debates trying to breakfree from fishing nets or dies in agony in fishing boats, there is depletion of their glycogenreserves, leading to rigor mortis more quickly and, consequently, to subsequent deterioration(Soares and Gonçalves, 2012).
Some issues, such as the choice for suitable instruments for trawling and their hygienicconditions, as well as the training of workers, who will carry out this function, can be criticalto avoid contamination.
When the fish is obtained from trawls, the vessels must be sanitized frequently and mustbe equipped with coolers and iceboxes or mechanical cooling systems, where the fish mustbe cooled immediately after capture.
The slaughter methods are considered stress factors for animals and can induce an earlyresolution of rigor mortis, changing the sensory characteristics and decreasing the productshelf life. Therefore, the choice for the slaughter method is of utmost importance to ensurefish quality (Ashley, 2007; Scherer et al., 2005).
Sanitary hygienic conditions of the sites and the tools used are considered a bottleneck inslaughter. It is necessary to pay attention to the bleeding practice to avoid cross-contamination and proliferation of microorganisms. It is recommended to use the stunningmethods prior to slaughter to ensure animal welfare and the immediate and permanent use ofthe cold chain shortly after the capture of the animals.
The degree of fish freshness starts to be changed soon after its slaughter, when chemical,biochemical, and enzymatic changes start, many of them caused by the action of endogenousand exogenous microorganisms that will culminate in physical changes.
Physical changes can be measured visually or through instrumentation, once decayadvances, physical changes will aggravate. Examples of such changes can be observed in

muscle rigidity or flaccidity, measured by the rigidity index (Oetterer et al., 2014).Postmortem changes in fish follow a typical and characteristic pattern for each species and
keep direct relation to the water quality of cultivation, nutritional, and sanitary quality of thefeed supplied to animals, choice of system, and production density, as well as the cultivatedspecies, technique, and time of harvest, methods of capture and slaughter, climaticconditions, hygienic conditions, conservation, transport, storage, and handling of the productat all stages of the production chain. All this information may be recorded in the traceabilitytool.
Microbiological tests are also used to assess the freshness degree of fish in the postmortemstage. The microbial assessment allows identifying possible contamination throughout theproduction chain, both caused by spoiling and pathogenic microorganisms.
The cold chain is another critical point of the fish production chain, mainly in tropicalcountries where, in some situations, fresh fish is offered inappropriately at supermarketshelves without enough ice to wrap the fish entirely.
Another inappropriate marketing point is the exhibition of minimally processed products(fillets and slices) along with the whole fish, without any barrier or protective packaging,allowing cross-contamination between products.
It is very common, especially in developing countries, to find the fish being sold at streetmarkets, offered without protection, without refrigeration, or under poor refrigeration.
There is a cultural issue in terms of marketing because in many places consumers have theneed to touch the product to check for its freshness, without any type of cleaning orprotection for the hands.
Often, the fish available for marketing is already at the deterioration stage when there is aformation of compounds that can be identified and quantified through sensory, chemical,biochemical, and microbiological methods (Nunes et al., 2007).
The use of technologies at this stage is related to smart packaging, such as timetemperature integrators, can provide qualitative information to the consumer about fishtemperature from the moment of production to commercialization (Tsironi et al., 2011) andare a useful option for monitoring product quality regarding the cold chain.
In some countries, there are laws that indicate monitoring and prohibition of irregularitiesalready addressed here; however, not always are there enough inspectors to monitor all thesefactors. Moreover, most of the time there is no concern of consumers with respect to thehygiene and quality requirements, being the price paid for the product often the major aspectconsidered at the time of the purchase decision (Maciel et al., 2016).
Similar to other stages, at the stage of fish processing, there are numerous problems andopportunities for contamination of raw materials, which could be minimized with the use ofthe cold chain. Its cost and the lack of supervision, however, may end up discouragingentrepreneurs from investing in systems that are more efficient, even if there is a return interms of the increased shelf life of the product.
Furthermore, many fish processors resent the lack of skilled workers, as well as the lack ofenterprises, that provide equipment of relative efficiency and affordability to automate theprocesses of fish industrialization.

Thus, in some countries, industrialized fish products do not offer practicality andconvenience and end up being offered in short cuts of cold and frozen products (fillets andslices), without using any kind of advanced technology in packaging nor do they offerdifferentiated and elaborated products.
The lack of modernization in the fish industrialization process ends up becoming anotherdifficulty in the sector because the products feature minimum quality, little convenience, andreduced shelf life.
Although fish offers excellent nutritional quality, it is often not the consumer’s firstpurchase option in many countries. This is mainly because of the high price, compared withother proteins of animal origin, along with deficiency in quality control and productstandardization (Maciel et al., 2013, 2016).
To produce quality fish, many factors are involved, especially the intrinsic features of thisraw material. Its pH is close to neutrality and its proper nutritional composition make fish aperishable food, requiring care to obtain good production, proper handling practices, and theapplication of the cold chain from the time of capture/harvest until the arrival to consumers.
The quality of the product is directly connected to the quality provided to fish throughoutits production and marketing chains, involving several physical, sensory, chemical, andmicrobiological attributes. However, the concept of quality is closely linked to the freshnesscondition of the raw material or product shelf life, involving also attributes related to foodsafety and issues associated with the nutritional and sensory aspects, as well as price andproduct availability (Oetterer et al., 2014).
Another obstacle already appointed to fish consumption is the price. Fish quality has adirect impact on market prices and quality assessments play a very important role in definingfish prices (García et al., 2015).
It is clear that quality and consumer satisfaction, considering fish products available in themarket, vary according to the development level of countries (Maciel et al., 2015, 2016).
Consumers still need greater awareness about the importance to demand quality standardsfrom both regulating entities and enterprises to produce and process fish. In this context,traceability is the path to be followed to achieve this aim (Thompson et al., 2005). Only thenwill it be possible to organize the fish production chain to ensure quality of products becausecare must start at cultivation farms, rivers, and seas and continue until the product reachesthe consumer’s table.
4. Traceability: Concept/DefinitionThe word traceability comes from the junction of the verb “track” with the noun “skill.”
According to international agencies, traceability is the ability to trace or track a history,application, or location of an entity by means of recorded information, ISO 8402:1994(FSA, 2002). It is the ability to detect the origin and to follow the track of a food type(CEN, 2002).
This system has been used for some time on a large scale in the automotive industry andmore recently by a few food-processing enterprises.
The implementation of a traceability system does not guarantee quality to the product;however, its database allows identifying a problem, and if necessary, removing a product or

batch of products from the market through a recall.In the pursuit of excellence for processes, food safety, and total quality in production
systems, traceability is a tool that allows knowing the chain and external agents. It works as adatabase, providing reliable data regarding the origin of the raw materials and the processesto which the material has been submitted, ensuring greater quality control for the product.
5. Quality and Traceability Systems in the FishProduction ChainThe implementation of simple routine activities related to good management practices, suchas aeration systems and water renewal of cultivation, periodic cleaning of tanks, regularmonitoring of water quality parameters, and mainly training of the personnel responsible forproduction, would be attitudes to be identified and implemented to prevent problems alongthe fish production chain.
Tools for quality control necessary for the proper functioning of a fish processor, such asgood manufacturing practices (GMP), hazard analysis and critical control points (HACCP),programs of auto control, traceability, total quality control, and, more recently, thecertification of management systems of Food Safety System Certification 22000 (FSSC) orin addition to the ISO series standards—ISO 22000 mainly—have their applicationfacilitated when traceability tools are used throughout the production chain (Oettereret al., 2014).
These programs bring recommendations and guidelines related to the cleaning ofequipment, furniture and fixtures, hygiene and health of handlers, conditions of facilities andbuildings, integrated control of pests and vectors, waste management, production flowcharts,as well as characterization of possible physical, chemical, and/or biological contaminants,strategies for the implementation of preventive, control, and corrective measures, in case offailures (ANVISA, 2002).
Increased fish consumption leads to greater concern with fish safety as food, thesustainability of aquaculture activity, maintenance of fish inventories, and the possibility ofcatching fish in contaminated waters. In addition, consumers demand transparency andaccreditation of the purchased product, which makes traceability a mandatory path (Sterlinget al., 2015).
The use of traceability systems in the fish production chain is a very useful tool, as itrecords the information of the productive process, encompassing all the links of this chain,bringing information about possible problems in the process related to the site of capture orcultivation. The use of processes monitored from the vessels to tanks, as well as cross-information avoids capture in problem areas.
Fish production or capture should not be held in polluted sites. It is recommended theimplementation of efficient and sustainable management systems on farms, as well astraceability systems, to use them also to monitor the levels and types of microorganismspresent in water in addition to measuring physical and chemical parameters of importance.
Traceability allows identifying batches specifically assigned to fishing boats or cultivationtanks, acting in the prevention of illegal fishing (Borit and Olsen, 2012) or identifying

conditions of good management practices.This tool can identify areas of fishing or farming and provide information about the batch
origin to identify whether it comes from unsuitable capture areas, inappropriate tanks forcultivation, or even economic fraud.
The adoption of traceability tools provides conditions for the capture and processing chainof fish to organize its processes. It also provides information that can help the sector to guidedecisions. The identification of production bottlenecks and their effects on product qualitynot only provides answers to consumers, but it also offers a feedback to the production chainabout its links, moving toward more efficient steps.
Traceability systems have been used by the fishing industry to give practical answers tothe industry, relating data stored in the system with various quality parameters of the rawmaterial, such as identifying correlation between numbers of parasites in fillets, andoccurrence of gaping and yield in fillets according to the fishing sites (Galvão et al., 2010).
Another factor to be highlighted is the effect of tools, such as traceability, on themarketing of fish products available, both at wholesale and retail. Worldwide, identificationwith the product and meeting the consumer needs under the most varied perspectives areincreasingly desired (Maciel et al., 2012a). Notably, consumers have been developing newconsumption habits over the last decade. Issues that were not taken into account then, relatedto concepts of healthiness and ethics, are gaining more and more relevance (FAO, 2014).
New technologies have been linked to traceability systems. Besides RFID, which hasalready been used in these systems, the electronic product code information services (EPCIS)technology has been tested on a pilot scale in internal traceability systems with excellentresults (Gunnlaugsson et al., 2011; Thakur et al., 2011).
In Sweden, a pilot study using the EPCIS technology increased sales of codfish from theBaltic Sea due to improvements in the information available to consumers (Thakur et al.,2011).
The growing need to connect the product to its production chain, as well as the provisionof information about the product being purchased, and how, where, and when the fish wascaptured/produced have imposed new demands for the fish production chain and itsregulating entities. Traceability in the fish production chain benefits consumers, as it isfundamental in the process to comply with food safety regulations and fishery control,fighting economic fraud, and meeting current and future expectations of consumers andauthorities (Bailey et al., 2016; Leal et al., 2015).
Companies operating along the supply chain can benefit from the safety provided bytraceability and invest in ecolabels to enhance their brands. Some of the benefits that can beassigned and ensured through traceability tools are reduction of environment destruction,elimination of forced or child labor, improvement of living conditions of the population,reduction of catches with great impact on the environment, socioeconomic development anddiversification, and reduction of carbon emissions (McClenachan et al., 2016).
Although traceability per se does not guarantee product quality, if it is applied carefully(Dabbene et al., 2014; Senneset et al., 2007) with suitable registrations and reports of datafor each batch from production/capture, transport, and processing up to distribution, it can be

a tool of great value, and, along with other quality tools, it can bring numerous advantagesand practical responses to the fish industry (Galvão et al., 2010).
6. Assessment of Fish Consumption RegardingTracked FishPioneer research was held in Brazil via the Internet to evaluate the characteristics of fishconsumption in members of the university community, including questions about tracked fishwith a questionnaire (Maciel et al., 2014b), using as a basis the fictional image of trackedfish (Maciel et al., 2013).
The constructs and indicators related to the questionnaire to evaluate fish consumptionused in this analysis are described in Table 5.2.
Table 5.2
Constructs and indicators used in assessment questionnaire of fishconsumption.
Constructs IndicatorsConsumption How important is fish taste for you?
How important is fish smell for you?
How important is fish color for you?
How important is fish texture/consistency for you?
Quality When you purchase fish, how important is the packaging for you?
When you purchase fish, how important is the product brand for you?
When you purchase fish, how important is the product origin for you?
How important is it for fish to have the stamp of federal inspection for you?
How important is it to have availability of fish at the usual sites of purchase for you?
How important is it that the fish is tracked for you?
Are you satisfied with the quality of fish available in the national market?
Where do you usually purchase fish?
General characteristics When you purchase fish, what is your preference for packages?
Do you know what a tracked product is?
Are you willing to pay more for a product a with guarantee of origin?
Among the results for frequency of fish consumption (Table 5.3), greater frequency ofconsumption occurs once a week (27.11%), followed by 2 or 3 times a month (25.94%)(Table 5.3).

Table 5.3
Frequency of fish consumption per campus.
Campuses
Cities inSãoPauloState
Frequencies
TwiceorMore aWeek
Once aWeek
TwiceorThriceaMonth
Once aMonth Rarely Never Total
1 Piracicaba 37 (7.67) 161(33.40)
139(28.83)
77 (15.97) 53 (10.99) 15 (3.11) 482[24.51]
2 São Paulo 114(11.40)
241(24.10)
253(25.30)
171(17.10)
160(16.00)
61 (6.10) 1000[50.86]
3 São Carlos 4 (6.77) 12 (20.33) 16 (27.11) 16 (27.11) 8 (13.55) 3 (5.08) 59 [3.00]
4 RibeirãoPreto
19 (7.91) 69 (28.75) 56 (23.33) 48 (20.00) 38 (15.83) 10 (4.16) 240[12.20]
5 Pirassununga 7 (8.33) 29 (34.52) 23 (27.38) 14 (16.66) 9 (10.71) 2 (2.38) 84 [4.27]
6 Bauru 4 (17.39) 6 (26.08) 8 (34.78) 2 (8.69) 2 (8.69) 1 (4.34) 23 [1.16]
7 Lorena 1 (1.61) 10 (16.12) 14 (22.58) 12 (19.35) 19 (30.64) 6 (9.67) 62 [3.15]
8 Outros a 1 (6.25) 5 (31.25) 1 (6.25) 4 (25.00) 2 (12.5) 3 (18.75) 16 [0.81]
Total 187 [9.51] 533[27.11]
510[25.94]
344[17.49]
291[14.80]
101 [5.13] 1966 [100]
Values in parentheses represent the percentages in relation to the value of each campus. Values in bracketsrepresent percentages in relation to total value of respondents (n = 1966).a Other research centers located outside the campuses of the university studied.
Among the participants who consume fish twice or more a week (9.5%), most presentnutritional status within the range of normality (60.9%) and indicated to be physically active(74.3%), which is the group composed of women (59.3%) and undergraduate femalestudents (42.7%) from the campuses of São Paulo University (60.9%).
Regarding the others, the most inadequately active and/or sedentary (39.2%) consume fishjust once a month.
The results indicated that consumers that meet recommendations for fish consumption arethose who tend to have behaviors that are more appropriate because they present nutritionalstatus within the range of normality and were classified with higher levels of physicalactivity. The opposite was also found for those who consume fish less frequently becausethey are less active and, consequently, with higher overweight rates.
This behavior can be justified, in part, by the relationship between healthiness and fishconsumption recommended worldwide (Jacobs et al., 2015).
However, the statistical relationship between these variables was not proven, showing thatthere are other factors involved in this relationship that should also be taken into account.
The respondents that consume fish can be considered different and show concerns withtopics related to health and quality of life, although represented by less than 10% of the

participants in this survey.The results showed that the distribution of respondents followed a national trend in which
women are the majority in universities and that they show greater concern with health-related issues.
Comparative tests were conducted using the grouping technique of issues according toconstructs for consumption and quality. For comparison purposes, the results (Table 5.4)refer to the comparisons between the constructs for consumption and quality level, and thecategory groups with a link to the institution. The same premise was considered for theinstitution and the sex of the participants (Table 5.5).
Table 5.4
Comparative test between constructs of fish consumption per category.
Constructs Categories Means (AIQ) Wilcoxon Groups (a = 0.05)Consumption Undergraduates 16 (4) B
KW: 52.5913 Graduates 17 (4) A
P < 0.0001 Employees 17 (3) A
Faculty 17 (4) A
Others 17 (4) A
Quality Undergraduates 8 (18) C
KW: 177.0706 Graduates 8 (20) B
P < 0.0001 Employees 27 (23) A
Faculty 26 (23) A
Others 8 (21) B
Table 5.5
Comparative test between constructs of fish consumption and sex of therespondents.
Constructs Sexes Means (AIQ) Wilcoxon Groups (a = 0.05)Consumption Male 16(4) B
KW: 43.4621 Female 17(4) A
P < 0.0001
General quality Male 8(20) B
KW: 6.6162 Female 8(21) A
P < 0.0101
These results indicate that, in both groups, there are differences between the constructsconsumption and quality.

Family habits and reference groups are determining factors in food consumption. Theresults of this study showed that this influence is statistically significant when comparing theconsumption within the groups at the university.
These results can be justified, in part, by the fact that the construct quality consists ofitems related to purchase. Although many students live far from their families and,consequently, should often go grocery shopping, it seems that the fish has not become part ofthe usual diet; therefore, both undergraduates and graduates do not present the profile of fishbuyers, despite being potential consumers.
Thus, it is important to note that there is no habit of fish consumption among youngpeople. This result is interpreted as a problem given that these young people will constitutethe families in the next generations and that it is in this family nucleus that the main livinghabits will be consolidated, mainly in terms of food consumption (Jacobs et al., 2015;Verbeke et al., 2005).
These results reinforce the idea that the habit is a primary factor for the consumption to beconsolidated in adulthood and that variables, such as culture and reference groups,fundamentally determine the behavior to purchase and consume fish (Verbeke et al., 2015).
In relation to the differences between the sexes, for both constructs consumer and quality,women present statistically significant differences compared to men, with better results. Thisindicates and supports our initial premises in which women show greater concern with healthissues and, consequently, with fish consumption and quality.
The consumer-related attributes that stood out for the group studied (Table 5.6) were thesensory attributes, such as smell, flavor, texture/consistency, color, the stamp of approvalfrom the federal inspection on the package, and the nutritional value and origin of fish, arelinked to the characteristics of product quality.

Table 5.6
Frequency of responses of the items assessed in the Likert scale.
How Important Are TheseAttributes for You?
Scale and Responses (%)
NothingVeryLittle
More orLess
VeryMuch Extremely
Taste 0.48 1.39 9.81 55.92 32.38
Size 6.64 27.82 47.77 16.19 1.55
Smell 0.80 4.12 15.17 36.30 43.59
Color 2.09 6.43 18.23 41.82 31.42
Texture/consistency 0.80 1.71 10.93 49.32 37.21
Price 0.23 3.90 35.10 46.57 14.18
Nutritional value 1.18 8.62 22.57 46.21 21.39
Brand 8.98 25.53 38.65 23.16 3.66
Availability at the usual sites of purchase 0.11 3.54 20.56 57.56 18.20
Stamp of federal inspection 5.08 8.98 16.31 30.14 39.47
Packaging 0.94 8.15 21.74 47.28 21.86
Origin 3.07 8.86 29.31 38.77 19.97
How do you rate your level of knowledgeof fish nutritional value?
5.04 26.32 42.14 20.69 5.79
Verydissatisfied
Dissatisfied Neithersatisfied/nordissatisfied
Satisfied Very satisfied
Are you satisfied with the quality of fishavailable in the national market?
2.09 18.92 46.16 31.95 0.85
Very bad Bad Neither bad norgood
Good Very good
What is your opinion about the initiativeto have tracked fish?
0.21 0.53 26.00 31.63 41.6
In relation to price, 46.57% considered the amount paid as very important. Regarding theplace of consumption, the results indicate that most respondents consume fish in their ownresidence (56.03%); the others, at restaurants (38.98%); and a smaller share in the home ofrelatives and friends (4.98%).
The results for the characterization of consumption also follows the national trend whereconsumption is limited by price or marketing (Maciel et al., 2013). Likewise, price has alsobeen a major limiting factor in other studies for fish consumption in some Brazilian regions(Maciel et al., 2013; Silva et al., 2012).
As for fish conservation, 56.94% of respondents prefer the cold fish and 43.05%, frozen.In relation to fish acquisition, most respondents (54.63%) did not have the habit of buyingfish. The others (45.36%) purchase the product at supermarkets (61.34%), fish market

(11.58%), specialized stores (9.33%), street markets (9.10%), municipal markets (6.73%),and straight from the producer/fisherman (1.89%).
Supermarkets may be preferred because of the choice options, environment, and trust inquality inspection. In addition, supermarkets tend to provide more information about theorigin, hygiene, and sanitation, offering safety to the consumer (Harris et al., 2006). Thiswould make the choice for products easier because it is a fact that there are consumers awareof their own inability to distinguish the quality of fresh fish and prefer to rely on processedproducts that have the quality associated with a brand already enshrined in the market.
In relation to packaging on the choice of fish purchase, 36.4% of respondents prefer topurchase in bulk, 32.03% in plastic containers, and 31.56% on trays. Regarding thepreference for the cut, most respondents (69.32%) prefer steaks without spines, a smallportion gives preference to gutted fish (15.01%), sliced fish (11.31%), or whole fish (4.34%).
Research conducted in China with 286 men and women indicated that most preferred tobuy products in bulk (65%) and fresh (75.2%) rather than packaged or frozen. Mostconsumers (67.5%) believe that the products on the market meet their basic demands.Approximately 58.6% of the respondents buy fish at supermarkets (Wang et al., 2009).
In relation to the results for customer satisfaction, concerning the fish marketed in Brazil,21.01% of the respondents are dissatisfied or very dissatisfied.
The results show that 96.67% of the respondents consider that fish is a food that promoteshealth and 39.08% do not know what a tracked product is.
Among the participants, 41.6% consider the initiative to offer tracked fish extremelyimportant and 31.3%, very important.
Most respondents (82.19%) would be willing to pay more for a product with a guaranteeof origin. Among these, 45.98% would pay up to 10% more than the value of theconventional product, 37.57% would be willing to pay up to 20% more, and 10.17% wouldpay up to 30% more for tracked fish.
Similar research conducted in Brazil and in Portugal has shown that consumers of bothcountries consider that traceability of national fish is very important, as well as informationabout the product. In Brazil, 32.2% of the participants indicated that they would be willing topay more for a product with guarantee of origin and in Portugal, 40.2%. Of these, 23.4 and29.9%, Brazil and Portugal, respectively, would pay up to 10% more (Maciel et al., 2016).
Although food traceability is an option for the control of the production chain, this studyshowed that most respondents indicated having no knowledge of what a tracked product is.Nevertheless, they would be willing to pay more for a product with a guarantee of origin. Itis a controversial result; however, it demonstrates the concern and availability of consumersin purchasing a better quality product. It also reinforces the need to disseminate informationon food in Brazil, with special focus on consumer education so that the information supportsthe choice for the most suitable products and, inevitably, with the strong appeal forhealthfulness because most have knowledge that fish is a food type that promotes health.
A highlighted factor in relation to fish consumption is the current interest of people forhealth, longevity and food safety (Souki et al., 2003). This behavior has increased thedemand for products with special features and fish is a favorable food for this market niche.

In Canada, between 10% and 33% of consumers would be willing to pay more for trackedproduct of animal food (Hobbs, 2003).
In China, where fish is the main food in the diet, consumers are concerned with lack offood safety (Wang, 2003; Zhou, 2004) and 85.7% of the Chinese recognize that the price offish products has been rising due to the increase in production costs within the traceabilitysystem. However, 21% of consumers are not willing to pay more for this program, but 60.1%are willing to pay up to 10% more on tracked fish products, aiming to increase safety ofthose products (Wang et al., 2009).
Due to its perishability, investing in fish safety is a potential market niche due to thedemand for high-quality products and issues concerning food risks, often expressed in recentyears (Wei and Zeng, 2011).
Thus, consumer education should be the focus to deal with all the updates in the field offood safety and, at the same time, act in the role of external oversight of food enterprises. Inaddition, public health agencies should include information on food safety through multiplechannels (Raspor, 2006).
Initiatives like these should be stimulated, as fish consumption is related to health issues,the main attributes that awaken consumer interest (Birgisdottir et al., 2008).
7. ConclusionsThe consumer perception regarding fish shows interest in products with guarantees ofquality, origin certified, and that were obtained from the production chain; however, there isa lack of further information for the large consumer market about how to purchase productswith these characteristics.
The consumer accepts the possibility of purchasing and paying more for tracked fish;however, little is known about these products.
Reducing the knowledge asymmetry about quality and origin of the fish consumed in thecountry will bring potential positive impacts arising from increased consumption, betterhealth for the population, and the development of the production chain.
In addition, living an active life and adopting proper dietary practices can improvepeople’s health. In this sense, fish is an excellent food. The promising participation of fish inhuman diets for the coming decades is attributed to increased aquaculture production, as wellas the awareness of the population regarding fish quality as food.
Increased consumption also depends on improvements in the production chain, aimed atensuring fish quality to reach the consumer, and on incentives in disseminating theimportance of the benefits of fish consumption to promote human health.
Therefore, there is need for further development in the fish production chain to ensureproduct quality and, consequently, increase consumption. Thus, fish traceability, in additionto assisting quality control, may influence consumers, stimulating them favorably toconsume fish, as the fish origin and quality are provided.
References

A.C. Nielsen, Company, 2015. We are what we eat: healthy eating trends around the world. January, pp. 1–27. Availablefrom: http://www.nielsen.com/us/en/insights/reports/2015/we-are-what-we-eat.html.
Agência Nacional de Vigilância Sanitária (ANVISA) Regulamento Técnico sobre Boas Práticas de Fabricação. RDC No.275 de 21 de Outubro de 2002. Brasília: Agência Nacional de Vigilância Sanitária; 2002.
Ashley PJ. Fish welfare: current issues in aquaculture. Appl. Anim. Behav. Sci.. 2007;104(3):199–235.Bailey M, Bush SR, Miller A, Kochen M. The role of traceability in transforming seafood governance in the global South.
Curr. Opin. Environ. Sustain.. 2016;18:25–32.Birgisdottir BE, Kiely M, Martinez JA, Thorsdottir I. Validity of a food frequency questionnaire to assess intake of seafood
in adults in three European countries. Food Control. 2008;19:648–653.Borit M, Olsen P. Evaluation framework for regulatory requirements related to data recording and traceability designed to
prevent illegal, unreported and unregulated fishing. Marine Policy. 2012;36(1):96–102.Dabbene F, Gay P, Tortia C. Traceability issues in food supply chain management: a review. Biosyst. Eng.. 2014;120:65–
80.European Committee for Standardization (CEN), 2002. Traceability of Fishery Products—Specifications of the Information
to be Recorded in Captured Fish Distribution Chains. CEN, Brussels, Belgium. Available from:http://193.156.107.66/ff/po/EUTrace/WGCaptured/WGC_StandardFinal.doc.
Food and Agriculture Organization of the United Nations (FAO), 2014. The State of World Fisheries and Aquaculture:Opportunities and Challenges. FAO, Rome, Italy.
Food Standards Agency (FSA), 2002. Traceability in the food chain: a preliminary study. FSA, Food Chain StrategyDivision, London, United Kingdom. Available from:http://www.food.gov.uk/multimedia/pdfs/traceabilityinthefoodchain.pdf.
Galvão JA, Margeirsson S, Garate C, ViÐarsson JR, Oetterer M. Traceability system in cod fishing. Food Control.2010;21(10):1360–1366.
García MR, Vilas C, Herrera JR, Bernárdez M, Balsa-Canto E, Alonso AA. Quality and shelf-life prediction for retail freshhake (Merluccius merluccius). Int. J. Food Microbiol.. 2015;208:65–74.
Guimarães SC, Quaresma FRP, Sonati J, Zica MM, da Silva Maciel E. Comparação do consumo de pescado em escolares esua relação com indicadores de saúde e qualidade de vida. Rev. Cereus. 2015;7(1):146–159.
Gunnlaugsson VN, Thakur M, Forås E, Ringsberg H, Gran-Larsen Ø, Margeirsson S. EPCIS standard used for improvedtraceability in the redfish value chain. Trondheim: MITIP; 2011.
Harris CA, Knight S, Worosz MR. Shopping for food safety and the public trust: what supply chain stakeholders need toknow about consumer attitudes. Food Saf. Mag.. 2006;June/July:52–59.
He K, Song Y, Daviglus ML, Liu K, Van Horn L, Dyer AR, Goldbourt U, et al. Fish consumption and incidence of stroke: ameta-analysis of cohort studies. Stroke. 2004;35(7):1538–1542.
He K, Song Y, Daviglus ML, Liu K, Van Horn L, Dyer AR, Greenland P. Accumulated evidence on fish consumption andcoronary heart disease mortality: a meta-analysis of cohort studies. Circulation. 2004;109(22):2705–2711.
Hobbs, J.E., 2003. International Agricultural Trade Research Consortium consumer demand for traceability. Working Paper03. Available from: http://purl.umn.edu/14614.
Jacobs S, et al. Consumers’ health risk-benefit perception of seafood and attitude toward the marine environment: insightsfrom five European countries. Environ. Res.. 2015;143(March):11–19.
Khan AQ, Aldosari FO, Hussain SM. Fish consumption behavior and fish farming attitude in Kingdom of Saudi Arabia(KSA). J. Saudi Soc. Agr. Sci.. 2016;(April):3–7: Available from:http://linkinghub.elsevier.com/retrieve/pii/S1658077X16300145.
Leal MC, Pimentel T, Ricardo F, Rosa R, Calado R. Seafood traceability: current needs, available tools, andbiotechnological challenges for origin certification. Trends Biotechnol.. 2015;33(6):331–336.
Maciel ES, Angelini M, Sucasas L, Savay-da-Silva LK, Galvão J, Oetterer M. Inquérito sobre o consumo de pescado emfeira comemorativa da “Semana do Peixe” em cidade do interior de São Paulo. Rev. Ciênc. Tecnol. UNIMEP.2009;31(16):59–68.
Maciel ES, Savay-da-Silva LK, Galvão JA, Oetterer M. Atributos de qualidade do pescado relacionados ao consumo nacidade de Corumbá, MS. Boletim Inst. Pesca. 2015;41(1):199–206.
Maciel ES, Savay-da-Silva L, Galvão JA, Vieira AF, Sonati JG, de Lima LKF, Oetterer M. Availability of fish in Brazilianhouseholds: analysis of data from the 2008–2009 survey of family budgets. Int. J. Appl.. 2014;4(4):102–110.
Maciel EDS, Savay-da-Silva LK, Vasconcelos JS, Sonati JG, Galvão JA, Lima LKFD, Oetterer M. Relationship betweenthe price of fish and its quality attributes: a study within a community at the University of São Paulo, Brazil. Food Sci.

Techol.. 2013;33(3):451–456.Maciel ES, Sonati JG, Lima LKF, Savay-da-Silva LK, Galvão JA, Oetterer M. Similarities and distinctions of fish
consumption in Brazil and Portugal measured through electronic survey. Int. Food Res. J.. 2016;23(1):404–411.Maciel EDS, Vasconcelos JS, Savay-da-Silva LK, Galvão JA, Sonati JG, Christofoletti JC, Oetterer M. Label designing for
minimally processed tilapia aiming the traceability of the productive chain. Bolet. Centro Pesquisa Process. Aliment..2012;30(2):157–168.
Maciel EDS, Vasconcelos JS, Silva LKSD, Sonati JG, Galvão J, Silva DD, Oetterer M. Designing and validating themethodology for the Internet assessment of fish consumption at a university setting. Food Sci. Techol.. 2014;34(2):315–323.
Maciel ES, Vasconcelos JS, Sonati JG, Savay-da-Silva LK, Galvão JA, Oetterer M. Perfil dos voluntários de universidadebrasileira a respeito do consumo de pescado1. Segur. Alim. Nutr.. 2012;19(1):60–70.
McClenachan L, Dissanayake S, Chen X. Fair trade fish: consumer support for broader seafood sustainability. Fish Fish.2016;17(3):825–838.
Nunes ML, Batista I, Cardoso C. Aplicação do Índice de Qualidade (QIM) Na Avaliação Da Frescura Do Pescado. Lisbon,Portugal: IPIMAR; 2007: (51 p.).
Oetterer M, Galvão JA, Savay-da-Silva LK. Qualidade do pescado: sistemas para padronização. In: Galvão JA, Oetterer M,eds. Qualidade e Processamento Do Pescado. Rio de Janeiro: Elsevier; 2014:31–72.
Raspor P. Faces of foods on the world of food systems. Acta Aliment.. 2006;35(3):247–249.Scherer R, Augusti PR, Steffens C, Bochi VC, Hecktheuer LH, Lazzari R, Emanuelli T. Effect of slaughter method on
postmortem changes of grass carp (Ctenopharyngodon idella) stored in ice. J. Food Sci.. 2005;70(5):348–353.Schmidt MI, et al. Chronic non-communicable diseases in Brazil: burden and current challenges. Lancet.
2011;377(9781):1949–1961.Senneset G, Forås E, Fremme KM. Challenges regarding implementation of electronic chain traceability. Br. Food J..
2007;109(10):805–818.Silva IA, Lima MFV, Brandão VM, Dias ICL, Silva MIS, Lacerda LM. Perfil de consumidores do pescado comercializado
em mercados do município de São Luis, Maranhão, Brasil. Cad. Pesq.. 2012;19:59–63.Soares KMDP, Gonçalves AA. Qualidade e segurança do pescado. Rev. Inst. Adolfo Lutz. 2012;71(1):1–10.Souki GQ, Salazar GT, Antonialli LM, PereIRA CA. Atributos que afetam a decisão de compra dos Consumidores de Carne
Bovina. Rev. Admin. UFLA. 2003;5(2):36–51.Sterling B, Gooch M, Dent B, Marenick N, Miller A, Sylvia G. Assessing the value and role of seafood traceability from an
entire value-chain perspective. Compr. Rev. Food Sci. Food Saf.. 2015;14(3):205–268.Thakur M, Sørensen CF, Bjørnson FO, Forås E, Hurburgh CR. Managing food traceability information using EPCIS
framework. J. Food Eng.. 2011;103(4):417–433.Thompson M, Sylvia G, Morrissey MT. Seafood traceability in the United States: current trends, system design, and
potential applications. Comp. Rev. Food Sci. Food Saf.. 2005;4(1):1–7.Tørris C, Molin M, Cvancarova Smastuen M. Fish consumption and its possible preventive role on the development and
prevalence of metabolic syndrome: a systematic review. Diabetol. Metab. Syndr.. 2014;6(1):112.Tørris C, Molin M, Cvancarova MS. Lean fish consumption is associated with lower risk of metabolic syndrome: a
Norwegian cross sectional study. BMC Public Health. 2016;16(1):347: Available from:http://bmcpublichealth.biomedcentral.com/articles/10.1186/s12889-016-3014-0.
Tsironi T, Stamatiou A, Giannoglou M, Velliou E, Taoukis PS. Predictive modelling and selection of time temperatureintegrators for monitoring the shelf life of modified atmosphere packed gilthead seabream fillets. LWT Food Sci.Technol.. 2011;44(4):1156–1163.
Tyrovolas S, Panagiotakos D. The role of Mediterranean type of diet on the development of cancer and cardiovasculardisease, in the elderly: a systematic review. Maturitas. 2010;65:122–130.
Verbeke W, et al. Consumer versus producer expectations and motivations related to “superior” quality meat. J. Food Prod.Market.. 2005;11:27–41.
Verbeke W, et al. “Would you eat cultured meat?”: consumers’ reactions and attitude formation in Belgium. Meat Sci..2015;102(2015):49–58.
Wang Z. The perception of food safety and purchase behavior-casefrom Tianjing. J. China Agr. Econ.. 2003;4:41–48.Wang F, Jian A, Mu W, Fu Z, Zhang X. Consumers’ perception toward quality and safety of fishery products, Beijing,
China. Food Control. 2009;20:918–922.

Wei, X., Zeng, Y., 2011. Consumer’s attitudes and willingness-to-pay for green food in Beijing, 1–10. Available from:http://sard.ruc.edu.cn/zengyinchu/files/taolunwengao/.
World Health Organization (WHO), 2014. Global status report on noncommunicable diseases 2014. World Health, p. 176.Available from: http://www.who.int/nmh/publications/ncd-status-report-2014/en/.
Wu D, Feng L, Gao Q, Li JL, Rajendran KS, Wong JCM, Ng TP. Association between fish intake and depressive symptomsamong community-living older Chinese adults in Singapore: a cross-sectional study. J. Nutr. Health Ag..2016;20(4):404–407.
Xun P, He K. Fish consumption and incidence of diabetes: meta-analysis of data from 438,000 individuals in 12independent prospective cohorts with an average 11-year follow-up. Diabetes Care. 2012;35(4):930–938.
Yu X-F, Zou J, Dong J. Fish consumption and risk of gastrointestinal cancers: a meta-analysis of cohort studies. World J.Gastroenterol.. 2014;20(41):15398–15412: Available from: http://www.ncbi.nlm.nih.gov/pubmed/25386090.
Zaribaf F, et al. Fish consumption is inversely associated with the metabolic syndrome. Eur. J. Clin. Nutr.. 2014;68(4):474–480: Available from: http://www.ncbi.nlm.nih.gov/pubmed/24549028.
Zhou JH. Consumer’s attitude, perception and purchase behavior: case from Jiangsu province. J. China Agr. Econ..2004;11:44–52.
Further ReadingFood and Agriculture Organization of the United Nations (FAO), 2009. The state of world fisheries and aquaculture
(SOFIA) 2008. FAO, Rome, Italy (196 p.).

C H A P T E R 6
High-Pressure Technologies inDairy Processing: QualityMaintenance and Increase inConsumptionBruno R. de Castro Leite, Jr.*
Miguel M. de Oliveira*,**
Marcelo Cristianini* * University of Campinas (UNICAMP), Campinas, São Paulo, Brazil ** Federal Center of Technological Education Celso Suckow da Fonseca (CEFET-RJ), Valença, Brazil
AbstractEmerging technologies, such as high isostatic pressure and dynamic high pressure, have beenwidely studied in food processing. These technologies can be applied to several food productsand ingredients in order to improve quality and increase the acceptance of processed foods. Themain advantage is the replacement of thermal process by high-pressure process, aimed at theinactivation of microorganisms at room temperature. With this technology it is possible toreplace the sensory changes caused by high temperature–produced foods with the characteristicsof close-to-fresh foods, besides changing the structure and constituents. These changes havebeen studied in various foods, including milk and dairy products. The results show thatdepending on the conditions used with each technology, both processes can improve theconsistency and increase water retention and emulsion stability in dairy products. The purposeof this chapter is to compare the evolution of these technologies in milk processing and discusstheir application in improving the quality and acceptance of these products.
Keywords

casein micelledynamic high pressurehigh isostatic pressurehigh-pressure homogenizationhigh-pressure processingmilk productswhey protein
1. IntroductionCurrently, two emerging technologies are used for food processing usinghigh pressure: high isostatic pressure (HIP) (also called high-pressureprocessing) and dynamic high pressure (DHP) (also called high-pressurehomogenization). Although both use high-pressure conditions, theprinciples are different, causing different effects on milk constituents. Thedifferentiation of these two technological processes is often misunderstood.This chapter discusses the differences between HIP and DHP on milkconstituents, as well as the effects of these changes on the acceptance ofdairy products, providing encouragement for research and partnerships withresearchers from related areas. Table 6.1 shows the main differences inprocess conditions of high-pressure technologies.

Table 6.1
Comparison between high isostatic pressure (HIP) and dynamichigh pressure (DHP).
Parameter HIP DHPType of food Liquid/semisolid/solid Liquid
Operation flow Batch/semicontinuous Continuous
Physical forces Compression and decompression Compression,cavitation,turbulence, andimpact
Pressure range Up to 1000 MPa Up to 350 MPa
Residence timeunderpressure
Unlimited (controlled by the operator, depending onthe goal)
Very fast (fewseconds—variable notcontrolled)
Processingtemperature
Freezing, low or mild temperature Low or mildtemperature (notfrozen)
Heating duringpressurization
3–10°C per 100 MPa (adiabatic heating) 15–25°C per100 MPa (energyconservation)
Capacity Chambers up to 525 L a ; production up to 3.000 kg/h Up to 5.000 L/h at150 MPa b
Filling Product packaged in flexible packaging beforeprocessing (most common) or product withoutpackaging (less common)
Product packed afterprocessing
DHP, Dynamic high pressure; HIP, high isostatic pressure. Trujillo et al. (2002), Hayes et al.(2005), Diels and Michiels (2006), Huppertz et al. (2006), Dumay et al. (2013).a Information extracted from Hiperbaric: high pressure processing.b GEA Process Engineering Ltd.
The most common characteristic of these processes is the ability toprocess food at low temperatures. In this context, these technologies areused in place of or together with thermal processing aiming microbiologicalsafety with minor damage to the sensory characteristics of the food,especially color and flavor, as well as decreasing nutrient losses and

preserving bioactive compounds (Evert-Arriagada et al., 2013, 2014).Thus, these technologies have the potential to be exploited, enabling thedevelopment of new products.
Although HIP has been widely applied in vegetable and meat processing,its use in the dairy industry is still restricted. In contrast, DHP is often usedin the pharmaceutical and cosmetics industries, with a smaller application inthe food industry, despite the promising results in research and pilot plants.An important reason for the delay to implement these technologies in theindustry, especially to replace pasteurization, is the low processingequipment capacity. However, there is an increased demand in thedevelopment of new equipment with higher production capacity, leading toindustrial application of high-pressure technologies.
2. High Isostatic PressureThe HIP, also known as high hydrostatic pressure or high-pressureprocessing, is an emerging process for food preservation, keeping the heat-sensitive compounds (Rendueles et al., 2011). However, this process canchange food constituents, including milk (Trujillo et al., 2002), allowing thedevelopment of new products/ingredients.
2.1. Principle and OperationThe HIP process has pressure, temperature, and holding time as processingvariables. The choice of these variables is a function of the desired goal foreach product. Usually, HIP is implemented by subjecting the food (liquid orsolid) sealed in flexible packages to a pressure up to 1000 MPa (10,000 bar)for a specific time under freezing or extremely high temperatures.
The process promotes a series of changes in cell membranes andenzymatic mechanisms of microorganisms (Rendueles et al., 2011).Concerning the food constituents, HIP can break noncovalent bonds, suchas ionic bonds and hydrophobic interactions, while covalent bonds are notaffected. Thus, although large biomolecules, such as proteins andpolysaccharides, can be affected by changes in their structures, smallmolecules (functional compounds and vitamins, and flavor and color

components) are not affected by HIP, keeping unchanged after processing(Chakraborty et al., 2014).
Moreover, the pressurization process, following the principle of LeChatelier, induces a reduction in molecular volume (Tomasula et al., 2014),accelerating exponentially the occurrence of pressure-favored reactions.Thus, the reaction rates catalyzed by proteolytic enzymes, such asproteolysis, can be accelerated by HIP (Delgado et al., 2012).
Fig. 6.1 illustrates the HIP process. During the indirect pressurization bya low-compressibility fluid (e.g., water or propylene in processes underfreezing temperatures), food instantly receives the same intensity ofpressure, regardless of the size and geometry. Thus, there is a pressuregradient, that is, there is no lower heating point or cold spot, as in the caseof thermal processes. In addition, pressurization is accompanied byadiabatic compression heating. The adiabatic heating rate is specific to eachchemical compound (e.g., foods with high water content increased 3–5°Cper 100 MPa, while foods with a high fat content increased 6–10°C per100 MPa), being dependent on pressure and temperature (Patazcaet al., 2007). In addition, the adiabatic heating is completely reversed uponpressure release.

FIGURE 6.1 Scheme of Operation for the High IsostaticPressure Device.

3. Dynamic High PressureThe DHP or high-pressure homogenization, also called ultrahigh-pressurehomogenization, is a nonthermal physical process introduced in foodprocessing in the 1980s to improve the efficiency of homogenization ofdairy emulsions (Diels and Michiels, 2006). This technology has a similaroperation principle of the conventional homogenizers, but using pressuresin the order of 10–15 times higher than those normally applied (up to350 MPa) (Diels and Michiels, 2006). In addition, several authors havefound that the process is capable of promoting the inactivation ofmicroorganisms, and changing food constituents (Augusto et al., 2012;Baier et al., 2015; Bravo et al., 2015; Dumay et al., 2013; Franchiet al., 2011a,b). Despite that this technology has been widely used inchemical, pharmaceutical, and biochemical industries, it is rarely appliedthe food industry, probably due to the low production flow. However, theindustrial interest has led to the development of new equipment with highercapacities, allowing the industrial application of this technology.
3.1. Principle and OperationThis process is described only for the application in fluid foods. In theapparatus, fluid is forced to pass through a homogenizing valve at highpressures. The passage through the narrow valve aperture (in the order ofmicrometers) and the sudden decompression of fluid generate an increase inboth speed (between 150 and 300 ms−1; Dumay et al., 2013) andtemperature (about 15 at 25°C per 100 MPa; Diels and Michiels, 2006),caused by heavy friction in the region of the homogenization valve, whichis dependent on the food matrix, total solids concentration, and other factors(Dumay et al., 2013; Hayes and Kelly, 2003a). The operating pressure iscontrolled by the width of the homogenization valve that restricts theproduct’s flow (Diels and Michiels, 2006; Pinho et al., 2011). Fig. 6.2shows a schematic illustration of the DHP equipment.

FIGURE 6.2 Operating Diagram for the Dynamic High PressureApparatus.
4. Effect HIP and DHP on Milk ConstituentsThe effects of HIP and DHP had a primary focus on the inactivation ofmicroorganisms (Dumay et al., 2013; Franchi et al., 2011b; Poliseli-Scopelet al., 2014; Silva, 2015; Tribst et al., 2008). However, several authors havereported that high pressure also affects milk constituents (Baieret al., 2015; Bravo et al., 2015; Dumay et al., 2013; Rodríguez-Alcaláet al., 2015; Sørensen et al., 2014; 2015; Zamora et al., 2012). Strategically,these changes in milk constituents help to improve the sensory andtechnological characteristics of dairy products.
Changes in milk constituents are distinct due to the different effects ofboth technologies. Thus, each technology is used according to the productof interest. These differences are highlighted in Table 6.2.

Table 6.2
Main changes in milk constituents by HIP and DHP.
HIP DHPFat No changes in fat globule in bovine milk
(Huppertz et al., 2003); increased numberof small globules in sheep milk (Gervillaet al., 2001)
Reduction of size of fat globules(Ciron et al., 2010; Oliveira et al., 2014)
Increased creaming (<250 MPa favors theinteraction of lipoproteins; Huppertzet al., 2003) or reduced creaming(>400 MPa, inactivates agglutinin(Huppertz et al., 2003)
Increased lipolysis in raw milk(Datta et al., 2005; Pereda et al., 2008a; Serra et al., 2008a)
No formation of free fatty acids in sheep milk(Gervilla et al. 2001)
Better emulsification and stability(Hayes and Kelly, 2003b)
No emulsifying effect (Huppertz et al., 2003) No changes in the structure of thetriglyceride (Rodríguez-Alcaláet al., 2009)
Protein(casein)
Fragmentation of the micelle (50% reduction;pressure >400 MPa; Huppertzet al., 2006; López-Fandiño, 2006)
Fragmentation of the micelle(∼30% reduction; Roach andHarte, 2008)
Solubilization of CCP (Huppertz et al., 2006;Huppertz and De Kruif, 2006)
Increasing the size of the micelle∼45% (over 300 MPa; Roachand Harte, 2008)
Reduction of hydrophobic interactions(Huppertz et al., 2006)
Solubilization of CCP (Zamoraet al., 2007)
Solubilization of casein fractions (in order: β-casein>κ-casein>αs1-casein>αs2-casein;López-Fandiño et al., 1998)
Reduction of hydrophobicinteractions (Zamoraet al., 2007)
Wheyprotein
Denaturation of β-lactoglobulin (β-Lg) at100 MPa and α-lactalbumin (α-La) at400 MPa (Huppertz et al., 2004c)
No denaturation of β-Lg (littleformation of disulfide bonds;Sørensen et al., 2014)
Immunoglobulins (IgG, IgM, and IgA) moreresistant to pressure than the thermalprocess (Contador et al., 2013; Sousa et al., 2014)
α-Lg resistant to pressure (Sørensenet al., 2014)
Reduction of protein size(>200 MPa; Bouaouinaet al., 2006)

HIP DHPSensitivity to denaturation: Lactoferrin<β-
Lg<immunoglobulin<BSA<α-La (Patelet al., 2006)
Increase in solubility of wheyproteins (Dissanayake andVasilejvic, 2009)
Enzymes Higher resistance of alkaline phosphatase(800 MPa inactivation for 8 min;Rademacher et al., 1998)
Alkaline phosphatase: activationfrom 100 to 150 MPa andinactivation above 175 MPa(Picart et al., 2006)
Plasmin resistant at 400 MPa/30 min at 25°C.87% inactivation of plasmin at400 MPa/15 min at 60°C; Garía-Riscoet al., 2000; Huppertz et al., 2004b)
Plasmin resistant up to 200 MPa(Iucci et al., 2008)
Lactoperoxidase very stable (50% reductionafter 800 MPa/4 h at 60°C; Rademacheret al., 1998)
Lactoperoxidase increased activityat 75 MPa (Vannini et al., 2004)
Lysozyme very resistant (Viazis et al., 2007) Lysozyme activity increased at75 MPa (Vannini et al., 2004)
Lipase resistance up to 400 MPa at 3°C(Pandey and Ramaswamy, 2004)
Lipase activated at 200 MPa at<58°C of outlet temperature orinactivated at 200 MPa at outlettemperature >71°C (Dattaet al., 2005)
Minerals Solubilization of colloidal calcium phosphate(63% at 350 MPa; Kielczewskaet al., 2009)
Solubilization of colloidal calciumphosphate (8%–30% from 150to 300 MPa; Serra et al., 2008b)
CCP, Colloidal calcium phosphate; DHP, dynamic high pressure; HIP, high isostaticpressure.
4.1. Fat4.1.1. Changes in milk fat by HIPHIP does not change the bovine milk fat globule size (100–600 MPa for upto 60 min at 20°C) (Huppertz et al., 2003), however, Gervilla et al. (2001)found a greater number of smaller particles in sheep milk after processes at200 or 300 MPa at 25 or 50°C, which may be related to the methodology,process conditions, or type of milk (Huppertz et al., 2003). In addition, noformation of free fatty acids was observed in sheep milk (Gervillaet al., 2001), which is interesting to prevent off-flavor by lipolytic enzymes

(Trujillo et al., 2002). However, creaming of fat globules can increase atpressures lower than 250 MPa or decrease at pressures higher than 400 MPa(Huppertz et al., 2003). Similar results were observed in sheep milk(reduction in creaming in processes at 500 MPa at 25 and 50°C; Gervillaet al., 2001). The increase in creaming can be due to interactions betweenthe fat globules and milk proteins (Huppertz et al., 2003), while lowercreaming is probably due to inactivation of agglutinins (Huppertzet al., 2003) or an increase in the number of smaller particles (Gervillaet al., 2001). Thus, it appears that the HIP processing under optimizedconditions can be used for reducing both creaming for processing of milkand milk beverages (Huppertz et al., 2003), or increasing creaming,facilitating cream separation prior to butter manufacturing (Trujilloet al., 2002).
4.1.2. Changes in milk fat by DHPThe effect of homogenization on milk fat has been extensively studied,mainly due to its wide application in dairy products. The DHP enhancesdispersion and reduces the size of fat globules. The temperature of the fatmatrix influences the reduction of globules, because the process is moreeffective when all fat is in liquid phase, with no formation of crystals attemperatures >40°C (Zamora et al., 2012).
Although the reduction of fat globules is a function of the level ofpressure applied in the DHP process, larger reductions than those obtainedby the conventional homogenization can be achieved using pressuresbetween 50 and 300 MPa (Sandra and Dalgleish, 2005). Thus, reduction insize of the fat globules is more intense with increasing pressure (Hayes andKelly, 2003b).
However, at homogenization pressures higher than 300 MPa, an oppositeeffect is observed, because greater reduction of fat globules modifies theirelectrical charge and enhances coalescence (Serra et al., 2007; Thiebaud et al., 2003). Coalescence is also favored by the absence of casein to adsorbnew small globules. This phenomenon can be minimized byhomogenization in two stages (Hayes and Kelly, 2003b) or the addition ofemulsifiers (Thiebaud et al., 2003).

The characterization of fat composition of bovine, goat, and sheep milkdemonstrated that homogenization up to 350 MPa did not alter the fattyacid profile of the samples or isomers of conjugated linoleic acids(Rodríguez-Alcalá et al., 2009), indicating that, despite the homogenization,was able to break down the fat globules, the process does not alter thestructure of triglycerides.
When raw milk is subjected to DHP or conventional homogenization, therupture of milk fat globule membrane increases the performance of nativemilk lipase, accelerating oxidation processes (Pereda et al., 2008a; Serra et al., 2008a). However, the induction of lipolysis in raw milk by the DHPcan be prevented by using temperature conditions sufficient to inactivatelipase (inactivated at 200 MPa/40°C or 300 MPa/30°C; Serra et al., 2008a).
4.2. Protein4.2.1. Changes in milk protein by HIPHIP process can cause changes in the milk proteins. Depending on theprocessing conditions, casein micelles can be blown away, not affected oraggregated, while whey proteins can also be denatured or not affected.These can alter the functional properties of proteins, improving the sensorycharacteristics of milk and milk products processed by HIP.
4.2.1.1. CaseinIn general, the processes carried out between 100 and 200 MPa for 30 minat 20°C promote little or no change in the casein micelle, while an increasein the average size of the micelles is observed (∼25%) in processes carriedout at ∼250 MPa for times greater than 15 min, due to casein aggregation.In processes conducted above 400 MPa, a reduction in the average size ofup to 50% is observed, regardless of time and temperature (Bravoet al., 2015; López-Fandiño, 2006). This phenomenon occurs due tobreakage of the hydrophobic interactions and partial solubilization ofcolloidal calcium phosphate (CCP), leading to solubilization of caseinfractions (Huppertz et al., 2006; Huppertz and De Kruif, 2006). However,fragmentation of casein can be reversed after 24 h or after heating (80–85°C) (Harte et al., 2003; Huppertz et al., 2004e), but the presence of

denatured β-Lg (β-Lg-κ-CN interaction) prevents casein aggregation(Johnston et al., 2002).
In structural terms, HIP can promote drastic changes in quaternary (atpressures higher than 150 MPa) and tertiary structures (at pressures higherthan 200 MPa) of the globular protein, despite providing a slight or noeffect on the secondary structure, due to the stability of hydrogen bonds(López-Fandiño, 2006). Thus, depending on the composition andconformation of the different caseins, the order of solubilization wasdetermined in HIP procedures above 400 MPa, as follows: β-casein>κ-casein>αs1-casein>αs2-casein (López-Fandiño et al., 1998). Although theorder has been due to the amount of serine phosphate residues, it may alsobe related to its hydrophobicity.
4.2.1.2. Whey proteinsWhey proteins can undergo reversible or irreversible denaturation,unfolding with their molecular structures under specific pressure conditions.The major whey proteins, β-lactoglobulin (β-Lg) and α-lactalbumin (α-La)present different resistances to pressure. Irreversible denaturation of β-Lg(by formation of the β-Lg-κ-casein complex by disulfide bonds) begins at100 MPa, while denaturation of α-La starts at pressures higher than400 MPa (Huppertz et al., 2004c). The intensity of denaturation is directlyrelated to increased pressure and temperature, and a reaction time is neededduring pressurization for irreversible denaturation (Bravo et al., 2015).Furthermore, the highest amount of intramolecular disulfide bonds and theabsence of free sulfhydryl groups, confer greater pressure resistance to α-La(López-Fandiño et al., 1996).
Thus, the sensitivity of whey proteins to denaturation by pressure followsthe order: lactoferrin>β-Lg>immunoglobulin>BSA>α-La (Patelet al., 2006). Immunoglobulins (IgG, IgM, and IgA) are bioactivecompounds that are very heat-sensitive, but pressure-resistant (400 MPa for6 min), while IgG is able to support up to 600 MPa for 3 min (Contador et al., 2013; Sousa et al., 2014).
4.2.2. Changes in milk proteins by DHP

Several authors have studied the effect of DHP on different types ofproteins, and found that the process was able to change the conformationand functionality of some proteins (Dong et al., 2011; Luo et al., 2010;Yuan et al., 2012), but without changing other proteins (Bouaouinaet al., 2006). The different effects are related to the type of protein andprocessing conditions.
The DHP is capable of providing enough energy to alter the tertiary andquaternary structure of most globular proteins (Luo et al., 2010). Thisphenomenon can cause disruption of protein, reducing the molecular weightand, consequently, increasing the area of exposure, with higher reducingpower, and elimination of hydroxyl radicals, which are the most activepotential groups (Dong et al., 2011). In milk, the DHP promotes differenteffects on caseins and whey proteins with consequent changes in thetechnological functionalities, aimed at increasing the acceptance of variousdairy products.
4.2.2.1. CaseinOne of the main effects observed in casein subjected to DHP is the changein micelle size. When pressures up to 250 MPa are used, a reduction of∼30% in the micelle size is observed (Hayes and Kelly, 2003a; Roach andHarte, 2008), followed by solubilization of CCP, and reduction ofhydrophobic interactions (Zamora et al., 2007). Sandra and Dalgleish(2005) studied reconstituted skimmed milk powder subjected to pressuresup to 186 MPa up to six runs, and found that the size of the casein micelledecreased with increasing pressure and increasing the number of passages.On the other hand, a slight increase in the average size of casein wasobserved after DHP at 300 or 350 MPa (Roach and Harte, 2008). Theincrease in micelle size is associated with denaturation of β-Lg and/oraggregation of casein micelles. Aggregation can occur due to removal of κ-casein hairs, reducing the electrostatic repulsion and favoring the formationof casein clusters (Roach and Harte, 2008).
4.2.2.2. Whey proteinsSome authors have found no denaturation of whey protein processed byDHP (Dissanayake and Vasilejvic, 2009), while others reported some

denaturation (Datta et al., 2005; Hayes et al., 2005). The apparentdiscrepancy between the results may be due to the levels of pressuresapplied and inlet temperatures used.
The most interesting and potential effect of DHP on whey protein isrelated to the changes in its functional properties. Even without proteindenaturation, significant changes in functionality are observed, such asincreased solubility and improved thermal stability (Dissanayake andVasilejvic, 2009). In addition, the increased exposure of hydrophobicgroups on the surface of the molecules by DHP can favor overrun and foamstability (Dissanayake and Vasilejvic, 2009).
4.3. EnzymesThe high-pressure technologies have the ability to activate, inactivate, ornot change the activity of the enzymes present in milk. This is interestingfrom a technological point of view, as these processes can activate orinactivate proteolytic and lipolytic enzymes, thus controlling themanufacturing process of dairy products, including ripened cheeses.However, these results depend on the technology used and the processconditions applied. These differences are discussed in the next sections.
4.3.1. Changes in enzymes by HIPSome studies have shown that the HIP process is capable of promotingenzyme activation (Leite Júnior et al., 2016a) or stabilization(Eisenmenger and Reyes-De-Corcuera, 2009), by applying low pressure (upto 400 MPa), and moderate temperatures. For each enzyme, there is apressure limit to be applied, because a loss of activity is observed from thislimit (Leite Júnior et al., 2016b) due to denaturation (Eisenmenger andReyes-De-Corcuera, 2009).
In general, milk enzymes are more resistant to the HIP process whencompared with the thermal process, such as high stability of lactoperoxidase(maintaining 50% of its activity after processes at 800 MPa for 4 h at 25 to60°C; Rademacher et al., 1998) and lysozyme (400 MPa for 30 min; Viaziset al., 2007). These results are interesting for production of dairy productsprocessed by HIP due to maintenance of the antimicrobial activity of these

heat-sensitive enzymes. However, the individual effect on each enzyme isvariable, for example, alkaline phosphatase is very pressure resistant(inactivation at 800 MPa for 8 min; Rademacher et al., 1998), while acidphosphatase is easily inactivated (inactivated at pressures higher than200 MPa; Balci et al., 2002).
Lipases can be used in cheese ripening when lipolysis is desirable. In thissense, milk subjected to 350 and 400 MPa up to 100 min presented anincrease up to 140% in the activity of these enzymes (Pandey andRamaswamy, 2004). On the other hand, plasmin can have its activityreduced to 75% or 87% in milk and milk derivatives subjected to600 MPa/30 min/20°C (Huppertz et al., 2004b) or 400 MPa/15 min/60°C(Garía-Risco et al., 2000), respectively.
4.3.2. Changes in enzymes by DHPStudies have shown that DHP can affect the activity and stability ofenzymes and other macromolecules. Most of DHP application studies onenzymes were performed in order to inactivate undesirable enzymes inprocessed foods (Calligaris et al., 2012; Velázquez-Estrada et al., 2012).Some studies have also evaluated the effect of DHP on enzymes withantimicrobial function, such as lysozyme (Tribst et al., 2008),lactoperoxidase (Iucci et al., 2007; Vannini et al., 2004) and lactoferrin(Iucci et al., 2007). The results showed increased antimicrobial activity oflysozyme and lactoperoxidase at 75 MPa (Vannini et al., 2004) or 100 MPa(Iucci et al., 2007).
Other studies have evaluated the activity of native enzymes, such asplasmin, lipase, and alkaline phosphatase (Datta et al., 2005; Hayes et al., 2005; Iucci et al., 2008; Lanciotti et al., 2004; Picart et al., 2006;Vannini et al., 2008). Concerning plasmin, no reduction in activity wasobserved in the processes carried out up to 200 MPa (Iucci et al., 2008). Forlipase, an increase of 140% was observed at 200 MPa and inlet temperatureof 10°C, with inactivation at 200 MPa in outlet temperature higher than71°C (Datta et al., 2005). For alkaline phosphatase, DHP processes usinginlet temperature of 24°C were able to activate the enzyme after processingat 100 or 150 MPa, with no changes at 175 MPa, and 94% inactivation at300 MPa (Picart et al., 2006). At 200 MPa, ranging the inlet temperature

from 10 to 50°C, no reduction of enzyme activity was observed from 10 to15°C, with enzyme inactivation at temperatures lower than 45°C; however,processes using inlet temperatures higher than 45°C resulted in theinactivation of this enzyme (Datta et al., 2005), and the outlet temperature(>75°C) was the determining factor for inactivation (Datta et al., 2005).
In addition, some authors evaluated cheeses made from milk processedby DHP at 100 MPa and reported an increase in activity of proteolytic andlipolytic enzymes present in milk or produced by microorganisms (Hayesand Kelly, 2003b; Lanciotti et al., 2004; Pinho et al., 2011; Vannini et al., 2008), thus accelerating cheese ripening by improving flavor, texture(Vannini et al., 2008), color, and aroma (Lanciotti et al., 2006).
4.4. Minerals4.4.1. Changes in minerals by HIP and DHPThe greatest effect of HIP on milk minerals is the solubilization of CCP(López-Fandiño, 2006). According to Kielczewska et al. (2009), bothcalcium and phosphorus significantly increase its solubility at 150–350 MPa (an increase of 42% and 63%, respectively). In contrast, the DHPalso solubilized calcium and phosphorus due to fragmentation of caseinmicelles (Serra et al., 2008b), although CCP solubilization is less intensethan that observed in the HIP process. According to Zamora et al. (2007), amaximum solubilization of 8% of calcium was observed at 130 MPa, whileSerra et al. (2008b) found maximum solubilization of ∼30% at 300 MPa.However, more studies under similar conditions are required.
5. Industrial ApplicationsDairy products processed by HIP and DHP have great advantages whencompared with conventional processes. Table 6.3 highlights the majorchanges in the dairy products that contribute to improving the marketing ofthese products.

Table 6.3
Main changes and improvements in the quality of milk and milkproducts promoted by HIP and DHP.
Product HIP DHPMilk Can replace pasteurization and
sterilization processes (Vazquez-Landaverde et al., 2006)
Can replace pasteurization processes(Pedras et al., 2012) or used incombination with thermal processfor sterilization (Amador Espejoet al., 2014a)
Skimmed milk appears semi transparentdue to casein fragmentation(>400 MPa; Devi et al., 2015)
No changes in milk appearance(Hernández and Harte, 2008)
Absence of undesirable volatilecompounds generated in the thermalprocess (Trujillo et al., 2002)
Absence of undesirable volatilecompounds generated in thethermal process (Amador-Espejoet al., 2014b)
No significant reduction of vitamins,amino acids, simple sugars andflavor compounds (Trujilloet al., 2002)
High stability of the fat emulsion,preventing phase separation(Zamora et al., 2012)
Processed milkfor cheesemanufacture
Moderate pressures (<300 MPa)accelerates coagulation (caseinfragmentation; López-Fandiñoet al., 1996; Ohmiya et al., 2014)
Acceleration or no effects oncoagulation (with no denaturationof β-Lg; Hayes and Kelly, 2003b;Sandra and Dalgleish, 2007;Zamora et al., 2007)
Higher pressures (>400 MPa) increasecoagulation time and cheese yield(better retention capacity due todenaturation of β-Lg; Huppertz et al., 2004a,c, 2005)
Increase in lipolysis during ripening(200 MPa, <58°C) or no effects(200 MPa, >71°C; Datta et al., 2005; Juan et al., 2015)
Fresh cheese is more soft, less brittleand more rigid (Molina et al., 2000)
Can accelerate cheese ripening (Juanet al., 2016; Lanciotti et al., 2004; Vannini et al., 2008)
Cheesemanufacture
Reduction of contamination andextension of shelf life (>400 MPa;Evert-Arriagadaet al., 2014; O’Reilly et al., 2000)
It cannot be used in cheese (onlyfluids)

Product HIP DHPAccelerating or delaying the ripening
process depending on the conditionsand microbial cultures (Costabel et al., 2016; Delgado et al., 2012)
Fresh cheese more compact and elastic(Sandra et al., 2004)
Yogurt Increased consistency (Harteet al., 2002), mainly in set yogurt
Increased consistency, mainly instirred yogurt (Serra et al., 2007)
Reduction of spoilage microorganisms(Penna et al., 2007; Shah et al., 2008)
Reduction of post acidification(Patrignani et al., 2007; Serra et al., 2009a)
Increased water retention capacity Increased water retention capacity(Oliveira et al., 2014)Extension of shelf life (Penna et al.,
2007; Shah et al., 2008)
Ice cream Improved foaming stability of wheyprotein (Liu et al., 2005)
Improved foaming capacity of wheyprotein (Bouaouina et al., 2006;Dissanayake and Vasilejvic, 2009)
Better interaction with aromas (Kühn et al., 2006; Liu et al., 2005)
Enables to produce low-fat icecreams with texture similar tofull-fat ice creams (Innocenteet al., 2009)Smooth texture (controlling small
crystals formation; Eberhard et al., 1999; Huppertz et al., 2011)
Butter Extension of shelf life (Dumayet al., 1996)
Improving aggregation of fat andconsistency (Dumay et al., 1996)
DHP, Dynamic high pressure; HIP, high isostatic pressure.
Various studies and patents have shown potential applications of HIP inthe production of dairy products, including clarification and stabilization ofprotein gels; lower proteolysis in fresh cheeses to maintain the functionaland sensory properties; extension of shelf life of fresh cheeses; increasedresistance of probiotic cultures; maintenance of thermosensitive bioactivecompounds (such as lactoferrin and immunoglobulins); acceleratedproteolysis in cheese or inhibition of proteolysis in aged cheeses (Bravoet al., 2015; Calzada et al., 2014a,b; Carroll et al., 2004, 2008; Costabel

et al., 2016; Evert-Arriagada et al., 2013, 2014; López-Fandiño, 2006;Trujillo et al., 2002; Voigt et al., 2011; Yang et al., 2014).
Concerning the DHP, despite its low pressure capacity for equipmentwith high flow rates (pharmaceutical industry as main commercial focus) itpresents as main advantages: emulsion stability, extension of shelf life andmaintenance of sensory characteristics in milk; increased yield, improvedflavor and texture, and acceleration of cheese ripening; increasedconsistency in yogurt made from DHP-processed milk; extraction ofintracellular enzymes and development of high added value products (Cironet al., 2011; Datta et al., 2005; Hayes and Kelly, 2003b; Hernández andHarte, 2008; Juan et al., 2015; 2016; Lanciotti et al., 2006; Oliveira et al., 2014; Pedras et al., 2012; Pereda et al., 2008b; 2009; Vannini et al., 2004; 2008; Zamora et al., 2007; 2011). Thus, the reduction ofequipment costs with increased production capacity and specific knowledgefor each product can lead to improvements of these technologies in dairyindustries, so that dairy products processed by DHP will be placed on themarket in the coming years. The advantages of high-pressure processing insome dairy products are detailed in the next sections.
5.1. Milk5.1.1. Effect of HIP on milk for direct consumptionThe HIP process can be used as a preservation method, reducing themicrobial load of milk with the possibility of processing under lowtemperatures, with less production of volatile compounds, which negativelyinterfere with milk flavor, as observed in conventional thermal processes(Garrido et al., 2015; Vazquez-Landaverde et al., 2006). Furthermore, nosignificant reduction of vitamins, amino acids, fatty acids, simple sugars,and flavor compounds are observed (Martínez-Monteagudo andSaldaña, 2014; Trujillo et al., 2002).
To reach pasteurization conditions, processes at 400–600 MPa for 3–15 min at 20°C produced milk with shelf life similar to thermalpasteurization of milk (Rademacher and Kessler, 1997). For sterilization,high temperatures (60–90°C) should be combined with high pressure(>600 MPa) to reach high temperatures (90–120°C) through adiabatic heat,

sufficient to inactivate spores. In addition, lower pressure conditions(<400 MPa) can also be used to encourage spore germination withsubsequent inactivation of vegetative cells (Black et al., 2007; Van Opstalet al., 2004). Thus, HIP can be used as an alternative to thermal processingto produce stable milk, reducing the undesirable taste produced by thethermal process.
However, this technology provides a limiting factor for the processing ofskimmed milk, once semitransparent milk is obtained at pressures higherthan 400 MPa, which is maintained for several days under refrigerationconditions (Devi et al., 2015). This phenomenon is mainly caused by thefragmentation of casein. However, negative effects are not observed in milkderivatives, thus milk can be used for the manufacture yogurts and cheeses,for example (Reps et al., 2009), due to casein aggregation during themanufacturing process (acid or enzymatic gel).
5.1.2. Effect of DHP on milk for direct consumptionStudies have shown that DHP (300 MPa) may be used to replace thermalpasteurization, maintaining milk stable under refrigeration for 1–2 weeks.However, pressures less than 200 MPa are inefficient to guarantee theabsence of pathogens in milk (Vannini et al., 2004), and pressure of130 MPa can inactivate only 0.3, 1.94, and 1.4 decimal reduction times ofEscherichia coli 555, Staphylococcus aureus ST1, and Salmonellaenteritidis E4, respectively (Vannini et al., 2004). In general, high pressuresand inlet temperature increases the effectiveness of DHP process, but it isdifficult to produce sterilized milk by this technology. However, the DHPprocess carried out at 300 MPa with an inlet temperature at 85°C promoteda complete inactivation of the several inoculated spores (Amador Espejoet al., 2014a) and these authors suggested that this process can producecommercially sterile milk. Further details on the process conditions andmechanism of inactivation of microorganisms in milk using DHP waspublished by Pedras et al. (2012).
The DHP is an excellent alternative to prevent phase separation due tothe rupture of the fat globule and high protein adsorption, favoring protein–fat interactions (Ciron et al., 2011; Oliveira et al., 2014; Zamora et al., 2012). Another advantage of the DHP is not changing milk color

(Hernández and Harte, 2008) and producing undesirable aromaticcompounds. Pereda et al. (2008b) investigated DHP processed milk(200 MPa at 30 or 40°C), and reported lower formation of volatilecompounds and oxidized off-flavors during heating, reduced formation ofcompounds during the Maillard reaction, and lower denaturation of β-Lg,with no lactose isomerization, when compared with commercial pasteurizedmilk. Furthermore, the DHP contributed to the maintenance of essentialamino acids (Pereda et al., 2009) and milk vitamins (Amador-Espejoet al., 2015).
5.2. Cheese5.2.1. Effect of HIP on cheese manufactureHIP can be used in cheese manufacturing in two ways. The first is usingHIP processed milk for cheese manufacture, which can lead to an increasein gel formation rate, higher yield, and a decrease in the initial microbialload. Another possibility is to subject cheese to HIP processing in specificstorage periods to decrease postcontamination, thus increasing the shelf lifeof the product; to accelerate ripening due to enzyme activation, reducingstorage costs reduction of the postripening due to enzyme inactivation tomaintain the cheese quality. These two processing conditions are discussedin more detail in the next sections.
5.2.1.1. HIP–processed milk for cheese manufactureThe HIP processing in milk affects the coagulation time (time is reduced inmilk processed at 300 MPa) and the final consistency of the gel (López-Fandiño et al., 1996). This reduction is due to the smaller size of the caseinmicelle that favors the increase in surface area, improving the performanceof the rennet and accelerating the coagulation process. At pressures above400 MPa, an increase in clotting time is observed, probably due todenaturation of β-Lg and its subsequent complexation with the caseinmicelle, preventing the enzyme to access κ-casein.
However, the β-Lg-κ-casein complex caused by HIP increases curd yield(Huppertz et al., 2004a,c, 2005), due to both the increased waterabsorption capacity of proteins, and higher incorporation of denatured β-Lg

in curd, evidenced by the lower protein levels in whey (Huppertz et al., 2006; Roach and Harte, 2008; Zamora et al., 2007). Huppertz et al.(2004a) found an increase in cheese yield of up to 25% from milk subjectedto 600 and 800 MPa, with no increase at pressures below 250 MPa.
The HIP process in milk can also improve the acceptance of fresh cheeseby changes in its sensory attributes. In this context, low-fat cheeses madefrom milk subjected to 400 MPa for 15 min at 22°C, combined withpasteurization (65°C for 30 min), resulted in better consumer acceptance ascompared to cheese made with pasteurized milk (Molina et al., 2000).Processed cheese made with HIP-processed milk exhibited betteracceptance scores, because of a softer, less brittle and more rigid texture,and more pronounced flavor, probably due to changes in protein (Molinaet al., 2000). Thus, the HIP is promising technology for cheesemanufacture, with improved yields and better sensory qualities (Alonso et al., 2012; Sandra et al., 2004).
5.2.1.2. Cheese processed by HIPHIP can also be used to process cheeses after manufacture and, therefore,reduce postprocessing contamination, thus extending the shelf life of theproduct (Evert-Arriagada et al., 2014; Ozturk et al., 2015). Several studieshave found a reduction of 5–6 log cycles of mesophilic microorganisms,and complete inactivation of E. coli inoculated into goat cheese processedat 500 MPa for up to 15 min (Capellas et al., 1996); reduction of 7.6 to 3log cycles of E. coli, Penicillium roqueforti, and S. aureus, respectively,inoculated into cheddar cheese subjected to 400 MPa for 20 min and 20°C(O’Reilly et al., 2000), and no mold growth and yeasts for up to 8 weeks inthe processes carried out above 400 MPa (Daryaei et al., 2008).Furthermore, the process at 500 MPa/5 min/16°C increased the shelf life offresh cheeses from 8 to 19–21 days (Evert-Arriagada et al., 2014). Thus, theuse of pressures above 400 MPa in a relatively short time at roomtemperature can be an effective alternative for extending the shelf life of theproduct without compromising its quality.
Besides the microbiological inactivation, the HIP process can promotethe acceleration of ripening due to increased proteolysis (Delgadoet al., 2012) and modification of the protein network. As examples, there is

the acceleration of the ripening period in cheddar cheese by the applicationof moderate pressures (345 MPa for 3 min) into the cheese curd, whichfacilitates cheddarization, resulting in similar textures to ripened cheddarcheese not subjected to the HIP process (Serrano et al., 2004). In addition,faster development of texture was observed in mozzarella cheeses subjectedto 200 MPa for 60 min at 20°C (Johnston and Darcy, 2000). In hardcheeses, such as Argentine Reggianito, HIP processes at 400 MPa for 5–10 min at 20°C after 1 day of cheese manufacture led to an increase inproteolysis rate, accelerating the cheese-ripening process (Costabelet al., 2016). Thus, the HIP process at pressures lower than 400 MPa can beuseful for cheese manufacture aimed to accelerate ripening. However,depending on the conditions applied, such as higher pressures, the delay incheese ripening can be observed (O’Reilly et al., 2000). Such differencesare mainly due to the increase or decrease of the enzyme activityresponsible for proteolysis, such as rennet or plasmin produced bymicroorganisms (O’Reilly et al., 2001).
Alternatively, HPI can be applied to the cheese after ripening period. Thisprocedure has the advantage of not affecting the ripening process, providingflavor and aroma characteristics similar to the conventional product.However, after ripening, the HIP processing can maintain the desirablesensory characteristics of cheeses during the shelf life, due to inactivationof enzymes and microorganisms, thus reducing the biochemical changes(Calzada et al., 2013a,b, 2014a,b; Voigt et al., 2010). As an example, blue-veined cheese processed at 400 or 600 MPa for 10 min at 20°C after42 days at 4°C presented a reduction of proteolytic activity and decelerationof proteolysis, extending its shelf life (Voigt et al., 2010). Similarly,processes at 400 or 600 MPa after 14 or 21 days prevented Brieoverripening (Calzada et al., 2014a) and the same strategy was usedeffectively to reduce proteolysis and avoid overripening in cheese producedfrom raw sheep milk, after 21 or 35 days (processes at 400 and 600 MPa for5 min at 14°C; Calzada et al., 2014b). Our research group investigatedMorbier cheese subjected to HIP process at 600 MPa for 30 min at 25°C,and stored for 30 days at 8°C, and found the extension of shelf life of theproduct, increasing time to market by 3 months (unpublished results). Thus,it is worth emphasizing the great potential of HIP processing for cheesemaking.

5.2.2. Effect of DHP on cheese manufacture
5.2.2.1. DHP–processed milk for cheese manufactureDHP has been reported as capable of accelerating (processes 200 and300 MPa; Zamora et al., 2007) or have no effect (Hayes and Kelly, 2003b)on milk coagulation time in the cheese-manufacturing process. The clottingtime is reduced due to lower aggregation of casein micelle, which facilitatesthe increase in the surface area and decrease in steric hindrance andelectrostatic repulsion between κ-casein (Sandra and Dalgleish, 2007).Another effect also observed by DHP is the adsorption of casein micelles atfat globules, despite that some authors have reported that this interactiondoes not affect the performance of rennet (Zamora et al., 2007).
Zamora et al. (2011) obtained higher curd yield after the application ofDHP at 300 MPa in raw milk due to an increase in both moisture content(18% increase) and total solids (11% increase). Other authors have alsoreported an increase in the yield of fresh cheese (Lanciotti et al., 2006;Vannini et al., 2008; Zamora et al., 2007) and ripened cheese (Juanet al., 2016). The increased yield by DHP is associated with the higherwater retention capacity of cheese curd, and protein/fat interactions(Vannini et al., 2008; Zamora et al., 2007).
During DHP, there is a disruption of milk fat globule membrane,exposing triglycerides to the action of endogenous lipase (Juan et al., 2015).Therefore, if endogenous lipase is not inactivated, cheese can exhibit highlipolysis during ripening (Lanciotti et al., 2004; Vannini et al., 2008),especially at the process conditions <200 MPa and <58°C that can activateup to 140% in endogenous lipase (Datta et al., 2005). On the other hand, ifthe process conditions are capable of inactivating the endogenous lipase(>200 MPa and >71°C; Datta et al., 2005) the hydrolysis profile is similarto that observed in cheese produced with pasteurized and nonhomogenizedmilk (72°C for 15 s) (Juan et al., 2015).
With respect to proteolysis, DHP breaks casein micelle, increasing thesurface area making the protein more susceptible to hydrolysis. Thus, thereis an increase in the hydrolysis of internal fractions (αs2- and β-casein),with release of hydrophobic and hydrophilic peptides. However, the overall

profile of free amino acids is not changed significantly when compared tocheese made from pasteurized milk (Juan et al., 2016).
The changes on lipolysis and proteolysis depend on DHP processingconditions, which can alter the formation of volatile compounds duringripening. Vannini et al. (2008) reported higher levels of butanoic, capric,caproic, and caprilic acids, and acetic acid and acetoin in pecorino cheesemade with sheep’s milk processed at 100 MPa. In sensory evaluation, thearomatic compounds of the cheese conferred higher scores to piquant flavorand lack of bitter aftertaste. No differences were observed in the sensoryevaluation of caciotta cheese made with bovine milk (100 MPa), whencompared to traditional cheese (Lanciotti et al., 2006). It is worth notingthat the flavor and aroma of cheese is influenced by the culture used in thecheese manufacture, and DHP can accelerate or delay the development ofspecific species (Juan et al., 2016). However, the DHP has the limitation ofprocessing only fluids, thus it is not possible to subject cheese to DHPprocessing.
5.3. YogurtTraditionally, for yogurt production, milk is heated to high temperatures(85–95°C for 3–10 min) to denature whey proteins, especially β-Lg, leadingto interactions between β-Lg and κ-casein by disulfide bonds. This structurelimits the approximation of casein micelles in the isoelectric point (pH 4.6),increasing consistency, reducing syneresis, and increasing water retentioncapacity. However, the HIP and DHP technologies may modify yogurtmicrostructure, improving the sensory characteristics when compared withthe traditional process. Fig. 6.3 summarizes the main changes caused by theHIP and DHP processes in the manufacture of set yogurt and stirred yogurt.In general, HIP is most suitable to increase the consistency of set yogurt,while the DHP is more effective for increasing the consistency of stirredyogurt.

FIGURE 6.3 Rheological behavior of set yogurt (A) and stirredyogurt (B). Black bars indicate the HIP process (600 MPa for 15 minat 50°C) and the gray bars indicate the DHP process (150 MPa at50°C). (1) Oliveira et al. (2014), (2) Ciron et al. (2010), (3) Zamoraet al. (2012), (4) Ciron et al. (2012), (5) Ciron et al. (2011), (6) Serraet al. (2009a), (7) Harte et al. (2002), (8) Penna et al. (2007), (9)López-Fandiño (2006).
5.3.1. Effect of HIP on yogurt manufactureThe use of HIP processed milk for yogurt manufacture has severaladvantages, including increased consistency, lower syneresis, and extensionof shelf life due to selective inactivation of spoilage microorganisms andmaintenance of starter bacteria (Penna et al., 2007). In this context, patents

have been developed to increase the shelf life of probiotic yogurt, byinactivating spoilage microorganisms, such as coliform bacteria, fungi, andyeasts while maintaining the viability of probiotic bacteria resistant topressure (Carroll et al., 2004, 2008). Other studies used HIP in yogurt toinactivate starter cultures (Lactobacillus delbrueckii sp. bulgaricus andStreptococcus salivarius spp. thermophilus), aimed to increase the shelf lifeof the product. After processing at 300–700 MPa for 15 min, both L.delbrueckii spp. bulgaricus and S. salivarius sp. thermophilus werecompletely inactivated; thus, it was possible to reduce the postacidificationand increase the time of market of the product (Reps et al., 2009). However,it is important to check the laws of the country, because in some regions theproduct must contain minimum amounts of viable starter culturesthroughout the marketing period.
The HIP process can also be used to increase yogurt consistency (Harteet al., 2002), with greater intensity in set yogurt (Fig. 6.3). This is achieveddue to (1) fragmentation of casein micelle, (2) partial solubilization of CCP,and (3) β-Lg denaturation caused by high pressures for longer times.Changes in casein lead to an increase in protein interactions, forming amore cohesive structure. De Ancos et al. (2000) have reported that thegreater consistency is perceived by consumers. HIP can also reduce yogurtsyneresis (Harte et al., 2003), and yogurt firmness increases with increasingpressure and process time.
5.3.2. Effect of DHP on yogurt manufactureThe DHP process in milk for yogurt production also contributes toincreasing consistency, reducing syneresis (Serra et al., 2007),postacidification, and development of dairy cultures (Serra et al., 2007).Serra et al. (2007) observed that milk processed at 200 and 300 MPashowed higher gel strength and reduced syneresis when compared to milkfortified with 3% milk powder. The improved consistency of yogurt is dueto changes in protein and fat. In protein, in particular casein, there isfragmentation of the micelle and solubilization of CCP (with no β-Lgdenaturation). DHP results in an intense size reduction of milk fat globulesand increases in the surface area, favoring the adsorption of casein micellesat fat globules, which promotes the increase in gel consistency

(Figure 6.3A). In this sense, the DHP contributes to the consistency ofstirred yogurt (Figure 6.3B), because the fat crystal’s network (5°C) limitsthe reorganization of the proteins during the breaking of the gel. In setyogurt, consistency is not as favored by DHP, mainly because the process isnot capable of denaturing β-Lg (Serra et al. 2009a). However, Oliveira et al.(2014) found that the combination of thermal process (90°C/5 min) andDHP (150 MPa at 50°C) can increase the consistency. Thus, it is possible toassociate the heat denaturation of β-Lg and fragmentation of the micelle andCCP solubilization caused by the DHP. The changes in yogurt consistencywere recognized by consumers in sensory tests (Ciron et al., 2011), and theyogurt samples were characterized for the attributes viscosity, creaminess,and texture (Ciron et al., 2011).
However, the disruption of the globules may favor lipolysis, especially ifthe enzymes were not inactivated by the process conditions (e.g., <200 MPaat <30°C cannot inactivate the endogenous lipase; Serra et al., 2008a). Incontrast, proteolysis in yogurt made with milk processed at 300 MPa didnot differ from conventional industrial process, without impact on thesensory characteristics (Serra et al., 2009b).
Regarding the fermentation rate, the DHP does not affect thefermentation of yogurt cultures, due to the very rapid metabolism of theseorganisms (S. thermophilus and L. delbrueckii ssp. bulgaricus), being ableto reduce pH to 4.6 in less than 6 h (Oliveira et al., 2014; Serra et al., 2007). However, during storage, DHP can reduce yogurt postacidification,because it favors the development of S. thermophilus rather than L.delbrueckii ssp. bulgaricus, which is mainly responsible for yogurtpostacidification during storage (Patrignani et al., 2007; Serraet al., 2009a,b).
5.4. Ice Cream and Butter5.4.1. Effect of HIP on ice cream and butter manufactureThe application of HIP in cream is able to induce the formation of crystalsduring pressurization, mainly the peripheral fat globules (between 300 and500 MPa). Whipping properties improved when cream was processed atpressures up to 600 MPa for up to 2 min (Eberhard et al., 1999), probably

due to better fat crystallization. However, in more severe processconditions, whey denaturation (β-Lg) is observed, reducing the stability ofwhipped cream. The HIP process can also modify the solid–liquid phasediagram of water, reducing the freezing point of water to −22°C at201.5 MPa (Kalichevsky et al., 1995). Thus, it is possible to induce theformation of small crystals by pressurizing the product at freezingtemperatures, which pass to the liquid state during pressurization, followedby formation of small crystals after rapid depressurization. Moreover, HIP(300 MPa for 15 min) improves whey protein functionality and foamstability in low-fat products and increases protein-binding sites with flavormolecules (Kühn et al., 2006). Thus, HIP contributes to the formation of thesmooth texture in ice cream and other frozen products, improving aromaand foam stability (Huppertz et al., 2011).
Another viable application of HIP is the production of pasteurized orsterilized cream. Dumay et al. (1996) found that cream (35% fat) processedat 450 MPa for 30 min at 25°C did not change the size of fat globules, andwas stable for 8 days at 4°C. However, in sterilization processes requiringhigher pressures and temperatures (>40°C), emulsion destabilization canoccur, leading to aggregation of fat globules.
5.4.2. Effect of DHP on ice-cream manufactureThe application of DHP for ice-cream manufacture produces good results,however, research on the subject is still scarce. Hayes et al. (2003)evaluated ice-cream mixtures (3%–8% fat) subjected to DHP at 100 or200 MPa, and found that the texture of ice cream produced with the mixturewith 5% fat was similar to the conventional mixture containing 8% fat,suggesting that DHP may be a promising technology to improve the textureof low-fat ice creams. Furthermore, DHP changes the functionality of wheyprotein, and increases overrun and foam stability (Dissanayake andVasilejvic, 2009), probably due to increased exposure of hydrophobicgroups on the surface molecules.

6. Prospects and Acceptance of ProcessedProducts Through High Pressure ProcessingTechnologiesAn interview in the US showed that consumers do not know HIPtechnology (Hicks et al., 2009). However, it is known by health-careprofessionals that technological innovations, including high-pressureprocessing, are related to prolonging products shelf life and healthpromotion (Delgado-Gutierrez and Bruhn, 2008; Ronteltap et al., 2007).
Hicks et al. (2009) found that after a brief explanation about HIPtechnology, 40% of consumers were willing to pay more for seafoodprocessed by high pressure (between $0.25 and $0.50), and only 15% ofrespondents would not pay more. Of the remaining respondents, 45% werenot sure if they would pay more, but were willing to learn more about thetechnology. The survey also pointed to the Internet, TV/radio, andmagazines/newspapers as the most important means of communication todisseminate new technologies. In a survey conducted in France and Englandin 2003, consumers reported that they would buy products processed byhigh pressure, especially if the product conferred health benefits, but wouldnot pay more for that product (Butz et al., 2003). In addition, Delgado-Gutierrez and Bruhn (2008) showed that consumers were interested ininformation on the safety and freshness of food, as provided by high-pressure processes.
Based on literature, the results indicate that consumers are receptive toconsuming products processed by high pressure, unlike that for irradiatedproducts. However, some companies have chosen to not state on a productlabel that it was subjected to high-pressure process to avoid bias/distrust ofpoorly informed consumers, leading to a reduction of sales. In fact, theadvantages of high-pressure processing, especially for extending theproduct shelf life without additives and preservatives, make these productsdesirable, even without other high-pressure claims.
7. Conclusion

The benefits of the HIP and DHP processes as compared with thermalprocesses is the fact that there is no heating step which reduces the changesin flavor (i.e. cooked flavor) when compared to thermally processed Milk.
The main advantages to the consumption of dairy products processed byhigh-pressure technology are reducing the use of additives and improvingthe sensory characteristics of products. In HIP, packaged products can beprocessed while minimizing postcontamination and extending their shelflife. Furthermore, high-pressure technology can contribute to thedevelopment of new goods/ingredients, promote consistency of set yogurt,contribute to cheese ripening and flavor characterization, among others.Although the DHP process is less effective on reducing the microbial load,it can improve emulsion formation and stability, providing greater fat–protein interactions, thus favoring consistency of stirred yogurt and icecream, as well as increasing the yield in cheese making. The protein–fatinteractions can reduce the amount of fat in dairy products (yogurt and icecream), besides maintaining the organoleptic characteristics of the productsimilar to full-fat products.
However, it is worth mentioning that the HIP and DHP processes arequite different, which result in different changes in milk constituents, thusaffecting the sensory characteristics of dairy products. Further studies onthe effects of these technologies on milk constituents are needed to assessthe final quality of these products.

ReferencesAlonso R, Picon A, Gaya P, Fernández-García E, Nuñez M. Effect of high-pressure treatment of ewe
raw milk curd at 200 and 300 MPa on characteristics of Hispánico cheese. J. Dairy Sci..2012;95:3501–3513.
Amador Espejo GG, Hernández-Herrero MM, Juan B, Trujillo AJ. Inactivation of Bacillus sporesinoculated in milk by ultra high pressure homogenization. Food Microbiol.. 2014;44:204–210.
Amador-Espejo GG, Suàrez-Berencia A, Juan B, Bárcenas ME, Trujillo AJ. Effect of moderate inlettemperatures in ultra-high-pressure homogenization treatments on physicochemical and sensorycharacteristics of milk. J. Dairy Sci.. 2014;97:659–671.
Amador-Espejo GG, Gallardo-Chacon JJ, Nykänen H, Juan B, Trujillo AJ. Effect of ultra high-pressure homogenization on hydro- and liposoluble milk vitamins. Food Res. Int.. 2015;77:49–54.
Augusto PED, Ibarz A, Cristianini M. Effect of high pressure homogenization (HPH) on therheological properties of tomato juice: time-dependent and steady-state shear. J. Food Eng..2012;111:570–579.
Baier D, Schmitt C, Knorr D. Changes in functionality of whey protein and micellar casein after highpressure–low temperature treatments. Food Hydrocoll.. 2015;44:416–423.
Balci AT, Ledward DA, Wilbey RA. Effect of high pressure on acid phosphatase in milk. High Press.Res.. 2002;22:639–642.
Black EP, Setlow P, Hocking AD, Stewart CM, Kelly AL, Hoover DG. Response of spores to high-pressure processing. Compr. Rev. Food Sci. Food Saf.. 2007;6:103–119.
Bouaouina H, Desrumaux A, Loisel C, Legrand J. Functional properties of whey proteins as affectedby dynamic high-pressure treatment. Int. Dairy J.. 2006;16:275–284.
Bravo FI, Felipe X, López-Fandiño R, Molina E. Skim milk protein distribution as a result of veryhigh hydrostatic pressure. Food Res. Int.. 2015;72:74–79.
Butz P, Needs EC, Baron A, Bayer O, Geisel B, Gupta B, Oltersdorf U. Consumer attitudes to highpressure food processing. Food Agr. Environ.. 2003;1:30–34.
Calligaris S, Foschia M, Bartolomeoli I, Maifreni M, Manzocco L. Study on the applicability ofhigh-pressure homogenization for the production of banana juices. LWT—Food Sci. Technol..2012;45:117–121.
Calzada J, del Olmo A, Picon A, Gaya P, Nuñez M, Olmo A, del, Picon A, Gaya P, Nuñez M. High-pressure processing for the control of lipolysis, volatile compounds and off-odours in raw milkcheese. Food Bioproc. Technol.. 2013;7:2207–2217.
Calzada J, del Olmo A, Picon A, Gaya P, Nuñez M. Using high-pressure processing for reduction ofproteolysis and prevention of over-ripening of raw milk cheese. Food Bioproc. Technol.. 2013; 1–10.
Calzada J, del Olmo A, Picon A, Nuñez M. Effect of high-pressure-processing on lipolysis andvolatile compounds of Brie cheese during ripening and refrigerated storage. Int. Dairy J..2014;39:232–239.
Calzada J, del Olmo A, Picon A, Gaya P, Nuñez M. Effect of high-pressure-processing on themicrobiology, proteolysis, texture and flavour of Brie cheese during ripening and refrigeratedstorage. Int. Dairy J.. 2014;37:64–73.

Capellas M, Mor-Mur M, Sendra E, Pla R, Guamis B. Populations of aerobic mesophils andinoculated E. coli during storage of fresh goat’s milk cheese treated with high pressure. J. FoodProt.. 1996;59:582–587.
Carroll, T.J., Chen, P., Harnett, M., Harnett, J., 2004. Pressure treating foods to reduce spoilage.International Patent WO 2004/032655 A1.
Carroll, T.J., Patel, H., Gonzalez-Martin, M.A., Dekker, J.W., Collett, M.A., Lubbers, M.W., 2008.High pressure processing of bioactive compositions. International Patent U.S. 2008/0317823A1.
Chakraborty S, Kaushik N, Rao PS, Mishra HN. High-pressure inactivation of enzymes: a review onits recent applications on fruit purees and juices. Compr. Rev. Food Sci. Food Saf.. 2014;13:578–596.
Ciron CIE, Gee VL, Kelly AL, Auty MAE. Comparison of the effects of high-pressuremicrofluidization and conventional homogenization of milk on particle size, water retention andtexture of non-fat and low-fat yoghurts. Int. Dairy J.. 2010;20:314–320.
Ciron CIE, Gee VL, Kelly AL, Auty MAE. Effect of microfluidization of heat-treated milk onrheology and sensory properties of reduced fat yoghurt. Food Hydrocoll.. 2011;25:1470–1476.
Ciron CIE, Gee VL, Kelly AL, Auty MAE. Modifying the microstructure of low-fat yoghurt bymicrofluidisation of milk at different pressures to enhance rheological and sensory properties.Food Chem.. 2012;130:510–519.
Contador R, Delgado-Adámez J, Delgado FJ, Cava R, Ramírez R. Effect of thermal pasteurisation orhigh pressure processing on immunoglobulin and leukocyte contents of human milk. Int. Dairy J..2013;32:1–5.
Costabel LM, Bergamini C, Vaudagna SR, Cuatrin AL, Audero G, Hynes E. Effect of high-pressuretreatment on hard cheese proteolysis. J. Dairy Sci.. 2016; 1–13.
Daryaei H, Coventry MJ, Versteeg C, Sherkat F. Effect of high pressure treatment on starter bacteriaand spoilage yeasts in fresh lactic curd cheese of bovine milk. Innov. Food Sci. Emerg. Technol..2008;9:201–205.
Datta N, Hayes MG, Deeth HC, Kelly AL. Significance of frictional heating for effects of highpressure homogenisation on milk. J. Dairy Res.. 2005;72:393–399.
De Ancos B, Pilar Cano M, Gómez R. Characteristics of stirred low-fat yoghurt as affected by highpressure. Int. Dairy J.. 2000;10:105–111.
Delgado FJ, González-Crespo J, Cava R, Ramírez R. Changes in microbiology, proteolysis, textureand sensory characteristics of raw goat milk cheeses treated by high-pressure at different stages ofmaturation. LWT—Food Sci. Technol.. 2012;48:268–275.
Delgado-Gutierrez C, Bruhn CM. Health professionals’ attitudes and educational needs regardingnew food processing technologies. J. Food Sci. Educ.. 2008;7:78–83.
Devi AF, Buckow R, Singh T, Hemar Y, Kasapis S. Colour change and proteolysis of skim milkduring high pressure thermal–processing. J. Food Eng.. 2015;147:102–110.
Diels AMJ, Michiels CW. High-pressure homogenization as a non-thermal technique for theinactivation of microorganisms. Crit. Rev. Microbiol.. 2006;32:201–216.
Dissanayake M, Vasilejvic T. Functional properties of whey proteins affected by heat treatment andhydrodynamic high-pressure shearing. J. Dairy Sci.. 2009;92:1387–1397.
Dong X, Zhao M, Yang B, Shi J, Jiang Y. Effect of high-pressure homogenization on the functionalproperty of peanut protein. J. Food Process Eng.. 2011;34:2194–2204.

Dumay E, Lambert C, Funtenberger S, Cheftel JC. Effects of high pressure on the physico-chemicalcharacteristics of dairy creams and model oil/water emulsions. LWT—Food Sci. Technol..1996;29:606–625.
Dumay E, Chevalier-Lucia D, Picart-Palmade L, Benzaria A, Gràcia-Julià A, Blayo C. Technologicalaspects and potential applications of (ultra) high-pressure homogenisation. Trends Food Sci.Technol.. 2013;31:13–26.
Eberhard P, Strahm W, Milchwirt EF. High pressure treatment of whipped cream. Agrar. Schweiz.1999;6:352–354.
Eisenmenger MJ, Reyes-De-Corcuera JI. High pressure enhancement of enzymes: a review. EnzymeMicrob. Technol.. 2009;45:331–347.
Evert-Arriagada K, Hernández-Herrero MM, Gallardo-Chacón JJ, Juan B, Trujillo AJ. Effect of highpressure processing on volatile compound profile of a starter-free fresh cheese. Innov. Food Sci.Emerg. Technol.. 2013;19:73–78.
Evert-Arriagada K, Hernández-Herrero MM, Guamis B, Trujillo AJ. Commercial application ofhigh-pressure processing for increasing starter-free fresh cheese shelf-life. LWT—Food Sci.Technol.. 2014;55:498–505.
Franchi MA, Tribst AAL, Cristianini M. Effects of high pressure homogenization on beer qualityattributes. J. Inst. Brew.. 2011;117:195–198.
Franchi MA, Tribst AAL, Cristianini M. Inactivation of Lactobacillus brevis in beer utilizing acombination of high-pressure homogenization and lysozyme treatment. J. Inst. Brew..2011;117:634–638.
Garía-Risco MR, Olano A, Ramos M, López-Fandiño R. Micelar changes induced by high pressure.influence in the proteolytic activity and organoleptic properties of milk. J. Dairy Sci..2000;83:2184–2189.
Garrido M, Contador R, García-Parra J, Delgado FJ, Delgado-Adámez J, Ramírez R. Volatile profileof human milk subjected to high-pressure thermal processing. Food Res. Int.. 2015;78:186–194.
Gervilla R, Ferragut V, Guamis B. High hydrostatic pressure effects on color and milk fat globule ofewe’s milk. J. Food Sci.. 2001;66:880–885.
Harte F, Amonte M, Luedecke L, Swanson BG, Barbosa-Canovas GV. Yield stress andmicrostructure of set yogurt made from high hydrostatic pressure-treated full fat milk. J. FoodSci.. 2002;67:2245–2250.
Harte F, Luedecke L, Swanson B, Barbosa-Cánovas GV. Low-fat set yogurt made from milksubjected to combinations of high hydrostatic pressure and thermal processing. J. Dairy Sci..2003;86:1074–1082.
Hayes MG, Kelly AL. High pressure homogenisation of raw whole bovine milk (a) effects on fatglobule size and other properties. J. Dairy Res.. 2003;70:297–305.
Hayes MG, Kelly AL. High pressure homogenisation of milk (b) effects on indigenous enzymaticactivity. J. Dairy Res.. 2003;70:307–313.
Hayes MG, Lefrancois AC, Waldron DS, Goff HD, Kelly AL. Influence of high pressurehomogenisation on some characteristics of ice cream. Milchwissenschaft. 2003;58:519–523.
Hayes MG, Fox PF, Kelly AL. Potential applications of high pressure homogenisation in processingof liquid milk. J. Dairy Res.. 2005;72:25–33.
Hernández A, Harte FM. Manufacture of acid gels from skim milk using high-pressurehomogenization. J. Dairy Sci.. 2008;91:3761–3767.

Hicks DT, Pivarnik LF, McDermott R, Richard N, Hoover DG, Kniel KE. Consumer awareness andwillingness to pay for high-pressure processing of ready-to-eat food. J. Food Sci. Educ..2009;8:32–38.
Huppertz T, De Kruif CG. Disruption and reassociation of casein micelles under high pressure:influence of milk serum composition and casein micelle concentration. J. Agr. Food Chem..2006;54:5903–5909.
Huppertz T, Fox PF, Kelly AL. High pressure-induced changes in the creaming properties of bovinemilk. Innov. Food Sci. Emerg. Technol.. 2003;4:349–359.
Huppertz T, Fox PF, Kelly AL. Effects of high pressure treatment on the yield of cheese curd frombovine milk. Innov. Food Sci. Emerg. Technol.. 2004;5:1–8.
Huppertz T, Fox PF, Kelly AL. Plasmin activity and proteolysis in high pressure-treated bovine milk.Lait. 2004;84:297–304.
Huppertz T, Fox PF, Kelly AL. High pressure treatment of bovine milk: effects on casein micellesand whey proteins. J. Dairy Res.. 2004;71:97–106.
Huppertz T, Grosman S, Fox PF, Kelly AL. Heat and ethanol stabilities of high-pressure-treatedbovine milk. Int. Dairy J.. 2004;14:125–133.
Huppertz T, Hinz K, Zobrist MR, Uniacke T, Kelly AL, Fox PF. Effects of high pressure treatmenton the rennet coagulation and cheese-making properties of heated milk. Innov. Food Sci. Emerg.Technol.. 2005;6:279–285.
Huppertz T, Fox PF, de Kruif KG, Kelly AL. High pressure-induced changes in bovine milkproteins: a review. Biochim. Biophys. Acta. 2006;1764:593–598.
Huppertz T, Smiddy Ma, Goff HD, Kelly AL. Effects of high pressure treatment of mix on ice creammanufacture. Int. Dairy J.. 2011;21:718–726.
Innocente N, Biasutti M, Venir E, Spaziani M, Marchesini G. Effect of high-pressure homogenizationon droplet size distribution and rheological properties of ice cream mixes. J. Dairy Sci..2009;92:1864–1875.
Iucci L, Patrignani F, Vallicelli M, Guerzoni ME, Lanciotti R. Effects of high pressurehomogenization on the activity of lysozyme and lactoferrin against Listeria monocytogenes. FoodControl. 2007;18:558–565.
Iucci L, Lanciotti R, Kelly A, Huppertz T. Plasmin activity in high-pressure-homogenised bovinemilk. Milchwissenschaft. 2008;63:68–70.
Johnston DE, Darcy PC. The effects of high pressure treatment on immature mozzarella cheese.Milchwissenschaft. 2000;55:617–620.
Johnston DE, Murphy RJ, Rutherford JA, McCreedy RW. Acidification of high pressure treatedmilk: the role of whey protein denaturation. Milchwissenschaft. 2002;57:605–608.
Juan B, Quevedo JM, Zamora A, Guamis B, Trujillo A-J. Lipolysis of cheeses made from goat milktreated by ultra-high pressure homogenization. LWT—Food Sci. Technol.. 2015;60:1034–1038.
Juan B, Zamora A, Quevedo JM, Trujillo A-J. Proteolysis of cheese made from goat milk treated byultra high pressure homogenisation. LWT—Food Sci. Technol.. 2016;69:17–23.
Kalichevsky M, Knorr D, Lillford PJ. Potential food applications of high-pressure effects on ice-water transitions. Trends Food Sci. Technol.. 1995;6:253–259.
Kielczewska K, Krok A, Czernewicz M, Kopeć M. Effect of high pressure on constituents of thecolloidal phase of milk. Milchwissenschaft. 2009;64:358–360.

Kühn J, Considine T, Singh H. Interactions of milk proteins and volatile flavor compounds:implications in the development of protein foods. J. Food Sci.. 2006;71:R72–R82.
Lanciotti R, Chaves-López C, Patrignani F, Paparella A, Guerzoni ME, Serio A, Suzzi G. Effects ofmilk treatment with dynamic high pressure on microbial populations, and lipolytic and proteolyticprofiles of Crescenza cheese. Int. J. Dairy Technol.. 2004;57:19–25.
Lanciotti R, Vannini L, Patrignani F, Iucci L, Vallicelli M, Ndagijimana M, Guerzoni ME. Effect ofhigh pressure homogenisation of milk on cheese yield and microbiology, lipolysis and proteolysisduring ripening of Caciotta cheese. J. Dairy Res.. 2006;73:216–226.
Leite Júnior BRC, Tribst AAL, Bonafe CFS, Cristianini M. Determination of the influence of highpressure processing on calf rennet using response surface methodology: effects on milkcoagulation. LWT—Food Sci. Technol.. 2016;65:10–17.
Leite Júnior BRC, Tribst AAL, Cristianini M. Comparative effects of high isostatic pressure andthermal processing on the inactivation of Rhizomucor miehei protease. LWT—Food Sci. Technol..2016;65:1050–1053.
Leite Júnior BRC, Tribst AAL, Cristianini M. The effect of high pressure processing on recombinantchymosin, bovine rennet and porcine pepsin: influence on the proteolytic and milk-clottingactivities and on milk-clotting characteristics. LWT—Food Sci. Technol.. 2016;76(Part B):351–360.
Liu X, Powers JR, Swanson BG, Hill HH, Clark S. Modification of whey protein concentratehydrophobicity by high hydrostatic pressure. Innov. Food Sci. Emerg. Technol.. 2005;6:310–317.
López-Fandiño R. High pressure-induced changes in milk proteins and possible applications in dairytechnology. Int. Dairy J.. 2006;16:1119–1131.
López-Fandiño R, Carrascosa AV, Olano A. The effects of high pressure on whey proteindenaturation and cheese-making properties of raw milk. J. Dairy Sci.. 1996;79:929–936.
López-Fandiño R, De La Fuente MA, Ramos M, Olano A. Distribution of minerals and proteinsbetween soluble and colloidal phases of pressurized milks from different species. J. Dairy Res..1998;65:69–78.
Luo DH, Zhao QZ, Zhao MM, Yang B, Long XT, Ren JY, et al. Effects of limited proteolysis andhigh-pressure homogenisation on structural and functional characteristics of glycinin. FoodChem.. 2010;122:25–30.
Martínez-Monteagudo SI, Saldaña MDA. Modeling the retention kinetics of conjugated linoleic acidduring high-pressure sterilization of milk. Food Res. Int.. 2014;62:169–176.
Molina E, Dolores Álvarez M, Ramos M, López-Fandiño R, Agustı́n Olano, López-Fandiño R. Useof high-pressure-treated milk for the production of reduced-fat cheese. Int. Dairy J.. 2000;10:467–475.
O’Reilly CE, O’Connor PM, Kelly AL, Beresford TP, Murphy PM. Use of hydrostatic pressure forinactivation of microbial contaminants in cheese. Appl. Environ. Microbiol.. 2000;66:4890–4896.
O’Reilly CE, Kelly AL, Murphy PM, Beresford TP. High pressure treatment: applications in cheesemanufacture and ripening. Trends Food Sci. Technol.. 2001;12:51–59.
Ohmiya K, Kajino T, Shimizu S, Gekko K. Effect of pressure on the association states of enzyme-treated caseins. Agr. Biol. Chem.. 2014;53:1–7.
Oliveira MM, Augusto PED, Cruz AG, Cristianini M. Effect of dynamic high pressure on milkfermentation kinetics and rheological properties of probiotic fermented milk. Innov. Food Sci.Emerg. Technol.. 2014;26:67–75.

Ozturk M, Govindasamy-Lucey S, Jaeggi JJ, Johnson ME, Lucey JA. Low-sodium Cheddar cheese:effect of fortification of cheese milk with ultrafiltration retentate and high-hydrostatic pressuretreatment of cheese. J. Dairy Sci.. 2015;98:6713–6726.
Pandey PK, Ramaswamy HS. Effect of high-pressure treatment of milk on lipase and gamma-glutamyl transferase activity. J. Food Biochem.. 2004;28:449–462.
Patazca E, Koutchma T, Balasubramaniam VM. Quasi-adiabatic temperature increase during highpressure processing of selected foods. J. Food Eng.. 2007;80:199–205.
Patel HA, Singh H, Anema SG, Creamer LK. Effects of heat and high hydrostatic pressure treatmentson disulfide bonding interchanges among the proteins in skim milk. J. Agr. Food Chem..2006;54:3409–3420.
Patrignani F, Iucci L, Lanciotti R, Vallicelli M, Maina Mathara J, Holzapfel WH, Guerzoni ME.Effect of high-pressure homogenization, nonfat milk solids, and milkfat on the technologicalperformance of a functional strain for the production of probiotic fermented milks. J. Dairy Sci..2007;90:4513–4523.
Pedras MM, Pinho CRG, Tribst AAL, Franchi MA, Cristianini M. The effect of high pressurehomogenization on microorganisms in milk. Int. Food Res. J.. 2012;19:1–5.
Penna ALB, Subbarao-Gurram, Barbosa-Cánovas GV. High hydrostatic pressure processing onmicrostructure of probiotic low-fat yogurt. Food Res. Int.. 2007;40:510–519.
Pereda J, Ferragut V, Buffa M, Guamis B, Trujillo AJ. Proteolysis of ultra-high pressurehomogenised treated milk during refrigerated storage. Food Chem.. 2008;111:696–702.
Pereda J, Jaramillo DP, Quevedo JM, Ferragut V, Guamis B, Trujillo AJ. Characterization of volatilecompounds in ultra-high-pressure homogenized milk. Int. Dairy J.. 2008;18:826–834.
Pereda J, Ferragut V, Quevedo JM, Guamis B, Trujillo AJ. Heat damage evaluation in ultra-highpressure homogenized milk. Food Hydrocoll.. 2009;23:1974–1979.
Picart L, Thiebaud M, René M, Pierre Guiraud J, Cheftel JC, Dumay E. Effects of high pressurehomogenisation of raw bovine milk on alkaline phosphatase and microbial inactivation: acomparison with continuous short-time thermal treatments. J. Dairy Res.. 2006;73:454–463.
Pinho CRG, Franchi MA, Tribst AAL, Cristianini M. Effect of ultra high pressure homogenizationon alkaline phosphatase and lactoperoxidase activity in raw skim milk. Procedia Food Sci..2011;1:874–878.
Poliseli-Scopel FH, Hernández-Herrero M, Guamis B, Ferragut V. Sterilization and asepticpackaging of soymilk treated by ultra high pressure homogenization. Innov. Food Sci. Emerg.Technol.. 2014;22:81–88.
Rademacher B, Kessler HG. High pressure inactivation of microorganisms and enzymes in milk andmilk products. In: Heremans K, ed. High Pressure Bioscience and Biotechnology. Leuven:Leuven University Press; 1997:291–293.
Rademacher B, Pfeiffer B, Kessler HG. Inactivation of microorganisms and enzymes in pressuretreated raw milk. In: Isaacs NS, ed. High Pressure Food Science, Bioscience and Chemistry.Cambridge: Royal Society of Chemistry; 1998:145–151.
Rendueles E, Omer MK, Alvseike O, Alonso-Calleja C, Capita R, Prieto M. Microbiological foodsafety assessment of high hydrostatic pressure processing: a review. LWT—Food Sci. Technol..2011;44:1251–1260.
Reps A, Jankowska A, Wiśniewska K. The effect of high pressure on selected properties of yoghurt.High Press. Res.. 2009;29:33–37.

Roach A, Harte F. Disruption and sedimentation of casein micelles and casein micelle isolates underhigh-pressure homogenization. Innov. Food Sci. Emerg. Technol.. 2008;9:1–8.
Rodríguez-Alcalá LM, Harte F, Fontecha J. Fatty acid profile and CLA isomers content of cow, eweand goat milks processed by high pressure homogenization. Innov. Food Sci. Emerg. Technol..2009;10:32–36.
Rodríguez-Alcalá LM, Castro-Gómez P, Felipe X, Noriega L, Fontecha J. Effect of processing ofcow milk by high pressures under conditions up to 900MPa on the composition of neutral, polarlipids and fatty acids. LWT—Food Sci. Technol.. 2015;62:265–270.
Ronteltap A, van Trijp JCM, Renes RJ, Frewer LJ. Consumer acceptance of technology-based foodinnovations: lessons for the future of nutrigenomics. Appetite. 2007;49:1–17.
Sandra S, Dalgleish DG. Effects of ultra-high-pressure homogenization and heating on structuralproperties of casein micelles in reconstituted skim milk powder. Int. Dairy J.. 2005;15:1095–1104.
Sandra S, Dalgleish DG. The effect of ultra high-pressure homogenization (UHPH) on rennetcoagulation properties of unheated and heated fresh skimmed milk. Int. Dairy J.. 2007;17:1043–1052.
Sandra S, Stanford MA, Meunier Goddik L. The use of high-pressure processing in the production ofQueso Fresco cheese. J. Food Sci.. 2004;69(4):69.
Serra M, Trujillo AJ, Quevedo JM, Guamis B, Ferragut V. Acid coagulation properties and suitabilityfor yogurt production of cows’ milk treated by high-pressure homogenisation. Int. Dairy J..2007;17:782–790.
Serra M, Trujillo AJ, Pereda J, Guamis B, Ferragut V. Quantification of lipolysis and lipid oxidationduring cold storage of yogurts produced from milk treated by ultra-high pressure homogenization.J. Food Eng.. 2008;89:99–104.
Serra M, Trujillo AJ, Jaramillo PD, Guamis B, Ferragut V. Ultra-high pressure homogenization-induced changes in skim milk: impact on acid coagulation properties. J. Dairy Res.. 2008;75:69–75.
Serra M, Trujillo AJ, Guamis B, Ferragut V. Evaluation of physical properties during storage of setand stirred yogurts made from ultra-high pressure homogenization-treated milk. Food Hydrocoll..2009;23:82–91.
Serra M, Trujillo AJ, Guamis B, Ferragut V. Proteolysis of yogurts made from ultra-high-pressurehomogenized milk during cold storage. J. Dairy Sci.. 2009;92:71–78.
Serrano J, Velazquez G, Lopetcharat K, Ramirez JA, Torres JA. Effect of moderate pressuretreatments on microstructure, texture and sensory properties of stirred-curd cheddar shreds. J.Dairy Sci.. 2004;87:3172–3182.
Shah NP, Tsangalis D, Donkor ON, Versteeg C. Effect of high pressure treatment on viability ofLactobacillus delbrueckii ssp. bulgaricus, Streptococcus thermophilus and L. acidophilus and thepH of fermented milk. Milchwissenschaft. 2008;63:11–14.
Silva FVM. High pressure processing of milk: modeling the inactivation of psychrotrophic Bacilluscereus spores at 38–70°C. J. Food Eng.. 2015;165:141–148.
Sørensen H, Mortensen K, Sørland GH, Larsen FH, Paulsson M, Ipsen R. Dynamic ultra-highpressure homogenisation of milk casein concentrates: influence of casein content. Innov. FoodSci. Emerg. Technol.. 2014;26:143–152.

Sørensen H, Mortensen K, Sørland GH, Larsen FH, Paulsson M, Ipsen R. Dynamic ultra-highpressure homogenisation of whey protein-depleted milk concentrate. Int. Dairy J.. 2015;46:12–21.
Sousa SG, Santos MD, Fidalgo LG, Delgadillo I, Saraiva Ja. Effect of thermal pasteurisation andhigh-pressure processing on immunoglobulin content and lysozyme and lactoperoxidase activityin human colostrum. Food Chem.. 2014;151:79–85.
Thiebaud M, Dumay E, Picart L, Guiraud JP, Cheftel JC. High-pressure homogenisation of rawbovine milk: effects on fat globule size distribution and microbial inactivation. Int. Dairy J..2003;13:427–439.
Tomasula PM, Renye Ja, Van Hekken DL, Tunick MH, Kwoczak R, Toht M, Leggett LN, LuchanskyJB, Porto-Fett AC, Phillips JG. Effect of high-pressure processing on reduction of Listeriamonocytogenes in packaged Queso Fresco. J. Dairy Sci.. 2014;97:1281–1295.
Tribst AAL, Franchi MA, Cristianini M. Ultra-high pressure homogenization treatment combinedwith lysozyme for controlling Lactobacillus brevis contamination in model system. Innov. FoodSci. Emerg. Technol.. 2008;9:265–271.
Trujillo AJ, Capellas M, Saldo J, Gervilla R, Guamis B. Applications of high hydrostatic pressure onmilk and dairy products: a review. Innov. Food Sci. Emerg. Technol.. 2002;3:295–307.
Van Opstal I, Bagamboula CF, Vanmuysen SCM, Wuytack EY, Michiels CW. Inactivation ofBacillus cereus spores in milk by mild pressure and heat treatments. Int. J. Food Microbiol..2004;92:227–234.
Vannini L, Lanciotti R, Baldi D, Guerzoni ME. Interactions between high pressure homogenizationand antimicrobial activity of lysozyme and lactoperoxidase. Int. J. Food Microbiol.. 2004;94:123–135.
Vannini L, Patrignani F, Iucci L, Ndagijimana M, Vallicelli M, Lanciotti R, Guerzoni ME. Effect of apre-treatment of milk with high pressure homogenization on yield as well as on microbiological,lipolytic and proteolytic patterns of “Pecorino” cheese. Int. J. Food Microbiol.. 2008;128:329–335.
Vazquez-Landaverde PA, Torres JA, Qian MC. Effect of high-pressure-moderate-temperatureprocessing on the volatile profile of milk. J. Agr. Food Chem.. 2006;54:9184–9192.
Velázquez-Estrada RM, Hernández-Herrero MM, Guamis-López B, Roig-Sagués AX. Impact of ultrahigh pressure homogenization on pectin methylesterase activity and microbial characteristics oforange juice: a comparative study against conventional heat pasteurization. Innov. Food Sci.Emerg. Technol.. 2012;13:100–106.
Viazis S, Farkas BE, Allen JC. Effects of high-pressure processing on immunoglobulin A andlysozyme activity in human milk. J. Hum. Lact.. 2007;23:253–261.
Voigt DD, Chevalier F, Qian MC, Kelly AL. Effect of high-pressure treatment on microbiology,proteolysis, lipolysis and levels of flavour compounds in mature blue-veined cheese. Innov. FoodSci. Emerg. Technol.. 2010;11:68–77.
Voigt DD, Patterson MF, Linton M, Kelly AL. Effect of high-pressure treatment of milk prior tomanufacture on ripening of Camembert cheese. Innov. Food Sci. Emerg. Technol.. 2011;12:1–5.
Yang W, Xu Y, Zhang D, Zhao Y, Zhao Z. Effects of high pressure treatments on the ripening ofhard cheeses. Appl. Mech. Mater.. 2014;464:98–102.
Yuan B, Ren J, Zhao M, Luo D, Gu L. Effects of limited enzymatic hydrolysis with pepsin and high-pressure homogenization on the functional properties of soybean protein isolate. LWT—Food Sci.

Technol.. 2012;46:453–459.Zamora A, Ferragut V, Jaramillo PD, Guamis B, Trujillo AJ. Effects of ultra-high pressure
homogenization on the cheese-making properties of milk. J. Dairy Sci.. 2007;90:13–23.Zamora A, Ferragut V, Juan B, Guamis B, Trujillo AJ. Effect of ultra-high pressure homogenisation
of milk on the texture and water-typology of a starter-free fresh cheese. Innov. Food Sci. Emerg.Technol.. 2011;12:484–490.
Zamora A, Trujillo AJ, Armaforte E, Waldron DS, Kelly AL. Effect of fat content andhomogenization under conventional or ultra-high-pressure conditions on interactions betweenproteins in rennet curds. J. Dairy Sci.. 2012;95:4796–4803.
Further ReadingHuppertz T, Fox PF, Kelly AL. Properties of casein micelles in high pressure-treated bovine milk.
Food Chem.. 2004;87:103–110.

C H A P T E R 7
Advances in Nonthermal ProcessingTechnologies for EnhancedMicrobiological Safety and Qualityof Fresh Fruit and Juice ProductsHafiz Muhammad Shahbaz*,**
Jeong Un Kim*
Sun-Hyoung Kim*
Jiyong Park* * Yonsei University, Seoul, South Korea ** University of Veterinary & Animal Sciences, Lahore, Pakistan
AbstractIncreasing consumer demand for fresh, nutritious, and convenient food products has triggeredacademic and industrial research toward development of innovative nonthermal food-processingtechnologies. An overview of recent research investigations, state-of-the-art microbial inactivationstrategies, advances in process and equipment design, and hurdle approaches for processing offresh fruit and juice products using high hydrostatic pressure (HHP), pulsed electric fields (PEF),ultraviolet (UV) light, and UV-assisted TiO2 photocatalysis (TUV) nonthermal technologies isprovided. Transition from lab and pilot-scale equipment to industrial scale equipment has occurredfor HHP and PEF technologies in recent years. HHP-treated and PEF-treated fruit juices arecurrently available on commercial market shelves of many countries worldwide. Future directionsto enhance the effectiveness and commercial adoption of these nonthermal food-processingtechnologies are discussed.

Keywords
fresh fruitfruit juicemicrobiological safetyhigh hydrostatic pressureultraviolet lightpulsed electric fieldsUV-assisted TiO2 photocatalysishurdle approachsensory characteristicsshelf life
1. Fresh Fruit and Juice Consumption Trends1.1. Health Benefits of Fresh Fruit IntakeIncreasing health consciousness and interest in the role of food formaintaining and improving human health has led to increased consumptionof fresh fruit and juice products. Fresh fruit is an important part of a well-balanced and healthy eating plan. Fruits contain essential nutrients, fiber,phytochemicals, vitamins, and minerals necessary for normal human growth.Epidemiological studies have shown a relationship between regularconsumption of fresh fruit and vegetables and prevention of a range ofchronic diseases, such as cardiovascular diseases, obesity, cancer, dementia,diabetes, cataracts, and age-related functional degeneration (Koseki, 2014;Ramos et al., 2013; Slavin and Lloyd, 2012).
1.2. Recommended Intake of Fresh FruitThe World Health Organization (WHO) recommends a minimum intake offruit and vegetables of ≥400 g/day (World Health Organization, 2003). Mostcountries have their own dietary recommendations on intake of fruit and

vegetables. Recommended quantities vary from country to country but aregenerally in line with WHO guidelines. In Denmark, for example, therecommendation is ≥600 g/day. However, a majority of European countriesdo not reach this WHO recommendation (European Food InformationCouncil, 2012). According to a report by the European Food Safety Authority(2008), this recommendation is only met in Poland, Germany, Italy, andAustria. Health Canada recommends 7–8 servings/day of fresh fruit andvegetables for adults, and 4–6 servings/day for children (Slavin andLloyd, 2012). The actual intake of fresh fruit and vegetables is closelyassociated with socioeconomic status and education level of the consumer. Inthe United States, consumption of total fruit and vegetables is expected togrow roughly 4% in the next 5 years (Produce for Better Health andFoundation, 2015). According to FAOStat (2012), fresh fruit productionincreased worldwide by 20% during 2003–12. Bananas, apples, and berriestop the list of the most consumed fruits.
1.3. Processing of Fruit Into Juice ProductsAll countries of the world are becoming increasingly urbanized (UnitedNations Department of Economic and Social Affairs, 2014). Growing trendsof urbanization and modernization have changed lifestyles and food habits ofconsumers. Modern consumers are seeking variety and convenience.Optimizing the use of fruit in different product forms, such as processedjuices and smoothies, provides convenient options for consumers.Conversion of fruit into processed products also enhances the economicvalue of fruit. Therefore, the fruit juice industry is rapidly growingworldwide. Fruit juices contain biologically active antioxidant compounds,such as ascorbic acid and phenols. Ascorbic acid possess antioxidant andantiinflammatory properties while phenolic compounds have anticancerproperties (Navarro-Pascual-Ahuir et al., 2015). Fruit juices are alsoperceived as healthy foods due to low sodium, cholesterol, and fat contents(Patrignani et al., 2013). The consumption of fruit and vegetable juices andnectars in European countries showed that the most popular nectar and juiceflavor is orange (38.5%), followed by mixed (19.9%), followed by apple(13.3%) (European Fruit Juice Association, 2012). The largest producer of

orange juice in the world is Brazil, followed by the United States (Lerma-Garcia et al., 2016).
2. Microbial Contamination of Fresh Fruit andJuices and Related Foodborne IllnessOutbreaksMicroorganisms can cause foodborne illness and spoilage in food products.Microorganisms, such as bacteria and yeast/molds, can grow in foods andcause spoilage. Bacteria and viruses can cause foodborne illness. Viruses arenot capable of growing in foods and, therefore, do not cause spoilage.Microbial foodborne illness can be dived into the two categories of foodinfection and food intoxication. Food infection occurs when microorganismsmultiply in food to reach the minimum infective dose: the number ofmicroorganisms that can cause illness in humans. When contaminated food isconsumed, microorganisms may act directly on the intestines. Most foodinfections result in some degree of diarrhea and abdominal distress. Foodintoxication occurs when pathogenic microorganisms secrete toxin into foodand consumption of that food may disrupt a particular target inside the body,such as the gastrointestinal tract or the nervous system. For example, Listeriamonocytogenes has a remarkable ability to transit from the gastrointestinalsystem and eventually migrate to the brain where it can cause encephalitis.Symptoms of intoxication vary from sessions of vomiting and diarrhea toseverely disrupted muscle function (US Department of Agriculture, 2012).
Yeast has the ability to grow in fruit juices at conditions of low pH andhigh sugar concentration, which are unfavorable for growth of othermicrobial species. Yeast growth in fruit juices may result in undesiredmetabolic products, such as carbon dioxide and alcohol. Yeast may alsocause the release of pectin-degrading enzymes, leading to a number of issues,such as enhanced turbidity, flocculation, and phase separation in fruit juices.Molds are similar to yeast with growth on a liquid surface. Molds are mostlyaerobic and cannot grow under low oxygen tension. Mold growth producesundesired effects, such as gas production, change of odor, and formation of amycelial mat on the juice surface (Tournas et al., 2006). Furthermore, moldsmay produce spores that are highly heat resistant and can survivepasteurization (Dantigny et al., 2005). Bacterial spores are not a direct hazard

to the food industry, but their eventual germination, outgrowth, andproliferation causes toxification and spoilage of food during postprocessingstorage (Heinz and Buckow, 2009).
Viruses are a serious risk to the safety of fresh produce. Viruses enter foodvia contaminated water or during unhygienic food-handling practices. Freshproduce is often vulnerable to virus contamination during pre- andpostharvest stages and produce is generally consumed after minimal or noprocessing (Bouwknegt et al., 2015). Among viruses, noroviruses andhepatitis viruses are of particular concern in foods. Human norovirus istransmitted primarily through the fecal–oral route via consumption ofcontaminated water and food or aerosolization of the virus and subsequentcontamination of food surfaces (Lee et al., 2008). Human norovirus isextremely contagious and fewer than 20 viral particles can cause an infection(Moore et al., 2015).
In recent decades, the frequency of reported foodborne diseases linked tofresh produce has increased that may be due to the increased consumption offresh produce (CDC, 2015; Meireles et al., 2016). Produce outbreakscaused 15% of all foodborne outbreaks and 23% of all foodborne illness from1998 to 2007. Salmonella, one of the primary pathogens, accounted for 17%of produce-related outbreaks during this period (Center for Science in thePublic Interest, 2009). The most common microorganisms associated withfoodborne illness in fruit and juice products include Escherichia coliO157:H7, L. monocytogenes, Salmonella spp., Shigella spp., Clostridiumbotulinum, Yersinia enterocolitica, and hepatitis A and norovirus (USDepartment of Agriculture, 2012). Several foodborne infection outbreakscaused by consumption of fruit juices containing E. coli O157:H7 andSalmonella spp. have been reported (Lee et al., 2012; Vojdani et al., 2008).
3. Challenges of the Fresh Produce– andJuice-Processing Industries3.1. Chlorine Disinfection of Fresh FruitFresh fruit can become contaminated with pathogenic microorganisms duringproduction, harvest, postharvest handling, and distribution. There are severalsimple safe handling practices to promote the safety of fresh produce. The

US FDA prescribes proper washing of fresh fruit with a sufficient amount ofcold or warm tap water and scrubbing with a brush for elimination of dirt,pathogenic microorganisms, and pesticide residues. However, at industrialscales, if produce is washed without sanitizers, a huge quantity of water isrequired to attain the same level of microbial reduction. Significant economicand environmental issues can result. Moreover, reuse of the processing watercan lead to a gradual accumulation of microbial loads, hence, making water asource of cross-contamination (Gil et al., 2009).
Chlorine-based disinfectants are widely used for sanitization of freshproduce surfaces against pathogenic microorganisms at commercial scales.Chlorine-based disinfectants can be used in the form of chlorine gas, calciumhypochlorite, and sodium hypochlorite. Application of chlorine-baseddisinfectants is considered to be responsible for numerous health andenvironment risks. Hypochlorous acid can rapidly react with organic matterin water, leading to formation of trihalomethanes, haloketones, haloaceticacids, and chloropicrin by-products, which can remain on a final product.Trihalomethanes are carcinogenic compounds considered to be responsiblefor cancers. Prolonged exposure to chlorine vapors can cause irritation ofskin and respiratory tract tissues, hence occupational health concerns havebeen raised. Moreover, maintaining adequate residual chlorine levels in awashing tank during commercial disinfection processes of fresh produce ischallenging (Gil et al., 2009; Goodburn and Wallace, 2013; Lee and Baek, 2008; Liu et al., 2015a; Meireles et al., 2016). The use of chlorine withminimally processed products has already been prohibited in the Europeancountries of Belgium, Denmark, Germany, and the Netherlands (Meireles et al., 2016; Misra et al., 2014).
Viruses are generally more resistant to sanitation treatments thanpathogenic bacteria (Predmore et al., 2015). Fresh produce washing with200-ppm chlorine, which is effective against most pathogenic bacteria, hasshown little-to-no effect against viral pathogens. Internalization of microbialpathogens into vascular tissues of produce is a serious problem relating totraditional postharvest intervention technologies. Thus, current proceduresfor controlling bacterial infections in foods may not be useful against viralpathogens (Predmore et al., 2015). Hence, there is a global trend forelimination of chlorine from fresh produce disinfection processes (Adhikariet al., 2015). The fresh produce industry is interested in adopting technically

and economically effective chlorine-alternative disinfection technologies tomeet consumer demands for fresh and safe fruit products.
3.2. Heat Pasteurization of Fresh Fruit JuicesFruit juices can be contaminated with pathogenic and spoilagemicroorganisms that can grow and survive under acidic conditions, creatingproblems for processors and consumers (Bayındırlı et al., 2006; Ferrarioet al., 2015). High concentration of sugars and other nutrients in fruit juicessupport the growth of microorganisms. The low pH values of fruit juicesmake juices susceptible to fungal spoilage even under refrigerated storage(Tournas et al., 2006). Some pathogenic strains, such as theEnterobacteriaceae, including certain strains of E. coli and Salmonellaenterica, can adapt to acidic environments (Choi et al., 2012). Hence,pasteurization is necessary to minimize the risk of microbial spoilage andextend the shelf life of fruit juices (Ferrario et al., 2015). Hazards Analysisand Critical Control Point (HACCP) regulations for juices require thatintervention techniques used to prevent biological contamination mustachieve at least a 5-log reduction (99.999%) of pathogen levels for species ofconcern to public health (Choi et al., 2012).
Thermal processing is the most widely used industrial method to achievemicrobial safety and preservation of fruit juices. In general, heat treatment attemperatures <100°C for several seconds (generally 90°C for 1 min) is usedto achieve a 5-log reduction for pathogen levels in fruit juices (Sunget al., 2014). Low-temperature long-time (LTLT) pasteurization and high-temperature short-time (HTST) pasteurization are used in large-scalecontinuous-mode juice production plants (Koutchma et al., 2016). However,despite the effectiveness of thermal processing for preservation of fruitjuices, heat treatment may result in undesirable biochemical and nutritionalchanges in food products, thereby affecting sensory properties. Modernconsumers are increasingly interested in minimally processed fruit productsthat maintain natural quality and freshness. Moreover, consumers aredemanding a product that has not been treated with chemicals. In 2014,almost one-third of consumers in the United States purchased products withno preservatives and approximately the same number purchased foodproducts with no chemical additives (Food Marketing Institute, 2014).

Therefore, food processors strive for production of high-quality foodsdemanded by modern consumers.
4. Potential of Nonthermal ProcessingTechnologies for Safety and Shelf LifeEnhancement of Fresh Fruit and JuiceProductsOver the past few years, industry and academia have been focused ondeveloping innovative technologies as alternatives to conventionalprocessing. Nonthermal food-processing technologies have received attentionfor microbial inactivation and maintenance of safety, quality, and freshness offoods. To this end, high hydrostatic pressure (HHP), pulsed electric fields(PEF), ultraviolet (UV) light, irradiation, microwave, ozone, cold plasma,radiofrequency, infrared, and ohmic heating are attractive preservationtechnologies (Knoerzer, 2016). Recently, UV-assisted TiO2 photocatalysis(TUV) has emerged as a novel technology for surface disinfection of freshfruit as an alternative to chlorine disinfection (Cho et al., 2007; Yooet al., 2015a,b). Jermann et al. (2015) collected response from foodprofessionals in North America and Europe associated with industry,academia, and government to determine current and potential applications ofnovel technologies for commercialization in the following 5–10 years. HHP,microwave, UV, PEF, and radiation were identified as the main technologies.The main drivers for favoring these technologies were higher qualityproducts (94%), product safety (92%), and shelf life (91%). Lee et al. (2015)conducted a large-scale survey in China while taking responses fromconsumers regarding preferences for HHP- and PEF-treated beverages.Generally, the respondents were unbiased and receptive toward HHP andPEF technologies. Romano et al. (2015) reported that HHP processing injuice industry was positively perceived by consumers, indicating HHPpotential applications in the Brazilian industry at a commercial scale.
4.1. High Hydrostatic Pressure

4.1.1. Introduction and mechanism of microbialinactivationHHP, also called high-pressure processing, has shown potential forinactivation of microorganisms in juices, jams, fruit blends, sauces, ready-to-eat meat products, and seafood with minimum impact on sensory andnutritional attributes (Balasubramaniam et al., 2015; Bermúdez-Aguirre andBarbosa-Cánovas 2011; Doona et al., 2016; Georget et al., 2015; Huanget al., 2014a; Knoerzer, 2016; Oey et al., 2008). At present, HHP has becomethe primary processing technology in the “cold-pressed” juice market forpreservation of a fresh flavor and nutritional value of fruit juices as analternative to heat pasteurization. Freshly prepared beverages are placed intoa high-pressure vessel in a final flexible package, such as a bottle, pouch, orbag, and subjected to hydrostatic pressure. Food and final packagingmaterials are treated together so that the entire pack remains a secure unituntil subsequent opening. The shape and integrity of the package remainsunchanged, as the pressure applied is identical on every part of the product(Fig. 7.1).

FIGURE 7.1 High Hydrostatic Pressure (HPP) Processing of FruitJuices. After extraction, juice was put in a bottle (final packaging) andsubjected to HHP treatment. Microorganisms need high pressurelevels for complete inactivation. The shape and integrity of the packageremained unchanged since the applied pressure was identical on everypart of the product. The entire pack remained a secure unit untilopened by consumer.
HHP processing generally involves use of hydrostatic pressures of 100–1,000 MPa (145,000 psi) for periods of 30 s up to several minutes mostlyusing water as a pressure transmission medium at room temperatures,refrigerated temperatures, or mildly elevated temperatures of <60°C todestroy pathogenic and spoilage microorganisms. Due to adiabatic heating,the temperature of the product increases slightly, but not above roomtemperature, then falls quickly (Balasubramaniam et al., 2015).
HHP does not break or create covalent bonds or new compounds viamolecular degradation. Low molecular–weight compounds associated withflavors, colors, and nutritional quality are not influenced under HHP atpressures <2000 MPa due to the inherent stability of covalent bonds.However, biological systems start experiencing intermolecular andintramolecular bond cleavage at pressures >400 MPa (Knorr et al., 2006) thatcan inactivate microorganisms with minimal impact on food chemistry. Thereal taste of freshly squeezed fruit juices is maintained during pressureprocessing. HHP can achieve a 5-log reduction of pathogen levels in

beverages, depending on process parameters. The HHP antimicrobialefficacy is mainly influenced by temperature, exposure time, productparameters, packaging type, and baro-tolerance of a target microorganism.High concentrations of sugars and salts in food products can exert a baro-protective effect against microbial inactivation during HHP (Gohet al., 2007). The product shelf life is multiplied by 3–10 times, comparedwith the same product without HHP under the same storage and temperatureconditions (www.hiperbaric.com). HHP can induce changes in cellmorphology, biochemical reactions, the thermotropic phase in cell membranelipids, and loss of microbial genetic functions (Goh et al., 2007;Patterson, 2005). The sensitivity of microorganisms to HHP treatment is inthe order of: Gram-negative bacteria > yeast/molds > Gram-positivebacteria > spores (Shahbaz et al., 2016b; Yoo et al., 2015b).
4.1.2. Current commercial applications in HHP processingof fruit juicesHHP technology for preservation of fresh juices has received a recent broadcommercial success. Engineering advancements have actually made thistechnology feasible at industrial scales. Currently, more than 200 companiesare using HHP technology in the United States, Spain, Italy, Germany,Switzerland, the United Kingdom, Mexico, Canada, India, South Korea,Japan, New Zealand, and Australia. Examples of some food companies usingHHP technology for production of fruit juices are enlisted in Table 7.1.

Table 7.1
Food companies using HHP technology for production of fruitjuices.
Food Companies CountriesUrban Remedy, RIPE Craft Juice, Evolution Fresh, Lumi Juice, Hain Celestial,
Suja Life, Fresh Promise Foods, Juiced Juice, Liquiteria, FreshbevUnited States
Rhythm Health, Fruitapeel, Innocent, Coldpress Foods UnitedKingdom
Pulmuone, Organica, Hyungkuk F&B South Korea
INVO Agua de Coco, Avomix Spain
Fruity Line TheNetherlands
Raw Presser India
Beskyd Fryčovice, UGO CzechRepublic
Ulti France
Preshafood, Urban Remedy, Inside Out Nutritious Goods Australia
HHP-treated juice products are currently available on supermarket shelvesin many countries (Fig. 7.2) (Knoerzer, 2016; www.hiperbaric.com).Hiperbaric (United States), Multivac (United States and Germany), BaoTouKeFa HPP (China), and Avure Technologies (United States and Sweden) arethe major suppliers of HHP commercial scale equipment. HHP equipment isavailable in both vertical and horizontal configurations. Hiperbaricintroduced the company’s largest HHP system in 2013, the Hiperbaric 525,with a capability to achieve throughputs of 3000 kg/h (or 3000 L/h) ofpackaged food or beverages (www.hiperbaric.com). Avure Technologieslaunched the first expandable HHP machine that allows for future expansiondependent on production capacity needs from 40 million pounds to 70million pounds of output per year (www.avure-hpp-foods.com). Visiongainforecasts that in 2016, the HHP food market will be worth 11.03 billion USDand the HHP equipment market will have a value of 0.47 billion USD(Visiongain, 2016). Consumers from countries, such as the United States, theUnited Kingdom, and Australia, are more positive toward HHP than theconventional processing technology of heat pasteurization due to improved

food safety and product quality, and environmental benefits associated withHHP technology. European consumers from Hungary, Slovenia, Slovakia,Serbia, Norway, and Denmark responded positively to the words “high–pressure processing” (Lee et al., 2015; Mireaux et al., 2007; Nielsen et al., 2009) (Fig. 7.3).
FIGURE 7.2 Some Examples of HPP “Cold-Pressed” CommercialJuice Products.

FIGURE 7.3 Scanning Electron Microscopy Images of DifferentBacteria Inactivated Using Different Nonthermal ProcessingTechniques. E. coli K-12 treated with UVC light for 6 min at 560 mJ/cm2, untreated(A) and UVC treated (B); Penicillium expansum treated with PEFs at30 kV/cm, untreated (C) and PEF treated (D); and Staphylococcusaureus treated with HHP at 350 MPa for 10 min at 30°C, untreated (E)and HHP treated (F). Highly deformed cell morphologies and cellcompression can be seen in treated cells. From Evrendilek, G.A., Tok, F.M.,Soylu, E.M., Soylu, S., 2008. Inactivation of Penicillum expansum in sour cherry juice,peach and apricot nectars by pulsed electric fields. Food Microbiol. 25 (5), 662–667; Tarek,

A.R., Rasco, B., Sablani, S.S., 2016. Ultraviolet-C light sanitization of English cucumber(Cucumis sativus) packaged in polyethylene film. J. Food Sci. 81 (6), E1419–E1430; Wang,L., Pan, J., Xie, H., Yang, Y., Lin, C., 2010. Inactivation of Staphylococcus aureus andEscherichia coli by the synergistic action of high hydrostatic pressure and dissolved CO2.Int. J. Food Microbiol. 144 (1), 118–125.
4.1.3. Recent research trends in HHP processing of fruitjuicesSeveral innovative approaches for enhanced microbial reduction in fruitjuices have been applied (Table 7.2). Chen et al. (2015a) compared theefficiency of HHP and HTST for treatment of a papaya beverage. HHP at550 MPa for 5 min and HTST at 110°C for 8.6 s inactivated total aerobicbacteria and yeast/molds and ensured microbiological safety of the beverageduring 40-day storage at 4°C. However, better retention of physicochemicaland sensory properties in the beverage were obtained using HHP treatment.Varela-Santos et al. (2012) reported that HHP ≥350 MPa for 150 s wassufficient to reduce levels of naturally occurring spoilage microflora inpomegranate juice to “undetected” and to extend the juice shelf life to morethan 35 days during storage at 4°C. Kaushik et al. (2014) used HHPtechnology to obtain high-quality and safe mango pulp. Effects of differentpressures levels, such as 100–600 MPa for 1 s to 20 min at ambienttemperature, were evaluated on biochemical properties and inactivationkinetics of natural microflora in fresh mango pulp. HHP at 600 MPa for5 min effectively inactivated indigenous microflora in fresh mango pulp andresulted in moderate changes in the pulp quality. HHP-treated pulp retained85% of original ascorbic acid, 92% of total phenolics contents, and 90% ofantioxidant capacity (Kaushik et al., 2014).

Table 7.2
HHP processing for inactivation of pathogenic microorganismsin fruit juices.
ProcessingConditions Juices Microorganisms
LogReductions References
400 MPa,3 min,25°C
Orange juice E. coli O157:H7 6.5 Torres et al.(2015)
600 MPa,1 min,25°C
Clarified applejuice
Bacteria and yeast No completeinactivation
Shahbaz et al.(2016b)
500 MPa,10 min
Red grapefruitjuice
Total plate count andyeast/molds
4.83 and 4.14;microbialstability during30 days storageat 4°C
Gao et al.(2015)
TUVcombinedwith 500MPa,1 min,25°C
Clarified applejuice
L. monocytogenes, S.aureus, SalmonellaTyphimurium,Saccharomycescerevisiae
Completeinactivation bysynergisticeffect
Shahbaz et al.(2016b)
400 MPa,10 min,25°C
Mango juice E. coli O157:H7 6 Hiremath andRamaswamy(2012)
600 MPa,10 min,75°C
Apple juice Neosartorya fischeriascospores
3 Evelyn et al.(2016)
464 MPa,12.8 min,54.61°C
Hami melonjuice
Bacillus subtilis spores 5; experimentalvalues were ingood agreementwith predictedvalues by RSM
Chen et al.(2015b)
300 MPa,15 min,50°C
Apple juice Alicyclobacillusacidoterrestrisspores
3.7 Porębska et al.(2016)
350 MPa,5 min,40°C
Apple, orange,apricot, andsour cherryjuices
S. aureus, E. coliO157:H7, S.enteritidis
Completeinactivation
Bayındırlı et al.(2006)

ProcessingConditions Juices Microorganisms
LogReductions References
550 MPa,20 min,20°C
Apple juice E. coli O157:H7 5 Espina et al.(2013)
600 MPa,7 min,25 °C
Squeezedorange juice
L. monocytogenes >5 Dogan andErkmen(2004)
402 MPa,3 min,31.8 °C
Grapefruit juice Total plate count andyeast/molds
No microbialgrowth during28-day storageat 4°C
Uckoo et al.(2013)
400 MPa,5 min,20°C
Cloudypomegranatejuice
Yeast/molds and totalaerobic bacteria
Completeinactivation;inactivation ofmicroorganismsfitted Weibullmodel
Chen et al.(2013)
600 MPa,1 min andHTST110°C, 8.6s
Mango nectar Naturalmicroorganisms
Significantreduction andmicrobialstability during16-week storageat 4 and 25°C
Liu et al. (2014)
300 MPa,5 min, 0°C,–10°C,20°C
Kiwifruit andpineapplejuices
E. coli and Listeriainnocua
Effective bacterialinactivationpossible at roomtemperature
Buzrul et al.(2008)
400 MPa,3 min,25°C
Orange juice E. coli O157:H7 6.5 Torres et al.(2015)
450 MPa,2 min,21 °C
Strawberrypuree
E. coli O157:H7 Completeinactivation
Huang et al.(2014a)
175–400 MPa,20 min,combinedwithessentialoils
Orange andapple juice
Salmonella spp., E.coli O157:H7
5 Espina et al.(2013)

ProcessingConditions Juices Microorganisms
LogReductions References
400–600 MPa,8 min,combinedwithenterocinAS-48
Cherimoya fruitpulp
Leuconostoc spp. HHP alone onlyinactivatedLeuconostoc;combinedtreatmentshowed aprotective effectduring storage
Toledo delÁrbol et al.(2016)
HTST, High temperature short time; RSM, response surface methodology; TUV, UV-assistedTiO2 photocatalysis.
Optimization of pressure–time conditions can be an important factorduring HHP for maximum retention of nutrients in fruit juices. Jayachandranet al. (2015) evaluated the effect of hydrostatic pressures of 200–600 MPa at30–70°C for 0–20 min on the physicochemical properties and bioactivecomponents of a newly formulated mixed fruit beverage prepared from litchijuice, coconut water, and lemon juice. In general, the physicochemicalproperties of the mixed fruit juice remained unaffected after HHP treatment.Equivalent HHP treatments at 500 MPa at 70°C for 20 min, and 600 MPa at60°C for 15 min resulted in better retention of nutritional quality attributes injuices, compared with heat-pasteurized juices. In Valencia orange juice, a 5-log reduction of the Salmonella level was achieved at 369, 25, and 5 s at 300,450, and 600 MPa, respectively, indicating correlation of time and theapplied pressure level. Mathematical modeling was carried out for predictionof the time to inactivation as a function of both pressure and the inoculumlevel. Modeling would be useful for the juice industry in selection ofprocessing criteria for an appropriate performance of HHP technology (Bullet al., 2005).
Bacterial spores are harder to inactivate by pressure-alone treatment. Apronounced synergy has been observed for spore inactivation when pressureand temperature are combined, compared to thermal processing alone(Evelyn et al., 2016; Gao et al., 2015; Porębska et al., 2016; Reineke et al., 2013; Terefe et al., 2016). HHP has been used for inactivation ofspores and quality-degrading enzymes in fruit products. Park et al. (2013)studied the efficacy of combined pressure, heat, and electrical treatments forinactivation of resistant spores in low-acid shelf-stable foods. This

sterilization process, called pressure–ohmic–thermal sterilization, was usedfor inactivation of Bacillus amyloliquefaciens and Geobacillusstearothermophilus endospores. Combination of treatments resulted insynergy for inactivation of pressure–thermal resistant bacterial spores.Olivier et al. (2011) found that high pressure combined with thermalprocessing at elevated temperatures of >60°C has potential for inactivation ofbacterial spores to produce microbiologically safe and stable low-acid foodproducts. Pressure and temperature integration was found to be useful forinactivation of quality deteriorative enzymes. Bayındırlı et al. (2006)observed that pressure levels higher than 400 MPa combined with mild heatat <50°C for 60 min accelerated polyphenol oxidase (PPO) inactivation inapple juice. Inactivation was irreversible and the enzyme remained inactiveduring storage. However, the processing time required for inactivation ofenzymes was much longer than the time required for inactivation of bacteriain acid juices. HHP was recommended for combination with mild heat toaccelerate enzyme inactivation in fruit juices. HHP effectiveness for controlof quality-degrading enzymes in horticultural products has also beenreviewed (Chakraborty et al., 2014; Terefe et al., 2014). PPO, peroxidase(POD), and pectin methylesterases (PME) are highly resistant to HHP andonly partially inactivated under commercially feasible conditions.
A review of studies by Koutchma et al. (2016) revealed that to achieve a4–5 log reduction in total microflora levels in juices, a commercial pressurelevel of 600 MPa was required. However, in commercial HHP operations,high pressure levels of >500 MPa with prolonged holding times duringrepeated process cycles are hard to achieve. HHP operations at such a highpressure level can lead to wear and tear on equipment, power and laborexpenses, and maintenance costs (Chen and Hoover, 2003; Hygreeva andPandey, 2016; Koutchma 2012; Pavoni et al., 2015). In addition, intensetreatment under high pressure can possibly cause deterioration of somequality attributes of food products. Hence, commercial HHP treatments mustbe kept at low pressures for commercial feasibility (Ye et al., 2015).
One limitation of HHP is the batch or semicontinuous process. Anothermajor obstacle to increase adoption of HHP processing is the equipment cost.The price of HHP units is generally higher than conventional pasteurizers.However, technological development has brought equipment costs down andmade HHP technology commercialization feasible. Innovation in HHP

equipment and wider availability of toll-processing facilities for HHPprocessing are anticipated to reduce costs in the future (McHugh andKingsley, 2016).
4.2. Pulsed Electric Fields4.2.1. Introduction and mechanism of microbialinactivationPEF technology is a potential alternative to thermal pasteurization formicrobial inactivation in liquid foods without significantly affecting flavor,color, and nutrients (Caminiti et al., 2011; Evrendilek et al., 2008; Mosqueda-Melgar et al., 2008; Sampedro et al., 2013). In a PEF process, food samplesare placed between two electrodes and treated with short pulses (<1 s) withhigh-intensity electric field (generally 20–80 kV/cm). The electric impulsescan be applied homogeneously through a product. Exposure times are shorter(1–10 μs) during PEF processing of foods than for other nonthermaltechnologies. Another advantage is that PEF can be used as a batch orcontinuous flow process but products need to be packed aseptically aftertreatment. The effectiveness of PEF processing to inactivate microorganismsmainly depends on electrical field strength and treatment time (Rasoet al., 2014).
PEF treatment inactivates microorganisms via electroporation of bacterialmembranes resulting in the formation of large, permanent pores in cellulartissues, leading to leakage of intracellular contents (Gurtler et al., 2010). PEFhas shown a demonstrated ability to inactivate the pathogenicmicroorganisms L. innocua, E. coli O157:H7, E. coli 8739, and S.Typhimurium in fluid foods (Mosqueda-Melgar et al., 2008). Generally,yeast/molds are relatively sensitive to PEF treatment (Buckow et al., 2013).However, PEF does not inactivate most enzymes and treated juices still haveto be refrigerated. PEF treatment extends the refrigerated shelf life of freshjuice from 6–7 days to 21 days while retaining the fresh taste and nutrition(Hartyáni et al., 2011; Vervoort et al., 2011).
4.2.2. Commercial developments in PEF processing offruit juices

Commercial applications of PEF technology are mainly focused onpasteurization of heat-sensitive foods, such as fruit juices and smoothies.Transition from lab- and pilot-scale equipment to industrial-scale equipmentoccurred for PEF technology during recent years (Timmermans et al., 2016).The first commercial application of PEF was launched in the United States in2006 for fruit juice processing. In Europe, the first commercial PEF juicepreservation line was launched in 2009 with 1500-L/h processing capacity.PEF was applied in orange juice at an initial temperature of 40°C under20 kV/cm field strength resulting in a final temperature of <60°C and a 5-logreduction in the total bacteria count. At present, PEF-treated fruit juices andsmoothies are available on commercial market shelves in Germany, theNetherlands, and the United Kingdom (Buckow et al., 2013). One reason forlow implementation of PEF technology at industry might be the lack of acomprehensive processing cost analysis. A large-scale commercial PEFsystem was designed by Sampedro et al. (2013). Total pasteurization cost wascalculated based on processing conditions to meet the US FDA 5-logreduction requirement for pasteurization of fruit juices in comparison to heattreatment. PEF processing total cost was estimated to be 3.7 ¢/L which was2.2 ¢/L more than that of conventional heat processing (Sampedroet al., 2013).
Pulsemaster (United States, the Netherlands) has developed industrial-scale PEF equipment for the food and beverage industry with a treatmentcapacity of 5000 L/h. Elea, in conjunction with DIL (Germany), has installedPEF systems in food production lines. Other PEF equipment manufacturersare Steribeam (Germany), Scandinova (Sweden), and PurePulse (theNetherlands), indicating a growing interest in the food industry forapplication of PEF technology. Hoogesteger and Fruity Line are the leadingfresh juice producers in the Netherlands using PEF technology in commercialoperations for a wide range of fresh fruit juices (Buckow et al., 2013).
4.2.3. Recent research trends in PEF processing of fruitjuicesAdvanced applications of PEF technology in fruit juice processing aresummarized in Table 7.3. PEF applications were compared with thermalpasteurization in orange juice processing. PEF better preserved orange juicequality than heat pasteurization during storage for 180 days at 4°C. Quality

attributes in orange juice, in particular the ascorbic acid content, were notaffected by mild PEF treatment. PEF processing extended the shelf life oforange juice as much as heat processing did, but with better retention ofquality parameters (Agcam et al., 2016). Timmermans et al. (2011) evaluatedthe comparative effects of mild heat pasteurization, HHP, and PEF onprocessing of freshly squeezed orange juice during storage for 2 months.Microbial counts in treated juice were reduced to below the detection limitimmediately after processing and no microbial growth was observed duringrefrigerated storage for 2 months. Quality parameters of juice were notsignificantly different after all treatments and remained unchanged duringstorage. Viscosity and cloud stability in juices were dependent on specificprocessing treatment and comparable results were found for HHP and PEF,except for cloud degradation. For HHP processing, a lower cloud degradationrate was observed. For PEF processing, residual enzyme activity was clearlyresponsible for changes in viscosity and cloud stability during storage.

Table 7.3
Pulsed electric fields (PEF) processing to inactivate pathogenicmicroorganisms in fruit juices.
ProcessingConditions Juices Microorganisms
LogReductions References
PEF continuous-flow system
Apple–strawberry–bananasmoothie
Yeast and molds Untreatedsmoothiesspoilage after8 days; PEF-treatedsmoothiespoilage after14 days at7°C and 18days at 4°C
Timmermanset al. (2016)
PEF Grape juice S. aureus, E. coliDH5α, and S.cerevisiae
E. coli was themostresistant;Weibullmodelssuccessfullypredicted theinactivationcurves
Huang et al.(2014b)
PEF incombinationwith lauroylethylester
Apple juice SalmonellaTyphimurium
>7 Saldaña et al.(2011)
PEF incombinationwith highintensity lightpulses
Apple juice E. coli K12 5 Caminiti et al.(2011)
PEF continuous-flow system
Apple, orange,andwatermelonjuices
Salmonella Panama,E. coli, L.monocytogenes,and S. cerevisiae
A synergisticeffectbetweentemperatureand electricpulses >35°C
Timmermanset al. (2014)

ProcessingConditions Juices Microorganisms
LogReductions References
High-intensityPEFcombinedwith naturalantimicrobials
Strawberry,apple, andpear juices
E. coli O157:H7, S.enteritidis, and L.monocytogenes
>5 Mosqueda-Melgar et al.(2008)
PEF benchscale/13–34 kV/cm,62–218 μs
Sour cherryjuice, peachand apricotnectars
Penicillium expansumspores
A completeinhibition ingerminationtubeelongationand sporegerminationrate with anincrease inelectric fieldstrength andprocessingtime
Evrendilek et al.(2008)
PEF and juicestorage inPET bottlescoated withpotassiumsorbate andsodiumbenzoate
Pomegranatejuice
Total aerobic bacteriaand yeast/molds
Shelf life over84 days
Jin et al. (2014)
Carvacrolcombinedwith PEF
Apple, mango,orange, andtomatojuices
E. coli O157:H7 5 Ait-Ouazzouet al. (2013)
PEF and UVcombinedtreatment
Apple juice Native microbial flora 7.1 Noci et al.(2008)
PEF with 750-ppm sodiumbenzoate and350-ppmpotassiumsorbate
Strawberry juice E. coli O157:H7 andSalmonellaenteritidis
5.11 Gurtler et al.(2011)

ProcessingConditions Juices Microorganisms
LogReductions References
UV or high-intensity lightpulses high-intensity lightpulses,followed byPEF
Apple andcranberryjuice blend
E. coli and Pichiafermentans
6; extended shelflife of 14days by UV–PEF and 21days byHILP–PEF
Palgan et al.(2011)
Timmermans et al. (2014) evaluated use of a continuous-flow PEF systemoperated at an electrical field strength of 20 kV/cm with variable frequenciesfor inactivation of Salmonella Panama, E. coli, L. monocytogenes, and S.cerevisiae in apple, orange, and watermelon juices. S. cerevisiae was found tobe the most sensitive microorganism while L. monocytogenes was the mostresistant microorganism to PEF treatment under the same processingconditions. Furthermore, inactivation of microorganisms was dependent onpH, the type of microbial species, and the inlet temperature of the matrixduring PEF processing of fruit juices.
PEF processing alone may not provide a sufficient juice shelf life expectedby juice processors. PEF processing can be optimally used in combinationwith other antimicrobial interventions (Jin et al., 2014). PEF combined withantimicrobial packaging was used for extension of the shelf life ofpomegranate juice as a model. Pomegranate juice was treated with PEF inboth lab- and pilot-scale systems and subsequently packed in simple PETbottles or PET bottles coated with potassium sorbate and sodium benzoate.Juices were stored at 4°C for 84 days and evaluated for total aerobic bacteriaand yeast/molds at 7-day intervals. Untreated juice had a shelf life of lessthan 1 week, while untreated juices stored in antimicrobial bottles had a shelflife of 56 days. Juices treated with PEF alone had a shelf life of 21 days on abench-scale equipment and over 84 days on a pilot-scale equipment. Juicestreated with PEF followed by storage in antimicrobial bottles had a shelf lifeover 84 days for both scale equipment. Use of a large-scale PEF system inconjunction with antimicrobial packaging may provide processors a novelapproach for enhancing the safety and shelf life of fresh juices (Jinet al., 2014). PEF treatments at low temperatures of 45, 50, and 55°C wereapplied both with and without sodium benzoate, potassium sorbate, and citricacid preservatives in strawberry juice inoculated with E. coli O157:H7

(ATCC 43895) and nonpathogenic E. coli (ATCC 35218). Addition ofpreservatives induced sublethal injury and enhanced the PEF inactivationefficiency (Gurtler et al., 2011). Noci et al. (2008) reported that UV inconjunction with PEF achieved satisfactory microbial safety andimprovement in product quality of freshly squeezed apple juice as analternative to heat treatment.
Effects of PEF processing parameters, such as electric field strength, pulsefrequency, and treatment time, was investigated against a mixture ofmicroorganisms in grape juice (Marsellés-Fontanet et al., 2009). Optimalmicrobial inactivation was predicted based on response surface methodology(RSM). A higher level of inactivation was experimentally achieved for yeastthan for bacteria while the same inactivation level was mathematicallypredicted using RSM. Microbial inactivation was influenced by all studiedparameters. RSM can be potentially used in the fruit juice industry tooptimize PEF treatment conditions for microbial inactivation. Sampedro et al.(2009) examined the effect of PEF and heat pasteurization on PMEinactivation in orange juice–based beverage. PEF treatment achieved a highdegree of PME inactivation with better preservation of the natural aroma inbeverage than thermal processing. PEF treatment can be applied to achieve alevel of PME inactivation similar to thermal processing. In another study,PEF-treated orange juice showed cloud stability during storage comparable toheat pasteurized juice produced using a pilot-scale system (Buckowet al., 2013).
Moody et al. (2014) evaluated the potential of PEF, HHP, and ultrasoundnonthermal technologies to achieve the required 5-log reduction FDAstandard for alternative pasteurization methods. The inactivation of E. coliwas studied in apple juice at selected treatment conditions, and lethal surfaceand internal damage was studied using SEM and TEM images. A gooddegree of inactivation (7 log) was achieved in almost all the tested treatmentswith a slight change in juice color. Microbial inactivation rate was fastest byHHP followed by ultrasound and PEF. Weibull and Fermi equations wereable to fit the survivor’s curve for PEF, HHP, and ultrasound with a verygood correlation.
Vervoort et al. (2011) compared the efficiency of PEF (2 μs, 23 kV/cm,90 Hz), HHP (600 MPa for 1 min), and thermal (72°C for 20 s) treatments toinactivate PME and POD enzymes in orange juice using pilot- and industrial-

scale systems. None of these treatments was capable for completeinactivation of PME. Heat pasteurization and HHP were effective in limitingthe residual activity. POD was completely inactivated by heat pasteurizationand showed less susceptibility to HHP and PEF treatments.
4.3. Ultraviolet Light4.3.1. Introduction and mechanism of microbialinactivationUVC light between 250 and 270 nm has exhibited germicidal effects againsta wide range of pathogenic and food spoilage microorganisms, includingbacteria, viruses, protozoa, yeast/molds, and algae (Bintsis et al., 2000;Koutchma, 2009; Sommers et al., 2016). DNA is the primary target duringUV treatment of microorganisms and inactivation is caused by cross-linkingof pyrimidine dimers in DNA that prevents microbial reproduction. The mosteffective UV wavelength is 253.7 nm (UVC) due to maximum absorption ofUV photons by genetic materials of microorganisms at this specificwavelength (Koutchma, 2009). UV processing has gained popularity across awide spectrum of food and beverage industries. In the food industry, UVCtechnology is mainly used for products that will be used immediately afterprocessing, such as for processing of water, surface disinfection of freshproducts, meat products, liquid foods, and air disinfection of meat andvegetables (Falguera et al., 2011). The efficiency of UV light is dependent onreactor design, the UV intensity, the fluid flow rate, food composition,microorganism type, and growth phase of the microorganism (Begum et al., 2009; Caron et al., 2007; Koutchma, 2009). The US FDA has approvedUVC treatment to reduce levels of human pathogens and othermicroorganisms in juice products. UV light is an environmentally friendlytechnology with low equipment, energy, and maintenance costs. The rise inthe use of UV technology is mainly due to the fact that oxidation productproduction is greatly reduced, compared with chlorination and ozonationprocesses. Furthermore, UV treatment does not alter the chemicalcomposition, taste, or odor of a food product and does not leave any residueon a food product (Guerrero-Betrán and Barbosa-Cánovas, 2005; Koutchma, 2009; Shamsudin et al., 2014).

4.3.2. Innovative approaches to enhance the efficiency ofUV processing of fruit juicesThe main limitation of UV light for fluid treatment is a low penetrationpower, which is determined by the characteristics of a target fluid. Colorpigments, organic solutes (sugars and organic acids), and suspended matter injuice products increase absorption and reduce transmission of UV light,thereby limiting industrial applications to achieve the required 5-logreduction level (Koutchma, 2009). In a study, a clear grape juice and a turbidgrape juice were subjected to UV treatment using a pilot-scale continuousflow UV system. The clear juice was more effectively treated using UVCthan freshly squeezed turbid juice because the turbid juice contained a largeamount of suspended solids that cause a shadowing effect, resulting in lowpenetration of UV light that allows microorganisms to survive during UVCtreatment. Physicochemical quality parameters of grape juice generallyremained unaffected after UVC treatment (Kaya and Unluturk, 2016).Different types of UV reactors have been introduced to improve theeffectiveness of UV processing (Table 7.4).
Table 7.4
UV reactors of different types to enhance the effectiveness of UVprocessing.
Design Approaches Reactors CompaniesThin-film flow for liquid foods CiderSure FPE Inc., New York
Taylor–Couetteflow
Forney and Pierson (2003)
Increasing of the turbulence within a UVreactor
Aquionics Hanovia Ltd., United Kingdom
SurePure SurePure Inc., South Africa
Dean flow Salcor Inc., California
UVivatec Bayer Technology Services,Germany
Source: From Kaya, Z., Unluturk, S., 2016. Processing of clear and turbid grape juice by acontinuous flow UV system. Innov. Food Sci. Emerg. Technol. 33, 282–288; Koutchma, T.,2009. Advances in ultraviolet light technology for non-thermal processing of liquid foods. FoodBioprocess Technol. 2 (2), 138–155.

Current research has focused on development of intelligent hurdletechnologies based on integration of UVC with other nonthermaltechnologies or conventional treatments, including mild heat (Goumaet al., 2015a,b). Innovative strategies used to enhance the effectiveness of UVlight against microorganisms in juice preservation are shown in Table 7.5.Combined application of UV with mild heat (UV-H) was proposed byGouma et al. (2015a) who investigated the temperature effect on UVinactivation kinetics using the pathogens E. coli, S. Typhimurium, L.monocytogenes, and S. aureus in apple juice. Mathematical models weredeveloped for each microorganism for prediction of UV-H inactivation atdifferent treatment temperatures. UVC inactivation was significantlyenhanced between treatment temperatures of 50–60°C; however, thethermodependency of UV-H resistance differed among microbial species. E.coli was the most UV-H–resistant microorganism in a treatment temperaturerange of 44–54°C. This combination of UVC and mild heat allowed areduction in the UV dosage and treatment times from 49.6% to 89.1%,compared with UVC treatments at room temperature. Gabriel and Nakano(2009) determined inactivation rates of UV light (220–300 nm) and heatpasteurization at 55°C against E. coli K-12 and E. coli O157:H7, S.enteritidis, S. Typhimurium, and L. monocytogenes AS-1 and L.monocytogenes M24-1 in phosphate-buffered saline and in apple juice.Variations were observed in inactivation rates between species and strains.Inactivation rates also varied with the suspension medium and the mode ofinactivation.

Table 7.5
Innovative approaches for effective decontamination of fresh fruitsurfaces and juice products using UV light.
TreatmentConditions
FreshFruits/Juices
TargetMicroorganisms
LogReductions References
A water-assistedUV system
Blueberry E. coli O157:H7 5.2 in spot-inoculatedberries and1.6 log indip-inoculatedberries
Liu et al. (2015a)
UVC withmodifiedatmospherepackaging at4°C storage
Cherry tomato S. Typhimurium Significant Choi et al. (2015)
UVC withantimicrobialsolutions
Plum tomato S. enterica 4.71 Mukhopadhyayet al. (2015)
UVC with low-dose gammairradiation at0.75 kGy
Grape tomato E. coli O157:H7, S.enterica
>5 Mukhopadhyayet al. (2013)
UVC Apple, pear,strawberry,red raspberry,andcantaloupefruit surfaces
E. coli O157:H7,Listeriamonocytogenes
Higherinactivationfor fruitswithsmoothsurfacescomparedto fruitswith roughsurfaces
Adhikari et al.(2015)
UVC in a coiltube reactor
Watermelon juice Bacteria andyeast/molds
50 and 30% Feng et al. (2013)
UVC with“DeanVortex”technology
Pineapple juice S. Typhimurium 5 Mansor et al.(2014)

TreatmentConditions
FreshFruits/Juices
TargetMicroorganisms
LogReductions References
A newlydesignedannular flowUV system
Freshly squeezedturbid whitegrape juice
E. coli K-12 5.34 Unluturk andAtilgan (2015)
UVC combinedwith mildheat at 45–60°C
Apple juice Yeasts Synergisticinactivationbetween52.5 and57.5°C
Gouma et al.(2015b)
UVC combinedwith sodiumbenzoate
Peach nectar Aspergillus niger 5; microbialstability upto 15 daysat 25°C
Flores-Cervanteset al. (2013)
UVC combinedwithultrasonics
Orange juice E. coli O157:H7 >3.5 Gabriel (2015)
Threewavelengthsof UV light
Apple juice E. coli O157:H7 2.81 withfar UV
1.83 withfarUV+
1.95 withUVC
Yin et al. (2015)
The effect of repetitive UV processing (two cycles, UV-UV) and thecombined effect with the dimethyl dicarbonate antimicrobial agent (UV-UV-DMDC) were investigated for microbiological stability and physicochemicalproperties in pineapple juice (Shamsudin et al., 2014). UV-UV showed a lowmicrobial reduction level of <2 log in the total plate count, and a 1.4-logreduction in the yeast/molds count, perhaps due to the presence of fibers andparticles in juice that blocked UV penetration. On the other hand, acomparatively higher level of microbial inactivation was achieved inpineapple juice when DMDC was added following UV cyclic treatment. UV-UV-DMDC showed much better microbial reduction levels of 2.61 log in thetotal plate count and 4.87 log in the yeast/molds count due to a combinationeffect of UV with additives. In addition, loss in the vitamin C contentoccurred under UV treatment. These treatments were insufficient to achievemicrobial reduction as required by the US FDA. Higher UV dosages were

suggested to achieve higher microbial reduction levels (Shamsudinet al., 2014).
The efficiency of a UV irradiation system is dependent on processengineering aspects. Feng et al. (2013) reported use of a helically woundTeflon coil UVC reactor for microbial inactivation in watermelon juice. Asecondary eddy flow effect was achieved for liquid flow in a coiled tube.Such types of liquid flow generate secondary vortices, allowing radical fluidmixing even in a laminar flow field and promoting maximum UV exposurefor all elements in a liquid (Dean 1927; Müller et al., 2011). Application ofUVC in this coiled tube reactor caused shelf life stability and betterpreservation of physicochemical quality in watermelon juice during storage(Feng et al., 2013). Shahbaz et al. (2017) reported use of UVC light in asimilar coiled tube reactor followed by HHP at 400–500 MPa at 25°C for1 min for control of lactic acid bacteria growth in dongchimi juice. The UV-HHP combined treatment inhibited bacterial growth via a synergistic effectand maintained a characteristic product quality during room temperaturestorage. Sensory analysis produced a higher consumer preference fornonthermally treated juices over untreated and heat-treated juices. A synergyeffect existed between UV and HHP that can be helpful for preparation offermented vegetable products.
4.3.3. Innovative approaches to enhance the efficiency ofUV disinfection of fresh produceUVC light is a novel method for surface disinfection of fresh produce. UVCprocessing helps to maintain the integrity and texture of fruit with soft anddelicate surfaces by eliminating a need for mechanical brushing (Adhikariet al., 2015). However, the shadowing effect has limited industrialapplications of UV disinfection for fruits. Microorganisms attached to roughfood surfaces or hidden in crevices are difficult to target using UVC. Forexample, complex fruit surface characteristics, such as for berries, areobstacles to commercial disinfection of fruit using UVC. Moreover, whenUV light is applied to fresh fruit in a processing line, not all parts of the fruitwill be directly exposed to UV treatment as fruit would be rolling on aconveyer belt (Lim and Harrison, 2016).
Novel approaches for effective decontamination of fresh fruit surfaceshave been proposed (Table 7.5). A water-assisted UV system was introduced

for microbial inactivation on fresh blueberries in both small- and large-scaleexperiments (Liu et al., 2015b). Blueberries were inoculated with the murinenorovirus (MNV-1) onto the blueberry skin and the calyx and subjected todry UV treatment (direct UV light) or water-assisted UV treatment, that is,blueberries immersed in agitated water for UV treatment. The effect ofblueberry juice (2% v/v) or crushed blueberries (5% w/w) addition to washwater was also evaluated. Water-assisted UV treatment generally produced ahigher efficacy than dry UV treatment. MNV-1 on blueberry skin was easierto inactivate than on blueberry calyx. UV treatment of skin- and calyx-inoculated blueberries reduced MNV-1 infectivity levels by 3.2 log and 1.8log, respectively. Hidden viral particles in the subsurface of the calyx couldbe protected from UV exposure. Blueberry juice in wash water lowered theefficiency of UV treatment. Water-assisted UV treatment was suggested forwashing the blueberries and potentially other fresh produce alternative tochlorine disinfection (Liu et al., 2015b).
In the past decade, research into UV processing has been focused onhurdle technologies to achieve higher microbial reduction levels (Choi et al., 2015; Gabriel, 2015; Mukhopadhyay et al., 2015; Santhirasegaram et al., 2015; Sommers et al., 2010). Choi et al. (2015) reported combined use ofUVC and active modified atmosphere packaging as a hurdle technology forimprovement of the microbial safety and quality of cherry tomatoes. S.Typhimurium populations were significantly reduced under this combinedtreatment during storage at 4°C. Mukhopadhyay et al. (2015) reported anintegrated treatment using UVC with an antimicrobial wash for tomatoesagainst S. enterica as a safe and effective postharvest treatment alternative tochlorine disinfection.
UV-damaged microorganisms regaining viability due to possiblephotoreactivation or dark repair is an important aspect of UV processing.Photoreactivation may result in serious food safety issues. Lim and Harrison(2016) observed no photoreactivation in UVC-treated Salmonella ontomatoes. UVC light was suggested for application in tomato-handlingfacilities to reduce levels of Salmonella. In contrast, Hu et al. (2012) foundthat S. Typhimurium, Shigella dysenteriae, and E. coli were able tophotoreactivate at different rates after UV treatment in different water types.
Enzymatic browning is the single largest cause of quality loss in fresh fruitand juice products. Polyphenol and PPO enzymes are responsible for

enzymatic browning. Browning is a significant issue in the food industrybecause food color influences consumer purchasing decisions. Lante et al.(2016) reported that UVA treatment was successful for controlling enzymaticbrowning on fresh-cut apples and pears without affecting the organolepticproperties of the fruit. A review of studies conducted by Koutchma et al.(2016) found that UV effectively preserved the quality and nutritionalattributes of juices than thermal pasteurization. UV processing does not posenutritional safety concerns when used at dosages required to achieve a 5-logreduction level in pathogenic organisms. Furthermore, correct alignment ofthe UV source and other system parameters are important for successfulapplication of UV processing.
4.4. UV-Assisted TiO2 Photocatalysis (TUV)
4.4.1. Historical applications of TUV and working principleTUV is a well-established technique for water treatment (Hashimoto et al., 2005; McCullagh et al., 2007; Thiruvenkatachari et al., 2008). In recentyears, TUV has emerged as a potential method for inactivation ofmicroorganisms in foods with minimal impact on quality attributes. The basicworking principle of TUV technology is photocatalytic production ofhydroxyl radicals that result in inactivation of microorganisms. TUVtechnology has an ability to deactivate a broad spectrum of microorganisms,including bacteria, spores, fungi, and viruses (Chen et al., 2010; Longet al., 2014; Ramesh et al., 2016; Shahbaz et al., 2016b; Srinivasan andSomasundaram, 2003; Yemmireddy and Hung, 2015; Yoo et al., 2015a,b).
TiO2 is a widely used semiconductor photocatalyst because it is an inert,nontoxic, photochemical stable, comparatively cheap, and environmentallyfriendly compound (Yemmireddy and Hung, 2015). TiO2 exists naturally inthe three different crystal forms of rutile, anatase, and brookite. Anatase andrutile tend to be the most photocatalytic active and stable forms of TiO2.Differences in photocatalytic abilities might be due to electronic andchemical characteristics. The anatase form has industrial applications as anadditive in foods and pharmaceuticals. Studies suggest that a mixture ofanatase and rutile would be best for achieving a maximum photocatalyticdisinfection efficiency. Several commercial varieties of TiO2 varying in

particle size and purity have been studied for determination of thephotocatalytic activity, including Degussa P25 grade, which is a mixture of70% anatase and 30% rutile. Degussa P25 exhibited a better degradationefficiency than other forms (Bonetta et al., 2013; Thiruvenkatachari et al., 2008).
TiO2 has been used to disinfect airborne pathogens, treat indoor airpollution, protect plants from diseases, treat cancer, treat waste water andeffluent, disinfect drinking water, and sterilize food packing materials andsurfaces (Gamage and Zhang, 2010). The US FDA has approved use of TiO2
as an additive in human foods, drugs, cosmetics, and food contact materials(US FDA, 2015). TiO2 has been used in the food industry as a coloringcompound, especially for confectionary, white sauces and dressings, andcertain powdered foods (Shan et al., 2010). Recently, the TUV process wasused to decontaminate surfaces of fresh produce and overcome the lowdegree of effectiveness of UV processing as an alternative treatment tochlorine disinfection. Furthermore, TUV can be easily incorporated intoexisting UV processing unit operations by changing lamps (Cho et al., 2007;Kim et al., 2009; Yoo et al., 2015b). This novel preservation method hasopened new perspectives for the food industry (Ramesh et al., 2016).
4.4.2. Mechanism of photocatalysis for microbialinactivationPhotocatalysis is an oxidative process involving generation of reactivechemical species at the interface of a semiconductor when illuminated underUV or visible light. TiO2, upon illumination with light ofwavelength <385 nm, adsorbs a proton, promoting electrons from the valence
band to the conduction band and leaving a positively
charged hole in the valence band . The reduces oxygen to asuperoxide radical, followed by a subsequent reduction to hydrogen peroxide,and finally to the OH radical (Fig. 7.4) (Cho et al., 2004; Yoo et al., 2015b). Hydroxyl radicals have a stronger oxidizing power (2.80 V) thanozone (2.07 V), hydrogen peroxide (1.78 V), hypochlorous acid (1.49 V), andchlorine (1.36 V) (Hashimoto et al., 2005; Srinivasan and Somasundaram, 2003). Reactive oxygen species, such as hydroxyl radicals and hydrogen

peroxide generated by TiO2 photocatalytic reactions, attack polyunsaturatedphospholipids in bacteria and catalyze site-specific DNA damage, whichresults in cell death (Hirakawa et al., 2004; Shahbaz et al., 2016a,b).
FIGURE 7.4 Mechanism of Photocatalysis (Reactive OxygenSpecies Formation).
In a UV-assisted TiO2 photocatalytic oxidation process, TiO2 can beapplied in either of the two modes of (1) TiO2 immobilized on supportmaterials and (2) TiO2 suspended in an aqueous medium. TiO2
immobilization can be carried out on a variety of support materials, such asquartz tubes, glass, a glass wool matrix, aluminum clays, activated carbon,and ceramic membranes. TiO2 fine powder can be suspended in an aqueousmedium and be repeatedly used without substantial loss of catalytic activity.However, a posttreatment phase separation process, such as a photocatalyticmembrane hybrid system, is required for recovery of catalyst particles afterthe oxidation process. Posttreatment is a time-consuming and costly process.The immobilized mode of TiO2 is preferred over the suspended mode basedon technical applications. Immobilization reduces incorporation of residualTiO2 into foods, although it is a US FDA–approved food additive. Moreover,immobilization of TiO2 helps to improve UV processing (Shan et al., 2010;

Thiruvenkatachari et al., 2008). A schematic diagram of a TUV reactor usedin our lab research is shown in Fig. 7.5
FIGURE 7.5 Schematic Diagram of a Lab-Scale Batch-Type TiO2Photocatalysis Reactor.
4.4.3. Food safety applications of TUV for fresh fruit andjuicesIn recent years, the potential of TUV technology for deactivation ofmicroorganisms in fresh fruit and juice products has been explored(Table 7.6). Yoo et al. (2015a) studied disinfection of orange fruit surfacesusing different decontamination methods to prevent cross-contaminationduring juice extraction. Orange fruit surfaces inoculated with E. coli

O157:H7 at a level of 7-log CFU/cm2 were treated with tap water, chlorine(200 ppm), UVC alone (23.7 mW/cm2), and TUV (17.2 mW/cm2). Levels ofE. coli O157:H7 on orange surfaces were reduced by a level of 4.3 logCFU/mL when treated with TUV at 17.2 mW/cm2. On the other hand,reductions of 1.5, 3.9, and 3.6 log CFU/mL were achieved using tap water,chlorine, and UVC alone, respectively. A low dosage of TUV (17.2 mW/cm2)achieved a higher level of microbial reduction than a high dosage of UVCalone (23.7 mW/cm2). E. coli level in juice was reduced below the detectionlimit when TUV pretreatment of oranges was followed by HHPposttreatment at 400 MPa for 1 min. In contrast, only a 2.4-log reduction wasobtained for juices without TUV pretreatment. The synergistic effectprevented cross-contamination of pathogens from the fruit surface to thejuice.

Table 7.6
TUV for surface disinfection of fresh fruits and safety of juiceproducts.
Fruits/JuiceProducts
TreatmentConditions Microorganisms
LogReductions References
Orange fruit Surfacedisinfection offruits withTUV followedby HHPtreatment ofjuice at 400MPa for 1 min
E. coli O157:H7 4.7 Yoo et al.(2015a)
Kiwi fruit TiO2 combinedwith ozone
Diaporthe actinidiae Efficacy ofdiseasecontrol was84.7%comparedwithfungicide,which was77%
Hur et al.(2005)
Pear fruit UVA illuminatedTiO2-coatedLDPEpackaging filmstored at 5°Cfor 17 days
Mesophilic bacteria With TUV, cellloaddecreasedfrom 3.14 to2 log;without TUV,it increasedfrom 3.19 to4.02 log
Bodaghi et al.(2013)
Pear fruit Yeast With TUV, cellloaddecreasedfrom 2.45 to2 log;without TUV,it increasedfrom 2.1 to3.37 log
Bodaghi et al.(2013)

Fruits/JuiceProducts
TreatmentConditions Microorganisms
LogReductions References
Apple fruit TiO2 powder andTiO2-coatedfilm forantifungalactivity
P. expansum TUV reactionshowedsignificantantifungalactivity tocontrol fruitrot
Maneerat andHayata(2006)
Tomato fruit P. expansum Fungal spoilagewas retardedby TUV
Maneerat andHayata(2006)
Agar modelsurface
TUV at25 mW/cm2 for40 s
S. Typhimurium 5 Yoo et al.(2015b)
Lemon fruit Wounded sites infruit weretreated withTiO2 powderand placedunder UVAlight
P. expansum TiO2-coated filmdecreasedbrownlesions andPenicilliumrot infection
Maneerat andHayata(2006)
Clarified applejuice
TUV; 8.45 J/cm2 E. coli O157:H7 3.16 Shahbaz et al.(2016b)
Clarified applejuice
TUV 0.82 J/cm2
combined withHHP at 400MPa, 25°C, 1min
E. coli O157:H7 5.6 Shahbaz et al.(2016b)
Clarified applejuice
TUV 0.82 J/cm2
combined withHHP at 500MPa, 25°C, 1min
S. Typhimurium 7.18 Shahbaz et al.(2016b)
Clarified applejuice
TUV 0.82 J/cm2,500 MPa,25°C, 1 min
L. monocytogenes 6.43 Shahbaz et al.(2016b)

Fruits/JuiceProducts
TreatmentConditions Microorganisms
LogReductions References
Sikhye beverage TUV 0.24 J/cm2 Total aerobic bacteriaand coliform
TUV effectivelycontrolledmicrobialgrowth over18 daysduringstorage at4°C andpreservedsensoryattributes
Shahbaz et al.(2016a)
Angelica keiskeijuice
TUV prewash for20 minfollowed byHHP at550 MPa for90 s
Pseudomonas,Bacillus cereus
Below thedetectionlimit
Chai et al.(2014)
LDPE, Low-density polyethylene.
A TiO2 photocatalyst film was developed as a fruit packaging material andevaluated for an antimicrobial capacity (Bodaghi et al., 2013). TiO2
nanoparticles as a combination of anatase and rutile were incorporated into alow-density polyethylene (LDPE) matrix and tested against Pseudomonasspp. and Rhodotorula mucilaginosa. LDPE–TiO2 nanocomposite filmexhibited antimicrobial activity only when illuminated with UVA light. Inanother study, Maneerat and Hayata (2006) investigated the antimicrobialactivity of TUV in the form of a TiO2 powder and as a TiO2 coating on aplastic film against fungal pathogens in tomatoes. Both of these treatmentsexhibited antifungal activities for control of fruit rot development. Viablecolonies of P. expansum were significantly reduced in number when UVAwas combined with TiO2. The TiO2 photocatalytic reaction has beensuggested for use in postharvest disease control. Photocatalysis was alsoshown to be not necessarily induced by UVC light. Applications of TiO2 withvisible light are also gaining popularity for food preservation as aneconomical alternative to UV light (Gamage and Zhang, 2010; Liou andChang, 2012).

TUV processing was used to extend the shelf life of a heat-sensitivetraditional drink. TUV effectively controlled microbial growth in a traditionalsikhye drink during storage at 4°C for more than 18 days and significantlyenhanced the shelf life with minimal impact on quality and sensory attributes.Higher sensory scores for flavor, taste, and overall preference were attainedfor low-dosage TUV-treated sikhye drinks than for heat-pasteurized sikhyedrinks. TUV showed the potential to maintain the native taste and quality andto overcome difficulties in commercialization of this drink with a fresh-liketaste (Shahbaz et al., 2016a).
A combined effect of TUV and ozone was evaluated for retardation ofdisease development during cold storage of kiwi fruits (Hur et al., 2005).TUV combined with ozone was highly effective with an 84.7% controlefficacy, compared with a flusilazole fungicide treatment with a 77% controlefficacy. However, no treatments were able to prevent infection of kiwi fruitin the field. Use of this combined treatment in cold storage for successfulpostharvest disease control in kiwi fruits was recommended. Shahbaz et al.(2016b) found that TUV integrated with HHP achieved synergisticinactivation of the Gram-positive bacteria L. monocytogenes and S. aureus,the Gram-negative bacteria E. coli O157:H7 and S. Typhimurium, and theyeast S. cerevisiae in clarified apple juice used as model liquid food. Asequentially combined TUV-HHP treatment was more effective for microbialinactivation than single treatments. Resistance to inactivation treatmentsvaried with the microorganism. Gram-negative bacteria showed lessresistance to TUV than Gram-positive bacteria, perhaps due to cell wallstructure and composition. S. Typhimurium was completely inactivated by acombined treatment of TUV at 8.45 J/cm2 with HHP at 400 MPa for 1 minwhile E. coli O157:H7 was completely inactivated by a combined treatmentof TUV at 8.45 J/cm2 with HHP at 600 MPa for 1 min via a synergisticeffect. Combining treatments might help to reduce the processing time andtreatment intensities from commercial food-processing perspectives(Fig. 7.6).

FIGURE 7.6 Scanning Electron Microscopic Images of L.monocytogenes (A), S. aureus (B), E. coli O157:H7 (C), S.Typhimurium (D), and S. cerevisiae (E) cells. Cells were eitheruntreated or treated using TUV alone (8.45 J/cm2), HHP alone (400and 500 MPa), and combined (TUV–HHP) treatments. Highlydeformed cell morphologies can be seen after combined treatments.From Shahbaz, H.M., Yoo, S., Seo, B., Ghafoor, K., Kim, J.U., Lee, D.U., Park, J., 2016b.Combination of TiO2-UV photocatalysis and high hydrostatic pressure to inactivate bacterialpathogens and yeast in commercial apple juice. Food Bioprocess Technol. 9, 182–190.
Inactivation of bacterial spores and viruses has been a great challenge forresearchers. Many emerging technologies have been evaluated againstbacterial spores and viruses with mixed results (Baert et al., 2009; Jean et al., 2011; Sánchez, 2015). TUV technology has shown potential againstbacterial spores and viruses (Chai et al., 2014; Gerrity et al., 2008; Liga et al., 2011) that are least sensitive to UV treatment and other thermaltreatments (Cho et al., 2011; Dunlop et al., 2008; Zhang et al., 2014).Park et al. (2016) evaluated the inactivation efficiency and mechanism ofMNV-1 used as a surrogate for human norovirus on a solidified agar matrixsimulated for blueberries under different UV light wavelengths (UVA, UVB,

and UVC) both with and without TiO2 photocatalysis. MNV-1 was inoculatedon exterior and interior of the solidified agar matrix and efficiencies ofdifferent inactivation treatments were studied using a number of assays. UVCboth with and without TiO2 was more effective for MNV-1 inactivation thanUVB and UVA. UVC with TiO2 therefore can be used as an effective methodalternative to conventional chlorine disinfection for reducing the risk ofhuman norovirus infection in blueberries and in other fresh produce.
Recent developments in TUV technology are promising. TUV technologycan be applied in a manner similar to UV technology for surface disinfectionof fresh produce. Extensive research must be performed to fully understandthe effects of TUV technology for inactivation of a wide range of pathogenicmicroorganisms and for evaluation of processing effects on physicochemical,nutritional, optical, and sensory attributes of different foods. Reportedresearch in TUV technology has been mostly conducted in the laboratory.There is a need for development of a pilot-scale equipment to betterunderstand the potential applications of TUV technology (Rameshet al., 2016).
5. Conclusions and Future DirectionsIn a consumer-driven market, food-processing companies are constantlyseeking ways to improve existing technologies and to develop innovative andimproved products to stay competitive. Modern consumers are increasinglyinterested in minimally processed food products that maintain natural qualityand freshness. Concerns have been raised about environmental and publichealth safety using chlorine-based disinfection of fresh produce. Use ofchlorine with minimally processed products has already been prohibited inthe European countries of Belgium, Denmark, Germany, and the Netherlands.The fresh produce industry is interested in adopting technically andeconomically effective chlorine-alternative disinfection technologies to meetconsumer demands for fresh and safe fruit. Similarly, despite theeffectiveness of thermal processing to preserve fruit juices, heat treatmentcauses undesirable biochemical and nutritious changes that may affectsensory attributes of fruit juices. Consumer demands for fruit juices that donot contain chemical additives and preservatives are increasing. In thisrespect, nonthermal technologies can play important roles in product

innovation to meet consumer demands for mildly processed products of highnutritional value with a fresh-like flavor.
Food companies are adopting nonthermal technologies for production ofmicrobiologically safe food products with better quality and taste and, moreoften, with enhanced health benefits. During the past few years, transitionfrom lab- and pilot-scale equipment to industrial-scale equipment hasoccurred for nonthermal food-processing technologies. HHP processing isglobally popular and pressure-treated fresh fruit juices are available incommercial markets in Europe, Australia, the United States, Canada, India,Taiwan, South Korea, and Japan. Visiongain forecasts that in 2016, the HHPfood market will be worth 11.03 billion USD and the HHP equipment marketwill have a value of 0.47 billion USD. The major obstacle to increasedadoption of HHP processing is equipment cost. Innovation in HHPequipment and wider availability of toll-processing facilities for HHPprocessing are anticipated to reduce costs in the future. Toll-processingfacilities offer benefits of a lower start-up cost and reduced long-terminvestment requirements, as well as faster start-up timelines for foodcompanies. Toll-processing business models have the potential to allow anyfood or beverage manufacturer to access industrial HHP equipment without aneed for direct capital investment for purchase of HHP technology. AvureTechnologies and Hiperbaric both have set up a worldwide network of toll-processing facilities, performing services for client food industries as simplypay for use of existing HHP industrial plants. In commercial HHP operations,high pressure levels of >500 MPa with prolonged holding times duringrepeated process cycles are hard to achieve. In addition, intense treatmentunder high pressure can possibly cause deterioration of some qualityattributes of food products. Hence, commercial HHP treatments must be keptat low pressures for commercial feasibility and hurdle approaches need to befurther explored. Industrial implementation and commercialization of PEFtechnology is in progress and PEF-processed fruit juices are on marketshelves in the Netherlands, Germany, and the United Kingdom. Despite thecommercial success of PEF technology, there are still many unknown factorsassociated with PEF processing of fruit juices and conflicting researchreports are available. More research is required in this regard for optimizationof processing parameters and establishment of consumer acceptance of PEFtechnology.

Further research is required for evaluation of the effects of UV lighttechnology on preservation of fruit juices. Development of off-flavors andoff-colors during UV exposure needs further evaluation as a function of UVdosage and UV system performance. There is still a knowledge gap withrespect to the fate of fruit juice quality and health-related constituents of fruit.Koutchma et al. (2016) stated that in the United States and Canada,commercialization of UV technology requires acceleration through existingregulatory approval with an emphasis on validation at commercial scales.TUV technology has emerged as a potential method for inactivation ofmicroorganisms in foods. Recent developments in TUV novel technology arepromising. Extensive research must be performed to fully understand theeffects of TUV technology for inactivation of a wider range of pathogenicmicroorganisms and evaluation of the effects of processing onphysicochemical, nutritional, optical, and sensory attributes of foods. MostTUV research has been conducted in a laboratory, and future work shouldfocus on the development of pilot-scale equipment to better understand thelimitations and potential applications of TUV technology. In general, there isneed to explore intelligent hurdle approaches to achieve higher microbialstability for production of mildly processed fruit juices, rather than relyingsolely on single intense treatment. Validated multiphysics models have beenused to characterize, evaluate, and optimize equipment for innovative food-processing technologies, and such modeling strategies can help in developingthese technologies for effective and efficient implementation in the food-processing industry (Knoerzer et al., 2015).
Consumers of food products are fundamentally conservative. Clear andeasily understandable communication with perceived benefits and perceivedrisks regarding innovative technologies are important factors for acceptance.Product labels are not enough. A communication campaign based onscientific results and providing relevant data is needed to introduceinnovative technologies (Jaeger et al., 2015). In the United States, pressure-treated fresh juices by Evolution Fresh are available in markets containingthe words “cold-pressured juices” on the product label (Fig. 7.2). In SouthKorea, pressure-treated fresh juices by Pulmuone are available in the marketwith the words “I’m Real” on the product label. Product labels carrying suchinformation may receive a positive consumer response toward a particularproduct and a novel processing technology. Consumer acceptance will

determine the acceptance of a novel food product and, to some extent,implementation of innovative processing technologies.
More than half (54%) of the world population is currently residing inurban areas. By 2050, 66% of the world population is anticipated to be urban(United Nations Department of Economic and Social Affairs, 2014). In aworld with an ever-growing population and urbanization, there is a need for amore-efficient use of raw materials and energy sources to promote foodsecurity. Nonthermal food-processing technologies can also play animportant role in reducing carbon and water footprints to promote moresustainable food processing. Food processors must select the mostappropriate nonthermal technology along with validated processingconditions to retain nutritive constituents, color, and flavor attributes of foodsbased on demands of modern consumers.
AcknowledgmentsThe work was supported by the High Value-Added Food TechnologyDevelopment Program, Ministry of Agriculture, Food and Rural Affairs,South Korea.
Disclaimer: Mention of trade names and commercial products is solely forthe purpose of providing scientific information and does not imply any sortof recommendation or endorsement by researchers at Yonsei University.

ReferencesAdhikari A, Syamaladevi RM, Killinger K, Sablani SS. Ultraviolet-C light inactivation of
Escherichia coli O157:H7 and Listeria monocytogenes on organic fruit surfaces. Int. J. FoodMicrobiol.. 2015;210:136–142.
Agcam E, Akyildiz A, Evrendilek GA. A comparative assessment of long-term storage stability andquality attributes of orange juice in response to pulsed electric fields and heat treatments. FoodBioprod. Process.. 2016;99:90–98.
Ait-Ouazzou A, Espina L, García-Gonzalo D, Pagán R. Synergistic combination of physicaltreatments and carvacrol for Escherichia coli O157:H7 inactivation in apple, mango, orange, andtomato juices. Food Control. 2013;32:159–167.
Baert L, Debevere J, Uyttendaele M. The efficacy of preservation methods to inactivate foodborneviruses. Int. J. Food Microbiol.. 2009;131:83–94.
Balasubramaniam VM, Martínez-Monteagudo SI, Gupta R. Principles and application of highpressure-based technologies in the food industry. Annu. Rev. Food Sci. Technol.. 2015;6:435–462.
Bayındırlı A, Alpas H, Bozoğlu F, Hızal M. Efficiency of high pressure treatment on inactivation ofpathogenic microorganisms and enzymes in apple, orange, apricot and sour cherry juices. FoodControl. 2006;17:52–58.
Begum M, Hocking AD, Miskelly D. Inactivation of food spoilage fungi by ultra violet (UVC)irradiation. Int. J. Food Microbiol.. 2009;129:74–77.
Bermúdez-Aguirre D, Barbosa-Cánovas GV. An update on high hydrostatic pressure, from thelaboratory to industrial applications. Food Eng. Rev.. 2011;3:44–61.
Bintsis T, Litopoulou-Tzanetaki E, Robinson RK. Existing and potential applications of ultravioletlight in the food industry: a critical review. J. Sci. Food Agr.. 2000;80:637–645.
Bodaghi H, Mostofi Y, Oromiehie A, Zamani Z, Ghanbarzadeh B, Costa C, Conte A, Del NobileMA. Evaluation of the photocatalytic antimicrobial effects of a TiO2 nanocomposite foodpackaging film by in vitro and in vivo tests. LWT Food Sci. Technol.. 2013;50:702–706.
Bonetta S, Bonetta S, Motta F, Strini A, Carraro E. Photocatalytic bacterial inactivation by TiO2-coated surfaces. AMB Express. 2013;3:59.
Bouwknegt M, Verhaelen K, Rzeżutka A, Kozyra I, Maunula L, et al. Quantitative farm-to-fork riskassessment model for norovirus and hepatitis A virus in European leafy green vegetable and berryfruit supply chains. Int. J. Food Microbiol.. 2015;198:50–58.
Buckow R, Ng S, Toepfl S. Pulsed electric field processing of orange juice: a review on microbial,enzymatic, nutritional, and sensory quality and stability. Compr. Rev. Food Sci. Food Saf..2013;12:455–467.
Bull MK, Szabo EA, Cole MB, Stewart CM. Toward validation of process criteria for high-pressureprocessing of orange juice with predictive models. J. Food Prot.. 2005;5:949–954.
Buzrul S, Alpas H, Largeteau A, Demazeau G. Inactivation of Escherichia coli and Listeria innocuain kiwifruit and pineapple juices by high hydrostatic pressure. Int. J. Food Microbiol..2008;124:275–278.
Caminiti IM, Palgan I, Noci F, Muñoz A, Whyte P, et al. The effect of pulsed electric fields (PEF) incombination with high intensity light pulses (HILP) on Escherichia coli inactivation and quality

attributes in apple juice. Innov. Food Sci. Emerg. Technol.. 2011;12:118–123.Caron E, Chevrefils G, Barbeau B, Payment P, Prevost M. Impact of microparticles on UV
disinfection of indigenous aerobic spores. Water Res.. 2007;41:4546–4556.Center for Science in the Public Interest, 2009. Analyzing foodborne outbreaks 1998 to 2007.
Available from: https://cspinet.org/new/pdf/outbreakalertreport09.pdf.Centers for Disease Control and Prevention, 2015. Multistate foodborne disease outbreaks sicken
thousands, highlight need for action. Available from:http://www.cdc.gov/media/releases/2015/p1103-foodborne-disease.html.
Chai C, Lee J, Lee Y, Na S, Park J. A combination of TiO2–UV photocatalysis and high hydrostaticpressure to inactivate Bacillus cereus in freshly squeezed Angelica keiskei juice. LWT Food SciTechnol.. 2014;55:104–109.
Chakraborty S, Kaushik N, Rao PS, Mishra HN. High-pressure inactivation of enzymes: a review onits recent applications on fruit purees and juices. Compr. Rev. Food Sci. Food Saf.. 2014;3:578–596.
Chen C, Wu L, Chen H, Chung Y. Inactivation of Staphylococcus aureus and Escherichia coli inwater using photocatalysis with fixed TiO2. Water Air Soil Pollut.. 2010;212:231–238.
Chen H, Hoover DG. Modeling the combined effect of high hydrostatic pressure and mild heat on theinactivation kinetics of Listeria monocytogenes Scott A in whole milk. Innov. Food Sci. Emerg.Technol.. 2003;4:25–34.
Chen D, Pang X, Zhao J, Gao L, Liao X, Wu J, Li Q. Comparing the effects of high hydrostaticpressure and high temperature short time on papaya beverage. Innov. Food Sci. Emerg. Technol..2015;32:16–28.
Chen D, Xi H, Guo X, Qin Z, Pang X, Hu X, et al. Comparative study of quality of cloudypomegranate juice treated by high hydrostatic pressure and high temperature short time. Innov.Food Sci. Emerg. Technol.. 2013;19:85–94.
Chen J, Zheng X, Dong J, Chen Y, Tian J. Optimization of effective high hydrostatic pressuretreatment of Bacillus subtilis in Hami melon juice. LWT Food Sci. Technol.. 2015;60:1168–1173.
Cho M, Choi Y, Park H, Kim K, Woo GJ, Park J. Titanium dioxide/UV photocatalytic disinfection infresh carrots. J. Food Prot.. 2007;70:97–101.
Cho M, Chung H, Choi W, Yoon J. Linear correlation between inactivation of E. coli and OH radicalconcentration in TiO2 photocatalytic disinfection. Water Res.. 2004;38:1069–1077.
Cho M, Gandhi V, Hwang T, Lee S, Kim J. Investigating synergism during sequential inactivation ofMS-2 phage and Bacillus subtilis spores with UV/H2O2 followed by free chlorine. Water Res..2011;45:1063–1070.
Choi M, Liu Q, Lee S, Jin J, Ryu S, Kang D. Inactivation of Escherichia coli O157:H7, Salmonellatyphimurium and Listeria monocytogenes in apple juice with gaseous ozone. Food Microbiol..2012;32:191–195.
Choi DS, Park SH, Choi SR, Kim JS, Chun HH. The combined effects of ultraviolet-C irradiationand modified atmosphere packaging for inactivating Salmonella enterica serovar Typhimuriumand extending the shelf life of cherry tomatoes during cold storage. Food Packag. Shelf Life.2015;3:19–30.
Dantigny P, Guilmart A, Bensoussan M. Basis of predictive mycology. Int. J. Food Microbiol..2005;100:187–196.

Dean WR. Motion of fluid in a curved pipe. Phil. Mag. J. Sci.. 1927;4:208–223.Dogan C, Erkmen O. High pressure inactivation kinetics of Listeria monocytogenes inactivation in
broth, milk, and peach and orange juices. J. Food Eng.. 2004;62:47–52.Doona CJ, Feeherry FE, Ross EW, Kustin K. Chemical kinetics for the microbial safety of foods
treated with high pressure processing or hurdles. Food Eng. Rev.. 2016;8:272–291.Dunlop PSM, McMurray TA, Hamilton JWJ, Byrne JA. Photocatalytic inactivation of Clostridium
perfringens spores on TiO2 electrodes. J. Photochem. Photobiol. A. 2008;196:113–119.
Espina L, Garcia-Gonzalo D, Laglaoui A, Mackey BM, Pagán R. Synergistic combinations of highhydrostatic pressure and essential oils or their constituents and their use in preservation of fruitjuices. Int. J. Food Microbiol.. 2013;161:23–30.
European Food Information Council, 2012. Fruit and vegetable consumption in Europe: doEuropeans get enough? Available from: http://www.eufic.org/article/en/expid/Fruit-vegetable-consumption-Europe/.
European Food Safety Authority, 2008. Concise database summary statistics: total population.Available from: http://www.efsa.europa.eu/en/datexfoodcdb/datexfooddb.html.
European Fruit Juice Association, 2012. AIJN Market Report 2012. Available from:http://www.aijn.org/pages/main/facts-figures.html.
Evelyn, Kim HJ, Silva FVM. Modeling the inactivation of Neosartorya fischeri ascospores in applejuice by high pressure, power ultrasound and thermal processing. Food Control. 2016;59:530–537.
Evrendilek GA, Tok FM, Soylu EM, Soylu S. Inactivation of Penicillum expansum in sour cherryjuice, peach and apricot nectars by pulsed electric fields. Food Microbiol.. 2008;25:662–667.
Falguera V, Pagán J, Garza S, Garvín A, Ibarz A. Ultraviolet processing of liquid food: a review. Part2: effects on microorganisms and on food components and properties. Food Res. Int..2011;44:1580–1588.
FAOStat, 2012. Crops. Available from: http://faostat.fao.org/site/567/default.aspx#ancor.Feng M, Ghafoor K, Seo B, Yang K, Park J. Effects of ultraviolet-C treatment in Teflon®-coil on
microbial populations and physico-chemical characteristics of watermelon juice. Innov. Food Sci.Emerg. Technol.. 2013;19:133–139.
Ferrario M, Alzamora SM, Guerrero S. Study of the inactivation of spoilage microorganisms in applejuice by pulsed light and ultrasound. Food Microbiol.. 2015;46:635–642.
Flores-Cervantes DX, Palou E, Lopez-Malo A. Efficacy of individual and combined UVC light andfood antimicrobial treatments to inactivate Aspergillus flavus or A. niger spores in peach nectar.Innov. Food Sci. Emerg. Technol.. 2013;20:244–252.
Food Marketing Institute U.S. Grocery Shopping Trends. Arlington, VA: Food Marketing Institute;2014.
Forney L, Pierson JA. Photolytic reactors: similitude in Taylor–Couette and channel flows. AIChe J..2003;49:1285–1292.
Gabriel AA. Combinations of selected physical and chemical hurdles to inactivate Escherichia coliO157:H7 in apple and orange juices. Food Control. 2015;50:722–728.
Gabriel A, Nakano H. Inactivation of Salmonella, E. coli and Listeria monocytogenes in phosphate-buffered saline and apple juice by ultraviolet and heat treatments. Food Control. 2009;20:443–446.

Gamage J, Zhang Z. Applications of photocatalytic disinfection. Int. J. Photoen. 2010;doi:10.1155/2010/764870.
Gao G, Zhao L, Ma Y, Wang Y, Sun Z, Liao X. Microorganisms and some quality of red grapefruitjuice affected by high pressure processing and high temperature short time. Food Bioprocess.Technol.. 2015;8:2096–2108.
Gerrity D, Ryu H, Crittenden J, Abbaszadegan M. Photocatalytic inactivation of viruses usingtitanium dioxide nanoparticles and low-pressure UV light. J. Environ. Sci. Health A.2008;43:1261–1270.
Georget E, Sevenich R, Reineke K, Mathys A, Heinz V, Callanan M, Rauh C, Knorr D. Inactivationof microorganisms by high isostatic pressure processing in complex matrices: a review. Innov.Food Sci. Emerg. Technol.. 2015;27:1–14.
Gil MI, Selma MV, López-Gálvez F, Allende A. Fresh-cut product sanitation and wash waterdisinfection: problems and solutions. Int. J. Food Microbiol.. 2009;134:37–45.
Goh ELC, Hocking AD, Stewart CM, Buckle KA, Fleet GH. Baroprotective effect of increasedsolute concentrations on yeast and moulds during high pressure processing. Innov. Food Sci.Emerg. Technol.. 2007;8:535–542.
Goodburn C, Wallace CA. The microbiological efficacy of decontamination methodologies for freshproduce: a review. Food Control. 2013;32:418–427.
Gouma M, Álvarez I, Condón S, Gayán E. Modelling microbial inactivation kinetics of combinedUV-H treatments in apple juice. Innov. Food Sci. Emerg. Technol.. 2015;27:111–120.
Gouma M, Gayán E, Raso J, Condón S, Álvarez I. Inactivation of spoilage yeasts in apple juice byUV-C light and in combination with mild heat. Innov. Food Sci. Emerg. Technol.. 2015;32:146–155.
Guerrero-Betrán JA, Barbosa-Cánovas GV. Reduction of Saccharomyces cerevisiae: Escherichia coliand Listeria innocua in apple juice by ultraviolet light. J. Food Process. Eng.. 2005;28:437–452.
Gurtler JB, Bailey RB, Geveke DJ, Zhang HQ. Pulsed electric field inactivation of E. coli O157:H7and non-pathogenic surrogate E. coli in strawberry juice as influenced by sodium benzoate,potassium sorbate, and citric acid. Food Control. 2011;22:1689–1694.
Gurtler JB, Rivera RB, Zhang HQ, Geveke DJ. Selection of surrogate bacteria in place of E. coliO157:H7 and Salmonella Typhimurium for pulsed electric field treatment of orange juice. Int. J.Food Microbiol.. 2010;139:1–8.
Hartyáni P, Dalmadi I, Cserhalmi Z, Kántor DB, Tóth-Markus M, Sass-Kiss Á. Physical-chemicaland sensory properties of pulsed electric field and high hydrostatic pressure treated citrus juices.Innov. Food Sci. Emerg. Technol.. 2011;3:255–260.
Hashimoto K, Irie H, Fujishima A. TiO2 photocatalysis: a historical overview and future prospects.Jpn. J. Appl. Phys.. 2005;44:8269–8285.
Heinz V, Buckow R. Food preservation by high pressure. J. Für Verbraucher. Lebensmittel..2009;5:73–81.
Hirakawa K, Mori M, Yoshida M, Oikawa S, Kawanishi S. Photo-irradiated titanium dioxidecatalyzes site specific DNA damage via generation of hydrogen peroxide. Free Radic. Res..2004;38:439–447.
Hiremath ND, Ramaswamy HS. High-pressure destruction kinetics of spoilage and pathogenicmicroorganisms in mango juice. Food Process. Preserv.. 2012;36:113–125.

Houška M, Strohalm J, Kocurová K, Totušek J, Lefnerová D, Tříska J, et al. High pressure andfoods-fruit/vegetable juices. J. Food Eng.. 2006;77:386–398.
Hu X, Geng S, Wang X, Hu C. Inactivation and photorepair of enteric pathogenic microorganismswith ultraviolet irradiation. Environ. Eng. Sci.. 2012;29:549–553.
Huang R, Li X, Huang Y, Chen H. Strategies to enhance high pressure inactivation of murinenorovirus in strawberry puree and on strawberries. Int. J. Food Microbiol.. 2014;185:1–6.
Huang K, Yu L, Wang W, Gai L, Wang J. Comparing the pulsed electric field resistance of themicroorganisms in grape juice: application of the Weibull model. Food Control. 2014;35:241–251.
Hur JS, Oh SO, Lim KM, Jung JS, Kim JW, Koh YJ. Novel effects of TiO2 photocatalytic ozonationon control of postharvest fungal spoilage of kiwifruit. Postharv. Biol. Technol.. 2005;35:109–113.
Hygreeva D, Pandey MC. Novel approaches in improving the quality and safety aspects of processedmeat products through high pressure processing technology: a review. Trends Food Sci. Technol..2016;54:175–185.
Jaeger H, Knorr D, Szabó E, Hámori J, Bánáti D. Impact of terminology on consumer acceptance ofemerging technologies through the example of PEF technology. Innov. Food Sci. Emerg. Technol..2015;29:87–93.
Jayachandran LE, Chakraborty S, Rao PS. Effect of high pressure processing on physicochemicalproperties and bioactive compounds in litchi based mixed fruit beverage. Innov. Food Sci. Emerg.Technol.. 2015;28:1–9.
Jean J, Morales-Rayas R, Anoman MN, Lamhoujeb S. Inactivation of hepatitis A virus and norovirussurrogate in suspension and on food-contact surfaces using pulsed UV light (pulsed lightinactivation of food-borne viruses). Food Microbiol.. 2011;28:568–572.
Jermann C, Koutchma T, Margas E, Leadley C, Ros-Polski V. Mapping trends in novel and emergingfood processing technologies around the world. Innov. Food Sci. Emerg. Technol.. 2015;31:14–27.
Jin TZ, Guo M, Yang R. Combination of pulsed electric field processing and antimicrobial bottle forextending microbiological shelf-life of pomegranate juice. Innov. Food Sci. Emerg. Technol..2014;26:153–158.
Kaushik N, Kaur BP, Rao PS, Mishra HN. Effect of high pressure processing on color, biochemicaland microbiological characteristics of mango pulp (Mangifera indica cv. Amrapali). Innov. FoodSci. Emerg. Technol.. 2014;22:40–50.
Kaya Z, Unluturk S. Processing of clear and turbid grape juice by a continuous flow UV system.Innov. Food Sci. Emerg. Technol.. 2016;33:282–288.
Kim Y, Choi Y, Kim S, Park J, Chung M, Song KB, Hwang I, Kwon K, Park J. Disinfection oficeberg lettuce by titanium dioxide-UV photocatalytic reaction. J. Food Prot.. 2009;72:1916–1922.
Knoerzer, K., 2016. Nonthermal and innovative food processing technologies. Available from:http://dx.doi.org/10.1016/B978-0-08-100596-5.03414-4.
Knoerzer K, Buckow R, Trujillo FJ, Juliano P. Multiphysics simulation of innovative foodprocessing technologies. Food Eng. Rev.. 2015;7:64–81.
Knorr D, Heinz V, Buckow R. High pressure application for food biopolymers. BBA ProteinsProteom.. 2006;1764:619–631.
Koseki S. Risk assessment of microbial and chemical contamination in fresh produce. In: Hoorfar J,ed. Global Safety of Fresh Produce. Cambridge: Woodhead Publishing; 2014:153–171.

Koutchma T. Advances in ultraviolet light technology for non-thermal processing of liquid foods.Food Bioprocess. Technol.. 2009;2:138–155.
Koutchma T, Design for high-pressure processing. Ahmed J, Rahman MS, eds. Handbook of FoodProcess Design, vol. 2. Oxford: Wiley-Blackwell; 2012:1010–1011.
Koutchma T, Popović V, Ros-Polski V, Popielarz A. Effects of ultraviolet light and high-pressureprocessing on quality and health-related constituents of fresh juice products. Compr. Rev. FoodSci. Nutr.. 2016;15:844–867.
Lante A, Tinello F, Nicoletto M. UV-A light treatment for controlling enzymatic browning of fresh-cut fruits. Innov. Food Sci. Emerg. Technol.. 2016;34:141–147.
Lee S, Baek S. Effect of chemical sanitizer combined with modified atmosphere packaging oninhibiting Escherichia coli O157:H7 in commercial spinach. Food Microbiol.. 2008;25:582–587.
Lee PY, Lusk K, Mirosa M, Oey I. Effect of information on Chinese consumers’ perceptions andpurchase intention for beverages processed by high pressure processing, pulsed-electric field andheat treatment. Food Qual. Prefer.. 2015;40:16–23.
Lee SY, Sagong HG, Ryu S, Kang DH. Effect of continuous ohmic heating to inactivate Escherichiacoli O157:H7, Salmonella Typhimurium and Listeria monocytogenes in orange juice and tomatojuice. J. Appl. Microbiol.. 2012;112:723–731.
Lee J, Zoh K, Ko G. Inactivation and UV disinfection of murine norovirus with TiO2 under variousenvironmental conditions. Appl. Environ. Microbiol.. 2008;74:2111–2117.
Lerma-Garcia MJ, D’Amato A, Simo-Alfonso EF, Righetti PG, Fasoli E. Orange proteomicfingerprinting: from fruit to commercial juices. Food Chem.. 2016;196:739–749.
Liga MV, Bryant EL, Colvin VL, Li Q. Virus inactivation by silver doped titanium dioxidenanoparticles for drinking water treatment. Water Res.. 2011;45:535–544.
Lim W, Harrison MA. Effectiveness of UV light as a means to reduce Salmonella contamination ontomatoes and food contact surfaces. Food Control. 2016;66:166–173.
Liou J, Chang H. Bactericidal effects and mechanisms of visible light-responsive titanium dioxidephotocatalysts on pathogenic bacteria. Arch. Immunol. Therap. Exp.. 2012;60:267–275.
Liu C, Huang Y, Chen H. Inactivation of Escherichia coli O157:H7 and Salmonella enterica onblueberries in water using ultraviolet light. J. Food Sci.. 2015;80:M1532–M1537.
Liu C, Li X, Chen H. Application of water-assisted ultraviolet light processing on the inactivation ofmurine norovirus on blueberries. Int. J. Food Microbiol.. 2015;214:18–23.
Liu F, Li R, Wang Y, Bi X, Liao X. Effects of high hydrostatic pressure and high-temperature short-time on mango nectars: changes in microorganisms, acid invertase, 5-hydroxymethylfurfural,sugars, viscosity, and cloud. Innov. Food Sci. Emerg. Technol.. 2014;22:22–30.
Long M, Wang J, Zhuang H, Zhang Y, Wu H, Zhang J. Performance and mechanism of standardnano-TiO2 (P-25) in photocatalytic disinfection of foodborne microorganisms—Salmonellatyphimurium and Listeria monocytogenes. Food Control. 2014;39:68–74.
Maneerat C, Hayata Y. Antifungal activity of TiO2 photocatalysis against Penicillium expansum invitro and in fruit tests. Int. J. Food Microbiol.. 2006;107:99–103.
Mansor A, Shamsudin R, Adzahan NM, Hamidon MN. Efficacy of ultraviolet radiation as non-thermal treatment for the inactivation of Salmonella typhimurium TISTR 292 in pineapple fruitjuice. Agr. Agric. Sci. Proc.. 2014;2:173–180.

Marsellés-Fontanet AR, Puig A, Olmos P, Mínguez-Sanz S, Martín-Belloso O. Optimising theinactivation of grape juice spoilage organisms by pulse electric fields. Int. J. Food Microbiol..2009;130:159–165.
McCullagh C, Robertson JMC, Bahnemann DW, Robertson PKJ. The application of TiO2photocatalysis for disinfection of water contaminated with pathogenic micro-organisms: a review.Res. Chem. Intermed.. 2007;33:359–375.
McHugh, T., Kingsley, D., 2016. Putting oysters under pressure. Food Technology Magazine.Available from: http://www.ift.org/food-technology/current-issue.aspx.
Meireles A, Giaouris E, Simões M. Alternative disinfection methods to chlorine for use in the fresh-cut industry. Food Res. Int.. 2016;82:71–85.
Mireaux M, Cox DN, Cotton A, Evans G. An adaptation of the repertory grid methodology toevaluate Australian consumers’ perceptions of food products produced by novel technologies.Food Qual. Prefer.. 2007;18:834–848.
Misra NN, Keener KM, Bourke P, Mosnier JP, Cullen PJ. In-package atmospheric pressure coldplasma treatment of cherry tomatoes. J. Biosci. Bioeng.. 2014;8:177–182.
Moody A, Marx G, Swanson BG, Bermúdez-Aguirre D. A comprehensive study on the inactivationof Escherichia coli under nonthermal technologies: high hydrostatic pressure, pulsed electricfields and ultrasound. Food Control. 2014;37:305–314.
Moore MD, Goulter RM, Jaykus LA. Human norovirus as a foodborne pathogen: challenges anddevelopments. Annu. Rev. Food Sci. Technol.. 2015;6:411–433.
Mosqueda-Melgar J, Elez-Martínez P, Raybaudi-Massilia RM, Martín-Belloso O. Effects of pulsedelectric fields on pathogenic microorganisms of major concern in fluid foods: a review. Critic.Rev. Food Sci. Nutr.. 2008;48:747–759.
Mukhopadhyay S, Ukuku V, Fan X, Juneja V. Efficacy of integrated treatment of UV light and low-dose gamma irradiation on inactivation of Escherichia coli O157:H7 and Salmonella enterica ongrape tomatoes. J. Food Sci.. 2013;78:M1049–M1056.
Mukhopadhyay S, Ukuku DO, Juneja VK. Effects of integrated treatment of nonthermal UV-C lightand different antimicrobial wash on Salmonella enterica on plum tomatoes. Food Control.2015;56:147–154.
Müller A, Stahl MR, Graef V, Franz CMAP, Huch M. UV-C treatment of juices to inactivatemicroorganisms using Dean vortex technology. J. Food Eng.. 2011;107:268–275.
Navarro-Pascual-Ahuir M, Lerma-García MJ, Simó-Alfonso EF, Herrero-Martínez JM. Qualitycontrol of fruit juices by using organic acids determined by capillary zone electrophoresis withpoly(vinyl alcohol)-coated bubble cell capillaries. Food Chem.. 2015;188:596–603.
Nielsen HB, Sonne AM, Grunert KG, Banati D, Pollák-Tóth A, Lakner Z, et al. Consumer perceptionof the use of high-pressure processing and pulsed electric field technologies in food production.Appetite. 2009;52:115–126.
Noci F, Riener J, Walkling-Ribeiro M, Cronin DA, Morgan DJ, Lyng JG. Ultraviolet irradiation andpulsed electric fields (PEF) in a hurdle strategy for the preservation of fresh apple juice. J. FoodEng.. 2008;85:141–146.
Oey I, Lille M, Loey A, Hendrickx M. Effect of high-pressure processing on colour, texture andflavour of fruit- and vegetable-based food products: a review. Trends Food Sci. Technol..2008;19:320–328.

Olivier S, Bull M, Stone G, Diepenbeek R, Kormelink F, Jacops L, Chapman B. Strong andconsistently synergistic inactivation of spores of spoilage-associated Bacillus and Geobacillusspp. by high pressure and heat compared with inactivation by heat alone. Appl. Environ.Microbiol.. 2011;77:2317–2324.
Palgan I, Caminiti IM, Muñoz A, Noci F, Whyte P, Morgan DJ, Cronin DA, Lyng JG. Combinedeffect of selected non-thermal technologies on Escherichia coli and Pichia fermentansinactivation in an apple and cranberry juice blend and on product shelf life. Int. J. FoodMicrobiol.. 2011;151:1–6.
Park SH, Balasubramaniam VM, Sastry SK, Lee J. Pressure-ohmic-thermal sterilization: a feasibleapproach for the inactivation of Bacillus amyloliquefaciens and Geobacillus stearothermophilusspores. Innov. Food Sci. Emerg. Technol.. 2013;19:115–123.
Park D, Shahbaz HM, Kim S-H, Lee M, Lee W, Oh J-W, Lee D-U, Park J. Inactivation efficiencyand mechanism of UV-TiO2 photocatalysis against murine norovirus using a solidified agarmatrix. Int. J. Food Microbiol.. 2016;238:256–264.
Patrignani F, Tabanelli G, Siroli L, Gardini F, Lanciotti R. Combined effects of high pressurehomogenization treatment and citral on microbiological quality of apricot juice. Int. J. FoodMicrobiol.. 2013;160:273–281.
Patterson MF. Microbiology of pressure-treated foods. J. Appl. Microbiol.. 2005;98:1400–1409.Pavoni E, Arcangeli G, Dalzini E, Bertasi B, Terregino C, Montesi F, et al. Synergistic effect of high
hydrostatic pressure (HHP) and marination treatment on the inactivation of hepatitis a virus inmussels (Mytilus galloprovincialis). Food Environ. Virol.. 2015;7:76–85.
Porębska I, Sokołowska B, Skąpska S, Rzoska SJ. Treatment with high hydrostatic pressure andsupercritical carbon dioxide to control Alicyclobacillus acidoterrestris spores in apple juice. FoodControl. 2017;73:24–30.
Predmore A, Sanglay G, Li J, Lee K. Control of human norovirus surrogates in fresh foods bygaseous ozone and a proposed mechanism of inactivation. Food Microbiol.. 2015;50:118–125.
Produce for Better Health Foundation, 2015. State of the plate: study on America’s consumption offruit and vegetables. Available from: http://www.PBHFoundation.org.
Ramesh T, Nayak B, Amirbahman A, Tripp CP, Mukhopadhyay S. Application of ultraviolet lightassisted titanium dioxide photocatalysis for food safety: a review. Innov. Food Sci. Emerg.Technol.. 2016;38:105–115.
Ramos B, Miller FA, Brandão TRS, Teixeira P, Silva CLM. Fresh fruits and vegetables: an overviewon applied methodologies to improve its quality and safety. Innov. Food Sci. Emerg. Technol..2013;20:1–15.
Raso J, Condón S, Álvarez I. Pulsed electric field. In: Batt CA, ed. Encyclopedia of FoodMicrobiology. second ed. London: Elsevier; 2014.
Reineke K, Mathys A, Heinz V, Knorr D. Mechanisms of endospore inactivation under highpressure. Trends Microbiol.. 2013;21:296–304.
Romano KR, Rosenthal A, Deliza R. How do Brazilian consumers perceive a non-traditional andinnovative fruit juice? An approach looking at the packaging. Food Res. Int.. 2015;74:123–130.
Saldaña G, Puértolas E, Monfort S, Raso J, Álvarez I. Defining treatment conditions for pulsedelectric field pasteurization of apple juice. Innov. Food Sci. Emerg. Technol.. 2011;151:29–35.
Sampedro F, Geveke DJ, Fan X, Zhang HQ. Effect of PEF, HHP and thermal treatment on PMEinactivation and volatile compounds concentration of an orange juice-milk based beverage. Innov.

Food Sci. Emerg. Technol.. 2009;10:463–469.Sampedro F, McAloon A, Yee W, Fan X, Zhang HQ, Geveke DJ. Cost analysis of commercial
pasteurization of orange juice by pulsed electric fields. Innov. Food Sci. Emerg. Technol..2013;17:72–78.
Sánchez G. Processing strategies to inactivate hepatitis A virus in food products: a critical review.Compr. Rev. Food Sci. Food Saf.. 2015;14:771–784.
Santhirasegaram V, Razali Z, Somasundram C. Effects of sonication and ultraviolet-C treatment as ahurdle concept on quality attributes of Chokanan mango (Mangifera indica L.) juice. Food Sci.Technol. Int.. 2015;21:232–241.
Shahbaz HM, Kim S, Hong J, Kim JU, Lee DU, Ghafoor K, Park J. Effects of TiO2-UVCphotocatalysis and thermal pasteurisation on microbial inactivation and quality characteristics ofthe Korean rice-and-malt drink sikhye. Int. J. Food Sci. Tech.. 2016;51:123–132.
Shahbaz HM, Ryoo H, Kim JU, Kim S, Lee DU, Ghafoor K, Park J. Effects of UV-C in a Teflon-coiland high hydrostatic pressure combined treatment for maintenance of the characteristic quality ofdongchimi (watery radish kimchi) during room temperature storage. J. Food Process. Preserv..2017;41:e13057: DOI: 10.1111/jfpp.13057.
Shahbaz HM, Yoo S, Seo B, Ghafoor K, Kim JU, Lee DU, Park J. Combination of TiO2-UVphotocatalysis and high hydrostatic pressure to inactivate bacterial pathogens and yeast incommercial apple juice. Food Bioprocess Technol.. 2016;9:182–190.
Shamsudin R, Adzahan NM, Yee PY, Mansor A. Effect of repetitive ultraviolet irradiation on thephysico-chemical properties and microbial stability of pineapple juice. Innov. Food Sci. Emerg.Technol.. 2014;23:114–120.
Shan AY, Ghazi TIM, Rashid SA. Immobilisation of titanium dioxide onto supporting materials inheterogeneous photocatalysis: a review. Appl. Catal. A.. 2010;389:1–8.
Slavin J, Lloyd B. Health benefits of fruits and vegetables. Adv. Nutr.. 2012;3:506–516.Sommers CH, Scullen OJ, Sheen S. Inactivation of uropathogenic Escherichia coli in ground chicken
meat using high pressure processing and gamma radiation, and in purge and chicken meatsurfaces by ultraviolet light. Front Microbiol.. 2016;7:413.
Sommers CH, Scullen OJ, Sites JE. Inactivation of foodborne pathogens on frankfurters usingultraviolet light and GRAS antimicrobials. J. Food Saf.. 2010;30:666–678.
Srinivasan C, Somasundaram N. Bactericidal and detoxification effects of irradiated semiconductorcatalyst, TiO2. Curr. Sci.. 2003;85:1431–1438.
Sung HJ, Song WJ, Kim KP, Ryu S, Kang DH. Combination effect of ozone and heat treatments forthe inactivation of Escherichia coli O157:H7, Salmonella typhimurium, and Listeriamonocytogenes in apple juice. Int. J. Food Microbiol.. 2014;171:147–153.
Terefe NS, Buckow R, Versteeg C. Quality-related enzymes in fruit and vegetable products: effects ofnovel food processing technologies, part 1: high-pressure processing. Crit. Rev. Food Sci. Nutr..2014;54:24–63.
Terefe NS, Tepper P, Ullman A, Knoerzer K, Juliano P. High pressure thermal processing of pears:effect on endogenous enzyme activity and related quality attributes. Innov. Food Sci. Emerg.Technol.. 2016;33:56–66.
Thiruvenkatachari R, Vigneswaran S, Moon IS. A review on UV/TiO2 photocatalytic oxidationprocess. Korean J. Chem. Eng.. 2008;25:64–72.

Timmermans RAH, Mastwijk HC, Knol JJ, Quataert MCJ, Vervoort, et al. Comparing equivalentthermal, high pressure and pulsed electric field processes for mild pasteurization of orange juice.Part I: impact on overall quality attributes. Innov. Food Sci. Emerg. Technol.. 2011;12:235–243.
Timmermans RAH, Nederhoff AL, Nierop Groot MN, van Boekel MAJS, Mastwijk HC. Effect ofelectrical field strength applied by PEF processing and storage temperature on the outgrowth ofyeasts and moulds naturally present in a fresh fruit smoothie. Int. J. Food Microbiol..2016;230:21–30.
Timmermans RAH, Nierop Groot MN, Nederhoff AL, van Boekel MAJS, Matser AM, Mastwijk HC.Pulsed electric field processing of different fruit juices: impact of pH and temperature oninactivation of spoilage and pathogenic microorganisms. Int. J. Food Microbiol.. 2014;173:105–111.
Toledo del Árbol J, Pérez Pulido R, Grande Burgos MJ, Gálvez A, Lucas López R. Inactivation ofleuconostocs in cherimoya pulp by high hydrostatic pressure treatments applied singly or incombination with enterocin AS-48. LWT Food Sci. Technol.. 2016;65:1054–1058.
Torres EF, Gonzalez MG, Klotz B, Rodrigo D. Effects of high hydrostatic pressure and temperatureincrease on Escherichia coli spp. and pectin methyl esterase inactivation in orange juice. FoodSci. Technol. Int.. 2015;22:173–180.
Tournas VH, Heeres J, Burgess L. Moulds and yeasts in fruit salads and fruit juices. Food Microbiol..2006;23:684–688.
Uckoo RM, Jayaprakasha GK, Somerville JA, Balasubramaniam VM, Pinarte M, Patil BS. Highpressure processing controls microbial growth and minimally alters the levels of health promotingcompounds in grapefruit (Citrus paradisi Macfad) juice. Innov. Food Sci. Emerg. Technol..2013;18:7–14.
Unluturk S, Atilgan MR. Microbial safety and shelf life of UV-C treated freshly squeezed whitegrape juice. J. Food Sci.. 2015;80:M1831–M1841.
United Nations Department of Economic and Social Affairs, 2014. World Urbanization Prospects:The 2014 Revision. Available from:http://www.un.org/en/development/desa/population/theme/urbanization/index.shtml.
US Department of Agriculture, 2012. Introduction to the microbiology of food processing.http://www.fsis.usda.gov/shared/PDF/SPN_Guidebook_Microbiology.pdf.
US Food and Drug Administration, 2015. 21 CFR 73.575. Available from:http://www.accessdata.fda.gov/scripts/cdrh/cfdocs/cfcfr/cfrsearch.cfm?fr=73.575.
Vervoort L, Van Der Plancken I, Grauwet T, Timmermans RAH, Mastwijk HC, Matser AM,Hendrickx ME, Van Loey A. Comparing equivalent thermal, high pressure and pulsed electricfield processes for mild pasteurization of orange juice: Part II: impact on specific chemical andbiochemical quality parameters. Innov. Food Sci. Emerg. Technol.. 2011;12:466–477.
Varela-Santos E, Ochoa-Martinez A, Tabilo-Munizaga G, Reyes JE, Pérez-Won M, Briones-LabarcaV, et al. Effect of high hydrostatic pressure (HHP) processing on physicochemical properties,bioactive compounds and shelf-life of pomegranate juice. Innov. Food Sci. Emerg. Technol..2012;13:13–22.
Visiongain, 2016. Food high pressure processing (HPP) technologies market 2016–2026. Availablefrom: https://www.visiongain.com/Report/1623/Food-High-Pressure-Processing-(HPP)-Technologies-Market-2016-2026.
Vojdani JD, Beuchat LR, Tauxe RV. Juice-associated outbreaks of human illness in the United States,1995 through 2005. J. Food Prot.. 2008;71:356–364.

World Health Organization, 2003. Diet, nutrition and the prevention of chronic diseases. Report of aJoint/WHO/FAO Expert Consultation. WHO Technical Report Series, No. 916 (TRS 916).
Ye M, Lingham T, Huang Y, Ozbay G, Ji L, Karwe M, Chen H. Effects of high-hydrostatic pressureon inactivation of human norovirus and physical and sensory characteristics of oysters. J. FoodSci.. 2015;80:M1330–M1335.
Yemmireddy VK, Hung Y. Selection of photocatalytic bactericidal titanium dioxide (TiO2)nanoparticles for food safety applications. LWT Food Sci. Technol.. 2015;61:1–6.
Yin F, Zhu Y, Koutchma T, Gong J. Inactivation and potential reactivation of pathogenic Escherichiacoli O157:H7 in apple juice following ultraviolet light exposure at three monochromaticwavelengths. Food Microbiol.. 2015;46:329–335.
Yoo S, Ghafoor K, Kim JU, Kim S, Jung B, Lee DU, Park J. Inactivation of Escherichia coliO157:H7 on orange fruit surfaces and in juice using photocatalysis and high hydrostatic pressure.J. Food Prot.. 2015;78:1098–1105.
Yoo S, Ghafoor K, Kim S, Sun YW, Kim JU, Yang K, Lee D, Shahbaz HM, Park J. Inactivation ofpathogenic bacteria inoculated onto a Bacto™ agar model surface using TiO2-UVCphotocatalysis, UVC and chlorine treatments. J. Appl. Microbiol.. 2015;119:688–696.
Zhang Y, Zhou L, Zhang Y. Investigation of UV-TiO2 photocatalysis and its mechanism in Bacillussubtilis spore inactivation. J. Environ. Sci.. 2014;26:1943–1948.
Further ReadingGani A, Baba WN, Ahmad M, Shah U, Khan AA, Wani IA, Masoodi FA, Gani A. Effect of
ultrasound treatment on physico-chemical, nutraceutical and microbial quality of strawberry. LWTFood Sci. Technol.. 2016;66:496–502.
He Z, Tao Y, Zeng M, Zhang S, Tao G, Qin F, Chen J. High pressure homogenization processing,thermal treatment and milk matrix affect in vitro bioaccessibility of phenolics in apple, grape andorange juice to different extents. Food Chem.. 2016;200:107–116.
Huang Y, Ye M, Chen H. Inactivation of Escherichia coli O157:H7 and Salmonella spp. instrawberry puree by high hydrostatic pressure with/without subsequent frozen storage. Int. J.Food Microbiol.. 2013;160:337–343.
Liao H, Hu X, Liao X, Chen F, Wu J. Inactivation of Escherichia coli inoculated into cloudy applejuice exposed to dense phase carbon dioxide. Int. J. Food Microbiol.. 2007;118:126–131.
Lou F, Neetoo H, Chen H, Li J. High hydrostatic pressure processing: a promising nonthermaltechnology to inactivate viruses in high-risk foods. Annu. Rev. Food Sci. Technol.. 2015;6:389–409.
Mosqueda-Melgar J, Raybaudi-Massilia RM, Martín-Belloso O. Non-thermal pasteurization of fruitjuices by combining high-intensity pulsed electric fields with natural antimicrobials. Innov. FoodSci. Emerg. Technol.. 2008;9:328–340.

C H A P T E R 8
Agroindustrial Coproducts asSources of Novel FunctionalIngredientsMaria Lourdes Pérez-Chabela
Annel M. Hernández-Alcántara Autonomous Metropolitan University, Iztapalapa, Mexico City, Mexico
AbstractThe disposal of agroindustrial coproducts derived from fruit and vegetable processing representsa serious contamination problem. Fruit and vegetable peels contain important bioactiveingredients like fiber and antioxidants. Different fiber sources contain high amounts of solubleand insoluble fiber. The peel fiber can be employed as a prebiotic ingredient. In vitro studieshave demonstrated that the flour of these peels stimulates the growth of probiotic lactic acidbacteria, besides the production of an important amount of short chain fatty acids, mainlybutyric. In same manner, these fibers as coating material improved the resistance of lactic acidbacteria against bile and acidic conditions. These fruit peels are low-cost potential foodfunctional ingredients that develop novel functional foods that improve nutritional quality.
Keywords
coproductsbioactive ingredientsfiberantioxidantspolyphenolsprebiotic

1. Agroindustrial CoproductsAccording to the Food and Agriculture Organization (FAO) one-third of theedible parts of food produced for human consumption gets lost or wastedglobally. This amount accounts about 1.3 billion tons per year (FAO, 2011).Food coproducts are residues of high organics load, which are usuallyderived during postharvest handling or storage. Coproducts of fruitprocessing exist in large amounts, the commercial production of fruit fibersis limited to small amounts. They are used in the feed industry. Fresh fruittissue after squeezing is not stable against enzymatic degradation and isvery sensitive to microbiological spoilage, a drying process soon after fruitprocessing is necessary (Fisher, 2012). In developing countries more than40% of the food losses occur at postharvest and processing levels, while inindustrialized countries, more than 40% of the food losses occur at retailand consumer levels.
Fruit and vegetable processing is the most investigated substrate for theextraction of several types of antioxidants and dietary fibers (DFs). Phenolsand carotenoids could be applied as natural food, because they extend theshelf life of the product by delaying the formation of off-flavors andrancidity (Galanakis, 2012).
2. Dietary Fiber From AgroindustrialCoproductsMany agricultural coproducts are rich in DFs. The term dietary fiber refersto the remnants of edible plant cells, polysaccharides, lignin, and associatedsubstances resistant to digestion by human alimentary enzymes(Trowell, 1974). In 2001, the American Association of Cereal Chemists(AACC, 2001) defined the fiber dietary as: “the edible parts of plants oranalogous carbohydrates that are resistant to digestion and absorption in thehuman small intestine with complete or partial fermentation in the largeintestine. Dietary fiber includes polysaccharides, oligosaccharides, lignin,and associated plant substances. Dietary fibers promote beneficialphysiological effects including laxation, and/or blood cholesterolattenuation, and/or blood glucose attenuation.” DF should be obtainedthrough consumption of foods. In addition to fiber, minimally processed

fruits, vegetables, grains, and legumes provide micronutrients that areessential components of healthful diets. Recommendations for DF intakefor adults generally fall in the range of 20–35 g/day or 10–13 gDF/1000 kcal (Marlett and Slavin, 1997). DF is one of the main dietaryfactors contributing to the well-being of consumers. Reyes-Caudillo et al.(2008) studied the DF content present in Mexican chia (Salvia hispanica L.)they reported a 37%–40% of total DF, concluding that chia seeds are animportant source of DF.
Borrelli et al. (2004) studied the possibility of using the roasted coffeesilvers (the coffee silver skin is a tegument of coffee beans that constitutes aby-product of the roasting procedure) dietetic fiber rich. The results of theirinvestigation showed that this material has 60% total dietetic fiber with arelevant component (14%) of soluble dietetic fiber. Nawirska and Uklanska(2008) determined and compared the neutral DF (NDF) and acid DF (ADF)contents in the pomace from the processing of two apple varieties (Idaredand Champion), two strawberry varieties (Ducat and Kent), chokeberry,black currant, red cabbage, and two carrot varieties (Black carrot andDolanka). Chokeberry pomace was found to contain the largest, andDolanka carrot pomace the smallest amounts of NDF and ADF. The resultsimply that chokeberry pomace, black currant pomace, and strawberry (bothDucat and Kent) pomace should be recommended as best suited for theproduction of high DF food components. Aguedo et al. (2012) studied thecomposition of by-products from cooked fruit processing (apple and pearpomaces), the content of DF is from 70% the dry-weight with aninsignificant soluble fraction, by-products came from cooked fruit impliesthat they contain specific aroms and sensory characteristics. Table 8.1shows some agroindustrial coproducts and their percentage of DF.

Table 8.1
% Dietary fiber from coproducts agroindustrials.
Sources Total Dietary Fiber ReferencesFig 16.53 Sánchez-Zapata et al. (2012)
BananaChía seeds
32.9–51.9 a
37–40Happi Emaga et al. (2007)Reyes-Caudillo et al. (2008)
Lemon albedo 22 Fernández-Ginés et al. (2004)
Raspberry pomace 77.5 Górecka et al. (2010)
Cactus pear peelPineapple peelGuava powderApple marc
64.1562.5446.7270.91
Díaz-Vela et al. (2013)Díaz-Vela et al. (2013)Verma et al. (2013)Cerda-Tapia et al. (2015)
Maguey leaf b 41.44 Castillejos-Gómez et al. (2015)
Orange peel 38.11 Pérez-Chabela et al. (2015a,b)a Depending of the varieties of banana.b Residue from“barbacoa” elaboration. Barbacoa is a Mexican dish elaborated with lambmeat, where the maguey leaves are utilized to retain and transfer heat to meat.
2.1. Classification and CompositionDF can be classified as polysaccharides type, divided into three majorfractions (Schneeman, 1986):
• Structural polysaccharides (cellulose, hemicellulose, and somepectin)
• Structural nonpolysaccharides (lignin)• Nonstructural polysaccharides (gums and mucilage)
But the most widely accepted and used system of classification is on thebasis of solubility and/or the fermentation behavior in an in vitro systemusing an enzyme component, which simulates digestion.
According to their water solubility, DF is conventionally classified into(Esposito et al., 2005):

• Insoluble DF (IDF)/less fermented fiber and soluble dietary fiber(SDF)/well-fermented fibers. Insoluble fiber consists of cellulose,part of hemicellulose and lignin
• Soluble fiber consists of pectin, gums, and mucilage
Soluble fiber is that fraction of the total fiber that is suspended in waterduring analysis. SDF may vary 15%–50% of the total fiber using differentanalytic methods. Nearly all fiber-containing foods have more insolublethan soluble dietary fiber. About two-thirds to three-fourths of the DF intypical mixed-food diets is water insoluble (Marlett, 1997).
2.1.1. CelluloseCellulose consists of long unbranched chains of glucose, (1-4) a linked D-glucopyranose. Cellulose is found in abundance in nature in virtually allplant tissues and is therefore a common component of our diet. Dietarycellulose is not digested in the stomach and small intestine, and 85% arerecoverable in ileostomy contents from subjects fed diets containing usuallyeaten foods (Cummings, 1984). Cellulose is fermented in the large intestineby the microflora producing short chain fatty acids (SCFA), hydrogen,carbon dioxide, and methane.
2.1.2. HemicelluloseHemicellulose are constituted by pentose sugars: arabinose and xylose, andmany of the arabinoxylans have a high water-holding capacity, a propertythat would explain the increase the rate food residue passes through the gut(Holloway et al., 1980). Arabinoxylans are a major component of DF inwhole grains, having considerable inclusions in both the endosperm andbran. During normal wheat flour processing, a majority of thearabinoxylans is removed as a by-product. In the gastrointestinal tract,arabinoxylans acts much like a soluble fiber being rapidly fermented by themicroflora of the colon (Lattimer and Haub, 2010).
2.1.3. PectinsPectic substances are a complex group of polysaccharides in which D-galacturonic acid is a principal constituent. They are structural components

of plant cell walls and also act as intercellular cementing substances. Thebackbone structure of pectin is an unbranched chain of axial-axial-(1-4)-linked D-galacturonic acid units. Long chains of galacturonan areinterrupted by blocks of L-rhamnose-rich units that result in bends in themolecule. Pectin is highly water-soluble and is almost completelymetabolized by colonic bacteria (Kay, 1982). The additives are selectedfrom high-methoxyl varieties, which have higher gelling properties.Amidation also improves the gelling capacity, and amidated pectin is usedin low-sugar jams and as emulsifiers and stabilizers (Southgate, 2001).
2.1.4. LigninLignin can be described as branched networks built up by phenylpropaneunits. Lignin is partly linked to cell wall cellulose and noncellulosicpolysaccharides and serves in principle two main functions. Lignin bondand anchor the cellulose microfibrils and other matrix polysaccharides andin this way stiffens the walls thus preventing biochemical degradation andphysical damage of the walls (Bach Knudsen, 1997).
2.1.5. Mucilage and gumsThe mucilage is synthesized by plant secretory cells, prevent desiccation ofseed endosperm your use in food industry as hydrophilic, stabilizer, forexample, guar. The gums are secreted at the site of plant injury byspecialized secretory cells, your use in food and pharmaceutical(Kay, 1982). Several exudative gums are used as additives and foodingredients. The most widely used gums are the galactomannan gums, guar,and carob bean gums, which are used as thickness in soup and other foods(Southgate, 2001).
2.2. Physiological Effects From the DFLarge amounts of research have reported an inverse relationship betweenfiber consumption and the risk for coronary heart disease and several typesof cancer. For that reason, the FDA has adopted and published the claimthat increased consumption of DF can reduce the prevalence of coronaryheart diseases and cancer. The mechanisms behind these findings are still

unclear. However, it is attributed to several factors, including increasing bileacid excretion, decreased caloric intake, increased SCFA production,carcinogen binding effects, increased antioxidants, and increased vitaminsand minerals. Although not as yet adopted by the FDA, DF is suggested toplay a role in other conditions, such as obesity and diabetes (Lattimer andHaub, 2010). Fig. 8.1 shows the physiological effects of DF, and followingphysiological effects are attributed to DF (Howlett et al., 2012):
• Reduced blood total and/or cholesterol levels• Attenuation of postprandial glycemia/insulinemia• Reduced blood pressure (BP)• Increased fecal bulk/laxation• Decreased transit time• Increased colonic fermentation/SCFA production
FIGURE 8.1 The Physiological Effects of Dietary Fiber.
2.2.1. Lowering cholesterol levels

Fibers may be fermented in the colon into SCFA, such as acetate,propionate, and butyrate. Propionate has been shown to inhibit the activityof the enzyme hydroxy-3-methylglutaryl-CoA reductase, the limitingenzyme for cholesterol synthesis. DF has the ability to bind with bile acidsand prevents their reabsorption in the liver, and thus inhibiting cholesterolsynthesis (Chen et al., 1984). Many studies have shown a positiverelationship between diets rich in SDFs, such as β-glucan (βG) from oatsand barley, pectin from fruits, guar gum, and psyllium, and reduced serumtotal cholesterol and low-density lipoprotein cholesterol (LDL-C) (Gunnessand Gidley, 2010). Babio et al. (2010) examined the effect of different typesand sources of DF on body weight, glucose metabolism, and lipid profile.They concluded that clinical studies consistently show that the intake ofviscous DF decreases the LDL-cholesterol levels.
2.2.2. Postprandial plasma glucose and glycemicattenuationSoluble fiber forms gels in the gastrointestinal tract, and may decrease theabsorption of glucose and cholesterol from the intestinal lumen(Kaczmarczyk et al., 2012). Fujii et al. (2013) demonstrated that theincreased of DF intake was associated with better glycemic control andmore favorable risk factors, including hypertension, metabolic syndrome,and CKD, along with improvements in insulin sensitivity andmicroinflammation, diabetic patients should be encouraged to consumemore DF in daily life according to the ethnic foods. The protective effectmay result from the ability of fiber to lower postprandial glucose peak,which leads to decreased insulin demand and protects the pancreas fromexhaustion (Verma and Banerjee, 2010).
2.2.3. Reduce blood pressureElevated BP is a modifiable major risk factor for cardiovascular morbidity.Pettersen et al. (2012) reported that the diet affects measured BP levels,both systolic and diastolic, with vegans and lacto-ovo vegetarians havinglower BP than nonvegetarians. People may benefit from a diet containingmore plant foods to prevent hypertension. Sánchez-Muniz (2012)speculated that fiber could influence cardiac input/output and total

peripheral resistance by affecting the sympathetic and parasympatheticnervous systems, but data concerning the effects of DFs on BP are scarcerand little is known regarding the mechanisms involved at the present time.
2.2.4. Bulking abilityDF affects bowel function by increasing fecal volume and weight,improving stool consistency, decreasing transit time, and increasing stoolfrequency (Raninen et al., 2011). The fermentation of DF can be increasethe mass bacterial due to the growth and proliferation of bacteria(Slavin, 2013). Insoluble fibers, such as cellulose and lignin, are mostlyunfermentable by colonic microflora and increase fecal bulk by theirparticle formation and water-holding capacity (Elleuch et al., 2011). Wheatbran is among the best bulking agents. Some fermentable hemicellulosefibers, including cabbage, increase fecal bulk by increasing fecal flora. Incontrast, highly fermentable fibers, such as pectin, have little effect on fecalbulk (Mudgil and Barak, 2013).
2.2.5. Fermentation on intestine (increase colonicfermentation)At both the colonic and systemic levels, fermentation and especially SCFAproduction play an integral role. Colonic epithelial cells preferentially usebutyrate as an energy source, even when competing substrates, such asglucose and glutamine, are available. Butyrate is considered a key nutrientdetermining the metabolic activity and growth of colonocytes and mayfunction as a primary protective factor against colonic disorders, althoughdata on this topic are conflicting. SCFAs are water soluble and are absorbedinto the blood stream (Lupton, 2004).
2.3. Fiber Effect in FoodsDF is naturally present in cereals, fruits, vegetables, and nuts. Duringprocessing the foods undergo various physical, chemical, enzymatic, andthermal treatments, which directly or indirectly affect the composition oftotal fiber. Incorporation of fiber can change the consistency, texture,rheological behavior, and sensory attributes of the end products. The

addition of fiber in breakfast cereals, bread, cookies, cakes, yogurt,beverages, and meat products has been reported with favorable results.Fiber can even be produced from sources that might otherwise beconsidered waste products, like agroindustrials coproducts. For example,wheat straw, soy hulls, oat hulls, peanut and almond skins, corn stalks andcobs, spent brewer’s grain and unedible portions of fruits (peel mainly), andvegetables resulted in large quantities of raw matter that can be convertedinto fiber ingredients, which may be highly functional in certain foodapplications (Dhingra et al., 2012).
Nonetheless, in other food the fiber content is poor, mainly in animalorigin foods considered as the main source of protein in diet. Incorporationof fiber from agroindustrial coproducts is a way to enrich the nutritionalcomposition of foods, where these ingredients can act as extenders oftexture modifiers.
2.3.1. Meat productsMeat is an integral component in our diet. Meat is a major source of foodproteins with high biological value, an excellent source of some essentialfats, soluble vitamins, and minerals. But recently, negative campaigns aboutmuscle foods, and their possible health hazard effects, show that consumersare increasingly interested about health-oriented functional meat products.Functional meat products either possess nutritional ingredients that improvehealth or contain lesser quantity of harmful compounds like cholesterol, fat(Biswas et al., 2011). Fernández-Ginés et al. (2004) studied the effect of theaddition of lemon albedo in bologna sausages; they utilized two types ofalbedo: raw and cooked. The addition of albedo to bologna sausagesrepresents a good source of fiber dietary and may have beneficial effects,possibly due to the presence of active compounds that induce a decrease inresidual nitrite levels. The use of orange fiber was studied in salchichón(Spanish dry-fermented sausage). Orange fiber decreases residual nitritelevels and favors micrococcus growth. Both effects have a positive impacton sausage safety and quality. The reduction in residual nitrite decreases therisk of nitrosamine formation (Fernández-López et al., 2008). Cava et al.(2012) evaluated the incorporation of three DF (tomato, beet root, andinulin) in chopped cooked chicken products. The fiber incorporation

reduces the pH of the chicken batters, increases the water-holding capacity,but the color and texture were affected. The tomato fiber increased theredness of the meat products. Sánchez-Zapata et al. (2013b) studied theeffect of the incorporation of tiger nut in chorizo. “Chorizo” is the mostpopular dry-cured meat product in Spain. Tiger nut addition decreases fatand increases moisture and fiber content; there were slight changes in thephysicochemical properties. The addition of tiger nut fiber to Spanish dry-cured sausages provides a healthier product: lesser percentage of fat andmore total DF content. In the same manner, López-Vargas et al. (2014)determined the technological, nutritional, and sensory characteristics ofpork burgers added with passion fruit albedo, obtained from passion fruittechnology. The addition of this coproduct improves their fiber content, thecooking characteristics, and moisture retention. The passion fruit albedo canbe recommended in pork burger production as a DF source. Díaz-Vela et al.(2015) evaluated the integration of agroindustrial coproducts as foodingredients: cactus pear (Opuntia ficus I.) flour and pineapple (Ananascomosus) as fiber source in cooked sausages, the use of fruit peel flourimproved the physicochemical properties of the cooked sausages. Bothtypes of flour increased water retention, increased yield, and decreasedoxidative rancidity in cooked sausages. Fruit peels could be employed as asource of bioactive compounds. Pérez-Chabela et al. (2015b) determinedthe effect the orange peel flour, potato starch, and carrageenan, employing amixture design approach on physicochemical and textural properties ofsausages, fiber in orange peel flour increased moisture, water retention,texture, and decreased oxidative rancidity. Cooked meat productsconditions (temperature and ionic strength) affected the functionality ofmeat extenders like potato starch and carrageenan, indicating that orangepeel flour as a cheap and viable fiber source can replace more expensivemeat extenders, as potato starch and carrageenan. Verma et al. (2015)investigated the efficacy of sweet potato powder and water as a fat replacerin low-fat pork patties. Results concluded that low-fat pork patties withacceptable sensory attributes, improved cooking yield, and texturalattributes can be successfully developed with the incorporation of acombination of 1.0% sweet potato powder and 9.0% chilled water. Hence,the developed product can be marketed as a functional meat product withimproved processing and sensory characteristics.

The DF can improve the health beneficiary characteristics and theconsumer acceptance of meat products added with it. The cholesterol-reducing property of DF is being utilized by meat processors to attract thehealth-conscious consumers worldwide. Various sensory attributes ofprocessed meat products, such as texture, juiciness, and color are variablymodified by the DF addition. The overall acceptance of the DF-added meatproducts has increased positively in recent time (Talukder, 2015). Theincorporation of DFs, either soluble or insoluble, in the meat products isconsidered needed in view of their various health benefits.
2.3.2. Dairy productsMilk contains no fiber. Dairy products have recently come under fire fromresearchers showing the detrimental effects of saturated fat and cholesterolin the body. Researchers reported positive effects of fiber in the diet.Fortification of dairy products using natural resources (fruits, cereal, etc.) isone of the best ways to improve the overall nutrient intake of food withminimal side effects (Abou-Zeid, 2016). Fernández-García and Mcgregor(1997) evaluated the use of seven types of IDF from five different sources(soy, rice, oat, corn, and sugar beet) in yogurt. Fiber addition causedacceleration in the acidification rate of the experimental group yogurts, andmost of the fortified yogurts also showed increases in their apparentviscosity. Soy and sugar beet fibers caused a significant decrease inviscosity due to partial syneresis. In general, fiber addition led to loweroverall flavor and texture scores. The evolution of organic acids during thefermentation and cold storage of yogurts showed a similar pattern; onlyacetic and propionic acids were found in significantly higher amounts in thefiber-fortified product. Sendra et al. (2010) studied the effect of orange fiberaddition on yogurt viscoelastic properties; orange fiber addition modifiesyogurt rheological parameters that remained low fiber doses due to thedisruptive effect of the fiber, where the presence of fiber particles alwaysalters yogurt structure. Ramírez-Santiago et al. (2010) studied the syneresis,microstructure, and rheological properties of yogurt enrichment with SDFfrom Pachyrhizus erosus, an underutilized crop. Their results showed thatthe yogurt with P. erosus displayed a lower syneresis percent, more openand relaxed protein network, and lower elastic and viscous module,

indicating the viability to obtain a commercial product. Staffolo et al.(2012) studied the effect of the interaction between nutrients and fibers(inulin, apple, bamboo) to evaluate the availability for absorption ofglucose, calcium, and iron using yogurt as a food model. Results showedthat the different plant fibers decreased glucose, calcium, and ironavailabilities; these findings could be positive or negative depending on thenutrient and the nutritional stage or health of the population who wouldreceive the food under study. Seckin and Baladura (2012) evaluated theeffect of the addition of apple, bamboo, and wheat DFs on color, texture,and sensory properties of strained yogurt during cold storage. Depending onstorage, the most changed textural parameter is consistency in bamboo,wheat and apple fibrous strained yogurt. L, a, and b values of apple fibrousstrained yogurts were determined to be different in comparison withbamboo and wheat fibrous strained yogurts due to the structure of applefiber. The type of DF caused statistically significant changes in color,texture values, and sensory evaluation scores. Apple fibrous strainedyogurts were not preferred by panelists because of their ragged structure,dominant apple taste, and strong odor. Panelists found bamboo and wheatfiber strained yogurts acceptable. No difference between wheat and bamboofiber addition was detected by the sensory panel. Panelists found bambooand wheat fiber–strained yogurts acceptable. In the same manner, Awadet al. (2014) utilized lupine flours, in the elaboration of imitation processedcheese, processed cheese can be formulated using different types of cheesewith different degrees of maturation, flavorings, emulsifying, salts, and/orseveral ingredients of nondairy components. Nondairy ingredients havebeen used in processed cheese for many dietary and economic reasons. Allprocessed cheeses produced were sensory acceptable but an overallacceptability was lowered by incorporating lupine in the formula. Body andtexture scores of processed cheese were the most affected by increasinglupine ratio in formula without significant difference up to 50% substitutionof the cheese base.
Some special milk to special dietary requirements can be low fat,delactosed, and fortified with SDF. In processed dairy products, like cheeseand yogurt, the fiber incorporation enhances texture besides to offer afermentable substrate for lactic acid bacteria, where fiber acts as a prebiotic.

2.3.3. Cereal productsCereal products are consumed daily by the majority of the populations.These products are rich in carbohydrates and may contribute to the obesityproblem, although now there are enriched products that are a vehicle of DFinto people diet. Górecka et al. (2010) studied the effort to use raspberrypomace, a by-product of food processing, in cookies. Raspberry pomace issourced directly from a fruit-processing plant. The content of DF inraspberry pomace was higher. These by-products were found to be rich incellulose and lignin, and their addition did not have negative influence onorganoleptic characteristics of the product and was accepted by consumers.The substantial DF content of fruit by-products and, in particular, fruitseeds, should attract the interest of dieticians. Ajila et al. (2010) utilized themango peel powder as a potential source of antioxidant and DF inmacaroni. Mango peel is obtained during processing of mango products andis currently discarded and thus, causing environmental pollution. When themango peel powder is added into macaroni, the total content of DFincreased 8.6%–17.8%, but also increased the cooking loss and thefirmness. Mango peel can be utilized for the preparations of macaroni withimproved nutritional properties. In another study, Lópes-Almeida et al.(2013) studied the effects of adding different DF sources (wheat branresistant starch and locust bean gum) on process and quality parameters ofpan bread. Wheat bran was the only fiber source that influenced specificvolume and crumb chroma and hue angle. Wheat bran and locust bean gumcontributed to retaining moisture in the crumb during the whole storageperiod. The acceptance of crust color, crust appearance, aroma, and tastewas not affected by the addition of the different DF. Silva de Paula et al.(2013) characterized cereal bars with high levels of fiber and ω-3 using 0%,5%, 10%, and 20% of linseed. Linseed is an oleaginous that has been usedin the human diet for thousands of years, presents proteins with an aminoacid composition that is similar to soy, and is considered a seed with goodprotein quality among vegetable origin products. This oleaginous is alsorich in DF and the α-linolenic acid (ω-3) concentration in linseed is morethan 50% its lipid content. Their results showed that the calorie value of thecereal bars were around 100 kcal/portion. The formulations containinglinseed presented higher acceptability, and that with 20% of linseed was

found to be the formulation with the best chemical and sensorycharacteristics. Therefore, the addition of linseed in cereal bars is a goodoption to develop a functional product, which may contribute to a healthydiet and to the reduction of several noncommunicable diseases. Total DFand the soluble and insoluble fractions increased as the amount of addedlinseed was higher and the caloric value was similar among the cereal bars.
Wandee et al. (2014) evaluated the use of Cassava pulp and pomelo peelfor their potential as sources of DF in dried rice noodles. Theydemonstrated the potential of using fiber-rich fractions derived fromagricultural product processing to improve qualities and to increase the totalDF content of rice noodles. A combination of cassava pulp and pomelo peelgave the best results. Noodles made from combinations of these fibersources contained about three times higher total DF content and displayedcomparable textural properties and much higher cooking weight, ascompared to the control. A mixture designed from three components (riceflour, cassava pulp, and pomelo peel) might be used as a tool to optimizecomposition and to obtain better noodle quality.
Cereal could be the main source of fiber in the diet, but in the last centuryprocessing eliminated most of the fiber for refined flours. The tendencynow is to produce integral flours with part of the endosperm and other partsof the seed, especially in wheat. Other cereals can be processed moreintegrally, leaving important parts of the fiber in the flours. However,compared with agroindustrial coproducts from fruits and vegetables, cerealfiber as a coproduct is more expensive.
2.4. Fiber Effect In VivoPaturi et al. (2012) evaluated the gastrointestinal transit in 120 Sprague-Dawley rats fed DFs (inulin, potato fiber, maize starch, and cellulose ascontrol). Fermentation of DF in the large intestine results in the productionof short-chain fatty acids—predominantly acetic, butyric, and propionicacids. The results showed that rats fed diets supplemented with inulin,potato fiber, or maize starch resulted in higher cecal SCFA concentrationscompared to rats fed cellulose diet. Pascoal et al. (2013) investigated thefermentation effects on the cecum of 16 Wistar rats treated with dietscontaining onion (source of fructans). The diet supplement with onion

showed an increase in the production of total and individual (propionate,acetate, and butyrate) SCFAs and a decrease in the pH of the cecal contentcompared to control. Pérez-Chabela et al. (2015a) studied the physiologicaleffects of agroindustrial coproducts (O. ficus) pear peel and stripe apple(Malus domestica) marc in 24 Wistar rats using inulin as control. Resultsshowed that diets with coproducts result in higher average body weightgain, reduce glucose and triglycerides in serum, and higher nondigestiblecarbohydrates, apple marc showed similar physiological effects ascompared to inulin for it can be employed as a good prebiotic source.
2.5. Short History of the Methods of Analysisof Dietary FiberVan Soest (1963) reported the first method for the determination of fiberand lignin using detergent. They evaluated the capacity ofcetyltrimethylammonium bromide to dissolve proteins in acid solution. Thismethod was called acid-detergent fiber method, which is not only a fiberdetermination in itself but also the major preparatory step in thedetermination of lignin. Prosky et al. (1985) determined the total DFcontent of food and food products using a combination of enzymatic andgravimetric procedures. Theander et al. (1994) reported the Uppsalamethodology for rapid analysis and characterization of total DF (defined asthe sum of DF polysaccharides and Klason lignin) utilizing a thermostableamylase and amyloglucosidase, method. The Official Method AOAC is the992.16 Total Dietary Fiber Enzymatic–Gravimetric Method is applicable todetermine the total DF in cereals, beans, vegetables, and fruits(AOAC, 2005).
3. Phenolic Compounds in AgroindustrialCoproductsPhenolic compounds are ubiquitous in plants, and when plant foods areconsumed, these phytochemicals contribute to the intake of naturalantioxidants in the human diets. Agroindustrial by-products are goodsources of phenolic compounds, and have been explored as a source of

natural antioxidants (Balasundram et al., 2006). The polyphenols aresecondary plant metabolites and have an important role in the defensesystem of the plant, protecting it from biotic and abiotic stress. Phenoliccompounds also show antimicrobial activity against plant pathogens.Because of their biological role in plants, secondary metabolites are locatedprimarily in the outer layers of fruits and vegetables and in the seeds.During processing, these plant parts are usually removed by peeling or areretained in the press residues (Kosseva, 2013). Table 8.2 shows someagroindustrial coproducts and their phenolic content.
Table 8.2
Polyphenols in coproducts agroindustrials (mg GAE/g).
Sources Polyphenols (mg GAE/g) ReferencesBanana peel 43.2 Bezuneh and Kebede (2015)
Papaya peel 26.6 Bezuneh and Kebede (2015)
Fig 5.72 Sánchez-Zapata et al. (2012)
Guava powder 44.04 Verma et al. (2013)
Apple marc 27.54 Cerda-Tapia et al. (2015)
Orange 12.30 Al-Juhaimi (2014)
Lemon 9.838 Al-Juhaimi (2014)
Mandarin 10.49 Al-Juhaimi (2014)
GAE, Gallic acid equivalent.
3.1. Classification and CompositionWith more than 8000 structural variants, they are secondary metabolites ofplants and denote many substances with aromatic rings bearing one or morehydroxyl moieties (Han et al., 2007). Polyphenols have been classified bytheir source of origin, biological function, and chemical structure. Also, themajority of polyphenols in plants exist as glycosides with different sugarunits, and acylated sugars at different positions of the polyphenol skeletons.

To simplify the discussion, classification of polyphenols in this review isdone according to the chemical structures of the aglycones (Tsao, 2010).
3.1.1. FlavonoidsThe name derives from the Latin “flavus,” which means “yellow.” Apartfrom their physiological roles in plants, flavonoids are importantcomponents of the human diet, although they are not considered as nutrients(Prochazkova et al., 2011). Flavonoids are the most abundant polyphenolsin human diets, and are mainly divided into: (1) anthocyanins, glycosylatedderivative of anthocyanidin, present in colorful flowers and fruits;(2) anthoxanthins, a group of colorless compounds further divided inseveral categories, including flavones, flavans, flavonols, flavanols,isoflavones, and their glycosides. Flavonols are mainly represented bymyricetin, fisetin, quercetin, and kaempferol (Han et al., 2007). Flavonoidsare uses as antioxidants, a term that is commonly used and can be defined inmultiple ways according to the methods to measure their concentration. Thein vitro flavonoid antioxidant activity depends on the arrangement offunctional groups on its core structure. Both the configuration and totalnumber of hydroxyl groups substantially influence the mechanism of theantioxidant activity (Heim et al., 2002).
3.1.2. FlavonolsFlavonols have a double bond between C2 and C3, with a hydroxyl group inthe C3-position. They represent the most ubiquitous flavonoids in foods,with quercetin as the more representative compound. The main sources offlavonols are onions (up to 1.2 g/kg fresh wt.), curly kale, leeks, broccoli,and blueberries (D’Archivio et al., 2007). The biosynthesis of flavonols is aphotosynthetic process, so these compounds are mainly located in the outerand aerial tissue of fruits (Quiñones et al., 2012).
3.1.3. FlavonesFlavones and their 3-hydroxy derivatives flavonols, including theirglycosides, methoxides, and other acylated products on all three rings, makethis the largest subgroup among all polyphenols. The skin of fruits contains

large amounts of polymethoxylathed flavones, like in the skin of mandarinwhich content is up to 6.5 g/L of essential oil of mandarin (Tsao, 2010).
3.1.4. FlavanonesFlavanones comprise a minority group in food, although they appear at highconcentrations in tomatoes and citrus, and in certain aromatic plants, suchas mint. The main aglycones are naringenin in grapefruit, hesperetin inoranges, and eriodictyol in lemons. Orange juices contain 470–761 mg/L ofhesperidin and 20–86 mg/L of narirutin (Leuzzi et al., 2000). Flavanonesare located mostly in the solid parts of the fruit, particularly the whitespongy portion, albedo, and the membranes separating the segments of thefruit), therefore, its concentration is up to five times higher in the fruits thanin juices (Quiñones et al., 2012).
3.1.5. IsoflavonesIsoflavones have structural similarities to estrogens, hydroxyl groups in theC7 and C4 positions, like estradiol molecule. Isoflavones can bind toestrogen receptors and are classified thus as phytoestrogens. They arecontained almost exclusively in leguminous plants, with soya and itsprocessed products as the major source of these compounds, which containthe three main molecules (genistein, daidzein, and glycitein) that occur asalgycones or more often as glucose-conjugated forms (Quiñones et al., 2012). Soybeans contain between 140 and 1530 mg isoflavones/kg freshwt., and soy milk may contain between 12 and 130 mg/L (D’Archivioet al., 2007). Isoflavones are sensitive to heat and are often hydrolyzed toglycosides during industrial processing and storage, like in the productionof soy milk.
3.1.6. AnthocyanidinsAnthocyanidins are water-soluble pigments, responsible for most of the red,blue, and purple colors of fruits, vegetables, flowers, and other plant tissuesor products (Mazza et al., 2004). Anthocyanidins are widely distributed inthe human diet: they are found in red wine, certain varieties of cereals andvegetables, but they are more abundant in fruit. Food contents are generally

proportional to color intensity reaching values up to 2–4 g/kg.Anthocyanins are found mainly in the skin, except for some red fruits(cherries and strawberries) in which they also are present in the flesh(D’Archivio et al., 2007).
3.1.7. FlavanolsFlavanols or flavan-3-ols are often commonly called catechins. Catechin isthe isomer with trans configuration and epicatechin is the one with cisconfiguration. Flavanols are found in many fruits, particularly in the skinsof grapes, apples, and blueberries (Tsao, 2010). Proanthocyanidins, alsoknown as condensed tannins, are dimmers, oligomers, and polymers ofcatechins. Due to their wide range of structures and molecular weight, thecontent of proanthocyanidins in food is difficult to establish, as in the caseof cider apples with a degree of polymerization between 4 and 11 (Guyotet al., 2001). Proanthocyanidins are responsible for the astringent characterof fruit as in grapes, apples, berries as same as in beverage like wine, cider,tea, and beer, and for the bitterness of chocolate (Rasmussen et al., 2005).
3.1.8. Phenolic acidsPhenolic acids are composed of hydroxycinnamic and hydroxybenzoicacids. They are ubiquitous to plant material and sometimes present as estersand glycosides. They have antioxidant activity as chelators and free radicalscavengers with special impact over hydroxyl and peroxyl radicals,superoxide anions, and peroxynitrites (Carocho and Ferreira, 2013). Fruitsand vegetables contain many free phenolic acids (Chandrasekara andShahidi, 2010). In grains and seeds (especially in the brand or hull)phenolic acids are found in the bound form (Adom and Liu, 2002). Theseacids can only be freed or hydrolyzed upon acid or alkaline hydrolysis, orby enzymes (Tsao, 2010).
3.1.9. Hydroxybenzoic acidsThe hydroxybenzoic acids, such as gallic acid and protocatechuic acid, arefound in very few plants eaten by humans. The hydroxycinnamic acidsconsist chiefly of coumaric, caffeic, and ferulic acid that are rarely found inthe free form. The bound forms are glycosylated derivatives or esters of

quinic, shikimic, or tartaric acid (D’Archivio et al., 2007).Hydroxycinnamic acids, the major hydroxycinnamic acid is caffeic acid,which occurs in foods mainly as an ester with quinic acid calledchlorogenic acid (5-caffeoylquinic acid). Chlorogenic acid and caffeic acidare antioxidants in vitro and they might inhibit the formation of mutagenicand carcinogenic N-nitroso compounds for the inhibitory effect on the N-nitrosation reaction in vitro (Han et al., 2007).
3.1.10. StilbenesStilbenes are a small family of plant secondary metabolites derived from thephenylpropanoid pathway, and produced in a number of unrelated plantspecies. These compounds have numerous implications in plant diseaseresistance and human health (Chong et al., 2009). Examples of commonstilbenes isolated from grape wine (Vitis vinifera), pine (Pinus and Picea),peanut (Arachis hypogaea), and sourghum (Sorhum bicolor) (Parageet al., 2012). Resveratrol is one of the most extensively studied stilbenesand is involved with health benefits related with its cardiovascular,chemopreventive, antiobesity, antidiabetic, and neuroprotective properties(Reinisalo et al., 2015). Another interesting stilbene with potential healthproperties is pinosylvin (3,5-hydroxytrans-stilbene), mainly found in theheartwood of Pinus species and at high concentrations in bark waste, thusthis stilbene may represent an inexpensive polyphenols with considerablepotential for diverse health promoting applications (Jeong et al., 2013).
3.1.11. Phenolic alcoholsTyrosol (4-hydroxyphenylethanol) and hydroxityrosol (3,4-dihydroxyphenyletanol) are the main phenolic alcohols that are present inextra virgin olive oil (40.2 and 3.8 mg/kg, respectively) (Cabriniet al., 2001). Tyrosol is also present in red and white wines and beer (Covaset al., 2003), meanwhile hydroxytyrosol is found in red wine but alsoproduced in vivo after its ingestion (De La Torre et al., 2006).
3.1.12. LignansLignans are bioactive, nonnutrient, noncaloric phenolic plant compoundsthat are found in highest concentration in flax and sesame seeds and in

lower concentrations in grains, other seeds, fruits, and vegetables (Petersonet al., 2010). They produced by oxidative dimerization of twophenylpropane units, and are mostly present in nature in the free form,while their glycoside derivatives are only a minor form (D’Archivioet al., 2007). The plant lignans most commonly distributed in foods arelariciresinol, matairesinol, pinoresinol, and secoisolariciresinol (Smedset al., 2007).
3.1.13. Polyphenolic amidesSome polyphenols may have N-containing functional substituents. Twosuch groups of polyphenolic amides are of significance for being the majorcomponents of common foods: capsaicinoids in chilli peppers (Daviset al., 2007). Capsaicinoids, such as capsaicin, are responsible for thehotness of the chilli peppers but have also been found to have strongantioxidant and antiinflamatory properties, as well as the ability to modulatethe oxidative defense system in cells (Tsao, 2010).
3.2. Physiological Effect From PhenolicCompoundsPolyphenols are thought to be responsible for some of the health effectsconferred by a diet rich in fruit and vegetables. Both the formation ofbioactive polyphenol-derived metabolites and the modulation of colonicmicrobiota contribute to these health benefits. Polyphenols may influenceseveral metabolic or signaling pathways involved in cardiovascular disease(CVD), chronic inflammation, bone, gut health, carcinogenesis, and manydegenerative diseases (Bolca et al., 2013).
3.2.1. Antioxidant activity and protection againstoxidative stressPolyphenols are strong antioxidants that complement and add to thefunctions of antioxidant vitamins and enzymes as a defense againstoxidative stress caused by excess reactive oxygen species (ROS). Althoughmost of the evidence of the antioxidant activity of polyphenols is based onin vitro studies, increasing evidence indicates they may act in ways beyond

the antioxidant functions in vivo (Tsao, 2010). Owing to the incompleteefficiency of our endogenous defense systems and the existence of somephysiopathological situations (cigarette smoke, air pollutants, UV radiation,high polyunsaturated fatty acid diet, inflammation, ischemia/reperfusion,etc.) in which ROS are produced in excess and at the wrong time and place,dietary antioxidants are needed for diminishing the cumulative effects ofoxidative damage (Pietta, 2000).
Polyphenols have been found to be strong antioxidants that can neutralizefree radicals by donating an electron or hydrogen atom. Polyphenolssuppress the generation of free radicals, thus reducing the rate of oxidationby inhibiting the formation of or deactivating the active species andprecursors of free radicals (Rice-Evans et al., 1996). Poyphenols can alsofunction as metal chelators. Chelation of transition metals, such as Fe2+ candirectly reduce the rate of Fenton reaction, thus preventing oxidation causedby highly reactive hydroxyl radicals (Perron and Brumaghim, 2009).However, they do not act alone, it has been found that polyphenols canactually function as coantioxidant, and are involved in the regeneration ofessential vitamins (Zhou et al., 2005).
3.2.2. Hypoglycemic effects on diabetes riskThe antidiabetic properties of some dietary polyphenols, suggest thatdietary polyphenols could be one dietary therapy for the prevention andmanagement of type 2 diabetes. Dietary polyphenols may inhibit α-amylaseand α-glucosidase, inhibit glucose absorption, stimulate insulin secretion,and reduce hepatic glucose output (Kim et al., 2016). Hanhineva et al.(2010) suggest that polyphenols may suppress glucose release from theliver, and improve glucose uptake in peripheral tissues by modulatingintracellular signaling.
3.2.3. Cardiovascular protective effectsThe polyphenols could be serious candidates to explain the protectiveeffects of plant-derived foods and beverages. Based on current studies, ageneral consensus has been achieved to sustain the hypothesis that thespecific intake of foods and beverages containing relatively highconcentrations of flavonoids may play a meaningful role in reducing CVD

risk through an improvement in vascular function and a modulation ofinflammation (Habauzit and Morand, 2012). Vasodilator effects are able toimprove lipid profiles and attenuate the oxidation of LDL. In addition, theyhave clear antiinflammatory effects and can modulate apoptotic processesin the vascular endothelium (Quiñones et al., 2013). Some wines, grapejuices, and grape skin extracts caused endothelium-dependent relaxations inaortic rings. Other studies confirmed that polyphenol-rich sources, such asextracts from red wines, green and black tea, and several plants causedendothelium-dependent relaxations in large arteries, arterioles, and veinsthat were prevented by competitive inhibitors of eNOS and guanylylcyclase (Andriantsitohaina et al., 2012).
3.2.4. Neurodegenerative protective effectsExcess production of ROS in the brain has been implicated as a commonunderlying risk factor for the pathogenesis of a number ofneurodegenerative disorders, including Alzheimer’s disease and Parkinson’sdisease. The resveratrol is an antioxidant and antiinflammatory but alsoactivated the sirtuin 1 (SIRT1) and vitagenes, which can prevent thedeleterious effects triggered by oxidative stress (Sun et al., 2010). In thecentral nervous system, the oral administration of green tea polyphenols andflavonoid-related compounds has been shown to inhibit iron-induced lipidperoxide accumulation and age-related accumulation of neurotoxic lipidperoxides (Nie et al., 2002). Epigallocatechin gallate (EGCG) postponedthe onset of neurological symptoms and prolonged life span in a micemodel of amyotrophic lateral sclerosis. Long-term treatment with EGCGincreased the life span and enhanced movement abilities in a transgenicDrosophila melanogaster model of postdoctoral studies (Ebrahimi andSchluesener, 2012).
3.2.5. Cancer protective effectsCancer is a major health problem and the main cause of death worldwide,affecting millions of people. The number of deaths resulting from cancerincreases from low- to high-income countries, although incidence of canceris now increasing in less developed countries as they succeed in achievinglifestyles similar to those observed in developed countries (Siegel

et al., 2012). The phenolic antioxidants are isolated from plants and plant-derived food, or commercially available (synthetic ones). The mostcommonly diagnosed cancers worldwide are lung (12.7%), breast (10.9%),colorectal (9.7%), and stomach (7.81%), among others (Roleiraet al., 2015).
Huang et al. (2010) studied the antimetastatic effects of the synthetizedhispolon (a phenolic compound of the mushroom Phellinus linteus) on ahighly metastaic human liver carcinoma cell lines, as well as its mechanismof action. Their results suggest that this phenolic compound inhibit themetastasis of the cellular lines by different mechanism, mainly by inhibitingmatrix metalloproteinase-2/9 and urokinase-plasminogen activator throughthe PI3 K/Akt and ERK signaling pathways. Many potential mechanismshave been proposed, including both antioxidant and prooxidant effects, butquestions remain regarding the relevance of these mechanisms to cancerprevention (Lambert and Elias, 2010). Polyphenols may exert theseanticancer effects via a variety of mechanisms, including removal ofcarcinogenic agents, modulation of cancer cell signaling, and cell cycleprogression, promotion of apoptosis and modulation of enzymatic activities(Vauzour et al., 2010).
3.3. Phenolic Compounds in FoodsIn same manner as fiber addition, the use of agroindustrial coproductsderived from fruit (like peels) represents as well an important source ofbioactive ingredients like phenolic compounds, with several importantbiological functions, as described earlier. The incorporation of fibers orflours from fruit peels in the best way to improve nutritional value ofanimal origin foods, even if cereal products derived from no-pigmentedseeds are poor in phenolic compounds content.
3.3.1. Meat productsVerma et al. (2013) explored the potential antioxidant and value functionalvalue of guava (Psidium guajava L.) powder in sheep meat nuggets Theresults of this study exhibited that guava powder is a rich source of DF,most of which present in an insoluble form and also possesses great

antioxidant potential, such as radical scavenging activity and ferric reducingantioxidant power. Guava powder is also a rich source of phenoliccompounds (44.04 mg GAE/g). Incorporation of guava powdersignificantly affected the physicochemical properties of the products. Themost significant effect of guava powder addition in sheep meat nuggets isenrichment of the products with DF and phenolic compounds. Guavapowder improved the redness value of the product, thus its appearance.Incorporation of guava powder could protect cooked sheep meat nuggetsagainst lipid oxidation during refrigerated storage. Incorporation of guavapowder up to 1% level did not affect the product’s organoleptic attributes.Thus, guava powder can be used as a source of antioxidant DF in sheepmeat nuggets without affecting their acceptability. Sánchez-Zapata et al.(2013a) evaluated the effect of the addition of tiger nut fiber in a dry-curedsausage. Tiger nut fiber increases oxidation stability, probably due to thecontribution of the bioactive compounds with antioxidant properties.Castillejos-Gómez et al. (2015) utilized the maguey leaves (these arediscarded after barbacoa elaboration) as fiber and antioxidant sources onphysicochemical properties and oxidative rancidity of cooked porksausages. Maguey leaf flour had no effect on physicochemical and texturalproperties of cooked sausages, but the lipid stability was notably improvedby the incorporation of maguey leaf flours. Maguey leaf flour frombarbacoa elaboration is a good source of antioxidant compounds, and itsapplication to cooked meat products, such as sausages, can be compensatedby employing another extender in the formulation.
One of the major advantages of incorporating phenolic compounds inmeat products is to avoid the fatty acids oxidation. Most meat products hadfat in their formulation, and this fat is responsible of texture andcharacteristic flavor. Retarding the development of rancidity duringmaturation or storage of meat products is important.
3.3.2. Dairy productsSun-Waterhouse et al. (2012) studied the addition of polyphenols to yogurtto deliver the health benefits of polyphenols and also the probiotic effects ofstarter cultures. These compounds can be added via two approaches:prefermentation approach (adding polyphenols before fermentation as part

of the yogurt ingredient mixing) or postfermentation approach (addingpolyphenols after fermentation as a part of the usual practice for improvingflavor and color agents). Their results showed that the polyphenols contentaffect the viscosity, storage modulus of yogurt, and other properties. Thesame authors in 2013 compared the effects of adding purified berrypolyphenols PP (cyaniding-3-O-β-glucopyranoside-chloride, Cyanindin) ora blackcurrant PP extract (BPE) before or after fermentation on thechemical, rheological, and microbiological properties of drinking yogurtsformulated with low- or high-methoxy (LM or HM) pectin. Results showedthat the incorporation of BPE before fermentation led to the presence ofsmall phenolic molecules (mainly phenolic acids) in the yogurt 3.5–3.9times greater than added after fermentation. Fermentation also influencedthe PP profiles of yogurt. Adding BPE and Cyanidin before fermentationaffected the colony number and appearance of starter cultures,Streptococcus thermophilus and Lactobacillus delbrueckii subsp.bulgaricus, as well as the elastic property and viscosity of the resultantyogurts. Carocho et al. (2015) evaluated the incorporation of decoctedextracts and dried chestnut flowers and lemon balm plants in “Serra daEstrela,” a Portuguese cheese produced from cattle milk, in order tofunctionalize and provide antioxidant activity to this product. The cheesesshowed higher antioxidant activity, mainly by lipid peroxidation inhibition.It was also observed that the incorporation of dried plants appeared to bemore effective that decoctions. Rashidinejad et al. (2016) evaluated theincorporation of green tea extract (GTE) into full-fat cheeses at 250, 500,and 1000 ppm, to determine the effect of green tea catechins on antioxidantproperties and microstructure of cheese, and recovery of catechins. Resultsshowed that the incorporation of GTE significantly decreased the pH ofwhey and curd during cheese manufacture and ripening (P < 0.05),nonetheless there was no significant (P > 0.05) effect on moisture, protein,or fat contents. Microscopy images showed that distribution of milk fatglobules entrapped in casein proteins was disrupted by GTE, contrary to theregular and homogeneous structure showed in the ripened control cheese.Ribeiro et al. (2016) evaluated the incorporation of rosemary (Rosmarinusofficinalis L.), a woody and aromatic Mediterranean plant, with numerousreported bioactivities (antioxidant, antiinflammatory, antimicrobialantidiabetic, and hepatoprotective). Results showed a decrease of

bioactivity for the cheese sample enriched with the free form after 7 daysunder storage; in contrast the microencapsulated form extracts maintainedtheir antioxidant properties more efficiently through the time of storage thusincreasing the bioavailability upon digestion.
Phenolic compounds in dairy products are most employed to improvefermentation because fat content is relatively lower as compared to meatproducts. Polyphenols also are employed to improve nutritional value ofyogurts, being an important source of probiotics, in addition to prebioticsand antioxidants when are added into formulation.
3.3.3. Cereal productsCereals are the most important food for human in the world. Wheat, maize,rice, and barley are considering the major agricultural cereal grains in theworld. Additionally, eight cereal grains: wheat, maize, rice, barley,sorghum, oats, rye, and millet provide 56% of the food energy and 50% ofthe protein consumed on earth. Recent studies indicate that cereal grainscontain significant amounts of phenolic compounds, which are related toreduced risk of chronic diseases. Del Nobile et al. (2009) studied theincorporation of some natural antimicrobial compounds, thymol, lemonextract, and grape fruit seed extract into refrigerated amaranth-basedhomemade fresh pasta products to enhance their microbial stability. Theirresults showed that grape extract strongly increases the microbial thresholdagainst the target microorganisms. The most effective antimicrobialcompound was thymol, which reduced the growth of psychrotrophic andmesophilic bacteria, and also Staphylococcus spp., having no significantinhibiting effect against total coliforms. On the other hand, lemon extractwas the least effective in delaying microbial growth, especially on totalpsychrotophic and mesophilic bacteria. Neither of these natural compoundsshowed a significant influence on the sensorial characteristics of theproducts elaborated with them. Anson et al. (2010) studied thebioaccessible compounds from wheat fractions of aleurone, brand, and flourafter their digestion in a dynamic in vitro model of the uppergastrointestinal tract. Results showed that bioaccessible compounds fromaleurone had the highest antioxidant capacity and provide a prolongedantiinflammatory effect that those of brand and flour. Sun-Waterhouse et al.

(2011) studied the effects of added fruit polyphenols and pectin on therheological and physicochemical properties of breads; their results showedthat breads containing added polyphenols and pectin affected theinteractions between water and bread components (such as gluten proteins)during dough development and bread baking, causing differences in breadcrosslinking microstructure and textural properties, which ultimatelyinfluenced the extractability and/or stability of added polyphenols. Misanet al. (2011) reported that the mixture of ethanolic extracts of somemedicinal plants of parsley, buckthorn, mint, caraway, and their mixturecalled “Vitalplant” can retard the process of lipid oxidation in cookies.Significantly different amounts of total phenolics were reported amongextracts, with a greater content in mint and the lowest in caraway. Theaddition of “Vitalplant” at 2%, 4%, and 6%, improved antioxidant activityand oxidative stability of the cookies in a dose-dependent manner. Yu et al.(2013) investigated the antioxidant properties of refined and whole wheatflour in bread elaborated with each. The data showed that whole wheat flourand bread have superior in vitro antioxidant properties with respect torefined flour and bread elaborated with it.
Polyphenols from agroindustrial coproducts are employed asantimicrobials and antioxidants in cereal foods. Probably the fiber content isadequate, but lacking of pigments made possible the incorporation of thesecompounds.
3.4. Phenolic Compounds Effects In VivoQingming et al. (2010) evaluated the in vivo antioxidant activity of maltextract from barley in Kunming mice. Scavenging effects on the hydroxyland superoxide radicals, and protection against ROS-induced lipid, protein,and DNA damage were evaluated. The ability of malt extract to behave asan antioxidant was evaluated by inducing mice with D-galactose. Results inboth in vitro and in vivo evidenced its ability to scavenge hydroxyl andsuperoxide radicals, high-reducing power, and protection againstmacromolecular (lipid, proteins, and DNA) oxidation damage. Theyconcluded that the malt can be used as an antioxidant for diseases caused byROS. Price et al. (2012) studied the effects of a diet high in wheat aleuroneon plasma antioxidants status, markers of inflammation, and endothelial

function. Seventy-nine healthy, older, overweight Northern Ireland peopleincorporated either aleurone-rich cereal products (27 g aleurone/day), orcontrol products balanced for fiber and macronutrients, into their habitualdiets during 4 weeks. The results showed that, compared to the control,consumption of aleurone-rich products provided substantial amounts ofmicronutrients and phytochemicals, which may function as an antioxidant.
3.5. Methods of Analysis of PhenolicCompoundsThe methods available for measuring the total antioxidant capacity dependon the chemical principles of antioxidant capacity assays and the reactionsinvolved in each one. The assays can be classified into two types: (1) assaysbased on hydrogen atom transfer (HAT) reactions, and (2) assays based onsingle electron transfer (SET). The majority of the HAT-based assays applya competitive reaction scheme, in which antioxidant and substrate competefor thermally generated peroxyl radicals through the decomposition of azo-compounds (Huang et al., 2005). Characteristics that should be consideredin the standardization of an assay include (1) analytical range, (2) recovery,(3) repeatability, (4) reproducibility, and (5) recognition of interferingsubstances (Pryor et al., 2005).
The SET-based assays measure the capacity of an antioxidant in thereduction of an oxidant, which changes color when reduced, and are themost employed. The degree of color change is correlated with the sample’santioxidant concentrations. The SET-based assays include the total phenolsassay by Folin–Ciocalteu reagent (FCR), Trolox equivalence antioxidantcapacity, ferric ion reducing antioxidant power (FRAP), “total antioxidantpotential” assay using a Cu (II) complex as an oxidant and DPPH (Huang et al., 2005; Pryor et al., 2005; Somogyi et al., 2007). The FCR is thesimplest and is widely used for the evaluation of the antioxidant potential.This method is based on the FCR (simple Folin or phosphomolybdateassay). It is a slightly yellowish golden mixture of hexavalent salts of Moand W in acidic media that are reduced to blue-color complexes, mainly bythe phenolic hydroxyls. The color develops completely after addition of analkaline salt, such as sodium carbonate. Today, FCR is used to measure the

total polyphenolic content in foods and beverages. As a standard referencecompound, gallic acid, a compound cheaply available in very pure form,endowed of an average reactivity. Therefore, the total phenolic content isconventionally expressed as Gallic acid equivalent (mg/L GAE). The bluecolor produced by the FCR with the phenolics is measured by colorimetryat 700–765 nm (Singleton and Rossi, 1965). This test does not entail anyspecial sample preparation other than homogenization of the sample,followed by centrifugation when necessary. Generally, this test gives thefirst information on the overall phenolic content in a sample, an importantdata in view of further analyses (Miniati, 2007).
4. PrebioticsGiven the burden and risk of microbial-associated gastroenteritis, the routeof using prebiotics to fortify the gut flora and improve colonizationresistance holds much potential. Prebiotics have powerful stimulatoryeffects upon the bifidobacteria that, in turn, exert several antipathogenicmechanisms. Future challenges may include an extrapolation of theprebiotic concept into antiadhesive aspects (Gibson et al., 2005). Considerthe following points:
• Although all prebiotics are fiber, not all fiber is prebiotic.Classification of a food ingredient as a prebiotic requires scientificdemonstration that the ingredient: resists gastric acidity, hydrolysisby mammalian enzymes, and absorption in the uppergastrointestinal tract.
• It is fermented by the intestinal microflora.• It selectively stimulates the growth and/or activity of intestinal
bacteria, potentially associated with health and well-being(Roberfroid, 2008).
The majority of the scientific data (both experimental and human) onprebiotic effects have been obtained using food ingredients/supplementsbelonging to two chemical groups: fructooligosaccharides (FOS), theexample more important are inulin and the galactooligosaccharides (GOS)

(Roberfroid et al., 2010). Another possible candidate as a prebiotic islactulose.
4.1. FructooligossacharidesFOS are oligosaccharides that occur naturally in plants, such as onion,chicory, garlic, asparagus, banana, artichoke. They are composed of linearchains of fructose units, linked by β (2-1) bonds. The number of fructoseunits ranges from 2 to 60 and often terminate in a glucose unit. The lengthof the chain ranges from 2 to 60 (Sabater-Molina et al., 2009). The mostcommon and studied method to produce FOS is by the transfructosylationof sucrose in a two-stage process (Singh and Singh, 2010). FOS presentsimportant physicochemical and physiological properties beneficial to thehealth of consumers. For this reason, their use as food ingredients hasincreased rapidly, presenting a significant growth on the functional foodmarket all over the world (Dominguez et al., 2014).
4.1.1. InulinInulin is a polymer of fructose monomers and is present in such foods asonions, garlic, wheat, artichokes, and bananas and is used to improve tasteand mouth feel in certain applications. It is also used as a functional foodingredient due to its nutritional properties. Inulin may be can be used as areplacement for fat or soluble carbohydrates without affecting the taste andtexture and still contribute to a foods nutritional value. Enzymatichydrolyses in the small intestine is minimal (<10%) because inulin consistsof beta bonds and is completely metabolized by the microflora; by this, it isconsidered a prebiotic (Lattimer and Haub, 2010).
4.2. GalactooligosaccharidesGOS are nondigestible, carbohydrate-based food ingredients that canenhance health-related physiological activities (production of SCFAs(Sangwan et al., 2011). GOS molecules are typically synthesized by theenzymatic activity of β-galactosidase on lactose in a reaction known astransgalactosylation (Lomer et al., 2008). GOS provide their health benefitsby two main mechanisms: one is by selective proliferation of beneficial

bacteria especially bifidobacteria and lactobacilli in the gut, which provideresistance against colonization of pathogens thereby reducing exogenousand endogenous intestinal infections (Sangwan et al., 2011). GOS aremainly used in infant milk formula, and may be able to be incorporated intoa wide variety of other foods as: beverages (fruit juices and other aciddrinks), meal replacers, fermented milks, flavored milks, and confectioneryproducts (Playne et al., 2009). Commercially available GOS products aremixtures of galactose-based oligosaccharides with varying degrees ofpolymerization and linkage configuration. GOS are safe and well-toleratedingredients up to intake levels of 20 g/day; they have GRAS status in theUnited States, FOSHU status in Japan, and can be included in the DFcontent of foods (Torres et al., 2010).
4.3. LactuloseLactulose is caused by the isomerization of lactose to generate thedisaccharide galactosyl-β-1,4-fructose (Venema and Do Carmo, 2015),which is present in milk and dairy products, causing acidification of theintestinal environment and a decrease in pH, and is a substrate forbifidobacteria and lactobacilli (Caselato de Sousa et al., 2011). In the largeintestine, lactulose is metabolized by some species of the colonicmicroflora, which exhibit a matching galactosidase activity. This selectivemetabolism of lactulose alters the microbial balance and the biochemicalcomposition of cecal contents (Schuster-Wolff-Bühring et al., 2010).
Lactulose is applied in a wide variety of foods as a bifidus factor or as afunctional ingredient for intestinal regulation. In addition to providinguseful modifications to food flavor and physicochemical characteristics,many of these sugars possess properties that are beneficial to the health ofconsumers. Additionally, lactulose can be used as a sweetener for diabetics,too. It also has some properties with desirable effects in food products, suchas flavor-enhancing properties, favorable browning behavior, and excellentsolubility in water (Panesar and Kumari, 2011).
4.4. Prebiotic Activity In Vitro

Sendra et al. (2008) studied the incorporation of Lactobacillus acidophilus,Lactobacillus casei, and Bifidobacterium bifidum with lemon and orangefibers. Citrus fibers enhanced bacterial growth and survival of the testedprobiotic bacteria. This study indicated that citrus fibers have goodacceptability and are good vehicles for a variety of commercial probiotics.Díaz-Vela et al. (2013) evaluated the cactus pear and pineapple peel floursas an alternative carbon source during fermentation from lactic acid bacteriawith probiotic potential, cactus pear peel, and pineapple peel floursproduced acceptable results as a carbon source, obtaining satisfactoryprebiotic properties. In conclusion, cactus pear and pineapple peel flourscan be used as functional ingredient due to their fermentable properties inaddition to their high total DF and antioxidant properties. The prebioticactivity of grapefruit albedo was evaluated with two lactic acid bacteriastrains; the results showed a specific growth rate was higher and with alower duplication time, SCFA production confirms the prebiotic potential ofthis coproduct (Parra-Matadamas et al., 2015). Ozcan and Kurtuldu (2014)studied the effects of using DF barley and oat β-glucan as a prebiotic on theviability of B. bifidum in probiotic yogurt and properties of yogurt duringstorage were investigated. The survival of B. bifidum was withinbiotherapeutic level (>7 log cfu/g) as a result of the prebiotic effect ofbarley- and oat-based β-glucan. The addition of β-glucan to yogurtsignificantly affected physicochemical properties including pH, titratableacidity (LA%), whey separation, color (L*, a*, b*), and sensorial propertiesof yogurts. β-glucan can be used on the development of cereal-basedfunctional dairy products with sufficient viability and acceptable sensorycharacteristics.
5. Future Perspectives for CoproductsAgroindustrialsAgroindustrial coproducts are a rich source of nutrients, like fiber andpolyphenols. Their processing to convert this food industry disposal intoadded-value functional food ingredients is now being studied and is apromissory line of investigation and business opportunity. Countries withthe adequate wheat allow fruits cultivation and can use the overproduction

of noncommercial, some fruits in addition to employ the peels derived fromjuice processing. These processed coproducts are the source of fiber andantioxidants.
Encapsulation with agroindustrial coproducts is another novel applicationto improve food functionality. On the one hand, it serves as protection forprobiotics during and after food manufacturing, shelf life, and consumption.On the other hand, both prebiotic and probiotic can be incorporated as afunctional ingredient.
6. ConclusionsAgroindustrial coproducts are a cheap and available source of functionalingredients like fiber, antioxidants, and prebiotics. The use of thesecoproducts as food ingredients decrease the environmental impact if theseare not correctly disposed, because they are organic matter. In same manner,fruit peels are cheaper underemployed resources than cereal coproducts.Their applications can cover almost all processed food products, especiallyanimal origin foods.

ReferencesAmerican Association Cereal Chemist (AACC) Report The definition of dietary fiber. Cereal Foods
World. 2001;46:112–126.Abou-Zeid NA. The nutraceutical effects of dairy products fortification with plant components: a
review. IJARSET. 2016;3:1475–1482.Adom KK, Liu RH. Antioxidant activity of grains. J. Agric. Food Chem.. 2002;50:6182–6187.Aguedo M, Kohnen S, Rabetafika N, Vanden Bossche S, Sterckx J, Blecker C, Beauve C, Paquot M.
Composition of by-products from cooked fruit processing and potential use in food products. J.Food. Compos. Anal.. 2012;27:61–69.
Ajila CM, Aalami M, Leelavathi K, Rao UJSP. Mango peel powder: a potential source of antioxidantand dietary fiber in macaroni preparations. Innov. Food Sci. Emerg. Technol.. 2010;11:219–224.
Al-Juhaimi FY. Citrus fruits by-products as sources of bioactive compounds with antioxidantpotential. Pak. J. Bot.. 2014;46:1459–1462.
Andriantsitohaina R, Auger C, Chataigneau T, Etienne-Selloum N, Li H, Martinez MC, Schini-KerthVB, Laher I. Molecular mechanisms of the cardiovascular protective effects of polyphenols. Br. J.Nutr.. 2012;108:1532–1549.
Anson NM, Havenaar R, Bast A, Haenen GRMM. Antioxidant and anti-inflammatory capacity ofbioaccessible compounds from wheat fractions after gastrointestinal digestion. J. Cereal Sci..2010;51:110–114.
AOAC International. In: Horwitz W, Latimer GW, eds. Official Methods of Analysis of AOACInternational. eighteenth ed. Gaithesburg, MD, United States: AOAC International; 2005.
Awad RA, Salama WM, Farahat AM. Effect of lupine as cheese base substitution on technologicaland nutritional properties of processed cheese analogue. Acta Sci. Pol. Technol. Aliment..2014;13:55–64.
Babio N, Balanza R, Basulto J, Bullo M, Salas-Salvado J. Dietary fibre: influence on body weight,glycemic control and plasma cholesterol profile. Nutr. Hosp.. 2010;25:327–340.
Bach Knudsen KE. Carbohydrate and lignin contents of plant materials used in animal feeding. Anim.Feed Sci. Technol.. 1997;67:319–338.
Balasundram N, Sundram K, Samman S. Phenolic compounds in plants and agri-industrial by-products: antioxidant activity, occurrence, and potential uses. Food Chem.. 2006;99:191–203.
Bezuneh TT, Kebede EM. UV-visible spectrophotometric quantification of total poliphenol inselected fruits. Int. J. Nutr. Food Sci.. 2015;4:397–401.
Biswas AK, Kumar V, Bhosle S, Sahoo J, Chatli MK. Dietary fibers as functional ingredients in meatproducts and their role in human health. Int. J. Livest. Prod.. 2011;2:45–54.
Bolca S, Van De Wiele T, Possemiers S. Gut metabotypes govern health effects of dietarypolyphenols. Curr. Opin. Biotechnol.. 2013;24:220–225.
Borrelli RC, Esposito F, Napolitano A, Ritieni A, Fogliano V. Characterization of a new potentialfunctional ingredient: coffee silverskin. J. Agric. Food Chem.. 2004;52:1338–1343.
Cabrini L, Barzanti V, Cipollone M, Fiorentini D, Grossi G, Tolomelli B, Zambonin L, Landi L.Antioxidants and total peroxyl radical-trapping ability of olive and seed oils. J. Agric. FoodChem.. 2001;49:6026–6032.

Carocho M, Barreira JCM, Antonio AL, Bento A, Morales P, Ferreira ICFR. The incorporation ofplant materials in “Serra da Estrela” cheese improves antioxidant activity without changing thefatty acid profile and visual appearance. Eur. J. Lipid Sci. Technol.. 2015;117:1607–1614.
Carocho M, Ferreira ICFR. A review on antioxidants, prooxidants and related controversy: naturaland synthetic compounds, screening and analysis methodologies and future perspectives. FoodChem.Toxicol.. 2013;51:15–25.
Caselato de Sousa VM, Santos E, Sgarbieri V. The importance of prebiotics in functional foods andclinical practice. Food Nutr. Sci.. 2011;2:133–144.
Castillejos-Gómez BI, Totosaus A, Pérez-Chabela ML. Use of maguey (Agave spp.) leaves as asource of functional ingredients in cooked sausages elaboration. In: García S, García-Galindo HS,Nevárez-Moorillón GV, eds. Advances in Science, Biotechnology and Safety of Foods. A.C.Ciudad de México: AMECA Asociación Mexicana de Ciencias de los Alimentos; 2015:163–170.
Cava R, Ladero L, Cantero V, Rosario Ramírez M. Assessment of different dietary fibers (tomatofiber, beet root fiber, and inulin) for the manufacture of chopped cooked chicken products. J.Food Sci.. 2012;77:C346–C352.
Cerda-Tapia A, Perez-Chabela ML, Perez-Alvarez JA, Fernandez-Lopez J, Viuda-Martos M.Valorization of pomace powder obtained from native Mexican apple (Malus domestica var.rayada): chemical techno-functional and antioxidant properties. Plant Foods Hum. Nutr..2015;70:310–316.
Chandrasekara A, Shahidi F. Content of insoluble bound phenolics in millets and their contributionto antioxidant capacity. J. Agric. Food Chem.. 2010;58:6706–6714.
Chen WJL, Anderson JW, Jenkins DJA. Propionate may mediate the hypocholesterolemic effects odcertain soluble plants fibers in cholesterol-fed-rats. Proc. Soc. Exp. Biol. Med.. 1984;175:215–218.
Chong J, Poutaraud A, Hugueney P. Metabolism and roles of stilbenes in plants. Plant Sci..2009;177:143–155.
Covas MI, Miro-Casas E, Fito M, Farre-Albadalejo M, Gimeno E, Marrugat J, De La Torre R.Bioavailability of tyrosol, an antioxidant phenolic compound present in wine and olive oil, inhumans. Drugs Exp. Clin. Res.. 2003;29:203–206.
Cummings JH. Cellulose and the human gut. Gut. 1984;25:805–810.D’Archivio M, Filesi C, Di Benedetto R, Gargiulo R, Giovannini C, Masella R. Polyphenols, dietary
sources and bioavailability. Ann. Ist Super. Sanita. 2007;43:348–361.Davis CB, Markey CE, Busch MA, Busch KW. Determination of capsaicinoids in habanero peppers
by chemometric analysis of UV spectral data. J. Agric. Food Chem.. 2007;55:5925–5933.De La Torre R, Covas MI, Pujadas MA, Fito M, Farre M. Is dopamine behind the health benefits of
red wine? Eur. J. Nutr.. 2006;45:307–310.Del Nobile MA, Di Benedetto N, Suriano N, Conte A, Lamacchia C, Corbo MR, Sinigaglia M. Use
of natural compounds to improve the microbial stability of Amaranth-based homemade freshpasta. Food Microbiol.. 2009;26:151–156.
Dhingra D, Michael M, Rajput H, Patil RT. Dietary fibre in foods: a review. J. Food Sci. Technol..2012;49:255–266.
Díaz-Vela J, Totosaus A, Cruz-Guerrero AE, De Lourdes Pérez-Chabela M. In vitro evaluation of thefermentation of added-value agroindustrial by-products: cactus pear (Opuntia ficus-indica L.) peel

and pineapple (Ananas comosus) peel as functional ingredients. Int. J. Food Sci. Technol..2013;48:1460–1467.
Díaz-Vela J, Totosaus A, Pérez-Chabela ML. Integration of agroindustrial co-products as functionalfood ingredients: cactus pear (Opuntia ficus indica) flour and pineapple (Ananas comosus) peelflour as fiber source in cooked sausages inoculated with lactic acid bacteria. J. Food Process.Preserv.. 2015;39:2630–2638.
Dominguez AL, Rodrigues LR, Lima NM, Teixeira JA. An overview of the recent developments onfructooligosaccharide production and applications. Food Bioprocess. Technol.. 2014;7:324–337.
Ebrahimi A, Schluesener H. Natural polyphenols against neurodegenerative disorders: potentials andpitfalls. Ageing Res. Rev.. 2012;11:329–345.
Elleuch M, Bedigian D, Roiseaux O, Besbes S, Blecker C, Attia H. Dietary fiber and fiber-rich-by-products of food processing: characterisation, technological functionality and commercialapplications: a review. Food Chem.. 2011;124:411–421.
Esposito F, Arlotti G, Maria Bonifati A, Napolitano A, Vitale D, Fogliano V. Antioxidant activityand dietary fibre in durum wheat bran by-products. Food Res. Int.. 2005;38:1167–1173.
FAO, 2011. Global Food Losses and Food Waste-Extent, Causes and Prevention. Rome.Fernández-García E, Mcgregor UJ. Fortification of sweetened plain yogurt with insoluble dietary
fiber. Z. Lebensm. Unters. Forsch. A. 1997;204:433–437.Fernández-Ginés JM, Fernandez-Lopez J, Sayas-Barbera E, Sendra E, Perez-Alvarez JA. Lemon
albedo as a new source of dietary fiber: application to bologna sausages. Meat Sci.. 2004;67:7–13.Fernández-López J, Sendra E, Sayas-Barbera E, Navarro C, Perez-Alvarez JA. Physico-chemical and
microbiological profiles of “salchichon” (Spanish dry-fermented sausage) enriched with orangefiber. Meat Sci.. 2008;80:410–417.
Fisher J. Fruit fibers. In: Cho SS, Almeida N, eds. Dietary Fiber and Health. Boca Raton, FL, UnitedStates: CRC Press; 2012:409–420.
Fujii H, Iwase M, Ohkuma T, Ogata-Kaizu S, Ide H, Kikuchi Y, Idewaki Y, Joudai T, Hirakawa Y,Uchida K, Sasaki S, Nakamura U, Kitazono T. Impact of dietary fiber intake on glycemic control,cardiovascular risk factors and chronic kidney disease in Japanese patients with type 2 diabetesmellitus: the Fukuoka Diabetes Registry. Nutr. J.. 2013;12:159–167.
Galanakis CM. Recovery of high added-value components from food wastes: conventional, emergingtechnologies and commercialized applications. Trends Food Sci. Technol.. 2012;26:68–87.
Gibson GR, Mccartney AL, Rastall RA. Prebiotics and resistance to gastrointestinal infections. Br. J.Nutr.. 2005;93(Suppl 1):S31–S34.
Górecka D, Pacholek B, Dziedzic K, Górecka M. Raspberry pomace as a potential fiber source forcookies enrichment. Acta Sci. Pol. Technol. Aliment.. 2010;9:451–461.
Gunness P, Gidley MJ. Mechanisms underlying the cholesterol-lowering properties of soluble dietaryfibre polysaccharides. Food Funct.. 2010;1:149–155.
Guyot S, Marnet N, Drilleau J. Thiolysis-HPLC characterization of apple procyanidins covering alarge range of polymerization states. J. Agric. Food Chem.. 2001;49:14–20.
Habauzit V, Morand C. Evidence for a protective effect of polyphenols-containing foods oncardiovascular health: an update for clinicians. Ther. Adv. Chronic Dis.. 2012;3:87–106.
Han X, Shen T, Lou H. Dietary polyphenols and their biological significance. Int. J. Mol. Sci..2007;8:950–988.

Hanhineva K, Torronen R, Bondia-Pons I, Pekkinen J, Kolehmainen M, Mykkanen H, Poutanen K.Impact of dietary polyphenols on carbohydrate metabolism. Int. J. Mol. Sci.. 2010;11:1365–1402.
Happi Emaga T, Andrianaivo RH, Wathelet B, Tchango JT, Paquot M. Effects of the stage ofmaturation and varieties on the chemical composition of banana and plantain peels. Food Chem..2007;103:590–600.
Heim KE, Tagliaferro AR, Bobilya DJ. Flavonoid antioxidants: chemistry, metabolism and structureactivity relationships. J. Nutr. Biochem.. 2002;13:572–584.
Holloway WD, Tasman-Jones C, Bell E. The hemicellulose component of dietary fiber. Am. J. Clin.Nutr.. 1980;33:260–263.
Howlett JF, Betteridge VA, Champ M, Craig SAS, Meheust A, Miller Jones J. In: Cho SS, AlmeidaN, eds. Dietary Fiber and Health. Boca Raton, FL, United States: CRC Press; 2012:11–18.
Huang D, Ou B, Prior RL. The chemistry behind antioxidant capacity assays. J. Agric. Food Chem..2005;53:1841–1856.
Huang G-J, Yang C-M, Chang Y-S, Amagaya S, Wang H-C, Hou W-C, Huang S-S, Hu M-L.Hispolon suppresses SK-Hep1 human hepatoma cell metastasis by inhibiting matrixmetalloproteinase-2/9 and urokinase-plasminogen activator through the PI3K/Akt and ERKsignaling pathways. J. Agric. Food Chem.. 2010;58:9468–9475.
Jeong E, Lee H-R, Pyee J, Park H. Pinosylvin induces cell survival, migration and anti-adhesivenessof endothelial cells via nitric oxide production. Phytother. Res.. 2013;27:610–617.
Kaczmarczyk MM, Miller MJ, Freund GG. The health benefits of dietary fiber: beyond the usualsuspect of type 2 diabetes mellitus, cardiovascular disease and colon cancer. Metabolism.2012;61:1058–1066.
Kay RM. Dietary fiber. J. Lipid Res.. 1982;23:221–242.Kim Y, Keogh JB, Clifton PM. Polyphenols and glycemic control. Nutrients. 2016;8:17–44.Kosseva MR. Functional food and nutraceuticals derived from food industry wastes. In: Kossewva
M, Webb C, eds. Food Industry Wastes. San Diego, CA, United States: Academic Press;2013:103–120.
Lambert JD, Elias RJ. The antioxidant and pro-oxidant activities of green tea polyphenols: a role incancer prevention. Arch. Biochem. Biophys.. 2010;501:65–72.
Lattimer JM, Haub MD. Effects of dietary fiber and its components on metabolic health. Nutrients.2010;2:1266–1289.
Leuzzi U, Caristi C, Panzera V, Licandro G. Flavonoids in pigmented orange juice and second-pressure extracts. J. Agric. Food Chem.. 2000;4:5501–5506.
Lomer MCE, Parkes GC, Sanderson JD. Review article: lactose intolerance in clinical practice:myths and realities. Aliment. Pharmacol. Ther.. 2008;27:93–103.
Lópes-Almeida EL, Chang YK, Steel CJ. Dietary fibre sources in bread: influence on technologicalquality. LWT Food Sci. Technol.. 2013;50:545–553.
López-Vargas JH, Fernandez-Lopez J, Perez-Alvarez JA, Viuda-Martos M. Quality characteristics ofpork burger added with albedo-fiber powder obtained from yellow passion fruit (Passiflora edulisvar. flavicarpa) co-products. Meat Sci.. 2014;97:270–276.
Lupton JR. Microbial degradation products influence colon cancer risk: the butyrate controversy. J.Nutr.. 2004;134:479–482.
Marlett A. Soluble dietary fiber workshop. In: Kritchevsky D, Bonfield C, eds. Dietary Fiber inHealth and Disease. Boston, MA, United States: Springer; 1997:311–313.

Marlett JA, Slavin JL. Position of the American Dietetic Association: health implications of dietaryfibers. J. Acad. Nutr. Diet. 1997;97:1157–1166.
Mazza G, Cacace JE, Kay CD. Methods of analysis for anthocyanins in plants and biological fluids.J. AOAC Int.. 2004;87:129–145.
Misan A, Mimica-Dukić N, Sakač M, Mandić A, Sedej I, Šimurina O, Tumbas V. Antioxidantactivity of medicinal plant extracts in cookies. J. Food Sci.. 2011;76:C1239–C1244.
Miniati E. Assessment of phenolic compounds in biological samples. Ann. Ist Super. Sanita.2007;43:362–368.
Mudgil D, Barak S. Composition, properties and health benefits of indigestible carbohydratepolymers as dietary fiber: a review. Int. J. Biol. Macromol.. 2013;61:1–6.
Nawirska A, Uklanska C. Waste products from fruit and vegetable processing as potential sources forfood enrichment in dietary fibre. Acta Sci. Pol. Technol. Aliment.. 2008;7:35–42.
Nie G, Cao Y, Zhao B. Protective effects of green tea polyphenols and their major component, (-)-epigallocatechin-3-gallate (EGCG), on 6-hydroxydopamine-induced apoptosis in PC12 cells.Redox Rep.. 2002;7:171–177.
Ozcan T, Kurtuldu O. Influence of dietary fiber addition on the properties of probiotic yoghurt. Int. J.Chem. Eng. Appl.. 2014;5:397–401.
Panesar PS, Kumari S. Lactulose: production, purification and potential applications. Biotechnol.Adv.. 2011;29:940–948.
Parage C, Tavares R, Rety S, Baltenweck-Guyot R, Poutaraud A, Renault L, Heintz D, Lugan R,Marais GA, Aubourg S, Hugueney P. Structural, functional, and evolutionary analysis of theunusually large stilbene synthase gene family in grapevine. Plant Physiol.. 2012;160:1407–1419.
Parra-Matadamas A, Mayorga-Reyes L, Pérez-Chabela ML. In vitro fermentation of agroindustrialby-products: grapefruit albedo and peel, cactus pear peel and pineapple peel by lactic acidbacteria. Int. Food Res. J.. 2015;22:859–865.
Pascoal GB, Filisetti TMCC, Alvares EP, Lajolo FM, Menezes EW. Impact of onion (Allium cepaL.) fructans fermentation on the cecum of rats and the use of in vitro biomarkers to assess in vivoeffects. Bioact. Carbohydr. Diet. Fibre. 2013;1:89–97.
Paturi G, Butts CA, Monro JA, Hedderley D, Stoklosinski H, Roy NC, Ansell J. Evaluation ofgastrointestinal transit in rats fed dietary fibres differing in their susceptibility to large intestinefermentation. J. Funct. Foods. 2012;4:107–115.
Pérez-Chabela ML, Cerda-Tapia A, Diaz-Vela J, Delgadillo PC, Diaz MM, Aleman G. Physiologicaleffects of agroindustrial co-products: cactus (Opuntia ficus) pear peel flour and stripe apple(Malus domestica) marc flour on Wistar rats (Rattus norvegicus). Pak. J. Nutr.. 2015;14:346–352.
Pérez-Chabela ML, Chaparro-Hernández J, Totosaus A. Dietary fiber from agroindustrial by-products: orange peel flour as functional ingredient in meat products. In: Clemens ME, ed.Dietary Fiber. New York, NY, United States: Nova Science Publishers; 2015:145–157.
Perron NR, Brumaghim JL. A review of the antioxidant mechanisms of polyphenol compoundsrelated to iron binding. Cell Biochem. Biophys.. 2009;53:75–100.
Peterson J, Dwyer J, Adlercreutz H, Scalbert A, Jacques P, Mccullough ML. Dietary lignans:physiology and potential for cardiovascular disease risk reduction. Nutr. Rev.. 2010;68:571–603.
Pettersen BJ, Anousheh R, Fan J, Jaceldo-Siegl K, Fraser GE. Vegetarian diets and blood pressureamong white subjects: results from the Adventist Health Study-2 (AHS-2). Public Health Nutr..2012;15:1909–1916.

Pietta PG. Flavonoids as antioxidants. J. Nat. Prod.. 2000;63:1035–1042.Playne MJ, Crittenden RG, Galacto-oligosaacharides and other products derived from lactose.
McSweeney PLH, Fox PF, eds. Advanced Dairy Chemistry Volume 3: Lactose, Water, Salts andMinor Constituents, 3. New York, NY, United States: Springer; 2009:121–201.
Price RK, Wallace JM, Hamill LL, Keaveney EM, Strain JJ, Parker MJ, Welch RW. Evaluation of theeffect of wheat aleurone-rich foods on markers of antioxidant status, inflammation andendothelial function in apparently healthy men and women. Br. J. Nutr.. 2012;108:1644–1651.
Pryor RL, Wu X, Schaich K. Standardized methods for the determination of antioxidant capacity andphenolics in foods and dietary supplements. J. Agric. Food Chem.. 2005;53:4290–4302.
Prochazkova D, Bousova I, Wilhelmova N. Antioxidant and prooxidant properties of flavonoids.Fitoterapia. 2011;82:513–523.
Prosky L, Asp NG, Furda I, Devries JW, Schweizer TF, Harland BF. Determination of total dietaryfiber in foods and food products: collaborative study. J. Assoc. Off. Anal. Chem.. 1985;68:677–679.
Qingming Y, Xianhui P, Weibao K, Hong Y, Yidan S, Li Z, Yanan Z, Yuling Y, Lan D, Guoan L.Antioxidant activities of malt extract from barley (Hordeum vulgare L.) toward various oxidativestress in vitro and in vivo. Food Chem.. 2010;118:84–89.
Quiñones M, Miguel M, Aleixandre A. Los polifenoles, compuestos de origen natural con efectossaludables sobre el sistema cardiovascular. Nutr. Hosp.. 2012;27:76–89.
Quiñones M, Miguel M, Aleixandre A. Beneficial effects of polyphenols on cardiovascular disease.Pharmacol. Res.. 2013;68:125–131.
Ramírez-Santiago C, Ramos-Solis L, Lobato-Calleros C, Peña-Valdivia C, Vernon-Carter EJ,Alvarez-Ramírez J. Enrichment of stirred yogurt with soluble dietary fiber from Pachyrhizuserosus L. Urban: effect on syneresis, microstructure and rheological properties. J. Food Eng..2010;101:229–235.
Raninen K, Lappi J, Mykkanen H, Poutanen K. Dietary fiber type reflects physiologicalfunctionality: comparison of grain fiber, inulin, and polydextrose. Nutr. Rev.. 2011;69:9–21.
Rashidinejad A, Birch EJ, Everett DW. Antioxidant activity and recovery of green tea catechins infull-fat cheese following gastrointestinal simulated digestion. J. Food Compos. Anal..2016;48:13–24.
Rasmussen SE, Frederiksen H, Struntze Krogholm K, Poulsen L. Dietary proanthocyanidins:occurrence, dietary intake, bioavailability, and protection against cardiovascular disease. Mol.Nutr. Food Res.. 2005;49:159–174.
Reinisalo M, Karlund A, Koskela A, Kaarniranta K, Karjalainen RO. Polyphenol stilbenes:molecular mechanisms of defence against oxidative stress and aging-related diseases. Oxid. Med.Cell. Longev.. 2015;2015:340520.
Reyes-Caudillo E, Tecante A, Valdivia-López MA. Dietary fibre content and antioxidant activity ofphenolic compounds present in Mexican chia (Salvia hispanica L.) seeds. Food Chem..2008;107:656–663.
Ribeiro A, Caleja C, Barros L, Santos-Buelga C, Barreiro MF, Ferreira IC. Rosemary extracts infunctional foods: extraction, chemical characterization and incorporation of free andmicroencapsulated forms in cottage cheese. Food Funct.. 2016;7:2185–2196.
Rice-Evans CA, Miller NJ, Paganga G. Structure-antioxidant activity relationships of flavonoids andphenolic acids. Free Radic. Biol. Med.. 1996;20:933–956.

Roberfroid M., Gibson GR, Hoyles L, Mccartney AL, Rastall R, Rowland I, Wolvers D, Watzl B,Szajewska H, Stahl B, Guarner F, Respondek F, Whelan K, Coxam V, Davicco MJ, Leotoing L,Wittrant Y, Delzenne NM, Cani PD, Neyrinck AM, Meheust A. Prebiotic effects: metabolic andhealth benefits. Br. J. Nutr.. 2010;104(Suppl 2):S1–S63.
Roberfroid MB, Gibson GR, Roberfroid MB. General Introduction: prebiotics in nutrition. Handbookof Prebiotics. Boca Raton, FL, United States: CRC Press; 2008: pp. 1–11.
Roleira FM, Tavares-Da-Silva EJ, Varela CL, Costa SC, Silva T, Garrido J, Borges F. Plant derivedand dietary phenolic antioxidants: anticancer properties. Food Chem.. 2015;183:235–258.
Sabater-Molina M, Larqué E, Torrella F, Zamora S. Dietary fructooligosaccharides and potentialbenefits on health. J. Physiol. Biochem.. 2009;65:315–328.
Sánchez-Muniz FJ. Dietary fibre and cardiovascular health. Nutr. Hosp.. 2012;27:31–45.Sánchez-Zapata E, Díaz-Vela J, Pérez-Chabela ML, Pérez-Alvarez JA, Fernández-López J.
Evaluation of the effect of tiger nut fibre as a carrier of unsaturated fatty acids rich oil on thequality of dry-cured sausages. Food Bioprocess. Technol.. 2013;6:1181–1190.
Sánchez-Zapata E, Fuentes-Zaragoza E, Viuda-Martos M, Martin-Sánchez A, Fernández-López J,Sendra E, Sayas-Barberá E, Navarro C, Pérez-Álvarez JA. Fig fruit by-products (Ficus carica) asa source of dietary fiber. In: Cho SS, Almeida N, eds. Dietary Fiber and Health. Boca Raton, FL,United States: CRC Press; 2012:421–431.
Sánchez-Zapata E, Zunino V, Perez-Alvarez JA, Fernandez-Lopez J. Effect of tiger nut fibre additionon the quality and safety of a dry-cured pork sausage (“Chorizo”) during the dry-curing process.Meat Sci.. 2013;95:562–568.
Sangwan V, Tomar SK, Singh RR, Singh AK, Ali B. Galactooligosaccharides: novel components ofdesigner foods. J. Food Sci.. 2011;76:R103–R111.
Schneeman BO. Dietary fiber: physical and chemical properties, methods of analysis andphysiological effects. Food Technol.. 1986;40:104–110.
Schuster-Wolff-Bühring R, Fischer L, Hinrichs J. Production and physiological action of thedisaccharide lactulose. Int. Dairy J.. 2010;20:731–741.
Seckin AK, Baladura E. Effect of using some dietary fibers on color, texture and sensory propertiesof strained yogurt. GIDA. 2012;37:63–69.
Sendra E, Fayos P, Lario Y, Fernandez-Lopez J, Sayas-Barbera E, Perez-Alvarez JA. Incorporationof citrus fibers in fermented milk containing probiotic bacteria. Food Microbiol.. 2008;25:13–21.
Sendra E, Kuri V, Fernández-López J, Sayas-Barberá E, Navarro C, Pérez-Alvarez JA. Viscoelasticproperties of orange fiber enriched yogurt as a function of fiber dose, size and thermal treatment.LWT Food Sci. Technol.. 2010;43:708–714.
Siegel R, Naishadham D, Jemal A. Cancer statistics, 2012. CA Cancer J. Clin.. 2012;62:10–29.Silva de Paula N, Gomes Natal DI, Ferreira HA, de Souza Dantas MI, Rocha Ribeiro SM, Duarte
Martino HS. Characterization of cereal bars enriched with dietary fiber and omega 3. Rev. Chil.Nutr.. 2013;40:269–273.
Singh RS, Singh RP. Production of oligosaccarides from inulin by endoinulinases and their prebioticpotential. Food Technol. Biotechnol.. 2010;48:435–450.
Singleton VL, Rossi JA. Colorimetry of total phenolics with phosphomolybdic-phosphotungstic acidreagents. Am. J. Enol. Vitic.. 1965;16:144–158.
Slavin J. Fiber and prebiotics: mechanisms and health benefits. Nutrients. 2013;5:1417–1435.

Smeds AI, Eklund PC, Sjoholm RE, Willfor SM, Nishibe S, Deyama T, Holmbom BR.Quantification of a broad spectrum of lignans in cereals, oilseeds, and nuts. J. Agric. Food Chem..2007;55:1337–1346.
Somogyi A, Rosta K, Pusztai P, Tulassay Z, Nagy G. Antioxidant measurements. Physiol. Meas..2007;28:R41–R55.
Southgate DAT. Polysaccaride food additives that contribute to dietary fiber. In: Spiller GA, ed.Handbook of Dietary Fiber in Human Nutrition. Boca Raton, FL, United States: CRC Press;2001:11–14.
Staffolo MD, Bevilacqua AE, Rodríguez MS, Albertengo L.. Dietary fiber and availability ofnutrients: a case study on yogurt as food model. In: Karunavatne DN, ed. The Complex World ofPolysaccarides. Rijeka, Croatia: In Tech; 2012:455–490.
Sun AY, Wang Q, Simonyi A, Sun GY. Resveratrol as a therapeutic agent for neurodegenerativediseases. Mol. Neurobiol.. 2010;41:375–383.
Sun-Waterhouse D, Sivam AS, Cooney J, Zhou J, Perera CO, Waterhouse GIN. Effects of added fruitpolyphenols and pectin on the properties of finished breads revealed by HPLC/LC-MS and size-exclusion HPLC. Food Res. Int.. 2011;44:3047–3056.
Sun-Waterhouse D, Zhou J, Wadhwa SS. Effects of adding apple polyphenols before and afterfermentation on the properties of drinking yoghurt. Food Bioprocess. Technol.. 2012;5:2674–2686.
Talukder S. Effect of dietary fiber on properties and acceptance of meat products: a review. Crit. Rev.Food Sci. Nutr.. 2015;55:1005–1011.
Theander O, Aman P, Westerlund E, Graham H. Enzymatic/chemical analysis of dietary fiber. J.AOAC Int.. 1994;77:703–709.
Torres DPM, Gonçalves MDPF, Teixeira JA, Rodrigues LR. Galacto-oligosaccharides: production,properties, applications, and significance as prebiotics. Compr. Rev. Food Sci. Food Saf..2010;9:438–454.
Trowell H. Definitions of fibre. Lancet. 1974;303:503.Tsao R. Chemistry and biochemistry of dietary polyphenols. Nutrients. 2010;2:1231–1246.Van Soest PJ. Use of detergents in the analysis of fibrous feed. II. A rapid method for the
determination of fiber and lignin. J. Assoc. Agron. Chem.. 1963;46:829–835.Vauzour D, Rodriguez-Mateos A, Corona G, Oruna-Concha MJ, Spencer JP. Polyphenols and human
health: prevention of disease and mechanisms of action. Nutrients. 2010;2:1106–1131.Venema K, Do Carmo AP. Probiotics and prebiotics: current status and future trends. In: Venema K,
do Carmo AP, eds. Probiotics, Prebiotics: Current Research and Future Trends. Poole, UnitedKingdom: Caister Academic Press; 2015:3–12.
Verma AK, Banerjee R. Dietary fibre as functional ingredient in meat products: a novel approach forhealthy living: a review. J. Food Sci. Technol.. 2010;47:247–257.
Verma AK, Chatli MK, Kumar D, Kumar P, Mehta N. Efficacy of sweet potato powder and addedwater as fat replacer on the quality attributes of low-fat pork patties. Asian-Australas. J. Anim.Sci.. 2015;28:252–259.
Verma AK, Rajkumar V, Banerjee R, Biswas S, Das AK. Guava (Psidium guajava L.) powder as anantioxidant dietary fibre in sheep meat nuggets. Asian-Australas. J. Anim. Sci.. 2013;26:886–895.
Wandee Y, Uttapap D, Puncha-Arnon S, Puttanlek C, Rungsardthong V, Wetprasit N. Enrichment ofrice noodles with fibre-rich fractions derived from cassava pulp and pomelo peel. Int. J. Food Sci.

Technol.. 2014;49:2348–2355.Yu L, Nanguet AL, Beta T. Comparison of antioxidant properties of refined and whole wheat flour
and bread. Antioxidants. 2013;2:370–383.Zhou B, Wu LM, Yang L, Liu ZL. Evidence for alpha-tocopherol regeneration reaction of green tea
polyphenols in SDS micelles. Free Radic. Biol. Med.. 2005;38:78–84.
Further ReadingSun-Waterhouse D, Zhou J, Wadhwa SS. Drinking yoghurts with berry polyphenols added before and
after fermentation. Food Control. 2013;32:450–460.

C H A P T E R 9
The Contribution of Bioactive Peptides of Wheyto Quality of Food ProductsTanja Krunic*
Marica Rakin*
Maja Bulatovic*
Danica Zaric** * University of Belgrade, Belgrade, Serbia ** IHIS Techno-experts D.o.o., Research Development Center, Belgrade, Serbia
AbstractWhey proteins are sources of biologically active peptides that can be released by controlled enzymatic hydrolysis or bacterial activity.Whey peptides have a wide range of bioactivities (ACE-inhibitory activity, antioxidant activity, antiinflammatory, antimicrobial), sothese peptides are more suitable as ingredients in functional foods than molecules with only one substantial characteristic.Bioactive peptides derived from whey protein and added into probiotic-fermented products and confectionery products (as chocolate,biscuit, or cream) affect human health directly and indirectly. These peptides increase the viable number of probiotic bacteria, increasethe stability of the probiotic products, and act in the human organism as antioxidants and ACE inhibitors, increase proliferation ofintestinal epithelial cells, and so forth. Bioactive peptides are suitable for application in food because of the simple procedure toproduce and separate it. In summary, this chapter describes the biological activity of peptides and their practical application in foodproducts.
Keywords
wheyproteinpeptideACEantioxidantbioactivityimmobilizationfunctional food
1. IntroductionMilk is a food that fulfills the nutritional needs of the mammal newborn and ensures development andgrowth during the first stages of its life. Milk is also recognized as a food that adults mammal do not

consume. Humans are the only mammals that consume milk as adults, but many experts consider thatthis is not in accordance with “human nature.” This statement is helped by the knowledge that a largenumber of adults are lactose intolerant or have an allergic reaction to different component of milk [suchas β-lactoglobulin (Lg)]. Milk has many components that contribute to human’s health, so it would be awaste to not consume it. Milk proteins are the most valuable components of milk. Normal bovine milkcontains about 3.5% of protein, of which casein constitutes 80% and whey proteins 20%. Theknowledge of bioactive peptides has steadily increased since 1979 with the “rediscovery” of whey.
Whey was discovered about 3000 years ago. In the 17th and 18th centuries, whey was considered amedicinal mostly because of biologically active proteins and peptides. Thereafter, whey was neglectedin the 19th century but in the second half of the 20th century many techniques for protein isolation weredeveloped in order to isolate whey protein as a very valuable component from whey. Before 1980,bioactive peptides were mostly fragments of α-, β-, and κ-casein, detected in milk. Bioactive peptidesderived from whey proteins were rapidly discovered in the 80s and 90s. The activity is based on theamino acid composition and sequence. Bioactive peptides usually contain 3–20 amino acids permolecule. They have been used for recovery after exercise, weight management and satiety, infantnutrition, cardiovascular health, and wound care and repair. During the research it was observed thatsome peptides that do not show a particular bioactivity become bioactive after ingestion and passingthrough the gastrointestinal system. That was the stimulus for the development of research on the effectof enzymatic hydrolysis of the bioactive properties of proteins. Nowadays, science has mostly unraveledthe secrets of whey proteins and achieved isolation of each component of whey and using it optionally.
Bioactive peptides, derived by enzymatic hydrolysis of whey protein, have demonstratedcharacteristics as health-promoting agents. Depending on these activities, bioactive peptides derivedfrom whey protein can be used as ingredients for various food and medical preparations. A food can beconsidered as functional if, beyond its nutritional outcomes, it provides benefits for one or morephysiological functions, thus improving health while reducing the risk of illness (Kailasapathy, 2009).The concept of functional food appears in Japan during the 1980s. The main idea was to improve thequality of life of the elderly population because it is been known that nutrition plays a key role in theprevention of various diseases. Whey protein is used in many different types of food as ice cream,pastry, and infant formula. It has also been used to replace fat in a number of products. With its high-protein quality score and branched-chain amino acid (BCAA) content, whey protein has also long beenpopular as a muscle-building supplement (Josse and Phillips, 2012; Lollo et al., 2011). Whey peptidesare more useful molecules derived from whey protein. Produce of bioactive peptides is usually carriedout as hydrolysis using mostly digestive enzyme, but also microbial, plant, or animal enzymes.Bioactive peptide can be produced by fermentation with some protolithic starter cultures. The functionalfood market abounds in fermented dairy products containing lactic acid bacteria with probioticproperties and produce secondary metabolites that deliver health benefits (Stanton et al., 2005). Theglobal functional food and drink market increased 1.5-fold between 2003 and 2010, and was expected togrow a further 22.8% between 2010 and 2014 (Leatherhead, 2011). Other estimates predicting themarket will reach €65 billion by the year 2016 (Marsh et al., 2014). Bioactive peptides are more likelyto be used in formulation of functional food due to their wide scope of activity.
Bioactive peptides are a rapidly developing field of research. According to the current state ofscientific knowledge, every protein can contain fragments that possess some of many bioactivities. Thischapter reviews recent research about producing of bioactive peptides from whey and peptideapplications in food and beverages to create functional food.
2. Bioactivity of Whey Protein and PeptideBovine milk contains about 3.0% of protein (Fox and McSweeney, 1998) of which 80% is caseins and20% is whey proteins that remain in the supernatant after precipitation of caseins. The bovine whey

protein contains six major proteins, β-Lg, α-lactalbumin (α-La), immunoglobulins (Ig), bovine serumalbumin (BSA), proteose-peptone, and glycomacropeptide [caseinomacropeptide (CMP)], whichtogether make up 85% of whey protein. Whey contains several proteins at very low levels as lactoferrin(Lf) and lactoperoxidase. These proteins are regarded as highly significant due to their bioactivities.Characteristics of major whey proteins are given in Table 9.1.
Table 9.1
Approximate composition and characteristics of major whey proteins (Sharma andShah, 2010; Zydney, 1998).
Proteins Concentrations (g/L) MW (kDa) Isoelectric Point (pI)β-Lg 3.2–4.0 18.4 3.2
α-La 1.2–1.5 14.2 4.70–5.1
BSA 0.3–0.6 69 4.7–4.9
IgG, IgA, IgM 0.6–0.9 150–1000 5.5–8.3
Protease-peptone 0.5–1.1 4–20
Lactoferrin 0.05 78 8.0
Lactoperoxidase 0.006 89 9.6
Glycomacropeptide 1.2 7
Whey proteins have been reported to have utility in many different applications ranging from effectson muscles and bone, blood, immune system brain, cancer, and infection. Whey protein seems to bemore effective in physiological systems than casein due to faster digestion and presence of bioactivecomponents (Boirie et al., 1997). Casein is easily hydrolyzed by digestive enzymes in thegastrointestinal tract, but whey protein hydrolyzed at a slower rate and maintains its function in thegastrointestinal tract.
There is substantial evidence that whey proteins influence the release of some satiety hormones.Insulin and glucagon-like peptide-1 release are stimulated by the ingestion of whey protein (Brubakerand Anini, 2003; Samra et al., 2007). Whey protein increased of cholecystokinin secretion more thancasein (Hall et al., 2003). The concentration of peptide YY in plasma increased after intragastricadministration of whey protein or whey peptide hydrolysate fractionation (Calbet and Holst, 2004).Recent studies showed that a whey drink caused significantly enhanced glucose-dependentinsulinotropic polypeptide response more than branched amino acid mixture. It is possible that bioactivepeptides present in whey and formed during digestion are the primary stimulators of glucose-dependentinsulinotropic polypeptide secretion (Nilsson et al., 2007). Whey proteins were found to inhibit thegrowth many types of tumors more effectively than other food proteins (Parodi, 2007). Attaallah et al.(2012) showed that a lesser number of tumor foci were observed when whey protein hydrolysate (WPH)was fed to colon cancer-bearing rats.
The therapeutic properties of milk and whey proteins have been investigated by many researchers inthe recent past (Madureira et al., 2007; Mils et al., 2011; Parodi, 2007). The functions of bioactiveproteins and peptides from whey in human body are shown in Fig. 9.1.

FIGURE 9.1 Function of Bioactive Proteins and Peptides From Whey.
2.1. β-Lactoglobulinβ-Lg is the major protein in bovine whey. β-Lg represents approximately 50% of the total whey protein(Creamer and Sawyer, 2003; Fox and McSweeney, 1998). It is also a rich source of amino acid(cysteine), which plays a key role in the synthesis of glutathione (GSH) (Anderson, 1998). Glutathioneis important for human health because it is an intracellular antioxidant that protects the body from theonslaught of stressors. Yahya et al. (2013) have reported the nexus between GSH deficiency and IL-8-driven pathogenesis. β-Lg binds retinol (vitamin A) and vitamin D, and promotes uptake of retinol viagastrointestinal tract. It has been speculated that this protein plays a role in the absorption of many fattyacids (Chatterton et al., 2006). Also, β-Lg is a molecular carrier that increases the accessibility oflinoleic acid (Le Maux et al., 2012).
β-Lg exhibits prebiotic effects on Bifidobacterium and Lactobacillus probiotics species.Bovine β-Lg is quite resistant to gastric digestion. This resistance may contribute to the allergy to
bovine milk and whey. Resistance to digestion by pepsin is not characteristic of all mammals. Forexample, ovine β-Lg is highly sensible to digestion by pepsin (El-Zahar et al., 2005). While β-Lg isresistant to the gastric digestion, it is likely to be digested in intestinal tract by trypsin andchymotrypsin.
β-Lg fragments obtained by intestinal digestion or limited hydrolysis by specific enzymes show manybioactivities as opioid, antihypertensive activity, antimicrobial activity, imunomodulatory activity, andso forth. More bioactivities of fragments are shown in the section “Bioactivity of Whey ProteinFragments.”
2.2. α-Lactalbumin

α-La appears quantitatively second in whey. It comprises about 20% of all proteins in bovine whey (Foxand McSweeney, 1998). α-La originates peptides with antimicrobial (Haque et al., 2009) and antistressproperties. Antistress activity is mediated by a high content of amino acid tryptophan used in serotoninsynthesis. Evening intake of α-La by human volunteers increased plasma tryptophan bioavailability andimproved morning alertness and brain measures of attention (Markus et al., 2005).
α-La shows bactericidal effects in the upper respiratory system and protective effects on gastricmucosa and provides protective effects against induced gastric mucosal injury caused by intake ofnonsteroid antiinflammatory drugs (NSAID) or a large dose of ethanol in animal experiments(Mezzaroba et al., 2006; Rosaneli et al., 2004). In an acidic environment, human α-La forms thecomplex with oleic acid named HAMLET (human α-La made lethal to tumor cells). HAMLETs positiveeffect on human health is shown as inhibiting proliferation of different tumor types by an apoptosismechanism with high selectivity (Svanborg et al., 2003). The BAMLET complex is the bovineequivalent of HAMLET. The BAMLET shows a strong cytotoxic effect on eight lines of tumor cells byincreasing the permeability of the lysosomal membrane (Rammer et al., 2010).
Some fragments of α-La showed ACE-inhibitory activity. α-La fragment known as α-lactophorin wasgiven subcutaneously to conscious, unrestrained, spontaneously hypertensive (SHR) and normotensiverats in experiment. It is shown that blood pressure decreased in the SHR rat group. Antihypersensitiveeffects have been associated with bioactive peptides originating from α-La and other whey components(Camfield et al., 2011).
2.3. Bovine Serum AlbuminBSA is not synthesized in the mammary glands; it is derived from the blood and represents 0.7%–1.3%of all whey proteins (Fox and McSweeney, 1998). As BSA is poorly represented in whey, its bioactivityis mostly examined as part of whey protein bioactivity. BSA possesses ACE-inhibitory activity andopioid-like characteristic (Poltronieri et al., 2012).
2.4. ImmunoglobulinsIg are protein complexes synthesized by B lymphocytes, derived in milk from blood serum. Igrepresents 10%–15% of the total whey proteins (Nakai and Modler, 1996). Ig protects the mucosa ofgastrointestinal tract from pathogenic microorganisms. In colostrum Ig’s role is to confer passiveimmunity to the neonate while its own immune system is developing (Gapper et al., 2007). Bovine IgGat concentrations as low as 0.3 mg/mL suppressed the synthesis of human IgG, IgA, and IgM by up to98%. On the basis of these findings, it is concluded that Ig from bovine whey have the potential tomodulate the immune response in humans (Reitelseder et al., 2011; Tipton et al., 2004). Also, bovinemilk contains specific antibodies to Salmonella typhimurium, Salmonella enteritidis, Escherichia coli,Shigella flexneri, and human rotavirus (Yolken et al., 1985).
2.5. Proteoso-Peptone (PP)Proteoso-peptone (PP) fraction is a minor peptide fraction in bovine whey. This fraction is a mixture ofheat-stable acid-soluble (at pH 4.6) 135 amino acid phosphorylated glycoprotein that does not derivefrom caseins. Lactophoricin is one of two domens of proteoso-peptone fraction. Lactophoricin is able topermeabilize planar lipid bilayers (Campagna et al., 2001, 2004). It is a peptide with bacteriostaticactivity against Gram-positive and Gram-negative bacteria.
2.6. Glukosomacropeptide (GMP) and Caseinomacropeptide

Glukosomacropeptide (GMP) is a C-terminal glycopeptide f(106–169) released from the κ-caseinduring cheese manufacturing. The nonglycosylated form of GMP is often termed CMP. CMP comprisesfrom 10% to 15% of whey proteins. It shows prebiotic effects on Bifidobacterium and Lactobacillusprobiotics species. CMP has been shown to increase the solubility of calcium and enhance theabsorption of calcium in colon. Also, this is characteristic for other phosphorylated peptides derivedfrom casein (Martinez et al., 2009). Many studies have shown that CMP possesses antimicrobial activityto fight caries and the oral pathogens Streptococcus mutans and Porphyromonas gingivalis(Aimutis, 2004). Also, it favors the growth of Lactobacilli in the oral cavity. GMP has been reported toinhibit bacterial and viral epithelial adhesion and to modulate the immune system response(Brody, 2000; Manso and López-Fandino, 2004). CMP shows antiinflammatory activity on monocytes(Requena et al., 2009) and strong ACE-inhibitory activity (Gobbetti et al., 2007). Oral intake GMPstimulates cholesystokinin release, a satiety hormone (Yvon et al., 1994). Bovine, ovine, and caprineCMP have been shown to inhibit platelet aggregation and the formation of thrombi (Poltronieriet al., 2012).
2.7. LactoferrinLf is a nonheme iron-binding glycoprotein, with antimicrobial, antioxidative, antiinflammatory,anticancer, and immune regulatory properties (Caccavo et al., 2002; Marnila and Korhonen, 2009;Wakabayashi et al., 2006). Lf has bacteriostatic and bactericidal activity against Gram-negative andGram-positive bacteria, fungicidal activity against Candida species. Also, Lf is capable of inhibitingreplication of viruses (Marnila and Korhonen, 2009; Wakabayashi et al., 2006). The N-terminal lobeincludes the lactoferricin (Lfcin) sequence, which possesses antibacterial activity (Lopez-Exposito andRecio, 2006). Lf and its sequence lactoferricin inhibit the attachment of Streptococcus mutans tohydroxyapatite or purified saliva host ligands (Johansson and Holgerson, 2011). Bovine Lf inhibit theproliferative response and cytokine production of Th1, but not Th2 cell lines. Oral intake reduced thespontaneous production of IL-6 and TNF-α by cultured peripheral blood mononuclear cells (PBMCs)and enhanced chemotactic reactions by promoting the recruitment of leukocytes to the inflammatory site(Zimecki and Kruzel, 2007). Both bovine and human Lf are anabolic factors for the bone in a mousemodel (Cornish, 2004). Lf protects against lethal endotoxin shock in germ-free piglets (Lee et al., 1998).
2.8. LactoperoxidaseLactoperoxidase is the most abundant enzyme in whey. It has demonstrated antibacterial effects againsta range of species. It catalyzes an antimicrobial system consisting of the thiocyanate anion (SCN−) andhydrogen peroxide to generate short-lived oxidation products, primarily hypothiocyanate (OSCN−),which kill or inhibit the growth of a wide range of bacteria, viruses, fungi, and protozoa (Seifuet al., 2005).
3. Production of Bioactive Peptide From WheyBesides intact proteins, increasing interest is focused on peptides obtained from proteins by enzymatichydrolysis. Biofunctionality characteristics of peptides depend on the amino acid sequence and thenumber of residues. Peptides that contain the same amino acids may exhibit different bioactivitybecause of different steric forms or hydrophobicity. Also, hydrophobic amino acids contribute to theantioxidant activity in particular when they are located at the N terminal of a peptide (Li et al., 2011).Milk and especially whey proteins are currently the main source of biologically active components.Bioactive peptide fragments from whey protein have a wider scope of activity than intact proteins. Theyplay regulatory roles, but also directly influence various developmental and metabolic processes.

Moreover, some activities attributed to proteins are actually activities of peptide fractions releasedduring digestion in gastrointestinal tract. For example, Lf during intestinal digestion released bioactivepeptide called lactoferricin. Proteolysis of Lf by pepsin produces N-terminal arginine-rich fragments(lactoferricin), which have antimicrobial, antiviral, and antiparasitic activity (Marnila and Korhonen, 2009; Wakabayashi et al., 2006). Also, GMP has been detected in the plasma of volunteers after milkor yogurt ingestion (Chabance et al., 1998). Lactoferricin has many bioactivities but its releasing andstability in gastrointestinal tract is variable. The last step constant yields and constant quality of thebioactive peptides can be reached by controlled hydrolysis.
Bioactive peptides can be obtained in three ways:
1. hydrolysis by digestive enzymes2. hydrolysis by enzymes derived from microorganisms or plants3. fermentation of milk with proteolytic starter cultures
3.1. Hydrolysis of Whey Proteins During FermentationProcess With Proteolytic Starter Culture to Obtain BioactivePeptidesA number of probiotic bacteria show proteolytic activity. These bacteria have been shown to hydrolyzewhey proteins to increase the number of peptides available for their growth. The peptides and aminoacids released during fermentation contribute to the typical flavor and texture of dairy products. That isthe reason why many industrially used dairy starter cultures are highly proteolytic.
Fermented milk and peptides isolated from fermented milk products showed various bioactivities.Despite this, the fermentation is not an easy way to produced required bioactive peptide. Fermentation isa complex process and many factors have influence to the process and production of bioactive peptides.In order to understand the choice of the culture used, it is essential to be familiar with the peptide-releasing mechanism. The process starts when the cell-wall bound proteinases, which have a very broadspecificity, initiate the proteolysis and release oligopeptides. Oligopeptides that cannot be transportedinto the cells can be further degraded after lysis of bacterial cell by released intracellular enzymes.Having this in mind, it becomes clear that is important to choose the strains or combination of strainswith optimal proteolytic activity and lysis at the right time, as the number of bioactive peptides dependson a balance between formation and degradation of inactive peptides and amino acids (Korhonen andPihlanto, 2007).
Many studies have demonstrated that Lactobacillus helveticus strains are capable of releasing ACE-inhibitory peptides as tri-peptides (VPP) and (IPP). Pihlanto-Leppala et al. (1998) studied the potentialformation of ACE-inhibitory peptides from whey during fermentation with various lactic acid starters.ACE-inhibitory activity was not proved after fermentation, but further digestion with pepsin and trypsinwas produced ACE-inhibitory peptides. It is identified peptide corresponding to β-lactorphin sequencein the hydrolysate after whey fermentation with Kluyvermyces marxinaus var marxianus (Belemet al., 1999). Elfahri (2012) studied the release of bioactive peptides from milk proteins by selectedLactobacillus species. Ten strains of Lactobacillus species (Lactobacillus helveticus 474, Lactobacillushelveticus 1188, Lactobacillus helveticus 1315, Lactobacillus helveticus 953, Lactobacillus delbrueckiissp. bulgaricus 734, Lactobacillus delbrueckii ssp. bulgaricus 756, Lactobacillus delbrueckii ssp.bulgaricus 857, Lactobacillus delbrueckii ssp. lactis 1210, Lactobacillus delbrueckii ssp. lactis 1307,and Lactobacillus delbrueckii ssp. lactis 1372 were assessed for growth characteristics, proteolyticactivity, and release of angiotensin-converting enzyme inhibitory peptides. The presence of selectedLAB enhanced proteolysis significantly compared to the control (sample without LAB). Also, it hasbeen shown that proteolytic activity varied with changes in pH.

All strains in Elfahri (2012) study released bioactive peptides with ACE-inhibitory activities between1.26% and 48.69%. Three strains of L. helveticus (474, 1188, and 1315) showed high proteolytic andantihypertensive activity.
Pan and Guo (2010) identified and purified the new ACE-inhibitory peptides from whey proteinhydrolyzed by crude proteinases (include cell-envelope proteinase and intracellular peptidases) of L.helveticus LB10. It was a new ACE-inhibitory peptide isolated from β-Lg f(148–153), with a peptidesequence of RLSFNP and an IC50 value of 177.39 mM.
Fermentation is a complex process that includes the whole microorganisms, with all its enzymes. Alarge number of enzymes in the fermentation system require a complex control, with the largepossibility of mistake. Despite the fact that the fermentation process is often an inexpensive way toproduce the desired product, the fermentation is not an easy way to produced bioactive peptides.Controlled enzymatic hydrolysis better meets the requirement for constant and large yield.
3.2. Enzymatic Hydrolysis: The Most Common Way to ObtainBioactive Peptides From Whey ProteinsEnzymatic hydrolysis converts protein into peptides of various sizes. Hydrolysis is stopped when thedesired degree of hydrolysis (DH) is reached, usually by temperature inactivation of the enzyme.Incubation at 100°C for 10 min is adequate for inactivation of most of the enzymes, but some proteases,such as bromelain, retained about 20% of original activity after incubation at 105°C for 30 min (Poh andAbdul Majid, 2011). Hydrolysates properties are dependent on the type of enzyme used, the substratepretreatment and the DH (Jeewanthi et al., 2014). Certain studies show that hydrolysis is effective afterheat (Adjonu et al., 2013) or high-pressure pretreatment (Piccolomini et al., 2012). It has been shownthat the DH increases significantly in the first 60 or 90 min and after that increases considerably moreslowly (Dryakova et al., 2010; Herregods et al., 2015; Krunic et al., 2016a). Some papers report thatthe extension of the time of hydrolysis leads to stagnation or even decrease in some bioactivities, suchas ACE–inhibitory activity and total reducing power of the hydrolysate (Corrêa et al., 2014; Herregodset al., 2015). DH is usually defined as the percentage of peptide bonds cleaved and it can bedetermined with the pH-stat method described by Adler-Nissen (1986). It is a method based onmeasuring the amount of acid or base needed to keep the pH constant during hydrolysis. Also, DH canbe defined as the amount of nitrogen soluble in trichloroacetic acid after hydrolysis, thus not expressingthe percentage of cleaved peptide bonds (Drago and González, 2000). Very common methods used forDH determination are based on quantify free amino groups with trinitrobenzenesulfonic acid, o-phthaldialdehyde (OPA), or formol titration. Silveira et al. (2013) compared OPA method, formoltitration method, and freezing point measurement method for determination of DH during hydrolysis ofwhey proteins with pancreatin. Determination of DH is important because it is the most commonly usedparameter to structurally differentiate between different hydrolysates. DH determination is not the topicin this chapter. The various methods of DH determination have been summarized in a review byRutherfurd (2010).
Pancreatic enzymes, especially trypsin and chymotrypsin are commonly used for production ofbioactive peptide. Also, proteinases, such as pepsin, thermolysin, alcalase, proteinase from bacterial andfungal sources or from plants and animals have been used. Many enhancements are reached innumerous studies with digestive enzymes. The hexapeptide VAGTWY, derived from β-Lg by trypsinhydrolysis was found to have all three examinated bioactivities (antioxidant, ACE-inhibitory activity.and DPP-IV inhibitory activity) (Power et al., 2014.). Also Power et al. (2014) detected two newbioactive peptides with ACE-inhibitory activity. Bioactivities of derived peptides are diverse. Alcalase-hydrolyzed whey protein liberated a pentapeptide (VHLKP), which demonstrated significant antioxidantactivity and protection of human lung fibroblast MRC-5 cells from H2O2 activity (Kong et al., 2012).

WPH derived by pepsin exhibited significant antimicrobial activity (Theolier et al., 2013). Quintieriet al. (2012) shows that pepsin-digested hydrolysate of bovine lactoferin possess antimicrobial activityagainst E. coli K12. Very active antimicrobial hydrolysates were obtained by hydrolysis of whey proteinby pepsin and trypsin (Benkerroum, 2010). But also, fractions that contain proline are very resistant tothe influence of digestive enzymes (Beermann and Hartunga, 2013).
Hydrolysis of α-La and β-Lg by pepsin and trypsin separately or in combination resulted in similarACE-inhibitory activities. The order of enzyme additions affected types of derived peptides in finalhydrolysates but not on ACE-inhibitory activity. A combination of different enzymes can alter digestionand peptides released, but will not necessarily result in greater bioactivity (Mullally et al., 1997).
In vitro digestibility of bioactive peptides derived from bovine β-Lg is not only influenced by pH,time of incubation, and enzyme/substrate ratio, but also by the length and the nature of the peptides(Roufik et al., 2006) Also, other peptides present in the medium can influence the hydrolysis by gastricenzymes. It was concluded that in a mixture, peptides may form complexes that interact more efficientlywith the hydrolyzing enzymes compared with peptides alone. The thermal or pH denaturation of wheyprotein prior to enzymatic hydrolysis has been shown to affect the bioactive properties (Leeb et al., 2015; O’Loughlin et al., 2014).
Bertucci et al. (2015) showed that after 180 min of hydrolysis of bovine whey with peptidases fromMaclura pomifera fruit, α-La and β-Lg were almost completely degraded. Peptides smaller than 3 kDashowed ACE inhibitory activity and antioxidant capacity. The authors concluded that the results supportthe conclusion that, by the presence of ACE-inhibitory and antioxidant peptides, it would be possible touse these WPHs for functional food manufacturing.
Tavares et al. (2011) showed that aqueous extracts from the plant C. cardunculus could bring aboutrelease of peptides from whey protein concentrate (WPC) that exhibit potent ACE-inhibitory effects.
Kim et al. (2010) showed that significant amounts of BSA, β-Lg, and α-La survived papain digestionof heated colostral whey. Alcalase completely eliminated BSA, β-Lg, and α-La, while pepsin completelyremoved BSA but not β-Lg.
Adriena et al. (2010) reported that on hydrolysis with microbial proteases (alcalase, flavorzyme,protamex, and neutrase) the antioxidant activity of whey protein increased from 7%–19.8% to 40%–54.2%. Naik et al. (2013) found increased antioxidant activity in WPHs compared to the intact proteins.Castro and Sato (2014) also found an increase in antioxidant activity up to 205.3% after hydrolysis ofprotein.
After hydrolysis, separation of bioactive peptides from other peptides in hydrolysates is an importantstep. Ultrafiltration (UF) is the most common way to separate small peptide.
3.3. Ultrafiltration as Method for Obtaining Bioactive PeptideVarious technologies have been applied for the separation of bioactive peptides from the hydrolysates.Membrane filtration shows the most potential to be used in food industry, especially UF with molecularweight cut-off membrane, due to its simplicity and low prices. UF membranes are traditionally producedusing polymers, such as cellulose acetate, and regenerated cellulose. Many studies showed thatultrafiltration with MWCO membranes is useful to separate small bioactive peptides from the restpeptides (Krunić et al., 2015; Poste et al., 2012; Power et al., 2014). UF can be used in the cheeseindustry to fractionate the proteins from whey (Athira et al., 2015).
Power et al. (2014) concluded that the two most potent β-Lg derived ACE-inhibitory peptides wereIPAVFK and IIAEK, which contain less than six amino acid residues. In contrast, the longer peptideTPEVDDEALEK showed very little ACE inhibitory activity. Recently, Demers-Mathieu et al. (2013)obtained a retentate rich in anionic peptides using a pilot scale nanofiltration from UF permeate of wheyprotein tryptic hydrolysate. It is determined the antibacterial activity of these peptides derived from β-

Lg against L. monocytogenes and S. aureus. They also reported that obtained activity could be improvedby process optimization.
Welderufael and Jauregi (2010) used UF for separation bioactive peptide from whey treated withproteolytic commercial mixtures. According to Welderufael and Jauregi (2010), incorporating 1 kDa UFmembrane enables to separate the most active peptides from less active or inactive peptides.
Gupta et al. (2013) used UF for isolation bioactive peptide from water-soluble extracts of the peptidesformed in cheddar cheese.
Athira et al. (2015) concluded that the hydrolysis of UF retentate of whey is an effective method forproduction of WPH directly from whey and it can be used as energy and cost-saving method comparedto the industrial production of WPH from WPC.
Bordenave et al. (1999) showed that α-lactorphin (bioactive fragment) was generated with continuoushydrolysis of goat whey in an ultrafltration reactor.
Qian et al. (2011) used UF MWCO membrane (1, 3, 5, and 10 kDa) for separation peptide with thehighest ACE-inhibitory and antioxidant activity from fermented skim milk.
Krunić et al. (2015) used MWCO membrane (3, 10, and 30 kDa) for separation peptide with thehighest ACE-inhibitory and antioxidant activity from WPH obtained by proteinase K hydrolysis.
Uluko et al. (2014) used UF and nanofiltration to obtain fraction with the highest ACE-inhibitoryactivity and fraction with the highest antioxidant activity from milk protein hydrolysates.
Tavares et al. (2011) showed that the peptide mixture generated under optimal processing conditionsexhibited an IC50 value of 52.9 ± 2.9 μg/mL, but its fraction with MW below 3 kDa had an IC50 of23.6 ± 1.1 μg/mL.
Laboratory UF unit with MWCO membrane is shown in Fig. 9.2.
FIGURE 9.2 Photo of millipore ultrafiltration stirred cell unit (Model 8050 1 Unit, Millipore Corporation,Bedford, MA, USA) with whey protein hydrolysate (A), schematic of millipore ultrafiltration stirred cellunit (B).
The applications of membrane processes in food industry can be classified into three main areas,namely dairy industry, beverage industry, and fish and poultry industries. UF has found a majorapplication in the dairy industry. It is used for production of WPC and whey protein isolate (WPI), butalso for separation of small bioactive peptides with molecular weight less than 3 kDa. Pihlanto-Leppalaet al. (2000) found that the ACE-inhibitory activity in the <1 kDa fraction was, in many cases, higherthan in the other fractions.
These results indicate that ultrafltration is a great way to derive bioactive peptides from whey protein.This technique provides good possibilities for enriching peptides with a low molecular mass and it is

easily upscaled.
3.4. Bioactivity of Whey Protein FragmentsAs previously stated, some activities attributed to proteins are actually activities of peptide fractionsreleased during digestion in gastrointestinal tract. Those activities and many other activities of fragmentreleased from whey peptides by hydrolysis are shown in Table 9.2.

Table 9.2
Bioactive fragments obtained by hydrolysis of different whey proteins.
Proteins Enzymes Fragments Bioactivities Referencesα-Lactalbumin — f(97–104) DKVGINYW ACE-inhibitor Tavares et al.
(2011)— — KGYGGVSLPEW ACE-inhibitor
— f(59–60) IW Antihypertensive Martin et al.(2008)
Trypsin f(104–108)
f(99–108)
WLAHK, VGINYWLAHK ACE-inhibitor Pihlanto-Leppalaet al. (2000)
Pepsin f(117–121) K7VGIN Antimicrobial activity:mainly Gram (−)bacteria
Theolier et al.(2013)
— f(50–53) YGLF Opioid-like peptide,ACE inhibitor
Haque et al.(2009)
— — YGGF Opoid Ijäes et al.(2004)
Lactoferin Pepsin — — Antimicrobial activity Quintieri et al.(2012)
Serum albumin — ALKAWSVAR ACE Poltronieriet al. (2012)— f(399–404) YGFQDA Opoid-like
GMP Trypsin f(106–112) MAIPPKK ACE-inhibitor Gobbetti et al.(2007)f(106–111) MAIPPK
f(106–116) — Antithrombotic activity Phelan andKerins(2011)
— f(108–110),f(106–112),f(113–116),f(112–116)
— Antithrombotic activity Martinez et al.(2009)
β-Lactoglobulin — f(33–42) DAQSAPLRVY ACE-inhibitor Tavares et al.(2011)
— f(40–42),f(122–124)
RVY, LVR Antihypertensive Hernández-Ledesmaet al. (2004)
— f(46–48),f(142–145), f(15–20)
LKP, ALPM, VAGTWY Antihypertensive Català-Clarianaet al. (2010)
— f(36–42) SAPLRVY ACE-inhibitor Welderufaeland Jauregi(2010)
— f(102–105) YLLF ACE-inhibitor, opoid Sipola et al.(2002)
— — TPEVDDEALEK ACE-inhibitor Picariello et al.(2010)
— f(78–80) IPA ACE-inhibitor Meisel et al.(2009)— f(102–103), YL ACE-inhibitor

Proteins Enzymes Fragments Bioactivities References— f(142–148) ALPMHIR ACE-inhibitor
Trypsin f(15–20),f(25–40),f(78–83),f(92–100)
VAGTWY,AASDISLLDAQSAPLR,IPAVFK, VLVLDTDYK
Antimicrobial activityGram (+) bacteria
Pellegrini et al.(2001)
f(71–75) IIAEK Hypocholesterolemicproperties
Nagaoka(2006)
f(22–25) LAMA ACE-inhibitor Pihlanto-Leppalaet al. (2000)
— VAGTWY ACE-inhibitor, DPP-IVinhibitor antioxidant
Power et al.(2014)
f(15–20) VAGTWY Antioxidant
f(19–29),f(145–149), f(42–46), f(58–61), f(95–101)
—————
— IPAVFK DPP-IV inhibitor Silveira et al.(2013);Uchidaet al. (2011)
— VAGTWY
— TPEVDDEALEK
f(15–20) VAGTWY ACE-inhibitor Ijäes et al.(2004)
Pepsin f(50–54),f(117–121)
PEGDL, KVGIN Antimicrobial activity:mainly Gram (−)bacteria
Theolier et al.(2013)
f(14–18),f(123–125),f(147–149)
K14VAGT, VRT, IRL Antimicrobial activity:mainly Gram (+)bacteria
Pepsin + Trypsin + Chymotrypsin
f(94–100) VLDTDYK ACE-inhibitor Pihlanto-Leppalaet al. (2000)
CorolasePP f(19–29) WYSLAMAASDI Antioxidant Hernández-Ledesmaet al. (2005)f(42–46) YVEE
f(145–149) MHIRL
Chymotrypsin f(146–149) HIRL Ileum-contractingactivity
Sipola et al.(2002)
4. Functional Properties4.1. SolubilityOf all functional properties of proteins, solubility is probably the most important one. It has the largestimpact on their overall usefulness in food systems and insoluble proteins have very limited applicationpotential in food. Other important functional properties, such as foaming and emulsifying or gelationproperties also require the protein to be soluble in the relevant medium. Solubility of protein depends onhydrophobicity and the charge of the amino acid, as well as conformation and surface properties(Walstra, 2003). pH and ionic strength strongly influence a protein’s solubility in a defined medium.

Larger proteins generally have lower solubility than small peptides. Also, proteins have low solubilityon isoelectric point (pI) because protein–protein interaction is more favorable than protein–waterinteraction, so compatibility of protein and enzyme during hydrolysis is very important. pH value inwhich enzyme used for hydrolysis has the strongest activity should not be the same value as pI ofprotein. Whey proteins have very good solubility in comparison with plant proteins. That is also areason why whey proteins are more suitable for application in functional foods. Cassiani et al. (2013)examined whey proteins solubility of the heated mixtures (whey protein, gelatin, starch, and sucrose) inmedia that disrupt different kinds of bonds. First, the system disrupts electrostatic bonds, whereas thesecond system disrupts electrostatic, hydrophobic, and hydrogen bonds. Solubility of whey protein wasexcellent in both systems in contrast to the other tested samples.
4.2. Water- and Fat-Holding CapacitiesWater- and fat-holding capacities (WHC and FHC) of proteins are important for determining textureproperties of food products, such as juiciness, mouthfeel, and tenderness (Zayas, 1997). WHC is animportant criterion to evaluate the acceptability of food systems. Meat proteins have excellent WHC andFHC, which explains the enjoyable organoleptic properties of many meat products. Cassiani et al.(2013) showed that whey proteins strongly hold water. Whey proteins with good WHC and FHC can beused as meat protein alternatives. WHC of the hydrolysates is higher than WHC of the nonmodifiedprotein. This may be due to increased availability of polar, ionizable groups liberated during hydrolysis.
4.3. Gel FormationGels are important for sensory and textural properties of many different food products. There is nosimple definition of a gel. It consists of a three-dimensional polymer network in which the gaps areusually filled with water. This gel framework can be a polysaccharide, a protein, or a combined protein–polysaccharide network. To form a gel, the native protein has to unfold (by protein denaturation) tofacilitate interaction between, and aggregation of, different protein strands (Wouters et al., 2016). Gelformation can be induced by a physical stimulant, usually heat or in some cases pressure, or by abiochemical stimulant, such as an enzyme. The most important interactions for gel forming are covalentbonds, such as disulfide bonds, hydrogen bonds, and hydrophobic interactions, but also properties of thefood matrix, such as protein concentration, pH, temperature, pressure, and ionic strength (Foegeding andDavis, 2011). Gel quality can be evaluated by elasticity determination by compression or indentationtests with a texture analyzer (Nieto-Nieto et al., 2014), by determination of the storage modulus (G′) ofgels (Zhao et al., 2011), and by determination of WHC of gels (Foegeding and Davis, 2011). Gelformation is important for whey protein application for probiotic encapsulation, which has beendescribed below.
4.4. Foam Formation and StabilityFoams are dispersions of gas, usually air, in a continuous phase, usually a liquid. In products, such aschocolate mousse, coffee preparations with milk foams, meringue, or cakes foams play importanttextural and structural roles (Foegeding and Davis, 2011). The air–water interfaces arethermodynamically unstable and foams rapidly collapse. Some proteins act as surfactant and kineticallystabilize foam interfaces. The foaming potential of proteins is assessed based on foaming capacity,namely the initial amount of foam formed after stirring or whipping, and foam stability, which is theamount of foam remaining after a certain time.
Krunic et al. (2016a) showed that whey protein hydrolysated by thermolysin possess better foamingproperties than nonhydrolysated whey protein.

4.5. EmulsificationEmulsions consist of two immiscible phases. The most common emulsion in food industry is mix of oilphase and water. Like foams, emulsions are thermodynamically unstable. The more importantdestabilizing factors are coalescence and creaming, which is the tendency of oil to rise to the top of anemulsified system. Hydrolysis is a common way to improve emulsification properties of proteindilution.
Krunic et al. (2016a) showed that whey protein hydrolysated by thermolysin possess betteremulsification properties than nonhydrolysated whey protein. Authors conclude that well-controlledenzymatic hydrolysis is good way to improve technological characteristics of protein and peptideintended for application in food products.
Palatnik et al. (2015) asserted that the good emulsifying properties, high water and oil holdingcapacity, and the rheological behavior of the caprine WPC, suggested the application of it in theformulation of a dressing.
4.6. FlavorFlavor and changes in texture and aroma are important factors for peptide application in food products.Bioactive peptides are usually tasteless or have a bitter taste, except glutamic acid and aspartic acid,which have a very sweet taste. The bitterness of peptide fraction increases with increasinghydrophobicity and the length of peptide sequences (Jakala and Vapaatalo, 2010). Four peptidesidentified in a WPH were shown to be responsible for 88% of the bitterness of hydrolysate. These fourpeptides were TGLF [α-La f(50–53)), IPAVF (β-Lg f(79–82)], LLF [β-Lg f(103–105), Lf f(298–300)and Lf f(659–641)] and YPFPGPIPN [β-CN f(60–68)] (Liu et al., 2014). Wang et al. (2013) showed acorrelation between selected bioactivities (ACE inhibition and antioxidant activity) of di- and tri-peptides and their bitterness. Debittering of an ACE inhibitory WPH has successfully been achieved byutilization of commercially available exopeptidases while maintaining its bioactivity (Cheunget al., 2015) or by encapsulated peptides as shown in studies by Ma et al. (2014) and Subtil et al. (2014).
5. Bioactive Peptide in Food IndustryThe global functional food market is growing because modern consumers show an increasing interest infoods that can improve health and reduce the risk of disease. In Western Europe and North America,fermented milk products, such as yogurt, are the most popular health beverages. Dairy-based produceaccounts for approximately 43% of the functional beverage market, and is mainly comprised offermented products (Ozer and Kirmaci, 2010). Some commercially available food and intermediate foodproducts containing bioactive peptides derived from whey protein, such as BioPURE-GMP andBioZate, are mentioned in a review by Dziuba and Dziuba (2014).
5.1. Production of Bioactive Peptides During Food ProcessingDuring processing, the proteins contained in food can modify. Bioactive peptides are often liberatedduring the manufacture of different dairy products. Proteases in food, such as plasmin in milk, canhydrolyze proteins during storage or food processing or in probiotic and fermented product intracellularpeptidases of lactic acid bacteria will most likely contribute to further degradation after lysis. The strainsshould be able to produce bioactive peptides with desired bioactivities, but not to be that muchproteolytic to destroy the product during storage time. The formation of bioactive peptides during thefermentation process was previously described in the section “Hydrolysis of Whey Proteins During

Fermentation Process with Proteolytic Starter Culture to Obtain Bioactive Peptides.” The main goal is tofind the best proteolytic culture and process conditions for certain medium.
Conti et al. (2012) studied the ability of mixture composed of L. helveticus, L. paracasei, L.fermentum, L. gasseri, L. parabuchneri, L. casei, L. panis, Pichia kudriavzevii, and S. cerevisiae todegrade whey proteins by fermentation to obtain a functional drink.
Pescuma et al. (2008) evaluated the potentiality of three lactic acid bacteria strains to design a starterculture for developing functional whey-based drinks. Lactobacillus delbrueckii subsp. bulgaricus CRL454 was the most proteolytic (91 mg Leu/mL) strain and released the BCAAs Leu and Val.Lactobacillus acidophilus CRL 636 and S. thermophiles CRL 804 were able to degrade the major wheyproteins, α-La and β-Lg. The amino acid release was higher for the starter Streptococcus thermophilesCRL 804 and Lactobacillus delbrueckii subsp. bulgaricus CRL 454 than for Lactobacillus acidophilusCRL 636 and S. thermophiles CRL 804.
Terzic-Vidojevic et al. (2014) investigated the composition of lactic acid bacteria in autochthonousyoung cheeses, sweet creams, and sweet kajmaks produced in central Bosnia and Herzegovina over afour-season period. These three products were made from bovine milk by a traditional method withoutthe addition of a starter culture. Fifteen species were identified as follows: Lactococcus lactis,Lactococcus raffinolactis, Lactococcus garviae, Lactobacillus casei, Lactobacillus plantarum,Lactobacillus helveticus, Enterococcus faecium, Enterococcus durans, Enterococcus faecalis,Enterococcus italicus, Leuconostoc mesenteroides, Leuconostoc pseudomesenteroides, Leuconostoclactis, Streptococcus thermophiles and Streptococcus mitis. Proteolytic activity was exhibited by 45 %of the lactobacilli and 54.4% of the lactococci.
Table 9.3 shows proteolytic activity of different cultures at different temperatures during 4 h offermentation. Fermentation medium was bovine whey obtained from domestic dairy plant Imlek a.d.(Belgrade, Serbia). The chemical composition of whey was: total solids 9.8% ± 0.03% (w/v); protein2.6 ± 0.012% (w/v); fat 1.05% ± 0.08% (w/v); and lactose 5.6% ± 0.114% (w/v). Commerciallyophilized dairy starter culture “Lactoferm ABY 6,” supplied by Biochem s.r.l. (Monterotondo, Rome,Italy), and the strain Lactobacillus rhamnosus ATCC 7469, supplied by American Type CultureCollection (ATCC, Rockville, USA), were used for fermentation in this study. Starter culture“Lactoferm ABY 6” is mixture of Streptococcus salivarius ssp. thermophilus (80%), Lactobacillusacidophilus (13%), Bifidobacterium bifdum (6%), and Lactobacillus delbrueckii ssp. bulgaricus (1%).

Table 9.3
Viability and proteolytic activity of “Lactoferm ABY 6” and “Lactoferm ABY 6” withLactobacillus rhamnosus ATCC 7469 after 4 h of whey-based substrate fermentation at39, 42, and 45°C.
LABCultures
FermentationTemperatures(°C)
Cell Growth Expressed as theDifference in the Viable CellCount After and BeforeFermentation (∆logCFU/mL)
Proteolytic Activity ExpressedOver the Difference in the Contentof Leucine After and BeforeFermentation (∆mMLe)
“LactofermABY 6”
39 1.45 0.46
42 1.21 0.37
45 1.82 0.39
“LactofermABY 6”and L.rhamnosusATCC7469
39 0.87 0.11
42 0.69 0.21
45 0.72 0.13
Commercial yogurt culture “Lactoferm ABY 6” in combination with Lactobacillus rhamnosus ATCC7469 showed the best proteolytic activity at 42°C, but the lowest cell growth. Commercial yogurtculture “Lactoferm ABY 6” showed even higher proteolytic activity at 39°C, the temperature withmedium cell growth. Proteolytic activity is not proportional with cell growth but is correlated with it.
Miclo et al. (2012) showed that under nongrowth conditions, it is possible to obtain differentdigestion profiles of various casein hydrolysates. Agyei et al. (2012) reported that the higher productionof cell envelope proteinase (CEP) of L. delbrueckii subsp. lactis can be achieved in the batchfermentation if the process is properly aerated with stable temperature at 45°C and initial pH between5.5 and 6.5. Cell envelope proteinase is one or more cell wall protease(s) capable of hydrolyzingproteins to peptides containing 4–30 residues.
Elfahri (2012) investigated 10 strains of Lactobacillus species (Lactobacillus helveticus 474,Lactobacillus helveticus 1188, Lactobacillus helveticus 1315, Lactobacillus helveticus 953,Lactobacillus delbrueckii ssp. bulgaricus 734, Lactobacillus delbrueckii ssp. bulgaricus 756,Lactobacillus delbrueckii ssp. bulgaricus 857, Lactobacillus delbrueckii ssp. lactis 1210, Lactobacillusdelbrueckii ssp. lactis 1307, and Lactobacillus delbrueckii ssp. lactis 1372) for proteolytic activity andrelease of angiotensin-converting enzyme inhibitory peptides using milk as substrate. The proteolyticactivity varied with changes in pH, time of fermentation and of course it was strain dependent. Threestrains of L. helveticus (474, 1188, and 1315) showed high proteolytic and antihypertensive activity.These strains were further investigated for aminopeptidase activity. Aminopeptidase activity was foundin both extracellular and intracellular extract to various extent in all three selected L. helveticus strains,while only oligopeptidase activity was observed in extracellular extract. The highest antioxidant andACE-inhibitory activity were observed in the soluble freeze dried peptides of crude proteinase extract ofL. helveticus 1188 compared to the other strains used at 12 h of incubation time. The effects of solublepeptides produced by crude proteinase extracts of individually selected L. helveticus strains on cytokineproduction by human PBMCs were determine. Effects of soluble peptide samples on the stimulation ofall tested cytokine Th2 Interleukin-10 and Th1 Interferon-γ production were detected in varied levels at6 and 12 h. These bioactive peptides might have capability to drive immune responses in oppositedirections in vitro and thus may bring about imbalance in the Th1/Th2 type cytokines. In a recentresearch it was found that L. lactis strains isolated from artisanal dairy starters or commercial starter

cultures are potential for the production of fermented dairy products with ACE-inhibitory properties(Rodríguez-Figueroa et al., 2010).
Rodríguez-Figueroa et al. (2010) evaluated and compared ACE-inhibitory activity of water-solubleextracts isolated from milk fermented by wild and commercial starter culture Lactococcus lactis strainsafter 48 h of incubation. The highest ACE-inhibitory activities were found in water-soluble extracts ofmilk inoculated with wild L. lactis strains isolated from artisanal dairy products and commercial startercultures.
Cheese is a complex food containing a large number of different peptides, which change with theripening time. Paul and van Hekken (2010) evaluated ACE-inhibitory activity of cheese extracts. Wanget al. (2011) evaluated the influence of certain probiotic strains on bioactivity of different kind ofcheeses. In their studies, starter cultures with the addition of L. helveticus ND01 produced Gouda cheesewith significantly more proteolysis than control cheeses. Gouda cheeses with L. helveticus ND01adjunct revealed significant increase in ACE-inhibitory activity and GABA content.
5.2. Addition of Whey Protein and Peptide in Food(Enrichment of Food With Whey Proteins and Peptides)Reports of therapeutic effects of functional foods and food ingredients have increased. A wide variety ofdairy ingredients (especially milk proteins and peptides) is commercially available and used in commonfood products, such as confectioneries, cereal bars, beverages, and sports supplements. Up to now, wheyproteins are usually used as dietary ingredients for bodybuilders and sportist. Many studies investigatethe effect of whey protein on satiety. A mice-model study showed that filtered whey protein can preventobesity. The beneficial effect was attributed to the α-La (Shi et al., 2012a) and Lf, which prevent fattyliver formation and slow down weight gain (Shi et al., 2012b). Also, a study in obese human subjectsshowed that WPC ingestion prior to main meal intake positively effects to body fat mass and leanmuscle (Tahavorgar et al., 2014). Modern lifestyle requires dietary corrections and the wide range ofapplication of bioactive components in the daily diet of human. A global survey has projected that 27major cancers cause millions of deaths annually (Ferlay et al., 2015). Also, high blood pressure is amajor risk factor for cardiac issues (Udenigwe and Mohan, 2014). Many studies provide strong evidencethat free radicals from food play an important role in development of many diseases. The action ofantioxidants may help to reduce the formation of oxidized molecules and prevent cellular deregulationand subsequent development of disease (Hernandez-Ledesma et al., 2011; Wojcik et al., 2010).
Lim et al. (2011) showed that commercial yogurt fortified with different whey hydrolysates possessesACE-inhibitory activity. Also, physicochemical characteristics, such as pH (3.47–3.77), titratable acidity(0.81%–0.84%), coloration, viable cell count, and sensory qualities were not significantly differentamong the tested yogurt beverage samples during storage. These results showed that yogurt beveragefortified with WPHs maintained antihypertensive activity and underwent no unfavorable changes inphysicochemical characteristics regardless of enzyme type.
Kim et al. (2010) showed that alcalase can be used to generate good iron-binding peptides in heatedcolostral whey. Also, Kim et al. (2010) concluded that iron-binding peptides could be suitable as avalue-added food ingredient for food supplements.
Jisha and Padmaja (2011) used WPC to fortify protein in cassava flour. Flour was used for makingtwo baked products, such as muffins and biscuits. WPC was found to be an excellent replacer for eggsfor producing eggless muffins and biscuits, which also significantly elevated the protein content of thesebaked goods made from cassava. Baked goods having WPC could be promoted for patients sufferingfrom egg allergy and also for vegetarians.
Wronkowska et al. (2015) used acid whey for fortified wheat and wheat-rye products. The resultsobtained in their study indicate that whey concentrated by UF could be used as a functional ingredient

of wheat and wheat–rye baking products, especially due to high concentrations of elements significantfor well-being.
Palatnik et al. (2015) investigated characteristics of ultrafiltrated caprine whey protein and itsapplication in a food protein formulation. The high water and oil holding capacity, good emulsifyingproperties, and the rheological characteristics suggested the application of the WPC in the formulationof a dressing. Samples were similar to a commercial dressing in viscosity, texture, moisture, and ashcontent. Also, the sensory analysis demonstrated a good acceptance of the samples. The protein contentof the product (0.97 ± 0.12 g/100 g) duplicated the value of the commercial sample incorporating higheradded value to a product with high consumption.
If it is known that bioactive peptides can contribute a slight bitterness to food formulation; besidesyogurt, chocolate and coffee can also be ideal flavor systems for application of those peptides.
Mann et al. (2015) used WPC and WPH (whey protein was hydrolyzed by using three commercialproteases; flavorzyme, alcalase, and corolase PP) for enrichment of milk. The strawberry- andchocolate-flavored milk was supplemented with WPC and WPHs. The addition of 2% of WPHs hasshown an increase in antioxidant activity up to 42%. The results suggest that WPH could be used asnatural biofunctional ingredients in enhancing antioxidant properties of food products.
Kumari et al. (2013) also found an increase in antioxidant activity after addition of 1% flavorzymeWPH and alcalase WPH up to 14.73% and 29.6% in chocolate ice cream.
Chatterjee et al. (2016) enriched Indian sweetened yogurt with 1%, 2%, and 3% (v/milk) of trypticwhey protein hydrolysate (TWPH). A level of 3%, v/v, of TWPH was most acceptable. Significantdifference was observed in case of % ACE inhibition (33,11% for sample with 1% TWPH, 43.17% forsample with 2% TWPH and 57.19% for sample with 3% TWPH). Addition of 3% TWPH may not bebeneficial to improve antioxidant properties of Indian sweetened yogurt but can enhance the % ACEinhibition.
Matumoto-Pintro et al. (2011) investigated the use of modified whey protein in yogurt formulations.Whey protein was modified to produce yogurt with acceptable texture properties. The studydemonstrates that the modification of whey protein ingredient prior to addition to milk can improve thetextural quality of both set-style and stirred-style yogurts.
Soukoulis et al. (2014) formulated a probiotic bread by applying a film-forming solution (edible film)based on a binary blend containing 0.5% (w/v) sodium alginate and 2% (w/v) WPC inoculated with theprobiotic strain Lactobacillus rhamnosus GG. The addition of whey improved the survival of the L.rhamnosus strain during drying and storage.
Castro et al. (2013) studied a strawberry-flavored dairy beverage supplemented with whey. Beverageswere prepared by mixing up to 80% of whey, strawberry pulp, and sugar and milk. The formulation wasfermented using a mixed culture containing strains of S. thermophilus, L. delbrueckii subsp. Bulgaricus,and L. acidophilus until a pH of 4.7 was reached. The fermented beverage with best properties was thesample that contained 45% of whey.
Athira et al. (2015) ultrafiltrated mozzarella cheese whey to remove lactose and mineral. Theretentate was hydrolyzed with food-grade enzyme alcalase and the hydrolysis conditions (pH,temperature, and time) were optimized for maximum antioxidant activity. WPH showed a high radicalscavenging activity. Further, they used hydrolysate for enrichment of lemon-based beverage. Theincorporation of WPH in lemon whey drink (5–10 g/L) increased its antioxidant activity from 76% to90% compared to control. So, they concluded that WPH with good nutritional and biological propertiescan be used in health-promoting foods as biofunctional ingredients.
5.3. Whey Proteins and Peptides as Carrier for ImmobilizationWhey proteins are widely used for probiotic encapsulation. As already mentioned fermented probioticdrinks are the majority of available functional foods. Probiotic beverages comprise between 60% and

70% of the total functional food market (Tripathy and Giri, 2014). That is not unexpected if it is knownthat probiotics have shown to play an important role in maintenance of the normal intestinal microflora,protection against gastrointestinal pathogens, lactose metabolism, reduction in the incidence ofurogenital and respiratory diseases, prevention of some cancers and reduction of serum cholesterol leveland blood pressure (Khani et al., 2012). Probiotics have been consumed in foods, such as yogurt forthousands of years and new application of probiotics has been proposed, such as bread, fermentedvegetables, and chocolate (Zaric et al., 2016). The shelf life of probiotics should be controlled in orderto manufacture products with a satisfactory number of live bacteria (at least 107 CFU/g) to obtain healthbenefits of probiotic cultures (Oliveira et al., 2002). Unfortunately, many studies indicated that there ispoor survival of probiotic bacteria in these products. Encapsulation of probiotics is a good way toimprove viable cell number during manufacturing or in extreme conditions as refrigerator orgastrointestinal tract (Krunic et al., 2016b).
Soukoulis et al. (2014) developed probiotic pan bread by the inclusion of Lactobacillus rhamnosusGG cells in edible films applied onto baked bread surface. They did not encapsulate probiotic cells butdelivered them through edible films, which were constituted by different combination of twobiopolymers usually used as microencapsulating agents, sodium alginate, and whey proteins. Alginicacid is nontoxic and widely used in food applications.
The most common ways to encapsulate the probiotics with whey protein as carrier are spray-dryingand extrusion (Fig. 9.3).
FIGURE 9.3 (A) Schematic presentation of the spray-drying procedure, (B) extrusion procedure.
Ying et al. (2013) encapsulated L. rhamnosus LGG by spray-drying in beads obtained from wheyproteins isolate and resistant starch (RS) matrices mixed in different ratio to protect probiotic cells inapple juice stored at 4 and 25°C. Particles with higher WPI content favored the growth of the entrappedprobiotic cells more efficiently than RS microcapsules.
Doherty et al. (2012) monitored L. rhamnosus LGG survival in juices. Probiotic cells weremicroencapsulated via extrusion in WPI matrices. It was followed by a secondary coating with differentpolysaccharides (apple pectin, citrus pectin, sodium alginate, kappa-carrageenan, iotacarrageenan, andinulin), and a final coating with an additional WPI layer to produce more mechanically stable capsules.WPI was efficient in protecting cells during a 28-day storage against low pH and high content ofphenolic acids of pomegranate and cranberry juice. The combination of WPI and apple pectin providedthe higher level of protection after gastrointestinal simulated passage in ex vivo porcine fluids.
Ribeiro et al. (2014) showed that pectin-whey proteins matrix was effective in protect cells duringsimulated gastrointestinal digestion of yogurt and presence of probiotic capsules was not negativelyaffect physiochemical parameters of yogurt.

Hernández-Rodríguez et al. (2014) investigated Lactobacillus plantarum immobilization in wheyprotein. Cell culture was entrapped in WPI and k-carrageenan complex coacervates at different pHvalues. Encapsulated of Lactobacillus plantarum significantly improve viability of cells ingastrointestinal condition (low pH value and bile salt present) compared to free cells. They alsoconcluded that the complex coacervates made with a 16.7:1 WPI-k-carrageenan weight ratio at pHvalues of 4.0 and 4.5 could be used as structural elements and probiotic carriers in functional foods,such as creams, yogurts, fermented lactic beverages, and certain types of cheeses, such as Petit Suisse.
Krunić et al. (2016c) compared effect of probiotic immobilization with different carriers. It wasinvestigated which carrier and which particle size is the most suitable for the fermentation of wheybased substrate. WPC-alginate beads showed the highest increase in viable cell number within allexamined particles. That can be explained with positive impact of WPC on growth of yogurt culture.Also, the percentage of inhibition of DPPH radicals significantly (P < 0.05) increased from an initialvalue of 15.1% to a variety of values recorded after the fermentation. The percentage of inhibition ofDPPH radicals was approximately 34.9% ± 0.5% for all samples except samples with WPC-alginatebeads. Samples with WPC-alginate beads had slightly higher inhibition of DPPH radicals, for both sizeof beads (36.5% ± 1.1% for beads with diameter 0.94 ± 0.07 mm and 38.8% ± 1.4% for bigger beadswith diameter 2.55 ± 0.09 mm). It could be assumed that proteolysis and lactic acid production as theresults of microbial activity during fermentation could be additional sources of antioxidant activity.Krunić et al. (2016c) concluded that alginate and chitosan-alginate beads are suitable for operation insystems where beads are subjected to a large number of washes, or systems that require as little aspossible of free viable cells in the medium because these beads showed low cell leaking. WPC-alginatebeads showed a high percentage of leaking, but also a high number of viable cells after fermentation.So, these beads are suitable for the production of fermented dairy products because they allow the bestgrowth of yogurt culture and parameters of the product (pH and titratable acidity), as well as goodantioxidant characteristics.
Further, Krunić et al. (2014) investigated viability of free and immobilized probiotic cells insimulated gastrointestinal conditions. In order to improve probiotic character of immobilized cells, theinfluence of beads wall material composition (alginate, WPC-alginate beads and chitosan–coatedalginate beads) was examined. Bile tolerance showed that all samples with encapsulated culture havegreat viable cell number after 4 h incubation in MRS broth with 0.3% of bovine bile. Acid toleranceassay showed that free cells had a drastic reduction in the number of viable cells in 2 h (50%) and in thethird hour there were no living cells at pH 2.5, samples with alginate beads had 36.18% surviving cellsafter 4 h. Samples with coated beads had 37.8% surviving cells after 4 h and samples with WPC-alginate beads had 40.0% surviving cells after 4 h.
Ilha et al. (2015) showed that whey used for encapsulation of Lactobacillus paracasei strain isolatedfrom grape sourdough has protective effect on probiotic in simulated gastrointestinal condition (low pHand presence of bile).
Whey protein can also be used to encapsulate bioactive compounds due to its functional properties,such as surface activity, gelation and some protective properties (Livney, 2010).
Madadlou et al. (2014) obtained particles with whey protein via heat gelation of enzymaticallyreinforced, using caffeine as drug model and confirmed that this method was responsible for obtainingstable nanoparticles with 45 nm of diameter.
Zhang et al. (2016) investigate alginate-whey protein beads as carrier for carvacrol. They showed thatalginate–whey protein beads could effectively minimize the absorption of carvacrol in the stomach andproximal intestine and increase the percentage of carvacrol being delivered to the distal small intestine.The microcapsules could completely release the encapsulated carvacrol during transition through thegastrointestinal tract of pigs.

Assadpour et al. (2016) encapsulated folic acid (vitamin B9) in maltodextrin-whey protein doubleemulsions via spontaneous emulsification method.
Abbasi et al. (2014) used WPIs beads for encapsulating vitamin D3. According to their results, beadshad the higher content residual of vitamin D3 compared to the control sample (water, native WPI, anddenaturized WPI) during 7 days of investigation of its stability in presence of air. They concluded thatthese beads are applicable in the beverage industry.
Perez-Masia et al. (2015) successfully applied electrospraying technique to encapsulate folic acid,entrapped by WPC matrix and commercial RS. According to their results, WPC particles enhanced thebioavailability and stability of folic acid.
Chapeau et al. (2016) used β-Lg and Lf coassemblies to bind vitamin B9. They showed that B9-Lf–β-Lg coacervates displayed great performance in entrapping vitamin B9 (10 mg B9/g protein) andconcluded that natural food components have great potential to be utilized as biocarriers in designingfunctional foods.
Wichchukit et al. (2013) showed that the combination of whey protein and alginate formed beadswith good integrity and zero order rate kinetics for the release of riboflavin.
Rafe et al. (2016) showed that the gelling structure of the mixed gel of WPC–rice bran protein wasimproved by adding WPC. Also, the gel structure was produced by adding WPC to the nongelling ricebran protein. They concluded that it is compatible with whey and can be applied as a functional food forinfants and adults.
6. ConclusionsCurrently, consumers have a growing interest in foods that are not only a source of basic nutrition, butwhich can also promote health and quality of life. Whey is a rich source of biologically active proteinand peptide that can be used in the production of functional food. Most whey peptides with biologicalactivity are released by enzymatic hydrolysis, but microbial fermentation can also be used for thispurpose. Bioactive peptides from whey are introduced to the food processing industry with the newtechnologies, such as UF. New manufacturing technologies, such as supplementation of fermentedproduct with specific bioactive peptides concentrated from hydrolysates of whey proteins seem toprovide a practical solution for the time being. Bioactive peptides derived from whey protein, added inprobiotic-fermented products and confectionery products (such as chocolate, biscuits, or cream) haveeffects, directly and indirectly, to human health. These peptides increase the viable number of probioticbacteria, increase the stability of the probiotic products, and act in the human organism as antioxidant,ACE-inhibitor, increase proliferation of intestinal epithelial cells, and so forth.
Immobilization is a proven method that improves peptide stability in foods and during digestion, butwhey proteins and peptides have also proved to be good carriers for probiotic bacteria. Probioticbacteria encapsulated with whey peptides as carrier are suitable for the production of fermented dairyproducts because they allow satisfactory growth of probiotic culture and parameters of the product, andalso protect probiotic bacteria during their transit through the gastrointestinal tract. Using whey proteinand peptide for probiotics encapsulation is a good practice for nondiary foods, too, since nondairyprobiotic foods are becoming popular for people with lactose intolerance.
The potential of whey proteins and peptides for the formulation of functional foods has been longdemonstrated, but they are still not mass-produced except as a dietary supplement for bodybuilders.
Bioactive peptides are suitable for application in food, due to a simple procedure to produce andseparate them. Also, good technological properties of whey protein and peptides fractions are obtainedby UF and contribute to their wide use in food manufacturing.

ReferencesAbbasi A, Emam-Djomeh Z, Mousavi MAE, Davoodi D. Stability of vitamin D3 encapsulated in
nanoparticles of whey protein isolate. Food Chem.. 2014;143:379–383.Adjonu R, Doran G, Torley P, Agboola S. Screening of whey protein isolate hydrolysates for their
dual functionality: influence of heat pre-treatment and enzyme specificity. Food Chem..2013;136:1435–1443.
Adler-Nissen J. Enzymic hydrolysis of food proteins. New York, NY, United States: Elsevier AppliedScience Publishers; 1986.
Adriena DK, Anne P, Pertti M, Ladislav C, Hannu JTK. Antioxidant properties of whey proteinhydrolysates as measured by three methods. Eur. Food Res. Technol.. 2010;230:865–874.
Agyei D, Potumarthi R, Danquah MK. Optimisation of batch culture conditions for cell-envelope-associated proteinase production from Lactobacillus delbrueckii subsp. lactis ATCC® 7830™.Appl. Biochem. Biotechnol.. 2012;168:1035–1050.
Aimutis WR. Bioactive properties of milk proteins with particular focus on anticariogenesis. J. Nutr..2004;134(4):989–995.
Anderson ME. Glutathione: an overiew of biosynthesys and modulation. Chemico Biol. Interact..1998;111:1–14.
Assadpour E, Maghsoudlou Y, Jafari SM, Ghorbani M, Aalami M. Optimization of folic acid nano-emulsification and encapsulation by maltodextrin–whey protein double emulsions. Int. J. Biol.Macromol.. 2016;86:197–207: 2016.
Athira S, Mann B, Saini P, Sharma R, Kumar R, Singh AK. Production and characterisation of wheyprotein hydrolysate having antioxidant activity from cheese whey. J. Sci. Food Agric..2015;95:2908–2915.
Attaallah W, Yilmaz AM, Erdoğan N, Yalçin AS, Aktan AO. Whey protein versus whey proteinhydrolyzate for the protection of azoxymethane and dextran sodium sulfate induced colonictumors in rats. Pathol. Oncol. Res.. 2012;18(4):817–822.
Beermann C, Hartunga J. Physiological properties of milk ingredients released by fermentation. FoodFunct.. 2013;4:185–199.
Belem MAF, Gibbs BF, Lee BH. Proposing sequences for peptides derived from whey fermentationwith potential bioactive sites. J. Dairy Sci.. 1999;82:486–493.
Benkerroum N. Antimicrobial peptides generated from milk proteins: a survey and prospects forapplication in the food industry. Int. J. Dairy Technol.. 2010;63:320–338.
Bertucci JI, Liggieri CS, Colombo ML, Cavalli SEV, Bruno MA. Application of peptidases fromMaclura pomifera fruit for the production of active biopeptides from whey protein. LWT FoodSci. Technol.. 2015;64:157–163.
Boirie Y, Dangin M, Gachon P, Vasson MP, Maubois JL. Slow and fast dietary proteins differentlymodulate postprandial protein accretion. Proc. Natl. Acad. Sci. USA. 1997;94:14930–14935.
Bordenave S, Sannier F, Ricart G, Piot JM. Continuous hydrolysis of goat whey in an ultrafiltrationreactor: generation of alpha-lactorphin. Prep. Biochem. Biotechnol.. 1999;29:189–202.
Brody EP. Biological activities of bovine glycomacropeptide. Br. J. Nutr.. 2000;84:39–46.

Brubaker PL, Anini Y. Direct and indirect mechanisms regulating secretion of glucagon-like peptide-1 and glucagon-like peptide-2. Can. J. Physiol. Pharmacol.. 2003;81:1005–1012.
Caccavo D, Pellegrino NM, Altamura M, Rigon A, Amati L. Antimicrobial and immunoregulatoryfunctions of lactoferrin and its potential therapeutic application. J. Endotoxin Res.. 2002;8:403–417.
Calbet JA, Holst JJ. Gastric emptying, gastric secretion, and enterogastrone response afteradministration of milk proteins or their peptide hydrolysates in humans. Eur. J. Nutr..2004;43:127–139.
Camfield DA, Owen L, Scholey AB, Pipingas A, Stough C. Dairy constituents and neurocognitivehealth in ageing. Br. J. Nutr.. 2011;22:1–17.
Campagna S, Cosette P, Molle G, Gaillard JL. Evidence for membrane affinity of the C-terminaldomain of bovine milk PP3 component. Biochim. Biophys. Acta. 2001;1513:217–222.
Campagna S, Mathot AG, Fleury Y, Girardet JM, Gaillard JL. Antibacterial activity ofLactophoricin, a synthetic 23-residues peptide derived from the sequence of bovine milkcomponent-3 of protease peptone. J. Dairy Sci.. 2004;87:1621–1626.
Cassiani DM, Yamul DK, Conforti PA, Pérez VA, Lupano CE. Structure and functionality of wheyprotein concentrate-based products with different water contents. Food Bioprocess. Technol..2013;6:217–227.
Castro WF, Cruz AG, Bisinotto MS, Guerreiro LMR, Faria JAF, Bolini HMA, Cunha RL, Deliza R.Development of probiotic dairy beverages: rheological properties and application of mathematicalmodels in sensory evaluation. J. Dairy Sci.. 2013;96:16–25.
Castro RJS, Sato H. Comparison and synergistic effects of intact proteins and their hydrolysates onthe functional properties andantioxidant activities in a simultaneous process of enzymatichydrolysis. Food Bioprod. Process.. 2014;92:80–88.
Català-Clariana S, Benavente F, Giménez E, Barbosa J, Sanz-Nebot V. Identification of bioactivepeptides in hypoallergenic infant milk formulas by capillary electrophoresis–mass spectrometry.Anal. Chim. Acta. 2010;683:119–125.
Chabance B, Marteau P, Rambaud JC, Migliore-Samour D, Boynard M, Perrotin P, Guillet R, JollèsP, Fiat AM. Casein peptide release and passage to the blood in humans during digestion of milkor yogurt. Biochimie. 1998;80:155–165.
Chapeau AL, Tavares GM, Hamon P, Croguennec T, Poncelet D, Bouhallab S. Spontaneous co-assembly of lactoferrin and b-lactoglobulin as a promising biocarrier for vitamin B9. FoodHydrocolloid. 2016;57:280–290.
Chatterjee A, Kanawjia SK, Khetra Y. Properties of sweetened Indian yogurt (mishti dohi) asaffected by added tryptic whey protein hydrolysate. J. Food Sci. Technol.. 2016;53:824–831.
Chatterton DEW, Smithers G, Roupas P, Brodkorb A. Bioactivity of β-lactoglobulin and α-lactalbumin: technological implications for processing. Int. Dairy J.. 2006;16:1229–1240.
Conti JP, Ceriani MC, Juliarena MA, Esteban EN. Protein and peptide profile of a fluid base forfunctional beverages obtained by whey fermentation. Inf. Technol.. 2012;23:61–70.
Cheung LKY, Aluko RE, Cliff MA, Li-Chan ECY. Effects of exopeptidase treatment onantihypertensive activity and taste attributes of enzymatic whey protein hydrolysates. J. Funct.Foods. 2015;13:262–275.
Corrêa APF, Daroitb DJ, Fontouraa R, Meiraa SMM, Segalina J, Brandellia A. Hydrolysates ofsheep cheese whey as a source of bioactive peptides with antioxidant and angiotensin-converting

enzyme inhibitory activities. Peptides. 2014;61:48–55.Cornish J. Lactoferrin promotes bone growth. Biometals. 2004;17:331–335.Creamer LK, Sawyer L. β-Lactoglobulin. In: Roginski H, Fuquay JW, Fox PF, eds. Encyclopedia of
Dairy Sciences. New York, NY, United States: Academic Press; 2003.Demers-Mathieu V, Gauthier SF, Britten M, Fliss I, Robitaille G, Jean J. Antibacterial activity of
peptides extracted from tryptic hydrolyzate of whey protein by nanofiltration. Int. Dairy J..2013;28:94–101.
Doherty SB, Auty MA, Stanton C, Ross RP, Fitzgerald GF, Brodkorb A. Application of whey proteinmicro-bead coatings for enhanced strength and probiotic protection during fruit juice storage andgastric incubation. J. Microencapsul.. 2012;29:713–728.
Drago SR, González RJ. Foaming properties of enzymatically hydrolyzed wheat gluten. Innov. FoodSci. Emerg. Technol.. 2000;1:269–273.
Dryakova A, Pihlanto A, Marnila P, Curda L, Korhonen H. Antioxidant properties of whey proteinhydrolysates as measured by three methods. Eur. Food Res. Technol.. 2010;230:865–874.
Dziuba B, Dziuba M. Milk proteins-derived bioactive peptides in dairy products: molecular,biological, and methodological aspects. Acta Sci. Pol. Technol. Aliment.. 2014;13(1):5–25.
Elfahri, K., 2012. Release of bioactive peptides from milk proteins by lactobacillus species. Degree.School of Biomedical and Health Sciences. Victoria University. Available from:http://vuir.vu.edu.au/21473/.
El-Zahar K, Sitohy M, Choiset Y, Métro F, Haertlé T, Chobert JM. Peptic hydrolysis of ovine β-lactoglobulin and α-lactalbumin: exceptional susceptibility of native ovine β-lactoglobulin topepsinolysis. Int. Dairy J.. 2005;15:17–27.
Ferlay J, Soerjomataram I, Dikshit R, Eser S, Mathers C, Rebelo M, Parkin DM, Forman D, Bray F.Cancer incidence and mortality worldwide: sources, methods, and major patterns in GLOBOCAN2012. Int. J. Cancer. 2015;136(5):359–386.
Foegeding EA, Davis JP. Food protein functionality: a comprehensive approach. Food Hydrocoll..2011;25:1853–1864.
Fox PF, McSweeney PLH. Milk proteins. Dairy Chemistry and Biochemistry. London, UnitedKingdom: Blackie Academic, Professional; 1998.
Gapper LW, Copestake DEJ, Otter DE, Indyk HE. Analysis of bovine immunoglobulin G in milk,colostrum, and dietary supplements: a review. Anal. Bioanal. Chem.. 2007;389:93–109.
Gobbetti M, Minervini F, Rizzello CG. Bioactive peptides in dairy products. In: Hui YH, Chandan R,Clark S, Cross NA, eds. Handbook of Food Products Manufacturing: Health, Meat, Milk, Poultry,Seafood, and Vegetables. Hoboken, NJ, United States: John Wiley & Sons; 2007:489–517.
Gupta A, Mann B, Kumar R, Sangwan RB. ACE-inhibitory activity of cheddar cheeses made withadjunct cultures at different stages of ripening. Adv. Dairy Res.. 2013;1:1–6.
Hall WL, Millward DJ, Long SJ, Morgan LM. Casein and whey exert different effects on plasmaamino acid profiles, gastrointestinal hormone secretion, and appetite. Br. J. Nutr.. 2003;89:239–248.
Haque E, Chand R, Kapila S. Biofunctional properties of bioactive peptides of milk origin. Food Rev.Int.. 2009;25:28–43.
Hernández-Ledesma B, Amigo L, Ramos M, Recio I. Release of angiotensin convertingenzymeinhibitory peptides by simulated gastrointestinal digestion of infant formulas. Int. DairyJ.. 2004;14:889–898.

Hernandez-Ledesma B, Contreras M, Recio I. Antihypertensive peptides: production, bioavailability,and incorporation into foods. Adv. Colloid Interface. 2011;165:23–35.
Hernández-Ledesma B, Dávalos A, Bartolomé B, Amigo L. Preparation of antioxidant enzymatichydrolysates from alpha-lactalbumin and beta-lactoglobulin: identification of active peptides byHPLC-MS/MS. J. Agric. Food Chem.. 2005;53:588–593.
Hernández-Rodríguez L, Lobato-Calleros C, Pimentel-González DJ, Vernon-Carter J. Lactobacillusplantarum protection by entrapment in whey protein isolate: κ-carrageenan complex coacervates.Food Hydrocoll.. 2014;36:181–188.
Herregods G, Camp JV, Morel N, Ghesquert B, Gevaert K, Vercruysse L, Dierck S, Quanten E,Smagghe G. Angiotensin I-converting enzyme inhibitory activity of gelatin hydrolysates andidentification of bioactive peptides. J. Agric. Food Chem.. 2015;59(2):552–558.
Ijäes H, Collin M, Finckenberg P, Pihlanto-Leppälä A, Korhonen H, Korpela R. Antihypertensiveopioid-like milk peptide a-lactorphin: lack of effect on behavioral tests in mice. Int. Dairy J..2004;14:201–205.
Ilha EC, da Silva T, Lorenz JG, Rocha G, Sant’Anna ES. Lactobacillus paracasei isolated fromgrape sourdough: acid, bile, salt, and heat tolerance after spray drying with skim milk and cheesewhey. Eur. Res. Technol.. 2015;240(5):977–984.
Jakala P, Vapaatalo H. Antihypertensive peptides from milk proteins. Pharmaceuticals.2010;3(1):251–272.
Jeewanthi C, Paik H, Kim M, Lee N, Kim S, Yoon C. Characteristics of whey protein hydrolysatesfrom cheese whey, favors on various food applications. Chem. Ind. Chem. Eng. Q..2014;20(4):503–509.
Jisha S, Padmaja G. Whey protein concentrate fortified baked goods from cassava-based compositeflours: nutritional and functional properties. Food Bioprocess. Technol.. 2011;4:92–101.
Johansson I, Holgerson LP. Milk and oral health. Nestle Nutr. Workshop Ser. Pediatr. Program..2011;67:55–66.
Josse AR, Phillips SM. Impact of milk consumption and resistance training on body composition offemale athletes. Med. Sport Sci.. 2012;59:94–103.
Kailasapathy K. Encapsulation technologies for functional foods and nutraceutical productdevelopment. CAB Rev. Perspect. Agric. Vet. Scie. Nutr. Nat. Resour.. 2009;4:1–19.
Kim SB, Ku MJ, Cho WM, Ki KS, Kim HS, Nam MS. Production of ironbinding peptides fromcolostral whey by enzymatic hydrolysis. Korean J. Food Sci. Anim. Resour.. 2010;30:923–929.
Khani S, Hosseini HM, Taheri M, Nourani MR, Imani Fooladi AA. Probiotics as an alternativestrategy for prevention and treatment of human diseases: a review. Inflamm. Allerg. DrugsTargets. 2012;11:79–89.
Kong B, Peng X, Xiong YL, Zhao X. Protection of lung fibroblast MRC-5 cells against hydrogenperoxideinduced oxidative damage by 0.1–2.8 kDa antioxidative peptides isolated from wheyprotein hydrolysate. Food Chem.. 2012;135(2):540–547.
Korhonen H, Pihlanto A. Technological options for the production of health-promoting proteins andpeptides derived from milk and colostrum. Curr. Pharm. Des.. 2007;13:829–843.
Krunić, T., Arsic, S., Bulatović, M., Vukašinović-Sekulić, M., Rakin, M., 2015. Recent trends inwhey utilization—production of bioactive peptides. In: 7th International Scientific and ExpertConference of the International TEAM Society, pp. 382–385.

Krunic, T., Bulatovic, M., Boric, M., Rakin, M., 2016. Improvement of bioactivity and technologicalproperties of whey protein. In: III International Congress, Food Technology, Quality and Safety.pp. 254–260
Krunić, T., Bulatović, M., Obradović, N., Vukašinović-Sekulić, M., Mojovic, L., Rakin, M., 2014.Fermentative activity and viability of immobilized probiotic starter culture ABY-6 in whey basedsubstrates. In: II International Congress , Food Technology, Quality and Safety, pp. 297–302.
Krunic TZ, Bulatovic ML, Obradovic NS, Vukasinovic-Sekulic MS, Rakin MB. Effect ofimmobilisation materials on viability and fermentation activity of dairy starter culture in whey-based substrate. J. Sci. Food Agric.. 2016;96:1723–1729.
Krunić TZ, Obradović NS, Bulatović ML, Vukašinović-Sekulić MS, Trifkovic K, Rakin MB. Impactof carrier material on fermentative activity of encapsulated yoghurt culture in whey basedsubstrate. Hem. Ind.. 2016;71(1):41–48.
Kumari A, Mann B, Prerna S, Singh RRB, Kumar R, Sharma R. Assesment of antioxidant andphysico-chemical characteristics of ice cream added with whey protein hydrolysates. Indian J.Dairy Sci.. 2013;66(5):382–387.
Leatherhead Future Directions for the Global Functional Foods Market. United Kingdom:Leatherhead Food Research; 2011.
Le Maux S, Giblin L, Croguennec T, Bouhallab S, Brodkorb AI. Lactoglobulin as a molecular carrierof linoleate: characterization and effects on intestinal epithelial cells in vitro. J. Agric. FoodChem.. 2012;60:9476–9483.
Lee WJ, Farmer JL, Hilty M, Kim YB. The protective effects of lactoferrin feeding against endotoxinlethal shock in germ-free piglets. Infect. Immun.. 1998;66:1421–1426.
Li YW, Li B, He J, Qian P. Structureeactivity relationship study of antioxidative peptides by QSARmodeling: the amino acid next to C-terminus affects the activity. J. Pept. Sci.. 2011;17:454–462.
Lim SM, Lee NK, Park KK, Yoon YC, Paik HD. ACE-inhibitory effect and physicochemicalcharacteristics of yogurt beverage fortified with whey protein hydrolysates. Korean J. Food Sci.Anim. Resour.. 2011;31:886–892.
Livney YD. Milk proteins as vehicles for bioactives. Curr. Opin. Colloid Interf. Sci.. 2010;15:73–83.Liu X, Jiang D, Peterson DG. Identification of bitter peptides in whey protein hydrolysate. J. Agric.
Food Chem.. 2014;62(25):5719–5725.Lollo PC, Amaya-Farfan J, de Carvalho-Silva LB. Physiological and physical effects of different
milk protein supplements in elite soccer players. J. Hum. Kinet.. 2011;30:49–57.Lopez-Exposito I, Recio I. Antibacterial activity of peptides and folding variants from milk proteins.
Int. Dairy J.. 2006;16:1294–1305.Ma JJ, Mao XY, Wang Q, Yang S, Zhang D, Chen S, Li YH. Effect of spray drying and freeze drying
on the immunomodulatory activity, bitter taste, and hygroscopicity of hydrolysate derived fromwhey protein concentrate. Lebensm. Wiss. Technol.. 2014;56(2):296–302.
Madadlou A, Jaberipour S, Eskandari MH. Nanoparticulation of enzymatically cross-linked wheyproteins to encapsulate caffeine via micro-emulsification/heat gelation procedure. LWT Food Sci.Technol.. 2014;57:725–730.
Madureira AR, Pereira CI, Gomes AMP, Pentado ME. Bovine whey proteins: overview on theirmain biological properties. Food Res. Int.. 2007;40:197–211.
Mann B, Kumari A, Kumar R, Sharma R, Prajapati K, Mahboob S, Athira S. Antioxidant activity ofwhey protein hydrolysates in milk beverage system. J. Food Sci. Technol.. 2015;52(6):3235–

3241.Manso MA, López-Fandino R. κ-Casein macropeptides from cheese whey: physicochemical,
biological, nutritional, and technological features for possible uses. Food Rev. Int.. 2004;20:329–355.
Markus CR, Jonkman LM, Lammers JH, Deutz NE, Messer MH, Rigtering N. Evening intake of α-lactalbumin increases plasma tryptophan availability and improves morning alertness and brainmeasures of attention. Am. J. Clin. Nutr.. 2005;81:1026–1033.
Martin M, Wellner A, Ossowski I, Henle T. Identification and quantification of inhibitors forangiotensin-converting enzyme in hypoallergenic infant milk formulas. J. Agric. Food Chem..2008;56:6333–6338.
Martinez MJ, Carrera Sánchez C, Rodríguez Patino JM, Pilosof AMR. Bulk and interfacial behaviourof caseinoglycomacropeptide (GMP). Colloid. Surf. B. 2009;71(2):230–237.
Marnila P, Korhonen HJT. Lactoferrin for human health. In: Corredig M, ed. Dairy Ingredients:Food and Nutraceutical Uses. Oxford, United Kingdom: Woodhead Publishing; 2009:290–307.
Marsh AJ, Hill C, Ross RP, Cotter PD. Fermented beverages with health-promoting potential: pastand future perspectives. Trends Food Sci. Technol.. 2014;38:113–124.
Matumoto-Pintro PT, Rabiey L, Robitaille G, Britten M. Use of modified whey protein in yoghurtformulations. Int. Dairy J.. 2011;21:21–26.
Meisel H, Walsh D, Murray B, FitzGerald RJ. ACE inhibitory peptides. In: Mine Y, Shahidi T, eds.Nutraceutical Proteins and Peptides in Health and Disease. Boca Raton, FL, United States:Taylor Francis Group; 2009:269–315.
Mezzaroba LFH, Carvalho JE, Ponezi AN, Antonio MA, Monteiro KM, Possenti A, Sgarbieri VC.Antiulcerative properties of bovine α-lactalbumin. Int. Dairy J.. 2006;16:1005–1012.
Miclo L, Roux E, Genay M, Brusseaux E, Poirson C, Jameh N, Perrin C, Dary A. Variability ofhydrolysis of β-, αs1-, and αs2-caseins by 10 strains of Streptococcus thermophilus and resultingbioactive peptides. J. Agric. Food Chem.. 2012;60:554–565.
Mils S, Ross RP, Hill C, Fitzgerald GF, Stanton C. Milk intelligence: mining milk for bioactivesubstances associated with human heath. Int. Dairy J.. 2011;21:377–401.
Mullally MM, Meisel H, FitzGerald RJ. Angiotensin-I-converting enzyme inhibitory activities ofgastric and pancreatic proteinase digests of whey proteins. Int. Dairy J.. 1997;7:299–303.
Naik L, Mann B, Bajaj R, Sangwan RB, Sharma R. Process optimization for the production of bio-functional whey protein hydrolysates: adopting response surface methodology. Int. J. Pept. Res.Ther.. 2013;19:231–237.
Nakai S, Modler HW. Food proteins. Properties and Characterization. New York, NY, United States:Wiley–VCH Publishers; 1996.
Nagaoka S. Cholesterol-lowering proteins and peptides. In: Mine Y, Shahidi T, eds. NutraceuticalProteins and Peptides in Health and Disease. Boca Raton, FL, United States: Taylor FrancisGroup; 2006:41–68.
Nieto-Nieto TV, Wang YX, Ozimek L, Chen LY. Effects of partial hydrolysis on structure andgelling properties of oat globular proteins. Food Res. Int.. 2014;55:418–425.
Nilsson M, Holst JJ, Bjorck IM. Metabolic effects of amino acid mixtures and whey protein inhealthy subjects: studies using glucose-equivalent drinks. Am. J. Clin. Nutr.. 2007;85:996–1004.
Oliveira MN, Sodini I, Remeuf F, Tissier JP, Corrieu G. Manufacture of fermented lactic beveragescontaining probiotic cultures. J. Food Sci.. 2002;67:2336–2340.

O’Loughlin IB, Murray BA, FitzGerald RJ, Brodkorb A, Kelly PM. Pilot-scale production ofhydrolysates with altered bio-functionalities based on thermally denatured whey protein isolate.Int. Dairy J.. 2014;34(1):146–152.
Ozer BH, Kirmaci HA. Functional milks and dairy beverages. Int. J. Dairy Technol.. 2010;63:1–15.Palatnik DR, Porcel MVO, González U, Zaritzky N, Mercedes E. Recovery of caprine whey protein
and its application in a food protein formulation. LWT Food Sci Technol.. 2015;63:331–338.Parodi PW. A role for milk proteins and their peptides in cancer prevention. Curr. Pharm. Des..
2007;13:813–828.Pan D, Guo Y. Optimization of sour milk fermentation for the production of ACE-inhibitory peptides
and purification of a novel peptide from whey protein hydrolysate. Int. Dairy J.. 2010;20:472–479.
Paul M, van Hekken DL. Assessing antihypertensive activity in native and model queso frescocheeses. J. Dairy Sci.. 2010;94:2280–2284.
Pellegrini A, Dettling C, Thomas U, Hunziker P. Isolation and characterization of four bactericidaldomains in the bovine α-lactoglobulin. Biochim. Biophys. Acta. 2001;1526:131–140.
Perez-Masia R, Lopez-Nicolas R, Periago MJ, Ros G, Lagaron JM, Lopez-Rubio A. Encapsulation offolic acid in food hydrocolloids through nanospray drying and electrospraying for nutraceuticalapplications. Food Chem.. 2015;168:124–133.
Pescuma M, Hebert EM, Mozzi F, de Valdez GF. Whey fermentation by thermophilic lactic acidbacteria: evolution of carbohydrates and protein content. Food Microbiol.. 2008;25:442–451.
Phelan M, Kerins D. The potential role of milk-derived peptides in cardiovascular disease. FoodFunct.. 2011;2:153–167.
Picariello G, Ferranti P, Fierro O, Mamone G, Caira S, Di Luccia A, Monica S, Addeo F. Peptidessurviving the simulated gastrointestinal digestion of milk proteins: biological and toxicologicalimplications. J. Chromatogr. B. 2010;878:295–308.
Piccolomini A, Iskandar M, Lands L, Kubow S. High hydrostatic pressure pre-treatment of wheyproteins enhances whey protein hydrolysate inhibition of oxidative stress and IL-8 secretion inintestinal epithelial cells. Food Nut. Res.. 2012;56(1):1–10.
Pihlanto-Leppala A, Koskinen P, Phlola K, Tupasela T, Korhonen H. Angiotensin I-convertingenzyme inhibitory properties of whey protein digests: concentration and characterization of activepeptides. J. Dairy Res.. 2000;67:53–64.
Pihlanto-Leppala A, Rokka T, Korhonen H. Angiotensin I converting enzyme inhibitory peptidesderived from bovine milk proteins. Int. Dairy J.. 1998;8:325–331.
Poh SS, Abdul Majid FA. Thermal stability of free bromelain and bromelainpolyphenol complex inpineapple juice. Int. Food Res. J.. 2011;18(3):1051–1060.
Poltronieri P, Cappello MS, D’Urso OF. Bioactive peptides with health benefit and their differentialcontent in whey of different origin. In: Benitez RM, Ortero GM, eds. Whey: Types, Compositionand Health Implications. Hauppauge, NY, United States: Nova Publisher; 2012.
Poste AE, Sampels H, Holder A, Hinrichs J. A comparison of micellar casein and β-casein as sourcesof basic peptides through tryptic hydrolysis and their enrichment using two-stage ultrafiltrationInternational. J. Dairy Technol.. 2012;65(4):482–489.
Power O, Fernández A, Norris R, Riera FA, FitzGerald RJ. Selective enrichment of bioactiveproperties during ultrafiltration of a tryptic digest of β-lactoglobulin. J. Funct. Foods. 2014;9:38–47.

Qian B, Xing M, Cui L, Deng Y, Xu Y, Huang M, Zhang S. Antioxidant, antihypertensive, andimmunomodulatory activities of peptide fractions from fermented skim milk with Lactobacillusdelbrueckii ssp. bulgaricus LB340. J. Dairy Res.. 2011;78:72–79.
Quintieri L, Caputo L, Monaci L, Deserio D, Morea M, Baruzzi F. Antimicrobial efficacy of pepsin-digested bovine lactoferrin on spoilage bacteria contaminating traditional Mozzarella cheese.Food Microbiol.. 2012;31(1):64–71.
Rafe A, Vahedi E, Hasan-Sarei AG. Rheology and microstructure of binary mixed gel of rice branprotein–whey: effect of heating rate and whey addition. J. Sci. Food Agric.. 2016;96(11):3890–3896.
Rammer P, Groth-Pedersen L, Kirkegaard T, Daugaard M, Rytter A, Szyniarowski P, Hoyer-HansenM, Povlsen LK, Nylandsted J, Larsen JE, Jäättelä M. BAMLET activates a lysosomal cell deathprogram in cancer cells. Mol. Cancer Ther.. 2010;9:24–32.
Reitelseder S, Agergaard J, Doessing S, Helmark IC, Lund P. Whey and casein labeled with L-[1-13C]leucine and muscle protein synthesis: effect of resistance exercise and protein ingestion. Am.J. Physiol. Endocrinol. Metab.. 2011;300:231–242.
Requena P, Daddaoua A, Guadix E, Zarzuelo A, Suárez MD, Sánchez de Medina F, Martínez-Augustin O. Bovine glycomacropeptide induces cytokine production in human monocytesthrough the stimulation of the MAPK and the NF-kappaB signal transduction pathways. Br. J.Pharmacol.. 2009;157(7):1232–1240.
Ribeiro MC, Chaves KS, Gebara C, Infante FNS, Grosso CRF, Gigante ML. Effect ofmicroencapsulation of Lactobacillus acidophilus LA-5 on physicochemical, sensory, andmicrobiological characteristics of stirred probiotic yoghurt. Food Res. Int.. 2014;66:424–431.
Rodríguez-Figueroa JC, Reyes-Díaz R, González-Córdova AF, Troncoso-Rojas R, Vargas-ArispuroI, Vallejo-Cordoba B. Angiotensin-converting enzyme inhibitory activity of milk fermented bywild and industrial Lactococcus lactis strains. J. Dairy Sci.. 2010;93:5032–5038.
Rosaneli CF, Bighetti AE, Antonio MA, Carvalho JE, Sgarbieri VC. Protective effect of bovine milkwhey protein concentrate on the ulcerative lesions caused by subcutaneous administration ofindomethacin. J. Med. Food. 2004;7:309–314.
Roufik S, Gauthier SF, Turgeon SL. In vitro digestibility of bioactive peptides derived from bovineβ-lactoglobulin. Int. Dairy J.. 2006;16:294–302.
Rutherfurd SM. Methodology for determining degree of hydrolysis of proteins in hydrolysates. J.AOAC Int.. 2010;3(5):1515–1522.
Samra RA, Wolever TM, Anderson GH. Enhanced food intake regulatory responses after a glucosedrink in hyperinsulinemicmen. Int. J. Obes.. 2007;31:1222–1231.
Seifu E, Buys EM, Donkin EF. Significance of the lactoperoxidase system in the dairy industry andits potential applications. Trends Food Sci. Technol.. 2005;16:137–154.
Sharma R, Shah N. Approximate composition of biologically active components of whey.Nutrafoods. 2010;9(4):39–45.
Shi J, Ahlroos-Lehmus A, Pilvi TK, Korpela R, Tossavainen O, Mervaala EM. Metabolic effects of anovel microfiltered native whey protein in diet-induced obese mice. J. Funct. Foods.2012;4(2):440–449.
Shi J, Finckenberg P, Martonen E, Ahlroos-Lehmus A, Pilvi TK, Korpela R, Mervaala EM.Metabolic effects of lactoferrin during energy restriction and weight regain in diet-induced obesemice. J. Funct. Foods. 2012;4(1):66–78.

Silveira ST, Martínez-Maqueda D, Recio I, Hernández-Ledesma B. Dipeptidyl peptidase-IVinhibitory peptides generated by tryptic hydrolysis of a whey protein concentrate rich in β-lactoglobulin. Food Chem.. 2013;141:1072–1077.
Sipola M, Finckenberg P, Vapaatalo H, Pihlanto-Leppala A, Korhonen H, Korpela R, Nurminen ML.Alpha-lactorphin and beta-lactorphin improve arterial function in spontaneously hypertensive rats.Life Sci.. 2002;71:1245–1253.
Soukoulis C, Yonekura L, Gan HH, Behboudi-Jobbehdar S, Parmenter C, Fisk I. Probiotic ediblefilms as a new strategy for developing functional bakery products: the case of pan bread. FoodHydrocoll.. 2014;39:231–242.
Stanton C, Ross RP, Fitzgerald GF, Van Sindern D. Fermented functional foods based on probioticsand their biogenic metabolits. Curr. Opin. Biotechnol.. 2005;16:198–203.
Subtil SF, Rocha-Selmi GA, Thomazini M, Trindade MA, Netto FM, Favaro-Trindade CS. Effect ofspray drying on the sensory and physical properties of hydrolysed casein using gum arabic as thecarrier. J. Food Sci. Technol.. 2014;51(9):2014–2021.
Svanborg C, Argestam H, Aronson A, Bjerkvig R, Duringer C. HAMLET kills tumor cells by anapoptosis-like mechanism: cellular, molecular, and therapeutic aspects. Adv. Cancer Res..2003;88:1–29.
Tahavorgar A, Vafa M, Shidfar F, Gohari M, Heydari I. Whey protein preloads are more beneficialthan soy protein preloads in regulating appetite, calorie intake, anthropometry, and bodycomposition of overweight and obese men. Nutr. Res.. 2014;34(10):856–861.
Tavares TG, Contreras MM, Amorim M, Martín-Álvarez PJ, Pintado ME, Recio I, Malcata FX.Optimization, by response surface methodology, of degree of hydrolysis, antioxidant, and ACE-inhibitory activities of whey protein hydrolyzates obtained with cardoon extract. Int. Dairy J..2011;21:926–933.
Terzic-Vidojevic A, Mihajlovic S, Uzelac G, Veljovic K, Tolinacki M, Nikolic M, Topisirovic Lj,Kojic M. Characterization of lactic acid bacteria isolated from artisanal Travnik young cheeses,sweet creams, and sweet kajmaks over four seasons. Food Microbiol.. 2014;39:27–38.
Theolier J, Hammami R, Labelle P, Fliss I, Jean J. Isolation and identification of antimicrobialpeptides derived by peptic cleavage of whey protein isolate. J. Funct. Foods. 2013;5:706–714.
Tipton KD, Elliott TA, Cree MG, Wolf SE, Sanford AP. Ingestion of casein and whey proteins resultin muscle anabolism after resistance exercise. Med. Sci. Sports Exerc.. 2004;36:2073–2081.
Tripathy MK, Giri SK. Probiotic functional foods: survival of probiotics during processing andstorage. J. Funct. Foods. 2014;9:225–241.
Uchida M, Ohshiba Y, Mogami O. Novel dipeptidyl peptidase-4 inhibiting peptide derived frombetalactoglobulin. J. Pharmacol. Sci.. 2011;117:63–66.
Udenigwe CC, Mohan A. Mechanisms of food proteinderived antihypertensive peptides other thanACE inhibition. J. Funct. Foods. 2014;8:45–52.
Uluko H, Zhang S, Liu L, Li H, Cui W, Xue H, Zhao L, Sun W, Lu J, Lv J. Pilot-scale membranefractionation of ACE inhibitory and antioxidative peptides from ultrasound pretreated milkprotein concentrate hydrolysates. J. Funct. Foods. 2014;7:350–361.
Wakabayashi H, Yamauchi K, Takase M. Lactoferrin research, technology and application. Int. DairyJ.. 2006;16:1241–1251.
Walstra P. Proteins. In: Walstra P, ed. Physical chemistry of foods. New York, NY, United States:Marcel Dekker; 2003:203–249.

Wang H, Cui L, Chen W, Zhang H. An application in Gouda cheese manufacture for a strain ofLactobacillus helveticus ND01. Int. J. Dairy Technol.. 2011;64:386–393.
Wang J, Liu Y, Ning J, Yu J, Li X, Wang F. Is the structural diversity of tripeptides sufficient fordeveloping functional food additives with satisfactory multiple bioactivities? J. Mol. Struct..2013;1040:164–170.
Welderufael F, Jauregi P. Development of an integrative process for the production of bioactivepeptides from whey by proteolytic commercial mixtures. Sep. Sci. Technol.. 2010;45:2226–2234.
Wichchukit S, Oztop MH, McCarthy MJ, McCarthy KL. Whey protein/alginate beads as carriers of abioactive component. Food Hydrocoll.. 2013;33:66–73.
Wojcik M, Burzynska-Pedziwiatr I, Wozniak LA. A review of natural and synthetic antioxidantsimportant for health and longevity. Curr. Med. Chem.. 2010;17:3262–3288.
Wouters AGB, Rombouts I, Fierens E, Brijs K, Delcou JA. Relevance of the functional properties ofenzymatic plant protein hydrolysates in food systems. Comp. Rev. Food Sci. Food Safe..2016;15(4):786–800.
Wronkowska M, Jadacka M, Soral-Smietana M, Zander L, Dejnowiec F, Banaszczyk P, Jelinski T,Szmatowicz B. ACID whey concentrated by ultrafiltration a tool for modeling bread properties.LWT—Food Sci. Technol.. 2015;61:172–176.
Yahya RS, Ghanem OH, Foyouh AA, Atwa M, Enany SA. Role of interleukin-8 and oxidative stressin patients with hepatocellular carcinoma. Clin. Lab.. 2013;59:969–976.
Ying D, Schwander S, Weerakkody R, Sanguansri L, Gantenbein-Demarchi C, Augustin MA.Microencapsulated Lactobacillus rhamnosus GG in whey protein and resistant starch matrices:probiotic survival in fruit juice. J. Funct. Foods. 2013;5:98–105.
Yolken RH, Losonsky GA, Vonderfecht S, Leister F, Wee SB. Antibody to human rotavirus in cow’smilk. N. Engl. J. Med.. 1985;312:605–610.
Yvon M, Beucher S, Guilloteau P, Le Huerou-Luron I, Corring T. Effects of caseinomacropeptide(CMP) on digestion regulation. Reprod. Nutr. Dev.. 1994;34:527–537.
Zaric DB, Bulatović ML, Rakin MB, Krunic TZ, Loncarevic IS, Pajin BS. Functional, rheologicaland sensory properties of probiotic milk chocolate produced in a ball mil. RSC Adv..2016;6:13934–13941.
Zayas JF. Functionality of Proteins in Food. New York, NY, United States: Springer-Verlag; 1997: p373.
Zhang Y, Wang QC, Yu H, Zhu J, de Lange K, Yin Y, Wang Q, Gong J. Evaluation of alginate–wheyprotein microcapsules for intestinal delivery of lipophilic compounds in pigs. J. Sci. Food Agric..2016;96:2674–2681.
Zhao G, Liu Y, Zhao M, Ren J, Yang B. Enzymatic hydrolysis and their effects on conformationaland functional properties of peanut protein isolate. Food Chem. 2011;127:1438–1443.
Zimecki M, Kruzel ML. Milk-derived proteins and peptides of potential therapeutic and nutritivevalue. J. Exp. Ther. Oncol.. 2007;6:89–106.
Zydney AL. Protein separations using membrane filtration: new opportunities for whey fractionation.Int. Dairy J.. 1998;l(8):243–250.
Further Reading

Athira S, Mann B, Sharma R, Kumar R. Ameliorative potential of whey protein hydrolysate againstparacetamol-induced oxidative stress. J. Dairy Sci.. 2013;96(3):1431–1437.
Doherty SB, Gee VL, Ross RP, Stanton C, Fitzgerald GF, Brodkorb A. Efficacy of whey protein gelnetworks as potential viability-enhancing scaffolds for cell immobilization of Lactobacillusrhamnosus GG. J. Microbiol. Methods. 2010;80:231–241.
Jelinski T, Szmatowicz B. ACID whey concentrated by ultrafiltration a tool for modeling breadproperties. LWT Food Sci.Technol.. 2015;61:172–176.
Leeb E, Götz A, Letzel T, Cheison SC, Kulozik U. Influence of denaturation and aggregation of β-lactoglobulin on its tryptic hydrolysis and the release of functional peptides. Food Chem..2015;187:545–554.
Nurminen ML, Sipola M, Kaarto H, Pihlanto-Leppala A, Piilola K, Korpela R, Tossavainen O,Korhonen H, Vapaatalo H. Alpha-lactorphin lowers blood pressure measured by radiotelemetry innormotensive and spontaneously hypertensive rats. Life Sci.. 2000;66:1535–1543.
Saeed M, Anjum FM, Khan MR, Khan MI, Nadeem M. Isolation, characterization, and utilization ofstarter cultures for the development of whey ghurt drink. Br. Food J.. 2013;115:1169–1186.

C H A P T E R 1 0
Amino Acids: Carriers ofNutritional and Biological ValueFoodsFanny Ribarova Medical College Yordanka Filaretova, Medical University Sofia, Sofia, Bulgaria
AbstractAmino acids are major building elements of protein, determining its biological value, carriers ofgene information, and playing a biochemical role, specific for each amino acid.The aim of this chapter is to present information on the development of knowledge on aminoacids, emphasizing the methods for assessment of their content in foods, and the methods forassessment of the biological value of food protein.The chapter presents general information on amino acids completed with important historicalpoints in the development of the knowledge on them, substantiating the need to proceed furtherwith scientific research. The current status of analytical methodology, concerning particularlyamino acid analysis and their participation in biological methods for evaluation of food proteinsis characterized. An option for a more correct calculation approach to amino acid content versustotal protein in foods is proposed.The analysis of the current scientific information outlines the need to standardize the analyticalmethods and calculation approaches implemented in the assessment of amino acid content infood products.
Keywords
amino acidschemistryanalysisprotein qualitybiological value

1. IntroductionThe quantitative and qualitative characteristics of protein intake areessential for the proper somatic and neuropsychic development and for thehealth status and work ability of the population. FAO reports have revealedthat some 800 million of the global population suffer from chronicmalnutrition resulting from lack or insufficient amount of food, mostfrequently caused by insufficient protein and energy intake(Moughan, 2012).
The development of contemporary precise indicators and criteria tocharacterize the protein component in conventional food products, novelprotein foods, or protein supplements are currently actively discussed bynutritional scientists (Millward, 2012a; Rutherfurd, 2015; Tome, 2012). Themost important criterion revealing the protein quality and physiologicalimportance is its amino acid composition. Amino acids are involved invarious numerous biochemical reactions and mechanisms associated withthe normal functions of the organism and maintaining its proper healthstatus. The successful implementation of amino acids in establishinghealthy, preventive, and/or curative diets requires comprehensiveknowledge on amino acids content in foods, their metabolism and usage asfood supplements to support healthy human nutritional status, and astherapeutic products administered in the course of treatment of variousdiseases.
Amino acids realize their biological function in the organism not only intheir capacity of essential protein elements, but as compounds withindividual activity and engagement in a rich variety of biochemical andphysiological processes.
Considering the historical development of the knowledge on amino acids,it could be stated that it contains three sequential stages progressing in linewith the development of the protein scientific research, keeping at the sametime the individuality of the knowledge on the role of free amino acids andtheir derivatives.
The first stage started yet in the 19th century when certain amino acidswere detected as individual compounds. Further studies, striving to clarifythe composition and structure of newly found proteins, resulted in the

establishment of new amino acids and provided evidence affirming aminoacids as major building elements of protein (Belitz et al., 2009).
The second stage progressed in the early 1800s and was associated withan intense search for new protein raw materials because of the scientificassertions stating the existence of real danger for global protein hunger andthe necessity to increase not only the quantity but also the quality of foodproteins with an emphasis on the amino acids building them. Thus, thisstage marked a certain progress in the methods for amino acids analysisused to control the food proteins quality (Butikofer et al., 1991; Gilani et al., 2008; Otter, 2012).
The third stage already enhanced the knowledge horizons penetrating inthe bioaccessibility, bioavailability, and metabolism of certain amino acidsand their derivatives involved in various biochemical reactions and in thecomposition of bioactive compounds vitally important for the organism(Jonker et al., 2012; Katsanos et al., 2016; Rutherfurd-Markwick, 2012).
Different hypotheses are presented currently referring to the involvementof proteins, respectively, the amino acids building them in the mechanismsoutlining the relationship between food, nutrition, and human health.Protein priority is reasonable as they are not only carriers of geneticinformation but are also active biocomponents, essential for the organism inmost cases. Their significance for the life, growth, development, and healthof living beings is outlined by their name “proteins,” evolving from theGreek word Πρωτɛύζ; first, most important, fundamental. This chapterpresents scientific information in two basic dimensions of the knowledge onamino acids: markers for food proteins quality and approaches for analysisand assessment of amino acid content. The following aspects are discussedin this context: Historical remarks, Chemistry and classification of aminoacids, amino acids—markers for the food protein quality, Methods foramino acids analysis.
2. General Information2.1. Historical RemarksThe isolation and identification of certain amino acids as individualcompounds started in the early 1800s. The first one, isolated by the French

chemists Vauguelin and Robiquet in 1806, was asparagine, isolated fromasparagus. Twenty-six years later it was established again by anotherresearcher as a component of the protein edestin. Asparagic acid was alsodiscovered later, being isolated from legumes by Ritthausen in 1868. Only afew years separated the isolation of the first amino acid from the discovery(1810) of the sulfur-containing amino acid cystine and its monomer,cysteine, was found many years later, in 1884. Many efforts were necessaryin those times to achieve the discovery of compounds, though similar incomposition and structure, that was clearly manifested by the sequentialreports on amino acids. The last one to be detected was the amino acidthreonine (1935) by Rose who proposed the term “essential amino acids”and established the minimum daily requirements of amino acids for optimalgrowth (Belitz et al., 2009).
Following the history of amino acids discoveries it could be evidencedthat it was associated with development of the knowledge on proteins.Thus, for example, lysine, methionine, tryptophan, thyrosine, and serinewere isolated from milk protein, casein; glutamic acid, from wheat gluten;histidine, from prolamin; isoleucine, from fibrin; leucine, from wool andmuscle mass (Belitz et al., 2009). The term amino acid has been used since1898 and in 1902 Emil Fischer and Franz Hofmeister described the bindingof amino acids one to another in linear chains by an amino-group of oneand carboxylic group of the other amino acid, respectively. Thosecompounds are known as peptides and amino acids in those times, regardedonly as basic building units of the proteins.
The interest in amino acids increased particularly in the 1950–60s of the20th century when multiple surveys and expert statements instigated theopinion of an existing world protein crisis (Webb, 2008). Considering theprotein significance for human health and development of the generations, alarge-scale research was initiated to search for an outcome of this issue. Thesolution was suggested to be in finding new protein sources and informulating food products enriched with proteins and amino acids (single-cell protein, soybean, fishmeal, peanuts, genetically improved plants,synthetic amino acids, etc.). This scientific and industrial progress imposedand required the establishment of the amino acid content of the newproducts and, respectively, an assessment of their quality compared to thatof animal protein foods, thus placing amino acids in the center of new

productions control and activating the search for more precise assessmentmethods. Discussing the issue from the position of current knowledge Webb(2008) described the so-called protein crisis and clarified the causes for itsappearance. The authors outlined that most possibly the world protein crisiswas the result of massive overestimation of the protein needs of children, aswell as that the children could manage on a lower minimum proteinconcentration in their diets than adults could (Webb, 2008). The currentrecommendations for children’s protein intake on a weight-for-weight basisare only about twofold, and not fivefold greater than those for adults asprovided by past recommendations. The calculations then were based onthree main sources: physiological protein needs depending on the age;population number and its distribution in age groups; and the globalproduction of protein foods. The calculations showed the necessity of large-scale increases of protein production. All projects and technologies,developed at that time for the achievement of new protein-rich foodsrequired lots of research, scientific potential, and abundant financing. Newscientific results have been obtained though, unfortunately, in spite of thegood idea and intentions of the presumable and prospected desiredeffectiveness was not achieved. Thus, several decades of expensive researchefforts did not provide any success. An admitted cause is an eventual errorin the extrapolation of the results obtained by experimental studies tohuman needs. Today it is considered that the more rarely met proteindeficiency characteristic for some individual regions and for particular riskgroups is due not as much as to the increased amounts and accessibility ofprotein foods as to modified recommendations and real involvement of totalmacronutrients building the diet. The substantial differences in the scientificviews concerning the recommendations for protein, respectively, aminoacids intake in the progress of this knowledge provide particular argumentsin favor of further, broader research of this issue. One of the positiveaspects of the state addressing protein hunger is the desire to develop moreprecise methods for assessment of the nutritional and biological value ofdietary protein, covering mainly the composition and content of aminoacids (Butikofer et al., 1991; Gilani et al., 2008; Rutherfurd and Dunn, 2011; Rutherfurd and Moughan, 2012).
The historical development of the knowledge on amino acids continueswith the search for specific functions of each amino acid not only as a

building element of protein but as an individual participant in the vitalprocesses of the organism (Levesque, 2015; Levesque et al., 2012). Somescientific publications outlined several hypotheses for the role of aminoacids in the food–health relationship. The oldest one was that of Krichevskyin the 1960s of the past century on the role of arginine, explaining thepositive effect of vegetable proteins. The homocysteine hypothesis wasespecially emphasized in the clarification of the mechanisms for theinitiation and development of cardiovascular diseases, pointing out that notonly the lipid hypothesis could clarify the progress of those diseases. Themost modern hypothesis that gained broad popularity is the antioxidant onewhere various amino acids find their role and significance. Those are theamino acids–building glutathione and the amino acid arginine, which, whenmodified into citrulline causes the formation of nitric oxide—a powerfulrelaxing agent.
Nowadays the knowledge on amino acids is focused more on theirengagement in genetic mechanisms and on their inclusion in foodsupplements as bioactive ingredients with wide application in the currentglobal population diet.
3. Chemistry and Classification of AminoAcidsAmino acids are low molecular organic compounds. Their specific physicaland chemical properties are determined by the simultaneous binding of theamino and carboxylic group to one and the same carbon atom in theirmolecule. The number of amino groups differentiates them as mono- anddiamino acids and the number of carboxylic groups classifies them asmono- and dicarboxylic ones. The location of the amino group versus thecarboxylic group defines the isomeric forms marked with numbers or Greekletters α, ß, γ, and so on. The amino group in α-amino acids is separatedfrom the carboxylic group by only one carbon atom, which is why it isnamed after the first letter of the Greek alphabet—α. When the carboxylicand amino group are separated by two and more carbon atoms, they arecalled β-, γ-, and so on, amino acids. Only α-amino acids are found innature. They the generalized chemical formula shown in Fig. 10.1.

FIGURE 10.1 General Chemical Formula of Amino Acids.
When R is substituted (represented) by H, this is the amino acid glycine.The location of R could contain aliphatic, aromatic, heterocyclic, or otherfunctional groups. With the exception of glycine all α-amino acids have twoenantiomers—L and D forms. Proteinogenic amino acids are only L-forms.
Amino acids are the main elements building proteins. Peptide bonds linkthem with the nitrogen atom of the amino group of one of the acids and isbound to the carbon atom of the carboxylic group of the other acid,releasing one molecule of water and forming popypeptide chains(Fig. 10.2). The different proteins are built of a different number of aminoacids arranged one after the other in a certain sequence that is genedetermined, thus specific for each protein.
FIGURE 10.2 Peptide Chain.
More than 200 amino acids are known but only 20 of them, often calledproteinogenic, are genetically determined and take part in protein synthesis.

The other amino acids are not engaged in protein synthesis. They areformed in vivo during and after protein translation or in vitro, throughvarious experimental synthesis. They are usually detected as free aminoacids or as their derivatives in the biological fluids and tissues of theorganism.
Depending on their chemical structure amino acids are classified asaliphatic and nonaliphatic into two main groups as presented in Table 10.1with the respective subclassification.
Table 10.1
Amino acids classification.
Aliphatic Nonaliphatic1. Monoaminocarbonic
a. Glycineb. Alaninec. Isoleucined. Valinee. Leucine
2. Hydroxymonoaminocarbonica. Serineb. Threonine
3. Monoaminodicarbonica. Asparagic acidb. Glutamic acid
1. Aromatica. Phenylalanineb. Thyrosine
2. Monoaminodicarbonic ω-amidesa. Asparagineb. Glutamine
3. Diaminocarbonica. Arginineb. Lysine
4. Sulfur containinga. Cysteineb. Cystinec. Methionine
5. Heterocyclica. Tryptophanb. Histidinec. Prolined. Hydroxyproline
Having in mind the ability of the organism to synthesize amino acids andtheir demand, amino acids could be distributed in three groups: essential(irreplaceable), nonessential (replaceable), and conditionally essential.Essential amino acids cannot be synthesized by the animal organism. Theonly way to be supplied is dietary. Plants and microorganisms cansynthesize all necessary amino acids, which is why there are noirreplaceable amino acids for them. Conditionally replaceable amino acids

are irreplaceable only in certain cases (e.g., newborns, small children,pregnant women, people with metabolic diseases); for the other people theyare replaceable.
The essential dietary amino acids are: lysine, leucine, tryptophan, valine,methionine, isoleucine, threonine, phenylalanine, and histidine.
Cysteine and tyrosine are not included because of the option to obtainthem from methionine and phenylalanine, respectively. They can beconditionally essential in premature babies, whose enzyme system,providing the respective translation of amino acids, is not yet developed andin patients with liver diseases when the synthesis of those amino acids isdisturbed. In case of hereditary phenylketonuria there is a genetic defect inthe enzyme, converting phenylalanine to tyrosine, thus in this casedetermining tyrosine as an essential amino acid (Webb, 2008). For manyyears histidine has been accepted as an essential amino acid only in the dietof small children, but due to the sufficient recent new evidence and dataabout its essential role in the adult organism it was included in the basicinventory of amino acids essential for the human organism.
Amino acids, synthesized in the organism by intermediate metabolites ofthe carbohydrate and lipid metabolism or intermetabolize are calledreplaceable. The replaceable amino acids present in food protein are:alanine, arginine, proline, asparagic acid, hydroxyproline, asparagine serine,glutamic acid, glycine, and glutamine.
The role of free amino acids found in the cellular cytoplasm, forming theso-called amino acid pool, acting as a stock of the building elements forprotein synthesis in the organism is also important (Ribarova et al., 1987).
The properties of amino acids depend on their chemical composition,structure, and form of existence. They, depending on the pH of the milieu,can be cations, zwitterions, and anions. The specific rotation of amino acidsis strongly influenced by pH, as well. The amino acids found in proteinshave the same α-C-atom configuration, determine their optical activity as L-amino acids. D-forms of amino acids have also been found in nature, mostoften in proteins of microbial origin.
The chemical properties of amino acids are determined by the presenceof carboxylic and amino group. Their solubility in water varies widely—from easily soluble, proline, hydroxyproline, glycine, and alanine to thealmost insoluble cystine and tyrosine. The polar characteristics of amino

acids explains their poor solubility in organic solvents. Esterification is thetypical reaction for carboxylic groups. The esters of free amino acids areable to form cyclic dipeptide or open-chain polypeptide. The reactionsdefined by the presence of an amino group are: acylation, alkylation, andreactions with carbonyl compounds (very important reaction forspectrophotometric quantitative determination of amino acids).
The quality of food products could be affected by the reactions of aminoacids at high temperatures when side products might potentially be formedbecause of Maillard reaction (Webb, 2008). The moderate thermalprocessing leads to enhanced protein decomposition via denaturation ofnative proteins and inactivation of certain protease inhibitors, contained inthe foods, but at the same time it triggers changes in the amino acidcomposition. Thus, the thermal processing of dairy products with highcontent of reducing sugars causes certain losses of the essential amino acidlysine. The processing at high temperatures causes the formation of internalpeptide bridges between the ɛ-amino group of lysine and the carboxylicgroups of amino acids in the protein (asparagines, glutamine). Thosebridges are decomposed at the protein salt–acid hydrolysis and this type ofdamage cannot be detected by chromatographic amino acid analysis. Onlythe deviations in the content of cystine could be accepted as indirect prooffor such thermal damage.
The combination of processing at higher temperatures and alkaline mediaresults in the formation of the isopeptide lysinoalanine (LAL) that is a formnonassimilable by the organism. LAL formation has been observed also innonalkaline conditions only at heating, for example, in condensed milk,acid caseinate, poultry. Soy globulin, ovoalbumin, lysozyme, and casein arenatural proteins, naturally contained in foods, able to produce LAL whenheated in nonalkaline media. LAL is regarded as a toxic compound as itcauses cytomegalic lesions of the renal tubules. The dose, provoking thiseffect, depends on LAL form—free state or bound with the protein. It hasbeen established that free LAL has a 15–2-fold stronger effect (Finot,1983). Digestibility and net protein utilization (NPU) decrease with anincrease in LAL content. The reduction in digestibility is related to theinability of trypsin to break peptide bond in the LAL crosslink. A beneficialfact is that free LAL is rarely found in the popular foods, and is in minimalamounts. Yet in 1982 the Otava meeting of Codex alimentarius on

vegetable proteins discussed LAL content from the viewpoint of reducedbiological value of the protein in the food rather than from the aspect of itstoxicity (because of the low content).
Cysteine and cystine are particularly sensitive to the different culinaryand technological processes. The thermal processing of protein results inthe release of significant amounts of SH2 and other volatile sulfurcompounds as a result from cystine decomposition. The oxidation processesthemselves cause the formation of cysteic acid that is completely notassimilated by the organism (Chang, 1983; Ribarova et al., 1987). Thesulfur-containing amino acid methionine is stable at high temperatures. It isquickly oxidized to methionine sulfoxide and further to methionine sulfonethat also leads to its conversion into a form inassimilable by the organism.
Histidine dipeptides are stable at high temperatures—anserine, carnosine,and balenine that are used as indicators for determination of the meat typein the different technologically processed meat food products.
Many scientific surveys have been dedicated to the development ofmethods for determination of accessible and inaccessible amino acid formsaiming to precisely define the real biological value of food proteins. Thischaracteristic can be achieved most accurately at combination of thechemical analysis with the biological experiment.
4. Amino Acids and Proteins Biological ValueThe capacity of food proteins to satisfy the demands of the organism ofnitrogen and essential amino acids determines their quality. Generally, theterm presented by the wording biological value of proteins means that theextent of nitrogen retention by the organism consuming protein foodproducts. The effectiveness of nitrogen assimilation in building the young,growing, developing organism or in supporting the nitrogen balance in theadult organism depends on protein amino acid composition and itsstructural features. The biological role of each individual amino aciddepends on its chemical features and on the specifics of the processes it isengaged in. It is doubtless that the content of essential amino acids that areabsolutely necessary for building the organism’s own proteins in the processof its development, growth, and functioning, is a criterion for the quality offood protein.

T. Voit was the first researcher to announce that the different foods andfood proteins had different effect on the growth and retention of nitrogen inyoung animals as well as on the nitrogen balance in adult individuals. Thefirst methods for evaluation of the quality of food proteins were proposedalmost a century ago. They were indirect methods based on the growth oftest animals fed with the protein foods that were in the focus of the study.
In 1946, Block and Mitchell proposed a calculation method forestimation of the biological value of protein based on its amino acidcomposition and referred to it as method of the amino acid score (Pellet andYoung, 1980). It was based on the comparison of the determined amountsof individual amino acids in the studied protein to those in appropriateprotein referent materials or amino acid mixtures. In 1973, the ExpertCommittee at FAO/WHO on protein requirements studied in depth thepapers and standpoints of numerous research groups and commissionsengaged in protein quality assessment. This work resulted in proposing astandard ideal protein, corresponding most precisely to the amino aciddemands of the organism. This FAO document also listed the formula forcalculation of amino acid score that was proposed as a temporary criterion.It is still used currently by the laboratories engaged with assessment of foodprotein. The formula is:
The nutritionist literature uses, besides amino acid score, also the termschemical score and protein score, all of them bearing the same meaning andcontent. The use of the term amino acid score reflects more precisely themeaning assigned to it as it involves the content of the individual aminoacids.
The amino acid with the smallest score (respectively, smallest amino acidnumber) sets a limit to the biological value of food proteins and is calledfirst limiting amino acid. The prevailing limiting amino acids in foodproducts are lysine, tryptophan, and sulfur-containing amino acids.
The method of the amino acid score provides many benefits anddisadvantages. It is simple and economical. It also enables the

determination of limiting amino acids and the amounts of supplementingproteins. Its shortcomings are the lack of information about amino acidaccessibility, on the extent of releasing amino acids during digestion(bioavailability), the role of essential nitrogen, and on the balance withreplaceable amino acids. This information can be acquired after biologicaltests that underlie the determination of protein requirements, as well.
The onset of the efforts to establish the physiological requirements ofprotein and amino acids could be traced back decades. An expert group ofFAO/WHO published yet in 1973 the physiological protein and essentialamino acids age-dependent demands setting three population age groups: 3–6 months; 10–12 years; 22+ years (FAO/WHO, 1973). The scientificknowledge in this field followed its upward progress and the followingyears brought new suggestions from various authors to reconsider thereference protein, proposed by the expert group. Those views weresupported by the results achieved by the studies of Torun et al. (1981),establishing that the values of the essential amino acids methionine, cystine,threonine, and valine in the reference protein provided by FAO in 1973were raised. Those data correlated with the results of Pineda et al. (1981)and showed the necessity to modify the content of the ideal protein used forcalculation of the amino acid score. New data were also published on theamino acid requirements of various animals and humans of different ageand belonging to different risk groups, underlining the specifics of therequirements depending on the status of the individual or particularorganism (Deglaire and Moughan, 2012). The demand of one essentialamino acid is determined by its minimal amount necessary to maintain thenitrogen balance even in the excessive presence of other essential aminoacids. When one essential amino acids is missing, there is a net loss of bodynitrogen, that is, a body protein depletion. The concept of limiting aminoacids has limited practical relevance in human nutrition, as the differentdiets have various structure and composition and the unification of oneapproach, such as the amino acid score requires its upgrading withadditional evidence provided by biological measurements of protein quality.NPU is such a method. It is mostly used in the evaluation of animalnutrition but is sometimes implemented currently in assessing humannutrition. It reflects the percentage of protein retained in the organism ofgrowing test animals in conditions of limited protein intake. Using nitrogen

balance, NPU can be assessed directly for humans, using the followingformula:
NPU is about 70 typically for most diets and it is not affected by the rateof dietary animal protein (Webb, 2008).
The reported comprehensive studies confirm more and more the lack ofinformation on the degree of digestibility of protein as a whole and of theamino acids building it. The chemical analysis of food protein and itsbioefficacy in the organism are separated by a need to clarify therelationship between the chemical assessment of the protein and itsphysiological significance for the organism. Many various studiesconcentrate their attention in this direction. Batterham (1992) elaborated theformulation for bioavailability of amino acids as the dietary proportion ofamino acids absorbed in a chemical form suitable for protein synthesis inthe organism. It is clear that the assessment of bioavailability is a multiple-step process depending on various factors but it is also clear that onlycalculation approaches based on chemical analysis are not sufficient forcorrect comprehensive assessment of food protein quality. The need toupdate the information and assessment of protein biological value triggerthe development and implementation of test models aiming to acquireevidence on the digestibility of amino acids in humans implementingdifferent criteria to nutritional protein quality estimation. Attempts havebeen made to upgrading the amino acid score in order to ensure more realcompliance with the protein requirements of the organism. The simplestapproach using the amino acid score in this aspect is to evaluatecomparatively the limiting amino acid in the test protein and the content ofthe same amino acid in 1 g of egg protein as it is a protein with a high

degree of bioavailability. Another similar protein that can be used asreference protein is mother’s milk. The calculation follows the formula:
This approach does not always provide correct assessment of thebioavailability of amino acids in the studied food proteins as, with someproteins difficult to digest, this calculation technique can significantlyoverestimate the biological quality of the tested protein and to provide avalue, much different from the real content of essential amino acids. Manyscientific discussions have been organized on the selection of referenceprotein and the development of this knowledge was presented in details inthe review of Millward (2012b), analyzing consecutively the expert reportsof FAO/WHO/UNU of 1985, 1991, and 2007 on the dietary protein quality.Particularly the report of 2007 was discussed in details and assessedoutlining that the proofs are insufficient to enable recommendations forspecific health outcomes. Nitrogen balance studies have shown 10% higherprotein requirements for adults, and also some uncertainty has remainedabout the interpretation of results from the majority of studies on aminoacid requirements (Millward, 2012b). That is why the studies continue infurther search of appropriate assessment methods.
The increased production and, respectively, consumption of foodsupplements, containing bioactive proteins, peptides, and differentcombinations of amino acids requires precise analysis, specific criteria, andcorrect assessment of the protein enabling the establishment of theircomposition, and argumentation of their respective claims that, on its sidedemanding standardization of the relevant methodology, recommendationsrecorded in the scientific papers and analyses of numerous researchers(Rutherfurd-Markwick, 2012; Tome, 2012). In this aspect Gilani et al.(2008) showed the need to standardize the determination of amino acids andbioactive peptides for evaluating protein quality and to assess the proteinclaims of foods. Protein digestibility-corrected amino acid score(PDCAAS), which requires amino acid composition data, is the official

method for assessing protein claims of foods and supplements,recommended by FAO/WHO (Gilani et al., 2008).
In the analysis of the international activities on the issue of proteinquality, Gilani et al. (2008) successfully presented the development of thetopic in the time. The onset period was in the period 1982–89, when theCodex Committee addressed the subject of vegetable proteins, followed bythe activities of FAO/WHO (2001) and FAO/WHO/UNU (2002) expertreviews. All those years evidenced the implementation of continuouschanges and amendments to the recommendations referring to themethodology for protein quality assessment. Thus, for example, after theadoption by FAO/WHO (1991) of PDCAAS (that included not only thechemical assessment of amino acid content but also the idea of theirbioavailability), this method has been criticized for a number of reasons.The FAO/WHO/UNU (2002) Expert Consultation on Protein and AminoAcid Requirements endorsed the PDCAAS method with minormodifications to the calculation method, including: calculation of scoringpatterns, protein digestibility, amino acid digestibility, amino aciddigestibility by fecal and ileal methods, bioavailability of lysine in theprocessed proteins, truncation of the amino acid score, and so on(Gilani, 2012). The author of this analysis clearly showed the significanceof the issue, the need to enhance the spectrum of indicators and criteria andthe demand for new regulatory activities.
Certain contemporary studies have used direct test methods enabling themeasuring of the requirement of indispensable amino acids, and the extentof amino acids availability. Traditionally, the methods to establish aminoacids availability are based on intestinal absorption or digestibility. Thedietary intake of amino acids increases at taking into account the nitrogenbalance and/or growth of the test animals until constant levels (plateaus)were reached. Other methods utilized tagged atoms (Elango et al., 2012),and another group of methods emphasized on the oxidation of particularamino acid differing from test indispensable amino acids—they are calledindicator amino acids (Elango et al., 2012; Humayun et al., 2006). Theoxidation of indicator amino acids was accepted as a marker of proteinsynthesis that decreased with the increasing of the level of oxidized aminoacids (Elango et al., 2008; Levesque et al., 2012).

The metabolic availability method, based on the indicator amino acidoxidation technique was first tested, for example, on amino acids lysineavailability in growing pigs, fed with peas as a protein source (Moehnet al., 2005). Some other studies have shown the effect of heat treatment onthe bioavailability of lysine, using also the indicator amino acid oxidationtechnique and others have adapted the metabolic availability method for usein humans (Levesque, 2015; Prolla et al., 2013). Many studies arededicated to the selection of test animals, adequate for the task, as it isnecessary that they match as much as possible to the human physiologicalspecifics. Thus, besides the routinely used laboratory rats, models with pigswhose upper digestive tract is anatomically and physiologically moresimilar to that of humans, and, besides that, they are fed with foodsincluded in the human diet, are promoted (Deglaire and Moughan, 2012). Inclinical tests the knowledge on the behavior of amino acids along theirroute in the organism is particularly important, that is, assessment of theirbioefficacy. In this aspect, special scientific attention has been paid toanabolic amino acids—leucine, arginine, and citrulline (Jonker et al., 2012),and other authors have focused on distinction between nutritionaldispensability and clinical efficacy of amino acids as homocysteine andcardiovascular disease (Wang et al., 2015); homocysteine and cancer andother diseases (Deng and Zheng, 2012; Lin et al., 2010; Miller et al., 2013; Wang et al., 2012; Zhang et al., 2012; 2015); glycine as animmunonutrient (D’Mello, 2012); tryptophan—medical aspects (Palegoet al., 2016); amino acids and kidney diseases (Ribarova et al., 2003;Vazelov et al., 1999; Vazelov and Ribarova, 2013); excitatory amino acidsand neurodegenerative disorders (Flores et al., 2012), and many others(Jonker et al., 2012; Katsanos et al., 2016).
Ghosh et al. (2012) presented a very interesting study, examining theeffect of adjusting total dietary protein for quality and digestibility(PDCAAS), including data from 116 countries, from FAO/FBS (foodsupply), from USDA nutrient tables, and from other data sources, by usingmodern statistical analyses. They have shown that protein and utilizableprotein availability were independently and negatively associated withstunting (P = 0.017). The utilizable protein, according to the authors, was abetter index of population impact of risk/prevalence of protein inadequacy(Ghosh et al., 2012).

Those facts imperatively challenge the nutritionists with the importanttask to unify the criteria for assessment and standardization of the usedanalytical methods and approaches for calculation and processing of theresults revealing the amino acid content of food products.
5. Amino Acid Analysis of Food ProteinsThe methods for determination of amino acids are among the most difficultones for implementation in food analytical chemistry. They progressthrough several stages. Besides the stages, relevant for almost all methodsfor food analysis (sampling, homogenization, quantitative, and qualitativedetermination), there is a substantial difference in the processing oflaboratory samples including determination of total protein, proteinhydrolysis, and derivatization of the obtained amino acids. Hydrolysis andderivatization are most critical for the quality of the analyses (Finley, 1985;Rutherfurd and Moughan, 2012).
Sampling is a very important stage of the analytical procedure. Thereproducible sampling is associated with the heterogenicity of the products,the content of high amounts of fat in animal products and fibers in plantfoods. Fats impede the proper homogenization of the sampled aliquot partsof the food product while with the greater amount of fibers thehomogenization could hardly be realized only by grinding.
Special attention is paid to sampling in the basic European regulations onthe content of various chemical substances in foods. The fundamentalinternational standard EN ISO 17025 explicitly postulates that suchmethods must have a developed optimal sampling plan. The number ofcollected samples most generally depends on the type of analyzed foodstuff,the size of the lot and, last but not least, on the repeatability (coefficient ofvariation) of the method itself.
Sample preparation for amino acid analysis covers the following stages:homogenization; determination of total protein; hydrolysis andderivatization of the obtained amino acids.
The homogenization depends on the type and structure of the particularsamples.
A mandatory step for all samples is to convert them into air-dry state,recording the weight of eliminated water. Similarly, the greater fat amount

is to be removed, particularly concerning foodstuffs of animal origin(Finley, 1985; Ribarova et al., 1987; Rutherfurd and Moughan, 2012).After this preliminary processing the homogenization implements two mainapproaches: grinding for most sample types and cutting into pieces withfurther grinding of the samples with higher fiber content.
5.1. Determination of Total ProteinIn order to establish the amino acid composition of the foods knowledge ontheir total protein content, including all protein types, found in the productcomposition is essential in the first place. Thus, cereals contain albumins,globulins, prolamins, glutelins, with different amino acid composition andcontent, respectively. The use of the total protein content in the calculationof amino acids in a product enables the elaboration of an assessment of itsbiological value based on essential amino acids. If the aim is to determinethe composition of a particular protein, it has to be preliminarily separatedfrom the other protein components, building the particular product. Thetotal protein content is an important indicator both for the foods and for theassessment of the dietary intake. The protein content in foods is determinedroutinely by Kjedahl’s method, one of the oldest and standardized methodsin food analytical chemistry, which enables the simultaneous determinationof protein and nonprotein nitrogen. Although it is not possible to distinguishquantitatively the nitrogen, obtained from the proteins and from thenonprotein compounds in the food, this method is a preferred analyticalapproach because of the comparatively good analytical parameters,reasonable cost, and the option for automation (Greenfield andSouthgate, 1992). It is based on the determination of total nitrogen in asample, which, multiplied by a coefficient, relevant for the sample,produces the total protein amount. And, although at nitrogen determinationthe errors can be minimized, the values of calculated protein bear alwayssome uncertainty. This is due to the fact that one part of the nitrogen is notprotein, that is, foodstuffs contain a significant number of substances, oftenin great amounts that increase the nitrogen content of nonprotein origin.Those are purines, pyrimidines, urea, amino sugars, creatine, creatinine,methylamino compounds, and so on. Only the nitrogen from the nitrate andnitrite salts contained in the samples is not included in the total nitrogen

content as it is released into the environment during the analysis.Nonprotein nitrogen can often represent one half and even more of the totaldetermined amount. Fish and seafood are rich in nonprotein nitrogen. Theratio between protein and nonprotein nitrogen to the greatest extent dependson the origin (nature) of the sample. The effect of interspecies differences isnot to be neglected, as well as the implemented food processing technology.There is evidence for efforts to achieve greater precision when calculatingtotal nitrogen, protein nitrogen, and amino acid nitrogen as well as separatedetermination of nucleic acids, but Kjedahl’s method is still relevant inroutine protein analysis. The main points in this analysis are the selection ofa catalyst and digestion methods. The temperature during digestion is acritical point and it must be kept between 370 and 410°C. The catalystCuSO4/TiO2 is preferred to HgO because of environmental concerns. Thereare also other methods, such as Dumas’s method, determining total nitrogenby combustion with oxygen, followed by reduction to liberate nitrogen gas.There is an automated version of the method with nitrogen evolved beingmeasured by thermal conductivity. Comparative studies of the two methodshave shown good compliance with very small increase of the valuesobtained by Dumas’s method. To make things easier at application ofKjeldahl’s method, numerous companies have developed and offeredsemiautomatic and automatic apparatuses. The international experience hasenabled the calculation of conversion coefficients for nitrogen-to-proteinconversion. For most basic food products with high protein content therecalculation with coefficients reduces to a certain degree the deviations inthe determined total protein amounts. Those coefficients have beenrecommended by FAO/WHO (FAO/WHO, 1973). Some of them arepresented in Table 10.2. It is recommended to list always the usedrecalculation coefficients when presenting data for food protein content.

Table 10.2
Coefficients for conversion of total nitrogen into total protein.
Food Products FactorsWheat 5.83
Wheat flour 5.70
Pasta 5.70
Rice 5.95
Rye, barley, etc. 5.83
Peanuts 5.46
Soy 5.71
Walnuts 5.18
Various seeds 5.30
Milk 6.38
Cheese 6.38
Other products 6.25
5.2. Protein HydrolysisThe procedure that is most critical for the analytical quality and gettingsatisfactory results is the one concerning the breaking of the peptide bonds,which, as a principle, are very strong from a chemical point of view.Another important issue is that the different amino acids are significantlyvariably stable to the possible chemical mixes applicable in the hydrolysis(strong acids or bases). The presence of oxygen in the mix during thehydrolysis is also a risk for reduced analytical recovery of the analysis ofcertain amino acids. On the other hand, protein type, its molecular mass,and qualitative composition are important as they are responsible for themoment when an acid will be released from the protein molecule,respectively, how long it will be subject to the decomposing effect of theaggressive hydrolysis media. The most unstable amino acids aremethionine, cystine, threonine, and tryptophan. Branched-chain amino acidsneed a longer hydrolysis time in order to be separated from the peptide

chain (Benson et al., 1981; Ribarova et al., 1987). The proteincomposition in food products varies in a broad range. Thus, theachievement of perfect hydrolysis conditions, specific for the respectiveproducts is a difficult task addressed by numerous scientific studies andliterature reviews (Liu and Chang, 1971; Pellet and Young, 1980;Williams, 1986). Different versions of hydrolysis are applied for proteinanalysis: acid—using various acids; alkaline—with different bases; enzyme—involving different peptidases. There are many published methods withvarious hydrolysis conditions concerning hydrolyzing chemical mixes andhydrolysis time, as well as the used heating equipment (muffle furnaces andmicrowave ovens) (Kabaha et al., 2011). The book Amino Acids in HigherPlants, J.P.F. D’Mello, ed., 2015, presents rich information concerning thediversity of conditions used in protein hydrolysis though the majority ofthem are not implemented in everyday routine practice. This fact isexplained to a certain degree by the nonlinear relationship between thedegree of protein decomposition and the duration of the hydrolysis processin similar other conditions (chemical agent and temperature). Thisrelationship is close to exponential and is different for the particular aminoacids, and, particularly, for more unstable ones. When more accurate aminoacid composition data are required, least squares nonlinear regression canbe used to estimate the amino acid content of a protein source. This methodcorrects for losses of amino acids during hydrolysis based on the aminoacid yield determined using a range of hydrolysis times. In routine analysesthose differences can be compensated to a great extent by adequate methodvalidation.
Some scientists yet in the past century, aiming at most effectivehydrolysis, have proposed to perform five individual hydrolyses: three with6 N HCL, duration respectively 24, 48, and 74 h; one acid after oxidationwith performic acid and one hydrolysis with 6 N NaOH (Pellet andYoung, 1980). The extrapolation of the obtained results from the first threeacid hydrolyses enables the more precise determination of the amino acidcomposition of the protein. The oxidation with performic acid causes thetransformation of cystine and cysteine into cysteic acid and of methionine—into methionine sulfate. Those compounds are resistant to acidhydrolysis, and, after it has finished, they can be determined quantitativelytogether with the other amino acids. In some cases cysteine oxidation to

cystine is practiced through alkalization of the hydrolysis after it wasfinalized down to pH 6.8 and leaving it to the effect of the ambient air for4 h. The essential amino acid tryptophan is almost fully decomposed byacid hydrolysis. That is why its determination is made after alkaline orenzyme hydrolysis (Andrews and Baldar, 1985; Lin et al., 1985; Vries et al., 1980). Contradicting evidence has been published on the methods fordetermination of sulfur-containing amino acids. According to Pienjaceket al. (1975), the application of preoxidation of sulfur-containing aminoacids with performic acid provides certain possibilities for errors as theanalyzed food product itself can contain oxidized forms of sulfur-containingamino acids that are not assimilated by the organism. The assimilation itselfdepends on the oxidation degree. While methionine sulfoxide is assimilated,methionine sulfone cannot be assimilated by the organism. Manyresearchers, striving to save time, looked for more rational routes to applysuch hydrolysis that provided maximum real amounts for all amino acids,with minimum losses. Liu and Chang (1971) were successful in this effort,hydrolyzing the protein with 3 N solution of p-toluenesulfonic acid. Penkeet al. (1974) have performed hydrolysis with mercaptoethanolsulfonic acid,which preserved tryptophan up to 95%. Simpson et al. (1976) achieved thesame results using hydrolysis with methanesulfonic acid. All approachesimplemented for hydrolysis have advantages and disadvantages. The majordisadvantages are the low analytical recovery and poor reproducibility thatsignificantly reduce the informative value of the overall analysis and caneven lead to false conclusions in some cases. The hydrolysis conditions(temperature, duration, sample/acid, sample/base ratio) must be maximallyoptimized with a view to improving the reproducibility of this stage ofamino acid analysis.
5.3. Qualitative and QuantitativeDetermination of Amino AcidsAfter the protein was decomposed to amino acids their qualitative andquantitative determination is performed (derivatization, chromatographicseparation of the individual amino acids with further detection). Theliterature provides many various descriptions of approaches and techniques

for derivatization, separation, and detection. The derivatization of theproduced by hydrolysis amino acids also poses certain risks for worseresults (analytical recovery), although, with the time certain techniqueshave established themselves and the optimization is significantly easier toperform compared to protein hydrolysis.
The initial periods of the development of protein analysis evidenced thecomprehensive implementation of microbiological and paperchromatographic methods that have now only historical significance. Thenext step of the progress of the methodology were the thin layerchromatographic methods with good resolution and low reproducibility.Some impetus was given to those methods with the development ofdensitometry, contributing to better accuracy, improved reproducibility, andtheir implementation in routine practice.
Amino acid determination by gas–liquid chromatography requires theirquantitative transformation into volatile derivatives, such as methyl,trimethylsilyl, and N-butyl-N-trifluoroacetyl esters (Bos et al., 1983; Pelletand Young, 1980). The gas chromatographic conditions require preliminarygood cleansing of the hydrolyzates. The quantitative derivatization requiresno less efforts without guarantees for good reproducibility. Thosedifficulties place gas chromatographic methods in the rear of availablemethods for amino acid analysis and currently they are quite rarely used.
For the separation of amino acids from the obtained mixture after thehydrolysis, because the middle of the 20th century, liquid chromatographcolumns using low or high pressure have gained wide popularity (Andrewsand Baldar, 1985; Deyl, 1986; Sarwar et al., 1983; Sarwar, 1984).Chronologically, the first ones were developed much earlier and were basedon the method of Spackman et al. (1958). The columns have relatively largediameter filled with ion exchange resin, the elution is realized with differentbuffer solutions at low pressure. Because amino acids generally do notabsorb light at any useful wavelength, although tryptophan and to somedegree tyrosine and phenylalanine absorb significantly at 280 nm, they mustbe derivatized. Initially, the derivatization was performed with ninhydrinafter separating the amino acid mixture with ionexchange chromatography(postcolumn derivatization) (S. Moore). The intensity of absorption of thecolored compounds produced by derivatization is determined at wavelength570 nm for amino acids and 440 nm—for imino acids (proline and

hydroxyproline). The mechanization of the overall analytical processresulted in the creation of a number of models and versions of mechanicalamino acid analyzers by different companies, used in routine practice.Blackburn (1973) and Benson et al. (1981) published reviews containingdetails about the development of equipment and methods using ionexchange chromatography.
Although the evaluations of the obtained results by this methodologicalapproach to amino acid analysis have been good, the long time needed forthe proper separation of the individual amino acids is still a problem. Insome cases the sensitivity is unsatisfactory, thus leading to increasing thesample amount and, hence, to deterioration of the analytical parameters.
In the 1980s, high-performance liquid chromatography (HPLC) wasnominated as the most effective method for amino acid determination. Ithelped to achieve maximal speed, sensitivity, and reproducibility. Themajority of described similar methods imply amino acid derivatizationaiming at their fluorescent detection (pre- or postcolumn). The moreprevalently applied technique is precolumn derivatization with o-phthalaldehyde or phenylisothiocyanate; 6-aminoquinolyl-N-hydroxysuccinimidyl carbamate; dansyl chloride, benzyl chloride,fluorescamine (Chang, 1983; Williams, 1986). The implementation ofHPLC with reverse-phase column, precolumn derivatization, andfluorescent detection allows the determination of very small amounts ofaminoacids (of the order of picograms) (Andrews and Baldar, 1985; Chang, 1983; Deyl, 1986; Turnell and Cooper, 1982). A proper combination ofchromatographic conditions can enable the separation of D- from L-isomersof amino acids (Pellet and Young, 1980).
The available scientific publications have reported numerous studies witha substantial number of derivatization agents that have not been widelyimplemented in practice. Agents for precolumn derivatization are preferredmost of all as the obtained compounds are very well separated by reversephase HPLC and manifest considerable fluorescence thus guaranteeingreliable identification and high sensitivity.
Recently, after liquid chromatography coupled to mass spectrometerswere introduced in the chemical analyses of foods and the relative reductionof the equipment costs, more and more numerous researchers haveattempted to implement this technique in the analysis of amino acids. The

principal advantages are the high selectivity and sensitivity, good speed ofthe analysis progress and, before all, the possibility to analyze mixtures ofamino acids without derivatization. As, in principle, it is better to usereversed phase chromatography columns with this equipment, and aminoacids are strongly polar and cannot be separated well with those columns,the researchers have used ion-pairing reagents. Salt-acid extracts obtainedby hydrolysis create certain difficulties and this equipment is mainly usedfor the determination of free amino acids in some food products andbiological materials (Thiele et al., 2012). In spite of the beneficial cheapercosts of this equipment, it is still unavailable at most laboratories engagedin protein analysis.
Validation of the analytical procedure and results: Verification program(EN ISO 17025 general requirements for the competence of testing andcalibration laboratories).
Method validation is a procedure where several parameters are calculatedbased on a performed test. Those parameters provide objective informationabout the possibilities of the particular method and, respectively, for thereliability of the obtained results:
• Linear range (linearity): The difference between the smallest andthe greatest concentrations with linear relationship betweenconcentration/signal (response) in the range between them.
• Sensitivity: It is defined by two values: limit of detection and limitof quantification.
• Repeatability: Relative standard deviation (coefficient of variation).It is calculated using the results for multifold analysis of one andthe same sample in equivalent laboratory conditions.
• Analytical recovery: In the case of amino acid analysis, the mostappropriate approach is the one that uses referent materials, but,mainly because of financial concerns the routine laboratorypractice still implements the so called method of the standardaddition.
The introduction of a system for intralaboratory analytical quality controlof the performed analyses (AQA) is essential for the verification of theresults.

Principally, the system consists of two parts:
• Periodical checks of the calibration of the analytical equipment;• Periodical analyses of samples with known concentration of amino
acids.
5.4. Presentation of the ResultsAmino acids are usually expressed as mg/g of nitrogen or as g/16 g nitrogen(approximately 100 g protein). The basis of expression should be chosen tofit the specific use of the data. The most common basis of expression forother food ingredients is g/100 g of edible portion of food.
The method implemented for processing and calculation of the dataobtained after the amino acid analysis is important for the accuracy ofexpression of the amounts of amino acids. The application of variouscalculation approaches leads to substantial differences between the finalresults from the amino acid analysis of one and the same product.
In most of the published tables the sum of amino acids per 100 g protein(16 g nitrogen) exceeds significantly 100%. This excess remains frequentlyunnoticed as the losses during the hydrolysis process are in the oppositedirection and are of equivalent value. Many authors have tried tocompensate this exceeding of the value by the idea to extrapolate the resultsto a different value: 90%, 95%, and 100% (normalization).
Having in mind that protein hydrolysis is one of the stages of amino acidanalysis with poor reproducibility, the additional calculation error isinadmissible.
It has been commonly accepted that the content of each amino acid ing/16 g nitrogen should be calculated using the formula:
With: C—the molar concentration, μmol/cm3; M—molecular mass; W—sample mass, g; V—final volume, cm3; 16 g—nitrogen content per 100 g

proteinIn the protein molecule the amino acids participate as amino acid
residues (one molecule of water is missing for each peptide bond). It isreasonable to correct the molecular mass of the individual amino acids inthe above formula as M—M(H2O). In this calculation method the sum ofamino acids is smaller than the total protein content. The differencecorresponds to the actual losses resulting from the hydrolysis process. Thecalculation is not correct referring to the free amino acids contained in thefood products as well as in relation to the final amino acid residues in theprotein molecule. This error, though, is negligibly small as the proteins inthe food products are with high molecular mass and the free amino acids arein very low concentration.
The great differences in the analytical recoveries of the salt–acidhydrolysis require that the calculation with corrected molecular massesmust absolutely be combined with normalization of the results. In this waythe coefficient of variation is significantly improved and the amino acidcontent corresponds more precisely to the value of total protein.
Table 10.3 presents the amino acid content of egg protein analyzed 7times implementing both calculation approaches.

Table 10.3
Amino acid composition of egg protein.
Molecular Masses M M-MH2O
Calculation Methods Without Normalization With Normalization
Amino Acids g/16 g N CV% CV%
EssentialValine 7.33 0.28 3.65 6.68 0.06 0.86
Isoleucine 5.65 0.24 3.98 5.25 0.07 1.35
Leucine 9.20 0.43 4.50 8.54 0.08 0.88
Lysine 7.61 0.31 3.90 7.18 0.18 2.40
Methionine 4.04 0.32 7.46 3.82 0.18 4.43
Cystine 2.83 0.25 8.41 2.59 0.20 7.45
Treonine 4.78 0.29 5.79 4.37 0.11 2.43
Tryptophan 1.16 0.18 14.78 1.14 0.20 17.03
Thyrosine 4.15 0.37 8.48 4.02 0.24 5.59
Phenylalanine 6.6 0.24 3.45 6.33 0.12 1.74
ReplaceableAlanine 6.55 0.26 3.82 5.62 0.06 0.94
Arginine 6.31 0.30 4.59 6.09 0.10 1.59
Aspartic acid 10.59 0.46 4.13 9.86 0.25 2.37
Glycine 3.77 0.16 3.92 3.09 0.03 1.07
Glutamic acid 14.14 0.70 4.69 13.35 0.13 0.90
Proline 3.80 0.27 6.77 3.44 0.18 4.99
Serine 6.92 0.38 5.27 6.17 0.10 1.56
Hydroxyproline — — — — — —
Histidine 2.59 0.12 4.28 2.47 0.04 1.63
Total amino acid content 108.3 — — 100 — —

, confidence interval of the value; S, standard deviation; t, Fisher’s
coefficient; N, number of tests; , coefficient of variation (relativestandard deviation).
In the course of the amino acid analysis, in spite of the great progress inthe development of analytical technique, there are still not fully clarifiedissues and problematic steps that require comprehensive additional studiesin order to elaborate and establish standardized procedures enabling theexchange of relevant data and scientific evidence.
6. ConclusionsConsidering the rich and continuously enhancing information during thelast two centuries on the role of amino acids as a basic building unit of foodproteins and as individual bioactive compounds, engaged in numerousbiochemical reactions and physiological processes in the organism, it couldbe stated that this scientific issue continues to pose a challenge to science,in spite of the significant achievements in the field.
The amino acids issue is discussed in three main aspects. The first onerefers to the assessment of the quality of protein foods based on the contentof essential amino acids. The second aspect concerns the role of aminoacids in the absorption of proteins and covers biological analyses andapproaches, and the third aspect reveals the development and upgrading ofanalytical methods used for analysis of the amino acid content. In spite ofthe introduction of modern analytical equipment, there are still unclear andunresolved problems along the overall chain of the methodologicalanalytical course, presented in details in the relevant parts of this chapter.
We have also presented evidence from our experience in the analysis ofamino acids in Bulgarian food products listing the approach we haveapplied to the calculation of the content of amino acids in relation to theamount of protein they are contained in. In order to enable the exchange ofdata and information through the available networks it is necessary to unifythe analytical methods and calculation approaches. The establishment of astandardized procedure is the only and unique prerequisite for the

organization of a database for the amino acid composition of food products.The need for such a database is urgent and its realization requires exchangeof experience and knowledge.
The increasing amount of scientific information during the last years,concerning the individual activity and biological role of each particularamino acid, requires comprehensive analysis and further studies aimed atclarifying the mechanisms of action and the effectiveness of amino acidintake in the form of pharmaceutical products, enriched foods, or foodsupplements. The concentration of more scientific interest and energy in thefield of amino acids will contribute to the better substantiated, supportedscientific evidence explanation of the claims listed on the product label onproducts containing amino acids and, respectively, bioactive proteins. Thisprovides a response in the two dimensions of the issue—science andpractice—associated with consumers’ demands.
The progressing unbalance between the global production of foods,availability of food sourced, and raw materials on one hand, and thedemographic burst and the physiological requirements of healthy,preventive, and curative nutrition on the other, support even stronger thesignificance of the protein quality issue and the necessity for its optimaldevelopment and resolution. Food proteins are at heart of a healthy diet.
ReferencesAndrews RP, Baldar NA. Amino acid analysis of feed constituents. Sci. Tools. 1985;32(2):44–48.Batterham ES. Availability and utilization of amino acids for growing pigs. Nutr. Res. Rev..
1992;5:1–18.Belitz H-D, Grosh W, Schiberle P. Food Chemistry. fourth ed. Berlin, Germany: Springer; 2009:8–
29.Benson J, Louie P, Pradshaw R. Amino acid analysis of peptides. Peptides. 1981;4:217–259.Blackburn S. Sample preparation and hydrolytic methods in amino acid determination. second ed.
Methods and Techniques. New York, NY, United States: Marcel Dekker Inc.; 1973: pp. 17–38.Bos KD, Verbeck C, Slump P. Gas-Liquid chromatographic method for the analysis of methionine
and of methionine sulfoxide in proteins. J. Agric. Food Chem.. 1983;31(1):63–66.Butikofer U, Fuchs D, Bosset JO, Gmur W. Automated HPLC-amino acid determination of protein
hydrolysates by precolumn derivatisation with OPA and FMOC and comparison with classical ionexchange chromatography. Chromatographia. 1991;31:441–447.
Chang JY. Amino acid analysis in the pico mole range by precolumn derivatization and highperformance liquid chromatography. Methods Ezymol.. 1983;91:41–48.

Deglaire A, Moughan PJ. Animal models for determining amino acid digestibility in humans: areview. Br. J. Nutr.. 2012;108:S273–S281.
Deng YL, Zheng LP. Analysis of the relationship between serum homocysteine level and breasttumor. Mod. Prev. Med.. 2012;34:87–89.
Deyl Z. Profiling of amino-acids in body fluids and tissues by means of liquid chromatography. J.Chromatogr.. 1986;379:117–250.
D’Mello JPF. Adverse effects. In: D’Mello JPF, ed. Amino Acids in Human Nutrition and Health.Wallingford, UK: CAB International; 2012:322–353.
Elango R, Ball RO, Pencharz PB. Indicator amino acid oxidation: concept and application. J. Nutr..2008;138:243–246.
Elango R, Ball RO, Pencharz PB. Recent advances in determining protein and amino acidrequirements in humans. Br. J. Nutr.. 2012;108:S22–S30.
FAO/WHO Ad Hoc Expert, 1973. Energy and protein requirements. WHO Technical Report Series,No. 522, FAO Nutrition Meetings Reports Series 52.
FAO/WHO, 1991. Protein Quality Evaluation: Report of a Joint FAO/WHO/UNU ExpertConsultation, FAO Food and Nutrition Paper 51. Rome.
FAO/WHO, 2001. Report of the FAO/WHO Working Group on Analytical Issues Related to FoodComposition and Protein Quality. Rome, Italy.
FAO/WHO/UNU, 2002. Expert Consultation on Protein and Amino Acid Requirements in HumanNutrition. World Health Organization, Geneva, Switzerland.
Finley JW. Reducing variability in amino acid analysis. In: Finley JW, Hopkins DT, eds.Digestibility and Amino Acid Availability in Cereals and Oilseeds. St Paul, MN, United States:American Association of Cereal Chemists; 1985:15–30.
Finot PA. Lysinoalanine in food proteins. Nutr. Abstr. Rev.. 1983;53(2):67–78.Flores G, Negrete-Diaz JV, Carrion M, Andrade-Talavera Y, Bello SA, Sihra TS, Rodriguez-Moreno
A. Excitatory amino acids in neurological and neurodegenerative disorders. In: D’Mello JPF, ed.Amino Acids in Human Nutrition and Health. Wallingford, United Kingdom: CABI Publishing;2012:479–524.
Ghosh Sh, Suri D, Uauy R. Assessment of protein adequacy in developing countries: quality matters.Br. J. Nutr.. 2012;108:S77–S87.
Gilani GS. Background on international activities on protein quality assessment of foods. Br. J. Nutr..2012;108:S168–S182.
Gilani GS, Xiao C, Lee N. Need for accurate and standardized determination of amino acids andbioactive peptides for evaluating protein quality and potential health effects of foods and dietarysupplements. J. AOAC Int.. 2008;91(4):894–900.
Greenfield H, Southgate DAT. Food composition data: production management and use. New York,NY, United States: Springer US; 1992.
Humayun MA, Elango R, Moehn S, Ball RO, Pencharz PB. Application of the indicator amino acidoxidation technique for the determination of metabolic availability of sulfur amino acids fromcasein versus soy protein isolate in adult men. J. Nutr.. 2006;137:1874–1879.
Jonker R, Engelen MPKJ, Deutz NEP. Role of specific dietary amino acids in clinical conditions. Br.J. Nutr.. 2012;108:S139–S148.
Kabaha K, Taralp A, Cakmak I, Ozturk L. Accelerated hydrolysis method to estimate the amino acidcontent of wheat (Triticum durum Desf.) flour using microwave irradiation. J. Agric. Food Chem..

2011;59:2958–2965.Katsanos CS, Madura JA, Roust LR. Essential amino acid ingestion as an efficient nutritional
strategy for the preservation of muscle mass following gastric bypass surgery. Nutrition.2016;32(1):9–13.
Levesque CL. Metabolic amino acid availability in foods of plant origin: implications for human andlivestock nutrition. In: D’Mello JPF, ed. Amino Acids in Higher Plants. Wallingford, UnitedKingdom: CAB International; 2015:497–507.
Levesque CL, Elango R, Ball RO. Metabolic availability of amino acids in food protein: newmethodology. In: D’Mello JPF, ed. Amino Acids in Human Nutrition and Health. Wallingford,United Kingdom: CAB International; 2012:256–266.
Lin J, Lee IM, Song Y, Cook NR, Selhub J, Manson JE. Plasma homocysteine and cysteine and riskof breast cancer in women. Cancer Res.. 2010;70:2397–2405.
Lin XY, Yu HJ, Mei X. An improved method for the determination of tryptophan in foods. Acta Nutr.Sin.. 1985;7(1):67–72.
Liu T, Chang J. Hydrolysis of protein with p-to-luene sulfonic acid. Determination of trypthophan. J.Biol. Chem.. 1971;246:2842–2848.
Miller JW, Beresford SA, Neuhouser ML, Cheng TY, Song X, Brown EC. Homocysteine, cysteine,and risk of incident colorectal cancer in the Women’s Health Initiative observational cohort. Am.J. Clin. Nutr.. 2013;97:827–834.
Millward DJ. Amino acid scoring patterns for protein quality assessment. Br. J. Nutr.. 2012;108:S31–S43.
Millward DJ. Identifying recommended dietary allowances for protein and amino acids: a critique ofthe 2007 WHO/FAO/UNU report. Br. J. Nutr.. 2012;108:S3–S21.
Moehn S, Bertolo RFP, Pencharz PB, Ball RO. Development of the indicator amino acid oxidationtechnique to determine the availability of amino acids from dietary protein in pigs. J. Nutr..2005;135:2866–2870.
Moughan PJ. Preface: dietary protein for human health. Br. J. Nutr.. 2012;108:S1–S2.Otter D. Standardised methods for amino acid analysis of food. Br. J. Nutr.. 2012;108:S230–S237.Palego L, Betti L, Rossi A, Giannaccini G. Tryptophan biochemistry: structural, nutritional,
metabolic, and medical aspects in humans. J. Amino Acids. 2016;2016:8952520.Pellet PL, Young VR. Nutritional Evaluation of Protein Foods. Tokyo, Japan: United Nations
University; 1980: 85–102.Penke B, Ferenczi R, Kovacs K. A new acid hydrolysis methods for determining tryplophan in
peptides and proteins. Anal. Biochem.. 1974;60:45–51.Pienjacek D, Grabarek Z, Rakowska M. A Quantitative determination of the content of available
methionine and cyslieine in food proteins. Nutr. Metab.. 1975;18:16–22.Pineda O, Torun B, Viteri F, Aroyave G. Protein quality in relation to estimates of essential amino
acid requirements. In: Bodwell CE, Adkins JS, Hopkins DT, eds. Protein Anality in Humans:Assesment and In vitro Estimation. Westport, CT, United Nations: AVI, Publishing Co.; 1981.
Prolla IRD, Rafii M, Courtney-Martin G, Elango R, da Silva LP, Ball RO, Pencharz PB. Lysine fromcooked white rice consumed by healthy young men is highly metabolically available whenassessed using the indicator amino acid oxidation technique. J. Nutr.. 2013;143:302–306.
Ribarova, F., Shishkov, S., Baklova, I., 1987. Amino Acid Composition of Bulgarian Food Products.Zemizdat, Sofia (in Bulgarian).

Ribarova, F., Vazelov, E., Shishkov, S., 2003. Nutrition and Chronic Renal Failure, IN.VENTO P,Sofia (in Bulgarian).
Rutherfurd SM. Amino acid analysis of plant products. In: D’Mello JPF, ed. Amino Acids in HigherPlants. Wallingford, UK: CAB International; 2015:481–496.
Rutherfurd SM, Dunn BM. Quantitative amino acid analysis. Curr. Protoc. Protein Sci.. 2011;63:3.2.1–3.2.6.
Rutherfurd SM, Moughan PJ. Available versus digestible dietary amino acids. Br. J. Nutr..2012;108:S298–S305.
Rutherfurd-Markwick KJ. Food proteins as a source of bioactive peptides with diverse functions. Br.J. Nutr.. 2012;108:S149–S157.
Sarwar GA. Available amino acid score for evaluating protein quality of foods. J. Assoc. Anal.Chem.. 1984;67(3):623–626.
Sarwar GA, Christensen AJ, Hackler LR, Pellet PL. Inter and intralaboratory ariation in amino acidanalysis of food proteins. J. Food. Sci.. 1983;48(2):526.
Simpson R, Ncubcrger M, Lin T. Complete amino acid analysis of proteins from a singlehydrolyzate. J. Biol. Chem.. 1976;251(7):1936–1940.
Spackman D, Stcin W, Moore S. Automatic recording apparatus for use in the chromatography ofamino acids. Anal. Chem.. 1958;30:1190–1205.
Thiele B, Stein N, Oldiges M, Hofmann D. Direct analysis of underivatized amino acids in plantextracts by LC-MS-MS. Methods Mol. Biol.. 2012;828:317–328.
Tome D. Criteria and markers for protein quality assessment: a review. Br. J. Nutr.. 2012;108:S222–S229.
Torun B, Pineda O, Viteri F, Arroyave G. Use of aminoacid composition data to product proteinnutritive value of children with specific reference to new estimates of essential amino acidrequirements. In: Bodwell CE, Adkins JS, Hopkins DT, eds. Protein Anality in Humans:Assesment and In Vitro Estimation. Westport, CT, United States: AVI Publishing Co.; 1981.
Turnell DC, Cooper JDH. Rapid assay for amino acids in serum or urine by precolumn derivatizationand reversed phase liquid chromatography. Clin. Chem.. 1982;28(3):527–531.
Vazelov E, Ribarova F. Dinamic changes in plasma glycine and serine in patients on hemodialysistreatment. Arch. Balkan Med. Union. 2013;48(1):66–69.
Vazelov E, Ribarova F, Shishkov S. Plasma levels of tryptophan and large neutral amino acids(LNAA) in patients on chroniohemodialysis. C. R. Acad. Bulgare Sci.. 1999;LII(1–2):133–136.
Vries J, Koski C, Larson P. Comparison between a spectrophotometric and HPLC method fordetermining tryptophan in food products. J. Agric. Food Chem.. 1980;28:886–898.
Wang LY, Ma L, Su JR. Initial investigation of serum homocysteine as cancer biomarker. Int. J.Surg.. 2012;39:752–755.
Wang XN, Ye P, Cao RH, Yang X, Xiao WK, Zhang Y, Bai YY, Wu HM. Plasma homocysteine is apredictive factor for arterial stiffness: a community-based 4: 8-year prospective study. J. Clin.Hypertens.. 2015;17(8):594–600.
Webb GP. Nutrition: A Health Promotion Approach. third ed. London, United Kingdom: HodderArnold; 2008: pp. 247–263.
Williams AP. General problems associated with the analysis of aminoacids by automated Ion-exchange chromatography. J. Chromatogr.. 1986;373:175–190.

Zhang SH, Liang ZJ, Huang FW. The value of serum homocysteine in primary hepatocarcinoma.Mod. Oncol.. 2012;20:2580–2581.
Zhang D, Wen X, Wu W, Guo Y, Cui W. Elevated homocysteine level and folate deficiencyassociated with increased overall risk of carcinogenesis: Meta-analysis of 83 case-control studiesinvolving 35,758 individuals. PLoS One. 2015;10(5):e0123423.
Further ReadingAlarcyn-Flores MI, Romero-Gonzalez R, Frenich AG, Vidal JLM, Reyes RC. Rapid determination of
underivatized amino acids in fertilizers by ultra high performance liquid chromatography coupledto tandem mass spectrometry. Anal. Methods. 2010;2:1745–1751.
FAO, 2011. Dietary protein quality evaluation in human nutrition. Report of an FAO ExpertConsultation, 31 March–2 April, Auckland, New Zealand.
FAO, 2013. Food and Nutrition Paper 92. Food and Agriculture Organization of the United Nations,Rome.
Inglis AS. Single hydrolysis method for all amino acids, including cysteine and tryptophan. MethodsEnzymol.. 1983;91:26–36.
Makedonski L, Peycheva K, Stancheva M. Laboratory Manual for General and Organic ChemistryStudents of Medicine. Varna, Bulgaria: STENO; 2011.
Yan LD, Li Ping Z. Analysis of clinical significance for the detection of serum homocysteine fordigestive system cancer patients. Mod. Prevent. Med.. 2012;39:1754–1755.
Yang, Y., Chang, L., Lu, Y., Yang, L., 2010. Analysis of amino acids in foodstuff by nuclear magneticresonance. In: Yu, W., Zhang, M., Wang, L., Song, Y. (eds), Proceedings of the 3rd InternationalConference on Biomedical Engineering and Informatics (BMEI). Institute of Electrical andElectronics Engineers, New York, NY, pp. 750–754.

C H A P T E R 11
Strategy for the Prediction,Control, and Optimization of theFunctional Properties of FoodProteins: Using Statistical andChemometric ToolsSonia E. Barberis*,**
Héctor L. Sturniolo*
Laura Folguera†
Jorge F. Magallanes† * Laboratorio de Bromatología, Facultad de Química, Bioquímica y Farmacia, Universidad Nacional de San Luis,Chacabuco y Pedernera, San Luis, Argentina ** Consejo Nacional de Investigaciones Científicas y Técnicas (CCT—San Luis—CONICET), Instituto de FísicaAplicada (INFAP), San Luis, Argentina † Comisión Nacional de Energía Atómica, Centro Atómico Constituyentes, San Martín, Provincia de Buenos Aires,Argentina
AbstractProteins have functional properties that govern their behavior in foods during processing,storage, and consumption. Proteins can have high nutritional quality and not have functionalproperties suitable for incorporation into determined food systems. Furthermore, a desirablefunctional attribute for an additive may be undesirable for everyone else. This chapter describesthe design of a new strategy to predict, control, and optimize the functional parameters of foodproteins hydrolyzed or not, using chemometrics tools. The starting material consists of proteinswhose functional properties are desired to modify. Functional properties (e.g., emulsifying and

foaming properties) can be simultaneously evaluated by an experimental statistical design,response surface graphics, and multiple linear regressions. This strategy expands theapplications of food proteins and allows the following facilities: assess interactions betweenvariables of multivariate systems, evaluate the dependence between functional parameters, andoptimize the additive production with tailor-made functional properties for different foodsystems.
Keywords
food proteinsprotein hydrolysisfunctional propertieschemometrical analysisDoehlert statistical designresponse surface graphics
1. IntroductionFood proteins play critical roles in human nutrition and have physical–chemistry properties that govern their behavior in foods during processing,storage, and consumption, processes that are collectively termed functionalproperties. Limited or controlled enzymatic hydrolysis of food proteinscould provide ingredients with desired or restored functionalities(Tavano, 2013).
Ingredients that give high viscosity and water absorption are preferred foruse in minced meat products, some bakery products and gravies; whilesoups, cheesecakes, and infant food formulations require less viscousproduct mix and weaker water retention (Fineli, 2011). Proteins ofhypoallergenic nutritional formulations are extensively hydrolyzed, 90% oftheir peptides have molecular weight lower than 500 Da. Proteinhydrolysates intended for use as nutritional supplements undergo slight(about 90% peptides higher than 5000 Da) or moderate (about 46% peptideshigher than 5000 Da) hydrolysis degree (Chr Hansen, 2012; Lamsal et al., 2007).

Protein enzymatic hydrolysis decreases the chain molecular weight andincreases the product hydrophilicity (Drago and González, 2001). Lowmolecular mass protein compounds (<500 Da) are responsible for the basistaste and free amino acids are precursors of volatile flavor compounds(Alonso et al., 2013).
Extensive literature is available about the enzymatic modification of foodproteins by proteolytic enzymes and its effects on hydrolysates functionalproperties (Del Mar Yust et al., 2013; Karaman et al., 2015; Kotlar et al., 2013; Li et al., 2013; Mune Mune, 2015; Wani et al., 2015; Yang andFoegeding, 2010). Nevertheless, each variable of the protein’s hydrolysisprocess has been individually studied in all cases.
Data analysis with multivariate statistical techniques has beensuccessfully used on sensory parameters after proteolysis (Prippet al., 2000). However, to the best of our knowledge, no successful attempthas been made to predict, control, and optimize the most adequatefunctional characteristics of foods proteins (hydrolyzed or not), usingstatistical and chemometrics tools.
In this study, a Doehlert statistical design (DOE) and response surfacegraphics (RSG) were applied to describe the effects of different factors (pH,temperature, time of hydrolysis, amount of added buffer andenzyme:substrate ratio [E:S]) on the following functional parameters(responses) of food proteins, which were hydrolyzed by a commercialproteolytic enzyme: free amine nitrogen (NA), total soluble nitrogen (NT),solubility (PSI), water-holding capacity (WHC), held water (HW),emulsifying activity index (EAI), emulsifying stability index (ESI),viscosity (η), surface hydrophobicity (So), foaming capacity (FC), and foamstability (FS).
The novelty of this strategy also lies in the evaluation of all the processvariables (factors and responses) at the same time, using multiple linearregression (MLR) in order to get relationships that allow for the prediction,control, and optimization of each functional parameter based on thesignificant factors and on the interactive effects among them.
Finally, the set of functional parameters was optimized according to thedesired application, using desirability functions. Thus, the production ofseveral additives with tailor-made functional properties has been optimizedin order to be added to different food systems, such as: sauces and soups,

bakery products, cheesecake, and a product to accelerate the ripening ofhard cheeses.
2. Materials and Methods2.1. Sample PreparationSoluble proteins of semi-hard goat cheese were taken as model in this study.Aqueous dispersions of goat cheese previously processed were preparedusing a laboratory homogenizer during 2 min, 10 g of processed samplewith different amounts of phosphate buffer (pH 5–9) were maintained understirring at 200 rpm using a rotating orbital shaker (GFL, Germany).Temperatures and time of hydrolysis varied from 35 to 70°C during 30–270 min, respectively. Commercial papain from Carica papaya (Fluka,3.11 U/mg, EC 3.4.22.2) was the proteolytic enzyme used in all trials.
2.2. Statistical Design of ExperimentsA multilevel Doehlert’s design was performed using the following factorranges, which were based on previous experimental trials: pH: 5–9 (7levels); temperature: 35–70°C (7 levels); time of hydrolysis: 30–270 min (7levels); amount of added buffer: 10–30 g of buffer/g of protein, (3 levels);enzyme: substrate ratio (E:S): 5.5.10−3 to 0.22 mg of papain/g of cheesecasein (5 levels).
Table 11.1 shows the experimental levels used for obtaining statisticalresults of functional parameters of hydrolyzed proteins. According toDoehlert’s design shown in Table 11.1, 31 runs (by duplicate) were carriedout, and the following responses were measured: NA, NT, PSI, WHC, HW,EAI, ESI, η, So, FC, and FS. Although Doehlert’s design is not blockable, adaily experimental order was followed to minimize biased results caused byblocking effects.

Table 11.1
Doehlert statistical design: experimental levels of hydrolysisprocess of goat cheese proteins.
IDNo.
(E:S) Ratio (mg ofPapain/g of CheeseCasein) pH
Time ofHydrolysis(min)
Temperature(°C)
AmountofAddedBuffer(g/gProtein)
5 levels 7 levels 7 levels 7 levels 3 levels
1 0.113 7 150 52.5 20
2 0.220 7 150 52.5 20
3 0.166 8.73 150 52.5 20
4 0.166 7.58 247.9 52.5 20
5 0.166 7.58 174.5 66.3 20
6 0.166 7.58 174.5 55.3 27.7
7 5.5 × 10⁻³ 7 150 52.5 20
8 0.059 5.27 150 52.5 20
9 0.059 6.42 52.1 52.5 20
10 0.059 6.42 125.5 38.7 20
11 0.059 6.42 125.5 49.7 12.2
12 0.166 5.27 150 52.5 20
13 0.166 6.42 52.1 52.5 20
14 0.166 6.42 125.5 38.7 20
15 0.166 6.42 125.5 49.7 12.2
16 0.059 8.73 150 52.5 20
17 0.113 8.15 52.1 52.5 20
18 0.113 8.15 125.5 38.7 20
19 0.113 8.15 125.5 49.7 12.2
20 0.059 7.58 247.9 52.5 20
21 0.113 5.84 247.9 52.5 20

IDNo.
(E:S) Ratio (mg ofPapain/g of CheeseCasein) pH
Time ofHydrolysis(min)
Temperature(°C)
AmountofAddedBuffer(g/gProtein)
22 0.113 7 223.4 38.7 20
23 0.113 7 223.4 49.7 12.2
24 0.059 7.58 174.5 66.3 20
25 0.113 5.84 174.5 66.3 20
26 0.113 7 76.6 66.3 20
27 0.113 7 150 66.3 12.2
28 0.059 7.58 174.5 55.3 27.7
29 0.113 5.84 174.5 55.3 27.7
30 0.113 7 76.6 55.3 27.7
31 0.113 7 150 41.4 27.7
Original protein isolates (blanks) without enzyme were carried out foreach experimental condition studied. All analytical grade chemicals used inthis work were supplied by Sigma-Aldrich Co. (St. Louis, USA).
2.3. Free Amine Nitrogen and Total SolubleNitrogenAfter finishing each experimental run, samples and blanks were heated toboiling point so as to stop enzymatic activity. They were cooled at −4°Cand centrifuged at 3000 g, during 15 min. NT and NA were determined bythe Kjeldhal and phenol-hypocloride methods in the free fat supernatantsafter filtering them through filter paper Whatman No. 1 (AOAC, 2006;Fawcet and Scott, 1960).
2.4. SDS-Polyacrylamide Gel Electrophoresis(SDS-PAGE)

(11.1)
Supernatants of samples and blanks were separated by polyacrilamide gelelectrophoresis under denaturant conditions with 0.2% SDS in a MiniProtean System II (BioRad) and dyed with blue bromophenol(Laemmli, 1977). Precision protein standards (BioRad) with knownmolecular masses from 10 to 250 kDa were also applied in gel.
2.5. SolubilityPSI describes the role of protein ingredients in solution and how they formcolloidal structures (Foegeding and Davis, 2011). PSI is the percentage ofsupernatant soluble protein with respect to the total protein contents (Eq.11.1) by Kjeldahl method (AOCS, 1997).
2.6. Water-Holding CapacityWHC has been estimated as the amount of water that original andhydrolyzed proteins can retain after the action of a centrifugal force understandardized conditions. The procedure developed by Piva et al. (1981) wasapplied according to Fig. 11.1.

(11.2)
FIGURE 11.1 Diagram for the Water-holding CapacityDetermination (WHC, g of H2O/g of Dry Pellet).
WHC was expressed as (g H2O/g of dry pellet) by Eq. (11.2):
Where: W2, weight of water in the pellet; R, weight of dry pellet.
2.7. Held WaterHW was determined by means of a method developed by Piva et al. (1981),according to Fig. 11.1. HW was quantified as the ratio of the amount ofwater that original and hydrolyzed proteins can retain after the action of a

(11.3)
(11.4)
(11.5)
centrifugal force under standardized conditions versus the total amount ofwater of the sample; and it was expressed as (%) (Eq. 11.3):
2.8. Emulsifying Activity Index andEmulsifying Stability IndexThe interface area that can be covered by a protein is related to its capacityto form and stabilize emulsions. EAI and ESI were measured by theturbidimetric method of Pearce and Kinsella (1978), modified by Tang et al.(2006). EAI (m2/g) and ESI (min) were calculated by Eqs. (11.4) and (11.5).
Where: A0, initial absorbance; A20, absorbance at 20 min; c, initial proteinconcentration (mg/mL); ϕ, optical way length (0.01 m); θ, fraction of oil(used to form the emulsion); DF, dilution factor.
2.9. Viscosity (η)Apparent η of hydrolyzed samples and their blanks were determined bymeans of a programmable rheometer (Brand Brookfield, Model DV-III),according to the method described by Hermansson (1978, 1979). Apparent

(11.6)
η was determined because in this type of sample there are a number ofoccurrences protein–protein interactions, which can produce flocculation,coagulation, and gelation (Surówka et al., 2004). Nine routinemeasurements were performed from 100 to 140 rpm, at 24°C, and theaverage apparent η was obtained.
2.10. FTIR SpectroscopyInfrared spectra were measured at 25°C with a Nicolet Protegé 460 Fouriertransform infrared spectrophotometer, provided with a CsI beam splitterbetween 4000 and 225 cm−1. The spectral resolution was 4 cm−1 between4000 and 225 cm−1. Supernatants of the protein hydrolysates and theirblanks were lyophilized, and approximately 1 mg of protein was combinedwith 300 mg of potassium bromide and annealed into a disc using ahydraulic press. This process has previously shown not to alter the IRspectra of proteins (Van der Weert et al., 2001). The instrument was purgedwith dry N2 to decrease atmospheric H2O vapor and the subtraction ofresidual vapor was also performed when necessary. The correction of thebasis line and the second-derivative infrared spectrum were carried outusing OMNIC spectrophotometer programme. The relative amounts of thedifferent components from the band amide I was determined by means ofthe second-derivative analysis. Similarity analysis of FTIR spectra werecarried out according to the method described by Prestrelski et al. (1993),and spectral similarity coefficients (similarity, r) were calculated using Eq.(11.6):
Where, xi and yi are absorbance values of reference and sample spectra,respectively; at frequency i (cm−1) in the band amide I. This correlationvalue is equal to 1 when there is no conformational change in the protein,

while if large conformational changes occur, spectral differences are alsolarge, and r coefficient becomes small.
2.11. HPLC-MS AnalysisProtein hydrolysates and their blanks were analyzed and identified byHPLC-MS. Analyses were performed on VG-Quattro (MicromassInstruments S.A.), with a C-18 Nucleosil (120–5) (5 μm), 250 mm × 40 mmcolumn (Scharlan). Electrospray technique was used with positive ionreading (100–1000 uma), nebulizer gas: N2 (flow: 10 L/h), drying gas: N2
(flow: 450 L/h), source temperature: 80°C, capillary voltage: 3.5 kV,voltage focus: 55 V, flow: 15 mL/min, elution: solvent A, H2O containing1% formic acid and solvent B, acetonitrile; A: B = 50:50. Injection volume:10–20 μL.
2.12. Surface HydrophobicitySurface Hydrophobicity (So) of original and hydrolyzed samples wasperformed with a probe of 1-anilino-8-naphthalene sulfonate (ANS), usingKato and Nakai’s method (Kato and Nakai, 1980). Supernatants of thehydrolysated protein were serially diluted with 0.01 M phosphate buffer(pH 7) for obtaining protein concentrations between 0.01 and 1 mg/mL.Protein concentrations in the supernatant were determined by Bradford’smethod (Bradford, 1976). Then, 40 μl ANS 8 mM in 0.1 M phosphatebuffer (pH:7) were added to 2 mL of the sample. Fluorescence intensity (FI)was measured with a fluorescence spectrophotometer (Perkin-Elmer, 2000)at 365 nm (excitation) and 484 nm (emission). FI versus proteinconcentration was plotted, and the initial slope of linear regression analysiswas used as an index of protein So.
2.13. Foaming Capacity and Foam Stability(FS)Foaming capacity (FC) was measured by using a graduated glass columnwith a porous glass disc (type G 4) at the bottom. Gas N2 (fr, mL/min) was

(11.7)
(11.8)
insufflate at a flow of 180 mL/min through 30 mL of supernatant ofhydrolyzed protein (containing 0.5–2 mg of protein/mL), until a finalvolume (Vf, mL) of 275 mL of foam was obtained. The time taken to obtainthis volume (tf, min) was registered. FC was calculated as (Eq. 11.7):
Where: Vf, final volume (mL); tf, time for obtaining final volume (min);fr, N2 gas flow (mL/min).
Simultaneously, the remaining liquid volume in the glass tube wasregistered at different times, until the end of the bubbling period. Thevolume of liquid that was taken up to the foam stage at the end of thebubbling period was determined as Vmax (mL). The time for drainage of thehalf of the entrapped liquid in the foam at the end of the bubbling period(t1/2, min) was also measured. The stability of the foam was measured as thespecific constant of drainage rate (FS, mL/m) (Sorgentini andWagner, 2002) (Eq. 11.8).
Where: Vmax, volume of liquid that was taken up in the foam stage at theend of the bubbling period (mL); t1/2, the time for drainage of half of theentrapped liquid in the foam at the end of the bubbling period (min).
All determinations were carried out by duplicate and they were comparedwith the same amount of sample without hydrolysis (blank).
2.14. Chemometrical Analysis

(11.9)
Statistical analysis was carried out by multivariate techniques, such as MLR(Chatterjee and Simonoff, 2012). Several empirical-statistical linear modelswere obtained to each of the responses according to Eq. (11.9), and theywere checked by Bayes-Gibbs probabilistic analysis (Bernardo, 2005).General system errors were estimated by repeating several measurements inthe center of the design, that is to say, the mean of the ranges of allvariables.
Where: X1, ratio (E:S); X2, pH; X3, time of hydrolysis; X4,temperature; X5, amount of added buffer.
2.15. DesirabilityOnce the MLR models were obtained, the significant factor’s ranges wereworked out by graphic representation of the responses as function of eachcouple of factors. Then, the definition of the factor’s ranges according tosome expected specific products were established. The definitions ofdesirability were made according with Derringer and Suich (1980). Forthose products that are compounded from specific suitable characteristics,this methodology allows the simultaneous optimization of several responsevariables according with the factors’ ranges.
3. Results and Discussion3.1. Effect of Protein Hydrolysis of GoatCheese on Free Amine Nitrogen ContentAverage maximal values of 1.365 g/mL at ID No. 27 and minimal of0.41 g/mL at ID No. 10 were obtained. This means that the hydrolysisdegree of soluble proteins into the supernatant was increased to 188%,

(11.10)
regard to the original protein isolates, as a result of optimization of thehydrolysis process.
Statistical analysis of NA by means of the proposed linear model in Eq.(11.9) showed significant first-order results for temperature and theinteractive effect between temperature and amount of added buffer, and ofsecond order for pH, according to Eq. (11.10).
Where: Y, NA β0:0.5171; X2, pH β4:0.3056; X4, temperature β2,2:0.6661;X5, amount of added buffer β4,5 −1.2768.
Fig. 11.2 shows the response surface of NA and the interactive effectbetween the temperature and amount of added buffer according to Eq.(11.10), using Statistica software (Statsoft Inc.). Circles in Fig. 11.2 showthe experimental points on the response surface. NA variability at the sameposition of coordinates X4, X5 is due to the different remaining combinationsof variables.

FIGURE 11.2 Response Surface Graphic of Free AmineNitrogen content (NA) and the Interactive Effect Between theTemperature and Amount of Added Buffer for Hydrolyzed GoatCheese Proteins.
High pH and temperature maximized the hydrolysis degree of goatcheese soluble proteins (NA) into the supernatant, at lowest amount ofadded buffer (10 g of buffer / g of protein). This behavior was due to thefact that papain is an active and stable enzyme up 80°C and has optimal pH9 (Kim et al., 2012). However, the increase of NA with the temperature wascompensated by the increase in the amount of added buffer due to thenegative interactive effect of both factors. Furthermore, if a large amount ofbuffer were added, a decrease of NA with the increase of temperaturewould be observed (Fig. 11.2).

(11.12)
(11.11)
The percentage relative error of predicted values of NA versus theexperimental values was calculated according to Eq. (11.11). Experimentalvalues of NA above 0.7 g/mL showed a maximal percentage relative errorof approximately ± 30%.
3.2. Effect of Protein Hydrolysis ofGoat Cheese on Total Soluble NitrogenContentAverage maximal values of 7.025 g/L at ID No. 15 and minimal of 1.11 g/Lat ID No. 7 were obtained. The release of soluble proteins from goat cheeseto the supernatant was increased to 278%, regard to the original proteinisolates, as a result of optimization of the hydrolysis process. Statisticalanalysis of NT showed significant first-order terms for ratio (E:S), pH,amount of added buffer, and the interactive effects of amount of addedbuffer with the ratio (E:S), and temperature, according to Eq. (11.12).
Where: Y, NT β0:3.9684; X1, ratio (E:S) β1:0.6912; X2, pHβ2:0.6162; X4, temperature β5:−0.9961; X5, amount of added bufferβ1,5:−2.3322; β4,5:2.5061.
Figs. 11.3A and B shows the response surfaces of NT and the interactiveeffects between the amount of added buffer and the ratio (E:S) andtemperature according to Eq. (11.12), using the Statistica software (StatsoftInc.). Average maximal values of NT were obtained at the highest pH (9)and lowest amount of added buffer (10 g of buffer/g of protein). This effectwas more evident at the highest ratio (E:S) (0.22 mg of papain/g of cheesecasein) and lowest temperature (35°C), due to their interactive effects.


FIGURE 11.3 Response Surface Graphics of Total SolubleNitrogen Content (NT). Interactive effects between (A) temperature and amount of addedbuffer, (B) ratio (E:S) and amount of added buffer for hydrolyzed goatcheese proteins.
Sign (–) of β5 coefficients in Eq. (11.12) indicates that the increase in theamount of added buffer decreased the release of NT from goat cheese to thesupernatant, probably due to a simple dilution effect.
The first-order interactive effect between the amount of added buffer andtemperature is negative for NA and positive for NT. According to Figs. 11.2 and 11.3A, the highest NA values were obtained at low amount ofadded buffer (10 g of buffer/g of protein) and highest temperature (70°C),but under these conditions NT did not reach maximal values. This meansthat there was not maximal release of peptides and soluble proteins from thegoat cheese to the supernatant under these conditions; but the releasedproteins underwent greater cleavage into small peptides and amino acids(which increase the flavor of protein hydrolysates).
These phenomena were verified by SDS-PAGE of supernatants fromsamples ID No. 27 and ID No. 15, in which maxima values NA and NTwere respectively obtained. Blanks of ID sample No. 27 showed severalbands of 16, 18, 30, and 32 kDa that correspond to β-casein, β-lactoalbumin, α S1- and α S2-casein, respectively (Vairo Cavalliet al., 2008), and were hydrolyzed in the samples. Blanks of ID sample No.15 showed a strong band at 32 kDa corresponding to α S2-casein, which wasnot hydrolyzed in the sample (data not shown).
Finally, ratios (E:S) influenced the release of peptides and proteins fromgoat cheese to the supernatant but did not affect their later hydrolysis intosmaller fragments, within the studied range (Eqs. 11.10 and 11.12).
Experimental values of NT above 3 g/L showed a maximal percentagerelative error of ± 20% (Eq 11.11).
3.3. Effect of Protein Hydrolysis of GoatCheese on Protein Solubility Index

(11.13)
(11.14)
Average maximal values of 91% at ID No. 28 and minimal of 14% at IDNo. 7 were obtained. Statistical analysis of PSI is shown in Eq. (11.13):
Where: Y, PSI β0:50.35; X5, amount of added buffer β5:11.67.As a result of optimization, PSI of the hydrolyzed goat cheese proteins
was increased to 231% by adding buffer, compared to the original proteinisolates.
Since peptides and amino acids are always required in the formulation offlavoring additives, because of they increase the flavor and are morereactive than proteins with other food components (Pires et al., 2013), thelowest value of amount of added buffer should be selected within thestudied ranges. However, the amount of added buffer should be regulatedaccording to the desired Solubility in the final product, because of it couldbe affected as it was previously mentioned.
Experimental values of PSI above 35% showed a maximal percentagerelative error of ± 30% (Eq. 11.11).
3.4. Effect of Protein Hydrolysis of GoatCheese on Water-Holding CapacityAverage maximal values of 3.08 g of water/g of dry pellet at ID No. 3 andminimal of 0.55 g of water/g of dry pellet at ID No. 9 were obtained.Statistical analysis of WHC is shown in Eq. (11.14):
Where: Y, WHC β0:1.4325; X1, ratio (E:S) β1:0.5221; X2, pH β2:0.4556;X5, amount of added buffer β5:0.5905.
As result of optimization of the hydrolysis process an increase of 450%in the WHC (regard to the original protein isolates) was obtained at high pH

(9), at a ratio (E:S) of 0.22 mg of papain/g of cheese casein, and an amountof added buffer of 30 g of buffer/g of protein.
Fig. 11.4A–C shows the dependency of WHC with the ratio (E:S), pH,and amount of added buffer. Besides, WHC of hydrolyzed goat cheeseproteins showed a good correlation with PSI (data not shown).


(11.15)
FIGURE 11.4 Dependency of Water-Holding Capacity (WHC) onDifferent Factors. (A) pH and ratio (E:S), (B) ratio (E:S) and amount of added buffer,(C) amount of added buffer and pH for hydrolyzed goat cheeseproteins.
Experimental values of WHC above of 1.2 g of water/g of dry pelletshowed a maximal percentage relative error of approximately ± 30% (Eq.11.11).
3.5. Effect of Protein Hydrolysis of GoatCheese on Held WaterAverage maximal values of 27% at ID No. 6, 28, 29, and minimal of 9.34%at ID No. 20 were obtained. This means that held water (HW) wasincreased to 190%, compared to the original protein isolates, as a result ofoptimization of the hydrolysis process.
Statistical analysis of HW showed significant first-order terms for theamount of added buffer and the interactive effect between temperature andamount of added buffer, and of second order for the amount of added buffer,according to Eq. (11.15):
Where: Y, HW β0:0.144; X4, temperature β5:0.052; X5, amount of addedbuffer β4,5:0.172, β5,5:0.087.
Fig. 11.5 shows the response surface of HW and the interactive effectbetween the amount of added buffer and temperature according to Eq.(11.15), using the Statistica software (Statsoft Inc.). Average maximalvalues of HW were reached at the highest temperature (70°C) and amountof added buffer (30 g of buffer/g of protein).
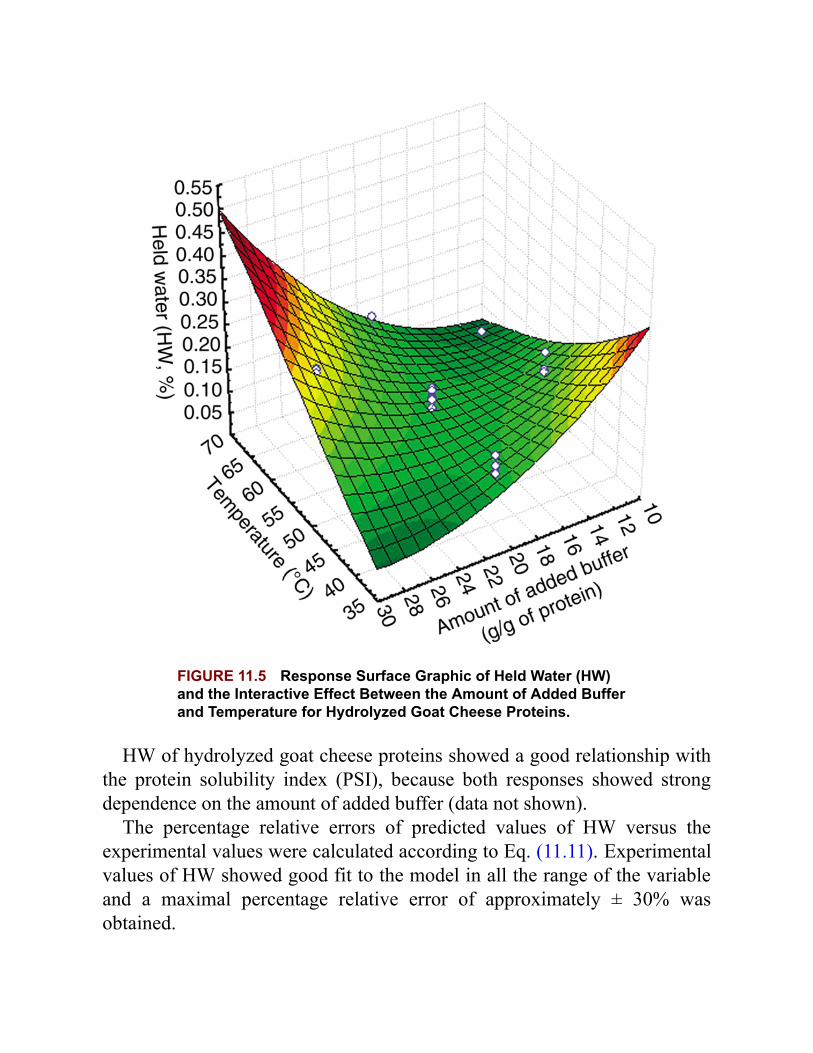
FIGURE 11.5 Response Surface Graphic of Held Water (HW)and the Interactive Effect Between the Amount of Added Bufferand Temperature for Hydrolyzed Goat Cheese Proteins.
HW of hydrolyzed goat cheese proteins showed a good relationship withthe protein solubility index (PSI), because both responses showed strongdependence on the amount of added buffer (data not shown).
The percentage relative errors of predicted values of HW versus theexperimental values were calculated according to Eq. (11.11). Experimentalvalues of HW showed good fit to the model in all the range of the variableand a maximal percentage relative error of approximately ± 30% wasobtained.

(11.16)
3.6. Effect of Protein Hydrolysis of GoatCheese on Emulsifying Activity IndexAverage maximal values of 223.71 m2/g at ID No. 4 and minimal of 66.43m2/g at ID No. 26 were obtained. EAI increased 235% compared to originalprotein isolates, as a result of optimization of the hydrolysis process.Statistical analysis of EAI is shown in Eq. (11.16):
Where: Y, EAI β0:134.01; X1, ratio (E:S) β1,3:106.64; X3, time ofhydrolysis.
Fig. 11.6A shows the response surface of EAI and the interactive effectbetween the ratio (E:S) and time of hydrolysis according to Eq. (11.16),using Statistica software (Statsoft Inc.).


(11.17)
FIGURE 11.6 Response Surface Graphics. (A) Emulsifying activity index (EAI) and the interactive effect betweenthe time of hydrolysis and ratio (E:S), (B) emulsifying stability index(ESI) and the interactive effect between the ratio (E:S) andtemperature for hydrolyzed goat cheese proteins.
EAI significantly increases as time of hydrolysis and ratio (E:S) areincreased. It is likely that the increase in hydrolysis time promotes thepeptide’s diffusion and peptide–lipid interaction, thus helping to theanchoring of the peptide molecules at the oil–water interface and theincreasing EAI. At low-soluble protein concentrations, the absorption ofprotein at oil–water interface is based on a diffusion-controlled kinetic anddepend on the time until the steady state is reached (Seki et al., 2013).
The hydrolysis degree of proteins has modified the emulsifyingproperties of wheat gluten, rice, and soybean (Agyare et al., 2009; Liet al., 2013). However, this behavior has not been observed in this work.
Experimental values of EAI from 90 m2/g showed a maximal percentagerelative error of ± 30% (Eq. 11.11).
3.7. Effect of Protein Hydrolysis of GoatCheese on Emulsifying Stability IndexAverage maximal values of 85.49 min at ID No. 14 and minimal of27.34 min at ID No. 20 were obtained. ESI increased 210% regard tooriginal protein isolates, by optimization of hydrolysis process. Statisticalanalysis of ESI is shown in Eq. (11.17):
Where: Y, ESI β0:52.5; X2, pH β5:−13.5; X1, ratio (E:S) β 1,4:−41.5; X4,temperature β 2,2:−13.3; X5, amount of added buffer.
Fig. 11.6B shows the response surface of ESI and the interactive effectbetween ratio (E:S) and temperature according to Eq. (11.17), using thestatistica software (Statsoft Inc.). Maximal values of ESI were reached

(11.18)
under two conditions: at high temperatures (60–70°C) and with low enzymeconcentration; and also at low temperatures (35–40°C), and with highenzyme concentration.
According to Eq. (11.17), ESI decreases as pH is increased due to highhydrolysis degree of soluble proteins (NA) under those conditions. Then,the excessive shortening of the soluble goat cheese proteins has caused adecrease of ESI, which was also reported for gluten hydrolysates (Lam andNickerson, 2013).
On the other hand, a decrease on NT and an increase on PSI wereobserved at a high amount of added buffer. Probably, these conditions havedecreased ESI due to the increase of electrostatic repulsion among peptidelayers absorbed at oil droplet surface, limiting stabilization by stericrepulsion of high molecular weight polypeptides. According to Damodaran(2005), the steric repulsion between polypeptides could prevent closecontact between oil droplets, and the resulting flocculation and coalescence.
Experimental values of ESI from 30 min showed a maximal percentagerelative error of approximately ± 30% (Eq. 11.11).
3.8. Effect of Protein Hydrolysis of GoatCheese on Viscosity (η)Average maximal values of 1.74 cP at ID No. 27 and minimal of 1.26 cP atID No. 10 were obtained. This means that η was increased to 40%,compared to the original protein isolates, as a result of optimization of thehydrolysis process.
Statistical analysis of η by means of the proposed linear model in Eq.(11.9) showed significant first-order results for all the factors studied andfor the interactive effect between amount of added buffer and temperature,according to Eq. (11.18).
Where:Y, η β0:1.5044; X1, ratio (E:S) β1:0.0812; X2, pHβ2:0.0710; X3, time of hydrolysis β3:0.0425; X4, temperature β4:0.1346; X5,

amount of added buffer β5:−0.0762, β4,5:−0.1133.Fig. 11.7 shows the response surface of η and the interactive effect
between the amount of added buffer and temperature according to Eq.(11.18), using Statistica software (Statsoft Inc.).
FIGURE 11.7 Response Surface Graphic of Viscosity (η) andthe Interactive Effect Between the Amount of Added Buffer andTemperature for Hydrolyzed Goat Cheese Proteins.
According to Eq. (11.18), η increases as pH, temperature, ratio (E:S), andtime of hydrolysis are increased, and the amount of added buffer isdecreased. Then, average maximal values of η of 1.74 cP were obtained at

the highest ratio (E:S) (0.22 mg of papain/g of cheese casein), pH (9), timeof hydrolysis (270 min), and temperature (70°C) and at the lowest amountof added buffer (10 g of buffer/g of protein).
However, the increase of η with temperature was compensated by theincrease in the amount of added buffer due to the negative interactive effectof both factors, when they were of similar magnitude (β4 and β4,5
coefficients are approximately equal but with opposite signs). Furthermore,if a large amount of buffer were added, a decrease of η with the increase oftemperature would be observed (Fig. 11.7).
According to other reports, although enzymatic treatments have beenlimited, they have always reduced η of hydrolyzed proteins (Lamsalet al., 2007). Contrary to those results, Eq. (11.18) predicts an increase of ηdue to an increase of hydrolysis degree, which was observed at high pH andtemperature and at a low amount of added buffer (see Fig. 11.2 and Eq.11.10).
In effect, a sharp increase of η of the hydrolyzed goat cheese proteinswith the rise of temperature was observed, at the lowest amount of addedbuffer (10 g of buffer/g of protein) (Fig. 11.7). We hypothesized that thisbehavior could be due to the fact that the peptides and amino acids releasedfrom goat cheese could aggregate, or that new peptides could besynthesized by the papain catalysis under those conditions.
According to the literature, papain is capable of catalyzing in aqueousmedia: the cleavage of peptide bonds (proteolysis) and, the synthesis of newpeptide bonds (amidolysis) (Barberis et al., 2008). The ability of theproteases to catalyze the synthesis of new peptide bonds has been shown bymany authors, and gave rise to an intense research and development on thepeptides synthesis in different media (Guzmán et al., 2007; Illanes et al., 2009).
Protein hydrolysates were analyzed by FTIR and HPLC-MS in order toconfirm our hypothesis and determine whether the protein aggregates wereformed, or whether new polymers were synthesized from the fragmentsobtained by hydrolysis.
Fig. 11.8 shows second derivative amide I FTIR spectra of hydrolyzedgoat cheese proteins (ID No. 10 and 27), after the subtraction of blankswithout papain.

FIGURE 11.8 Second Derivative Amide I FTIR Spectra ofHydrolyzed Goat Cheese Proteins. Samples ID No. 10 and ID No. 27) after the subtraction of blankswithout papain.
The frequency assignment for amide I components of hydrolyzed goatcheese proteins (Table 11.2) were performed according to the literature(Barth, 2000; Dong et al., 1990, 1995a,b).

Table 11.2
Relative areas of amide I components of FTIR spectra of goatcheese hydrolyzed proteins (samples ID No. 10 and ID 27) afterthat baseline was corrected.
Bands Frequency (± 2 cm−1)Relative Areas
ID 10 ID 27β—Sheet 1636 0.00485 0.00197
1689
1698
α—Helix 1660 0.00257 0.00058
Random 1647 0.0048 0.0019
1653
β—Turn 1669 0.00383 0.00263
1674
1683
Side chains 1622 0.00078 0.00291
1615
1608
Total area (1600–1700) 0.01683 0.00999
Most bands of the sample ID No. 27 showed a lower absorbance than IDNo. 10, except for the side chains and β-sheet bands at the highest wavenumbers (Fig. 11.8). Sample ID No. 10 has a maximal absorbance at1653 cm−1 and 1659 cm−1, which corresponds to random structures and α-helix, respectively. Random components were defined by X-raycrystallographic studies as components that are not α-helix or β-sheet and β-turn (Richardson, 1991). Sample ID No. 27 has maximal absorbance at1683 and 1698 cm−1, which corresponds to β-turn structures and β-sheet,respectively.
The reduction and even the disappearance of the β-sheet band at1689 cm−1, and the appearance of the β-sheet band at the highest wavenumbers (1698 cm−1) of the sample ID No. 27 are indicative of protein

aggregation (Dong et al., 1995b). This fact indicates that the increase of ηwith temperature (Fig. 11.7) could be due to hydrolyzed proteinsaggregation. Besides the widening and the slight shifting of bands at 1683and 1698 cm−1 of sample ID No. 27 are indicative of protein unwinding(Dong et al., 1996).
Relative areas of amide I components of hydrolyzed goat cheese proteins(samples ID No. 10 and 27) after that baseline was corrected are shown inTable 11.2. The β-sheet/α-helix area for sample ID No. 10 was 1.887, and itwas 3.396 for sample ID No. 27. A secondary structure with a higher β-sheet character indicates an increase of intermolecular hydrogen bridgebonds and protein aggregation, which justifies the increase of η for sampleID No. 27.
FTIR spectra similarity analysis between samples ID No. 10 and 27 werecarried out according to the method described by Prestrelski et al. (1993),and spectral similarity coefficients (similarity, r) were calculated using Eq.(11.6). An r coefficient of 0.825 for the aforementioned spectra wasobtained, thus confirming conformational changes in hydrolyzed goatcheese proteins under both conditions.
On the other hand, Fig. 11.9A and B shows HPLC chromatograms ofhydrolyzed goat cheese proteins (samples ID No. 10 and 27) and theirblanks without papain.

FIGURE 11.9 HPLC Chromatograms of Hydrolyzed GoatCheese Proteins. Sample ID No. 10 (A) and Sample ID No. 27 (B), and their blankswithout papain.

(11.19)
Several fractions that could correspond to polypeptides obtained bysynthesis catalyzed by papain—from peptides and amino acids previouslyreleased by hydrolysis—were analyzed by MS to elucidate its structure. Forinstance, fractions at tR:3 and 62.5 min for sample ID No. 27. At tR:3 min, aSer-Asp-Tyr-Phe-Cys peptide with the following M/Z was obtained: 69, 77,79, 91, 105, 107, 115, 119, 121, 129, 133, 135, 143, 149, 173, 178, 189,191, 259, 273, 279, 283, 313, 325, 329, 353, 355, and 367. At tR:62.5 min, aCys-Cys-Ser-Lys-Phe peptide with the following M/Z was obtained: 69, 70,79, 81, 84, 91, 105, 117, 121, 145, 147, 163, 241, 313, 327, 353, 368, 369,381, and 395. However, this hypothesis could not be verified due to thecomplexity of protein hydrolysates of goat cheese.
Then, the atypical behavior of η of the hydrolyzed goat cheese proteinswas attributed to the increase of intermolecular hydrogen bridge bonds ofsecondary structures with high β-sheet character, as well as to the solubleprotein aggregations under those conditions, which were demonstrated byFTIR spectra.
Experimental values of η showed a good fit to the model and a maximalpercentage relative error of approximately ± 6% was obtained (Eq. 11.11).
3.9. Effect of Protein Hydrolysis of GoatCheese on Surface HydrophobicityAverage maximal value of 15.65 FI/(mg of protein/mL) at ID No. 7 andminimal of 0.95 FI/(mg of protein/mL) at ID No. 29 were obtained. Thismeans that So was decreased to 94%, regard to the original protein isolates,as a result of optimization of the hydrolysis process.
Statistical analysis of So showed significant first-order results for ratio(E:S) and for the amount of added buffer, and for the interactive effect oftime of hydrolysis and temperature, according to Eq. (11.19).

Where: Y, So β0:4.53; X1, ratio (E:S) β1:−4.67; X3, time of hydrolysisβ5:−2.47; X4, temperature β3,4:−7.61; X5, amount of added buffer.
Fig. 11.10 shows the response surface of So and the interactive effectbetween time of hydrolysis and temperature according to Eq. (11.19), usingthe Statistica software (Statsoft Inc.). Under the conditions set for the study,the average minimal value of So was 0.95 FI/(mg of protein/mL). It isnoteworthy that the lowest values of So are the most desirable ones, sincethis parameter is an indicator of the presence of bitter peptides in thehydrolysates (Børsting et al., 2012).

FIGURE 11.10 Response Surface Graphic of SurfaceHydrophobicity (So) and the Interactive Effect Between Time ofHydrolysis and Temperature for Hydrolyzed Goat CheeseProteins.
The highest temperature (70°C), time of hydrolysis (270 min), ratio (E:S)(0.22 mg of papain/g of cheese casein) and amount of added buffer (30 g ofbuffer/g of protein) have allowed for an optimized parameter. However,there is also an area of minimal So at the lowest temperature (35°C) andtime of hydrolysis (30 min) due to the interactive effect of these factors(Fig. 11.10).
According to the literature, So correlates with hydrolysis degree,solubility, and emulsifying activity index of protein hydrolysates (Li-Chan

et al., 2006). Nevertheless, no relationship was observed among thoseresponses in this study.
Experimental values of So from 4 FI/(mg of protein/mL) showed amaximal percentage relative error of approximately ±40% at the borders ofthe experimental design (Eq. 11.11).
3.10. Effect of Protein Hydrolysis of GoatCheese on Foaming CapacityAverage maximal values of 0.65 at ID No. 8 and 13 and minimal of 0.03 (inseveral samples) were obtained. These values were remarkably lower thanothers reported in the literature for several hydrolyzed proteins (Agyare et al., 2009; Mune Mune, 2015; Wani et al., 2015). Statistical analysis ofFC did not show any significant relationship with the studied factors.
Several authors have observed that the solubility and the FC ofhydrolyzed whey and soybean proteins have been significantly enhanced bymeans of an increase of the time of hydrolysis and ratio (E:S), but thiseffect has not been observed in this work (Sorgentini and Wagner, 2002;Surówka et al., 2004). Besides, it is known that pH modifies protein netcharges, which usually affects not only the foam formation but also the filmviscoelastic properties (Drago and González, 2001). Nonetheless, no effectof pH on the FC of hydrolyzed goat cheese proteins has been observedunder the studied conditions.
These results suggest that some protein structures should be retained inorder to have good foam and that the rupture of the polypeptide chainsdecreases the FC. In spite of the low papain concentrations that were usedin this experimental design (DOE), it is likely that this protease (with broadspecificity) has destroyed the cheese protein structure excessively. It is alsoevident that the FC of hydrolyzed proteins depends on the specificity of theproteolytic enzymes used, the physico-chemical nature of the parentprotein, and the experimental conditions of the proteolysis.
3.11. Effect of Protein Hydrolysis of GoatCheese on Foam Stability

(11.20)
Average maximal values of 1.48 mL/min at ID No. 9 and minimal of0.1 mL/min (in several samples) were obtained.
Statistical analysis of FS showed only one significant term of first orderfor the time of hydrolysis, according to Eq. (11.20).
Where: Y, FS β0: 0.756; X3, time of hydrolysis β3:−0.500.Eq. (11.20) indicates that the increase in the time of hydrolysis resulted in
a decrease in the FS. This effect was due to gravitational drainage andbubbles coalescence. Coalescence occurs because of the liquid drainingfrom the lamella film while two gas bubbles approach each other, thusleading to the film thinning and its rupture (Damodaran, 2005; Yang andFoegeding, 2011). The addition of NaCl has decreased the gravitationaldrainage rate and improved the stability of soy isolated protein foams;however, ionic strength is a factor that was not included in this DOEexperimental design (Agyare et al., 2009).
According to other authors, the FS of hydrolyzed proteins of soybean,cheese whey, and cowpea decreased as a result of an increase in thehydrolysis degree (Mune Mune, 2015). In spite of hydrolysis degree of thegoat cheese, the FS was excessively low under the studied conditions in thiswork.
Experimental values of FS from 0.6 mL/min showed a maximalpercentage relative error of approximately ± 50% (Eq. 11.11).
3.12. DesirabilityThe desirability technique consists of transforming each predicted responseŷ to a desirability value 0 ≤ d ≤ 1. The greater the desirability function d,the better the desirability of the corresponding response.
The individual desirabilities of each variable (di) allow us to calculate thedesirability function as the geometrical mean of them. Thus,
, i = 1 to m.

(11.22)
(11.21)
A more general expression for d is
, where 0 ≤ wi ≤ 1 are weights,which hold the condition Σwi = 1. The weights allow us to establish relativeimportance to the responses.
There are three classes of individual desirabilities according with thekind of desire: the-nominal-the-best, the-smaller-the-best, and the-larger-the-better.
The case of the-nominal-the-best assumes that the product is mostdesirable at ŷ = t and the unacceptable limits are ŷ < L and ŷ > U, then therange of t is L ≤ t ≤ U. The desirability di is then defined as (Eq. 11.21):
The choice for α depends on preferences as an acute approachto t (α > 1) or a smooth approach to t (α < 1). This is valid for all classes ofindividual desirability.
The case of the-smaller-the-better supposes that a is the smallestdesirable value for ŷ and U is the limit above which the response isconsidered to be unacceptable; then, the definition of di is (Eq. 11.22):
The case of the-larger-the-better assumes that L is the limit below whichthe product is considered to be unacceptable and a is a finite maximumnumber to which the best response can be expected, then the definition of dis (Eq. 11.23):

(11.23)
Table 11.3 shows the maximum U and minimum L values, as well as thelow intermediate and high ranges for the responses considered in this study.
Table 11.3
Limits and ranges of responses for individual desirabilityfunctions.
Responses Minimum MaximumLowRange
IntermediateRange
HighRange
NA 0.41 1.364 0.41–0.645 >0.645–1.129 >1.129–1.364
NT 1.11 7.025 1.11–2.588 >2.588–5.544 >5.544–7.025
PSI 14.14 91.035 14.14–33.36
>33.36–71.81 >71.81–91.035
WHC 0.55 3.08 0.55–1.182 >1.182–2.447 >2.447–3.08
HW 9.34 27.33 9.34–13.84 >13.84–22.73 >22.73–27.33
EAI 66.435 223.71 66.435–105.75
>105.75–184.4 >184.39–223.7
ESI 27.33 85.45 27.33–41.86
>41.86–70.9 >70.9–85.45
η 1.265 1.74 1.265–1.384
>1.384–1.62 >1.62–1.74
So 0.955 15.64 0.955–4.626
>4.626–11.97 >11.97–15.64
FC 0.025 0.67 0.025–0.186
>0.186–0.508 >0.508–0.67
FS 0.14 1.48 0.14–0.475 >0.475–1.145 >1.145–1.48
Desirability functions have been established as different combinations ofthe responses in order to obtain novel flavoring additives with tailor-made

functional properties, according to desirable properties, based onhydrolyzed goat cheese proteins for being added to different food systems.They are:
• Additive for sauces and soups.• Additive for bakery products.• Additive for accelerate the maturation of hard cheeses.• Additive for cheesecake.
Figs. 11.11–11.13 show the behavior of different couples of factors withreference to the desirability function depending on the class of the finalproduct. From them it is possible to work out the ranges of factorspresented in Table 11.4.


FIGURE 11.11 Case of Additive for Sauces and Soups. Desirability functions as the result of factors (A) E:S ratio and amountof added buffer, (B) pH and time of hydrolysis, and (C) temperatureand time of hydrolysis.


FIGURE 11.12 Case of Additive for Bakery Products. Desirability functions as the result of factors (A) E:S ratio and amountof added buffer, (B) pH and time of hydrolysis, and (C) temperatureand time of hydrolysis.


FIGURE 11.13 Case of Additive to Accelerate the Maturation ofHard Cheeses. Desirability functions as the result of factors (A) E:S ratio and amountof added buffer, (B) pH and time of hydrolysis, and (C) temperatureand time of hydrolysis.
Table 11.4
Optimal ranges of factors for producing novel flavoringadditives with tailor-made functional properties, based onhydrolyzed goat cheese proteins, for adding to different foodsystems.
Product pHTemperature(°C)
Time ofHydrolysis(min)
Enzyme:SubstrateRatio(mg/g ofCheeseCasein)
AmountofAddedBuffer(g/gProtein)
Additive for saucesand soups
5–9 50–70 75–270 Full range 13–22
Additive forbakeryproducts
8–9 40–50 or 60–70 50–100 or175–270
0.12–0.22 20–30
Additive toaccelerate thematuration ofhard cheeses
6–9 45–52 270 0.20–0.25 10–20
Table 11.4 shows the optimal ranges of factors for producing novelflavoring additives with tailor-made functional properties, based onhydrolyzed goat cheese proteins, for adding to different food systems.
The optimization of factors related to a product for using it as aningredient in cheesecake could not be addressed because the optimal rangefor foaming capacity (1.748–2.285) fell off the experimental range (seeTable 11.3).

4. ConclusionsThis strategy has focused on the study and modeling of key functionalparameters of hydrolyzed goat cheese proteins, using chemometricmethodologies. All the variables, factors, and responses were taken togetherby multiple linear regression and good correlations between experimentaland predicted values were found. The results allowed easy understandingabout the prediction, control, and optimization of each functional parameterbased on the significant factors and the interactive effects among them forobtaining the maximal efficiency in the desirable functional characteristicsof the protein hydrolysates.
In brief, to enhance the flavoring power of the goat cheese by means ofprotein hydrolysis, the conditions that maximized NA and NT should beselected, that is, the highest values of pH (9) and ratio (E:S) (0.22 mg ofpapain/g of cheese casein), and the lowest amount of added buffer (10 g ofbuffer/g of protein). Temperature showed a compromised situation, sincemaximal NA and NT were obtained at 70 and 35°C, respectively.
Besides, if high EAI and ESI were required in the formulation offlavoring additives, the following conditions should be selected: the lowestvalues of pH (5), of amount of added buffer (10 g of buffer/g of protein)and of temperature (35°C), and the highest values of ratio (E:S) (0.22 mg ofpapain/g of cheese casein) and of time of hydrolysis (270 min).
However, high amount of added buffer was required to obtain high PSIand WHC. Then, that factor should be regulated according to the desiredPSI and WHC in the final product. Similarly, pH should be regulatedaccording to the desired ESI in the final product.
Since a low concentration of bitter peptides is always required in theformulation of flavoring additives, the highest values of all factors shouldbe selected within the studied range. These conditions will also favor theability to retain water and the solubility of the goat cheese hydrolyzedproteins. However, the amount of added buffer should be regulatedaccording to the desired viscosity in the final product, since it could beaffected as it was previously mentioned.
After optimization, the release of soluble proteins from goat cheese to thesupernatant (NT) and the hydrolysis degree of proteins into the supernatant(NA) were increased to 278 and 188%, respectively. PSI, WHC, EAI, and

ESI were increased to 231, 450, 235, and 210%, respectively. η and HWwere increased to 40 and 190%, respectively. The So was decreased to 94%in regard to the original protein isolates. FC and FS were extremely low ornull under the studied conditions.
Predicted values were experimentally confirmed and compared withthose of the original protein isolates.
Desirability designs have allowed us to find the right combination ofparticular factor ranges in order to obtain several products, with optimalfunctional properties, for being added to selected food systems. Thisprocedure can facilitate the manufacture of different protein productsstarting always with the same group of ingredients. The starting materialcan be one or more proteins (hydrolyzed or not), whose functionalproperties are desired to be modified.
Consequently, the results obtained in this work contributed to establishthe best conditions for designing and producing of novel tailor-madeflavoring additives, with desirable functional properties, based onhydrolyzed goat cheese proteins, for addition to different food systems.
AcknowledgmentsThe authors wish to thank the generous and valuable collaboration of Dr.Gerardo Enrique Camí (Area of Inorganic Chemistry, Faculty of Chemistry,Biochemistry, and Pharmacy, National University of San Luis, San Luis,Argentina), by performing FTIR spectra.
ReferencesAlonso R, Picón A, Gaya P, Núñez M. Proteolysis, lipolysis, volatile compounds and sensory
characteristics of Hispánico cheese made using frozen curd from raw and pasteurized ewe milk. J.Dairy Res.. 2013;80(1):51–57.
Agyare KK, Addo K, Xiong YL. Emulsifying and foaming properties of transglutaminase-treatedwheat gluten hydrolysates as influenced by pH, temperature, and salt. Food Hydrocoll..2009;23:72–81.
AOAC, 2006. 973.48 Nitrogen (total) in water by Kjeldhal method. In: Association of OfficialAnalytical Chemists (Eds.), Official Methods of Analysis, Arlington, VA, United States.
AOCS. Official Methods and Recommended Practices. Fifth ed. Champaign (IL), USA: AmericanOil Chemists Society; 1997.

Barberis S, Guzmán F, Illanes A, López Santín J. Study cases of enzymatic processes. In: IllanesFrontaura A, ed. Enzyme Biocatalysis: Principles and Applications. New York, NY, United States:Springer Science + Business Media B.V; 2008:253–273.
Barth A. The infrared adsorption of amino acid side chains. Prog. Biophys. Mol. Bio.. 2000;74:141–173.
Bernardo JM. Reference analysis. In: Dey DK, Rao CR, eds. Handbook of Statistics, Vol. 25.Amsterdam, The Netherlands: Elsevier; 2005:17–90.
Børsting MW, Qvist KB, Rasmussen M, Vindeløv J, Vogensen FK, Ardö Y. Impact of selectedcoagulants and starters on primary proteolysis and amino acid release related to bitterness andstructure of reduced-fat Cheddar cheese. Dairy Sci. Technol.. 2012;92(5):593–612.
Bradford MM. A rapid and sensitive method for the quantitation of microgram quantities of proteinutilizing the principle of protein dye binding. Anal. Biochem.. 1976;72:248–254.
Chatterjee S, Simonoff JS. Multiple Linear Regression Handbook of Regression, Analysis. Hoboken,NJ: John Wiley & Sons; 2012.
Chr Hansen, 2012. Improving food and health: natural ingredient solutions. Available from:http://www.chr-hansen.com.
Damodaran S. Protein stabilization of emulsions and foams. J. Food Sci.. 2005;70(3):R54–R66.Del Mar Yust M, Millán-Linares M, Alcaide-Hidalgo JM, Millán F, Pedroche J. Hydrolysis of
chickpea proteins with Flavourzyme immobilized on glyoxyl-agarose gels improves functionalproperties. Food Sci. Technol. Int.. 2013;19(3):217–223.
Derringer G, Suich R. Simultaneous optimization of several response variables. J. Qual. Technol..1980;12(4):214–219.
Dong, A., Carpenter, J.F., Caughey, W.S., 1995a. Protein Infrared Database. Chemistry Program atUniversity of Northern Colorado, United States. Available from:http://www.unco.edu/nhs/chemistry/faculty/dong/irdata.htm.
Dong A, Huang P, Caughey WS. Protein secondary structure in water from second–derivative amideI infrared spectra. Biochemistry. 1990;29:3303–3308.
Dong A, Meyer JD, Kendrick BS, Manning MC, Carpenter JF. Effect of secondary structure on theactivity of enzymes suspended in organic solvents. Arch. Biochem. Biophys.. 1996;334:406–414.
Dong A, Prestrelski SJD, Allison SD, Carpenter JF. Infrared spectroscopic studies of lyophilizationand temperature induced protein aggregation. J. Pharm. Sci.. 1995;84(4):415–424.
Drago SR, González RJ. Foaming properties of enzymatically hydrolysed wheat gluten. Innov. FoodSci. Emerg. Technol.. 2001;1:269–273.
Fawcet JK, Scott JE. A rapid and precise method for the determination of urea. J. Clin. Pathol..1960;13:156–159.
Fineli, 2011. Food Composition Database based on the Fineli Release 14. National Institute forHealth and Welfare, Finland. Available from: http://www.fineli.fi.
Foegeding EA, Davis JP. Food protein functionality: a comprehensive approach. Food Hydrocoll..2011;25(8):1853–1864.
Guzmán F, Barberis S, Illanes A. Peptide synthesis: chemical or enzymatic. Review article. Electron.J. Biotechn.. 2007;10(2):279–314.
Hermansson AM. Physico-chemical aspects of soy proteins structure formation. J. Texture Stud..1978;9:33–58.

Hermansson AM. Methods of studying functional characteristics of vegetable proteins. J. Am. OilChem. Soc.. 1979;56:272–279.
Illanes FA, Guzmán F, Barberis S. Proteases as powerful catalysts for organic synthesis. In: HughesAB, ed. Amino Acids, Peptides and Proteins in Organic Chemistry. Volume 2, Part Three:Enzymes. Weinheim, Germany: Wiley-VCH; 2009:341–361.
Karaman S, Karasu S, Tornuk F, Toker OS, Gecgel U, Sagdic O, Ozcan N, Gül O. Recoverypotential of cold press by-products obtained from the edible oil industry: physicochemical,bioactive, and antimicrobial properties. J. Agr. Food Chem.. 2015;63(8):2305–2313.
Kato A, Nakai S. Hydrophobicity determined by a fluorescence probe method and its correlation withsurface properties of proteins. Biochim. Biophys. Acta.. 1980;624:13–20.
Kim CJ, Lee DI, Lee CH, Ahn IS. A dityrosine-based substrate for a protease assay: application forthe selective assessment of papain and chymopapain activity. Anal. Chim. Acta.. 2012;723:101–107.
Kotlar CE, Ponce AG, Roura SI. Improvement of functional and antimicrobial properties of breweryby-product hydrolysed enzymatically. LWT—Food Sci. Technol.. 2013;50(2):378–385.
Laemmli UK. Cleavage of structural proteins during the assembly of the head of bacteriophage T4.Nature. 1977;227(5259):680–685.
Lam RSH, Nickerson MT. Food proteins: a review on their emulsifying properties using a structure–function approach. Food Chem.. 2013;141(2):975–984.
Lamsal BP, Jung S, Johnson LA. Rheological properties of soy protein hydrolysates obtained fromlimited enzymatic hydrolysis. LWT—Food Sci. Technol.. 2007;40:1215–1223.
Li Y, Zhong F, Ji W, Yokoyama W, Shoemaker CF, Zhu S, Xia W. Functional properties of Maillardreaction products of rice protein hydrolysates with mono-, oligo-, and polysaccharides. FoodHydrocoll.. 2013;30(1):53–60.
Li-Chan E, Nakai S, Wood DF. Hydrophobicity and solubility of meat proteins and their relationshipto emulsifying properties. J. Food Sci.. 2006;49(2):345–350.
Mune Mune MA. Influence of degree of hydrolysis on the functional properties of cowpea proteinhydrolysates. J. Food Process. Pres.. 2015;39(6):2386–2392.
Pires C, Clemente T, Batista I. Functional and antioxidative properties of protein hydrolysates fromCape hake by-products prepared by three different methodologies. J. Sci. Food Agr..2013;93(4):771–780.
Piva, M., Pinnavaia, G., Lerici, C.R., 1981. Idratazione. In: Consiglio Nazionale delle Ricerche(Eds.), Propietá funzionali delle proteine. Consiglio Nazionale delle Ricerche (CNR) TheNational Research Council, Italy, pp. 34–48.
Prestrelski SJ, Tedeschi N, Arakawa T, Carpenter JF. Dehydration induced conformational changesin proteins and their inhibition by stabilizers. Biophys. J.. 1993;65:661–671.
Pripp AH, Stepaniak L, Sørhaug T. Chemometrical analysis of proteolytic profiles during cheeseripening. Int. Dairy J.. 2000;10:249–253.
Richardson JS. The anatomy and taxonomy of protein structure. Adv. Protein Chem.. 1991;34:167–339.
Seki K, Komuri Sh, Ramachandran S. Growth kinetics of circular liquid domains on vesicles bydiffusion-controlled coalescence. J. Phys. Condens. Mat.. 2013;25:195105.
Sorgentini DA, Wagner JR. Comparative study of foaming properties of whey and isolate soybeanproteins. Food Res. Int.. 2002;35(8):721–729.

Surówka K, Zmudzinski D, Surówka J. Enzymic modification of extruded soy protein concentratesas a method of obtaining new functional food components. Trends Food Sci. Tech.. 2004;15:153–160.
Tang CH, Ten Z, Wang XS, Yang XQ. Physicochemical and functional properties of hemp (Cannabissativa L. protein isolate). J. Agr. Food Chem.. 2006;54:8945–8950.
Tavano OL. Protein hydrolysis using proteases: an important tool for food biotechnology. J. Mol.Catal. B-Enzym.. 2013;90:1–11.
Vairo Cavalli S, Silva SV, Cimino C, Malcata FX, Priolo N. Hydrolysis of caprine and ovine milkproteins, brought about by aspartic peptidases from Silybum marianum flowers. Food Chem..2008;106(3):997–1003.
Van der Weert M, Haris PI, Hennink WE, Crommelin DJA. Fourier transform infrared spectrometricanalysis of protein conformation: effect of sampling methods and stress factors. Anal. Biochem..2001;297:160–169.
Wani IA, Sogi DS, Gill BS. Physico-chemical and fuctional properties of native and hydrolysedprotein isolated from Indian black gram (Phaseolus mungol L.) cultivars. LWT—Food Sci.Technol.. 2015;60(2):848–854.
Yang X, Foegeding A. Effects of sucrose on egg white protein and whey protein isolate foams:factors determining properties of wet and dry foams (cakes). Food Hydrocoll.. 2010;24(2–3):227–238.
Yang X, Foegeding EA. The stability and physical properties of egg white and whey protein foamsexplained based on microstructure and interfacial properties. Food Hydrocoll.. 2011;25:1687–1701.

C H A P T E R 1 2
Production of Low-Alcohol Beverages: CurrentStatus and PerspectivesLoredana Liguori*
Paola Russo**
Donatella Albanese*
Marisa Di Matteo* * University of Salerno, Fisciano, Salerno, Italy ** Sapienza University of Rome, Rome, Italy
AbstractLow alcohol beverages represent a new fast-growing sector due to major awareness about serious long-term effects of drinking and societal andindividual vulnerability factors on alcohol consumption have been reported, together with consumers’ preferences.This chapter is focused on the various techniques for low alcohol beverage production from wine and beer. Regarding wine, climate changes alongwith research of more intensely flavored products have produced more alcoholic wine. Regarding beer, the reduction of alcohol content aims atdrinking less alcohol and familiarizing consumers with new, lower-alcoholic drinks. The main obstacles for development of these types of beveragesare taste and quality.The right process should combine efficiency in terms of energy demand and capital costs, reducing alcohol content and keeping sensory quality ofbeverage.Finally, low-alcohol beverages may widen the marketing of functional beverages and satisfy the needs of different people.
Keywords
winebeerlow alcoholdealcoholizationviticultural practicesmicrobiological practicespre-fermentationpost-fermentationmembrane processessensory properties
1. Overview of Alcohol ConsumptionAlcoholic beverages have been an integral part of many different cultures since ancient times, when fermentedbeverages were produced as household or artisanal activities by using agricultural surpluses from tribal and villagesocieties. From traditional patterns of drinking to modern industrialization, patterns of production, consumption,and distribution have been developed, along with improved transportation, so that market beverages have became amarket commodity that are available in all seasons of the year and at any time during the week.

Alcohol consumption is widespread and different around the globe, and it is influenced by both societal andindividual vulnerability factors. Societal factors include levels of development of societies, culture, drinkingcontext, and alcohol production.
Alcohol consumption culture is so varied within countries around the globe: from religious rituals to socialaggregation, to traditional family meals in some countries (i.e., Italy and France), to some highly religiouscountries (majority of Muslim countries) where alcohol is banned because of sacred rules. One may experiencedifferent cross-cultural variation in the way people behave when they drink, and the effects of alcohol on behaviorare primarily determined by social and cultural factors, rather than ethanol’s chemical actions.
Another societal factor affecting people’s alcohol consumption is the level of development of countries. Thegreater the economic wealth, the higher the levels of consumption and the lower the levels of abstention rates.However, for a given level or drinking pattern, alcohol-attributable mortality and the burden of disease willgenerally be greater in societies with lower economic development than in more affluent societies (WHO, 2014).
Alcohol policies vary tremendously in each country and may influence consumers’ relationships with alcohol,ensuring a safe public environment for leisure-time events, minimizing accidents and loss of workplaceproductivity. Drunk-driving campaigns, school-based education, mass-media campaigns, workplace and localcommunity programs are some education and information efforts at different levels (national, regional, or local)(Rehn et al., 2001).
Individual factors affecting the alcohol consumption include age, gender, familial factors, and socioeconomicstatus.
Age represents one distinctive factor among drinkers. Adolescents and elderly people are more vulnerable toalcohol than other groups and, especially youth. The risk of alcohol dependency and abuse becomes higher at laterages. Nowadays, we are witnessing a rising phenomenon among teenagers: binge drinking, the practice ofconsuming large quantities of alcohol (defined as 60 or more grams of pure alcohol on at least one single occasion)in a single session, with neurological and pathological consequences and obvious impacts, for example, also ondriving safety. Contrarily, older people drink more on fewer occasions (Conibear, 2010). Regarding gender, mendrink more frequently and in larger quantities than women: 32% and 45% are numbers for female abstainers,respectively, in Europe and the United States, whereas the result for men abstainers is 16% and 32%(Conibear, 2010). Reasons for this trend in women choosing not to drink are complex, but do include health andweight.
The other person-dependent factor is familial history of alcohol abuse, which can account for substantialconsumption of drinks if there were heavy drinkers among family members. This situation may affect not onlychild development adversely and parent-child relationships, but can also lead to drinking problems later.
The latest factor influencing the way people drink is socioeconomic status. Thanks to surveys in the developedworld, it is possible to conclude that more drinkers and drinking occasions rise in higher socioeconomic groupswith low-risk drinking patterns, whereas abstainers are more common in poorer social groups, and they are morevulnerable to tangible problems and alcohol consumption consequences due to a lack of resources (WHO, 2014).
All of these factors together with high and frequent alcohol consumption can bring health outcomes such asphysical and mental diseases (i.e., liver cirrhosis, cancers, depression, alcohol dependence) (WHO, 2014).Therefore, the quest for moderate alcohol consumption has become important globally for reducing the level ofharmful use of alcohol, which is considered the third leading risk factor for premature deaths and disabilities in theworld (WHO, 2010).
The global strategy of the World Health Organization (WHO) “To Reduce the Harmful Use of Alcohol,”approved and implemented by the member states, aims at promoting and supporting local, regional, and globalactions to prevent and reduce the harmful use of alcohol. The policy interventions may include, on one hand, theproduction, wholesaling, and serving of alcoholic beverages in accordance with cultural norms; on the other hand,alcohol industries should contribute to this progress by considering effective ways to prevent and reduce theexcessive use of alcohol, including self-regulatory actions and initiatives.
From this perspective, the development and marketing of new, high-quality products with lower alcohol strengthmay enhance and prompt consumer choices for lower alcohol alternatives.
1.1. Consumer Preferences and TrendsGlobal Health Observatory (GHO) data (http://www.who.int/gho/alcohol/en/) reports and monitors healthsituations and alcohol consumption trends, injuries caused by alcohol, and policy responses in various countries

(GHO, 2016). The latest official data on alcohol consumption (2010) highlighted a worldwide total consumption ofalcohol (including both recorded and unrecorded alcohol, which means consumption of homemade or informallyproduced alcohol, smuggled alcohol) equaling 6.2 L of pure alcohol per person, 15 years and older, whichcorresponds to 13.5 g of pure alcohol daily. This amount varies among countries due to the factors mentionedearlier and their interactions, not neglecting beverage preference. In fact, geographical differences exist regardingthe major type of alcoholic beverages people consume: beer, wine, spirits, or other alcoholic beverages (e.g.,fortified wines, rice wine, or other fermented beverages made of sorghum, millet, or corn), as shown in Fig. 12.1.
FIGURE 12.1 Beverages Preferences Worldwide. Source: From World Health Organization (WHO), 2014. Global Status Report onAlcohol and Health. WHO, Geneva, Switzerland.
Globally, spirits are the most consumed recorded alcohol (50.1%), the main beverages, especially in the WHOSouth-East Asia region (mainly China) and Western Pacific regions (mainly India) according to WHO’s worldcountries classification report (WHO, 2014). Secondly, beer accounts for 34.8% of all recorded alcohol consumedin the world and it is mostly imbibed in the Americas (55.3%). Lower percentages of 8% and 7.1%, respectively,for wine and other beverages, though wine results in more consumption in WHO’s European regions (25.7%) andin the Americas, especially Argentina and Chile (11.7%). Apart from spirits, beer, and wine, other alcoholicbeverages represent 51.6% of the total recorded alcohol consumption in the African region (WHO, 2014).
2. Dealcoholization of BeveragesApart from wine and beer as low-alcohol beverages, the low-alcohol market includes beverages created fromcereal fermentation, typical of production areas with unique names.
In fact, Kombucha is produced from the fermentation of sweet black/green tea using specific bacteria/yeasts(originating from China, then diffused in Eastern Europe). Boza is a low-alcohol [∼1% (v/v)] beverage producedby corn fermentation, wheat, millet, or other cereals and it is popular in Eastern Europe and Turkey. Kvass is acarbonated beverage from Eastern Europe produced by fermentation of rye bread. It contains less than 1.2% (v/v).Chicha is a homemade beverage in Latin America, produced by fermentation of corn, yuca, rice, potatoes,pineapple, and so on. It may contain 1–3% (v/v) of alcohol. Other variously widespread products can be obtainedby mixing beer with citrus soda (Radler in Europe, Australia; Panaché in France, Switzerland) or ginger aleShandy, shandygraff (in the United Kingdom and the United States) (NutrientsReview, 2016).
2.1. Definitions and LegislationWe focused mainly on the two most consumed fermented beverages: wine and beer. As follows, we reported whatis regulated by law about alcohol reduction for wine and beer.

2.1.1. WineWine is the product obtained exclusively from the total or partial alcoholic fermentation of fresh grapes, whetheror not crushed, or of grape must. Alcohol content must be in the range of 9–15% (v/v), with some exceptions oflower [8.5% (v/v)] and upper limits [20% (v/v)], due to climate, soil, vine variety, special qualitative factors orspecific traditions, according to Council Regulation, 2008 [(EC) No. 479/2008]. Within and beyond this range,other concentrations of alcohol can be found in wine; for example a minimum of 4.5% (v/v) in Australia(Fsanz, 2011).
Consequential reasons (i.e., global warming, rinsing temperatures, faster pulp maturation) create unbalancedwine in terms of phenolic maturity and the grape’s aroma profile with ethanol concentration over 15% (v/v).Moreover, wine high in alcohol content is taxed at a higher rate in many countries. Therefore, according toCommission Regulation, 2009 [(EC) No. 606/2009], partial removal of alcohol is allowed using physicalseparation techniques up to a maximum reduction of 2% (v/v) relative to the original alcohol content.
The requirements of dealcoholized wine concern:
• The wines treated must have no organoleptic faults and must be suitable for direct human consumption.• Alcohol removal from wine cannot be carried out if one of the enrichment operations laid down in Annex
V to Regulation (EC) No. 479/2008 was applied to one of the wine products used in production of wineunder consideration.
• Alcohol reduction should not exceed 2% (v/v) and the actual alcohol content (by volume) of the finalproduct must comply with that defined in point (a) of the second subparagraph of paragraph 1 of AnnexIV to Regulation (EC) No. 479/2008.
• Dealcoholization treatment must be registered and notified to the competent authorities.
Alongside this Commission Regulation, membrane-based methods may be used for the production andmarketing of wines, according to what was established by the International Organization of Vine and Wine (OIV)(Resolution OIV-OENO 373B/2010). Likewise, the declaration of definitions and procedures for beveragesobtained by dealcoholization or partial dealcoholization of wine (Resolution OIV-ECO 432-2012 and OIV-ECO 433-2012, respectively) has been necessary to improve the quality of dealcoholized wine and to clarify,protect, and ensure users about low-alcohol consumption or directly of dealcoholized beverages of vitiviniculturalorigin.
The individual or combined use of membrane-based methods (i.e., microfiltration, ultrafiltration, nanofiltration,membrane contactors, reverse osmosis, and electromembranes) to wine (Resolution OIV-OENO 373B/2010) canbe applied to:
• Elaborate more balanced wine in terms of organoleptic characteristics.• Compensate the effects of adverse climate conditions and consequences.• Correct particular organoleptic defects.• Satisfy consumer expectations by developing new products.
With regard to new wine-based beverages, in response to the market demands and new advances in technology,Resolution OIV-OENO 394A-2012 and OIV-OENO 394B-2012 specify the separation techniques (i.e., partialvacuum evaporation, membranes, distillation) that can be used either to dealcoholize wine or to regulate winestrength of wine, respectively.
Regulating the alcohol content of a particular wine, which means reducing an expected excessive level ofethanol to improve its taste balance, is allowed with a maximum reduction of 20%. It is possible to reduce ethanolcontent in wine at a maximum of 20% (of the initial ethanol content) to improve its balanced taste. Productsobtained through this practice must still conform to the definition of wine, and especially the alcohol content maynot be lower than the minimum alcoholic strength of wines. Otherwise, if alcohol reduction is greater than 20% ofthe initial content, it will fall under a dealcoholization process, which means removing part or almost all of theethanol content in wine to develop vitivinicultural products with low or reduced alcohol content.
Hence, the new definitions of dealcoholized beverages pertain to beverages obtained by dealcoholization andpartial dealcoholization of wine. The former group includes beverages produced only from wine and with analcoholic strength below 0.5% (v/v); the latter refers to beverages produced only from wine that has undergone

dealcoholization treatment and with an alcoholic content equal to or greater than 0.5% (v/v) and less than theminimum content applicable for wine (Fig. 12.2).
FIGURE 12.2 Beverage Classification Based on Alcohol-Content Reduction. Source: From Resolution OIV-OENO394A-2012 and Resolution OIV-OENO 394B-2012.
The use of the denomination “dealcoholized wine” and “partially dealcoholized wine” has, however, beenallowed by each state (International code of Oenological Practices, 2016).
Different technologies can be applied, either prior to or after alcoholic fermentation, from the vineyard to thewinery to produce or correct alcohol content in wine, as reported in the following paragraph 3: Techniques forAlcohol Reduction in Wine.
2.1.2. BeerBeer is one of the most popular drinks, obtained by the fermentation process of wort, composed of malt, hops, andwater. Beer can differ enormously in its composition from brand to brand depending on its alcohol strength andhow it is made in terms of raw materials and technologies, which gradually improved with brewing technologistadvancements.
A way of describing the strength of a beer is on the basis of alcohol strength, usually defined in terms of alcoholby volume (ABV) (i.e., the number of cm3 of ethanol per 100 cm3 of beer, % (v/v)]. Beer can be classified byalcohol strength as low [2–3% (v/v)], medium [about 5% (v/v)], and high [6–12% (v/v)] alcohol degrees(Sohrabvandi et al., 2010). In fact, the range of alcohol content is very wide, from 0.05% (v/v) in alcohol-freeproducts up to 10% (v/v) and higher in beer produced in Trappist monasteries (Bamforth, 2004). The vast majorityof beer is in the range of 3–6% (v/v), and if compared with other alcoholic beverages, it is possible to declare thatbeer has low alcohol content except for high strength beers (Bamforth, 2003) (Fig. 12.3).

FIGURA 12.3 Types of Alcoholic Beverages.
Low-alcohol content beer has only recently entered the market, due to the boost in drinking less alcohol amongpeople. In recent years, there has been an increased market share for low-strength alcohol as well as alcohol freebeer in Europe, whereas in the United States, from a growth increase among the years 2007–12, a stagnating levelhas been recorded (Alkhatib, 2013). Each country has its own legislation on the classification of beer with nocommunity law in Europe about reduced-alcohol-content beer.
Beer can be classified as light, low-alcohol, and alcohol free, but alcohol limits for each group differ amongstates. More harmonized classification among different countries are welcome. It is possible to state light beer withan alcohol content ranging between 1.2–3.5% (v/v); low-alcohol beer with a maximum of 1.2% (v/v), and alcohol-free beer that is not more than 0.5% (v/v) (Montanari et al., 2009). A scheme is reported in Table 12.1 that includessome exceptions in various countries.
Table 12.1
Alcohol content range and exceptions in beer classification.
Type of Beer Min–Max ABV [% (v/v)] Exceptions [ABV, % (v/v)]Light beer 1.2–3.5
Low-alcohol beer 0.5–1.2 0.1–1.2 Netherlands
0.1–1.9 Austria
1–3 Spain
≤1.2 United Kingdom
≥2.25 Sweden
≤2.5 United States
Alcohol-free beer ≤0.5 ≤0.1 Netherlands
<0.1 Denmark
<1 Spain
≤0.05 United Kingdom
No alcohol in the United States
No alcohol in Islamic countries

Various methods and practices have been applied to the production of low-alcohol and alcohol-free beer dividedin biological or post fermentation methods, as explained later.
2.2. Why Dealcoholization?It is widely recognized that the alcoholic strength of wine has been trending upward over time in differentworldwide geographic locations. Alston et al. (2015) analyzed about 100 thousand wines from 11 wine-producingcountries and highlighted that red wines are more alcoholic than whites, and wine production in warmer regionsand in the “Old World” determines high alcohol content more so than cooler regions and in the “New World.”
These outcomes come from two main trends:
1. The harvest of riper grapes with more sugar and less acid produced by rising temperatures associated withglobal warming.
2. The rational decisions of winemakers to maximize their profits: overripe grapes harvested later in order toproduce bigger, more intensely flavored wines that bring higher prices and appeal of more expressive tasteprofiles by consumers.
The strong increase in the alcohol strength in wine has considerably contributed to the rise of per capita alcoholconsumption. Therefore, the wine industry may choose between acting now by helping to decrease alcoholconsumption or waiting for rigorous regulations, similar to those of the tobacco industry.
For beer, which is one of the most friendly and popular beverages in the world, the reduction of alcohol contentaims at encouraging less alcohol intake and familiarizing consumers with new, lower alcoholic drinks, changingthe attitude towards drinking and lifestyle.
Recently, especially in western European countries, the level of alcohol consumption has been falling, asconsumers are increasingly aware of health issues caused by alcohol and increasingly seeking healthieralternatives. The production of less alcoholic wine and beer can increase beverage supply and marketing and,improve consumer well being by taking advantage of beneficial molecules and restricted alcohol content.
2.3. Social and Economic ImpactRecently, the enacted rules on alcoholic beverages consumption and personal responsibility have been morerestrictive. Moreover, campaigns to build awareness for responsible drinking have been launched. As aconsequence, in the 2005–10 period, the consumption of alcohol-free products was increased with respect tobeverages with 0.5–4% (v/v). In 2010, the 83% growth of low-alcohol wine market was observed. Now, in theUnited Kingdom, low-alcohol wine represents 1% of the wine sold and it is expected to grow to 3%–10% (Corbet-Milward and Loftus, 2011).
The low-alcohol beer market is increasing very quickly worldwide. Research by Mintel (2016) analysts reportsthat 2.2 billion L of nonalcoholic beer were imbibed in 2012—an increase of 80% from 5 years earlier.
Health advantages may include reduced calorie intake, decreased risk from alcohol-related illness and disease,and specific benefits for pregnant women, breast-feeding mothers, and consumers unable to take alcohol formedical purposes. Human studies have demonstrated that short-term interventions with moderate amounts ofethanol, dealcoholized red wine, or low polyphenol sparkling wine reduced the risk of atherosclerosis, as measuredby biomarkers (Guilford and Pezzuto, 2011).
Social benefits may include improved productivity and function after activities involving alcohol (e.g., businesslunches), lower risk of prosecution or accidents while driving, and, in general, more acceptable social behavior.
Nevertheless, alcohol is one of the main by-products of the dealcoholization process with its own market andincomes. The production of low-alcohol beverages represents a valid possibility to differentiate the wine sectorand, in such a fragmented sector, also helps producers to avoid price competitiveness. Moreover, wine surplusesmay be used for the production of dealcoholized wine, which diminishes the costs.
For these wines producers, the incentive of identified markets and market segments exists, as well as lower salesand duty taxes applicable in many countries. Therefore, dealcoholized wine should be sold as a different beverage,neither as wine nor as a substitute of wine.
The obvious health benefits and general social concerns about alcohol intake have meant that the wine industryhas begun to respond by going beyond classic rosé to create an entirely new category of lower alcohol [4–9%

(v/v)] still-wine styles. Sales of these low-alcohol styles have increased rapidly with recent figures showing anencouraging growth to 1 million cases off trade with an expected market share of 5 million cases within five years.Taste is paramount; consumers will reject low-alcohol wines if they feel they are being robbed of flavor (orcheated into thinking something is pure wine when it clearly is not). It was not surprising that recent researchrevealed the main obstacles to consumers are taste (40%) and quality (30%). However, some 16% of consumerswanted to purchase low-alcohol wines regardless, and had no concerns at all (YouGov Omnibus Panel, 2011).
3. Techniques for Alcohol Reduction in WineThe increasing alcohol content in wines may be due to both climate changes and consumer preferences for full-bodied, rich and ripe fruit flavor profiles. A high alcohol concentration can interfere with a wine’s taste in terms offlavor and complexity of the wine itself. Hence, the development and use of techniques enable the limitation orreduction of alcohol, evaluating pro and cons, mainly in terms of taste and costs, may represent preliminary stepsfor successfully launching low-alcohol wine.
Techniques can be divided in viticultural strategies, prefermentation and microbiological strategies, as well aspostfermentation techniques (Fig. 12.4).
FIGURE 12.4 Overview of Techniques Applied to Wine Supply Chain for Reducing Alcohol Content inWines.
3.1. Viticultural StrategiesThe accumulation of sugar, mainly glucose and fructose within the cellular medium, specifically in the vacuoles, isone of the main features of the ripening process in grape berries and has a great impact on wine’s alcohol content.
As reported by Jordão et al. (2015) sugar composition is mainly determined by genotype, but its concentration isstrongly affected by both environmental and cultural management factors on the canopy, which can lower thealcohol concentration in the resultant wine. These practices can be grouped into short- and long-term vineyardchanges as reported in Table 12.2.

Table 12.2
Viticultural strategies for limiting sugar accumulation in grape berries.
Short-Term Changes of Vineyard Long-Term Changes of VineyardReducing leaf area and leaf removal, shoot trimming, summer pruning, defoliation Selection of root stock
Application of growth regulators Grape varieties and vineyard site; soil composition
Managing harvest date
Modification irrigation regimes
The main objective of viticultural strategies consists of the production of well-balanced, good quality grapes,with a lower concentration of soluble solids.
3.1.1. Short-term vineyard changes
3.1.1.1. Reducing leaf area and fruit mass ratioThe establishment of the leaf area/fruit mass ratio (LA/FW) is one of the most important viticultural indexes fordefining a well-balanced vineyard that could produce high-quality grapes and wine.
The rate of sugar accumulation in berries is largely determined by this ratio (Stoll et al., 2010), which alsoinfluences flavor and phenolic ripeness. A range value of 0.8–1.2 m2/kg allows grapes to achieve good ripeness. Ifthe ratio of LA/FW is high, the sugar concentration may rise to an unacceptable level by the time the flavor andphenolic ripeness occurs for a particular wine style.
Leaf area reduction can be achieved through severe trimming or leaf removal treatments, performed at differentstages of berry growth, thereby influencing the sugar content in must and the subsequent alcoholic degree in of thewine. The leaf area reduction performed after fruit set may ensure a better synchronization of sugar and flavor andphenolic compound ripeness, avoiding unbalanced wine in terms of flavor and a tasty sensation. Several papershave been published on this issue (Martinez de Toda et al., 2013; Stoll et al., 2010; Whiting, 2010).
Martinez de Toda et al. (2013) evaluated leaf area reduction by intense shoot trimming treatment (decreasing theLA/FM ratio) after berry set to reduce sugar and the pH of Grenache and Tempranillo grape varieties and, theyevaluated the consequences for grapevine productivity. The results highlighted an important delay in graperipening, lower levels of soluble solids and pH, and lower total anthocyanin content. These changes reflect a winealcohol reduction of 2% (v/v). But the trimming technique may create negative effects on grapevine productivity(i.e., berry weight, reduced bunch size, and yield), unless the LA/FM ratio is above 0.50 m2/kg.
Stoll et al. (2010) investigated a wide range of LA/FM ratios of a Riesling cultivar grape by using amechanically defoliated canopy (MDC) and severe summer pruning (SSP). The former consisted of mechanicalleaf defoliation above the bunch zone and the latter was shoot topping to approximately 6 leaves per shoot. Theberry ripening was heavily affected by the LA/FM ratio with effect on the velocity of harvest maturity and berrycomposition. Initial sensory evaluation showed that wines of a reduced LA/FW ratio by MDC were consideredwell balanced and capable of a two-week delay in ripening and in production of high quality fruit.
Whiting (2010) evaluated grapes and wines obtained by leaf removal. The defoliation regulates sugaraccumulation in the grapes, reducing anthocyanin content and color of wine but not tannin in the fruit and wine.
For delaying ripening and avoiding unbalanced wine, Poni et al. (2013) evaluated a late (at postveraison,average 12 °Bx) leaf removal above a Sangiovese bunch area. In this way, the total soluble solids content in thegrape must and wine alcohol concentration was significantly reduced [the latter by 0.6% (v/v)] without anysignificant effect on other compositional parameters, including phenolic substances.
Similar results were obtained in Sangiovese wine by apical defoliation to the bunch zone (about 35%) by using aleaf-plucking machine when berry sugar content was approximately 16–17 °Bx (postveraison) (Palliottiet al., 2013a). The technique was easily and economically viable for delaying sugar accumulation in the berriesand for limiting the alcohol content of wines [reduction of 0.6% (v/v)] with no negative impact on desirablecomposition of either berries or wines.
Increasing leaf removal up to 50% in Sangiovese cultivar grapes, resulted in a soluble solids reduction in grapeswithout any effect on other parameters except for yield in the following season (Filippetti et al., 2015).
The practice of decreasing leaf area by defoliation above the bunch zone or by topping of shoots to reduce leafnumber per shoot may allow a good synchronization of sugar and flavor/phenolic ripening, but they may cause

excessively delayed ripening at high crop loads or excessive bunch exposure.
3.1.1.2. Application of growth regulatorsThe application of exogenous growth regulators (i.e., 1-naphthalene acetic acid) may be a useful tool for delayingthe onset of sugar ripening and improving synchronization of sugar accumulation, as investigated by Bottcher et al.(2011) in Syrah grapes.
Moreover, postveraison antitranspirant treatments, obtained by distillation of conifer resins (such as thosecontaining “pinolene,” a product having 1-p-menthene as active compound), may induce a significant reduction ofmust sugar concentration and, hence, of wine alcoholic level, regardless of the cultivar and the vine productivity(Palliotti et al., 2010, 2013b). In Italy, trials were carried out on Sangiovese, Tocai rosso, Trebbiano toscano andGrechetto. However, antitranspirant treatments may induce some detrimental effects on phenolic content, mostly inblack-berry varieties and especially for anthocyanins, while total polyphenol content seems less affected (Palliottiet al., 2010, 2013a).
Similar results were obtained by Tittmann et al. (2013) in Riesling and Müller Thurgau grapes grown either ingreenhouse or in open field.
3.1.1.3. Managing harvest datesAmong viticultural practices, grapes can be picked twice: at early and mature stages. In this way, the organolepticdefects arising from green berries with herbaceous notes and high acidity levels can be offset by fruit flavors,viscosity and heat related to normal grape maturity (Ozturk and Anli, 2014).
Some grape cultivars were investigated in low-alcohol wine production by means of this strategy. In fact,Bindon et al. (2013, 2014) evaluated, by chemical and sensory analyses, wine made from Cabernet Sauvignongrapes, harvested sequentially. The alcohol degree in wines was in the range 11.8–15.5% (v/v); consumerpreference was similar for wines containing 13.6–15.5% (v/v), indicating earlier harvest could deliver loweralcohol wines with the same liking for consumers.
In other papers (Balda and Martínez de Toda, 2013; Kontoudakis et al., 2011), an alcohol reduction up to 3%(v/v) was obtained, but wines exhibited undesirable acidic and unripe flavors.
3.1.1.4. Modification irrigation regimesA short-term viticultural practice consists of water management: increasing irrigation during the last few weeksbefore harvest (from 22 °Bx to harvest) may cause a significant delay in ripening with a small reduction in winealcohol content. The results were not confirmed in different seasons (McDonnell, 2011). Similar irrigationtreatments showed no significant effect on wine sensory score and composition (Mendez-Costabel, 2007; Sanchezet al., 2006).
3.1.2. Long-term vineyard changesLong-term vineyard changes make it possible to regulate sugar’s concentration and raise grape yield. In fact, lowto moderate vigorous genotypes of root stocks may be chosen to lower alcohol content in wines, (Ozturk and Anli,2014).
Another strategy is the selection of grape variety and optimal vineyard sites in terms of climate and specificconditions of fields—that is, slopes shaded by mountains, sun and wind exposure (Ozturk and Anli, 2014).
Soil composition can also influence grape ripening in terms of acidity and mineral composition. The mainminerals affecting grape quality are magnesium and nitrogen. In the case of magnesium deficiency and an excessof nitrogen, grape quality loss can occur in terms of delayed ripening and lowered sugar accumulation,respectively (Ozturk and Anli, 2014).
3.2. Prefermentation and Microbiological StrategiesOther techniques can be applied in the cellar during the vinification process for limiting alcohol production byremoving sugar. Dilution of must (juice), membrane processes, and enzyme addition can be used to obtain low-alcohol wines, without considering the pros and cons of these techniques.
3.2.1. Dilution of must

The illegality of water addition to must is widespread worldwide (i.e., Europe, New Zealand, Australia, and SouthAfrica) except for the United States (excluding California) (Salamon, 2006). In some countries, water addition isconsidered as a processing aid, which can be added at the lowest level to achieve the purpose required (i.e., toprevent stuck fermentation, which may happen when grapes are very ripe or for the incorporation of any permittedadditive).
In the literature, good results achieved by adding water to must are reported (Harbertson et al., 2009; Heymannet al., 2013). The dilution of Merlot must allows it to reduce wine alcohol content at 2% (v/v) with an increasedfresh fruit flavor and no difference in perceived heat in comparison to untreated wine, as reported by Harbertsonet al. (2009). Likewise, Heymann et al. (2013) compared wine produced by dilution of Cabernet Sauvignon must(from 30 to 24 °Bx) with that obtained from the early harvest of grapes. The sensory results were similar for bothwines.
Anyway, water addition may have a double and opposite effect: it reduces must acidity and negatively affectsappearance and the wine’s future taste (i.e., color, tannins, flavor compounds).
3.2.2. Membrane processesMembrane technology has been tried for sugar removal from must prior to fermentation (Garcia-Martinet al., 2010; Mihnea et al., 2012; Salgado et al., 2015). In particular, taking into account the molecular weight ofsugars in must, nanofiltration (NF) seems to be the most appropriate technique to control sugar concentration interms of low to moderate retention of low molecular weight. NF technology requires a pressure gradient totransport the grape must and to separate the resultant two fractions (retentate, R, and permeate, P); a membraneshould be suitable for the purpose in terms of configuration and cutoff.
In literature, must obtained from Spanish grape varieties (Verdejo, Garnacha, Tinta de Toro) were tested byusing spiral-wound modules in a single or two-step nanofiltration process. At the end of the process, both streams(R, P) were blended in such an amount to have less sugar content than untreated must. In Garcia-Martin et al.(2010), a retention of sugar with lower alcoholic wine [up to 3% (v/v)] can be achieved, but color- and flavor-compound reduction is found in wine due to the retention of glycosidic precursors of terpenes. Furthermore, fluxdecay may occur, due to must having complex liquids with extreme colloidal and fouling properties, which cancause economic losses in terms of time and costs.
In order to preserve good taste in wine, an appropriate type of membrane should be selected to minimize theretention of volatile compounds and process conditions should be well established and controlled.
3.2.3. Enzyme (glucose oxidase) additionSugar removal can be achieved by glucose oxidase (GOX) enzymes, which catalyses the reaction of β-D-glucoseinto D-glucono-δ-lactone with hydrogen and gluconic acid such as reaction products. The enzyme is purified fromAspergillus or Penicillium genus (Aspergillus niger is the most commonly used in enzyme production) and addedto must before yeasts; it has an optimum condition at pH range of 3.5–6.5 and is oxygen dependent (Schmidtkeet al., 2012). Therefore, addition of calcium carbonate and aeration can increase its activity.
This technique brings an alcohol reduction up to 0.7% (v/v) in wine with respect to the untreated one (Biyelaet al., 2009). An increase in total acidity and a slight decrease of pH are outcomes of GOX activity, which affectswine’s sensory properties. In fact, more carbonyl compounds are formed and a higher demand of SO2 occurs forthe linkage with them. Other defects are color depletion in wine (browning) because of phenolic compoundoxidation by must aeration, which favors microbial activity and fruity aroma loss, as reported by Varela et al.(2015).
3.2.4. Microbiological practicesAn applicable strategy during fermentation involves using specific yeast strains, capable of producing loweralcohol content by means of less sugar fermentation or diverting carbon metabolism toward other pathways.
Alcohol fermentation occurs mainly by Saccharomyces cerevisiae, efficient in converting sugar into alcohol andtolerant to stressful conditions developed during fermentation itself. Other yeasts belonging to non-Saccharomycesspecies are involved at the early stage of the wine-making process and may persist during other fermentativestages, which can affect the final product’s style. The possibility of using non-Saccharomyces strains in mixedculture with S. cerevisiae for wine fermentation presents double and opposite effects at the same time. They are not

capable of completing fermentation, hence the subsequential addition of the S. cerevisiae strain becomes necessary.They consume sugar by respiration rather than fermentation, producing a moderate alcohol yield and, by means ofdesirable compounds, they may positively influence sensory characteristics of wines. Yeast strains involved in thefirst stage of fermentation are Metschnikowia pulcherrima, S. uvarum, Torulaspora delbrueckii, and Candidazemplinina.
Papers in literature (Contreras et al., 2015; Loira et al., 2015; Sun et al., 2014; Varela et al., 2016) assessthese yeast strains in combination with S. Cerevisiae to produce low-alcohol wine with respect to the control wine.The yeast mixtures originate metabolic interactions resulting in a combination of chemical substances distinctlydifferent from those in wines made by blending together monocultural wine produced from the same yeast strains.
Another approach involves genetic engineering by using gene modification technologies (GMT) or adaptiveevolution and selection. GMT includes an increase of glycerol formation, gluconic acid production and lifting ofglucose repression of respiration, and changing of the NAD/NADH+ ratio. All GMT concerns the manipulation ofvarious gene encoding for different enzymes as reported by Varela et al. (2015). The most effective strategy isglycerol formation, since other GMT involves the production of undesirable metabolites for wine flavor, such asacetic acid, ethyl acetate, aldehyde, and acetoin.
Despite a modest alcohol reduction in wine, the genetic approach is not well considered in the wine sector dueto a bad association of consumers with genetically modified organisms in food and beverage production.
Other nongenetic approaches consist of: (1) novel yeast selection by interspecific strain hybrids, which limitalcohol production in wine; (2) use of substances able to inhibit enzymes taking part in the glycolytic pathway, or(3) selection of yeasts with a lower ethanol yield (Ozturk and Anli, 2014; Varela et al., 2015).
3.3. Postfermentation TechniquesLow alcohol wines can be produced by applying techniques at the end of the fermentation process, relying onethanol removal from already formed wine. The postfermentation practices are based on thermal or physicalprinciples as shown in Fig. 12.5. As reported by Varela et al. (2015), the best technology for alcohol removalshould fit an effective and precise control of alcohol reduction and a tolerable energy demand and impact oncomposition and sensory attributes of wine.
FIGURE 12.5 Scheme of Postfermentation Techniques for Wine Dealcoholization.
3.3.1. Vacuum distillationTests on wine dealcoholization by vacuum distillation were first performed by Gómez-Plaza et al. (1999). Theydistilled wine under vacuum, at low temperature by means of a continuous flow, recovering both the distillate andthe dealcoholized wine. This latter resulted in low levels of volatile compounds suggesting its use as a base, after

mixing it with wine, for a low ethanol content product. Instead, the distillate could be recovered in terms of ethanoland aroma compounds, which can be added to the final product.
In a more recent paper (Aguera et al., 2010), the vacuum distillation was applied at the fermentation step forremoving 2% (v/v) of ethanol in the future wine. A loss of volatiles was detected, but partly compensated bysynthesis in the second part of fermentation.
In the wine industry, the use of high-vacuum and low-temperature treatments is generally preferred todistillation at atmospheric pressure, which implies processing wine at 100 °C for 20–30 min and produced highdegrading changes of the final product quality.
3.3.2. Spinning cone columnThe progressive development of the vacuum distillation has originated the spinning cone column (SCC). SCC ismade up of a vertical stainless steel column of alternate rotating and stationary cones, through which liquid flowsas a thin film from a stationary cone draining into the base of rotating cone, whence it flowed upward and outwardby means of centrifugal force. Countercurrent to the liquid, stripping steam flows up removing volatile compoundsunder the vacuum. SCC consists of a double stage process, which involves initial aroma removal at vacuumconditions (4 kPa) and low temperature (26°C). Thereafter, the increase in temperature (30°C) allows the removalof ethanol while the aroma fraction is added back to dearomatized wine.
Belisario-Sánchez et al. (2009) dealcoholized red, white, and rosè Spanish wines up to approximately 0.05–0.15% (v/v) by means of SCC. The molecular integrity of the phenolic compounds was preserved and thedealcoholized wine exhibited differences in free-radical scavenging activity and phenolic substances than rawwines probably due to both SO2 removal during distillation and concentration effect via ethanol removal.
It is possible to conclude that SCC is a dealcoholization technique that is minimally destructive with the winephenolic compounds, ensuring low entrainment and low liquid residence time, and with high efficiency. On theother hand, it requires high capital cost for equipment and operating costs and high-volume operations (Margalloet al., 2015).
3.3.3. Solvent supercritical extractionThe solvent supercritical extraction technique is based on the elimination of wine aroma compounds together withethanol by means of supercritical carbon dioxide, which is the most commonly supercritical solvent due to itsadvantageous properties (i.e., low critical temperatures, relatively inexpensive, and easily handled).
As reported by Fornari et al. (2009), the process was applied to different beverages (i.e., cider, excess wine ofpoor quality, concentration of aroma responsible for a brandy flavor) and in particular for producing alcohol-freewine.
In the patent by Seidlitz et al. (1991), the process involved the distillation of ethanol and aroma compounds atlow temperatures (24–28°C) and high vacuum (3.5–5 kPa); the liquid CO2 was fed to the bottom of the column andmoved in a countercurrent mode with respect to the beverage that was pumped on the top. Ethanol–water mixtureand aroma substances were separated by means of partial expansion of CO2 supercritical, which was scrubbedfrom the dearomatized wine. This latter was then enriched with the aroma substances. However, extraction by CO2
supercritical is not commonly used for the dealcoholization of wine. Despite technical feasibility, the high vacuumdistillation system and high capital costs, together with the nonflexible plant are the main drawbacks for itsindustrial application. (Schmidtke et al., 2012).
3.3.4. Membrane processesThe main technologies based on the use of a semipermeable membrane are osmotic distillation, pervaporation, andreverse osmosis. Each of them presents specific membranes, operating conditions, equipment, and costs related tolow-alcohol wine production. All these processes are based on the transfer of solutes from the most concentratedside to the other with a driving force of the process in different phase status.
3.3.4.1. Reverse osmosisReverse osmosis is based on the use of a semipermeable membrane that separates two solutions with differentsolvent concentrations; by applying a pressure higher than osmotic pressure, the solvent moves from the higherconcentrated solution to the other side. The selectivity of membranes for pore size, material, and applied pressure

raises filtration processes different to reverse osmosis (RO), named nanofiltration, ultrafiltration, andmicrofiltration (Schmidtke et al., 2012).
As reported by Catarino et al. (2007), low nominal molecular weight cutoff (<200 Da) allows water and ethanoltransport through the membrane from beverage to the other solution (permeate). The original water content in thedealcoholized wine (retentate) is then restored by adding water (where permitted) or low Brix juice (Schmidtkeet al., 2012) to maintain the concentration of nonpermeable species that are approximately constant, as well as theosmotic pressure, and minimizing the concentration polarization phenomenon (diafiltration mode) (Catarino andMendes, 2011a).
Some other researchers (Gil et al., 2013; Labanda et al., 2009) took RO into account for low-alcohol wineproduction. Labanda et al. (2009) studied ethanol reduction and the permeation of several characteristic aromacompounds of a model white wine by means of two reverse osmosis and one nanofiltration membrane in the batchretentate-recycling mode. They developed a mathematical model for calculating the aroma compoundconcentrations in the retentate and permeate streams as a function of permeate volume. The dealcoholized winewas obtained at 8% (v/v), but it was not evaluated for sensory quality.
The research performed by Gil et al. (2013) focused on red wines (Cabernet Sauvignon, Grenache andCarignan) partially dealcoholized [ethanol reduction about 1% and 2% (v/v)]. Wines were evaluated in terms ofmain chemical characteristics and taste. Some parameters related to wine color and polysaccharides were affectedsignificantly by alcohol reduction, the concentration of flavor compounds was not reported, but a trained panelcould not consistently distinguish between control and reduced alcohol wines.
3.3.4.2. Osmotic distillationIt is an emerging technology with respect to RO, based on the membrane module for beverage dealcoholization.The hydrophobicity of microporous membranes does not permit streams at the two sides of the membrane to be incontact; the transfer of solute (ethanol) from the high concentration side to the other one (where water flows duringthe stripping phase) occurs in vapor phase, under atmospheric pressure and at room temperature, causing nothermal degradation of the volatile components. Hence, the process is named as osmotic distillation (OD),isothermal membrane distillation, and evaporative pertraction. The volatile compounds have lower vapor pressurein alcoholic solutions, and their losses should be restricted; energy savings with respect to RO may arise from theoperating conditions.
Several works were recently published on the OD application for low-alcohol wine production (Diban et al., 2013; Gambuti et al., 2011; Liguori et al., 2013a, 2013b; Lisanti et al., 2013; Varavuth et al., 2009).
Firstly, Varavuth et al. (2009) presented water as a more promising stripper with respect to others [50% (w/w)glycerol, 40% (w/w) CaCl2] for ethanol removal from beverages, because it provided higher ethanol flux and lowercounter transport of water due to water activity differences.
Later, papers were focused on wine characteristics, model solutions, and the development of mathematicalmodels to predict ethanol flux, mass transfer resistances, and aroma losses during dealcoholization.
The base chemical properties of red wine before and after the OD process seemed not be influenced by partialdealcoholization (Gambuti et al., 2011; Liguori et al., 2013a). In fact, Gambuti et al. (2011) investigated theinfluence of partial dealcoholization [alcohol reduction of 2, 3 and 5% (v/v)] on wine phenolics and chromaticcharacteristics of red wines (Merlot, Piedirosso and Aglianico). Wine color remained unaffected despite a loss ofmonomeric anthocyanins probably due to the adsorption on the membrane surface or to the oxidation of winewhen in contact with air during the treatment. The decrease in alcohol levels may affect wine astringency, whichincreased with the dealcoholization level.
Similar results were reported in Liguori et al. (2013a), where a partial [–2% (v/v)] dealcoholization of Aglianicowine did not influence significantly (p < 0.05) the color, total volatile acidity, total polyphenols, and organic acidcontent.
With reference to aroma profile and taste of wine during partial and total dealcoholization by OD, differentdealcoholization tests [alcohol reduction of 2, 3, and 5% (v/v)] on two red wines (Aglianico Vitis vinifera cultivar)highlighted that the dealcoholization of 2% (v/v) minimally affected the sensory properties of wine. Indeed, greatmodifications of aroma intensity for the red fruit attributes—cherry and spicy—together with an increase ofastringency occurred increasing the dealcoholization level (Lisanti et al., 2013).
In fact, deeper dealcoholization levels reaching up to 0.2% (v/v) in Aglianico wine were studied by Liguori et al.(2013b). The results pointed out the sensory profile and aroma intensity, which were likely affected, whereas

phenolic substances, flavonoids, and organic acids remained unchanged after treatment. The aroma compoundsloss increased with the alcohol removal and in the dealcoholized Aglianico wine [0.2% (v/v)] the loss of volatilecompounds was 98% with respect to the starting wine. Similar results were obtained on an industrial OD plant(Liguori et al., 2010).
For partial dealcoholization [2% (v/v)] of red wines (Xarelo, Garnacha and Tempranillo), Diban et al. (2013)suggested optimized conditions for limiting aroma compound loss (not over 20%) working at low flow rates of thestripping phase, high feed to stripping volume ratio and employing acidified water at pH 3 as in the strippingphase. They developed a mathematical model both for the description of the dealcoholization rate as well as therate of aromatic losses that were developed and validated with the experimental data achieved using real wine.
3.3.4.3. PervaporationThe pervaporation technique found application in wine dealcoholization as reported by Takács et al. (2007).
The process consists of the substance (ethanol) permeation through the nonporous membrane, by the change ofphase: from liquid it is desorbing as vapor on the other side, where vacuum is applied. The mechanism ofseparation is driven by the partial pressure difference of the components on the two sides of the membrane. Highertemperatures allowed better membrane separation efficiency, but the separation ability decreased with consequentaroma loss in wine. Furthermore, the technique seemed not to be feasible from an economical point of view forgreat investment cost demand, mainly attributable to the pervaporation membranes.
4. Techniques for Reducing the Alcohol Level in BeerBeer is one of the most popular worldwide beverages for its pleasant taste, low cost, large variety of choices andassociation with convivial moments and friendship meetings. Trends of healthier wellness and dietary style,alongside major safety in the workplace or within the framework of road traffic, prompt brewery toward newproducts with limited alcohol content. Challenge regards organoleptic characteristics, which should makebeverages pleasant. Some techniques for reducing alcohol content in beer find application also in wine, so they arenot further discussed.
4.1. Fermentation ApplicationsThe methods for managing wort fermentation, and hence alcohol content in beer, involve some different strategiesrelated to arresting or limiting the fermentation step acting on yeasts in batch systems or continuous immobilizedsystems.
In a batch system, yeast cells are in a suspended state in the wort during fermentation. It is difficult to controlthe process parameters (i.e., temperature, concentration of dissolved oxygen, etc.) for producing low-alcohol beers.Alternatively, the use of immobilized yeasts offers more efficient results, although different devices are required.In fact, the technique includes an immobilization support and carrier for the yeasts, low temperatures (2–4°C) forlimiting yeasts’ growth and metabolism, and anaerobic conditions for preventing an oxidation phenomenonresponsible of off flavor development. Different techniques for immobilization exist, as reported by Montanariet al. (2009).
The strategy of continuous fermentation has not been widely utilized for various reasons related to equipmentcosts, methods of yeast immobilization and materials. In fact, as reported by Brányik et al. (2012), it is difficult totranslate the traditional batch process into a continuous and immobilized process obtaining a correct balance ofsensory compounds in the final product, choosing process parameters, carrier material, kinds of reactors for theyeast immobilization, and so forth.
The other strategy regards changes in the mashing process in order to manage sugar fermentation for low-alcohol beer production.
4.1.1. Arresting fermentationChanging temperatures or removing yeasts from fermenting wort by centrifugation or filtration can arrest thefermentation activity. Regarding temperature, there are two possibilities: raising or decreasing the temperature.The first procedure is not commonly used due to undesirable heat-induced changes in the beer, as reported inSohrabvandi et al. (2010).

The other possibility is by applying a low temperature (0–1°C) and lengthening fermentation time (named ColdContact Method, CCM) (Brányik et al., 2012; Montanari et al., 2009; Sohrabvandi et al., 2010). In theseconditions, ethanol production is restricted while other biochemical processes related to volatile compoundsformation occur. In fact, yeasts exhibit moderate metabolism such as the production of esters and higher alcoholsand carbonyl reduction, which avoids the formation of worty off flavors (mainly aldehydes that are reduced to thecorresponding alcohol) (Sohrabvandi et al., 2010). The process requires changing temperatures (low and ambienttemperature), adding high yeast cell concentration (>108 cells/mL), pH of wort adjustment at about 4°C (Montanariet al., 2009). The main disadvantages are limited to the removal of branched Strecker aldehydes, which candamage the sensory profile of low-alcohol beer, and a significant alcohol content [about 6% (v/v)] of yeast slurryused for inoculation, as reported by Brányik et al. (2012).
4.1.2. Use of special fermenting yeastsThe strategy based on special yeasts used in the fermentation of wort involves two different approaches: one basedon the selection of specific strains and the other on genetic modifications of brewing yeast.
The selection of specific strains regards mainly Saccharomyces and Saccharomycodes genus. Some strains ofthe genus Saccharomyces are unable to ferment maltose, the major fermentable sugar of wort. The beer that will beproduced has a lower ethanol content due to fermentation of glucose, fructose, and sucrose, but a high residualextract content and a high amount of glycerol and sugar alcohols (Sohrabvandi et al., 2010).
The application of S. rouxii for low-alcohol beer is limited since it requires oxygenation of beer for ethanolconsuming under aerobic conditions by yeast, but at the same time it has negative effects on the flavor andcolloidal stability (Brányik et al., 2012).
The use of S. ludwigii generates better results than the previous ones. Like S. cerevisiae, it is unable to fermentthe main fermentable sugars of malt wort and it produces low-alcohol beer with sweet notes from the high residualmaltose and maltotriose, liveliness and fullness for higher alcohol and ester formation, whereas the defect of wortyoff-flavor is barely perceptible for low aldehyde reduction.
The genetic approach finds obstacles by consumers and, hence, breweries do not risk their industrial application.Nevertheless, for clarity, genetic modifications regard random mutation (followed by the selection of specificmutants) or gene deletion, both regarding citric acid cycle.
Research studies investigating this kind of approach are backdated about a decade ago and more, as reported inBrányik et al. (2012). Selected mutants of S. cerevisiae, lacking 2-ketoglutarate dehydrogenase (KGD) andfumarase (FUM) activity, produce beer with low-alcohol content and volatile compounds (higher alcohol andesters) in lower or higher concentration than original beer. The microbial stability of final beer is conferred bylactic acid production. Also, the gene deletions of KGD and FUM activity or alcohol dehydrogenase free (ADH)negative effect low-alcohol beer; the glycerol content improves the body of beer with an enhanced worty aldehydereduction.
4.1.3. Changes of mashing processThe production of low-alcohol beer can be achieved by modifying the mashing process by means of differentmethods, listed here (Brányik et al., 2012; Sohrabvandi et al., 2010):
• Inactivation of β-amylase enzyme (responsible of fermentable sugars production), which is sensible to ahigher mashing temperature (>75°C).
• Cold water malt extraction obtaining wort with some fermentable sugars resulting from malting.• Reducing the fermentable extract/unfermentable extract ratio adding grains (maize, rice) to barley.• Use of barley varieties with β-amylase deficient.
All these account for some problems in beer such as an unpleasant sweetness and risk of microbialcontamination for extra sugar residue, worty flavor; suggesting the combination with other corrective measures—that is, lowering level of aldehydes, and color and bitterness adjustment for producing alcohol-free beers.
4.2. Postfermentation Techniques

The postfermentation strategies focus on separating alcohol from original beer by thermal or membrane processes.Various methods were applied on a lab and industrial scale, differing in quality of low-alcohol beer andmanagement costs. The techniques include vacuum distillation, thin layer evaporation (one or multiple stages),dialysis, reverse osmosis, and osmotic distillation. The comparison among various techniques on beer properties isreported in Table 12.3.
Table 12.3
Comparison among different postfermentation techniques on beer properties before and afterdealcoholization.
Technique Dialysis Reverse Osmosis Osmotic DistillationVacuum
RectificationThin-Evapo
Reference Zufall andWackerbauer(2000a)
Stein(1993)
Kavanaghet al.(1991)
CatarinoandMendes(2011b)
Liguori et al. (2016) Narzisset al.(1993)
Zurcheret al.(2005)
Zufall andWackerbau(2000b)
Type of beer — — — Pilsner Bitter Weiss Weiss withCO2 instrippingsolutions
— — —
Ethanol –90 — –92 –100 –80 –82 –81 –90 –99 —
Originalextract
–59 — –77 –57 — — — –55 — —
pH +3 — — — –2 0 –2 –1 — —
Color +3 –3 — — +1 +9 +8 +13 — +10
Bitterness –3 –7 –50 — –2 –1 –1 +2 — –8
Total esters –99 –78 –89 n.d. –92 –96 –91 –100 –100 –100
Total alcohols –96 –69 –81 n.d. –53 –75 –61 –78 –78 –95
4.2.1. Vacuum distillationDistillation at atmospheric pressure was completely outdated by vacuum distillation (4–20 kPa at 30–60°C)limiting such significant damages to beer by high temperatures and time exposure, in terms of color, sugarcaramelization, and aroma depletion. Modern continuous vacuum distillation equipment consists of a plate heatexchanger, degasser, vacuum column, cooler: beer is preheated, volatile compounds and CO2 are stripped in avacuum degasser and ethanol is distilled under vacuum at 42–46°C. Then, flavor compounds are added back tobeer, which has been previously cooled, and ethanol is concentrated in a rectification system and recovered forsale. The reconstitution of beer flavor is necessary since volatile depletion occurs in low or high amounts, asshown by Narziss et al. (1993), sometimes also adding water and CO2. Another way is to blend low alcohol andoriginal beer (Montanari et al., 2009).
Since the quality of separation depends on vapor-liquid equilibrium phases, on time as a function of beer amountin the exchange, thin layer evaporators are preferred (Montanari et al., 2009).
4.2.2. Thin layer evaporationThin layer evaporators work under vacuum and use steam as a heating medium allowing efficient ethanol removalfrom beverages, since it flows in a thin layer and on a wide surface, minimizing residence time. The mainevaporation systems are centrifugal or falling film.
The former are Centritherm and SCC systems; the falling film evaporators can be used in single or multiple (2–3) stages (Brányik et al., 2012; Montanari et al., 2009).
The Centritherm system is a single-effect, centrifugal evaporator, similar to a plate centrifuge designed with 1–12 hollow cones, within each of them the vapors of ethanol and volatiles compounds are collected in an exhaustpipe, which collects in a condenser chamber. The system works with minimal thermal impact on beer for ethanol

removal due to short residence time (not over than 30 s) and low operating temperatures ranging from 35 to 60°C,although oxygenation of beer may occur in the moving system, as reported by Montanari et al. (2009).
The SCC, constituted by alternating fixed and rotating cones, is similar to Centritherm system for steam, whichflows upward in the column and collects volatiles compounds and ethanol from a thin layer of beer. Othersimilarities are operating conditions (under vacuum and low temperature) and short residence time [in about 20 sbeer is reduced at 0.03% (v/v) in a single pass] (Brányik et al., 2012).
The falling film evaporator may be preferred to the centrifugal ones for its simple construction, and greatefficiency, ease of cleaning, lack of moving parts, and cheaper investment and costs; the residence time ofbeverage to be dealcoholized is a few seconds. In the evaporator’s head, a device spreads beer in all heating tubes;beer and vapor flow co-currently downward with a gradually improved contact since the beer layer becomesthinner and vapor mass increases; at the end a condenser permits ethanol recovery. As reported in Montanari et al.(2009), the dealcoholized beer has slightly more color, less organic acids, hop-bittering, and volatile substances.
It is possible to use one or multistage evaporators. An optimization system may be set up, using the vapor fromthe first evaporator as a heating steam for the second one, and the alcohol-containing vapor as heating steam of thethird one. The main disadvantage of the multistage evaporator is the relatively high temperature of the firstevaporator (60°C), which can raise some thermal impacts on beer with respect to lower temperatures of the otherevaporators (Montanari et al., 2009).
4.2.3. Membrane processesMembrane processes are declared mild technologies in beverages sector and employ a semipermeable membranefor small molecules (i.e., ethanol) for beverages dealcoholization. They are: dialysis, reverse osmosis, osmoticdistillation, pervaporation, and membrane distillation. The operating conditions differ from one process to theother for type of membrane, temperature and pressure.
4.2.3.1. DialysisA semipermeable membrane separates beer and dialysate (aqueous solution), which flow in countercurrent; a transmembrane pressure difference (10–60 kPa) is applied at the membrane sides in order to limit water transfer fromdialysate to beer. The set pressure may allow molecule transfer into dialysate depending on the pore size andsurface properties of membrane. Other operating parameters are refrigerated temperatures (1–6°C), carbonateddialysate and pressure value equal to that of CO2 saturation of original beer in order to limiting thermal damages,oxygenation, and CO2 loss in beer, although some volatiles (i.e., higher alcohols, esters) are removed. In fact,results reported by Brányik et al. (2012) and Montanari et al. (2009) regarding studies on beer dealcoholization bymeans of this technique highlighted how increasing the ratio of dialysate to beer flow causes major loss of alcoholand volatiles, involving also higher energy costs for rectification of dialysate.
4.2.3.2. PervaporationThe pervaporation technique was employed in aroma compounds recovery in food applications: beer (Catarino andMendes, 2011b) and other beverages (i.e., fruit juices) as reported by del Olmo et al. (2014). In dealcoholizationprocesses of beverages by means of this technique, low temperatures are essential when sensitive aromacompounds are separated. In pervaporation, the energy consumption is normally lower than other conventionalseparation processes such as steam distillation, liquid solvent extraction, and vacuum distillation.
Catarino and Mendes (2011b) produced low-alcohol beer by combined techniques and using industrial plant.The volatile compounds were recovered by pervaporation unit, whereas SCC was used for ethanol removal.Several pervaporation experiments were performed to assess the influence of the feed temperature and flow rate onthe aroma compounds extraction. The low-alcohol beer was blended with aroma compounds and a fraction oforiginal beer without overcoming the ethanol concentration limit of 0.5% (v/v).
del Olmo et al. (2014) pervaporated two different beers and elaborated a model of solubility for polymer andspecies in the solution in order to define the selectivity of membrane towards some species.
4.2.3.3. Membrane distillationThis technique involves the use of a membrane coupled to temperature and vacuum pressure. Purwasasmita et al.(2015) investigated a nonporous membrane for beer dealcoholization, applying feed pressure and vacuumcondition on the permeate side in order to have ethanol transfer and permeate condensation in a chiller system. The

nonporous membrane distillation is a similar process to pervaporation and the selectivity is determined bymembrane characteristics and operating conditions, suitable for component separation. In fact, the combination offeed pressure and vacuum pressure may be adjusted appropriately by limiting excess water transfer alongsideethanol, because the increase on both pressures cause an increase in membrane permeability.
In the study performed by Purwasasmita et al. (2015), low-alcohol beer at 2.45% (v/v) was produced in a 6 hprocess; maltose and glycerol as nutritive and flavoring components were evaluated in beer, and theirconcentration in beer was almost the same as in the original product, however, other components and sensoryanalysis were not evaluated.
4.2.3.4. Reverse osmosisReverse osmosis has been used also for beer dealcoholization (Catarino et al., 2007; Catarino and Mendes, 2011b).
In Catarino and Mendes’ paper on dealcoholized beer by RO, the most critical operating conditions wereanalysed. Higher transmembrane pressures resulted in a higher permeate flux, higher rejection of ethanol andhigher alcohols, while esters went in the permeate. Otherwise, lowering the process temperature, permeate fluxwas lower, but volatile compounds were preserved in retentate (Catarino et al., 2007). Sometimes, in RO, thediafiltration mode is applied, which consists of replacing permeates with demineralized water and furtherincreasing the flux of solute across the membrane retentate (Catarino et al., 2007).
4.2.3.5. Osmotic distillationThe osmotic distillation, successfully applied for wine dealcoholization, has also been used for low-alcohol beerproduction in several papers (De Francesco et al., 2014; Liguori et al., 2015a,b, 2016; Russo et al., 2013a,b).
The process efficiently extracts ethanol from one enriched solution to another with no or less ethanol. Smallmolecules can pass through the membrane, and this transfer can be minimized using stripping solutions similar tothe beer. In fact, limiting the pressure gradient of these components between beer and stripping solution, theirdiffusion from one side to the other is prevented. Applying pure water as a stripper, carbon dioxide loss andoxygenation of beer can rise during the process, which adversely affect flavor attributes of beer. In Liguori et al.(2015a), the stripping solutions were obtained by diluting beer and were carbonated (up to saturation atatmospheric pressure) to reduce oxygenation, volatile compounds, and CO2 loss. The results highlighted a lowerpermeation of aldehydes and ketones in stripper with respect to those previously obtained (Russo et al., 2013b),using water as the stripper; the carbonation of the stripper and then of the beer before bottling allowed a lower CO2
loss in beer (Liguori et al., 2016; Table 12.3).Moreover, the possibility of decreasing the environmental impact of the process, minimizing the loss of volatile
compounds, and reducing the water consumption was considered (Liguori et al., 2015b). To this aim, permeatesolutions recycled by a preliminary dealcoholization process were used as the stripping agents, which allowed asignificant cost reduction.
5. Sensory Properties and Low-alcohol Beverage ImprovementsThe tasting quality of beverage may be strictly related to its composition (i.e., raw materials, production,marketing) and other features such as pleasure, appearance, aroma, and flavor.
When we drink a beverage, taste is characterized by different perceptions that occur to the taste organs, shortlyfollowing one after the other, and the overall impression is a mixture of first and final taste and should be wellbalanced.
Alcohol activates olfactory, taste, and chemesthetic receptors, and each input is carried centrally by differentnerves and evokes a perception, which plays an important role in its acceptance or rejection of a beverage. Humanalcohol perception is a combination of sweet and bitter tastes and oral irritation (burning sensation), also varyingas function of alcohol concentration (Jordão et al., 2015).
Wine is a complex mixture of compounds (i.e., ethanol, carbon dioxide, glycerol, aroma, etc.) that interactamong them and influence perception and a wine’s sensory quality (Pretorius, 2000). Ethanol has a strong impacton a wine, affecting acidity, astringency, and sweetness; it influences flavor intensity, enhances aroma compoundsvolatility, and induces textural properties such as palate warmth (Nascimento Moreira, 2015).

Alternatively, beer acceptability and drinkability is strongly influenced by an overall set of attributes regardingflavor and taste: ethanol, aroma, bitterness, foam stability, CO2, color, and usually the absence of haze; allcontribute to the enjoyment and pleasure of drinking a glass of beer (Blanco et al., 2016; Briggs et al., 2004).
Since ethanol enhances beverage’s sensory properties, its reduction may affect the taste resulting the finalproduct not as good as that of alcoholic beverage.
Regarding wine, some studies (Lisanti et al., 2013; Meillon et al., 2010a) have shown an alcohol reduction of2% (v/v), which slightly affects wine’s sensory profile, whereas greater alcohol removal increased the intensity ofastringency, bitterness, and acidity. Moreover, a decrease in the perception of hotness, bitterness, aromas, andpersistency in the mouth was observed, affecting the perception of wine complexity (Jordão et al., 2015;Pickering, 2000).
Regarding low-alcohol beer, some sensory defects occur. For example, worty flavor rises due to the presence ofcompounds (i.e., acetaldehyde, vicinal diketones, and diacetyl) produced by limited fermentation. The artificialand flat flavor comes from the inappropriate body and foaming properties, and the low aromatic profile of low-alcohol beer. In fact, ethanol enhances foam stabilization and affects the beverage’s preservation, which could bemore prone to microbial contamination resulting in off flavors such as rotten egg, cooked cabbage, vinegary, andso forth (Sohrabvandi et al., 2010).
Hence, low-alcohol beverage tastes result from some features changes:
• Altered volatility interaction and aroma compound concentration.• An increase or decrease of some descriptors (acidity, astringency, sweetness, body, and hotness).• Change of mouth-feel characteristics.• Consumer resistance.
Regarding the latter, low-alcohol beverages are usually considered lacking in body and flavor. Therefore, someconsumers do not accept the idea of low-alcohol wines, either by invoking a lack of gustative quality incomparison to traditional wines or by invoking interference with traditional winemaking (Meillon et al., 2010b;Pickering, 2000; Schmidtke et al., 2012).
Some low-alcohol beverage improvements are necessary regardless of which technique is applied for theirproduction. In fact, all dealcoholization technologies lead to significant losses of volatiles, although minimal lossesoccur when membrane processes are used.
One strategy consists of the addition of grape juice or original beer (also an aromatic beer) to low-alcohol wineor beer, respectively. In the case of the limited fermentation of beer, the addition of fresh yeast or krausen followedby maturation may also be employed (Brányik et al., 2012).
Another strategy includes recovering the volatile compounds from the stripper solution after thedealcoholization process (i.e., osmotic distillation) and their restoration into low-alcohol beverages (i.e.,pervaporation unit) (Fig. 12.6). Using the membrane process with stripping solutions made by dilution of the samebeverage, resulting in enrichment in volatile compounds and CO2, may represent an alternative to theaforementioned strategies in order to hinder the volatile compounds’ loss in the beverage during ethanol removal(Liguori et al., 2016).

FIGURE 12.6 Scheme of Combined Osmotic Distillation and Pervaporation Process.
Finally, stabilization by microbial filtration and highly controlled packaging conditions can assure low-alcoholbeverage marketing alongside labeling and promoting healthy features related to these types of drinks, whichpreserve their beneficial compounds.
Increased information and media publicity about health and well being, along with increased pressure fromdrunk-driving campaigns and healthier lifestyles can change consumption habits toward light products.
Studies on consumer acceptability and a preference for low-alcohol wines (Meillon et al., 2010b; Stasiet al., 2014) showed their aversion. In particular, an opposed attitude emerged: French consumers enjoyed thesensory properties of reduced-alcohol wines, whereas wine professionals disliked them compared to less hot,sweet, persistent, and balanced wines. Once information about alcohol reduction was given, consumer sentimentschanged in a negative or positive effect about the information, depending on individual consumer beliefs (Meillonet al., 2010b). As reported by Stasi et al. (2014), Italian consumer preferences were positively influenced by awine’s alcohol content, whereas dealcoholization was disliked.
Results highlight that the context of consumption should be taken into account, and young people or neophytesof the wine world could be the main new consumers who are willing to try and appreciate this new product.
6. Conclusions and Future TrendsAn emerging trend and interest of consumers toward products with healthy features in terms of lower caloriecontent, less alcohol, and positive effects through antioxidants and nutraceutical ingestion was observed. Thesetrends have been largely responsible for increased interest from producers and researchers in low-alcohol beveragealternatives.
Several techniques for producing low-alcohol beverages have been developed in recent years. The mostimportant factors influencing the selection of the technique are related to capital costs and product quality; highequipment costs without neglecting environmental impact, nonflexible plant, and significant quality loss of low-alcohol beverages represent the main drawbacks of implementing any adequate technique. The possibility ofcombining some of the strategies and the valorization of the “waste” during a process may provide a goodalternative for balancing production costs and the sensory profile of beverages with a lower alcohol content.
Moreover, the advantages related to low-alcohol beverage consumption are varied and relate to both producersand consumers. The first may be advantageous in terms of expanding in more beverage market segments—forexample, exportation and distribution in countries where alcoholic beverage sales are restricted or forbidden forreligious reasons. About by-products of dealcoholization processes, alcohol represents an additional revenue by

itself on a market; also water-waste can be reused in the same beverage production or as a base for other softdrinks.
From the consumer’s point of view, low-alcohol beverages may widen the marketing of functional beveragesand satisfy the needs of differently targeted people such as younger folks, people with weight problems, those whomisuse alcohol, for religious problems—those who like the taste of beer and wine, but not the alcoholic content.
Last, but not the least, everyone who is willing to try a dealcoholized version of a wine or beer can beencouraged to drink these low-alcohol alternatives even if a certain discount is applied. Hence, the driving forcefor developing this type of product should avoid any considerations on profitability in the early stages of a productlaunch, hoping for an increase and surge in sales.
ReferencesAguera E, Bes M, Roy A, Camarasa C, Sablayrolles JM. Partial removal of ethanol during fermentation to obtain reduced-alcohol wines. Am. J. Enol.
Viticult.. 2010;61:53–60.Alkhatib A. As good as it gets: low/non-alcoholic beer in mature markets. Euromonitor. 2013; http://blog.euromonitor.com/2013/11/as-good-as-it-gets-
lownon-alcoholic-beer-in-mature-markets.html.Alston JM, Fuller KB, Lapsley JT, Soleas G, Tumber KP. Splendide mendax: false label claims about high and rising alcohol content of wine. J. Wine
Econ.. 2015;10(3):275–313.Balda P, Martínez de Toda F. Decreasing the alcohol level and pH in wines by the “double harvest” technique. Ciência e Técnica Vitivinícola. 2013;
899–903: Proceedings 18th International GiESCO Symposium.Bamforth C. Beer - Tap into the Art and Science of Brewing. 2nd ed Oxford, United Kingdom: Oxford University Press; 2003.Bamforth CW. Beer Health and Nutrition. Oxford, United Kingdom: Blackwell Science Ltd.; 2004.Belisario-Sánchez YY, Taboada-Rodríguez A, Marín-Iniesta F, López-Gómez A. Dealcoholized wines by spinning cone column distillation: phenolic
compounds and antioxidant activity measured by the 1,1-diphenyl-2-picrylhydrazyl method. J. Agric. Food Chem.. 2009;57(15):6770–6778.Bindon K, Varela C, Kennedy J, Holt H, Herderich M. Relationships between harvest time and wine composition in Vitis vinifera L. cv. Cabernet
Sauvignon 1. Grape and wine chemistry. Food Chem.. 2013;138:1696–1705.Bindon K, Holt H, Williamson PO, Varela C, Herderich M, Francis IL. Relationships between harvest time and wine composition in Vitis vinifera L. cv.
Cabernet Sauvignon 2. Wine sensory properties and consumer preference. Food Chem.. 2014;154:90–101.Biyela BNE, du Toit WJ, Divol B, Malherbe DF, van Rensburg P. The production of reduced-alcohol wines using Gluzyme Mono 10.000 BG-treated
grape juice. S. Afr. J. Enol. Vitic.. 2009;30:124–132.Blanco CA, Andrés-Iglesias C, Montero O. Low alcohol beers: Flavour compounds, defects and improvement strategies. Crit. Rev. Food Sci. Nutr..
2016;56(8):1379–1388.Bottcher C, Harvey K, Forde CG, Boss PK, Davies C. Auxin treatment of pre-veraison grape (Vitis vinifera L) berries both delays ripening and increases
the synchronicity of sugar accumulation. Aust. J. Grape Wine Res.. 2011;17:1–8.Brányik T, Silva DP, Baszczyňski M, Lehnert R, Almeida e Silva JB. A review of methods of low alcohol and alcohol-free beer production. J. Food
Eng.. 2012;108(4):493–506.Briggs DE, Boulton CA, Brookes PA, Stevens R. Brewing Science and Practice. Cambridge, United Kingdom: Woodhead Publishing; 2004.Catarino M, Mendes A, Madeira LM. Alcohol removal from beer by reverse osmosis. Sep. Sci. Technol.. 2007;42:3011–3027.Catarino M, Mendes A. Dealcoholizing wine by membrane separation processes. Innov. Food Sci. Emerg.Technol.. 2011;12:330–337.Catarino M, Mendes A. Non-alcoholic beer—a new industrial process. Sep. Purif. Technol.. 2011;79(3):342–351.Commission Regulation, (EC) No. 606/2009 of 10 July 2009 laying down certain detailed rules for implementing Council Regulation (EC) No. 479/2008
as regards the categories of grapevine products, oenological practices and the applicable restrictions. Offi. J. Eur. Union, L 193/59.Conibear, H., 2010. European drinking trends—the way we drink now. Available from: http://www.aim-
digest.com/digest/members%20%20yr/thewaywedrink.pdfover%.Contreras A, Curtin C, Varela C. Yeast population dynamics reveal a potential “collaboration” between Metschnikowia pulcherrima and Saccharomyces
uvarum for the production of reduced alcohol wines during Shiraz fermentation. Appl. Microbiol. Biotechnol.. 2015;99(4):1885–1895.Corbet-Milward J, Loftus S. When is a wine not a wine? Bringing a low alcohol product to market. Presentation at OIV meeting. 2011.Council Regulation (EC) No. 479/2008 of April 29, 2008 on the common organisation of the market in wine, amending Regulations (EC) No.
1493/1999, (EC) No. 1782/2003, (EC) No. 1290/2005, (EC) No. 3/2008 and repealing Regulations (EEC) No. 2392/86 and (EC) No. 1493/1999.De Francesco G, Freeman G, Lee E, Marconi O, Perretti G. Effects of operating conditions during low-alcohol beer production by osmotic distillation. J.
Agric. Food Chem.. 2014;62(14):3279–3286.del Olmo A, Blanco CA, Palacio L, Prádanos P, Hernández A. Pervaporation methodology for improving alcohol-free beer quality through aroma
recovery. J. Food Eng.. 2014;133:1–8.Diban N, Arruti A, Barcelo A, Puxeu M, Urtiaga A, Ortiz I. Membrane dealcoholization of different wine varieties reducing aroma losses: modeling and
experimental validation. Innov. Food Sci. Emerg. Technol.. 2013;20:259–268.Filippetti I, Movahed N, Allegro G, Valentini G, Pastore C, Colucci E, Intrieri C. Effect of post-veraison source limitation on the accumulation of sugar,
anthocyanins and seed tannins in Vitis vinifera cv Sangiovese berries. Aust. J. Grape Wine Res.. 2015;21:90–100.Fornari T, Hernández EJ, Ruiz-Rodriguez A, Seňorans FJ, Reglero G. Phase equilibria for the removal of ethanol from alcoholic beverages using
supercritical carbon dioxide. J. Supercrit. Fluids. 2009;50:91–96.Fsanz, 2011. Application A1026—Minimum alcohol content for wine assessment report. Food Standards Australia New Zealand.Gambuti A, Rinaldi A, Lisanti MT, Pessina R, Moio L. Partial dealcoholisation of red wines by membrane contactor technique: influence on colour,
phenolic compounds and saliva precipitation index. Eur. Food Res. Technol.. 2011;233:647–655.

Garcia-Martin N, Perez-Magarino S, Ortega-Heras M, Gonzalez-Huerta C, Mihnea M, Gonzalez-Sanjose ML, Palacio L, Pradanos P, Hernandez A.Sugar reduction in musts with nanofiltration membranes to obtain low alcohol-content wines. Sep. Purif. Technol.. 2010;76:158–170.
Gil M, Estevez S, Kontoudakis N, Fort F, Canals JM, Zamora F. Influence of partial dealcoholization by reverse osmosis on red wine composition andsensory characteristics. Eur. Food Res. Technol.. 2013;237:481–488.
Global Health Observatory (GHO), 2016. Available From: http://www.who.int/gho/alcohol/en/.Gómez-Plaza E, López-Nicolás JM, López-Roca JM, Martinez-Cutillas A. Dealcoholization of wine behaviour of the aroma components during the
process. Lebensm. Wissens. Technol.. 1999;32:384–386.Guilford JM, Pezzuto JM. Wine and health: a review. Am. J. Enol. Vitic.. 2011;62:4.Harbertson JF, Mireles MS, Harwood ED, Weller KM, Ross CF. Chemical and sensory effects of saignee, water addition, and extended maceration on
high Brix must. Am. J. Enol. Vitic.. 2009;60:450–460.Heymann H, LiCalzi M, Conversano MR, Bauer A, Skogerson K, Matthews M. Effects of extended grape ripening with or without must and wine
alcohol manipulations on Cabernet Sauvignon wine sensory characteristics. S. Afr. J. Enol. Vitic.. 2013;34:86–99.International code of Oenological Practices, 2016. International Organisation of Vine and Wine, Paris, France.Jordão AM, Vilela A, Cosme F. From sugar of grape to alcohol of wine: sensorial impact of alcohol in wine. Beverages. 2015;1:292–310.Kavanagh TE, Clarke BJ, Gee PS, Miles M, Nicholson BN. Volatile flavor compounds in low alcohol beers. Tech. Q. Master Brew Assoc. Am..
1991;28(3):111–118.Kontoudakis N, Esteruelas M, Fort F, Canals JM, Zamora F. Use of unripe grapes harvested during cluster thinning as a method for reducing alcohol
content and pH of wine. Aust. J. Grape Wine Res.. 2011;17:230–238.Labanda J, Vichi S, Llorens J, Lopez-Tamames E. Membrane separation technology for the reduction of alcoholic degree of a white model wine. Food
Sci. Technol.. 2009;42:1390–1395.Liguori L, Attanasio G, Albanese D, Di Matteo M. Aglianico wine dealcoholization tests. Computer Aided Chem. Eng.. 2010;28:325–330.Liguori L, Russo P, Albanese D, Di Matteo M. Effect of process parameters on partial dealcoholization of wine by osmotic distillation. Food Bioprocess
Technol.. 2013;6(9):2514–2524.Liguori L, Russo P, Albanese D, Di Matteo M. Evolution of quality parameters during red wine dealcoholization by osmotic distillation. Food Chem..
2013;140(1–2):68–75.Liguori L, De Francesco G, Russo P, Albanese D, Perretti G, Di Matteo M. Quality improvement of low craft beer produced by evaporative pertraction.
Chem. Eng. Trans.. 2015;43:13–18.Liguori L, De Francesco G, Russo P, Perretti G, Albanese D, Di Matteo M. Production and characterization of alcohol-free beer by membrane process.
Food Bioprod. Process. 2015;94(1):158–168.Liguori L, De Francesco G, Russo P, Perretti G, Albanese D, Di Matteo M. Quality attributes of low-alcohol top-fermented beers produced by membrane
contactor. Food Bioprocess Technol.. 2016;9(1):191–200.Lisanti MT, Gambuti A, Genovese A, Piombino P, Moio L. Partial dealcoholization of red wines by membrane contactor technique: Effect on sensory
characteristics and volatile composition. Food Bioprocess Technol.. 2013;6(9):2289–2305.Loira I, Morata A, Comuzzo P, Callejo MJ, González C, Calderón F, Suárez-Lepe JA. Use of Schizosaccharomyces pombe and Torulaspora delbrueckii
strains in mixed and sequential fermentations to improve red wine sensory quality. Food Res. Int.. 2015;76:325–333.Margallo M, Aldaco R, Barceló A, Diban N, Ortiz I, Irabien A. Life cycle assessment of technologies for partial dealcoholisation of wines. Sustain.
Product. Consump.. 2015;2:29–39.Martinez de Toda F, Sancha JC, Balda P. Reducing the sugar and pH of the grape Vitis vinifera L. cvs “Grenache” and “Tempranillo” through a single
shoot trimming. S. Afr. J. Enol. Vitic.. 2013;34:246–251.McDonnell, C., 2011. The effect of crop load and extended ripening on wine quality and vine balance in Vitis vinifera cv Cabernet Sauvignon. PhD
thesis, University of Adelaide, Adelaide, Australia.Meillon S, Viala D, Medel M, Urbano C, Guillo G, Schlich P. Impact of partial alcohol reduction in Syrah wine on perceived complexity and temporality
of sensations and link with preference. Food Qual. Prefer.. 2010;21:732–740.Meillon S, Dugas V, Urbano C, Schlich P. Preference and acceptability of partially dealcoholized white and red wines by consumers and professionals.
Am. J. Enol. Vitic.. 2010;61:1.Mendez-Costabel, M., 2007. Impact of irrigation levels during the latter stages of fruit ripening on the yield components, physiology and berry and wine
composition of Vitis vinifera L. MS thesis, University of California, Davis, CA, United States.Mihnea M, González-SanJosé ML, Ortega-Heras M, Pérez-Magariño S, García-Martin S, Palacio NL, Prádanos P, Hernández A. Impact of must sugar
reduction by membrane applications on volatile composition of Verdejo wines. J. Agric. Food Chem.. 2012;60:7050–7063.Mintel, 2016. Available from: http://reports.mintel.com.Montanari L, Marconi O, Mayer H, Fantozzi P. Production of alcohol-free beer. In: Preedy VR, ed. Beer in Health and Disease Prevention. Cambridge,
MA, United States: Acdemic Press; 2009:61–75.Narziss L, Back W, Stich S. Alcohol removal from beer by countercurrent distillation in combination with rectification. Brauwelt Int..
1993;133(38):1806–1820.Nascimento Moreira, C., 2015. Light Wine—Technological and Legal Aspects of Alcohol Reduced Wine. Master's thesis in Viticulture and Winemaking.
Available from: https://www.repository.utl.pt/bitstream/10400.5/11041/1/Tese_CM2015.pdf.Rehn N, Room R, Edwards G. Alcohol in the European Region – Consumption Harm and Policies. Copenhagen, Denmark: World Health Organization
Regional Office for Europe; 2001.NutrientsReview, 2016. Alcoholic beverages: beers, wines, spirits, liqueurs. Available from: http://www.nutrientsreview.com/alcohol/alcoholic-
beverages-abv-calories.html.Ozturk B, Anli E. Different techniques for reducing alcohol levels in wine: a review. Bio. Web Conf.. 2014;3.Palliotti A, Poni S, Berrios JG, Bernizzoni F. Vine performance and grape composition as affected by early-season source limitation induced with
antitranspirants in two red Vitis Vinifera L. cultivars. Austr. J. Grape Wine Res.. 2010;16:426–433.

Palliotti A, Silvestroni O, Leoni F, Cini R, Poni S. Effect of late mechanized leaf removal to delay grape ripening on Sangiovese vines. Acta Hort..2013;978:301–307.
Palliotti A, Panara F, Silvestroni O, Lanari V, Sabbatini P, Howell GS, Gatti M, Poni S. Influence of mechanical postveraison leaf removal apical to thecluster zone on delay of fruit ripening in Sangiovese (Vitis vinifera L) grapevines. Aust. J. Grape Wine Res.. 2013;19:369–377.
Pickering GJ. Low- and reduced-alcohol wine: a review. J. Wine Res.. 2000;11(2):29–144.Poni S, Gatti M, Bernizzoni F, Civardi S, Bobeica N, Magnanini E, Palliotti A. Late leaf removal aimed at delaying ripening in cv Sangiovese:
physiological assessment and vine performance. Aust. J. Grape Wine Res.. 2013;19:378–387.Pretorius IS. Tailoring wine yeast for the new millennium: novel approaches to the ancient art of winemaking. Yeast. 2000;16:675–729.Purwasasmita M, Kurnia D, Mandias FC, Khoiruddin, Wenten IG. Beer dealcoholization using non-porousmembrane distillation. Food Bioprod. Process.
2015;94:180–186.Resolution OIV-OENO 373B/2010. Application of membrane techniques. Oenology Resolutions. International Organisation of Vine and Wine, Paris,
France.Resolution OIV-ECO 432-2012. Beverage obtained by dealcoholisation of wine. In: International Code of Oenological Practices, 2016. Chapter 6, Part I.
International Organisation of Vine and Wine, Paris, France.Resolution OIV-ECO 433-2012. Beverage obtained by partial dealcoholisation of wine. In: International Code of Oenological Practices, 2016. Chapter 6,
Part I. International Organisation of Vine and Wine, Paris, France.Resolution OIV-OENO 394A-2012. Dealcoholisation of wines. In: International Code of Oenological Practices, Chapter 3, Part I, par. 3.5.16.Resolution OIV-OENO 394B-2012. Correction of the alcohol content in wines. In: International Code of Oenological Practices, Chapter 3, Part II, par.
3.5.13.Russo P, Liguori L, Albanese D, Crescitelli A, Di Matteo M. Investigation of osmotic distillation technique for beer dealcoholization. Chem. Eng. Trans..
2013;32:1735–1740.Russo P, Liguori L, Albanese D, Crescitelli A, De Francesco G, Perretti G, Di Matteo M. Investigation of osmotic distillation technique for beer
dealcoholization. AIDIC Conf. Series. 2013;11:311–320.Salamon, A., 2006. Techniques to achieve moderate alcohol levels in South African wine. Assignment submitted in partial requirement for the Cape
Wine Master Diploma.Salgado MC, Fernández-Fernández E, Palacio L, Hernández A, Prádanos P. Alcohol reduction in red and white wines by nanofiltration of musts before
fermentation. Food Bioprod. Process.. 2015;96:285–295.Sanchez, L.A., Mendez, M.P., Dokoozlian, N., 2006. Irrigation levels during the latter stages of ripening influence vine yield components and physiology
but have little impact on fruit and wine composition in Merlot (Vitis vinifera L.) grapevines. Proceedings of the 15th International GiESCOSymposium; June 20–23, pp.758–766.
Schmidtke LM, Blackman JW, Agboola SO. Production technologies for reduced alcoholic wines. J. Food Sci.. 2012;71(1):25–41.Seidlitz, H., Lack., E., Lackner, H., 1991. Process for the reduction of the alcohol content of alcoholic beverages. United States Patent, no. 5034238.Sohrabvandi S, Mousavi S, Razavi S, Mortazavian A, Rezaei K. Alcohol-free beer: methods of production, sensorial defects and healthful effects. Food
Rev. Int.. 2010;26(4):335–352.Stasi A, Bimbo F, Viscecchia R, Seccia A. Italian consumers’ preferences regarding dealcoholized wine, information and price. Wine Econ. Policy.
2014;3:54–61.Stein W. Dealcoholization of beer. Tech. Q. Master Brew. Assoc. Am.. 1993;30(2):54–57.Stoll M, Scheidweiler M, Lafontaine M, Schultz HR. Possibilities to reduce the velocity of berry maturation through various leaf area to fruit ratio
modifications in Vitis vinifera L Riesling. Progres Agricole Viticole. 2010;7(3):68–71.Sun SY, Gong HS, Jiang XM, Zhao YP. Selected non-Saccharomyces wine yeasts in controlled multistarter fermentations with Saccharomyces
cerevisiae on alcoholic fermentation behaviour and wine aroma of cherry wines. Food Microbiol.. 2014;44:15–23.Takács L, Vataia G, Korány K. Production of alcohol free wine by pervaporation. J. Food Eng.. 2007;78:118–125.Tittmann S, Stöber V, Bischoff-Schaefer M, Stoll M. Application of anti-transpirant under greenhouse conditions of grapevines (Vitis vinifera cv.
Riesling and cv. Müller-Thurgau) reduce photosynthesis. Ciência e Técnica Vitivinícola. 2013;28:276–282: Proceedings 18th InternationalSymposium GiESCO, Porto, 7-11 July.
Varavuth S, Jiraratananon R, Atchariyawut S. Experimental study on dealcoholization of wine by osmotic distillation process. Sep. Purif. Technol..2009;66:313–321.
Varela C, Dry PR, Kutyna1 DR, Francis IL, Henschke PA, Curtin CD, Chambers PJ. Strategies for reducing alcohol concentration in wine. Aust. J.Grape Wine Res.. 2015;21:670–679.
Varela C, Sengler F, Solomon M, Curtin C. Volatile flavour profile of reduced alcohol wines fermented with the non-conventional yeast speciesMetschnikowia pulcherrima and Saccharomyces uvarum. Food Chem.. 2016;209:57–64.
Whiting J. Regulating winegrape sugar accumulation through leaf removal. Aust. New Zeal. Grapegrower Winemaker. 2010;555:18–20.World Health Organization (WHO), 2010. Global strategy to reduce the harmful use of alcohol. Available from:
http://www.who.int/substance_abuse/activities/gsrhua/en/.World Health Organization (WHO), 2014. Global Status Report on Alcohol and Health. WHO, Geneva, Switzerland.YouGov Omnibus Panel, 2011 (August). WDR analysis. Base size: 1,693 British adult drinkers.Zufall C, Wackerbauer K. The dealcoholization of beer bydialysis—influencing beer quality by process engineering (written in German). Monatsschr.
Brauwiss.. 2000;53(9/10):164–179.Zufall C, Wackerbauer K. Process engineering parameters for the dealcoholization of beer by means offalling film evaporation and its influence on beer
quality (written in German). Monatsschr. Brauwiss.. 2000;53(7/8):124–137.Zurcher A, Jakob M, Back W. In: Proceedings of the 30th EBC Congress; 2005Prague, Czech Republic. 240–248.
Further Reading

García-Martín N, Palacio L, Prádanos P, Hernández A, Ortega-Heras M, Pérez-Magarino S, González-Huerta DC. Evaluation of several ultra- andnanofiltration membranes for sugar control in winemaking. Desalin. 2009;245:554–558.
World Health Organization (WHO), 2013. Status Report on Alcohol and Health in 35 European Countries. WHO Regional Office for Europe,Copenhagen, Denmark.

C H A P T E R 1 3
Dielectric Defrosting of Frozen FoodsYvan Llave
Noboru Sakai Tokyo University of Marine Science and Technology, Tokyo, Japan
AbstractNovel defrosting methods, such as dielectric heating [microwave (MW) and radio frequency (RF)] havebeen developed and recently used in domestic and industrial applications due to their volumetric heatingcapability, which has outstanding properties for food-quality preservation. In spite of the extensive use ofthese methods, nonuniform temperature distributions are frequently reported during dielectric defrosting;this problem causes microbial proliferation, increased drip losses, and color changes. This chapter is acompilation of recently published data on MW and RF defrosting including the dielectric properties (DPs)of frozen foods and frozen-food models in the MW and RF bands, the recent mathematical modelsdeveloped in this field, and the approaches to uniform heating. The data described herein are valuable as atool for research on the heating patterns during defrosting of frozen foods assisted by dielectric heating.These data may be useful for the development of improved MW and RF defrosting systems.
Keywords
microwave heatingradio frequency heatingdefrostingfrozen foodsdielectric propertiesmathematical modelinguniform heating
1. IntroductionThe cycle of freezing/storage/defrosting is presently the most popular method forfood preservation in industrial countries and a popular practice of food preservation

at home. Freezing is a convenient way of preserving foods, and defrosting offrozen materials is an important part of some food-manufacturing processes,especially in the meat and food service industry. The main goal of a defrostingprocess is to keep defrosting time to a minimum to ensure the least possibledamage to quality. Consequently, effort has been devoted to developing defrostingtechnologies that are efficient and hygienic with the goal of yielding products readyfor processing (James and James, 2002) or for immediate raw consumption, forexample, sushi and sashimi. In the food industry, predominately air and, to a lesserdegree, water immersion is conventionally used for defrosting. These methods arebased on heat transfer by conduction; placing the frozen item in a warmer mediumthaws the external surface of the frozen food and heat is eventually transferred tothe interior. However, defrosting in this way is time consuming, microbial loadscan be increased, and the methods are detrimental to product yield and quality.These problems led to the development of dielectric heating methods exploitingmicrowave (MW) and radio frequency (RF) radiation.
Rapid uniform heating is achievable with a dielectric heating method.Nevertheless, when a frozen food is dielectrically heated, some small regions thawfirst due to spatial nonuniformities of heating. As heating continues, these thawedhigh-loss regions absorb much more power than the rest of the frozen low-lossregions due to the high efficiency of power absorption at small volumes for high-loss materials (power absorption: the dielectric power absorbed per unit of volumein the material). The power is generated by the electromagnetic waves applied tothe sample during dielectric heating, which is a function of the sample’s geometryand dielectric properties (DPs) as well as the electrode configuration. This situationleads to thermal runaway heating (Llave and Sakai, 2016) and is more complicatedwhen the dielectric heating is intended for uniform defrosting of multicomponentand multicompartment frozen meals (runaway heating: the material’s ability toabsorb increasing amounts of MW or RF energy, as its temperature increases; thus,the rate of temperature rise progressively increases as heating progresses). This isbecause frozen meals include different types of frozen foods with differentcomposition and dielectric behavior, besides the size of each food portion and thevolume that each portion occupies within the tray container. In addition, when largeblocks of frozen food have to be defrosted, it has been reported that MW heatingdoes not perform well (Jiao et al., 2014c). In these cases, instead of MW heating,RF heating has been satisfactorily used in recent years.
The scarce data on the DPs of frozen foods in the MW and RF bands and thelimited available computer simulation models had constrained the optimizationstudies in this field until a few years ago. The DPs of food materials are thedielectric constant (ɛ′) and the dielectric loss factor (ɛ″). These are electrical

properties that govern the interaction between dielectric heating and food. In thischapter, basics of dielectric defrosting of frozen foods; novel published DPs;applications of MW and RF heating of frozen foods; recent mathematicalsimulation models for the defrosting of single-component, multicomponent, andmulticompartment frozen meals; and selected ways to achieve uniform heatingduring dielectric defrosting are summarized and discussed in detail.
2. Frozen Foods and DefrostingFreezing of foods has been a common way of long-term food preservation becauseof the high product quality and long shelf life. During freezing, water is convertedinto ice, and the formation of ice removes water from food systems. The reducedwater activity helps to preserve foods for longer periods, and freezing temperaturesreduce the rate of chemical reactions and the activity of microorganisms andenzymes, thereby extending the storage life of frozen foods. The nutritional qualityof the food is also preserved better by freezing, and it is known that the leastvitamin loss occurs during freezing preservation of food. The loss of quality offrozen foods mainly depends on packaging, storage temperature, duration ofstorage, and the thawing procedure (Seyhun et al., 2014). Frozen foods are usuallystored at ≤−18°C; however, few processes can handle the frozen material, and it isusually defrosted before processing or direct consumption.
Frozen food is defined as tempered when its temperature is increased but is stillbelow the initial freezing point. This approach brings the solidly frozen food itemto a condition where it is still hard but can undergo further processing readily, suchas mixing, dicing, grinding, and slicing (Boillereaux et al., 2011). Thawing isusually regarded as complete when the center of the food sample has reached 0°C.Lower temperatures (−5 to −2°C) are acceptable for food that is destined forfurther processing, but such food is considered tempered rather than thawed (Jamesand James, 2002). It is known that tempering is faster than thawing and makes theprocess more energy efficient (Farag et al., 2008b). These properties maketempering the more viable option because it has the potential to produce higher-quality products as compared with thawing. The process of tempering is similar tothat of thawing, differing only in the target endpoint temperature.
Thawing is usually defined as the reverse process of freezing, but it is slowerthan freezing because of the different physical properties of water and ice [e.g., thethermal conductivity of water (0.6 W m−1 K−1) is significantly lower than that of ice(2.25 W m−1 K−1)]. Therefore, for an identical driving force, the thawing durationwill be longer than freezing duration. During thawing, the surface of frozen foodsthaws, and then a water film works as a thermal insulator to retard the thawing

process (Min et al., 2016). The lengthy period required to conventionally thawfoods can increase surface microbial growth, reduce nutritional value due toleached soluble proteins and vitamins, increase energy costs, and require largequantities of loaded wastewater (Icier et al., 2010; Seyhun et al., 2014). Thawingof voluminous frozen foods, such as big chunks of meat or fish takes anexcessively long time with conventional methods like the use of still-air or low-velocity moving air environment (Uyar et al., 2015). This is because thawinginvolves the conduction mode of heat transfer within the product, and after thawingof the surface, the frozen parts of the food are surrounded by a low-thermal-conductivity layer. This situation slows down the process and inevitablydeteriorates food quality via excessive water loss due to dripping or evaporationand increased microbial growth on the food surface. Moreover, it has been reportedthat ice crystal size increases due to recrystallization during prolonged storage andslow thawing (Hagiwara et al., 2003).
Many methods used for thawing of frozen foods have been reported, includingthawing at room temperature, cold-storage thawing, warm salt water thawing, staticwater thawing, MW thawing, RF thawing, ohmic thawing, pressure ohmic thawing,high-pressure thawing, high-voltage electric-field thawing, and acoustic thawing.Volumetric thawing methods offer solutions to the problems with quality attributesmentioned earlier. MW and RF heating are two of the volumetric heating methodswith the recognized potential for utilization in thawing applications for increasedconsumption of frozen foods. Volumetric heating does not require large amounts ofwater and is more rapid because the thermal conductivity of the food product doesnot control the thawing rate.
3. The Mechanism of Dielectric Heating3.1. Principles of Dielectric HeatingIn the electromagnetic (EM) spectrum, RF waves range mainly from 3 kHz to300 MHz, whereas MWs typically range from 300 MHz to 300 GHz. Nevertheless,only a few selected frequencies within these ranges are allowed for use inindustrial, scientific, and medical applications. Only radio frequencies of 13.56,27.12, and 40.68 MHz with the corresponding wavelengths of 22, 11, and 7.4 m arepermitted to be used in the United States for industrial, scientific, and medicalapplications. For MWs, only frequencies of 915 and 2450 MHz with wavelengthsof 0.33 and 0.12 m, respectively, are permitted.
Both RF waves and MWs are nonionizing forms of EM radiation and can bedescribed in terms of time-varying electric and magnetic fields moving through

space in wavelike patterns (Farag et al., 2011). When MW or RF radiation isabsorbed by a medium, the most obvious effect is heating. Therefore, dielectricheating, unlike conventional methods, is capable of generating heat within theproduct, which is also known as volumetric heating. The energy absorption infoods during dielectric heating proceeds primarily via two mechanisms: dipolarrelaxation (or dipolar reorientation) and ionic conduction, as depicted in Fig. 13.1.These interactions involve the electric field of the RF waves and MWs. Water inthe food is often the primary component responsible for the dielectric heating.Because of their dipolar nature, water molecules try to follow the electric fields asthey alternate at very high frequencies. Such rotations of water molecules produceheat. Ions, such as those present in a salty food, migrate under the influence of theelectric field, generating heat (Datta et al., 2014). Thus, dielectric heating withMWs, which have higher frequencies, proceeds basically through dipolereorientation as opposed to ionic conduction, which is predominant in heating withlower frequency RF waves (Farag et al., 2011).

(13.1)
FIGURE 13.1 A Schematic Diagram Depicting the Dipolar and IonicLoss Mechanisms and Their Contributions to the Dielectric Properties(DPs) as a Function of Frequency. The dashed lines are contributions due to individual mechanisms, and thesolid line stands for the combined effect. ɛ″eis the effective loss factor thatgroup together all forms of losses. However, in practice the subscript on ɛ″e isdropped, and ɛ″rwill be used for the rest of this chapter. Reproduced from Datta,
A.K., Sumnu, G., Raghavan, G.S.V., 2014. Dielectric properties of foods. In: Rao, M.A., Rizvi, S.S.,Datta, A.K., Ahmed, J. (Eds.), Engineering Properties of Foods, fourth ed. CRC Press Taylor &Francis Group, FL, United States. pp. 571–636, with permission of CRC Press in the format Book viaCopyright Clearance Center.
DPs of foods govern how foods react to alternating electric fields that generateheat. The DPs of a material are given as:

(13.2)
(13.3)
(13.4)
where ɛr is the complex relative (to air) permittivity, ɛ′r is the relative dielectricconstant (real part) and is related to the amount of energy that can be stored in amaterial, ɛ″r is the relative dielectric loss factor (imaginary part) and is related tothe amount of energy in heat form that a dielectric material can dissipate when
exposed to alternating electric fields, and .Penetration depth (dp) is the depth at which the power is reduced by 1/e or
approximately to 37% of its initial value. The dp value is calculated from thecomplex relative permittivity:
where c is the speed of light in vacuum (2.998 × 10⁸ m s−1) and f is the temporalfrequency (Hz).
Conversion of electrical energy to heat within the volume of foods is termeddielectric loss. Conversion of MW or RF power received by foods into thermalenergy can be calculated as:
where Pv is power conversion per unit of volume (W m−3) and E is the electricfield (V m−1).
The loss factor of a material relevant to MW and RF heating can be expressed as
where ɛ″d is the relative dipole loss and ɛ″σ is the relative ionic loss.

3.2. Dielectric Defrosting of Frozen FoodsDuring the dielectric heating process, energy carried by the EM wave is convertedinto thermal energy within the material owing to its dielectric losses. This processhas the advantage of being faster than conventional heating systems, especially forthawing of food products. MWs are successful at thawing small samples of food,but they often fail to thaw larger samples. This drawback is the result of lowerpenetration of MWs into larger samples. Higher dp of RF waves compared to MWsand generation of lesser energy that can be converted to heat improve heatinguniformity and minimize the runaway heating problem.
Fig. 13.2 shows the typical thawing curves of frozen foods with conventional(e.g., natural-convection air), RF, and MW thawing methods. In general, thawingcurves have three zones: the temperature rise zone, conversion zone (also calledmushy zone), and thawing zone. Initially the temperature rise is rapid because ofthe presence of an ice layer around the surface of the frozen sample. Thermalconductivity of ice is higher than that of water and the heat conduction is faster inthe frozen sample. Owing to the generation of heat, the ice on the surface isconverted into water, and subsequent conversion of ice into water within thesample then takes place at a lower rate (Rattan and Ramaswamy, 2014). Thisphenomenon is represented by the conversion zone in the curve. In this zone, theconventional thawing method produces a time–temperature profile with a partialplateau (Llave et al., 2014). In this region, as ice is converted to water in themelting phase, there is no large change in temperature; there is self-absorption ofthe latent heat of fusion (Mascheroni and Calvelo, 1980). In the RF thawingprofiles, the plateau is much less evident, and almost nonexistent in the MWthawing profiles. This is thought to be because of the volumetric nature of theheating by these methods (Farag et al., 2011). Complete thawing is achieved whenall the ice is converted into water, and the temperature rises again rapidly. Theheating rate is higher for RF thawing than for conventional methods and is thehighest for MW thawing (Llave and Sakai, 2016).

FIGURE 13.2 Typical Thawing Curves for Different Thawing Methods:Conventional (Natural-Convection Air), Radio Frequency (RF) Heating,and Microwave (MW) Heating.
Because dielectric heating recently became a common addition to many food-manufacturing processes, determining the DPs of frozen foods—raw or precooked—has become increasingly relevant. This information is necessary to understandthe heating profiles of frozen foods being defrosted in MW or RF ovens, todetermine heating rates and uniformity during dielectric defrosting, and to developequipment and microwaveable or RF-processable foods (Llave et al., 2016). Even

though a number of studies have reported DPs of foods in a wide frequency range,there is only limited data on frozen foods in the defrosting temperature range.
For frozen foods during dielectric defrosting, because the temperature incrementoccurs mainly on the surface, the waves will penetrate less deeply, thus decreasingthe energy absorbed by the frozen food. In other words, a shell of high impedanceforms that reflects more of the waves, but in the frozen core, both the real andimaginary part of the permittivity is small; therefore, little energy is absorbed(Chen et al., 2016b). They also reported that the energy absorption fluctuatesduring heating due to the fluctuation of DPs with temperature; these phenomenacan explain the mechanism of the lower energy absorption with an increasedtemperature of frozen foods during MW heating. They developed a model for thesimplified EM analysis (Fig. 13.3), consisting of plane waves incident on a layeredflat surface, that can be viewed as a three-layer problem: low dielectric (high-impedance) air, medium dielectric (low-impedance) unfrozen sample, and lowdielectric (high-impedance) frozen sample. The large difference in impedancebetween the frozen and unfrozen layers will increase reflection, and thus moreenergy will be absorbed in the unfrozen region. As the unfrozen region’stemperature increases, the dielectric loss increases, and thus more energy isabsorbed near the surface before reaching the frozen core region.

FIGURE 13.3 A Simplified Description of Microwaves Incident on aMaterial With Varying Dielectric Properties, Showing Reflected andRefracted Waves. Reproduced from Fig. 11 in Chen, F., Warning, A.D., Datta, A.K., Chen, X.,2016b. Thawing in a microwave cavity: comprehensive understanding of inverter and cycled heating.J. Food Eng. 180, 87–100.
3.3. Dielectric Heating EquipmentRF and MW heating systems are differentiated by their source and system designs.Electric field generation in a RF heating system is achieved by the use of a pair ofelectrode plates, resulting in an electric field in a fixed direction. This is in contrastto MW heating systems that, depending on the design, can produce an electricalfield in any and all directions. Another point of difference is that MW heatingsystems also require a waveguide to transmit the MWs (Jiao et al., 2014c).
3.3.1. The RF heating systemA typical RF heating system (Fig. 13.4) consists of two main components: agenerator and applicator. The generator part is mainly used to generate the RFenergy, and the applicator part is where the material is placed and heated throughtransformation of EM energy into thermal energy (Jiao et al., 2014c). Traditionally,the industrial RF technologies have been classified into two categories: the basictechnology known as the self-oscillator RF generator (variable-frequency RF

technique), and the more efficient technology known as the 50 Ω RF amplifier. Theself-oscillator RF system is used widely in many industrial applications, but the50 Ω system is a relatively new technology that has shown several advantages overthe other approach. It provides a fixed frequency as compared with the self-oscillatory circuit, satisfies the stringent EM compatibility regulations, andprecisely controls power and feedback.
FIGURE 13.4 A schematic diagram of (A) configuration of a RF continuousdefroster, (B) 50 Ω RF heating system. Adapted from Yamamoto Vinita Corp, 2015.Osaka, Japan, 2015. Catalogue A High-frequency defroster–Tempertron., available from:http://www.vinita.co.jp/pdf/tempertron.pdf.
RF heating involves the use of electrodes (with the product being placed eithermidway between or on top of one of a pair of electrodes) between which a high-frequency directional electrical field is generated by high-power electrical valvesthat transfer energy to the electrodes via transmission lines. Nonetheless, RFheating does not have any requirement for direct contact between the product andelectrodes, because RF waves will penetrate through conventional cardboard orplastic packaging.

3.3.2. The MW heating systemIn the MW system (Fig. 13.5), a magnetron (source) and a MW cavity (load) arethe two keys parts. In an industrial MW system, however, waveguide is also anessential part for transport of MW energy from the generator to applicator. In MWheating, waves (generated by a magnetron or by a number of antennas) pass via awaveguide into a cavity in which they essentially bounce around off the metalwalls of the cavity interior, impinging on the product from many directions. Thereare two types of MW equipment for domestic use: a flatbed oven and turntableoven. Domestic flatbed MW ovens have been available to customers for manyyears. In addition to being easier to clean, flatbed MW ovens can accommodaterectangular and larger dishes owing to the stationary ceramic plate inside thecavity. Newer models produce relatively uniform heating by including a base withan aluminum antenna with irregularly shaped holes that rotates during operation(Liu et al., 2014).

FIGURE 13.5 Schematic diagrams of (A) configuration of a MW heatingdevice, (B) components of a MW heating system (conveyer type), and (C)components of a domestic turntable MW heating oven. Adapted from YamamotoVinita Corp, 2015. Osaka, Japan. Catalogue B: Microwave heating device, available from:http://www.vinita.co.jp/pdf/microwave.pdf.
4. DPs of Frozen Foods and DefrostingApplications

4.1. Special Considerations for Measurementof DPs of Frozen FoodsAlthough many techniques have been devised for DP measurement [waveguideand coaxial transmission line methods, short-circuited line methods, open-endedprobe technique, time domain reflectometry method, free-space transmissiontechnique, microstrip transmission line, six-port reflectometer using an open-endedcoaxial probe, parallel-plate method, colloid dielectric probe (Hewlett-Packard),test cell with Boonton RX-meter, and the cavity perturbation technique], selectionof the proper approach depends on the nature of the dielectric material, thefrequency of interest, the degree of accuracy required, and availability of themeasuring equipment (Datta et al., 2014).
In spite of numerous studies devoted to the measurement of DPs of frozensamples by means of an open-ended coaxial dielectric probe kit, Curet et al. (2014)reported that this method remains more appropriate for defrosted foods due to theirhigh dielectric characteristics. Although for frozen foods, the cavity perturbationmethod seems to be more accurate but requires the design of a proper cavity. Forfrozen foods, it is necessary to ensure that the frozen samples are kept at aspecified measurement temperature in the defrosting temperature range. Farag et al.(2008a) used a water bath for recirculation of water at a desired temperaturethrough a jacketed sample cup holder. However, as the liquids have differentfreezing points, below-zero refrigeration of sample containers with water or liquidcoolants is somewhat challenging. One work around is to employ a temperedchamber in which the measurement device is placed (Llave et al., 2014; Trabelsi, 2015; Wang et al., 2012). Trabelsi (2015) reported that for determination of DPs,the entire assembly—coaxial cable/open-ended probe/stainless steel cup—wasplaced in a temperature chamber. For analysis of the DPs at the surface, it isimportant to ensure full contact between the electrode and sample surface. Thisrequirement is complicated for frozen samples because they do not adhere easily tothe surface of the coaxial probe (Liu and Sakai, 1999) at differences betweensamples above 0°C, which can be semisolid (show better adhesion). For frozensamples, good contact between the sample surface and the flat contact-surface ofthe coaxial probe cannot be easily attained because it requires that the surfaceflatness of the sample satisfies the flatness condition of the device manufacturer:2.54 × 10⁻⁶ m (Llave et al., 2016). This condition is difficult to attain during samplepreparation. The method for fine-tuned roughness correction of the top surface ofthe frozen samples was successfully used by Liu and Sakai (1999) and Llave et al.(2016). The roughness correction method consists of pressing the surface with asmooth metal at the very early stage of freezing, followed by prompt freezing of

the sample in close contact with the metal. Finally, after reaching the final targettemperature, the metal is separated from the surface. This approach improvessmoothness of the surface without influencing the structure of the frozen samples(Llave et al., 2014).
4.2. Characteristics of Dielectric Defrosting ofFrozen FoodsThe DPs of food products depend mainly on factors, such as the temperature,frequency, the state of the food (maturity, chemical composition), the state of themoisture content (frozen, free, or bound), surface charges, electrolytes,nonelectrolytes, and hydrogen bonding (Llave et al., 2014). The effects of the mainfactors on DPs of frozen foods are discussed later.
4.2.1. Effects of temperature on DPsGenerally, during defrosting of frozen foods, there is a slight increase in both DPs,ɛ′r and ɛ″r, at the frozen stage, which is followed by a sharp increase in theconversion zone and then an abrupt increase close to the melting point. After thispoint, both ɛ′r and ɛ″r either decrease or increase slightly until the target thawingtemperature is achieved, depending on the concentration of ions in the sample.Observations of the behavior of ɛ′r and ɛ″r during MW-band dielectric defrostingresembled that of RF-band defrosting at small scale because of the higherfrequency ranges.
At lower frozen-food temperatures, the DPs do not differ significantly. Apossible reason is that at lower temperatures, the proportion of mobile water isreduced, and as a result, the dielectric values are lowered as compared to thoseobserved at higher temperatures. Over a temperature range of −20 to −5°C, thechanges in the DPs are correlated with the frozen water proportion in the samplemuscle (Llave et al., 2015). During thawing (e.g., −5 to −1°C), an increase in ɛ′rand ɛ″r values is frequently observed, being more pronounced at lower frequencies,as shown in Fig. 13.6 for the case of frozen tuna. The temperature range −5 to−1°C coincides with the freezing point of most frozen foods, and within this range,the ɛ′r values observed are significantly higher than at other temperatures. In thisrange, evidence of a phase transition appears as the system absorbs energy becausethe process is endothermic and involves addition of energy to overcomeintermolecular attractions within the product in RF defrosting (Llave et al., 2014).In MW defrosting, the DPs may increase because of an increase in dipolaroscillations of water molecules at temperatures close to the melting point of ice

(Gunasekaran et al., 2005). Reports have shown that ɛ′r and ɛ″r exhibit nosignificant dependence on temperature over a range of 1–10°C (Farag et al., 2008a;Llave et al., 2014), especially for meats with higher fat content. However, it hasbeen noted that the DPs of lean meats decrease slightly immediately after thefreezing point; this is thought to be a result of the physical state changing duringthawing with the release of water/electrolytes. At temperatures above the freezingpoint, bound water molecules gradually form an aqueous ionic solution ofdissolved salts with surface layers or tightly bound water molecules around eachcounterion (Mudgett, 1985).

FIGURE 13.6 Dependence of DPs on composition of tuna samples at (A)13.56 MHz, fat content: □, 1.00%; ^, 11.1%; ◊, 30.6%; (B) 2450 MHz, fatcontent: □, 0.4%; ^, 9.7%; ∆, 15.9%; ◊, 30.2%. Part A, adapted from Fig. 4 in Llave, Y.,Terada, Y., Fukuoka, M., Sakai, N., 2014. Dielectric properties of frozen tuna and analysis ofdefrosting using a radio-frequency system at low frequencies. J. Food Eng. 139, 1–9; part B,adapted from Figs. 3–4 in Liu, C., Sakai, N., 1999. Dielectric properties of tuna at 2450 MHz and 915MHz as a function of temperature. J. Jpn. Soc. Food Sci. 46 (10), 652–656.
4.2.2. Frequency dependence of DPs

Owing to the higher operating frequency used in MW applications, dp isappreciably less than that during RF heating. This phenomenon may explain theremarkable effect of frequencies in RF bands as compared to the small effect offrequencies in MW bands on the measured DPs of foods; lower RF bands tend tobe associated with higher dp values.
The reasons for an increase in DPs with the increasing temperature at RFfrequencies are not well understood in spite of numerous reports for various high-moisture products, but more is understood about the phenomenon at MWfrequencies (Wang et al., 2008). In the RF range, the ɛ″r of high-moisture foods isaltered by ionic loss due to the migration of ions, which also increases with theincreasing temperature. During MW-mediated defrosting of frozen foods, thechange in DPs due to the frequency is less pronounced. This situation can also beobserved in Fig. 13.6 where for MW bands, the effect of frequency on DPs isminimized, especially for ɛ″r. The reduction in DPs could be attributed to thedispersion of water molecules at higher frequencies.
4.2.3. Effects of the composition of frozen foods on DPsFreezing and thawing mainly influence the water fraction of meat products.Because water is contained within and between the muscle fibers of meat,compartments are created in the tissue and complicate the process. As waterfreezes, the concentration of the remaining solutes (proteins, carbohydrates, lipids,vitamins, and minerals) increases, thereby disrupting the homeostasis of thecomplex meat system (Leygonie et al., 2012). The water in the food material has anumber of dissolved components, and therefore it freezes or thaws gradually acrossa range of temperatures as opposed to a pure material that changes the phase at asingle temperature. Free and bound water contents affect the rate of change of ɛ′rand ɛ″r with temperature. If the water is in bound form, the increase in temperatureincreases the DPs, whereas in the presence of free water, DPs decrease as thetemperature increases. In the frozen state, both ɛ′r and ɛ″r of samples are small andnot significantly affected by an increase in water content. This phenomenon isattributed to the presence of water and salt in the sample in bound form (Dattaet al., 2014). Therefore, the rate of variation of DPs depends on the ratio of boundto free water content; thus, adjusting the water content is the key to formulatingmicrowaveable foods (Sahin and Summu, 2006).
The interaction of food components with water is a factor that significantlyaffects DPs. For example, the stronger the binding forces between protein orcarbohydrates and water, the smaller are the contribution of the bound water to ɛ′r

or ɛ″r (Datta et al., 2014). The freezing point is decreased by the presence of salt,resulting in more unfrozen water at a given temperature and a subsequent change inthe dielectric behavior. Salt also improves ionic strength, and therefore there is anincrease in interactions with dielectric waves. During thawing, physical changes,such as the release of water/electrolytes and the subsequent differences in the DPsand thermophysical properties of the fluid and those of the still-frozen materiallead to a bigger variation in the temperature distribution (Farag et al., 2008a;Llave et al., 2015). Melted fluid and associated electrolytes migrating (e.g., to thebase of frozen blocks) could explain the gradient pattern of the endpointtemperature profile during RF thawing (Farag et al., 2011; Llave et al., 2014).
A study conducted by Wang et al. (2011) revealed that in the frozen state, ɛ′r andɛ″r of potato puree increase significantly as the salt content increases [from 1% to7% (w/w)]. This effect can be attributed to the fact that ionic conduction slowsdown but does not stop because ɛ″r of the frozen food material is greater than thatof pure ice. As the unfrozen fraction increases, ɛ′r increases, increasing reflectionand reducing power absorption. Salt concentration (2%–4%) has been reported tosignificantly change DPs of a tylose (or methyl cellulose, a food model) cube(especially ɛ″r ) and to lead to greater energy absorption but does not significantlychange the heating rate due to the impedance shell that forms on the surface of thecube, preventing EM waves from thawing the core (Chen et al., 2016b). Similarresults (on DPs) were reported by Llave et al. (2016) for 0%–2% salt-added tylosepastes (Fig. 13.7). Interestingly, tylose pastes with a salt concentration of 0.5%exhibited changes in the heating rate that were significant (P < 0.05), and thedielectric behavior of frozen lean tuna during MW thawing was successfullysimulated with such paste (Fig. 13.8).

FIGURE 13.7 Dielectric Properties (ɛ′r and ɛ″r) of Tylose Pastes WithAdded Salt (NaCl in wt.%) at 2450 and 915 MHz. Reproduced from Fig. 3 in Llave,Y., Mori, K., Kambayashi, D., Fukuoka, M., Sakai, N., 2016. Dielectric properties and model foodapplication of tylose water pastes during microwave thawing and heating. J. Food Eng. 178, 20–30.

FIGURE 13.8 Comparison of Time–Temperature Profiles of Lean Tuna(Tu) and Tylose Paste (Ty) With Salt Concentration of 0.5% at Three Sites(Center, Top, and Bottom) During MW Heating at 2450 MHz. Reproduced fromFig. 8 in Llave, Y., Mori, K., Kambayashi, D., Fukuoka, M., Sakai, N., 2016. Dielectric properties andmodel food application of tylose water pastes during microwave thawing and heating. J. Food Eng.178, 20–30.
The effect of sucrose content—3, 7, 11, or 15% (w/w)—on DPs using the samevariables as the effect of salt content was also reported by Wang et al. (2011). Theincrease in sucrose content has a smaller effect on ɛ′r and ɛ″r as compared with thatof salt content. Nevertheless, in the subzero temperature zones, the DPs increaseslightly with the increasing sucrose content. The addition of sucrose increases theDPs of potato puree probably due to freezing-point depression, which shifts morewater to the liquid phase. Furthermore, sucrose also binds to water molecules,reducing the proportion of free water.
On the other hand, lower moisture content was observed in products with ahigher fat content, and this consequently dampened the dielectric interactions. Liu

and Sakai (1999) and Llave et al. (2014) reported higher DPs for tuna samples withlower fat content.
Moreover, it has been reported that proteins are relatively inert and do notinteract significantly with MWs (Llave et al., 2015). The relationship betweenproteins and DPs is currently ambiguous, but it is thought to be weaker than theDPs relationship with the moisture content (Shukla and Anantheswaran, 2001).Some additional explanations of the effect of food composition on DPs can befound in the article by Datta et al. (2014).
4.3. DPs in the RF RangeUnlike the wealth of data for the MW range, there is limited information availableon the DPs of frozen foods in the RF range. In Table 13.1, some selected data on ɛ′rand ɛ″r of frozen foods in the RF range are shown.

Table 13.1
DPs of selected frozen foods in the RF range.
FrozenFoods
Frequency(MHz)
Temperature(°C) ɛ′r ɛ″r References
Beef lean 10 −10/−5/10 13/18/101 6.5/25.2/808 Bengtssonet al.(1963)
Beef lean 35 −10/−5/10 9/13/79 3.6/7.8/237 Bengtssonet al.(1963)
Beef blends (lean;67.8 and11.8% ofmoisture andfat content,respectively)
27.12 −15/−5/ −3/−1 22.3/36/51.2/68.8
28.8/81.4/149.3/241.9
Farag et al.(2008a)
Beef blends(50:50,lean:fat; 48.2and 36.1% ofmoisture andfat content,respectively)
27.12 −15/−1 18.4/37.3 23.4/92.4 Farag et al.(2008a)
Beef blends (fullfat; 26.3 and65.7% ofmoisture andfat content,respectively)
27.12 −15/−1 9.7/18.3 7.7/26.1 Farag et al.(2008a)
Chicken breast(75.5% ofmoisturecontent)
200 −19.4 to −1.3 5–47 0–32 Trabelsi(2015)
Codfish 10 −25/−5/10 6.25/17/95.2 71.25/41.31/33.32
Bengtssonet al.(1963)
Codfish 35 −25/−5/10 5.45/13.2/75.4 24.31/17.56/18.10
Bengtssonet al.(1963)
Codfish 100 −25/−5/10 4.9/10.5/72.8 8.33/7.46/13.83 Bengtssonet al.(1963)

FrozenFoods
Frequency(MHz)
Temperature(°C) ɛ′r ɛ″r References
Codfish 200 −25/−5/10 4.45/9.1/68.9 3.92/5.01/11.71 Bengtssonet al.(1963)
Tuna flesh (lean;70.9 and 1.0%of moistureand fatcontent,respectively)
13.56 −20 to 10 5.4–263.0 2.0–483.9 Llave et al.(2014)
Tuna flesh (mid-oily; 61.8 and11.0% ofmoisture andfat content,respectively)
13.56 −20 to 10 3.7–56.2 1.28–253.9 Llave et al.(2014)
Tuna flesh (oily;44.9 and30.6% ofmoisture andfat content,respectively)
13.56 −20 to 10 3.7–20.0 1.4–116.1 Llave et al.(2014)
Tuna flesh (lean;70.9 and 1.0%of moistureand fatcontent,respectively)
27.12 −20 to 10 1.7–89.5 1.0–276.9 Llave et al.(2014)
Tuna flesh (mid-oily; 61.8 and11.0% ofmoisture andfat content,respectively)
27.12 −20 to 10 3.4–20.4 0.9–130.9 Llave et al.(2014)
Tuna flesh (oily;44.9 and30.6% ofmoisture andfat content,respectively)
27.12 −20 to 10 2.6–14.1 1.0–71.9 Llave et al.(2014)
%, w.b., Wet basis.
Summarized later are some of the most recent and relevant applications. In thePizza et al. (1997) study of pork muscle (35 × 10 × 11 cm pieces) thawing using an4 kW, 27.5 MHz RF source, it was noted that the average surface temperature was

approximately 13°C, but the average temperature at the center was 4°C. Farag et al.(2008a) reported the DPs and thermophysical properties of three beef meat blends(lean, fat, and 50:50 mixture) from −18 to 10°C at 27.12 MHz, apart fromfrequencies of 896 and 2450 MHz using an open-ended coaxial probe. Farag et al.(2008b) conducted tempering studies on different meat blends (lean, 50:50 lean:fat,and full fat). Those authors used a custom-built 50 Ω RF system with a low-power(0.6 kW) RF wave generator. Comminuted beef samples (20 × 20 × 10 cm) weretempered from −20°C to endpoint temperatures ranging between −5 and −2°C.Those investigators reported an approximate 30-fold reduction in tempering timeand greater uniformity of endpoint temperature distribution as a result of RFtempering instead of conventional air tempering. Farag et al. (2011) comparedconventional and RF thawing of 4-kg blocks of lean, lean-fat, and 100% full-fatbeef meats, concluding that better temperature uniformity can be obtained duringRF thawing.
Experimental characterization of tuna (Thunnus maccoyii) defrosting wasperformed by Llave et al. (2014), who considered RF defrosting of three ordinarymuscles at 13.56 and 27.12 MHz and evaluated the DPs over a temperature rangeof −20 to 10°C using the parallel-plate measurement method. Tuna samples withhigh moisture content were found to have higher DP values, especially at lowerfrequencies. RF defrosting of samples (60 × 60 × 25 mm) was accomplished with a13.56-MHz, 50-Ω parallel-plate system. When the top electrode projection and thesample were of a similar size, the endpoint temperature distribution in the tunamuscle was more uniform; this was particularly true for samples with a high-moisture content.
4.4. DPs in the MW RangeIn this section, selected data on DPs of real foods and frozen food models aresummarized.
4.4.1. MW defrosting of real foodsSeveral studies conducted in the 1960s and 1970s generated DP data on severalfrozen products, among which frozen raw beef and frozen beef products have beenthe most studied by researchers. These data were compiled in a few reviews andbook chapters (Datta et al., 2014; Komarov, 2012; Nelson and Datta, 2001). Inthis chapter, some of the most recent and relevant studies on DPs of frozen foods,considering temperature dependence, are summarized in Table 13.2. Explanationsof some of these results are given ahead.

Table 13.2
DPs of selected frozen foods in the MW range.
FrozenFoods
Frequency(MHz)
Temperature(°C) ɛ′r ɛ″r References
Ground beef (73and 4% ofmoistureand fatcontent,respectively)
915/2450 −25 to 10 Eqs. (13.9–13.10)
Gunasekaranet al. (2005)
Ground beef (71and 9% ofmoistureand fatcontent,respectively)
915/2450 −25 to 10 Eqs. (13.9–13.10)
Gunasekaranet al. (2005)
Ground beef (62and 20% ofmoistureand fatcontent,respectively)
915/2450 −25 to 10 Eqs. (13.9–13.10)
Gunasekaranet al. (2005)
Pork Ham (68.9and 4.17%of moistureand ashcontent,respectively)
2450 −35 to 0 5–45 0.5–27 Sipahioglu et al.(2003)
Pork ham (68.6and 2.17%of moistureand ashcontent,respectively)
2450 −35 to 0 4–43 0.5–19 Sipahioglu et al.(2003)
Pork ham (67.0and 1.82%of moistureand ashcontent,respectively)
2450 −35 to 0 4–42 0.4–17 Sipahioglu et al.(2003)
Chicken breast(75.5% ofmoisturecontent)
500 −19.4 to 25 5–71 a 0.5–34 a Trabelsi (2015)

FrozenFoods
Frequency(MHz)
Temperature(°C) ɛ′r ɛ″r References
Chicken breast(75.5% ofmoisturecontent)
1550 −19.4 to 25 5–55 a 0.5–18 a Trabelsi (2015)
Chicken breast(75.5% ofmoisturecontent)
7960 −19.4 to 25 5–42 a 0.5–23 a Trabelsi (2015)
Surimi (SAgrade, 74%of moisturecontent)
915/2450 −30 to 10 2.80–55.18/2.75–50.57
0.05–12.34/0.06–14.64
Mao et al.(2003)
Surimi (Kgrade,78.8% ofmoisturecontent)
915/2450 −30 to 10 3.1–62.7/ 2.9–56.3
0.3–12.9/0.2–17.5
Mao et al.(2003)
Tuna (leanmeat; 75.3,0.4, and23.5% ofmoisture,fat, andproteincontent,respectively)
915/2450 −30 to 10 4.2–57.2/ 4.1–50.1
0.09–23.9/ 0.8–21.2
Liu and Sakai(1999)
Tuna (fattymeat; 62.7,9.7, and26.1% ofmoisture,fat, andproteincontent,respectively)
915/2450 −30 to 10 4.1–48.0/ 4.1–47.6
0.07–23.3/ 0.8–18.3
Liu and Sakai(1999)
Tuna (fattymeat; 61.7,15.9, and21.1% ofmoisture,fat, andproteincontent,respectively)
915/2450 −30 to 10 4.0–43.8/ 3.9–28.7
0.06–16.2/ 0.7–15.2
Liu and Sakai(1999)

FrozenFoods
Frequency(MHz)
Temperature(°C) ɛ′r ɛ″r References
Tuna (fattymeat; 55.0,30.2, and14.9% ofmoisture,fat, andproteincontent,respectively)
915/2450 −30 to 10 3.9–31.5/ 3.8–26.4
0.05–13.3/0.6–9.4
Liu and Sakai(1999)
Tuna flesh (leanmeat, 75%of moisturecontent)
2450 −30 to 60 Eqs. (13.7–13.8) Liu et al. (2005)
Tuna flesh (leanmeat, 74.2%of moisturecontent)
915/2450 −30 to 60 3.5–52.9/ 3.5–47.4
0.4–40.5/0.4–21.1
Llave et al.(2016)
Shrimp 915/2450 −25 to70 Eqs. (13.5–13.6) Tanaka et al.(1999)
Potato puree(15% potatopureepowder,which has6% ofmoisturecontent)
2450 −30 to 10 3–58 0–17 Seyhun et al.(2009)
Potato puree(81.5% ofmoisturecontent)
2450 −20 to 65 3.71–58.32 0.29–16.1 Wang et al.(2011)
Potato puree(79.0% ofmoisturecontent)
2450 −20 to 65 3.48–58.31 0.32–17.01 Wang et al.(2011)
Potato puree(76.0% ofmoisturecontent)
2450 −20 to 65 3.42–56.05 0.41–17.49 Wang et al.(2011)
Potato puree(67.5% ofmoisturecontent)
2450 −20 to 65 3.36–47.23 0.44–17.32 Wang et al.(2011)

FrozenFoods
Frequency(MHz)
Temperature(°C) ɛ′r ɛ″r References
Potato puree(54.4% ofmoisturecontent)
2450 −20 to 65 3.01–30.92 0.37–13.39 Wang et al.(2011)
Potato puree(21.1% ofmoisturecontent)
2450 −20 to 65 1.69–4.78 0.09–0.82 Wang et al.(2011)
Mashed potato(74 and0.4% ofmoistureand saltcontent,respectively)
915/2450 −20 to 0 4.1-53.5/NR 0.3-25.3/0.4–22.1
Chen et al.(2013)
Cream croquette(73.56,11.96, and0.72% ofmoisture,fat, and saltcontent,respectively)
915/2450 −20 to 0 3.90–52.35/3.78–4731
0.34–20.85/0.29–18.44
Llave and Sakai(2016)
Whey proteingel (80% ofmoisturecontent)
915/2450 −20 to 0 3.6–65.9/NR 0.1–18/0.2–20.7
Chen et al.(2013)
Cheese sauce(73.7 and16.8% ofmoistureand fatcontent,respectively)
2450 −20 to −2 4–8 0–3 Tilford et al.(2007)
Edam cheese 2450 −15 to 10 5.9–12.8 1.8–6.6 Llave and Sakai(2016)
Dry salt goudacheese
2450 −15 to 10 5.6–12.6 1.7–5.1 Llave and Sakai(2016)
Romano cheese 2450 −15 to 10 5.4–11.6 1.6–3.7 Llave and Sakai(2016)
Cheddar cheese 2450 −15 to 10 5.0–9.8 1.5–3.5 Llave and Sakai(2016)
%, w.b., Wet basis; NR, not reported.

(13.5)
(13.6)
(13.7)
a Approximate values.
Tanaka et al. (1999) reported DPs of shrimp measured at frequencies between0.3 and 3 GHz and in the temperature range from −25 to 70°C using an open-endedcoaxial probe. They found that DPs of shrimp from different sample parts (top,middle, and bottom sections) or sample orientation (butterfly and sectional cuts)are not significantly different. They also reported that ɛ′r and ɛ″r are small andindependent of frequency and temperature. They reported empirical Eqs. (13.5–13.6), for the estimation of ɛ′r and ɛ″r at 915 and 2450 MHz, respectively:
where T indicates the temperature of shrimp in °C, and Tf/T is the ratio ofunfrozen water (−). For more details on the determination of Tf/T and thecoefficients used in Eqs. (13.5–13.6), please refer to the article by Tanaka et al.(1999).
Liu and Sakai (1999) and Liu et al. (2005) measured the DPs of tuna samples ofdifferent chemical composition at 2450 MHz from −30 to 60°C using an open-ended coaxial probe. Liu and Sakai (1999) also reported the DPs of tuna in thesame temperature range at 915 MHz. They found that in spite of the small valuesof DPs at temperatures below the freezing point, especially for a higher frequency,both properties increased with the increase in water content at a constanttemperature. Liu et al. (2005) reported empirical Eqs. (13.7–13.8), representing therelation between the DPs and temperature (T < Tsh):

(13.8)
(13.9)
(13.10)
where Tsh is the initial freezing temperature (assumed to be −1°C), Tf is thereference temperature for zero enthalpy (−40°C), and ɛ′ice and ɛ″ice are the DPs ofice. A1 and A2 are the empirical constants for the prediction of ɛ′r, 0.067, and 30.13,respectively; while B1 and B2 are the empirical constants for prediction of ɛ″r, 0.040and 16.40, respectively.
Mao et al. (2003) measured DPs of unsalted frozen surimi made from the Alaskapollock at 2450 and 915 MHz from −30 to 30°C using an open-ended coaxialprobe. They reported that dp calculated from the obtained DPs suggested that thevalues at 915 MHz are on average 2.5-fold greater than values at 2450 MHz.Sipahioglu et al. (2003) measured the DPs of 19 different ham samples withdifferent moisture content (68.8, 68.6, and 67.0%) and ash content (4.17, 2.17, and1.82%) at 2450 MHz from −35 to 70°C using an open-ended coaxial probe. Theyreported that the DPs of ham are very low up until melting started at −20 to −10°C.Gunasekaran et al. (2005) reported the relation between DPs (measured using anopen-ended coaxial probe), fat level (4, 9, and 20%), and temperature (−25 to75°C) for ground beef at 915 and 2450 MHz. They also reported the effect ofgrinding on DPs of beef; raw beef has higher DPs than ground beef does. Theyclaimed that this effect could be due to grinding, which increases pore space in themeat as compared to intact raw muscle where the presence of air voids couldaccount for the lower values of DPs. They also published equations for estimationof the DPs of ground beef using a stepwise regression procedure (R2 ≥ 0.86 in allcases):
where T is temperature (in °C), and F is fat content (%). For details onthe coefficients used in Eqs. (13.9–13.10), please refer to the article byGunasekaran et al. (2005).

Basaran-Akgul et al. (2008) reported DPs of the eye of round beef at 27, 915,and 1800 MHz at temperatures between −5 and 130°C. They found that the DPsdecreased with the increasing frequency from 27 to 1800 MHz in both the paralleland perpendicular tissue orientations. The values of the DPs were lower for frozenperpendicular samples than for frozen parallel samples. Chen et al. (2013)measured the DPs of a whey protein gel and mashed potatoes in the frequencyrange 300 to 3000 MHz from −20 to 100°C, using a high-temperature coaxialprobe. The ɛ″r values of both samples rapidly increased from −20 to 0°C. Theyattributed the low values of DPs in the freezing temperature range to the rigidcrystalline structure of ice, which influences the MW power absorption of frozenfoods. Moreover, at freezing temperatures (−20°C), dp was fairly large (203.8 mmfor the whey protein gel and 114.4 mm for mashed potato at 2450 MHz), but itdramatically decreased when the sample was thawed (7.4 mm for the whey proteingel and 6.1 mm for mashed potato at 2450 MHz and 0°C). Thus, they concludedthat the differences in dp between the frozen and thawed states of the sampledramatically influenced the heating uniformity and caused runaway heating.
The DPs of cubic samples of stem lettuce were measured at 2450 MHz in thetemperature range –30 to 20°C using an open-ended coaxial probe connected to avector network analyzer inside a freezing chamber (Wang et al., 2012). The valuesof ɛ′r and ɛ″r in the thawing process were lower than those in freezing process. Thesignificant reduction in ɛ′r and ɛ″r values after freezing was probably due to thefreezable water remaining in the frozen samples; this water will be continuouslyturned into ice crystals in the thawing process below the initial freezing pointtemperature. Trabelsi (2015) measured DPs of chicken breast meat with an open-ended coaxial-line probe between 200 MHz and 20 GHz at temperatures rangingfrom −20 to 25°C. They reported that below 0°C, ɛ′r is nearly temperatureindependent and has a value of ∼5 for all frequencies, whereas ɛ″r is nearly zeroand reflects the tightly bound nature of water in the chicken meat. In contrast, at∼0°C, a significant increase in the DPs occurs, marking a phase transition of thestatus of water binding in the chicken meat from tightly bound (ice-like) to looselybound (liquid-like).
4.4.2. MW defrosting of food modelsThe ingredients, preheating conditions, and thermal treatments of food materialswill affect the DPs (Sakai et al., 2005), and so in developing MW processing,periodical system stability verification tests with food materials is challenging.Each sample of food can also only be used once, which creates a waste problemthat is exacerbated in high-production capacity industrial systems. As an

alternative, consistent, predictable DPs are obtained using dummy loads of modelfoods (or food analogs). Dummy loads need to be cheap, thermally stable to allowreuse, easy to prepare, have a homogeneous composition, and possess food-comparable dielectric and thermal properties (Luan et al., 2015). Some dummyloads utilized so far in MW heating research include agar gel (Padua, 1993; Sakaiet al., 2005), tylose (Basak and Ayappa, 1997; Chamchong and Datta, 1999),synthetic paste (Cheng et al., 1997), bentonite water pastes (Liu and Sakai, 1999;Llave and Sakai, 2016; Luan et al., 2015), and whey protein gel (Lauet al., 2003). However, few investigators have reported the DPs of food models atthawing temperatures.
It has been asserted that in the frozen zone tylose has similar DPs to those ofbeef muscle (Basak and Ayappa, 1997; Chamchong and Datta, 1999), and tyloseis frequently used as a frozen beef substitute in MW-related experiments(Chamchong and Datta, 1999; Chen et al., 2016b; Curet et al., 2014).Nevertheless, there was a lack of data on temperatures below 0°C, and across awide frequency range particularly in the phase change region. Over a range of 300–3000 MHz, DPs of tylose pastes of varying salt concentrations were measured byLlave et al. (2016) for freezing temperatures (−30°C) to a common reheating targettemperature (≤60°C). The MW thawing and heating performance at 2450 MHz oftylose was compared to that of lean tuna (T. maccoyii) to investigate the suitabilityof tylose pastes for industrial MW tests in microwaveable food development(Fig. 13.8). Closer matching of the dielectric behavior of food models to real foodsamples can be achieved by fine-tuning the addition of suitable additives other thansalt (e.g., sucrose and olive oil), as was reported by Luan et al. (2015). Table 13.3shows selected data on DPs of frozen food models at MW frequencies.

Table 13.3
DPs of selected frozen food models in the MW range.
FrozenFoodModels
Frequency(MHz)
Temperature(°C) ɛ′r ɛ″r References
Bentonite paste8%
2450 −25/−10/0 3.6/3.7/69.2 0.4/0.5/17.9 Tong andLentz(1993)
Bentonite paste10%
2450 −25/−10/0 3.6/3.8/67.8 0.4/0.6/16.8 Tong andLentz(1993)
Bentonite paste10%
2450 −25/−10/0 2.9/3.1/69.7 0.6/0.7/21.9 Liu and Sakai(1999)
Bentonite paste10%
915 −25/−10/0 4.46/4.79/67.62
0.45/0.61/11.23 Llave andSakai(2016)
Tylose 2450 −20 to −2 5.59 ɛ″r = 1.08 × exp(0.0648 × T)
Curet et al.(2008)
Tylose paste23%
915/24509 −30 to +60 4.43–43.74 0.63–3.41 Llave et al.(2016)
Tylose paste23% + 0.5%salt
15/2450 −30 to +60 4.45–43.47 0.57–20.33 Llave et al.(2016)
Tylose paste23% + 1.0%salt
915/2450 −30 to +60 4.53–47.37 0.65–39.86 Llave et al.(2016)
Tylose paste23% + 2.0%salt
915/2450 −30 to +60 4.37–46.92 0.50–68.12 Llave et al.(2016)
%, w.b., Wet basis.
5. Mathematical Modeling of Dielectric Defrostingof Frozen FoodsEven though dielectric heating of frozen foods involves multiple physical effects,food product development has proceeded via trial and error, which is a very time-consuming and expensive approach in the food industry. Experimental techniquesalone sometimes are insufficient for optimizing food product design to achieveuniform heating, due to the complex interactions of dielectric waves with various

food components; therefore, predictive simulation is desirable. Recently,multiphysics models were developed to characterize the heating of food products inMW and RF ovens. These models can enhance the understanding of interactionsbetween the dielectric waves and the food products and serve as an excellent toolfor food product developers during the design of a food product that cooks moreuniformly across a range of MW and RF ovens. Modeling is one way to design andoptimize such a process where some complexities have been reported due tocoupling of the heat transfer with the phase change and the solution of an electricfield (Resurreccion et al., 2013). In dielectric thermal processes, the resolution ofMaxwell’s equations (the equations that describe the EM field within an applicator;Maxwell’s equations can predict the absorption of energy, accounting for thereflections at the front and back surfaces, as well as all internal interfaces) and ofthe heat equation cannot be performed separately. Indeed, the magnitude of thelocal electric field will influence the source term of the heat equation, and thetemperature-dependent DPs will alter the distribution of the electric field.Additionally, variations in thermophysical properties in the phase transition regionalso increase the complexity of a MW and RF defrosting simulation. The mostcommonly applied numerical method for solution of the EM and heat and masstransfer equation is the finite element method (FEM). An alternative method is thefinite difference time domain, which is limited in simulation applications becauseof its inability to handle irregular geometric features and longer computational time(Pitchai et al., 2015).
In modeling of a defrosting process, the major challenge is the presence of themoving boundary condition, which leads to a complex interaction of the thawingfront, temperature profiles, and absorbed energy within the sample(Rattanadecho, 2004). In some published works on modeling of MW thawing(Basak and Ayappa, 1997; Rattanadecho, 2004), the calculations introduced adifferential layered sample (ice and liquid). Basak and Ayappa (1997) noted that aphase change occurs during thawing and that the position of the phase changeinterface and the total thawing periods must be predicted by the model. Such anapproach, however, is complicated by the exact positioning of ice/liquid layers.Thawing happens over an extended temperature range and in multicomponentsamples like food, solid and liquid phases coexist in a heterogeneous region knownas the mushy zone. To analyze the thawing of materials, several methods have beenproposed, such as the temperature method (which is analyzed with a fixed meltingpoint), the enthalpy or effective heat capacity method (which implies that materialsmelt across a range of temperatures) also known as the fixed-grid methods, and theapparent-specific-heat method.

(13.11)
(13.12)
(13.13)
(13.14)
(13.15)
5.1. Basics of the Mathematics of DielectricHeating5.1.1. Governing equations
5.1.1.1. ElectromagneticsThe EM field distribution in space and time of EM waves like MWs and RF wavesis governed by Maxwell’s equations. The differential form of Maxwell’s equationsare as follows (Knoerzer et al., 2008):
where is the electric-field intensity (V m−1); is the magnetic-field
intensity (A m−1); is the magnetic induction (Wb m−2); is the electricdisplacement (C m−2); ρm is the electric volume charge density (C m−3); J is thecurrent flux (A m−2); ɛr is the complex permittivity (Eq. 13.1); and permeability μ

(13.16)
can be expressed using the magnetic permeability of free space: μ0 = 4π × 10−7 (Hm−1). Electric conductivity σ is related to the relative dielectric loss factor of thematerial (ɛ″r ); ω (= 2πf, where f is the frequency of the RF wave) is the angularfrequency (rad s−1), and ɛ0 = 8.854 × 10⁻¹² (F m−1) is the permittivity of free space.
5.1.1.2. Heat generationThe absorbed power per unit volume (Q, W m−3) in the material is directlyproportional to the square of the electric field strength (E, V m−1), the ɛ″r of thematerial, and the frequency (f, Hz) of the generator:
where Erms is the root mean square value of the electric field, which is equal to 1/
√2 times the E-field amplitude, and is the modulus of the E(x, y, z) field.A dielectric material with a considerable power dissipation capability (a loss
material) placed between two plate electrodes (RF heating) or within a cavity (MWheating) interacting with an EM field is the basis of dielectric heating. Todetermine the absorbed power density at any point inside the sample, the value of Emust be known, and E depends on the sample geometry, DPs, and systemconfiguration.
5.1.1.3. Heat transferThe thawing process is at its most basic a phase change. There are two concomitantphases involved in the complex process of heat conduction in frozen foods, andsome energy is absorbed by the latent heat prior to the production of sensible heat.Introducing an apparent specific heat (Capp) parameter, which accounts for thelatent heat of fusion, can simplify matters. In this way, a three-dimensional (3D)heat transfer equation (dependent on the thermophysical properties of the sample)in addition to the internal heat production resulting from dielectric heating can beused to simulate temperature distributions:

(13.17)
where T is the temperature (K), k is the thermal conductivity (W m−1 K−1), ρ isthe density (kg m−3), Capp is expressed in J kg−1 K−1, and Q is the internal heatgeneration obtained from Eq. (13.16).
Converting a moving boundary problem into a heat conduction problem with aphase change requires an apparent specific heat term (Succar andHayakawa, 1983). The same governing equation can then be used for both phases,and the moving boundary condition can be implicitly incorporated into theequation (Llave et al., 2015). Fourier’s heat equation with a generation term (Eq.13.17) can be employed along with the heat generation data to calculate the spatialand transient temperatures. Simultaneous solutions can be obtained using severalnumerical algorithms and specialized software, described in detail by Awuah et al.(2014), Koutchma and Yakovlev (2010), Tilford et al. (2007), and Zhang andMarra (2010). The selection of the appropriate boundary conditions depends ofseveral factors, which include the type and geometry of the sample, the selectedsolution method, the characteristics of the oven, the assumptions, and others. Fordetails, readers see the article by Chakravorti (2015).
5.2. Modeling of RF Defrosting of Frozen FoodsThe phase change problem, which is inevitable in a defrosting process, has beenhandled in two novel defrosting models assisted by RF heating, using apparentspecific heat, including the latent heat of fusion during calculations aside from thechanges in physical properties as well as DPs especially in the vicinity of thefreezing point (Llave et al., 2015; Uyar et al., 2015). In the apparent-specific-heat model, the goal of considering the changes in the specific heat of the apparentlatent heat is to simplify the handling because it does not consider the movingboundary surface of the melting layer and frozen layer.
It was reported by Uyar et al. (2014) that during RF heating the powerabsorption is strongly dependent on the sample size. They also reported that RFpower absorption is higher for a large block of food, and as a result, the thawingduration is shorter, and this phenomenon might be even more effective for frozenproducts due to the DPs of ice. Some of these results were used for thedevelopment of a computer model for analysis of RF thawing of frozen beefsamples of various sizes using a 27.12-MHz RF system (Uyar et al., 2015). Llaveet al. (2015) also reported a 3D model for simulating RF defrosting that improved

on the simulation performance of 50 Ω RF systems by allowing the constant total-power-absorbed value inside the sample to be controlled. The RF defrosting modelwas validated for the defrosting of tuna muscles. In a simulation, the experimentalresults reported by Llave et al. (2014) were confirmed in relation to the finding thata less uniform heating is observed when electrodes have sizes different from thoseof the upper surface of the sample (Fig. 13.9).

FIGURE 13.9 A schematic view of the upper electrode (400 × 260 mm) andits projections (40 × 60, 60 × 60, and 100 × 200 mm) used in the RF system(A), and simulated electric field distribution (in V m–1) after 5 min of RFthawing of the whole system using different projection sizes of the upperelectrode (B). White dotted lines are the outline of the lean tuna samples.Reproduced from Fig. 11 in Llave, Y., Liu, S., Fukuoka, M., Sakai, N., 2015. Computer simulation ofradiofrequency defrosting of frozen foods. J. Food Eng. 152, 32–42.
5.3. Modeling of MW Defrosting of Frozen FoodsModeling work on defrosting of frozen foods by MW heating can be broadlysubdivided into two groups based on how the EM were modeled (Chenet al., 2016b): (1) using plane waves with or without an exponential decay solutionof the EM field; and (2) using MW cavity solutions. Studies in the first group

include all the early work before dramatic improvements in both computerhardware and software. Some mechanistic understanding of MW heating wasreported in studies of this first group, but according to Taher and Farid (2001), thesolution proposed by these models cannot capture the nonuniformity of the electricfield or other EM details.
In the second group are the relatively more recent models in which cavitysolutions are coupled with heat transfer, and changing DPs are taken into account.With advances in computing power, it is now possible to couple multiphysicssimulations where Maxwell’s equations are solved in the MW cavity and food.
Most MW ovens manufactured today have a turntable that rotates the foodduring heating to improve the MW heating uniformity. There is a significantvariation in EM field distribution within the cavity at different locations; for thisreason, the rotation of the turntable needs to be included in the modeling process.Only a few studies included rotation of the turntable when modeling MW heating(Chen et al., 2016a; Geedipalli et al., 2007; Liu et al., 2013; Pitchai et al., 2014; 2015). Because of difficulties with implementation of the rotation, discreterotating steps are often used. The heating pattern of a food product is mainlydetermined by the EM power distribution. Thus, characterizing the EM powerdensity during the heating process helps to understand the interactions betweenMW and dielectric food products. For frozen foods, with a characteristic rapidchange of DPs (a big change in dp) during heating, the changes in EM powerdensity during heating need to be clarified (Chen et al., 2015). Those researchersreported that mashed potatoes at the refrigerated and room temperature absorbsimilar and relatively constant MW energy during the heating, whereas frozenmashed potatoes absorb slightly less energy (∼18% less) at the beginning ofheating, and then catch up quickly with the power absorption level of fresh mashedpotatoes in ∼20 s.
Although several MW models for thawing of frozen food products have beenreported, most of these models couple only EM heating and heat transfer tosimulate the MW heating process for a short heating period or with cycled MWpower. In these models, the food products are assumed to be a single-phase solidfood product where evaporation and moisture movement within the food areignored (Chen et al., 2016a). The latter researchers developed a comprehensive 3Dfinite-element model to describe MW heating of a food product on a rotatingturntable, including multiphysics of Maxwell’s EM heating, energy conservation,Darcy’s velocity, mass conservation of water and gas, and the phase transition ofmelting and evaporation of water. These approaches have been reported to providebetter understanding of moisture evaporation and movement (which is critical forfood quality) and resulted in a more accurate simulation of temperature

distributions. The MW heating models that consider only heat transfer oftenoverestimate temperature when compared to experiments, especially for longerheating periods (Pitchai et al., 2012, 2014). In models without mass transferphysics, the higher temperature is a consequence of neglecting the movement ofmoisture from the top surface of the product, which removes a large portion of thesurface thermal energy. Although the apparent specific heat capacity term takesinto account the latent heat of evaporation, the temperature continues to increaserapidly beyond the latent heat region if mass transfer is ignored in the model. Inreality, however, the evaporated moisture escapes the food surface taking awaysome thermal energy while the moisture from the interior moves to the drier areaand continues to maintain the temperature at ∼100°C, as shown in Fig. 13.10(Chen et al., 2016a).
FIGURE 13.10 Simulated Temperature and Pressure Horizontal ProfilesAfter 2, 4, and 6 min of MW Heating of Frozen Mashed Potatoes.Reproduced from Fig. 10 in Chen, J., Pitchai, K., Birla, S., Jones, D., Negahban, M., Subbiah, J.,2016a. Modeling heat and mass transport during microwave heating of frozen food rotating on aturntable. Food Bioprod. Process 99, 116–127.
Chen et al. (2016b) developed a comprehensive mechanistic understanding ofthe EM and thermal characteristics of the thawing of frozen foods in a domestic

MW oven cavity using a beef substitute (frozen tylose). They reported that as thematerial thaws, total energy absorption decreases, explained by the continuouschanges in DPs. Shifts in the resonant frequency of the cavity as load size changesexplain the changes in total energy absorption with size. They also explored theMW technology used in inverter heating, which is a relatively newer mode ofheating that involves a constant power level during thawing, as opposed to themore typical cycled-power heating. In cycled-power heating, the magnetrondelivers 100% of the power followed by the absence of power. However, Chenet al. (2016b) reported that regardless of whether inverter or cyclical heating isinvolved, there is little difference in the overall heating rate or uniformity or colorof frozen tylose between the two MW heating technologies.
5.4. Modeling of Multicomponent Frozen MealsDuring MW HeatingMW heating of a frozen heterogeneous meal is highly nonuniform. Pitchai et al.(2015) listed the main reasons:
• nonuniform distribution of MW within the cavity (Pitchai et al., 2012);• food components having different dielectric and thermal properties, leading
to different MW power absorption values, heat dissipation, and diffusion(Chamchong and Datta, 1999);
• thawed regions’ absorbing more energy than frozen regions’, leading tothermal runaway heating (Tilford et al., 2007); and
• differences in physical properties (size, shape, and location of the food)leading to different heating rates (Zhang and Datta, 2000).
Frozen microwaveable meals are available as ready-to-eat or as not-ready-to-eatproducts, meaning in the last case that the product has to be thoroughly cooked bythe consumer before consumption to ensure food safety. Frozen meals are availablein a variety of product layouts, such as single-component, multicomponent, andmulticompartment meals. Thus, application of MW defrosting may produce anonuniform temperature distribution within the food, possibly resulting inovercooked and undercooked regions. This is especially important because whenthe cooking temperature does not reach the desired target level for inactivatingmicroorganisms, they can survive in the cold regions and cause a foodborne illness(Pitchai et al., 2014).
In multicompartment meals, the low-loss components should be small involume, and the high-loss components should occupy a large volume, so that more

uniform heating can be achieved. Zhang and Datta (2003) reported that when twofoods having significantly different DPs are heated simultaneously in a MW oven,the amount of power that one food absorbs relative to the other could determine theoverall success of the heating process. For example, in the reheating of amulticompartment frozen dinner, vegetables and mashed potatoes do not heat at thesame rate, and depending on the duration of heating, vegetables may end up losingall the moisture while parts of the mashed potatoes remain frozen. Foods with asmall loss factor, such as frozen foods, may not absorb less power if they aresufficiently large, while high-loss foods usually absorb more power at small sizes(Zhang and Datta, 2003). Therefore, relations between the critical variables need tobe based on engineering fundamentals, such as the total power absorption as afunction of a food’s DPs, size, and shape, and relative power absorption when twoor more foods are heated simultaneously. Such relations can help developers ofmicrowavable food products and processors to better understand MW defrostingand to reduce the role of trial and error in the improvement of quality.
A few recently developed MW heat transfer models have been reported forheterogeneous multicomponent meals going through a multiphase change (frozento thawed to cooked). For instance, Pitchai et al. (2014) reported a 3D FEM modelfor heating of a frozen two-component meal on a turntable, using chicken nuggetsand mashed potatoes. In that study, components were homogeneous and were nottouching each other (Fig. 13.11). Predicted spatial surface temperature distributionswere in good agreement with the corresponding experimental distribution in termsof patterns of hot and cold spots (Fig. 13.12).

FIGURE 13.11 The Meshing Scheme Implemented for the Oven Cavityand a Multicomponent Meal Tray. Reproduced from Fig. 3 in Pitchai, K., Chen, J., Birla,S., Gonzalez, R., Jones, D., Subbiah, J., 2014. A microwave heat transfer model for a rotating multi-component meal in a domestic oven: development and validation. J. Food Eng. 128, 60–71.

FIGURE 13.12 Comparison of Spatial Temperature Profiles inExperiments With Simulation of 90-s Heating in a 1200-W MicrowaveOven of a Multicomponent Meal Tray (Including Chicken Nuggets andMashed Potatoes). Reproduced from Fig. 10 in Pitchai, K., Chen, J., Birla, S., Gonzalez, R.,Jones, D., Subbiah, J., 2014. A microwave heat transfer model for a rotating multi-component mealin a domestic oven: Development and validation. J. Food Eng. 128, 60–71.
Pitchai et al. (2015) developed a 3D FEM model for a frozen heterogeneouslasagna meal to predict temperature and moisture while heating in a domestic MWoven with a turntable (Fig. 13.13). The model was demonstrated to be useful forresearch into various packages, shapes, layout, and thickness of each layer, withadjustment of ingredients in each layer for improved uniformity to enhance bothfood safety and quality (Fig. 13.14).

FIGURE 13.13 The geometric model of a 1200-W domestic microwaveoven: Model No. NN-SD767W, Panasonic Corporation, Shanghai, China (A)and layers of food components of lasagna (B). Reproduced from Fig. 1 in Pitchai, K.,Chen, J., Birla, S., Jones, D., Gonzalez, R., Subbiah, J., 2015. Multiphysics modeling of microwaveheating of a frozen heterogeneous meal rotating on a turntable. J. Food Sci. 80 (12), E2803–E2814.

FIGURE 13.14 A Slice Plot of Temperature, Vapor Pressure, VaporConcentration, and Final/Initial Moisture Content Distribution at the Endof a 6-min Heating Period for Thawed Lasagna. (A) Temperature (°C), (B) Vapor pressure (Pa), (C) Vapor concentrationnormalized to porosity (mol/m3), and (D) Percent moisture loss in dry basis(%). Reproduced from Fig. 10 in Pitchai, K., Chen, J., Birla, S., Jones, D., Gonzalez, R., Subbiah,J., 2015. Multiphysics modeling of microwave heating of a frozen heterogeneous meal rotating on aturntable. J. Food Sci. 80 (12), E2803–E2814.
6. Approaches to Uniform HeatingRapid food reheating and convenience have made MW ovens ubiquitous, but theproblem of nonuniform temperatures in the food remains. This disadvantage isobvious in food thawing, owing to the solid and liquid phases of water (major foodcomponents) having considerably different DPs. Overheating in the corners, alongthe edges, and in the center, particularly in foods with intermediate or high watercontents is a result of runaway heating (Vadivambal and Jayas, 2010). Asbiological systems are multicomponent, the solid–liquid water phase transitiontakes place across a finite temperature range. When the ice in food melts,absorption of dielectric waves increases tremendously. Thus, the regions that willthaw sooner will absorb an increasing amount of dielectric energy and can boil

while other regions within the same piece of food are still frozen, especially in thecase of MW heating.
Many studies, mainly on meat matrices, have shown runaway heatingphenomena in RF and MW thawing applications. Lean/fat blends and full-fat beefmeats but not lean beef meats have exhibited runaway heating during RF thawing(Farag et al. 2011). Small blocks of frozen tuna showed similar behavior (Llaveet al., 2014), with runaway heating being more difficult to avoid in fatty tuna.Farag et al. (2008b) compared RF and MW tempering of beef samples in terms ofheating uniformity using the infrared (IR) snapshot method. They found that RFtempering provides better temperature uniformity as compared with MWtempering, where nonuniform heating results in formation of hot spots in variousregions within the beef samples. There are many factors affecting MW heatinguniformity including DPs (ɛ′r and ɛ″r ), thermal properties (specific heat capacityand thermal conductivity), and physical properties (size, shape, density, andlocation in the package) of foods (Zhang and Datta, 2000). Meanwhile sample DPs,sample size—geometry, and sample position between RF electrodes with electrodeconfiguration affect power absorption of the processed sample and hence thetemperature and uniformity of thermal field (Uyar et al., 2016).
There are several optimization studies focused on the improvement of heatinguniformity and on minimization of runaway heating problems during dielectricheating. Some studies have been focused on minimizing runaway heating duringMW thawing by applying cyclic heating (Taher and Farid, 2001), by limitingthermal runaway via refrigeration of the surface during MW thawing (Virtanenet al., 1997), and by greatly improving the uniformity of MW heating by means ofvariable-frequency MW waves, adding a mode-stirrer near the waveguide, androtating the waveguide or moving food in the cavity (Liu et al., 2014). Damouret al. (2012) summarized the most relevant approaches published until then thatprovide solutions to the problem of thermal runaway and developed novelapproaches for optimization of the energy consumption during defrosting by MWheating. Nevertheless, the success of such methods is contingent on the design ofaccurate mathematical models to simulate dielectric defrosting of frozen foods.
Jiao et al. (2014a) validated a method, experimentally and by modeling, using aplastic material—polyetherimide (PEI)—to facilitate improvement of RF heatinguniformity in peanut butter (in cylindrical plastic jars). They found that PEIreduces the difference between the maximal and minimal temperature of the topsurface and cross-sectional surface temperatures; thus, this method showed thepotential for improvement of the heating uniformity of low-moisture foods heatedin RF systems and may be of interest after its validation for frozen foods. Knowingthe DPs as a function of temperature, moisture content, and other properties before

(13.18)
the experiments may help to predict possible thermal runaway and temperaturedistribution in the bulk food. For this reason, a mathematical equation was deduced(Jiao et al., 2014b) to better understand the heating behavior of food productsduring RF heating with a free-running oscillator:
where Tf is the final temperature of the load (°C), Ti is the initialtemperature of the load (°C), t is the total processing time (s), V is the voltage (thetotal electric potential between the two electrodes, V), d0 is the air gap (m), and dm
is the sample height (m). In RF systems with a fixed electrode gap, the heating ratehas been reported to be mainly affected by the DPs; salt solutions and peanut buttersamples heated in a 27.12-MHz 6-kW RF system validated the results. Althoughthe results indicated that the heating rate could be predicted by the mathematicalmodel in a large range and under various RF heating conditions, it needs to bevalidated for frozen foods that also show a phase transition.
Geedipalli et al. (2007) developed a MW heat transfer model for rotation of apotato slab at the center of the turntable. They demonstrated that the rotation of theturntable can improve heating uniformity by 40%. In contrast, Pitchai et al. (2015)reported that nonuniform heating persists even after rotation of the frozen lasagnaduring heating. Rotation primarily makes the heating more uniform along thecircumference of the piece of food and makes the heating pattern more symmetric;however, nonuniform heating persists across the radius of the rotation, asconfirmed by an experiment. Liu et al. (2013) also reported edge heating duringMW heating of rotating foods. Edge heating is prominent in MW cooking becauseMWs incident on the edges come from multiple directions resulting in fasterheating. Due to rapid MW heating, the temperature of a food product candramatically change with small changes in spatial locations. This phenomenonposes a major challenge for real-time temperature measurement during MWcooking using fiber-optic probes because a small movement or change of thelocation of the probes in the food may result in substantial alterations in themeasured temperature (Pitchai et al., 2015). The latter authors provided evidenceof huge nonuniformity between different layers of the lasagna in which a maximaltemperature difference between the different layer components exceeded 100°C,with some portions close to the freezing or near the thawing temperature. Although

heating uniformity is an important parameter of a food product design in terms offood quality (which is greatly influenced by the uniformity of EM powerdistribution), MW heating models incorporating physics of EM and heat transferare computationally intensive (which limits their use in the industry). Chen et al.(2015) studied the effect of decoupling EM from heat transfer analysis on accuracyand computation time, which was evaluated for MW heating of mashed potatoes atvarious initial states (frozen and fresh). The simulation and validation resultsrevealed that the simplification (the decoupled approach) did not affect thepredicted temperature considerably while reducing the computation duration by93%.
Domestic MW oven magnetrons produce MWs in the frequency range2.45 ± 0.05 GHz. Most MW heat transfer simulations simplify this processassuming that the magnetron produces a monochromatic EM wave (e.g., atfrequency 2.45 GHz) to reduce the computational complexity. An approach toimprovement of a simulation of MW heating of frozen mashed potatoes in adomestic oven was recently reported by Pitchai et al. (2016). They developed aMW EM and heat transfer model that includes the frequency spectrum using anapproximated Gaussian-shape distribution to calculate the EM power density. Theyfound that implementing the MW frequency spectrum in the simulation improvedthe accuracy of the temperature field pattern and transient temperature profile whencompared to monochromatic frequency of 2.45 GHz.
7. ConclusionsThis chapter attempts to describe the behavior of frozen foods when subjected todielectric heating and may serve as a database of the reported DPs for frozen foodsand frozen food models in MW and RF bands. Designers of RF and MW defrostingsystems may find these reported DPs useful, and it is envisaged that heatingpatterns of defrosting using dielectric heating could be studied with these DPs. Theinformation obtained via computer simulations can help to achieve uniform heatingand prevent runaway problems (which results in enhanced food safety) during aprocess of defrosting of frozen foods assisted by MW or RF heating.
In addition, the data discussed in this chapter have the potential to facilitate thedevelopment of microwavable and RF-processable food products for massconsumption and improve the design and optimization of newer MW and RF ovensthrough better mechanistic understanding of dielectric defrosting.
References

Awuah GB, Ramaswamy HS, Tang J, eds. Radio-Frequency Heating in Food Processing: Principles andApplications (Electro -Technologies for Food Processing Series). Boca Raton, FL, United States: CRCPress Taylor & Francis Group; 2014.
Basak T, Ayappa KG. Analysis of microwave thawing of slabs with effective heat capacity method. AIChE J..1997;43(7):1162–1174.
Basaran-Akgul N, Basaran P, Rasco BA. Effect of temperature (−5 to 130°C) and fiber direction on thedielectric properties of beef semitendinosus at radio frequency and microwave frequencies. J. Food Sci..2008;73(6):243–249.
Bengtsson NE, Melin J, Remi K, Säoderlind S. Measurements of the dielectric properties of frozen anddefrosted meat and fish in the frequency range 10–200 MHz. J. Sci. Food Agric.. 1963;14(8):592–604.
Boillereaux L, Alamir M, Curet S, Rouaud O, Bellemain P. Estimation of temperature field during microwavetempering with unknown dielectric properties using CLPP: a generic user-friendly software sensor. Innov.Food Sci. Emerg.. 2011;12:288–297.
Chakravorti S. Electric Field Analysis. Boca Raton, FL, United States: CRC Press Taylor & Francis Group;2015: (Chapter 6).
Chamchong M, Datta AK. Thawing of foods in a microwave oven: II effect of load geometry and dielectricproperties. J. Microw. Power Electromagn. Energy. 1999;34(1):22–32.
Chen J, Pitchai K, Birla S, Gonzalez R, Jones D. Temperature-dependent dielectric and thermal properties ofwhey protein gel and mashed potato. T. ASABE. 2013;56(6):1457–1467.
Chen J, Pitchai K, Birla S, Jones D, Negahban M, Subbiah J. Modeling heat and mass transport duringmicrowave heating of frozen food rotating on a turntable. Food Bioprod. Proc.. 2016;99:116–127.
Chen J, Pitchai K, Jones D, Subbiah J. Effect of decoupling electromagnetic from heat transfer analysis onprediction accuracy and computation time in modelling microwave heating of frozen and fresh mashedpotato. J. Food Eng.. 2015;144:45–57.
Chen F, Warning AD, Datta AK, Chen X. Thawing in a microwave cavity: comprehensive understanding ofinverter and cycled heating. J. Food Eng.. 2016;180:87–100.
Cheng Y, Sakai N, Hanzawa T. Effects of dielectric properties on temperature distributions in food modelduring microwave heating. Food Sci. Technol. Int. Tokyo. 1997;3:324–328.
Curet S, Rouaud O, Boillereaux L. Microwave tempering and heating in a single-mode cavity: numerical andexperimental investigations. Chem. Eng. Process.. 2008;47:1656–1665.
Curet S, Rouaud O, Boillereaux L. Estimation of dielectric properties of food materials during microwavetempering and heating. Food Bioprocess Technol.. 2014;7:371–384.
Damour C, Hamdi M, Josset C, Auvity B, Boillereaux L. Energy analysis and optimization of a food defrostingsystem. Energy. 2012;37:562–570.
Datta AK, Sumnu G, Raghavan GSV. Dielectric properties of foods. In: Rao MA, Rizvi SS, Datta AK, AhmedJ, eds. Engineering Properties of Foods. fourth ed. Boca Raton, FL, United States: CRC Press Taylor &Francis Group; 2014:571–636.
Farag KW, Lyng JG, Morgan DJ, Cronin DA. Dielectric and thermophysical properties of different beef meatblends over a temperature range of −18 to +10°C. Meat Sci.. 2008;79:740–747.
Farag KW, Lyng JG, Morgan DJ, Cronin DA. A comparison of conventional and radio frequency tempering ofbeef meats: effects on product temperature distribution. Meat Sci.. 2008;80:488–495.
Farag KW, Lyng JG, Morgan DJ, Cronin DA. A comparison of conventional and radio frequency thawing ofbeef meats: effects on product temperature distribution. Food Bioprocess Technol.. 2011;4:1128–1136.
Geedipalli SSR, Rakesh V, Datta AK. Modeling the heating uniformity contributed by a rotating turntable inmicrowave ovens. J. Food Eng.. 2007;82:359–368.
Gunasekaran N, Mallikarjunan P, Eifert J, Sumner S. Effect of fat content and temperature on dielectricproperties of ground beef. T. ASABE. 2005;48(2):673–680.

Hagiwara T, Hayashi R, Suzuki T, Takai R. Fractal analysis of ice crystals in frozen fish meat. J. Food Eng..2003;4:11–17.
Icier F, Izzetoglu GT, Bozkurt H, Ober A. Effects of ohmic thawing on histological and textural properties ofbeef cuts. J. Food Eng.. 2010;99(3):360–365.
James SJ, James C. Meat Refrigeration. Cambridge, United Kingdom: Woodhead Publishing; 2002.Jiao Y, Tang J, Wang S. A new strategy to improve heating uniformity of low moisture foods in radio
frequency treatment for pathogen control. J. Food Eng.. 2014;141:128–138.Jiao Y, Tang J, Wang S, Koral T. Influence of dielectric properties on the heating rate in free-running oscillator
radio frequency systems. J. Food Eng.. 2014;120:197–203.Jiao S, Luan D, Tang J. Principles of radio-frequency and microwave heating. In: Awuah GB, Ramaswamy HS,
Tang J, eds. Radio-Frequency Heating in Food Processing: Principles and Applications (Electro-Technologies for Food Processing Series). Boca Raton, FL, United States: CRC Press Taylor & FrancisGroup; 2014:3–20.
Knoerzer K, Regier M, Schubert H. A computational model for calculating temperature distributions inmicrowave food applications. Innov. Food Sci. Emerg.. 2008;9(3):374–384.
Komarov VV. Handbook of Dielectric and Thermal Properties of Materials at Microwave Frequencies.Boston, MA, United States: Artech House; 2012.
Koutchma T, Yakovlev V. Computer modelling of microwave heating processes for food preservation. In:Farid MM, ed. Mathematical Modeling of Food Processing. Boca Raton, FL, United States: CRC PressTaylor & Francis Group; 2010:625–658.
Lau MH, Tang J, Taub IA, Yang TCS, Edwards CG, Mao R. Kinetics of chemical maker formation in wheyprotein gels for studying microwave sterilization. J. Food Eng.. 2003;60:397–405.
Leygonie C, Britz TJ, Hoffman LC. Impact of freezing and thawing on the quality of meat: review. Meat Sci..2012;91:93–98.
Liu S, Fukuoka M, Sakai N. A finite element model for simulating temperature distributions in rotating foodduring microwave heating. J. Food Eng.. 2013;115(1):49–62.
Liu S, Ogiwara Y, Fukuoka M, Sakai N. Investigation and modeling of temperature changes in food heated ina flatbed microwave oven. J. Food Eng.. 2014;131:142–153.
Liu C, Sakai N. Dielectric properties of tuna at 2450 MHz and 915 MHz as a function of temperature. J. Jpn.Soc. Food Sci.. 1999;46(10):652–656.
Liu CM, Wang QZ, Sakai N. Power and temperature distribution during microwave thawing, simulated byusing Maxwell’s equations and Lambert’s law. Int. J. Food Sci. Tech.. 2005;40:9–21.
Llave Y, Sakai N. Dielectric properties of frozen foods. In: Marra F, Barba AA, Lyng JG, eds. DielectricProperties and Experimental Measurement: Foods, Bio-Systems and Health Materials. New York, NY,United States: Springer; 2016.
Llave Y, Liu S, Fukuoka M, Sakai N. Computer simulation of radiofrequency defrosting of frozen foods. J.Food Eng.. 2015;152:32–42.
Llave Y, Mori K, Kambayashi D, Fukuoka M, Sakai N. Dielectric properties and model food application oftylose water pastes during microwave thawing and heating. J. Food Eng.. 2016;178:20–30.
Llave Y, Terada Y, Fukuoka M, Sakai N. Dielectric properties of frozen tuna and analysis of defrosting using aradio-frequency system at low frequencies. J. Food Eng.. 2014;139:1–9.
Luan D, Tang J, Liu F, Tang Z, Li F, Lin H, et al. Dielectric properties of bentonite water pastes used for stableloads in microwave thermal processing systems. J. Food Eng.. 2015;161:40–47.
Mao W, Watanabe M, Sakai N. Dielectric properties of frozen surimi at 915 MHz and 2450 MHz. Food Sci.Technol. Res.. 2003;9(4):361–363.
Mascheroni RH, Calvelo A. Relationship between heat transfer parameters and the characteristic damagesvariables for the freezing of the beef. Meat Sci.. 1980;4(4):267–285.

Min S-G, Hong G-P, Chun J-Y, Park SH. Pressure ohmic thawing: a feasible approach for the rapid thawing offrozen meat and its effects on quality attributes. Food Bioprocess Technol.. 2016;9:564–575.
Mudgett RE. Dielectric properties of foods. In: Decareau RV, ed. Microwaves in the Food Processing Industry.Orlando, FL, United States: Academic Press Inc.; 1985:15–37.
Nelson SO, Datta AK. Dielectric properties of food materials and electric field interactions. In: Data AK,Anantheswaran RC, eds. Handbook of Microwave Technology for Food Applications. New York, NY,United States: Marcel Dekker; 2001:69–114.
Padua GW. Proton NMR and dielectric measurements on sucrose-filled agar gels and starch pastes. J. FoodSci.. 1993;58:603–605.
Pitchai K, Birla SL, Subbiah J, Jones D, Thippareddi H. Coupled electromagnetic and heat transfer model formicrowave heating in domestic ovens. J. Food Eng.. 2012;112:100–111.
Pitchai K, Chen J, Birla S, Gonzalez R, Jones D, Subbiah J. A microwave heat transfer model for a rotatingmulti-component meal in a domestic oven: development and validation. J. Food Eng.. 2014;128:60–71.
Pitchai K, Chen J, Birla S, Jones D, Gonzalez R, Subbiah J. Multiphysics modeling of microwave heating of afrozen heterogeneous meal rotating on a turntable. J. Food Sci.. 2015;80(12):E2803–E2814.
Pitchai K, Chen J, Birla S, Jones D, Subbiah J. Modeling microwave heating of frozen mashed potato in adomestic oven incorporating electromagnetic frequency spectrum. J. Food Eng.. 2016;173:124–131.
Pizza A, Pedrielli R, Busetto M, Bocchi M, Spinelli R. Use of radiofrequencies in the meat processingindustry: effects of the quality characteristics of meat and cooked meat products. Ind. Conserve.1997;72:122–133.
Rattan NS, Ramaswamy HS. Radio-frequency thawing and tempering. In: Awuah GB, Ramaswamy HS, TangJ, eds. Radio-Frequency Heating in Food Processing: Principles and Applications (Electro-Technologiesfor Food Processing Series). Boca Raton, FL, United States: CRC Press Taylor & Francis Group;2014:247–258.
Rattanadecho P. Theoretical and experimental investigation of microwave thawing of frozen layer using amicrowave oven (effects of layered configurations and layer thickness). Int. J. Heat Mass Transf..2004;47(5):937–945.
Resurreccion FP, Tang J, Tang Z. Development of a computer simulation model for processing food in amicrowave assisted thermal sterilization (MATS) system. J. Food Eng.. 2013;118(4):406–416.
Sahin S, Summu SG. Electromagnetic properties. In: Sahin S, Sumnu SG, eds. Physical Properties of Foods.New York, NY, United States: Springer; 2006:157–192.
Sakai N, Mao W, Koshima Y, Watanabe M. A method for developing model food system in microwaveheating studies. J. Food Eng.. 2005;66:525–531.
Seyhun N, Ramaswamy H, Summu G, Sahin S, Ahmed J. Comparison and modelling of microwave temperingand infrared assisted microwave tempering of frozen potato puree. J. Food Eng.. 2009;92:339–344.
Seyhun N, Sumnu SG, Ramaswamy H. Ohmic heating as thawing and tempering technology. In: RamaswamyHS, Marcotte M, Sastry S, Abdelrahim K, eds. Ohmic Heating in Food Processing. Boca Raton, FL, UnitedStates: CRC Press Taylor & Francis Group; 2014:369–379.
Shukla TP, Anantheswaran RC. Ingredient interactions and product development. In: Datta AK,Anantheswaran RC, eds. Handbook of Microwave Technology for Food Applications. New York, NY,United States: Marcel Dekker; 2001:355–395.
Sipahioglu O, Barringer SA, Taub I, Prakash A. Modeling the dielectric properties of ham as a function oftemperature and composition. J. Food Sci.. 2003;68(3):904–909.
Succar J, Hayakawa K. Empirical formulas for predicting thermal physical properties of food at freezing ordefrosting temperature. LWT Food Sci. Technol.. 1983;16:326–331.
Taher B, Farid M. Cyclic microwave thawing of frozen meat: experimental and theoretical investigation.Chem. Eng. Process.. 2001;40(4):379–389.

Tanaka F, Mallikarjunan P, Hung YC. Dielectric properties of shrimp related to microwave frequencies: fromfrozen to cooked stages. J. Food Process Eng.. 1999;22:455–468.
Tilford T, Baginski E, Kelder J, Parrott K, Pericleous K. Microwave modelling and validation in food thawingapplications. J. Microw. Power Electromagn. Energy. 2007;41(4):30–45.
Tong CH, Lentz RR. Dielectric properties of bentonite pastes as a function of temperature. J. Food Process.Pres.. 1993;17:139–145.
Trabelsi S. Variation of the dielectric properties of chicken meat with frequency and temperature. J. FoodMeas. Charact.. 2015;9(3):299–304.
Uyar R, Bedane TF, Erdogdu F, Palazoglu TK, Farag KW, Marra F. Radio-frequency thawing of foodproducts: a computational study. J. Food Eng.. 2015;146:163–171.
Uyar R, Erdogdu F, Marra F. Effect of load volume on power absorption and temperature evolution duringradio-frequency heating of meat cubes: a computational study. Food Bioprod. Process.. 2014;92:243–251.
Uyar R, Erdogdu F, Sarghini F, Marra F. Computer simulation of radio-frequency heating applied to block-shaped foods: analysis on the role of geometrical parameters. Food Bioprod. Process.. 2016;98:310–319.
Vadivambal R, Jayas DS. Non-uniform temperature distribution during microwave heating of food materials: areview. Food Bioprocess Technol.. 2010;3:161–171.
Virtanen AJ, Goedeken DL, Tong CH. Microwave assisted thawing of model frozen foods using feed-backtemperature control and surface cooling. J. Food Sci.. 1997;62(1):150–154.
Wang Y, Tang J, Rasco B, Kong F, Wang S. Dielectric properties of salmon fillets as a function of temperatureand composition. J. Food Eng.. 2008;87(2):236–246.
Wang R, Zhang M, Mujumdar AS, Jiang H. Effect of salt and sucrose content on dielectric properties andmicrowave freeze drying behavior of re-structured potato slices. J. Food Eng.. 2011;106(4):290–297.
Wang Y, Zhang M, Mujumdar AS, Mothibe KJ, Azam SMR. Effect of blanching on microwave freeze dryingof stem lettuce cubes in a circular conduit drying chamber. J. Food Eng.. 2012;113:177–185.
Zhang H, Datta AK. Coupled electromagnetic and thermal modeling of microwave oven heating of foods. J.Microw. Power Electromagn. Energy. 2000;35(2):71–85.
Zhang H, Datta AK. Microwave power absorption in single- and multiple-item foods. Food Bioprod. Proc..2003;81:257–265.
Zhang L, Marra F. Radio frequency heating of foods. In: Farid MM, ed. Mathematical Modeling of FoodProcessing. Boca Raton, FL, United States: CRC Press Taylor & Francis Group; 2010:691–706.
Further ReadingLi B, Sun D-W. Novel methods for rapid freezing and thawing of foods: a review. J. Food Eng.. 2002;54:175–
182.

C H A P T E R 1 4
Role for Value Addition in Processing Foods ofTraditional Varieties of GrainsAmmu Sathya School of Chemical and Biotechnology, SASTRA University, Thanjavur, Tamil Nadu, India
AbstractHuman kind stretches with stress and strain relentlessly with hope for a secured life with health to relish it satisfactorily. Day by day, food hastransformed into varieties of choices for taste, aroma, quality, and health preferences. In tune to the nature and origin of raw materials, thenutritional ratio fluctuates. The final essentials of food is determined not in the cooking pan alone. It starts right from the farm where the choice forseeds is made. Although the traditional grains of rice, wheat, millets, and pulses are embodiment of diversified nutrients, the grains are neglected forlack of pleasant taste, aroma, and appearance. Hence, in this chapter, the role of value addition in processing foods of traditional grain varieties intonovel products, such as therapeutic products and ethnic and functional foods is discussed. Conquering the constraints for conversion of traditionaltoxic-free varieties into desirable food products for promoting consumption for health and remunerative livelihood will be an eye-opener for allreaders across the globe. The art of fortification and designing options available to develop functional foods with careful cost economics gives usthe choice to decide about whether to proceed with value addition in traditional grains.
Keywords
traditional grainsricewheatmilletspulsesvalue additionfortificationmarket preference
1. Introduction
The house of Israel named it manna, and it was like coriander seed, white, and its taste was like waferswith honey
—Exodus 16:31.
The appearance, composition, color, taste and aroma of divine “manna” in the quote is a masterpiece of clearevidence for value addition and its capability to feed and sustain the Israelites in the wilderness. Value of food isdetermined not only by its nutritional quality but by its stimulating parameters of palatability relished by the fivesenses of human reflecting in quantum of consumption and marketability. After the sweep of the green revolution,one of the objectives of breeding was bewitched for breeding varieties for a specific way of processing andconsumer preference. Before man’s intervention in creating varieties for special purposes, the varieties created bynatural evolution and diversification led to innumerable traditional varieties and landraces with inherent specialcompositional make, forming the germplasm pool of traditional grains.
1.1. What are Traditional Grains?

According to Stading and Taylor (2016), the grains used for “subsistence” are grossly referred as “traditionalgrains.” Seeds of about 100 different grasses are consumed as food in Africa (Belton and Taylor, 2002). Thetraditional varieties of major cereals, such as rice, wheat, and maize are also referred to as traditional grains. Theseinclude both cereal grasses and grass-like grains and they are called “pseudocereals” (Stading and Taylor, 2016).
1.2. Physiologic Features of Traditional GrainsThe traditional grains can withstand harsh and extreme environmental conditions without the demand for copiousirrigation, chemical fertilizers, pesticides, and machinery.
The indigenous varieties that can withstand the harsh conditions to give sustainable yield in addition to thehealth benefits are now well recognized by consumers of all categories (age, culture, social, and economicstratifications) all over the world. Research needs to be promoted for innovative value-added product developmentfrom these healthy, nutritious grains of traditional varieties (Figs. 14.1 and 14.2). Domestic, ethnic, and dietaryfoods can be developed with additives of extracts from plant and animal origin, which can add taste, value, flavor,and beneficial bioactive compounds improving the quality of products made out of locally available varieties ofcereals, millets, and pulses.

FIGURE 14.1 Dynamic Features of a Cereal Grain. Source: Poutanen, 2012. Past and future of cereal grains as food for health.Trends Food Sci. Technol. 25, 58–62.

FIGURE 14.2 Coordinated Health Benefits That a Single Cereal Grain Offers to Human. Source: Poutanen, 2012.Past and future of cereal grains as food for health. Trends Food Sci. Technol. 25, 58–62.
1.3. Controversy Over Traditional Grains UtilizationMany of the traditional grains have desirable qualities as preferred by “exotic western markets” with lowcholesterol and high antioxidants. Most of them do not contain gluten and its slower hydrolysis makes it suitable toalleviate the stigma of diabetics, celiac, and makes it attractive to “ethnic markets.” These are obviously a “naturalhealthy choice” or “functional foods” (Llyod, 2014; Stading and Taylor, 2016).
But many of these traditional grains’ goodness for health are hidden under the fibrous nature and coarsestructure of their kernels. This renders the products made out of these nutritious traditional varieties inferior to theproducts developed out of modern hybrids due to a lack of desired processing parameters, such as fine quality,slender grains in most of the traditional grains. One of the main problems of value added products developed fromtraditional grains is poor protein digestibility. In turn, this low preference by consumers for products of traditionalvarieties due to the aforementioned reasons slackens viable market price.
There is a reasonable chance for growth of the market for these value-added products from the extant traditionalvarieties, if the products developed could meet the consumer preferences with good quality, appreciable nutritiousand medicinal benefits, acceptable taste, aroma, flavor, and so on. Moreover, with respect to market suitability, thevalue-added products developed should be packed to suit the storage parameters, such as shelf life, ease ofhandling, genuine nutritious fact-bearing labels in appropriate packages, and above all, affordable cost. In addition,a stable market for traditional grains requires a stable supply of uniform high-quality grains. Promotion of the tradeof traditional grains and development of new desirable products of traditional grains could snap the negativefeedback loop of the regular supply of uniform high-quality grains (without contamination, adulteration) andmarketability. The panorama for breeding objectives can be realigned to improve promotion and conservation ofsuch local traditional varieties, which have excellent functional properties, including milling, cooking, and eatingqualities for developing such marketable value-added products creating both domestic and international markets.

Few examples of such value-added products already desired in the traditional grains market are breakfast cerealof popped amaranth, gluten-free bread from sorghum and tef.
1.4. What Is Value Addition?Monetary price, health benefits, or any other measure of importance that catalyzes the factor of utility can becreated/upgraded by employing an appropriate process that may utilize physical/chemical/biologicalmethods/technologies/tools on any living or nonliving matter transforming both the ends of production andprocessing with innovations and disseminations.
This chapter exclusively and explicitly articulates the potentials of sustainable value addition in a wide range ofgrains of millets, cereals, and pulses to bring forth the possibilities of creating a promising market value for thevalue-added consumables in these traditional grains.
2. Key Limitations in Developing Value Added Products ofTraditional GrainsThere are a handful of issues relating to the difficulties in traditional grains processing. Any cereal or millet issubject to the four major classes of factors causing constraints:
1. Environmental factors2. Varietal factors3. Agronomic factors4. Socioeconomic factors (FAO, http://www.fao.org/wairdocs/ilri/x5458e/x5458e05.htm-
constraints%20in%20the%20traditional%20p)
2.1. Environmental FactorsEnvironmental factors include sun, rain, wind, humidity, and snow that cause fluctuations in the ecology ofcultivation of crops beginning from sowing to harvesting. For example, showers of rain during the grain-fillingstage of growth causes ill-filled grains with low levels of starch accumulation in the grains, leading to substandardproduct development. Similarly, heavy rain during harvest leads to fungal diseases in stored grains prior toprocessing, which in turn leads to processing of contaminated grains diminishing the quality or grade leading tonegative consumer preference.
2.2. Varietal FactorsEach traditional variety possesses inherent special qualities suitable for various processing and productdevelopment. There is diversity in physical and physiochemical properties of every variety extant in this world.Although the presence of innumerable varieties is a positive door for exploring the possibilities of these varietiesfor various purposeful applications, on the other hand, availability of large quantities of uniform single traditionalvariety in nature is a challenge. Traditional varieties naturally evolving in the farmer’s fields are being subjected tovarious pressures of Mother Nature; it is obvious that each grain has its inherent codes of secrecy for diversifiedphenotypes and compositional variations. These variations pose a challenge to develop a product with consistentquality.
According to (Llyod, 2014), lack of consistent and uniform quality grain supplies is considered as one of themain constraints for developing value-added products from traditional varieties of sorghum. In addition, he alsoenlists the other factors of constraints in sorghum products as logistics/markets, subsidized imported cereals,unavailability of extension of existing processing technologies, few shelf-stable convenience foods, governmentalpolicies, subsidized rice, maize, wheat based ecosystems, poor image of sorghum and millets, and nutritionalmyths. The necessity for uniform high-quality traditional grains is mandatory for creating a successful market forvalue-added products out of traditional grains of all categories, including cereals and millets.
2.3. Agronomic Factors

According to an FAO report on cassava (http://www.fao.org/wairdocs/ilri/x5458e/), planting and harvesting time,age of plant, affect yield, starch content, and quality. Other agronomic operations, including intercropping,application of manure, fertilizer, and plant spacing also affect yield and quality of produce. Moreover, recently,awareness and inclination toward organic vegetables, crops, and food products has increased prior to theconsumers’ decision making. Right from the choice of seeds to processing after harvest every intervention needs tobe based on organic approaches. For example, seed treatment with effective mycorrhyza (E.M.) solution, pest anddisease control with locally available plant-based extracts, microbe-based formulations and nutrisolutions derivedfrom animal-based products for sustainable and nontoxic production of traditional grains is mandatory for thedevelopment of healthy organic products with value addition.
Moreover, every region or country of the world has adopted its own package of organic practices from thelocally available flora and fauna. These practices can be accessed from their regional/local government andnongovernment documentations and from publications for extension services. Requirements for production ofhigh-quality uniform grains of traditional varieties with organic certificati on are a Himalayan demand at stake forsuccessful development and marketing of value-added products of traditional grains.
2.4. Socioeconomic FactorsSocioeconomic factors include the influence of age, gender, economic status, health, social facilities, such asinfrastructure, tools, and road facilities. In order to vividly understand the influence of socioeconomic factors inmaking value-added products, the following excerpt from the FAO report “An overview of traditional processingand utilization of cassava in Africa” is presented as follows:
Harvesting and transporting of roots from farm to homestead and subsequent processing are mainlydone by women. Most of the steps in processing are carried out manually using simple and inexpensivetools and equipment that are available to small farmers. Cassava processing is labor intensive andproductivity is usually very low. Transport of products to markets is made difficult by the poor condition ofrural roads. The drudgery associated with traditional processing is enormous and the products fromtraditional processing methods are often contaminated with undesirable extraneous matter. Some of theproducts are therefore not hygienic and so are of poor market value. Better processing methods canimprove the life-styles and health of rural people through higher processing efficiency, labor saving andreduced drudgery, all of which improve the quality of products.
Subsistence farmers harvest cassava when needed. Thus, they leave the cassava in the ground forlong periods, believing that the cassava is safer and would undergo less damage than when harvested.Although this system has certain merits, a delay in harvest can result in root losses due to root rots,damage by animals, and a decrease in the starch content in roots. Furthermore, keeping cassava in theground prevents the use of that land for other purposes (http://www.fao.org/wairdocs/ilri/x5458e/).
The aforementioned monograph on cassava (harvesting and processing) clearly carves out a picture vividlypinpointing the role of each factor of socioeconomics. The interwoven role of gender, season, infrastructure,transport, gender, and so on, are meticulously analyzed and coherently presented to gain actual understanding ofwhat is going on in the cassava fields of Africa.
All four categories of constraints highlight the significance of each factor in developing value added productsfor traditional grains for creating a viable market for every traditional variety of cereals, millets, and pulses inevery part of the world.
3. Strategies for Value Addition in Traditional GrainsThe sequential strategies for value addition (Fig. 14.3) in traditional grains are presented in Fig. 14.4.

FIGURE 14.3 Major Constraints in Value Addition of Traditional Grains.

FIGURE 14.4 Strategies for Value Addition in Traditional Varieties.
3.1. Sustainable Value Addition in Traditional GrainsTraditional foods have intrinsic characters of variability, evolution, and direct perception of food values(Antuono, 2016). With or without value addition, traditional foods can be developed for marketing andconsumption carrying its intrinsic values, such as variability and novelty, without negotiating it. But for large-scaleupscaling of traditional grains, value addition is vital, blending and transforming inherent compositional goodnesswith special thermal/chemical/biological methods with or without additives. From the earlier mentioned sequentialorder of value addition, the significance of each step is highlighted.
Each kind of crop and every variety of crops needs to be carefully observed to identify its specialty to developas a product. The products can range from snacks, breakfast cereals, fortified foods, and complementary foods.Moreover, in the path of product development, a survey for identification of consumer preference and marketopportunities is of prime importance. This endeavor simultaneously widens the scope of profitability and narrowsdown the chances of risk. This can otherwise be called as risk analysis. Next, a significant approach is the actualprocess of developing the value-added products with appropriate technologies and consistently maintaining the

quality for sustainable profit. Value addition with high quality in traditional grains needs to be continuouslymonitored and promoted coordinately by producers and processors with justified sharing of profits.
The aforementioned flow chart in Fig. 14.2 is an overall sketch for achieving successful marketability for value-added products in traditional grains. This is a basic foundation for piling up the stones of success for capacitybuilding of entrepreneurs in a local community scale, which can be upscaled to regional and national levels.
3.2. Stages in Handling Processing (FAO, 1997)The stages of processing can be ranked as primary, secondary, and tertiary are as follows:
1. The primary processing includes the post harvest activities, such as drying, threshing/shelling, winnowingin cereals and pulses. Primary processing extends shelf life and reduces fiber content.
2. Secondary processing includes transformation in the form, state, and quality of traditional grains forsubsequent use.The postharvest operations, such as cleaning, grading, tempering/parboiling, dehulling,polishing, and splitting into halves are done as secondary processing methods for grains of cereals andlegumes.
3. Tertiary processing of traditional grains converts uncooked grains into commercial products, such asweaning foods, extrusion products, etc. Combinations of preparations for domestic consumption of thefamily also fall under tertiary steps in processing.
Using the aforementioned stages of processing, innovation platforms identified by Virgin et al. (2014) fortraditional grains to create an avenue for steering competitively in the domestic, as well as international marketincludes the following:
1. Sustainable bioproducts production system2. Using modern technologies for value addition to indigenous germplasms3. Novel high-value processing with wider agroindustrial applications
According to UNDP (2001), the key problems highlighted for unattractive product development from traditionalgrains is attributed to inefficient innovative structures, lack of entrepreneurial capacity, inappropriate use of humanand capital investments for science and technological interventions. These parameters pull down the competingability in global markets for value-added/processed products of traditional grains.
The anticipation of achieving a profitable and sustainable market for the value-added/processed products out oftraditional grains can be pivoted upon the pooling of key expertise across the states/region/country, cross-disciplinary approaches, and effective value-added product supply chain. Moreover, strategic, realistic, clearthinking is a prerequisite for creating a trade niche in the global scale for the products of traditional grains. Thepolicy makers need to address the questions, including what are the viable products of value addition? How canthese be developed? What types of investments need to be done in the background of economic, social, andenvironmental aspects? The present unsustainable environmental trends, such as habitat disturbances, habitatdestruction, and unscrupulous use of chemicals, soil erosion, and loss of social, cultural niches can also be reversedwith the advent of organic production for high-quality value addition. These concerted efforts for upscaling themarket viability of value-added products directly alleviate poverty, malnutrition, and promotes sustainabledevelopment. Investments need to be prioritized for capacity building, dissemination of standardizedprotocols/technologies and innovation systems.
The value-added products of traditional grains that can be developed for sustainable acceptability andprofitability are broadly discussed as follows:
1. Value-added products in cereals2. Value-added products in millets3. Value-added products in pulses
In general, most of the cereals, millets, and pulses possess excellent processing properties, such as color andflavor in developing breakfast cereals, array of flours, grits porridges, and meals. It is a specifically importantaspect of value addition through processing in creating great diet diversity and providing a wider range of products

for regular consumption with recommended quantum of nutrition, minerals, and vitamins to the consumers thanthe present options they have. If the subsistence farmers wish to develop into commercial farmers then addingvalue to the indigenous varieties is the best option for capacity building, innovation, and investment.
The following sections discuss the types of value-added products developed and the process of developing themin a large scale for consumer acceptability and marketability.
4. Value Addition in Traditional Cereal Grains4.1. Value-Added Products in Traditional Rice GrainsIn general, after harvest the farmers sell their rice grains to traders without any further processing. But, even thesimple primary processing operations, such as cleaning and grading are sure to be higher prices to the farmers. Inaddition, value addition, such as preparation of brown rice, puffed rice, flaked rice, ready-to-eat foods, andextruded foods will increase the value of plain grains reflected in the inflow of more income(http://www.blackseagrain.net/novosti/rice-processing-and-value-addition-in-india).
4.1.1. Brown riceEven though it is rich in nutrition, brown rice, due to the drudgery in preparation by hand pounding, is not popular.Still, it is traditionally consumed. In recent days, suitable machineries have been fabricated. Brown rice fromtraditional and organically grown paddies has gained more commercial value nowadays. In order to get brown rice,it has to be milled in rubber roll shellers to remove husks, followed by unshelled paddy separation.
4.1.2. Puffed riceUsually, processing for puffed rice is done by immersing the sand-roasted paddy immediately in water, then thewater is drained, tempered, dried, and milled. The treatment of polished rice with solutions of salt, sugar, soda salt,and then puffing in sand medium is recommended. Snack foods that are ready-to-eat include the mouthwatering“bhel poori” (an anytime snack of North India gaining popularity in South India, also) can be prepared from thepuffed rice.
4.1.3. Flaked riceFlaked rice is yet another form of nutritious and quick-cooking product. During the production of flaked rice, moreloss of rice grains occurs due to powdering. Initially, the paddy is soaked in water, drained, roasted, and flakedusing edge runners or roller flakers. Technologies have been developed in India for preparation of ready-to-cooklemon bath, curd bath, and so on, using these rice flakes and it has more export potentials. Brown rice flakes of aSouth Indian traditional rice variety called “Mapillai samba” is gaining widespread preference and acceptanceamong South Indian consumers of Tamil Nadu and Kerala owing to its goodness of taste and nutrition.
4.1.4. Miscellaneous productsThe flour from whole or broken rice can be used for developing various products, such as murrukku (Fig. 14.5;dark colored due to the processing of rice into murrukku with value addition by adding mint leaves, and the lightcolored murrukku has been processed without value addition), puttu, noodles, idiyappam, appam, neer dosa. “Ricesevai” with different tastes and flavors add value for consumption. Rice flour can be used for preparation ofextruded rice. Rice coextrusion with herbs and other nutraceutical compounds is an innovative product of valueaddition in traditional rice varieties. Fortification with minerals and vitamins is a noteworthy product for export.

FIGURE 14.5 Murrukku—a Rice Snack Processed With Value Addition (Dark Colored); Processed Without ValueAddition (Light Colored).
4.2. Traditional Processing Method in Traditional RiceValue-added products developed using traditional processing methods are also available. But the traditionalmethod of value addition and processing is labor-intensive and the products have less shelf life. The commercialexploitation of traditional rice grains can be promoted if, and only if, automatic or semiautomatic machineries aredeveloped for hygienic ways of preparation of ready-to-serve products with extended shelf life.
4.3. Medicinal and Therapeutic Products in Indian Traditional RiceVarietiesThere is a good niche in domestic and export markets for value-added products from organic rice and rice varietieswith therapeutic properties.
Rice feeds more than 50% of the population around the world as a staple food. The world rice (paddy, unmilled)production in 2015 was estimated at 749.1 million tons by FAO. India accounts for more than 21% of worldproduction, ranking second only to China.
There had been 4 lakh varieties of paddy in India alone. Before 1965, in other words, prior to the advent of thegreen revolution, there had been 400 rice varieties in Tamil Nadu alone (Nammazhvar and Kumaravel, 1999).Thirty thousand indigenous varieties of rice grew in India prior to the green revolution. Today, there are not morethan 50 widely known and grown (Vijayalakshmi and Nambi, 1997).
Jayashankar et al. (2002) state that according to Dr. Richharia, the well-known rice scientist in India, 400,000varieties of rice had existed in India during the Vedic period. He has estimated that even today 200,000 varieties ofrice exist in India—a truly phenomenal number. Every variety has a specific purpose and utility.
Among this rich traditional rice heritage in India, there are numerous specific traditional rice varieties withspecific medicinal value. Hence, any form of value-added products from such traditional grains can cure thespecific ailments of consumers. Hence, value addition of these varietal grains could definitely promote consumerpreference and market opportunities. Table 14.1 highlights a few medicinal traits of some of the ancient traditionalvarieties of rice listed in the medicinal notes of “Pathartha Kunapadam” of Yogis and Siddhas of south India(Sourirajan, 2000).

Table 14.1
List of South Indian traditional rice varieties with medicinal characters.
Names of the Traditional RiceVarieties Medicinal Characters1. Kar Arici It is docile in nature. It imparts strength and increases body weight. It causes gastric trouble and is
called karappan pandam.
2. Manakkathai, Karunguruvai It cures leprosy and is used as antidiuretic for poisonous bug bites.
3. Eerkku samba It is tastier and has good look It causes “pitham” (gall bladder disease).
4. Vaikarai samba It gives great strength and manpower.
5. Puzhugu samba It quenches intense thirst. It improves luster of body and increases appetite and strength.
6. Senchamba It increases appetite. It causes itching sores.
7. Gundu samba It quenches uncontrollable thirst. It causes docility and creates “karappan” (urticaria).
8. Kallundai samba It imparts enormous strength especially arm strength and the consumers become precocious.
9. Malligai samba It relieves from “karappan” and body heat. It gives healthy and strong body.
10.Iluppai poo chamba It relieves headaches, thirst, and heat of “pitham.”
11. Mani samba It reduces frequent urination. It energizes growth of young and old.
12. Valaithadi samba It causes “pitham” and stomach disorders with indigestion.
13. Korai samba It reduces body heat and cures mental disorders and body heat.
14. Kurunchamba It cures “pitham,” “karappan.” It increases semen secretion. It cures “arthritis” of rheumatism.
15. Milagu samba rice It gives health to body and cures rheumatism and arthritis.
16. Kalanchamba rice It gives enormous strength to body and health. It cures rheumatic diseases.
17. Michamba rice It relieves from vomiting, aversion, “pitham,” and rheumatic disorders.
18. Kodai samba rice It reduces rheumatic pain and regulates gall bladder functioning.
19. Kadai samba rice It cures fever and increases the sematic secretions and imparts strength.
20. Kundri manichamba rice It gives relief from rheumatic disease and gives strength with increase in semen secretions.
21. Annamazhagi rice It subsides all types of fevers and high temperature caused by gall bladder disorders.
22. Pacharici (rice from unboiled paddy) It gives good strength and reduces rheumatism and irritation sensation of gall bladder disorders.
23. Puzhungalarici (rice from boiled paddy) It is good for infants, rheumatoid patients, etc. It is not for strength of body.
24. Pazhamai arici (long-term stored rice) It is good for children, patients. It gives coolness and appetite to body. It also cures certain gall bladderdiseases.
25. Seeraga samba It increases appetite and relieves from rheumatic disorders.
Karappan, Urticaria; pitham, gall bladder disease.
In general, South Indian traditional rice varieties have been found to be suitable for overnight water preservedrice (Pazhayathu), for example, Mapillai samba, famous for its “neeragam”—supernatant water of pazhayathu.
Also, traditional rice varieties have been noted to be suitable for making breakfast preparations, such as riceflakes, idly, and dosa and, for example, Vadan samba, Madu muzhungi, and Kulla kar.
4.4. Value Addition in Japan for Rice GrainsGerminated brown rice (GBR) and rice bread (RB) are innovative value-added products pioneered by theJapanese. Popularity and acceptance has been gained for these rice-based, novel, value-added products in Japan.
Japonica rice, as well as Indica rice, is suitable for making GBR. Its popularity has extended throughout theworld because the process of making GBR is easy to do even at home with available brown rice (Ito andIshikawa, 2004). During germination, nutrients in brown rice change significantly. According to Kayahara andTsukahara (2000), the nutrients, such as γ-amirobutyric acid (GABA), dietary fiber, inositols, ferulic acid, phyticacid, tocotrienols, magnesium, potassium, zinc, γ-oryzanol, and prolylendopeptidase inhibitor increasesignificantly during germination. The analytical results of their research depicts that continuous intake of GBR isgood for increasing brain metabolism, reducing headaches, resolving constipation problems, protecting againstcolon cancer, controlling blood sugar levels, reducing blood pressure, preventing Alzheimer’s and heart diseases.

Processing and Market Analysis of GBR (Ito and Ishikawa, 2004)The basic procedure to prepare GBR is: the first step is to make a good choice of brown rice for germination; the
second step is to soak in lukewarm water for about 20 h at 30–40°C or for a longer time with low/coolertemperatures; the third step is changing water a few times, depending on the smell generated during soaking due tofermentation; the fourth step is to wash it slightly before cooking (Patil and Khan, 2011).
It was suggested at the FAO conference in 2004 that GBR is suitable for preparing Italian dish risotto, paella, therice specialty of Spain, Brazilian rice-based dish fejoada, and Indian recipes of rice, and so on. The Japanesecompanies that produce GBR pack it both as dry and wet packs with 15 and 30% of moisture levels, respectively.
According to Patil and Khan (2011), the brown rice consumption in Japan was about 9 MT in the year 2001. Asper the marketability report of Ito and Ishikawa (2004), value addition as GBR started in the year 1995 and about15,000 MT was sold per year in Japan with an estimation of marketed value approximately about 15 billion yenper annum. This implies that after 12 years of Ito and Ishikawa’s presentation at FAO conference in 2004, themarket price would have definitely escalated. As per their presentation report, marketing was carried out in Japanthrough catalog, Internet, and retail shopping with price for GBR ranging 800–100 yen (US$ 7–9) per kg in 2004.
4.5. Rice BreadsIto and Ishikawa (2004) claim that about 80% rice flour and 20% gluten is the composition of rice bread. They haddiscussed different varieties of rice breads, such as plain rice bread, raisin rice bread, nut rice bread, rice breadrolls, croissant rice bread. They also highlighted that by 2003, wheat bread was replaced with rice bread atJapanese schools in 11 prefectures out of 47. Rice bread flour is nearly 3 times more expensive than wheat breadflour. They quote that as of that date, people allergic to the gluten prefer (100% rice) gluten-free rice bread and soit is regularly produced and marketed. Finally, Ito and Ishikawa (2004) predicted that these novel ways ofconsuming rice could allure people who are conventionally nonrice eaters. True to their prediction, GBR couldserve as best dietary food, improving the health of people of developed nations, as well as a means to reinforcefood security in food-deficit regions.
4.6. Rice FortificationAccording to Steiger et al. (2014), in most languages of low-income regions, the words for rice and food are thesame. Rice is considered a staple food in African nations, countries of largest Asian continent, and in theAmericas. Hence, according to the aforementioned authors, value-added products of rice could serve as a feasiblemedium and tool for delivering micronutrients to the malnourished and thereby the micronutrient deficienciesamong all age groups of people across the globe can be effectively rectified. With the clear perception ofinefficiency of simple mixing of micronutrient blends with rice kernels the following disadvantages werehighlighted by Steiger et al. (2014), which may end up with micronutrient separation (Alavi et al., 2008),inhomogeneity, and losses during production, transport, washing, and so on.
4.7. Technologies for Rice Fortification (Alavi et al., 2016)4.7.1. DustingThe electrostatic forces between the rice surface and micronutrient blends could retain the fine particles ofmicronutrients and thereby dusting is suggested as best method for rice fortification with micronutrients, such asiron, zinc, calcium, vitamins.
4.7.2. CoatingThe fortificant ingredients (micronutrients) to be coated are mixed with gums and waxes and made into a liquidthat can be sprayed in layers over the surface of the rice kernels. This forms the rice premix. The gums and waxesenable the micronutrients to stick to the kernel, preventing the loss during washing of the kernels. Then the retailrice is blended with the coated rice for fortification. The color varies with the type of fortificant added and this ispracticed widely in developing nations.
4.7.3. Extrusion processing

According to Steiger et al. (2014), “rice analogs or simply extruded rice” can be developed using cold, warm, orhot extrusion processes of rice kernels with micronutrient premix along with binders of choice, emulsifiers, water-resistant agents, water, and steam. This forms dough and passed through a rice-shaped die where the rice-shapedkernels are formed and removed. The detached kernels can be optionally cooked, wetted, or dusted with cross-linking agents. As a final step, the extruded kernels are dried. The same ratio of mixing of extruded rice productsladen with micronutrients, minerals, and vitamins with normal rice, as that of coating (1:50 to 1:200) is suggested.
According to them, “phytates” that are intrinsically present in the rice kernels are considered as agents thatcause low bioavailability of iron fortification in a rice matrix. Finally the WHO monograph of earlier cited authorsclearly highlights that “an optimal product should have high bioavailability in the presence of inhibitors and, at thesame time, low reactivity with the rice matrix, which otherwise leads to color change.”
This manuscript was presented by Steiger et al. (2014) at the WHO Consultation Technical Considerations forRice Fortification in Public Health, convened in collaboration with the Global Alliance for Improved Nutrition(GAIN) on October 9–10, 2012, at WHO, Geneva, Switzerland, which concludes about the effect of ricefortification stating that among all the studies investigating the effect of iron fortification with use of high amountsof iron (above 10 mg/100 g), the authors of this WHO manuscript claim that even with low levels of interventionof 3 mg/100 g, the effects of iron rice fortification was able to decrease the frequency of anemia especially amongthe malnourished people in the Philippines.
Publicly available monographs and manuscripts of international organizations, such as FAO, WHO, UNDP,serve as freely accessible documents for understanding, dissemination, and adoption of these feasible valueaddition technologies for generating viable value-added products of cereals for increasing the consumeracceptability and creating an optimistic markets for such products.
In the similar way, fortifications can also be carried out in traditional rice grains available in their local farmswith plant and animal proteins, bioactive compounds with appropriate technologies, such as extrusion, coating, toretain the fortified layer of compounds in the rice kernels of processed traditional varieties. Vitamin D fortificationof rice and rice flour will enable the consumers to intake adequate amount of vitamin D recommended per day inthe form of all the extrusion products made out of such fortified rice flour. Rice and rice flour fortification withvitamin D could surely serve as good source of vitamin D during daily food intake (Ritu and Gupta, 2014).
Although primarily iron, thiamin, niacin, and riboflavin are considered for fortification with rice as vehicles,other nutrients, including pantothenic acid, B6, calcium, and folate have also been included in some enrichmentpremixes. Predominantly rice is used as a vehicle for vitamin A fortification in the rice consuming countries of theworld (USAID, 1998).
The economic analysis of fortified rice was carried out by USAID in four countries, such as China, Philippines,Costa Rica, and United States in 2008. The summary of the report “A Critical Review of the Technical andEconomic Feasibility: Rice Fortification in Developing Countries” is available athttp://pdf.usaid.gov/pdf_docs/PNACD279.pdf. The objectives of this assessment report were to establish abaseline of rice fortification practices and industrial requirements to estimate the needed investment and recurrentcosts for rice manufacturers; and to assess the technical and economical feasibility and the consequences of theintroduction of rice fortification in developing countries.
The economic feasibility of fortified/enriched rice (with iron and other macro- and micronutrients) developed byprivate companies in the respective country is presented.
Moreover, in the view of a true economist, the cash inflow into rice processing is very favorable due to a shorterpay-back period and hence the processing business is very lucrative. Processing business seems to have the upperhand over the production of grains as the latter may sometimes take up to 5 months for cash inflow.
According to Ugwu et al. (2014), there is a state of value-chain exhaustion following a lack of adequatetechnology, technical know-how, government incentive and training, high cost, and drudgery in processing oftraditional grains. Hence, enough attention needs to be paid to set right these parameters.
The earlier speculations reinforce the fact that the traditional rice grains can be transformed into a wide range ofenriched nutritious foods, complementing taste health and economics simultaneously, for wider acceptability andmarket preferences across all levels of local, regional, and global markets.
4.8. Traditional and Ayurvedic Rice Grain–Based Health Products:India

Ayurveda is one of the ancient and traditional systems of medicine having its roots of origin in Indian soil.Specifically in Ayurveda, diet regulation is more vital, as it believes that the food is transformed into variousorgans of whole human body as the product of food (Ravishankar and Shukla, 2007).
The ancient ayurvedic texts mention rice grain–based products, such as idli, dosa, and herbal rice drinks. Idli(Fig. 14.5) is a fermented product prepared from rice and black gram batter prepared in the ratio of 2:1 followed bysteam cooking (Agarwal and Bhasin, 2002). As seen in the Fig. 14.6, idli is a white-colored, small, round, andspongy product.
FIGURE 14.6 Idli. Source: Sarkar, P., DH, L.K., Dhumal, C., Panigrahi, S.S., Choudhary, R., 2015. Traditional and ayurvedic foods of Indianorigin. J. Ethn. Foods 2, 97–109.
According to Mukherjee et al. (1965), leavening, which is the vital process in idli preparation, involves the roleof microorganisms, such as heterofermentative lactic acid bacterium, Lactobacillus mesenteroides. But at the sametime, the acidity of the batter due to lactic acid is regulated by homofermentative lactic acid bacteriumStreptococcus faecalis (Iyer et al., 2013).
Dosa is another fermented breakfast food in addition to idli in south India. According to Sarkar et al. (2015), it iseasily digestible and nutritionally intense, and hence is recommended to elderly people and children younger than10 years. It is consumed with palya or curry in all seasons.
Idli and dosa are much preferred South Indian breakfast foods, which can be prepared from various traditionalrice varieties as listed in Table 14.2. These breakfast foods prepared from each kind of traditional rice varietyvaries in color, texture, taste, and aroma depending on the extent of starch (amylose) and Table 14.3 fiber contentin their grains.

Table 14.2
The value-added products of respective traditional rice varieties of Tamil Nadu, South India.
Names of theTraditionalRice Varieties Value-Added ProductsVadan samba Suitable for idly and dosa (South Indian delicacies); coarse rice quality; it is suitable for making puffed rice
Seeraga samba (red,white, andblack)
The rice is extremely fine and aromatic; hence, it is used for making “briyani”
Thuyyamalli Slender variety, suitable for South Indian meals; it is also used for making special dishes, such as “Briyani”; since it is a finevariety, it fetches a good price
Gundunel Suitable for overnight soaked rice called “Pazhayathu” (cold rice) and also for making “Puttu” (pounded rice)
Madu muzhungi Suitable for idly and dosa; good for preparing rice flakes
Kulla kar Highly preferred for idly and dosa; also used in preparation of porridge
Samba mosanam Coarse variety, suitable for rice flakes preparation
Arcot kitchilli Slender variety, suitable for South Indian meals.
Kitchilli samba Suitable for South Indian meals especially for making “Briyani”
Mappillai samba Rice flakes; the “Neeragaram”—the supernatant water of overnight soaked rice is so nutritive, that the bridegroom drinks it inthe early morning before lifting the “Mappillai kal”—a heavy weight bolder, to display his strength and valor (hence thename “Mapillai samba” came into vogue as “Mappillai” means the bridegroom)
Puzhuthi kar Ideal for preparing idly and dosa (South Indian breakfast dishes)
Pisini Suitable for preparation of rice flakes
Table 14.3
Economic feasibility for rice fortification in selected countries.
Names of the Countries Fortified Rice (Cost per Metric Ton in US$)China 17.09–19.09
Philippines 10.95
Costa Rica 8.0–10.04
USA 4.9
Source: USAID, 2008. Rice Fortification in Developing Countries: A Critical Review of the Technical and Economic Feasibility. In: Alavi, S.,Bugusu, B., Dary, O., Lee, T.-C., McEntire, J., Wailes, E. (Eds.). Academy for Educational Development, Washington, DC. Available from:http://pdf.usaid.gov/pdf_docs/PNACD279.
Idli and dosa can be prepared and marketed as a value-added product of traditional rice grains for immediate useor their shelf life can be extended by using modified packages, which can protect these starchy grain-based foodswith palatable quality for 3 months. Moreover, preparation of batter for idli and dosa in retail shops has alreadybeen recognized as a viable “household” business in most of the districts of Tamil Nadu, India.
A noteworthy value-added product with therapeutic value developed from a specific Indian traditional ricevariety is “herbal rice drink.” Herbal rice drinks are the combination of extract of bark of Terminalia arjuna orFicus religiosa (locally known as arali mara) with prior exposure to moonlight for 4–5 days and pounded ricegruel along with cow’s milk, jiggery, or sugar. This mixture is exposed to Moon’s radiation for 4–5 days beginningfrom a full-moon night by keeping the mixture on a copper plate. The moon’s radiation activates the antibioticsand immunoglobulin constituents of milk and thereby used for treatment of coronary and respiratory diseases. Forthis purpose, a special traditional red rice variety—athikaraya is specifically used (Hegde et al., 2013).
Value-added herbal rice drinks could be marketed as such or in suitable sachet or bottles with priorpasteurization and vacuum hermetic sealing for transport, handling, distribution, and promotion of sales withoutloss and contamination.
The rice flakes of a traditional rice variety “Mapillai samba” can be used to make an Indian sweet called“laddu,” which is normally made from black gram. The addition of dates and jiggery increases the iron and dietary

fiber increasing taste and trade.
4.9. Value-Added Traditional Grain Products From KoreaApart from South Indian, Japanese products of traditional rice grains, Korean traditional food, Bibimbap ischaracterized by setting kimchi variety of rice, guk (Korean-style soup), banchan (side dishes), and Jang (redpepper) on a table, which are all eaten at the same time (Kyung Rhan et al., 2015). This fits into the choice ofWesterners, as they prefer a single main dish. Hence, a preliminary investigation to promote, “Bibimbap” inWestern countries by Seo et al. (2012) clearly indicated a welcome sign in the Western world.
4.10. Value Addition in African Traditional Rice VarietiesThe controversy over the origin of rice is oscillating between India, China, and Africa. Africa is the origin forOryza glaberrima, which is one among the three domesticated rice species. The other two domesticated ricespecies are O. indica and O. japonica. Africa has been designated as one of the centers of origin as it is anembodiment of rich diversity of land acres of rice. Many ethnic foods are developed from every part of Africafrom these traditional grains in combination with pulses, oil, and fish. According the IRRI publication, Rice Today(2014), Mohapatra (2014) writes:
“In many African countries, locally milled rice is of variable quality and it has a high percentage of brokengrains. Sometimes, unhusked grains, as well as bran and husk fractions are found in the milled rice. The inferiorquality of local rice makes it less competitive against imported rice on the market. Thus, African rice farmers findit so difficult to sell their rice because locally produced rice is widely perceived as being of poor quality.”
To overcome these hurdles in marketing the local, traditional rice grains with low-milling quality and to bridgethe gap between producers and consumers with sustainable profit, Canada’s Department of Foreign Affairs, Tradeand Development (DFATD), and Africa Rice, in partnership with McGill University, are spearheading anambitious project on food security in Africa with a focus on rice postharvest handling and marketing.
The women farmers don’t have access and have fewer rights to vital resources, which they need to farm,process, and sell. The majority of the small-holder farmers and processors happen to be women and hencesuccessful implementation of this project will enable them to develop new rice products in Africa. Initially, asurvey was initiated to assess the consumer preference for various rice-based value-added products across Africa.Simultaneously, screening will be initiated in the O. glaberrima germplasm for identifying suitable varieties withnecessary constituents that cause slow digestibility, which is a desirable diet for patients suffering with type IIdiabetes. The possibility of using low-value broken rice for making breakfast porridge fortified with protein richgroundnut or soyabean for malnourished children and babies need to be explored and standardized.
In the meantime, the flour from broken kernels has already been used in Africa to develop products, such asnoodles, biscuits, and porridges.
Value addition in low-value traditional rice grains will help catalyze the rural enterprises and empower thewomen farmers and processors with raised income through tasty and innovative uses of broken rice kernels.
The project claims for building the capacity of rice stakeholders throughout the value chain, from farmers,through millers and parboilers, to marketers as a vital part of the implementation.
Apart from puffed rice, rice flakes, and parboiled rice, which are regular value-added foods, this initiative fordeveloping noodles, porridges, wafers using low-milling traditional rice grains will definitely be a groundbreakingventure for gain and sustainability in Africa.
Similar to the earlier listed efforts, eight popular low-grade rice varieties (PLRVs) of Andhra pradesh, Indiawere processed into eight products of traditional/commercial importance, such as burfi, noodles, extruded snackproducts, vennaundalu (butter-coated calls); plathalikalu (dough rolled into strips, steamed/cooked in milk); ricesemolina (instant kheer mix and instant upma mix); and flaked rice (nutritious bar) by Anitha and Rajyalakshmi(2014). The nutritional, cooking quality characteristics, consumer acceptability, and shelf life were evaluated forall eight products. A significant difference (P <0.05) from initial to 90 days was recorded as the overallacceptability scores for all the eight products developed out of PLRVs.
According to the study of Nipat et al. (2010) using the by-products from the vegetables, yacon stem(Smallanthus sonchifolius) and carrot leaf (Daucus carota), and the herbs, garlic (Allium sativum), egoma (Perillaflutescens var. flutescens), and Japanese green tea (Camellia sinensis) for developing extruded products from ricestarch, red kidney bean flour, broad bean flour, corn grit, soy flour, black soy flour, and green pea flour. The

inference recorded showed high antioxidant properties for Japanese tea. But the resistant starch content wasrecorded to be low after extrusion. Hence, taking a cue from the results of this endeavor the best by-products fromvegetables need to be screened and identified for possible fortification with extrusion products.
According to Frei et al. (2003), rice varieties with high amylose have lower digestibility than rice varieties withlower amylose content, which are reported to have high digestibility. Hence, Ganiyu et al. (2015) states that theaddition of fruits with rice products is recommended to improve digestibility of traditional rice grains with highamylose content.
The earlier discussion in developing various tasty, nutritional, and healthy value-added products that could bepossibly developed from traditional rice grains is an attempt to sketch out the feasibilities for market acceptability.The wider coverage on traditional rice, from challenges to methodologies, ethnic to fortified, ancient to moderncategories of value-added products with their economic analysis in specific cases is an endeavor to present thereader with the broader prospective of value addition in traditional rice grains.
The insights about rice products presented in this chapter were broad and deep, as more than 50% of the world’spopulation consumes rice as staple food depending on its innumerable varieties and adaptabilities to feed a majorslice of world. Further, we need to ponder about the possible value-added products in traditional wheat grains withkeen insight.
5. Value-Added Products in Traditional Wheat GrainsBarley, wheat, rice, and maize are rich in protein, dietary fibers, and lipids, so they are gaining popularity all overthe world for consumption. In general, in some parts of the world, cereals serve 56% as a source of energy for thepopulation. However, it is reasonably true that wheat-based foods are rich in starch and also these food productsare associated with high glycaemic impact. Wild relatives of wheat are still surviving with secret nutritive valuesfor developing value-added products. The potential of all the cereals that are under the grip of evolutionary forcesstill holds hope for evolving a new variety in the future from nature with more probability for value addition.Simultaneously, humankind is busy with innovating new processing methodologies apart from routine milling,cooking, soaking, fermentation, and extrusion. But now the question is to upgrade the existing technologies withpromising modifications or to develop new technologies to address the necessity of developing novel value-addedproducts.
A composite answer to earlier two questions could be that wheat has an immense potential in forging into novelvalue-added products, such as aleuron flours, wheat beers, biodegradable plastics from wheat starch, blasting/paintstripping with wheat starch, wheat-based raw materials for cosmetics, wheat conversion to ethanol, wheat productsfor aquaculture and turkey feed, meat substitutes from wheat (Dotty et al., 2012).
Composite flours made in combination with the blend of other protein-rich flours could enhance the value ofwheat flour. The protein content in sorghum, finger millet, and so on, is appreciably higher. Hence, even thoughthe protein present in wheat is on par with that of the amount found in spelt/quinoa (ancient strains of wheat) thereis a novel possibility to enrich the wheat flour with more protein content by mixing with other protein-rich floursof sorghum and finger millet there by ending up with protein laded “atta/composite flours” (Rao et al., 2014;Zimmerman, 2014).
The world renowned Italian pasta/noodles are gaining popularity due to different shapes and varieties. Each typeof pasta or noodle is influenced by the quality of the flour used. Although mostly, Triticum aestivum wheat flour orT. durum semolina is used in pasta/noodle preparation, the main factor that decides the quality is the amount of itsprotein content. Hence, composite flours enriched with protein as cited earlier can be used or additives, such ascarbonates, monoglycerides, lipases, phosphates, and hydrocolloids could enhance quality of these extrusionproducts by increasing elasticity, extending shelf life, increasing expansion ratio, firm network formation of glutenwith good texture, augmenting the interaction of starch and protein matrix (Susanna, 2014).
Moreover, without changing the life style and food habits, the wheat flour can be enriched with nutrients, suchas fiber content, iron folic acid, and zinc by developing a “multigrain atta” or “multigrain wheat” with thesubsequent addition of wheat flour with other six grains, such as whole wheat, maize, oats, soy, Bengal gram, andbarley.
Fortified wheat with fortificants, such as multigrains, EDTA, and phytochemicals, such as soy isoflavones, β-glucans, conjugated linoleic acid, and n−3 fatty acids can be used for making bakery products with functionalcompounds to feed the consumers who prefer bakery products, such as breads, biscuits, and cakes (Raoet al., 2014).

Wheat consumption per se can be replaced by consuming wheat germ, which could be extracted usingultramodern milling technology. As it contains 27–28 g of protein, it is laden with all types of amino acids,including lysine, which are basic body-building agents promoting growth in children. Dietary fiber intake will be20% if just 3 spoons of wheat germ–based food is consumed. Moreover, the wheat germ is devoid of free radicals,which reduce the risk of coronary heart diseases and obesity. Wheat germ consumption could delay the agingprocess (Priya, 2014).
According to Priya (2014), the richness of wheat bran with dietary fiber, omegas, starch, protein, and so on, is abest candidate for weight control by replacing high calorific value foods. The dietary fiber consumption gives afeeling of fullness, thereby it keeps overeating at bay. With respect to reduced fasting and postglucose levels, thevictims of diabetics will be safe to consume such wheat bran–enriched functional foods. It is claimed that thephytoestrogens present in wheat could protect against hormone-mediated cancers, such as breast, colon, prostrate,especially in women.
According to Zimmerman (2014), industrially milled fortified atta is the recommended choice for consumers ofchapatti, roti, naan, and puri in Indian households. The multigrain atta and fortified composite wheat flour can berecommended to prepare bakery products, which are highly consumed in widely classified categories in the UnitedStates as given in Table 14.4.
Table 14.4
Bakery products categorized in the United States.
Categories SubcategoriesAll breads White pan bread
Variety breads Variety bread, including hearth bread, whole wheat bread, rye, and other variety breads
Other breads Unspecified bread
Rolls Hamburger and hot dog, bagels, brown-and-serve, hearth rolls, English muffins, croissants, other bread-type rolls
Sweet yeast goods Doughnuts and all other sweet yeast goods
Soft cakes Snack cakes and all other cakes
Pies Snack pies and all other pies
Cake-type doughnuts —
Cookies Sandwich, marshmallow, wafers for ice-cream sandwiches, and others
Crackers Graham, saltines, cracker sandwiches, cracker meal and crumbs, pretzels, others
Source: Bureau of the Census, 1992. Census of manufactures: bakery products. US Department of Commerce, MC92-I-20E, Washington,DC. Copyright 1998 by Jianqiang Lou and William W. Wilson (1992).
According to Mogra and Midha (2013), whole or refined wheat flour can be used to prepare “vermicelli,” aconvenience product of wheat in India. The refined flour is poor in nutrition and hence an attempt to produce“vermicelli” as a value-added convenient product was undertaken. Instead of using whole-wheat flour or refinedwheat flour, a nutrimix (MGSS) was prepared by combining malted wheat flour, green gram, spinach, and sago.The results of their study concluded that the nutritionally, value-added product developed was superior with a shelflife for 2 months at a temperature of 20–25°C.
Subramaniam (2013) suggests that doors can be thrown open for the modern high-tech wheat industries if thefollowing wheat-based industrial interventions could be initiated: wheat as morning breakfast cereal (BFC), wheat“atta,” and other products for making flat Indian breads, wheat bran as food and feed, wheat starch, wheat germ(WG) oil, wheat straw cellulose and paper industry, malting wheat for leisure times.
5.1. Grains of Ancient Wheat and Rice StrainsThis section is an attempt to turn our attention to the grains of ancient relative strains of wheat, such as faro, spelt,kamut, quinoa, amaranth, chia, sorghum, freekeh, teff, and millet for consumption.
According to a whole grains council (http://wholegrainscouncil.org/whole-grains-101/whats-whole-grain/ancient-grains), ancient grains root their name with the emphasis that they have been in use for consumptionfrom yonder years, which have been gradually falling into oblivion. Their specialty features with varying levels of

nutrition (macro and micro) in these ancient grains, apart from fiber content, scores them a high rank for theirrevival and consumption. Moreover, these grains can be grown with minimum agricultural inputs, such asfertilizers and pesticides, which classify them as “nontoxic” and can be consumed without hesitation.
The proclamation of “International year of Quinoa 2013” by FAO highlights the significance of this ancientgrain for its rich quality protein, which can be processed into flour or consumed as whole grains. Moreover,promotion of quinoa, which is imbibed with hardiness in the face of climate change, could secure the world withfood and nutrition laden with high content of low glycemic carbohydrate.
Even wild rice is also considered as ancient grain. Wild relatives of both Asian (Oryza sativa) and African (O.glabberima) domesticated rice species (black rice/red rice) can serve as best ancient grain meal. The hardiness ofthese varieties possesses the power to feed the world sustainably under the grip of climate change. Apart fromfeeding the world, the medicinal and therapeutic values of the ancient grains of rice have been discussed in theprevious section.
Wide diversity of these ancient grain varieties and their capability to adapt to varied geographical conditionsheightens their scope of promotion as potential nutrition suppliers consumed as whole grain bread, biscuits, andcrepes/pancakes.
The ancient grains as highlighted can also be subjected to similar value-addition formulae standardized forwheat grains, enhancing the fiber, mineral, and antioxidant uptake without altering the food habits. The forgottennutritious ancient grains can be revived to bring back the real value of healthy life of humankind. More detailsabout the nutritional composition, recipes on these grains for value addition, and consumption are available athttp://wholegrainscouncil.org/.
Table 14.5 clearly tabulates the health benefits of foods made out of whole grains of wheat and rye with lowcholesterol, high minerals in comparison with white bread made out of refined flour. Remarkably, fiber content isobviously high in whole grain rye bread, reiterating the claim for low cholesterol, optimum blood pressuremanagement, and reduced risk for cardiovascular diseases among the consumers.
Table 14.5
Nutrients delivered in portions of whole grain and refined bread and pasta. a
Products PortionEnergy(kcal)/Portion
Protein(g)/Portion
Fat(g)/Portion
Carbohydrate(g)/Portion
Fiber(g)/Portion
Fe(mg)/Portion
Mg(mg)/
Whole grainryebread
40 g 90 3 0.5 16 4.5 1.5 34
Whole grainwheatbread
40 g 100 4 2 14 3 1.4 38
Whitewheatbread
40 g 100 3 0.5 21 1 0.4 7
Whole grainpasta,cooked
1.5 dl(100 g)
100 4 1 20 2 1.2 27
Pasta,cooked
1.5 dl(100 g)
100 3 0.3 20 1 1 10
Source: From Poutanen, 2012.Past and future of cereal grains as food for health Trends Food Sci. Technol. 25, 58–62.a National Institute for Health and Welfare, Fineli database version 14. Available from: www.fineli.fi.
6. Value Addition in Traditional Millet GrainsLet us first understand a key difference between cereals and millets. Cereals belong to the family of Graminae andtheir fruit is called caryopsis in which the seed coat is fused with the ovary wall.
The term “millets” is applied to species of plants that produce smaller grains compared to cereals, and withinherent drought-resistance capacity.

Millets are small-seeded and are of different varieties, such as:
• Pearl millet (Pennisetum glaucum)• Finger millet (Eleusine coracana)• Kodo millet (Paspalum setaceum)• Proso millet (Penicum miliaceum)• Foxtail millet (Setaria italic)• Little millet (Panicum sumatrense)• Barnyard millet (Echinochloa utilis)
They are known as coarse cereals besides maize (Zea mays), sorghum (Sorghum bicolor), oats (Avenasativa),and barley (Hordeum vulgare) (Bouis, 2000; Kaur et al., 2014).
The food baskets of Americans and Europeans do not have much of a place for millets. But, owing to theirsignificant role as multigrain functionality and gluten-free merit, nowadays, their attention has been drawn towardthem. Many types of millet-based traditional foods and beverages are consumed by the people of Africa and India.These traditional millet foods, such as porridges (fermented and unfermented), snacks are major energy-givingfoods for people with rural, low economic backgrounds (Chandrasekara and Shahidi, 2011, 2012) undertakingstrenuous manual labor.
As the world is not yet ready enough to consume regular millet-based products already available in the markets,it doesn’t make much difference if the value addition could be done for traditional millet varieties or for moderncultivars.
According to Truswell (2002) and Gupta et al. (2012), the millets are embodiments of health benefits, such asanticancer capability, preventing the onset of cardiovascular diseases, suppressing tumor invasion and progression,managing blood pressure levels, cardio-protective in nature, preventing accumulation and absorption of badcholesterol, giving a feeling of “fullness of stomach,” thereby delaying the frequency of food uptake.
Millets are subjected to processing methods that are traditionally done. It starts with decorticating, malting,fermentation, roasting, flaking, and grinding.
According to FAO (2012), negative changes in the sensory and nutritive properties develop during processing asviable processing methods have not yet been standardized to the required fully fledged level as that of wheat andrice. Development of appropriate value-addition methodologies is a prerequisite to creating a high demand amongurban and nontraditional millet user communities.
Value addition can be done by mechanical technologies, such as decortications, milling and sieving, baking,extrusion, fortification, etc., improving the nutritional, and sensory parameters in addition to the traditional andbioprocessing technologies of germination or malting, fermentation, and enzymatic hydrolyzation, popping orpuffing, soaking and cooking (Ahmed et al., 2013).
The value-added products developed out of millets can be broadly classified:
• Traditional foods: porridge, snacks, ethnic Indian food (Adhirasam, Khakra)• Bakery products: bread, rusk, biscuits, soup sticks• Instant food mix: murukku mix (an Indian snack)• Extruded products: noodles, pasta• Supplementary food mix
The dietary fiber of Panicum milare (samai) has the capacity to strengthen the skeletal muscles. Paspalumscobiculatum (kodo millet) regulates the function of liver, prevents eye diseases, and regulates hormonalsecretions. Eleusine cora cana (finger millet) is capable of healing stomach ulcers (Tovey, 1994). A geriatric foodambali is prepared from finger millet, which is rich in calcium and low in resistant starch. Another Indian dishmade from flour of popped finger millet is Ragi hurihittu, which has more amounts of reducing sugars with highamylase activity thereby making it desirable for its nutritional quality (Sarkar et al., 2015).
Anju and Sarita (2010) claim that the biscuits made out of fox tail millet had a very low glycemic index (GI) of50.8 than the GI value of 68 in the biscuits made from barnyard millet flour and refined wheat flour and therebygiving a strong cue that the millets can be exploited to develop low GI therapeutic products, such as biscuits,instead of just revolving around traditional foods, porridge, and chapatti (flat Indian bread).

While developing whole grains product or functional grain products, we need to pay enough attention on theexpectations of the consumer that may influence a willingness to use these products. It seems that when theconsumers were personally convinced about the capability of the value-added products in mitigating diabetes, thenthey showed inclination and willingness to buy such functional products (Dean et al., 2011).
7. Value Addition in Traditional PulsesIn line with the traditional grains of cereals, pseudocereals, and millets, a pulse doesn’t align well, as there are notmany value-added products developed solely from pulses. Mostly mature seeds of pulses are used for consumptionand occasionally green immature seeds are also preferred for consumption, for example, peas (Pisum sativum).They are considered as a good supplication for cereal proteins. Although pulses are rich in protein, they haveappreciable amounts of carbohydrates and minerals. The complementary nature of supplication between pulse andcereal is that they mutually meet the lacuna of each other. That is, lysine deficiency in cereals is contributed bypulses, similarly, pulses lack sulfur-containing amino acids, which is balanced by contribution from cereal grains.
The ethnic foods containing legumes in various combinations with other cereals and millets gives a clearunderstanding about the symbiotic blend of pulse with other counterparts from the family of cereals,pseudocereals, and millets. Such value-added products range from daily breads to weaning foods.
Some ethnic foods of malawi made with pulses (Katungwe et al., 2014) are: whole maize flour bread(chikondomoyo/chigumu) (maize + cow pea); whole maize flour fritters (Zitumbuwa) (maize + cow pea); maizeflour steamed bread (mkate) (maize + cowpea).
Some ethnic foods of India made with pulses (Sarkar et al., 2015) are: enduri pitha, idli, dosa—Indian breakfastfoods (rice + black gram); dhokla-Bengal gram + rice; Hawaijar—fermented soya bean product; weaning foodshave been used in Indian tradition. A brief methodology in preparing weaning foods is presented in Fig. 14.7;ethnic foods of iran made with pulses: apart from Africa and India, the food basket of Iran, the Middle Eastcountry is proud about its ethnic foods containing legumes and other ingredients (Table 14.6).

FIGURE 14.7 Preparation of Indian Weaning Foods Using Cereal and Legume Combination. Source: Sarkar, P., DH,L.K., Dhumal, C., Panigrahi, S.S., Choudhary, R., 2015. Traditional and ayurvedic foods of Indian origin. J. Ethn. Foods 2, 97–109.

Table 14.6
Rice + legume-based Iranian ethnic foods.
Persian NamesEnglishEquivalent Main Ingredients
Baghali polow Fava beans pilaf Rice, fava beans, dill
Chelow gheimeh Pilaf gheimeh Rice, split pea, mutton, potato, dried lemon, onion, turmeric, pepper, tomato paste
Chelow-khoreshlubia-sabz
Pilaf green beansstew
Rice, green beans, mutton, onion, turmeric, pepper, tomato paste, cinnamon
Dale-adas polow Red lentil pilaf Rice, red lentil, minced meat, onion, turmeric, pepper, coriander, mustard powder
Kary polow Curry pilaf Rice, chicken, curry, green pea, turmeric, pepper, saffron, potato
Koofteh Kofta Rice, minced meat, split pea, onion, lemon, egg, tomato paste, dill, parsley, tarragon, mint, savory
Lubia polow Beans pilaf Rice, beans, mutton, turmeric, pepper, cinnamon
Mani polow Mani pilaf Rice, raisin, split pea, barberry, mutton, noodles, onion, turmeric, pepper, saffron, caraway
Nokhod polow Green pea pilaf Rice, green pea, minced meat, onion, tomato paste, cinnamon, turmeric, pepper,
Polow cheshm bolboli Blackeyed pea pilaf Rice, blackeyed pea, dill
Sholeh amiri Sholeh amiri Rice, mung, onion, turmeric
Ash berenj Rice pottage Rice, mutton, fried onion, lentil, spinach, coriander, pepper
Ash halav Halav pottage Rice, white bean, chickpea, mutton, onion, parsley, mint, spring onion, chard, turmeric, bulgur, lemon
Ash kadou Pumpkin soup Rice, lentil, pumpkin, sugar, lemon, mint
Ash mash Mung soup Rice, mung, onion, coriander, parsley, mint, pepper
Ash miveh Fruit soup Rice, chickpea, red bean, minced meat, apricot, greengage, onion, coriander, parsley, mint, turmeric
Ash mostafa Mostafa pottage Rice, chickpea, chard, kashk (a thick liquid similar to whey), mint, onion
Ghalieh ash Ghalieh pottage Rice flour, white bean, chickpea, minced meat, onion, carrot, parsley, mint, raisin, beet, coriander,sugar, vinegar, pepper
Mashab Mashab Rice, mung, blackeyed pea, wheat, potato, pumpkin, lentil, mutton, fried onion, mint, turmeric,pepper, kashk
Source: From Karizaki, V.M., 2016. Ethnic and traditional Iranian rice-based foods. J. Ethn. Foods 3, 124–134.
It needs to be understood that as pulse grains are mostly consumed along with other cereal counterparts, the roleof value addition in developing products exclusively out of pulses are not necessary, as long as the average nutrientrequirements are balanced. But, the possibilities of developing fortified products with vegetables, fruits, seaweedsin the form of instant curry/food mix, as ready-to-use products can be ventured for creating a unique market forsuch value-added pulse products.
Apart from human consumption, the scope of developing value-added products for plants, animals, domesticand industrial applications is wide and due to space limitations, their value could not be accommodated in detail inthis chapter, which doesn’t underestimate their virtue of health and wealth promotion.
7.1. A Universal Value-Added Product From Traditional GrainsSprouted grain, sprouted grain milk, and sprouted grain mix are universal value-added products that could bedeveloped from all traditional grains, including cereals, millets, and pulses nourishing everyone with a widevariety of choices catering to age, gender, and metabolic requirements.
8. ConclusionsThe regrettable words, such as “malnutrition and hunger” will soon be forgotten from the human vocabulary whenthe traditional grains have a prominent place in every dish served and are consumed all over globe, thanks to theimpact of value addition, blessing the producers, processors, and consumers with health and wealth. This chaptercan’t reach its entirety ever and is still open to fill up with more value-added products from traditional grains withtheir hidden secrets of wellness and market suitability, which is waiting to be unveiled in the future or still inaction at someone’s skilled hands.

ReferencesAgarwal K, Bhasin SK. Feasibility studies to control acute diarrhoea in children by feeding fermented milk preparations Actimel and Indian dahi. Eur. J.
Clin. Nutr.. 2002;56(Suppl. 4):S569.Ahmed SMS, Qing Z, Jing C, Qun S. Millet grains: nutritional quality, processing, and potential health benefits. Comp. Rev. Food Sci. Food Saf..
2013;12:281–295.Alavi, S., Bugusu, B., Cramer, G., Dary, O., Lee, T., Martin, L., McEntire, J., Wailes, E., 2016. Rice fortification in developing countries: a critical
review of the technical and economic feasibility. Available from: http://pdf.usaid.gov/pdf_docs/PNACD279.pdf.Alavi, S. et al., 2008. Rice fortification in developing countries: a critical review of the technical and economic feasibility. A2Z Project, Academy for
Educational Development. Washington, DC. Available from: http://www.spring-nutrition.org/sites/.Anitha G, Rajyalakshmi P. Value added products with popular low grade rice varieties of Andhra Pradesh. J. Food Sci. Technol.. 2014;51(12):3702–
3711.Anju Jr T, Sarita S. Suitability of foxtail millet (Setaria italica) and barnyard millet (Echinochloa frumentacea) for development of low glycemic index
biscuits. Malays. J. Nutr.. 2010;16(3):361–368.Antuono LFD. Traditional foods. In: Caballero B, Finglas PM, Toldrá F, eds. Encyclopedia of Food and Health. New York, NY, United States: Elsevier;
2016:39–344.Belton PS, Taylor JRN. Pseudo Cereals and Less Common Cereals: Grain Properties and Utilization Potential. Berlin: Springer; 2002.Bouis HE. Enrichment of food staples through plant breeding: a new strategy for fighting micronutrient malnutrition. Nutrition. 2000;16:701–704.Chandrasekara A, Shahidi F. Determination of antioxidant activity in free and hydrolyzed fractions of millet grains and characterization of their phenolic
profiles by HPLC-DAD-ESI-MSn. J Funct. Foods. 2011;3:144–158.Chandrasekara A, Shahidi F. Bioaccessibility and antioxidant potential of millet grain phenolics as affected by simulated in vitro digestion and microbial
fermentation. J Funct. Foods. 2012;4:226–237.Dean M, Lahteenmaki L, Shepherd R. Nutrition communication: consumer perceptions and predicting intention. Proc. Nutr. Sci.. 2011;70:19–25.Dotty, N.C., et al., 2012. Value–added opportunities and alternative uses for wheat and barley. Auri Agricultural Research Institute. Available from:
http://www.auri.org/assets/2013/02/12-12-wheat-barley.pdf.FAO, 1997. An overview of traditional processing and utilization of cassava in Africa. Available from: http://www.fao.org/wairdocs/ilri/x5458e/.FAO, 2012. Economic and Social Department: The Statistical Division. Statistics Division 2012. Available from:
http://faostat.fao.org/site/567/DesktopDefault.aspx?PageID=567#ancor.Frei M, Siddhuraju P, Becker K. Studies on in vitro starch digestibility and the glycemic index of six different indigenous rice cultivars from the
Philippines. Food Chem.. 2003;83:395–402.Ganiyu O, Ayokunle OA, Margareth A, Olasunkanmi SO, Aline AB, Margareth L. Starch composition, glycemic indices, phenolic constituents, and
antioxidative and antidiabetic properties of some common tropical fruits. J. Ethn. Foods. 2015;2:64–73.Gupta N, Srivastava AK, Pandey VN. Biodiversity and nutraceutical quality of some Indian millets. Proc. Natl. Acad. Sci. India. 2012;B 82(2):265–273.Hegde S, Yenagi N, Kasturiba B. Indigenous knowledge of the traditional and qualified ayurveda practitioners on the nutritional significance and use of
red rice in medicine. Indian J. Tradit. Knowl.. 2013;12:506–511.Ito, S., Ishikawa, Y., 2004. Marketing of value-added rice products in Japan: germinated brown rice and rice bread. Fao Rice Conference 04/CRS.7,
Rome, Italy.Iyer B, Singhal K, Ananthanarayan RSL. Characterization and in vitro probiotic evaluation of lactic acid bacteria isolated from idli batter. Food Sci.
Technol.. 2013;50:1114–1121.Jayashankar N, Arumugasamy S, Saraswathy H, Vijayalakshmi K. Indigenous Rice Varieties: 2. Multicraft, Chennai: Centre for Indian Knowledge
Systems; 2002: pp. 1–30.Katungwe, P., Mulwafu, A., Mwangwela, A.M., 2014. Utilisation of flour milled from micronized (130C) cowpeas in maize based traditional Malawian
snacks. Workshop on traditional grains. Available from: http://projekt.sik.se/traditionalgrains/review/default.htm.Kaur KD, Jha A, Sabikhi L, Singh AK. Significance of coarse cereals in health and nutrition: a review. J. Food Sci. Technol. 2014;51(8):1429–1441.Kayahara H, Tsukahara K. Flavor, health and nutritional quality of pre-germinated brown rice. International Chemical Congress of Pacific Basin
Societies 2000; 2000Hawaii.Kyung Rhan C, Hye-Jeong Y, Dai-Ja J, Dae Young K. Historical and biological aspects of bibimbap: a Korean ethnic food. J. Ethn. Foods. 2015;2:74–
83.Llyod W.R., 2014. Workshop on traditional grains. Available from: http://projekt.sik.se/traditionalgrains/review/default.htm; file:///Y/wwwnysv/public-
html/traditionalgrains/review/default.htm.Mogra R, Midha S. Value addition of traditional wheat flour vermicelli. J. Food Sci. Technol.. 2013;50(4):815–820.Mohapatra, S., 2014. Adding value to Africa’s rice. Rice Today 13 (4). Available from: https://www.scribd.com/document/243023602/Rice-Today-Vol-
13-No-4-Adding-value-to-Africa-s-rice.Mukherjee SK, Albury MN, Pederson CS, Vanveen AG, Steinkraus KH. Role of Leuconostoc mesenteroides in leavening the batter of idli, a fermented
food of India. Appl. Microbiol.. 1965;13:227–231.Nammazhvar K, Kumaravel M, Ramesu VK. Thalanmai Velanmai. Coimbatore, Tamil Nadu, India: Nigazh; 1999: pp. 72–73.Nipat L, Makiko T, Itaru S, Kazuko N, Charunuch C, Isobe S. Functional properties of cereal and legume based extruded snack foods fortified with by-
products from herbs and vegetables. Kasetsart J. (Nat. Sci.). 2010;44:271–279.Patil SB, Khan Md K. Germinated brown rice as a value added rice product: a review. J. Food Sci. Technol.. 2011;48(6):661–667.Priya, H., 2014. Health and nutritional benefits of wheat germ and wheat bran. Handbook on Processing Technology & Value Addition of Wheat and
Wheat Products. Foretell Business Solutions Pvt. Ltd. India, pp. 33–35. Available from:http://commodityindia.com/publication/Wheat_handbook_2014.
Rao D, Bhargavi G, Patil JV. Fortification of wheat flour with millets. Handbook on Processing Technology & Value Addition of Wheat and WheatProducts. India: Foretell Business Solutions Pvt. Ltd; 2014: (pp. 19–23).

Ravishankar B, Shukla VJ. Indian systems of medicine: a brief profile. Afr. J. Tradit. Complement. Altern. Med.. 2007;4:319–337.Ritu G, Gupta A. Fortification of foods with vitamin D in India. Nutrients. 2014;6:3601–3623.Sarkar P, Lohith Kumar DH, Chanda D, Panigrahi SS, Choudhary R. Traditional and ayurvedic foods of Indian origin. J. Ethn. Foods. 2015;2:97–109.Seo S, Kim HE, Kwock M, Wie CKSH. Preferences of US consumers for setting quality factors of Bibimbap. Kor. J. Food Cult.. 2012;27:30–37.Sourirajan M. Pathartha Gunapadam—Palporul Vilakkam (in Tamil). Thanjavur: 322-328.Stading, M., Taylor, J., 2016 An introduction to traditional grains. Workshop on traditional grains. Available from:
http://projekt.sik.se/traditionalgrains/review/default.htm.Steiger G, Müller-Fischer N, Cori H, Conde-Petit B. Fortification of rice: technologies and nutrients. Ann. NY Acad. Sci. 2014;1324:29–39.Subramaniam N. Bio-processing of wheat: untapped opportunities for value added products. J. Wheat Res.. 2013;5(1):1–6.Susanna, S., 2014. Noodle/pasta improvers. Handbook on Processing Technology & Value Addition of Wheat and Wheat Products. Foretell Business
Solutions Pvt. Ltd. India, pp. 19–23. Available from: http://commodityindia.com/publication/Wheat_handbook_2014.pdf.Tovey FI. Diet and duodenal ulcer. J. Gastroenterol. Hepatol.. 1994;9:177–185.Truswell AS. Cereal grain and coronary heart disease. Eur. J. Clin. Nutr. 2002;56(1):1–4.Ugwu JN, Mgbakor M, Chitor NCC. Assessment of value addition in rice production and processing in Adani in Uzouwani Local Government Area of
Enugu State, Nigeria. Int. J. Agric. Sci. Vet. Med.. 2014;2:2–18.UNDP Human Development Report. New York, NY: Oxford University Press; 2001.USAID, 1998. Patricia B. Dexter. Rice fortification for developing countries. Available from: http://pdf.usaid.gov/pdf_docs/Pnacd279.pdf.Vijayalakshmi K, Nambi A. Toward setting up a community seedbank: experience from Chengam, Tamil Nadu. In: Sperling L, Loevinsohn M, eds.
Using diversity: Enhancing and Maintaining Genetic Resources on-farm. Ottawa, Canada: International Development Research Centre; 1997:Available from: http://archive.idrc.ca/library/document/104582/index.html#toc.
Virgin, I., Nilsson, M., Johnson, F., 2014. Adding value to the traditional grains and potential to the bio-resource based economic growth in sub SaharanAfrica Workshop on traditional grains.
Zimmerman, S., 2014. Fortification of atta. Handbook on Processing Technology & Value Addition of Wheat and Wheat Products. Foretell BusinessSolutions Pvt. Ltd. India, pp. 24–26. Available from: http://commodityindia.com/publication/Wheat_handbook_2014.pdf.
Further ReadingCordeiro LMC, Reinhardt VDF, Baggio CH, Werner MFDP, Burci LM, Sassaki GL, Iacomini M. Arabinan and arabinan-rich pectic polysaccharides
from quinoa (Chenopodium quinoa) seeds: structure and gastroprotective activity. Food Chem.. 2012;130:937–944.Iglesias-Puig E, Haros M. Evaluation of performance of dough and bread incorporating chia (Salvia hispanica L.). Eur. Food Res. Technol..
2013;237:865–874.Sofi F, Whittaker A, Cesari F, Gori AM, Fiorillo C, Becatti M, Marotti I, Dinelli G, Casini A, Abbate R, Gensini GF, Benedettelli S. Characterization of
Khorasan wheat (Kamut) and impact of a replacement diet on cardiovascular risk factors: cross-over dietary intervention study. Eur. J. Clin. Nutr..2013;67:190–195.

C H A P T E R 1 5
Role of Food Product Developmentin Increased Food Consumptionand Value AdditionMian K. Sharif
Asna Zahid
Faiz-ul-Hassan Shah National Institute of Food Science & Technology, University of Agriculture, Faisalabad,Pakistan
AbstractTechnological developments over the past few decades have affected standards of livingsignificantly and have also influenced food industry. Food prepared today is different from thatproduced decades ago. Food production has shifted from small agricultural farming to large-scale mechanized production processes, which have transformed the way food is grown, stored,distributed, and consumed. The food industry is making new, innovative and value-addedproducts with a focus on quality, functionality, packaging, form, and ease of possession. Suchproducts are made to increase revenue and satisfy consumers’ changing demands, which aredriven by parameters, such as population growth, lifestyle and economic changes, agingpopulation, and increased awareness about healthy foods. The food industry is also developingspecific food products for people with specific health problems or who belong to differentcultures and religions. Thus, with advancements in food product development, consumers areable to get superior products, which have led to increased food consumption worldwide.
Keywords
food product developmentvalue addition

food consumptionpopulation growthmodern lifestyleinnovative productsincreased food consumption
1. Food Product Development1.1. IntroductionOver the past few decades, major changes in agriculture and industry havetaken place, which are driven by factors, such as growing population,lifestyle and economic changes, aging population, and other social andenvironmental influences. These factors have brought about agricultural andindustrial revolution. Food production has become more uniform as themanufacturing process has changed from traditional methods to large-scalemechanized processes. These processes have been altered to show how foodis grown, processed, and distributed. Furthermore, consumers’ needs anddesires have also been altered with demographic shifts. For example, insome families both partners have full-time jobs, thus eating together at aparticular time has gradually been replaced with more individual meals atless particular times. Moreover, many consumers are inclined to expend lesstime on preparing their meals because of increased work pressure and busyroutines, and more time on other recreational activities, such as sports, sothey need meals that can be readily available for consumption. Similarly, itis expected that in the coming years, people aged 45 years and older will bea major part of the global population. So taking these demographic changesinto account, food, nowadays, is grown and processed based on the needs ofthe consumers, the desires of the consumer, and also as a means to increasethe sustainability of food supply systems (Costa and Jongen, 2006). Thusthe appropriate use of new and advanced technologies is relevant for thesuccessful development of new products that are easily prepared, packaged,handled, transported, and consumed. The term product developmentdescribes the idea generation, product design, and detailed engineeringinvolved in bringing new products to the market, which are possible with a

proper understanding of the science of food—food chemistry and nutrition.New products made by food industries with the knowledge of variousingredients and global cuisines are being launched in markets worldwide,and the industry is keen for further development of these productsaccording to changing trends. This process involves people that worktogether across a range of disciplines for successful product development.Other technological developments, like agricultural modernization have ledto the introduction of pesticides and chemical fertilizers, which have furtherincreased production of raw material. Thus with the increase in population,food supply has also been increased. Moreover, product developmentcomprises the use of accurate ingredients at accurate levels, that leads tosuccessful marketing and increased consumption (MacFie, 2007). Throughthese innovations, current food products have prolonged shelf life, safety,affordability, and are easily accessible (Beckley et al., 2008).
1.2. HistoryToday, food manufacturing is considered one of the largest industries in theworld. This business is growing day-by-day and bringing innovations in theform of convenience, extended shelf life, food safety, and food productswith enhanced aesthetic, texture, and flavors. Resultantly a large number offood products are now available in the market. This great revolution in thefood industry is directed by technological improvements, changing trends,and the needs of consumers, shifting the food industry toward advancedlevels. For example a child of 1950s would have seen his mother preparingdinner for her family. She spent her entire day going to the butcher andgrocer to buy fresh ingredients, cook them, and make a well-balanced meal.Now, there is a wide range of food products, which have replaced thoseconventional methods of food preparation, and ultimately preparing foodhas become a convenient task. This is a gradual change, which took placeover a century. To understand how this change took place we have to lookinto its history (Beckley et al., 2008). In the 1880s, most of the world wasrural and used a farm-based economy. At that time, almost 70% of thepeople farmed their own land and ate reared livestock and the commoditiesthey produced. At that time, meeting the needs of a growing population wasa concern. Moreover, most people spent entire day at work and it was

difficult for them to spend a lot of time preparing meals, so horse-drawnlunch wagons were introduced, which were followed by restaurants andgeneral stores. Then there was prosperity in product development from1900 to 1910 as the rural areas were replaced by expanding cities andcommercially manufactured foods and restaurants gained importance.Hydrogenation processes were developed, that convert mono- andpolyunsaturated oils to solid fat, increasing the melting point and slowingrancidity, thus improving the shelf life of food products. Likewise, instantcoffee and canned tuna was introduced during this era. Further progress inproduct development took place from 1911 to 1920. In this time period,continuous cooking and cooling equipment was introduced. World War Ihighlighted concerns about soldiers’ nutrition, which led to thedevelopment of fortified food products. After the First World War, from1921 to 1930, tremendous new products were introduced, such asprepackaged meat, French fries, frozen foods in packages, and numerousother commercial food products, such as baby foods, powdered fruit drinks,biscuits, cake mixes, and so on. Further industrial progress took place in the1930s, and automated kitchen appliances like electric blenders and pressurecookers were developed, along with processes, such as deep freezing. Saladdressings and Kraft Macaroni and Cheese Dinner made cooking easy. Theintroduction of evaporated and fortified milk led to health benefits. Thefood industry was revolutionized from 1941 to 1950; products, such asdehydrated potatoes and altered rice were produced, having extensive shelflife. Some products were introduced in frozen form, such as pastries, soups,French fries, whipped topping, meat pies, seafood, and pizza. Thedistribution of food products improved, and the rise of fast food chainshappened from 1951 to 1960. Margarine was developed, having anextended shelf life than butter. Furthermore, advancements in pasteurizationtechniques accelerated the production of pasteurized fruit juices forextended storability. This development revolutionized the beverage industryfrom 1961 to 1970. Sugar substitutes, such as high fructose corn syrup,pull-tab openers, and reusable plastic bags were also introduced. Due to theconcept of prepackaged foods, fresh foods with natural seasonal ingredientswere forgotten, thus, fresh foods with natural spices were reintroduced from1971 to 1980. This era is known as the natural or organic era, and products,such as baby foods, herbal teas, and mineral water gained importance.

Further healthy products were introduced from 1981 to 1990 as healthgained importance in this era; sugar and fat substitutes replaced sugar insoft drinks, low fat, low salt, and low cholesterol entrees were preferred.From 1991 to 2000, different types of packaging were developed.Furthermore, standard nutrition labels were approved by Congress, whichoutlined label claims, such as low sugar, low fat, low sodium, and so on.Nutraceutical and functional food products started to gain importance aswell. In the beginning of the 21st century, food products, such as ready toeat meals, home style frozen meals, and processed and organic foods gainedfurther importance. Sales of fresh, dried, and processed commoditiesincreased. Due to unhealthy eating and living style, obesity became agrowing concern, so popular diets, such as the Atkins and South Beachdiets were introduced. Thus the food industry is still the most flourishingindustry and is developing healthier products with value-added attributesfor consumers (Beckley et al., 2008).
1.3. Development of a New Food ProductThe development of food products is an amazingly multifaceted effort thatemploys the abilities, patience, assets, and commitment of an entireenterprise. The development of a new product is also considered an “art,”where numerous individuals working together complete a bright idea raisedin the brain of an inventor (Moskowitz et al., 2009). The development of anew food product is mainly driven by consumers’ demands. The demandsof consumers change as time passes. These changes vary from basiccontemplations, such as improvements in food safety, shelf life, andreducing food waste, to demands for more and more refined foods havingspecific features, palatability, and suitability. The genuine process ofdeveloping a product is determined by the collaboration between consumerexpectations and demands, the nominal ability of food manufacturers, andevolving information from food science research (Winger and Wall, 2006).
1.3.1. Product development processProduct development processes consist of organized, commercially adaptedstudies that are focused on developing specific products and procedures,

which can satisfy the needs of a known or a suspected consumer. It is atechnique of industrial assessment in its particular rights. It is a blend ofnatural sciences, social sciences, dispensation, and consumer sciences into acombined investigation aimed to develop new products. There are basicallyfour stages in this process, including:
1. Product strategy development2. Product design and development3. Product commercialization4. Product launch and postlaunch
Each and every stage of product development has events, which produceoutcomes and draw conclusions. The first stage in product development isthe development of a strategy, including initial screening, which is done inthe first phase, followed by a detailed market assessment and research,which is used to determine which products are already in the market andwhere there is room for new products. After proper research, productconcept development is done, which is then subjected to a financialfeasibility study; further decisions about the product are made according tothe results of this study. The second stage in product development is designand process development of the particular product, which involvesprototype design or development—after the concept has been developed,then the scientists work together to develop one or more prototypes. In-house testing is done followed by consumer testing. Once the productdevelopment scientists have refined their prototypes, they are tested bysensory scientists for various attributes, such as appearance, taste, aroma,texture, overall acceptability, and so on, to further refine the formulas withmaximum consumer acceptability. When the formula is finalized, it issubjected to a large-scale production plant, which is called scaling up. Thethird stage involves commercialization of the product. At the end, theproduct is ready to be launched in the market. After the product is launchedin the market, product support needs to be in place to receive feedbackabout how the product is running and if the consumers satisfied or not. Theperception of consumers about products depends on the site where theconsumer is present and the categories of food products, which arecurrently in the market. For example, in early 1990s Asian foods were new

to Western superstores, but they were deep-rooted products in Asia. Thechallenge for food manufacturers is to develop products, which are suitablefor the marked consumer. In this example, the particular flavors,ingredients, and intensity in Asian foods sold in Western countries areconsiderably different than those in Asia. In the same manner, ice creamflavors present in Asia (e.g., coconut, mango, pistachio) are not popular inwestern countries, which normally prefer chocolate, vanilla, and strawberryflavors. This example illustrates that the key principle in productdevelopment is the compulsory need to certify that the developed foodproduct meets a consumer demand. The eventual examination of theproduct in the market is done and the product is only considered successfulif it has a market and economic success (Winger and Wall, 2006).
1.4. Categories of New Food ProductsNew food products introduced by food companies can be categorized as:
1.4.1. Me-too productsThese are existing products produced by a different company. This group ischaracterized as the largest group of novel food products.
1.4.2. Line extensionsThese are alternatives to a renowned product, for example, new flavors ofproduct. Development of such products requires relatively less strength andtime.
1.4.3. Repositioned existing productsProducts, which are already present are promoted again so as to repositionit, for example, due to increased consideration of health promoting productsa brand of margarine repositioned its product, taking into account itsnaturally high tocopherol (vitamin E) content. The time taken fordevelopment of this type of product is nominal but the marketingdepartment has to work hard to maintain the position of the product in themarket.

1.4.4. New form of existing productsProducts, which exist, are transformed into another form as per the demandof consumer, such as dried soups. Such products may involve an increaseddevelopment time as the physical properties of the products are completelychanged.
1.4.5. Reformulation of existing productsIn this group, acknowledged products are manufactured with a newformula. Reformulated products have better color, flavor, and fiber contentand are low in fat, sodium, saturated fat, table sugar, and cholesterol.Development processes of such products are reasonable and need less time.
1.4.6. New packaging of existing productsThis group comprises of recognized products with new and advancedpackaging ideas. New concepts of packaging require expensive packagingapparatuses.
1.4.7. Innovative productsThese are the products, which result from alterations in present productsother than defined earlier. Such products have an added value. The processfor designing these products is usually extensive and expensive. Besides,marketing of such products is sometimes costly. Though, sometimes costand time of novelty is relatively less.
1.4.8. Creative productsThese are truly new products that are brought into existence, for example,new protein foods, which are created from vegetable proteins. Theseproducts normally require wide-ranging development are usually pricey andhave a chance of failure.
2. Value AdditionValue addition is mainly enhancement, which a company gives to itsproduct or service before the product is offered to the consumer. Certain

characteristics are involved that add value to food products include quality,functionality, packaging, form, place, time, and ease of possession. With thepassage of time, consumers’ demands, lifestyle, preferences, choices, andtastes are changed. Consumers are more conscious about their well-beingand want reductions in disease risks. Consumers’ demands and needs createan opportunity for food technologists to add value to food products. Newproducts are designed according to the consumers’ demands. Globaleconomies and trends are shifting, which has increased the internationalmarket for value added products. The process of value addition producesdiverse products that can increase sales, generate profits in the off-season,stabilize income, and also increase profits by making use of excess produce.Value addition provides opportunities for other groups or sectors to createprofit from the products of food and can provide an outlet for other creativetalents (Hanselka and Anderson, 2009). Furthermore, the role of productdevelopment in value addition is to produce a new recipe that does not existto fulfill the demands of consumer and to increase profit. With the help ofappropriate information about food and food products, value is added tofood that reduces uncertainty risk (Browning et al., 2002).
2.1. IntroductionValue addition is defined as an extra feature of an item of interest, whichmay be a product, service, person, and so on that provides something morethan standard expectations, even if the cost is higher to the client. In short,value addition is the process of adding value to a food product (rawmaterial) and transforming it into a more valuable product (Coltrain, 2000).The food industry can add value to a food product through different ways,such as processing, packaging, genetic modification, or by introducing newflavors and colors. For example, wheat is transformed into flour byprocessing or milling and corn is transformed into breakfast cereals, whichare then properly packed to extend the shelf life of the product (Salinet al., 2002). Consumer demands regarding health and nutrition areincreasing and technological advancements have enabled producers toproduce products that fulfill consumers’ needs. The producers also producekinds of products that are for the end user. This means not only producing

raw material. For example, beef producers producing meat that is ready toeat instead of raw meat products (Coltrain, 2000).
The Agricultural Marketing Resource Center (AMRC) described valueaddition as:
• altering the physical shape or state of an agricultural product, suchas the conversion of wheat into flour by milling, corn into ethanol,and canola into biodiesel;
• alterations in the production process and processing that increasethe value of the final product; and
• marketing that is done on the basis of unique characteristics, forexample, marketing soya beans through a well-preservedmarketing system (Lambert et al., 2006).
The USDA defined value addition in agriculture as:
• The agricultural commodity has almost five methodologies that arevalue added; these include changes in physical condition,production in a way that increases the product’s value, physicalsegregation, the source of a farm’s base renewable energy, and ifthe product is marketed as a locally produced agricultural foodproduct.
• When the physical state changes, more revenue is derived frommarketing processing and physical segregation (Lu andDudensing, 2015).
There are two different ways to increase value in agriculture, whichenhances the margin between gross output and intermediate input cost, suchas by increasing the efficiency of production and by changing the forms offood, functions, quality, and the characteristics of food (Lambertet al., 2006). Value addition in food products is done two different ways toevaluate the efficiency of marketing, such as innovation and coordination.The first case is a process to bring something new and different to themarket. The main focus of innovation is to improve existing processes,procedures, services, and products to create new and better products.Innovation can be done by producing alternative crops (such as castor beans

for their oil) through research and by replacing traditional crops. Valueadded producers could create more profit by producing an alternative cropand innovative products. Coordination mainly emphasizes the arrangementsof the produce and marketing farmed products. It alters customarymarketing dealings that link consumers, food retailers, suppliers, and foodmanufacturers. Coordination among them helps to produce better andeffective end products. Individual efforts are not sufficient to produceproducts of good quality. Joint effort is required to enhance marketcompetence and decrease budget, because different individuals havedifferent skills and talents to produce and market a product (Coltrain, 2000).
2.2. BenefitsValue addition in food products helps to increase revenue, as by addingextra value to a food product, its financial value increases. For example, theprice of corn increases when it is sold as corn flakes, and its price increasesfurther when we introduce different flavors of corn flakes. Value addition infood products allows food manufacturers to focus on the consumer to meettheir needs instead of only product production. For example, if we want toproduce mango juice, the variety of mangos will be selected in accordancewith consumers’ choices. Value addition can help to increase the shelf lifeof food products so that we can use such products for an extended timeperiod. In this way, producers can get more profit by the assurance that theiritems have a longer shelf life. For example, producers take milk from theproduction line, which has a shelf life of one day, but preserving the milkusing UHT technology packing it in a tetra pack enhances its shelf life.Now this milk has a shelf life of several months. Value addition helps toincrease the bargaining power of a product. For example, if a producergrows fish that are free from contaminants, this will boost up the bargainingpower against that fish that are not free from contaminants. With the help ofvalue addition in food products, marketing bills are increasing every day.Producers or marketers get positive results through value added products,and the consumer is also satisfied with the product (Lunghabo, 2014). Valueaddition in food production and manufacturing is equally beneficial for theproducer, consumer, industry, and government. A brief description of eachis given below.

2.2.1. Benefits to producerValue addition in agriculture and food products helps farmers/producersfocus on the consumers’ preferences. They characterize value addition bychanging their position in the supply chain, by altering productionprocesses, which preserve the inner characteristic of raw materials andproducts, and by developing strong relationships between themselves andthe consumers. It helps a farmer or a producer to think beyond what theyare producing (Lu and Dudensing, 2015). Value addition is very importantfor producers because it provides an opportunity to convert unprofitableenterprises into a profitable product. A coffee farmer simply grows coffee,harvests it, takes it to the market, and sells it to local processors at a lowprice. This type of marketing may be viable for a short period of timebecause it covers only the cost that is involved in the production of crops.But it is not a good strategy because it will not fulfill the total cost ofproduction. The farmer/producer has a lot of options before selling the cropto the market. The producer can remove dust particles, wash, and dry thecoffee beans to increase product value. Now this coffee can either be storedfor some period or sold. In this way, value is added to the coffee. If aproducer sells the coffee at this stage, he can get more profit than before. Ifa farmer sells this coffee to the processor and the producer adds furthervalue to the coffee by making instant coffee or by adding beautiful andattractive packaging, this will further generate good revenue(Fleming, 2005). More value can be generated by the producer by openingcoffee farms to visitors who can visit the farm/production area and learnmany things about the different processes through which coffee passes,such as growing, pulping, washing, drying, milling, roasting, packaging,and labeling. Taking the coffee to the agricultural tourism level is a valueadded strategy. It allows more and more entrepreneurial growers to operatea retail market and give an opportunity to sell coffee through the Internet tothose consumers who had already visited the farm. It is a more profitablestrategy for the producer who can market coffee in essentially differentways, such as organic coffee. Organic production is very effective.Likewise, coffee produced at different regions has different characteristic soit can be marketed according to its region of production. These strategiesadopted by the producer increases the cost of the product. This is the way

producers can add value to their product and get benefits from valueaddition (Fleming, 2005). If we consider a wheat producer, he can add valuein wheat in different ways. First, wheat is used for production of food andfood products. The waste of wheat, such as wheat straw, can be harvested,processed, and then turned into building materials. From wheat grains, aproducer can generate organic natural food products and market it as ahealthy food. A producer grows and harvests wheat but instead of selling itas it is, he washes, dries, and removes the dust particles from wheat. In thisway, value is added to wheat. Further processing and milling is done tocreate different products from wheat, which will increase profit. By takinggreater responsibility for their products, producers are moving closertowards the consumer. Value addition in a food product can develop astrong relationship or link between the producer and the consumer(Hanselka and Anderson, 2009).
2.2.2. Benefits to consumerBenefits of value addition to the consumer can be classified into twocategories: customer value and consumer value. Customer value is definedas the benefit that the customer gets when he buys the right things at theright price. If the product price is higher and it also has benefits, thecustomer perceives that product as valuable. The interaction betweencustomer and producer creates customer value and opportunity to add valueto the product. Customers have different perceptions about value addition,such as quality, quantity, service, convenience, comfort, selection, andhealth (Hanselka and Anderson, 2009; Lai, 1995). Second, consumer valueis defined as an important personal goal that consumers want. Consumersbuy products just for the sake to get benefits, and to satisfy their desires andpersonal values, rather than for the transactional value. The product’sbenefits alone do not explain consumer product choice (Lai, 1995). Valueaddition in products creates a relationship between the producer andconsumer. It provides a good chance to have interactions with the consumer.The consumer receives benefits, such as the product quickly entering themarket so he can get it easily. Another benefit is direct access toinformation about the product of interest. Value addition is a very importanttactic used by small businesses to acquire and retain their customer,

increase brand awareness among consumers, and differentiate one’s place inthe market and among consumers (Morrison, 2013). Producers try to reachconsumers by offering unique and healthy food and also by advertisementsthat convey their message to the consumer. When the income of theconsumer rises, he tries to buy unique food products that are highlyprocessed, advertised, and low price (Boland, 2009).
Consumers prefer to replace traditional foods with new food products.Ready-to-eat value added food products provide convenience to theconsumer. Food eaten away from home has increased by almost 50% in thepast 2 decades. Growth trends according to consumers’ demands have beenidentified as foods that are convenient and comforting for the consumer,such as matching his or her ethnic background and population age; lowcalorie meals, fresh foods instead of frozen or canned meals, and healthynatural food products are also in trend. Value added producers should placeemphasis on these factors according to the consumers’ desires(Boland, 2009). Value added food products have a lot of advantages forconsumers. Traditional food is difficult to get from a market, is not properlypacked, has a small shelf life, and takes time for preparation. Value additionin food makes it convenient for the consumer to get easily from the market.Now the consumer may have easy access to “ready to eat meals” and foodthat has a shelf life of several weeks, months, or years. The consumersimply goes to the supermarket and buys desirable products. For example,value added chicken products are of great interest to the consumers ofdeveloped and developing countries. If chicken is simply farmed by theproducer in poultry farms and sold as such, the consumer would not bewilling to pay more than the cost of that chicken, and he has to work hardfor its preparation. In this way, the consumer’s demand is not fulfilled. Thefood industry uses different techniques to add value to chicken according toconsumers’ preferences, such as production, washing, processing, storage,added flavor, and spices. In this way, a consumer is ready to pay a premiumvalue for different combinations of chicken products that ultimately haveadded value. If the industry further adds value to the chicken and makesdifferent products from chicken, such as nuggets, pop shots, patties,tempura, croquettes, and so on, these products attract the consumer, whowill pay a high cost for these things. The consumer is now happy, gettingdesired products that can be readily cooked at home although he has to pay

even more than 30% of the original price for these chicken products. Manyconsumers prefer organic products and are more likely to pay a superiorprice for value added goods. The food industry should design new andinnovative products according to consumer preferences for their satisfactionand generation of more profit (Michel et al., 2011).
2.2.3. Benefits to industryProduct development and value addition is a main strategy of foodindustries to remain economical and maintain a position in the market(Winger and Wall, 2006). There are three types of food industries that addvalue in their food products. The first one is demand driven industry; theseindustries locate their facilities close to their customer. For example,bakeries are located in a highly populated area where their products areclose to the customers. The second type of food industry is the agricultureindustry, which is located in major agriculture production zones. The thirdtype of food industry is foot loose industry, which fulfills or satisfiesdemands of a relatively large area with one plant. Their contribution inregards to value addition is larger than the demand driven and agricultureindustries (Salin et al., 2002). The food industry transforms raw materialsinto value added final products that are safe and healthy for the customers.Raw materials are washed, dried, stored, refrigerated, processed, preserved,packed, and labeled by the industry to satisfy customers’ needs and fulfillrequirements. The industry should focus on and adopt some elements ofvalue added business to satisfy the customers. For example, the industryshould adopt market changes, open to explore new ideas and products, andoperate or work more as a resource manager than as a producer. A majoraim of the industry in providing value added service is to developrelationships with the customer that will lead to more revenue. The foodindustry launches thousands of new products every year with increasingcompetition. They add health benefits and convenience to foods, which is agood way to attract customers. For example, companies have lot ofopportunities to add value in the beef industry. Industries rear cattle andthen slaughter them; following the washing and processing of meat, somespices are added and the meat is refrigerated for long periods of time. Themeat industry puts effort into the production of refrigerated products, such

as sausages, hot dogs, tamales, and so on, which have a long shelf life andcan be used for several months. After that, the industry makes their producteasily available for the customers at a reasonable cost and makes peopleknow about their product through advertisement and media (Hanselka andAnderson, 2009; Maverick, 2015).
2.2.4. Benefits to the government/tradeValue addition in food products is also very important at the governmentlevel. It provides many benefits to the government and the country’s trade.Value addition makes it easy for a country or a state to increase theirexports and to earn more international revenue. It helps to increaseglobalization, influence foreign media, awareness about health amongurban and rural consumers, and it develops good relationships betweendifferent countries through their exports. Governments are ready to takeproducts with added value and try to regulate them for trade, whichencourages imports of value added foods. Governmental agencies playimportant roles in creating public value. The government of a country ismore concerned about public health and welfare. The modern world is moreinterested in new, innovative ideas and healthy products. This increasesexports and imports of value added products. For example, Kellogg’scompany produces corn flakes, which are a value added product. Thisproduct is delivered to the whole world and is utilized as a breakfast cereal.Likewise, drinks and beverages are exported to other countries, whichgenerates great gross revenue (Koopman and Wang, 2012). The WorldTrade Organization requires its member countries to export theiragricultural commodities free of cost. International trading helps toinfluence agricultural production, processing, and marketing of value addedfood products. Value added food products replace and complementdomestic production of food. It also increases easy access to foreignmarkets to generate more profit. Overall, value added processing andmarketing helps in the growth of the agriculture sector (Boland, 2009)(Fig. 15.1).

FIGURE 15.1 Suggested Caption should be replaced with:Benefits of Value-Added Processing for Various Stakeholders.
3. Reasons for Increased Food Consumptionand Value AdditionEnormous revolutions in agricultural practices occurred during the last 5decades that have boosted the global capacity to provide food for themasses through increased production, great variety, and less seasonal

dependence. The food processing industry plays a central role in linking theproducer with the consumer and it also has an influence on farming anddistribution. This industry has flourished to a large extent and is now able todeliver the buyer with variety of foods and food products according toconsumers’ demands. During the last century, along with the revolution infood industry, other factors, such as economic growth, alterations in tasteand preferences, and immense development have caused drastic changes inpatterns of food consumption from that of traditional food commodities toprocessed and high value commodities (Kearney, 2010). Such dietarychanges are called “nutrition transition.” These dietary changes includeshifts towards diets that are rich in energy density, added fats and sugars,saturated fats, cholesterol, and sodium, are low in complex carbohydratesand dietary fiber, and reduce fruit and vegetable intakes. Such dietaryfluctuation together with lifestyle changes reflects reduced physical activity.The reason for this shift in dietary patterns is massive availability of foodproducts to the consumer with the support of the food processing industry(Amine et al., 2002). This topic will provide some of the insights adjoiningthe most obvious driver for increased consumption of food in globalpopulations since previous decades. The following factors have acceleratedincreased food consumption and value addition:
1. Population growth2. Modern lifestyle3. Aged population4. Consumers’ demands5. Wellness foods/foods for health promotion6. Age specific foods7. Special foods for allergies and intolerances8. Foods for specific cultures
3.1. Population GrowthIn order to live a productive life a person needs ample amounts of food overhis or her lifespan according to his or her needs. It is the obligation of thestate to provide inhabitants with the proper amount of food as per theirrequirements and choices. The availability of food most probably depends

upon three main aspects: the accessibility of arable land, available water,and population pressures. With increasing populations, land and waterresources have become limited, especially in developing countries wherefood and nutrition security has emerged as a major public issue. Globalpopulation has increased up to fourfold in past century. At present, it isabout 7.5 billion and is likely to increase over one billion in next 15 years,reaching almost 8.5 billion in 2030, up to 9.7 billion in 2050, and 11.2billion by 2100 (United Nations, 2015). As the population around the globeis increasing at a startling rate, it has become a challenge for states toprovide enough food to the people, which led to the food crisis. The currentrate of food production by agricultural lands only is not sufficient to feedthe growing population. The production of food has to be increasedconsistently with the growth of the world’s population if we are to avoid atotal food crisis (Carlsson-Kanyama and González, 2009), as well as reducethe postharvest losses through value added food processing. At the moment,the food industry is doing its best to meet increased consumer demands.The food industry has employed the latest techniques of productdevelopment and is developing new and varied products to meet the needsof consumers. New technologies employed provide products with increasedenergy densities to meet the energy requirements of the population.Techniques, such as preservation, packaging, and dehydration have beendeveloped to increase the shelf life of food products and preserve nutrientswithin the food chain for human consumption, rather than wasting them.The food industry is developing enormous products with differentprocessing techniques and trying hard to fill the gap in food supply anddemand. For example, previously seasonal fruits and vegetables are nowavailable year round, milk and other dairy products are preserved for alonger time, and cereals and grains are available in various forms that meetbasic energy requirements (Godfray et al., 2010).
3.2. Modern LifestyleLifestyle usually refers to a person’s attitudes, customs, morals,or worldview. A person’s lifestyle can be influenced by many factors, suchas an individual’s environment and societal and technical systems. Over thepast century, people’s standards of living have improved. Numerous

elements in our surrounding environments have transformed. Institutionaland technological changes have greatly altered the way by which urbanresidents work and their social attitudes and values are changing. People arebusier and have less time for themselves. They have fewer leisure activities,work the whole day, and need products that are readily available for them tocope with such settings. Thus, social and technical advances taking placeover the last few decades have prompted the need for a transition of theagricultural and food industry segments’ orientation from production tomarketplace.
3.2.1. Changes in eating habitsWith changes in lifestyles, people’s eating habits have also evolved. Thesedietary changes are affected by many factors; for example, the technologythat is present in our kitchens, the means of transportation delivering to ourmarkets, the media, the government, and employment and voyage. Thecurrent ways of shopping and food preparation have also been altered bychanges in attitudes towards health, table manners, “foreign” foods, andchoices. Our eating habits have changed to such an extent that the diet ofour parents, grandparents, and great-grandparents would be unnatural tomany people, as they took home basic vegetables, meat, dairy, and otherfresh foods as lunchtime snacks, and our lunchtime snacks mostly includesandwiches, pizzas, burgers, spring rolls, and so on.
3.2.2. Newly developed food products conferring lifestylechangesFood markets are now filled with new consumer products that have reducedthe time spent at home cooking; farm based gardening changed to ready-to-cook meals and processed foods have taken over the grocery stores. Ready-to-eat meals, ready-to-cook, and ready-to-use foods have flooded themarket; they take no time to cook and taste good. These foods includefrozen foods, such as meat, parathas, or French fries; canned products, suchas canned tuna and vegetables; precut fresh fruits and fruit salads; fruitjuices that have a shelf life longer than 6 months; and ready-to-use soup ornoodles that can be instantly cooked. Moreover, fast food chains arebecoming a global phenomenon. Fried chicken, burgers, sandwiches, and

pizzas are easily available in nearby restaurants. Junk food products are alsoavailable in the market as people today have the habit of nibbling the wholeday. Such products include packaged chips, biscuits, chocolates, and so on.(Ross et al., 2009).
3.2.3. Aged populationLife expectancy has increased as a result of developmental andtechnological advancements. As a result, the amount of people aged 60 orolder is growing rapidly. In 2015, the estimated number of people in thisage group was 901 million, which is equal to almost 12% of the globalpopulation. The population of people aged 60 years and over is rising at afrequency of 3.26% per annum and it is estimated that in 2050, thepopulation of people above 65 years of age will grow at four times the rateof today (Giacalone et al., 2016). As life expectancy has increased, it isnecessary to meet the needs of this diverse and rapidly growing populationgroup. Different kinds of food products have been developed for elderlypeople with attributes, such as controlled portion sizes with relatively lesscalories, as elderly people have less energy requirements. Foods that arenutrient dense, have modified textures for easy chewing and swallowing,have enhanced flavors to mask flavor perception declines, are fortified bymicronutrients as nutrient absorption capacity decreases with age, and foodsthat are soft or finely cut into pieces so that they can be easily handled andconsumed using a fork or a spoon are also marketed to the elderlypopulations. Packages that contain such food products are easy to open anduse (Giacalone et al., 2016). Thus, with development of targeted foodproducts for elderly people, it is easy for them to consume what they likeand make their meals more enjoyable. As more people are getting older andthere is an increased demand for such products, the food industry is makingenough food products for this age group so that most people can benefitfrom them, fulfill their requirements, and feel pleasure eating them.
3.3. Consumer’s DemandsWith changing trends, demands of consumers have also changed. Todayconsumers want choices and variety with uniqueness. For example, a

mother wants food that can be cooked in 15 min or less, but should behealthy, make her family feel good, and promote longevity. She also wantsthe food to taste good so her family cherishes it (Beckley et al., 2008).Customers, such as foods that are appropriate, garden-fresh with lesspackaging and processing, and healthy (low in fat, sugar, and salt). Foodsshould also provide health benefits along with nutritional benefits and haveenhanced flavor and taste (Zink, 1997). The food industry knows that theconsumers have specific demands so food professionals are keen to developnew products by adding value. The industry strives to make the supplychain more effective and efficient and create low cost, value addedproducts.
3.3.1. Fresh food productsProducts are being developed by the industry according to consumers’demands that are fresh and have less processing and packaging. Forexample, fruit juices or nectars were first pasteurized by subjecting them tohigh temperatures for longer times, which had a negative effect onnutrients, or they were preserved by adding preservatives to prolong theirshelf life, but now they are subjected to ultra high temperatures for of 15 s,which causes a minimum loss of nutrients and also improves shelf life.Juices with no added preservatives are attractive to the consumer andincrease the demand of the product.
3.3.2. Healthy foods (low salt, sugar, and added fat)With increased awareness, consumers know that they have to take care oftheir health. More than 50% of consumers are interested in foods that arelow in salt, added sugar, or fat, assuming that these are not good for health.The industry is developing new food products that have low or no fatattributes and many low salt products have been developed. Nevertheless,consumers perceive low salt products to be less tasty, but newly developedproducts have better and enhanced taste, as the salt is replaced by flavoringherbs. Such innovations in food products have increased consumers’demands for these products and give value to the consumers. Artificialsweeteners that have little or no calories are replacing added sugar in foodsand beverages, attracting diet conscious and diabetic people. This is an

innovative way to add value to food and develop new products for specificgroups.
3.3.3. Foods with health benefitsWith an increased understanding of the relationship between nutrition andhealth, many consumers are inclined towards products that providenutritional and health benefits together. For this purpose, new value addedproducts that provide health and nutritional benefits and satisfy consumersare continuously being introduced in markets. Furthermore, foodfortification and enrichment is being done to provide the recommendedamounts of nutrients to consumers. These types of food products catch theattention of health conscious people and have aroused the market of suchproducts.
3.3.4. Innovations in flavor and tasteThe chief characteristics of a good food product are its flavor and taste.Good flavor and taste increases the demand of the product. Whiledeveloping a new food product, food manufacturers keep in mind the likesand dislikes of specific consumers. Products with health and nutritionalbenefits are only accepted if these are also good in flavor and taste. Aproducer can introduce value added food products with new and elegantcolors and flavors. The food industry tends to make products in a new wayto attract maximum consumers. For example, coffee is consumedworldwide and its brewing, drinking, and trading is not unfamiliar toanyone. It was first consumed in Ethiopia over 1,000 years ago. The foodindustry made innovations in coffee by adding milk, sugar, and cream to it,which was widely accepted, even by people who did not like it very much.Now, a lot of flavors in coffee have been introduced, such as caramel,vanilla, chocolate, and so on, and high quality, specialty coffees andindulgent drinks based on coffee are also being introduced, attracting a widerange of consumers. In the same manner, chocolate, when introduced to theworld, had a bitter taste and was not readily accepted, but withadvancements in technology and innovations in the food industry, acompletely new chocolate was developed with a delicious taste. Thechocolate now available is sugar-based chocolate and has varieties, such as

chocolate with nuts, fruits, biscuits, white chocolate, and so on. Now it hasbecome a globally favorite food. Due to its delicious taste and attractivepackaging it is also used as a gift or symbol of love. With innovations andvalue additions in chocolate in a different way demands for the chocolatehas increased. Similarly, children do not cheerfully accept yogurt, which isconsidered a healthy food containing probiotics that promote healthydigestion and have benefits for immune system. So food manufacturersdeveloped flavored fruit yogurt, which is a combination of fruit and yogurtthat has a good taste and color. This innovation increased the demand ofyogurt, as it is now accepted due to its good taste and appealing color(Zink, 1997).
3.4. Wellness Foods/Foods for HealthPromotionDue to rapid scientific and technological developments, the increasing costof healthcare, changes in food laws, aging population, and increasedinstances of obesity, people are becoming more conscious about theirhealth. In the modern era, the relationship between diet, health, and diseasehas been clearly understood. Food and nutrition is now being implementedfor health purposes. That is a real, as well as novel methodology to attainoptimum health status by promoting a state of well-being and a reduction indisease risk. The food industry is developing nutritious food products withhealth benefits. For this purpose, the industry, instead of producing onlyraw materials, is adding value in food products through washing, drying,refrigeration, processing, packaging, labeling, storage, and by addingingredients to food that enhance the food’s quality and impart benefits (Siroet al., 2008).
3.4.1. Functional foodsFunctional foods offer additional health benefits beyond basic nutrition.These are different from medical foods and dietary supplements. Functionalfoods are one of the constantly growing segments of the food industry asthe demands of consumers have been increased. The food industry is nowdeveloping food products based on functional foods targeting various

population groups. Consumers assume that functional foods should havegood aroma, taste, texture, and visual qualities and these should be similarto traditional foods present in the market (Smith and Charter, 2001).
3.4.2. Microencapsulated food ingredientsFor satisfying sensory demands of the consumers and to ensure thatbioactive ingredients added in food products, such as vitamins, minerals,antioxidants, omega-3 fatty acids, plant extracts, prebiotics, probiotics, andfiber enrichments are delivered to the specific sites in the gastrointestinaltract and exert their desired health benefits, microencapsulation of thesebioactive materials has been applied to a number of food ingredients.Microencapsulated food ingredients are tempting for consumers as theyprovide promising health benefits and add some extra characteristics to thefood. The market for these microencapsulated food ingredients istremendously increasing (Smith and Charter, 2001).
3.4.3. Vitamins and mineralsMany food products available today are fortified with vitamins andminerals. Fortification is often applied to foods in which vitamins andminerals are degraded during cooking, processing, or due to theirsusceptibility to light and changes in pH and reactions with otheringredients present in the food. Vitamins and minerals are added to a varietyof food products to replace losses, to meet age-specific nutritional needs(e.g., for infants and the elderly), and to prevent disease in specificconsumers or at-risk groups (Smith and Charter, 2001).
3.4.4. Functional fatty acidsFunctional fatty acids are gaining importance due to their potential healthbenefits. Functional fatty acids, mainly docosahexaenoic acid,eicosapentaenoic acid, linolenic acid, and conjugated linoleic acid, aremostly employed in some food products. Omega-3 enriched eggs are nowavailable for consumers in the supermarkets. This is achieved bymanipulating the poultry feed. These value added eggs have the ability toreduce dangerous LDL cholesterol (Smith and Charter, 2001).

3.4.5. ProbioticsProbiotics are live microorganisms that have health benefits, such asmaintaining a healthy immune system, strengthening the mucosal barrier,and suppressing intestinal infections. Probiotics must remain alive duringprocessing, storage, and gastric transit to fulfill their desired function in thebody. Such health benefits have focused attention on adding probiotics to abroader range of food products, including traditional fermented dairyproducts, such as yogurt. Consumers have shown an increased interest infermented dairy products and other probiotic-added products (Smith andCharter, 2001).
3.4.6. PhytochemicalsPhytochemicals are biologically active compounds present in plants. Theseare also known as secondary metabolites of plants. Evidence suggests thatthese can reduce the risk of chronic diseases. Components that are claimedto be rich in phytochemicals are extracted from plant sources and, afterisolation, are added to food products through microencapsulationtechniques to mask undesirable color, odor, or texture. Importantphytochemicals with health benefits and are of consumers’ interest includephytosterols, tocopherols, carotenoids, coenzyme Q10, curcumin, garlicextracts, and polyphenols (e.g., resveratrol). Consumers are aware thatproducts containing such ingredients help in the prevention of chronicdiseases. Thus, the demand of such value-added products in the market isincreasing (Smith and Charter, 2001).
3.4.7. FiberThere is an increasing trend of adding dietary fiber to foods and beveragesthat originally do not contain fiber, with increasing awareness about healthbenefits of high-fiber diets. Examples of dietary fibers that are added tofood and beverages include β-glucan from oats and psyllium fiber. Glucanis a cholesterol-lowering soluble fiber and is known to reduce the risk ofheart diseases. Other dietary fibers that are added to food and beveragesinclude indigestible gums, polysaccharides, oligosaccharides, and lignins.Due to increased rate of heart diseases and obesity, consumers prefer fiber

rich food and beverages. Furthermore, such value added foods are safer andhealthier for the consumer (Smith and Charter, 2001).
3.4.8. Immune enhancing nutrientsImmune enhancing nutrients are substances that provide identifiablebeneficial effects to the immune system. Some immune enhancing nutrientsinclude glutamine, arginine, omega-3 fatty acids, nucleotides, andprobiotics. Consumers are attracted to such products for their desiredbenefits. With an increase in awareness, people are more conscious abouttheir health and are inclined towards foods that they assume are beneficialfor their health. Consumers want health and convenience together, which isonly possible by value addition in food products. Due to increasedconsumer demand for such products, the food industry is constantlyintroducing health-promoting food products. The market for such foodproducts is tremendously growing day by day to deliver the consumer safer,better, and healthier food products (Smith and Charter, 2001).
3.5. Age Specific FoodsThe food industry is keen to develop foods for specific age groups toprovide convenience to the consumer and increase the market. Infantformulas, various types of flavored baby food products, and modified foodproducts for the elderly are now present in the market.
3.5.1. Infant formulasInfant formulas are foods designed to feed babies and infants less than12 months of age. These are normally prepared for bottle-feeding and are ina powdered form that is mixed with water or another liquid and is usuallyconsidered a substitute for breast milk. The manufacturers of infantformulas claim that the composition of these formulas is almost same asthat of the mother’s milk. Commonly available infant formulas containpurified whey and casein from cow’s milk as a protein source, a blend ofvegetable oils as a source of fat, lactose as a source of carbohydrates, amixture of vitamins and minerals, and other materials depending upon themanufacturer. Although the best food for young ones is breast milk and it is

not favorable to replace it with any infant formula, a wide range of infantformulas with attractive packaging are available in the market, which drawsthe attention of consumers, increasing the market of infant formulas.
3.5.2. Cereals and other baby foodsWith growing age, nutrient requirements are increased and babies needcomplementary food along with breast milk. A variety of cereal-basedinfant and baby foods and other weaning foods available in the market areconsidered ideal complementary foods. Such foods available are thought tocontain the natural goodness of cereal grains, fruits, and vegetables and arenutritionally adequate. For example, Nestlé infant cereals are widelyavailable in the market in a variety of flavors with optimal nutritionalcomposition. Furthermore, most of these baby foods are fortified withprobiotics and numerous immune-nutrients, recognized to help strengthenbabies’ natural defenses. Other baby foods include high quality fruit andvegetables that use a patented steaming process to retain essential nutrientsand natural tastes. All baby foods are made with natural ingredients,without added sugar, salt, or additives. People nowadays usually prefer suchcomplementary food products for their babies because they are safe andconvenient to use.
3.5.3. Food for elderly peopleThe food industry is keen on developing specific food products for elderlygroups. As people age, many changes take place in the body, such asdecreased sensory perception (i.e., decrease in senses of smell, taste, touch,vision, and hearing). Additionally, elderly people also have impaired bodymovements. So, it is not pleasant for elderly people to consume foods thatcan normally be eaten by adults. Elderly people, especially those who havepartial or complete dentures, have reduced masticatory efficiency.Furthermore, as the person ages, caloric requirements also decrease. Thefood industry is developing food products for elderly people according totheir requirements, such as foods with low energy density and high nutrientdensity, soft in texture, low in spices, and enhanced flavors, and that areeasy to handle, canned, or packaged. With old age, conditions, such ashypertension, hypercholesterolemia, and hyperglycemia are common, so

when developing food products for elderly people, food manufacturers takethese conditions into account and develop foods that are low in fats,cholesterol, salt, and added sugars. Thus, targeted food products for elderlypeople are making their ground in the food market by taking the interests ofconsumers into consideration.
3.6. Specific Foods for Allergies andIntolerancesMany people enjoy a wide range of foods without any problem. For somepeople, however, specific foods or food components may cause adversereactions ranging from a minor rash to an aggressive allergic response.Adverse reactions to foods may be due to food allergy or food intolerance.A food allergy is a specific reaction to a food or food component thatactivates the immune system, while food intolerance involves the body’smetabolism but not the immune system. Lactose intolerance can be a goodexample, in which certain individuals lack the digestive enzyme, lactase,which breaks down milk sugars.
3.6.1. Lactose intoleranceLactose is milk sugar and some people have problems digesting this due tothe absence of the lactase enzyme, which is essential for its digestion.Undigested lactose is the main cause of discomforts in the small and largeintestines suffered by lactose intolerant people. Many products have beendeveloped for lactose intolerant people, such as lactase tablets, which aretaken with lactose containing meals; lactose-free milk products, which areproduced by breaking down lactose by lactase; and sour milk products, inwhich lactose is converted to lactic acid using microbes. The market forlactose-free products is on the rise and the demand for such products is highin both developed and developing countries. Food industries arecontinuously increasing the range of healthy and tasty lactose-free milkproducts, such as lactose-free puddings, ice creams, and creams.
3.6.2. Gluten intolerance

Gluten intolerance is a condition in which a person is unable to digestgluten proteins present in wheat, rye, and barley. An adverse reaction togluten occurs in the body causing many problems like gastrointestinaldiscomforts, such as bloating, and nongastrointestinal discomforts, such asheadache and fatigue. The most common form of gluten intolerance isceliac disease, which results in damage to the digestive system. Thisdamage is the result of an autoimmune reaction that harms the surface ofthe small intestine. As the rate of celiac disease diagnoses increases andconsumers are becoming more aware, the market of gluten-free products isgrowing. Currently, the global market of such food products is estimated tobe over US$ 1 billion per anum.
3.6.3. Food allergyFood allergy is an adverse or a hypersensitive response of the immunesystem towards food, especially against food proteins. The body’s immunesystem starts to produce antibodies against that food. During infancy,chances of food allergy are greater; it may affect 15%–20% of infantsbecause in infancy and childhood the immune system is weak, so the bodystarts giving adverse reactions against food. The most common foods thatcause 90% of allergic reactions are milk, egg, soya, wheat, peanut, tree nut,fish, and shellfish. There are three types of food allergy: IgE mediated, non-IgE mediated (such as cellular, delayed type hypersensitivity), and mixed(IgE/non-IgE) (Morita et al., 2013). Symptoms of food allergies can varyfrom mild to very severe reactions. The most severe allergic reaction isknown as “anaphylaxis,” which is life threatening. It is estimated that 150–200 people die every year due to severe allergic reactions. The mostcommon symptoms of allergies are vomiting, shortness of breath, wheezing,coughing, circulatory collapse, tongue swelling, weak pulse rate, pale skin,dizziness, and so on. Injection of epinephrine is the first and fastesttreatment for an anaphylactic reaction (The Food Allergy & AnaphylaxisNetwork, 2006). People with allergies should avoid food containing thatspecific allergen. Food manufacturers ensure that the presence of allergensmust be mentioned on the label if the allergen is present in any form in thefood product as main component, a flavoring ingredient, or food additive(FARE, 2015). With advancements in technology, food manufacturers are

making allergen-free products for the allergic consumer. Producers makesuch products by removing that specific protein. Hypoallergenic milkformulas are available in market. Manufacturers produce hypoallergenicproducts for allergic consumers to help maintain their health and make theirlives easy.
3.7. Food for Specific CulturesThe way we eat, the kind of food we buy, and how it is prepared is a part ofour identity—one of the directing forces that figures how we live. Foodunites us and also divides us. Food brings people together in communalgatherings but it also pits ideologies alongside each other. There may be asignificant cultural background to food consumption. Along with culturalfactors, religion also has an impact on food preferences since somereligions do not allow the consumption of certain foods, for example,vegetarians versus carnivores, lacto-ovo vegetarian versus vegetarian, andhalal versus haram. On one hand, technological innovation has given rise toall manner of food products of exceptional quality and safety. On the otherhand, the complexity of the food chain leading to human consumption hasincreased.
3.7.1. Food and cultureCulture can be considered the single biggest determining factor of aperson’s food choices. It is considered that if one wants to predict anyinformation about a person’s background, the person’s eating habits andchoice of food can be an important determinant of his or her culture. Mostof the people in the world eat according to their tradition rather than choice.Many people believe in the moral aspect of food that “you are what youeat.” Basic preparation techniques and flavors are different in different partsof the world. We can consider some examples like Asian people preferseasoned and spiced foods, while Western people prefers foods that are lessspicy; consumption of dairy products is uncommon in China, while theyconstitute a major part of food intake in the Western world; manyAmericans are fond of fermented grapes (wine) and milk (cheese andyogurt), but do not like decayed meat, while in some parts of world decayed

meat is preferred. Keeping in mind such cultural preferences, foodmanufacturers are finding ways to make cultural foods more appealing inflavor, texture, and cost. Foods of various cultures have been developed bythe food industry in such a manner that they have increased shelf life andcan be shipped to any part of the world, making consumption easy for theconsumer.
3.7.2. Food and religionReligion has a great impact on a person’s food choices. Around the world,people choose to eat or avoid certain foods depending on their religiousbeliefs. Some beliefs have been followed for centuries and are a well-known part of life. Some of the religions that require particular food rulesinclude: Islam, Hinduism, Judaism, Sikhism, and Buddhism. Muslimsfollow guidelines from their holy book, the Quran, which specifies thefoods, which can be eaten (halal) and those that are forbidden (haram).Beef, lamb, and chicken can only be eaten if slaughtered in a method that isconsidered halal. The preparation of halal food requires that the animalmust be killed by slitting its throat. The animal will then have all the blooddrained from its body. Muslims will only eat meat slaughtered by Muslims,Christians, or Jews. Haram foods include pork, blood, alcohol, and meatsacrificed to idols. Previously, Muslim countries grew most of their foodlocally or purchased them from other Muslim countries. However, theincrease in population outpaced the food supply and Muslim traders wereforced to import foods from agriculturally leading countries. Now, a largenumber of halal food products can be found in the market. The halalmarketplace is evolving as one of the most worthwhile and prominentmarket arenas in the world today, having a global consumer base of about1.9 billion people across 112 countries; the halal market is estimated to beworth trillions of US dollars.
Strict Hindus are purely vegetarian. Some Hindus, however, eat chicken,lamb, and fish. They consider the cow to be a symbol of abundance; hencethey do not eat beef. Hindus may also avoid certain foods, such as domesticfowl, pork, milk, ghee, onions, garlic, eggs, and coconut. Food productsprepared for Hindus, such as bread, biscuits, cheese, and jam, are checkedto ensure that forbidden ingredients are not present. Vegetarian foods can be

largely found in the market nowadays. The Torah defines foods that areallowed for Jews and foods that are not allowed. Permitted foods are calledkosher and forbidden foods are called trefa. Animals that do not have acompletely split hoof and chew cud, such as cows, goats, and sheep arekosher. Horses and pigs are not kosher animals. Kosher fish have fins andscales, therefore shellfish and eels are excluded. All plant foods are kosher,if not damaged by rot or insects. Kosher meat is prepared using single knifethat cuts open the throat to kill the animal and drains it entirely of blood.The meat is soaked in water and salted to remove the last traces of blood.They do not eat meat and dairy foods together. The kosher food industryhas become a big business, certifying nearly 1,000,000 products in over8,000 plants in more than 80 countries. Sikhs avoid eating halal or koshermeat. They also avoid food and drinks that may harm their body, such asalcohol. Wide ranges of products are being introduced for Sikhs in themarket. Animal flesh is totally prohibited in Buddhism, as they believe thatthey should not be responsible for the death of any other living organism.They follow strict vegetarian diet. They also avoid the consumption ofalcohol. Vegetarian food products with improved shelf life are present inmarket.
4. ConclusionsChanges in the food industry in the past few decades have altered the wayfood is grown, processed, handled, stored, distributed, and consumed. Newand advanced food products are being developed by the food industry withlonger shelf life and special characteristics in terms of nutritional value,palatability, and suitability. The products developed by the food industryhave added value, benefiting the consumer and also increasing the revenueof the food industry. The rapidly growing global population, changinglifestyles, changing consumers’ demands, economic development, andincreased consumer awareness have led the food industry to develop foodproducts with different attributes and qualities. So we can say that with thechanges that have occurred in past half-century, the food industry has had todevelop new products for its consumers with added value, which has led tomore and more food consumption as compared to consumption decadesago.

ReferencesAmine E, Baba N, Belhadj M, Deurenbery-Yap M, Djazayery A, Forrester T, Galuska D, Herman S,
James W, Mbuyamba J. Diet, Nutrition and the Prevention of Chronic Diseases: Report of a JointWHO/FAO Expert Consultation. Geneva, Switzerland: World Health Organization; 2002.
Beckley JH, Foley MM, Topp EJ, Huang JC, Prinyawiwatkul W. Accelerating New Food ProductDesign and Development. Chichester, West Sussex, UK: Wiley-Blackwell, A John Wiley & Sons,Ltd.; 2008.
Boland M. Why Value Added Agriculture is Important. Ames, IA: Agriculture Resource MarketingCenter, Iowa State University; 2009.
Browning TR, Deyst JJ, Eppinger SD, Whitney DE. Adding value in product development bycreating information and reducing risk. IEEE Trans. Eng. Manage.. 2002;49:443–458.
Carlsson-Kanyama A, González AD. Potential contributions of food consumption patterns to climatechange. Am. J. Clin. Nutr.. 2009;89:1704–1709.
Coltrain D. Value Added: Opportunities and Strategies. Manhattan, KS: Kansas State University;2000.
Costa AI, Jongen W. New insights into consumer-led food product development. Trends Food Sci.Technol.. 2006;17:457–465.
Fleming, K., 2005. Value-added strategies: taking agricultural products to the next level.AgriBusiness (AB-16). Avaiable from: www.ctahr.hawaii.edu/oc/freepubs/pdf/AB-16.pdf.
Food Allergy Research & Education (FARE), 2015. Your Food Allergy Field Guide. Available from:http://www.foodallergy.org/file/field-guide.pdf.
Giacalone D, Wendin K, Kremer S, Frøst MB, Bredie WL, OlssoN V, Otto MH, Skjoldborg S,Lindberg U, Risvik E. Health and quality of life in an aging population—food and beyond. FoodQual. Prefer.. 2016;47:166–170.
Godfray HCJ, Beddington JR, Crute IR, Haddad L, Lawrence D, Muir JF, Pretty J, Robinson S,Thomas SM, Toulmin C. Food security: the challenge of feeding 9 billion people. Science.2010;327:812–818.
Hanselka D, Anderson DP. Adding Value to Agricultural Products. College Station, TX: Texas A&MUniversity; 2009.
Kearney J. Food consumption trends and drivers. Philos. Trans. R. Soc. Lond. B. 2010;365:2793–2807.
Koopman, R., Wang, Z., 2012. The Value-added Structure of Gross Exports: Measuring RevealedComparative Advantage by Domestic Content in Exports. AEA Annual Meeting, Chicago, IL.
Lai AW. Consumer values, product benefits and customer value: a consumption behavior approach.Adv. Consum. Res.. 1995;21:381–388.
Lambert DK, Lim SH, Tweeten K, Leistritz FL, Wilson WW, Mckee GJ, Nganje WE, Devuyst CS,Saxowsky DM. Agricultural Value Added: Prospects for North Dakota. Fargo, ND: Departmentof Agribusiness and Applied Economics, North Dakota State University; 2006.
Martínez Michel L, Anders S, Wismer WV. Consumer preferences and willingness to pay for value-added chicken product attributes. J. Food Sci.. 2011;76(8):69–77.
Lu R, Dudensing R. What do we mean by value-added agriculture? Choices. 2015;30(4):1–8:http://www.choicesmagazine.org/choices-magazine/submitted-articles/what-do-we-mean-by-value-added-agriculture.

Lunghabo, J.W., 2014. Compelling reasons to add value to your produce. Available fromhttp://www.monitor.co.ug/Magazines/Farming/Compelling-reasons-to-add-value-to-your-produce/-/689860/2342924/-/s0qrbh/-/index.html.
Macfie H. Consumer-Led Food Product Development. Boca Raton, FL: CRC Press; 2007.Maverick, J.B., 2015. What are some examples of companies that are value-added resellers?
Available from: http://www.investopedia.com/ask/answers/020615/what-are-some-examples-companies-are-valueadded-resellers.asp.
Morita H, Nomura I, Matsuda A, Saito H, Matsumoto K. Gastrointestinal food allergy in infants.Allergology Int. 2013;62:297–307.
Morrison R. The benefits of value-added services. J. Global Accounting Alliance. 2013; Avaiablefrom: http://www.gaaaccounting.com/the-benefits-of-value-added-services/.
Moskowitz HR, Saguy IS, Straus T. An Integrated Approach to New Food Product Development.Boca Raton, FL: CRC Press; 2009.
Ross AB, Johansson Å, Vavruch-Nilsson V, Hassler S, Sjölander P, Edin-Liljegren A, Gyllensten U.Adherence to a traditional lifestyle affects food and nutrient intake among modern Swedish Sami.Int. J. Circumpolar Health. 2009;68(4):372–385.
Salin V, Atkins JA, Salame O. Value added in food manufacturing and retailing: a ratio analysis ofmajor US states. J. Food Dis. Res.. 2002;33:136–150.
Siro I, Kapolna E, Kapolna B, Lugasi A. Functional food. Product development, marketing andconsumer acceptance—a review. Appetite. 2008;51:456–467.
Smith J, Charter E. Functional Food Product Development. Chichester, West Sussex, UK: Wiley-Blackwell, A John Wiley & Sons, Ltd.; 2001.
The Food Allergy & Anaphylaxis Network. 2006. Food Allergy Training Guide for Hospital andFood Service Staff. Available from: http://www.foodallergy.org/file/hospital-food-training-faan.pdf.
United Nations, 2015. Department of Economic and Social Affairs, Population Division. WorldPopulation Prospects: The 2015 Revision, Key Findings and Advance Tables. pp. 1–59.
Winger R, Wall G. Food Product Innovation: A Background Paper. Rome, Italy: Food andAgriculture Organization of the United Nations; 2006: pp.1–26.
Zink DL. The impact of consumer demands and trends on food processing. Emerg. Infect. Dis..1997;3(4):467–469.

Index
A
AACC, See American Association of Cereal Chemists (AACC)
ACE, See Angiotensin-converting enzyme (ACE)
Acid detergent fiber (ADF), 220
method, 229
Acid hydrolysis, 302
Acidification technique, 44
Added-value functional food ingredients, 243
ADF, See Acid detergent fiber (ADF)
Adiabatic heating rate, 151
Aerobic bacteria, 192
Aggressive hydrolysis media, 300
Aglianico Vitis vinifera cultivar, 366
Aglianico wine, 366
Aglycones, 231
Agricultural Marketing Resource Center (AMRC), 461
Agriculture, 16
products, 56
Agroindustrial coproducts

dietary fiber from, 219–220, 230
classification and composition, 221–222
cellulose, 221
gums, 222
hemicellulose, 221
lignin, 222
mucilage, 222
pectic substances, 222
fiber effect in foods, 225–229
cereal products, 228–229
dairy products, 226–228
meat products, 225–226
fiber effect in vivo, 229
physiological effects from, 222–225
bulking ability, 224
fermentation on intestine (increase colonic fermentation), 224–225
lowering cholesterol levels, 223–224
postprandial plasma glucose and glycemic attenuation, 224
reduce blood pressure, 224
short history methods of analysis, 229–230
future perspectives for, 243
phenolic compounds in, 230–240
classification and composition, 230–234
anthocyanidins, 232
flavanols, 232

flavanones, 231
flavones, 231
flavonoids, 231
flavonols, 231
hydroxybenzoic acids, 233
isoflavones, 232
lignans, 233–234
phenolic acids, 232–233
phenolic alcohols, 233
stilbenes, 233
effects in vivo, 239
methods of analysis of, 239–240
polyphenolic amides, 234–239
antioxidant activity and protection against oxidative stress, 234–235
cancer protective effects, 236
cardiovascular protective effects, 235
cereal products, 238–239
dairy products, 237–238
diabetes risk, hypoglycemic effects on, 235
meat products, 236–237
neurodegenerative protective effects, 235
physiological effects of, 229
prebiotics, 240–243
activity in vitro, 242–243
fructooligossacharides (FOS), 241

inulin, 241
galactooligosaccharides (GOS), 241–242
lactulose, 242
as sources of novel functional ingredients, 219–243
Airborne pathogens, 200
Alcohol
activates olfactory, 374
beverages, 353
content reduction, beverage classification, 352
fermentation, 362
intake, 354
policies, 347
reduction, 351, 359, 361
removal, from wine, 351
by volume (ABV), 353
Alcohol consumption, 347, 348
beverages, dealcoholization of, 350
consumer preferences/trends, 349
dealcoholized wine, requirements of, 351, 352, 354–355
definitions/legislation
beer, 353–354
wine, 350
factors affecting, 348
overview of, 347
postfermentation techniques, 370

membrane processes, 361
dialysis, 372
distillation, 373
osmotic distillation, 374
pervaporation, 373
reverse osmosis, 373
thin layer evaporation, 370
vacuum distillation, 370
regulating, 351
sensory properties/low-alcohol beverage improvements, 374–377
social/economic impact, 355
Aleurone-rich cereal products, 239
Alkaloids, 6
Alternative agriculture systems, 23
Alternative pasteurization methods
FDA standard for, 194
American Association of Cereal Chemists (AACC), 219
Amino acids, 298
analysis, 305, 306
of food proteins, 299–307
presentation of the results, 305–307
protein hydrolysis, 301–303
qualitative and quantitative determination, 303–305
total protein, determination of, 300–301
sample preparation for, 299

carriers of foods nutritional and biological value, 287–308
chemical properties of, 293
chemistry and classification, 290–294
classification, 292
composition, 300
of egg protein, 307
determination of, 299
formation and degradation of, 258
general chemical formula of, 291
general information, 288–290
historical remarks, 288–290
historical development of, 287
implementation of, 287
isolation and identification, 288
pool, 292
properties of, 293
and proteins biological value, 294–299
reactions of, 293
residues, 306
role of, 290
score, 295, 296
AMRC, See Agricultural Marketing Resource Center (AMRC)
Amylase inhibitors, 2
α-Amylases, 2–3
Analytical quality control analyses (AQA)

parts, 305
Analytical recovery, 305
ANFs, See Antinutritional factors (ANFs)
Angiotensin-converting enzyme (ACE), 269
inhibitory activity, 256
inhibitory peptides, 258, 259
1-Anilino-8-naphthalene sulfonate (ANS), 319
ANS, See 1-Anilino-8-naphthalene sulfonate (ANS)
ANSYS software package, 114
Anthocyanidin, 231
Anthocyanins, 231, 359
Antibodies
IgG, 3
IgM, 3
Antimicrobial packaging, 192
Antinutritional factors (ANFs), 2, 6
processing techniques for reduction, 7
Antioxidants
capacity assays
chemical principles of, 239
types, 239
types of, 219
Apparent-specific-heat method, 406
Arabinoxylans, 221
Area force, stress generated by, 101–105

stress distribution formulation
at normal area force, 102–103
at tangential area force, 103–105
Asian foods, 458
Asparagic acid, 288
ATI force/torque sensor, 114
Atmosphere packaging, 199
Automated cutting strategies
design of, 94
B
Bacteria
cells, encapsulation of, 80
membranes, electroporation of, 191
spores, 188
inactivation of, 204
Bakery products, 40, 445
Barley, 443
Bayes-Gibbs probabilistic analysis, 320
BCAA, See Branched-chain amino acids (BCAA)
Beer
alcohol content range and exceptions, 354
alcohol reduction techniques, 367
fermentation applications, 367
arresting fermentation, 368

changes of mashing process, 369
use of yeasts, 368–369
dealcoholization, 373
flavor, 370
low-alcohol content, 353
postfermentation techniques, 371
Beverage processing, 53
BFC, See Breakfast cereal (BFC)
Bifidobacteria, 240
Bifidus factor, 242
Biharmonic equations, 94
Bioactive
compounds, 67, 69
food components, feature of, 76
fragments, obtained by hydrolysis of different whey proteins, 264
nutrients, 62
Bioactive peptides
contribution of whey to quality of food products, 251–277
by digestive enzyme hydrolysis, 257
in food industry, 267–276
production during food processing, 268–270
whey protein and peptides
addition in food (enrichment of food with whey proteins andpeptides), 270–272
whey proteins and peptides
as carrier for immobilization, 273–276

formation of, 268
fragments, 257
functional properties, 263–267
emulsification, 267
flavor, 267
foam formation and stability, 266
gel formation, 266
solubility, 263
water/fat-holding capacities, 266
hydrolysis by enzymes derived from microorganisms/plants, 258
production from whey, 257–263
bioactivity of whey protein fragments, 263
enzymatic hydrolysis, 259–261
ultrafiltration method for, 261–263
whey proteins hydrolysis during fermentation process with proteolyticstarter culture to, 258–259
separation of, 261
in vitro digestibility of, 260
from whey, function of, 254
whey protein and peptide, bioactivity of, 252–257
bovine serum albumin (BSA), 255
caseinomacropeptide, 256
glukosomacropeptide (GMP), 256
immunoglobulins, 255–256
α-lactalbumin, 255
lactoferrin, 256–257

β-lactoglobulin, 253–254
lactoperoxidase, 257
proteoso-peptone (PP) fraction, 256
Bioactive proteins, See Bioactive peptides
Bioactivity
of whey protein fragments, 254
Biological tests, 295
Biological value, 129
Biomaterial cutting modeling, 94, 96–106
principles of, 125
relative blade sharpness factor, definition of, 106
stress generated by area force, 101–105
stress generated by line force, 98–101
stress generated by point force, 97–98
Bioreactors, 79
Blackcurrant polyphenol extract (BPE), 237
Blanching, 35, 41–42
Block cryoconcentration technique, 75
Boonton RX-meter, 391
Bovine milk, 252
Bovine serum albumin (BSA), 255
BPE, See Blackcurrant polyphenol extract (BPE)
Branched-chain amino acids (BCAA), 301
content, 251
Breads, physicochemical properties of, 238

Breakfast cereal (BFC), 445
manufacturers, 34
BSA, See Bovine serum albumin (BSA)
C
Cabernet Sauvignon, 360
grapes, 359
Canada’s Department of Foreign Affairs, Trade and Development(DFATD), 441
Cancer, 236
cell signaling, modulation of, 236
Canning, 42
Carbohydrate
based food ingredients, 241
fractions, 11
matrices, 82
membrane receptors, 3
Carboxylic groups, 290
Cardiovascular disease (CVD), 234
Cardiovascular morbidity, risk factor for, 224
Carica papaya, commercial papain from, 314
κ-Carrageenan
complex, 274
Caseinomacropeptide, 256
Cell encapsulation method, 79
Cell envelope proteinase (CEP), production of, 269

Cell membrane, 83
Cellulose, 221
microfibrils, 222
Centrifugal force, 316, 317
Centritherm system, 370
CEP, See Cell envelope proteinase (CEP)
Cereal-based processed products, 31
Cereal grain
coordinated health benefits, 425
dynamic features, 424
Cheese, 270
dinner, 456
Chelation, of transition metals, 234
Chelators, 232
Chemical
degradation, 76
fertilizers and pesticides
use of, 12
pesticides, 13
score, 295
Chemometrical analysis, 320
Chicken
butterfly, harvesting of, 94
deboning, cutting device design for, 120–125
chicken front halves, anatomy structure of, 120–122

cutting area and cutting trajectory, 123–125
processing, 93
Childhood obesity, 30
Chlorine, based disinfectants, 182, 206
Chlorogenic acid, 233
Chlortetracycline, 38
Citrus fibers, 242
Coalescence, 336
Code of Federal Regulations, 45
Codex Committee, 297
Coefficients for conversion, 301
Cold-pressured juices, 207
market, 184, 186
Colonic disorders, 224
Colonic epithelial cells, 224
Commercial disinfection processes, 182
Commercial food preservation, 38
Commercialization, 135
Commercial proteolytic enzyme, 314
Commercial starter cultures, 269
Comparative tests, 141
Condensed tannins, 4
Consumers, 129
buy products, 463
demands, 460, 466, 469

driven market, 206
focused production technology, 129
prefer, 464
preferences, 462
related attributes, 142
Contaminant smoking process, 82
Contemporary precise indicators
development of, 287
Controlled enzymatic hydrolysis, 259
Coronary heart disease, risk of, 132
Cryoconcentrate samples, physicochemical characteristics of, 76
Cryoconcentration, See Freeze concentration process
Crystal growth (G)
rate of, 72
Crystallization process
of water, 71
Customer
satisfaction, 144
value, 463
Cutting
angle, 105
device design, for chicken deboning, 120–125
forces, 96, 106, 123
intensity, 97
fractures, 105

postfracture, 105
prefracture, 105
Cutting automation
biomaterial cutting modeling, 96–106
relative blade sharpness factor, definition of, 106
stress generated by area force, 101–105
stress generated by line force, 98–101
stress generated by point force, 97–98
cutting device design for chicken deboning, 120–125
experimental results and discussion, 114–120
discussion about influence of slicing angle on cutting force, 119–120
equivalent fracture force, 114–118
relative blade sharpness factor, 118–119
finite element modeling, results from, 113–114
in food processing, 93–126
simulation with changing parameters, 107–113
fracture force via blade shape, 112–113
relationship between fracture force and slicing angle, 109–112
stress distribution results, 107–109
CVD, See Cardiovascular disease (CVD)
Cyanogenic glycosides, 3
Cysteine, 292
D
Dairy products, 226

fortification of, 226
thermal processing of, 293
DDT residues, 15
Dealcoholization process, 355
Dealcoholized beverages
definitions of, 352
Dealcoholized wine, 352
requirements of, 351, 352, 354–355
Decontamination
methods, 201
processes, 20
Deformation-relaxation phenomenon (DRP), 84
Defrosting, 384
Degree of hydrolysis (DH), 259
Degree of polymerization, 232
Degree of processing, 54
Dehydration, 43–44
Desirability, 320
definitions of, 320
designs, 343
functions, 338
technique, 337
DFATD, See Canada’s Department of Foreign Affairs, Trade andDevelopment (DFATD)
DFs, See Dietary fibers (DFs), See α,α-Diphenyl-β-picrylhydrazyl (DPPH)
DH, See Degree of hydrolysis (DH)

DHP, See Dynamic high pressure (DHP) technique
Dielectric defrosting, frozen foods
and defrosting, 384
overview of, 383
Dielectric heating mechanism, 385, 387
equipment, 390
MW heating system, 391
RF heating system, 390
principles of, 385
schematic diagram, 386
Dielectric material, with power dissipation capability, 407
Dielectric properties (DPs)
beef, 403
defrosting of food models, 404
dependence of, 395
freezing temperature, 404
frozen food, 384, 393
models, 405
in RF range, 399
MW range, 401
potato puree, 396
schematic diagram, 386
stem lettuce, 404
temperature-dependent, 406
of tuna, 403

tylose, 396
pastes with added salt, 397
Dietary antioxidants, 234
Dietary cellulose, 221
Dietary fibers (DFs), 219–230
cholesterol-reducing property of, 226
classification and composition, 221–222
cellulose, 221
gums, 222
hemicellulose, 221
lignin, 222
mucilage, 222
pectic substances, 222
effect in foods, 225–229
cereal products, 228–229
dairy products, 226–228
meat products, 225–226
effect in vivo, 229
fermentation of, 224
physiological effects from, 222–225
bulking ability, 224
fermentation on intestine (increase colonic fermentation), 224–225
lowering cholesterol levels, 223–224
postprandial plasma glucose and glycemic attenuation, 224
reduce blood pressure, 224

physiological effects of, 223
polysaccharides type, 221
nonstructural polysaccharides, 221
structural nonpolysaccharides, 221
structural polysaccharides, 221
short history methods of analysis, 229–230
types of, 219
Dietary fluctuation, 466
Dimethyl dicarbonate antimicrobial agent, 196
α,α-Diphenyl-β-picrylhydrazyl (DPPH)
inhibition of, 274
DNA damage, 239
DOE, See Doehlert statistical design (DOE)
Doehlert statistical design (DOE), 314, 315
experimental design, 336
Domestic processing, 23
Dripping method
principal advantage of, 82
Drosophila melanogaster model
of postdoctoral studies, 235
DRP, See Deformation-relaxation phenomenon (DRP)
Dryers, types of, 44
Dynamic high pressure (DHP), 149–151
apparatus, operating diagram, 153
changes in milk fat by, 155

effect on milk constituents, 153
enzymes changes by, 159
industrial applications, 160
effect on cheese manufacture, 165
DHP-processed milk for, 165
effect on milk for direct consumption, 162
ice cream and butter, 168
effect on ice-cream manufacture, 169
milk, 160
yogurt, 166
effect on manufacture, 168
rheological behavior of set yogurt, 167
main changes in milk constituents by, 154
minerals changes by, 159
operation, 151
principle, 151
prospects and acceptance of processed products through, 169
protein changes in milk proteins by, 157
casein, 157
whey proteins, 158
E
Effective emerging technique, 84
Egoma (Perilla flutescens var. flutescens), 442
Eigen-value problem, 105

Electrical conductivity, 86
Electric energy, transformation of, 85
Electric field, application of, 86
Electrode production technology, 86
Electromagnetic (EM)
characterizing, 409
field distribution, 407
spectrum, 385
Electronic instrument perception
consumers vis-à-vis tracked fish measured via, 129–145
fish
consumption, health benefits, 131–133
consumption regarding tracked fish, assessment of, 139–145
production chain quality, 133–136
and traceability systems in, 136–138
traceability, concept/definition, 136
Electronic product code information services (EPCIS) technology, 138
Electropermeabilization, 86
Electroporation, 86
Electrospray technique, 318
Elimination of water, 43
Emerging novel processes, 51–52
high-pressure processing, 51–52
microwave heating, 51
ohmic heating, 51

pulsed electric fields, 52
Empirical-statistical linear models, 320
Emulsification, 80, 267
Emulsifying activity index, 317–318
Emulsifying stability index (ESI), 317–318
statistical analysis of, 329
Emulsions
in food industry, 267
Encapsulated bacteria, 79
Encapsulated peptides, 267
Encapsulation technique, 76–83, 243
benefits of, 77
carrier material of, 77
characteristics, 77
effectiveness of, 80
efficient system for, 77
of flavors, 82–83
matrix type of, 76
poly/multiple-core, 76
of probiotics, 77–82
types of, 76
Endothelial nitric oxide synthase (eNOS)
competitive inhibitors of, 235
Energy
barrier, existence of, 71

method, 94
eNOS, See Endothelial nitric oxide synthase (eNOS)
Enrichment, 35
Environmental life style hazardous issues, 30
Enzyme
activity, 5
browning, 199
hydrolysis, 241, 259–261
inhibitors, 2–3
α-amylases, 2–3
protease inhibitors, 3
trypsin inhibitors, 3
Enzyme:substrate ratio, 314, 315
EPCIS, See Electronic product code information services (EPCIS)technology
Epigallocatechin gallate (EGCG), 235
ESI, See Emulsifying stability index (ESI)
Essential amino acids, 12, 288
Estrogen receptors, 232
European Food Safety Authority, 77, 179
European regulations, 299
Evaporation, 71
Exotic western markets, 424
Experimental constants, 72
Extrusion
procedure, schematic presentation of, 273

technology, 48–49
F
FAO, See Food and Agriculture Organization (FAO)
Fat-holding capacities (FHC), 266
FC, See Foaming capacity (FC)
FCR, See Folin-Ciocalteu reagent (FCR)
FDA, See Food and Drug Administration (FDA)
FEM method, 96
Fermentable hemicellulose fibers, 224
Fermentation, 44–45, 259, 268
Fermented legumes, 10
Fermented milk products, 258
FHC, See Fat-holding capacities (FHC)
Finite element modeling, 96, 113
results from, 113–114
First limiting amino acid, 295
Fish
consumption, 132, 141
assessment questionnaire, constructs and indicators used in, 139
benefits of, 130
characteristics of, 139
frequency of, 139
per campus, 140
habit of, 142

health benefits, 131–133
production chain quality, 133–136
and traceability systems in, 136–138
regarding tracked fish, assessment of, 139–145
traceability systems, perception and vision on, 131
processing, stage of, 135
processors, 135
production, 137
Flavanols, 232
Flavanones, 231
Flavones, 231
Flavonoids, 231, 235
Flavonols, 231
Flavors, 267
and fragrances
encapsulation of, 82
role in consumer satisfaction, 82
Fluorescence spectrophotometer, 319
Foam formation and stability, 266
Foaming capacity (FC), 319–320
Foam stability (FS), 319–320
Folic acid (vitamin B9)
in maltodextrin-whey protein, 275
Folin-Ciocalteu reagent (FCR), 240
Food

additives, 49–50
chemistry, 455
commodities, contamination of, 22
contamination, 15
coproducts, 219
cutting, 95
expenditure in total expenditure, 53
extruder, 49
grade acidulates, 45
industry
transforms raw materials, 464
ingredients
classification of, 240
intoxication, 180
symptoms of, 180
legumes, 1–2
manufacturing, 456
systems, 40
technologies, 34
matrix, 85
nutritional and biological value
carriers of, 287–308
packaging, 50
preservation, 383
preservation processes, 39, 83, 84

chronological development of, 36
historical development of, 36–38
industrial, need for and benefits of, 38–39
principles of, 39–40
production, 455
products, protein composition in, 301
safety
and quality issues, 12
regulations, 138
scarcity, 31
supplies, categories, 32
technology, 85
traceability, 144
vending sector, 59
waste management, 52–53
Food and Agriculture Organization (FAO), 15, 219
document, 295
reports, 287
Food and Drug Administration (FDA), 15, 222
Foodborne diseases, 181
Foodborne pathogens, 12
Food consumption, 31–33
age specific foods, 473
cereals/baby foods, 474
for elderly people, 474

infant formulas, 473
allergies/intolerances, 474
food allergy, 475
gluten intolerance, 475
lactose intolerance, 475
Consumer’s demands, 469
flavor and taste, 470
fresh food products, 469
health benefits, 470
healthy foods, 470
for cultures, 476
factors, 467
food supply category, 32
in India, statistics of, 54–62
consumption of processed food, 54–60
cost and quality of distribution, 57–59
existence of mediator, 57
expenditure on packing, 57
lack of measuring unit, 57
low earnings, 55
raw material sources and price, 56
sociocultural factors, 55
tax configuration, 60
demand drivers, 60–62
level of food processing, 54

processed food vs. obesity, 62
modern lifestyle, 468
aged population, 469
eating habits, changes, 468
lifestyle changes, 468
population growth, 467
religion, 476
selected food storage terms, 32–33
value addition, 466
wellness foods/foods, 471
fiber, 473
functional fatty acids, 472
functional foods, 471
immune enhancing nutrients, 473
microencapsulated food ingredients, 471
minerals, 472
phytochemicals, 472
probiotics, 472
vitamins, 472
Food industry, 67
bioactive peptides in, 267–276
production during food processing, 268–270
whey protein and peptides
addition in food (enrichment of food with whey proteins andpeptides), 270–272
whey proteins and peptides

as carrier for immobilization, 273–276
Food processing technologies, 29, 63, 93, 126, 208, 300
aim of, 33
antinutrients in legumes and removal, 2–6
alkaloids, 6
cyanogenic glycosides, 3
enzyme inhibitors, 2–3
lectins, 3–4
oxalates, 4–5
phytates, 5
saponins, 5–6
tannins, 4
application of, 40–52
acidification, 44
blanching, 41–42
canning, 42
dehydration, 43–44
emerging novel processes, 51–52
high-pressure processing, 51–52
microwave heating, 51
ohmic heating, 51
pulsed electric fields, 52
extrusion technology, 48–49
fermentation, 44–45
food additives, 49–50

heat, application of, 41
irradiation, 47–48
mechanical operations, 40–41
packaging, 50–51
pasteurization, 42
preservation by CA/MA, 49
refrigeration and freezing, 42–43
smoking, 46–47
water activity (aW), 45–46
companies, 206
enterprises, 136
food consumption, 31–33
food legumes, 1–2
food preservation
historical development of, 36–38
industrial, need for and benefits of, 38–39
principles of, 39–40
food processing, principle of, 33–36
food safety and quality issues, 12
food waste management, 52–53
for increasing consumption, 1–23
paradigm shift, significance of, 12–13
pesticides, 13–22
principle of, 33–36
availability of raw material, 35

convenience, 34–35
enrichment and fortification to maintain nutritional levels, 35
food safety, 34
quality attributes, 35
sustainability, 36
variety, 34
sectors, 31
statistics of food consumption in India, 54–62
consumption of processed food, 54–60
cost and quality of distribution, 57–59
existence of mediator, 57
expenditure on packing, 57
lack of measuring unit, 57
low earnings, 55
raw material sources and price, 56
sociocultural factors, 55
tax configuration, 60
demand drivers, 60–62
level of food processing, 54
processed food vs. obesity, 62
techniques to reduce antinutritional factors, 6–12
heat processes, 10–11
nonheat processing, 10
radiation-based technology, 11–12
Food product development, 455, 457

agriculture and industry, 455
benefits, 462
to consumer, 463–464
government/trade, 465–466
to industry, 464
to producer, 462
categories of, 459
creative products, 460
innovative products, 460
line extensions, 459
me-too products, 459
new form of products, 459
packaging, of existing products, 459
reformulation, of existing products, 459
repositioned existing products, 459
history, 456
process of, 458
value addition
Agricultural Marketing Resource Center (AMRC), 461
overview of, 460
USDA, defined, 461
Food proteins, 313
analysis of, 299–307
presentation of the results, 305–307
protein hydrolysis, 301–303

qualitative and quantitative determination, 303–305
total protein, determination of, 300–301
assessment of, 295
building unit of, 307
capacity of, 294
functional properties of, 313–343
limited/controlled enzymatic hydrolysis of, 313
materials and methods, 314–320
chemometrical analysis, 320
desirability, 320
emulsifying activity index, 317–318
emulsifying stability index, 317–318
foaming capacity (FC), 319–320
foam stability (FS), 319–320
free amine nitrogen, 316
FTIR spectroscopy, 318
held water, 317
HPLC-MS analysis, 318–319
sample preparation, 314
SDS-polyacrylamide gel electrophoresis (SDS-PAGE), 316
solubility, 316
statistical design of experiments, 315–316
surface hydrophobicity (So), 319
total soluble nitrogen, 316
viscosity, 318

water-holding capacity (WHC), See Water-holding capacity (WHC)
protein hydrolysis effect of goat cheese
desirability, 337–342
on emulsifying activity index, 325–327
on emulsifying stability index, 329
on foaming capacity, 333–336
on foam stability, 336–337
on free amine nitrogen content, 320–322
on held water, 325
on protein solubility index, 324
on surface hydrophobicity, 333–336
on total soluble nitrogen content, 322–324
on viscosity, 329–333
on water-holding capacity, 324–325
quality, 288
quality of, 288, 294
Food Safety System Certification 22000 (FSSC), 137
Food technology approaches
encapsulation, 76–83
of flavors, 82–83
of probiotics, 77–82
freeze concentration for bioactive compounds and flavor preservation,70–76
applications in, 74–76
fundamentals of, 70–74
for organoleptic properties improvement, 67–88

osmotic dehydration (OD), 83–88
ohmic heating (OH), 85–88
pulsed vacuum, 84–85
Force
distribution, 101
torque sensor, 123
Fortification, 35
Fourier-transform infrared spectroscopy (FTIR), 318
Fracture
force, 114–118
toughness concept, 95
Free amine nitrogen (NA), 316
response surface graphic of, 321
statistical analysis of, 320
Free amino acids
role of, 292
Free radicals, 234
scavengers, 232
Freeze concentration process
for bioactive compounds and flavor preservation, 70–76
applications in, 74–76
fundamentals of, 70–74
elemental system, stages of, 72
freezing (crystallization), 72
separation, 72

practical examples of, 74
principle of, 70
priority of, 71
process, 72
Freezing, 42–43
desalination by, 74
initial process of, 71
temperature, 43
Fresh fruit and juices
consumption trends, 179–180
fresh fruit intake
health benefits of, 179
recommendation, 179–180
products potentials for safety and shelf life enhancement of, 183–206
high hydrostatic pressure, 184–190
commercial applications, 185–186
microbial inactivation mechanism, 184–185
research trends in, 188–190
pulsed electric fields, 190–194
commercial developments in, 191–192
microbial inactivation mechanism, 190–191
research trends in, 192–194
ultraviolet light, 195–199
innovative approaches to enhance efficiency, 195–198
innovative approaches to enhance efficiency of disinfection, 198–199

microbial inactivation mechanism, 195
UV-assisted TiO2 photocatalysis (TUV), 199–206
food safety applications of, 201–206
photocatalysis mechanism for microbial inactivation, 200–201
and working principle, historical applications of, 199–200
Frozen foods, dielectric defrosting, 384, 391, 392
characteristics of, 393
and defrosting, 384
defrosting applications, 391
effects of composition, 394
effects of temperature, 393
frequency dependence, 394
mathematical modeling, 406
governing equations, 407
mathematical modeling, governing equations
electromagnetics, 407
heat generation, 407
heat transfer, 408
measurement of, 391
MW defrosting modeling of, 409
MW heating device, schematic diagrams, 392
in MW range, 400
food models, 404
of real foods, 400
overview of, 383

RF defrosting modeling, 408
in RF range, 398
Frozen microwaveable meals, 415
Fructooligossacharides (FOS), 241
Fructose monomers
polymer of, 241
Fruit processing, 219
Fruits and vegetables
freezing of, 43
Fruit/vegetable-based processed products, 54
FS, See Foam stability (FS)
FTIR, See Fourier-transform infrared spectroscopy (FTIR)
Functional fatty acids, 472
Functional foods
market, 252, 267
therapeutic effects of, 270
G
GAE, See Gallic acid equivalent (GAE)
GAIN, See Global Alliance for Improved Nutrition (GAIN)
Galactooligosaccharides (GOS), 241–242
β-Galactosidase, enzymatic activity of, 241
D-Galacturonic acid, 222
Gallic acid equivalent (GAE), 240
Gas chromatographic methods, 303

Gas-liquid chromatography, 303
Gastric enzymes, 260
Gel
formation, 266
framework, 266
Generally recognized as safe (GRAS), 38, 78
Germination, 10, 11
GHO, See Global Health Observatory (GHO)
Global Alliance for Improved Nutrition (GAIN), 437
Global economies, 460
Global Health Observatory (GHO), 349
Global population, 467
Glucagon-like peptide-1, 253
Glucan, 473
Glucose
conjugated forms, 232
dependent insulinotropic polypeptide, 253
Glucose oxidase (GOX) enzymes, 361
Glukosomacropeptide (GMP), 256
Glutathione (GSH)
synthesis of, 253
Glycemic index (GI), 448
α-D-(1,4)-Glycosidic linkages
hydrolysis of, 2
γ-Gmirobutyric acid (GABA), 434

GMP, See Glukosomacropeptide (GMP)
Good management practices, 137
Good manufacturing practices (GMP), 137
Good-quality proteins, 16
GOS, See Galactooligosaccharides (GOS)
GOX, See Glucose oxidase (GOX) enzymes
Grains, traditional
agronomic factors, 427
controversy over utilization, 424
defined, 423
environmental factors, 426
handling processing, stages, 430
market preferences, 438
physiologic features, 423
rice breads, 436
rice fortification, 436
coating, 437
dusting, 436
extrusion processing, 437–438
technologies for, 436
rice grain, and ayurvedic, 438–441
socioeconomic factors, 428
traditional processing method, in traditional rice, 433
medicinal and therapeutic products , in Indian rice, 433
value-added products of, 431

value addition, 429
African traditional rice varieties, 441–443
ancient wheat and rice strains, 445–446
defined, 426
in Japan, for rice grains, 434
key limitations, 426
Korea, traditional grain, 441
miscellaneous products, 432
rice grains, 432
brown rice, 432
flaked rice, 432
puffed rice, 432
strategies for, 428
sustainability, 428
traditional millet grains, 447–448
traditional pulses, 449
traditional wheat grains, 443
universal product from traditional grains, 451
varietal factors, 427
Gram-negative bacteria, 204
Gram-positive bacteria, synergistic inactivation of, 204
Grape berries, sugar accumulation, 357
GRAS, See Generally recognized as safe (GRAS)
Green tea extract (GTE), 237
GSH, See Glutathione (GSH)

GTE, See Green tea extract (GTE)
Guanylyl cyclase, competitive inhibitors of, 235
Gums, 222
H
HACCP, See Hazard analysis and critical control points (HACCP)
HAMLET, 255
HAT, See Hydrogen atom transfer (HAT) reactions
Hazard analysis and critical control points (HACCP), 137
regulations, 183
HCH, See Hexachlorocyclohexane (HCH)
HCN, See Hydrogen cyanide (HCN)
HDM, See Hydrodynamic mechanism (HDM)
Heat
application of, 41
pasteurization, 194
conventional processing technology of, 186
processed juices, 75
processes, 10–11
cooking, 10–11
roasting, 11
processing, 192
sensitive factors
inactivation of, 10
trypsin inhibitors, 10

sensitive probiotic bacteria, 81
Held water (HW), 317, 325
statistical analysis, 325
Hemicellulose, 221
Herbal rice drinks, 439
value-added, 440
Hertzian method, 117
Hexachlorocyclohexane (HCH), 14
β-Hexachlorocyclohexane (BHC), 15
HHP, See High hydrostatic pressure (HHP)
High-energy electrons, 11
High hydrostatic pressure (HHP), 51, 184–190
commercial applications, 185–186
equipment market, 186
of fruit juices, 185
for inactivation of pathogenic microorganisms, 189
limitation of, 190
machine, 186
microbial inactivation mechanism, 184–185
preservation of fresh juices, 185
research trends in, 188–190
toll-processing facilities for, 190, 206
High-intensity electric field, 190
High isostatic pressure (HIP), 149, 150
changes in, milk fat by, 155

effect on milk constituents, 153
enzymes, changes in, 158
industrial applications, 160
cheese, 163
cheese processed by, 164
effect on cheese manufacture, 163
HIP-processed milk for, 163
ice cream and butter, 168
effect on manufacture, 168
milk, 160
effect on milk for direct consumption, 160
main changes and improvements in quality, 161
yogurt, 166
effect on manufacture, 166
rheological behavior of set yogurt, 167
main changes in milk constituents by, 154
minerals changes by, 159
operation, 150
scheme of operation for, 152
principle, 150
prospects and acceptance of processed products through, 169
protein changes in milk protein by, 156
casein, 156
whey proteins, 156
Highly processed foods, 53

High-performance liquid chromatography (HPLC), 304
implementation of, 304
MS analysis, 318–319
High-porosity food matrix, 84
High-pressure processing, 51–52
High-pressure technologies, See Dynamic high pressure (DHP), See Highisostatic pressure (HIP)
High-quality foods, 38, 183
High-quality products, 145
High-quality protein, 132
High-temperature short-time (HTST) pasteurization, 183
HIP, See High isostatic pressure (HIP)
Hot-water blanching, 17
Household processing
on pesticide residue dissipation, effect of, 18
HPLC, See High-performance liquid chromatography (HPLC)
HTST, See High-temperature short-time (HTST) pasteurization
Human
alimentary enzymes, 219
health, 30
hazards, 14
Hydrocyanic acid, 3
Hydrodynamic mechanism (HDM), 84
Hydrogenation processes, 456
Hydrogen atom transfer (HAT) reactions, 239
Hydrogen bridge bonds, 333

Hydrogen cyanide (HCN), 3
Hydrolysis degree, 335, 337
Hydrolyzable tannins, 4
Hydrolyzed proteins, 330
goat cheese proteins, 331, 338
amide I FTIR spectra of, 332
functional parameters of, 342
HPLC chromatograms, 333, 334
Hydroxityrosol (3,4-dihydroxyphenyletanol), 233
Hydroxybenzoic acids, 233
Hydroxycinnamic acids, 233
Hydroxy-3-methylglutaryl- CoA reductase, 223
Hypoallergenic milk, 475
Hypoallergenic nutritional formulations, 313
Hypochlorous acid, 182
Hypothiocyanate, 257
I
ICAR, See Indian Council for Agricultural Research (ICAR)
Ice exclusion phenomenon, 70
Ideal protein, 295
Immobilization, 276
Immobilized probiotic cells, 275
Immune enhancing nutrients, 473
Immunoglobulins, 255–256

Inactive peptides
formation and degradation of, 258
Indian Council for Agricultural Research (ICAR), 15
Indian weaning foods
using cereal and legume combination, 450
Indicator amino acids, 298
Inermediate-to-high molecular weight, 4
Infrared (IR) snapshot method, 415
Innovative technologies, 68
Inositol hexakisphosphates (InsP6), 5
In-plane shear test, 95
Internal stresses, 96, 125
International Atomic Energy Agency, 21
International year of Quinoa 2013, 445
Iodate-fortified salt, 49
Ionizing radiations, 11
Ion-pairing reagents, 304
Iron-binding glycoprotein, 256
Irradiation, 47–48
Isoflavones, 232
Isopeptide lysinoalanine, 293
ISO series standards, 137
Isothermal membrane distillation, 365
J

Junk food, 468
K
Kato and Nakai’s method, 319
Kinetic processes, 73
Kjedahl’s method, 300, 316
application of, 300
Kluyvermyces marxinaus, 258
Knife-steeling schedules, 95
Kraft Macaroni, 456
L
LABs, See Lactic acid bacteria (LABs)
Lab-scale batch-type TiO2 photocatalysis reactor
schematic diagram of, 202
α-Lactalbumin, 255
Lactic acid bacteria (LABs), 78, 268
strains of, 78
Lactobacillus acidophilus
spray drying encapsulation, 79
Lactobacillus bulgaricus, 37
Lactobacillus delbrueckii subsp. bulgaricus, 237, 268
Lactobacillus helveticus strains, 258
Lactobacillus mesenteroides, 439
Lactobacillus paracasei strain

encapsulation of, 275
Lactobacillus plantarum
immobilization, 274
Lactobacillus rhamnosus GG, 272
Lactoferm ABY 6
viability and proteolytic activity of, 269
Lactoferricin (Lfcin), 257
sequence, 256
Lactoferrin, 256–257
β-Lactoglobulin, 253–254
Lactoperoxidase, 257
Lactophoricin, 256
α-Lactorphin, 262
Lactose, 474
Lactulose, 242
selective metabolism of, 242
LDL-C, See Low-density lipoprotein cholesterol (LDL-C)
LDPE, See Low-density polyethylene (LDPE) matrix
Lectins, 3–4
Legumes, 1–2
seeds, 22
Life expectancy, 469
Light-driven refractance-window dryers, 44
Light reactions, 32
Lignans, 233–234

Lignin, 222
Likrert scale, 143
Limiting amino acids concept, 295
Line force
stress generated by, 98–101
formulation of stress distribution
at only normal line force, 98–100
at only tangential line force, 100–101
Lipid
oxidation, 236
soluble aglycone, 5
Liquid chromatography, 303, 304
Liquid food
concentration of, 70
organoleptic properties of, 70
Liquid smoke, 47
Liquid-to-solid transformation, 71
Listeria monocytogenes
scanning electron microscopic images of, 205
Low-density lipoprotein cholesterol (LDL-C), 223
Low-density polyethylene (LDPE) matrix, 202
Low-gossypol cotton nutrients, 3
Low molecular mass protein compounds, 313
Low molecular-weight compounds, 184
Low-temperature long-time (LTLT) pasteurization, 183

LTLT, See Low-temperature long-time (LTLT) pasteurization
M
Malathion residues, 20
Mapillai samba, 441
Maxwell’s equations, 406, 407
MDC, See Mechanically defoliated canopy (MDC)
Mechanical cooling systems, 133
Mechanically defoliated canopy (MDC), 358
Mechanical operations, 40–41
Membrane-based methods, 351
Membrane technology, 361
Metabolic availability method, 298
Metabolic processes, 10
Metabolic syndrome
implications on, 132
risk of, 132
Methionine sulfoxide, 302
Microbial-associated gastroenteritis
risk of, 240
Microbial cells
microencapsulation of, 79
Microbial foodborne illness, 180
Microbial pathogens
internalization of, 182

Microbial populations, 42
Microbiological tests, 134
Microencapsulated food ingredients, 471
Microencapsulation, 79
benefits of, 80
processing steps of, 79
techniques, 80
technologies, 68
Micronutrients, 219
Microorganisms, 180
viability enhancement of, 79
Microspheres
application of, 79
Microwave
heating, 51
sterilization, 51
Microwave (MW), 383
band dielectric defrosting, 393
3D finite-element model, 410
domestic oven magnetrons, 418
geometric model, 415
heat transfer models, 413, 417
mediated defrosting of frozen foods, 394
nonuniform distribution, 412
oven, 414

meshing scheme, 413
ubiquitous, 415
schematic diagrams, 392
thawing applications, 415
time-temperature profiles, 398
Microwave (MW) heating
dielectric heating mechanism
equipment, 391
frozen foods
defrosting modeling, 409
dielectric properties (DPs), 400
heating device, schematic diagrams, 392
of frozen mashed potatoes, 411
models, 417
multicomponent frozen meals
modeling of, 412–414
uniformity, 416
Milk, 251
Millets, 447, 448
Milling, of grains, 20
Millipore ultrafiltration stirred cell unit, 262
Mini Protean System II, 316
MLR, See Multiple linear regression (MLR)
MNV-1, See Murine norovirus (MNV-1)
Molecular diffusion coefficient, 73

Mucilage, 222
Multicomponent frozen meals
microwave heating modeling, 412–414
Multiple linear regression (MLR), 314
models, 320
Multivariate statistical techniques
data analysis with, 314
Murine norovirus (MNV-1), 198
inactivation efficiency and mechanism, 204
MW, See Microwave (MW)
MWCO membranes, 261
Mycorrhyza, 427
N
Natural antimicrobial compounds, 238
Natural compounds, 238
Natural enzymes, 47
Natural foods, 67
NCDs, See Noncommunicable diseases (NCDs)
NDF, See Neutral detergent fiber (NDF)
Nestlé infant cereals, 474
Net protein utilization (NPU), 293
Neutral detergent fiber (NDF), 220
Nitrogen
balance studies, 297

sulfur heterocycles, 82
Noncaloric phenolic plant compounds, 233
Noncommunicable diseases (NCDs), 131
death rates associated with, 132
Nondairy ingredients, 226
Nonheat processing, 10
fermentation, 10
germination/sprouting, 10
soaking, 10
Nonprotein nitrogen, 300
Nonsteroid antiinflammatory drugs (NSAID), 255
Nonthermal processing technologies, 179–206, 208
development, future directions for, 206–208
fresh fruit and juices
consumption trends, 179–180
products potentials for safety and shelf life enhancement of, 183–206
and related foodborne illness outbreaks, microbial contamination of,180–182
fresh produce-and juice-processing industries, challenges of, 182–183
fresh fruit
chlorine disinfection of, 182
juices, heat pasteurization of, 183
scanning electron microscopy images, 187
Normal force intensity, 102, 103
NPU, See Net protein utilization (NPU)
NSAID, See Nonsteroid antiinflammatory drugs (NSAID)

N-terminal arginine-rich fragments, 257
Nucleation, 71, 73
Nutrients
transition, 466
utilization of, 2
whole grain and refined bread and pasta, 446
Nutritional component, 133
Nutritional quality, 135
O
Obesity, 30
OD, See Osmotic dehydration (OD), See Osmotic distillation (OD)
Official Method AOAC, 229
OH, See Ohmic heating (OH)
Ohmic heating (OH), 51, 85–88
application on bioactive compounds, 86–88
influencing factors in, 85–86
synergistic effect of, 86
OIV, See Organization of Vine and Wine (OIV)
Oligopeptides, 258
OPA. See O-phthaldialdehyde (OPA),
O-phthaldialdehyde (OPA), 259
Orange juice, producers of, 180
Organic acids, evolution of, 226
Organic production, 462

Organization of Vine and Wine (OIV), 351
Organochlorines
insecticides
aldrin, 14
DDT, 14
dieldrin, 14
hexachlorocyclohexane (HCH), 14
residues of, 21
Organophosphates, 13
Oryza glaberrima, 441
γ-Oryzanol, 434
Osmotic dehydration (OD), 69, 83–88
ohmic heating (OH), 85–88
process, schematic diagram of, 87
pulsed vacuum, 84–85
Osmotic distillation (OD), 365, 374
and pervaporation process, 376
Osmotic drying
benifits of, 69
Osmotic pressure, 83
Osmotic process, 84
Overweight, 30
Oxalates, 4–5
bind minerals, 4
Oxidation

processes, 294
product production, 195
Oxidized molecules formation, 270
P
Packaging, 50–51
costs, 57, 59
Pancreatic enzymes, 260
Panicum milare, 448
Papain catalysis, 331
Paradigm shift, significance of, 12–13
Parboiling process, 21
Partial dehydration, 83
Paspalum scobiculatum, 448
Pasteurization, 42, 149
of fruit juices, 191
Pasteurized milk, 42
Pathogenic bacteria, 182
Pathogenic microorganisms, 42, 182, 255
PBMCs, See Peripheral blood mononuclear cells (PBMCs)
PDCAAS, See Protein digestibility-corrected amino acid score (PDCAAS)
Peas (Pisum sativum), 449
Pectic substances, 222
Pectin
degrading enzymes, 181

whey proteins matrix, 274
PEF, See Pulsed electric fields (PEF)
PEM, See Protein-energy malnutrition (PEM)
Pentose sugars, 221
Peptides, 289
biofunctionality characteristics of, 257
bonds, 291, 300
releasing mechanism, 258
sequences, 267
Peripheral blood mononuclear cells (PBMCs), 256
Perishable foods, level of processing, 54
Pervaporation technique, 367, 373
Pesticidal mechanism, 17
Pesticides, 13–22
classes of, 13
cooking process, 17–20
domestic processing techniques and food safety (pesticide residues), 16–17
environmental impacts, 14
exposure to, 14
food processing, 17
formulations, 16
grain storage and pesticide residue dissipation, 21–22
health impacts of, 14
not-to-be-used pesticides, 14–15
pollution, 14

processing methods resulting in residue dissipation, 20–21
residues, 13
elimination of, 20
sources of, 21
residues in food, 15–16
sustainable methodology for food safety within transitional phase, 15–16
types and application, 13–14
PFC, See Progressive freeze concentration (PFC)
Phase change problem, 408
Phenol hypocloride methods, 316
Phenolic acids, 232–233
Phenolic alcohols, 233
Phenolic compounds, 67, 230–240
advantages of, 237
classification and composition, 230–234
anthocyanidins, 232
flavanols, 232
flavanones, 231
flavones, 231
flavonoids, 231
flavonols, 231
hydroxybenzoic acids, 233
isoflavones, 232
lignans, 233–234
phenolic acids, 232–233

phenolic alcohols, 233
stilbenes, 233
in dairy products, 238
effects in vivo, 239
methods of analysis of, 239–240
polyphenolic amides, 234–236, 236–239
antioxidant activity and protection against oxidative stress, 234–235
cancer protective effects, 236
cardiovascular protective effects, 235
cereal products, 238–239
dairy products, 237–238
diabetes risk, hypoglycemic effects on, 235
meat products, 236–237
neurodegenerative protective effects, 235
source of, 236
Photocatalysis, 200
mechanism of, 201
pH-stat method, 259
Phytates, 5
Phytic acid, 5
Plant
foods, 2
foods and beverages, 69
secondary metabolites, 233
Point force, 98

airy functions, 94
stress generated by, 97–98
stress distribution formulation
at only normal point force, 97–98
at only tangential point force, 98
Poisson’s ratio, 99, 109
Polycyclic aromatic hydrocarbons, 82
Polymerized compounds, 69
Polypeptide chains, 336
Polyphenolase
enzymatic hydrolysis by, 11
Polyphenolic amides, 234
Polyphenolic compounds
in sorghum, 69
Polyphenol oxidase (PPO), 188
enzymes, 199
Polyphenols, 69, 199, 230
antidiabetic properties of, 235
chemical structures, 69
Pork burgers
sensory characteristics of, 225
Postfermentation techniques, 237, 370
membrane processes, 372
dialysis, 372
distillation, 373

osmotic distillation, 374
pervaporation, 373
reverse osmosis, 373
thin layer evaporation, 370
vacuum distillation, 370
Potential function method, 94
PPO, See Polyphenol oxidase (PPO)
Prebiotics, 240–243
activity in vitro, 242–243
fructooligossacharides (FOS), 241
inulin, 241
galactooligosaccharides (GOS), 241–242
lactulose, 242
Precision protein standards, 316
Prefermentation approach, 237
Preservation, 33, 34
by CA/MA, 49
method, 200
Preservatives, 49
Pressure
ohmic-thermal sterilization, 188
time conditions, optimization of, 188
Proanthocyanidins, 232
Probiotic bacteria, 258, 276
survival of, 273

Probiotics, 70, 78
beverages, 273
cells, advantages for, 80
encapsulation of, 81
encapsulation technology, 79
food products, 78
microorganisms, 69
types of foods, 78
Processed foods, 29
products, 63
requirements for, 54
Product
assessment program, 33
shelf life, 135
Production-to-consumption processing, 62
Progressive freeze concentration (PFC)
application of, 75
headspace samples processed by, 75
Protease inhibitors, 3
Bowman-Birk inhibitors, 3
Kunitz type, 3
Protein digestibility-corrected amino acid score (PDCAAS), 297, 299
Protein-energy malnutrition (PEM), 12
Protein hydrolysis, 301–303, 306, 342
effect of goat cheese

desirability, 337–342
on emulsifying activity index, 325–327
on emulsifying stability index, 329
on foaming capacity, 333–336
on foam stability, 336–337
on free amine nitrogen content, 320–322
on held water, 325
on protein solubility index, 324
on surface hydrophobicity, 333–336
on total soluble nitrogen content, 322–324
on viscosity, 329–333
on water-holding capacity, 324–325
Proteinogenic, 291
amino acids, 291
Protein-protein interactions, 263, 318
Proteins
analysis
development of, 303
laboratories engaged in, 304
bioactive properties of, 251
chemical assessment of, 296
crisis, 289
enzymatic hydrolysis, 313
foaming potential of, 266
foods, quality of, 307

functional properties, 263
hydrolysates, 313, 318, 331
activity index of, 335
hydrolysis degree of, 327
isolates, 316
priority, 288
rich foods, 289
salt-acid hydrolysis, 293
score, 295
source of, 225
synthesis, marker of, 298
thermal processing of, 294
tryptic hydrolysate, 261
Protein solubility index (PSI), 316
statistical analysis of, 324
Proteolytic microbes, 78
Proteoso-peptone (PP) fraction, 256
Pseudocereals, 423
PSI, See Protein solubility index (PSI)
Pulsed electric fields (PEF), 52, 190–194
commercial developments in, 191–192
for inactivation of pathogenic microorganisms, 193
microbial inactivation mechanism, 190–191
processed fruit juices, 206
research trends in, 192–194
technology, commercial applications of, 191
Pulsed vacuum, 84–85
Pulsed vacuum osmotic dehydration (PVOD), 84
application of, 85
PVOD, See Pulsed vacuum osmotic dehydration (PVOD)
Pyrethroids, 13
Q
Quality tools, 138
R
Radappertization, 48
disadvantage of, 48
Radiation
based technology, 11–12
irradiation, 11–12
microwave cooking, 11
treatment, 48
radappertization, 48
radicidation, 48
radurization, 48
Radicidation, 48
Radioactive isotopes, 47
Radio frequency (RF), 388
heating, 391

plastic material-polyetherimide (PEI), 417
radiation, 383
schematic diagram, 390, 410
Radurization, 48
Ragi hurihittu, 448
Raw foods
ingredients, preservation of, 41
organoleptic properties of, 68
Reactive oxygen species (ROS), 234
Ready-to-eat, 432
Ready-to-eat meal processors, 62
Recalculation coefficients, 300
Reduction ratio, 40
Reference-point method, 93
Refrigeration, 42–43
Relative blade sharpness factor, 118–119
Relative error, 322
Relative sharpness factor, 106
Repeatability, 305
Residual enzyme, 192
Resistant starch (RS) matrices, 273
Response surface graphics (RSG), 314, 328
of held water (HW), 327
of total soluble nitrogen content, 323
of viscosity, 330

Response surface methodology (RSM), 194
Retail development
impact of, 60
Reverse osmosis (RO), 365
RF, See Radio frequency (RF)
L-Rhamnose-rich units, 222
Rice
bread, 434
bread flour, 436
coextrusion, 432
fortification, economic feasibility, 440
legume-based Iranian ethnic foods, 451
sevai, 432
snack, 433
Robotics technology
development of, 94
ROS, See Reactive oxygen species (ROS)
RSG, See Response surface graphics (RSG)
RSM, See Response surface methodology (RSM)
S
Saccharomyces rouxii, 369
Saccharomycodes ludwigii, 369
Salmonella enterica, 183
Salt-acid hydrolysis, 306

Sample preparation, 314
Sampling, 299
Sandvik Materials Technology, 95
Sangiovese cultivar grapes, 358
Sangiovese wine, 358
Sanitary hygienic conditions, 134
Saponins, 5–6
bitter taste of, 5
Sausages
physicochemical and textural properties of, 225
SCC, See Spinning cone column (SCC)
SCFA, See Short chain fatty acids (SCFA)
SCFC, See Suspension crystallization freeze concentration (SCFC)
SDF, See Soluble dietary fiber (SDF)
SDS-PAGE, See Sodium dodecyl sulfate polyacrylamide gel electrophoresis(SDS-PAGE)
Secondary metabolites, 2
Second-derivative infrared spectrum, 318
Semiperishable foods, 32
Semipermeable cell membrane, 83
Sensitivity, 305
Sensory analysis, 198
SET, See Single electron transfer (SET)
Severe summer pruning (SSP), 358
Shear stresses, 109, 112
Shelf life, 33

Shelf-stable foods, 32
Short chain fatty acids (SCFA), 221
production, 222, 224
SHR, See Spontaneously hypertensive rat (SHR)
Simulation
with changing parameters, 107–113
fracture force via blade shape, 112–113
relationship between fracture force and slicing angle, 109–112
stress distribution results, 107–109
Single electron transfer (SET), 239
Sirtuin 1 (SIRT1), 235
Slaughter methods, 133
Slicing angle, 109, 112–114, 119
Smoking, 46–47
advantages, 46
as antioxidant, 47
Sodium dodecyl sulfate polyacrylamide gel electrophoresis (SDS-PAGE),316, 322
Soil composition, 360
Solidified agar matrix, 204
Solubility, 263, 316
Soluble dietary fiber (SDF), 221, 224
Soluble peptide samples, 269
Soluble proteins
hydrolysis degree of, 320, 329
of semi-hard goat cheese, 314

Solvent supercritical extraction, 364
South India
traditional rice varieties, 434, 435
value-added products, 440
Spanish grape varieties, 361
Spectral similarity coefficients, 318
Spinning cone column (SCC), 363
Spontaneously hypertensive rat (SHR), 255
Spore inactivation, 188
Spray drying, 82
encapsulation, 79
procedure, schematic presentation of, 273
Sprouted grain, 451
SSP, See Severe summer pruning (SSP)
Standard addition method, 305
Staphylococcus spp., 238
Statistical design
of experiments, 315–316
Statistica software, 322, 327, 330
Stilbenes, 233
Stork poultry processing, 93
Streptococcus faecalis, 439
Streptococcus thermophilus, 237
Stress
component, 108

distribution, 99, 107, 109, 111
numerical results of, 115
tensor, 94, 107
Structurally diverse molecules, 5
Sugar
accumulation, 360
removal, 361
Sulfur-containing amino acids, 12
Supernatants, 316
Superposition
principle of, 97
Superposition theorem, 99
Surface hydrophobicity (So), 319
statistical analysis of, 333
Surface-to-volume ratio, 73
Suspension crystallization freeze concentration (SCFC), 73
control crystallization in, 73
Sustainable management systems, 137
Synthetic pyrethroids, 13
residues of, 21
use of, 14
Synthetized hispolon
antimetastatic effects of, 236
T

Tannins, 4
concentration, 4
TCP, See 3,5,6-Trichloro-2-pyridinol (TCP)
Technological tools, 130
Thawing, 385, 405
process, 408
Thermal pasteurization
for microbial inactivation, 190
Thermal processing, 41, 183
Thermosensitive compounds, 83
Thiocyanate anion, 257
TIA, See Trypsin inhibitor activity (TIA)
TiO2, 200
photocatalyst film, 202
photocatalytic reaction, 202
Tocai rosso, 359
“Total antioxidant potential” assay, 240
Total dietary fiber enzymatic-gravimetric method, 229
Total phenols assay, 240
ferric ion reducing antioxidant power (FRAP), 240
Folin-Ciocalteu reagent (FCR), 240
Trolox equivalence antioxidant capacity, 240
Total protein, 300
contents, 300, 316
Total soluble nitrogen, 316

Traceability, 130, 136, 137
systems, 138
use of, 137
tools, adoption of, 137
Trebbiano toscano, 359
Tresca’s fracture criterion, 105
3,5,6-Trichloro-2-pyridinol (TCP), 21
Trinitrobenzenesulfonic acid, 259
Triticum aestivum, 443
Trypsin
chymotrypsin inhibitors, 3
hydrolysis, 260
inhibitors, 3, 10
Trypsin inhibitor activity (TIA), 11
Tryptic whey protein hydrolysate (TWPH), 272
Tuna (Thunnus maccoyii), 400
TUV, See UV-assisted TiO2 photocatalysis (TUV)
TWPH, See Tryptic whey protein hydrolysate (TWPH)
Tyrosine, 292
Tyrosol (4-hydroxyphenylethanol), 233
U
UF, See Ultrafiltration (UF)
UHP, See Ultra-high pressure (UHP)
UHT technology packing, 462

Ultrafiltrated caprine, 271
Ultrafiltrated mozzarella cheese, 272
Ultrafiltration (UF), 73, 261
membrane, 261
method, 261–263
MWCO membrane, 262
Ultra-high pressure (UHP), 51
Ultraviolet (UV)
damaged microorganisms, 199
irradiation system, efficiency of, 198
light, 195–199
efficiency of, 195
innovative approaches to enhance efficiency, 195–198
innovative approaches to enhance efficiency of disinfection, 198–199
limitation of, 195
microbial inactivation mechanism, 195
reactors, types of, 195, 196
UV-H, inactivation, 196
Uniform heating, approaches, 415–418
Uppsala methodology
for rapid analysis, 229
Urbanization, 180
Urokinase-plasminogen activator, 236
US Food and Agriculture Organization (FAO), 78
US Food and Drug Administration (FDA), 77

approved food additive, 201
U.S. Public Health Service
FDA’s Pasteurized Milk Ordinances, 42
UV, See Ultraviolet (UV)
UV-assisted TiO2 photocatalysis (TUV), 183, 199–206
antimicrobial activity of, 202
food safety applications of, 201–206
oxidation process, 201
photocatalysis mechanism for microbial inactivation, 200–201
for surface disinfection, 203
technology, 205
potential of, 201
principle of, 199
treated sikhye drinks, 204
and working principle, historical applications of, 199–200
V
Validated multiphysics models, 207
Validation method, 305
Value added food products, 464
Value-added processing
extra feature, 466
Vectorborne diseases, 13
Vegetarian food products, 477
Viruses, 181

Viscosity, 318
Vitalplant, 238
Vitamin D fortification, 437
Vitamins
B-group, 1
definition of, 70
fat-soluble, 70
water-soluble, 70
Volatile compounds, 75, 82, 83
Volumetric heating, 385
Volumetric heating technology, 86
W
Water
activity (aW), 45–46
fat-holding capacities, 266
food matrix of, 83
quality, monitoring parameters for, 133
soluble extracts
ACE-inhibitory activity of, 270
soluble sugar chains, 5
soluble vitamins
sources of, 1
Water-holding capacity (WHC), 266
dependency of, 326

determination, diagram for, 317
experimental values of, 325
statistical analysis of, 324
WHC, See Water-holding capacity (WHC)
Wheat
bran, 226
fiber-strained yogurts, 226
flour processing, 221
rye products, 271
Wheat germ (WG) oil, 445
Whey protein concentrate (WPC), 261
alginate beads, 274
matrix, 275
rice bran protein, 276
Whey protein hydrolysate (WPH), 253
Whey protein isolate (WPI), 263
Whey proteins, 267, 275
antioxidant activity of, 261
composition and characteristics of, 253
enzymatic hydrolysis of, 251
during fermentation process, hydrolysis of, 268
fragments, bioactivity of, 263
hydrolysis during fermentation process with proteolytic starter culture to,258–259
and peptides
bioactivity of, 252–257

bovine serum albumin (BSA), 255
caseinomacropeptide, 256
glukosomacropeptide (GMP), 256
immunoglobulins, 255–256
α-lactalbumin, 255
lactoferrin, 256–257
β-lactoglobulin, 253–254
lactoperoxidase, 257
proteoso-peptone (PP) fraction, 256
potential of, 276
solubility of, 263
Whole grains council, 445
Wine
alcohol reduction techniques, 356
postfermentation techniques, 362
membrane processes, 364
solvent supercritical extraction, 364
spinning cone column, 363–364
vacuum distillation, 363
postfermentation techniques, membrane processes
osmotic distillation, 365–367
pervaporation, 367
reverse osmosis, 365
prefermentation/microbiological strategies, 360
dilution of must, 360

enzyme (glucose oxidase) addition, 361
membrane processes, 361
microbiological practices, 361
viticultural strategies, 357
growth regulators, application of, 359
long-term vineyard changes, 360
managing harvest dates, 359
modification irrigation regimes, 359
short-term vineyard changes, 357–358
dealcoholization, 363
by vacuum distillation, 363
supply chain, 356
Wood, shearing properties of, 95
World Health Organization (WHO), 78, 132, 179, 348, 349
South-East Asia region, 349
World Trade Organization (WTO), 465
WPC, See Whey protein concentrate (WPC)
WPI, See Whey protein isolate (WPI)
WTO, See World Trade Organization (WTO)
X
X-rays, 11
crystallographic studies, 331
Y

Yacon stem (Smallanthus sonchifolius), 442
Yeasts, 44, 181
mediated fermentation, 20
Yerba mate infusion
antioxidant activity of, 76
Young’s modulus, 117