
Classical vs Keynesians Consumption Function
77
Transcript of Classical vs Keynesians Consumption Function


Origin of RESEARCH
French word recherché (re·cher·ché), from recercher
to go about seeking or traveling
Definition of RESEARCH
•Studious inquiry or examination
•Investigation or experimentation aimed at the
discovery and interpretation of facts,
•Revision of accepted theories or laws in the light of
new facts
Or
•Practical application of such new or revised
theories or laws 3

•Research is the systematic approach to obtaining and confirming new and reliable knowledge.
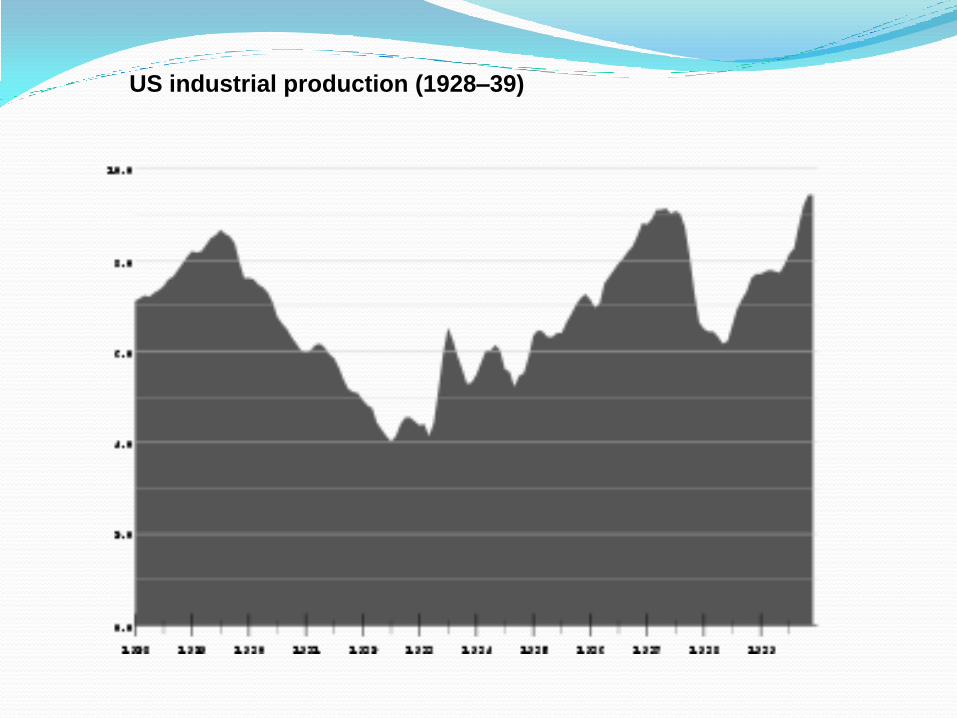
Examples of Why Research at a bigger scale:Economics (Birth of Macroeconomics)Classical vs KeynesiansConsumption FunctionFinance (Three Factor Fama and French Model)SMB = Small (market capitalization) minus big" and HML = "high (book-to-market ratio) minus low
4

USA annual real GDP from 1910–60, with the years of the
Great Depression (1929–1939) highlighted.

USA annual real GDP 1from 910–60, with the years of the Great
Depression (1929–1939) highlighted.
Unemployment rate in the US 1910–1960, with
the years of the Great Depression (1929–1939)
highlighted.

Disciplinary Research is that which is designed to improve a discipline, Subject-Matter Research is a research on a subject of interest to a set of decision makers facing a set of practical problems, and Problem Solving Research is designed to solve a specific problem for a specific decision maker.
9

10
Information Reduces Uncertainty

"The secret of success is to know something nobody else knows. "
Aristotle Onassis
11

Definition of Strategy
Strategy: A firm’s theory about how to gain
competitive advantage
12

Mission Objectives
External
Analysis
Internal
Analysis
Strategic
Choice
Strategy
Implementation
Competitive
Advantage
The Strategic Management Process
13

The Strategic Management Process
Competitive Advantage
Definition: the ability to create more economic value
than competitors
• all other elements of the strategic management
process are aimed at achieving competitive advantage
Mission Objectives
External
Analysis
Internal
Analysis
Strategic
Choice
Strategy
Implementation
Competitive
Advantage
14
Competitive Advantage
The Ability to Create More Economic
Value Than Competitors
• there must be something different about a firm’s
offering vis-à-vis competitors’ offerings
• if all firms’ strategies were the same, no firm
would have a competitive advantage
• competitive advantage is the result of doing
something different and/or better than competitors
15

Competitive Advantage
Two Types of Difference
1)Preference for the firm’s output
2)Cost advantage vis-à-vis competitors
• people choose the firm’s output over others’
• people are willing to pay a premium
• lower costs of production/distribution
16

Competitive Advantage
External
Analysis
Internal
Analysis
Strategic
Choice
Strategy
Implementation
Competitive
Advantage
• identify and exploit differences that may lead
to competitive advantage
The Strategic Management Process
17

Q
P
D
MR
D
ATC
MC
Q
P
(D=MR=Price)
Imperfect Competition Perfect Competition
Competitive Advantage
ATC
MC
Competitive Advantage
Economic Models
18

Two Classes of Measures:
1) Accounting Measures
2) Economic Measures
Competitive Advantage
Measuring Competitive Advantage
• ROA, ROS, ROE, etc. that exceed industry
averages
• earning a return in excess of the cost
of capital
19

Competitive Advantage
Competitive Advantage
Disadvantage
Parity
Advantage
Below Normal
Normal
Above Normal
Economic Returns
• exceeding expectations
• meeting expectations
• failing expectations
20

The VRIO Framework
If a firm has resources that are:
• valuable,
• rare, and
• costly to imitate, and…
• the firm is organized to exploit these resources,
then the firm can expect to enjoy a sustained
competitive advantage.
21

The VRIO Framework
Valuable? Rare?
Costly to
Imitate?
Exploited by
Organization?
Competitive
Implications
No
Yes
Yes
Yes
Yes
Yes Yes Yes
No
No
No Disadvantage
Parity
Temporary
Advantage
Sustained
Advantage
Economic
Implications
Below
Normal
Normal
Above
Normal
Above
Normal
22

BRAND ISTRANSFORMING A PRODUCT INTO SOMETHING
ELSE…
A SINGLE IDEA….
An IMAGE
A PERCEPTION
A PROMISE
A HUMAN BEING.
23

Unique Selling Proposition(USP)
The differentiator or discriminator The single most compelling reason for the target market to choose the brand
Great brands generally discriminate in terms of
BenefitsReason to believeEmotions & values

Brand Value Pyramid Reflects the power of brand associations.
Features
Attributes
Benefits
Emotions
Beliefs
Where the brand exists in the mind of the consumer?

26
Brand Value Pyramid
Benefits
Features
Value
•Choice of the young •Heads will surely turn•The NEW Honda•Proud •Self esteem •Best money can buy •Envied by all •Confident•Happiness
•Economical•Durable•Resale Value-CD•73 km/h mileage•Service Centers •Carries heavy loads
•Econo-power engine •Lajawab Control •Lajawab Road grip •LajawabSuspension

Bases of Differentiation
A base of differentiation must fill some
customer need:
• image
• status
• comfort
• taste
• beauty
• style
• reliability in use• safety
• cleanliness
• service
• quality
• accuracy
• hunger • belonging
A differentiated product fills one or more needs
better than the products of competitors
27

Type Of Research Qualitative Research
Exploratory
Quantitative Research
Descriptive
Causal
28

Questions What is research anyway?
What are the types of research?
What is the basic difference between qualitative and quantitative research?
Is it necessary to know quantitative techniques to conduct research work
29

30

Stages of the Research Process
Problem Discovery
and Definition
Research
Design
Sampling
Data
Gathering
Data Processing
and Analysis
Conclusions and
Report
Discovery and
Definition
and so on
31

Problem
discovery
Problem definition
(statement of
research objectives)
Secondary
(historical)
data
Experience
survey
Pilot
study
Case
study
Selection of
exploratory research
technique
Selection of
basic research
method
Experiment Survey
ObservationSecondary
Data StudyLaborator
y
Field Interview Questionnair
e
Selection of
exploratory research
techniqueSampling
Probability Non probability
Collection of
data
(fieldwork)
Editing and
coding
data
Data
processing
Interpretation
of
findings
Report
Data
Gathering
Data
Processing
and
Analysis
Conclusions
and Report
Research Design
Problem Discovery
and Definition
32

Quantitative Research: Overview Systematic scientific investigation of data and their
relationships.
The objective of quantitative research is to develop and employ mathematical/statistical models, theories and hypotheses pertaining to natural phenomena.
Measurement is key in quantitative research because it shows the relationship between data and observation
Use of appropriate tools of analysis is crucial in getting the plausible results
33

Difference between Qualitative & Quantitative Research Their analytical objectives
The types of questions they pose
The types of data collection instruments they use
The forms of data they produce
The degree of flexibility built into study design
34

General Framework
Quantitative Seek to confirm hypotheses about phenomena Instruments use more rigid style of eliciting and categorizing responses to
questions Use highly structured methods such as questionnaires, surveys, and structured
observation
Qualitative
Seek to explore phenomena
Instruments use more flexible, iterative style of eliciting and categorizing responses to questions
Use semi-structured methods such as in-depth interviews, focus groups, and participant observation
35

Analytical Objectives Quantitative
To quantify variation
To predict causal relationships
To describe characteristics of a population
Qualitative
To describe variation
To describe and explain relationships
To describe individual experiences or group norms
36

Data Format Quantitative
Numerical (obtained by assigning numerical values to responses)
Qualitative
Textual (obtained from audiotapes, videotapes, and field notes)
37

Flexibility in Study Design Quantitative Study design is stable from beginning to end Participant responses do not influence or determine how
and which questions researchers ask next Study design is subject to statistical assumptions and
condition
Qualitative Some aspects of the study are flexible Participant responses affect how and which questions
researchers ask next Study design is iterative
38

39
QUANTITATIVE
VS.
QUALITATIVE

40
Quantitative Qualitative
Concepts
– Emphasizes numbers, measurements, control, and experimentation – This is the traditional approach in business & economics research
– Emphasizes natural settings, observations, verbal narratives, and interpretations – Emerged in the mid- 1970s as an approach to educational research
Goals
– Test theory – Establish facts – Show relationships – Predict – Statistically describe
– Understand theory – Develop understanding – Describe multiple realities – Capture naturally occurring behavior
Design
– Structured – Predetermined – Formal – Specific
– Evolving – Flexible – General

41
Quantitative Qualitative
Sample
– Large – Representative – Random Selection – Control Groups – Stratified
– Small – Non-representative – Purposeful
Data
–Quantities – Counts – Measures – Instruments – Numbers – Statistics
– Verbal descriptions – Field Notes – Observations – Documents – Photographs – People’s own words – Narrative
Methods
– Experiments – Quasi-experiments – Surveys – Structured Interviews – Structured Observations
– Observation – Open-ended interviewing – Review of documents and artifacts

Types of Quantitative Research Correlational Research
Descriptive Research
Causal Research
Quasi Experimental Research
Experimental Research
Mathematical Modeling
Simulation
42

Correlational Research To find if the data has an observable relationship that
can be further specified in terms of magnitude and/or an increase or decrease.
Examples:
Is there any relationship between sales and advertisement of a product?
Higher the awareness regarding the package (mobile phone service) lesser the customer join that package
Interest rate
43

Correlation Coefficient A statistical measure of the covariation or association
between two variables.
Are dollar sales associated with advertising dollar expenditures?
44

Why do we use it? Correlation indicates the strength and direction of a linear
relationship between variables.
Non-linear relationships can also be discussed but difficult to understand and interpret.
We want to know
Is there a relationship between two variables/data?
What is the direction of the relationship?
What is the magnitude?
These relationships may show any tendency for the variables to vary consistently.
45

Causal ResearchBivariate Regression A measure of linear association that investigates a
straight line relationship
Useful in forecasting
46

Bivariate Linear Regression
A measure of linear association that investigates a straight-line relationship
Y = a + bX + e
Y^ = a + bX
where
E = Y-Y^
Y is the dependent variable
X is the independent variable
a and b are two constants to be estimated
47

Multiple Regression An extension of bivariate regression
Allows for the simultaneous investigation
two or more independent variables
a single interval-scaled dependent variable
Y= a +b1X1 +b2X2+b3X3...+bnXn
48

49
Few examples of the kind of problems that
may be solved using Regression
1. Testing whether financial markets are weak-forminformationally efficient.
2. Testing whether the CAPM or APT represent superiormodels for the determination of returns on risky assets.
3. Measuring and forecasting the volatility of bond returns.

50
What do We Use and For?
In the CAPM example used above, plugging the 5 observations in to make up the formulae given above would lead to the estimates
= -1.74 and = 1.64. We would write the fitted line as:
Question: If an analyst tells you that she expects the market to yield a return
20% higher than the risk-free rate next year, what would you expect the return
on fund XXX to be?
Solution: We can say that the expected value of y = “-1.74 + 1.64 * value of x”,
so plug x = 20 into the equation to get the expected value for y:
$a $b
$a $b
06.312064.174.1ˆ +iy
tt xy 64.174.1ˆ +
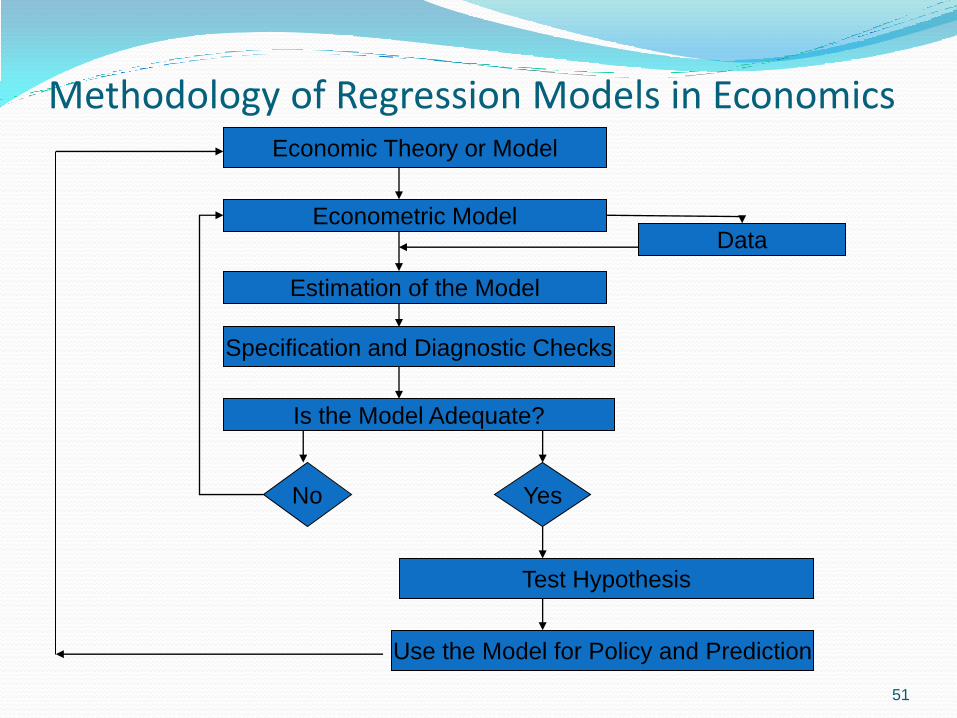
Methodology of Regression Models in Economics
51
Economic Theory or Model
Econometric Model
Estimation of the Model
Data
Specification and Diagnostic Checks
Is the Model Adequate?
YesNo
Test Hypothesis
Use the Model for Policy and Prediction

A Case study of Agriculture Productivity in Taiwan
Thomas Chen, an Economist, wanted to study agriculture productivity in Taiwan. An aim was to know if there was increasing returns to scale in Taiwan’s agriculture sector He used famous Cobb-Douglas production function
Y: Production or Output L: Labor Input K: Capital Input A: Technological Constant
Alpha and Beta: Elasticities of output with respect to labor and capital
Research Hypothesis:
βα= KALY
1>β+α
52

Descriptive Research The research that simply describes the data
Normally the descriptive statistics (like mean, median, standard deviation, skewness and kutosis) are used
Examples:
Describe the characteristics of mobile users according to the mobile service providers, package, and income group
53

Why do we use it? Data description gives the understanding regarding
the data set
Helpful to compare two or more data sets (segments)
For example comparing two branches, operators, methods etc.
Shape of data distribution is required for further analysis
Provides and insight and understanding regarding the data
Provides the basis for various other statistical analysis Exploratory Research Descriptive Research Explanatory
54

Experimental Research Research in which the investigator deliberately controls
and manipulates the independent variable to observe the effect of that change on another the dependent variable.
Examples
To know the effectiveness of training – tests are conducted before and after specific training and results are compared
To know whether bundle offer will boost the sales – data of sales before and after sales is recorded
To identify impact of packaging (three different packages) on brand awareness and recall
55

Quasi Experimental Research When there is no control on the subjects, then we apply
quasi experimental research Almost same as experimental research (randomization) Results are less reliable as compared to experimental
research
Examples Comparing the output of two factory workers on different
machines, but machines cannot be assigned randomly Comparing three different methods of teaching on three
groups but students in each group are not assigned randomly
56

Mathematical Modeling Identify variables
Develop mathematical relationships between the variables
Normally this relationship is in the form of mathematical equations (often linear)
Examples
Relationship between stress and workload, flexible hours, experience, age
Employee motivation is function of reward, recognition, fringe benefits, environment, culture
57

When to use it? When variables are clearly identified
Mathematical relationship can be explained
Model is helpful to explain the phenomena
Inclusion and exclusion of variables help to modify the variables
Factor analytic study is required
58

59

60
Levels of Measurement
Ordinal
interval
Ratio
NominalClassification
Order
Classification
Order
Classification Distance
Natural Origin
Order
Classification Distance

Type of
Measurement
Nominal
Two
categories
More than
two categories
Frequency table
Proportion (percentage)
Frequency table
Category proportions
(percentages)
Mode
Type of
descriptive analysis
61

Type of
MeasurementType of
descriptive analysis
Ordinal Rank order
Median
62

Type of
MeasurementType of
descriptive analysis
Interval Arithmetic mean
63

Type of
MeasurementType of
descriptive analysis
RatioIndex numbers
Geometric mean
Harmonic mean
64

Measure of
Central Measure of
Type of Scale Tendency Dispersion
Nominal Mode None
Ordinal Median Percentile
Interval or ratio Mean Standard deviation
Central Tendency
65

Type of MeasurementDifferences between
two independent groups
Differences among
three or more
independent groups
Interval and ratioIndependent groups:
t-test or Z-test
One-way
ANOVA
Common Bivariate Tests
66

Type of MeasurementDifferences between
two independent groups
Differences among
three or more
independent groups
OrdinalMann-Whitney U-test
Wilcoxon testKruskal-Wallis test
Common Bivariate Tests
67

Type of MeasurementDifferences between
two independent groups
Differences among
three or more
independent groups
NominalZ-test (two proportions)
Chi-square testChi-square test
Common Bivariate Tests
68

Type of
MeasurementDifferences between
two independent groups
Nominal Chi-square test
69

Type of
MeasurementDifferences between
two independent groups
Interval and
ratiot-test or
Z-test
70

Type of
MeasurementDifferences between
two independent groups
Nominal Z-test (two proportions)
71

Type of
Measurement
Differences between
three or more
independent groups
Interval or ratio One-way
ANOVA
72

Measures of Association A general term that refers to a number of bivariate
statistical techniques used to measure the strength of a relationship between two variables.
73

Relationships Among Variables Correlation analysis
Bivariate regression analysis
74

Type of
MeasurementMeasure of
Association
Interval and
Ratio ScalesCorrelation Coefficient
Bivariate Regression
75

Type of
MeasurementMeasure of
Association
Ordinal Scales Chi-square
Rank Correlation
76

Type of
MeasurementMeasure of
Association
NominalChi-Square
Phi Coefficient
Contingency Coefficient
77

78
Summary: Primary Scales of Measurements
and appropriate use of Quantitative Research
Techniques