Effects on nutrient intake of a family-based intervention to promote increased consumption of...
12
Effects on nutrient intake of a family-based intervention to promote increased consumption of low-fat starchy foods through education, cooking skills and personalised goal setting: the Family Food and Health Project Peter J. Curtis 1,2 , Ashley J. Adamson 1 and John C. Mathers 1 * 1 Institute for Ageing and Health, The Human Nutrition Research Centre, William Leech Building, Newcastle University, Newcastle upon Tyne NE2 4HH, UK 2 Norwich Medical School, University of East Anglia, Norwich, Norfolk NR4 7TJ, UK (Submitted 18 October 2010 – Final revision received 16 August 2011 – Accepted 16 August 2011 – First published online 12 October 2011) Abstract Reducing the prevalence of fat-rich, energy-dense diets is a public health priority. The present parallel-designed randomised study compared three interventions aimed to increase intakes of low-fat starchy foods and to reduce fat intakes among 589 individuals from 169 families in the Family Food and Health Project (FFHP). Intervention A was education only, intervention B provided ‘cook and eat’ sessions only, whereas intervention C included personalised goal setting, ‘cook and eat’ and education. Diet was assessed at baseline (T 0 ) and at 3 months (T 1 ), 6 months (T 2 ) and 18 months (T 3 ) post-intervention. Retention rates were 75 % at T 1 , 63 % at T 2 and 40 % at T 3 . ANCOVA (baseline intake as covariate) was assessed between intervention differences at T 1 , T 2 and T 3 . At T 1 , individuals in intervention C consumed less fat (P¼ 0·02) and more total carbohydrate (P¼ 0·001), starch (P¼ 0·04) vitamin C (P¼ 0·002) and NSP (P¼ 0·01) than those in intervention A. Whereas similar dietary intakes were reported across interventions at T 2 , participants in intervention C had less energy-dense diets that contained more NSP and vitamin C at T 3 than intervention A (P, 0·0001, P¼ 0·002 and P¼ 0·01, respectively). Across all intervention groups, the more socially deprived participants in the FFHP (n 119) consumed less fat (P¼ 0·01) and more total carbohydrate (P¼ 0·02) at T 2 than the least socially deprived (n 240). These data demonstrate the importance of personalised goal setting to translate knowledge and practical cooking skills into healthier food choices, suggesting that low-fat starchy food-focused interventions may be effective in reducing fat intake. Key words: Starchy foods: Family-based interventions: Cooking skills: Social deprivation It is widely recognised that dietary patterns that are typified by energy-dense, fat-rich foods (often described as a ‘Western diet’) are associated with an increased prevalence of obesity (1,2) , diabetes (3,4) , CVD (5) and cancers at several sites (6) , and effective strategies to improve such dietary patterns are a public health priority (5) . The present UK dietary target to reduce fat intake to no more than 35 % of energy derived from food (%FE) (7) was established in 1984 (8) and this target has been confirmed in a number of subsequent UK government health initiatives (7,9) . However, food purchasing data from the UK National Food Survey (10) and the Family Food 2008 report (based on the 2008 Expenditure and Food Survey data, UK) suggest that habitual intakes of fat in the UK are resistant to change and, if anything, have been increasing in recent years (11) . Although these indices of food purchasing should be interpreted with caution, it seems that reaching the dietary target for fat intake remains difficult for some UK consumers. For more than a decade (12) , it has been suggested that low-fat starchy foods such as bread, cereals, rice, pasta, potatoes, legumes and pulses may be a suitable replacement for energy-dense foods of low nutrient quality. These starchy foods are often described as ‘complex carbohydrate-rich’ foods and some are ‘whole-grain-rich’ foods and recom- mendations to eat more of these food groups continue to be promoted (13–15) . Despite this, evidence suggests that consumers have mixed views about the role of such foods in their diets (16) . Compared with the recommendations, pre- sent intakes of these foods are sub-optimal and, for example, it has been reported recently that only 55 % of French subjects meet specific targets for starchy food intake (17) . * Corresponding author: Professor J. C. Mathers, fax þ 44 191 222 8943, email [email protected] Abbreviations: %FE, percentage of food energy; %TE, percentage of energy derived from food and alcohol; ED, enumeration district; FFHP, Family Food and Health Project; GLM, general linear ANCOVA model; SES, socioeconomic status; T 0 , baseline assessment; T 1 , 3 months post-intervention; T 2 , 6 months post-intervention; T 3 , 18 months post-intervention. British Journal of Nutrition (2012), 107, 1833–1844 doi:10.1017/S0007114511005101 q The Authors 2011 British Journal of Nutrition
-
Upload
independent -
Category
Documents
-
view
3 -
download
0
Transcript of Effects on nutrient intake of a family-based intervention to promote increased consumption of...
Effects on nutrient intake of a family-based intervention to promoteincreased consumption of low-fat starchy foods through education, cookingskills and personalised goal setting: the Family Food and Health Project
Peter J. Curtis1,2, Ashley J. Adamson1 and John C. Mathers1*1Institute for Ageing and Health, The Human Nutrition Research Centre, William Leech Building, Newcastle University,
Newcastle upon Tyne NE2 4HH, UK2Norwich Medical School, University of East Anglia, Norwich, Norfolk NR4 7TJ, UK
(Submitted 18 October 2010 – Final revision received 16 August 2011 – Accepted 16 August 2011 – First published online 12 October 2011)
Abstract
Reducing the prevalence of fat-rich, energy-dense diets is a public health priority. The present parallel-designed randomised study
compared three interventions aimed to increase intakes of low-fat starchy foods and to reduce fat intakes among 589 individuals from
169 families in the Family Food and Health Project (FFHP). Intervention A was education only, intervention B provided ‘cook and eat’
sessions only, whereas intervention C included personalised goal setting, ‘cook and eat’ and education. Diet was assessed at baseline
(T0) and at 3 months (T1), 6 months (T2) and 18 months (T3) post-intervention. Retention rates were 75 % at T1, 63 % at T2 and 40 % at
T3. ANCOVA (baseline intake as covariate) was assessed between intervention differences at T1, T2 and T3. At T1, individuals in intervention
C consumed less fat (P¼0·02) and more total carbohydrate (P¼0·001), starch (P¼0·04) vitamin C (P¼0·002) and NSP (P¼0·01) than
those in intervention A. Whereas similar dietary intakes were reported across interventions at T2, participants in intervention C had less
energy-dense diets that contained more NSP and vitamin C at T3 than intervention A (P,0·0001, P¼0·002 and P¼0·01, respectively).
Across all intervention groups, the more socially deprived participants in the FFHP (n 119) consumed less fat (P¼0·01) and more total
carbohydrate (P¼0·02) at T2 than the least socially deprived (n 240). These data demonstrate the importance of personalised goal setting
to translate knowledge and practical cooking skills into healthier food choices, suggesting that low-fat starchy food-focused interventions
may be effective in reducing fat intake.
Key words: Starchy foods: Family-based interventions: Cooking skills: Social deprivation
It is widely recognised that dietary patterns that are
typified by energy-dense, fat-rich foods (often described as
a ‘Western diet’) are associated with an increased prevalence
of obesity(1,2), diabetes(3,4), CVD(5) and cancers at several
sites(6), and effective strategies to improve such dietary
patterns are a public health priority(5). The present UK
dietary target to reduce fat intake to no more than 35 %
of energy derived from food (%FE)(7) was established in
1984(8) and this target has been confirmed in a number of
subsequent UK government health initiatives(7,9). However,
food purchasing data from the UK National Food
Survey(10) and the Family Food 2008 report (based on the
2008 Expenditure and Food Survey data, UK) suggest that
habitual intakes of fat in the UK are resistant to change
and, if anything, have been increasing in recent years(11).
Although these indices of food purchasing should be
interpreted with caution, it seems that reaching the dietary
target for fat intake remains difficult for some UK
consumers.
For more than a decade(12), it has been suggested that
low-fat starchy foods such as bread, cereals, rice, pasta,
potatoes, legumes and pulses may be a suitable replacement
for energy-dense foods of low nutrient quality. These starchy
foods are often described as ‘complex carbohydrate-rich’
foods and some are ‘whole-grain-rich’ foods and recom-
mendations to eat more of these food groups continue to
be promoted(13–15). Despite this, evidence suggests that
consumers have mixed views about the role of such foods
in their diets(16). Compared with the recommendations, pre-
sent intakes of these foods are sub-optimal and, for example,
it has been reported recently that only 55 % of French
subjects meet specific targets for starchy food intake(17).
*Corresponding author: Professor J. C. Mathers, fax þ44 191 222 8943, email [email protected]
Abbreviations: %FE, percentage of food energy; %TE, percentage of energy derived from food and alcohol; ED, enumeration district; FFHP, Family Food
and Health Project; GLM, general linear ANCOVA model; SES, socioeconomic status; T0, baseline assessment; T1, 3 months post-intervention; T2, 6 months
post-intervention; T3, 18 months post-intervention.
British Journal of Nutrition (2012), 107, 1833–1844 doi:10.1017/S0007114511005101q The Authors 2011
British
Journal
ofNutrition
To date, relatively few studies have assessed explicitly the
effectiveness of interventions aimed at increasing intake of
low-fat starchy foods as a route to reduced intake of dietary
fat. Of those that have, studies have either been restricted
to obese/pre-obese individuals and those at increased risk of
CVD(18–20) or have focused on a particular type of low-fat
starchy food, e.g. breakfast cereals(21–23). Few studies have
used the family as a setting for low-fat starchy food/complex
carbohydrate dietary interventions(24). Although the available
evidence is limited, it has been shown that fat intake can be
reduced as a consequence of increasing intake of low-fat star-
chy foods/complex carbohydrates(21), and that the adoption
of such diets can result in significant improvements in body
mass(18,19,24,25) and biochemical markers of CVD risk(22,23).
In meta-analyses and systematic reviews of previous inter-
vention strategies, specific intervention components such as
family involvement, cooking skills and food-related activity,
peer-support and tailored goal setting have been shown to
facilitate dietary change(26–29). In particular, there is evidence
that family involvement is conducive to positive changes in
diet and other health constructs including body weight man-
agement(24,30–33). In addition, confidence in the ability to
prepare and cook healthy food is correlated positively with
purchasing of healthy foods (e.g. vegetables) in families(34),
consumption of vegetables in adults(35) and meeting dietary
targets (e.g. for fat and whole-grain intake) in young
adults(36). Interventions that have taught food preparation
and cooking skills have resulted in increased intakes of
healthy foods(37–39).
The Family Food and Health Project (FFHP) was designed
to determine which combinations of key facilitators of dietary
change (i.e. information based food-related activities, cooking
skills or personalised goal setting) would affect the translation
of a message to increase the intake of low-fat starchy
foods into improvement in dietary behaviours and, in parti-
cular, in reductions in fat intake. To this end, we conducted
a randomised, parallel-group design intervention study in
which we compared the efficacy of three dietary intervention
strategies that differed in the amount of education and cook-
ing skill provision and the use of a personalised goal setting
framework. The FFHP also examined the sustainability of
changes in dietary behaviours.
Experimental methods
Study participants
The data presented in the present paper relate to the indi-
viduals in the families that participated in the FFHP. Between
1998 and 2000, 169 families with a mean dietary intake at
screening, who did not meet the targets of the study
(#29 %FE from starch and/or $35 %FE from fat) and who
were in the middle three quintiles (quintiles 2–4) of relative
socioeconomic deprivation, based on unemployment, car
ownership, owner occupation and overcrowding in given post-
code areas (Townsend Deprivation Index(40)) were recruited
to one of three interventions promoting increased consump-
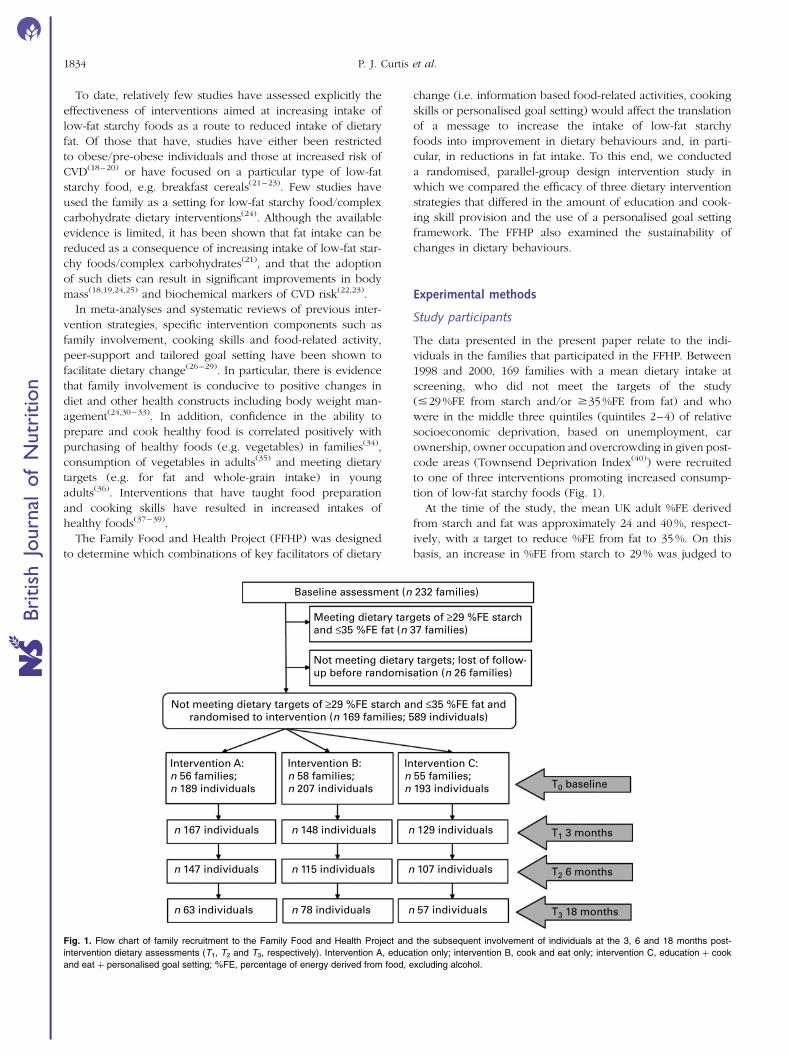
tion of low-fat starchy foods (Fig. 1).
At the time of the study, the mean UK adult %FE derived
from starch and fat was approximately 24 and 40 %, respect-
ively, with a target to reduce %FE from fat to 35 %. On this
basis, an increase in %FE from starch to 29 % was judged to
Baseline assessment (n 232 families)
Meeting dietary targets of ≥29 %FE starchand ≤35 %FE fat (n 37 families)
Not meeting dietary targets of ≥29 %FE starch and ≤35 %FE fat andrandomised to intervention (n 169 families; 589 individuals)
Intervention A:n 56 families;n 189 individuals
Intervention B:n 58 families;n 207 individuals
Intervention C:n 55 families;n 193 individuals T0 baseline
T1 3 months
T2 6 months
T3 18 months
n 167 individuals n 148 individuals n 129 individuals
n 147 individuals n 115 individuals n 107 individuals
n 63 individuals n 78 individuals n 57 individuals
Not meeting dietary targets; lost of follow-up before randomisation (n 26 families)
Fig. 1. Flow chart of family recruitment to the Family Food and Health Project and the subsequent involvement of individuals at the 3, 6 and 18 months post-
intervention dietary assessments (T1, T2 and T3, respectively). Intervention A, education only; intervention B, cook and eat only; intervention C, education þ cook
and eat þ personalised goal setting; %FE, percentage of energy derived from food, excluding alcohol.
P. J. Curtis et al.1834
British
Journal
ofNutrition
be an important change. In the absence of data on variance
of change in %FE from starch or fat following intervention,
based on available data on inter-person variation in %FE
from fat(41), fifty individuals would be required to detect a
change of 3·5 % units in energy from starch (a ¼ 0·05,
power 90 %). We anticipated that this would provide the
power to detect a reciprocal change in %FE from fat.
Families were defined as groups of cohabiting persons
containing any number of adults and at least one person
under the age of 16 years. Local Health Authority National
Health Service (NHS) registers were used to identify 2977 pro-
spective families (addresses identified to have a child under
the age of 16 years) who were sent a study information
pack by the Local Health Authority, which was labelled ‘for
the attention of the parent/guardian’ of the named person
under 16 years of age residing in the household. The infor-
mation pack included a participant information sheet, a
contact sheet for families to register an interest in the trial
and a stamped addressed envelope (addressed to the research
team). Recruitment took place in six phases, and was
restricted to targeted areas of Newcastle upon Tyne, UK,
which had local community venues that were suitable for
hosting the interventions. Families received no financial
incentive to participate in the study. A total of 475 (16 %
response) of households mailed responded positively (4 %
gave a negative response), and of these 335 families were con-
tacted to discuss the study further. Of these, 232 had a baseline
dietary assessment, thirty-seven families met the dietary target
of $29 %FE from starch and #35 %FE from fat and were
excluded, twenty-six families were lost to follow-up before
randomisation to treatment and the remaining 169
proceeded to the intervention (Fig. 1). Families with individual
prescribed high-fat diets (n 2 children) were excluded; a total
of 589 individuals participated per protocol in the study
(Table 1). Baseline data were collected at T0, with outcome
data collected at 3 months (T1), 6 months (T2) and 18 months
(T3) after the end of the intervention. The dietary data from
individuals reporting less than 3 d at any given time point
(T0, T1, T2 or T3), were excluded from analysis at that data asse-
ssment point (at T0, T1, T2 and T3, the number of individuals
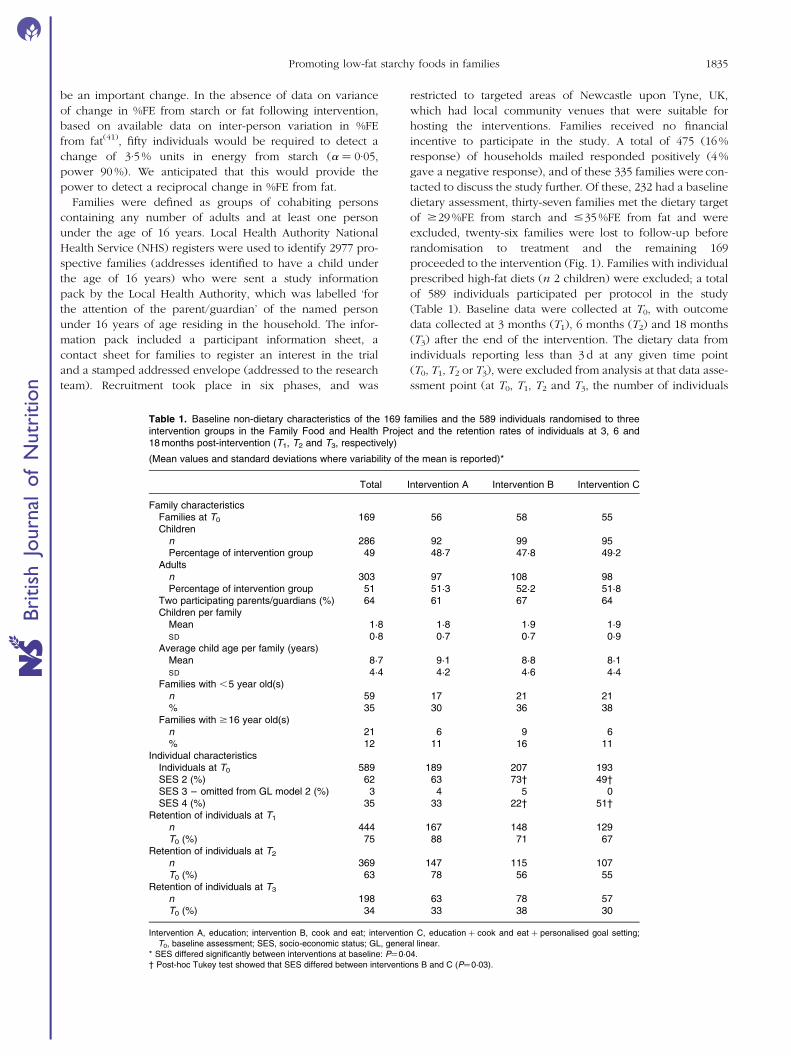
Table 1. Baseline non-dietary characteristics of the 169 families and the 589 individuals randomised to threeintervention groups in the Family Food and Health Project and the retention rates of individuals at 3, 6 and18 months post-intervention (T1, T2 and T3, respectively)
(Mean values and standard deviations where variability of the mean is reported)*
Total Intervention A Intervention B Intervention C
Family characteristicsFamilies at T0 169 56 58 55Children
n 286 92 99 95Percentage of intervention group 49 48·7 47·8 49·2
Adultsn 303 97 108 98Percentage of intervention group 51 51·3 52·2 51·8
Two participating parents/guardians (%) 64 61 67 64Children per family
Mean 1·8 1·8 1·9 1·9SD 0·8 0·7 0·7 0·9
Average child age per family (years)Mean 8·7 9·1 8·8 8·1SD 4·4 4·2 4·6 4·4
Families with ,5 year old(s)n 59 17 21 21% 35 30 36 38
Families with $16 year old(s)n 21 6 9 6% 12 11 16 11
Individual characteristicsIndividuals at T0 589 189 207 193SES 2 (%) 62 63 73† 49†SES 3 – omitted from GL model 2 (%) 3 4 5 0SES 4 (%) 35 33 22† 51†
Retention of individuals at T1
n 444 167 148 129T0 (%) 75 88 71 67
Retention of individuals at T2
n 369 147 115 107T0 (%) 63 78 56 55
Retention of individuals at T3
n 198 63 78 57T0 (%) 34 33 38 30
Intervention A, education; intervention B, cook and eat; intervention C, education þ cook and eat þ personalised goal setting;T0, baseline assessment; SES, socio-economic status; GL, general linear.
* SES differed significantly between interventions at baseline: P¼0·04.† Post-hoc Tukey test showed that SES differed between interventions B and C (P¼0·03).
Promoting low-fat starchy foods in families 1835
British
Journal
ofNutrition
with incomplete dietary records was 1, 11, 7 and 3, respectively).
Collection of outcome data at T3 included families recruited
in phases 2–6 only, as funding for this additional work was
secured after the due date for the T3 assessment for those
recruited in phase 1. The present study was conducted accord-
ing to the guidelines laid down in the Declaration of Helsinki,
and all procedures involving human subjects were approved
by the Newcastle and North Tyneside Joint Ethics Committee
and the Health Authorities Research Committee. Written
informed consent was obtained from all subjects.
The interventions
Participating families were randomised by enumeration district
(ED; a group of approximately 150 adjacent postal addresses).
Briefly, participating families were first grouped by ED, and
then three groups were formed that (1) consisted of contiguous
ED and (ii) contained approximately equal numbers of families.
The three groups were then randomly allocated to the three
intervention strategies (interventions A–C). Allocation by ED
was chosen to minimise potential ‘contamination’ arising from
close neighbours being allocated to different interventions.
All three interventions aimed to promote increased intake of
low-fat starchy foods by both broadening the range of low-fat
starchy foods consumed and increasing the portion sizes of
these foods. At the beginning of the study (T0), each family
received a selection of low-fat starchy foods to trial at home
and a recipe file with low-fat starchy meal/snack ideas.
The interventions were led by state-registered dietitians and
were delivered using three strategies that differed in intensity
(i.e. the amount of contact time with dietitians) and scope (i.e.
the range of behavioural strategies adopted in the interven-
tion). The three interventions included (1) a one-off ‘edu-
cation-based’ intervention (intervention A); (2) a ‘cook and
eat’ cooking skills-based intervention (intervention B); and
(3) an ‘education þ cook and eat þ personalised goal setting’
intervention (intervention C).
Intervention A was centred on a health fayre, which
was held in a local community centre and to which all mem-
bers of the family were invited. Intervention A adopted an
attitude-, awareness- and knowledge-centred approach (deliv-
ered during a 2 h session) that aimed to increase awareness of
‘low-fat starchy foods’, identified target portion sizes for men,
women and children and emphasised on the potential health
benefits of consuming more of these foods. To appeal to all
family members, the health fayre included food tasting,
food-related games and food challenges.
Intervention B (based on the ‘cook and eat’ approach) was
skills-centred and was delivered in community centres.
Families allocated to intervention B were offered four ‘cook
and eat’ sessions each lasting for 2 h (over 6 weeks), which
focused on the meal planning, food preparation and cooking
skills required to incorporate more low-fat starchy foods into
familiar meals and snacks. In addition, families were encour-
aged to try less familiar low-fat starchy foods during the
‘cook and eat’ sessions. Up to ten families were facilitated in
each session and the cooking ingredients were provided at
no cost. All family members were encouraged to participate
in the food preparation and cooking, and each family was
encouraged to prepare a different meal. A creche facility was
provided at the venue to accommodate those children unable
to participate in the cooking sessions. At the end of each
session, the foods prepared by all families were shared and
families were encouraged to discuss their cooking experience
and their preferences of the meals prepared. This approach
was adopted to encourage group support from other families
as well as from the study dietitians. In addition, a 2 h ‘children-
only’ cooking session was also provided as part of inter-
vention B; this was offered to all children aged at least 8 years.
Families allocated to intervention C received both the health
fayre and ‘cook and eat’ sessions offered to participants in
interventions A and B, respectively, and, in addition, were
offered personalised goal setting. The latter was delivered by
the study dietitians and was based on stages of change
models(42). Briefly, the process consisted of negotiation and
agreement of three personalised dietary goals (consistent
with the project aim of increasing low-fat starchy foods) at
T0 followed by monitoring, evaluation of progress and nego-
tiation of further dietary goals, as original goals were achieved
at two subsequent personalised face-to-face meetings with a
research dietitian.
Dietary intake data
An in-house devised 3 d estimated food diary was used to
report the dietary intakes of individuals at four time points,
namely, T0, T1, T2 and T3(43). Dietary reporting days ran
sequentially and included two weekdays and one weekend
day. For each food item consumed, a full description was
recorded (time of consumption, brand name, relevant packa-
ging information (e.g. weight and nutrient composition)) and
the participants were asked to include an approximation of
the quantity of each food consumed in household measures,
e.g. slice, teaspoon or cup. Leftovers were excluded from
the reporting process. The amount of food consumed was
quantified at the interview principally by using the photo-
graphic atlas of food portion sizes(44) and from weights ident-
ified on product packaging. Where this approach was not
applicable, a standard typical portion weight(45) was assigned.
Energy and nutrient intakes were calculated using the UK
food composition tables that were available at the time of
the study. These were the supplements to the McCance and
Widdowson standard UK food tables (Royal Society of Chem-
istry 1988–96(46–54)) and the fifth edition(55). Where necessary,
additional food composition data were obtained from Ministry
of Agriculture, Fisheries and Food surveillance information
sheets(56–63) and manufacturers’ data. We are aware of the
limitations of the dietary reporting approach used in the pre-
sent study and the potential benefit of having biomarkers as
independent indices of food intake(64,65). However, there are
no validated biomarkers suitable for measuring %FE from
fat or intakes of starch (the primary foci of the present study).
Total energy intake (%TE; including energy derived
from alcohol) and food energy intake (excluding energy
derived from alcohol) were calculated and the intakes of
macronutrients were expressed as a proportion of food
P. J. Curtis et al.1836
British
Journal
ofNutrition
energy (%FE). The present format was chosen to aid com-
parisons between individuals who differed in age and sex
(both characteristics known to influence absolute dietary
intakes). As indicators of dietary quality, the intakes of NSP
and selected micronutrients (vitamin C, Fe and Ca) were
calculated and intakes expressed in g (for NSP) or mg (for
micronutrients) per MJ of food energy consumed. Dietary
energy density was calculated and expressed as kJ/g of
food. Milk and milk-based drinks were included in food for
this purpose, as milk was a constituent part of commonly
consumed meals, e.g. breakfast, in mashed vegetables and
as a component of dairy-based sauces. Milk-based beverages
included in the analysis included milk, milkshakes and hot
chocolate. Beverages excluded from the analysis include all
alcohol-based beverages, fruit juices, soft drinks, water, tea
and coffee. The dietary data reported at T0, T1, T2 and T3
include data only for those individuals who completed the
3 d dietary record per protocol; partial dietary records (i.e. 1
or 2 d records) were excluded.
Statistical analyses
Differences in the dietary and non-dietary characteristics of
the three intervention groups at T0 were determined using
one-way ANOVA with post hoc Tukey’s multiple comparison
testing. The principal analysis of intervention effect on sub-
sequent nutrient intake (at T1, T2 and T3) was undertaken
using a univariate general linear ANCOVA model (GLM),
with T0 values used as a covariate. Post hoc multiple pairwise
comparisons of the GLM data were performed using the
Bonferroni test. The data presented (Tables 2 and 3) for T1,
T2 and T3 intake are the estimated marginal mean values
and standard errors derived from the primary GLM of interven-
tion effect (GLM1; fixed factor, intervention group; covariates,
socioeconomic status (SES), age, sex, phase of recruitment,
parental participation and T0 dietary intake). In Tables 2
and 3, T0 intake refers to the mean and standard error of the
mean derived from baseline ANOVA analysis.
Two further GLM models were conducted as secondary
analyses. GLM2 (fixed factor, SES; covariates, intervention
group, age, sex, phase of recruitment, parental participation
and T0 dietary intake) was conducted to establish whether
the significant difference in SES, observed between inter-
vention groups at baseline, influenced intervention effective-
ness. Of note, in GLM2, quintile 3 (3%) the seventeen
subjects in SES were omitted from the analysis due to under-
representation in the model (Table 1). GLM3 (fixed factor,
parental participation; covariates, intervention group, SES,
age, phase of recruitment and T0 dietary intake) was con-
ducted to identify whether the level of familial involvement
per se, across the three dietary interventions, could have
influenced the degree of dietary change. For GLM3, individ-
uals were categorised according to the number of parents/
guardians who participated in the project (i.e. either one
or two parents). Parents/guardians were considered to
be ‘participating’ if they consented to dietary assessment.
The individuals assigned to the grouping of one ‘participating’
parent included those with one parent residing in the
household and families where only one of the resident parents
was willing to participate in the study. Data were analysed
using SPSS 16.0 for Windows statistical analysis software
(SPSS Inc., Chicago, IL, USA) and probability levels #0·05
were considered significant.
Results
Baseline data
Following screening, 169 families (including 589 individuals
of all ages) were randomised to one of three dietary interven-
tions; 63 % of families (n 106 families, containing 62 % of
individuals in the study) were from the more affluent SES
quintile (SES2) compared with 34 % of families (n 58 families,
containing 35 % of individuals in the study) from the less
affluent SES quintile (SES4). At T0, the intervention groups
were similar (P.0·05) with respect to mean child age per
family, the number of children per family and the number
of children aged under 5 or 16 years and over (Table 1).
However, assessment of socioeconomic deprivation showed
that despite randomisation to intervention treatment, the
intervention groups differed at baseline (ANOVA, P¼0·04).
Tukey’s post hoc testing showed that a greater proportion
of the most socially deprived individuals were randomised
to intervention C (accounting for 51 % of the ‘education þ
cook and eat þ personalised goal setting’ group) compared
with intervention B (accounting for 22 % of the ‘cook and
eat’ group; P¼0·03). Intakes of energy (MJ), alcohol (%TE)
and macronutrients (as a %FE) were similar at baseline
(Table 2), but individuals in intervention B consumed more
vitamin C than those in interventions C and A (‘education
only’ group; P,0·001 and P¼0·02, respectively) and had a
less energy-dense diet (kJ/g) than individuals in intervention
C (P¼0·003; Table 3).
Primary analyses of effects of the interventions on dietaryoutcomes
Our primary analysis aimed to test the hypothesis that the
nature (and intensity) of family-based interventions, aimed at
increasing intake of low-fat starchy foods, differed in their
effectiveness in eliciting change in dietary behaviour. To
assess intervention efficacy, estimates of dietary intake were
collected at T1, T2 and T3; a total of 444 individuals completed
T1, 369 completed T2 and 198 completed T3 (Table 1).
Starch, fat and total carbohydrate intake
After adjusting the data for covariates in GLM1, dietary intakes
at T1 differed by intervention group for fat (P¼0·02), carbo-
hydrate (P,0·01) and starch (P¼0·03; all expressed as a
%FE). In each case, Bonferroni analysis showed that indivi-
duals randomised to intervention C consumed less fat
(P¼0·02) and more total carbohydrate (P¼0·001) and starch
(P¼0·04) than those in intervention A (Table 2). Although
the between-intervention difference in fat was not sustained at
subsequent data collections (T2 and T3), there were significant
Promoting low-fat starchy foods in families 1837
British
Journal
ofNutrition
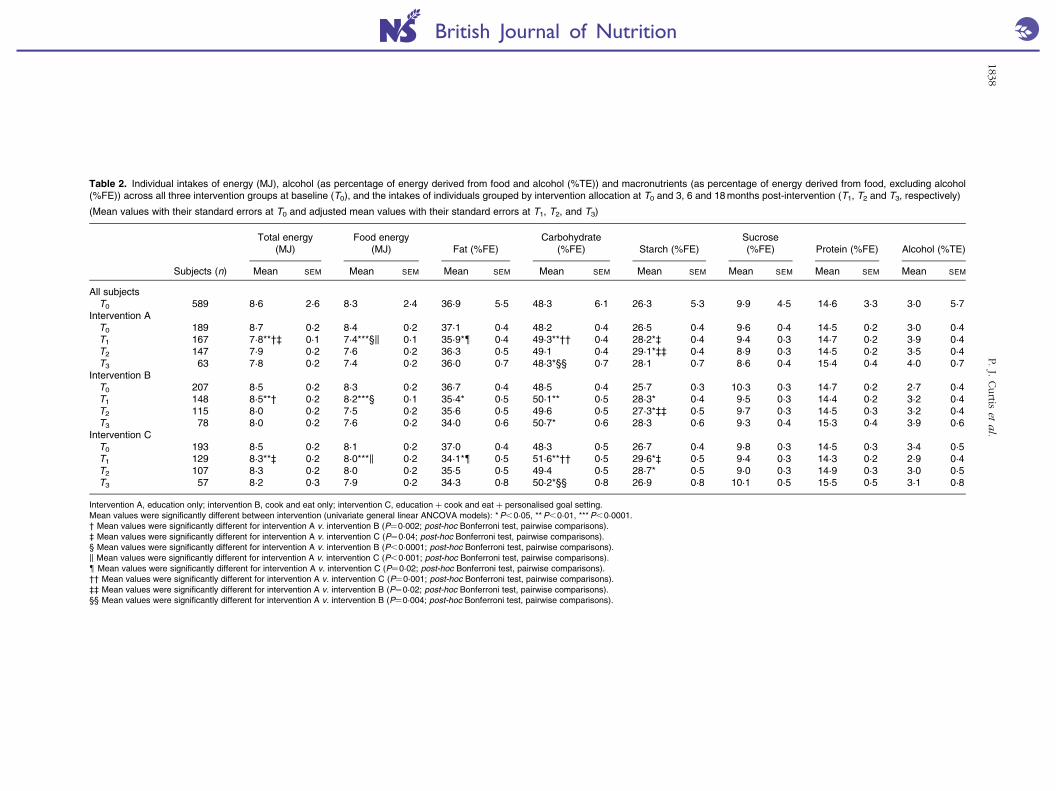
Table 2. Individual intakes of energy (MJ), alcohol (as percentage of energy derived from food and alcohol (%TE)) and macronutrients (as percentage of energy derived from food, excluding alcohol(%FE)) across all three intervention groups at baseline (T0), and the intakes of individuals grouped by intervention allocation at T0 and 3, 6 and 18 months post-intervention (T1, T2 and T3, respectively)
(Mean values with their standard errors at T0 and adjusted mean values with their standard errors at T1, T2, and T3)
Total energy(MJ)
Food energy(MJ) Fat (%FE)
Carbohydrate(%FE) Starch (%FE)
Sucrose(%FE) Protein (%FE) Alcohol (%TE)
Subjects (n) Mean SEM Mean SEM Mean SEM Mean SEM Mean SEM Mean SEM Mean SEM Mean SEM
All subjectsT0 589 8·6 2·6 8·3 2·4 36·9 5·5 48·3 6·1 26·3 5·3 9·9 4·5 14·6 3·3 3·0 5·7
Intervention AT0 189 8·7 0·2 8·4 0·2 37·1 0·4 48·2 0·4 26·5 0·4 9·6 0·4 14·5 0·2 3·0 0·4T1 167 7·8**†‡ 0·1 7·4***§k 0·1 35·9*{ 0·4 49·3**†† 0·4 28·2*‡ 0·4 9·4 0·3 14·7 0·2 3·9 0·4T2 147 7·9 0·2 7·6 0·2 36·3 0·5 49·1 0·4 29·1*‡‡ 0·4 8·9 0·3 14·5 0·2 3·5 0·4T3 63 7·8 0·2 7·4 0·2 36·0 0·7 48·3*§§ 0·7 28·1 0·7 8·6 0·4 15·4 0·4 4·0 0·7
Intervention BT0 207 8·5 0·2 8·3 0·2 36·7 0·4 48·5 0·4 25·7 0·3 10·3 0·3 14·7 0·2 2·7 0·4T1 148 8·5**† 0·2 8·2***§ 0·1 35·4* 0·5 50·1** 0·5 28·3* 0·4 9·5 0·3 14·4 0·2 3·2 0·4T2 115 8·0 0·2 7·5 0·2 35·6 0·5 49·6 0·5 27·3*‡‡ 0·5 9·7 0·3 14·5 0·3 3·2 0·4T3 78 8·0 0·2 7·6 0·2 34·0 0·6 50·7* 0·6 28·3 0·6 9·3 0·4 15·3 0·4 3·9 0·6
Intervention CT0 193 8·5 0·2 8·1 0·2 37·0 0·4 48·3 0·5 26·7 0·4 9·8 0·3 14·5 0·3 3·4 0·5T1 129 8·3**‡ 0·2 8·0***k 0·2 34·1*{ 0·5 51·6**†† 0·5 29·6*‡ 0·5 9·4 0·3 14·3 0·2 2·9 0·4T2 107 8·3 0·2 8·0 0·2 35·5 0·5 49·4 0·5 28·7* 0·5 9·0 0·3 14·9 0·3 3·0 0·5T3 57 8·2 0·3 7·9 0·2 34·3 0·8 50·2*§§ 0·8 26·9 0·8 10·1 0·5 15·5 0·5 3·1 0·8
Intervention A, education only; intervention B, cook and eat only; intervention C, education þ cook and eat þ personalised goal setting.Mean values were significantly different between intervention (univariate general linear ANCOVA models): *P,0·05, **P,0·01, ***P,0·0001.† Mean values were significantly different for intervention A v. intervention B (P¼0·002; post-hoc Bonferroni test, pairwise comparisons).‡ Mean values were significantly different for intervention A v. intervention C (P¼0·04; post-hoc Bonferroni test, pairwise comparisons).§ Mean values were significantly different for intervention A v. intervention B (P,0·0001; post-hoc Bonferroni test, pairwise comparisons).k Mean values were significantly different for intervention A v. intervention C (P,0·001; post-hoc Bonferroni test, pairwise comparisons).{ Mean values were significantly different for intervention A v. intervention C (P¼0·02; post-hoc Bonferroni test, pairwise comparisons).†† Mean values were significantly different for intervention A v. intervention C (P¼0·001; post-hoc Bonferroni test, pairwise comparisons).‡‡ Mean values were significantly different for intervention A v. intervention B (P¼0·02; post-hoc Bonferroni test, pairwise comparisons).§§ Mean values were significantly different for intervention A v. intervention B (P¼0·004; post-hoc Bonferroni test, pairwise comparisons).
P.J.
Curtis
eta
l.1838
British Journal of Nutrition
inter-intervention differences in starch intake at T2 (P¼0·02)
and carbohydrate intake at T3 (P¼0·04). Those individuals in
intervention A consumed more starch than individuals
in intervention B at T2 (Bonferroni test; P¼0·04), whereas
at T3, the individuals in intervention B had higher intakes of
total carbohydrate (P¼0·04) than those in intervention A
(Table 2).
Micronutrient and energy intake (food energy, total energyand energy density)
After adjusting the data for covariates in GLM1, the intakes of
vitamin C (mg/MJ) and NSP (g/MJ) at T1 differed between
intervention groups (both P,0·01), with intervention C con-
suming more vitamin C than intervention A (P¼0·002) and
also more NSP than both interventions A and B (P¼0·01
and P,0·0001, respectively; Table 3). At T1, total energy and
food energy intakes differed between intervention groups
(P,0·01 and P,0·0001, respectively). In each instance, indi-
viduals in intervention A reported lower intakes of total
energy and food energy than those in interventions B and C
(total energy, P¼0·002 and P¼0·04; food energy, P,0·001
and P,0·001 for intervention A v. interventions B and C,
respectively). At T2, there were no between-intervention
differences for micronutrients, energy intakes (total energy
and food energy) or energy density.
At T3, there were significant between-intervention differ-
ences for intakes of NSP (g/MJ; P,0·01), vitamin C
(P¼0·04) and Ca (P¼0·001; expressed in mg/MJ) and for
energy density of food consumed (g/kJ; P,0·0001). Post hoc
testing showed that individuals in intervention C consumed
more NSP (P¼0·002) and vitamin C (P¼0·01) than those in
intervention A, and that the diets of those in interventions
containing a ‘cook and eat’ component (interventions B and
C) were less energy dense than those for individuals in inter-
vention A (both P,0·0001). In addition, at T3, participants
in intervention B consumed more Ca than those in both
interventions A and C (P¼0·004 and P¼0·001, respectively).
Secondary analyses of factors potentially influencingintervention effects
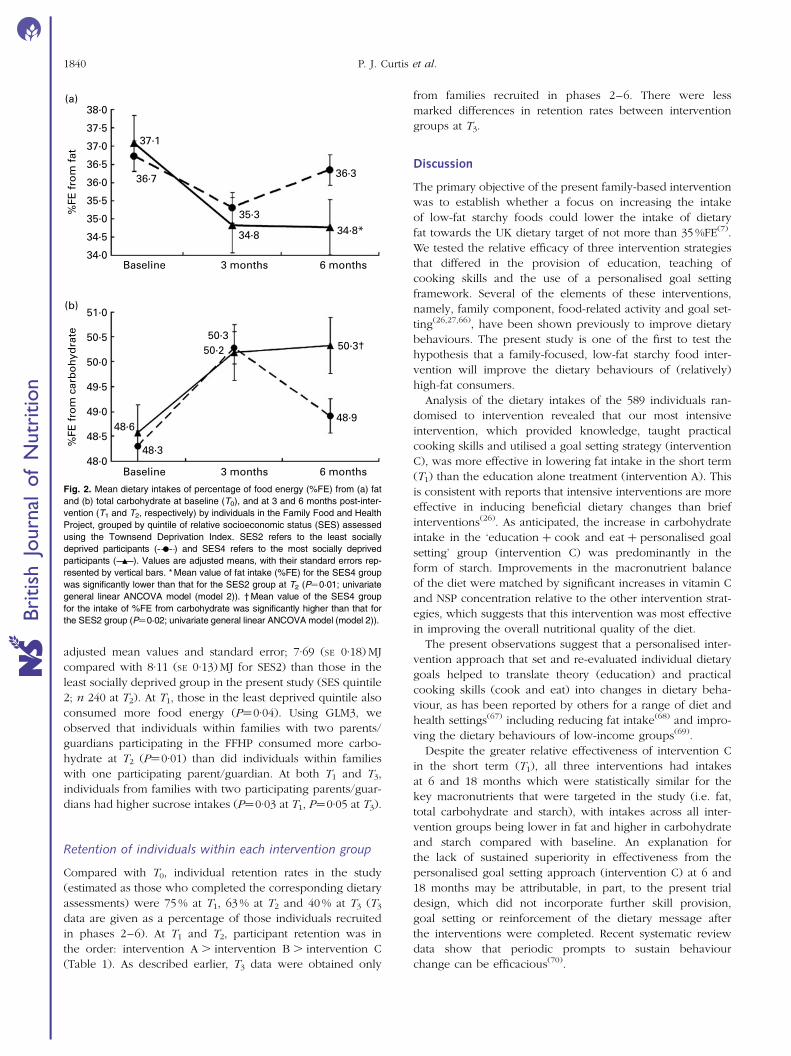
Outcomes from GLM2 demonstrated that individuals in the
most socially deprived group in the present study (SES quintile
4; n 119 at T2) consumed less fat (P¼0·01; adjusted mean
values and their standard error; 34·8 (SE 0·51) %FE compared
with 36·3 (SE 0·35) %FE for SES2 (Fig. 2(a)), more carbohydrate
(P¼0·02; adjusted mean values and standard error; 50·3 (SE
0·50) %FE compared with 48·9 (SE 0·35) %FE for SES2
(Fig. 2(b)), and less food energy (P¼0·01; adjusted mean
values and standard error; 7·32 (SE 0·17) MJ compared with
7·85 (SE 0·11) MJ for SES2) and total energy intake (P¼0·05;
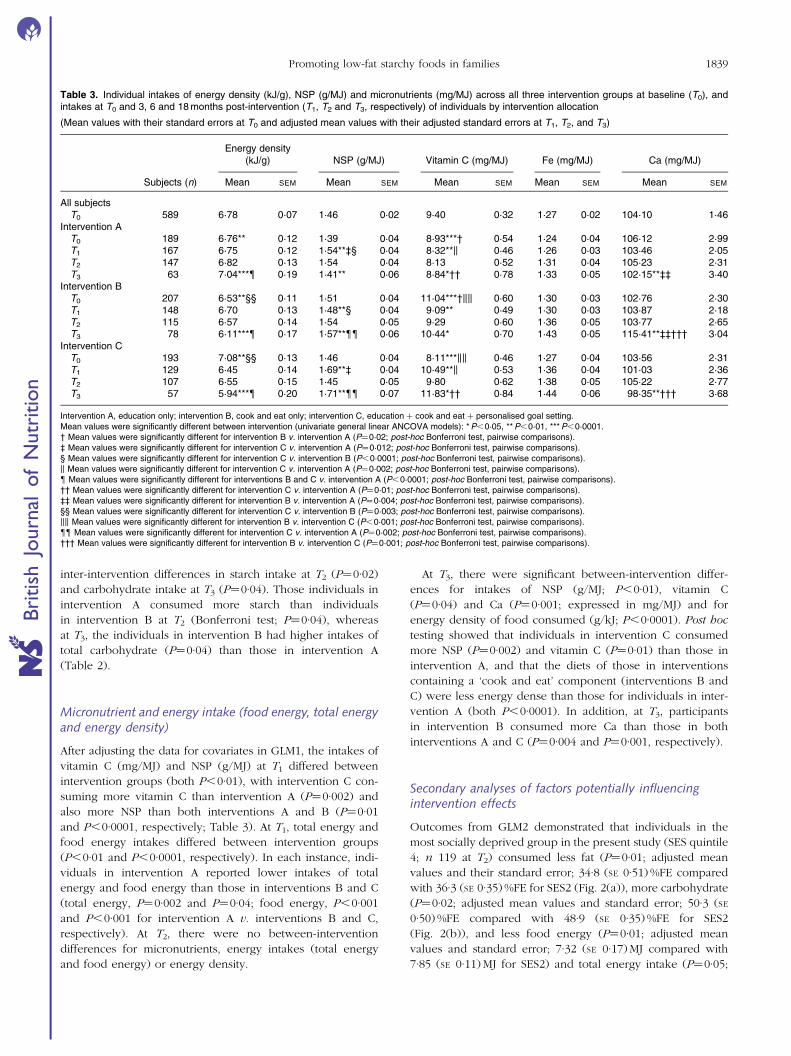
Table 3. Individual intakes of energy density (kJ/g), NSP (g/MJ) and micronutrients (mg/MJ) across all three intervention groups at baseline (T0), andintakes at T0 and 3, 6 and 18 months post-intervention (T1, T2 and T3, respectively) of individuals by intervention allocation
(Mean values with their standard errors at T0 and adjusted mean values with their adjusted standard errors at T1, T2, and T3)
Energy density(kJ/g) NSP (g/MJ) Vitamin C (mg/MJ) Fe (mg/MJ) Ca (mg/MJ)
Subjects (n) Mean SEM Mean SEM Mean SEM Mean SEM Mean SEM
All subjectsT0 589 6·78 0·07 1·46 0·02 9·40 0·32 1·27 0·02 104·10 1·46
Intervention AT0 189 6·76** 0·12 1·39 0·04 8·93***† 0·54 1·24 0·04 106·12 2·99T1 167 6·75 0·12 1·54**‡§ 0·04 8·32**k 0·46 1·26 0·03 103·46 2·05T2 147 6·82 0·13 1·54 0·04 8·13 0·52 1·31 0·04 105·23 2·31T3 63 7·04***{ 0·19 1·41** 0·06 8·84*†† 0·78 1·33 0·05 102·15**‡‡ 3·40
Intervention BT0 207 6·53**§§ 0·11 1·51 0·04 11·04***†kk 0·60 1·30 0·03 102·76 2·30T1 148 6·70 0·13 1·48**§ 0·04 9·09** 0·49 1·30 0·03 103·87 2·18T2 115 6·57 0·14 1·54 0·05 9·29 0·60 1·36 0·05 103·77 2·65T3 78 6·11***{ 0·17 1·57**{{ 0·06 10·44* 0·70 1·43 0·05 115·41**‡‡††† 3·04
Intervention CT0 193 7·08**§§ 0·13 1·46 0·04 8·11***kk 0·46 1·27 0·04 103·56 2·31T1 129 6·45 0·14 1·69**‡ 0·04 10·49**k 0·53 1·36 0·04 101·03 2·36T2 107 6·55 0·15 1·45 0·05 9·80 0·62 1·38 0·05 105·22 2·77T3 57 5·94***{ 0·20 1·71**{{ 0·07 11·83*†† 0·84 1·44 0·06 98·35**††† 3·68
Intervention A, education only; intervention B, cook and eat only; intervention C, education þ cook and eat þ personalised goal setting.Mean values were significantly different between intervention (univariate general linear ANCOVA models): *P,0·05, **P,0·01, ***P,0·0001.† Mean values were significantly different for intervention B v. intervention A (P¼0·02; post-hoc Bonferroni test, pairwise comparisons).‡ Mean values were significantly different for intervention C v. intervention A (P¼0·012; post-hoc Bonferroni test, pairwise comparisons).§ Mean values were significantly different for intervention C v. intervention B (P,0·0001; post-hoc Bonferroni test, pairwise comparisons).k Mean values were significantly different for intervention C v. intervention A (P¼0·002; post-hoc Bonferroni test, pairwise comparisons).{ Mean values were significantly different for interventions B and C v. intervention A (P,0·0001; post-hoc Bonferroni test, pairwise comparisons).†† Mean values were significantly different for intervention C v. intervention A (P¼0·01; post-hoc Bonferroni test, pairwise comparisons).‡‡ Mean values were significantly different for intervention B v. intervention A (P¼0·004; post-hoc Bonferroni test, pairwise comparisons).§§ Mean values were significantly different for intervention C v. intervention B (P¼0·003; post-hoc Bonferroni test, pairwise comparisons).kk Mean values were significantly different for intervention B v. intervention C (P,0·001; post-hoc Bonferroni test, pairwise comparisons).{{ Mean values were significantly different for intervention C v. intervention A (P¼0·002; post-hoc Bonferroni test, pairwise comparisons).††† Mean values were significantly different for intervention B v. intervention C (P¼0·001; post-hoc Bonferroni test, pairwise comparisons).
Promoting low-fat starchy foods in families 1839
British
Journal
ofNutrition
adjusted mean values and standard error; 7·69 (SE 0·18) MJ
compared with 8·11 (SE 0·13) MJ for SES2) than those in the
least socially deprived group in the present study (SES quintile
2; n 240 at T2). At T1, those in the least deprived quintile also
consumed more food energy (P¼0·04). Using GLM3, we
observed that individuals within families with two parents/
guardians participating in the FFHP consumed more carbo-
hydrate at T2 (P¼0·01) than did individuals within families
with one participating parent/guardian. At both T1 and T3,
individuals from families with two participating parents/guar-
dians had higher sucrose intakes (P¼0·03 at T1, P¼0·05 at T3).
Retention of individuals within each intervention group
Compared with T0, individual retention rates in the study
(estimated as those who completed the corresponding dietary
assessments) were 75 % at T1, 63 % at T2 and 40 % at T3 (T3
data are given as a percentage of those individuals recruited
in phases 2–6). At T1 and T2, participant retention was in
the order: intervention A . intervention B . intervention C
(Table 1). As described earlier, T3 data were obtained only
from families recruited in phases 2–6. There were less
marked differences in retention rates between intervention
groups at T3.
Discussion
The primary objective of the present family-based intervention
was to establish whether a focus on increasing the intake
of low-fat starchy foods could lower the intake of dietary
fat towards the UK dietary target of not more than 35 %FE(7).
We tested the relative efficacy of three intervention strategies
that differed in the provision of education, teaching of
cooking skills and the use of a personalised goal setting
framework. Several of the elements of these interventions,
namely, family component, food-related activity and goal set-
ting(26,27,66), have been shown previously to improve dietary
behaviours. The present study is one of the first to test the
hypothesis that a family-focused, low-fat starchy food inter-
vention will improve the dietary behaviours of (relatively)
high-fat consumers.
Analysis of the dietary intakes of the 589 individuals ran-
domised to intervention revealed that our most intensive
intervention, which provided knowledge, taught practical
cooking skills and utilised a goal setting strategy (intervention
C), was more effective in lowering fat intake in the short term
(T1) than the education alone treatment (intervention A). This
is consistent with reports that intensive interventions are more
effective in inducing beneficial dietary changes than brief
interventions(26). As anticipated, the increase in carbohydrate
intake in the ‘education þ cook and eat þ personalised goal
setting’ group (intervention C) was predominantly in the
form of starch. Improvements in the macronutrient balance
of the diet were matched by significant increases in vitamin C
and NSP concentration relative to the other intervention strat-
egies, which suggests that this intervention was most effective
in improving the overall nutritional quality of the diet.
The present observations suggest that a personalised inter-
vention approach that set and re-evaluated individual dietary
goals helped to translate theory (education) and practical
cooking skills (cook and eat) into changes in dietary beha-
viour, as has been reported by others for a range of diet and
health settings(67) including reducing fat intake(68) and impro-
ving the dietary behaviours of low-income groups(69).
Despite the greater relative effectiveness of intervention C
in the short term (T1), all three interventions had intakes
at 6 and 18 months which were statistically similar for the
key macronutrients that were targeted in the study (i.e. fat,
total carbohydrate and starch), with intakes across all inter-
vention groups being lower in fat and higher in carbohydrate
and starch compared with baseline. An explanation for
the lack of sustained superiority in effectiveness from the
personalised goal setting approach (intervention C) at 6 and
18 months may be attributable, in part, to the present trial
design, which did not incorporate further skill provision,
goal setting or reinforcement of the dietary message after
the interventions were completed. Recent systematic review
data show that periodic prompts to sustain behaviour
change can be efficacious(70).
38·0(a)
37·1
36·7
34·8
35·3
36·3
34·8*
%FE
fro
m f
at
37·5
37·0
36·5
36·0
35·5
35·0
34·0Baseline 3 months 6 months
34·5
51·0(b)
50·350·2
48·6
48·3
50·3†
48·9
%FE
fro
m c
arb
ohy
dra
te 50·5
50·0
49·5
49·0
48·0Baseline 3 months 6 months
48·5
Fig. 2. Mean dietary intakes of percentage of food energy (%FE) from (a) fat
and (b) total carbohydrate at baseline (T0), and at 3 and 6 months post-inter-
vention (T1 and T2, respectively) by individuals in the Family Food and Health
Project, grouped by quintile of relative socioeconomic status (SES) assessed
using the Townsend Deprivation Index. SES2 refers to the least socially
deprived participants ( ) and SES4 refers to the most socially deprived
participants ( ). Values are adjusted means, with their standard errors rep-
resented by vertical bars. * Mean value of fat intake (%FE) for the SES4 group
was significantly lower than that for the SES2 group at T2 (P¼0·01; univariate
general linear ANCOVA model (model 2)). † Mean value of the SES4 group
for the intake of %FE from carbohydrate was significantly higher than that for
the SES2 group (P¼0·02; univariate general linear ANCOVA model (model 2)).
P. J. Curtis et al.1840
British
Journal
ofNutrition
Of interest was the finding that, at T3, those exposed to
interventions B and C consumed diets that were significantly
lower in energy density than those exposed to intervention
A. The common characteristic of both interventions B and C
was the inclusion of a family-based cooking skills element
that encouraged participants to base meals and snacks on
low-fat starchy foods. A reduction in energy density in the
longer term is of particular consequence, as the diets of
adults and children that are less energy-dense correlate with
greater nutrient quality(71–75) and, conversely, more energy-
dense diets are associated with a higher risk of a cluster of
conditions including obesity(1,2), diabetes(3) and CVD(5).
Although not designed to investigate socioeconomic differ-
ences in response to the interventions, the FFHP recruited
participants by ED (as a surrogate for socioeconomic circum-
stances) and families were randomised to interventions within
ED. We observed that individuals residing in areas of greater
relative social deprivation exhibited more favourable dietary
changes in response to the dietary intervention (averaged
across all three interventions) than those residing in more
relatively affluent areas, and that this difference was
significant for measurements made T2. The mean reported
reductions in fat and increases in carbohydrate at the 3- and
6-month assessments (see Fig. 2) were greatest for the least
affluent participants in the present study (SES4) and met the
UK dietary recommendations(7,8) at both time points. The pre-
sent data are in contrast with the findings of a recent syste-
matic review of the socioeconomic determinants of dietary
interventions(76), which has shown that positive changes in
the intakes of fruits, vegetables and fat are associated with
greater affluence. In addition, a recent review of forty-two
school-based studies showed limited intervention effective-
ness in children from lower socioeconomic groups(77).
The widening gap in health provision and dietary beha-
viours associated with social inequalities(78–80) underscores
the importance of developing interventions that are effective
among the more disadvantaged. The present data are the
first to demonstrate that an intervention focused on increasing
the intake of low-fat starchy foods may be particularly effec-
tive in lower-income households in producing sustained
reductions in fat intakes. These findings require confirmation
in further intervention studies, targeted to households of
increased deprivation and designed specifically to test the
efficacy of a low-fat starchy food intervention.
We designed a family-based intervention because of the
evidence that such interventions produce favourable dietary
changes(27,66), that shared family meals are positively associated
with greater dietary quality(81,82) and that childhood food
choices ‘track’ into life-long eating habits(81,83). Additional
parental/guardian involvement has been shown to enhance
the effectiveness of breakfast eating interventions(82).
When considering the importance of the present findings,
a number of characteristics of the study design should be
noted. We undertook interventions in families because of
the potential beneficial changes with respect to shared food
shopping, food preparation and eating behaviours. However,
a consequence of this approach is that the dietary data from
individuals within these families, and to a lesser extent the
intervention groups, will exhibit some degree of inter-depen-
dency. Similarly, the present strategy of grouping families by
ED in an attempt to minimise ‘contamination’ of the inter-
vention message between neighbours may have resulted in
subjects in neighbouring families not being fully independent.
As such, the extrapolation of the present findings to other
settings should be approached with caution. Further, fewer
subjects dropped-out from intervention A than from the
more time-demanding, and arguably more successful, inter-
ventions C and B. As a result of this disparity in retention
rates, it could be speculated that interventions C and B may
have had greater representation of more highly motivated
subjects, and that the present per protocol assessment
may therefore favour the more demanding interventions. As
aforementioned, families in phase 1 of recruitment were not
able to participate in T3; this, along with attrition of phases
2–6 families at the 18-month assessment, means that the T3
results should be interpreted with some caution. Finally,
across the intervention groups, there was a pattern of lower
reported mean energy intake (although, less pronounced in
intervention C) at T1, T2 and T3 (compared with baseline)
and it is possible that this may indicate higher levels of dietary
underreporting as the study progressed.
Conclusions
In the present family-based study, we have shown that the
most intensive low-fat starchy food intervention, which
included education, cooking skills and goal setting com-
ponents, was the most effective in reducing fat intake and
improving diet quality in both the short and longer term.
Irrespective of intervention approach, the secondary analysis
of the present study suggested that individuals residing in
households with greater socioeconomic deprivation respon-
ded more favourably to the intervention in the medium
term than those from more affluent areas. Further studies,
which are explicitly designed to account for differences in
SES, are warranted to confirm whether this positive approach
to dietary change (encouraging greater intake of low-fat
starchy foods) may be useful in addressing social inequalities
in dietary intake.
Acknowledgements
The present study was commissioned by the Food Standards
Agency (project code, N09001). A. J. A. and J. C. M. designed
the study and obtained funding. P. J. C. conducted the
research and analysed the data. P. J. C., A. J. A. and J. C. M.
wrote the paper. All authors read and approved the final
manuscript. J. C. M. had primary responsibility for final con-
tent. The authors acknowledge the contributions made by
the study dietitians: Jane Loughridge, Clare Beard and Nigel
Denby; the study’s qualitative researcher: Anne Spendiff; the
quantitative data collector for 18-month assessments: Una
Tohill; the support team at the dietary intervention sessions:
Julie Hooper, Emma Foster, Emma Northover and Sara
Wynn; and are grateful for quality assurance assessment of
the dietary interventions performed by Moira Hill and for
Promoting low-fat starchy foods in families 1841
British
Journal
ofNutrition
the clerical assistance of Pauline Winship. In addition, they
also acknowledge the input of Simon Raybould for power cal-
culations and geographical mapping, Leslie Carlin for project
management assistance and the study’s steering committee;
Andrew Rugg-Gunn, Martin White, Chris Seal, Neil Niven,
Nigel Unwin, Rosie Stacey and John Matthews. Finally, the
authors thank the participants of the FFHP, Newcastle upon
Tyne, who gave their time to ensure the success of the project.
The authors declare no conflict of interest.
References
1. Rolls BJ (2010) Plenary Lecture 1: Dietary strategies for theprevention and treatment of obesity. Proc Nutr Soc 69,70–79.
2. Johnson L, Mander AP, Jones LR, et al. (2008) A prospectiveanalysis of dietary energy density at age 5 and 7 years andfatness at 9 years among UK children. Int J Obes (Lond)32, 586–593.
3. Wang J, Luben R, Khaw KT, et al. (2008) Dietary energy den-sity predicts the risk of incident type 2 diabetes: the Euro-pean Prospective Investigation of Cancer (EPIC)–NorfolkStudy. Diabetes Care 31, 2120–2125.
4. Erber E, Hopping BN, Grandinetti A, et al. (2010) Dietarypatterns and risk for diabetes: the multiethnic cohort. Dia-betes Care 33, 532–538.
5. World Health Organization (2003) Diet, Nutrition and thePrevention of Chronic Diseases. Joint WHO/FAO Expert Con-sultation. WHO Technical Report Series no. 916. Geneva:WHO.
6. World Cancer Research Fund/American Institute for CancerResearch (2007) Food, Nutrition, Physical Activity, and thePrevention of Cancer: A Global Perspective. Washington,DC: WCRF/AICR.
7. Department of Health (2005) Choosing a Better Diet: AFood and Health Action Plan. London: DOH Publications(Gateway reference 4618).
8. Department of Health and Social Security (1984) Report onHealth and Social Subjects. Vol. 28. Diet and CardiovascularDisease: Committee on Medical Aspects of Food Policy: Reportof the Panel on Diet in Relation to Cardiovascular Disease.London: The Stationery Office.
9. Department of Health (1992) The Health of the Nation:A Strategy for Health in England. London: The StationeryOffice.
10. Department for Environment, Food and Rural Affairs(2004) National Food Survey, 2000. London: Her Majesty’sStationery Office (series no. 4512).
11. Department for Environment, Food and Rural Affairs (2010)Family Food. A Report on the 2008 Family Food Moduleof the Living Costs and Food Survey. National StatisticsPublication by DEFRA. London: The Stationery Office.http://www.defra.gov.uk/statistics/files/defra-stats-food-family-annual-2008.pdf
12. Department of Health (1994) Nutritional Aspects of Cardio-vascular Disease. Report of the Cardiovascular ReviewGroup of the Committee on Medical Aspects of Food Policy.London: The Stationery Office.
13. Food Standards Agency, Wales (2003) Food and Well Being.Reducing Inequalities through a Nutrition Strategy for Wales.Cardiff, Wales: Food Standards Agency. http://www.food.gov.uk/multimedia/pdfs/foodandwellbeing.pdf
14. The Scottish Government (2008) Healthy Eating in Schools.A Guide to Implementing the Nutritional Requirements for
Food and Drink in Schools (Scotland) Regulations 2008.Edinburgh: The Scottish Government. http://www.scotland.gov.uk/Resource/Doc/238187/0065394.pdf
15. British Dietetic Association (BDA) (2004) Obesity; BDAresponse to the House of Commons Health CommitteeThird Report of Session 2003–04, Volume 1. Media Statement27 May 2004.
16. Stubenitsky K & Mela DJ (2000) UK consumer perceptions ofstarchy foods. Br J Nutr 83, 277–285.
17. Touvier M, Mejean C, Kesse-Guyot E, et al. (2010) Variationsin compliance with starchy food recommendations and con-sumption of types of starchy foods according to sociodemo-graphic and socioeconomic characteristics. Br J Nutr 103,1485–1492.
18. Saris WH, Astrup A, Prentice AM, et al. (2000) Randomizedcontrolled trial of changes in dietary carbohydrate/fat ratioand simple vs complex carbohydrates on body weight andblood lipids: the CARMEN study. The Carbohydrate RatioManagement in European National diets. Int J Obes RelatMetab Disord 24, 1310–1318.
19. Poppitt SD, Keogh GF, Prentice AM, et al. (2002) Long-termeffects of ad libitum low-fat, high-carbohydrate diets onbody weight and serum lipids in overweight subjects withmetabolic syndrome. Am J Clin Nutr 75, 11–20.
20. Drummond S, Kirk T, Jackson J, et al. (2003) Effectiveness ofdietary advice given by community dietitians to men withelevated blood cholesterol in a clinical setting: a pilotstudy. J Hum Nutr Diet 16, 81–83.
21. Kirk TR, Burkill S & Cursiter M (1997) Dietary fat reductionachieved by increasing consumption of a starchy food –an intervention study. Eur J Clin Nutr 51, 455–461.
22. Albertson AM, Affenito SG, Bauserman R, et al. (2009) Therelationship of ready-to-eat cereal consumption to nutrientintake, blood lipids, and body mass index of children asthey age through adolescence. J Am Diet Assoc 109,1557–1565.
23. Rosado JL, del R Arellano M, Montemayor K, et al. (2008) Anincrease of cereal intake as an approach to weight reductionin children is effective only when accompanied by nutritioneducation: a randomized controlled trial. Nutr J 7, 28.
24. Paineau DL, Beaufils F, Boulier A, et al. (2008) Family dietarycoaching to improve nutritional intakes and body weightcontrol: a randomized controlled trial. Arch Pediatr AdolescMed 162, 34–43.
25. Neumark-Sztainer D, Hannan PJ, Story M, et al. (2003)Family meal patterns: associations with sociodemographiccharacteristics and improved dietary intake among adoles-cents. J Am Diet Assoc 103, 317–322.
26. Pignone MP, Ammerman A, Fernandez L, et al. (2003) Coun-seling to promote a healthy diet in adults: a summary of theevidence for the U.S. Preventive Services Task Force. Am JPrev Med 24, 75–92.
27. Ammerman AS, Lindquist CH, Lohr KN, et al. (2002) The effi-cacy of behavioral interventions to modify dietary fat andfruit and vegetable intake: a review of the evidence. PrevMed 35, 25–41.
28. Pomerleau J, Lock K, Knai C, et al. (2005) Interventionsdesigned to increase adult fruit and vegetable intake canbe effective: a systematic review of the literature. J Nutr135, 2486–2495.
29. Perez-Escamilla R, Hromi-Fiedler A, Vega-Lopez S, et al.(2008) Impact of peer nutrition education on dietary beha-viors and health outcomes among Latinos: a systematic lit-erature review. J Nutr Educ Behav 40, 208–225.
30. Cullen KW, Lara Smalling A, Thompson D, et al. (2009)Creating healthful home food environments: results of
P. J. Curtis et al.1842
British
Journal
ofNutrition
a study with participants in the expanded food and nutritioneducation program. J Nutr Educ Behav 41, 380–388.
31. Oude Luttikhuis H, Baur L, Jansen H, et al. (2009) Inter-ventions for treating obesity in children. Cochrane Databaseof Systematic Reviews issue 1, CD001872. http://www.mrw.interscience.wiley.com/cochrane/clsysrev/articles/CD001872/frame.html.
32. American Dietetic Association (ADA) (2006) Position of theAmerican Dietetic Association: individual-, family-, school-,and community-based interventions for pediatric over-weight. J Am Diet Assoc 106, 925–945.
33. Burgess-Champoux TL, Larson N, Neumark-Sztainer D, et al.(2009) Are family meal patterns associated with overall dietquality during the transition from early to middle adoles-cence? J Nutr Educ Behav 41, 79–86.
34. Winkler E & Turrell G (2009) Confidence to cook vegetablesand the buying habits of Australian households. J Am DietAssoc 109, 1759–1768.
35. Zehle K, Smith BJ, Chey T, et al. (2008) Psychosocial factorsrelated to diet among women with recent gestational dia-betes: opportunities for intervention. Diabetes Educ 34,807–814.
36. Larson NI, Perry CL, Story M, et al. (2006) Food preparationby young adults is associated with better diet quality. J AmDiet Assoc 106, 2001–2007.
37. Wrieden WL, Anderson AS, Longbottom PJ, et al. (2007) Theimpact of a community-based food skills intervention oncooking confidence, food preparation methods and dietarychoices – an exploratory trial. Public Health Nutr 10,203–211.
38. Fulkerson JA, Rydell S, Kubik MY, et al. (2010) HealthyHome Offerings via the Mealtime Environment (HOME):feasibility, acceptability, and outcomes of a pilot study. Obes-ity (Silver Spring) 18, S69–S74.
39. Brown BJ & Hermann JR (2005) Cooking classes increasefruit and vegetable intake and food safety behaviors inyouth and adults. J Nutr Educ Behav 37, 104–105.
40. Townsend P, Phillimore P & Beattie A (1998) Health andDeprivation: Inequality and the North. London, New York:Croom Helm.
41. Adamson AJ, Foster E, Butler TJ, et al. (2001) Non-diabeticrelatives of type 2 diabetic families: dietary intake contrib-utes to the increased risk of diabetes. Diabet Med 18,984–990.
42. Prochaska JO & DiClemente CC (1986) Toward a compre-hensive model of change. In Addictive Behaviors: Processesof Change, pp. 3–27 [WR Miller and N Heather, editors].New York, NY: Plenum Press.
43. Fletcher ES, Rugg-Gunn AJ, Matthews JN, et al. (2004)Changes over 20 years in macronutrient intake and bodymass index in 11- to 12-year-old adolescents living in North-umberland. Br J Nutr 92, 321–333.
44. Nelson M, Atkinson M & Meyer J (1997) A Photographic Atlasof Food Portion Sizes. London: Ministry of Agriculture, Fish-eries and Food (MAFF) Publications.
45. Ministry of Agriculture. Fisheries and Food (MAFF) (1994)Food Portion Sizes: Second Edition. London: Her Majesty’sStationery Office.
46. Holland B, Unwin ID & Buss DH (1988) Cereals and CerealProducts: The Third Supplement to McCance and Widdow-son’s The Composition of Foods, 4th ed. London: RoyalSociety of Chemistry and Ministry of Agriculture, Fisheriesand Food.
47. Holland B, Unwin ID & Buss DH (1989) Milk Products andEggs: The Fourth Supplement to McCance and Widdowson’s
The Composition of Foods, 4th ed. London: Royal Society ofChemistry and Ministry of Agriculture, Fisheries and Food.
48. Holland B, Unwin ID & Buss DH (1991) Vegetables, Herbsand Spices: The Fifth Supplement to McCance and Widdow-son’s The Composition of Foods, 4th ed. London: RoyalSociety of Chemistry and Ministry of Agriculture, Fisheriesand Food.
49. Holland B, Unwin ID & Buss DH (1992) Fruit and Nuts: TheFirst Supplement to McCance and Widdowson’s The Compo-sition of Foods, 5th ed. London: Royal Society of Chemistryand Ministry of Agriculture, Fisheries and Food.
50. Holland B, Welch AA & Buss DH (1992) Vegetable Dishes:The Second Supplement to McCance and Widdowson’s TheComposition of Foods, 5th ed. London: Royal Society ofChemistry and Ministry of Agriculture, Fisheries and Food.
51. Holland B, Brown J & Buss DH (1993) Fish and Fish Pro-ducts: The Third supplement to McCance and Widdowson’sThe Composition of Foods, 5th ed. London: Royal Societyof Chemistry and Ministry of Agriculture, Fisheries and Food.
52. Chan W, Brown J & Buss DH (1994) Miscellaneous Foods:The Fourth Supplement to McCance and Widdowson’s TheComposition of Foods, 5th ed. London: Royal Society ofChemistry and Ministry of Agriculture, Fisheries and Food.
53. Chan W, Brown J, Lee SM, et al. (1995) Meat, Poultry andGame: The Fifth Supplement to McCance and Widdowson’sThe Composition of Foods, 5th ed. London: Royal Societyof Chemistry and Ministry of Agriculture, Fisheries and Food.
54. Chan W, Brown J, Church SM, et al. (1995) Meat Productsand Dishes: The Sixth Supplement to McCance and Widdow-son’s The Composition of Foods, 5th ed. London: RoyalSociety of Chemistry and Ministry of Agriculture, Fisheriesand Food.
55. Holland B, Welch AA, Unwin ID, et al. (1991) McCance andWiddowson’s The Composition of Food, 5th ed. London,Cambridge: Royal Society of Chemistry.
56. Brookes A (1995) Nutrient Analysis of Pizza, Part 1 – Ana-lytical Results. Ministry of Agriculture, Fisheries and Food(MAFF), in Report Series No. B915 by RHM Technology,MAFF Project No. 2B023.
57. Brookes A (1995) Nutrient Analysis of Selected Foods. PartOne – Analytical Results. Ministry of Agriculture, Fisheriesand Food (MAFF), in Report Series No. B913 by RHM Tech-nology, MAFF Project No. 2B021.
58. Ministry of Agriculture, Fisheries and Food (MAFF) (1995)Nutrient Analysis of Foods Commonly Consumed by SchoolChildren, Nutritional Survey, 1995. Part 2 – AnalyticalReport, MAFF Project No. AN 1036.
59. Aspland and James Ltd (1997) Nutrient Analysis of EthnicTakeaway Foods 1997. Part 2 – Analytical Report, MAFFProject No. AN 1053.
60. Ministry of Agriculture, Fisheries and Food (MAFF) (1999)Nutrient Analysis of Other Milks and Creams. MAFF Surveil-lance Sheet, number 178. http://archive.food.gov.uk/maff/archive/food/infsheet/1999/no178/178milk.htm
61. Ministry of Agriculture, Fisheries and Food (MAFF) (2000)Nutrient Analysis of Bread and Morning Goods. MAFFSurveillance Sheet, number 194. http://archive.food.gov.uk/maff/archive/food/infsheet/2000/no194/194bred.htm
62. Ministry of Agriculture, Fisheries and Food (MAFF) (2000)Nutrient Analysis of Cheese. MAFF Surveillance Sheet,Number 196. http://archive.food.gov.uk/maff/archive/food/infsheet/2000/no196/196chee.htm
63. Ministry of Agriculture, Fisheries and Food (MAFF) (2000)Nutrient Analysis of Ice creams and Desserts. MAFF Surveil-lance Sheet, Number 195. http://archive.food.gov.uk/maff/archive/food/infsheet/2000/no195/195dess.htm
Promoting low-fat starchy foods in families 1843
British
Journal
ofNutrition
64. Adamson AJ & Mathers JC (2004) Effecting dietary change.Proc Nutr Soc 63, 537–547.
65. Penn L, Boeing H, Boushey CJ, et al. (2010) Assessment ofdietary intake: NuGO symposium report. Genes Nutr 5,205–213.
66. Pearson N, Biddle SJ & Gorely T (2009) Family correlates offruit and vegetable consumption in children and adoles-cents: a systematic review. Public Health Nutr 12, 267–283.
67. Shilts MK, Horowitz M & Townsend MS (2004) Goal settingas a strategy for dietary and physical activity behaviorchange: a review of the literature. Am J Health Promot 19,81–93.
68. Hoy MK, Winters BL, Chlebowski RT, et al. (2009) Imple-menting a low-fat eating plan in the Women’s InterventionNutrition Study. J Am Diet Assoc 109, 688–696.
69. Shilts MK, Horowitz M & Townsend MS (2009) Guided goalsetting: effectiveness in a dietary and physical activity inter-vention with low-income adolescents. Int J Adolesc MedHealth 21, 111–122.
70. Fry JP & Neff RA (2009) Periodic prompts and reminders inhealth promotion and health behavior interventions: sys-tematic review. J Med Internet Res 11, e16.
71. Ledikwe JH, Blanck HM, Khan LK, et al. (2006) Low-energy-density diets are associated with high diet quality in adults inthe United States. J Am Diet Assoc 106, 1172–1180.
72. Schroder H, Covas M, Elosua R, et al. (2008) Diet quality andlifestyle associated with free selected low-energy densitydiets in a representative Spanish population. Eur J ClinNutr 62, 1194–1200.
73. Drewnowski A, Monsivais P, Maillot M, et al. (2007) Low-energy-density diets are associated with higher diet qualityand higher diet costs in French adults. J Am Diet Assoc107, 1028–1032.
74. Patterson E, Warnberg J, Poortvliet E, et al. (2010) Dietaryenergy density as a marker of dietary quality in Swedish chil-dren and adolescents: the European Youth Heart Study. Eur JClin Nutr 64, 356–363.
75. Schroder H, Vila J, Marrugat J, et al. (2008) Low energy den-sity diets are associated with favorable nutrient intake profileand adequacy in free-living elderly men and women. J Nutr138, 1476–1481.
76. Oldroyd J, Burns C, Lucas P, et al. (2008) The effectiveness ofnutrition interventions on dietary outcomes by relative socialdisadvantage: a systematic review. J Epidemiol CommunityHealth 62, 573–579.
77. Van Cauwenberghe E, Maes L, Spittaels H, et al. (2010) Effec-tiveness of school-based interventions in Europe to promotehealthy nutrition in children and adolescents: systematicreview of published and ‘grey’ literature. Br J Nutr 103,781–797.
78. Wrieden WL, Connaghan J, Morrison C, et al. (2004) Secularand socio-economic trends in compliance with dietary tar-gets in the north Glasgow MONICA population surveys1986–1995: did social gradients widen? Public Health Nutr7, 835–842.
79. Friel S, Newell J & Kelleher C (2005) Who eats four or moreservings of fruit and vegetables per day? Multivariate classifi-cation tree analysis of data from the 1998 Survey of Lifestyle,Attitudes and Nutrition in the Republic of Ireland. PublicHealth Nutr 8, 159–169.
80. Deshmukh-Taskar P, Nicklas TA, Yang SJ, et al. (2007) Doesfood group consumption vary by differences in socioeco-nomic, demographic, and lifestyle factors in young adults?The Bogalusa Heart Study. J Am Diet Assoc 107, 223–234.
81. Larson NI, Neumark-Sztainer D, Hannan PJ, et al. (2007)Family meals during adolescence are associated withhigher diet quality and healthful meal patterns duringyoung adulthood. J Am Diet Assoc 107, 1502–1510.
82. Pearson N, Biddle SJ & Gorely T (2009) Family correlates ofbreakfast consumption among children and adolescents.A systematic review. Appetite 52, 1–7.
83. Lake AA, Adamson AJ, Craigie AM, et al. (2009) Tracking ofdietary intake and factors associated with dietary changefrom early adolescence to adulthood: The ASH30 study.Obes Facts 2, 157–165.
P. J. Curtis et al.1844
British
Journal
ofNutrition