Factors in food consumption
15
1 Peter Atkins and Ian Bowler (2001) Food in society: economy, culture, geography London: Arnold ISBN 0 340 72003 4 (hbk); 0 340 72004 2 (pbk) http://www.routledge.com/books/details/9780340720042/ 20 FACTORS IN FOOD CONSUMPTION INTRODUCTION It was Paul Vidal de la Blache (1926) who noted that among the connexions between nature and culture, ‘one of the most tenacious is food supply’. Nineteenth and early twentieth century geographers emphasised this mainly in discussions on the importance of physical geography as a key set of constraining variables in human activity. Soils and climate were identified as fundamental to food production, and so indeed they were in economies dominated by subsistent peasant agriculture. Since then the steady progress of urbanization and industrialization has put paid to such deterministic assumptions, in the developed world at least, and modern social scientists have different perspectives on the environmental context of the economy in general and consumption in particular. Table 20.1 Factors in food choice Geo-environmental Socio-economic Physiological Agro-ecosystem Religion, taboo, social custom Heredity Time of day, season Ethnicity Allergy Regionality of food culture Income, social class Therapeutic diets Spatio-temporal and hierarchical diffusion of food habits Household composition Taste, acceptability Knowledge of nutrition Sex, body size Attitude to food-related health risk Age Advertising, mass communications, travel Retail system Moral values Source: modified and extended after McKenzie (1979). Table 20.1 transcends the idea of environmental determinism in food habits to encompass a wider range of socio-economic and physiological factors. In this and the following two chapters we start with a recognition that the ecology of food production
Transcript of Factors in food consumption

1
Peter Atkins and Ian Bowler (2001) Food in society: economy, culture,
geography London: Arnold ISBN 0 340 72003 4 (hbk); 0 340 72004 2 (pbk)
http://www.routledge.com/books/details/9780340720042/
20
FACTORS IN FOOD CONSUMPTION
INTRODUCTION
It was Paul Vidal de la Blache (1926) who noted that among the connexions between
nature and culture, ‘one of the most tenacious is food supply’. Nineteenth and early
twentieth century geographers emphasised this mainly in discussions on the
importance of physical geography as a key set of constraining variables in human
activity. Soils and climate were identified as fundamental to food production, and so
indeed they were in economies dominated by subsistent peasant agriculture. Since
then the steady progress of urbanization and industrialization has put paid to such
deterministic assumptions, in the developed world at least, and modern social
scientists have different perspectives on the environmental context of the economy in
general and consumption in particular.
Table 20.1 Factors in food choice
Geo-environmental Socio-economic Physiological
Agro-ecosystem Religion, taboo, social
custom
Heredity
Time of day, season Ethnicity Allergy
Regionality of food
culture
Income, social class Therapeutic diets
Spatio-temporal and
hierarchical diffusion of
food habits
Household composition Taste, acceptability
Knowledge of nutrition Sex, body size
Attitude to food-related
health risk
Age
Advertising, mass
communications, travel
Retail system
Moral values
Source: modified and extended after McKenzie (1979).
Table 20.1 transcends the idea of environmental determinism in food habits to
encompass a wider range of socio-economic and physiological factors. In this and the
following two chapters we start with a recognition that the ecology of food production

2
does still have some direct and indirect relevance for a study of consumption patterns,
and we then turn to a more conventional discussion of other factors, such as prices
and incomes, social class, taste, tradition and lifestyle.
ECOLOGY
In truly subsistence economies the diets of farming families are limited to own-
production, plus some local trade. The ingredients are, therefore, constrained by the
range of farming systems practised within a particular adaptation to physical
conditions, such as climate, soils, topography and the availability of water for
irrigation. Such fully independent agro-ecosystems are increasingly rare in the
modern world of regional and international trade, but the foods eaten by the bulk of
the world’s population are still dominated by locally produced staples and by the
inertia of dietary tradition. The global pattern of food régimes (Figure 20.1)
demonstrates this, as does the spatial distribution of regional dietary staples in India
(Figure 20.2), although Chapter 21 will show why such maps do not tell the full story.
Annegers (1973a, 1973b, 1973c, 1974) investigated the ecological background
to certain nutritional imbalances in West Africa. He concluded that, while historical
factors have been important in the spread of particular crops and farming systems, it
is the agro-climatic environment that has had most significance in the evolution of
regional dietary patterns (Figure 20.3). Although he found that the region generally
has a sufficiency of calories, the protein quality of local foods varies considerably,
with certain root crops and coarse grains falling short of requirements (Table 20.2).
The result is that people in the coastal ‘guinea’ zone, who are reliant upon staples
such as manioc, are more at risk of protein deficiency than in almost any other part of
the world (see Chapter 10).

3

4
Table 20.2 The protein quality of the main foods consumed in West Africa
Amino acids
Food Isoleucine Lysine Methionine &
cystine
Tryptophan
Fish 72 141 73 70
Beef 73 137 72 70
Cow’s milk 71 121 60 88
Fonio 60 40 152 88
Millet 62 53 87 122
Rice 57 59 61 78
Yam 56 64 50 80
Manioc 42 64 49 72
Sorghum 59 31 52 76
Maize 55 41 63 44
Note: The protein score is calculated as a percentage of the respective amino acids in
egg protein.
Source: Annegers (1974).
Lest we get too carried away with the neat symmetry of a local agricultural
ecosystem determining dietary choice, let us remind ourselves that this has only
limited relevance for food consumption in richer countries. Trade in foodstuffs is
now taken for granted and supermarkets are full of exotic and out-of-season fruits and
vegetables, to the extent that local farming products elicit less and less allegiance
from consumers. In the case of Britain this has been the case for at least 250 years,
because the policies of free trade and imperial expansion drew in food from all over

5
the world (Walvin 1997). One might reasonably claim that it was the British who had
the first ‘global’ diet in terms of sourcing, although of course that did not guarantee
quality.
The continuing relevance of ecology in the H.I.C.s is not in the determination
of all aspects of the diet by local agricultural output but in the maintenance of a
steady core of the food economy. In many Asian countries, even the richer ones, this
is still founded on rice, and in many temperate lands staples such as wheat, potatoes
and livestock products remain popular.
INCOME, CLASS, AGE, SEX, ETHNICITY AND HOUSEHOLD
COMPOSITION
In the late eighteenth and nineteenth centuries there was a growing interest in the
household budgets of working people and in particular in their expenditure on food
items. To begin with this was a practical concern for the poverty of farm and
industrial workers, but later Frédéric Le Play (1806-62) and some of the early
geographers gathered substantial quantities of data in an attempt to form a broader
view about livelihoods in a wide range of settings.
Table 20.3 Approaches to generating data on food consumption
Data from Method
Sample survey A representative sample is drawn from a certain population,
bearing in mind the need to have accurate information on
consumers of all income groups, and also sex, age and household
composition. Questionnaires are used to prompt people’s
memory of recent meals, or the respondent may be asked to fill in
a food diary. The most accurate method is for skilled surveyors
to weigh all food portions and analyse typical foods chemically
but this is too time-consuming and labour-intensive for large-
scale research.
Panel survey Here the respondent group may be retained over a period of time.
Balance sheets This method is commonly used at the national scale. If a
country’s agricultural production and international food trade
statistics are available, then it is possible to generate estimates of
per capita consumption after allowances have been made for
seeds, wastage and storage carry over.
Scanning data Most modern supermarkets have automatic technology to read
and log the bar codes on the food items they sell. As a result
there are data on the aggregate sales of each store and also on
each consumer if they have a loyalty card. Commercial and
individual confidentiality mean that this data is not readily
available.
Many countries now have regular, official sample surveys of food
consumption for the purposes of monitoring the problems associated with
malnutrition and diet-related disease (Chapter 16), and also to provide the data
needed by governments for the formulation of food policies. Others use estimation

6
methodologies based upon macro-level data of production and trade or upon the
interviewing of individuals or panels of households by market research companies
(Table 20.1). This variety of compilation methods makes it sensible to think of
Figure 20.4 as impressionistic because of the problems of comparability (see also
Grigg 1993a and 1993b).
Some of the early researchers realised that a number of factors influenced
food consumption beyond the context of the regional food culture. Income and class,
for instance, could not be ignored. Higher income groups were observed to purchase
higher quality items rather than increase their intake of basic staples. This is also true
today, with the adoption of tastier, higher status, and easy-to-prepare foods as
incomes rise, and this helps to explain the long-term rise of animal foods (meat, fish,
7
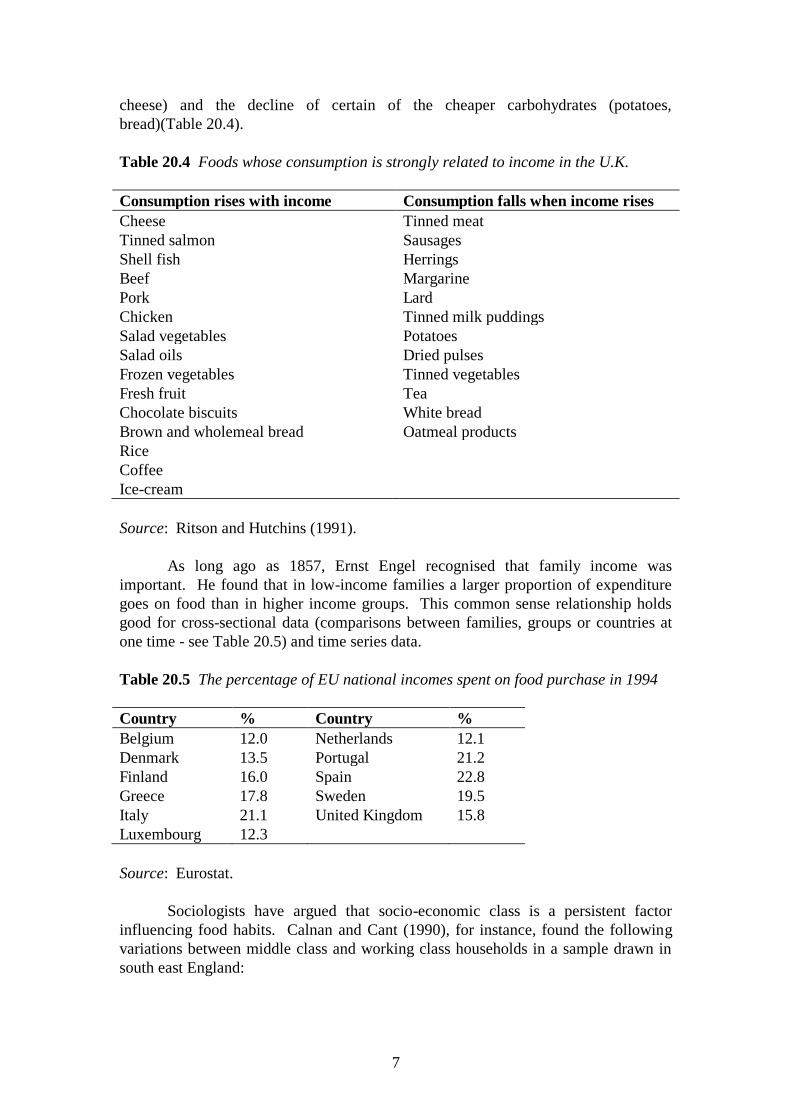
cheese) and the decline of certain of the cheaper carbohydrates (potatoes,
bread)(Table 20.4).
Table 20.4 Foods whose consumption is strongly related to income in the U.K.
Consumption rises with income Consumption falls when income rises
Cheese Tinned meat
Tinned salmon Sausages
Shell fish Herrings
Beef Margarine
Pork Lard
Chicken Tinned milk puddings
Salad vegetables Potatoes
Salad oils Dried pulses
Frozen vegetables Tinned vegetables
Fresh fruit Tea
Chocolate biscuits White bread
Brown and wholemeal bread Oatmeal products
Rice
Coffee
Ice-cream
Source: Ritson and Hutchins (1991).
As long ago as 1857, Ernst Engel recognised that family income was
important. He found that in low-income families a larger proportion of expenditure
goes on food than in higher income groups. This common sense relationship holds
good for cross-sectional data (comparisons between families, groups or countries at
one time - see Table 20.5) and time series data.
Table 20.5 The percentage of EU national incomes spent on food purchase in 1994
Country % Country %
Belgium 12.0 Netherlands 12.1
Denmark 13.5 Portugal 21.2
Finland 16.0 Spain 22.8
Greece 17.8 Sweden 19.5
Italy 21.1 United Kingdom 15.8
Luxembourg 12.3
Source: Eurostat.
Sociologists have argued that socio-economic class is a persistent factor
influencing food habits. Calnan and Cant (1990), for instance, found the following
variations between middle class and working class households in a sample drawn in
south east England:

8
Information about healthy eating was more readily available to the middle class
households, whereas working class expenditure, although constrained by the need
for careful budgeting, was more directed to the purchase of high status meats.
Middle class husbands played a greater part in decision-making about shopping
lists, although they made little more effort in the shopping or cooking.
Working class recipes and ingredients were more likely to be conservative and
repetitive.
The income/diet relationship may create problems for the needy. In L.I.C.s
food poverty may lead to hunger and malnutrition (Chapter 10) but the rich countries
are by no means exempt. In the U.S.A part of the state welfare provision is paid as
‘food stamps’ in order to create a safety net for the poor and unemployed, but there is
a stigma attached to such handouts. Even families with a worker on regular (but low)
wages are at risk because there is a strong drive in all of us to emulate the diets of the
cultural norm and this may lead to over-expenditure on some items and the neglect of
the essentials. Expensive ‘junk foods’ may be consumed in preference to cheaper and
more nutritious alternatives, especially in families where television-inspired pressure
comes from young people, and food poverty may therefore be perpetuated.
Food consumption differences between the sexes are not only a matter of
intake to match different body weights and nutrient requirements (Chapter 10). In
most societies there are foods that are seen to be ‘feminine’ or ‘masculine’ (Chapter
23). For example, in Britain the consumption of beer is commonly accepted as a
largely male preserve, whereas among teenagers a predominance of vegetarians are
female because girls and young women have become concerned with methods of
animal rearing and slaughter (Chapter 18).
The age and sex composition of the population is also significant for the
overall structure of demand. This was discussed as early as the 1860s by one
investigator, Dr Edward Smith, and he even incorporated into his analysis what we
would now call ‘reference adults’. This allowed him to calculate the average
consumption per head within a family in terms that were then comparable between
families.
9
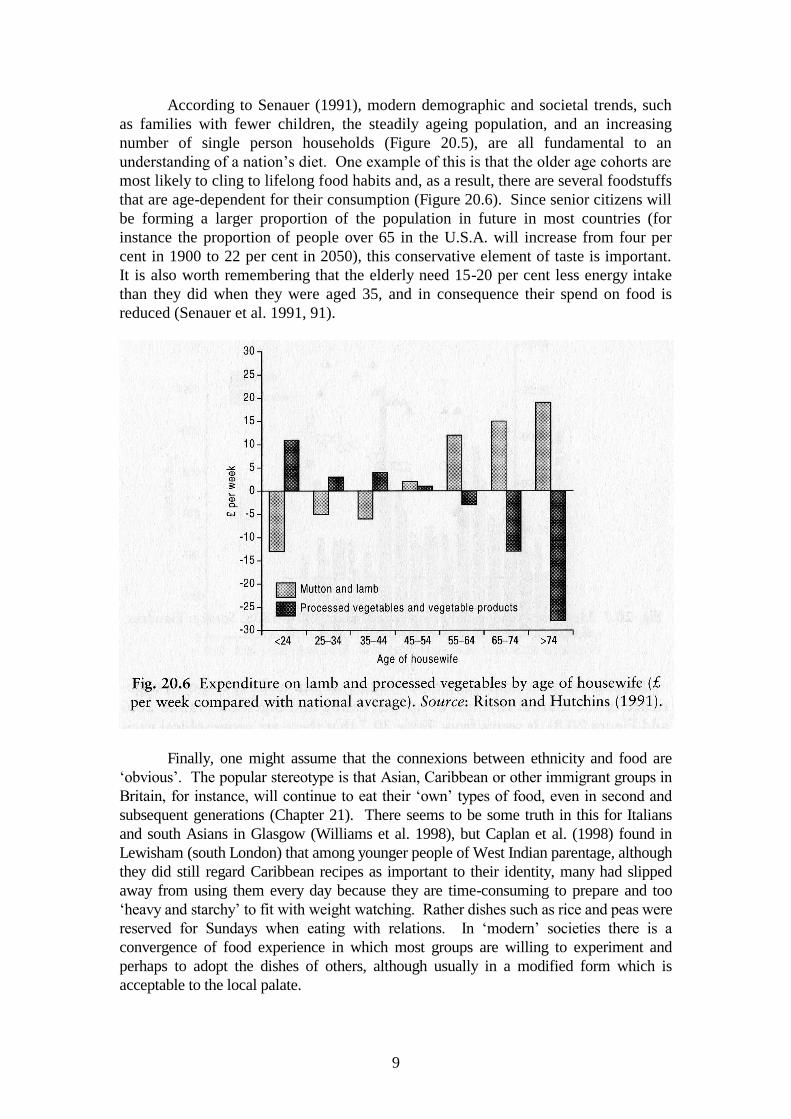
According to Senauer (1991), modern demographic and societal trends, such
as families with fewer children, the steadily ageing population, and an increasing
number of single person households (Figure 20.5), are all fundamental to an
understanding of a nation’s diet. One example of this is that the older age cohorts are
most likely to cling to lifelong food habits and, as a result, there are several foodstuffs
that are age-dependent for their consumption (Figure 20.6). Since senior citizens will
be forming a larger proportion of the population in future in most countries (for
instance the proportion of people over 65 in the U.S.A. will increase from four per
cent in 1900 to 22 per cent in 2050), this conservative element of taste is important.
It is also worth remembering that the elderly need 15-20 per cent less energy intake
than they did when they were aged 35, and in consequence their spend on food is
reduced (Senauer et al. 1991, 91).
Finally, one might assume that the connexions between ethnicity and food are
‘obvious’. The popular stereotype is that Asian, Caribbean or other immigrant groups in
Britain, for instance, will continue to eat their ‘own’ types of food, even in second and
subsequent generations (Chapter 21). There seems to be some truth in this for Italians
and south Asians in Glasgow (Williams et al. 1998), but Caplan et al. (1998) found in
Lewisham (south London) that among younger people of West Indian parentage, although
they did still regard Caribbean recipes as important to their identity, many had slipped
away from using them every day because they are time-consuming to prepare and too
‘heavy and starchy’ to fit with weight watching. Rather dishes such as rice and peas were
reserved for Sundays when eating with relations. In ‘modern’ societies there is a
convergence of food experience in which most groups are willing to experiment and
perhaps to adopt the dishes of others, although usually in a modified form which is
acceptable to the local palate.

10
TIME
Any serious study of diet should consider the dimension of time. Stephen Mennell
(1996), citing Norbert Elias, sees time as crucial to the process and structure of
civilization, and argues that the social construction and regulation of time owes much
to the question ‘when shall we eat?’. The answer to this question has varied
according to the era and location. Figure 20.7 illustrates this by showing the changing
number and timing of meals among the social élite in France.
Among the most immediate observations we can make is our own experience
of the diurnal rhythms of hunger, eating and digestion (Tables 20.6 and Figure 20.8).
It seems from Table 20.7 that there are geographical variations in this, some of them
quite surprising. In Poland, for instance, among the elderly at least, there is a greater
intake of energy at breakfast time than from the evening meal.
Table 20.6 Percentage nutrient intake at different meals of 899 men in Augsburg,
Austria
Nutrient Breakfast Morning
snack
Lunch Afternoon
snack
Dinner Supper
Energy 17.2 7.4 29.2 6.8 33.1 6.4
Protein 13.6 7.2 36.3 4.1 35.5 3.3
Fat 16.9 7.0 32.5 5.5 35.1 3.1
Carbohydrates 22.9 7.7 25.1 8.8 28.5 7.0
Fibre 19.9 7.4 29.4 5.2 32.7 5.3
Calcium 21.3 7.5 24.3 7.8 32.1 7.1
Alcohol 2.1 7.6 21.0 8.9 39.8 20.5
Source: Winkler et al. (1999).

11
Table 20.7 Energy intake at different meals as a percentage of total consumption
among the elderly in eight European towns
Breakfast Midday Evening Snacks
Padua, Italy 11 45 37 7
Romans, France 18 45 30 7
Haguenau, France 19 39 30 12
Yverdon, Switzerland 19 39 33 9
Marki, Poland 28 33 27 12
Ballymoney, N. Ireland 22 32 30 16
Roskilde, Denmark 19 25 35 21
Culemborg, Netherlands 15 21 33 31
Source: Schlettwein-Gsell et al. (1999).
There are also seasonal shifts in the availability of certain foods, and in some
societies even seasonal fluctuations in energy intake (Chapter 10), but it is the
fundamental changes over longer time periods that concern us in this section. They
tend to mirror the process of economic development, with greater prosperity and
social dynamics encouraging the evolution of dietary patterns.
In Britain, The National Food Survey provides an historical data series that
allows us to describe these changes since the Second World War. As Figure 20.9
shows, food purchases have been fluid. Rising incomes are a factor (e.g. in the falling
consumption of bread and potatoes), but health considerations have also been
important (e.g. in the decline of full cream milk), as have secular changes in taste.
Nelson (1993) argues that such national averages hide social class variations,
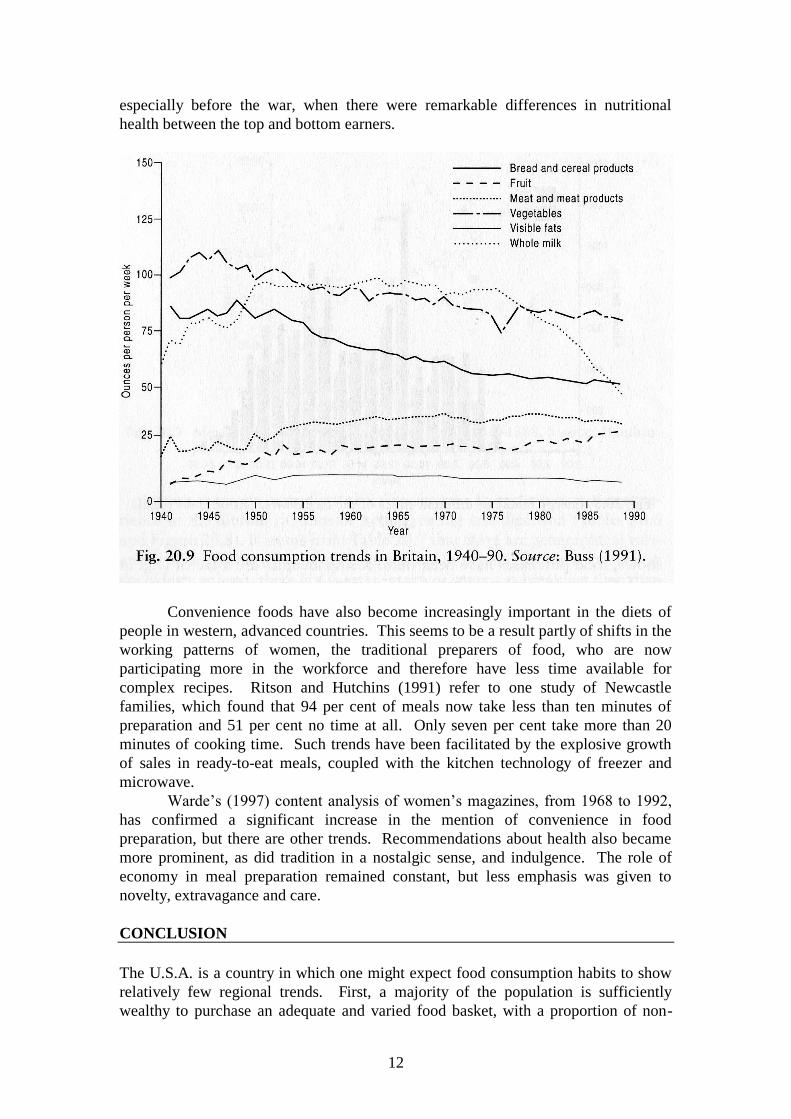
12
especially before the war, when there were remarkable differences in nutritional
health between the top and bottom earners.
Convenience foods have also become increasingly important in the diets of
people in western, advanced countries. This seems to be a result partly of shifts in the
working patterns of women, the traditional preparers of food, who are now
participating more in the workforce and therefore have less time available for
complex recipes. Ritson and Hutchins (1991) refer to one study of Newcastle
families, which found that 94 per cent of meals now take less than ten minutes of
preparation and 51 per cent no time at all. Only seven per cent take more than 20
minutes of cooking time. Such trends have been facilitated by the explosive growth
of sales in ready-to-eat meals, coupled with the kitchen technology of freezer and
microwave.
Warde’s (1997) content analysis of women’s magazines, from 1968 to 1992,
has confirmed a significant increase in the mention of convenience in food
preparation, but there are other trends. Recommendations about health also became
more prominent, as did tradition in a nostalgic sense, and indulgence. The role of
economy in meal preparation remained constant, but less emphasis was given to
novelty, extravagance and care.
CONCLUSION
The U.S.A. is a country in which one might expect food consumption habits to show
relatively few regional trends. First, a majority of the population is sufficiently
wealthy to purchase an adequate and varied food basket, with a proportion of non-
13
local items high enough to rule out ecologically-determined diets. Second, although
there are spatial concentrations of immigrant groups, one would not expect these to
have developed into homogeneous regional cuisines as has happened in countries
with a longer cultural history. Third, the commercialization of both the grocery food
chain and fast food restaurants has reached such levels in America that the
standardizing tendencies of modernity have penetrated deeply into the national food
psyche.
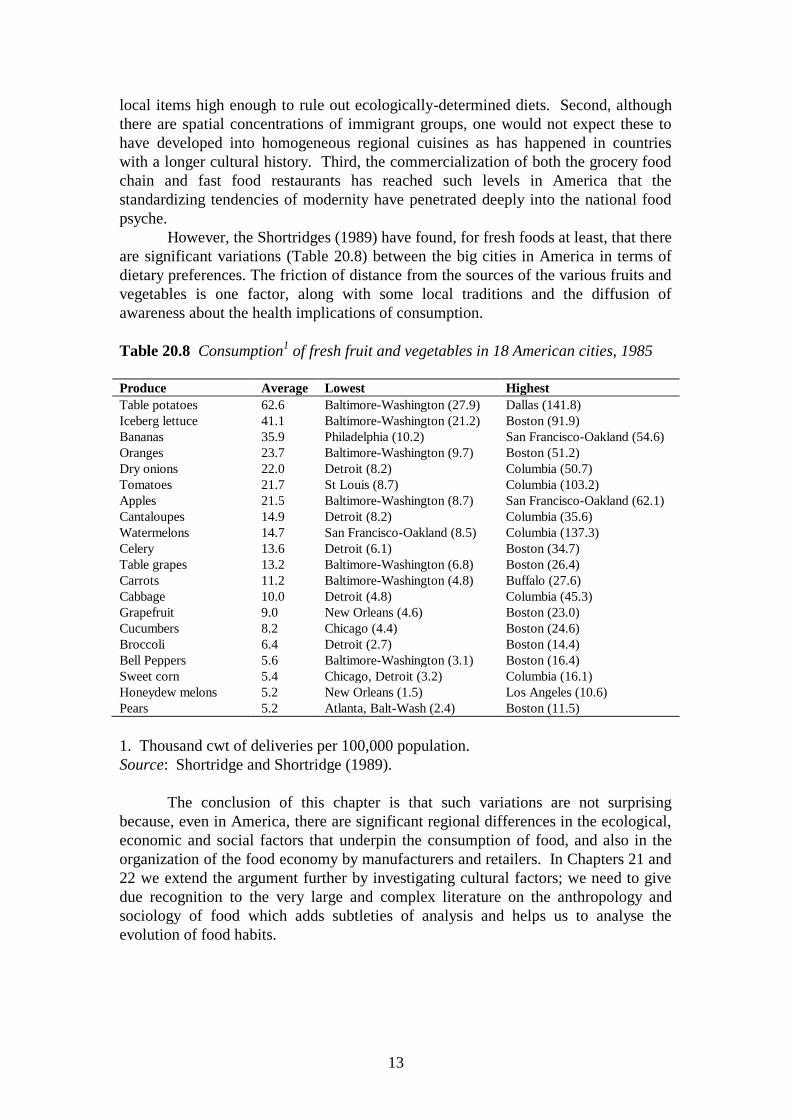
However, the Shortridges (1989) have found, for fresh foods at least, that there
are significant variations (Table 20.8) between the big cities in America in terms of
dietary preferences. The friction of distance from the sources of the various fruits and
vegetables is one factor, along with some local traditions and the diffusion of
awareness about the health implications of consumption.
Table 20.8 Consumption1 of fresh fruit and vegetables in 18 American cities, 1985
Produce Average Lowest Highest
Table potatoes 62.6 Baltimore-Washington (27.9) Dallas (141.8)
Iceberg lettuce 41.1 Baltimore-Washington (21.2) Boston (91.9)
Bananas 35.9 Philadelphia (10.2) San Francisco-Oakland (54.6)
Oranges 23.7 Baltimore-Washington (9.7) Boston (51.2)
Dry onions 22.0 Detroit (8.2) Columbia (50.7)
Tomatoes 21.7 St Louis (8.7) Columbia (103.2)
Apples 21.5 Baltimore-Washington (8.7) San Francisco-Oakland (62.1)
Cantaloupes 14.9 Detroit (8.2) Columbia (35.6)
Watermelons 14.7 San Francisco-Oakland (8.5) Columbia (137.3)
Celery 13.6 Detroit (6.1) Boston (34.7)
Table grapes 13.2 Baltimore-Washington (6.8) Boston (26.4)
Carrots 11.2 Baltimore-Washington (4.8) Buffalo (27.6)
Cabbage 10.0 Detroit (4.8) Columbia (45.3)
Grapefruit 9.0 New Orleans (4.6) Boston (23.0)
Cucumbers 8.2 Chicago (4.4) Boston (24.6)
Broccoli 6.4 Detroit (2.7) Boston (14.4)
Bell Peppers 5.6 Baltimore-Washington (3.1) Boston (16.4)
Sweet corn 5.4 Chicago, Detroit (3.2) Columbia (16.1)
Honeydew melons 5.2 New Orleans (1.5) Los Angeles (10.6)
Pears 5.2 Atlanta, Balt-Wash (2.4) Boston (11.5)
1. Thousand cwt of deliveries per 100,000 population.
Source: Shortridge and Shortridge (1989).
The conclusion of this chapter is that such variations are not surprising
because, even in America, there are significant regional differences in the ecological,
economic and social factors that underpin the consumption of food, and also in the
organization of the food economy by manufacturers and retailers. In Chapters 21 and
22 we extend the argument further by investigating cultural factors; we need to give
due recognition to the very large and complex literature on the anthropology and
sociology of food which adds subtleties of analysis and helps us to analyse the
evolution of food habits.
14
FURTHER READING AND REFERENCES
For a sample of the francophone literature in this area see Sorre (1952), George
(1963), Livet (1969), Bernard, Salles and Thouvenot (1980), Favier and Thouvenot
(1980).
Annegers, J.F. 1973a: Ecology of dietary patterns and nutritional status in
West Africa. 1: distribution of starchy staples. Ecology of Food and Nutrition 2,
107-19
Annegers, J.F. 1973b: The protein-calorie ratio of West African diets and
their relationship to protein calorie malnutrition. Ecology of Food and Nutrition 2,
225-35.
Annegers, J.F. 1973c: Seasonal food shortages in West Africa. Ecology of
Food and Nutrition 2, 251-57.
Annegers, J.F. 1974: Protein quality of West African foods. Ecology of Food
and Nutrition 3, 125-30.
Atkins, P.J. and Raw, M. 1995: Agriculture and food. London: Collins
Educational.
Bernard, A.J-M., Salles, P. and Thouvenot, C. 1980: Consommation
alimentaire: une orientation interdisciplinaire, Annales de Géographie 493, 258-72.
Buss, D. 1991: The changing household diet. In Slater, J.M. (ed.) Fifty years
of the National Food Survey. London: H.M.S.O., 47-54.
Caplan, P., Keane, A., Willetts, A. and Williams, J. 1998: Studying food
choice in its social and cultural contexts: approaches from a social anthropological
perspective. In Murcott, A. (ed.) ‘The Nation’s Diet’: the social science of food
choice. London: Longman, 168-82.
Cummins, S. and Macintyre, S. 1999: The location of food stores in urban
areas: a case study in Glasgow. British Food Journal 101, 545-53.
Favier, A. and Thouvenot, C. 1980: Eléments de cartographie alimentaire,
Annales de Géographie 493, 273-89.
Flandrin, J.-L. 1996: Mealtimes in France before the nineteenth century. Food
and Foodways 6, 261-282.
George, P. 1963: Géographie de la consommation. Paris: Presses
Universitaires de France.
Grigg, D.B. 1993a: International variations in food consumption in the 1980s,
Geography 78, 251-266.
Grigg, D.B. 1993b: The European diet: regional variations in food consumption
in the 1980s, Geoforum 24, 277-290.
Livet, R. 1969: Géographie de l’alimentation. Paris: Editions Ouvrières.
McKenzie, J. 1979: Economic influences on food choice. In Turner, M. (ed)
Nutrition and lifestyles London: Applied Science Publishers, 91-103.
Mennell, S. 1996: Sociogenetic connections between food and timing. Food
and Foodways 6, 3-4, 195-204.
Nelson, M. 1993: Social class trends in British diet, 1860-1980. In Geissler, C.
and Oddy, D.J. (eds) Food, diet and economic change past and present. Leicester:
Leicester University Press, 101-20.
Ritson, C. and Hutchins, R. 1991: The consumption revolution. In Slater,
J.M. (ed.) Fifty years of the National Food Survey. London: H.M.S.O., 35-46.
15
Roos, E. & Prättälä, R. 1997: Meal pattern and nutrient intake among adult
Finns. Appetite 29, 11-24.
Schlettwein-Gsell, D., Declari, B. & De Groot, L. 1999: Meal patterns in the
SENECA study of nutrition and the elderly in Europe: assessment method and
preliminary results on the role of the midday meal. Appetite 32, 15-22.
Senauer, B., Asp, E. and Kinsey, J. 1991: Food trends and the changing
consumer. St Paul, Minnesota: Eagan Press.
Shortridge, B.G. and Shortridge, J.R. 1989: Consumption of fresh produce in
the metropolitan United States. Geographical Review 79, 79-98.
Sorre, M. 1952: La géographie de l’alimentation, Annales de Géographie 61,
184-99. Translated as ‘The geography of diet’. In Wagner, P.L. and Mikesell, M.W.
(eds) 1962: Readings in cultural geography. Chicago: University of Chicago Press,
445-56.
Tomlinson, M. 1998: Changes in tastes in Britain, 1985-1992. British Food
Journal 100, 295-301.
Vidal de la Blache, P. 1926: Principles of human geography. New York:
Holt.
Walvin, J. 1997: Fruits of empire: exotic produce and British taste, 1660-
1800. Basingstoke: Macmillan.
Warde, A. 1997: Consumption, food and taste: culinary antimonies and
commodity culture. London: Sage.
Williams, R., Buch, H., Lean, M., Anderson, A.S. and Bradby, H. 1998: Food
choice and culture in a cosmopolitan city: South Asians, Italians and other
Glaswegians. In Murcott, A. (ed.) ‘The Nation’s Diet’: the social science of food
choice. London: Longman, 267-84.
Winkler, G., Döring, A. & Keil, U. 1999: Meal patterns in middle-aged men
in southern Germany: results from the MONICA Augsburg dietary survey 1984/85.
Appetite 32, 33-37.
Wrigley, N. 1998: How British retailers have shaped food choice. In Murcott,
A. (ed.) ‘The Nation’s Diet’: the social science of food choice. London: Longman,
112-28.