Religious Specificities in the Early Sultanate of Banten - Neliti
Upload
khangminh22Category
view
0download
0
Agromet 34 (2): 129-142, 2020
129
Determinant Factors of Food Farming Vulnerability in Banten Province to
Support Climate Change Adaptation
Suciantini1, Woro Estiningtyas1, Adi Rahman2
1Indonesian Agro-Climate and Hydrology Research Institute (IAHRI), Ministry of Agriculture, Jalan Tentara Pelajar No. 1A,
Cimanggu, Bogor, Indonesia 16111 2Centre for Climate Risk and Opportunity Management in Southeast Asia Pacific, Baranangsiang Campus, IPB University, Jalan
Pajajaran Bogor, Indonesia 16143
A R T I C L E I N F O
Received
16 July 2020
Revised
21 September 2020
Accepted for Publication
11 November 2020
Published
29 Desember 2020
doi: 10.29244/j.agromet.34.2.129-142
Correspondence:
Suciantini
Indonesian Agro-Climate and
Hydrology Research Institute (IAHRI),
Ministry of Agriculture, Jalan Tentara
Pelajar No. 1A, Cimanggu,
Bogor, Indonesia 16111
Email: [email protected]
This is an open-access article
distributed under the CC BY License.
© 2020 The Authors. Agromet.
A B S T R A C T
Food crop is one of the most impacted agricultural sectors by climate related
disaster. The negative impacts of climate related disaster could be assessed
by its vulnerability level that depends on various indicators including
exposure, sensitivity, and adaptive capacity. This paper aims to identify the
determinant factors that influence the vulnerability of food farming based on
the characteristics of land resources, climate and water, and socio-economic
factors at the district level in Banten Province, and to develop
recommendations on climate adaptation. Identification of the dominant
factors, which most contribute to the level of vulnerability, is one of the main
considerations to determine the strategy of adaptation. Our results showed
that the main determinant factors varied among districts. The most important
factors were Oldeman’s climate type (SEI12), the ratio of the number of
extension agents to rice field area (ACI3), and the ratio of the number of
farmer groups to rice field area (ACI4). SEI12 deals with the climate, whereas
ACI3 and ACI4 are related human resources and institutions. Further, although
urban area had high exposure and sensitivity as in rural area, but the adaptive
capacity for the urban area was still high. Therefore, the level of vulnerability
was reduced in urban, but still high in rural area. More efforts are expected to
adapt climate related disaster in rural area.
KEYWORDS
agricultural sector, adaptive capacity index, local adaptation, sensitivity-exposure
index, technology recommendation
INTRODUCTION
Climate change has become a very strategic
issue for the last two decades. Nowadays, the frequency
of climate related disasters, as the climate change im-
pacts, is becoming more frequent. The frequent disas-
ters can disrupt national food production and crop’s
productivity. Therefore, many efforts should be taken
to adapt climate change impacts on agriculture sector,
since the sector is the most vulnerable sectors effected
by climate variability and climate change (Kukal and
Irmak, 2018; Menike and Arachchi, 2016). For instance,
climate change can have indirect impact to farmers' in-
come due to crop failure or decreased productivity
(Rondhi et al., 2019; Saptutyningsih et al., 2020), which
can lead to negative impacts on their food security
(Alam et al., 2017; Bocchiola et al., 2019). To increase
resilience on agriculture sector, the impact of climate
change on agriculture vulnerability level is urgently to
be accounted (Mallari, 2016). Also, the production risks
related to adaptation action, which is suitable for poli-
cymakers, needs for estimation (Reinmuth et al., 2017).
To improve resilience of agriculture sector to climate
related disaster, information on current and future vul-
nerability, risks, and opportunities is required for better
planning and management of agriculture sector in the
future (Cains and Henshel, 2019).
The level of vulnerability is an important
indicator to determine the magnitude of climate
change impacts. Vulnerability is a measure of the nega-

Suciantini et al./Agromet 34 (2): 129-142, 2020
130
tive impacts of climate change that a system cannot
tolerate (Boer et al., 2015a; Chinwendu et al., 2017).
Climate change can have an impact on three
dimensions of vulnerability; the level of sensitivity and
adaptation of an area, the level of exposure to climate
change, and the threat of disasters that occurs in the
region (Thomas et al., 2019). Higher exposure and
sensitivity result in increased vulnerability. The level of
sensitivity is closely related to the level of vulnerability
of the system in response to the adverse impacts, while
the level of adaptation is the ability of the system to
overcome the adverse impacts (Wichern et al., 2019).
These three dimensions are complex interactions of
several important factors, namely; human, natural,
financial, social, and physics (Pandey et al., 2017). The
important factors comprise of social and biophysical
aspects that need to be considered in a holistic
approach to vulnerability analysis (Lee, 2017). Vulnera-
bility is dynamic and contextual, which is determined by
the continuous interaction of various exogenous and
endogenous stressors in addition to the associated
components that interact with the vulnerability (Naylor
et al., 2020), such as the affected system (Morel et al.,
2019) and potential loss or danger (Noy and Yonson,
2018). In addition, the existence of institution may alter
the vulnerability (Rufat et al., 2015). Climate vulnera-
bility factors are required to be anticipated by perfor-
ming long-term actions (Jakariya et al., 2020) by formu-
lating adaptation strategies to address vulnerabilities
and developing technology-based solutions.
Determinant factor is a very important stage to
be examined carefully in vulnerability analysis. Deter-
minant factors can be considered as determinant of
vulnerability, also as benchmarks for comparison on
national scale (Sujakhu et al., 2018). Vulnerability
assessment may differ significantly in the same geo-
graphic area, depending on the indicators selected, the
weighting mechanisms, and the methods used (Neset
et al., 2019). Considering that vulnerability differs
among regions, the management of vulnerability is
highly dependent on local management (Papathoma-
Köhle et al., 2019). Perdinan et al. (2015) stated that the
preparation and implementation of adaptation at the
local level are closely related to the understanding,
socio-economic conditions of the community, and the
preparation of adaptation programs. This was consis-
tent to other study in Italy (Papathoma-Köhle et al.,
2019) that mentioned indicators of vulnerability were
not generally applicable in all regions. There were three
approaches for vulnerability analysis, including mecha-
nistic, correlative, and trait-based (de los Ríos et al.,
2018). The mechanistic approach utilizes process-based
analysis, such as biological processes analysis, energy
equilibrium equations and interactions, etc. The corre-
lative approach includes predicting changes in species
distribution due to climate change. The trait-based
approach combines the components of vulnerability
(exposure, sensitivity, and adaptive capacity) with se-
lected biological features.
In agricultural sector, vulnerability is technically
related to land use systems and soil properties,
cropping patterns, management of soil, water and crop,
and crop varieties (Kantamaneni et al., 2020). Deter-
minant factors of vulnerability in crop farming are
required to rule the direction and strategies of adap-
tation programs, therefore the high vulnerability level
can be avoided or reduced. Determinant factors are the
dominant determinants of sensitivity, exposure, and
adaptive capacity. Increased vulnerability is expected
when the level of exposure and sensitivity is high
(Koutroulis et al., 2019). Improvement of food vulnera-
bility indicator will have a direct or indirect impact on
food security. By undertanding the determinant factors
in a certain area, it is possible to determine the selec-
tion of adaptation technology according to regional
conditions. Tyler et al. (2016) explained that there were
several criteria for indicators selection, namely: (i)
observable and verifiable, (ii) quantitative or qualitative,
(iii) relevant to local decision making, (iv) specific, (v)
measurable, (vi) actionable, (vii) dynamic, and (viii) de-
pendent on available data.
The adaptive capacity index (ACI) and the
sensitivity-exposure index (SEI) are functions that re-
present the vulnerability index of lowland agriculture
related to climate change (Boer et al., 2015b;
Estiningtyas et al., 2016a). ACI is calculated based on in-
dicators related to adaptation activities that affect the
level of agricultural vulnerability. SEI is calculated based
on indicators that are vulnerable to exposure and sensi-
tive when climate change occurs. Assessment of vulne-
rability level used the quadrant method and weighting
method. ACI is plotted on the X-axis and SEI on the Y-
axis, because to the level of vulnerability, adaptation is
inversely proportional while exposure and sensitivity
are directly proportional. The distribution of vulnerabi-
lity level of food farming ranges from very low to very
high. Here, we applied ACI and SEI approach to analyze
vulnerability level of agriculture sector in Banten
Province. Previous studies revealed that this province
was affected by climate related variability and change
(Estiningtyas et al., 2016b; Mulyaqin, 2020). In Banten,
four districts (Pandeglang, Lebak, Serang, and
Tangerang) were categorized as very high level of
vulnerability to crop farming (Estiningtyas et al., 2016b).
However, the cause of very high vulnerability in
the four districts remains research challenge, therefore
information on the determinant factors affecting very
high vulnerability is required. This study aims to identify
Suciantini et al./Agromet 34 (2): 129-142, 2020
131
the determinant factor affecting vulnerability of crop
farming based on aspect of land, climate, water, and
socio-economic activities in district level. Also, to
propose policy recommendations related to climate
change adaptation based on vulnerability level.
RESEARCH METHODS
General Conditions of Banten Province
Banten Province is geographically located at the
western Java Island, between 5° 07'50 "- 7° 01'1" S and
105° 01'11 "- 106° 07'12" E, and is directly adjacent to
West Java Province and DKI Jakarta. This province has
an area of 9.663 km2 or only 0.51% of the entire land
area of Indonesia. Topographically, the altitude ranges
0-2000 m above sea level, but most area are located in
the lowland area (<200 m asl). The altitude higher than
200 m asl is partly found in Lebak, Pandeglang, and
Serang Regency. Locations above 1,000 m are
mountainous area around Mount of Halimun. In Banten,
administratively there are four regencies (Pandeglang,
Lebak, Tangerang, and Serang), and four cities
(Tangerang, Cilegon, Serang, and South Tangerang)
(The Central Bureau of Statistics of Banten Province,
2016).
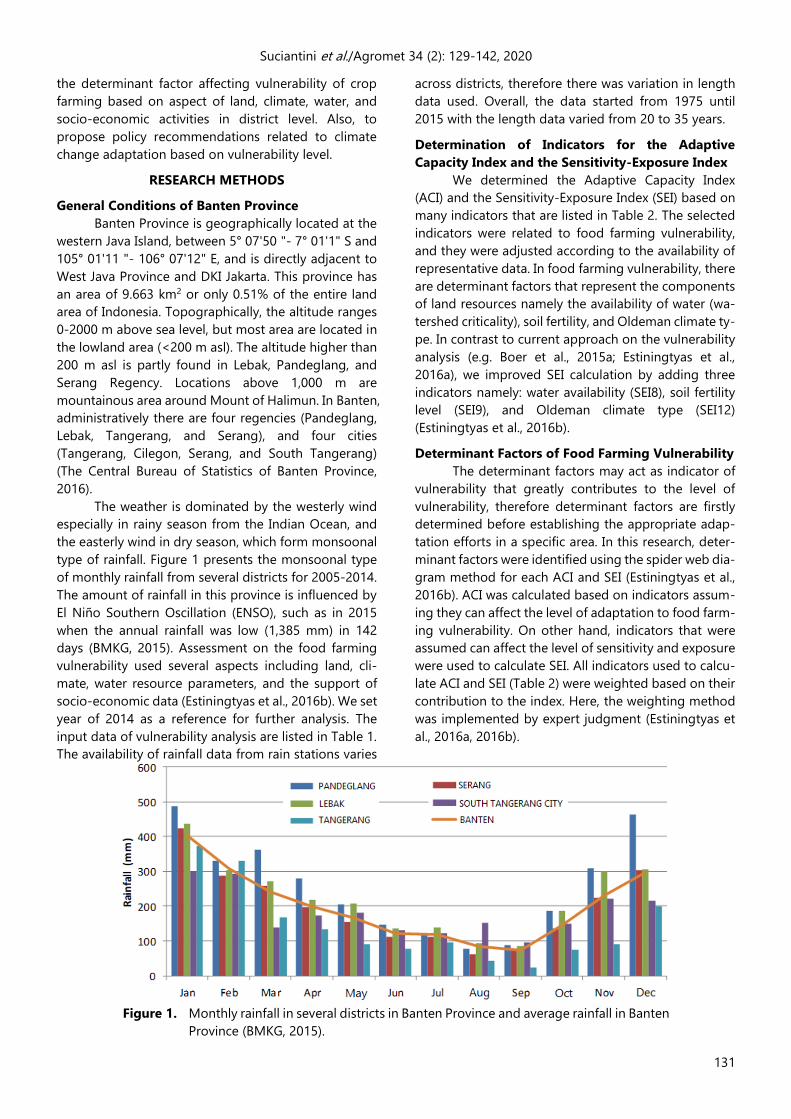
The weather is dominated by the westerly wind
especially in rainy season from the Indian Ocean, and
the easterly wind in dry season, which form monsoonal
type of rainfall. Figure 1 presents the monsoonal type
of monthly rainfall from several districts for 2005-2014.
The amount of rainfall in this province is influenced by
El Niño Southern Oscillation (ENSO), such as in 2015
when the annual rainfall was low (1,385 mm) in 142
days (BMKG, 2015). Assessment on the food farming
vulnerability used several aspects including land, cli-
mate, water resource parameters, and the support of
socio-economic data (Estiningtyas et al., 2016b). We set
year of 2014 as a reference for further analysis. The
input data of vulnerability analysis are listed in Table 1.
The availability of rainfall data from rain stations varies
across districts, therefore there was variation in length
data used. Overall, the data started from 1975 until
2015 with the length data varied from 20 to 35 years.
Determination of Indicators for the Adaptive
Capacity Index and the Sensitivity-Exposure Index
We determined the Adaptive Capacity Index
(ACI) and the Sensitivity-Exposure Index (SEI) based on
many indicators that are listed in Table 2. The selected
indicators were related to food farming vulnerability,
and they were adjusted according to the availability of
representative data. In food farming vulnerability, there
are determinant factors that represent the components
of land resources namely the availability of water (wa-
tershed criticality), soil fertility, and Oldeman climate ty-
pe. In contrast to current approach on the vulnerability
analysis (e.g. Boer et al., 2015a; Estiningtyas et al.,
2016a), we improved SEI calculation by adding three
indicators namely: water availability (SEI8), soil fertility
level (SEI9), and Oldeman climate type (SEI12)
(Estiningtyas et al., 2016b).
Determinant Factors of Food Farming Vulnerability
The determinant factors may act as indicator of
vulnerability that greatly contributes to the level of
vulnerability, therefore determinant factors are firstly
determined before establishing the appropriate adap-
tation efforts in a specific area. In this research, deter-
minant factors were identified using the spider web dia-
gram method for each ACI and SEI (Estiningtyas et al.,
2016b). ACI was calculated based on indicators assum-
ing they can affect the level of adaptation to food farm-
ing vulnerability. On other hand, indicators that were
assumed can affect the level of sensitivity and exposure
were used to calculate SEI. All indicators used to calcu-
late ACI and SEI (Table 2) were weighted based on their
contribution to the index. Here, the weighting method
was implemented by expert judgment (Estiningtyas et
al., 2016a, 2016b).
Figure 1. Monthly rainfall in several districts in Banten Province and average rainfall in Banten
Province (BMKG, 2015).

Suciantini et al./Agromet 34 (2): 129-142, 2020
132
Table 1. List of the research data used in this study
No. Data Resolution Source
1 Soil map 1: 250,000 Indonesian Center for Agricultural Land Resources
Research and Development/ICALRRD (BBSDLP) in
1998-2015
2 Ricefield map 1: 5,000 Center for Data and Information System- Ministry
of Agriculture (Pusdatin) in 2014
3 Rainfall - Meteorological, Climatological, and Geophysical
Agency (BMKG), Ministry of Publik Work,
Indonesian Agro-Climate and Hydrology
Institute/IAHRI (Balitklimat) database (1975-2015)
4 Type and area of irrigation - The Central Bureau of Statistics (BPS) in 2014
5 Number of reservoirs per area - Ministry of Publik Work in 2014
6 Length of irrigation network per area - Ministry of Publik Work in 2014
7 Crop production - The Central Bureau of Statistics (BPS) in 2014
8 Land area - The Central Bureau of Statistics (BPS) in 2014
9 Harvested area - The Central Bureau of Statistics (BPS) in 2014
10 Farmer household - National Socio-Economics Survey Data 2013 The
Central Bureau of Statistics (Susenas-BPS)
11 School participation rate - The Central Bureau of Statistics (BPS) in 2014
12 Road length according to surface
conditions
- The Central Bureau of Statistics (BPS) in 2014
13 Number of extension agents - Center for Data and Information System-Ministry
of Agriculture (Pusdatin) in 2014
14 Number of farmer groups (Poktan) - Center for Data and Information System-Ministry
of Agriculture (Pusdatin) in 2014
15 Number and types of agricultural
machinery
- Integrated Cropping Calendar version 2.4
16 Food consumption - National Socio-Economics Survey Data 2013 The
Central Bureau of Statistics (Susenas-BPS)
17 Food expenditure - National Socio-Economics Survey Data 2013 The
Central Bureau of Statistics (Susenas-BPS)
18 Percentage of poor people - The Central Bureau of Statistics (BPS) in 2014
19 Gross Regional Domestic Product
(GRDP)
- The Central Bureau of Statistics (BPS) in 2014
20 Coefficients to measure the income
and wealth gap (GINI index)
- National Socio-Economics Survey Data 2013 The
Central Bureau of Statistics (Susenas-BPS)
21 Agroclimate type - Oldeman (1975)
22 Population density - The Central Bureau of Statistics (BPS) in 2014
23 Indonesian administration - The Central Bureau of Statistics (BPS) and the
Geospatial Information Agency (BIG) in 2013
Weighting of ACI and SEI for Vulnerability Index
analysis
To obtain indicator value between 0 and 1, all of
data were normalized, ranked, and weighted.
Estiningtyas et al. (2016b) mentioned that the weigh-
ting was subjective depending on the knowledge of
experts related to the important indicators’ relevance
for the level of consumption and production. Equation
(1) and (2) are used for computing ACI and SEI.
𝐴CI =1
WACI+∑Wpi . Ipi (1)
SEI =1
WSEI+ ∑Wci. Ici (2)
where i = the i-th weighting factor, W = the weight for
each indicator from the i-th district, and I = the vulnera-
bility indicator (Estiningtyas et al., 2016b).
The ACI and SEI were then plotted on the spider
web diagram separately, based on all indicators that
constructed each index. The determinant factor for the
SEI was obtained by identifying indicators that have a
substantial contribution to vulnerability, which resulted
in a high index value. On the spider web diagram, the
determinant factor of SEI was identified by the indica-
tors that have a value >0.5, whereas an indicated value

Suciantini et al./Agromet 34 (2): 129-142, 2020
133
<0.5 for ACI. The determinant factor for ACI means that
the indicators need improvement (Estiningtyas et al.,
2016b).
Survey and Interview
Based on the level of vulnerability and the deter-
minant factors that affected the vulnerability, various
adaptation efforts were identified. Further, to decide
adaptation efforts that can be implemented, a survey
was carried out by interviewing policymakers, extension
officers, or farmer groups to collect information on
each district based on previous research (Estiningtyas
et al., 2016b). Field survey to verify applicable techno-
logy related to land and water resources was done in
Pandeglang and Lebak Districts.
Food Farming Vulnerability in Banten Province
Previous study revealed that there were four
districts in Province Banten, in which their food farming
vulnerability was categorized as very high level
(Estiningtyas et al., 2016b). The same study also repor-
ted that one district was in medium vulnerability, while
three districts had low vulnerability level. Districts that
were categorized as very high concentrated in Pande-
glang, Lebak, Serang, and Tangerang (Figure 2). More
actively adaptation actions were proposed in the highly
vulnerable districts to increase adaptation capability of
the district in response to climate change. The vulnera-
bility level indicates that the higher the vulnerability of
district, the more sensitive the district to climate change
(Handayani et al., 2017). The area affected by climate
change even in a low scale was more intense in the area
having low vulnerability compared to the area that not
vulnerable. In areas with medium and low levels of vul-
nerability, which were generally located in urban areas
(Figure 2), it is possible to have better adaptation readi-
ness, because they had a wider adaptation or were not
sensitive to climate shocks (Estiningtyas et al., 2016b).
RESULTS AND DISCUSSIONS
Determinant Factors of Food Farming Vulnerability
in Banten Province
Figure 3 presents the vulnerability level for Banten
Province, which shows contribution of each indicator
(determinant factor) that affects ACI and SEI. Based on
our analysis, area with high vulnerability needs more
adaptation actions. To increase adaptation capacity,
determinant factor should be improved. For ACI,
determinant factors included; ACI3 (ratio of the number
of extension workers to rice field area), ACI4 (ratio of
total farmer groups (poktan) to rice field area), ACI2
(road length based on surface conditions), ACI1 (school
participation rate), and ACI6 (ratio of food consumption
to total household expenditure).
On other hand, the high vulnerability area was
treated by lowering SEI indicators. The determinant
factors of SEI included; SEI12 (Oldeman climate type),
SEI3 (entropy), SEI1 (ratio of rice consumption to total
carbohydrate food), SEI8 (water availability (criticality
level of the watershed)), SEI15 (ratio of agricultural food
land area to area), SEI9 (soil fertility level) ), SEI4 (ratio
of expenditure on rice to total expenditure on food),
SEI6 (ratio of rice and maize production to population),
SEI10 (ratio of agricultural GRDP to total GRDP), SEI7
(ratio of soybean production to population), and SEI13
Figure 2. Map of Food Farming Vulnerability of Banten Province (Estiningtyas et
al., 2016b).

Suciantini et al./Agromet 34 (2): 129-142, 2020
134
Table 2. Input data to represent the indicator of Adaptive Capacity Index (ACI) and Sensitivity-
Exposure Index (SEI)
Indicators Definition
Adaptive Capacity Index (ACI)
ACI1 School Participation Rate
ACI2 Road length based on surface conditions
ACI3 Ratio of the number of extension agents to rice field area
ACI4 Ratio of the number of farmer groups (poktan) to rice field area
ACI5 Ratio of the number of agricultural machinery to rice field area
ACI6 Ratio of the value of food consumption to the total value of household expenditure
Sensitivity-Exposure Index (SEI)
SEI1 Ratio of rice consumption to total carbohydrate food
SEI2 Rice consumption per capita
SEI3 Entropy (food diversification level)
SEI4 Ratio of expenditure on rice to total expenditure on food
SEI5 Percentage of poor people
SEI6 Ratio of rice and maize production to total population
SEI7 Ratio of soybean production to total population
SEI8 Water availability
SEI9 Soil fertility level
SEI10 Ratio of agricultural GRDP to total GRDP
SEI11 GINI index (income gap)
SEI12 Climate type (Oldeman)
SEI13 Ratio of farmer households to total households
SEI14 Population density
SEI15 Ratio of land area for agriculture to total area
Source : Estiningtyas et al. (2016a, 2016b)
(ratio of farmer households to total households).
Understanding both the ACI and SEI indicators, which
were as determinant factors, can be a basis for formu-
lating appropriate programs for local governments in
response to threat of climate change, and in efforts to
improve food security and community welfare, in this
case, the farming community in the implementation of
food farming.
To increase the ACI indicators, several efforts are
listed here (Estiningtyas et al., 2016b);
1. ACI3 (ratio of the number of extension workers
to rice field area), needs: (i) improvement on
the extension agency, guidance, and super-
vision, (ii) improvement on the welfare of
extension workers, and (iii) recruitment the new
member of extension workers;
2. ACI4 (ratio of total farmer groups (poktan) to
rice field area), was by recruitment more
farmers to increase the number of farmer
groups. Other efforts were by improving far-
mer institutions and empowering the capacity
of farmer groups;
3. ACI2 (road length based on surface conditions).
Government should build or repair farming in-
frastructure. Therefore, the distribution of food
products goes well;
4. ACI1 (school participation rate), were by
supporting the 12-years compulsory education
program, by equitable distribution of educa-
tional facilities, and by providing learning mo-
dules related to technical aspects;
5. ACI6 (ratio of the value of food consumption to
the total value of household expenditures). The
efforts to diversify food and develop local non-
rice food can be encouraged. The lower food
consumption than food production, the higher
adaptive capacity.
To reduce the SEI indicators, several actions
could be performed (Estiningtyas et al., 2016b);
1. SEI12 (Oldeman climate type), efforts that can
be implemented include: (i) adjusting farming
to climate conditions, (ii) following the planting
calendar, and (iii) providing alternative irriga-
tion and irrigation infrastructure;

Suciantini et al./Agromet 34 (2): 129-142, 2020
135
2. SEI3 (entropy) and SEI1 (ratio of rice
consumption to total carbohydrate food), it
was recommended to plant in yards to fulfill
household needs and to develop local non-rice
for food diversification;
3. SEI8 (the availability of water-criticality level of
the watershed), were by: (i) restoration of criti-
cal watersheds, (ii) improvement and develop-
ment of infrastructure and irrigation networks,
and (iii) socialization and implementation of
water-saving cultivation technology. Activities
related to water availability have been pro-
grammed by the Banten Provincial Govern-
ment as listed in Banten Provincial Regulation
No. 5 of 2017 namely integrated watershed de-
velopment, development of reservoirs, and
construction of irrigation channels (Bappeda
Provinsi Banten, 2017);
4. SEI15 (ratio of land area for food agriculture to
total area), were by open new agricultural land
and transmigration;
5. SEI9 (level of soil fertility), efforts to reduce SEI
were by implemented: (i) the tolerant rice and
efficient fertilization, (ii) balanced and site spe-
cific fertilization, and (iii) soil and water conse-
rvation;
6. SEI4 (ratio of expenditure on rice to total
expenditure), were by food diversification, con-
trolling rice prices, and non-rice food subsidies;
7. SEI14 (population density), the recommen-
dation was transmigration, which was adjusted
to the Agrarian reform;
8. SEI6 (ratio of production of rice and maize to
population) and SEI7 (ratio of soybean produc-
tion to population). It was recommended to
increase the production of these commodities;
9. SEI10 (ratio of agricultural GRDP to total GRDP),
were by drive the regional economy, increase
agricultural GRDP, and promote micro-scale
industrial activities and businesses;
10. SEI13 (ratio of farmer household to household
population), was by improving the skills of
farmers through training and development of
non-agricultural businesses.
Determinant Factors of Food Farming in District
Level
Pandeglang and Lebak Districts had similar
determinant factors for ACI, namely ACI1, ACI2, ACI3, ACI4, and ACI6 (Figures 4a and 4c). The ratio of food consumption value (ACI6) may be raised by improving diversification of food, while the improvement on num-
ber of extension officers in each district will increase the
value of ACI3 indicator. The school participation rate
(ACI1) is risen by complying the 12-years compulsory
education. Enhancement on the role of the institution
in the village and active participation of farmers in the
meeting and related training will raise the ratio of the
number of farmer groups (ACI4). Good transportation
facilities and road infrastructure are all supporting
factors that make it easier for farmers to get the needs
for cultivation (Estiningtyas et al., 2016b) that probably
increase the ACI2.
The determination of determinant factors for SEI
covers 15 types. The 3-dominant determinant factors
for SEI in Pandeglang were SEI1, SEI3, and SEI4, while in
Lebak were SEI8, SEI7, and SEI12. Those determinant
factors for SEI were management priorities to increase
the adaptation capacity. For example, in SEI12, several
efforts were listed such as adjusting crop cultivation,
cropping patterns, planting time, planting intensity,
and varieties based on the type of climate in the loca-
tion. Hence, losses due to climate risk can be minimized.
The use of an integrated planting calendar is one of the
recommended efforts.
Another example is the ratio of expenditure on
rice to total expenses (SEI4). To reduce the SEI4, it needs
Figure 3. Spider graph of ACI (a) dan SEI (b) at a very high level of vulnerability in
Banten Province (Estiningtyas et al., 2016b).

Suciantini et al./Agromet 34 (2): 129-142, 2020
136
several strategies to reduce household rice consump-
tion, therefore it will reduce the dependence of rice. The
strategies were among others: food diversification, in-
crease income that lead the variation consumption, sta-
ble rice prices, provide subsidies for non-rice food, and
build sustainable food home areas (KRPL). One study
analyzed that KRPL program was able to reduce expen-
diture on food consumption and to increase energy
and protein consumption (Purwantini et al., 2016).
The determinant factors for ACI in Serang were
ACI4, ACI3, ACI2, ACI1, and ACI6 (Figure 4e), while for
SEI, the 3-dominant determinant factors include SEI12,
SEI3, and SEI1 (Figure 4f). In Tangerang, the deter-
minant factors for ACI were ACI2, ACI3, ACI4, ACI5, and
ACI1 (Figure 4g). On other hand, the 3-determinant
factors of SEI in Tangerang include; SEI12, SEI3, and
SEI14 (Figure 4h). Based on the main determinant
factors in each district (Figures 4 and 5), SEI12 was the
main indicator that was found in many districts. SEI12
associated with climate, especially rainfall and its
distribution. Therefore, the right solution to minimize
the loss of food farming related to climate risk is neces-
sary. For rainfall variable, there were two parameters
that were considered for analysis namely the beginning
of rainy season and the length of rainy season. In res-
ponse to crop cultivation, rainfall influenced the availa-
bility of water that can affect the productivity and pro-
duction of crop farm. Previous studies reported that
rainfall substantially influences the development of
food crops (Estiningtyas et al., 2020; Farhan et al., 2020).
Generally, the length of rainy season in Banten was
around 3 to 6 months, with the beginning season in
October and November. Several efforts to minimize the
production losses include; providing alternative water
sources, adjusting farming to climate conditions, imple-
menting a planting calendar, and developing irrigation
infrastructure.
In districts with a very high level of vulnerability,
such as in Pandeglang, Lebak, Serang, and Tangerang,
the following indicators of SEI were dominant in
addition to SEI12, namely SEI1, SEI3, SEI4, and SEI10.
The indicators of SEI1, SEI3, and SEI4 are related to food,
therefore similar efforts may work to decline their indi-
cator values. The efforts were among others; diversi-
fying food especially from rice to non-rice with prefe-
rably local food, developing non-rice food technology,
controlling rice prices and non-rice food subsidies, im-
plementing KRPL, and increasing income (Estiningtyas
et al., 2016b).
Food diversification is related to consumption
patterns, public food expenditure, and public protein
consumption. To increase food security in Indonesia,
food diversification was proposed (Ariani, 2019). Food
diversification can be done with increasing the con-
sumption of yams, animal food, vegetables, and fruit,
but by reducing the rice consumption.
From the ACI perspective, the main determinant
factors that were required to improve were ACI3 and
ACI4. Several actions to increase the performance or
both factors included an increase of human resource
capacity and its institutional resource. For instance; (i)
improving extension agencies, (ii) assigning new exten-
sion officers, (iii) improving advocation and control, (iv)
improving welfare to increase the work ethic of exten-
sion workers, (v) improving farmer group institutions
(poktan), (vi) increasing the number of farmer groups
(poktan), and (vii) increasing the capacity of poktan and
empowering poktan (Estiningtyas et al., 2016b).
Figures 4 and 5 show that in urban areas with low
to medium level of vulnerability. The urban areas may
still have an exposure or sensitivity, but high adaptive
capacity. Therefore, some urban areas like in Tangerang
City did not have determinant factor of ACI, indicating
the high ability to adapt in urban area. The high adap-
tability can reduce the level of sensitivity or exposure.
However, different situation was found in rural area,
where each adaptation was relatively low.
Recommendations for Adaptation Technology in
Banten Province
Adaptation technology recommendations were
compiled based on determinant factors, and were
aligned with adaptation actions and programs as listed
in the Regional Medium-Term Development Plan
(RPJMD). The recommendations aim to reduce the level
of vulnerability through adaptation option of climate
change. The knowledge about vulnerability level can be
used by policymakers to decide the appropriate poli-
cies related to climate risk (Ford et al., 2018). But recom-
mendations were site-specific according to each district.
Table 3 presents adaptation efforts that can be
performed according to the determinant factors of ACI
and SEI in Banten Province. The survey and interview
were performed in Pandeglang and Lebak Districts. The
two districts are agricultural areas that are prone to
floods or drought. The prone areas were found in
southern Pandeglang, including Patia Sub-district and
Pagelaran Sub-district. For Lebak, the prone areas were
in Warung Gunung Sub-district and Malingping Sub-
district. Based on our survey, generally cropping
pattern of rice was twice a year, but three times a year
for area with sufficient water.
Survey and Interview Results
Agricultural activities were supported by use of
agricultural machinery, especially tractors and combine
harvesters. There was an action on Rural Food Self-
Sufficiency Program (Program Desa Mandiri Pangan)
starting from 2012, in the form of coordination in meet-

Suciantini et al./Agromet 34 (2): 129-142, 2020
137
ings and supervising. Several obstacles faced by the
farming community in the two case study area were: (i)
human resources (not having extensive land, too many
farmers, and field agricultural extension activity needs
improvement), (ii) geographic location (more rainfed
land, but less irrigated land), (iii) road infrastructure, (iv)
silting rivers, (v) the planting calendar has not been well
socialized to farmers, (vi) pests (especially brown
planthopper and stem borer), (vii) high conversion of
agricultural land, and (viii) high salinity in some
locations. In Lebak, several actions have been perform-
ed to support agricultural activities among others the
Figure 4. The spider web diagram (left) for ACI in District (a) Padeglang, (c) Lebak,
(e) Serang, and (g) Tangerang. The spider web diagram (right) for SEI in
District (b) Pandeglang, (d) Lebak, (f) Serang, and (h) Tangerang.

Suciantini et al./Agromet 34 (2): 129-142, 2020
138
use of submersible pumps (boreholes) from the
government to overcome drought and agricultural
machinery such as tractors. Several farmers have
already participated in insurance for agriculture, and
other farmers have implemented the jajar legowo
cropping system. Problems faced by farming
communities in both the case studies are generally
similar to Pandeglang, such as; human resources
(cultivated land is not wide, lack of agricultural
extension agents), water availability, floods due to dam
Figure 5. The spider web diagram (left) for ACI in City of (a) Tangerang, (c)
Cilegon, (e) Serang, and (g) Tangerang Selatan. The spider web
diagram (right) for SEI in City of (b) Tangerang, (d) Cilegon, (f) Serang,
and (h) Tangerang Selatan.

Suciantini et al./Agromet 34 (2): 129-142, 2020
139
Table 3. Technology recommendations based on determinant factors for ACI and SEI in Banten Province
(modified from Estiningtyas et al., 2016b)
Determinants Districts Recommendations
Adaptive Capacity Index (ACI)
ACI1 Pandeglang, Lebak, Serang
Regency, Tangerang Regency,
Serang City
12-year compulsory education program, equitable distribu-
tion of educational facilities to the village level, and enrich-
ment of educational modules related to technical aspects and
adaptation to formal education
ACI2 Pandeglang, Lebak, Serang
Regency, Tangerang Regency
Repairing and building road infrastructure, also providing
education and training on adaptive technology skills
ACI3 All districts, except Tangerang
City
Improving extension agents, recruiting new extension
workers, coaching, advocating and monitoring, and improv-
ing welfare to increase the work ethic of extension workers
ACI4 Pandeglang, Lebak, Serang
Regency, Tangerang Regency,
Serang City
Improving farmer groups’ (poktan) institutions and increasing
the number of poktan, increasing the capacity of poktan, and
empowering poktan
ACI5 Tangerang Regency,
Serang City
Site-specific agricultural machinery assistance as needed and
providing spare parts, optimizing existing machinery, al-
so developing and engineering the Agricultural Machinery
Services Business Farmer Group (UPJA)
ACI6 Pandeglang, Lebak, Serang
Regency
Food diversification, local non-rice food development,
and food home area (KRPL/Kawasan Rumah Pangan Lestari)
Sensitivity-Exposure Index
(SEI)
SEI1 Pandeglang, Serang Regency,
and Tangerang Regency
Food diversification, especially from rice to non-
rice, particularly local food; the development of local pro-
duction of food technology non rice (process technology
and KRPL)
SEI2 Tangerang City and
Cilegon
Food diversification, local non-rice food development (variety
diversification, production and process technology), and KRPL
SEI3 Pandeglang, Serang Regency,
and Tangerang Regency
Increased food diversification, developed the local non-
rice food, and developed KRPL
SEI4 Pandeglang and Lebak Increase revenue, control the price of rice and subsi-
dized food of non-rice, also food diversification and KRPL
SEI5 None
SEI6 Tangerang, Cilegon City,
Serang City, and South
Tangerang City
Increased production of rice and maize, and improved the
diversification of cropping patterns
SEI7 Lebak and South Tangerang Increase in soybean production, and repair and develop-
ment of irrigation infrastructure
SEI8 Lebak and Serang Regency Dissemination and implementation of water-saving
technology in rice cultivation, implementing irrigation net-
work improvement programs, repairing critical watersheds,
repairing and developing irrigation infrastructure, especially
the development of water harvessing infrastructure (reser-
voirs, long storage, and trench dams) and the application of
specific location for Integrated Crop Management (PTT)
SEI9 Pandeglang and Lebak Balance fertilization (the use of organic materials/fertilizers)
specific to location, using tolerant varieties, efficient fertiliza-
tion rice varieties, and soil management and conservation.
SEI10 All districts, except
Pandeglang and Lebak
Development of various sources of production/community
economic growth, such as household business/industrial acti-

Suciantini et al./Agromet 34 (2): 129-142, 2020
140
vities, increasing agricultural GDP, driving the regio-
nal economy, and increasing the role of women
SEI11 None
SEI12 All districts
in Banten Province
Adapting, providing alternative water sources, farming
adjusts to the climatic conditions, implementing the planting
calendar, developing irrigation infrastructure and water
harvesting, and using alternative water resource
SEI13 None
SEI14 All cities in Banten Province Transmigration, which is synergized with the implementation
of the agrarian reform program, review of the RTRW, and the
implementation of UU No.41 / 29 P2L B
SEI15 City of Serang Creating new agricultural lands and transmigration in synergy
with the implementation of the agrarian reform program
failure, the planting calendar has not been well socializ-
ed to farmers, pests (especially brown planthopper), the
low rate of willingness to buy fertilizers, availability of
seeds and not many farmers understand the use of
superior variety, and irrigation infrastructure.
Adaptation recommendations that can be imple-
mented in Pandeglang and Lebak for instance: (i) the
need for technical handling of irrigation problems, such
as repairing channels through dredging, river norma-
lization; (ii) the use of ‘caplak jarwo’, traditional farming
tools, for implementation ‘jajar legowo’ cropping sys-
tem; (iii) the use of dryer to reduce the sales of wet
grain; (iv) improvement on road infrastructure; (v) intro-
ducing Integrated Planting Calendar to farmers, school
of field climate, and agricultural insurance or other
programs that support adaptation actions that can be
applied in that location; (vi) encouragement to use
other superior varieties, especially those that are resis-
tant to drought and floods; (vii) planting simultaneous-
ly to suppress the increase of pests; (viii) promoting
production aspects by utilizing sub-optimal lands, idle
lands, etc.; (ix) implementation of the Integrated
Planting Calendar in the field to adapt with high climate
variability; (x) improvements on infrastructure at the
farm level; and (xi) increasing farmer institutions and
promoting food diversification.
CONCLUSSIONS
We found that high vulnerability of crop
farming was associated with low adaptive capacity
index and high sensitivity-exposure index. To decline
the vulnerability level, several efforts were proposed to
increase ACI and reduce SEI. Here, we used determinant
factors as approach to explore the important indicators
for ACI and SEI for area in Pandeglang, Lebak, Serang,
and Tangerang Districts. Our findings revealed that the
indicators varied among districts. For Pandeglang, ACI3
and SEI1 were the determinant factors, while in Lebak
were ACI6 and SEI8. The determinant factors found in
Tangerang were ACI2 and SEI12, whereas in Serang City
and Serang were ACI4 and SEI12. Tangerang City had
SEI12 as determinant factor. On other hand, Cilegon
City and Tangerang Selatan City had ACI3 and SEI12 as
determinant factors.
The determinant factors found in most of the
districts were SEI12, SEI4, ACI3, and ACI4. SEI12 is
climate related indicator. Adaptation actions related to
SEI12 include; providing alternative water sources,
adapting farming to climate conditions, implementing
a planting calendar, development infrastructure for
irrigation and water harvest, and the use of alternative
water resources. To reduce value of SEI4, several efforts
were proposed, namely: food diversification, control-
ling rice prices and subsidy for non-rice food and
building sustainable food house areas (KRPL). For ACI3
and ACI4, improvements were as follow: increasing the
capacity and resilience of the production system
through the cultivation approach including opening
the new rice fields, improving human and institutional
capacity, and accelerating food diversification.
ACKNOWLEDGEMENTS
The authors thank to Prof. Dr. Irsal Las, MS, and
Prof. Dr. Erna Sri Adiningsih, MS for their inputs to
improve the manuscript. Special thanks to Adilla, Revo,
and Dariin Firda for helping in database and mapping.
This paper was funded by the 2016 Agricultural land
resource management policy recommendations
activities financed by state budget of BALITKLIMAT
(Indonesian Agro-Climate and Hydrology Resesarch
Institute) with grant number 1800.107.001.412 H.
REFERENCES
Alam, M.M., Siwar, C., Talib, B.A., Wahid, A.N., 2017.
Climatic changes and vulnerability of
household food accessibility. International
Journal of Climate Change Strategies and
Management.
Ariani, M., 2019. Arah, Kendala dan Pentingnya
Diversifikasi Konsumsi Pangan di Indonesia.
Bappeda Provinsi Banten, 2017. Peraturan Daerah
Provinsi Banten Nomor 5 Tahun 2017 Tentang

Suciantini et al./Agromet 34 (2): 129-142, 2020
141
Perubahan Atas Peraturan Daerah Provinsi
Banten Nomor 2 Tahun 2011 Tentang Rencana
Tata Ruang Wilayah Provinsi Banten Tahun
2010-2030.
BMKG, 2015. Data dasarian untuk Kementan sepuluh
tahun. Badan Meteorologi, Klimatologi dan
Geofisika.
Bocchiola, D., Brunetti, L., Soncini, A., Polinelli, F.,
Gianinetto, M., 2019. Impact of climate change
on agricultural productivity and food security
in the Himalayas: A case study in Nepal.
Agricultural Systems 171, 113–125.
https://doi.org/10.1016/j.agsy.2019.01.008
Boer, R., Perdinan, Faqih, A., Amanah, S., Rakhman, A.,
2015a. Kerentanan Dan Pengelolaan Risiko
Iklim Pada sector Pertanian, Sumberdaya Air &
Sumber Kehidupan Masyarakat Nusa Tenggara
Timur (UNDP-SPARC Project). Kementerian
Lingkungan Hidup dan Kehutanan, Jakarta.
Boer, R., Rakhman, A., Faqih, A., Perdinan, Situmorang,
A., 2015b. Indeks Kerentanan Dan Risiko Iklim
Nusa Tenggara Timur (UNDP-SPARC Project).
Kementerian Lingkungan Hidup dan
Kehutanan, Jakarta.
Cains, M.G., Henshel, D., 2019. Community as an equal
partner for region-based climate change
vulnerability, risk, and resilience assessments.
Current Opinion in Environmental
Sustainability 39, 24–30.
Chinwendu, O.G., Sadiku, S., Okhimamhe, A., Eichie, J.,
2017. Households vulnerability and adaptation
to climate variability induced water stress on
downstream Kaduna River Basin. American
Journal of Climate Change 6, 247–267.
de los Ríos, C., Watson, J.E., Butt, N., 2018. Persistence
of methodological, taxonomical, and
geographical bias in assessments of species’
vulnerability to climate change: A review.
Global Ecology and Conservation 15, e00412.
Estiningtyas, W., Susanti, E., Suciantini, 2020. The
efficacy of using climate data for developing
food crops in wetlands: A case study from
Kalimantan Island, in: Proceedings of the
International Workshop on Tropical Wetlands:
Innovation in Mapping and Management.
Taylor & Francis Group, London.
Estiningtyas, W., Surmaini, E., Susanti, E., 2016a.
Kerentanan Sub-sektor tanaman pangan
terhadap perubahan iklim. Jurnal Sumberdaya
Lahan Edisi khusus 85–96.
Estiningtyas, W., Syahbuddin, H., Harmanto,
Sumaryanto, Mulyani, A., Setyorini, D., Kartiwa,
B., Susanti, E., Surmaini, E., Sujono, R., Haryono,
Rakhman, A., Suciantini, Apriyana, Y., Pramudia,
A., Sarvina, Y., Nengsusmoyo, C., Kurniawan, H.,
Nugroho, A., Samudera, R., Hutami, A., 2016b.
Analisis dan Pemetaan Tingkat Kerentanan
Usahatani Tanaman Pangan dan Risiko Iklim
(Laporan Akhir). Balai Penelitian Agroklimat
dan Hidrologi, Badan Penelitian dan
Pengembangan Pertanian, Kementerian
Pertanian.
Farhan, A., Ilhamsyah, Y., Akhyar, 2020. The Use of SST
Anomaly to Predict Seasonal Rainfall during
the Second Planting Period in the Tanoh Abee
Irrigation Area, Aceh Besar. Agromet 34, 100–
109.
https://doi.org/10.29244/j.agromet.34.2.100-
109
Ford, J.D., Pearce, T., McDowell, G., Berrang-Ford, L.,
Sayles, J.S., Belfer, E., 2018. Vulnerability and its
discontents: the past, present, and future of
climate change vulnerability research. Climatic
Change 151, 189–203.
Handayani, W., Rudiarto, I., Setyono, J.S., Chigbu, U.E.,
Sukmawati, A.M., 2017. Vulnerability
assessment: A comparison of three different
city sizes in the coastal area of Central Java,
Indonesia. Advances in Climate Change
Research 8, 286–296.
Jakariya, M., Alam, M.S., Rahman, M.A., Ahmed, S., Elahi,
M.L., Khan, A.M.S., Saad, S., Tamim, H., Ishtiak,
T., Sayem, S.M., 2020. Assessing climate-
induced agricultural vulnerable coastal
communities of Bangladesh using machine
learning techniques. Science of the Total
Environment 742, 140255.
Kantamaneni, K., Rice, L., Yenneti, K., Campos, L.C., 2020.
Assessing the Vulnerability of Agriculture
Systems to Climate Change in Coastal Areas: A
Novel Index. Sustainability 12, 4771.
Koutroulis, A., Papadimitriou, L., Grillakis, M., Tsanis, I.,
Warren, R., Betts, R., 2019. Global water
availability under high-end climate change: A
vulnerability-based assessment. Global and
Planetary Change 175, 52–63.
Kukal, M.S., Irmak, S., 2018. Climate-driven crop yield
and yield variability and climate change
impacts on the US Great Plains agricultural
production. Scientific Reports 8, 1–18.
Lee, Y.-J., 2017. A synthesized biophysical and social
vulnerability assessment for Taiwan. E&ES 94,
012161.
Mallari, A.E.C., 2016. Climate change vulnerability
assessment in the agriculture sector: Typhoon
Santi experience. Procedia-Social and
Behavioral Sciences 216, 440–451.

Suciantini et al./Agromet 34 (2): 129-142, 2020
142
Menike, L., Arachchi, K., 2016. Adaptation to climate
change by smallholder farmers in rural
communities: Evidence from Sri Lanka.
Procedia food science 6, 288–292.
Morel, A.C., Hirons, M., Demissie, S., Gonfa, T., Mehrabi,
Z., Long, P.R., Rifai, S., Gole, T.W., Mason, J.,
McDermott, C.L., 2019. The structures
underpinning vulnerability: examining
landscape-society interactions in a smallholder
coffee agroforestry system. Environmental
Research Letters 14, 075006.
Mulyaqin, T., 2020. The Impact of El Niño and La Nina
on Fluctuation of Rice Production in Banten
Province. Agromet 34, 34–41.
https://doi.org/10.29244/j.agromet.34.1.34-41
Naylor, A., Ford, J., Pearce, T., Van Alstine, J., 2020.
Conceptualizing Climate Vulnerability in
Complex Adaptive Systems. One Earth 2, 444–
454.
Neset, T.-S., Wiréhn, L., Opach, T., Glaas, E., Linnér, B.-O.,
2019. Evaluation of indicators for agricultural
vulnerability to climate change: The case of
Swedish agriculture. Ecological Indicators 105,
571–580.
Noy, I., Yonson, R., 2018. Economic vulnerability and
resilience to natural hazards: A survey of
concepts and measurements. Sustainability 10,
2850.
Oldeman, L.R., 1975. An Agro-climate map of Java
[Indonesia]. Contribution from the Central
Research Institute for Agriculture, Bogor.
Pandey, R., Jha, S.K., Alatalo, J.M., Archie, K.M., Gupta,
A.K., 2017. Sustainable livelihood framework-
based indicators for assessing climate change
vulnerability and adaptation for Himalayan
communities. Ecological Indicators 79, 338–
346.
Papathoma-Köhle, M., Cristofari, G., Wenk, M., Fuchs, S.,
2019. The importance of indicator weights for
vulnerability indices and implications for
decision making in disaster management.
International journal of disaster risk reduction
36, 101103.
Perdinan, Boer, R., Rakhman, A., Situmorang, A.,
Zulaikha, M., Nurbaeti, B., 2015. Pilihan
Adaptasi Perubahan Iklim Nusa Tenggara
Timur (UNDP-SPARC Project). Kementerian
Lingkungan Hidup dan Kehutanan, Jakarta.
Purwantini, T.B., Saptana, S., Suharyono, S., 2016.
Program kawasan rumah pangan lestari (KRPL)
di Kabupaten Pacitan: analisis dampak dan
antisipasi ke depan. Analisis Kebijakan
Pertanian 10, 239–256.
Reinmuth, E., Parker, P., Aurbacher, J., Högy, P., Dabbert,
S., 2017. Modeling perceptions of climatic risk
in crop production. PloS one 12, e0181954.
Rondhi, M., Fatikhul Khasan, A., Mori, Y., Kondo, T., 2019.
Assessing the role of the perceived impact of
climate change on national adaptation policy:
the case of rice farming in Indonesia. Land 8,
81.
Rufat, S., Tate, E., Burton, C.G., Maroof, A.S., 2015. Social
vulnerability to floods: Review of case studies
and implications for measurement.
International Journal of Disaster Risk Reduction
14, 470–486.
Saptutyningsih, E., Diswandi, D., Jaung, W., 2020. Does
social capital matter in climate change
adaptation? A lesson from agricultural sector in
Yogyakarta, Indonesia. Land use policy 95,
104189.
Sujakhu, N.M., Ranjitkar, S., Niraula, R.R., Salim, M.A.,
Nizami, A., Schmidt-Vogt, D., Xu, J., 2018.
Determinants of livelihood vulnerability in
farming communities in two sites in the Asian
Highlands. Water International 43, 165–182.
Thomas, K., Hardy, R.D., Lazrus, H., Mendez, M., Orlove,
B., Rivera‐Collazo, I., Roberts, J.T., Rockman, M.,
Warner, B.P., Winthrop, R., 2019. Explaining
differential vulnerability to climate change: A
social science review. Wiley Interdisciplinary
Reviews: Climate Change 10, e565.
Tyler, S., Nugraha, E., Nguyen, H.K., Van Nguyen, N., Sari,
A.D., Thinpanga, P., Tran, T.T., Verma, S.S., 2016.
Indicators of urban climate resilience: A
contextual approach. Environmental science &
policy 66, 420–426.
Wichern, J., Descheemaeker, K., Giller, K.E., Ebanyat, P.,
Taulya, G., van Wijk, M.T., 2019. Vulnerability
and adaptation options to climate change for
rural livelihoods–A country-wide analysis for
Uganda. Agricultural Systems 176, 102663.
Copyright © 2022 FDOKUMEN