Minimum β-Divergence Estimators of Multivariate Location ...
Flux divergence of nitric acid in the marine atmospheric surface layer
Lise Lotte Sørensen,1 Sara C. Pryor,2 Gerrit de Leeuw,3 and Michael Schulz4
Received 31 August 2004; revised 3 December 2004; accepted 9 March 2005; published 12 August 2005.
[1] It is hypothesized that removal of HNO3 from the atmosphere close to the sea surfaceis due to two processes: dry deposition to the sea surface and chemical reaction withsea spray. The latter process invalidates the application of the constant flux layerassumption to calculate dry deposition based on concentrations of HNO3 at, e.g., areference height of 10 m. A field experiment was carried out to investigate this hypothesis,and the measured concentration profiles were found to differ dramatically from the loglinear profiles, which would have been produced by turbulent transport only. Surfacefluxes of HNO3 were calculated from the measured profiles taking chemical reactions intoaccount and were compared to surface fluxes calculated by the traditional resistancemethod. It was found that the surface fluxes could be a factor of two less when chemicalreactions are taken into account, depending on the characteristics of the near-surfaceaerosols. HNO3 loss rates due to heterogeneous chemistry are calculated by twoindependent methods and are compared.
Citation: Sørensen, L. L., S. C. Pryor, G. de Leeuw, and M. Schulz (2005), Flux divergence of nitric acid in the marine atmospheric
surface layer, J. Geophys. Res., 110, D15306, doi:10.1029/2004JD005403.
1. Introduction
[2] During the past half century, there has been a growingbody of literature dealing with air sea exchange of varioustrace gases [see, e.g., Liss and Duce, 1997]. Much of theattention has been placed on efforts to measure the climaterelevant gases, e.g., carbon dioxide and dimethyl sulfidefluxes. Building on the theoretical base developed by Moninand Obukhov [1954], methods of estimating these fluxeshave typically relied on the assumptions of horizontalhomogeneity and steady state, and it has furthermore beenassumed that the constant flux layer assumption applies tothe lowest tens of meters over the sea, i.e., in the marineatmospheric surface layer.[3] For momentum and/or heat fluxes, the assumptions
supporting the Monin-Obukhov similarity theory are gen-erally satisfied. However, the theory begins to break downwhen one examines the nutrient compounds of interest tomarine ecosystems, such as the nitrogen gases. Unlikemomentum or heat, ammonia (NH3) and nitric acid(HNO3) undergo reactions on fairly short timescales intro-ducing a source/sink term, which must be taken into accountboth in the analysis of experimental data and in models. Ifthe source/sink term is significant, a flux divergence will beintroduced where one cannot simply assume that the flux
measured at a given height above the surface is equivalentto the surface flux.[4] To estimate the deposition/emission of reactive or
nonconservative species, classical flux theory must there-fore be modified in order to take a height-dependent sink/source term into account. Lenschow [1982], Lenschow andDelaney [1987], and Duyzer [1992] have each described theflux divergence for the chemical triad nitrogen dioxide(NO2), nitric oxide (NO) and ozone (O3) with the samegeneral approach and conclusions, and Kramm and Dlugi[1994] have described the flux divergence for NH3, HNO3
and ammonium nitrate (NH4NO3). None of these previousstudies have focused on the marine environment, but theyhave rather emphasized either terrestrial or idealized con-ditions. The few studies designed to estimate reactive tracegas fluxes between the atmosphere and the ocean [Quinn etal., 1988; Sørensen et al., 1994a; Asman et al., 1995;Geernaert et al., 1998], faced unresolvable problems asregards the estimation of the source/sink term with suffi-cient accuracy, given the uncertainties in either the chem-istry or horizontal homogeneity. In the study by Geernaertet al. [1998], data were presented which suggest thatreaction on sea spray may produce a flux divergence ofHNO3. The present paper extends that work with ananalysis of the chemistry involved in the source/sink termbased on the fundamental hypothesis that sea spray is animportant scavenger in the marine atmosphere for highlysoluble gases, specifically HNO3.[5] Because of technological limitations in high-frequency
sampling for HNO3, direct flux measurements using, e.g., theeddy correlation method, are not practical. Instead, indirectmethods, such as the gradient technique, are often used formeasurement of these gas fluxes. However, since the flux ofchemically reactive compounds can be influenced by chem-ical reactions, the interpretation of the profile is often difficult.
JOURNAL OF GEOPHYSICAL RESEARCH, VOL. 110, D15306, doi:10.1029/2004JD005403, 2005
1Department of Wind Energy, Risø National Laboratory, Roskilde,Denmark.
2Atmospheric Science Program, Department of Geography, IndianaUniversity, Bloomington, Indiana, USA.
3TNO-Physics and Electronics Laboratory, The Hague, Netherlands.4Laboratoire des Sciences du Climat et de l’Environnement, CEA/
CNRS–LSCE, Gif-sur-Yvette, France.
Copyright 2005 by the American Geophysical Union.0148-0227/05/2004JD005403$09.00
D15306 1 of 12

This paper will serve to demonstrate that the flux divergencecan be both measured and predicted, using HNO3 as anexample. Such a demonstration requires that HNO3, NH3,and sea spray concentrations are measured over a variety ofenvironmental conditions, and that the profiles are interpretedbased on the inclusion of all terms in the budget equations(described in section 2).[6] In the next section, we review the flux profile theory,
which is followed in section 3 with a discussion of thenature of the source/sink term in the flux profile equations.Experimental details to test our hypothesis are summarizedin section 4. In section 5, we provide results, which arefollowed by concluding remarks in sections 6 and 7.
2. Flux Theory
[7] The description of vertical fluxes of gases is based onthe continuity equation
dc
dt¼ @c
@tþ ui
@c
@xi¼ D
@2
@x2icþ S; ð1Þ
where c is the concentration of the gas; ui is the windvelocity; D is the molecular diffusion coefficient of thequantity c in air; and S is an internal source (positive) or asink (negative) term. Reynolds averaging and conservationof mass is applied. The averaging time must be sufficientlylong that the mean vertical velocity is zero (e.g., on theorder of half an hour or more), and the horizontal turbulentflux is small compared to the advection, and recognizingthat molecular diffusion is insignificant with respect toturbulent transport, the continuity equation reduces to thefollowing more practical form:
@c
@tþ @w0c0
@zþ u
@c
@x¼ S: ð2Þ
In (2), the second term represents the flux divergence(w0c0 = F) and the third term the advection term in thedownwind direction.[8] To simplify the analysis, we assume that the concen-
tration and reaction rates do not change significantly duringthe averaging interval. Also other removal and productionprocesses are considered constant. With such conditions thephysical and chemical attributes of the system are in steadystate, where @c/@t = 0.[9] In steady state any measured or assumed flux diver-
gence term, @F/@z, can be attributed to some combination ofu@c/@x and S:
u@c
@x� S ¼ @F
@z: ð3Þ
[10] Since we want to relate measured flux divergence tointernal sinks, we need to investigate the possible interfer-ence of the advection term. This applies to both the speciesof interest (HNO3 in this case) and reactants that influencethe concentration of HNO3 (e.g., sea salt).[11] The production of HNO3 is due to photochemical
reactions (HNO3 is mainly formed from NO2, with aconversion rate of less than 3% per hour) and may be
considered constant giving rise to only small horizontalgradients, which are negligible on the scale of interest. Onemay assume that above the atmospheric surface layer, whereno significant scavenging of HNO3 by freshly produced seaspray is taking place, @c/@x is negligibly small. Assumingthat sea spray of a size that dominates uptake of HNO3 andother constituents involved in the S term also are spatiallyhomogeneous on the scale of interest, an obvious conclu-sion is that @c/@x may also be neglected as one approachesthe surface. The degree to which the constant flux layerassumption where @F/@z � 0 and thus S = 0 and u@c/@x = 0can be employed for fluxes of sea spray is dependent on thesize fraction in focus [Petelski, 2003], and the assumption isviolated close to the coast, where sea spray production inthe surf zone significantly affects the atmospheric compo-sition [de Leeuw et al., 2000]. The fetch at which surf-produced sea spray is well mixed throughout the MBL isdependent on atmospheric stability and wind speed butnumerical models suggest vertical homogeneity is estab-lished within 5–10 km of the coast even with initialconditions of zero sea spray aerosol above 25 m and a verysteep vertical profile below that level in the modelingconducted by Vignati et al. [2001]. Denmark has an aerosolburden that is heavily marine influenced and hence inmodeling conducted with an equilibrium open-ocean seaspray profile the influence of the surf zone was even morerapidly dispersed. In these conditions the advection termu@c/@x can be ignored for HNO3 with respect to S, and@F/@z will be equal to S, and thus for the examination ofthe flux divergence of HNO3 only the chemistry involvedin the source/sink function, S needs to be explored. Theinfluence on the flux of horizontal sea spray productiongradients, e.g., in a developing wave field in offshorewind, would be a subject for future research.[12] With the following practical example, using realistic
values for the various physical and chemical quantities willbe shown that the effect of advection due to horizontalHNO3 gradients may be neglected. Assuming that a fewkilometers downstream from the coast the atmosphere iswell mixed, a budget for the atmospheric surface layer(completed by entrainment fluxes) can be described byequation (4):
u@c
@x¼ � vd þ weð Þc
hþ wec1
hþ S1� S2
dhh:
I II III IV V
ð4Þ
Term I is the advection term which we want to estimate. Theflux out of the air parcel due to deposition (depositionvelocity vd) and entrainment (entrainment rate we), isdescribed by term II. Term III describes the flux into theair parcel by entrainment from above the boundary layer.The terms IV and V are specific chemical source/sink terms,the former describes production and the latter describesscavenging of HNO3 by sea salt. Since the scavenging onlytakes place in the lowest part of the boundary layer this termis also height-dependent. Rearranging equation (4) yields
hu@c
@x¼ � vd þ weð Þcþ wec1 þ hS1 � S2dh: ð5Þ
D15306 SØRENSEN ET AL.: FLUX DIVERGENCE OF NITRIC ACID
2 of 12
D15306
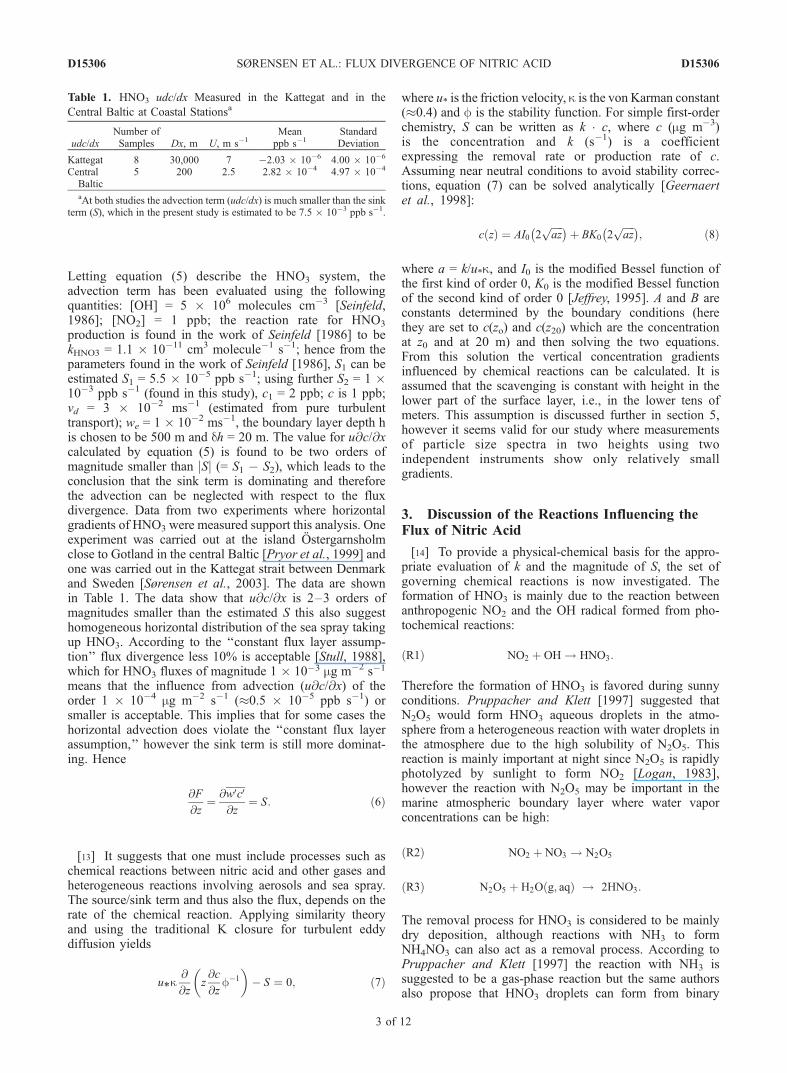
Letting equation (5) describe the HNO3 system, theadvection term has been evaluated using the followingquantities: [OH] = 5 � 106 molecules cm�3 [Seinfeld,1986]; [NO2] = 1 ppb; the reaction rate for HNO3
production is found in the work of Seinfeld [1986] to bekHNO3 = 1.1 � 10�11 cm3 molecule�1 s�1; hence from theparameters found in the work of Seinfeld [1986], S1 can beestimated S1 = 5.5 � 10�5 ppb s�1; using further S2 = 1 �10�3 ppb s�1 (found in this study), c1 = 2 ppb; c is 1 ppb;vd = 3 � 10�2 ms�1 (estimated from pure turbulenttransport); we = 1 � 10�2 ms�1, the boundary layer depth his chosen to be 500 m and dh = 20 m. The value for u@c/@xcalculated by equation (5) is found to be two orders ofmagnitude smaller than jSj (= S1 � S2), which leads to theconclusion that the sink term is dominating and thereforethe advection can be neglected with respect to the fluxdivergence. Data from two experiments where horizontalgradients of HNO3 were measured support this analysis. Oneexperiment was carried out at the island Ostergarnsholmclose to Gotland in the central Baltic [Pryor et al., 1999] andone was carried out in the Kattegat strait between Denmarkand Sweden [Sørensen et al., 2003]. The data are shownin Table 1. The data show that u@c/@x is 2–3 orders ofmagnitudes smaller than the estimated S this also suggesthomogeneous horizontal distribution of the sea spray takingup HNO3. According to the ‘‘constant flux layer assump-tion’’ flux divergence less 10% is acceptable [Stull, 1988],which for HNO3 fluxes of magnitude 1 � 10�3 mg m�2 s�1
means that the influence from advection (u@c/@x) of theorder 1 � 10�4 mg m�2 s�1 (�0.5 � 10�5 ppb s�1) orsmaller is acceptable. This implies that for some cases thehorizontal advection does violate the ‘‘constant flux layerassumption,’’ however the sink term is still more dominat-ing. Hence
@F
@z¼ @w0c0
@z¼ S: ð6Þ
[13] It suggests that one must include processes such aschemical reactions between nitric acid and other gases andheterogeneous reactions involving aerosols and sea spray.The source/sink term and thus also the flux, depends on therate of the chemical reaction. Applying similarity theoryand using the traditional K closure for turbulent eddydiffusion yields
u*k@
@zz@c
@zf�1
� �� S ¼ 0; ð7Þ
where u* is the friction velocity, k is the von Karman constant(�0.4) and f is the stability function. For simple first-orderchemistry, S can be written as k c, where c (mg m�3)is the concentration and k (s�1) is a coefficientexpressing the removal rate or production rate of c.Assuming near neutral conditions to avoid stability correc-tions, equation (7) can be solved analytically [Geernaertet al., 1998]:
c zð Þ ¼ AI0 2ffiffiffiffiffiaz
p� �þ BK0 2
ffiffiffiffiffiaz
p� �; ð8Þ
where a = k/u*k, and I0 is the modified Bessel function ofthe first kind of order 0, K0 is the modified Bessel functionof the second kind of order 0 [Jeffrey, 1995]. A and B areconstants determined by the boundary conditions (herethey are set to c(zo) and c(z20) which are the concentrationat z0 and at 20 m) and then solving the two equations.From this solution the vertical concentration gradientsinfluenced by chemical reactions can be calculated. It isassumed that the scavenging is constant with height in thelower part of the surface layer, i.e., in the lower tens ofmeters. This assumption is discussed further in section 5,however it seems valid for our study where measurementsof particle size spectra in two heights using twoindependent instruments show only relatively smallgradients.
3. Discussion of the Reactions Influencing theFlux of Nitric Acid
[14] To provide a physical-chemical basis for the appro-priate evaluation of k and the magnitude of S, the set ofgoverning chemical reactions is now investigated. Theformation of HNO3 is mainly due to the reaction betweenanthropogenic NO2 and the OH radical formed from pho-tochemical reactions:
NO2 þ OH ! HNO3:ðR1Þ
Therefore the formation of HNO3 is favored during sunnyconditions. Pruppacher and Klett [1997] suggested thatN2O5 would form HNO3 aqueous droplets in the atmo-sphere from a heterogeneous reaction with water droplets inthe atmosphere due to the high solubility of N2O5. Thisreaction is mainly important at night since N2O5 is rapidlyphotolyzed by sunlight to form NO2 [Logan, 1983],however the reaction with N2O5 may be important in themarine atmospheric boundary layer where water vaporconcentrations can be high:
NO2 þ NO3 ! N2O5ðR2Þ
N2O5 þ H2O g; aqð Þ ! 2HNO3:ðR3Þ
The removal process for HNO3 is considered to be mainlydry deposition, although reactions with NH3 to formNH4NO3 can also act as a removal process. According toPruppacher and Klett [1997] the reaction with NH3 issuggested to be a gas-phase reaction but the same authorsalso propose that HNO3 droplets can form from binary
Table 1. HNO3 udc/dx Measured in the Kattegat and in the
Central Baltic at Coastal Stationsa
udc/dxNumber ofSamples Dx, m U, m s�1
Meanppb s�1
StandardDeviation
Kattegat 8 30,000 7 �2.03 � 10�6 4.00 � 10�6
CentralBaltic
5 200 2.5 2.82 � 10�4 4.97 � 10�4
aAt both studies the advection term (udc/dx) is much smaller than the sinkterm (S), which in the present study is estimated to be 7.5 � 10�3 ppb s�1.
D15306 SØRENSEN ET AL.: FLUX DIVERGENCE OF NITRIC ACID
3 of 12
D15306

nucleation in a HNO3–water vapor reaction, and thisdroplet will react with available NH3:
HNO3 g; aqð Þ þ NH3 gð Þ Ð NH4NO3 s; aqð Þ:ðR4Þ
The nucleation rate for the HNO3 reaction with water vapormight even be enhanced by the presence of NH3, as issuggested to be the case for the reaction between H2SO4 andwater vapor [Hoppel and Frick, 1991]. The reactionbetween sodium chloride (NaCl) and HNO3 to form sodiumnitrate (NaNO3) and hydrochloric acid (HCl) in the marineatmosphere has relevance for oxidant cycling and thechemical composition of marine aerosol [Robbins et al.,1959; Martens et al., 1973; Harrison and Pio, 1983;Hillamo et al., 1993; Pakkanen et al., 1996; Plate andSchulz, 1997; Vignati et al., 2001]:
HNO3 gð Þ þ NaCl s; aqð Þ Ð NaNO3 s; aqð Þ þ HCl gð Þ:ðR5Þ
4. Experimental Design
[15] Two field experiments were designed and conductedto quantify the processes governing the flux divergence ofHNO3. The experiments took place at a coastal station nearVindeby, on the island Lolland in Denmark (see Figures 1
and 2). Most of the water near the station is rather shallow(depth: 0.5–15 m) except for a 20–55 m deep navigationalchannel to the west of the field site. The field experimentswere conducted from 27 October to 10 November 1994 and27 April to 10 May 1995.[16] HNO3 was sampled with denuders comprising a
3 mm inner diameter, 500 mm long (Duran) glass tubecoated with NaCl (0.5 volume %) [Perrino et al., 1990].This method was chosen because of the good selectivity ofthis coating to HNO3 [Perrino et al., 1990] and thecollection efficiency is close to 100%. The flow throughthe denuder is approximately 1–1.5 L min�1 driven by apump which was connected to a manifold. From themanifold there was a polypropylene tube to each denuder,and in each tube a nozzle was placed to control the flow.The denuders were installed in a mast situated about 1 kmoffshore (the sea mast) (Figure 3) at elevations of 2.5, 5, 7,10, 15 and 20 m above mean sea level. The sampling timeswere relatively long (minimum 3 hours, depending on themeteorological conditions).[17] Two different types of devices were used for collec-
tion of NH3, diffusion scrubbers and denuders. Diffusiondenuders [Ferm, 1979] were used to collect NH3 at the seamast in the spring campaign. The denuder setup anddesign were the same as for the NaCl coated denuder,described above, except the tube was coated with oxalicacid (1.5 volume %). The diffusion scrubber measuresNH3 semicontinuously with a detection limit of 0.01 ppb[Sørensen et al., 1994b]. During the fall 1994 experiment thediffusion scrubber systems were placed at three levels on thesea mast. For the spring experiment the diffusion scrubberswere mounted on a land mast (10 m from the water line).[18] Filterpacks were used on the sea mast at heights of
2.5, 5, 7 and 10 m to measure the main water solubleaerosol constituents (sodium (Na+), potassium (K+), calcium(Ca2+), magnesium (Mg2+), chloride (Cl�), S(NH3, NH4
+),S(HNO3, NO3
�), sulfate (SO42�) [Plate, 2000; Tamm and
Schulz, 2003]. The filter pack consists of a PTFE particlefilter with a pore size of 5 mm, and two back-up filters tocollect gaseous species. The back-up filters were washednylon filters with a pore size of 0.45 mm (for HNO3) andwashed H3PO4
� impregnated paper filter (for NH3). Owingto evaporation of NH3 and possible HNO3 from NH4NO3 atthe particle filter it is not possible to separate the gasesHNO3 and NH3 from the aerosols in a filterpack. They doprovide, however, a reliable measure of the sum of NH3 +NH4
+ and HNO3 + NO3�.
[19] Particle size distributions were measured at the seamast using optical particle counters (Particle MeasuringSystems, Boulder, Colorado, USA). A CSASP-200 probewas mounted at 7.5 m above the sea surface to sampleparticles in the 0.2–20 mm diameter range; a CSASP-100-HV probe was mounted on the grid at 3 m above the seasurface to sample particles in the 0.5–47 mm diameterrange. For logistical reasons the particle counters wereplaced in a fixed position with the inlet aligned into theprevailing wind direction (west) during both experiments.This implies that at certain wind directions at high windspeeds the larger particles were likely undersampled.[20] Equipment for measurement of mean wind speed
and direction and temperature were mounted at severallevels on both masts; in addition, sonic anemometers were
Figure 1. Measurement site in Lolland, Denmark.
D15306 SØRENSEN ET AL.: FLUX DIVERGENCE OF NITRIC ACID
4 of 12
D15306

Figure 2. Maps showing the measurement site with the wind direction for the specific periods: (a) 94-3;(b) 94-4; (c) 94-6; (d) 94-13; (e) 95-7; and (f) 95-14.
D15306 SØRENSEN ET AL.: FLUX DIVERGENCE OF NITRIC ACID
5 of 12
D15306

mounted on the water mast at 15 and 40 m height to obtainmeasurements of turbulence intensity and the frictionvelocity.
5. Calculating the Surface Flux
[21] The measured profiles were used to derive themagnitude of the surface flux by extrapolation using equa-tion (8) and compared to the flux obtained from the constantflux layer assumption. To avoid complications from stabilitycorrections only cases in which the stratification was near-neutral (1/L < j0.03j) were selected for analysis. Further, toensure uniform chemistry in time, sampling periods werechosen with relatively steady wind direction (within 30�) sothat the fetch and the air mass composition could be treatedas constants. Also periods were used with only smallchanges in wind speed (±1–2 m s�1) during the samplingtime, so that the conditions could be assumed to be in asteady state. These criteria left us with only 6 useful profilesof HNO3 from the two experiments. In Table 2 we summa-rize the profiles and concurrent environmental conditions.Only two of the profiles were associated with relatively highconcentrations of NH3 (the profiles from the spring exper-iment). As indicated in the introduction, only compoundsnewly introduced into the system and reacting at a timescale
shorter than the timescale for turbulent transport will cause aflux divergence. We hypothesize that the major reason forflux divergence observed in the profiles from Vindeby is theinteraction between HNO3 and sea spray droplets and notreaction with NH3 because NH3 can only be invoked as anexplanation if there is a local NH3 source present.[22] From equation (8) the vertical profiles of the chem-
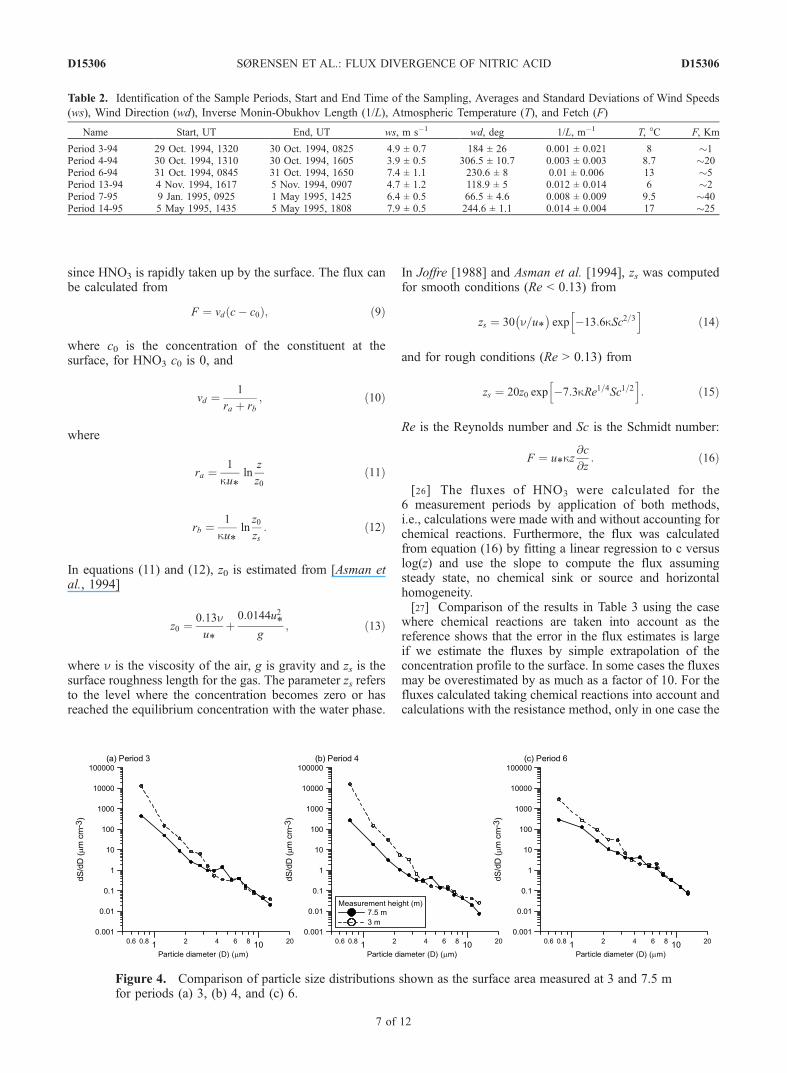
ical species can be calculated, but to carry out this calcu-lation the coefficient k is needed, recalling k is the removalrate that occurs in the sink term in equation (7), involvingreaction between HNO3 and sea spray. Existing data on seaspray concentrations in the surface layer indicate that seaspray gradients are small except very close to the surfacefrom the wave trough up to 1–2 times wave height [deLeeuw, 1986, 1993]. No significant trend with meteorolog-ical parameters or wave height is apparent from these data.Therefore aerosol measurements were conducted at twolevels (7.5 and 3 m) in the fall Vindeby experiment. Theobserved particle surface area at the two heights (Figure 4)show that gradients between 3 and 7.5 m are generallysmall, and may result in part from differences in theaccuracy and precision of the instruments deployed at thetwo heights. The only long fetch in the data set for 1994 wasperiod 4, periods 3 had a short fetch (about 1–2 km) and inperiod 6 the fetch was along shore (Table 2 and Figure 2c).In view of these small gradients, and considering that thewaves in the area are too small to create strong concentra-tion gradients observed by [de Leeuw, 1986] or to otherwisesignificantly influence the concentration of sea spray aero-sol at the levels where the HNO3 concentrations weremeasured, the sea spray concentrations are assumed to bewell mixed across the layer where the measurements arecarried out. This assumption will allow for the reaction to betreated as a first-order reaction where the sea spray surfaceis constant in the vertical direction over the domain ofinterest, i.e., between 3 and 20 m above the surface and thusthe analytical solution of equation (7) can be used.[23] The concentrations of HNO3 at different heights
were determined using the boundary conditions c(z0) = 0,c(20) = ‘‘the concentration measured at 20 m’’ to estimate Aand B from the two equations and then adjusting k inequation (8), in order to fit the calculated concentrationsto the measured profile, by a least squares function. Themeasured and calculated profiles are shown in Figure 5.[24] The surface fluxes were calculated by the following
approach. Close to the surface where the turbulent eddiesare small, the turbulent timescale is expected to dominatethe chemical timescale. Hence the flux divergence closeto the surface will be insignificant. Therefore it is assumedthat there is no flux divergence at a level of 10 cm and theconcentration at this height was calculated by equation (8).The calculated concentrations were then used to calculatethe HNO3 dry deposition by application of the resistancemethod [Wesley and Hicks, 1977] for the layer between thesurface and 10 cm height.[25] The Wesley-Hicks method is based on a deposition
velocity, vd (m s�1) which is parameterized in terms of tworesistances: ra (m
�1 s), the aerodynamic resistance govern-ing the turbulent transport; and rb (m�1 s), the sublayerresistance, governing diffusion through the laminar sub-layer. A resistance, rs (surface resistance) can express thetransfer across the surface. Here we will consider rs = 0
Figure 3. Measurement masts in Vindeby, Lolland, Den-mark. The land mast was situated at the coast 10 m inland.The water mast was situated in the water about 1.5 km fromthe coastline.
D15306 SØRENSEN ET AL.: FLUX DIVERGENCE OF NITRIC ACID
6 of 12
D15306
since HNO3 is rapidly taken up by the surface. The flux canbe calculated from
F ¼ vd c� c0ð Þ; ð9Þ
where c0 is the concentration of the constituent at thesurface, for HNO3 c0 is 0, and
vd ¼1
ra þ rb; ð10Þ
where
ra ¼1
ku*ln
z
z0ð11Þ
rb ¼1
ku*lnz0
zs: ð12Þ
In equations (11) and (12), z0 is estimated from [Asman etal., 1994]
z0 ¼0:13nu*
þ0:0144u2
*g
; ð13Þ
where n is the viscosity of the air, g is gravity and zs is thesurface roughness length for the gas. The parameter zs refersto the level where the concentration becomes zero or hasreached the equilibrium concentration with the water phase.
In Joffre [1988] and Asman et al. [1994], zs was computedfor smooth conditions (Re < 0.13) from
zs ¼ 30 n=u*� �
exp �13:6kSc2=3h i
ð14Þ
and for rough conditions (Re > 0.13) from
zs ¼ 20z0 exp �7:3kRe1=4Sc1=2h i
: ð15Þ
Re is the Reynolds number and Sc is the Schmidt number:
F ¼ u*kz@c
@z: ð16Þ
[26] The fluxes of HNO3 were calculated for the6 measurement periods by application of both methods,i.e., calculations were made with and without accounting forchemical reactions. Furthermore, the flux was calculatedfrom equation (16) by fitting a linear regression to c versuslog(z) and use the slope to compute the flux assumingsteady state, no chemical sink or source and horizontalhomogeneity.[27] Comparison of the results in Table 3 using the case
where chemical reactions are taken into account as thereference shows that the error in the flux estimates is largeif we estimate the fluxes by simple extrapolation of theconcentration profile to the surface. In some cases the fluxesmay be overestimated by as much as a factor of 10. For thefluxes calculated taking chemical reactions into account andcalculations with the resistance method, only in one case the
Table 2. Identification of the Sample Periods, Start and End Time of the Sampling, Averages and Standard Deviations of Wind Speeds
(ws), Wind Direction (wd), Inverse Monin-Obukhov Length (1/L), Atmospheric Temperature (T), and Fetch (F)
Name Start, UT End, UT ws, m s�1 wd, deg 1/L, m�1 T, �C F, Km
Period 3-94 29 Oct. 1994, 1320 30 Oct. 1994, 0825 4.9 ± 0.7 184 ± 26 0.001 ± 0.021 8 �1Period 4-94 30 Oct. 1994, 1310 30 Oct. 1994, 1605 3.9 ± 0.5 306.5 ± 10.7 0.003 ± 0.003 8.7 �20Period 6-94 31 Oct. 1994, 0845 31 Oct. 1994, 1650 7.4 ± 1.1 230.6 ± 8 0.01 ± 0.006 13 �5Period 13-94 4 Nov. 1994, 1617 5 Nov. 1994, 0907 4.7 ± 1.2 118.9 ± 5 0.012 ± 0.014 6 �2Period 7-95 9 Jan. 1995, 0925 1 May 1995, 1425 6.4 ± 0.5 66.5 ± 4.6 0.008 ± 0.009 9.5 �40Period 14-95 5 May 1995, 1435 5 May 1995, 1808 7.9 ± 0.5 244.6 ± 1.1 0.014 ± 0.004 17 �25
Figure 4. Comparison of particle size distributions shown as the surface area measured at 3 and 7.5 mfor periods (a) 3, (b) 4, and (c) 6.
D15306 SØRENSEN ET AL.: FLUX DIVERGENCE OF NITRIC ACID
7 of 12
D15306

difference between the two calculated fluxes was more thana factor of two (period 4) and in another one the differencewas close to a factor of two (period 6). For the measurementperiods presented here, the calculation of surface fluxesusing the resistance method traditionally used in atmosphericchemistry-transport models may be sufficient since thecalculated fluxes here are very similar, however that maynot be true for other cases. Large chemical removal ratescan cause large differences in the surface flux estimations.
6. Discussion of the Heterogeneous Reactions
[28] In the present study the sink term (S = k c) inequation (8) describes the removal of HNO3, where c =[HNO3] and k represents the removal rate, which we assumedepends on the following four processes or parameters:(1) the surface area of the marine aerosol; (2) the transportin the atmosphere of the gas to the aerosol surface bymolecular diffusion; (3) the adsorption or uptake at the
surface; and (4) the conversion rate of HNO3 to NO3�, which
is a measure of available adsorption sites. Since it isassumed that the uptake/removal depends on sea spray, kderived using (8) and the measured profiles should correlatewith the sea spray concentration. The chemical compositionof the aerosols (Table 4) can be used as an indicator for theorigin of the aerosols and enable us to identify sea sprayaerosols and sea spray having reacted with nitric acid.NaNO3 and NH4NO3 concentrations were calculated forthe periods where data were available (see explanations inTable 4). Geernaert et al. [1998] suggested that the removalrate, k, could correlate with the NaCl concentrations.However, a scatterplot of k versus [Na+] (Figure 6) doesnot show a clear correlation. Nevertheless [Na+] was higherfor the period (6–94), which had the largest flux divergenceor k. Next a possible relation between k and NaNO3 wasinvestigated, with the rationale that NaNO3 is producedfrom the reaction between HNO3 and sea spray. The resultin Figure 7 indicates increased k with increasing NaNO3
Figure 5. Measured vertical profiles of HNO3 (diamonds) and the calculated profiles taking chemicalreactions into account (solid lines) for the six measurement periods in the experiments in 1994 and 1995.The dotted lines show the profiles that would be expected if chemical reactions were not influencing theprofiles. See color version of this figure in the HTML.
Table 3. Surface Fluxes of HNO3 Calculated for the Six Measurement Periods by the Three Different Approachesa
Period
Flux Using Equation (16) Fitting a LinearRegression to c Versus log (z),
F (kg m�2 s�1) � 1012
Flux Calculated by the Use of theResistance Method [Asman et al., 1994],
F (kg m�2 s�1) � 1012
Flux Using Equation (8) From 20 m to 0.1 mand Equation (9) From 0.1 m to the Surface,
F (kg m�2 s�1) � 1012
3-94 3.49 0.99 0.77 ± 0.14-94 5.14 0.89 0.46 ± 0.196-94 1.94 0.39 0.24 ± 0.1913-94 0.57 1.38 1.05–2.397-95 1.19 0.29 0.21 ± 0.0314-95 1.69 0.27 0.16 ± 0.06
aThe flux calculation in the last column is based on a calculated concentration at 0.1 m. The calculated concentration is derived from a measured profile,and the standard deviation on the measurements gives a standard deviation on the flux, which can be seen in the last column.
D15306 SØRENSEN ET AL.: FLUX DIVERGENCE OF NITRIC ACID
8 of 12
D15306

concentration. However, since the data set is very small, thisrelation needs to be confirmed by more data obtained indifferent conditions. The lack of a strong correspondencebetween aerosol composition and k may be due to difficultyin relating local HNO3 flux divergence as manifest in k withaerosol composition which is an integrated product ofremote and local effects.[29] Recent studies have shown that sea salt aerosol is
produced over a very wide range of sizes from less than100 nanometers to hundreds of micrometers [e.g., O’Dowdet al., 1997; Martensson et al., 2003], but measurementsfrom impactors suggest that Cl� depletion due to uptake ofacidic gases is most pronounced for particle diameters ofapproximately 0.5–5 mm [Martens et al., 1973; Pryor et al.,1999, 2001], in the size range in which marine aerosolsdominate the particle mass and surface area [e.g., Harrisonand Pio, 1983]. For the present study, to estimate the seaspray surface that is available for accommodation of HNO3,i.e., the surface of sea spray aerosol, the measured sizedistributions were integrated over the range from 0.75 mm to5.25 mm diameter. It is assumed that this surface area is areasonable surrogate for the total sea spray surface availablefor uptake, although it must be acknowledged that not allparticles in this size range will be of marine origin, and theerror in this assumption will depend on fetch and sourcesupwind other than sea spray, and further that some fractionof the sea spray surface will lie outside this range. Figure 8
shows a scatterplot of k versus (circles are the k estimatedfrom measurements) surface area. In spite of the largescatter in k and the uncertainty in the surface area, the dataindicate that the magnitude of k may increase with increas-ing surface. The statistical significance of such a speculationmust be evaluated with more data to be collected in futurestudies.[30] It is obvious from Figure 8 that the particles mea-
sured in period 3-94 and period 13-94 offer a larger surfacearea than the particles in period 4-94 and 7-95. However,since both periods 3-94 and 13-94 are sampled during short-fetch conditions (see Table 2), the large surface could be dueto other types of particles which are either in equilibrium ordo not react with HNO3. In case 13-94 we expected to findNaNO3 due to the presence of Na+ (which concentrationwas similar to that in most of the other cases). However,consistent with a negligible removal rate and a wind speeddecreasing during the sampling period, no NaNO3 wasmeasured, and indeed a surplus of chloride was found inthe aerosol. Biomass burning was observed on the islandand the concurrent highest observed potassium concentra-tion, which is a good tracer for biomass burning, canexplain the high chloride concentration, which could in partexplain also the high Na concentration and the large amountof small particles. The easterly wind, which prevailedduring that period, also causes the shortest possible marinefetch of only 2 km with very little sea salt productionbetween the coastline and the measurement site. Thus also
Figure 6. Estimated k versus Na+. See color version ofthis figure in the HTML.
Figure 7. Estimated k versus NaNO3. See color version ofthis figure in the HTML.
Table 4. Relative Humidity (RH), Rate Constant (k), and Chemical Concentrations During the Measurement Periodsa
PeriodNa+,
nmol m�3NaNO3,nmol m�3
NH4NO3,nmol m�3
K+,nmol m�3
nss-SO42�,
nmol m�3NH3,
nmol m�3 RH, % k, s�1
3-94 17.1 4.1 63.2 1.3 34.3 <10 �100 0.0028 ± 0.00874(+5)-94 5.0 50.3 0.8 44.4 <10 �100 0.0035 ± 0.0296-94 57.9 8.9 3.1 0 7 <10 �100 0.0085 ± 0.01413-94 14.3 83.4 3.4 77.2 <10 �90 0.00 ± 0.00577-95 9.0 3.5 28.2 0 35.0 �350 0.0017 ± 0.005214-95 7.6 5.2 347.7 4.7 302.4 �710 0.0057 ± 0.018
aThe particle concentrations presented are averages of measurements at three/four different levels. The NaNO3 concentration was calculated via the molarCl�/Na+ ratio on the particle filter assuming that all Na+ and Cl� is sea salt derived, with a molar ratio of 1.166, and that any chloride loss is due to thereaction of HNO3 with sea salt as suggested in data from the Baltic [Pryor et al., 1999]. The NH4NO3 concentrations result from particulate NO3
�, fromwhich NaNO3 is subtracted. Non-sea salt-sulphate (nss-SO4
2�) was calculated using a mass ratio of Na+/SO42� = 3.99 in seawater. The estimated k is derived
by making a best fit of the calculated profile to measured concentrations obtaining the least variance between measurement and calculated profile. Thestandard deviation reported in the last column is derived from the obtained variance.
D15306 SØRENSEN ET AL.: FLUX DIVERGENCE OF NITRIC ACID
9 of 12
D15306

the influence of removal by heterogeneous reaction on theHNO3 profile was expected to be smallest. Period 3-94 wasalso measured during short-fetch conditions but here wefound slightly higher Na+ concentrations than in case 13-94for the same wind speeds. Also the removal rate for case3-94 was higher than in case 13-94. The higher removal ratecan be due to the higher relative humidity during period3-94 (see Table 3). Karlsson and Ljungstrom [1994] mea-sured the rate of replacement of Cl� by NO3
� on sea sprayparticles as a function of time and relative humidity, andshowed that HNO3 uptake is faster on wet particles and thatthe replacement rates are higher at higher temperature[Hoffman et al., 2003].[31] The highest removal rates are observed for the cases
14-95 and 6-94 (see Table 3), with case 6-94 having thehighest sea salt concentration. We hypothesize that thechemical interaction profile can develop over the water tothe southwest of the measuring site during high winds, dueto the buildup of sea spray concentrations caused bybreaking waves and surfs around the pier and the harborin Onsevig (see Figure 3).[32] With a much longer fetch but similar wind condi-
tions, case 14-95 also shows considerable aerosol contribu-tions from land based sources as is reflected by the highNH4NO3 and nss-SO4 concentrations. Pakkanen et al.[1996] found that when 90% of the original Cl� is releasedfrom the marine particles, the rate of replacement decreases,which indicates saturation. Despite reduced Na concentra-tions, NaNO3 comprises 68% of the sea salt mass. Thereforethe uptake of HNO3 may be reduced in this case, resultingin a lower removal rate as deduced from the HNO3 profile.This would imply that the sink term is not a first-order linearreaction since @k/@z is not zero, however according toFigure 4 the vertical gradients of the aerosol surface aresmall.[33] In order to investigate further the k values derived
from the shape of the HNO3 profiles and assess whetherthey can be caused by sea spray reactions we computed theexpected uptake rate for HNO3 on sea spray droplets usingthe model proposed by Pakkanen et al. [1996]. Using theirrelationship, under the assumption of spherical particles andsurface-limited chemical reactions, the rate at which nitrate
accumulates into a sea spray particle (I, in mol s�1) is givenby
I ¼ 2pDdp HNO3½ �1þ b
; ð17Þ
where
D diffusivity of HNO3 (m2 s�1);
dp particle diameter (m).
[HNO3] is concentration of HNO3 (in this application weuse the measured concentration from the uppermost mea-surement height) in mol m�3:
b ¼ 2D
ksdpð18Þ
ks ¼gc
4; ð19Þ
where
g reaction uptake coefficient;c mean molecular speed of HNO3 (m s�1).
In this analysis we calculate the mean molecular speedaccording to sample temperature and diffusivity of HNO3
according to the sample mean temperature based on theFuller method [Reid et al., 1987]. The particle size distri-bution is set according to the mean size distribution for eachsample determined from the PMS data, and is confined tothe size range 0.75–5.25 mm. Further following Evans et al.[2004] we assume the reaction uptake coefficient is 0.5 (asdetermined in the laboratory studies of Guimbaud et al.[2002]).[34] The results (when normalized by concentration) are
plotted in Figure 8 and demonstrate very good agreementwith the values derived entirely independently from theHNO3 profile. The discrepancies between the two estimatesof k for any given sample may reflect variations in theparticle size distribution during the sampling period, ana-lytical uncertainties in the measurement of HNO3 or possi-bly variations in the actual reaction uptake coefficient that inreality will vary according to the actual composition of theparticles including the role of previous uptake of acidifyinggases or the possible role of surfactants.
7. Conclusion
[35] It is shown that removal of HNO3 from the atmo-sphere close to the sea surface is due to two processes: drydeposition to the sea surface and chemical reaction with seaspray. The latter process invalidates the application of theconstant flux layer assumption to calculate dry depositionbased on concentrations of HNO3 at, e.g., a reference heightof 10 m. Measured HNO3 concentration profiles were foundto differ from the log linear profiles, and hence surfacefluxes of HNO3 calculated from the measured profiles overestimate fluxes computed taking into account flux diver-gence due to uptake of HNO3 on marine aerosol. HNO3 lossrates to marine particles computed using the measured
Figure 8. Values of k estimated from profile measure-ments (circles) and k values calculated from the modeldescribed in equations (17)–(19) (squares) versus theestimated sea spray surface. See color version of this figurein the HTML.
D15306 SØRENSEN ET AL.: FLUX DIVERGENCE OF NITRIC ACID
10 of 12
D15306

profiles and a Bessel function compare very well with ratesestimated from the observed particle size distribution andthe model of Pakkanen et al. [1996]. The good agreementbetween the modeled and the measured k also supports themodel parameterization of HNO3 uptake on sea spray. It isimportant to note however that the data set used herein issmall and more data, particularly fetch-dependent observa-tions of sea spray profiles are needed to confirm ourconclusions.[36] The particles absorbing the HNO3 will eventually
deposit to the sea as well, thus implying that the nitrogenoriginating from the HNO3 will still provide a contributionto the eutrophication of the marine waters. However, sincethe deposition velocities for particles are different fromthose for gases [Pryor and Sørensen, 2000] the amount ofthe deposited nitrogen to the water can be substantiallydifferent from model estimates on a local basis. This impliesthat more effort is needed to improve model performancewhen computing high-resolution variability of deposition.
[37] Acknowledgments. The field work received financial supportfrom the U.S. Office of Naval Research, the Danish EnvironmentalResearch Program, and the Nordic Council of Ministers. We acknowledgesupport from the Nordic Centre of Excellence (BACCI), the E.U. contractMAST3-CT96-0058, and the E.U. contract EVK3-CT-1999-00014-MEADfor the data analysis; Sara Pryor also acknowledges support from NSF(ATM 0334321). Thanks are extended to Hans E. Jørgensen from RisøNational Laboratory and Poul Hummelshøj from MetSupport Aps. fordiscussions on the flux calculations and the particle data interpretation.Measurements of the aerosol composition were performed by Elke Plate inthe scope of her Ph.D. at the University of Hamburg. Measurements ofHNO3 and NH3 were supported by Bjarne Jensen and Hanne Langberg,National Environmental Research Institute, Denmark. Meteorologicalmeasurements were supported by Jørgen Højstrup, Søren W. Lund, andJan Nielsen from Risø National Laboratory, Denmark. Aerosol measure-ments were supported by Marcel Moerman, Leo Cohen, Gerard Kunz, andLex Van Eijk from TNO-FEL, with financial support from ONR grantN00014-91-J-1948. Thanks to the technicians from NERI and RISØ fortheir helping hands every time it was needed and to Bent Christensen and‘‘Inge’’ from Onsevig for sailing to the water mast in Vindeby.
ReferencesAsman, W. A. H., R. M. Harrison, and C. J. Ottley (1994), Estimation of thenet air-sea flux of ammonia over the southern bight of the North Sea,Atmos. Environ., 28, 3647–3654.
Asman, W. A. H., et al. (1995), Atmospheric nitrogen input to the Kattegat,Ophelia, 42, 5–28.
de Leeuw, G. (1986), Vertical profiles of giant particles close above the seasurface, Tellus, Ser. B, 38, 51–61.
de Leeuw, G. (1993), Aerosols near the air-sea interface, Trends Geophys.Res., 2, 55–70.
de Leeuw, G., F. P. Neele, M. Hill, M. H. Smith, and E. Vignati (2000), Seaspray aerosol production by waves breaking in the surf zone, J. Geophys.Res., 105, 29,397–29,410.
Duyzer, J. H. (1992), The influence of chemical reactions on surfaceexchange of NO, NO2 and O3, in Precipitation Scavenging andAtmospheric-Surface Exchange, edited by S. Schwartz and W. Slinn,pp. 1105–1114, Taylor and Francis, Philadelphia, Pa.
Evans, M., S. Campbell, V. Bhethanabotla, and N. Poor (2004), Effect ofsea salt and calcium carbonate interactions with nitric acid on the directdry deposition of nitrogen to Tampa Bay, Florida, Atmos. Environ., 38,4847–4858.
Ferm, M. (1979), Method for determination of atmospheric ammonia,Atmos. Environ., 13, 1385–1393.
Geernaert, L. L. S., G. L. Geernaert, K. Granby, and W. A. H. Asman(1998), Fluxes of soluble gases in the marine atmospheric surface layer,Tellus, Ser. B, 50, 111–127.
Guimbaud, C., F. Arens, L. Gutzwiller, H. W. Gaggeler, and M. Ammann(2002), Uptake of HNO3 to deliquescent sea-salt particles, Atmos. Chem.Phys. Disc., 2(4), 739–763.
Harrison, R. M., and C. A. Pio (1983), Size differentiated composition ofinorganic atmospheric aerosols of both marine and polluted continentalorigin, Atmos. Environ., 17, 1733–1738.
Hillamo, R. E., J. M. Pacyna, A. Semb, and J. E. Hanssen (1993), Sizedistributions of inorganic ions in atmospheric aerosol in Norway, inProceedings of the Workshop on the Development of Analytical Tech-niques for Atmospheric Pollutants, Rome, April 13–15 1992, edited byI. Allegrini, Air Pollut. Res. Rep. 41, Comm. of the Eur. Commun.,Brussels.
Hoffman, R. C., M. A. Kaleuati, and B. J. Finlayson-Pitts (2003), Knudsencell studies of the reaction of gaseous HNO3 with NaCl using less than asingle layer of particles at 298 K: A modified mechanism, J. Phys. Chem.A, 107, 7818–7826.
Hoppel, W. A., and G. M. Frick (1991), Effect of nonprecipitating cloudson the aerosol size distribution: Results of a cloud chamber study andatmospheric measurements, Eos Trans. AGU, 72(44), Fall MeetingSuppl., 104.
Jeffrey, A. (1995), Handbook of Mathematical Formulas and Integrals, 401pp., Elsevier, New York.
Joffre, S. M. (1988), Modelling the dry deposition velocity of highlysoluble gases to the sea surface, Atmos. Environ., 22, 1137–1147.
Karlsson, R., and E. Ljungstrom (1994), Transformation and removal ofN-compounds in the marine atmosphere, Final Rep. ct90-0047, RisøNatl. Lab., Roskilde, Denmark.
Kramm, G., and R. Dlugi (1994), Modelling of the vertical fluxes of nitricacid, ammonia and ammonium nitrate, J. Atmos. Chem., 18, 319–357.
Lenschow, D. H. (1982), Reactive trace species in the boundary layerfrom a micrometeorological perspective, J. Meteorol. Soc. Jpn., 60,472–480.
Lenschow, D. H., and A. C. Delaney (1987), An analytical formulation forNO and NO2 flux profiles in the atmospheric surface layer, J. Atmos.Chem., 5, 301–309.
Liss, P. S., and R. A. Duce (1997), The Sea Surface and Global Change,519 pp., Cambridge Univ. Press, New York.
Logan, J. A. (1983), Nitrogen oxides in the troposphere: Global and regio-nal budget, J. Geophys. Res., 88, 10,785–10,807.
Martens, C. S., J. J. Wesolowski, R. C. Harriss, and R. Kaifer (1973),Chlorine loss from Puerto Rican and San Francisco bay area marineaerosols, J. Geophys. Res., 78, 8778–8791.
Martensson, E. M., E. D. Nilsson, G. de Leeuw, L. H. Cohen, and H.-C.Hansson (2003), Laboratory simulations and parameterization of the pri-mary marine aerosol production, J. Geophys. Res., 108(D9), 4297,doi:10.1029/2002JD002263.
Monin, A. S., and A. M. Obukhov (1954), Basic laws of turbulent mixingin the atmosphere near the ground layer of the atmosphere, Trans. Geo-phys. Inst. Akad., Nauk USSR, 151, 163–187.
O’Dowd, C. D., M. H. Smith, I. E. Consterdine, and J. A. Lowe (1997),Marine aerosol, sea-salt, and the marine sulphur cycle: A short review,Atmos. Environ., 31, 73–80.
Pakkanen, T. A., V.-M. Kerminen, R. E. Hillamo, M. Makinen, T. Makela,and A. Virkkula (1996), Distribution of nitrate over sea-salt and soilderived particles: Implications from a field study, J. Atmos. Chem., 24,189–205.
Perrino, C., F. De Santis, and A. Febo (1990), Criteria for the choice of adenuder sampling technique devoted to the measurements of atmosphericnitrous and nitric acids, Atmos. Environ., Part A, 24, 617–626.
Petelski, T. (2003), Marine aerosol fluxes over open sea calculated fromvertical concentration gradients, J. Aerosol Sci., 34, 359–371.
Plate, E. (2000), Variabilitat der Zusammensetzung anoorganischerAerosole—insbesondere der reaktiven Stickstoffverbindungen—in kus-tennahen Gebieten der Nordsee und Ostsee, Ph.D. dissertation, Inst. ofInorg. and Appl. Chem., Univ. of Hamburg, Hamburg, Germany.
Plate, E., and M. Schulz (1997), Coarse nitrate formation in a coastal areaof the North Sea, J. Aerosol Sci., 28, 333–334.
Pruppacher, H. R., and J. D. Klett (1997), Microphysics of Clouds andPrecipitation, 976 pp., Springer, New York.
Pryor, S. C., and L. L. Sørensen (2000), Nitric acid-sea salt reactions:Implications for nitrogen deposition to water surfaces, J. Appl. Meteorol.,39, 725–731.
Pryor, S. C., R. J. Barthelmie, L. L. S. Geernaert, T. Ellermann, and K. D.Perry (1999), Speciated particle dry deposition to the sea surface: Resultsfrom ASEPS ’97, Atmos. Environ., 33, 2045–2058.
Pryor, S. C., R. J. Barthelmie, J. T. Schoof, L. L. Sørensen, and D. J.Erickson (2001), Implications of heterogeneous chemistry of nitric acidfor nitrogen deposition to marine ecosystems: Observations and model-ing, J. Water Air Soil Pollut., 1(5/6), 99–107.
Quinn, P. K., R. J. Charlson, and T. S. Bates (1988), Simultaneous observa-tions of ammonia in the atmosphere and ocean, Nature, 335, 336–338.
Reid, R. C., J. M. Prausnitz, and B. E. Poling (1987), The Properties ofGases and Liquids, 741 pp., McGraw-Hill, New York.
Robbins, R. C., R. D. Cadle, and D. L. Eckhardt (1959), The conversion ofsodium chloride to hydrogen chloride in the atmosphere, J. Meteorol., 16,53–56.
D15306 SØRENSEN ET AL.: FLUX DIVERGENCE OF NITRIC ACID
11 of 12
D15306

Seinfeld, J. H. (1986), Atmospheric Chemistry and Physics of Air Pollution,738 pp., John Wiley, Hoboken, N. J.
Sørensen, L. L., O. Hertel, B. Pedersen, M.Wagner, S. E. Larsen, J. Højstrup,M. Schulz, G. de Leeuw, and G. L. Geernaert (1994a), Horizontal transportmodelling and exchange of atmospheric nitrogen gases with the coastalocean, in Proceedings of the 2nd International Conference on Air-SeaInteraction and Meteorology and Oceanography of the Coastal Zone,pp. 208–209, Am. Meteorol. Soc., Boston, Mass.
Sørensen, L. L., K. Granby, H. Nielsen, and W. A. H. Asman (1994b),Diffusion scrubber technique used for measurements of atmosphericammonia, Atmos. Environ., 28, 3637–3645.
Sørensen, L. L., S. C. Pryor, L. Spokes, and A. M. Sempreviva (2003), Air-sea fluxes of nitrogen compounds: Coastal Air Pollution Meteorologyand Air-Sea Nutrient Exchange (CAPMAN), in EUROTRAC-2 Subpro-ject Final Report, pp. 111–123, GSF-Nat. Res. Cent. for Environ. andHealth, Munich, Germany.
Stull, R. B. (1988), An Introduction to Boundary Layer Meteorology, 666pp., Springer, New York.
Tamm, S., and M. Schulz (2003), Open-ocean aerosol composition obtainedduring 15 months on a North Sea ferry, Atmos. Environ., 37, S133–S143.
Vignati, E., G. de Leeuw, and R. Berkowicz (2001), Modeling coastalaerosol transport and effects of surf-produced aerosols on processes inthe marine atmospheric boundary layer, J. Geophys. Res., 106, 20,225–20,238.
Wesley, M. L., and B. B. Hicks (1977), Some factors that affect the deposi-tion rates of sulfur dioxide and similar gases on vegetation, JAPCA, 27,1110–1116.
�����������������������G. de Leeuw, TNO-Physics and Electronics Laboratory, P.O. Box 96864,
2509 JG The Hague, Netherlands. ([email protected])S. C. Pryor, Atmospheric Science Program, Department of Geography,
Indiana University, 701 E. Kirkwood Avenue, Bloomington, IN 47405,USA. ([email protected])M. Schulz, Laboratoire des Sciences du Climat et de l’Environnement,
CEA/CNRS–LSCE, L’Orme des Merisiers, Bat. 701, F-91191 Gif-sur-Yvette Cedex, France. ([email protected])L. L. Sørensen, Department of Wind Energy, Risø National Laboratory,
Frederiksborgvej 399, DK-4000 Roskilde, Denmark. ([email protected])
D15306 SØRENSEN ET AL.: FLUX DIVERGENCE OF NITRIC ACID
12 of 12
D15306
Copyright © 2022 FDOKUMEN