FLUOXETINE ALTERS MU OPIOID RECEPTOR EXPRESSION IN OBESE ZUCKER RAT EXTRAHYPOTHALAMIC REGIONS
Upload
global-studiesCategory
view
2download
0
N
EUROPSYCHOPHARMACOLOGY
2002
–
VOL
.
26
,
NO
.
2
© 2002 American College of NeuropsychopharmacologyPublished by Elsevier Science Inc. 0893-133X/02/$–see front matter655 Avenue of the Americas, New York, NY 10010 PII S0893-133X(01)00314-1
Fluoxetine and Sleep EEG: Effects of a Single Dose, Subchronic Treatment, and Discontinuation in Healthy Subjects
Bernd Feige, Ph.D., Ulrich Voderholzer, M.D., Dieter Riemann, Ph.D., Professor of ClinicalPsychophysiology, Ralf Dittmann, M.D., Ph.D., Fritz Hohagen, M.D., Professor of Psychiatry,
and Mathias Berger, M.D., Professor of Psychiatry
The goals of the current study were to evaluate whether a single dose of fluoxetine causes qualitatively different changes in sleep architecture and NREM sleep EEG than subchronic administration in healthy subjects and to determine degree and duration of such changes after the single dose and after discontinuation from subchronic administration. Our hypothesis was that subchronic intake should cause changes qualitatively different from the single dose and that such changes could be sufficiently long-lived to suggest the possibility of a dosing in intervals of several days. Ten healthy volunteers first took one single 60-mg dose of fluoxetine and a week later started to take a 40-mg dose every morning for three weeks. Sleep laboratory nights included two nights before and four nights after the single dose and every second night for two weeks after discontinuation from subchronic administration. The single dose caused only a slight increase in drug plasma concentrations but relatively clear changes in sleep structure. After discontinuation from subchronic administration, sleep quality indices normalized quickly
(within 2–4 days), whereas REM latency and spectral power effects correlated with total SSRI plasma concentration and normalized more slowly, corresponding to the drug plasma half-life of about 10 days. The REM fraction of the sleep period showed a rebound, whereas the delta sleep ratio did not correlate with drug plasma levels and yet remained increased after the medication interval. Thus, the only qualitative difference seen between acute and subchronic medication was the initial sleep disturbance. REM latency and especially the delta sleep ratio remained increased for several days after discontinuation from subchronic administration, indicating the possibility of a less-than-daily maintenance medication after an initial daily interval. Finally, the pattern of change observed for the delta sleep ratio indicates that it may be due to secondary, adaptive effects possibly linked to the antidepressant effect of fluoxetine in depressed patients.
[Neuropsychopharmacology 26:246–258, 2002]
© 2002 American College of Neuropsychopharmacology.Published by Elsevier Science Inc.
KEY
WORDS
:
Human; Sleep; EEG spectral effects; Antidepressants; SSRIs
In the last years, selective serotonin reuptake inhibitors(SSRIs) have increasingly replaced tricyclics in antide-pressive treatment due to their more benign side effectprofile. Still, compliance in long-term maintenancetherapy often enough is insufficient, since many pa-tients are reluctant to accept daily dosing of antidepres-sants and thus tend to omit medication sometimes. It iswell known for most antidepressants that a discontinu-
From the Department of Psychiatry and Psychotherapy, Albert-Ludwigs-University, Freiburg, Germany (BF, UV, DR, FH, MB); andLilly Deutschland GmbH and Psychosomatic Department, Chil-dren’s Hospital, University of Hamburg, Hamburg, Germany (RD).
Address correspondence to: Dr. Bernd Feige, Department of Psy-chiatry and Psychotherapy, Albert-Ludwigs-University Freiburg,Hauptstraße 5, 79104 Freiburg, Germany.
Received 22 September 2000; revised 30 May 2001; accepted 6July 2001.
Online publication: 7/10/01 at www.acnp.org/citations/Npp071001148.

N
EUROPSYCHOPHARMACOLOGY
2002
–
VOL
.
26
,
NO
.
2
Fluoxetine and Sleep EEG
247
ation for some days can lead to relapse into depression(for a review, cf. Viguera et al. 1998).
The SSRIs currently available are mainly distin-guished by their plasma halflife, which is particularlylong for fluoxetine (1–3 days after single and 4–6days after chronic administration) and its active metab-olite norfluoxetine (7–14 days) (Hyttel 1994). There-fore, the question arises what the time course of cen-tral nervous effects of a single and a subchronic doseof fluoxetine is: If the effects should last for severaldays after discontinuation, this would be an indicationof a higher level of security of this medication with re-spect to compliance problems. It has already been sug-gested that the long plasma half-life is the reason forthe negligible adverse effects reported upon fluoxetinediscontinuation (Zajecka et al. 1998; Lejoyeux andAdés 1997; Haddad 1997; for a recent definition of aSSRI discontinuation syndrome cf. Schatzberg et al.1997).
Furthermore, there are several indications that im-portant central nervous effects of antidepressant medi-cation are of a secondary, adaptational nature, prompt-ing a comparison of the time course of these effects withplasma drug concentration. Especially the fact that sev-eral clearly distinct pharmacological interventions allresult in an amelioration of depressive symptoms in re-sponders, and do so only with a delay of some days toweeks, indicates that the actual antidepressant effectand change in symptomatology is an indirect conse-quence of the drug action. A delay of about two weekshas even been used to discriminate true drug effectsfrom spontaneous remissions in pattern analytical as-sessments of antidepressive efficacy (Quitkin et al.1984, 1987), although the delayed onset hypothesis hasbeen challenged in favor of a triggering or ‘kick-start-ing’ concept (Stassen and Angst 1998). Shortened timeto remission using pulse loading schemes has also beenreported (down to about 72h by bolus injection of imi-pramine; Malhotra and Santosh 1996). Finally, a previ-ous study found a significant antidepressive effect of atwo-day treatment with the tricyclic antidepressant clo-mipramine (plasma half-life of about 21 hours) 5 daysafter either oral or intravenous dosing (Pollock et al.1989; Kupfer et al. 1989). These findings indicate that arelatively short-term plasma presence of antidepres-sants might be sufficient in order to initiate the neces-sary neurophysiological changes leading to an amelio-ration of depressive symptoms.
In order to measure central nervous effects of fluox-etine, we performed a spectral analysis of the sleep EEGin healthy human volunteers. Specific spectral EEG ef-fects of antidepressants have been reported by severalauthors (Tarn et al. 1993; Saletu and Grünberger 1985;Patat et al. 1998; Fischer et al. 1986; Yamadera et al.1987; Saletu et al. 1991; Röschke et al. 1997); further-more, there is evidence for a link between sleep regula-
tion and depression, with sleep homeostasis being rou-tinely characterized by spectral EEG parameters(Borbély et al. 1988; Achermann et al. 1993).
Evidence for a link between sleep structure and de-pression comes from the fact that sleep deprivation(which actually constitutes a manipulation of sleep ho-meostasis) is an effective, albeit often short-lived, anti-depressant treatment in about 70% of patients with ma-jor depressive disorder (Riemann et al. 1999; Berger etal. 1997; Vollmann and Berger 1993). Furthermore,there are consistent findings of a REM sleep disinhibi-tion (shortened REM latency, higher REM density; cf.Vogel 1983; Kupfer et al. 1976; Berger and Riemann1993) and a NREM delta power shift towards the sec-ond NREM episode (decreased
delta sleep ratio
; Kupferet al. 1990; Buysse et al. 1997) as correlates of depres-sion. A decreased delta ratio has also been found to in-crease the likelihood of further depressive episodes inthe absence of pharmacotherapy (Spanier et al. 1996).
Most antidepressants normalize both of these pa-rameters in depressed patients, i.e., they increase REMlatency (Vogel 1983) and delta ratio (Kupfer et al. 1994).The increase in delta ratio has been found to be associ-ated with clinical response to clomipramine (Ehlers etal. 1996). An increase in REM latency has been observedin healthy subjects after administration of fluoxetine(Vasar et al. 1994). This indicates that sleep EEGchanges in normals can be used as a model of the anti-depressant effect of a substance.
It should be noted, however, that some clinically ef-fective antidepressants do not suppress REM sleep, e.g.,trimipramine (Vogel et al. 1990; Sonntag et al. 1996;Wiegand and Berger 1989) and the postsynaptic seroto-nin antagonist and presynaptic serotonin and norepi-nephrine reuptake inhibitor nefazodone (Vogel et al.1998; Armitage et al. 1997; Rush et al. 1998; Gillin et al.1997). Thus, REM latency changes may be associatedwith the mechanism of action of many antidepressantsas previously suggested (Vogel 1983; Vogel et al. 1975;this includes many SSRIs and specifically fluoxetine; cf.Buysse et al. 1999; Trivedi et al. 1999), but not of all anti-depressants. Much less is known about delta ratiochanges due to various antidepressants, allowing thespeculation that the delta sleep ratio could be closer to ageneral mechanism of antidepressant action than REMlatency.
In the current study we therefore examined sleep ar-chitecture and NREM sleep EEG changes in the courseof a single dose and subsequent subchronic applicationof fluoxetine for signs of secondary, adaptive changesand the time course of normalization after discontinua-tion for implications regarding clinical applicationschemes. Our hypothesis was that subchronic intakeshould cause qualitatively different changes than thesingle dose in one of the parameters linked to depres-sion, i.e., REM latency or delta sleep ratio. These

248
B. Feige et al. N
EUROPSYCHOPHARMACOLOGY
2002
–
VOL
.
26
,
NO
.
2
changes could furthermore be sufficiently long-lived tosuggest the possibility of a fluoxetine dosing in inter-vals of several days for antidepressive maintenancetherapy (e.g. once-weekly; cf. Schmidt et al. 2000). Thestudy was conducted with healthy male subjects in-stead of depressed patients in order to reduce possibleconfounding effects of an amelioration of the depres-sive state.
MATERIALS AND METHODS
Ten healthy male volunteers aged between 20 and 34years (27.8
�
4.1 years) with a body weight between 60and 90 kg (71.9
�
7.5 kg) were enrolled. There were noabnormal findings upon clinical and laboratory exami-nations in any of the subjects. None of them had a per-sonal or family history of psychiatric disorders, aller-gies, adverse drug reactions, or major surgicalinterventions involving the gastrointestinal tract. Par-ticipants were drug free, had no history of drug or alco-hol abuse, and none of then had participated in otherdrug studies within a month preceding the start of thistrial. Written consent was obtained from each subject.The experiments were performed in accordance to theHelsinki Declaration of 1975. The protocol was ap-proved by the Ethical Committee of the University ofFreiburg.
Capsules containing 20 mg of fluoxetine and match-ing placebo capsules were used. The single dose con-sisted of three capsules (60 mg) and the daily dose inthe subchronic phase was two capsules (40 mg).
Study Design
On the first study day, inclusion/exclusion criteriawere evaluated, including demographic data and medi-cal history. A full physical examination, includingblood pressure, pulse and weight measurements, EEG(12 leads), neurological, and psychiatric examinationswere performed. Laboratory tests included a full bloodcount (including platelets), clinical chemistry: sodium,
potassium, chloride, calcium, urea, serum creatinine,glucose, total protein, albumin, total bilirubin, SGOT,SGPT, AP, GGT, LDH, HbsAg and HIV, T3, T4, TSH,and urine analysis (dip stick): urobilinogen, glucose,pH, protein, nitrite and blood.
Study nights 2 through 4 and every second nightfrom night 28 to 42 (cf. the study design overview, Fig-ure 1) included standard sleep recordings of horizontalEOG, submental EMG and EEG (C3-A2; C4-A1). Timein bed was held constant from 23:00 to 7:00 h; subjectswere required to adhere to this fixed sleep schedule andto remain abstinent from alcohol during the wholecourse of the study. The polysomnograms were scoredblindly in epochs of 30 s by two experienced raters ac-cording to standardised criteria (Rechtschaffen andKales 1968). Blood samples drawn at 22:00 h beforeeach study night were centrifuged and frozen on siteand sent to an external laboratory (Simbec ResearchLtd., UK) for measurement of fluoxetine and norfluox-etine plasma concentrations by gas chromatography.For statistical analysis, values below the detectionthreshold were set to the detection threshold (1.957 ng/ml for fluoxetine and 2.239 ng/ml for norfluoxetine).During the three-week medication interval, additionalblood samples were drawn on nights 14 and 21 and an-alyzed for plasma concentrations to ensure compliance.
Conventional Sleep Measures
Polysomnographical parameters derived from visualstaging were total sleep time, the fraction of each sleep(or wake) stage within the sleep period (SP) in percent,REM latency, and the number of eye movements inREM sleep. Sleep onset was defined as the first occur-rence of stages 2, 3, 4, or REM sleep (one 30-s epoch wassufficient). The sleep period ended correspondinglywith the first wake or stage 1 epoch not followed bydeeper sleep until the end of bedtime. Sleep latency isthe time between the start of bed time (
lights out
) andsleep onset. Total sleep time is the time within the sleepperiod not spent awake. Sleep efficiency is defined asthe percentage of total sleep time within bedtime. REM
Figure 1. Study design. Nights spent in the sleep lab are shown as boxes with solid lines, nights spent at home with brokenlines. In the morning prior to the baseline night (�1), subjects received placebo capsules; in the morning before night 1, theyreceived a single dose of 60mg (3 � 20 mg) fluoxetine, and in each morning preceding nights 8–28 they received a dose of40mg (2 � 20 mg).

N
EUROPSYCHOPHARMACOLOGY
2002
–
VOL
.
26
,
NO
.
2
Fluoxetine and Sleep EEG
249
latency is the time between sleep onset and the first oc-currence of REM sleep.
For “REM latency-wake,” epochs scored as wakethat may have occurred between sleep onset and REMsleep were excluded. REM density, finally, was calcu-lated as the number of REM eye movements per 30-sepoch multiplied by 10. This can be interpreted as apercentage where a REM density of 100% is defined as10 eye movements per 30 s (20 per minute).
Spectral Analysis
During the night, continuous EEG (C3 referenced to theright ear) was amplified with a time constant of 0.3 s anda lowpass at 70 Hz, digitized at 102.4 Hz and stored foroff-line analysis. Due to the sampling theorem, this led toan aliasing of frequencies above 51.2Hz into the frequen-cies between 32.4 and 51.2Hz, which therefore were ex-cluded from the analysis of sleep spectral power changes(but used in the artifact detection algorithm).
An all-night spectral analysis was performed on thesame 30-s epochs for which sleep stages had been deter-mined. Within each 30-s epoch, spectral power was cal-culated using the Fast Fourier Transform (FFT) algo-rithm from forty-six 128-point windows overlapping byhalf, resulting in a spectral resolution of 0.8 Hz. Withineach FFT window separately, the EEG was demeanedand detrended by subtracting the linear least-squaresregression line before applying a Welch window andcalculating the FFT. The 46 spectral power estimateswere averaged in order to increase the stability of theestimate. The estimates obtained for each frequencyand 30-s epoch were continuously stored on disk.
The goal of the further analysis was to minimize theeffects of confounding variables on the spectra averagedacross epochs, such as the number of movements orarousals and other sleep parameters that can be analyzedseparately (cf. Feige et al. 1999). This was done by ex-cluding ‘deviant’ epochs from the average. Deviant ep-ochs were those containing movements or arousals asdetermined during staging; furthermore, the total (0.8–48Hz) and gamma-band (32–48 Hz) log power of each ep-och was related to the corresponding median-filteredvalue (the median of values in the 5 min preceding and 5min following the epoch), and an epoch was excluded ifthe deviation was larger than the difference between themedian and the first quartile of all median-filtered valuesacross the night. In this way, artifacts mainly restricted tolow frequencies (such as EOG events) as well as those oc-curring mainly in higher frequencies (such as EMG con-tamination) were eliminated in a data-driven way.
Statistical Analysis
The logarithmic (base
e
) spectra for artifact-free NREMsleep epochs were averaged across each night and addi-
tionally (in order to calculate the delta sleep ratio)within each NREM sleep episode. Logarithmic spectralband power was calculated after adding the spectralpower values within the following frequency bands:Delta 0.1–3.5 Hz, theta 3.5–8 Hz, alpha 8–12 Hz, sigma12–16 Hz, beta1 16–24 Hz, and beta2 24–32 Hz. Thedelta sleep ratio is the quotient of mean delta bandpower values in the first NREM sleep episode to thecorresponding mean in the second NREM sleep episode(Kupfer et al. 1990).
From the average log spectral power values, the cor-responding average for the baseline night was sub-tracted for each subject in order to derive baseline-rela-tive spectra due to the properties of the logarithm.
The significance of baseline-relative sleep/spectralparameter changes throughout the experiment was as-sessed using a repeated measures ANOVA with thewithin-subject factor NIGHT. Two-sided contrasts wereused within these ANOVAs to assess the statistical sig-nificance of the baseline deviation for each night. Corre-lations between plasma concentrations and sleep/spec-tral parameters were evaluated by ANOVA with the(individually baseline-subtracted) parameter entered asvariate and plasma level entered as covariate.
Pharmacodynamic Modeling of SpectralPower Effects
It is not within the scope of the current study to derivefull pharmacokinetic / pharmacodynamic models forall observed sleep and spectral parameters. We will fo-cus upon the pharmacodynamic relationship betweendrug plasma concentrations
C
and log spectral powervalues
E
, for which an established and simple model,the
E
max
model, is available (cf. Bellissant et al. 1998):
where
E
0
(power at concentration 0),
E
max
(maximumpower change),
CE
50
(concentration at half the maxi-mum effect), and
�
(Hill coefficient) are the model pa-rameters. Sigma, beta1 and beta2 frequency bands wereanalyzed in parallel;
CE
50
and
�
were modeled globallyacross subjects and frequency bands, whereas
E
0
and
E
max
were allowed to be different for each subject andfrequency band. Nonlinear least-squares optimizationwas performed using the `nls’ package of S-PLUS(MathSoft, Cambridge, MA).
RESULTS
The upper left panel of Figure 2 shows the plasma con-centrations of fluoxetine and its active metabolite nor-fluoxetine. After the single 60mg dose, plasma levels in-creased to 31
�
30 ng/ml (mean
�
SD) for fluoxetine
E E0 EmaxC
γ
CE50( )γC
γ+--------------------------------⋅+=

250
B. Feige et al. N
EUROPSYCHOPHARMACOLOGY
2002
–
VOL
.
26
,
NO
.
2
and 27
�
23 ng/ml for norfluoxetine, while reaching153
�
56 ng/ml and 171
�
53 ng/ml on day 28, afterthree weeks of the daily 40 mg dose. The large variabil-ity is in line with previous reports of large interindivid-ual differences in plasma concentration following oralintake of a fixed dose (DeVane 1992).
REM latency and total sleep time (TST) were alreadychanged significantly after the single dose and normal-ized within six and two days, respectively, after discon-tinuation from subchronic intake. The REM fraction ofthe sleep period showed a rebound four days after dis-continuation.
Figure 2. Study time courses of fluoxetine (open circles) and norfluoxetine (closed circles) plasma concentrations (top leftpanel) and of the baseline-subtracted sleep parameters: Total sleep time (TST), slow-wave sleep fraction of sleep period(SWS % SP), REM latency, REM fraction of sleep period, and REM density. The baseline levels (mean � SE) are noted aboveor below the dotted zero (baseline) axis within each graph. Note that TST is significantly decreased at the end of the sub-chronic medication period but recovers quickly, while REM latency is significantly increased and takes longer to normalize.While REM density is not changed significantly, the REM sleep fraction is acutely suppressed but increased after discontin-uation. At most one missing value was allowed in any single average (9 � N � 10). Significance levels for 2-sided contrastsagainst baseline are indicated.

N
EUROPSYCHOPHARMACOLOGY
2002
–
VOL
.
26
,
NO
.
2
Fluoxetine and Sleep EEG
251
Figure 3 shows the averaged baseline-relative spec-tral power for the nights after three weeks of medica-tion (night 28) and subsequent discontinuation. Thebaseline-relative drug effect is a clear spectral power in-crease, starting at about 12 Hz, with a peak in the sigmaband (around 14 Hz) and, with rising tendency, up tothe highest observed frequency (32 Hz). After discon-tinuation, the spectral increment generally decayedwith time after discontinuation but did not reach thebaseline level at the end of the observed time interval,12 days after discontinuation. The beta-range increment(16–32 Hz) did not decrease monotonically but peakedaround night 34, causing spectral power on this night tobe the second largest after night 28.
The time course of spectral changes of NREM sleepEEG (slight suppression of delta wave activity, increasein sigma- and beta-band activity; cf. Figure 4) was gen-erally similar to that of fluoxetine and norfluoxetineplasma concentrations (as shown in the upper left panelof Figure 2): they were not significant after the singledose but marked after the subchronic intake, remainingsignificant between 8 and 12 days after discontinuation.
While the total delta power across nights waschanged only weakly by the drug (about 10% reductionat the end of the subchronic phase; ANOVA
p
�
.031; cf.Table 1), the delta ratio was increased, i.e., the distribu-tion of delta power across NREM episodes was clearlyshifted towards the first episode (cf. Figure 4, upperright panel). A single dose caused a slight but not sig-nificant increase in delta ratio. In the last medicationnight (night 28), a significant delta ratio increase couldbe seen on the 5% level despite a large variability. Be-tween two and four days after discontinuation (nights30–32), the difference to baseline did not reach signifi-cance but subsequently increased and remained signifi-
cant up to the last observed night (12 days after discon-tinuation).
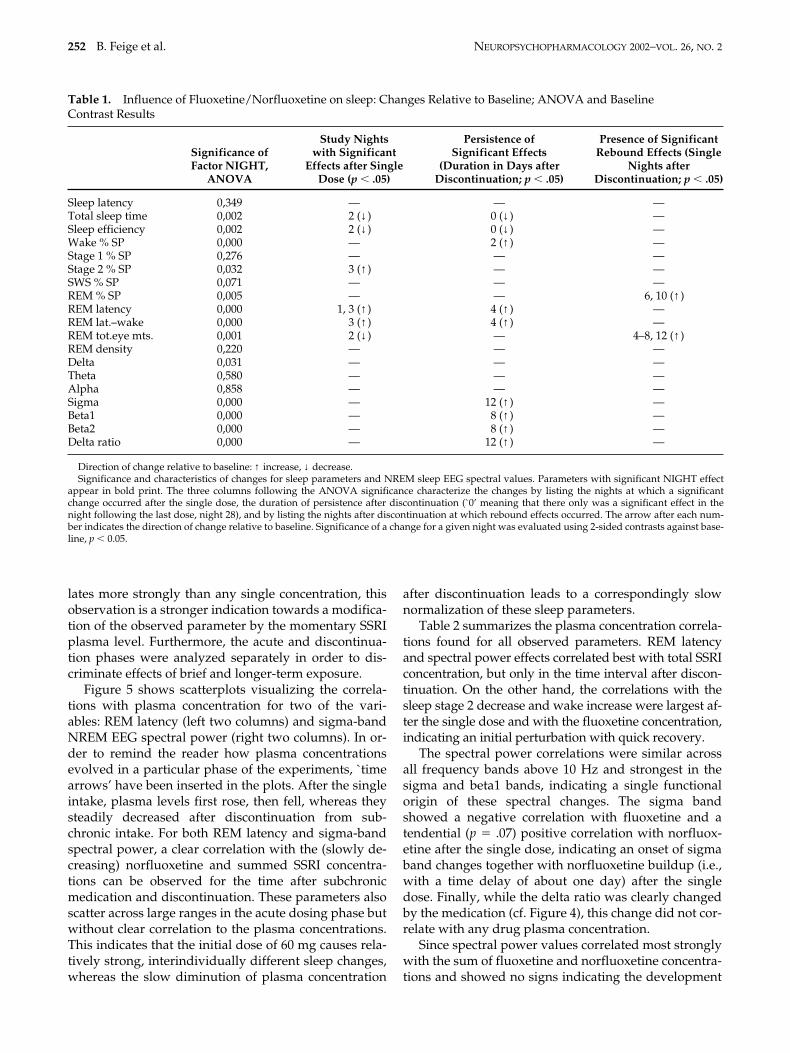
Table 1 summarizes the effects of fluoxetine on poly-somnographic and spectral parameters. Changes are di-vided into three categories: nights with significant ef-fects after a single dose, duration of persistence afterdiscontinuation from subchronic medication, and delayof rebound effects after this discontinuation, deter-mined by 2-sided contrasts against baseline (
p
�
.05).Sleep quality-related parameters such as sleep effi-ciency and fraction of stage 2 sleep showed a relativelyearly response and low persistence; REM fraction andREM total eye movements showed a rebound. SpectralEEG parameters were only weakly influenced by thesingle dose, but showed long persistence after discon-tinuation from subchronic dosing and no rebound ef-fects during the time of observation.
One well-known source of variance in clinical trialswith fluoxetine is due to the large interindividual dif-ferences in the pharmacokinetics of this substance andthe correspondingly large differences in plasma levelswithin a fixed intake scheme. For this reason, we alsoexamined the correlations between plasma concentra-tions of fluoxetine, norfluoxetine, and their sum, whichapproximately represents the amount of SSRI present inthe plasma since the two substances are nearly equipo-tent as SSRIs. All three concentrations were examinedin order to increase the specificity of the analysis. Since,for example, the norfluoxetine concentration decreasedabout linearly after discontinuation, any effect whichalso evolves in one direction in this time interval willcorrelate with the norfluoxetine concentration, withoutnecessarily indicating a causal link. If, however, thesum of the two concentrations with its initially morerapid decrease (due to the fluoxetine component) corre-
Figure 3. Grand-average baseline-relative NREM EEG spectra for the study nights following the subchronic medicationinterval, displayed as the spectral power difference in percent relative to the baseline night.
252
B. Feige et al. N
EUROPSYCHOPHARMACOLOGY
2002
–
VOL
.
26
,
NO
.
2
lates more strongly than any single concentration, thisobservation is a stronger indication towards a modifica-tion of the observed parameter by the momentary SSRIplasma level. Furthermore, the acute and discontinua-tion phases were analyzed separately in order to dis-criminate effects of brief and longer-term exposure.
Figure 5 shows scatterplots visualizing the correla-tions with plasma concentration for two of the vari-ables: REM latency (left two columns) and sigma-bandNREM EEG spectral power (right two columns). In or-der to remind the reader how plasma concentrationsevolved in a particular phase of the experiments, `timearrows’ have been inserted in the plots. After the singleintake, plasma levels first rose, then fell, whereas theysteadily decreased after discontinuation from sub-chronic intake. For both REM latency and sigma-bandspectral power, a clear correlation with the (slowly de-creasing) norfluoxetine and summed SSRI concentra-tions can be observed for the time after subchronicmedication and discontinuation. These parameters alsoscatter across large ranges in the acute dosing phase butwithout clear correlation to the plasma concentrations.This indicates that the initial dose of 60 mg causes rela-tively strong, interindividually different sleep changes,whereas the slow diminution of plasma concentration
after discontinuation leads to a correspondingly slownormalization of these sleep parameters.
Table 2 summarizes the plasma concentration correla-tions found for all observed parameters. REM latencyand spectral power effects correlated best with total SSRIconcentration, but only in the time interval after discon-tinuation. On the other hand, the correlations with thesleep stage 2 decrease and wake increase were largest af-ter the single dose and with the fluoxetine concentration,indicating an initial perturbation with quick recovery.
The spectral power correlations were similar acrossall frequency bands above 10 Hz and strongest in thesigma and beta1 bands, indicating a single functionalorigin of these spectral changes. The sigma bandshowed a negative correlation with fluoxetine and atendential (
p
�
.07) positive correlation with norfluox-etine after the single dose, indicating an onset of sigmaband changes together with norfluoxetine buildup (i.e.,with a time delay of about one day) after the singledose. Finally, while the delta ratio was clearly changedby the medication (cf. Figure 4), this change did not cor-relate with any drug plasma concentration.
Since spectral power values correlated most stronglywith the sum of fluoxetine and norfluoxetine concentra-tions and showed no signs indicating the development
Table 1.
Influence of Fluoxetine/Norfluoxetine on sleep: Changes Relative to Baseline; ANOVA and BaselineContrast Results
Significance of Factor NIGHT,
ANOVA
Study Nightswith Significant
Effects after SingleDose (
p
�
.05)
Persistence ofSignificant Effects
(Duration in Days afterDiscontinuation;
p
�
.05)
Presence of SignificantRebound Effects (Single
Nights afterDiscontinuation;
p
�
.05)
Sleep latency 0,349 — — —Total sleep time 0,002 2 (
↓
) 0 (
↓
) —Sleep efficiency 0,002 2 (
↓
) 0 (
↓
) —Wake % SP 0,000 — 2 (
↑
) —Stage 1 % SP 0,276 — — —Stage 2 % SP 0,032 3 (
↑
) — —SWS % SP 0,071 — — —REM % SP 0,005 — — 6, 10 (
↑
)REM latency 0,000 1, 3 (
↑
) 4 (
↑
) —REM lat.–wake 0,000 3 (
↑
) 4 (
↑
) —REM tot.eye mts. 0,001 2 (
↓
) — 4–8, 12 (↑ )REM density 0,220 — — —Delta 0,031 — — —Theta 0,580 — — —Alpha 0,858 — — —Sigma 0,000 — 12 (↑ ) —Beta1 0,000 — 8 (↑ ) —Beta2 0,000 — 8 (↑ ) —Delta ratio 0,000 — 12 (↑ ) —
Direction of change relative to baseline: ↑ increase, ↓ decrease.Significance and characteristics of changes for sleep parameters and NREM sleep EEG spectral values. Parameters with significant NIGHT effect
appear in bold print. The three columns following the ANOVA significance characterize the changes by listing the nights at which a significantchange occurred after the single dose, the duration of persistence after discontinuation (`0’ meaning that there only was a significant effect in thenight following the last dose, night 28), and by listing the nights after discontinuation at which rebound effects occurred. The arrow after each num-ber indicates the direction of change relative to baseline. Significance of a change for a given night was evaluated using 2-sided contrasts against base-line, p � 0.05.

NEUROPSYCHOPHARMACOLOGY 2002–VOL. 26, NO. 2 Fluoxetine and Sleep EEG 253
of tolerance, it can be assumed that a simple Emax modelis applicable for these effects. Furthermore, sigma, beta1,and beta2 bands showed similar and strong correlationswith total SSRI plasma concentration and were thereforeanalyzed within a single joint optimization model (seeMethods). The global parameters were modeled as (esti-mate � SE) CE50 � 204 � 57 ng/ml and � � 1.3 � 0.6. Theparameters modeled individually for each subject andfrequency band, E0 and Emax, were (mean � SD) 2.1 � 0.3and 0.4 � 0.3 for sigma, 0.6 � 0.2 and 0.7 � 0.5 for beta1,and �0.3 � 0.2 and 1.0 � 0.9 for beta2.
DISCUSSION
In this study, fluoxetine induced four different types ofdynamic changes in the sleep EEG:
• Sleep quality measures (sleep efficiency, total sleeptime) showed a clear worsening upon the initial dosebut quick recovery (within one or two days) afterboth the single dose and discontinuation from sub-chronic administration despite the long plasma half-life of 1–2 weeks;
Figure 4. Study time courses of the changes in NREM EEG spectral power, measured as the difference in percent relativeto the baseline night, for different frequency bands. In addition, the top right graph shows the change in delta ratio relativeto the baseline.

254 B. Feige et al. NEUROPSYCHOPHARMACOLOGY 2002–VOL. 26, NO. 2
Figu
re 5
.E
xam
ples
for
the
cor
rela
tion
bet
wee
n (b
asel
ine-
rela
tive
) sl
eep
para
met
ers
(her
e: R
EM
lat
ency
) or
NR
EM
EE
G s
pect
ral
pow
er (
here
: si
gma
band
) an
d t
he p
lasm
a co
ncen
trat
ions
of
fluo
xeti
ne (
Flu)
, nor
fluo
xeti
ne (
NFl
u), o
r to
tal a
ctiv
e SS
RI
(Flu
N
Flu)
. Eac
h pl
ot s
how
s on
e d
ata
poin
t fo
r ev
ery
nigh
t of e
very
sub
ject
wit
hin
a gi
ven
tim
e in
terv
al: T
he le
ft c
olum
ns s
how
onl
y th
e ti
me
inte
rval
aft
er th
e si
ngle
dos
e (n
ight
s 1–
4, `�
’ sym
bols
), w
hile
the
righ
t col
umns
sho
w d
ata
from
the
who
le s
tud
y, w
ith
dat
a po
ints
from
the
tim
e in
terv
al a
fter
the
3-w
eek
subc
hron
ic m
edic
atio
n ap
pear
ing
as `
’ sym
bols
.T
he la
rge
arro
ws
in e
ach
plot
ind
icat
e th
e ti
me
cour
se o
f pl
asm
a co
ncen
trat
ions
: Aft
er t
he s
ingl
e d
ose,
obs
erve
d f
luox
etin
e co
ncen
trat
ions
fir
st r
ose
and
then
fel
l, w
hile
nor
fluo
xeti
ne c
once
ntra
tion
s m
ainl
y in
crea
sed
; aft
er s
ubch
roni
c m
edic
atio
n, b
oth
conc
entr
atio
ns d
ecre
ased
, whi
ch m
eans
that
the
earl
iest
valu
es a
ppea
r on
the
righ
t sid
e of
the
plot
s.

NEUROPSYCHOPHARMACOLOGY 2002–VOL. 26, NO. 2 Fluoxetine and Sleep EEG 255
• REM latency and spectral power increases acrossthe alpha- to higher beta bands took longer to nor-malize after discontinuation and correlated with thesum of fluoxetine and norfluoxetine concentrations(total SSRI plasma concentration);
• The relative amount of REM sleep and the total rapideye movement count showed a rebound effect, i.e., al-though there was a (tendential) reduction after boththe single dose and subchronic dosing, they were sig-nificantly increased relative to baseline as soon as thedrug plasma concentration was sufficiently decreasedafter discontinuation;
• The delta ratio remained elevated up to the end of theobservation period (12 days after discontinuation) andshowed no correlation with drug plasma levels.
General Effect of Fluoxetine on the All-Night NREM Sleep EEG Spectrum
At the end of the three-week medication interval, fluox-etine increased NREM sleep EEG spectral power in fre-quencies above 12 Hz relative to baseline, with a peakaround 14 Hz and an increasing tendency towards thehighest observed frequency (32 Hz). A slight decreasewas observed in the delta band. This pattern is in linewith previous reports of general activating effects offluoxetine on the human sleep EEG (Saletu et al. 1991),
including an increase in high- and a relative decrease inlow-frequency activity, and a general alerting effect asreported by Blom et al. (1991). Despite the peak in thesigma band, no qualitative differences in drug responsewere observed between sigma and beta bands.
This spectral pattern is different from the SSRI effectsconsistently described in rats, namely a reduction ofNREM sleep EEG spectral power in the 5–20 Hz range(Neckelmann et al. 1996 for citalopram; Bjorvatn et al.1995 for zimelidine). Also, in awake depressed patientsafter four weeks of treatment with fluoxetine, Tarn et al.(1993) found a decrease in beta activity relative to base-line. Finally, Schlösser et al. (1998) reported a lack of sig-nificant NREM EEG spectral changes after four weeks ofthe SSRI paroxetine (30 mg) in eight healthy subjects.
Effects on Sleep Continuity Measures
Similar to Kupfer et al. (1991) with the SSRI fluvoxamine,we found that sleep-disturbing effects of fluoxetine oc-curred in the initial medication phase, i.e., after the singledose of 60 mg, despite the fact that fluoxetine and norflu-oxetine plasma levels were only slightly elevated by thisdose. This means that sleep continuity could be describedas sensitive to the change in plasma levels rather than tothe absolute levels. The fact that sleep continuity was alsosignificantly reduced after subchronic intake but recov-
Table 2. Correlations with Fluoxetine/Norfluoxetine Plasma Concentrations
Correlation after Single Dose (Nights 1-4)
Correlation after SubchronicAdministration (Nights 28-40)
Flu NFlu FluNFlu Flu NFlu FluNFlu
Sleep latency — — — — — —Total sleep time — — — — — —Sleep efficiency — — — — — —Wake % SP ↑↑ — — — — —Stage 1 % SP — — — — ↑ —Stage 2 % SP ↓↓↓ — ↓↓ ↓ — —SWS % SP — — — ↑ — —REM % SP — — — — — —REM latency — — — ↑↑↑↑↑ ↑↑↑↑↑ ↑↑↑↑↑↑↑↑REM lat.–wake — — — ↑↑↑↑ ↑↑↑↑ ↑↑↑↑↑↑↑REM tot. eye mts. — — — — — —REM density — — — — — —Delta — — — — — —Theta — — — — — —Alpha — — — — ↑ ↑Sigma ↓ — — ↑↑ ↑↑↑ ↑↑↑Beta1 — — — ↑↑ ↑↑↑ ↑↑↑↑Beta2 — — — ↑↑ ↑↑ ↑↑↑Delta ratio — — — — — —
↑ positive, ↓ negative correlation; p � .05; ↑↑ p � .01; ↑↑↑ p � .001; ↑↑↑↑ p � 10�4; ↑↑↑↑↑ p � 10�5 . . .Correlations of the (baseline-relative) sleep and NREM EEG spectral parameters with the fluoxetine (Flu)
and norfluoxetine (NFlu) plasma concentrations and with their sum, which corresponds to the total amountof SSRI. Correlations were determined independently for the time interval after the single dose of 60mg(nights 1–4) and for the time interval after 3-week administration of a daily 20mg dose (nights 28–40, cf. Fig.5). Direction and number of the arrows indicate the direction and significance of each correlation.

256 B. Feige et al. NEUROPSYCHOPHARMACOLOGY 2002–VOL. 26, NO. 2
ered within 2–4 days indicates an additional influence ofabsolute plasma levels upon sleep continuity. The quickrecovery may be explained by the effect of an increasedhomeostatic sleep pressure accumulated during the medi-cation interval in which sleep continuity was reduced.
Effects on REM Latency and NREM Sleep EEG Spectral Power
Both REM latency and NREM sleep EEG spectralpower effects covaried most clearly with the sum of flu-oxetine and norfluoxetine plasma concentrations, bothwith regard to the mean time courses across the study(Figures 2 and 4) and with regard to the actual correla-tions between these parameters. This indicates thatthese effects are determined by the total plasma concen-tration of active SSRI rather than by fluoxetine or nor-fluoxetine alone, and do not show habituation withinthe sensitivity of the current study. Changes in REM la-tency excluding intervening wake periods were nearlyequal to and only slightly less significant than those in-cluding wake periods, indicating that the observedchanges in REM latency are not due to the overall de-crease of sleep continuity (increase in wake % SP).
Due to the apparent dependence of spectral powereffects upon total SSRI plasma concentration, an Emax
pharmacodynamic model could be applied. In all exam-ined spectral bands (sigma, beta1, and beta2), the stan-dard deviation of the Emax parameter across subjects,which measures the actual influence of plasma concen-tration on spectral power, was nearly as large as the av-erage Emax. This indicates that a large interindividualvariability is not only present in the pharmacokineticsof fluoxetine but also in the effect of a given plasmaconcentration on NREM sleep EEG spectral power.
An unexpected finding was a slight increase in spec-tral power in the beta frequency ranges at night 34, i.e.six days after discontinuation, despite the continuousdecline of plasma drug levels. It is tempting to proposea link between this high-frequency increase, the REMrebound observed at night 32 and the delta ratio in-crease observed at night 34. However, further studiesare needed to validate this observation.
Habituation and Rebound Effects on REM Sleep
Both the REM fraction of the sleep period and the totalnumber of rapid eye movements (total REM activity)showed a habituation and rebound pattern of changes.Since REM density only showed a slight, not significantincrease on day 28, the change in total REM eye move-ments appears to be mostly governed by the increase inREM percentage, i.e., by an aspect of REM generation.REM latency but not REM density also clearly covariedwith the total SSRI plasma level. This suggests thattonic and phasic REM activity are modified in different
ways by fluoxetine treatment, at least in healthy con-trols.
It is tempting to assume a correspondence betweenthe observed rebound effects and possible SSRI discon-tinuation symptoms. However, there are no studiescharacterizing the time course of such symptoms forfluoxetine; in fact, some studies have failed to find asignificant increase of complaints after discontinuationat all (Zajecka et al. 1998; Rosenbaum et al. 1998). Blacket al. (2000) concluded in a review of reports forshorter-halflife SSRIs that discontinuation symptomsbegin 1–3 days after discontinuation and last for morethan a week in half of the cases, which could corre-spond to the significant rebound effects we observedbetween four and 12 days after discontinuation.
Prolonged Increase in Delta Ratio
Kupfer et al. (1989) observed no change in whole-nightdelta wave count in depressives after clomipramine,but a rearrangement of delta activity towards the firstNREM episode, as indicated by an increased delta sleepratio. In the current study, delta ratio was slightly ele-vated by the initial dose and clearly elevated after thethree-week medication interval. At the same time, itshowed no correlation with drug plasma concentra-tions. This indicates that the delta ratio change iscaused by secondary, adaptive processes and probablydoes not occur consistently across subjects. A low deltaratio has been described as a predictor for recurrence ofdepression (Kupfer et al. 1990), and in longitudinalstudies an increase in delta ratio has been found to beassociated with remission (Buysse et al. 1997), thuspointing at both `state’ and `trait’ relevance of this pa-rameter. Since variations in depressive vulnerabilityand mood are continuous and certainly present inhealthy subjects, one could hypothesize that the ob-served elevation in delta ratio in healthy controls couldbe due to such variations within our subjects.
Implications for Clinical Application
A daily intake of 40 mg of fluoxetine for three weeks re-sulted in clear effects in sleep and NREM EEG spectralpower variables, including REM latency and delta ratio,which have previously been linked to the effect of anti-depressants. Whether a maintenance treatment coulduse other than daily application schemes, e.g. once ev-ery few days, depends upon which of these variableswill represent a valid correlate of the antidepressant ef-fect. The correlation of REM latency and spectral powereffects with SSRI plasma concentration suggests thatthe plasma concentration would have to remain highduring maintenance therapy. The REM fraction of thesleep period habituated, thereby suggesting that REMfraction is probably not indicative of the antidepressant

NEUROPSYCHOPHARMACOLOGY 2002–VOL. 26, NO. 2 Fluoxetine and Sleep EEG 257
effect. Finally, the delta sleep ratio did not correlatewith drug plasma concentrations but remained ele-vated after treatment. Thus, if delta ratio increase was acorrelate of the antidepressive effect, fluoxetine dosesseparated by some days might be effective in mainte-nance therapy after an initial daily phase.
ACKNOWLEDGMENTS
This study was supported by a grant from Eli Lilly & Co, Ger-many. The authors wish to thank the anonymous referees fortheir constructive criticism and comments.
REFERENCES
Achermann P, Dijk DJ, Brunner DP, Borbély AA (1993): Amodel of human sleep homeostasis based on EEG slow-wave activity: Quantitative comparison of data andsimulations. Brain Res Bull 31:97–113
Armitage R, Yonkers KA, Cole D, Rush AJ (1997): A multi-center, double-blind comparison of the effects of nefaz-odone and fluoxetine on sleep architecture and qualityof sleep in depressed outpatients. J Clin Psychopharma-col 17:161–168
Bellissant E, Sebille V, Paintaud G (1998): Methodologicalissues in pharmacokinetic-pharmacodynamic model-ling. Clin Pharmacokinet 35:151–166
Berger M, Riemann D (1993): REM sleep in depression. JSleep Res 2:211–223
Berger M, Vollmann J, Hohagen F, König A, Lohner H,Voderholzer U, Riemann D (1997): Sleep deprivationcombined with consecutive sleep phase advance as afast-acting therapy in depression: An open pilot trial inmedicated and unmedicated patients. Am J Psychiatry154:870–872
Bjorvatn B, Bjorkum AA, Neckelmann D, Ursin R (1995):Sleep/waking and EEG power spectrum effects of anonselective serotonin (5-HT) antagonist and a selective5-HT reuptake inhibitor given alone and in combina-tion. Sleep 18:451–462
Black K, Shea C, Dursun S, Kutcher S (2000): Selective sero-tonin reuptake inhibitor discontinuation syndrome:Proposed diagnostic criteria. J Psychiatry Neurosci25:255–261
Blom MW, Sommers DK, Bartel PR, van der Meyden CH,Becker PJ (1991): A comparison of psychomotor andEEG effects of desipramine, clomipramine and fluoxet-ine. Med Sci Res 19:751–752
Borbély AA, Achermann P, Trachsel L, Tobler I (1988): Sleephomeostasis in humans and rats. In Lydic R, BiebuyckJF (eds), Clinical Physiology of Sleep. Bethesda, MD,Americal Physiological Society, pp 191–198
Buysse DJ, Frank E, Lowe KK, Cherry CR, Kupfer DJ (1997):Electroencephalographic sleep correlates of episode andvulnerability to recurrence in depression. Biol Psychia-try 41:406–418
Buysse DJ, Kupfer DJ, Cherry C, Stapf D, Frank E (1999):Effects of prior fluoxetine treatment on EEG sleep in
women with recurrent depression. Neuropsychophar-macology 21:258–267
DeVane CL (1992): Pharmacokinetics of the selective seroto-nin reuptake inhibitors. J Clin Psychiatry 53:13–20
Ehlers CL, Havstad JW, Kupfer DJ (1996): Estimation of thetime course of slow-wave sleep over the night indepressed patients: Effects of clomipramine and clinicalresponse. Biol Psychiatry 39:171–181
Feige B, Voderholzer U, Riemann D, Hohagen F, Berger M(1999): Independent sleep EEG slow-wave and spindleband dynamics associated with 4 weeks of continuousapplication of short-halflife hypnotics in healthy sub-jects. Clin Neurophysiol 110:1965–1974
Fischer W, Streubel FR, Heydenreich F, Rabending G (1986):Quantitative EEG analysis of a single dose of psychotro-pic drugs in healthy probands. Psychiatrie NeurologieMedizinische Psychologie 38:450–455
Gillin JC, Rapaport M, Erman MK, Winokur A, Albala BJ(1997): A comparison of nefazodone and fluoxetine onmood and on objective, subjective, and clinician-ratedmeasures of sleep in depressed patients: A double-blind, 8-week clinical trial. J Clin Psychiatry 58:185–192
Haddad P (1997): Newer antidepressants and the discontin-uation syndrome. J Clin Psychiatry 58:17–22
Hyttel J (1994): Pharmacological characterization of selectiveserotonin reuptake inhibitors (SSRIs). Int Clin Psycho-pharmacol 9:19–26
Kupfer DJ, Ehlers CL, Frank E, Grochocinski VJ, McEachranAB, Buhari A (1994): Persistent effects of antidepres-sants: EEG sleep studies in depressed patients duringmaintenance treatment. Biol Psychiatry 35:781–793
Kupfer DJ, Ehlers CL, Pollock BG, Nathan S, Perel JM (1989):Clomipramine and EEG sleep in depression. PsychiatryRes 30:165–180
Kupfer DJ, Foster FG, Reich L, Thompson SK, Weiss B(1976): EEG sleep changes as predictors in depression.Am J Psychiatry 133:622–626
Kupfer DJ, Frank E, McEachran AB, Grochocinski VJ (1990):Delta sleep ratio. A biological correlate of early recur-rence in unipolar affective disorder. Arch Gen Psychia-try 47:1100–1105
Kupfer DJ, Perel JM, Pollock BG, Nathan RS, GrochocinskiVJ, Wilson MJ, McEachran AB (1991): Fluvoxamine ver-sus desipramine: Comparative polysomnographiceffects. Biol Psychiatry 29:23–40
Lejoyeux M, Adés J (1997): Antidepressant discontinuation:A review of the literature. J Clin Psychiatry 58:11–16
Malhotra S, Santosh PJ (1996): Loading dose imipramine-new approach to pharmacotherapy of melancholicdepression. J Psychiatr Res 30:51–58
Neckelmann D, Bjorkum AA, Bjorvatn B, Ursin R (1996):Sleep and EEG power spectrum effects of the 5-HT1Aantagonist NAN-190 alone and in combination with cit-alopram. Behav Brain Res 75:159–168
Patat A, Troy S, Burke J, Trocherie S, Danjou P, Le CF, AllainH, Gandon JM (1998): Absolute bioavailability and elec-troencephalographic effects of conventional andextended-release formulations of venlafaxine in healthysubjects. J Clin Pharmacol 38:256–267
Pollock BG, Perel JM, Nathan S, Kupfer DJ (1989): Acute

258 B. Feige et al. NEUROPSYCHOPHARMACOLOGY 2002–VOL. 26, NO. 2
antidepressant effect following pulse loading withintravenous and oral clomipramine. Arch Gen Psychia-try 46:29–35
Quitkin FM, Rabkin JD, Markowitz JM, Stewart JW,McGrath PJ, Harrison W (1987): Use of pattern analysisto identify true drug response. A replication. Arch GenPsychiatry 44:259–264
Quitkin FM, Rabkin JG, Ross D, Stewart JW (1984): Identifi-cation of true drug response to antidepressants. Use ofpattern analysis. Arch Gen Psychiatry 41:782–786
Rechtschaffen A, Kales A (1968): A manual of standardizedterminology, techniques, and scoring system for sleepstages of human subjects. (Publication 204). Washing-ton, DC, National Institutes of Health
Riemann D, König A, Hohagen F, Kiemen A, VoderholzerU, Backhaus J, Bunz J, Wesiack B, Hermle L, Berger M(1999): How to preserve the antidepressive effect ofsleep deprivation: A comparison of sleep phaseadvance and sleep phase delay. Eur Arch PsychiatryClin Neurosci 249:231–237
Röschke J, Kogel P, Schlosser R, Wagner P, Mann K, Ross-bach W, Benkert O (1997): Analysis of sleep EEG micro-structure in subchronic paroxetine treatment of healthysubjects. Psychopharmacology 132:44–49
Rosenbaum JF, Fava M, Hoog SL, Ascroft RC, Krebs WB(1998): Selective serotonin reuptake inhibitor discontin-uation syndrome: A randomized clinical trial. Biol Psy-chiatry 44:77–87
Rush AJ, Armitage R, Gillin JC, Yonkers KA, Winokur A,Moldofsky H, Vogel GW, Kaplita SB, Fleming JB, Mont-plaisir J, Erman MK, Albala BJ, McQuade RD (1998):Comparative effects of nefazodone and fluoxetine onsleep in outpatients with major depressive disorder.Biol Psychiatry 44:3–14
Saletu B, Frey R, Krupka M, Anderer P, Grünberger J, See WR(1991): Sleep laboratory studies on the single-dose effects ofserotonin reuptake inhibitors paroxetine and fluoxetine onhuman sleep and awakening qualities. Sleep 14:439–447
Saletu B, Grünberger J (1985): Classification and determina-tion of cerebral bioavailability of fluoxetine: Pharmaco-kinetic, pharmaco-EEG, and psychometric analyses. JClin Psychiatry 46:45–52
Schatzberg AF, Haddad P, Kaplan EM, Lejoyeux M, Rosen-baum JF, Young AH, Zajecka J (1997): Serotoninreuptake inhibitor discontinuation syndrome. A hypo-thetical definition. J Clin Psychiatry 58:5–10
Schlösser R, Röschke J, Rossbach W, Benkert O (1998): Conven-tional and spectral power analysis of all-night sleep EEGafter subchronic treatment with paroxetine in healthymale volunteers. Eur Neuropsychopharmacol 8:273–278
Schmidt ME, Fava M, Robinson JM, Judge R (2000): The effi-cacy and safety of a new enteric-coated formulation offluoxetine given once weekly during the continuationtreatment of major depressive disorder. J Clin Psychia-try 61:851–857
Sonntag A, Rothe B, Guldner J, Yassouridis A, Holsboer F,Steiger A (1996): Trimipramine and imipramine exertdifferent effects on the sleep EEG and on nocturnal hor-mone secretion during treatment of major depression.Depression 4:1–13
Spanier C, Frank E, McEachran AB, Grochocinski VJ, KupferDJ (1996): The prophylaxis of depressive episodes inrecurrent depression following discontinuation of drugtherapy: Integrating psychological and biological fac-tors. Psychol Med 26:461–475
Stassen HH, Angst J (1998): Delayed onset of action of anti-depressants — fact or fiction? CNS Drugs 9:177–184
Tarn M, Edwards JG, Sedgwick EM (1993): Fluoxetine, ami-triptyline and the electroencephalogram. J Affect Dis29:7–10
Trivedi M, Rush AJ, Armitage R, Gullion CM, GrannemannBD, Orsulak PJ, Roffwarg HP (1999): Effects of fluoxet-ine on the polysomnogram in outpatients with majordepression. Neuropsychopharmacology 20:447–459
Vasar V, Appelberg B, Rimon R, Selvaratnam J (1994): Theeffect of fluoxetine on sleep: A longitudinal, double-blind polysomnographic study of healthy volunteers.Int Clin Psychopharmacol 9:203–206
Viguera AC, Baldessarini RJ, Friedberg J (1998): Discontinu-ing antidepressant treatment in major depression. Har-vard Rev Psychiatry 5:293–306
Vogel GW (1983): Evidence for REM sleep deprivation as themechanism of action of antidepressant drugs. ProgNeuropsychopharmacol Biol Psychiatry 7:343–349
Vogel GW, Buffenstein A, Minter K, Hennessey A (1990):Drug effects on REM sleep and on endogenous depres-sion. Neurosci Biobehav Rev 14:49–63
Vogel GW, Cohen J, Mullis D, Kensler TT, Kaplita SB (1998):Nefazodone and REM sleep: How do antidepressantdrugs decrease REM sleep? Sleep 21:70–77
Vogel GW, Thurmond AJ, Gibbons P, Sloan K, Walker M(1975): REM sleep reduction effects on depression syn-dromes. Arch Gen Psychiatry 32:765–777
Vollmann J, Berger M (1993): Sleep deprivation with consecu-tive sleep-phase advance therapy in patients with majordepression: A pilot study. Biol Psychiatry 33:54–57
Wiegand M, Berger M (1989): Action of trimipramine onsleep and pituitary hormone secretion. Drugs 38(Suppl1):35–50
Yamadera H, Ferber G, Matejcek M, Pokorny R (1987):Quantitative pharmaco-electroencephalographic differ-entiation between the CNS effects of bromocriptine andimipramine, drugs with qualitatively different antide-pressant properties. Pharmacopsychiatry 20:54–59
Zajecka J, Fawcett J, Amsterdam J, Quitkin FM, Reimherr F,Rosenbaum JF, Michelson D, Beasley C (1998): Safety ofabrupt discontinuation of fluoxetine: A randomized,placebo-controlled study. J Clin Psychopharmacol18:193–197
Copyright © 2022 FDOKUMEN