Fluid–structure interaction of a square cylinder at different angles of attack
34
J. Fluid Mech. (2014), vol. 747, pp. 688–721. c Cambridge University Press 2014 doi:10.1017/jfm.2014.167 688 Fluid–structure interaction of a square cylinder at different angles of attack Jisheng Zhao 1, †, Justin S. Leontini 1, 2 , David Lo Jacono 1, 3 and John Sheridan 1 1 Fluids Laboratory for Aeronautical and Industrial Research (FLAIR), Department of Mechanical and Aerospace Engineering, Monash University, Melbourne, Vic 3800, Australia 2 Department of Mechanical Engineering and Product Design Engineering, Swinburne University of Technology, John St Hawthorn, 3162, Australia 3 Institut de Mécanique des Fluides de Toulouse (IMFT), CNRS, UPS, Université de Toulouse, Allée Camille Soula, F-31400 Toulouse, France (Received 16 August 2013; revised 14 January 2014; accepted 24 March 2014) This study investigates the free transverse flow-induced vibration (FIV) of an elastically mounted low-mass-ratio square cylinder in a free stream, at three different incidence angles: α = 0 ◦ , 20 ◦ and 45 ◦ . This geometric setup presents a body with an angle of attack, sharp corners and some afterbody, and therefore is a generic body that can be used to investigate a wide range of FIV phenomena. A recent study by Nemes et al. (J. Fluid Mech., vol. 710, 2012, pp. 102–130) provided a broad overview of the flow regimes present as a function of both the angle of attack α and reduced flow velocity U * . Here, the focus is on the three aforementioned representative angles of attack: α = 0 ◦ , where the FIV is dominated by transverse galloping; α = 45 ◦ , where the FIV is dominated by vortex-induced vibration (VIV); and an intermediate value of α = 20 ◦ , where the underlying FIV phenomenon has previously been difficult to determine. For the α = 0 ◦ case, the amplitude of oscillation increases linearly with the flow speed except for a series of regimes that occur when the vortex shedding frequency is in the vicinity of an odd-integer multiple of the galloping oscillation frequency, and the vortex shedding synchronizes to this multiple of the oscillation frequency. It is shown that only odd-integer multiple synchronizations should occur. These synchronizations explain the ‘kinks’ in the galloping amplitude response for light bodies first observed by Bearman et al. (J. Fluids Struct., vol. 1, 1987, pp. 19–34). For the α = 45 ◦ case, the VIV response consists of a number of subtle, but distinctly different regimes, with five regimes of high-amplitude oscillations, compared to two found in the classic VIV studies of a circular cylinder. For the intermediate α = 20 ◦ case, a typical VIV ‘upper branch’ occurs followed by a ‘higher branch’ of very large-amplitude response. The higher branch is caused by a subharmonic synchronization between the vortex shedding and the body oscillation frequency, where two cycles of vortex shedding occur over one cycle of oscillation. It appears that this subharmonic synchronization is a direct result of the asymmetric body. Overall, the FIV of the square cylinder is shown to be very rich, with a number of distinct regimes, controlled by both α and U * . Importantly, α controls the underlying FIV phenomenon, as well as controlling the types of possible synchronization between the oscillation and vortex shedding. Key words: flow-structure interactions, vortex streets † Email address for correspondence: [email protected]
Transcript of Fluid–structure interaction of a square cylinder at different angles of attack

J. Fluid Mech. (2014), vol. 747, pp. 688–721. c© Cambridge University Press 2014doi:10.1017/jfm.2014.167
688
Fluid–structure interaction of a square cylinderat different angles of attack
Jisheng Zhao1,†, Justin S. Leontini1,2, David Lo Jacono1,3 andJohn Sheridan1
1Fluids Laboratory for Aeronautical and Industrial Research (FLAIR), Department of Mechanical andAerospace Engineering, Monash University, Melbourne, Vic 3800, Australia
2Department of Mechanical Engineering and Product Design Engineering, Swinburne University ofTechnology, John St Hawthorn, 3162, Australia
3Institut de Mécanique des Fluides de Toulouse (IMFT), CNRS, UPS, Université de Toulouse,Allée Camille Soula, F-31400 Toulouse, France
(Received 16 August 2013; revised 14 January 2014; accepted 24 March 2014)
This study investigates the free transverse flow-induced vibration (FIV) of anelastically mounted low-mass-ratio square cylinder in a free stream, at three differentincidence angles: α= 0◦, 20◦ and 45◦. This geometric setup presents a body with anangle of attack, sharp corners and some afterbody, and therefore is a generic body thatcan be used to investigate a wide range of FIV phenomena. A recent study by Nemeset al. (J. Fluid Mech., vol. 710, 2012, pp. 102–130) provided a broad overview ofthe flow regimes present as a function of both the angle of attack α and reduced flowvelocity U∗. Here, the focus is on the three aforementioned representative angles ofattack: α=0◦, where the FIV is dominated by transverse galloping; α=45◦, where theFIV is dominated by vortex-induced vibration (VIV); and an intermediate value of α=20◦, where the underlying FIV phenomenon has previously been difficult to determine.For the α= 0◦ case, the amplitude of oscillation increases linearly with the flow speedexcept for a series of regimes that occur when the vortex shedding frequency is inthe vicinity of an odd-integer multiple of the galloping oscillation frequency, and thevortex shedding synchronizes to this multiple of the oscillation frequency. It is shownthat only odd-integer multiple synchronizations should occur. These synchronizationsexplain the ‘kinks’ in the galloping amplitude response for light bodies first observedby Bearman et al. (J. Fluids Struct., vol. 1, 1987, pp. 19–34). For the α = 45◦ case,the VIV response consists of a number of subtle, but distinctly different regimes, withfive regimes of high-amplitude oscillations, compared to two found in the classic VIVstudies of a circular cylinder. For the intermediate α= 20◦ case, a typical VIV ‘upperbranch’ occurs followed by a ‘higher branch’ of very large-amplitude response.The higher branch is caused by a subharmonic synchronization between the vortexshedding and the body oscillation frequency, where two cycles of vortex sheddingoccur over one cycle of oscillation. It appears that this subharmonic synchronizationis a direct result of the asymmetric body. Overall, the FIV of the square cylinder isshown to be very rich, with a number of distinct regimes, controlled by both α andU∗. Importantly, α controls the underlying FIV phenomenon, as well as controllingthe types of possible synchronization between the oscillation and vortex shedding.
Key words: flow-structure interactions, vortex streets
† Email address for correspondence: [email protected]

Fluid–structure interaction of a square cylinder 689
1. Introduction
This study presents the results of experiments on the flow past an elasticallymounted square-cross-section cylinder, where the flow is perpendicular to the longaxis of the cylinder, and the cylinder is constrained to oscillate across the flow. Assuch, this setup falls under the broader class of investigations of the fluid–structureinteraction of bluff, slender structures in cross-flow. This particular geometry issusceptible to two main flow-induced vibration (FIV) phenomena: vortex-inducedvibration (VIV) where the frequency of periodic vortex shedding and the frequencyof the body oscillation synchronize; and transverse galloping, an aeroelastic instability,caused by changes in the relative angle of attack induced by the body motionresulting in aerodynamic forces in the same direction as the motion. The prevalenceand importance of FIV of such structures in practical engineering applications hasmotivated extensive investigations in the past half-century that aim to characterize,predict, and suppress FIV of bluff bodies. Comprehensive reviews of this large bodyof research work have been given by Blevins (1990), Naudascher & Rockwell (2005)and Païdoussis, Price & De Langre (2010).
The FIV of an elastically mounted body constrained to oscillate across the streamis dependent on the body mass in oscillation m, the mechanical damping c andthe spring stiffness k (both assumed here to be constant), the fluid density ρ, thekinematic viscosity ν, and the inflow speed U. A number of dimensionless groupscan be defined, but typically for VIV studies the following independent parametersare used: the mass ratio, m∗ =m/md, where md is the mass of the fluid displaced bythe body; the structural damping ratio with consideration of the added mass,
ζ = c/(2√
k(m+mA)), (1.1)
in which mA is the added mass, which can be estimated from potential flow ormeasured directly through its influence on the natural frequency of the body instill fluid; the reduced velocity, U∗ = U/
√k(m+mA)H = U/fNH; and the Reynolds
number, Re = UH/ν. The displaced fluid mass is defined as md = ρCL, where C isthe geometry’s cross-sectional area, and L is the length of the body immersed in thefluid. Here, U is the free-stream velocity and H is the length of the cross-sectionperpendicular to the flow. For this particular study, the angle of attack of the squarecross-section with respect to the flow, α, is also a variable.
A number of dependent variables are also presented non-dimensionally. The bodydisplacement yb can be normalized by H. Forces, such as the lift force, are presentedas non-dimensional coefficients, Cy= Fy/0.5ρU2HL. Throughout this paper, measuredfrequencies are presented normalized by the natural frequency in water, f /fN . Thefrequency of the body oscillation f ∗yb
, the frequency of the total lift f ∗Cy, the frequency
of the vortex lift f ∗Cvortexand the frequency of the drag f ∗Cd
, are all non-dimensionalizedin this manner. It should be noted that the vortex lift is defined as the componentof the lift force that remains after subtracting the potential-flow added mass lift,following the method of Lighthill (1986).
A circular cross-section is not susceptible to galloping. Galloping relies on theaerodynamic forces being a function of the angle of attack of the body. Due to itssymmetry, a cylinder does not have an angle of attack. A cylinder is therefore onlysusceptible to VIV, and has served as an ideal model for fundamental research onthis phenomenon. Many of the previous results can be found in a series of reviewarticles (Bearman 1984; Sarpkaya 2004; Williamson & Govardhan 2004).

690 J. Zhao, J. S. Leontini, D. Lo Jacono and J. Sheridan
The result of these studies most pertinent to the current study is that the flowresponse for light cylinders (m∗ 6 10) can be broken down into four distinct regimesas a function of increasing U∗, typically referred to as branches (Khalak & Williamson1996; Govardhan & Williamson 2000). First is the initial branch, where the amplitudeof oscillation increases with U∗ and the oscillation is modulated due to the influenceof both the body natural frequency and the Strouhal frequency (the vortex sheddingfrequency of a stationary cylinder). Second is the upper branch, characterized byoscillations of large amplitude at a frequency around the body natural frequency,that appear to be unstable and chaotic (Hover, Techet & Triantafyllou 1998; Morse& Williamson 2009). The wake configuration in the upper branch consists of twooppositely signed pairs of vortices per oscillation cycle, where one vortex in the pairis much stronger than the other, and so is designated 2Po, following the namingconvention of Williamson & Roshko (1988). Third is the lower branch, consistingof very periodic and stable oscillations at amplitudes around 0.6D, where D is thecylinder diameter, and a frequency around the natural frequency of the body. Thevortex shedding and body oscillation are synchronized at the same frequency. Thewake again consists of two pairs of oppositely signed vortices, but this time moreeven in strength, and so it is designated 2P. Finally, the synchronization is lost anda desynchronized regime takes over, consisting of small oscillations at a fluctuatingfrequency around the Strouhal frequency.
Moving to the phenomenon of galloping, square-cross-sectional cylinders orientedwith a flat face normal to the flow have been widely adopted as the canonicalexperiment. While Den Hartog (1932) first proposed a criterion for the onsetof galloping of ice-covered cables, Parkinson & Smith (1964) developed a verysuccessful quasi-steady theory to predict the amplitude response of a square cylinderundergoing galloping. The theory is especially successful for relatively heavy andhighly damped bodies, such as typically occurs in air, where the galloping oscillationfrequency is much lower than the vortex shedding frequency.
For relatively light and lightly damped bodies, such as occur in water, the oscillationfrequency and vortex shedding frequency are not necessarily as well separated, and theimpact of the vortex shedding is more directly felt. Bearman et al. (1987) conductedexperiments in a wind tunnel using a system with low damping, and found that,while the overall picture is similar to that described by the theory of Parkinson &Smith (1964), a ‘kink’ region in the amplitude response occurred at U∗ ≈ 6π, with astrong third-harmonic frequency of the body oscillation present in the transverse liftfrequency components. Theoretical efforts to capture the effect of the vortex sheddingon the galloping response have been made by Bokaian & Geoola (1984), and acombined model for galloping and VIV developed by Corless & Parkinson (1988,1993), with limited success.
Much less attention has been paid to FIV of a square cylinder with variation ofangle of attack. A definition sketch for this case is given in figure 1. A recent paperby Nemes et al. (2012) experimentally investigated the influence of angle of attack ofa square cylinder with low mass-damping ratio on the body’s FIV response in thesame water channel facility as used for this study. An overall picture of the flowregimes that occur as a function of α and U∗ was presented. It was observed thata higher branch (HB) of amplitude response occurred over a range of angle of attack,10◦ < α < 22.5◦, where the body oscillation amplitudes are considerably higher thanthose seen in the upper branch associated with VIV, but with an oscillation frequencylocked onto approximately half of the Strouhal frequency. A numerical study fromZhao, Cheng & Zhou (2013), which allowed motion in both the cross-stream andstreamwise directions, found a similar high-amplitude response regime.

Fluid–structure interaction of a square cylinder 691
U
k c
y
xm
Fy
H
FIGURE 1. A definition sketch of the problem studied: a square cross-sectional cylinderwith variable angle of attack α, constrained to oscillate across the stream.
The present study aims to provide a precise and systematic description of thedynamics and response regimes of this system. As such, it significantly extends andrefines the findings of Nemes et al. (2012). Careful experiments, at a fine resolutionin terms of the independent parameters, allows different flow regimes to be clearlycharacterized and demarcated. As well as this, particle image velocimetry (PIV)and phase-averaging techniques have been employed for cases representing eachof the identified flow regimes, to show the vorticity production and vortex wakeconfigurations.
Three representative values of α have been chosen. The first, α=0◦, is the canonicaltest case for transverse galloping, and so the findings can be compared directly withthe results in the literature. The second, α= 45◦, results in FIV that is VIV dominated.As such, the results from this setup can be compared to the canonical results of VIVof a circular cylinder, and provide some insight into the generality of the circularcylinder results. The third, α= 20◦, presents the unique higher branch, and shows theimpact of a geometry that breaks the reflection symmetry.
The experimental method, including the experimental apparatus, measurementtechniques and experimental validation, is detailed in § 2. The following section, § 3,presents the obtained experimental results and discussion on the dynamic responsesand wake modes of a freely vibrating square cylinder at α = 0◦, 45◦ and 20◦. Lastly,conclusions of the present study are given in § 4.
2. Experimental method2.1. Experimental apparatus
The experiments were conducted in the free-surface recirculating water channel ofthe Fluids Laboratory for Aeronautical and Industrial Research (FLAIR), MonashUniversity. More details of this water channel facility can be found in Sherry, LoJacono & Sheridan (2010). The free-stream velocity in the present experiments wasvaried continuously in a range of U = 48–456 mm s−1.
The experimental setup is shown in figure 2. The rigid square cylinder model usedin the present study was made from aluminium square-cross-sectional tubing with aside width of 24.6 mm and an immersed length of L=620 mm, giving an aspect ratio

692 J. Zhao, J. S. Leontini, D. Lo Jacono and J. Sheridan
Cha
nnel
wid
th: 6
00 m
mC
hann
el h
eigh
t: 86
0 m
m
Wat
er le
vel:
786
mm
0.26
5 m
U
U
Laser sheet
Cylindrical lens
Lasers
Optional weights
Force balance
Test cylinder
y
x
Platform
Air bearing systemBase plate
(a)
(b)
Camera
y
x
FIGURE 2. (Colour online) A schematic showing the experimental setup in the test sectionof the water channel: (a) top view; (b) side view.
range of 17.8 6 AR = L/H 6 25.2. The displaced mass of water was md = 373.2 g,giving a minimum achievable mass ratio of m∗ = 2.64 for the square cylindermodel. In order to allow optical access the body was fitted with a 20 mm longPerspex section sitting 110 mm from the bottom end. The model was coupled witha force balance sting which was vertically mounted on an air bearing system. Moredetails of this air bearing system can be found in Nemes et al. (2012). To promoteparallel vortex shedding, an end conditioning platform technique used by Khalak &Williamson (1997) was adopted in the present experiments. The present platform hada height of 165 mm and a top plate with dimensions of 600 × 400 × 5 mm, givinga small gap of approximately 1 mm (4 %H) between the cylinder free end and thewater channel floor.
The natural frequencies of the system in both air and water were measured byconducting free decay tests individually in air and in quiescent water. The natural

Fluid–structure interaction of a square cylinder 693
frequency in air was measured and assumed to be the natural frequency of the systemin vacuum, while the natural frequency in water was also measured, for each angle ofattack tested. The test results showed that the natural frequencies of the system for thethree angles of attack were highly repeatable at fNa = 0.803 Hz and fNw = 0.648 Hz.Thus, the structural damping ratio, defined as ζ = c/(2
√k(m+mA))= 2.58× 10⁻³ was
determined, in which mA = ((fNa/fNw)2 − 1)m.
2.2. MeasurementsThe displacement of the cylinder was measured using a non-contact magnetostrictivelinear variable differential transformer (LVDT). The accuracy of the LVDT was within±0.01 % of the 250 mm linear range available, giving a displacement measurementprecision of 0.001H (see Nemes et al. 2012). The lift and drag forces acting on thecylinder were measured simultaneously along with the cylinder displacement usinga two-component force balance based on strain gauges configured in a Wheatstonebridge circuit. For the transverse lift measurement, the inertial force due to thecylinder’s acceleration was taken into account to recover the instantaneous Fy actingon the body using the following equation:
Fy = FSG +mByb, (2.1)
where FSG is the calibrated force output from the strain gauges of the lift measurementchannel, mB is the bottom part of the system’s mass consisting of half the forcebalance sting and the entire cylinder model, and yb is the body acceleration in thetransverse direction.
Further insight can also be gained by decomposing this measured force into acomponent due to potential flow, and a component due to vorticity, which can beassociated with the vortex shedding, according to the method proposed by Lighthill(1986), and employed by a number of studies of VIV (Govardhan & Williamson2000; Carberry, Sheridan & Rockwell 2001, 2005). This gives two important timeseries of force: the total lift force Fy and the vortex lift force Fvortex. The instantaneousrelative phases between these two forces and the body displacement, φtotal and φvortex,were calculated using the Hilbert transform (HT) (see Hahn 1996).
The vorticity fields in the near wake of the cylinder was measured using thePIV technique. The PIV system detailed in Nemes et al. (2012) was used forthis purpose. The flow was seeded with hollow micro-spheres (model: Sphericel110P8, Potters Industries Inc.) having a normal diameter of 13 µm and a specificweight of 1.1 g m−3. Illumination was provided by two miniature Ng:YAG pulselasers (Continuum Minilite II Q-Switched lasers) which produced a 2 mm thickhorizontal planar sheet. Imaging was performed using a PCO 2000 (PCO, Germany)camera with a resolution of 2048 × 2048 pixel. The camera was equipped with a50 mm lens (Nikon Corporation, Japan), giving a magnification of approximately9.73 pixel mm−1 for the field of view of interest. In the present study, twophase-averaging methods were used. Where the body oscillations are highly periodicand sinusoidal (i.e. in the lock-in region of α = 45◦), the PIV measurements weretriggered using a real-time control system at eight specified phases of the body’soscillations, giving 250 image pairs for each phase for phase-locked averaging. Whenthe oscillations were periodic but not sinusoidal (i.e. in the cases of α = 0 and20◦), the PIV measurements were sampled at 4 Hz(more than eight times the bodyoscillation frequency for all U∗) initially at a random phase of the body motion.The cylinder’s location at each PIV imaging trigger was determined by analysing
694 J. Zhao, J. S. Leontini, D. Lo Jacono and J. Sheridan
the transistor–transistor logic (TTL) pulses and the LVDT signals, and then the PIVimages were sorted into 12 different phase regions (or time intervals) with respect tothe body oscillation period. To achieve high-quality phase-region-averaged PIV results,a large number of 5000 PIV image pairs were recorded for each reduced velocity ofinterest, yielding at least 400 image pairs for each of the 12 phase regions, whichallowed much finer time intervals for phase-averaging compared to the method usedpreviously in Nemes et al. (2012). The PIV image data were analysed with validatedin-house PIV software developed by Fouras, Lo Jacono & Hourigan (2008), using32× 32 pixel interrogation windows in a grid layout with 50 % window overlap.
2.3. Experimental validationThe methodologies used are validated here against the published results of Khalak &Williamson (1997) for VIV of a circular cylinder. The present circular cylinder hada diameter of D= 40 mm and an immersed length of L= 620 mm, giving an aspectratio of AR=L/D= 15.5 and a displaced water mass of md= 780.1 g. The total massof the oscillating system was m = 1872.2 g, resulting in a mass ratio of m∗ = 2.40.Free decay tests were conducted individually in air and water to determine thenatural frequency in air, fNa = 0.572 Hz, and in water, fNw = 0.477 Hz. The structuraldamping ratio was measured at ζ = 2.43× 10⁻³, resulting in a mass-damping ratio ofm∗ζ = 5.83× 10⁻³, which was comparable to the case study with m∗ζ = 11.3× 10⁻³
(in which m∗ = 2.4 and ζ = 4.5 × 10⁻³) by Khalak & Williamson (1997). Theend condition was also controlled using the platform end control technique asdescribed previously. The Strouhal number of the cylinder at rest of the present caseis St= 0.208 which is in excellent agreement with St≈ 0.21 for 1000< Re< 10 000consistently reported in the literature (see Norberg 2001).
The dynamic response of VIV was investigated over a reduced velocity of 2.75<U∗< 17, corresponding to a flow velocity range of 49.5 mm s−1<U∞< 32.4 mm s−1
and a Reynolds number range of 2000 < Re < 13 000. The response amplitude andfrequency of the present work are compared directly to the results of Khalak &Williamson (1997) at the same mass ratio in figure 3. It should be noted that theresults of Khalak & Williamson (1997) include data of both increasing and decreasingreduced velocities for hysteresis and intermittency, while the present results includeonly data of increasing reduced velocities since the phenomena of hysteresis andintermittency are not focused on in this comparison. The comparison shows thatthe overall agreement is remarkable in terms of the three-branch amplitude responsepattern, the amplitude peak value, the lock-in region, and the frequency response.
2.3.1. The transverse lift force measurementAs the transverse lift force is a crucial parameter in FIV studies, it is of importance
to validate the lift measurement in experiments. However, very few such experimentalvalidations can be found in the literature. For validation purposes, measurements ofthe lift acting on a circular cylinder undergoing VIV were also conducted.
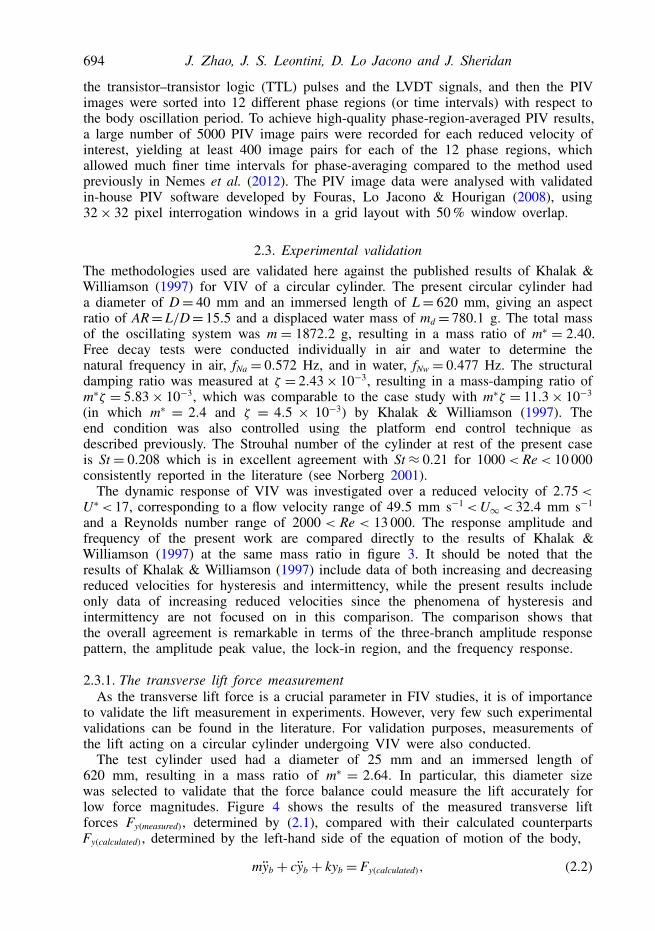
The test cylinder used had a diameter of 25 mm and an immersed length of620 mm, resulting in a mass ratio of m∗ = 2.64. In particular, this diameter sizewas selected to validate that the force balance could measure the lift accurately forlow force magnitudes. Figure 4 shows the results of the measured transverse liftforces Fy(measured), determined by (2.1), compared with their calculated counterpartsFy(calculated), determined by the left-hand side of the equation of motion of the body,
myb + cyb + kyb = Fy(calculated), (2.2)

Fluid–structure interaction of a square cylinder 695
0
0.2
0.4
0.6
0.8
1.0
0
1
2
3
4
2 4 6 8 10 12 14 16 18
U*
(a)
(b)
FIGURE 3. (Colour online) A comparison of experimental results shows excellentagreement between the present study and Khalak & Williamson (1997) in (a) theamplitude and (b) the frequency responses of a circular cylinder with m∗ = 2.4. In (a)open circles represent the normalized amplitude peaks, A∗max, of the present results, solidcircles represent the present A∗10 values, the mean of the top 10 % of the oscillationamplitudes, and open squares represent the results of Khalak & Williamson (1997). In(b) solid circles represent the present results, while open squares represent the results ofKhalak & Williamson (1997).
at different reduced velocities corresponding to the initial, the upper, and the lowerbranches. Note that in the figure, the two curves lie almost on top of each other,verifying that Fy(measured) agreed well with Fy(calculated) in a wide typical VIV range,indicating that the force balance could accurately measure the fluctuating Fy atmagnitudes as low as 0.005 N.
3. Results3.1. Galloping-dominated response at α = 0◦
The results presented in this section significantly expand upon previous results fromBearman et al. (1987) and Nemes et al. (2012). Using very fine increments of flowspeed, represented by U∗, the previously reported kink is shown to be a regionof harmonic resonance between the body oscillation and three cycles of the vortexshedding. Following the lead of Bearman et al. (1987), it is also shown that a similar

696 J. Zhao, J. S. Leontini, D. Lo Jacono and J. Sheridan
0 5 10 15 20 25 30
–0.1
0
0.1
Fy
(N)
Fy
(N)
Fy
(N)
–0.1
0
0.1
–0.1
0
0.1
(a)
(b)
(c)
t (s)
FIGURE 4. (Colour online) Time traces of the transverse lift force of a circular cylinderin the three typical response branches: (a) U∗ = 4.4, in the initial branch, (b) U∗ = 5.0,in the upper branch, and (c) U∗ = 8.0, in the lower branch. The solid lines representthe calculated values (Fy(calculated)) using the left-hand side of (2.2), while the dashed linesrepresent the measurement values (Fy(measured)).
process occurs between the body oscillation and five cycles of vortex shedding. Thesesynchronized regimes are clearly shown in the trend of the oscillation amplitudeversus U∗, as well as in the dependence of the frequency content of the oscillation,lift force and drag force, on U∗. Establishing that the kink is due to resonance, aswell as finding a series of synchronizations between the body oscillation frequencyand odd numbers of vortex shedding cycles, appears to be a novel result.
Further, a novel explanation for the synchronization to odd numbers of vortexshedding cycles, while even numbers appear to have no special effect, is also provided.
3.1.1. Amplitude and frequency responseFigure 5(a) shows A∗ as a function of U∗ for the α = 0◦ case. Also shown
(figure 5b–e) are contours of energy as a function of frequency and U∗ for fourdifferent sets of time series: the body oscillation, the total lift (transverse) force, thelift force attributable to the vortex shedding, and the total drag force. The contourswere formed by taking the Fourier transform of the time series at a given value ofU∗, then normalizing the resulting spectrum by the maximum energy, then ‘stacking’the resulting normalized spectrum next to that obtained at the previous value of U∗.This normalization process means that the dominant frequencies at any value of U∗are clearly visible on the plot, as are changes in the frequency response as a functionof U∗. This process has been employed successfully previously by Assi, Bearman& Meneghini (2010), Leontini, Lo Jacono & Thompson (2011, 2013), Leontini &Thompson (2013) and Tudball-Smith et al. (2012), the latter providing further detailsof how these plots are constructed.

Fluid–structure interaction of a square cylinder 697
2 4 6 8 10 12 14 16 18 20 22 24 260
2
4
6
80
1
2
3
40
1
2
3
40
1
2
3
40
0.5
1.0
1.5
2.0
2.5
0
−0.5
−1.0
−1.5
−2.0
−2.5
−3.0
(a)
(b)
(c)
(d)
(e)
U*
A*
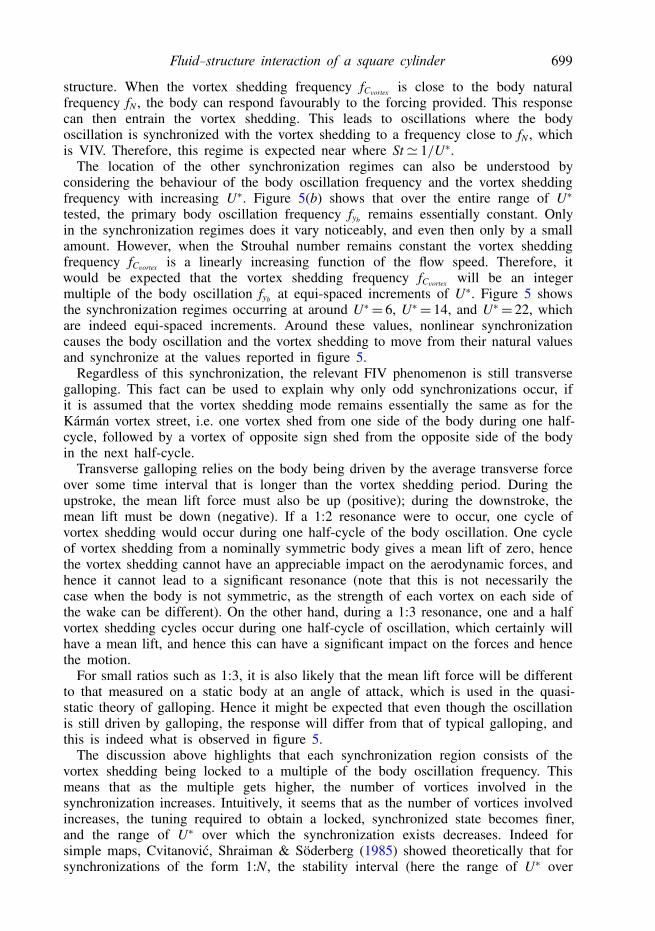
FIGURE 5. (Colour online) Three resonance regions are revealed in the amplitude responseand frequency content as a function of reduced velocity of a free vibrating squarecylinder with m∗ = 2.64 at α= 0◦. In (a), open and solid squares represent A∗max and A∗10,respectively. The resonance regions are shaded in (a), and correspondingly shown clearlyby distinctive single-frequency response regions in (b)–(e), which are the logarithmic-scalefrequency power spectrum contour plots of the body oscillation (f ∗yb
), transverse lift (f ∗Cy),
transverse vortex force (f ∗Cvortex), and the drag (f ∗Cd
), respectively. Note that the frequencycomponents are normalized by fNw, e.g. f ∗yb
= fyb/fNw. The dashed line represents the valueof St.

698 J. Zhao, J. S. Leontini, D. Lo Jacono and J. Sheridan
While the general trend of classical galloping is shown in figure 5 (A∗ increasingapproximately linearly with U∗ once U∗ is beyond some threshold value), a numberof features that diverge from the classical picture are immediately apparent. The mostobvious are the steps or kinks in the amplitude response, that have been marked bythe shaded background of figure 5(a).
The first of these kinks with increasing U∗ occurs around U∗ = 6. This coincideswith a non-dimensional natural frequency f ∗N = 1/U∗ ' 0.167. The Strouhal numberfor this system (the non-dimensional vortex shedding frequency from a rigidlymounted square) is St = 0.131. Therefore, this kink represents a small regime ofVIV-dominated response, where the body motion frequency and vortex sheddingfrequency synchronize, and the motion is essentially periodic and regular. Themotion in this regime is driven by the unsteady vortex shedding, as opposed tothe long-time-average aerodynamic forces that dictate the motion during typicalgalloping. The synchronization between the oscillation frequency f ∗yb
and the vortexshedding f ∗Cvortex
can be confirmed by comparing the spectra shown in figures 5(b) and5(d). Both show the same single dominant frequency at U∗= 6. The presence of onlya single frequency also confirms the periodicity of the motion. As the frequency ofthe oscillation and the vortex shedding is the same, this is a 1:1 synchronization.
The second of these kinks, that occurs over a much larger range of U∗ than thefirst, is focused around U∗ = 14. This regime begins around U∗ = 11, and is markedby a small, but distinct plateau in the amplitude of oscillation. The regime endsaround U∗ = 16, where there is a small but distinct increase in the amplitude ofoscillation. Throughout this regime, the flow is periodic, with only a single dominantfrequency occurring in the body oscillation f ∗yb
. This frequency increases very slowly,but essentially linearly, with U∗.
A key feature of this regime is the difference in the contribution of the frequencycomponent at three times the body oscillation frequency, 3f ∗yb
, to the body oscillationand the lift force. For the body oscillation, the contribution of 3f ∗yb
is relatively weak,whereas for the total lift force and the vortex lift force, both f ∗yb
and 3f ∗ybmake
significant contributions. In fact, for the vortex lift force, the component at 3f ∗ybis
the strongest component for U∗ > 14. This is indicative of the fact that the vortexshedding is synchronized to 3f ∗yb
in this regime, or a 1:3 synchronization. It appearsthat this regime is the same as the kink observed by Bearman et al. (1987).
The third of these kinks is focused around U∗= 22. The regime is delineated by aregion where the amplitude appears to be constant with increasing U∗. Similarly to the1:1 synchronization and the 1:3 synchronization, this regime appears to have a singledominant frequency of oscillation f ∗yb
. However, the total and vortex lift spectra showa significant component at 5f ∗yb
, indicating that this regime is a 1:5 synchronizationbetween the oscillation and the vortex shedding.
3.1.2. Synchronization regimesAs a whole, figure 5 shows that the FIV of a square cylinder generally follows
the trends predicted by the quasi-static theory of transverse galloping developed byParkinson & Smith (1964), punctuated by a series of synchronization regimes betweenthe body oscillation and the vortex shedding. Three key questions arise out of thispicture: Why do the synchronization regimes occur at these particular values of U∗?Why do only ‘odd’ synchronizations occur, while ‘even’ ones do not (such as 1:2, 1:4,etc.)? What controls the extent of each of the synchronization regions?
The location of the first 1:1 synchronization can be understood by consideringthe interaction between the vortex shedding and the natural frequency of the body
Fluid–structure interaction of a square cylinder 699
structure. When the vortex shedding frequency fCvortex is close to the body naturalfrequency fN , the body can respond favourably to the forcing provided. This responsecan then entrain the vortex shedding. This leads to oscillations where the bodyoscillation is synchronized with the vortex shedding to a frequency close to fN , whichis VIV. Therefore, this regime is expected near where St' 1/U∗.
The location of the other synchronization regimes can also be understood byconsidering the behaviour of the body oscillation frequency and the vortex sheddingfrequency with increasing U∗. Figure 5(b) shows that over the entire range of U∗tested, the primary body oscillation frequency fyb remains essentially constant. Onlyin the synchronization regimes does it vary noticeably, and even then only by a smallamount. However, when the Strouhal number remains constant the vortex sheddingfrequency fCvortex is a linearly increasing function of the flow speed. Therefore, itwould be expected that the vortex shedding frequency fCvortex will be an integermultiple of the body oscillation fyb at equi-spaced increments of U∗. Figure 5 showsthe synchronization regimes occurring at around U∗= 6, U∗= 14, and U∗= 22, whichare indeed equi-spaced increments. Around these values, nonlinear synchronizationcauses the body oscillation and the vortex shedding to move from their natural valuesand synchronize at the values reported in figure 5.
Regardless of this synchronization, the relevant FIV phenomenon is still transversegalloping. This fact can be used to explain why only odd synchronizations occur, ifit is assumed that the vortex shedding mode remains essentially the same as for theKármán vortex street, i.e. one vortex shed from one side of the body during one half-cycle, followed by a vortex of opposite sign shed from the opposite side of the bodyin the next half-cycle.
Transverse galloping relies on the body being driven by the average transverse forceover some time interval that is longer than the vortex shedding period. During theupstroke, the mean lift force must also be up (positive); during the downstroke, themean lift must be down (negative). If a 1:2 resonance were to occur, one cycle ofvortex shedding would occur during one half-cycle of the body oscillation. One cycleof vortex shedding from a nominally symmetric body gives a mean lift of zero, hencethe vortex shedding cannot have an appreciable impact on the aerodynamic forces, andhence it cannot lead to a significant resonance (note that this is not necessarily thecase when the body is not symmetric, as the strength of each vortex on each side ofthe wake can be different). On the other hand, during a 1:3 resonance, one and a halfvortex shedding cycles occur during one half-cycle of oscillation, which certainly willhave a mean lift, and hence this can have a significant impact on the forces and hencethe motion.
For small ratios such as 1:3, it is also likely that the mean lift force will be differentto that measured on a static body at an angle of attack, which is used in the quasi-static theory of galloping. Hence it might be expected that even though the oscillationis still driven by galloping, the response will differ from that of typical galloping, andthis is indeed what is observed in figure 5.
The discussion above highlights that each synchronization region consists of thevortex shedding being locked to a multiple of the body oscillation frequency. Thismeans that as the multiple gets higher, the number of vortices involved in thesynchronization increases. Intuitively, it seems that as the number of vortices involvedincreases, the tuning required to obtain a locked, synchronized state becomes finer,and the range of U∗ over which the synchronization exists decreases. Indeed forsimple maps, Cvitanovic, Shraiman & Söderberg (1985) showed theoretically that forsynchronizations of the form 1:N, the stability interval (here the range of U∗ over

700 J. Zhao, J. S. Leontini, D. Lo Jacono and J. Sheridan
–1.2
–0.6
0
0.6
1.2
–2
–1
0
1
2
–2
–1
0
1
2
1
2
3
4
5
0
0.5
1.0
Pf
PfCy
Cd
Pf
Pf
0
0.5
1.0
0
0.5
1.0
0
0.5
1.0
0 1 2 3 4 5 1 2 3 4
f *
(ai)
(aii)
(aiii)
(aiv)
(bi)
(bii)
(biii)
(biv)
C
FIGURE 6. An example of the dynamics of the 1:3 synchronization for α= 0◦: time traces(a) and normalized power spectra (b) of displacement (i), total lift (ii), vortex lift (iii) anddrag (iv). The reduced velocity of this case is U∗ = 14.26. A third-harmonic frequencyof the body oscillation is clearly seen in Cy and Cvortex. The frequency components arenormalized by fNw, i.e. f ∗ = f /fNw, and τ = tfNw.
which the synchronization exists) scales with N−3. Excluding the 1:1 synchronization(which is controlled by VIV, not galloping), a significant reduction in the stabilityinterval is observed with increasing N, with the 1:3 synchronization occurring over amuch greater range of U∗ than the 1:5 synchronization.
It should also be noted that the same basic phenomena control the flow whether theflow is synchronized or not. These are the body oscillation, and the vortex shedding.Outside of the synchronization regimes, these two phenomena are uncorrelated, andso both contribute to the spectral content of the response, resulting in a modulatedbody oscillation. However, the two phenomena cannot be thought of as purely additivedue to the nonlinearity of the system, and it is this nonlinearity that allows the bodyoscillation and vortex shedding to synchronize.
3.1.3. Further details of the 1:3 synchronizationThis section presents details of the case at U∗ = 14.26, close to the centre of the
range over which the 1:3 synchronization occurs as shown in figure 5.Figure 6 shows time traces and power spectra of the displacement and the fluid
forces for the case at U∗= 14.26. At this reduced velocity, the body’s oscillations are

Fluid–structure interaction of a square cylinder 701
highly periodic as shown in figure 6(ai), with a dominant frequency of f ∗yb= 0.77 and
a third-harmonic frequency (3f ∗yb= 2.31) with a much weaker power magnitude as
shown in figure 6(bi). The fluid forces (Cy, Cvortex, and Cd) are also highly periodic.The drag is dominated by a frequency equal to the second-harmonic frequency ofthe body motion, and also has a component at twice this frequency. The total liftforce fluctuates with the same frequency components as the body motion, howeverits third-harmonic frequency is much stronger in power than that of the body motion.This is reflected in the significant modulation of the time trace of the lift. If onlythe vortex lift is considered, the force is dominated by its third-harmonic frequency(while still possessing a significant component at the body-motion dominant gallopingfrequency). This indicates that the vortex shedding frequency is three times thegalloping oscillation frequency.
For the 1:3 synchronization to be described as a modified galloping phenomenon,the lift force and the body oscillation should be essentially in phase. However,because of the reasonably complicated relationship between the lift force and thebody oscillation, defining a phase between the two signals can be difficult. Whatis most important is the phase between the component of the lift force that issynchronized to the body motion. Rather than decompose the signal using a Fourierdecomposition which assumes sinusoidal modes, the total lift and the vortex lift canbe decomposed using empirical mode decomposition (EMD) pioneered by Huanget al. (1998). This results in mode shapes that are not sinusoidal, but they areorthogonal.
Figure 7 shows that the leading EMD mode of both Cy and Cvortex, denotedby Cy (EMD1) and Cvortex (EMD1) respectively, oscillate with a frequency similar to thedominant frequency of the body motion. Therefore, the leading EMD modes ofCy and Cvortex can be thought of as representing the body oscillation. The secondEMD modes of both Cy and Cvortex, denoted by Cy (EMD2) and Cvortex (EMD2) respectively,oscillate with a frequency similar to the vortex shedding frequency, and can be thoughtof as representing the influence of the vortex shedding. For a galloping-dominatedprocess, the long-time forces (over the period of body oscillation) are expected to bein phase with the oscillation. Figure 7(c) shows that this is indeed the case, furthersuggesting that the 1:3 synchronization is a galloping-dominated phenomenon.
Interestingly, figure 7(d) shows that the second EMD modes of the oscillation andthe vortex shedding are also in phase. Cvortex (EMD1) is in phase with Cy (EMD1), shownin figure 7(c), and d). Thus, this EMD analysis of the lift and vortex forces furthersuggests that the 1:3 synchronization is a galloping-dominated phenomenon.
Images of the wake show further evidence of this. Figure 8 shows a series of twelveimages of vorticity contours over one cycle of oscillation obtained from PIV. Theimages were obtained by averaging a series of images obtained over a small timeperiod, as explained in § 2.2. The time period averaged over for each image is markedon the time history plot in figure 8(a).
The images show very clearly the regular vortex shedding that occurs. The wakemode is essentially the same as the classic Kármán vortex street, with vortices beingalternately shed from each side of the cylinder.
3.2. VIV dominated response α = 45◦
Like the case at α = 0◦, the case at α = 45◦ presents a body that is symmetric withrespect to the wake centreline. When the body is fixed, the vortex shedding proceedsquite similarly to the canonical bluff body, the cylinder, resulting in a Kármán vortex

702 J. Zhao, J. S. Leontini, D. Lo Jacono and J. Sheridan
–2
0
2
Cy
–2
0
2
C
0
90
180
0
90
180
0 1 2 3 4 5
(a)
(b)
(c)
(d)
FIGURE 7. Decomposition using the EMD method shows that the first two modes ofCy and Cvortex are in-phase in the 1:3 synchronization of α = 0◦. In (a) and (b), theblack solid lines represent Cy and Cvortex, respectively, in which the grey dashed linesrepresent the first EMD mode (Cy (EMD1) and Cvortex (EMD1)) and the grey dot-dashed linesrepresent the second EMD mode (Cy (EMD2) and Cvortex (EMD2)). (c) The relative phase (φvt1)between Cvortex (EMD1) and Cy (EMD1), and (d) the relative phase (φvt2) between Cvortex (EMD2)and Cy (EMD2). The reduced velocity of this case is U∗ = 14.26.
street that is spatio-temporally symmetric, i.e. evolution forward in time by half aperiod plus reflection about the wake centreline returns the original flow (it shouldbe noted that the flow is not exactly spatio-temporally symmetric, due to significantthree-dimensional effects, and some fluctuation in the frequency of the shedding overtime, but the basic configuration of the vortex shedding does not deviate from thisbasic spatio-temporal picture significantly).
Unlike the case at α = 0◦, the case at α = 45◦ is not susceptible to galloping. Asexplained by the quasi-static theory of Parkinson & Smith (1964), galloping shouldonly occur when ∂Cy/∂α > 0◦ at the base angle of attack (here 45◦). This does occurfor α = 0◦, but not for α = 45◦. However, the α = 45◦ case, like any bluff body thatcauses alternate vortex shedding, is susceptible to VIV, and it is this phenomenon thatdominates the FIV of this case.
Nemes et al. (2012) showed that in some respects the response of the squarecylinder at α= 45◦ is similar to that of the circular cylinder, as described in § 2.3 andshown in figure 3. The primary differences identified were a less distinct transitionbetween the initial and upper branches, and rather than a distinct periodic lowerbranch that suddenly loses coherence beyond some critical U∗, a gradual increase indisorder was observed, with significant amplitude oscillations still occurring for theunsynchronized flow.

Fluid–structure interaction of a square cylinder 703
–2
0
2
0 11
2
3
4
5
Cd
Tb
i(a)
(b)
ii iii iv v vi vii viii ix x xi xii i
0 1 2 3 4 5 6 7 0 1 2 3 4 5 6 7 0 1 2 3 4 5 6 7
−2
−1
0
1
2
−2
−1
0
1
2
−2
−1
0
1
2
−2
−1
0
1
2
(iv)
(iii)
(ii)
(i)
(viii)
(vii)
(vi)
(v)
(xii)
(xi)
(x)
(ix)
A
A
A
A
B
B
B
C
AB
C
C
C
C
D
D
D
D
E
C
D
D
D
E
E
E
F
F
F
−4.0 −2.4 −0.8 0.8 2.4 4.0
FIGURE 8. (Colour online) Time-based phase-averaged vorticity fields reveal a 3(2S) modein the 1:3 synchronization regime. Three cycles of the 2S mode are shed in an oscillationcycle. For the case shown, m∗ = 2.64, α = 0◦ and U∗ = 14.26. (a) The time history ofthe displacement and forces over a cycle of oscillation. The black solid line representsyb, the black short-dashed line represents Cy, the black dot-dashed line represents Cvortex,and the grey long-dashed line represents Cd. (b) Images of vorticity from PIV averagedover the intervals marked on the time history in (a). The vorticity contour levels shownare normalized by ω∗z = ωzH/U. The contours marked with solid lines represent positivevalues, and the contours marked with dashed lines represent negative values.

704 J. Zhao, J. S. Leontini, D. Lo Jacono and J. Sheridan
The results presented here build on and clarify those results. Experiments at veryfine increments of U∗ have been performed in order to home in on the transitionsbetween the various response regimes present. The results presented below showthat, in addition to the results presented by previous studies, this upper branch infact consists of a number of regimes, each with distinct frequency, force, and phasecharacteristics.
3.2.1. Amplitude and frequency responsesFigure 9(a) shows the variation of the amplitude of oscillation as a function of U∗
for a relatively light body at m∗ = 2.64, together with the variation of the frequencycontent of the displacement and force time series (figure 9b–e). The frequency contentplots are constructed in the same manner as figure 5, described in § 3.1.1.
Figure 9 shows that the response type is quite varied, with large-amplitudeoscillations for 3 < U∗ < 7.5 (the region designated as the upper branch by Nemeset al. 2012) consisting of five regimes, the boundaries of which are marked by thedotted vertical lines on the figure. The characteristics of each of these regimes, aswell as the initial branch and desynchronization regions, are highlighted below, inorder of increasing U∗.
For U∗ < 3, the flow is on the initial branch. Here, the oscillations are small andmodulated, and figure 9 shows that the oscillation as well as the lift force consists offrequency components at both the Strouhal and natural frequencies.
At U∗ = 3, the flow transits to the beginning of the upper branch, and the first ofa series of synchronized regimes, where the vortex shedding and the body oscillationoccur at the same frequency. In this first regime (i), the vortex shedding occurs inthe 2S mode, similar to the classic Kármán vortex street. The frequency of oscillationis close to, but slightly below, the natural frequency of the body. The amplitude ofoscillation in this regime is almost a linear function of U∗. The onset of this regimeis also marked by a distinct increase in the magnitude of the lift force measured onthe body, as shown in figure 10.
At U∗ = 4.4, a change to a second distinct synchronized regime (ii) occurs. Thewake mode changes from the 2S mode to the 2P mode, as shown in figure 11. Thisis accompanied by a small but distinct kink in the trend of amplitude as a functionof U∗. There is also a distinct change in the frequency response. The frequency ofoscillation and vortex shedding shifts to a value close to, but now slightly above, thenatural frequency of the body. This appears to be related to a change of the addedmass related to the redistribution of vorticity that occurs with the change of wakemode (see Lighthill 1986). Figure 10 shows that with the onset of this regime andthe change in wake mode, there is also a switch in the vortex phase from φvortex= 0◦to φvortex = 180◦, and a jump in the magnitude of the vortex lift.
At U∗=5, a third distinct synchronized regime (iii) begins. The onset of this regimeoccurs close to the point where the body natural frequency is equal to the Strouhalfrequency. There is little discernible difference in the flow between this regime and theprevious one (ii); however, there is a distinct change in the frequency of response asshown in figure 9. The frequency moves from a value close to the natural frequency,to a value close to, but slightly above, the Strouhal frequency. The flow remainssynchronized; both the vortex shedding and the body oscillation occur at this valueclose to the Strouhal frequency, and the governing FIV phenomenon appears to beVIV. Regardless, the frequency is not set by the body natural frequency as it invariablyis during synchronized VIV of a circular cylinder.

Fluid–structure interaction of a square cylinder 705
2 4 6 8 10 12 14 16 180
2
4
6
80
1
2
3
40
1
2
3
40
1
2
3
40
0.2
0.4
0.6
0.8
1.0
0
−0.5
−1.0
−1.5
−2.0
Desynchronization
i ii iii iv v
(a)
(b)
(c)
(d)
(e)
U*
A*
FIGURE 9. (Colour online) Various response regimes (separated by vertical dotted lines,and labelled i–v on (a)) occur as a function of U∗ for the α = 45◦ case, demarcatedby their amplitude, frequency, and phase characteristics. In (a), open and solid squaresrepresent A∗max and A∗10, respectively; (b)–(e) are the logarithmic-scale frequency powerspectrum contour plots of the body oscillation (f ∗yb
), transverse lift (f ∗Cy), transverse vortex
force (f ∗Cvortex), and drag (f ∗Cd
), respectively. Note that the frequency components arenormalized by fNw, e.g. f ∗yb
= fyb/fNw. The dashed line on (b)–(e) marks the Strouhalfrequency.

706 J. Zhao, J. S. Leontini, D. Lo Jacono and J. Sheridan
0
0.5
1.0
1.5
2.0
Cy
(r.m
.s.), C
(r.
m.s
.)
0
90
180
2 4 6 8 10 12 14 16 18
(a)
(b)
U*
i ii iii iv v
FIGURE 10. (a) The root mean square (r.m.s.) of the total and vortex lift force and (b)the average phase between the total lift and the body displacement, and the vortex liftand the body displacement. Solid circles represent quantities relating to the total force,and open circles represent quantities relating to the vortex force.
Figure 9 shows that the amplitude of oscillation first increases, then decreaseswith increasing U∗ in this regime. Figure 10 shows that the onset of this mode isaccompanied by a sharp increase in the total lift force, which then linearly decreaseswith U∗. The vortex force, on the other hand, increases with U∗.
A further interesting feature of this regime is the fact that the drag appears tooscillate at a frequency that is the same as for the lift, rather than a frequency twicethat of the lift. A significant component is present at twice the primary frequency ofthe lift; however, the strongest component is the same as that of the lift. One wayfor this to occur is for the vortex shedding to be asymmetric, which should result ina small non-zero mean lift and displacement. However, a non-zero mean lift is notimmediately apparent in the results of the current experiments. A subtle asymmetrymay exist that is the cause of the spectral characteristics of the drag, but furtherexperiments are required to fully understand this feature.
The reason why a non-zero mean displacement is difficult to measure is that theexact equilibrium position of the body in the channel is unknown. The resting positionof the body while there is no flow in the channel could be used, but this assumes thatthe inflow is perfectly aligned. The error in the actual resting position from makingthis assumption is small, but it may be of the same order as the mean displacementfor a flow that is only weakly asymmetric. Strong asymmetries will be clear from theshape of the time history, i.e. for a periodic flow, y(t + T/2) 6= −y(t). However, fora weakly asymmetric flow, it is difficult to separate such inherent asymmetries fromfluctuations in the body position due to external disturbances.
U∗= 6 marks the beginning of a fourth regime (iv), distinct from the others in thehigh-amplitude upper branch region as it is not periodic. Figure 9 shows that while thefrequency content of the body oscillation remains dominated by a single component at

Fluid–structure interaction of a square cylinder 707
−4.0 −2.4 −0.8 0.8 2.4 4.0
t
yb
yb
t
yb
t
t
yb
(ai)
(aii)
(aiii)
(aiv)
(bi)
(bii)
(biii)
(biv)
0 1 2 3 4 5 0 1 2 3 4 5−2
−1
0
1
2
−2
−1
0
1
2
−2
−1
0
1
2
−2
−1
0
1
2
A
A
A
A
B
B
A
A
A
A
B
B
B
C
C
D
FIGURE 11. (Colour online) Phase-averaged vorticity fields show the 2S↔ 2P wake modetransition. The schematics on the left show the position in the oscillation cycle of thecorresponding images. (a) The different phases of the 2S mode at U∗ = 3.28; (b) thedifferent phases of the 2P mode at U∗= 4.29. Note that the vorticity contour levels shownare normalized by ω∗z = ωzH/U. The contours marked with solid lines represent positivevalues, and the contours marked with dashed lines represent negative values.
a value slightly above the Strouhal frequency, the lift force shows a more broadbandresponse, focused around harmonics of the oscillation frequency. This is indicative ofa vortex shedding process that is ‘almost’ periodic.
It is possible that this regime is not inherent, but is rather a response of the systemto the external noise in any experimental setup. Figure 10 shows that the onsetof this regime is also the point where the total phase switches from φtotal = 0◦ toφtotal = 180◦. Along with this, the figure shows that the total lift force is close tothe minimum recorded. This is consistent, as the shift in φtotal is most likely drivenby a change in the balance of two opposing forces, as explained by Carberry et al.(2005). This fine balance of forces may render the system more susceptible to noise

708 J. Zhao, J. S. Leontini, D. Lo Jacono and J. Sheridan
–2
0
2
0
1
–2
–1
0
1
2
0
1
0 1 2 3 4 5 1 2
(bi)
(bii)
(ai)
(aii)
Pf
Pf
f *
FIGURE 12. A jump of 0◦↔ 180◦ in the vortex phase, and switch in the frequency fromslightly below to slightly above the natural frequency, which are associated with the 2S↔2P wake mode transition, as the flow changes from regime (i) to regime (ii) for the α=45◦ case. Time traces of (a) the displacement (solid lines), transverse lift (dashed lines)and vortex force (dot-dashed lines), and (b) power spectra (normalized by the peak values)for cases α = 45◦, m∗ = 2.64 at (i) U∗ = 3.28 and (ii) U∗ = 4.29.
than normal. Further evidence for this regime being a function of external forcing isthat the body oscillation frequency and amplitude are practically continuous acrossregimes (iii), (iv), and (v), indicating there is little change in the wake configurationacross these regimes.
Regime (v) begins at U∗= 6.5 and continues to U∗= 7.5 where the body oscillationand vortex shedding become desynchronized. Like regime (iii), regime (v) consists ofsynchronized oscillations at a frequency slightly above the Strouhal frequency. Alsolike regime (iii), the drag has a strong component at the same frequency as the liftand the displacement; however the strongest component is at a frequency twice thisvalue. Any asymmetry present in regime (iii) may therefore still occur here.
Finally, at U∗ = 7.5, the body oscillation and the vortex shedding becomedesynchronized. The vortex shedding occurs at a primary frequency close to, butslightly below, the Strouhal frequency for the fixed body; however the spectra arequite broadband indicating that the flow is not strictly periodic. The amplitude ofoscillation is only a weak negative function of U∗ as shown in figure 9, as is the liftforce as shown in figure 10.
3.2.2. Further details of the 2S↔ 2P wake mode transitionFigure 12 shows time traces of the oscillation and forces and frequency spectra for
two cases; one at U∗ = 3.28, in regime (i), and one at U∗ = 4.29, in regime (ii). Theperiodicity of the oscillation in both regimes is clear from the time traces. The switchin φvortex that occurs is also clear. Comparison of the spectra of the two cases alsoshows very explicitly the switch from a frequency just below the natural frequency,to a frequency just above the natural frequency.

Fluid–structure interaction of a square cylinder 709
Figure 11 above shows sequences of images of the wake, visualized using vorticity,from phase-averaged PIV measurements. From left to right, the figure shows a columnof schematics indicating the point in the oscillation cycle at which each image is taken,then a column of images of the wake in regime (i) at U∗ = 3.28, then a column ofimages of the wake in regime (ii) at U∗ = 4.29.
The change in wake mode between the two cases is clear. Regime (i) displays a2S mode, with alternating vortex shedding from each side of the body. Regime (ii)displays a 2P mode, where during one half-cycle a positive vortex shed from thebottom edge of the body is paired with a negative vortex shed from the rear edgeof the body. The inverse occurs in the following half-cycle, with a negative vortexshed from the top edge paired with a positive vortex shed from the rear edge.
3.3. Modified VIV response α = 20◦
While the case at α=0◦ is clearly dominated by the phenomenon of galloping, and thecase at α= 45◦ is dominated by the phenomenon of VIV, the governing phenomenonfor the case at a resting angle of attack of α = 20◦ is not as clear. The complicatedregime map presented in Nemes et al. (2012) shows that there is at least one newresponse regime present, labelled the ‘higher’ branch, as it consists of well-organizedoscillations at amplitudes larger than those present in the upper branch.
This section presents results of experiments at α = 20◦ at very fine increments ofU∗, so that the extent of the response regimes identified can be clearly identified. Theresults show that there is indeed an upper and a higher branch of response, separatedon the U∗ axis by a region of chaos that appears to be driven by intermittency betweenthe two modes. In addition, the results presented here show the higher branch is a typeof subharmonic response, with two vortex shedding cycles occurring over one bodyoscillation cycle. The vortex formation and shedding process, which for this branchdepends on vorticity created at different faces of the body, is also presented.
3.3.1. Amplitude and frequency responsesFigure 13 shows the amplitude of the body oscillation as a function of U∗, as well
as the frequency content of the displacement and various forces, for the α= 20◦ case.Again, the plots are constructed in the same manner as those of figure 5 as explainedin § 3.1.1.
Observation of the amplitude response in figure 13(a) clearly shows four responseregimes: an initial branch (IB), an upper branch (UB), a higher branch (HB), anda desynchronization region where the amplitude is approximately constant. Both theupper and higher branches consist of ordered, periodic oscillations, hence both arehighlighted with dark shading in the figure. Outside of these two regimes, the flowresponse can be more complicated. These various response regimes are outlined below.
The initial branch consists of small-amplitude oscillations. The oscillations aremodulated, as both the Strouhal frequency (the vortex shedding frequency from therigid body) and the body natural frequency play a role. This behaviour is similar tothe initial branch that occurs in VIV studies of a circular cylinder.
Increasing U∗ beyond U∗ = 4 sees the flow transit to the upper branch. Withthe onset of the upper branch, the oscillations become regular and periodic withamplitude increasing with U∗. Like the classic upper branch identified in flows pasta circular cylinder, here the frequency appears to lock on to a frequency close tothe natural frequency. This is clearly evident in the plots of frequency content shownin figure 13(b–e), that show only a single line for the displacement and the lift

710 J. Zhao, J. S. Leontini, D. Lo Jacono and J. Sheridan
2 4 6 8 10 12 14 16 180
2
4
6
80
1
2
3
40
1
2
3
40
1
2
3
40
0.4
0.8
1.2
0
−0.5
−1.0
−1.5
−2.0
−2.5
−3.0
IB
UB
HB
Desynchronization
(a)
(b)
(c)
(d)
(e)
U*
A*
FIGURE 13. (Colour online) The amplitude (a) and frequency response (b)–(e) as afunction of U∗ with m∗ = 2.64 at α = 20◦, showing two resonance regions shaded indark grey in (a). In (a), open and solid squares represent A∗max and A∗10, respectively;logarithmic-scale frequency power spectrum contour plots of f ∗yb
, f ∗Cyand f ∗Cvortex
in (b)–(d)clearly show that in the upper branch (UB) the body oscillation synchronizes with thenatural frequency, and then to half of the Strouhal frequency in the higher branch (HB).The higher branch is bounded by intermittent regions (shaded in light grey) on either side.Note that the frequency components are normalized by fNw, e.g. f ∗yb
= fyb/fNw. The slopevalues of the dotted, dashed, and dot-dashed lines represent St/2, St and 2St, respectively.

Fluid–structure interaction of a square cylinder 711
force that remains close to the natural frequency. The range of U∗ over which thissynchronization occurs is below the value of U∗ at with the natural frequency isequal to the Strouhal frequency, ending when U∗ is such that the Strouhal frequencyis approximately equal to the natural frequency.
At the point where the synchronization of the upper branch is lost, the flow becomeschaotic, with a broadband frequency response focused around a frequency slightlybelow the Strouhal frequency. The amplitude of oscillation is approximately constantwith further increases in U∗. Here, the flow is desynchronized, and this regime issimilar to the desynchronized regime found at high U∗ for the α = 45◦ case.
Unlike the α= 45◦ case, this desynchronization region does not then persist for allhigher U∗. Instead, just prior to U∗ = 8, the flow reorganizes and the higher branchregime begins, as first identified by Nemes et al. (2012), where it was hypothesizedthat this regime was a type of interaction mode between VIV and transverse galloping,based on the high amplitude of the response. However, the high fidelity of the datapresented in figure 13 shows that this mode is in fact a type of subharmonic VIV.The frequency content of the displacement shown in figure 13 shows that throughoutthe higher branch regime, the flow is very well-organized and periodic, with a singledominant frequency, which remains very close to half of the Strouhal frequency (infact just slightly above it). The same frequency appears in the lift, along with asignificant component at twice this frequency, which becomes the dominant frequencyin the vortex lift. This indicates that this mode consists of two cycles of vortexshedding per oscillation cycle, which is further discussed in § 3.3.3.
The onset of the higher branch occurs intermittently with increases in U∗. Fromaround U∗= 7.5, small periods of organized flow appear intermingled with periods ofdisorder. These periods of organized flow persist longer and occur more rapidly as U∗
is increased, before the higher branch becomes ‘locked’ around U∗=8. This behaviourindicates that this transition occurs through type-one intermittency, as described byPomeau & Manneville (1980). A similar process occurs at the other end of the rangeof existence of the higher branch. Increasing U∗ beyond around U∗ = 9.5 sees theorganized flow interrupted by small periods of disorder, which become longer andmore prevalent at U∗ is further increased, until no evidence of the higher branchremains beyond U∗ = 10.5.
Further increases in U∗ see no further qualitative changes in the flow. The frequencyresponse becomes quite broadband, though focused around a frequency slightly belowthe Strouhal frequency. The vortex formation and shedding are desynchronized fromthe oscillation, even so the amplitude remains quite high. Qualitatively, the flow issimilar to the desynchronized region that divides the upper and higher branches.
Figure 13 gives a good overview of the flow regimes present for the case at α= 20◦.It shows that there are a number of regimes present, all with unique characteristics.Further details of each of these flow regimes are presented in the following sections.
3.3.2. The upper branchThe upper branch is characterized by oscillation and vortex shedding close to
the Strouhal frequency. Figure 14 shows time traces and frequency spectra of thedisplacement and forces for a representative case at U∗ = 5.1. The oscillations areclose to periodic, as is the lift force, and only a single predominant frequency ispresent in the spectra.
Figure 15 shows twelve images of the wake, visualized as contours of vorticity,over one oscillation cycle. The images were obtained by averaging a number of PIV

712 J. Zhao, J. S. Leontini, D. Lo Jacono and J. Sheridan
–0.4
0
0.4
–2
0
2
–0.8
0
0.8
0
2.5
5.0
0
0.5
1.0
0
0.5
1.0
0
0.5
1.0
0.5
1.0
1
f *2 3 4 5 0 1 2 3 4
Pf
PfCy
Cd
C
Pf
Pf
(ai)
(aii)
(aiii)
(aiv)
(bi)
(bii)
(biii)
(biv)
FIGURE 14. Time histories for the case at α = 20◦ and U∗ = 5.1, in the upper branch.(a) Time traces, and (b) normalized power spectra, of (i) displacement, (ii) total lift, (iii)vortex lift, and (iv) drag.
images over a short time span. The time span for the averaging used for each periodis marked on the time history shown in figure 15(a).
One feature of note in figure 15 is that even though the total lift and the vortexlift force are approximately sinusoidal, the timing of the vortex shedding is not thesame on either side of the wake. This is clear when the streamwise spacing betweenconsecutive vortices is compared. For instance, in the first image moving downstreamfrom left to right, the streamwise distance from the first positive (solid line) vortex onthe bottom side to the first negative (dashed line) vortex on the top side is much lessthan the distance from that first negative vortex to the second positive vortex. This isperhaps not surprising considering the asymmetry of the body.
The formation of the negative vortex on the top side of the body should also benoted. This formation occurs primarily during the second half (the downstroke) of theoscillation cycle, starting from image (vii) in the sequence shown in figure 15. Theseimages show that initially nascent vortices form, one from the leading edge and onefrom the trailing edge of the body. It is hypothesized that the trailing-edge vortex isactually formed during the upstroke of the body on the back face, as evidenced fromimages (i)–(v) of the sequence. Even though it is formed, this trailing-edge vortex isnot shed into the wake. Rather, it is eventually amalgamated into the vortex that isformed from the leading edge as shown in images (vii)–(x), and this final single vortexis shed into the wake. This complex vorticity production and amalgamation may go

Fluid–structure interaction of a square cylinder 713
–1.5
0
1.5
0 10
2
4
(iv)
(iii)
(ii)
(i)
(viii)
(vii)
(vi)
(v)
(xii)
(xi)
(x)
(ix)A
A
A
A
B
B
B
B
A
A
A
A
B
B
B
B
C
C
C
A
A
A
A
B
B
B
B
C
C
−2
−1
0
1
2
−2
−1
0
1
2
−2
−1
0
1
2
−2
−1
0
1
2
0 1 2 3 4 5 6 0 1 2 3 4 5 6 0 1 2 3 4 5 6
i ii iii iv v vi vii viii ix x xi xii i
Cd
(a)
(b)
Tb
−4.0 −2.4 −0.8 0.8 2.4 4.0
FIGURE 15. (Colour online) Time-based phase-averaged vorticity fields in the upperbranch, for the case m∗ = 2.64 at α = 20◦ and U∗ = 5.1. (a) The time history of thedisplacement and forces over a cycle of oscillation. The black solid line represents yb, theblack short-dashed line represents Cy, the black dot-dashed line represents Cvortex, and thegrey long-dashed line represents Cd. (b) Images of vorticity from PIV averaged over theintervals marked on the time history. The vorticity contour levels shown are normalizedby ω∗z = ωzH/U. The contours marked with solid lines represent positive values, andthe contours marked with dashed lines represent negative values. The trailing-edge vortexformed during the upstroke is amalgamated with the leading-edge vortex before shedding.
some way to explain the difference in timing of vortex shedding from the top andbottom sides of the body.

714 J. Zhao, J. S. Leontini, D. Lo Jacono and J. Sheridan
–0.8
–0.4
0
0.4
–2
–1
0
1
–2
–1
0
1
2
4
6
0 1 2 3 4 5
0
0.5
1.0
Pf
Pf
Pf
Pf
0
0.5
1.0
0
0.5
1.0
0
0.5
1.0
1 2 3 4
f *
(bi)
(bii)
(biii)
(biv)
Cy
Cd
C
(ai)
(aii)
(aiii)
(aiv)
FIGURE 16. (a) Time traces, and (b) normalized power spectra, of (i) displacement,(ii) total lift, (iii) vortex lift, and (iv) drag for the case at α = 20◦ and U∗ = 6.1.
The delicate vortex formation and shedding process is further highlighted byobserving a case that is very close to the upper limit of U∗ for the upper branch.Figure 16 shows time histories and spectra for such a case at U∗ = 6.1. Somesimilarities with the case at U∗ = 5.1 can be found: the primary frequency ofoscillation and the total lift force is close to the Strouhal frequency, and the oscillationremains reasonably regular and close to sinusoidal. However, there is a large differencein the vortex lift. While there is still significant energy at the Strouhal frequency, themost energetic component is actually at twice this value, indicating that there hasbeen some kind of change in the vortex formation or timing of vortex shedding.
This change can be seen in the sequence of images of the wake for the U∗ =6.1 case, shown in figure 17. Again, the images are of vorticity contours formed byaveraging the PIV images over a short time period, which is marked for each imageon the time history in figure 17(a).
Overall, the shedding process is very similar to the upper branch case at U∗ = 5.1shown in figure 15. However, here, the negative trailing-edge vortex that is formedfrom vorticity produced on the back face of the body during the upstroke of the bodyis not simply amalgamated with the vortex forming from the vorticity on the upperside. Instead, this initial trailing-edge vortex is shed into the wake, as shown in images(vi)–(ix) in the sequence of figure 17. However, this vortex is quite weak, and images(x)–(xii) indicate that it quickly dissipates (possibly due to three-dimensional effects)as it travels away from the body. This complex formation–shedding–dissipation cycle

Fluid–structure interaction of a square cylinder 715
–2
0
2
0
2
4
6
0 1
i ii iii iv v vi vii viii ix x xi xii i
0 1 2 3 4 5 6 0 1 2 3 4 5 6 0 1 2 3 4 5 6
−2
−1
0
1
2
−2
−1
0
1
2
−2
−1
0
1
2
−2
−1
0
1
2
(iv)
(iii)
(ii)
(i)
(viii)
(vii)
(vi)
(v)
(xii)
(xi)
(x)
(ix)A
A
A
A
B
B
B
B
A
A
A
A
B
B
B
B
C
C
C
A
A
A
A
B
B
B
B
C
C
C
C
Cd
(a)
(b)
Tb
−4.0 −2.4 −0.8 0.8 2.4 4.0
FIGURE 17. (Colour online) Time-based phase-averaged vorticity fields just beyond theupper branch. For this case, m∗ = 2.64, α = 20◦ and U∗ = 6.1. (a) The time history ofthe displacement and forces over a cycle of oscillation. The black solid line representsyb, the black short-dashed line represents Cy, the black dot-dashed line represents Cvortex,and the grey long-dashed line represents Cd. (b) Images of vorticity from PIV averagedover the intervals marked on the time history. The vorticity contour levels shown arenormalized by ω∗z =ωzH/U. The contours marked with solid lines represent positive values,and the contours marked with dashed lines represent negative values. The trailing-edgevortex formed during the upstroke is shed before the leading-edge vortex, but is quicklydissipated.

716 J. Zhao, J. S. Leontini, D. Lo Jacono and J. Sheridan
–1.2
–0.6
0
0.6
–2
0
2
–2
0
2
4
8
0 1 2 3 4 5
0
0.5
1.0
Pf
Pf
Pf
Pf
0
0.5
1.0
0
0.5
1.0
0
0.5
1.0
1 2 3 4
f *
(bi)
(bii)
(biii)
(biv)
Cy
Cd
C
(ai)
(aii)
(aiii)
(aiv)
FIGURE 18. Time histories for the case at α = 20◦ and U∗ = 8, in the higher branch.(a) Time traces, and (b) normalized power spectra, of (i) displacement, (ii) total lift,(iii) vortex lift, and (iv) drag. The subharmonic synchronization between the vortexshedding and body motion is shown by the fact that the primary frequency of the vortexlift is twice that of the body motion.
goes some way to explaining why the synchronization between the body motion andthe vortex shedding is lost as U∗ is increased beyond this point.
3.3.3. The higher branchThe higher branch is characterized by oscillation at close to half of the Strouhal
frequency. The time trace of the oscillation for a representative case at U∗ = 8 isshown in figure 18(ai). The asymmetry of the flow induced by the angle of attack isclear in this figure. Unlike the upper branch, the vortex shedding in the higher branchdoes not occur at the same frequency as the oscillation. Instead, it occurs at twice thefrequency of the oscillation. The influence of this higher harmonic is clear in the timetrace of the total lift force shown in figure 18(aii), and the presence of significantenergy at twice the oscillation frequency is shown in the corresponding spectrum offigure 18(bii). This effect is even more pronounced in the vortex lift, where the energyin the spectrum at twice the oscillation frequency is greater than the energy at theoscillation frequency.
This subharmonic synchronization between the oscillation and the vortex shedding,where the oscillation is synchronized to half the vortex shedding frequency, is clearlyshown in the images of figure 19. Here is shown a sequence of twelve images of the

Fluid–structure interaction of a square cylinder 717
–2
0
2
0
4
8
Cd
Tb
−4.0 −2.4 −0.8 0.8 2.4 4.0
0 1
i ii iii iv v vi vii viii ix x xi xii i
0 1 2 3 4 5 6 0 1 2 3 4 5 6 0 1 2 3 4 5 6
−2
−1
0
1
2
−2
−1
0
1
2
−2
−1
0
1
2
−2
−1
0
1
2
(iv)
(iii)
(ii)
(i)
(viii)
(vii)
(vi)
(v)
(xii)
(xi)
(x)
(ix)
A
A
A
A
B
B
A
A
A
A
B
B
B
B
C
C
C
C
A
A
B
C
C
C
C
D
D
D
D
(a)
(b)
FIGURE 19. (Colour online) Time-based phase-averaged vorticity fields in the upperbranch. For this case, m∗ = 2.64 at α = 20◦ and U∗ = 8. (a) The time history of thedisplacement and forces over a cycle of oscillation. The black solid line represents yb, theblack short-dashed line represents Cy, the black dot-dashed line represents Cvortex, and thegrey long-dashed line represents Cd. (b) Images of vorticity from PIV averaged over theintervals marked on the time history. The vorticity contour levels shown are normalizedby ω∗z = ωzH/U. The contours marked with solid lines represent positive values, and thecontours marked with dashed lines represent negative values. The images show that twocycles of 2S vortex shedding occur over each oscillation cycle, which has been named a2(2S) mode.

718 J. Zhao, J. S. Leontini, D. Lo Jacono and J. Sheridan
wake over one cycle of oscillation, visualized using vorticity contours generated fromPIV. Again, the images were obtained by averaging a series of PIV images over ashort time. The time window used for the averaging for each image is marked on thetime history shown in figure 19(a).
Figure 19 shows that two cycles of ‘classic’ vortex shedding (where a vortex of onesign is shed from the body in one half-cycle, then alternately a vortex of opposite signis shed in the next half-cycle as in the Kármán vortex street) occur per oscillationcycle. Therefore, if this wake mode is to be named using the convention introducedby Williamson & Roshko (1988), it should be designated 2(2S), meaning two cyclesof two single opposite-signed vortices are shed per oscillation cycle. However, thesetwo cycles of shedding are not identical, and there is no spatio-temporal symmetry(the second cycle is not simply the same as the first cycle reflected). The two cyclesoccur over different periods. This process is explained below.
As shown in figure 18, and the time history of a single cycle in figure 19(a), theoscillation is far from sinusoidal. Instead, the body rapidly ascends over the firstquarter of a period, then spends around half an oscillation period with little variationin amplitude, before rapidly descending over the last quarter of a period.
In the first ascent phase (images i–iii of figure 19), negative vorticity is producedat the rear surface of the body, producing a negative (dashed line) vortex attached tothe trailing edge. Over this same period, the previously formed positive (solid line)vortex is shed into the wake.
At the beginning of the slow variation phase, represented by images (iv) and (v),this negative trailing-edge vortex is shed into the wake, and a new positive vortexbegins to form, being fed from vorticity on the bottom surface of the body. Thenegative vortex shed from the trailing edge is relatively weak. Over the rest of thisslow variation phase, represented by images (vi)–(viii), this positive vortex is shed intothe wake, and a new negative vortex begins to form, this time fed by vorticity beingproduced on the top surface on the body. This new negative vortex is much strongerthan the previous negative vortex that was fed by vorticity from the rear face.
During the descent phase represented by images (ix)–(xii), this negative vortex isshed into the wake, and a new positive vortex forms, this time fed by positive vorticitybeing generated on the rear side of the body.
In summary, the vortex shedding can be described as consisting of a pair of vorticesshed during the descent and ascent, where the vortices are fed by vorticity producedat the rear surface of the body due to the acceleration of the body across the flow.This is followed by the shedding of a second pair of vortices during the phase wherethe body is almost stationary, the vortices this time being fed from vorticity producedat the sides of the body due to the passing flow.
Nemes et al. (2012) showed that there is an upper limit to the angle of attack αfor the appearance of the higher branch, and consideration of the complex vorticityproduction mechanisms described above seems to explain this. For the vorticityproduction to occur at the rear surface, the surface needs to be approximately alignedwith the direction of the acceleration of the body. For higher values of α, this is notthe case, and the higher branch is not observed.
The results presented in § 3.1.2 indicated that when α = 0◦, only odd numbers ofvortex shedding cycles can be involved in synchronized modes. However here for α=20◦, the higher branch consists of a synchronized mode involving two shedding cycles.It is hypothesized here that this occurs due to the imbalance between the two cycles.As pointed out above, every second negative vortex is fed by vorticity from the rearface of the body and is relatively weak, whereas every other negative vortex is fedfrom vorticity from the top surface and is relatively strong. This difference in strength

Fluid–structure interaction of a square cylinder 719
is enough to generate a forcing at half of the vortex shedding frequency that the bodycan respond to. It seems this imbalance is driven by the breaking of the reflectionsymmetry about the wake centreline. Here, this is done explicitly by having an angleattack. However, similar subharmonic VIV modes were observed in the simulations ofa case at α = 45◦ performed by Leontini & Thompson (2013), where the symmetrybreaking was spontaneous.
4. Conclusions
For the case at α = 0◦, the canonical flow for the study of transverse galloping,it has been shown that the general behaviour is similar for light bodies as for theheavier bodies on which the quasi-steady theory of Parkinson & Smith (1964) isbased. However, the results of this paper for a square cylinder show that a series of‘odd’ synchronizations exist, when the Strouhal frequency is in the vicinity of an oddinteger multiple of the oscillation frequency. During these synchronizations, the bodyoscillation frequency is modified so that a multiple of the vortex shedding frequencyis synchronized to the body oscillation. If the vortex shedding process is to remainsimilar to that of a fixed body, it has been shown that only synchronizations to oddnumbers of vortex shedding cycles can occur, as synchronizations to even numbersof vortex shedding cycles do not lead to the imbalance of forces required to excitegalloping.
For the case at α = 45◦, the current results show that while the motion is due toVIV, the flow response is more complicated than that of the canonical VIV case ofthe circular cylinder. Multiple synchronized regimes are possible, with different wakemodes in each. A significant difference between the VIV of this square cylinder bodyand the VIV of a circular cylinder is that this body has synchronized regimes thatare synchronized to the Strouhal frequency, rather than the natural frequency of thebody. A small range of U∗ was also found to produce chaotic flow, which at thisstage appears to be due to a very fine balance between competing forces resulting ina system that is very sensitive to external disturbances, rather than being due to anyinherent chaotic dynamics.
Moving from these reflection-symmetric cases to the case at α=20◦ leads to anotherset of responses. The higher branch, consisting of very high-amplitude oscillationsfirst identified in Nemes et al. (2012), has been shown by the results presented hereinto be a type of subharmonic mode, with two vortex shedding cycles per oscillationcycle. During each vortex shedding cycle, a negative vortex is shed from one side,and a positive vortex from the other, reminiscent of the classic Kármán vortex street.However, every other pair of vortices is fed from vorticity formed on the back faceof the body, rather than the sides. The dependence on this back face vorticity meansthat this mode is only accessible for a limited range of α. The occurrence of thissubharmonic response seems to only be possible when the spatio-temporal symmetryis broken, meaning that the flow produces a non-zero mean lift. This symmetrybreaking in this case is explicit, due to the angle of attack of the body.
Acknowledgements
The authors would like to acknowledge the financial support of the AustralianResearch Council (ARC) through grant number DP110102141 under the Discoveryprogram. J.S.L. would like to acknowledge the financial support of the ARC throughan Australian Postdoctoral Fellowship.

720 J. Zhao, J. S. Leontini, D. Lo Jacono and J. Sheridan
REFERENCES
ASSI, G. R. S., BEARMAN, P. W. & MENEGHINI, J. R. 2010 On the wake-induced vibration oftandem circular cylinders: the vortex interaction excitation mechanism. J. Fluid Mech. 661,365–401.
BEARMAN, P. W. 1984 Vortex shedding from oscillating bluff bodies. Annu. Rev. Fluid Mech. 16,195–222.
BEARMAN, P. W., GARTSHORE, I. S., MAULL, D. & PARKINSON, G. V. 1987 Experiments onflow-induced vibration of a square-section cylinder. J. Fluids Struct. 1 (1), 19–34.
BLEVINS, R. D. 1990 Flow-Induced Vibration. 2nd edn. Krieger.BOKAIAN, A. R. & GEOOLA, F. 1984 Hydroelastic instabilities of square cylinders. J. Sound Vib.
92, 117–141.CARBERRY, J., SHERIDAN, J. & ROCKWELL, D. 2001 Force and wake modes of an oscillating
cylinder. J. Fluids Struct. 15, 523–532.CARBERRY, J., SHERIDAN, J. & ROCKWELL, D. 2005 Controlled oscillations of a cylinder: forces
and wake modes. J. Fluid Mech. 538, 31–69.CORLESS, R. & PARKINSON, G. V. 1988 A model of the combined effects of vortex-induced
oscillation and galloping. J. Fluids Struct. 2 (3), 203–220.CORLESS, R. M. & PARKINSON, G. V. 1993 Mathematical modelling of the combined effects of
vortex-induced vibration and galloping. Part II. J. Fluids Struct. 7, 825–848.CVITANOVIC, P., SHRAIMAN, B. & SÖDERBERG, B. 1985 Scaling laws for mode lockings in circle
maps. Phys. Scr. 32 (4), 263–270.DEN HARTOG, J. P. 1932 Transmission line vibration due to sleet. Trans. Am. Inst. Electr. Engrs
51 (4), 1074–1076.FOURAS, A., LO JACONO, D. & HOURIGAN, K. 2008 Target-free stereo PIV: a novel technique
with inherent error estimation and improved accuracy. Exp. Fluids 44 (2), 317–329.GOVARDHAN, R. & WILLIAMSON, C. H. K. 2000 Modes of vortex formation and frequency response
of a freely vibrating cylinder. J. Fluid Mech. 420, 85–130.HAHN, S. L. 1996 Hilbert Transforms in Signal Processing. Artech House.HOVER, F. S., TECHET, A. H. & TRIANTAFYLLOU, M. S. 1998 Forces on oscillating uniform and
tapered cylinders in crossflow. J. Fluid Mech. 363, 97–114.HUANG, N. E., SHEN, Z., LONG, S. R., WU, M. C., SHIH, H. H., ZHENG, Q., YEN, N.-C., TUNG,
C. C. & LIU, H. H. 1998 The empirical mode decomposition and the Hilbert spectrum fornonlinear and non-stationary time series analysis. Proc. R. Soc. Lond. A 454 (1971), 903–995.
KHALAK, A. & WILLIAMSON, C. H. K. 1996 Dynamics of a hydroelastic cylinder with very lowmass and damping. J. Fluids Struct. 10 (5), 455–472.
KHALAK, A. & WILLIAMSON, C. H. K. 1997 Fluid forces and dynamics of a hydroelastic structurewith very low mass and damping. J. Fluids Struct. 11 (8), 973–982.
LEONTINI, J. S., LO JACONO, D. & THOMPSON, M. C. 2011 A numerical study of an inlineoscillating cylinder in a free stream. J. Fluid Mech. 688, 551–568.
LEONTINI, J. S., LO JACONO, D. & THOMPSON, M. C. 2013 Wake states and frequency selectionof a streamwise oscillating cylinder. J. Fluid Mech. 730, 162–192.
LEONTINI, J. S. & THOMPSON, M. C. 2013 Vortex-induced vibrations of a diamond cross-section:sensitivity to corner sharpness. J. Fluids Struct. 39, 371–390.
LIGHTHILL, J. 1986 Fundamentals concerning wave loading on offshore structures. J. Fluid Mech.173, 667–681.
MORSE, T. L. & WILLIAMSON, C. H. K. 2009 Prediction of vortex-induced vibration response byemploying controlled motion. J. Fluid Mech. 634, 5–39.
NAUDASCHER, E. & ROCKWELL, D. 2005 Flow-Induced Vibrations: An Engineering Guide. Dover.NEMES, A., ZHAO, J., LO JACONO, D. & SHERIDAN, J. 2012 The interaction between flow-induced
vibration mechanisms of a square cylinder with varying angles of attack. J. Fluid Mech. 710,102–130.
NORBERG, C. 2001 Flow around a circular cylinder: aspects of flucuating lift. J. Fluids Struct. 15,459–469.

Fluid–structure interaction of a square cylinder 721
PAÏDOUSSIS, M. P., PRICE, S. & DE LANGRE, E. 2010 Fluid–Structure Interactions: Cross-Flow-Induced Instabilities. Cambridge University Press.
PARKINSON, G. V. & SMITH, J. D. 1964 The square prism as an aeroelastic nonlinear oscillator.Q. J. Mech. Appl. Maths 17 (2), 225–239.
POMEAU, Y. & MANNEVILLE, P. 1980 Intermittent transition to turbulence in dissipative dynamicalsystems. Commun. Math. Phys. 74 (2), 189–197.
SARPKAYA, T. 2004 A critical review of the intrinsic nature of vortex-induced vibrations. J. FluidsStruct. 19 (4), 389–447.
SHERRY, M., LO JACONO, D. & SHERIDAN, J. 2010 An experimental investigation of the recirculationzone formed downstream of a forward facing step. J. Wind Engng Ind. Aerodyn. 98 (12),888–894.
TUDBALL-SMITH, D., LEONTINI, J. S., SHERIDAN, J. & LO JACONO, D. 2012 Streamwise forcedoscillations of circular and square cylinders. Phys. Fluids 24, 111703.
WILLIAMSON, C. H. K. & GOVARDHAN, R. 2004 Vortex-induced vibration. Annu. Rev. Fluid Mech.36, 413–455.
WILLIAMSON, C. H. K. & ROSHKO, A. 1988 Vortex formation in the wake of an oscillating cylinder.J. Fluids Struct. 2 (4), 355–381.
ZHAO, M., CHENG, L. & ZHOU, T. 2013 Numerical simulation of vortex-induced vibration of asquare cylinder at low Reynolds number. Phys. Fluids 25, 023603.