Selective Right Ventricular Unloading and Novel Technical Concepts in Ebstein's Anomaly

JOURNAL OF GEOPHYSICAL RESEARCH, VOL. 94, NO. B10, PAGES 13,919-13,950, OCTOBER 10, 1989
Flexural Uplift of Riff Flanks Due to Mechanical Unloading of the Lithosphere During Extension
JEFFREY K. WEISSEL AND GARRY D. KARNER
Lamont-Doherty Geological Observatory of Columbia University, Palisades, New York
We suggest that the uplift of rift flanks results from mechanical unloading of the lithosphere during extension and consequent isostatic rebound. This mechanism is presented as an alternative to explanations for rift flank uplift involving thermal or dynamic processes, and magmatic thickening of the crust. Our hypothesis is based on two critical concepts. First, the lithosphere retains finite mechanical strength or flexural rigidity during extension. Second, isostatic rebound (uplift) of the lithosphere follows when the kinematics of extension produces a surface topographic depression that is deeper than the level to which the surface of the extended lithosphere would subside assuming local isostatic compensation. We develop and analyze two kinematic models for instantaneous extension of the lithosphere to show that flexural rebound is a viable explanation for the uplift of rift flanks. We first investigate the isostatic consequences of finite simple slip on an initially planar, dipping normal fault cutting the entire lithosphere. When the lithosphere retains flexural rigidity during extension, the topography resulting from this model resembles a half graben, and the footwall rift flank is flexurally uplifted. This simple normal faulting model explains free-air gravity anomalies and topography observed at rift flanks in oceanic lithosphere (such as Broken Ridge in the eastern Indian Ocean, the Caroline ridges-Sorol Trough in the western equatorial Pacific, and the Coriolis Trough behind the New Hebrides island arc). We then investigate a general kinematic model for lithospheric extension where simple slip on a surface of arbitrary shape is accompanied by pure shear extension in the upper and lower plates. When the simple slip component is not zero or the distribution of pure shear in the upper and lower plates is not identical, the surface of slip can be regarded as a detachment. By simplification, our general model accounts for pure shear extension of the lithosphere that is uniform with depth. In this case, detachments have no meaning in the geologic sense. However, the kinematics of depth-independent pure shear may nevertheless be described in terms of a surface, which we term a kinematic reference surface, at some depth in the lithosphere. We speculate that the depth of this surface may be rheologically controlled. The magnitude of rift flank uplift by flexure depends critically on the depth of this reference surface. In contrast, if local isostasy is assumed when the lithosphere undergoes a given amount of depth-independent pure shear, the resulting topography will be the same regardless of how the kinematics of that extension are formulated. The basin and rift flank topography and free-air gravity anomaly over young continental rifts, such as the Rhine graben, can be satisfied using our general extensional model with a small amount (<5 km) of extension along a listric-shaped detachment soling into the crust-mantle boundary. Because the flexural rebound mechanism explains the observed topography and gravity anomaly over both oceanic and continental extensional domains, we suggest that rheological differences between the two lithospheric types may not be important in their overall response to extension.
INTRODUCTION
The prevailing view on the cause for uplifted flanks or shoulders of rifts is that such uplifts are due to thermal processes or other sources of buoyancy in the Earth's subsurface. These processes are thought to result, directly or indirectly, from extension of the lithosphere. Some of the proposed mechanisms for rift flank uplift are (1) lateral conduction of heat from the region of extended lithosphere to the unextended flanks [Cochran, 1983; Alvafez et al., 1984; Buck et al., 1988], (2) heat transferred from beneath the rift to the flanks by small-scale mantle convection which is induced by lateral temperature gradients set up by exten- sion [Keen, 1985; Buck, 1986], (3) greater thinning of the mantle lithosphere beneath rift flank areas compared to crustal thinning [Royden and Keen, 1980; Hellinger and Sclater, 1983; Morgan et al., 1985; Watts and Thorne, 1984; Steckler, 1985; Wernicke, 1985; Lister et al., 1986; Villerain et al., 1986; White and McKenzie, 1988], (4) magmatic thickening (or underplating) of the rift flank crust in response to partial melting in the underlying mantle [Cox, 1980; Ewart
Copyright 1989 by the American Geophysical Union.
Paper number 89JB01075. 0148-0227/89/89JB-01075505.00
et al., 1980; McKenzie, 1984; White et al., 1987; Mutter et al., 1988], and (5) dynamic support of rift flank topography during extension [Zuber and Parmentier, 1986; Parmentier, 1987].
Apart from magmatic underplating, thermal or dynamic processes do not necessarily lead to permanent uplift of rift flanks. Uplift ceases when extension ends in the case of dynamically supported rift flanks, and whether the topogra- phy can be maintained after extension is debatable. In the case of thermally supported rift flanks, uplift diminishes over time at a rate commensurate with thermal equilibrium of the extended lithosphere. Elevated topography observed along many passive margins of the Gondwana continents (Figure 1) suggests, however, that uplifted rift flanks are maintained permanently. In the case of southeast Brazilian and southern African passive margins, for example, any thermal support for rift flank uplift should have dissipated long ago, because extension ended at those margins in Late Jurassic/Early Cretaceous time. In addition, subaerial erosion of rift flanks uplifted by transient thermal processes probably ensures that such rift flanks will eventually subside below sea level [Sleep, 1971; Turcotte, 1977], contrary to observations at many passive margins (Figure 1).
In this study, we propose that permanent uplift of rift
13,919

13,920 WEISSEL AND KARNER: FLEXURAL UPLIFT OF RIFT FLANKS
s.E. AUSTRA L IA
S E. AUSTRALIA
S E SOUTHERN
S W SOUTHERN __•-• o
Fig. 1. Elevation profiles across selected passive margins of the Gondwana continents. These profiles were constructed from global 5 arc minx 5 arc min average elevations [National Geophysical Data Center, 1985]. Note that uplifted flanks lie adjacent to ocean basins of widely differing ages (youngest is at the top). S.L., sea level.
see also Heiskanen and Vening Meinesz, 1958, chapter 10, part D].
Normal slip along deeply penetrating detachments has been used to explain the gross structural asymmetry of conjugate passive continental margins [e.g., Lister et al., 1986] and major features in the surface geology and subsur- face seismic reflection characteristics of the Basin and Range of the western United States [Wernicke and Burchfiel, 1982; Wernicke, 1985; Allmendinger et al., 1983]. Some workers believe that detachments represent rheological boundaries, such as the brittle-ductile transition in the crust [e.g., Kusz- nir et al., 1987]. Others suggest that detachments represent preexisting weak zones which are later reactivated under normal motion. For example, Chadwick [1985] and Lake and Karner [1987] attribute the development of several basins in southern Britain and the adjacent offshore area to normal reactivation during Permian to Cretaceous time of Cale- donide- and Variscan-age thrusts. Similarly, Ratcliffe and Burton [1985] and Swanson [1986] attribute the Triassic Newark series basins of eastern North America to normal
reactivation of thrusts in the Appalachian orogen. Although the question of the origin of detachments does not directly concern us in this study, they are important in describing the kinematics of extension.
The aim of this paper is to show that mechanical unloading of the lithosphere during extension leads to isostatic uplift of the flanks when the lithosphere retains nonzero flexural rigidity. To accomplish this, we develop simple kinematic and isostatic models for instantaneous, two-dimensional extension of the lithosphere incorporating detachment sur- faces. Kinematic models describe how the lithosphere might extend if we could ignore the effects of the Earth's gravity field. Since we cannot ignore gravity, we must then deter- mine the isostatic consequences of the kinematic model to obtain the total or resulting deformation of the lithosphere. We first consider the isostatic consequences of instanta- neous simple slip on an initially planar, dipping normal fault which cuts the entire lithosphere. We then present a general model in which the lithosphere above and below a detach- ment undergoes different amounts of pure shear extension in addition to simple shear along the detachment surface. The calculations are mainly analytical, allowing an appreciation of how each model parameter affects the results. We com- pare our predictions of rift flank uplift by flexure against gravity and topography data from extended regions of both oceanic and continental lithosphere.
flanks is due to flexural isostatic rebound in response to mechanical unloading of the lithosphere during extension. Underlying this idea are the concepts that (1) the lithosphere maintains finite strength (or flexural rigidity) during exten- sion, and (2) the kinematics of extension can be described relative to a surface within the lithosphere (which we term a reference surface) that is either rheologically controlled or serves to decouple the upper and lower parts of the extend- ing lithosphere. In some respects, the latter is similar to the role played by detachments in governing lithospheric exten- sion [e.g., Wernicke, 1985; Lister et al., 1986]. The founda- tion of the flexural rebound explanation for rift flank uplift can be found in early studies of gravity data across the rift valleys of East Africa [Bullard, 1936; Vening Meinesz, 1950;
LITHOSPHERIC EXTENSION BY SIMPLE SLIP
ON A NORMAL FAULT
Background
Soon after the rift valleys of east Africa were first de- scribed by geologists [e.g., Suess, 1891; Gregory, 1896], conflicting explanations were proposed for their origin. More than 50 years ago, Bullard [1936] obtained pendulum gravity measurements across the rifts in an attempt to distinguish between an extensional and a compressional explanation for the rift valleys and their elevated flanking topography.
Bullard found that large negative gravity anomalies oc- curred over the rift valleys when a reduction scheme based on the assumption of local or pointwise isostasy was used. Thus more low-density material apparently occurs under the

WEISSEL AND K^Rr•ER: FLEXU•L UPLIFT OF RIFT FL^r•CS 13,921
A. (BULLARD 19:56)
•N
B. (VENING MEINESZ 1950)
N. ", , N
N' [c ----**N
Fig. 2. Mechanical models for the formation of the East African rifts: (a) after Bullard [1936], (b) after Vening Meinesz [1950]. Both models assume that the crust (thickness to) fails along an inclined fault (reverse faulting in Figure 2a, normal faulting in Figure 2b) under the applied tectonic load N (compression in Figure 2a, tension in Figure 2b). The footwall and hanging wall blocks respond isostatically as independent elastic cantilevers subject to vertical loads at their ends.
rift valleys than would be expected if the topography of the east African rifts were locally compensated (whether by a Pratt or Airy scheme is largely irrelevant). The implication is that the surface morphology across the African rifts and their flanks constitutes a flexural (regional) rather than a local isostatic response to lithospheric deformational processes. We surmise that once the regional nature of isostatic com- pensation for the African rift topography was established from the gravity observations, Bullard favored a compres- sional origin for the features because of the belief (prevalent then as it is now) that extension leaves the lithosphere with little or no strength [e.g., Barton and Wood, 1984; Watts, 1988; Fowler and McKenzie, 1989].
Bullard suggested that the rift valleys and their flanks represent underthrust and overthrust crustal blocks sepa- rated by a high-angle reverse fault (Figure 2a). The weight of the overthrust flank causes downward bending to form a rift valley half graben, while the buoyancy of the underthrust block causes uplift of the rift flank. Bullard treated these two crustal blocks as independent cantilever beams supported by a fluid mantle and subject to vertical loads at their free ends. The elastic thickness T e of the cantilevers was assumed to be equal to the crustal thickness. Normal faults mapped along the boundary between rift valleys and flanks were explained by Bullard as the collapse under gravity of the tip of the overthrust block (Figure 2a).
Vening Meinesz [1950] also noted the regional nature of isostatic compensation for the rifts of East Africa but sug- gested that the morphology and Bullard's gravity data over the rifts are better explained as the response of the litho- sphere to tensile forces (Figure 2b). He proposed that tension in the crust would lead to the formation of an
inclined normal fault allowing slip to occur between the hanging wall and footwall blocks. Venus Meinesz also allowed the two crustal blocks to behave as independent
elastic cantilevers. In this case, however, uplift of the rift flank footwall is an isostatic rebound effect due to unloading of the fault surface by removal of the hanging wall. Subsid- ence of the hanging wall half graben is due to the replace- ment of the footwall crust with rock of mantle density.
These early studies of the east African rifts introduced two important concepts we will use to explain the uplift of rift flanks:
1. The lithosphere retains lateral strength or flexural rigidity during extension (although the amount of extension across the East African rifts is thought to be small [Rosen- dahl, 1987]), even though the upper part of the lithosphere may appear pervasively faulted.
2. The lithosphere is mechanically unloaded when nor- mal slip occurs on a deeply penetrating fault, and isostatic rebound will occur.
Theory for the Isostasy of Normal Faulting Through the Lithosphere
Kinematic model. We investigate the isostatic conse- quences of instantaneous simple slip on an initially plane, dipping normal fault that cuts the entire lithosphere (Figure 3). The model is described in terms of e0, the amount of extension (or heave on the fault), and % the dip of the fault. The overall extension factor B of the lithosphere can be defined as
I e0 tan •/ B =-= 1 q-• (1)
10 a
where l 0 and I denote the width of the zone of extension before and after extension, respectively. In (1), a is the thickness of the lithosphere before extension, taken as the depth where temperature reaches T m, the temperature of the isothermal asthenosphere beneath the lithosphere. These and other modeling parameters used throughout this study are listed in Table 1.
An important feature of the kinematic model for normal faulting (Figure 3) is that displacement on the fault intro- duces surface topography which has profound isostatic effects. This kinematically produced topography Zo(X) is given by
z0(x) = x tan •/ 0 • x -• e0
Zo(X) - e0 tan y x • e0
Isostatic response to normal faulting through the litho- sphere. The kinematic model for normal faulting (Figure 3) transforms an originally undeformed lithosphere in isostatic equilibrium to a configuration which is not in isostatic equilibrium. Thus isostatic restoring stresses will immedi- ately act to regain isostatic equilibrium. The magnitude and lateral distribution of these restoring stresses are found by requiring the mass/unit area in columns above a depth of isostatic compensation to be the same before and after extension. As usual in isostatic calculations, we define the depth of compensation as the level below which there are no lateral density variations. Inspection of Figure 3 shows that this surface lies at a depth of a + e 0 tan %
In determining the distribution of isostatic restoring stresses, we account for the temperature dependence of density in the crust and lithospheric mantle through relations of the form

13,922 WEISSEL AND KARNER: FLEXURAL UPLIFT OF RIFT FLANKS
>x
Fig. 3. Kinematic description of instantaneous slip along a plane, dipping normal fault cutting the entire lithosphere. The model is parameterized by y the fault dip, e0 the heave on the fault (equal to the amount of extension I - /0), the initial crustal thickness tc, and the initial thickness of the lithosphere a (defined as the depth where temperature reaches T m, the asthenosphere temperature).
pc(X, z, t)= p•[1 - aT(x, z, t)] (3)
pm(X, z, t)= p•[1 - aT(x, z, t)]
where a is the volumetric coefficient of thermal expansion, T(x, z, t) is the temperature structure of the lithosphere at time t, and P'c and P•n are the densities of crustal and mantle rocks respectively at 0øC. In particular,
P a = t9•(1 -- Ot Tin) (4)
gives the density of the asthenosphere. If the lithosphere has zero flexural rigidity, so that isos-
tatic equilibrium is reestablished in a local or pointwise manner, the surface of the deformed lithosphere will imme- diately (i.e., at time t = 0) be displaced vertically by an amount s i(x, 0) which is linearly proportional to the isostatic restoring stress at position x. Using the approach described above, we find that the locally compensated vertical dis- placements si(x, 0)required to balance the isostatic restoring stresses engendered by whole lithospheric normal faulting are given by
si(x, O) = 0 x -< 0 (5a)
xtany I a Tm ] - • x tan y (5b) si(x, 0)= -• (p•-pw) P; 2a Pa- Pw
O<x•eo
si(x, O) • • • (2x- eo)eo tan 2 y Pa- Pw 2a
Si(X , O)--•
P•- Pw e0 tan •, eo < x -< tc/tan •, (5c)
I ] P'• - P• (tc - x tan •/) 1 (x tan •/+ tc) Pa- Pw 2a
e0tan•, p• 1- (2x-e0) tan•, -pw (5d) Pa- Pw 2a
tc/tan •, < x -< eo + tc/tan •,
- pw Tm Si(X, 0) = -- • e0 tan •, + •
Pa- Pw Pm- Pw 2a (2 x - eo)
ß e0 tan 2 •/ eo + tc/tan •, < x -< a/tan •, (5e)
P•n- P w P•n- P a si(x, 0) = - e0 tan •, + • (x tan •, - a)
Pa- Pw Pa- Pw
atto
Pa -- Pw 2a • [(x- e0) 2 tan 2 y - a 2] (5f)
a/tan •, < x --< e0 + a/tan
Si(X , 0) -- -- e0 tan •/ x > e0 + a/tan •/ (5g)
Allowing a flexural isostatic response to extension. If the lithosphere retains flexural rigidity during extension, the isostatic restoring stresses (or, equivalently, the locally compensated vertical displacement given by (5a)-(5g)) will be balanced by the deflection wi(x, 0) of a thin elastic plate whose thickness Te will generally vary with position x across the extended region. The deflection w i(x, 0) is found from the differential equation governing flexure of a thin elastic plate overlying a fluid substratum:
O x 2 D( x, O) O x 2 + • N( x, O) • Ox Ox
+ Apgwi(x, O)= Apgsi(x, 0) (6)
In (6), Ap = (Pa - Pw), where Pw is the density of material overlying the lithosphere, g is the acceleration due to grav- ity, N(x, 0) is the applied horizontal force/unit length (which we take to be zero in this study), and D(x, 0) is flexural rigidity which is related to the effective elastic thickness Te(x, 0) of the lithosphere through
D(x, O)= ETe3(X, 0)/12(1- •2) (7)
In (7), E is Young's modulus, and v is Poisson's ratio. The characteristic wavelength of flexure, A•, depends on D and •pg through the relation

WEISSEL AND KARNER: FLEXURAL UPLIFT OF RIFT FLANKS 13,923
Parameter
X, Z
t
x6 x0
td tc a
h
e0
B(x6) •(x0)
Pw
q,(z) •o
Ps
Pa
T(x, z, t) rm
D(x, t) E
re(x, t) g
k
4,(x)
TABLE 1. Model Parameters
Definition
general horizontal and vertical coordinates time
unstretched horizontal coordinate below the detachment
unstretched horizontal coordinate above the detachment
depth to detachment (generalized shape) crustal thickness (31.2 km) lithospheric thickness at the time of extension (125 km) steady state lithospheric thickness (125 km)
horizontal offset of upper plate (heave) dip of planar detachment pure shear extension of the lower plate (footwall block) pure shear extension of the upper plate (hanging wall block) total thinning of the lithosphere
density of material overlying the lithosphere (either air or water)
porosity as a function of depth surface (or initial) porosity (60%) rate of decay of porosity with depth (2.5 km -1) density of sediment grains comprising the basin fill (2650 kg/m 3) density of the crust at 0øC (2800 kg/m 3) density of the mantle at 0øC (3330 kg/m 3) density of the asthenosphere (3179 kg/m 3)
lithospheric temperature structure temperature at the base of the lithosphere (1333øC) coefficient of thermal expansion (3.4 x 10 -5 øC -1) thermal diffusivity (8.0 x 10 -7 m2/s)
flexural rigidity of the lithosphere Young' s modulus (1011 N/m 2) Poisson's ratio (0.25) effective elastic thickness of the lithosphere gravitational acceleration (9.8 m/s 2)
wave number
flexural response function; space domain flexural response function; Fourier domain
4 4D/Apg
In the general case of laterally varying flexural rigidity, we assume that the temperature structure of the lithosphere T(x, z, t) at time t determines the effective elastic thickness Te(x, t). Studies of seamount loads and bending of the lithosphere seaward of oceanic trenches have provided empirical evi- dence that T e for the oceanic lithosphere varies as the depth to an isotherm in the range 300ø-600øC [Watts et al., 1980; Bodine et al., 1981; McNutt, 1984]. For simplicity, we will assume that Te(x, t) is given by the depth to the 450øC isotherm, which, for t = 0, is found by interpolation from the initial conditions on temperature given in Appendix A. Thus we ignore any effects on T e of compositional or rheological layering in the lithosphere, even though weak layers in the continental crust are likely to influence the flexural rigidity of continental lithosphere [Kusznir and Karner, 1985; Kusznir and Park, 1987]. When flexural rigidity depends on position x, i.e., D = D(x, t), we utilize the numerical finite difference approach of Bodine [1981] in solving (6). When flexural rigidity is constant or a function of time t only, (6) may be solved algebraically in the Fourier or wave number domain. As expected, (6) shows that wi(x, O) = si(x, O) when flexural rigidity is zero everywhere.
Resulting surface topography at time t - 0. The topog- raphy zi(x, 0) which results from instantaneous simple slip on a normal fault cutting the entire lithosphere is the sum of two components: (1) the topography wi(x, 0) which balances the isostatic restoring stresses, and (2) the topography zo(x) introduced in the kinematic model (Figure 3). Thus
Zi(X, O) = Wi(X, O) n t- Zo(X) (8)
where zo(x) is given by (2) and Wi(X , 0) is found from (5a)-(5g) and (6).
Additional subsidence or uplift of the lithospheric surface that occurs for times t > 0 as temperature perturbations decay can be found using the methods discussed in Appen- dix A.
Modeling Results
Figure 4 illustrates the topography developed at time t = 0 when simple slip occurs on a normal fault cutting through the lithosphere. The four topography profiles shown correspond to different values of effective elastic plate thickness T e given in the box lower left (Figure 4). The most important and obvious result is that no uplift of the unextended

13,924 WEISSEL AND KARNER: FLEXURAL UPLIFT OF RIFT FLANKS
Te'. (kin)
•• 5
........ 20
• Te (x)
Fig. 4. Resulting topography at time t = 0 due to normal faulting of the lithosphere. The kinematic model from Figure 3 is shown in the inset upper right. A dip 7 = 20ø and a horizontal offset e0 - 10 km (exaggerated in the inset for clarity) were used. We assumed that the material overlying the plate is air. The topographic profiles were determined using the values for effective elastic thickness T e given in the key at lower left. For the profile with variable rigidity, we assume that the effective elastic thickness Te(x ) varies with the depth to the 450øC isotherm, which is found from the initial conditions on temperature (see Appendix A).
footwall flank (x < 0) occurs if the flexural rigidity of the lithosphere is uniformly zero. The reason is that the isostatic restoring stresses are zero for x < 0, as given in (5a-5g) and depicted graphically in Figure 5a. The topographic profile for Te = 0 is similar to results obtained by other workers for models of" simple shear" of the entire lithosphere assuming local isostatic compensation [Mudford, 1988; Voorhoeve and Houseman, 1988; Issler et al., 1989]. When a flexural re- sponse during rifting is considered the resulting topographic profiles resemble half graben (Figure 4). For flexure during rifting, the amplitude and wavelength of the footwall flank uplift both decrease as flexural rigidity decreases. Notice, however, that the horizontal integral of each of the four topographic profiles in Figure 4 is a constant value linearly proportional to the amount of extension e0( = I - 10).
The results shown in Figure 4 also have an intuitive explanation. In the kinematic model for normal faulting, the footwall or lower plate is fixed, and the hanging wall or upper plate is rigidly displaced along the fault (Figures 3 and 5a). This displacement produces a topographic "hole" (z0(x), given by (2)) that is filled with material overlying the litho- sphere, such as air or water, which are less dense than the replaced crustal rocks. It is the buoyancy of the infilled topography relative to the original crustal material that predominates in the isostatic restoring stresses, causing the lithosphere to rebound. Uplift of the unextended footwall flank is permanent unless destroyed by subaerial erosion. Its amplitude, however, will be reduced if sediments, rather than air or water, fill the basinal region of the topography in Figure 4. We discuss the effects of infill by compacting sediments in Appendix B.
Discussion
Comparison with Vening Meinesz' model for the isostatic effects of normal faulting. A major reason for investigating the isostatic consequences of normal faulting through the lithosphere is to provide some improvement over the earlier
treatment of this problem by Vening Meinesz [1950] in his study of the origin of the east African rifts (Figure 2b). A comparison between the two approaches is warranted be- cause Vening Meinesz' model has been used in several studies to explain the topography developed across extended regions [Bott, 1976; Zandt and Owens, 1980; Hellinger and Sclater, 1983; Jackson and McKenzie, 1983; Owens, 1983].
Although we consider normal faulting through the entire lithosphere (Figures 3 and 5a) whereas Vening Meinesz considered faulting only through the crust (Figures 2b and 5b), this is not the major difference between the two ap- proaches. Two major differences are apparent in the way the isostatic response to instantaneous normal slip on the fault is determined. First, we allow the hanging wall and footwall to respond as integral parts of a continuous elastic plate, whereas Vening Meinesz allowed the footwall and hanging wall to respond as two independent elastic cantilevers. Our approach tacitly assumes that the fault is "locked" after slip but before isostatic restoring stresses act. In contrast, the half plate approach of Vening Meinesz does not allow mechanical interaction between the hanging wall and foot- wall as each is deflected in opposite directions by the isostatic restoring stresses.
The second, and most important, difference between the two approaches concerns the material that fills the space vacated by the hanging wall or upper plate and the conse- quences for isostatic rebound. As explained above, we allow the material overlying the lithosphere to fill that kinemati- cally produced topography. Because Vening Meinesz treated the footwall and hanging wall blocks separately, he introduced a critical assumption into his analysis, namely, that fluid mantle of density Pm upwells to a height H above the base of the crust. Thus, in the case of the footwall block (Figure 5b), a wedge of mantle material will partly overlie the fault plane in the space vacated by the hanging wall. Vening Meinesz' assumption significantly limits the magnitude of the resulting isostatic rebound because mantle is denser than

WEISSEL AND KARNER: FLEXURAL UPLIFT OF RIFT FLANKS 13,925
A©
MPa x I0 •
0
Isostatic Restoring Stress
................................................................ x=O
0
t c
Be
km
Fig. 5. Comparison between the magnitude and distribution of isostatic restoring stress (vertically hatched areas) from (a) our model (Figures 3 and 4, equations (5a)-(5c)) and (b) that of Vening Meinesz [1950] for the isostatic effects of simple slip on a normal fault which dips y = 30 ø. In Figure 5a the top portion of our kinematic model for normal faulting (crust is stippled) for a heave e0 = 20 km is shown under the isostatic restoring stress distribution. Figure 5b shows the configuration of the footwall block in Vening Meinesz' model from which the uplift-producing isostatic restoring stresses are determined. Also in Figure 5b the horizontal dashed line denotes the level H to which mantle (constant density Pm) may freely rise above the base of the crust (constant density Pc).
the replaced crustal material. The distribution of isostatic restoring stress acting on the footwall cantilever in Vening Meinesz model (Figure 5b) can be determined using the reasoning employed in deriving (Sa)-(Sg). The vertical dis- placements si(x) which balance the restoring stresses by pointwise or local isostatic compensation are given by
(Pc- Pw) $i(X) -- -- X tan 3,
(Prn- P w) 0 < x -< (tc - H)/tan 3'
(Pm- Pc) $i(X) = (X tan 3, - tc)(tc - H)/tan (9)
(Pm -- Pw)
y < x --< tc/tan
In (9), the crustal density Pc is assumed constant, and H is given under the condition that local isostatic compensation occurs at the base of the crust:
(Pc- Pw) H = tc (10)
(Pm -- Pw)
The vertically hatched areas in Figures 5a and 5b depict the magnitude and distribution of the isostatic restoring stress induced by instantaneous normal slip according to our formulation (5a)-(5g), and Vening Meinesz' formulation (9), respectively.
Finally, in order to calculate the deflection of the footwall and hanging wall cantilevers, Vening Meinesz determined the vertical force/unit length P acting on the free end of the
cantilevers. For the footwall block (Figure 5b), this quantity is simply the horizontal integral of the isostatic restoring stresses (Pm -- Pw)gSi(x) given by (9):
2 (Pc- P w) t c
P = -(Pm- Pc) g • (11) (p•-p•) 2tan3,
Below, we use expression (11) to model the uplifted rift flank topography of Broken Ridge and find that the observed magnitude of uplift is too large to be explained using Vening Meinesz' approach.
Comparison with models for dip-slip faulting during earth- quakes. Recent models for the topography that develops in response to repeated dip-slip earthquakes [e.g., Rundle, 1982; Savage and Gu, 1985; King et al., 1988; Stein et al., 1988] yield results strikingly similar to those that we have obtained above for finite simple slip on a normal fault cutting the lithosphere (Figures 3 and 4). In the seismologic models the lithosphere is regarded as an elastic plate overlying a Maxwell viscoelastic half-space. As in the present study, the surface topography that develops in response to repeated earthquakes is obtained in three steps. First, the immediate or coseismic topographic response to seismogenic slip is found using theory governing an edge dislocation embedded in an elastic half-space. This step is equivalent to the kinematic model for normal faulting in our modeling proce- dure (Figure 3 and equation (2)). Second, the topography that develops following a seismic event (the postseismic deformation) is determined over time as the Maxwell half- space flows in response to the "load" represented by the

13,926 WEISSEL AND KARNER: FLEXURAL UPLIFT OF RIFT FLANKS
>x 2- -2
! km i 0 20
o
km
5O
Fig. 6. Kinematic description of instantaneous extension of the lithosphere involving simple slip with heave e0 along a detachment combined with pure shear &(x0) in the upper plate or hanging wall, and pure shear/3(xb) in the lower plate or footwall. The deformed configuration of the kinematic model is found by using the extension parameters $ and /3 shown above the model as mapping functions. The initial shape of the detachment is denoted by the dotted curve, while its shape in the deformed configuration is the solid curve.
coseismic deformation [Rundle, 1982]. At large times com- pared to the Maxwell time constant, the underlying half- space will behave as a perfect fluid. Thus, at large times the problem is equivalent to finding the response of a thin elastic plate on a fluid substratum to isostatic restoring stresses engendered by the coseismic load [Savage and Gu, 1985]. This is the same approach we use in (5a)-(5g) to find the topography that balances the isostatic restoring stresses induced by the kinematic model for normal faulting. Third, the resulting surface topography is the sum of the coseismic and postseismic surface deformations, and this is identical to the way we sum the surface topography due to the kinemat- ics of extension and the topography which balances the induced isostatic restoring stresses.
LITHOSPHERIC EXTENSION INVOLVING PURE SHEAR
ABOVE AND BELOW A DETACHMENT
Introduction
In the preceding model for normal faulting through the lithosphere (Figures 3 and 4), we found that slip on the fault engenders uplift of the footwall rift shoulder when the lithosphere has finite strength or flexural rigidity. In the kinematic formulation of the normal faulting model the footwall and hanging wall blocks remain internally unde- formed (Figure 3), and the material deformation observed at time t = 0 is entirely bending strain resulting from isostasy. We now determine the implications for rift flank uplift in the more general case where actual material deformation of the lithosphere occurs during extension.
Theory for Lithospheric Extension Involving Pure Shear and Simple Slip Components
Kinematic model. As before, we consider a region of lithosphere originally l0 wide that is extended to a new width l, so that the overall amount of extension is given by the difference I - l0 (Figure 6). In this model, however, the kinematics of extension are described by (1) e0, the horizontal displacement of the upper plate relative to the unextended lithosphere, (2) &(x0) which denotes vertically homogeneous
pure shear extension of the upper plate, (3) /3(x•) which denotes vertically homogeneous pure shear extension of the lower plate, and (4) the geometry of the detachment surface. Because our approach is strictly forward modeling, we define the pure shear extension distributions •x0) and &(x•) in terms of the undeformed or preextension coordinate system, where x0 (primed for material below the detachment and unprimed for material above the detachment) denotes the horizontal coordi- nate of an element of lithosphere before extension.
In order to determine the isostatic restoring stresses engendered by extension, we first map the lithosphere into its deformed configuration (Figure 6) using the deformation parameters defined above. We observe that •(x0) denotes the extension factor for a horizontal element dxo at position x0 in the upper plate before extension. Similarly,/3(x•)) is the extension factor for an element dxb at x• in the lower plate before extension. Thus
dx/dxo = &(x0) (12a)
for 0 < x0 -< l0 in the upper plate, and
x/x6 (]20)
for 0 < x• -< l0 in the lower plate provide the basis for mapping the undeformed lithosphere into its deformed configuration. The location x after extension of a column of upper plate matehal originally at x0 is found by integrating (12a):
•0 Xø x- e0 = &(se) dse (13a)
Similarly, the location after extension of lower plate material located at x•) before extension is found from (12b):
x = ,8(•) ds c (13b)
Thus (13a) and (13b) show that a column of material at position x after extension is actually composed of a column of upper plate material originally at x0 and a column of lower plate material originally at x•. In particular, material lying in

WEISSEL AND KARNER: FLEXURAL UPLIFT OF RIFT FLANKS 13,927
the vertical plane x0 = l0 (or x• = 10) before extension in both the upper and lower plates maps to x = I after extension. Substitution of these values into the integration limits in (13a) and (13b) leads to the following relation:
•0 lø [•(S c) -- /3(SC)] ds c -- e0 (14)
which provides for conservation of mass in the extended lithosphere. By requiring e0,/3(x0), and/3(xb) to satisfy (14), we avoid the criticism made by Kligfield et al. [1984] that previous models for lithospheric extension by pure shear in two layers produce areas of strain incompatibility (i.e., "room" or "space" problems).
In contrast to the rigid block kinematic description of normal faulting (Figure 3), the detachment surface in the general model (Figure 6) is allowed to change shape as the lower plate is mapped into its deformed configuration by (13b). Note, however, that a horizontal detachment remains horizontal and lies at the same depth as before extension.
Figure 6 illustrates that in our general kinematic model for extension, the upper plate (or hanging wall) collapses on to the detachment, thereby creating a topographic "hole." This kinematically produced topography Zo(X) is given by
zo(x) = ta(x6) 0 < x -< eo
Zo(X) = ta(x(•)- ta(Xo)//3(Xo) x>e o
(15)
In (15), ta(Xo) and ta(xb) denote the original depth to the detachment for the upper plate and lower plate components respectively, of a column of lithosphere at position x after extension. We allow the material (air or seawater) overlying the lithosphere to infill the kinematically produced depression given by (15). Because the density of the infill is less than that of the replaced crustal material, the lithosphere rebounds isostatically when extended as described above and shown in Figure 6. This effect is important for the uplift of the flanking areas when the lithosphere retains flexural rigidity.
A final note on the general kinematic model for lithospheric extension concerns our decision to parameterize extension in the upper plate by vertically homogeneous pure shear Evidence suggests that the collapsing hanging wall deforms in a brittle fashion involving simple slip between tilted fault blocks which are, in turn, undefiain by the detachment surface [e.g., de Charpal et al., 1978; Wernicke and Burchfiel, 1982; Gibbs, 1984; Williams and Vann, 1987; White et al., 1986]. We use the pure shear description in the interest of mathematical simplic- ity. Errors in the resulting isostatic subsidence/uplift and lith- ospheric temperature structure are probably not large when the detachment surface lies at shallow depths within the litho- sphere, that is, within the crust.
Isostatic response to extension where simple slip on a detachment is combined with depth-dependent pure shear. No lateral density variations occur below the depth a in the kinematic model shown in Figure 6. That depth is therefore taken as the depth of compensation for the calcu- lation of isostatic restoring stresses induced by the kinemat- ics of extension. Recall that /3(x0) and /3(x;)) denote the distribution of pure shear in the upper plate and lower plate, respectively, in the undeformed coordinate system 0 < x0, xb -< 10). With this understood, we drop the dependent
variable in the expressions involving/3 and/3 that follow. The isostatic restoring stresses engendered by the general kine- matic model for extension vary according to whether the detachment crosses the crust-mantle boundary. There are three possible expressions for the restoring stress at x, according to whether ta(Xo) and ta(x•) denote crustal or mantle depths. These expressions are linearly proportional to vertical displacement si(x, 0) under the assumption of local or pointwise isostasy. Thus
1. For ta(Xo) < tc and ta(x •) -< tc,
(P a -- P w) S i( X, O) = -- (p a -- Pw) ZO( X)
+ (p•- p•)tc 1 tc 1- 2a
td(XO) 1 td(XO) - (P'• - P•) /3 2a
ta(x6) 1 - • ta( x6) + (P/n- P3) 13 2a .rm ta(Xo)
- P;• 2a /3 [ta(xo)- ta(x6)] arm td(xO)
- P;n --•-- t•(x6)- •
ølTm { •• -p• • [a-ta(•)] 1- 2. For ta(Xo) • tc and ta(xb) > tc,
(P a -- P w)S i( X, O) = -- (p a -- P w) Zo( X)
+ (p•- p•) • -• t c 2a
• aT m ta(xo) 1 - (P• - P3) • 2 a
atto [ta(Xo)
-• ta(Xo)]
- p,•--• a 1- O <x_< l 3. For ta(Xo) > tc and ta(xb) > tc,
(P a -- P w) S i( X, O) -- -- (p a -- P w) ZO( X)
0 < x -< l (16a)
(16b)
(16c)

13,928 WEISSEL AND KARNER: FLEXURAL UPLIFT OF RIFT FLANKS
In the above expressions for Si(X , 0), 1/fiL represents the fractional thinning of the entire lithosphere [cf. Hellinger and Sclater, 1983]. This may be written as
a td(xo) a- td(x4) = • (17)
Equation (16a) is the expression required f extension of the lithosphere is accommodated on an intracrustal detachment. In the general case where the simple slip component of extension e0 • 0, the correct expression for Si(X , 0) for 0 < x -< e0 is found by setting td(xo) = 0 and taking 8 to be finite (1, say) in the appropriate form of equation (16).
Resulting topography at t - 0 after including the effects of flexure. When the isostatic restoring stresses given by (16) are balanced flexurally instead of locally, we again use (6) to determine w i(x, 0), the deflection of a thin elastic plate loaded by the restoring stresses. The surface topography zi(x, 0) is found by adding the deflection wi(x, 0) and Zo(X), the kinematically produced surface topography. For the general model for extension by simple slip on the detach- ment combined with depth-dependent pure shear, w i(x, 0) is found from (16) and (6), and Zo(X) is given by (15).
As for the isostatic model for normal faulting through the lithosphere, the additional subsidence or uplift for times t > 0 resulting from thermal reequilibration can be determined using the methods discussed in Appendix A.
Results
By implementing the forward modeling procedure de- scribed above, we investigate the implications for rift flank uplift when lithospheric extension involves pure shear. In particular, we describe how such uplift depends on (1) the geometry of the detachment surface, (2) the lateral separa- tion of maximum pure shear in the upper plate relative to maximum pure shear in the lower plate, and (3) the size of the distance separating these pure shear maxima compared to the characteristic wavelength of flexure of the lithosphere. To simplify matters, we set the amount of simple slip e0 - 0, because the implications for footwall uplift due to simple slip on the fault have been adequately covered by the results presented above for the normal faulting model (Figure 4).
In Figures 7, 8, and 9 we compare the magnitude of rift flank uplift produced under two contrasting assumptions about the mode of isostatic compensation: Flexure (T e is determined by the depth to the 450øC isotherm) and local (r e = 0 for all x).
Figures 7 and 8 illustrate the implications for uplifted rift flank morphology when the pure shear distribution 8(x0) above the detachment does not coincide spatially with the distribution fi(x[) below the detachment. In Figure 7, the offset between these stretching functions is smaller than the flexural wavelength of the lithosphere. In Figure 8, however, the offset between the stretching functions is similar to the flexural wavelength of the lithosphere. Two detachment geometries, uniformly dipping (in the undeformed litho- sphere) and horizontal (midcrustal), are investigated for times t - 0 and t = 100 m.y. It is readily apparent in Figures 7a and 8a that uplift of the rift flanks occurs when litho- spheric flexural rigidity remains finite during extension (t - 0 m.y.). Moreover, when the lithosphere has strength, large uplift of both the footwall and hanging wall flanks occurs in
the example with small offset between the maxima in the upper plate and lower plate stretching distributions (Figure 7). This occurs regardless of the shape of the detachment because the distance between the maxima of the stretching functions is smaller than the flexural wavelength of the lithosphere. Thus, in relatively narrow rift zones, it may be difficult to distinguish which side is the hanging wall and which is the footwall or to determine the dip of the detach- ment with confidence solely from the topography.
For the case of a horizontal detachment at time t - 0, both local and flexural isostatic models are insensitive to the
distance between the maxima of the upper plate and lower plate stretching functions (Figures 7a and 8a). The reason is that the major source of isostatic rebound is the buoyancy of the kinematically produced topography Zo(X) (Figure 6). Equation (15) shows that the shape of this depression depends only on 8(x0) when the detachment is horizontal. However, the effect of the different offsets between the upper and lower plate stretching distributions becomes ap- parent with time after the extensional event. At t = 100 m.y., a clear separation between a "rift" basin and a "thermal" or "sag" basin is observed for the example with large offset between stretching maxima (Figure 8b).
For the dipping detachment example, however, the pat- terns of flexural uplift of the rift flanks at t = 0 differ according to the separation between the maxima of the upper and lower plate stretching distributions (left-hand panels, Figures 7a and 8a). When the separation distance is large (Figure 8), the rift basin is deeper adjacent to the footwall at t = 0, but the sense of basin asymmetry is reversed in the thermal phase, as expected from the location of greatest mantle thinning which is governed by fi(x•). For local isostasy, short-wavelength uplifts are predicted at t = 0 near the hanging wall for the dipping detachment model (Figures 7a and 8a). These features are thermally supported and will "disappear" during the postrift (i.e., cooling) stage if local isostasy is assumed. However, these uplifts are "frozen in" if flexure is assumed during the postrift phase.
Figure 9 shows the effect of detachment shape when the pure shear distribution functions 8(x0) and •(x[) are iden- tical and symmetric. The most important result is that when local isostasy is assumed, the resulting surface topography at time t = 0 is the same for both dipping and horizontal detachment geometries and no rft flank uplift occurs. When flexure during rifting is considered, the resulting pattern of rift flank uplift does depend on the geometry of the detach- ment surface (left and right panels, Figure 9). Notice that the thermal phase subsidence after 100 m.y. is the same in both cases.
At first glance, the geological significance of detachments becomes unclear if lithospheric extension is uniform with depth because no relative displacement occurs between the upper and lower plates along the detachment surface. De- tachments, however, are assumed to play a key role in the kinematics of extension in the modeling thus far. In the mathematical development, we treat the detachment as a surface which undergoes minimal vertical displacement as the lithosphere extends. Consequently, surface topography Zo(X) (given by (2) and (15)) develops purely as a result of the kinematics of extension. As we have shown, the flexural rebound mechanism for the uplift of rift flanks depends primarily on the buoyancy of the infilled, kinematically

WEISSEL AND KARNER: FLEXURAL UPLIFT OF RIFT FLANKS 13,929
a DIPPING DE TACHMEN T
0 75 krn
/C 50 km
•oo
STRETCHING FA C TORS
/ - _
0 #m $00
FLAT DETACHMENT
0 7•krn
/c 50 t•rn
I00
b
km 0
km 0
km 0
DIPPING DETACHMENT
kn7
,o /o,o •,oo •,oo FLAT DETACHMENT
8-
LOCAL -• LOCAL
LOCAL + FLEXURE o
LOCAL + L OCA L
! = I00 rn.y. LOCAL + FLEXURE
o
! I00 rny
• FLEXURE+ FLEXURE
:-, ½7 •'- ,%.-'..,•:?,;2-' . _
Fig. 7. Resulting topography when pure shear extension of the lithosphere occurs above and below a detachment, but where the stretching functions 8(x0) and 13(x8) (top center) are dissimilar. Note that the width of the zone of extension in this example is small compared to the flexural wavelength of the lithosphere. We use an initially plane, dipping detachment for profiles on the left and a horizontal detachment for those on the right. We assume that the lithosphere is overlain by seawater. (a) The results of the time t = 0 m.y., and (b) the results for time t = 100 m.y. The labels "flexure" and "local" above each column of profiles indicate the assumption about isostatic compensation, the first label indicates the assumption made for time t = 0 m.y. (i.e., during extension), the second for time t > 0 m.y. (i.e., during the postrift phase). Postrift phase subsidence was determined using the methods set out in Appendix A.

13,930 WEISSEL AND KARNER: FLEXURAL UPLIFT OF RIFT FLANKS
a DIPPIAIG DE' TACHME-AI T
0 5?0 lrm I
/C õ0
I00
0 Irrn
STRETCHING FACTO R S
2-
I
0 k m $00
FLAT DE-TACHME-NT
b DIPPING DETACHMENT o /oo
LOCAL
o
,'_,k,; •-,','_,' ;z•, i•:<" :'•;"-i' •', ';-'•:• ,' = •,' • V-,..'•,;'- •',. ,_..< • ..... , .•:.'i-',u._,•'.'•'•V?:?d,'•'5.."i'•'•.,L',•'
km
200 zoo FLAT DETACHMENT
-2
km 0
-2-
km 0 ß
o I FLEXURE + FLEXURE
Fig. 8. Resulting topography when pure shear extension of the lithosphere occurs above and below a detachment, but where the stretching functions 5(x0) and/3(x•) (top center) are dissimilar. Note that in contrast to Figure 7, the width of the zone of extension is comparable to the flexural wavelength of the lithosphere. We assume that the lithosphere is overlain by seawater. Again, we use an initially plane, dipping detachment on the left, and a horizontal detachment on the right. (a) The results for time t = 0 m.y., and the results for time t = 100 m.y. The labels "flexure" and "local" indicate the assumption about the mode of isostatic compensation as explained in the caption of Figure 7.

WEISSEL AND KARNER.' FLEXURAL UPLIFT OF RIFT FLANKS 13,931
DIPPING DE TACHMENT
0 $00 tm
50 krn
•00
S TRETCHI AIG FACTORS
d' (Xo)
2-
I-- J
8•--•r• ' •oo
FLAT DETACHMENT
0 $00 krn
0
ø t 50 krn
I00
L OCA L FLEXURE
?
LOCAL + FLEXURE FLEXURE+ FLEXURE
Fig. 9. Resulting topography when the lithosphere is extended by pure shear that is uniform with depth. The stretching functions $(x 0) and/3(xb) shown at the top, center are identical and symmetric. W½•assume that the material overlying the plate is seawater. The two topography profiles in the left-hand column relate to the dipping "detach- ment," and the two in the right-hand column relate to the initially horizontal, midcrustal "detachment." The top line of profiles was determined for time t = 0 m.y., while the lower line of profiles was determined for t = 100 m.y. The labels "flexure" and "local" indicate the assumption about the mode of isostatic compensation as explained in the caption of Figure 7. Note that the center profiles where local isostasy is assumed during extension (t = 0) relate to both "detachment" geometries, because the results are identical for pure shear that is uniform with depth.
produced topography relative to the crustal material orig- inally occupying the "hole."
As shown by the simple example in Figure 9, two (or any number of) different detachment geometries lead to the same resulting topography for a given depth-independent stretch- ing distribution if local isostasy is assumed. Because this assumption has often been employed by other workers in forward models for extensional sedimentary basins and continental margins, we examine its implications in more detail below.
Discussion
Previous modeling of pure shear extension with local compensation. It is important, first, to see how previous formulations for uniform and two-layer pure shear extension of the lithosphere [McKenzie, 1978; Royden and Keen, 1980; Hellinger and Sclater, 1983] are related to the general kinematic and isostatic model that we have developed for lithospheric extension involving simple slip along a detach- ment combined with components of pure shear extension in the upper and lower plates (Figures 6-9, equations (8), (15) and (16a)-(16c)).
To obtain the expression derived by Hellinger and Sclater [1983, equation (2)] for initial surface topography for two- layer (crustal and subcrustal) pure shear extension of the lithosphere, we assume in our general model that the amount of simple slip e0 - 0 and the detachment is planar and lies at the base of the crust. The required result follows by substi-
tuting td(xO) = td(X•)) = tc in equations (8), (15), and (16a) under the assumption of local isostasy.
If we now assume that the detachment lies at the Earth's
surface, i.e., td(xO) = td(x•)) -- 0, again assume local isostasy and use (8), (15), and (16a), we arrive at an expression for the resulting topography zi at time t = 0 for homogeneous pure shear extension of the lithosphere by a factor/3:
Zi = (Pa- Pw) (P[n- P•)tc 1 2a /]
- P• 2 1 - (18)
Equation (18) is recognized as the expression for locally compensated initial subsidence derived by McKenzie [1978] for lithospheric extension by uniform pure shear. Note that the ratio to/a in (18) governs whether zi denotes surface subsidence (>0) or uplift (<0) [McKenzie, 1978]. For the parameter values listed in Table 1, subsidence occurs if to > 0.15a.
In placing the detachment at the Earth's surface, we implicitly refer the kinematics of extension to that surface in order to emulate McKenzie' s kinematic model for pure shear extension. Material originally lying on the surface z = 0 does not change vertical position as the lithosphere extends in McKenzie's model, and the remainder of the lithosphere is thinned relative to z - 0. Therefore the kinematically pro- duced topography zo(x) in (15) is zero.
13,932 WEISSEL AND KARNER: FLEXURAL UPLIFT OF RIFT FLANKS
A, 2- 2
Temperature, T
Tm o
go ao
60
km
0 0
x--o x•Lo x•t i Z o
Zo+a
o T,•
Fig. 10. Kinematic models for extension of a finite width 10 of lithosphere by depth-independent pure shear. (a) The kinematics of extension are referred to the surface of the unextended lithosphere z = t,• = 0 (analogous to McKenzie [1978]). (b) The kinematics of extension are referred to a surface z = t,• • 0 at a midcrustal level (16 km). The distribution of extension • above, and/3 below the reference surface are identical, as shown at the top. On the right, temperature-depth profiles through the lithosphere at position x = 50 km are shown for both models. Notice that they are the same. The solid lines denote the temperature-depth profile immediately after extension, the long-dashed line denotes the temperature profile immediately before extension, and the short-dashed line denotes the steady state geotherm.
Indeterminacy in forward models for lithospheric exten- sion when local isostatic compensation during rifting is assumed. The assumption of local isostatic compensation was correct in McKenzie's original analysis of lithospheric extension. The reason is that he considered instantaneous,
uniform stretching of an infinite viscous lithosphere overly- ing a fluid substratum. In this situation, the isostatic restor- ing stresses have an infinite wavelength and would appear locally compensated regardless of the actual strength or flexural rigidity of the lithosphere. A problem arises if extended regions (rifts, basins, or continental margins) of finite width are modeled assuming local isostasy. The as- sumption is then generally invalid because the flexural wavelength of the lithosphere may not be small compared to the wavelength of the isostatic restoring stresses engendered by extension, unless the flexural rigidity of the lithosphere is uniformly very low.
We determine the isostatic consequences of the two kinematic formulations in Figure 10 for pure shear extension by a factor/3(x) to provide quantitative arguments for the importance of lithospheric flexure during extension. The first kinematic model (Figure 10a) essentially follows McKen- zie's formulation where material originally at z = 0 does not change in vertical position as extension occurs and the
remainder of the lithosphere is thinned relative to z - 0. In the kinematic model in Figure 10b, however, we assume that material along a midcrustal surface z = t a does not move vertically as extension occurs. In this case, the kinematically produced topography from (15) is given by z0 = re(1 - 1//3) (as before, we drop the independent variable x in the remainder of this discussion).
Because the term detachment has no geological signifi- cance when extension is uniform with depth, the surfaces z( = t•) = 0 and z = t• in Figures 10a and 10b, respectively, should be regarded instead as surfaces to which the kine- matics of extension are referred. The models in Figure 10 therefore represent two alternative ways of describing depth-uniform pure shear extension of the lithosphere by/3 if isostasy could be ignored. Note in Figure 10 that the thermal perturbation due to extension is the same in both formula- tions. Although we are primarily interested in comparing the isostatic consequences of these two kinematic formulations and their implications for the uplift of rift flanks, we provide at the end of this section some qualitative rheological argu- ments for preferring a reference surface within the litho- sphere over one at the Earth's surface.
The resulting topography at two times, t = 0 and t = 100 m.y. is shown for the kinematic model in which extension is

WEISSEL AND KARNER: FLEXURAL UPLIFT OF RIFT FLANKS 13,933
A. td--O
km 0 I00 I I I
B. td-- 16 km
....... "' .......... ---'---'ø---"- "•ø-- •-•--
• // FLEXURE LOCAL
t = Om.y. .-.-- t = Om.y. t = IOOm.y. ß ...... t = IOOrn.y.
Fig. 11. Resulting topography at time ! = 0 and ! = 100 m.y. following extension oœ the lithosphere by depth-independent pure shear. (a) Flexural and locally compensated topography resulting from the model in Figure 10a, where the kinematics oœ extension are referred to the Earth's surface z = tg = 0 (i.e., the McKenzie [1978] model). (b) Flexural and locally compensated topography resulting from the model in Figure 10b, where the kinematics oœ extension are referred to a midcrustal surface z = t d • 0. We assume that air rather than seawater overlies the lithosphere. Notice that locally compensated topography for both models is identical. Flexural •igidity is determined as a simple function of the lithospheric temperature structure (see text). The resulting topography 100 m.y. after extension is found using the methods described in Appendix A.
referred to the Earth's surface (ta = 0), and to a midcrustal surface (ta -• 0), in Figures 1 la and 1 lb, respectively. Notice that for each time there are two topography profiles accord- ing to whether the isostatic restoring stresses are balanced flexurally or locally.
As we found for the models presented in Figure 9, the resulting topography under the assumption of local compen- sation is independent of the location and shape of the kinematic reference surface when the lithosphere extends by depth-independent pure shear. For time t = 0, (18) gives the resulting topography zi for both cases in Figure 11. For the model with the reference surface at the surface (Figures 10a and 11a), there is no kinematically produced topography,
and hence the resulting topography Zi(tct=O) at position x is linearly proportional to the isostatic restoring stress at that location. Thus, from (8), (15), and (16a),
Zi(ta= O) = Si(ta= 0) (19)
Because the resulting topography is the same for the two alternative kinematic models when local isostasy is as- sumed, we can find from (19), (8), (15), and (16a) a simple relation between the isostatic restoring stresses (linearly
proportional to $i(ta•o)) for the model featuring the midcrustal reference surface (Figures 10b and l lb) and the isostatic
stresses (linearly proportional to s i(t,=o)) resulting from the model where the kinematics are referred to the Earth's
surface (Figures 10a and 11 a)'
Si(tct • O) -- --ZO(tct • O) q- Si(tct = 0) (20)
This relation provides fundamental insight into the isostatic response of the lithosphere to the mechanical unloading that occurs when the kinematics of extension is described in
terms of a reference surface t a -3 0 that lies within the lithosphere. Equation (20) says, in effect, that isostatic uplift
(Si(tct•O) < 0) will occur whenever z0 > Si(zo=O). In other words, isostatic rebound of the lithosphere occurs when the depth of the kinematically-produced topography z0 (given by (15)) is greater than the surface topography that results when extension is referred to the Earth's surface and local isos-
tatic compensation is assumed. In contrast to the results obtained assuming local isostasy,
the resulting topography clearly depends on the location of the kinematic reference surface when the lithosphere re- sponds fiexurally during extension (profiles for t = 0, Figures 11 a and 11 b). Notice that large rift flank uplift occurs for the model featuring the midcrustal reference surface (ta 5 • 0), whereas small flexural bulges occur for the model in which the kinematics of extension are referred to the Earth's
surface (ta = 0). These dramatically different results are due to the way the
isostatic restoring stresses given by (16a) are assumed to be compensated. When the lithosphere has nonzero flexural rigidity, the isostatic restoring stresses act as vertical loads on a thin elastic plate overlying a fluid substratum. The deflection w i(x, 0) of the plate is found by solving the differential equation (6) governing plate flexure. We assume for simplicity that D(x, 0) is a nonzero constant D so that (6) can be solved algebraically in the Fourier transform domain.

13,934 WEISSEL AND KARNER: FLEXURAL UPLIFT OF RIFT FLANKS
As we deal only with finite widths of extension in this paper, the Fourier transforms of the various spatial functions in (8), (15), and (16a) will exist. Taking Fourier transforms of both sides of (6), we obtain the following expression for Wi(k), the Fourier transform of the deflection wi(x, 0):
wi(, o)= 0) (21) where S i(k , 0) is the Fourier transform of the isostatic restoring stresses Apgsi(x, 0) found from (16a), and k is wave number which is related to wavelength A by A = 2rdk.
For the model (Figure 10a) where the kinematics of extension are referred to the Earth's surface (ta = 0), we have from (21)
Wi(ta = 0)(k, O) = dP(k)Si(ta = 0)(k, O) (22)
where cI)(k), the flexural response function of the lithosphere in the wave number domain, is the expression in brackets in (2•).
On the other hand, for the kinematic model where exten- sion is referred to a midcrustal surface (ta -• 0), the deflec- tion which balances the isostatic restoring stresses is found from (20) and (21) to be
Wi(ta- • 0)(k, 0) = (I)(k)Si(ta • 0)(k, 0)
= dP(k)[Si(t a = 0)(k, 0) - Z0(k)] (23)
where Zo(k) is the Fourier transform of the kinematically produced topography Zo(X) given by (15).
The resulting flexural topography Zi(td=o)(k, 0) for the model where the kinematics are referred to the Earth's
surface (Figure 1 la) is the sum of the kinematically produced topography (which is zero by (15)) and the deflection
Wi(t,•=o)(k, 0), given by (22), which balances the isostatic restoring stresses'
Zi(ta = o)(k, O) = Wi(ta = o) -- (I)(k)Si(ta = 0)(k, 0) (24)
For the model where the kinematics are described in terms
of a midcrustal reference surface (Figure 1 lb), the resulting
flexural topography Zi(ta9o)(k , O) is found from (23) and (8) to be
Zi(ta _• 0)(k, 0) -- (I)(k)[Xi(ta= 0)(k, 0) - Z0(k)] q- Zo(k ) (25)
Comparing (24) and (25), if the lithosphere retains finite strength or flexural rigidity during rifting, the resulting topography depends clearly on the location of the kinematic reference surface through the isostatic effect of the kinemat- ically produced topography Zo(X). However, if cI>(k) = 1 (i.e., when either D = 0 or A --> o•), then local or pointwise isostasy prevails, and the resulting topography from (24) and (25) is identical and is independent of the location of this surface (Figure 11). Notice that the horizontal integrals of the resulting topography for time t = 0 are independent of the location of the reference surface and the assumption about isostatic compensation. The topographic profiles integrate to a value linearly proportional to the overall amount of exten- sion.
This result has important implications for permanent uplift of the rift flanks. We noted from (20) that the isostatic restoring stresses engendered by extension cause isostatic
uplift when the kinematically produced topography z0 is larger (i.e., deeper) than the topography that results when local compensation is assumed. Uplift of the unextended rift shoulders will then occur if the lithosphere retains finite flexural rigidity during extension simply because the uplift- producing isostatic restoring stresses are compensated re- gionally (i.e., by flexure). In fact, if we can demonstrate that rift flank uplift is a permanent effect of extension and not due to transient thermal processes, we might reasonably infer that a detachment(s) or an intralithospheric reference sur- face was important in governing how the lithosphere ex- tended.
A possible rheological control for kinematic reference surfaces. How do we choose between the two alternative kinematic descriptions for depth-independent pure shear by a factor/3 (Figure 10).9 In other words, are there physical reasons for referring extension to a level z = td within the lithosphere instead of its surface z = 07
The kinematic models for extension used in this study (Figures 3, 6, and 10) attempt to describe how the litho- sphere might extend in the absence of gravity and hence when isostasy is ignored. The necking of a metal bar could perhaps serve as a useful analogue to the kinematics of lithospheric extension. Beaumont et al. [1982], for example, considered plastic necking of the lithosphere under horizon- tal tension as a conceptual kinematic model for extension. For a rheologically homogeneous lithosphere, necking would occur symmetrically about the center plane of the lithosphere. Thus the center plane would constitute the kinematic reference surface because it undergoes zero ver- tical displacement during extension.
However, if the lithosphere contains a mechanically strong layer embedded in weaker layers, necking would likely occur about the strong layer [Beaumont et al., 1982; Braun and Beaumont, 1989]. Because the strong layer would have no vertical component of displacement, it would there- fore serve as the reference surface for describing the kine- matics of extension. We suggest it is unlikely that the strong layer would occur at the lithospheric surface as required in the kinematic formulation for lithospheric extension intro- duced by McKenzie [1978] (Figure 10a). It is well known that the continental lithosphere is compositionally layered and that rheological differences occur between the quartz-rich crust and olivine-rich mantle. Further research is needed to
establish whether the concept of a reference surface within the lithosphere used in our kinematic models for depth- independent pure shear lithospheric extension (Figure 10b) can be explained by rheological layering. We show later, however, that similar patterns of uplifted rift flanks are found for both oceanic and continental lithosphere, suggesting that rheological differences between the two lithospheric types are not a dominant factor in their response to extension.
APPLICATIONS
Topography, seismic reflection, and gravity data across selected regions of extended oceanic and continental litho- sphere are presented in order to show that observed uplifted rift flanks can be explained as a flexural isostatic rebound effect of lithospheric extension as we have suggested theo- retically in the first part of this study. The oceanic examples (Broken Ridge in the eastern Indian Ocean, the Caroline ridges-Sorol Trough in the western equatorial Pacific, and

WEISSEL AND KARNER: FLEXURAL UPLIFT OF RIFT FLANKS 13,935
92 ø 9:5 ø 94 ø 95 ø 96 ø
29 ø
2700
1700
2600 BROKEN RIDGE
:.'50 ø
31 ø
;52 ø
Fig. 12. Bathymetry map of the western part of Broken Ridge [Driscoll et al., 1989]. Contour interval is 100 m except along the southern escarpment of Broken Ridge where some contours are omitted for clarity. The solid line marked EL48 is the ship track from which gravity and bathymetry data are shown in Figure 13. DSDP site 255 is located by the small dot.
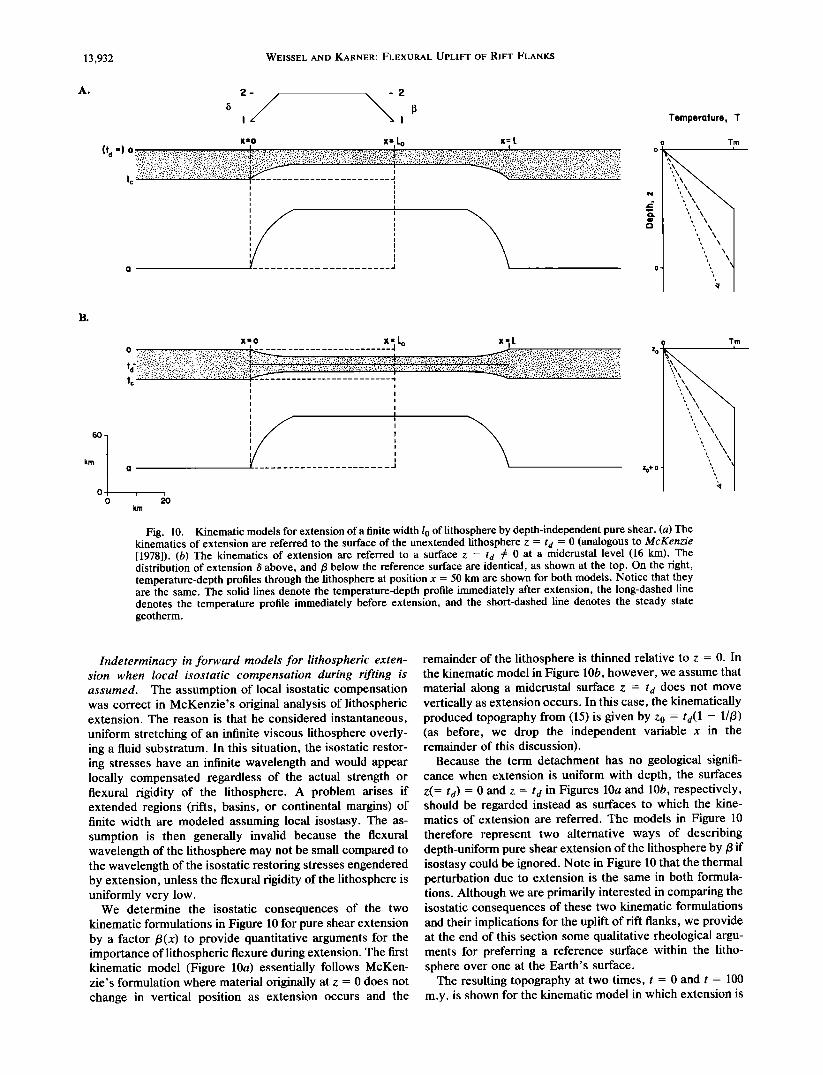
the Coriolis Trough behind the New Hebrides island arc) all involve extension in lithosphere with a crust thicker than normal oceanic crust. In the continents, we consider the Rhine graben, a relatively young rift, where we assume that erosion of the uplifted flanks can be neglected. Erosion of rift flanks and sediment infill of rift basins in the continents generally mean that the modeling of continental examples is more complicated than for the oceanic examples. For this reason we will apply our simple model for normal faulting through the entire lithosphere (Figure 3 and 4) to explain the topography and gravity observed over oceanic rift flanks. To model topography and gravity for the Rhine graben, how- ever, we will employ the general model for extension (Figure 6) involving both simple slip along a detachment combined with pure shear extension in the upper and lower plates.
Oceanic Rifts
Broken Ridge. An oceanic plateau located in the eastern Indian Ocean, Broken Ridge (Figure 12) was originally contiguous with the northern part of the Kerguelen-Heard plateau. Lithospheric extension (rifting) followed by seafloor spreading which began at about anomaly 18-time (•42 Ma [McKenzie and $clater, 1971; Mutter and Cande, 1983]) are together responsible for the present separation of the two platforms across the southeast Indian Ocean. Drilling at Deep Sea Drilling Project (DSDP) site 255 (Figure 12) bottomed in shallow water limestones of Santonian age [Davies et al., 1974], establishing that the age of the under- lying basement is greater than •80-85 Ma. Basaltic rocks
dredged from the prominent southern escarpment of Broken Ridge suggest that basement on Broken Ridge and the corresponding portion of the Kerguelen Plateau originated from intraplate volcanism in the Early or mid-Cretaceous [see, e.g., Morgan, 1981]. Seismic refraction data indicate that the crust beneath Broken Ridge is 18-20 km thick [MacKenzie, 1984].
The effects of the rifting episode at Broken Ridge are evident in the present-day topography (Figure 12 and 13). Broken Ridge is uplifted along its southern margin, which is delineated by major southward dipping normal faults with a cumulative throw of •5 km and an overall dip of 20 ø. Depths shoal to about 1000 m adjacent to the south facing escarp- ment, and the topography deepens northward to a morpho- logic saddle at about 2500 m depth over a distance between 80 and 150 km from the escarpment (Figures 12 and 13). The minimum amplitude of uplift at Broken Ridge is thus about 1500 m, because the drilling results [Davies et al., 1974] and the seismic stratigraphy observed over Broken Ridge [Driscoll et al., 1989] indicate that the crest of the uplifted topography was removed by either subaerial or wave base erosion.
Figure 13 shows that the ratio of free-air gravity anomaly to topography over the crest of Broken Ridge is large (•90 mGal/km). This large gravity/topography admittance can be explained if the Moho and the surface topography are uplifted by similar magnitudes.
Three isostatic models are presented in Figure 13 to explain the gravity and topography (topography only in

13,936 WEISSEL AND KARNER: FLEXURAL UPLIFT OF RIFT FLANKS
Figure 13a) observed along the ship track across Broken Ridge shown in Figure 12. In Figure 13a, we assume that Broken Ridge responds during extension as would the foot- wall block in Vening Meinesz' [1950] model for the isostatic consequences of normal faulting (Figure 5b). The predicted uplift of Broken Ridge is found from applying the upward directed force/unit length P given by (11) to an elastic cantilever whose thickness equals the observed crustal thickness. It is clear that the amplitude of uplift obtained using the elastic cantilever approach (dotted curve, Figure
BROKEN RIDGE
OLD NEW
A. FLEXURAL UPLIFT OCEAN I OCEAN (CANTILEVER) MODEL
'' "•'"•• '•-•'•'••••••' ".•v•'. '. i 2 ..... ß .."MODEL 'i'•i'•t I km
. • OBSERVED
B. RIFT FLANK SUPPORT: CRUSTAL '!}:}.•....:......•?W' ' THICKENING (LOCAL ISOSTASY)
+50
mgal
ß 1-50
2
km
4
..
C. FLEXURAL UPLIFT (CONTINUOUS . I
PLATE) ! +50 mgal
-,50
.'...•::,..: ..... . ..... •:'.,5.•::•:•.•'..V•'...'•.':':;•':'..'...:..-.: TOPOGRAPHY '. km
0 80 k rn 'i'!! .'"':"•• :• © 7 ©
13a) is much smaller than the uplift actually observed at Broken Ridge.
In Figure 13b, we test the explanation that the topography observed at Broken Ridge is supported by a thickening of the crust, analogous to an Airy scheme of local isostatic com- pensation. Such crustal thickening can potentially be attrib- uted to magmatic underplating of the crust by extension- induced partial melting of the mantle [White et al., 1987; Mutter et al., 1988; McKenzie and Bickle, 1988]. To model the free-air gravity anomaly over Broken Ridge, we must first determine the shape of the compensating Moho topog- raphy. The thickness of the crust t(x) across Broken Ridge and the adjacent ocean crust can be calculated using the following expression [e.g., Driscoll et al., 1989]:
[dref- d(x)](Pm- Pw) + tref(Pm- Pc)
t(x) = (Pm- Pc) (26a) where d(x), the observed bathymetry at location x, is as- sumed to be in local isostatic equilibrium with a standard column of crustal thickness tre f and water depth dre f. Note that since we use the observed topography to estimate the crustal thickness, the gravity, rather than the topography, is the object of the modeling in this case (cf. Figure 13c). For this example, we assume that the standard column is the adjacent ocean crust of the southeast Indian Ridge. Conse- quently, tre f is 6.0 km and dre f is 4.5 km. The resulting Moho topography r(x) is given by
r(x) = t(x) + d(x) (26b)
Figure 13b shows that the gravity anomaly predicted assum- ing local isostatic compensation by crustal thickening is significantly smaller than that observed. We conclude there- fore that the observed topography of Broken Ridge is not supported by crustal thickness variations (and hence mag- matic thickening) in a local isostatic manner.
An alternative explanation for the uplifted rift flank topog- raphy of Broken Ridge is that it is maintained thermally, i.e., by elevated temperatures within the lithosphere, analogous to a Pratt scheme of local isostatic compensation [e.g., Royden and Keen, 1980; Hellinger and Sclater, 1983; Watts
Fig. 13. (Opposite) Comparison between observed and mod- eled topography and free-air gravity across Broken Ridge. The observations were obtained along the shiptrack EL48 shown in Figure 12. (a) Predicted topography (dots) assumes that Broken Ridge represents the footwall in Vening Meinesz' [ 1950] treatment of the isostasy of normal faulting. The dip 3/of the fault is 20 ø. The predicted topography represents the deflection of an elastic cantile- ver of thickness t c = 20 km by an upward directed force/unit length P given by equation (11). (b) Predicted gravity effect (dots) for the situation in which the uplifted topography of Broken Ridge is supported by crustal thickness variations in a local isostatic manner. Note that the model gravity anomaly is much smaller in amplitude compared to the observed (solid line). (c) Predicted topography and gravity effect (dots) using our model for the isostatic effects of slip on a normal fault cutting the entire lithosphere (Figures 3 and 4). Broken Ridge represents the flexurally uplifted footwall flank of a half graben. The best fitting model profiles are determined at time t = 49 m.y. after rifting. Model parameters include a fault dip 3/of 20 ø, heave e 0 of 18 km, initial lithospheric thickness a of 45 km, and a crustal thickness tc of 18 km. The effective elastic thickness Te(x, t) in the model is allowed to vary with the depth to the 450øC isotherm. We assume that seawater (Pw = 1.03 g/cm 3) overlies the lithosphere in these calculations.

WEISSEL AND KARNER: FLEXURAL UPLIFT OF RIFT FLANKS 13,937
and Thorne, 1984; Steckler, 1985; Steckler et al., 1988a, b]. To test the feasibility of this explanation, we attempted to calculate the degree of mantle thinning necessary to support the observed topography. The degree of mantle thinning (parameterized by /3(x)) is dependent on both the litho- spheric thickness a at the time of rifting, and the crustal thickness to. We calculated a prerift lithospheric thickness of 60 km by noting that (1) Broken Ridge was at an average water depth of •1500 m at the time of rifting, and (2) the lithosphere was approaching thermal equilibrium since the time interval between its formation and the rifting event was •50 m.y. Given these parameters, it is not possible to construct a/3(x) function. Therefore the observed topogra- phy at Broken Ridge cannot be attributed to temperature variations within the lithosphere.
In Figure 13c, we employ the theory developed in this study for the isostasy of normal faulting through the litho- sphere where the footwall and hanging wall blocks behave as integral parts of a continuous elastic plate overlying a fluid substratum (Figures 3 and 4, equations (2), (5a)-(5g), and (8)). We assume that Broken Ridge represents the footwall of this extensional system and focus the modeling effort on explaining the topography and gravity effect due to flexural rebound of the footwall as a result of extension. That is, we do not intend to predict gravity or topography for the 42 Ma and younger southeast Indian ridge seafloor south of the boundary line drawn in Figure 13. The observed topography and gravity anomaly across Broken Ridge are explained very effectively by the normal faulting model for an elastic thickness T e of 15-20 km for Broken Ridge at the time of rifting. This value of Te corresponds to a thermal thickness a for the lithosphere of 45-60 km at the time of rifting, if we assume that Te tracks the 450øC isotherm in the lithosphere. The model topography (Figure 13c) suggests, in fact, that the original magnitude of flexural uplift at Broken Ridge was over 2000 m at the south facing escarpment, when we allow for the amount eroded while the "tip" of the uplifted flank was subaerially exposed in the middle to late Eocene [Scientific Staff Leg 121, 1988; see also Davies et al., 1974].
In summary, the model developed in this study for the isostatic consequences of lithospheric extension by simple slip on a normal fault (Figures 3 and 4) explains both the topography and gravity anomaly observed over Broken Ridge (Figure 13c). This example provides good evidence that the uplift of rift flanks can be attributed to flexural rebound following mechanical unloading of the lithosphere during extension.
Caroline ridges-Sorol Trough. The Sorol Trough (Figure 14, top) appears to mark the northern boundary between the Caroline and Pacific plates in the western equatorial Pacific [Weissel and Anderson, 1978]. A transtensional tectonic regime has been predicted for the Sorol Trough on the basis of present-day plate motion models [Weissel and Anderson, 1978; Ranken et al., 1984], with the component of extension across the Sorol Trough increasing westward toward the Yap Trench. Sparse teleseismicity indicates that the feature is currently active.
Weissel and Anderson noted the asymmetric morphology of the Sorol Trough with the greatest depths (>4000 m) displaced toward the southern side and that the southern margin is defined by large-offset normal faults (Figure 14, bottom). The blocky morphology within the trough suggests an extensively faulted, collapsed hanging wall of a half graben, but it is
unknown whether seafloor spreading has commenced within the Sorol Trough (see Fornari et al. [1979] and Perfit and Fornari [1982] for a detailed discussion of the tectonic implica- tions of rocks dredged from the Sorol Trough).
The Sorol Trough is a rift zone which has developed in the originally contiguous West Caroline Ridge and the Caroline Islands Ridge. These two ridges appear to be oceanic basalt platforms of Oligocene age, according to DSDP drilling on the Caroline Islands Ridge [Fischer et al., 1971; Ridley et al., 1974]. Notice, from the seismic reflection and bathymetry data shown in Figures 14 and 15, the upturned morphology and stratigraphy of the West Caroline Ridge and its normally faulted margin along the Sorol Trough.
We model the morphology and gravity anomalies across the Caroline ridges-Sorol Trough extensional domain using the model for slip on a normal fault through the lithosphere developed earlier in this study and used above for Broken Ridge (Figure 13c). Because the West Caroline Ridge appears to represent the footwall block of the extensional domain, we concentrate in the modeling on matching the observations over the West Caroline Ridge and southern margin of the Sorol Trough. In Figure 14 (bottom) we compare a model for flexural topography with a seismic reflection profile across the Sorol Trough and West Caroline Ridge, while in Figure 15 we compare modeled topography and gravity anomalies with ob- served bathymetry and gravity profiles.
The flexural isostatic model for a simple normal fault is clearly capable of explaining the uplift of the West Caroline Ridge observed in the seismic reflection profile (Figure 14, bottom). The effective elastic thickness Te in the best fitting model is • 10 km, suggesting that the lithosphere beneath the Caroline ridges was thermally young at the time of rifting. This implication is compatible with the Oligocene age deter- mined for the seafloor in the Caroline basins to the south
[Weissel and Anderson, 1978; Bracey, 1983] and for the magmatic episode which formed the Caroline ridges [Ridley et al., 1974].
There is some variability in the morphology along strike of the Sorol Trough extensional domain, such that models with Te between 5 and 10 km appear to satisfy the observations (Figure 15a). The model gravity anomalies adequately match the observations over the West Caroline Ridge and southern margin of the Sorol Trough (Figure 15b). However, the complex morphology within the Sorol Trough and the asso- ciated large, short-wavelength gravity anomalies are not matched in the model profiles, because actual material deformation of the hanging wall block is not allowed in the simple normal faulting model for extension (Figure 3).
Coriolis Trough. The Coriolis Trough is a series of linked half graben located east of the southern islands of the New Hebrides island arc (Figure 16). There is a suggestion in the bathymetric map of Karig and Mammerickx [1972] that the sense of structural asymmetry alternates along strike of the 300-km-long Coriolis Trough in a manner similar to the East African rifts [Ebinger et al., 1987; Rosendahl, 1987; Burgess et al., 1989]. A recent Sea Beam survey of the central part of the Coriolis Trough revealed a southwest facing half graben with a border fault system along the northeast margin [Recy et al., 1986]. Near the island of Futuna on the uplifted footwall (Figure 16), cumulative throw on the bounding normal faults exceeds 3.5 km. The Coriolis Trough may be actively extend- ing as indicated by shallow earthquake activity detected be- neath the feature during ocean bottom seismometer (OBS)

13,938 WEISSEL AND KARNER: FLEXURAL UPLIFT OF RIFT FLANKS
138 ø 139 ø 140 ø 141 ø 142 ø 143 ø 144 ø
9ø• 9 ø
138 ø 139 ø 140 ø 141 ø 142 ø 143 ø 144 ø
o 5o I I I
krn
NE
;• • .... SOROL TROUGH • 'i-( •.._
ß
ß
ß
ß
SW
ß
ß .. MODEL' '. Te=10 km
i ßßßßßßßß, ß ß ß ß ß
•i W. CAROLINE '\' RIDGE
Fig. 14. Comparison between a seismic reflection profile across the Caroline ridges-Sorol Trough and topography predicted 25 m.y. after extension of the lithosphere on an initially plane, dipping normal fault (Figures 3 and 4). We assumed that the lithosphere is overlain by seawater and the model profile is for a crustal thickness tc = 18 km, an initial lithospheric thickness a = 30 km, fault dip 7 = 20ø, and heave e0 = 12 km. The effective elastic thickness Te(x, t) in the model is allowed to vary with the depth to the 450øC isotherm. The observed profile is denoted by the solid line in the bathymetry map at the top (contour interval is 500 m).
experiments [Coudert et al., 1981]. Because the geology of Futuna includes volcanic rocks with island arc affinities, we
infer that extension is occurring in island arc crust. The seismic reflection profile selected for modeling, which
is located east of the island of Tanna (Figure 16), clearly shows the half graben structure of the central part of the Coriolis Trough. As with the previous oceanic examples, we model the topography across the Coriolis Trough as the flexural isostatic effect of extension by normal faulting through the entire lithosphere (Figures 3 and 4). With this simple model, we are able to reproduce the general morpho- logic shape of the half graben, particularly the uplifted
footwall flank on the east (Figure 16). The modeling results suggest that the thermal age of the extending island arc lithosphere must be very young, because we require very low values of effective elastic thickness Te < 5 km in the modeling.
Continental Rifts
Continent rifts have additional complications relative to their oceanic counterparts in that (1) their rift flank morphol- ogy is continually being modified by erosional processes, and (2) sediment loading within the rift basin tends to reduce

WEISSEL AND KARNER: FLEXURAL UPLIFT OF RIFT FLANKS 13,939
Ao TOPOGRAPHY B. GRAVITY
MODEL: Te =5km
ß
ß
':..:
MODEL: ' " ß
ß
..
ß . . ..
...
%.
4km
4km
4km
©
,;% ß o
ß ß
..
MODEL: Te •10 k•'".. ' ß
ß
ß
ß ,
'.;
MODEL: -.
Fig. 15. Comparison between observed and modeled topography and gravity anomalies over the Caroline ridges-Sorol Trough in the western equatorial Pacific Ocean. The observed profiles, denoted by the circled numbers, are located in the bathymetry map at the top of Figure 14. Two model topography profiles (dotted) are shown at the top and bottom on the left, while two model gravity profiles (determined by the techniques discussed by J. K. Weissel et al. (unpublished manuscript, 1989)) are shown as the dotted curves top and bottom on the right. The parameters used for the modeling are the same as given in the caption to Figure 14, except that two flexural rigidity schemes were used: variable T e at the bottom (where Te(x , t) varies as the depth to the 450øC isotherm) and T e = 5 km at the top.
the adjacent riff flank upliftß We address the first point by investigating a relatively young rift (the Rhine graben) where we assume that the flanking uplifts are not eroded signifi- cantly. The second point is addressed by investigating the flexural effects of changing infill load by sediment compac- tion (Appendix B). If we can model continental rift flank uplift using the same isostatic rebound principle as for oceanic rift flanks, then we can infer that although oceanic and continental lithosphere might differ rheologically, the overall response to the extension process is similar in either tectonic setting.
In the oceanic rift examples, we were interested in ex- plaining primarily only the footwall uplift and therefore we used the simple normal fault model for lithospheric exten- sion (Figure 3). In the continents, we are interested in explaining the total morphological shape (both the flanks and the rift basin) across the extended zone. Consequently, we use our more general model for lithospheric extension in- volving slip along a detachment combined with components of pure shear extension in the upper and lower plates (Figure 6). For mathematical convenience, we use a simple listric fault that soles into the Moho to describe the detachment. The form of this listric fault is described by
ta(Xo) = tc(1 - e -kaxø) (27)
The kinematic model therefore is parameterized by the depth to the Moho to, the curvature of the listric fault with depth kj • , and the heave along the detachment (e0, Figure 6). The values of the parameters describing the listric fault geometry are chosen so that the border fault is steeply dipping and the upper plate "rollover" simulates the width of the observed
rift basin. The extension in the upper plate is calculated by first specifying the kinematically produced hole Zo(X) con- sistent with the rollover and then using (15) to obtain iS(x0). Extension below the detachment/3(x•) is assumed to occur over a broad region relative to k• -• and balances the upper plate extension and heave on the detachment according to (17).
Rhine Graben. The Rhine graben is considered the "type" example of a symmetric rift [e.g., lilies, 1970, 1974; Ziegler, 1982]. It is approximately 300 km long and 35-45 km wide, bordered by normal faults, and terminated in the south by the Jura mountains (Figure 17). The locations of many European rifts, including the Rhine graben, appear to have been controlled by preexisting Hercynian structural fabrics [lilies, 1970; SengOr and Burke, 1978]. Subsidence in the Rhine graben was time transgressive, beginning in the south and migrating northward. The southern Rhine graben began subsiding in the Eocene, in contrast to the northern Rhine
13,940 WEISSEL AND KARNER: FLEXURAL UPLIFT OF RIFT FLANKS
ß
ß
ß
ß
ß
ß
ß
ß
ß
ß
ß
ß
ß
ß
ß
ß
ß
ß
ß
ß
ß
ß
ß
ß
ß
ß
ß
ß
ß
ß
ß
ß
ß
ß
ß
ß
ß
ß
ß

WEISSEL AND KARNER: FLEXURAL UPLIFT OF RIFT FLANKS 13,941
6 ø 8 ø 10 o
50 ø
48 ø
50 ø
48 ø
6 ø 8 ø 10 o
Fig. 17a. Topography map of Rhine graben and vicinity showing position of profile (approximately coincident with A-A of Mueller and Rybach [1974]). The shaded areas on the map lie at elevations >650 m.
graben which began filling in the Plio-Pleistocene [Illies, 1974]. The fact that the Rhine River flows approximately along the Tertiary depocenters implies that the basin is still subsiding. Maximum sediment thicknesses range from 2500-
3000 m in the southern Rhine graben and 1500-2500 m in the central regions to 3400-3800 m in the north [Doebl and Olbrecht, 1972]. Individual depocenters are contained within asymmetric half graben distributed along the rift axis, each
RHINE GRABEN
NW SE
FREE-AIR GRAVITY
5O
mgals 0
SCHWARZWALD
1 mefers
0
TOPOGRAPHY RHINE JURA F VALLEY ,,,,,• ,,,, _ .•..,....-_,..;•.?•-'"' .. _
F ., ..i. •.'
50 km
Fig. 17b. Comparison between observed and predicted free-air gravity and topography profiles over the Rhine graben. The observed profiles were constructed by projecting all point gravity and elevation data within the box in Figure 17a on to a single profile coincident with the long axis of the box. We used our general model for lithospheric extension (Figure 6) to determine the model topography profile. The predicted topography/basement shape, and associated gravity effect, calculated using the methods described by J. K. Weissel et al. (unpublished manuscript, 1989), are denoted by the bold dashed lines. Observed basement depths (open triangles), determined from base-Tertiary sediment isopachs [Doebl and Olbrecht, 1974], are plotted along the profile. Model parameters, including the compaction characteristics of the rift basin sediments, are given in the text.

13,942 WEISSEL AND KARNER: FLEXURAL UPLIFT OF RIFT FLANKS
separated by transfer faults. Each major depocenter is associated with a corresponding footwall uplift, as, for example, the Odenwald Mountains on the flanks of the northern Rhine graben. In the south, the flanking topography consists of exposed Hercynian crystalline crust in the Vos- ges and Schwarzwald mountains (Figure 17). These moun- tains have typically been interpreted as the symmetric rift flank uplifts accompanying full graben formation [e.g., Muel- ler, 1970; Illies, 1970; Illies and Greiner, 1978]. Figure 17, from the south central Rhine graben, clearly shows the asymmetric nature of not only the rift flank topography but also the free-air gravity anomaly. The ratio of free-air gravity to topography over the flanking southeastern topography is large, indicative of lithospheric flexural strength during extension. In contrast, the relatively subdued northwestern flanking topography is associated with a broad, but low- amplitude, gravity anomaly. The Jura Mountains to the southeast of the Schwarzwald rift flank are related to Alpine compression, and their topography is not related to exten- sion in the Rhine graben. Much of the southern Schwarzwald signature may actually be part of the Jura Mountains, as can be seen by the merging of Jura and Schwarzwald trends in the contour map of Figure 17a. The southern Schwarzwald topography, therefore, may be unrelated to extension.
The development of the southern Rhine graben and the symmetric distribution of the Vosges/Schwarzwald have been attributed by other workers either to the local isostatic re- sponse of the lithosphere to two-layer pure shear extension (i.e., where the distribution of crustal extension is narrower than the distribution of extension in the mantle [e.g., Kahle and Werner, 1980; Villemin et al., 1986]) or to small-scale convec- tion induced during extension [Buck, 1986]. A fundamental problem with the two-layer models, especially when attempt- ing to match the observed to predicted rift flank uplift, is the need to essentially replace the entire mantle lithosphere by asthenosphere (i.e.,/3-• o•, while •-• 1.0). This "infinite/3" approach is not restricted to Rhine graben studies but has been used by many workers to account for uplifted rift flanks adjacent to intracratonic and passive margin basins [e.g., Watts and Thorne, 1984; Steckler, 1985; Hellinger and Sclater, 1983; $clater and Celerier, 1989].
In Figure 17, we show the results of modeling both the topography and free-air gravity anomaly across the Rhine graben (profile A-A of Mueller and Rybach [1972]). For the Rhine graben, the modeling parameters, tc, k• -1, and e0 are assumed to be 32, 32, and 3 km, respectively. The heave on the boundary fault is similar to that reported by Illies[ 1970], indicating only minor extension of the crust. The modeled sediment-filled half graben is very similar in shape to the sediment-basement interface obtained from the base-
Tertiary sediment isopachs [from Doebl and Olbrecht, 1972] recovered along the profile. The modeling predicts a maxi- mum basin depth of 2280 m (as compared to the observed 2500 m [Doebl and Olbrecht, 1972]), and uplifted rift flank topography reaching a maximum height of 545 m above the level of the Rhine River on the southeast side (Figure 17b). Sediment densities are assumed to vary as a function of depth within the basin due to compaction because, as demonstrated in Appendix B, the density of the infilling sediment can significantly affect the amplitude of the rift flank uplift. For the Rhine graben, the compaction charac- teristics (Table I and Appendix B), q•0, kff • , and Ps are assumed to be 30%, 0.5 km, and 2.65 g/cm 3, respectively.
This results in sediment densities ranging in value from 2.26 to 2.64 g/cm3 as a function of depth in the basin.
To model the free-air gravity anomaly, we follow the procedure developed by J. K. Weissel et al. (unpublished manuscript, 1989). We can see from Figure 17b that the observed free-air anomaly gently varies across the rift basin, a feature characteristic of the gravity field along the entire graben [e.g., Kahle and Werner, 1980]. That is, the gravity anomalies do not reflect details of the basement geometry. From our modeling, it would appear that the observed gravity over the rift basin primarily reflects the compaction characteristics of the sediment infill. We conclude that in
general, there is excellent agreement between the observed and modeled rift flank uplift, basement depth, and free-air gravity anomaly for the profile across the Rhine graben shown in Figure 17. The best fitting effective elastic thick- ness Te is found to be 21-25 km, consistent with the value obtained by Karner and Watts [1983] in their gravity study of the Molasse basin.
CONCLUSIONS
We draw the following conclusions from the two simple kinematic and isostatic models for extension presented above and their application to both continental and oceanic rift zones:
1. The uplift of rift flanks can be explained as the flexural isostatic rebound of the lithosphere following its mechanical unloading during extension.
2. For this explanation to be viable, the lithosphere must retain finite mechanical strength or flexural rigidity even though it is extended.
3. Isostatic rebound implies that the kinematics of exten- sion is governed by (1) a deeply penetrating detachment surface which decouples the upper and lower parts of the extending lithosphere, or (2) a rheological strong layer within the lithosphere which undergoes zero vertical displacement during extension and therefore serves as a reference surface when describing the kinematics of extension. Under these circumstances, the kinematics of extension produces a sur- face depression or "hole" that is filled by the material overlying the lithosphere. Although the buoyancy of the infilled "hole" is important for determining the isostatic response of the lithosphere to extension, whether the litho- sphere will be uplifted or subside during extension depends on the following condition: If the kinematically produced topography is greater (i.e., deeper) than the level to which the surface of the extended lithosphere would subside as- suming local isostatic compensation, then isostatic rebound of the lithosphere will occur. The areas flanking the extended lithosphere will then be uplifted if isostatic rebound is compensated regionally (i.e., by flexure) rather than locally.
4. Flexurally uplifted rift flank topography forms at the time of rifting and represents a permanent deformation of the lithosphere. Modification of this initial topography, however, will occur over time due to erosion of the uplifted flanks and basin infilling by sediments, particularly in continental settings, and by vertical displacements due to decay of the thermal perturbation of the lithosphere engendered by extension.
5. We investigated the isostatic consequences of simple slip along an initially planar, dipping normal fault cutting the entire lithosphere in order to explain footwall uplift observed at half graben. Our model provides some advantages over earlier treatment of the same problem by Vening Meinesz

WEISSEL AND KARNER: FLœXU}C•L UPLIFT OF RIFT FLANKS 13,943
[1950]. The methods differ in two basic ways: (1) We allow the lithosphere to respond as a continuous elastic plate, rather than allowing the footwall and hanging wall blocks to behave as independent elastic cantilevers. Our method ac- counts in a simple way for the mechanical interaction of the footwall and hanging wall as the lithosphere responds isos- tatically following slip on the fault. (2) We allow material overlying the plate to fill the space vacated by the hanging wall, thus avoiding the questionable assumption made by Vening Meinesz that fluid mantle rises isostatically and partially loads the footwall cantilever.
6. Our model for flexural uplift of the footwall rift flank following slip on a normal fault cutting the entire lithosphere provides a good explanation for gravity and topography data from rift flanks in oceanic lithosphere. In particular, the flexural rebound model provides a much better explanation for the large free-air gravity anomaly observed over Broken Ridge than does a model which assumes that the uplifted topography of Broken Ridge is compensated in a local isostatic manner by either crustal thickening (i.e., by an Airy scheme of is•0Stasy) or by elevated temperatures within the lithosphere (i.e., by a Pratt scheme of isostasy).
7. We investigated the isostatic consequences of litho- spheric extension where simple slip on a surface of arbitrary shape within the lithosphere is accompanied by pure shear extension in the upper and lower plates. We derived an integral expression linking these extension parameters which ensures conservation of mass in the extended lithosphere. Previous models for pure shear extension of the lithosphere in one [McKenzie, 1978] and two layers [Royden and Keen, 1980; Hellinger and Sclater, 1983] can be derived as special cases from our general model. In fact, our model is a general formulation for instantaneous lithospheric extension involv- ing both pure shear and "simple shear" components.
8. A problem arises with depth-independent pure shear extension of the lithosphere by a factor /3(x) in that any kinematic formulation of such extension gives the same result- ing topography when local isostatic compensation is assumed. If instead the lithosphere is allowed to respond flexurally during extension, different kinematic descriptions of depth- independent pure shear give resulting topography that is unique. In particular, if the surface to which the kinematics of pure shear extension is referred is sufficiently deep within the lithosphere, the rift flanks will be flexurally uplifted (see con- clusion 3, above). We speculate that because detachments may have no geological meaning when the lithosphere extends by depth-independent pure shear, rheological (or strength) strati- fication of the lithosphere may explain why the kinematics of lithospheric extension should be governed by a surface within the lithosphere rather than at its surface.
9. The basin and rift flank topography and free-air grav- ity anomaly over the Rhine graben can be satisfied using our general extensional model with only a small amount (<5 km) of extension along a listric-shaped detachment soling at the crust-mantle boundary. We found, however, that the pre- dicted depth of the basin and associated gravity anomaly are both sensitive to the compaction characteristics assumed for the sediment infill of continental rift basins.
10. Because the flexural rebound mechanism explains the observed topography and gravity anomaly over both oceanic and continental extensional domains, we suggest that the rheological differences between the two lithospheric types may not be as important in their response to extension
as some laboratory experiments and theoretical models (e.g., yield-stress envelopes) have implied.
APPENDIX A
In this appendix we consider the thermal reequilibration problem connected with lithospheric extension. Although aspects of the development below have been treated previ- ously [McKenzie, 1978; Royden and Keen, 1980; and oth- ers], several features are probably new. In particular, we (1) treat a nonequilibrium but linear temperature gradient at the time of extension, (2) show how to account for crustal thickness variations caused by extension in the calculation of the thermal phase subsidence, and (3) demonstrate that it is necessary to calculate thermal subsidence incrementally over time if the changing lithospheric temperature structure governs flexural rigidity.
Thermal Reequilibration of the Lithosphere Following Extension
We need to know the lithospheric temperature structure with time following extension in order to determine (1) the additional vertical displacement that occurs as isostatic compensation to changes in the lithospheric temperature structure, (2) the spatial and temporal variations in flexural rigidity D (or, equivalently, Te) , which will occur if flexural rigidity depends on temperature, (3) the heat flow through the surface of the lithosphere with time, and (4) gravity and geoid anomalies which will also vary with time.
As previous workers have done [e.g., McKenzie, 1978; Royden and Keen, 1980; Hellinger and Sclater, 1983], we uncouple the thermal problem associated with lithospheric extension from the mechanical or isostatic problem. We determine the temperature distribution with time in a slab of thickness h and separately calculate the isostatic response of the lithosphere to the changes in the lithospheric tempera- ture structure through time. This procedure is followed in the interest of mathematical expediency, and in most cases it does not lead to inaccurate results.
The temperature distribution T(x, z, t) for times t > 0 following extension can be written
Tm
r(x, z, t) = • z + r'(x, z, t) (A1) where T'(x, z, t) is the transient or anomalous temperature distribution, and Tmz/h is the steady state geotherm. We solve for T'(x, z, t) from the differential equation governing heat conduction in two-dimensions:
= K • + (A2) ot O x 2 •-z2 j
where K is thermal diffusivity. The boundary conditions for the top and bottom of the
slab are
r'(x, O, t)= r'(x, h, t)= 0 (A3)
Our treatment of the thermal problem associated with exten- sion differs from those previously published in that we explicitly consider a lithosphere with a nonequilibrium tem- perature gradient at the time of extension. Indeed it would be fortuitous if the lithosphere were in a condition of thermal equilibrium at the time of rifting. We approximate the nonequilibrium temperature gradient by Tm/a, where a, the

13,944 WEISSEL AND KARNER: FLEXURAL UPLIFT OF RIFT FLANKS
thermal thickness of the lithosphere at the time of extension, is less than h, the steady state thickness required in (A1). Thus the initial conditions T'(x, z, 0) for our two models for instantaneous extension of the lithosphere are given by
1. Normal faulting through the entire lithosphere (Figure 3):
T'(x,z, O)=• 1- O<z<a a
for x < 0 and x >- e o + a/tan 3'.
a
for 0_< x < e0.
+ x tan 3'
a<z<h
(A4a)
where
_ ! f_• - _ An*(X, t) 2(z. trt) l/2 An(x,)e (x x')2/4•tt dx'
=- z 1 - + e0 tan 3' a
(A7)
An(x ) are the coefficients of the Fourier sine series which describes the anomalous vertical temperature distribution at t = 0. These coefficients are found in the normal way from the initial conditions T'(x, z, 0) in (A4) or (A5), i.e., from
An(x) = • T'(x, z', 0) sin • dz' (A8)
1. For the normal faulting model (Figure 3), the expres- sions for An(x ) are
O<z-<a-xtan 3' 2Tm 1 h An(x) = { sin (n•tr a) } (A9a) (A4b) nrr nrra
a-x tan 3'<z-<h
(A4c)
0 < z < (x - e o) tan 3'
(x - e0) tan 3' < z -< a - e0 tan 3'
T'(x,z, 0)=Tm[1--•] a-e0tan 3'<z-<h for e0 -< x < a/tan 3'.
T'(x, z, 0) = 1 - 0 < z -< (x - e0) tan 3' a
(A4d)
T'(x, z, 0)= Tm[1- •] (x - eo) tan 3' < z-< h for a/tan 3'-< x < e0 + a/tan 3'.
2. General model for simple slip on a detachment with pure shear extension in the upper and lower plates (Figure 6):
(A5a)
(A5b)
T'(x, z, O) Tm[1 •] td(xO) a-- td(x•) = _ • <z<_h
(A5c)
The initial-boundary value problem (A2)-(A5) can be solved for T'(x, z, t) by the method of sources and sinks [Carslaw and Jaeger, 1958, chapter 10]. The solution can be written as
(A6) T ' ( x, z, t) = •'. A n*( X, t)e -n z' ,:t/h 2 sin • z n=l
An(x) 2Tm {x tan 3' 1 h nrr a nrra
x -< 0; x > e0 + a/tan
(A9b)
O<x•e o
t7)]}cos (-••L) (A10)
+ • - sin nrra
a h •
(nz' td•xO) ) 2rm cos h nrr
{(13L-J3) 13 [td(xO) /3r h •
2T•
An(x) = • COS • (X - e0) tan 3' nrr a
+ •- sin • (a - e0 tan 3') (A9c) nrra
e0 < x -< a/tan 3'
2Tm{a-(x-eo) tan3' (•z' An(x) = COS • (X -- e0) tan 3' nvr a
+ sin (x -- e0) tan 3' (A9d) nrra
a/tan 3' < x -< e0 + a/tan 3'
2. For the general model (Figure 6) involving slip along a detachment with pure shear in the upper and lower plates, the expression for An(x ) is
An(x) = sin nrr nrr a

WEISSEL AND KARNER.' FLEXURAL UPLIFT OF RIFT FLANKS 13,945
Thermal Phase Uplift/Subsidence: Local Isostasy
Consider the incremental change AT(x, z, t + At) in the temperature structure of the lithosphere over the time inter- val t to t + At. From (A6), this can be written
AT'(x, Z, t + At) = • [An*(X, t + At)e -n rr2•rAt/h n=l
- An*(X, t)]e -n2•r2gt/h sin • (All)
Because of the temperature dependence of density (see (3) and (4) in text), the incremental temperature change AT'(x, z, t + At) produces density changes so that the mass/unit area in columns of height h will change. Incremental subsid- ence or uplift A ST(X, t + At) will occur to balance these changes in a local or pointwise isostatic manner. This can be written
AST(X , t + At)= • p• Ar'(x, z', t + At) clz' Pa- Pw
f•,h ] + p,• Ar'(x, z', t + At) dz' (A12)
where t• is the new crustal thickness at x due to extension. Substituting (A 11), we find
-a o• h •.{ Asr(x, t+At)=•n • •C (P/n-P•) Pa -- Pw = 1 nrr
where C} is given by 2 2
C• = [A•(x, t + •t)e -n •2gAt/h --g•(x, t)]e -n2•2•t/h2 (A•4)
Note that the methodology given in (A12)-(A14) to deter- mine locally compensated, thermal phase uplift or subsid- ence differs from previous studies in that the temperature changes in the crust are explicitly considered in (A12). Most previous formulations treat the lithosphere as entirely of mantle composition and ignore the contribution of density changes in the crust to thermal phase subsidence.
The effect of lateral strength or flexural rigidity in the lithosphere is to redistribute the locally compensated sub- sidence or uplift, as we have discussed in the text. The locally compensated subsidence, or, equivalently, the isos- tatic restoring stresses, act as a normal load to a thin elastic plate overlying a fluid substratum. Thus, for each time increment t to t + At, the flexurally redistributed thermal subsidence Aw(x, t + At) is found from (cf. (6) in the text)
0X 2 [(pa-- Pw) g 0X 2 • AW(X)] q- AW(X) = AST(X ) (A15)
where A ST(X, t + At) is the incremental amount of thermal subsidence from (A12) and (A13).
In general, flexural rigidity D(x, t + At) varies laterally during thermal reequilibration of the lithosphere, and (A15) is solved using a finite difference approach developed by Bodine [1981]. Because flexural rigidity also varies tempo- rally, we need to calculate thermal phase subsidence or uplift incrementally with time. To show this, we will assume that at time t + At flexural rigidity does not vary spatially, so that (A15) can be solved algebraically in the Fourier transform domain (cf. (21)), or as a convolution operation in the space domain:
AW(X, t q- At)= AST(X' , t + At)ch(x- X', t + At) dx'
(A16a)
Aw(x, t + At) = AST(X, t + At).ch(x, t + At) (A16b)
where the asterisk in (A16b) symbolizes the convolution operation and 4• represents the flexural response of the lithosphere to an "impulsive" load; 4•(x) is the inverse Fourier transform of cI)(k), defined in (21).
Using the notation introduced in (A16b), we can express w(x, t'), the total, flexurally redistributed thermal subsid- ence at time t' after extension as
t/
w(x, t + t') = • A w(x, t +jAt) (A17) j=l
where t' - nat and t, the time at which extension occurred, is taken as t - 0 in the development that follows. We use the convolution representation for A w from (A16b) to rewrite (A17) as
w(x, t')= AST(X, At) ß oh(x, At) + AST(X, 2At)
Calculation of Thermal Phase Uplift/Subsidence for Finite Flexural Rigidity
The locally compensated initial (time t - 0) and thermal phase (t > 0) subsidence or uplift due to lithospheric extension can be obtained by the development in the text and in this appendix up to this point. In particular, for the thermal phase calculations, locally compensated subsidence or uplift for any time t' after extension can be obtained by letting t = 0 and A t = t' in (A11)-(A14). However, if the lithosphere has nonzero flexural rigidity that varies with time as the anomalous temperatures decay, the calculation of thermal phase subsidence or uplift must be done incremen- tally in time. The purpose of this section is to show why this is so.
ß •b(x, 2At) +... + AST(X , nat) * oh(x, nat) (A18)
We can also write an expression for the total locally compensated subsidence ST(X, t') at time t' since extension as a summation similar in form to (A18):
ST(X , t') = AST(X , At) + As•x, 2At) +'.. + AST(X , nat)
(A19)
We next assume that it is not necessary to calculate thermal phase subsidence incrementally, even though the flexural rigidity of the lithosphere varies with time. If we now use st(x, t') in (AI$) to find wt(x, t') its flexural equivalent and write wt(x, t') using (A16b) as
Wt(X, t')= St(X, t') * oh(X, t') (A20)

13,946 WEISSEL AND KARNER: FLEXURAL UPLIFT OF RIFT FLANKS
which, from (A19), can also be expressed as the summation:
wr(x, t') = Asr(x, At),c•(x, nat) + Asr(x, 2At)
ß c•(x, nat) +... + Asr(x, nat) ß c•(x, nat) (A21)
Comparing (A18) and (A21), it is apparent that w(x, t') and wr(x, t') are different when the flexural rigidity of the lithosphere varies with time. This result demonstrates that thermal phase subsidence needs to be calculated incremen- tally, since flexural rigidity will likely vary with time follow- ing extension if it is a function of the instantaneous temper- ature distribution. For our modeling, the time increments need only be "sufficiently" small, and we use time intervals of n 2 m.y., where n = 1-10.
The depth z(x, t') to the surface of the lithosphere at time t' since rifting is the sum of (1) w(x, t'), the thermal phase subsidence or uplift from (A18), (2) the initial subsidence or uplift wi(x, 0) found from (5a)-(5g) or (16) and (6), and (3) the topography Zo(X) related to a kinematic model for extension given in (2) or (15). When flexural rigidity varies temporally but not spatially, we can extend the summation notation given above to include wi(x, 0) and express z(x, t') as
t/
z(x, t') = Zo(X) + • As(x, jAt) * qb(x, jAt) j=0
(A22)
simple porosity-depth relation is that found empirically by Athy [1930]:
Ip(Z) = IpO e-kpz (B1)
where ½0 is the initial porosity (i.e., at z = 0) and kp is the porosity "decay" constant with depth. The compaction parameters (i.e., ½0 and k• -1) depend on the density of the fluid supporting the sediment matrix and are empirically obtained. Generally, the supporting fluid is either water or air.
Forward modeling of compaction requires that we can sspecify how the sediment load within a basin changes as a function of depth and time. Any column of compacting sediment z0 can be separated into two components: (1) the equivalent thickness of sediment grains with density Ps, given by
fO Zø h sediment grains = (1 -- ½(Z)) dz (B2)
and (2) the thickness of the supporting fluid with density Pfluid, given by
hfluid-- Z0- hsediment grains (B3)
The total pressure (or load) acting on thes lithosphere due to this column of compacting sediment is therefore
APPENDIX B
This appendix deals with the forward modeling of sedi- ment compaction and its effects on the rift flank uplift. Flexurally uplifted rift-flank topography due to mechanical unloading of the lithosphere during extension represents a permanent deformation. Its destruction, therefore, must be related to factors essentially unrelated to the rifting process. Both the loading effects of sediment infill and erosion are potential candidates for the destruction of uplifted rift flanks. However, the sediment infill in a basin is a function of depth due to compaction. Therefore we need to model the chang- ing infill load, as it relates to compaction, if we expect to predict the resultant magnitude of any rift flank topography. Note that the forward modeling of compaction presented here is new and differs from previous studies [e.g., Sclater and Christie, 1980]. Previous workers dealt solely with the conceptual process of decompaction (i.e., sediments do not in fact decompact when the overburden is removed). While the same physics is embodied in the "mass equations" (cf. equation (B2)), the forward modeling of compaction repre- sents a nonlinear process in that sediment deposition at any time modifies the thickness of all older stratigraphic units and increases the space available for sedimentation. We link this approach to the sediment infilling of the subsidence engendered by extension. Another important and rarely appreciated aspect of sediment compaction is that the grav- ity anomaly over a basin is sensitive to the compaction characteristics of the sediment infill (P. A. Cowie and G. D. Karner, unpublished manuscript, 1989).
The sediment load within a basin is a function of sediment
porosity ½(z). As sediments fill a basin, they will do so in such a way as to maintain a porosity-depth profile. In general, ½(z) is primarily a function of depth, but it also depends on lithology, the degree of overpressuring and underpressuring, and diagenetic history. An example of a
P s gh sediment grains q- P fluid ghfluid
If Pfluid is the same as Pw (i.e., the material overlying the lithosphere), then the isostatic effect of the pore fluid has already been included in the determination of the tectonic subsidence. In this case, the effective load infilling the basin is simply
p s gh sediment grains
Equations (B1)-(B3) form the basis for our forward mod- eling of the compaction process. Two problems need to be addressed: (1) What is the total thickness of sediment grains infilling the basin for a given time interval and hence loading the basement, and (2) for any one time interval, how does the underlying sediment compact and thereby increase the avail- able space for further sedimentation?
Sediment Infilling
Single time step. Consider a water-filled depression, depth Zhole- If we were to fill this hole with sediment, then the equivalent thickness of sediment grains within the column actually loading the lithosphere is given by (B2), which becomes on substituting for ½(z) (equation (B1)):
hsediment grains• = Zhole- IP0[1 -- e-kpZhø'½]/kp (B4)
Filling Zhole with sediment, however, flexurally depresses the basement by an amount, Aft:
A fl = [(Ps - P w) qb/ (p m - P w)] * h sediment grains• (US)
where Pa and Pw are the asthenosphere and displaced densities, respectively, •b is the flexural isostatic response of the lithosphere to loading, and the asterisk is the convolution operation. This additional subsidence will fill with sediment according to the same porosity law and, in doing so, com-

WEISSEL AND KARNER: FLEXURAL UPLIFT OF RIFT FLANKS 13,947
V=Vo e Vo =100% 4 k• 1 = 0 km
b)
4 •o = 0% kp -1 = 0 km Ps = 2650 kg/m 3
c)
%,x • • •: 60% 4 • k/• = 2.5 km
Fig. B1. The effect on uplifted rift flanks when the adjacent basin is infilled with compacting sediments. Three model stratigraphies at time t - 100 m.y. after extension are shown in Figures Bla-Blc for different values of the parameters in the simple porosity-depth function shown at the top left [Athy, 1930]. Parameter ½0 denotes the porosity of the surface sediment, Ps is the sediment grain density, and k v governs how quickly porosity decreases with depth. Notice in Figure Blb that the flank topography is completely pulled down if sediment of high bulk density is allowed to infill the basin. The profile in Figure Bla is the same as in Figure 9 (bottom left) drawn with half the vertical exaggeration.
pacts the underlying sediments. The problem now is to determine the equivalent thickness of sediment grains that will infill Af• given that ½(z) is maintained throughout the sediment column. The total thickness of sediment grains contained in Zhole q- Afl is
hsediment grains 2 = (Zhole + Afl) -- tP0/k [1 - e -kv(zhø•e +/xf,)] (B6)
The incremental sediment load (hsediment grains2 -- hsediment grains•) flexurally depresses the basement creating an additional subsidence A f2. This procedure, of sediment- induced loading, subsidence, compaction, and subsequent infilling, is repeated until convergence is reached using an appropriate criterion (e.g., when the incremental flexural subsidence is <10 m). The total sedimentary thickness for a given time interval is therefore
Ztotal-- Zhole q- Z Aft' i=1
(B7)
where n defines the number of iterations until convergence is reached.
Multiple time steps. For the single time step considered above, the problem is one of calculating the additional basement subsidence induced by sediment loading as the column compacts: only the basement itself needed to be
tracked with time. In contrast, for incremental time steps, it is necessary to track not only the basement but also each interface between the various stratigraphic units.
Once a unit is deposited, the thickness of sediment grains (equivalently its mass) will remain constant, regardless of the degree of compaction. The total thickness of sediment grains in a stratigraphic unit defined by Ztop and Zbottom is
Zbottom h sediment grain s = (1 -- ½(Z)) dz (B8) ß d Ztop
which, on integration using (B 1), gives
hsediment grains = (Zbottom- Ztop) q- tPO[ e-kvzbøttøm -- e-kvztøp]/kp (B9)
The unit thickness at any other depth can therefore be calculated using the iterative equation
Zbottom q- ( tP 0 e -kv Zbottom)/kp
= Ztopq-(tPoe-kvztøp)/kp+hsediment grains (BI0)
where Zto p is usually given and Zbottom is to be calculated. To forward model compaction, it is important to keep in mind that sediment is allowed to accumulate in two ways: (1) primary sedimentation associated with the tectonic subsid- ence of the basement, and (2) secondary sedimentation associated with compaction of the sediment column.
13,948 WEISSEL AND KARNER: FLEXURAL UPLIFT OF RIFT FLANKS
Consider three interfaces, Zb, Zseds, and Zsur•, bounding two stratigraphic units where b, seds, and surf initially refer to the basement/sediment, sediment/sediment, and sedi- ment/surface interfaces. We wish to add a third unit. Now, the tectonic subsidence A s• over a given time interval causes the basement to subside to a new depth, z0 + As•. The sediment/sediment and sediment/surface interfaces Zseds and Zsur• will subside to Zseds + Asl and Zsur• + Asl, respectively, in sympathy with the basement. By using (B9) to determine the equivalent thickness of sediment within each unit, the new basement depth (Zb + As•), and equation (B10), it is possible to first calculate the new position of Zseds and then the new position of Zsur• (which will no longer be at the surface). The new "hole," Zsur•, will be greater than the original tectonic subsidence A s• because of the effects of compaction. The sediment deposited into this depression will also follow a given porosity law. Again however, any sediment infill will flexurally load the basement, inducing yet further subsidence All. The method so far has been to repeat steps (B6)-(B9). Following the infilling of this sediment- induced subsidence, the entire process must be repeated. That is, given a new position for the basement induced by sediment loading, new positions need to be calculated for each sediment/sediment interface through the column, lead- ing to the creation of yet further compaction-induced sub- sidence at the surface. Iteration continues until the user-
defined convergence criterion has been reached. For the next time interval, the driving subsidence initiates the entire iteration process again and, over the life of the tectonic subsidence, produces a stratigraphic column.
To forward model compaction within an evolving sedi- mentary basin (e.g., the basin shown in Figure 9), it is necessary to repeat the above analysis over the region of basin development (Figure B 1). In Figure B 1, we illustrate the effect of varying the compaction parameters and the effect on the magnitude of the rift flank topography. Initially, we set ½0 to 100%, implying that the sediment fill is entirely the supporting fluid. The resulting time line stratigraphy (Figure B la) showing basement subsidence with time is a useful "null" experiment with which to compare and con- trast results for ½0 > 0. For ½0 = 0%, the sediment grain density and bulk sediment density are the same. As can be seen in Figure B lb, the •2 km rift flank uplift has decreased to the extent that the flanks have become part of the basinal area. Such a situation, that of ½0 = 0%, is the usual assumption used in the modeling of basin stratigraphy [e.g., Watts et al., 1982; Sawyer et al., 1982] except that Ps is assumed constant and in the range 2.2-2.5 g/cm3.
For the general case of ½0 > 0 and k• -1 > 0, however, the resultant rift flank topography is intermediate between Fig- ures B l a and B lb. In particular, Figure B l c, using repre- sentative compaction parameters of ½0 = 60% and k• -1 = 2.5 km, predicts a rift flank uplift of 1.5 km 100 m.y. after rifting. In addition to diminishing flank uplift, compaction also significantly modifies the time line stratigraphy, especially that of the rift phase and early thermal phase sediments. From Figure B 1, we conclude that (1) the loading effect of sediment infill can have a major effect in reducing the magnitude of rift flank topography, and (2) compaction significantly modifies the rift to postrift sediment thickness ratios.
Acknowledgments. This paper benefited from numerous discus- sions with our colleagues which have helped to clarify our thoughts and, sometimes, made us even more determined to adhere to our convictions. We particularly want to thank R. E. Bell, W. R. Buck, J. F. Dewey, N. W. Driscoll, C. J. Ebinger, N.J. Kusznir, M.S. Steckler, and I. Vann for many hours of fruitful discussions. We also thank M. A. Etheridge and G. S. Lister for sharing work in advance of publication. D. E. Hayes, L. Royden, R. S. Stein, W. R. Buck, an Associate Editor, and an anonymous reviewer critically reviewed the manuscript and their comments are appreciated. Major support of this work was by Office of Naval Research contracts N00014- 84-C-0132 and N00014-87-K-0204 and National Science Foundation
grant OCE 85-16918. G.D.K. acknowledges early support by the Durham University Research Foundation and the Society of Fel- lows during a Postdoctoral Fellowship at the University of Durham, England. Lamont-Doherty Geological Observatory contribution 4514.
REFERENCES
Allmendinger, R. W., J. W. Sharp, D. Von Tish, L. Serpa, S. Kaufman, J. Oliver, and R. B. Smith, Cenozoic and Mesozoic structure of the eastern Basin and Range Province, Utah, from COCORP seismic reflection data, Geology, 11,532-536, 1983.
Alvarez, F., J. Virieux, and X. Le Pichon, Thermal consequences of lithosphere extension: The initial stretching phase, Geophys. J. R. Astron. Soc., 78, 389-411, 1984.
Athy, L. F., Density, porosity and compaction of sedimentary rocks, Am. Assoc. Pet. Geol. Bull., 14, 1-24, 1930.
Barton, P., and R. Wood, Tectonic evolution of the North Sea basin: Crustal stretching and subsidence, Geophys. J. R. Astron. Soc., 79, 987-1022, 1984.
Beaumont, C., C. E. Keen, and R. Boutilier, Foreland and rift margin sedimentary basins, Philos. Trans. R. Soc. London, Ser. A, 305,295-318, 1982.
Bodine, J. H., Numerical computation of plate flexure in marine geophysics, Tech. Rep. 1, 153 pp., Columbia Univ., New York, 1981.
Bodine, J. H., M. S. Steckler, and A. B. Watts, Observations of flexure and the rheology of the oceanic lithosphere, J. Geophys. Res., 86, 3695-3707, 1981.
Bott, M. H. P., Formation of sedimentary basins of graben type by extension of the continental crust, Tectonophysics, 36, 77-86, 1976.
Bracey, D. R., Geophysics and tectonic development of the Car- oline basin, Tech. Rep. TR-283, Nav. Oceanogr. Office, Bay St. Louis, Miss., 1983.
Bracey, D. R., and J. E. Andrews, Western Caroline Ridge: Relic island arc?, Mar. Geophys. Res., 2, 111-125, 1974.
Braun, J., and C. Beaumont, A physical explanation for the relation between flank uplifts and the breakup unconformity at rifted continental margins, Geology, in press, 1989.
Buck, W. R., Small-scale convection induced by passive rifting: The cause for uplift of rift shoulders, Earth Planet. Sci. Lett., 77, 362-372, 1986.
Buck, W. R., F. Martinez, M. S. Steckler, and J. R. Cochran, Thermal consequences of lithospheric extension: Pure and sim- ple, Tectonics, 7, 213-234, 1988.
Bullard, E. C., Gravity measurements in East Africa, Philos. Trans. R. Soc. London, Ser. A, 235,445-531, 1936.
Burgess, C. F., B. R. Rosendahl, S. Sander, C. A. Burgess, J. Lambiase, S. Derksen, and N. Meader, The structural and stratigraphic evolution of Lake Tanganyika: A case study of continental rsifting, Am. Assoc. Pet. Geol. Spec. Publ., in press, 1989.
Carslaw, H. S., and J. C. Jaeger, Conduction of Heat in Solids, 510 pp., Oxford University Press, Oxford, 1959.
Chadwick, R. A., Upper Jurassic to Cretaceous sedimentation and subsidence, in Atlas of Onshore Sedimentary Basins in England and Wales: Post-Carboniferous Tectonics and Stratigraphy, ed- ited by A. Whittaker, pp. 49-52, Blackie, Glasgow, 1985.
Cochran, J. R., Effects of finite extension times on the development of sedimentary basins, Earth Planet. Sci. Lett., 66,289-302, 1983.
Coudert, E., B. L. Isacks, M. Barazangi, R. Louat, R. Caldwell, A. Chen, J. Dubois, G. Latham, and B. Pontoise, Spatial distribution and mechanisms of earthquakes in the southern New Hebrides

WEISSEL AND KARNER: FLEXURAL UPLIFT OF RIFT FLANKS 13,949
Arc from a temporary land and ocean bottom seismic network and from worldwide observations, J. Geophys. Res., 86, 5905-5925, 1981.
Cox, K. G., A model for flood basalt vulcanism, J. Petrol., 21, 629-650, 1980.
Daniel, J., Morphologie et structures superficielles de la partie sud de la zone de subduction des Nouvelles-H6brides, in Contribution a l'Etude Gdodynamics du sud-ouest Pacifique, pp. 36-60, Office de la Recherche Scientifique et Technique Outre-Mer, Paris, 1982.
Davies, T. A., et al., Site 255, Initial Rep. Deep Sea Drill. Proj., 26, 281-294, 1974.
de Charpal, O., P. Guennoc, L. Montadert, and D. G. Roberts, Rifting, crustal attenuation, and subsidence in the Bay of Biscay, Nature, 275,706-711, 1978.
Doebl, F., and W. Olbrecht, An isobath map of the Tertiary base in the Rhine Graben, in Approaches to Taphrogenesis, edited by J. H. Illies and K. Fuchs, pp. 71-72, Schweizerbart'sche Verlagso buchhandlung, Stuttgart, 1974.
Driscoll, N. W., G. D. Karner, and J. K. Weissel, Evidence from seismic stratigraphy for the tectonic development of Broken Ridge, southeast Indian Ridge, Proc. Ocean Drill. Program Initial Rep., 121, in press, 1989.
Ebinger, C. J., B. R. Rosendahl, and D. Reynolds, Tectonic model of the Malawi rift, Africa, Tectonophysics, 141,215-235, 1987.
Ewart, A., K. Baxter, and J. A. Ross, The petrology and petroge- neis of the Tertiary anorogenic mafic lavas of southern and central Queensland, AustraliamPossible implications for crustal thicken- ing, Contrib. Mineral. Petrol., 75, 129-152, 1980.
Fischer, A. G., et al., Initial Report of the Deep Sea Drilling Program, vol. 6, 1329 pp., U.S. Government Printing Office, Washington, D.C., 1971.
Fornari, D. J., J. K. Weissel, M. R. Perfit, and R. N. Anderson, Petrochemistry of the Sorol and Ayu troughs: Implications for crustal accretion at the northern and western boundaries of the
Caroline plate, Earth Planet. Sci. Lett., 45, 1-15, 1979. Fowler, S., and D. P. McKenzie, Flexural studies of the Exmouth
and Rockall Plateux using SEASAT altimetry, Basin Res., in spress, 1989.
Gibbs, A.D., Structural evolution of extensional basin margins, J. Geol. Soc. London, 141,609-620, 1984.
Gregory, J. W., The Great Rift Valley, 424 pp., John Murray, London, 1896.
Heiskanen, W. A., and F. A. Vening Meinesz, The Earth and Its Gravity Field, 470 pp., McGraw-Hill, New York, 1958.
Hellinger, S. J., and J. G. Sclater, Some remarks on two-layer extensional models for the evolution of sedimentary basins, J. Geophys. Res., 88, 8251-8269, 1983.
Illies, J. H., Graben tectonics as related to crust-mantle interaction, in Graben Problems, edited by J. H. Illies and S. Mueller, pp. 4-26, E. Schweizerbart'sche Verlagsbuchhandlung, Stuttgart, 1970.
Illies, J. H., Taphrogenesis and Plate Tectonics, in Approaches to Taphrogenesis, edited by J. H. Illies and K. Fuchs, pp. 433-460, E. Schweizerbart'sche Verlagsbuchhandlung, Stuttgart, 1974.
Illies, J. H., and G. Greiner, Rhinegraben and the Alpine system, Geol. Soc. Am. Bull., 89, 770-782, 1978.
Issler, D., H. McQueen, and C. Beaumont, Thermal and isostatic consequences of simple shear extension of the continental litho- sphere, Earth Planet. Sci. Lett., 91,341-358, 1989.
Jackson, J. A., and D. P. McKenzie, The geometrical evolution of normal fault systems, J. Struct. Geol., 13, 189-193, 1983.
Kahle, H.oG., and D. Werner, A geophysical study of the Rhineø graben, II, Gravity anomalies and geothermal implications, Geoo phys. J. R. Astron. Soc., 62, 631-647, 1980.
Karig, D. E., and J. Mammerickx, Tectonic framework of the New Hebrides Island Arc, Mar. Geol., 12, 187-205, 1972.
Karner, G. D., and A. B. Watts, Gravity anomalies and flexure of the lithosphere at mountain ranges, J. Geophys. Res., 88, 10,449- 10,477, 1983.
Keen, C. E., The dynamics of rifting: Deformation of the litho- sphere by active and passive driving forces, Geophys. J. R. Astron. Soc., 80, 95-120, 1985.
King, G. C. P., R. S. Stein, and J. B. Rundle, The growth of geological structures by repeated earthquakes, 1, Conceptual framework, J. Geophys. Res., 93, 13,307-13,318, 1988.
Kligfield, R., J. Crespi, S. Naruk, and G. H. Davis, Displacement
and strain patterns of extensional orogens, Tectonics, 3,577-609, 1984.
Kusznir, N., and G. D. Karner, Dependence of the flexural rigidity sof the continental lithosphere on rheology and temperature, Nature, 316, 138-142, 1985.
Kusznir, N.J., and R. G. Park, The extensional strength of the continental lithosphere: Its dependence on geothermal gradient, crustal composition and thickness, Continental Extensional Tec- tonics, edited by M.P. Coward, J. F. Dewey, and P. L. Hancock, Spec. Publ. Geol. Soc. London, 28, 35-52, 1987.
Kusznir, N.J., G. D. Karner, and S. Egan, Geometric, thermal and isostatic consequences of lithospheric extension using low angle faults and detachments, Basins of Eastern Canada and World- wide Analogues, edited by C. Beaumont and A. J. Tankard, Mem. Can. Soc. Petrol. Geol., 12, 185-203, 1987.
Lake, S. D., and G. D. Karner, The structure and evolution of the Wessex basin, southern England: An example of inversion tec- tonics, Tectonophysics, 137, 347-378, 1987.
Lister, G. S., M. A. Etheridge, and P. A. Symonds, Detachment faulting and the evolution of passive continental margins, Geol- ogy, 14, 246-250, 1986.
MacKenzie, K., Crustal stratigraphy and realistic seismic data, Ph.D. thesis, 121 pp., Univ. of Calif., San Diego, 1984.
McKenzie, D. P., Some remarks on the development of sedimentary basins, Earth Planet. Sci. Lett., 40, 25-32, 1978.
McKenzie, D. P., A possible mechanism for epeirogenic uplift, Nature, 307, 616-618, 1984.
McKenzie, D. P., and M. J. Bickle, The volume and composition of melt generated by extension of the lithosphere, J. Petrol., 29, 625-679, 1988.
McKenzie, D. P., and J. G. Sclater, The evolution of the Indian Ocean since the late Cretaceous, Geophys. J. R. Astron. Soc., 25, 437-528, 1971.
McNutt, M. K., Lithospheric flexure and thermal anomalies, J. Geophys. Res., 89, 11,180-11,194, 1984.
Morgan, P., F. K. Boulos, S. F. Hennin, A. A. EloSherif, A. A. EloSayed, N. Z. Basta, and Y. S. Melek, Heat flow in eastern Egypt: The thermal signature of a continental breakup, J. Geo- dyn., 4, 107-131, 1985.
Morgan, W. J., Hotspot tracks and the opening of the Atlantic and Indian Oceans, in The Sea, vol. 7, The Oceanic Lithosphere, edited by O. Miliani, pp. 443-487, John Wiley, New York, 1981.
Mudford, B. S., A quantitative analysis of lithospheric subsidence due to thinning by simple shear, Can. J. Earth Sci., 25, 20-29, 1988.
Mueller, S., Geophysical aspects of graben formation in continental rift systems, in Graben Problems, edited by J. H. Illies and S. Mueller, pp. 27-36, E. Schweizerbart' sche Verlagsbuchhandlung, Stuttgart, 1970.
Mueller, S., and L. Rybach, Crustal dynamics in the central part of the Rhinegraben, in Approaches to Taphrogenesis, edited by J. H. Illies and K. Fuchs, pp. 379-388, E. Schweizerbart'sche Verlagso buchhandlung, Stuttgart, 1974.
Mutter, J. C., and S.C. Cande, The early opening between Broken Ridge and Kerguelen Plateau, Earth Planet. Sci. Lett., 65, 369- 376, 1983.
Mutter, J. C., W. R. Buck and C. M. Zehnder, Convective partial melting, 1, A model for tfi• formation of thick basaltic sequences during the initiation of spreading, J. Geophys. Res., 93, 1031- 1048, 1988.
National Geophysical Data Center, Relief of the surface of the Earth, Rep. MGG-2, World Data Cent. A for Mar. Geol., and Geophys., Natl. Geophys. Data Cent., Boulder, Colo., 1985.
Owens, T. J., Normal faulting and flexure in an elastic-perfectly plastic plate, Tectonophysics, 93, 129-150, 1983.
Parmentier, E. M., Dynamic topography in rift zones: Implications for lithospheric heating, Philos. Trans. R. Soc. London, Ser. A, 321, 23-25, 1987.
Perfit, M. R., and D. J. Fornari, Mineralogy and geochemistry of volcanic and plutonic rocks from the boundaries of the Caroline plate: Tectonic implications, Tectonophysics, 87, 279-313, 1982.
Ranken, B., R. K. Caldwell, and D. E. Caldwell, Kinematics of the Philippine Sea plate, Tectonics, 3, 555-576, !984.
Ratcliffe, N.M., and W. C. Burton, Fault reactivation models for the origin of the Newark basin and studies related to eastern U.S. seismicity, edited by G. P. Robinson and A. J. Froelich, Proceed-

13,950 WEISSEL AND KARNER: FLEXURAL UPLIFT OF RIFT FLANKS
ings of the Second U.S. Geological Survey Workshop on the Early Mesozoic Basins of the Eastern United States, U.S. Geol. $urv. Circ., 946, 36-45, 1985.
Recy, J., et al., Tectonique et volcanisme sous-marine h l'arri•re de l'arc des Nouvelles-H6,brides (Vanuatu, Pacifique sud-ouest): R6sultats pr61iminaires de la campagne SEAPSO leg II du N/O Jean-Charcot, C. R. Acad. $ci., $er. 2,303,685-690, 1986.
Ridley, W. I., J. M. Rhodes, A.M. Reid, P. Jakes, C. Shih, and M. N. Bass, Basalts from leg 6 of the Deep Sea Drilling Project, J. Petrol., 15, 140-159, 1974.
Rosendahl, B. R., Architecture of continental rifts with special reference to East Africa, Annu. Rev. Earth Planet. Sci., 15, 445-503, 1987.
Royden, L., and C. E. Keen, Rifting processes and thermal evolu- tion of the continental margin of eastern Canada determined from subsidence curves, Earth Planet. $ci. Lett., 51,343-361, 1980.
Rundle, J. B., Viscoelastic-gravitational deformation by a rectangu- lar thrust fault in a layered earth, J. Geophys. Res., 87, 7787-7796, 1982.
Savage, J. C., and G. Gu, A plate flexure approximation to post- seismic and interseismic deformation, J. Geophys. Res., 90, 8570-8580, 1985.
Scientific Staff Leg 121, A tale of two ridges, Nature, 335,593-594, 1988.
Sclater, J. G., and B. Celerier, Extensional models for the formation of sedimentary basins and continental margins, Nor. Geol. Tiosskr., in press, 1989.
Sclater, J. G., and P. A. Christie, Continental stretching: An explanation of the post Mid-Cretaceous subsidence of the Central North Sea basin, J. Geophys. Res., 85, 3711-3739, 1980.
Seng6r, A.M. C., and K. Burke, Relative timing of rifting and volcanism on Earth and its tectonic implications, Geophys. Res. Lett., 5,419-421, 1978.
Sleep, N.H., Thermal effects of the formation of Atlantic continen- tal margins by continental breakup, Geophys. J. R. Astron. Soc., 24, 325-350, 1971.
Steckler, M. S., Uplift and extension at the Gulf of Suez: Indications of induced mantle convection, Nature, 317, 135-139, 1985.
Steckler, M. S., F. Berthelot, N. Lyberis, and X. Le Pichon, Subsidence in the Gulf of Suez: Implications for rifting and plate kinematics, Tectonophysics, 153,249-270, 1988a.
Steckler, M. S., A. B. Watts, and J. A. Thorne, Subsidence and basin modeling at the U.S. Atlantic passive margin, in The Atlantic Continental Margin, The Geology of North America, vol. I-2, edited by R. E. Sheridan and J. A. Grow, U.S. Geological Society of America, Reston, Va., 1988b.
Stein, R. S., G. C. P. King, and J. B. Rundle, The growth of geological structures by repeated earthquakes, 2, Field examples of continental dip-slip faults, J. Geophys. Res., 93, 13,319-13,331, 1988.
Stern, T. A., and F. J. Davey, Flexure of continental lithosphere associated with the isostatic loading of Ross Island Archipelago, Victoria Island, Antarctica, Eos Trans. AGU, 68, 1465, 1987.
Suess, E., Die Brueche des ostlichen Afrikas, Dekschr. Akad. Wiss. Wien, 553, 1-580, 1891.
Swanson, M. T., Preexisting fault control for Mesozoic basin formation in eastern North America, Geology, 14,419-422, 1986.
Turcotte, D. L., J. L. Ahern, and J. M. Bird, Thermal and mechanical evolution of the Michigan basin, Tectonophysics, 36, 57-75, 1977.
Vening Meinesz, F. A., Les Grabens Africans resultant de compres- sion ou de tension dans la cr6ute terrestre?, Inst. R. Kolonial Belge Bull., 21,539-552, 1950.
Villemin, T., F. Alvarez, and J. Angelier, The Rhinegraben: Exten- sion, subsidence and shoulder uplift, Tectonophysics, 128, 47-59, 1986.
Voorhoeve, H., and G. Houseman, The thermal evolution of lithosphere extending on a low-angle detachment zone, Basin Res., 1, 1-10, 1988.
Watts, A. B., Gravity anomalies, crustal structure and flexure of the lithosphere at the Baltimore Canyon Trough, Earth Planet. Sci. Lett., 89, 221-238, 1988.
Watts, A. B., and J. A. Thorne, Tectonics, global changes in sea level and their relationship to stratigraphical sequences at the U.S. Atlantic continental margin, Mar. Pet. Geol., 1, 319-339, 1984.
Watts, A. B., J. H. Bodine, and M. S. Steckler, Observations of flexure and the state of stress in the oceanic lithosphere, J. Geophys. Res., 85, 6369-6376, 1980.
Watts, A. B., G. D. Karner, and M. S. Steckler, Lithospheric flexure and the evolution of sedimentary basins, Philos. Trans. R. $oc. London, $er. A, 305, 249-281, 1982.
Weissel, J. K., and R. N. Anderson, Is there a Caroline plate?, Earth Planet. $ci. Lett., 41, 143-158, 1978.
Wernicke, B., Uniform-sense normal simple shear of the continental lithosphere, Can. J. Earth $ci., 22, 108-125, 1985.
Wernicke, B., and B. C. Burchfiel, Modes of extensional tectonics, J. $truct. Geol., 4, 213-246, 1982.
White, N.J., and D. P. McKenzie, Formation of the "steer's head" geometry of sedimentary basins by differential stretching of the crust and mantle, Geology, 16, 250-253, 1988.
White, N.J., J. A. Jackson, and D. P. McKenzie, The relationship between the geometry of normal faults and that of the sedimentary layers in their hanging walls, J. $truct. Geol., 8, 897-909, 1986.
White, R. S., G. D. Spence, S. R. Fowler, D. P. McKenzie, G. K. Westbrook, and A. N. Bowen, Magmatism at rifted continental margins, Nature, 330, 439-444, 1987.
Williams, G. D., and I. Vann, The geometry of listric normal faults and deformation in their hanging walls, J. Struct. Geol., 9, 789-795, 1987.
Zandt, G., and T. J. Owens, Crustal flexure associated with normal faulting and implications for seismicity along the Wasatch Front, Utah, Bull. $eismol. $oc. Am., 70, 1501-1520, 1980.
Ziegler, P. A., Geological Atlas of Western and Central Europe, 130 pp., Amsterdam, 1982.
Zuber, M. T., and E. M. Parmentier, Lithospheric necking: A dynamic model for rift morphology, Earth Planet. Sci. Lett., 77, 373-383, 1986.
G. D. Karner and J. K. Weissel, Lamont-Doherty Geological Observatory, Palisades, NY 10964.
(Received May 9, 1988; revised March 6, 1989;
accepted May 23, 1989.)
Copyright © 2022 FDOKUMEN