Shear-driven and diffusive helicity fluxes in alphaOmega dynamos
Upload
independentCategory
view
0download
0
arX
iv:0
905.
2828
v1 [
hep-
ex]
18
May
200
9EUROPEAN ORGANIZATION FOR NUCLEAR RESEARCH
CERN–PH–EP/2009–0089 April 2009
Flavour Separation of Helicity Distributions
from Deep Inelastic Muon–Deuteron Scattering
COMPASS Collaboration
Abstract
We present a LO evaluation of helicity densities of valence, ∆uv+∆dv, non-strange sea, ∆u+∆d,and strange quarks, ∆s (assumed to be equal to ∆s). They have been obtained from the inclusiveasymmetry A1,d and the semi-inclusive asymmetries Aπ+
1,d , Aπ−
1,d , AK+1,d , AK−
1,d measured in polariseddeep inelastic muon-deuteron scattering. The full deuteron statistics of COMPASS (years 2002–2004and 2006) has been used. The data cover the range Q2 > 1 (GeV/c)2 and 0.004 < x < 0.3. Both non-strange densities are found to be in a good agreement with previous measurements. The distributionof ∆s(x) is compatible with zero in the whole measured range, in contrast to the shape of the strangequark helicity distribution obtained in most LO and NLO QCD fits. The sensitivity of the values of∆s(x) upon the choice of fragmentation functions used in the derivation is discussed.
Keywords: COMPASS; double-spin asymmetry; helicity density; parton distribution function; flavour sep-aration analysis; polarised DIS and SIDIS reactions; charged kaon asymmetry
PACS: 13.60.Hb, 13.60.Le, 13.88+e
submitted to Physics Letters

COMPASS Collaboration
M. Alekseev30), V.Yu. Alexakhin8), Yu. Alexandrov16), G.D. Alexeev8), A. Amoroso28), A. Austregisilio11,18),B. Bade lek31), F. Balestra28), J. Ball23), J. Barth4), G. Baum1), Y. Bedfer23), J. Bernhard14), R. Bertini28),M. Bettinelli17), R. Birsa25), J. Bisplinghoff3), P. Bordalo13,a), F. Bradamante26), A. Bravar25), A. Bressan26),G. Brona31), E. Burtin23), M.P. Bussa28), A. Chapiro27), M. Chiosso28), S.U. Chung18), A. Cicuttin25,27),M. Colantoni29), M.L. Crespo25,27), S. Dalla Torre25), T. Dafni23), S. Das7), S.S. Dasgupta6), O.Yu. Denisov29,b),L. Dhara7), V. Diaz25,27), A.M. Dinkelbach18), S.V. Donskov22), N. Doshita2,33), V. Duic26), W. Dunnweber17),A. Efremov8), A. El Alaoui23), P.D. Eversheim3), W. Eyrich9), M. Faessler17), A. Ferrero28,11), M. Finger20),M. Finger jr.8), H. Fischer10), C. Franco13), J.M. Friedrich18), R. Garfagnini28), F. Gautheron1), O.P.Gavrichtchouk8), R. Gazda31), S. Gerassimov16,18), R. Geyer17), M. Giorgi26), B. Gobbo25), S. Goertz2,4),S. Grabmuller18), O.A. Grajek31), A. Grasso28), B. Grube18), R. Gushterski8), A. Guskov8), F. Haas18),R. Hagemann10), D. von Harrach14), T. Hasegawa15), J. Heckmann2), F.H. Heinsius10), R. Hermann14),F. Herrmann10), C. Heß2), F. Hinterberger3), N. Horikawa19,c), Ch. Hoppner18), N. d’Hose23), C. Ilgner11,17),S. Ishimoto19,d), O. Ivanov8), Yu. Ivanshin8), T. Iwata33), R. Jahn3), P. Jasinski14), G. Jegou23), R. Joosten3),E. Kabuß14), W. Kafer10), D. Kang10), B. Ketzer18), G.V. Khaustov22), Yu.A. Khokhlov22), J. Kiefer10),Yu. Kisselev1,2), F. Klein4), K. Klimaszewski31), S. Koblitz14), J.H. Koivuniemi2), V.N. Kolosov22),E.V. Komissarov8,+), K. Kondo2,33), K. Konigsmann10), R. Konopka18), I. Konorov16,18), V.F. Konstantinov22),A. Korzenev14,b), A.M. Kotzinian8,23), O. Kouznetsov8,23), K. Kowalik31,23), M. Kramer18), A. Kral21),Z.V. Kroumchtein8), R. Kuhn18), F. Kunne23), K. Kurek31), J.M. Le Goff23), A.A. Lednev22), A. Lehmann9),S. Levorato26), J. Lichtenstadt24), T. Liska21), A. Maggiora29), M. Maggiora28), A. Magnon23), G.K. Mallot11),A. Mann18), C. Marchand23), J. Marroncle23), A. Martin26), J. Marzec32), F. Massmann3), T. Matsuda15),A.N. Maximov8,+), W. Meyer2), T. Michigami33), Yu.V. Mikhailov22), M.A. Moinester24), A. Mutter10,14),A. Nagaytsev8), T. Nagel18), J. Nassalski31), S. Negrini3), F. Nerling10), S. Neubert18), D. Neyret23),V.I. Nikolaenko22), A.G. Olshevsky8), M. Ostrick4,14), A. Padee32), R. Panknin4), D. Panzieri30), B. Parsamyan28),S. Paul18), B. Pawlukiewicz-Kaminska31), E. Perevalova8), G. Pesaro26), D.V. Peshekhonov8), G. Piragino28),S. Platchkov23), J. Pochodzalla14), J. Polak12,26), V.A. Polyakov22), G. Pontecorvo8), J. Pretz4), C. Quintans13),J.-F. Rajotte17), S. Ramos13,a), V. Rapatsky8), G. Reicherz2), D. Reggiani11), A. Richter9), F. Robinet23),E. Rocco28), E. Rondio31), D.I. Ryabchikov22), V.D. Samoylenko22), A. Sandacz31), H. Santos13,a), M.G.Sapozhnikov8), S. Sarkar7), I.A. Savin8), G. Sbrizza26), P. Schiavon26), C. Schill10), L. Schmitt18,e),W. Schroder9), O.Yu. Shevchenko8), H.-W. Siebert14), L. Silva13), L. Sinha7), A.N. Sissakian8), M. Slunecka8),G.I. Smirnov8), S. Sosio28), F. Sozzi26), A. Srnka5), M. Stolarski31,11), M. Sulc12), R. Sulej32), S. Takekawa26),S. Tessaro25), F. Tessarotto25), A. Teufel9), L.G. Tkatchev8), G. Venugopal3), M. Virius21), N.V. Vlassov8),A. Vossen10), Q. Weitzel18), K. Wenzl10), R. Windmolders4), W. Wislicki31), H. Wollny10), K. Zaremba32),M. Zavertyaev16), E. Zemlyanichkina8), M. Ziembicki32), J. Zhao14,25), N. Zhuravlev8) and A. Zvyagin17)

1) Universitat Bielefeld, Fakultat fur Physik, 33501 Bielefeld, Germanyf)
2) Universitat Bochum, Institut fur Experimentalphysik, 44780 Bochum, Germanyf)
3) Universitat Bonn, Helmholtz-Institut fur Strahlen- und Kernphysik, 53115 Bonn, Germanyf)
4) Universitat Bonn, Physikalisches Institut, 53115 Bonn, Germanyf)
5) Institute of Scientific Instruments, AS CR, 61264 Brno, Czech Republicg)
6) Burdwan University, Burdwan 713104, Indiah)
7) Matrivani Institute of Experimental Research & Education, Calcutta-700 030, Indiai)
8) Joint Institute for Nuclear Research, 141980 Dubna, Moscow region, Russia9) Universitat Erlangen–Nurnberg, Physikalisches Institut, 91054 Erlangen, Germanyf)
10) Universitat Freiburg, Physikalisches Institut, 79104 Freiburg, Germanyf)
11) CERN, 1211 Geneva 23, Switzerland12) Technical University in Liberec, 46117 Liberec, Czech Republicg)
13) LIP, 1000-149 Lisbon, Portugalj)
14) Universitat Mainz, Institut fur Kernphysik, 55099 Mainz, Germanyf)
15) University of Miyazaki, Miyazaki 889-2192, Japank)
16) Lebedev Physical Institute, 119991 Moscow, Russia17) Ludwig-Maximilians-Universitat Munchen, Department fur Physik, 80799 Munich, Germanyf,l)
18) Technische Universitat Munchen, Physik Department, 85748 Garching, Germanyf,l)
19) Nagoya University, 464 Nagoya, Japank)
20) Charles University, Faculty of Mathematics and Physics, 18000 Prague, Czech Republicg)
21) Czech Technical University in Prague, 16636 Prague, Czech Republicg)
22) State Research Center of the Russian Federation, Institute for High Energy Physics, 142281 Protvino, Russia23) CEA DAPNIA/SPhN Saclay, 91191 Gif-sur-Yvette, France24) Tel Aviv University, School of Physics and Astronomy, 69978 Tel Aviv, Israelm)
25) Trieste Section of INFN, 34127 Trieste, Italy26) University of Trieste, Department of Physics and Trieste Section of INFN, 34127 Trieste, Italy27) Abdus Salam ICTP and Trieste Section of INFN, 34127 Trieste, Italy28) University of Turin, Department of Physics and Torino Section of INFN, 10125 Turin, Italy29) Torino Section of INFN, 10125 Turin, Italy30) University of Eastern Piedmont, 1500 Alessandria, and Torino Section of INFN, 10125 Turin, Italy31) So ltan Institute for Nuclear Studies and University of Warsaw, 00-681 Warsaw, Polandn)
32) Warsaw University of Technology, Institute of Radioelectronics, 00-665 Warsaw, Polando)
33) Yamagata University, Yamagata, 992-8510 Japank)
+) Deceaseda) Also at IST, Universidade Tecnica de Lisboa, Lisbon, Portugalb) On leave of absence from JINR Dubnac) Also at Chubu University, Kasugai, Aichi, 487-8501 Japanj)
d) Also at KEK, 1-1 Oho, Tsukuba, Ibaraki, 305-0801 Japane) Also at GSI mbH, Planckstr. 1, D-64291 Darmstadt, Germanyf) Supported by the German Bundesministerium fur Bildung und Forschungg) Suppported by Czech Republic MEYS grants ME492 and LA242h) Supported by DST-FIST II grants, Govt. of Indiai) Supported by the Shailabala Biswas Education Trustj) Supported by the Portuguese FCT - Fundacao para a Ciencia e Tecnologia grants POCTI/FNU/49501/2002 and
POCTI/FNU/50192/2003k) Supported by the MEXT and the JSPS under the Grants No.18002006, No.20540299 and No.18540281; Daiko Foundation
and Yamada Foundationl) Supported by the DFG cluster of excellence ‘Origin and Structure of the Universe’ (www.universe-cluster.de)
m) Supported by the Israel Science Foundation, founded by the Israel Academy of Sciences and Humanitiesn) Supported by Ministry of Science and Higher Education grant 41/N-CERN/2007/0o) Supported by KBN grant nr 134/E-365/SPUB-M/CERN/P-03/DZ299/2000

1 Introduction
Among the various sea quarks contributing to the nucleon spin, the strange quark is the onlyone accessible in inclusive lepton-nucleon scattering experiments. The first moment of the strange quarkhelicity distribution, ∆s+∆s, has been found to be negative already twenty years ago in the EMCexperiment [1] under the assumption of SU(3)F symmetry in hyperon β decays. This result has beenconfirmed with improved precision by recent measurements performed by HERMES [2] and by COMPASSwhich has obtained
∆s + ∆s = −0.09 ± 0.01(stat.) ± 0.02(syst.) (1)
at Q2 = 10(GeV/c)2 at leading order (LO) in QCD [3]. Inclusive experiments, however, provide anevaluation of the first moment ∆s+∆s only. The shape as a function of the Bjorken scaling variable xis determined in global fits of the nucleon spin structure function g1(x, Q2) where a parameterisation ofthe strange quark helicity as a function of x assumed to be valid at some reference value of the photonvirtuality, Q2
0, is evolved to the Q2 of each data point and fitted to the measured values. The resultingdistribution ∆s(x), further assumed to be equal to ∆s(x), is generally concentrated at the highest valuesof x compatible with the positivity limit |∆s(x, Q2)| ≤ s(x, Q2) [4, 5].
Direct information on the distribution ∆s(x) can be obtained from semi-inclusive channels, in whichinteractions on strange quarks are enhanced, such as charged kaon production. These measurements,which require final state particle identification, became only feasible in recent experiments and the onlyresults published so far are from the HERMES experiment [6, 7, 8].
In a full flavour decomposition analysis, the HERMES collaboration has obtained ∆s = 0.028 ±0.033(stat.) ± 0.009(syst.) in the range 0.023 < x < 0.6 [7]. In their most recent analysis of the chargedkaon and inclusive asymmetries in deuteron data, they have obtained ∆s + ∆s = 0.037 ± 0.019(stat.) ±0.027(syst.) [8]. The negative values of ∆s(x) expected from the full first moment have thus never beenobserved in the x range covered by HERMES. The implication of a positive ∆s in a limited experimentalrange was discussed in relation with the assumed SU(3) flavour symmetry and it was shown that a non-negative first moment of ∆s was highly unlikely [9]. This situation is clearly reflected in the result ofa global fit including all inclusive and semi-inclusive results in the DIS region: the fitted distribution of∆s(x) which is positive at x > 0.03 receives a negative contribution in the unmeasured low x range, tobring its first moment close to the values of Eq. (1) [10].
In this paper we present a new precise measurement of the inclusive and semi-inclusive doublespin asymmetries measured on an isoscalar target by the COMPASS experiment at CERN and a LOevaluation of the polarised parton distributions ∆uv+∆dv, ∆u+∆d and ∆s (=∆s).
At LO in QCD under the assumption of independent quark fragmentation, the double spin asym-metries for hadrons h produced in the current fragmentation region can be decomposed into a sum ofproducts of quark helicity distributions ∆q(x, Q2) times quark fragmentation functions Dh
q (z, Q2) wherez is the fraction of the virtual photon energy taken by the hadron h:
Ah1 (x, Q2, z) =
∑
q e2q∆q(x, Q2)Dh
q (z, Q2)∑
q e2qq(x, Q2)Dh
q (z, Q2). (2)
A previous determination of the quark helicity distributions performed by SMC [11] covers a kine-matic range similar to the COMPASS data but does not provide a determination of ∆s due to the lackof hadron identification.
The deuteron data presented in this paper were collected in the years 2002-2004 and 2006. Theproduced hadrons cover a large phase space. In the present analysis only those identified as pions or kaonsare used.
2 Experimental setup
A general description of the COMPASS spectrometer in the initial configuration is given in [12].Only modifications introduced after the year 2005 will be mentioned here. They mainly concern thepolarised target, the large area trackers around the first spectrometer magnet (SM1) , and the RICHdetector.
Before 2005 the target solenoid magnet was the one previously used by the SMC experiment [13]with an aperture of ±70 mrad as seen from the upstream end of the target. The new solenoid magnet[14] installed in 2005 has an acceptance of ±180 mrad. Before 2005 the polarised target, located insidethe solenoid, consisted of two cells, each 60 cm long and 3 cm in diameter, separated by 10 cm. A threecell target has been installed in the new magnet. In this configuration the central cell is 60 cm long andthe two outer ones 30 cm long, separated by 5 cm. The total amount of material thus remains unchanged.
1

z [cm]-100 -50 0 50
A.U
.
0
1
2
3
z [cm]-50 0 50
A.U
.
0
2
4
6
Figure 1: Distribution of the interaction vertices along the beam axis for the 2 cell (years 2002–2004)and 3 cell (year 2006) target configurations. The solid lines show the length of the cells.
The distribution of the interaction vertices along the beam axis for the events used in the present analysisis shown in Fig. 1 for the old and new target configurations.
The deuterated lithium target material (6LiD) is longitudinally polarised with the method of dy-namic nuclear polarisation (DNP) [15]. In the old as well as in the new configuration neighbouring cellsof the targets are polarised in opposite directions so that data from both spin directions are recordedat the same time. The absolute value of the averaged polarisation varies between 0.50 and 0.56. Before2005 the spin directions in the target cells were reversed every 8 hours by rotating the magnetic fielddirection. In this way, fluxes and acceptances cancel out in the calculation of spin asymmetries, providedthat the ratio of acceptances remains unchanged after spin reversal. In the new configuration, the datasamples obtained with both spin orientations have in average the same acceptance, which limits falseasymmetries. In view of this, the magnetic field direction was rotated only once per day during the 2006data taking. In order to minimise possible acceptance effects related to the orientation of the solenoidfield, the sign of the polarisation in each target cell was also reversed a few times per year by changingthe DNP microwave frequencies.
Several modifications have been introduced in the tracking detectors around SM1 in order to matchthe enlarged acceptance of the new solenoid: an additional medium size drift chamber station (DC) hasbeen installed upstream of SM1 and two smaller DCs, downstream of SM1, have been replaced by a newlarger one and by a straw tube station.
A major upgrade has also been applied to the RICH detector to improve its performance in termsof efficiency and purity [16]: in the most critical central region, photon detection previously provided bylarge-size MWPCs with CsI photocathodes has been replaced by a system based on multi-anode PMTs.It improves considerably the signal-to-noise ratio in the region where the beam halo is largest. In additionthe readout system for the peripheral region has been replaced by a faster one.
3 Asymmetries
All events used in the present analysis are required to have a reconstructed primary interactionvertex defined initially by the incoming and the scattered muon trajectories (the reconstruction procedureis described in Ref.[17]). The energy of the beam muon is constrained to be in the interval 140 < Eµ < 180GeV. To equalise fluxes through the different target cells, it is required for the trajectory of the incomingmuon to cross entirely all cells. This condition is essential because it allows to cancel out the muon flux in
2

Pur
ities
& c
onta
min
atio
ns
0
0.2
0.4
0.6
0.8
1
x -210 -110
x -210 -110
0
0.2
0.4
0.6
0.8
1
⟩+π→+πQ⟨
⟩+π→+KQ⟨⟩
-π→-πQ⟨
⟩-π→-K
Q⟨
πHadron identified as
0
0.2
0.4
0.6
0.8
1
⟩+K→+πQ⟨
⟩+K→+KQ⟨⟩
-K→-πQ⟨
⟩-K→-K
Q⟨
Hadron identified as K
Figure 2: Purities Qπ→π, QK→K and contaminations Qπ→K , QK→π calculated for the 2004 data.
the calculation of asymmetries. The kinematic region is defined by cuts on the photon virtuality, Q2, andthe fractional energy, y, transfered from the beam muon to the virtual photon. DIS events are selected byrequiring Q2 > 1 (GeV/c)2. The requirement y > 0.1 removes events affected by bad resolution and lowphoton polarisation. The region most affected by radiative corrections is eliminated by the cut y < 0.9.
The x range covered in the present analysis extends from 0.004 to 0.3. The low limit is definedby the kinematical cut Q2 > 1 (GeV/c)2. The upper limit is set to x = 0.3 because interactions on seaquarks are negligible at higher x. The total energy of the γ∗-nucleon system in the selected events coversthe range 5 . W . 17 GeV. The statistics of 135.1 million events includes the sample used in Ref.[4] andreduces the statistical errors by about 30 %.
Hadron tracks are required to originate from the main vertex. A cut on the fractional energy z > 0.2is applied to the hadron candidates in order to select those produced in the current fragmentation region.In addition an upper limit z < 0.85 is imposed in order to suppress hadrons from diffractive processes andto avoid contamination from wrongly identified muons. Several other cuts are applied to guarantee thequality of the selected track sample: the first reconstructed track point must be upstream of SM1; tracksreconstructed only upstream of SM1 are rejected and those crossing more than 30 radiation lengths ofmaterial are not accepted as hadrons.
Hadron identification is performed using the RICH detector. For the present analysis, the momentaof hadrons are restricted to the range common to pion and kaon identification 10 < p < 50 GeV/c. Theexpected distributions of photo-electrons are calculated for different particle masses as well as for thebackground assumption. These distributions are compared to the observed one and the mass is assignedaccording to the ratios of their likelihoods. The statistics available for the π+(π−) and K+(K−) samplesafter all cuts is 22.8(20.5), and 4.8(3.3) millions, respectively.
Since the samples of identified pions and kaons do not fully correspond to the true ones, an un-folding procedure must be applied to correct rates and asymmetries. In a first step, the elements of theidentification efficiency matrix, P t→i, are calculated. They represent the probability for a particle of truetype t to be identified as type i. The values of P t→i are obtained from samples of reconstructed pionsand kaons resulting from K0
S and φ decays, respectively. Since the RICH performance depends criticallyon the phase space of particles, the elements P t→i are calculated in bins of momentum and polar angle(angle w.r.t. beam axis) of the selected particle.
In a second step the contributions , Qt→i, from different hadron species t to the identified samplei are determined. They depend not only on the identification efficiencies P t→i but also on the observedhadron rates and therefore must be calculated separately for every bin of x. As an example the contri-butions Qπ→π, QK→K (called ”purities”) and Qπ→K , QK→π (called ”contaminations”) for positive andnegative hadrons in the 2004 data are shown in Fig. 2 as a function of x. In general, Qπ→π is close to 1.0and QK→K varies from about 0.8 at low x to about 0.93 at medium x. In view of this, unfolding can onlyhave a significant effect at low x but since the pion and kaon asymmetries are similar in this region, itseffect remains small as compared to the statistical errors.
The inclusive asymmetries and the unfolded hadron asymmetries have been corrected for radiative
3

-0.2-0.1
00.10.20.30.40.5
1,dA
-0.2-0.1
00.10.20.30.40.5 +π
1,dA
-0.2-0.1
00.10.20.30.40.5
K+1,dA
-0.2-0.1
00.10.20.30.40.5 -π
1,dA
-0.2-0.1
00.10.20.30.40.5
K-1,dA
-0.2
0
0.2
0.4
-210 -110
-0.2
0
0.2
0.4
-210 -110 x-210 -110
COMPASS
HERMES
Figure 3: Comparison of final asymmetries of COMPASS as a function of x with results of HERMES [7].Bands at bottom of graphs represent systematic uncertainties. Solid markers and bands correspond toCOMPASS data. Open markers and bands are taken from the HERMES publication.
effects according to the procedure of Ref.[18] and are shown in Fig. 3 as a function of x. The values of theinclusive asymmetry are in good agreement with those of Ref.[4]. The results of HERMES, the only otherexperiment which measured asymmetries of identified hadrons [7], are shown for comparison. The twosets of measurements are well compatible and in the region of kinematic overlap the statistical precision ofthe two experiments is generally comparable. However COMPASS extends the measured region towardsx = 0 by an order of magnitude. It is also observed that all asymmetries, except AK−
1,d , are quite similar to
each other. This feature is expected due to the isoscalar symmetry of the 6LiD target. The K− asymmetryis consistent with zero over the full range of x. The values of the inclusive and semi-inclusive asymmetriesare listed with their statistical and systematic errors in Tables 2 and 3. Correlations between differentasymmetries in bins of x are listed in Table 4.
There are several sources of systematics uncertainties in the determination of the asymmetries.The error of the target polarisation measurement and the error on the parameterisation of the beampolarisation amount to 5% of their respective value. The uncertainty related to the dilution factor, whichincludes the dilution due to radiative events on the deuteron, is 2% over the full range of x. The ratio R =σL/σT used to calculate the depolarisation factor [19] gives an error of 2-3%. When added in quadraturethese multiplicative uncertainties amount to a systematic error of 8% of the asymmetry. The systematicerror also accounts for false asymmetries which could be generated by instabilities in some components ofthe spectrometer. Asymmetries due to apparatus effects have been searched for in combinations of datasamples where the physical asymmetry cancels out. The asymmetries observed in these combinations werefound compatible with zero. Systematic effects have also been studied by comparing results obtainedwith different microwave settings. No significant difference was found. The possible error due to falseasymmetries was evaluated as a fraction of the statistical error: σsyst < 0.4 σstat[4]. The total systematicuncertainty is shown by the bands at the bottom of each plot in Fig. 3.
4 Polarised PDFs from a fit to the asymmetries
As in our previous LO analysis [3], we assumed that hadrons in the current fragmentation regionare produced by independent quark fragmentation, so that their spin asymmetries can be written interms of parton distribution functions (q(x, Q2), ∆q(x, Q2)) and fragmentation functions (FFs) Dh
q (z, Q2)according to Eq. (2). In the present analysis we use the unpolarised parton distribution functions (PDFs)from MRST [20]1) and the recent DSS parameterisation of FFs at LO which was obtained from a combinedanalysis of inclusive pion and kaon production data from e+e− annihilation, semi-inclusive DIS data(”SIDIS”) from HERMES and proton-proton collider data [21]. In order to test the dependence of thepolarised PDFs on the FFs, we also show the values obtained with the EMC FFs [22]. In contrast toother parameterisations which are derived from global fits, the latter ones have been extracted from theEMC data only, so that only non-strange quark fragmentation could be measured. Therefore, in addition
1) We use the LO set with three quark flavours.
4
-0.2
0
0.2
0.4fit with DSS FFsfit with EMC FFs
DNS prediction
-0.1
0
-0.1
-0.05
0
)
vd∆+ vu∆x(
-0.2
0
0.2
0.4
)
d∆+u∆x(
-0.1
0
s
∆x
-0.1
-0.05
0
x -210 -110
Figure 4: The quark helicity distributions evaluated at common value Q2 = 3 (GeV/c)2 as a function of xfor two sets of fragmentation functions (DSS and EMC). Bands at bottom of graphs represent systematicuncertainties. Solid markers and bands correspond to PDFs obtained with DSS parameterisation of FFs.Open markers and bands are obtained with EMC parameterisation of FFs. The curves represent the LODNS parameterisation of polarised PDFs [26].
to the assumptions generally made to reduce the number of FFs, the EMC analysis also assumed thatDK+
s = Dπ+u .
The recent HKNS parameterisation of FFs [23] strongly disagrees with the ratio of negative topositive hadrons observed in our data, as was already observed in [3] for the KRE parameterisation [24].For this reason, these parameterisations based only on e+e− collider data are not usable in the kinematicrange of the present analysis.
Since the analysis is based on deuteron data only, only the sums of u and d densities can beextracted: ∆uv+∆dv and ∆u+∆d. In principle ∆s and ∆s could both be extracted from the chargedkaon asymmetries AK+
1,d and AK−
1,d but in view of the precision of the data, they are assumed to be equal.
All asymmetries are also assumed to be independent of Q2. In this way the resulting PDFs are obtainedat a common Q2 fixed to 3 (GeV/c)2.
The five measured asymmetries form a linear system of equations with three unknowns (∆uv+∆dv,∆u+∆d, ∆s), which is solved by a least-square fit independently in each x-bin. Only statistical errorsare used in the fit and correlations between asymmetries are taken into account. Two corrections (c1, c2)are applied in the evaluation of quark helicity distributions from the asymmetries. The first one, c1 =1−1.5ωD, accounts for the deuteron D-state contribution (ωD = 0.05±0.01 [25]). The second one accountsfor the fact that, although R(x, Q2) = 0 at LO, the unpolarised PDFs originate from F2 distributions inwhich R = σL/σT was different from zero [19]. In the present analysis we assume R to be the same forinclusive and semi-inclusive reactions, so that the same correction, c2 = 1 + R(x, Q2), can be used forinclusive and hadron asymmetries. The resulting quark helicities thus are corrected by a factor ξ = c1 ·c2.
5

-2 -1
-1
-0.95
-0.9
-0.85
-0.8
)d∆+u∆,vd∆+vu∆cor(
-2 -1
00.10.20.30.40.5 s)∆,vd∆+vu∆cor(
-2 -1
-0.6
-0.5
-0.4
-0.3
-0.2
s)∆,d∆+u∆cor(
-1
-0.95
-0.9
-0.85
-0.8
00.10.20.30.40.5
-0.6
-0.5
-0.4
-0.3
-0.2
x-210 -110
Figure 5: Correlation coefficients of PDFs obtained in the fit with DSS parameterisation as a functionof x.
Table 1: First moments ∆uv+∆dv, ∆u+∆d and ∆s at Q2 = 3 (GeV/c)2 from the COMPASS data andalso from the DNS fit at LO [26] truncated to the range of the measurements (0.004 < x < 0.3).
FF DSS EMC
measur. 0.26 ± 0.06 ± 0.02 0.30 ± 0.08 ± 0.02∆uv+∆dv
DNS 0.225
measur. −0.04 ± 0.03 ± 0.01 −0.05 ± 0.04 ± 0.01∆u+∆d
DNS −0.009
measur. −0.01 ± 0.01 ± 0.02 −0.05 ± 0.03 ± 0.03∆s(=∆s)
DNS −0.035
The results of the fit obtained with the two sets of fragmentation functions are shown in Fig. 4. Sig-nificant differences are observed only for ∆s. Indeed the main difference of DSS with respect to EMC is the
enhanced s(s) quark contribution to the production of K−(K+): the ratio∫ 1
0.2 DK+s (z)dz/
∫ 1
0.2 DK+u (z)dz,
which is equal to 3.4 for the quoted EMC values, increases to 6.6 in DSS. The statistical precision of ∆sfor the two parameterisations changes in the same proportion. The curves obtained with the LO DNSparameterisation of polarised PDFs [26] are also shown. As in our previous publication on the asymmetryof unidentified hadrons [3], a nice agreement is observed in the valence sector. The asymmetries of thenon-strange sea are also compatible with the DNS curve, although we observe a tendency for the datapoints to be above and below the curve at low and high x, respectively. The shape of the x∆s curveof DNS is quite typical for QCD fits of g1(x, Q2) data, showing a minimum in the medium x region(x ≈ 0.2). With the DSS fragmentation functions, the SIDIS measurements of COMPASS do not seem tosupport this behaviour, while with the EMC ones, the errors become too large to draw any conclusion.
The elements of the correlation matrix for the obtained densities are shown in Fig. 5. The correlationbetween the non-strange densities ∆uv+∆dv and ∆u+∆d is large and negative. This feature can beexplained by the fact that their sum is highly constrained by the very precise value of A1,d: since theterm with ∆s in Eq. (2) is smaller than the other ones, A1,d fixes well the sum of non-strange densitiesand forces them to anti-correlate.
The estimates of the truncated first moments ∆uv+∆dv, ∆u+∆d and ∆s are given in Table 1.The systematic errors have been estimated by refitting the asymmetries shifted simultaneously withinthe limits of their systematic uncertainty. The value quoted for valence quarks is in good agreement withthe one derived in our previous publication from the difference asymmetries for non-identified hadronsobtained from a partially overlapping data sample (0.26 ± 0.07 ± 0.04 at Q2=10 (GeV/c)2) [3].
6
x -210 -110
-0.2
-0.1
0
0.1
0.2
0.3
0.4from COMPASS
-+K+K1,dA
from HERMES-+K+K
1,dA
prediction from DSSV fit1,d
A
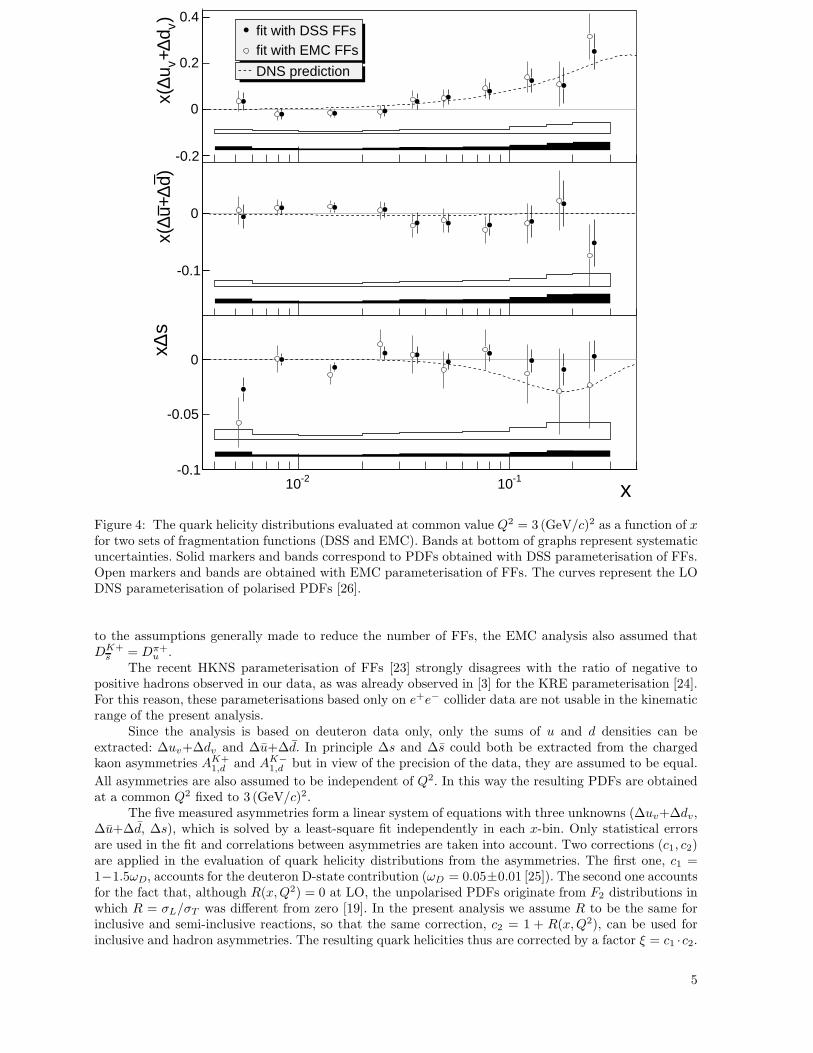
Figure 6: Charged kaon asymmetries obtained with cross-section weights from MRST PDFs and DSSFFs. For comparison results of HERMES [7] are also presented. The curve shows the A1,d prediction ofthe DSSV fit [10].
5 Direct evaluation of ∆s from the charged kaon asymmetry
The dependence of ∆s(x) on the FFs can be further explored in relation with the charged kaon
asymmetry AK++K−
1,d . This asymmetry is a weighted average of AK+
1,d and AK−
1,d with weights given by the
spin-averaged K+ and K− cross-sections
AK++K−
1,d =σK+
AK+
1,d + σK−
AK−
1,d
σK+ + σK−
. (3)
It is found to be very stable with respect to the ratio σK−
/σK+
. Indeed a change of this ratio by ±10%
does not modify AK++K−
1,d by more than 10% of its statistical error. At LO, the cross-section ratio onlydepends on the unpolarised PDFs and on the ratios of unfavoured to favoured and strange to favouredFFs:
RUF =
∫
DK+
d (z)dz∫
DK+
u (z)dz, RSF =
∫
DK+
s (z)dz∫
DK+
u (z)dz(4)
which are respectively equal to 0.13 and 6.6 for the DSS FFs at Q2 = 3 (GeV/c)2 (0.35 and 3.4 for theEMC FFs).2) The values shown in Fig. 6 have been obtained with the MRST PDFs and the DSS FFs. Asfor the K+ and K− asymmetries, they are in very good agreement with the HERMES values of Ref. [7].
For an isoscalar target, the charged kaon asymmetry and the inclusive asymmetry can be writtenat LO as
AK++K−
1,d = ξ∆Q + α∆s
Q + αs, A1,d = ξ
∆Q + 45∆s
Q + 45s
(5)
where Q is the non-strange quarks density Q = u + u + d + d, the corresponding helicity density is ∆Q,and α = (2RUF + 2RSF )/(2 + 3RUF ).
2) These values remain practically unchanged when the range of z is limited to 0.85 instead of 1.
7

x -210 -110
s ∆x
-0.03
-0.02
-0.01
-0
0.01
0.02
-+K+K
1,d and A1,dExtracted from A
K-1,d
, AK+1,d
, A-π1,d
, A+π1,d
, A1,dFit of A
Figure 7: The strange quark spin distribution x ∆s(x) at Q2 = 3 (GeV/c)2 derived from the charged
kaon asymmetry AK++K−
1,d using DSS FFs and from A1,d, compared to the result of the correspondingleast square fit. The quoted errors are statistical only.
To take advantage of the similarity between AK++K−
1,d and A1,d, it is convenient to write the strangequark polarisation ∆s/s in the form
∆s
s=
1
ξ
[
A1,d + (AK++K−
1,d − A1,d)Q/s + α
α − 0.8
]
, (6)
where Q and s are spin-independent non-strange and strange quark densities. As expected, the use ofthis formula leads to values of ∆s practically equal to those of the least square fit but with slightly larger
statistical errors (Fig. 7). The above formula shows that in the special case where AK++K−
1,d would bestrictly equal to A1,d, the strange quark helicity would become insensitive to FFs and its first momentwould be small and positive (≈ 0.006). Otherwise the main dependence on the FFs is due to RSF ,which appears only in the numerator of α, and its effect is amplified by the large values of the ratio
Q/s. Negative values of ∆s correspond to negative values of AK++K−
1,d at low x where Ad1 ≈ 0 and to
AK++K−
1,d < A1,d at higher x. The A1,d(x) prediction of the DSSV fit [10] is shown in Fig. 6 for comparison.Neither the COMPASS nor the HERMES points show any tendency to lie below the A1,d curve in therange 0.03 < x < 0.3. There is thus no indication for a significantly negative ∆s in this region, in contrastto predictions of most fits using only g1 data, as shown for instance by the DNS prediction in Fig. 4. The
COMPASS values of AK++K−
1,d provide at least a hint that ∆s may become negative in the previouslyunmeasured low x region (x < 0.02), as predicted in the recent DSSV fit [10].
Fig. 8 shows the variation of the first moment of ∆s truncated to the measured region as a functionof RSF . For RSF & 5, we observe that the values are close to zero and larger than the full moment derivedfrom the inclusive analysis (Eq. 1). The contribution from the region x > 0.3 is limited by the positivitycondition |∆s(x)| ≤ s(x) and cannot exceed 0.003 in absolute value. Thus any difference between thetruncated SIDIS moment and the full moment must be compensated by an unmeasured contribution inthe low x region. In particular this is the case for the DSS FFs where RSF = 6.6. The difference neverexceeds two standard deviations, so that no firm conclusions can be drawn from the COMPASS dataonly, nevertheless, as shown on Fig. 6, the HERMES data lead to a similar result. In contrast, if RSF . 4,
the asymmetry AK++K−
1,d becomes less and less sensitive to ∆s because DK+
s is small. This is the case forthe EMC FFs and, in general, for older parameterisations such as KRE [24].
8

SFR
s(x)
dx∆ ∫
KRE =2.1SFKRE: R
=3.4SFEMC: R=6.6SFDSS: R
2 3 4 5 6 7-0.16
-0.14
-0.12
-0.1
-0.08
-0.06
-0.04
-0.02
0
0.02
Stat. uncert. (incl. DIS)
Stat. uncert. (SIDIS+DSS)
UFUncert. due to R
Figure 8: Integral of ∆s over the measured range of x, as a function of the ratio RSF for RUF fixedat the DSS value of 0.13 (thick solid curve). The light-grey area shows the statistical uncertainty andthe hatched band inside of it shows the effect of increasing RUF to 0.35 (EMC value). The horizontalband represents the full moment of ∆s derived from the COMPASS value of the first moment of gd
1(x)(Eq. 1). The values of RSF corresponding to DSS[21], EMC[22] and KRE[24] parameterisations of FFsare indicated by arrows.
6 Conclusions
We have presented a first measurement of the longitudinal spin asymmetries for charged pions andkaons identified with the RICH detector in the COMPASS experiment. These measurements are used incombination with the inclusive asymmetries to evaluate the polarised valence, non-strange sea and strangequark distributions. The results for valence quarks and non-strange sea quarks are in good agreementwith the DNS parameterisation. They show weak dependence on the selected parameterisation of thefragmentation functions. The distribution of ∆s is compatible with zero in the whole measured range, incontrast to the shape of the strange quark helicity distribution obtained in most LO and NLO QCD fits.The value of the first moment of ∆s and its error are very sensitive to the assumed value of the ratio ofthe s-quark to u-quark fragmentation functions into positive kaons
∫
DK+
s (z)dz/∫
DK+
u (z)dz.
Acknowledgements
We gratefully acknowledge the support of the CERN management and staff and the skill and effortof the technicians of our collaborating institutes. Special thanks go to V. Anosov and V. Pesaro for theirtechnical support during the installation and the running of this experiment. This work was made possiblethanks to the financial support of our funding agencies.
References
[1] EMC, J. Ashman et al., Phys. Lett. B 206 (1988) 364.[2] HERMES Collaboration, A. Airapetian et al., Phys. Rev. D 75 (2007) 012007.[3] COMPASS Collaboration, M. Alekseev, et al., Phys. Lett. B 660 (2008) 458.[4] COMPASS Collaboration, V.Yu. Alexakhin et al., Phys. Lett. B 647 (2007) 8.[5] E. Leader, A.V. Sidorov, D.B. Stamenov, Phys. Rev. D 75 (2007) 074027.[6] HERMES Collaboration, A. Airapetian et al., Phys. Rev. Lett. 92 (2004) 012005.[7] HERMES Collaboration, A. Airapetian et al., Phys. Rev. D 71 (2005) 012003.[8] HERMES Collaboration, A. Airapetian et al., Phys. Lett. B 666 (2008) 446.[9] E. Leader, D.B. Stamenov, Phys. Rev. D 67 (2003) 037503.
[10] D. de Florian, R. Sassot, M. Stratmann, W. Vogelsang, Phys. Rev. Lett. 101 (2008) 072001.
9

Table 2: Values of the inclusive asymmetry A1,d with their statistical and systematic errors as a functionof x, with the corresponding average value of Q2.
x-bin 〈x〉 〈Q2〉 A1,d ± δAstat ± δAsyst
(GeV/c)2
0.004–0.006 0.0052 1.17 0.001 ± 0.005 ± 0.0020.006–0.010 0.0079 1.48 −0.001 ± 0.003 ± 0.0010.010–0.020 0.0141 2.15 −0.002 ± 0.003 ± 0.0010.020–0.030 0.0244 3.23 0.010 ± 0.005 ± 0.0020.030–0.040 0.0346 4.33 0.003 ± 0.006 ± 0.0030.040–0.060 0.0487 5.87 0.016 ± 0.006 ± 0.0030.060–0.100 0.0765 8.63 0.039 ± 0.007 ± 0.0040.100–0.150 0.121 12.9 0.090 ± 0.010 ± 0.0080.150–0.200 0.172 17.8 0.126 ± 0.015 ± 0.0110.200–0.300 0.240 24.9 0.159 ± 0.017 ± 0.014
[11] SMC, B. Adeva et al., Phys. Lett. B 420 (1998) 180.[12] COMPASS Collaboration, P. Abbon et al., Nucl. Instr. Meth. A 577 (2007) 455.[13] D. Adams et al., Nucl. Instrum. Meth. A 437 (1999) 23.[14] N. Doshita et al., AIP Conf. Proc. 980 (2008) 307; F. Gautheron, AIP Conf. Proc. 915 (2007) 961.[15] J. Ball et al., Nucl. Instrum. Meth. A 498 (2003) 101.[16] P. Abbon et al., Eur. Phys. J.ST 162 (2008) 251; P. Abbon et al., Nucl. Instrum. Meth. A 595 (2008)
23.[17] V. Aleksakhin, Y. Bedfer, S. Gerasimov, A. Korzenev, Phys. Part. Nucl. Lett. 4 (2007) 350.[18] I.V. Akushevich, N.M. Shumeiko, J. Phys. G 20 (1994) 513.[19] E143 Collaboration, K. Abe et al., Phys. Lett. B 452 (1999) 194.[20] A.D. Martin, W.J. Stirling, R.S. Thorne, Phys. Lett. B 636 (2006) 259.[21] D. de Florian, R.Sassot, M. Stratmann, Phys. Rev. D 75 (2007) 114010.[22] EMC, A. Arneodo et al., Nucl. Phys. B 321 (1989) 541.[23] M. Hirai, S. Kumano, T.-H. Nagai, K. Sudoh, Phys. Rev. D 75 (2007) 094009.[24] S. Kretzer, Phys. Rev. D 62 (2000) 054001.[25] R. Machleidt et al., Phys. Rep. 149 (1987) 1.[26] D. de Florian, G.A. Navarro, R. Sassot, Phys. Rev. D 71 (2005) 094018.
10

Table 3: Unfolded hadron asymmetries of charged pions and kaons.
〈x〉 〈Q2〉 Aπ+1,d ± δAπ+
stat ± δAπ+syst Aπ−
1,d ± δAπ−stat ± δAπ−
syst AK+1,d ± δAK+
stat ± δAK+syst AK−
1,d ± δAK−
stat ± δAK−
syst
(GeV/c)2
0.0052 1.16 0.006 ± 0.014 ± 0.006 0.009 ± 0.014 ± 0.006 −0.018 ± 0.029 ± 0.011 −0.084 ± 0.030 ± 0.0140.0079 1.42 −0.003 ± 0.008 ± 0.003 −0.002 ± 0.008 ± 0.003 −0.017 ± 0.017 ± 0.007 0.014 ± 0.018 ± 0.0070.0141 2.03 −0.003 ± 0.007 ± 0.003 −0.007 ± 0.007 ± 0.003 −0.039 ± 0.014 ± 0.006 −0.004 ± 0.016 ± 0.0060.0244 3.19 −0.001 ± 0.011 ± 0.004 0.006 ± 0.012 ± 0.005 0.020 ± 0.022 ± 0.009 0.025 ± 0.026 ± 0.0100.0346 4.43 0.026 ± 0.015 ± 0.006 0.004 ± 0.016 ± 0.006 0.021 ± 0.030 ± 0.012 0.012 ± 0.035 ± 0.0140.0487 6.10 0.016 ± 0.015 ± 0.006 0.037 ± 0.016 ± 0.007 0.066 ± 0.029 ± 0.011 −0.058 ± 0.035 ± 0.0150.0763 9.26 0.046 ± 0.017 ± 0.008 0.018 ± 0.018 ± 0.007 0.064 ± 0.032 ± 0.013 0.015 ± 0.041 ± 0.0170.121 14.9 0.094 ± 0.025 ± 0.012 0.087 ± 0.028 ± 0.013 0.117 ± 0.046 ± 0.019 −0.007 ± 0.065 ± 0.0260.171 22.4 0.102 ± 0.039 ± 0.017 0.132 ± 0.044 ± 0.020 0.116 ± 0.070 ± 0.028 0.002 ± 0.103 ± 0.0410.240 32.8 0.218 ± 0.044 ± 0.024 0.147 ± 0.051 ± 0.023 0.208 ± 0.078 ± 0.031 −0.018 ± 0.118 ± 0.047
11

Table 4: Correlation coefficients of unfolded asymmetries in bins of x.
x-bin 0.004-0.006 0.006-0.01 0.01-0.02 0.02-0.03 0.03-0.04 0.04-0.06 0.06-0.10 0.10-0.15 0.15-0.20 0.20-0.30
Aπ+1,d&A1,d 0.29 0.34 0.39 0.40 0.40 0.41 0.41 0.40 0.39 0.39
Aπ−1,d&A1,d 0.30 0.35 0.38 0.39 0.39 0.39 0.38 0.36 0.35 0.34
Aπ−1,d&Aπ+
1,d 0.12 0.15 0.17 0.16 0.16 0.16 0.16 0.15 0.15 0.17
AK+1,d &A1,d 0.11 0.15 0.17 0.19 0.19 0.20 0.21 0.21 0.21 0.21
AK+1,d &Aπ+
1,d −0.18 −0.12 −0.08 −0.06 −0.05 −0.04 −0.04 −0.03 −0.02 −0.02
AK+1,d &Aπ−
1,d 0.03 0.04 0.04 0.04 0.04 0.04 0.04 0.05 0.05 0.05
AK−
1,d &A1,d 0.11 0.14 0.16 0.16 0.16 0.16 0.16 0.15 0.14 0.14
AK−
1,d &Aπ+1,d 0.03 0.03 0.03 0.03 0.03 0.03 0.03 0.03 0.03 0.03
AK−
1,d &Aπ−1,d −0.14 −0.09 −0.05 −0.04 −0.04 −0.03 −0.03 −0.03 −0.03 −0.04
AK−
1,d &AK+1,d 0.05 0.07 0.09 0.10 0.10 0.10 0.10 0.10 0.11 0.12
12
Copyright © 2022 FDOKUMEN