The Economic and Fiscal Impacts of the Distilling Industry in ...
Upload
independentCategory
view
0download
0
1
FISCAL TRANSPARENCY AND ECONOMIC PERFORMANCE
Jorge Baldrich [email protected]
September 2005
ABSTRACT Recent research has shown a robust relation between institutions and the economic performance of countries. A less satisfactory conclusion, however, has been drawn on the link between measures of institutions quality and policy making tools. This paper is an initial attempt to present an institutions-related variable, fiscal transparency, which is connected with economic performance and also has a neat policy dimension. Although a measure of fiscal transparency can be regarded as an interesting alternative to other institutions measures in terms of its proxy potentiality, it can also be considered a direct measure of institutional quality. In this sense, Adam Smith’s development views provide a perspective where the absence of agents able to influence the government paved the way to the improvement in living standards. This is precisely what fiscal transparency is about. By defining the scope and responsibilities of the government in a clear manner, making available the fiscal information for the population, openly preparing and executing the budget, and assuring the integrity of fiscal procedures, a transparent fiscal environment limits corruption and diversion and, therefore, facilitates development and the increase in living standards. This paper presents a new data set on fiscal transparency based on an IMF assessment of progress on the implementation of the Fiscal Transparency Code by 45 countries in the fiscal modules of Reports on Observance of Standards and Codes. Our empirical estimations show a strong link from fiscal transparency to per capita income. Standard steps on budget preparation and execution, and fiscal procedures are identified as a set of policy tools to improve the fiscal transparency of countries and provide a growth impulse.
JEL Codes: O1, H6, E6.
2
FISCAL TRANSPARENCY AND ECONOMIC PERFORMANCE
Jorge Baldrich [email protected]
September 2005
“But what all the violence of the feudal institutions could never have
effected, the silent and insensible operation of foreign commerce and
manufactures gradually brought about…….
The great proprietors were no longer capable of interrupting the
regular execution of justice or of disturbing the peace of the
country…… they became as insignificant as any substantial burgher
or tradesman in a city. A regular government was established in the
country as well as in the city, nobody having sufficient power to disturb
its operations in the one any more than in the other”.
A. Smith, “An Inquire into the Nature and Causes of he Wealth of
Nations”, B. III, Ch. 4, italics added.
Introduction
Recent research has shown a robust relation between institutions and the
economic performance of countries. A less satisfactory conclusion, however, has
been drawn on the link between measures of institutions quality and policy making
tools. This paper is an initial attempt to present an institutions-related variable,
fiscal transparency, which is connected with economic performance and also has a
3
neat policy dimension. Although a measure of fiscal transparency can be regarded
as an interesting alternative to other institutions measures in terms of its proxy
potentiality, it can also be considered a direct measure of institutional quality. In
this regard, Adam Smith’s quotation provides a development perspective where the
absence of landowner’s power to influence the justice paved the way to a “regular
government”1. This is precisely what fiscal transparency is about. By defining the
scope and responsibilities of the government in a clear manner, making available
the fiscal information for the population, openly preparing and executing the
budget, and assuring the integrity of fiscal procedures, a transparent fiscal
environment limits corruption and diversion and, therefore, facilitates development
and increase in living standards.
This paper presents a new data set on fiscal transparency based on an IMF
assessment of progress on the implementation of the Fiscal Transparency Code by
45 countries in the fiscal modules of Reports on Observance of Standards and
Codes. Our empirical estimations show a strong link from fiscal transparency to
per capita income. Standard steps on budget preparation and execution, and fiscal
procedures are identified as a set of policy tools to improve the fiscal transparency
of countries.
Fiscal Transparency
Fiscal transparency has long being recognized as a requisite for a well functioning
public sector. During the last 10 years, however, a significant progress has been
made on cementing a concept of fiscal transparency which allows the development
of quantitative measures of it. Particularly relevant has been the international
financial community’s initiative to launch the Reports on Observance of Standards
and Codes (ROSCs) in the late 90s as a vehicle for strengthening the financial
system’s stability.
1 See also Ellis and Fender (2003) where the fiscal transparency variable captures the quality of economic institutions.

4
The main idea behind the initiative was to strengthen institutions with the aim of
promoting good governance and transparency. Better institutions provide a link to
the improvement of the accountability and credibility of policies and reduce the
vulnerability to crises. The development of international standards and codes has
been accelerated recently by the Financial Stability Forum’s endorsement of
internationally recognized standards in 12 areas: accounting, anti-money
laundering, auditing, banking, corporate governance, dissemination of data, fiscal
transparency, insolvency and creditors rights, insurance regulation, monetary and
financial transparency policies, payments systems, and securities markets
regulations. These areas cover three main categories: transparency standards
(data, fiscal, and monetary and financial policy transparency); financial sector
(banking supervision, securities, insurance, payment systems, and anti-money
laundering); and market-integrity for the corporate sector (corporate governance,
accounting, auditing, and insolvency and creditor rights).2 The Financial Stability
Forum has emphasized the importance of the 12 standards by saying that “the
international community attaches much importance to the adoption and
implementation of these standards because of their beneficial effects on the
stability of financial systems both inside countries and globally” 3
In 2001, the IMF and the World Bank agreed that ROSCs would be a principal tool
for undertaking country assessments. Both institutions have taken a central role in
developing, implementing, and assessing internationally recognized standards and
codes. ROSCs are now a central element of the IMF’s surveillance.4
The Code on Good Practices on Fiscal Transparency (CGPFT)
2 The transparency standards were developed by the IMF. The financial sector standards were designed by institutions like the Basel’s Committee, the International Organization of Securities Commissions, and the International Association of Insurance Supervisors. The standards on market integrity were developed by related institutions and the World Bank. 3 See: www.fsforum.org/compendium. 4 A main responsibility of the IMF is to promote a dialogue among countries on economic and financial policies. This process of monitoring and consultation is referred as IMF surveillance.
5
The CGPFT was adopted by the IMF on 1998. The Code, together with the
explanatory Manual on Fiscal Transparency, is based on the following four
principles which provide the organization of the Code.
The first principle deals with the clarity of roles and responsibilities of the
government. This principle assesses the extent to which the non-commercial
activities of the government are clearly distinguished from the rest of the economy;
how clearly defined are the responsibilities of the executive, legislative and judicial
branches; how the budgetary and extra-budgetary activities are coordinated and
managed; how clear are the arrangements between the government and non-
government public agencies; how clear and nondiscriminatory is the government
involvement in the private sector; how open and comprehensive are the budget
laws defining the commitment and administrative rules; how explicit, easily
accessible and understandable is the legal framework for taxation; and how well
defined and publicized are ethical standards of public servants’ behavior.
The second principle, public availability of information, relates to the publication of
comprehensive fiscal data and information at specified times. The principle
stresses the publication of all the budgetary and extrabudgetary operations of the
government; the comparison of the current year budget with two previous year
outturns and to two projected year fiscal aggregates; the assessment of quasi-
fiscal activities, contingent liabilities, and tax expenditures; the publication of full
information on the level and composition of government’s debt and assets as well
as the consolidated account with the sub national levels of government; the legal
obligation nature of fiscal data publication and the need to announce advance
release date calendars for fiscal publications.
The third principle is about open budget preparation, execution and reporting.
The annual budget framework should include an assessment of fiscal sustainability
and be based on fiscal policy objectives; fiscal rules should be clearly specified; the
annual budget should be prepared within a comprehensive and consistent
6
quantitative macro framework, and the main assumptions underlying the budget
should be provided; the budget should identify major fiscal risks; budget data
should be reported on a gross basis distinguishing revenue, expenditure, and
financing, with expenditure classified in economic, functional and administrative
category; the public sector balance should be reported in cases where non
government public agencies undertake significant quasi fiscal activities; payments
arrears should be comprehensively reported; procurement and employment
regulations should be standardized and accessible to all parties; budget execution
should be internally audited, and audit procedures should be open to review; the
tax administration should be legally protected from political direction, a mid-year
report on budget developments should be presented to the legislature.
Finally, the fourth principle refers to assurances of integrity. Budgetary data should
reflect recent revenue and expenditure trends, underlying macroeconomic
developments, and well-defined policy commitments; the annual budget and the
final accounts should specify the accounting basis (cash or accrual) and the
standards used in the compilation and presentation of data; specific assurances
should be provided as to the quality of the fiscal data. It should be indicated if
fiscal data is internally consistent and has been reconciled with data from other
sources; a national audit body, which is independent of the executive, should
provide timely reports to the legislature and public on the financial integrity of fiscal
accounts; independent experts should be invited to asses fiscal forecasts; an
independent national statistics agency should verify the quality of the fiscal data.
Fiscal Transparency, Performance, and Growth
Adam Smith’s view about the raise of industry and commerce as paving the way to
the development of a “regular government” where nobody has the “sufficient power
to disturb its operations” is particularly relevant. The absence of fiscal
transparency can be associated to countries characterized by corruption, take over
of regulatory frameworks and bodies, and diversion.
7
The IMF Manual on Fiscal Transparency stresses the central importance of good
governance on achieving high-quality growth providing a link between fiscal
transparency and good governance. In terms of the Manual “fiscal transparency
should make those responsible for the design and implementation of fiscal policy
more accountable. The stronger, more credible fiscal policies that follow should
attract the support of well-informed public, result in more favorable access to
capital markets, and reduce the incidence and severity of crises” (IMF, 1999)5.
Corruption and rent-seeking have well known adverse effects on economic
development (Tanzi, 1998, Mauro, 1995, Hall and Jones, 1998, Rodrik, 1998).
Certainly, avoiding corruption is at the core of a transparent fiscal framework. As
Folsher points out “the institutionalization of transparency in budget practices
creates the demand for those types of government systems which are key to
combating corruption: namely an independent, effective and efficient auditing
system, an internal accountability system and an information system that produces
timely and accurate information” (Folsher, 1999). Tanzi (1998) includes the
transparency of rules, laws and processes into the factors affecting the supply of
acts of corruptions. Following Tanzi, “In many countries the lack of transparency in
rules, laws, and processes creates a fertile ground for corruption. Rules are often
confusing, the documents specifying them are not publicly available, and at times,
the rules are changed without properly publicized announcements. Laws and
regulations are written in a way that only trained lawyers can understand and are
often conceptually and not just linguistically opaque about important aspects thus
leaving grounds for different interpretations. Processes and procedures on policy
matters and other actions, as for example for competitions for public projects, are
equally opaque so that, at times it is difficult to understand the process that was
followed before a decision was reached”.
5 Krebs (2005), however, presents a general equilibrium model where an increase in information stemming from improvements in the dissemination of macroeconomic data has two effects on the welfare of countries: a direct effect that increases the efficiency of global capital allocation, and an indirect effect that increases bond price volatility and may reduce welfare.

8
Ellis and Fender (2003) present a model where fiscal transparency is associated
with the length of the public capital’s production lag. Their model shows that as the
economy converges to the steady state the share of corruption in total output is
monotonically decreasing in the level of fiscal transparency. In addition, the level
of output is increasing in fiscal transparency at the steady state. The results of the
model also suggest that a lack of fiscal transparency has particularly adverse
effects for countries in the early stages of development.
Djankov et al (2004) point out that a more transparent government allows the
economy to incur in lower social costs as the government undertakes the task of
controlling economic disorder. In addition, since transparency is likely to be
influenced by what the authors called civic capital, the greater the level of
transparency the lower the social costs of controlling disorder at the efficient
choice.
In summary, the relation between fiscal transparency and economic performance
has long been present in the literature as well as in the stylized experience of cross
countries analysis and policy evaluation. As Kopits (2000) points out “despite the
inherent difficulty of corroborating the link between transparency, on the one hand,
and fiscal discipline and economic performance, on the other, it can be shown that
the better-performing countries in the various major regions of IMF membership
generally follow more transparent fiscal practices. There are good reasons to
believe that fiscal transparency contributes to macroeconomic stability, allocative
efficiency, and fairness. Furthermore, fiscal transparency leads to increase
credibility, which, in turn, helps reduce risk premiums in financial markets and
strengthens support by the electorate”.
Institutions, Growth and Policies
9
The empirical analysis of output per worker has recently followed two main
approaches. On the one hand, studies based on an aggregate production function
where differences among countries’ productivity levels are associated with
differences in savings, and physical and human capital (Mankiw et al, 1992). On
the other hand, there is an approach which goes beyond the production function
and tries to focus the output per capita as a variable related to more profound
determinants of inputs and productivity. This approach is more philosophical since
it tries to comprehend the ultimate causes of factor accumulation in lieu of the
immediate effects of inputs and technology on output per capita. In a seminal
paper, Hall and Jones (1999) presented the role of social infrastructure as
determining economic performance. Social infrastructure was conceptualized as
the set of institutions and public policies that determine the economic environment
in which economic agents take decisions on saving, human capital accumulation,
and family size. Social infrastructure’s main role is to protect the output of
individual units from diversion. A government policy prevents diversion not only by
anti-diversion policies but, also, by refraining itself from diverting behavior. In order
to measure social infrastructure, Hall and Jones use the combination of two
indexes: an index on government anti-diversion policies6, and an index on
openness to international trade. The Hall and Jones paper paved the way to
contributions focused on the relation between institutions and economic
development (Rodrik, 1999; Rodrik, Subramanian and Trebbi, 2004). In a well
known contribution Acemoglu, Johnson and Robinson (AJR, 2001) used the
mortality rates expected by settlers as an instrument for current institutions. In AJR
a risk of expropriations index is used as a measure of institutions.
Policy implications
A key aspect of the recent literature is that improving institutions and property
rights will have a significant effect on per capita income and poverty reduction.
6 A related index also based in the same data source is used by Rodrik (1998) as a proxy for conflict-management institutions.
10
Besley and Burgess (BB 2003) calculate that a halving of world poverty can be
achieved by either a twofold increase in the standard deviation of Hall and Jones’
social infrastructure index, or by an increase of halve of one standard deviation on
AJR’s property rights protection measures. However, as BB points out, “how to
map from these findings into concrete policy suggestions about property rights or
social infrastructure is not immediately clear”. In a related opinion, Sokoloff and
Engerman (SE 2002) state that “ascribing differences in development to
differences in institutions raises the challenge of explaining where the differences
in institutions come from. Those who have addressed this formidable problem have
typically emphasized the importance of presumed exogenous differences in
religion and social inheritance”. One of the main reasons behind the present
skepticism is that, although the institutions literature offers robust estimations of the
institutions-development relation, a corresponding relation between institutions and
concrete policy tools needs further development and research. Clearly, if the
determinants of economic performance are either exogenous or policy
disconnected, little can be done in the medium run to raise living standards in poor
countries7.
On the other hand, the literature associated with focusing the initial conditions as
having enduring influences over the institutional and economic development of the
developing world (AJR, SE) provide little clues about policy action. As SE points
out “although one could imagine that extreme inequality could take generations to
dissipate in even a free an even-handed society, such biases in the path of
institutional development likely go far in explaining the persistence of inequality
over the long run in Latin America and elsewhere in the New World”.
Consequently, a crucial question is if there are alternatives to a mere passing of
7 This view has been challenged by AJR (2001) by saying that “our findings do not imply that institutions today are predetermined by colonial policies and cannot be changed”. The same argument is raised by Rodrik, Subramanian, and Trebbi (2004). The evidence they present, however, are episodes such as the case of Japan during the Meiji Restoration and the case of China since the late 70s, countries which have not experienced the immigration aspects highlighted in the AJR and SE papers. In this regard, one of the three AJR’s premises is that colonial state and institutions persisted even after independence and the empirical interest rests on “the effects of colonization policy conditional on colonization”.
11
time and if these alternatives are available for policy makers through concrete
tools.
Measuring Fiscal Transparency
The measurement of fiscal transparency has recently been facilitated by the new
data and research based on the international financial community’s
recommendations on standard and codes. Alt and Lassen (2002) used self-
reported measures of fiscal transparency from a 1999 OECD questionnaire sent to
Budget Directors of OECD member countries. In 1999 the International Budget
Project and the Institute for Democracy in South Africa compiled a rating of
transparency in South Africa and an overall country rating (Petrie, 2003).
In this paper we make use of an IMF assessment (IMF, 2003) on fiscal
transparency practices for a set of 45 countries. The Fund paper assesses fiscal
transparency of countries in comparison with the best practices implied by the
Code on Fiscal Transparency. Our data come from Annex 2 of the IMF paper
where three main categories of fiscal transparency are analyzed: fiscal data
quality, use of off-budget mechanisms, and clarity on tax policy and administration.
The categories are assessed for a sample of 45 countries including 17 developing,
8 transition, 14 emerging, and 6 advanced nations.
The fiscal quality data category has 4 components, the use of off-budget
mechanisms category includes 3 components and, finally, the tax policy and
administration category encompasses 2 components. The components of these
categories for each country are classified in a pass-fail range allowing, therefore,
for a quantitative measurement of a fiscal transparency index.
The quality of fiscal data category is has four components. The first element is
budget realism. The assessment includes the discrepancy between budgets and
outturn, the budgetary covering of obligations, the overuse of supplementaries, and
12
the occurrence of under funded utilities. The second component is about budget
execution data and focuses on the quality of ex-post data and control procedures.
It also focuses on whether data is reconciled, if suspense accounts are cleared,
and if arrears and irregular procedures are common and unreported. The third
component is the coverage of fiscal activity. The analysis is focused on the
comprehensiveness of the general government data coverage. Particular attention
is paid on the consistency with which the government data is treated in the Ministry
of Finance and in the Central Bank accounts, the quality of timely data on sub
national levels of government, and the use of the privatization proceeds. In
addition, the inclusion of extrabudgetary funds, and externally financed projects
into fiscal reports and documents are taken into account. The fourth component is
about external audit and considers if the audit of final accounts is made on a
satisfactory mode, if the periodicity of audits is reasonable, if there are adequate
resources and technical capacity to carry out the audits, and if there is a follow up
on audit findings.
The second main category is the extrabudgetary activity. This category has three
components: the complete coverage of contingent liabilities, the quasi-fiscal
operations related to the financial sector, and the quasi-fiscal operations related to
the non-financial public enterprises. Quasi-fiscal activities related to below market
interest rates, lending policies, loan guarantees and/or individual lending decisions
subject to political direction are considered in this category. Non-reported
employment, price setting, below cost pricing, and cross subsidizing in public firms
are also taken into account.
The third category is the clarity on tax policy and administration and includes two
components. It assesses whether tax expenditures are published in budget
documents. In addition, it analyzes if the tax administration procedures are subject
to administrative discretion and characterized by unclear rules, inadequate or
bureaucratic appeal procedures, and poor observation of the legal framework.

13
Following Jones et al (1997), we computed our index on fiscal transparency by
adding up the components across the categories. Since the three categories have
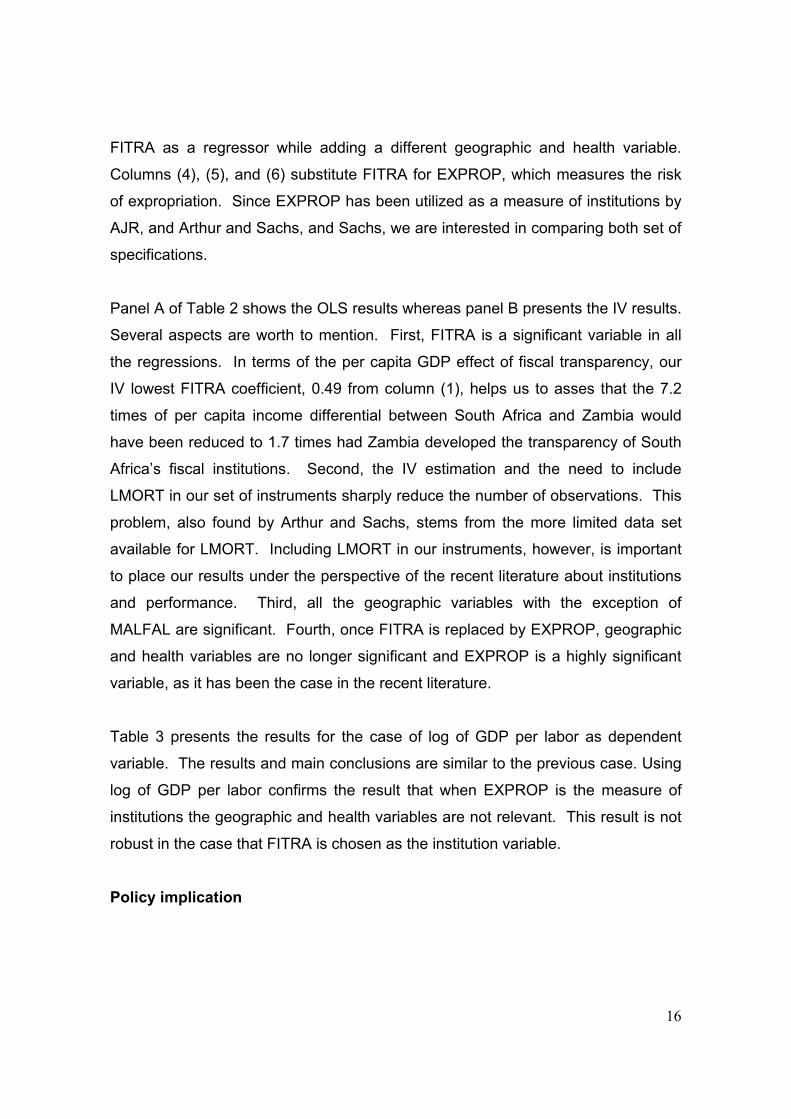
a total of 9 components, the highest level of the fiscal transparency index is nine
and the lowest level is cero. In our sample the country with greater transparency
index is Italy whereas three countries receive cero index level: Cameroon, Uganda
and Ukraine. Figure I plots the log of 2003 per capita income against our fiscal
transparency index.
FISCAL TRANSPARENCY INDEX AND LOG OF GDP PER CAPITA
ARM
BEN
BRABGR
BFA
CMR
CAN
CZE
EGY
FRA
GRC
HND
HUN
ITA
JPN
KAZ
KOR
KGZ
LVA
MWI
MLI
MEX
MNG
MOZ
NIC
PAK PNG
PHL
POL
RUS
SVK
SVN
ZAF
LKA
SWE
TUNTUR
UGA
UKR
URY
ZMB
AZE
TZA
4,000
5,000
6,000
7,000
8,000
9,000
10,000
11,000
0 1 2 3 4 5 6 7 8 9 10
FISCAL TRANSPARENCY INDEX
LOG
OF
GD
P PE
R C
API
TA 2
003
Estimation
Our empirical analysis is based on the assumption that fiscal transparency is a
summary variable for the institutional quality of nations. To study the effect of
transparency on per capita income we run regressions of the form:
Log yi = α + β FITRAi + X’i γ + εi (1)
14
Where yi is per capita income in country i, FITRA is the fiscal transparency index of
country i, Xi is a vector of geographic, health, and other variables, and εi is a
random error term. Particularly relevant is the coefficient β, which captures the
influence of fiscal transparency on economic performance. The empirical
approach behind equation 1 has been used by AJR, Rodrik, Subramanian and
Trebbi (2002 ), Arthur and Sachs (2001), and Sachs (2002). Equation 1 allows us
to assess the empirical link between institutions and geographic and health
variables on per capita income. AJR used an index of protection against
expropriations (EXPROP) to capture institutional differences. In their empirical
results EXPROP instrumented with the measure of settlers’ mortality rates from the
early 19th century is a significant variable for explaining per capita income
differences. In addition, geographic variables are not significant in their
regressions. Rodrik, Subramanian and Trebbi used a rule of law variable as a
measure of the quality of institutions; their empirical results stressed the
importance of institutions in explaining income differentials and found that
controlling for institutions, geographic and integrations variables do not have
additional power in explaining development. Arthur and Sachs also use EXPROP
as an institutional quality measure; they examine the role of other geographically-
related variables such as malaria prevalence or health indicators. Under a more
comprehensive data set than the one employed by AJR, Arthur and Sachs
conclude that both institutions and geographical-related variables play a significant
role in explaining income differentials; they also show that the predominance of
institutional variables found by AJR are probably the result of the small sample of
ex-colonies and to the limited geographic dispersions of those countries. Finally,
Sachs (2002)’s empirical results show that malaria transmission directly affects per
capita income after controlling for institutions.
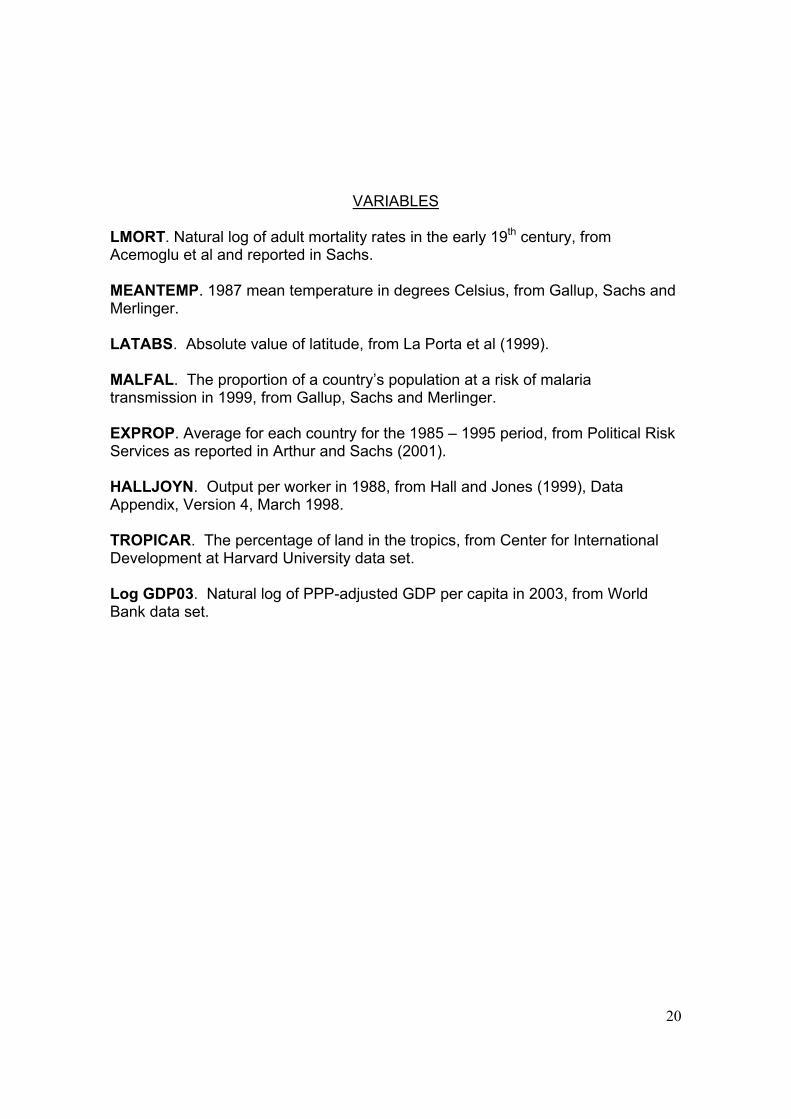
We use 3 geographic and health variables in our empirical analysis: LATABS, the
absolute value of latitude, TROPICAR, the percentage of land in the tropics, and
MALFAL, the proportion of countries’ population at risk of malaria transmission.
We run regressions using two measures of our dependent variable, economic
15
performance. The first is the log of PPP-adjusted GDP per capita in 2003. The
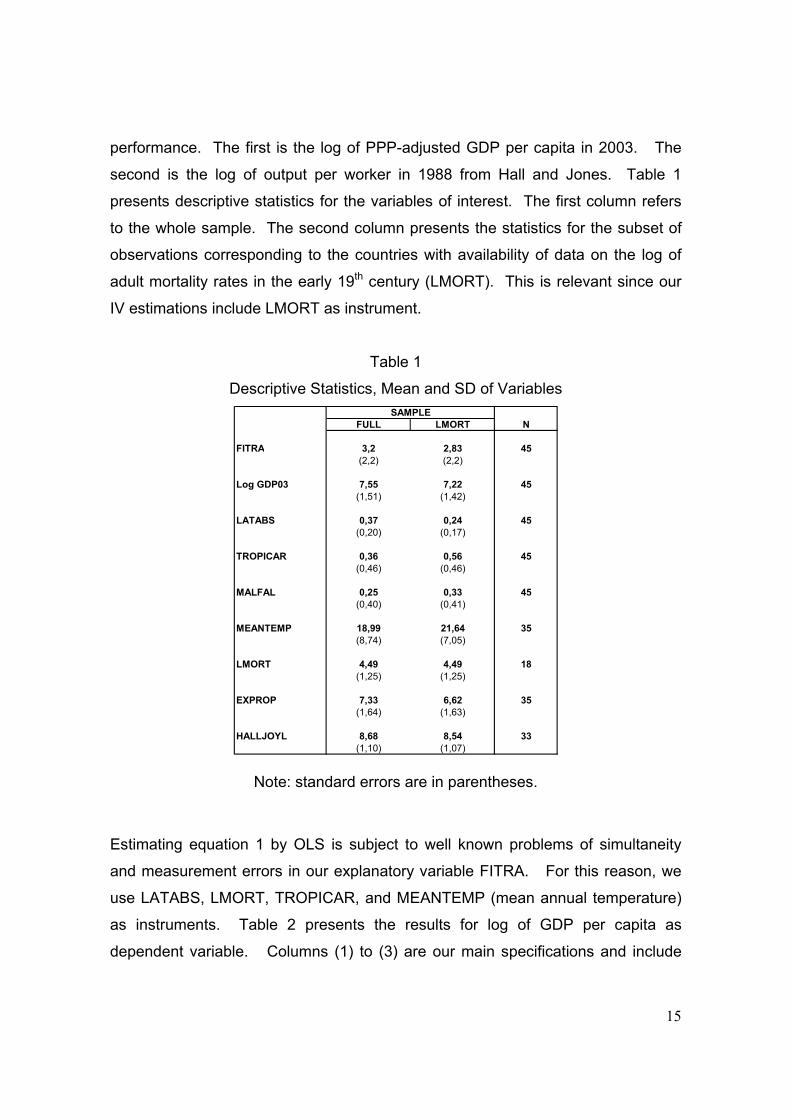
second is the log of output per worker in 1988 from Hall and Jones. Table 1
presents descriptive statistics for the variables of interest. The first column refers
to the whole sample. The second column presents the statistics for the subset of
observations corresponding to the countries with availability of data on the log of
adult mortality rates in the early 19th century (LMORT). This is relevant since our
IV estimations include LMORT as instrument.
Table 1
Descriptive Statistics, Mean and SD of Variables
FULL LMORT N
FITRA 3,2 2,83 45(2,2) (2,2)
Log GDP03 7,55 7,22 45(1,51) (1,42)
LATABS 0,37 0,24 45(0,20) (0,17)
TROPICAR 0,36 0,56 45(0,46) (0,46)
MALFAL 0,25 0,33 45(0,40) (0,41)
MEANTEMP 18,99 21,64 35(8,74) (7,05)
LMORT 4,49 4,49 18(1,25) (1,25)
EXPROP 7,33 6,62 35(1,64) (1,63)
HALLJOYL 8,68 8,54 33(1,10) (1,07)
SAMPLE
Note: standard errors are in parentheses.
Estimating equation 1 by OLS is subject to well known problems of simultaneity
and measurement errors in our explanatory variable FITRA. For this reason, we
use LATABS, LMORT, TROPICAR, and MEANTEMP (mean annual temperature)
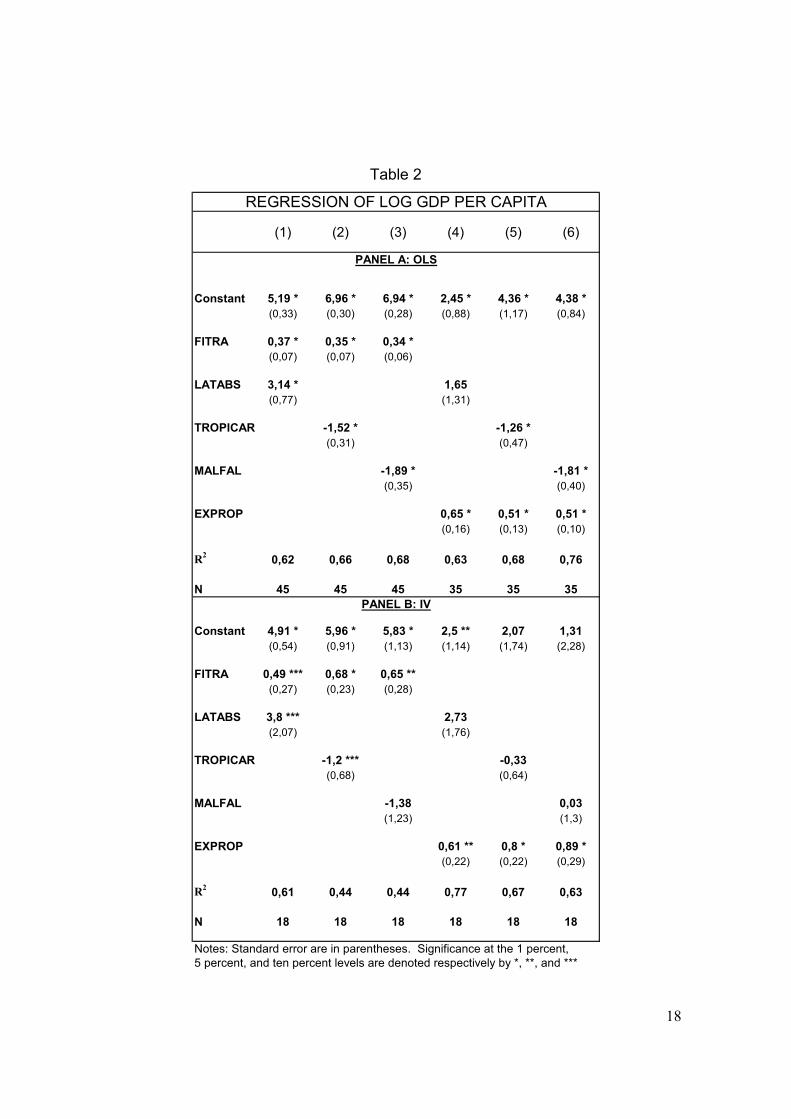
as instruments. Table 2 presents the results for log of GDP per capita as
dependent variable. Columns (1) to (3) are our main specifications and include
16
FITRA as a regressor while adding a different geographic and health variable.
Columns (4), (5), and (6) substitute FITRA for EXPROP, which measures the risk
of expropriation. Since EXPROP has been utilized as a measure of institutions by
AJR, and Arthur and Sachs, and Sachs, we are interested in comparing both set of
specifications.
Panel A of Table 2 shows the OLS results whereas panel B presents the IV results.
Several aspects are worth to mention. First, FITRA is a significant variable in all
the regressions. In terms of the per capita GDP effect of fiscal transparency, our
IV lowest FITRA coefficient, 0.49 from column (1), helps us to asses that the 7.2
times of per capita income differential between South Africa and Zambia would
have been reduced to 1.7 times had Zambia developed the transparency of South
Africa’s fiscal institutions. Second, the IV estimation and the need to include
LMORT in our set of instruments sharply reduce the number of observations. This
problem, also found by Arthur and Sachs, stems from the more limited data set
available for LMORT. Including LMORT in our instruments, however, is important
to place our results under the perspective of the recent literature about institutions
and performance. Third, all the geographic variables with the exception of
MALFAL are significant. Fourth, once FITRA is replaced by EXPROP, geographic
and health variables are no longer significant and EXPROP is a highly significant
variable, as it has been the case in the recent literature.
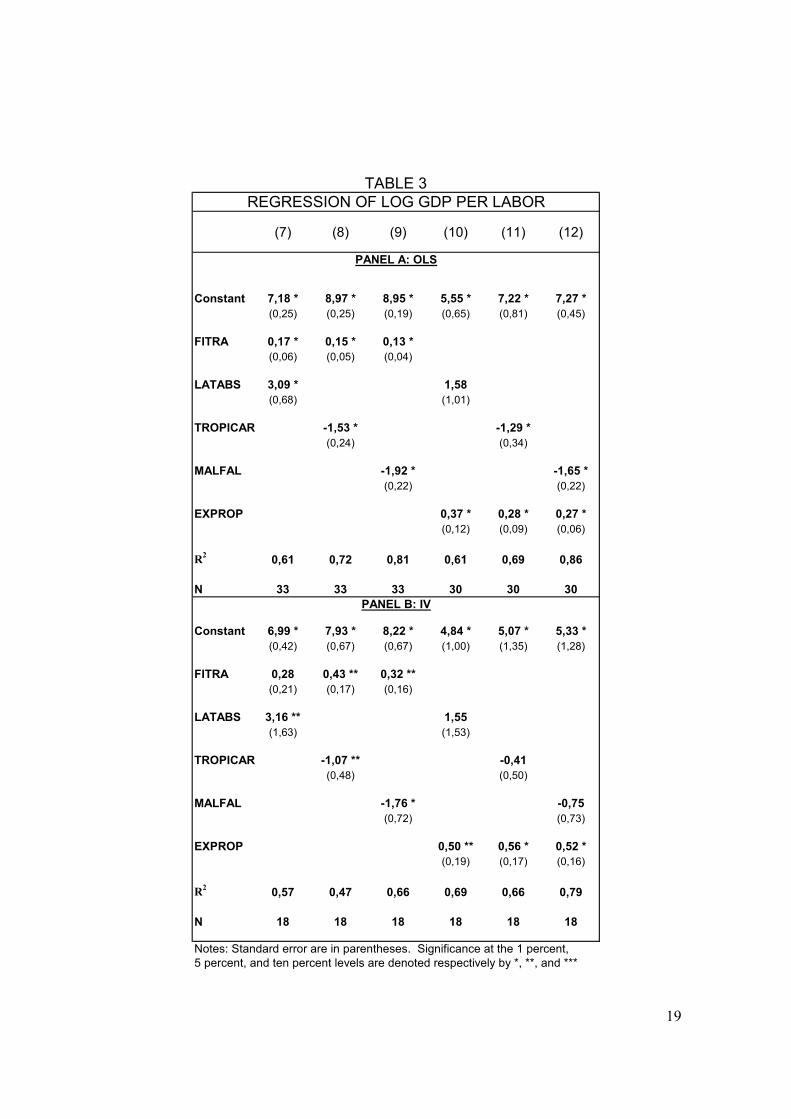
Table 3 presents the results for the case of log of GDP per labor as dependent
variable. The results and main conclusions are similar to the previous case. Using
log of GDP per labor confirms the result that when EXPROP is the measure of
institutions the geographic and health variables are not relevant. This result is not
robust in the case that FITRA is chosen as the institution variable.
Policy implication

17
Our results suggest that focusing on the improvement of fiscal transparency can be
a concrete action to provide a growth impulse. By mapping institutional upgrading
to proposals including the clear definition of the scope and responsibilities of the
government, the public availability of fiscal information, the openly preparation and
execution of the budget and the assurance of the integrity of fiscal procedures,
policy makers and financial institutions can add a new dimension of policy tools. In
this regard, however, although the Fiscal Transparency Code and the progress
already made in identifying transparency tools provide a trip-tick for institutional
enhancement, the task of improving a country’s fiscal transparency is a formidable
one at the political level. As Tanzi (1998) has stressed, some of the policies
needed include the reform of the state since a complex net of regulations,
techniques and interest groups must be overhauled. For developing countries the
substitution of quasi fiscal regulations for a tax and spending framework included in
the budget needs a fiscal reform to increase taxation, which, in turn, requires time
to be accomplished. In the implementation of the reform, financial markets should
also play a role in fostering a more transparent framework and, also, the civic
society can also be required to leverage the reform process (Petrie, 2003)
The empirical results are robust in highlighting the role of fiscal transparency under
a generally accepted model of economic performance. Further work associated
with transparency data includes the relation between corruption and transparency,
as well as the effects of transparency on financial variables as bond price volatility.
Our results are preliminary and need to be confronted with the evidence stemming
from a more comprehensive data set. The development of such data set can be
facilitated by the ongoing assessment of countries made by international
organizations.
18
Table 2
(1) (2) (3) (4) (5) (6)
Constant 5,19 * 6,96 * 6,94 * 2,45 * 4,36 * 4,38 *(0,33) (0,30) (0,28) (0,88) (1,17) (0,84)
FITRA 0,37 * 0,35 * 0,34 *(0,07) (0,07) (0,06)
LATABS 3,14 * 1,65(0,77) (1,31)
TROPICAR -1,52 * -1,26 *(0,31) (0,47)
MALFAL -1,89 * -1,81 *(0,35) (0,40)
EXPROP 0,65 * 0,51 * 0,51 *(0,16) (0,13) (0,10)
R2 0,62 0,66 0,68 0,63 0,68 0,76
N 45 45 45 35 35 35
Constant 4,91 * 5,96 * 5,83 * 2,5 ** 2,07 1,31(0,54) (0,91) (1,13) (1,14) (1,74) (2,28)
FITRA 0,49 *** 0,68 * 0,65 **(0,27) (0,23) (0,28)
LATABS 3,8 *** 2,73(2,07) (1,76)
TROPICAR -1,2 *** -0,33(0,68) (0,64)
MALFAL -1,38 0,03(1,23) (1,3)
EXPROP 0,61 ** 0,8 * 0,89 *(0,22) (0,22) (0,29)
R2 0,61 0,44 0,44 0,77 0,67 0,63
N 18 18 18 18 18 18
Notes: Standard error are in parentheses. Significance at the 1 percent,5 percent, and ten percent levels are denoted respectively by *, **, and ***
REGRESSION OF LOG GDP PER CAPITA
PANEL B: IV
PANEL A: OLS
19
TABLE 3
(7) (8) (9) (10) (11) (12)
Constant 7,18 * 8,97 * 8,95 * 5,55 * 7,22 * 7,27 *(0,25) (0,25) (0,19) (0,65) (0,81) (0,45)
FITRA 0,17 * 0,15 * 0,13 *(0,06) (0,05) (0,04)
LATABS 3,09 * 1,58(0,68) (1,01)
TROPICAR -1,53 * -1,29 *(0,24) (0,34)
MALFAL -1,92 * -1,65 *(0,22) (0,22)
EXPROP 0,37 * 0,28 * 0,27 *(0,12) (0,09) (0,06)
R2 0,61 0,72 0,81 0,61 0,69 0,86
N 33 33 33 30 30 30
Constant 6,99 * 7,93 * 8,22 * 4,84 * 5,07 * 5,33 *(0,42) (0,67) (0,67) (1,00) (1,35) (1,28)
FITRA 0,28 0,43 ** 0,32 **(0,21) (0,17) (0,16)
LATABS 3,16 ** 1,55(1,63) (1,53)
TROPICAR -1,07 ** -0,41(0,48) (0,50)
MALFAL -1,76 * -0,75(0,72) (0,73)
EXPROP 0,50 ** 0,56 * 0,52 *(0,19) (0,17) (0,16)
R2 0,57 0,47 0,66 0,69 0,66 0,79
N 18 18 18 18 18 18
Notes: Standard error are in parentheses. Significance at the 1 percent,5 percent, and ten percent levels are denoted respectively by *, **, and ***
REGRESSION OF LOG GDP PER LABOR
PANEL A: OLS
PANEL B: IV
20
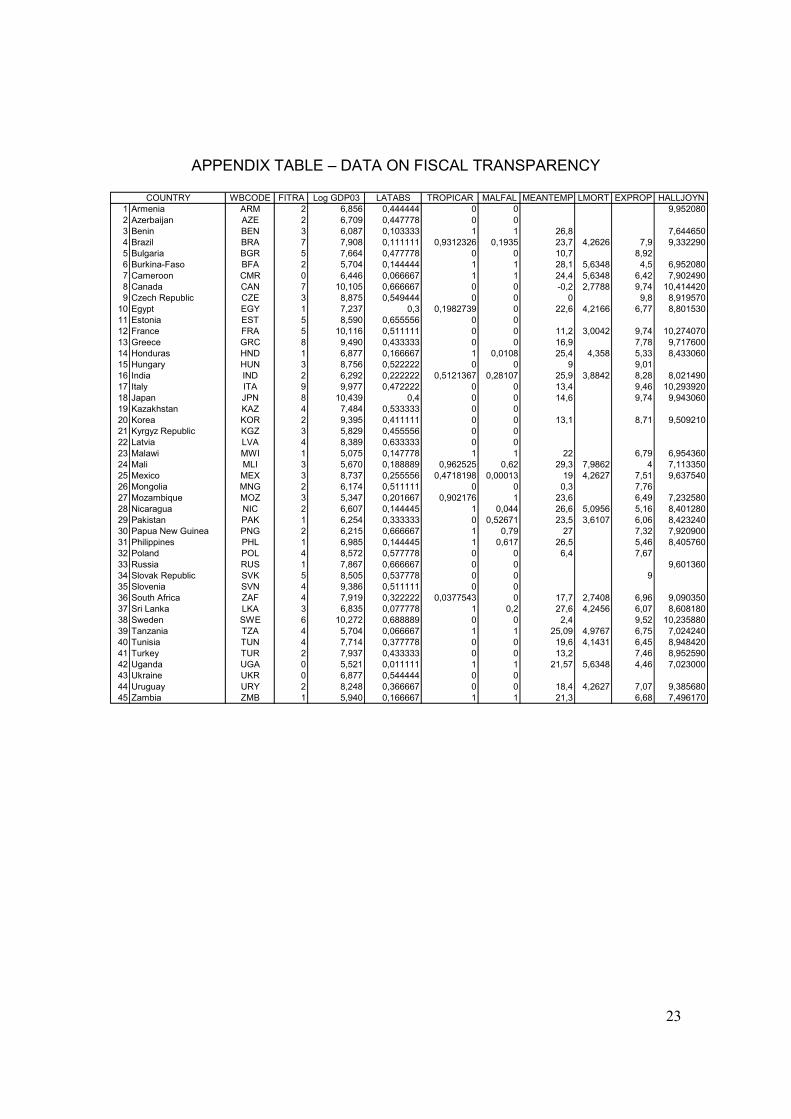
VARIABLES LMORT. Natural log of adult mortality rates in the early 19th century, from Acemoglu et al and reported in Sachs. MEANTEMP. 1987 mean temperature in degrees Celsius, from Gallup, Sachs and Merlinger. LATABS. Absolute value of latitude, from La Porta et al (1999). MALFAL. The proportion of a country’s population at a risk of malaria transmission in 1999, from Gallup, Sachs and Merlinger. EXPROP. Average for each country for the 1985 – 1995 period, from Political Risk Services as reported in Arthur and Sachs (2001). HALLJOYN. Output per worker in 1988, from Hall and Jones (1999), Data Appendix, Version 4, March 1998. TROPICAR. The percentage of land in the tropics, from Center for International Development at Harvard University data set. Log GDP03. Natural log of PPP-adjusted GDP per capita in 2003, from World Bank data set.
21
REFERENCES Acemoglu, D, Johnson, S, and Robinson, J, “The Colonial Origins of Comparative Development: An Empirical Investigation”, The American Economic Review, December 2001. Alt, J, and Lassen, D, “Fiscal Transparency and Fiscal Policy Outcome in OECD Countries”, Economic Policy research Unit, University of Copenhagen, 2002. Arthur, J, and Sachs, J, “Institutions and Geography: Comment on Acemoglu, Johnson and Robinson”, NBER, Working Paper 8114, 2001. Besley, T, and Burgess, R. “Halving Global Poverty”, mimeo, London School of Economics, March 2003. Djankov, S, Glaeser, E, La Porta, R, Lopez de Silanes, F, and Shleifer, A,“The New Comparative Economics”, 2004. Ellis, C, and Fender, J, “Corruptions and Transparency in a Growth Model”, University of Oregon, 2003. www.uoregon.edu/~cjellis/Research/JuneCorruption.pdf Folsher, A, “Transparency and participation in Soth Africa’s budget process”, The 9th International Anticorruption Conference, www.transparency.org/iacc/9th_iacc/papers/day4/ws2/d4ws2_afolschersummary.html Hall, R, and Jones C, “Why do Some Countries Produce so Much Output per Worker than Others?”, Quarterly Journal of Economics, February, 1999. IMF, “Manual on Fiscal Transparency”, 1999. IMF, “Assessing and Promoting Fiscal Transparency: a Report on Progress”, prepared by the Fiscal Affairs Department. 2003. http://www.imf.org/external/np/pdr/sac/2003/030503s2.pdf Jones, M, Sanguinetti, P, and Tomasi, Mariano,(1997) “Politics, Institutions, and Fiscal Performance in the Argentine Provinces”. Documento de Trabajo 16, Universidad de San Andrés, Departamento de Economía. Kopits, J, “Transparency in Government Operations”, Inter American Development Bank, Conference: Transparency and Development in Latin America and the Caribbean, 2002. www.iadb.org/leg/Documents/Transparency%20Kopitz%20Eng.pdf Krebs, T, “Fundamentals, Information, and International Capital Flows: a Welfare Analysis”, European Economic Review, April 2005, vol. 49, iss3, pp 579-98.
22
Mankiw, G, Romer, D and Weil, D. “A Contribution to the Empirics of Economic Growth”, Quarterly Journal of Economics, v. 107, 2, May, 1992. Mauro, Paolo (1995), “Corruption and growth”, Quarterly Journal of Economics 110, 681-712. Petrie, M, “Promoting Fiscal Transparency: the Complementary Roles of the IMF, Financial Markets and Civic Society”, IMF Working Paper 09/199, 2003. Rodrik, D, “Where did all the Growth Go? External Shocks, Social Conflict, and Growth Collapses”, 1998, Harvard University. Sachs, J, “Institutions Don’t Rule: A Refutation to Institutional Fundamentalism”, mimeo, Earth Institute at Columbia University, 2002. Sokoloff, K, and Engerman, S, “History Lessons. Institutions, Factor Endowments, and Path of Development in the New World”. Journal of Economic Perspectives, v.14, n.3, 2002. Tanzi, V, “Corruption Around the World: Causes, Consequences, Scopes and Cures” IMF Working Paper N 98/63, May 1998.
23
APPENDIX TABLE – DATA ON FISCAL TRANSPARENCY
WBCODE FITRA Log GDP03 LATABS TROPICAR MALFAL MEANTEMP LMORT EXPROP HALLJOYN
1 Armenia ARM 2 6,856 0,444444 0 0 9,9520802 Azerbaijan AZE 2 6,709 0,447778 0 03 Benin BEN 3 6,087 0,103333 1 1 26,8 7,6446504 Brazil BRA 7 7,908 0,111111 0,9312326 0,1935 23,7 4,2626 7,9 9,3322905 Bulgaria BGR 5 7,664 0,477778 0 0 10,7 8,926 Burkina-Faso BFA 2 5,704 0,144444 1 1 28,1 5,6348 4,5 6,9520807 Cameroon CMR 0 6,446 0,066667 1 1 24,4 5,6348 6,42 7,9024908 Canada CAN 7 10,105 0,666667 0 0 -0,2 2,7788 9,74 10,4144209 Czech Republic CZE 3 8,875 0,549444 0 0 0 9,8 8,919570
10 Egypt EGY 1 7,237 0,3 0,1982739 0 22,6 4,2166 6,77 8,80153011 Estonia EST 5 8,590 0,655556 0 012 France FRA 5 10,116 0,511111 0 0 11,2 3,0042 9,74 10,27407013 Greece GRC 8 9,490 0,433333 0 0 16,9 7,78 9,71760014 Honduras HND 1 6,877 0,166667 1 0,0108 25,4 4,358 5,33 8,43306015 Hungary HUN 3 8,756 0,522222 0 0 9 9,0116 India IND 2 6,292 0,222222 0,5121367 0,28107 25,9 3,8842 8,28 8,02149017 Italy ITA 9 9,977 0,472222 0 0 13,4 9,46 10,29392018 Japan JPN 8 10,439 0,4 0 0 14,6 9,74 9,94306019 Kazakhstan KAZ 4 7,484 0,533333 0 020 Korea KOR 2 9,395 0,411111 0 0 13,1 8,71 9,50921021 Kyrgyz Republic KGZ 3 5,829 0,455556 0 022 Latvia LVA 4 8,389 0,633333 0 023 Malawi MWI 1 5,075 0,147778 1 1 22 6,79 6,95436024 Mali MLI 3 5,670 0,188889 0,962525 0,62 29,3 7,9862 4 7,11335025 Mexico MEX 3 8,737 0,255556 0,4718198 0,00013 19 4,2627 7,51 9,63754026 Mongolia MNG 2 6,174 0,511111 0 0 0,3 7,7627 Mozambique MOZ 3 5,347 0,201667 0,902176 1 23,6 6,49 7,23258028 Nicaragua NIC 2 6,607 0,144445 1 0,044 26,6 5,0956 5,16 8,40128029 Pakistan PAK 1 6,254 0,333333 0 0,52671 23,5 3,6107 6,06 8,42324030 Papua New Guinea PNG 2 6,215 0,666667 1 0,79 27 7,32 7,92090031 Philippines PHL 1 6,985 0,144445 1 0,617 26,5 5,46 8,40576032 Poland POL 4 8,572 0,577778 0 0 6,4 7,6733 Russia RUS 1 7,867 0,666667 0 0 9,60136034 Slovak Republic SVK 5 8,505 0,537778 0 0 935 Slovenia SVN 4 9,386 0,511111 0 036 South Africa ZAF 4 7,919 0,322222 0,0377543 0 17,7 2,7408 6,96 9,09035037 Sri Lanka LKA 3 6,835 0,077778 1 0,2 27,6 4,2456 6,07 8,60818038 Sweden SWE 6 10,272 0,688889 0 0 2,4 9,52 10,23588039 Tanzania TZA 4 5,704 0,066667 1 1 25,09 4,9767 6,75 7,02424040 Tunisia TUN 4 7,714 0,377778 0 0 19,6 4,1431 6,45 8,94842041 Turkey TUR 2 7,937 0,433333 0 0 13,2 7,46 8,95259042 Uganda UGA 0 5,521 0,011111 1 1 21,57 5,6348 4,46 7,02300043 Ukraine UKR 0 6,877 0,544444 0 044 Uruguay URY 2 8,248 0,366667 0 0 18,4 4,2627 7,07 9,38568045 Zambia ZMB 1 5,940 0,166667 1 1 21,3 6,68 7,496170
COUNTRY
Copyright © 2022 FDOKUMEN