FULL REPORT - Extractive Industries Transparency Initiative
90
NEITI SOLID MINERALS AUDIT REPORT FOR 2016 Tajudeen Badejo & Co (Chartered Accountants) Page 1 of 90 FULL REPORT November 2018
-
Upload
khangminh22 -
Category
Documents
-
view
0 -
download
0
Transcript of FULL REPORT - Extractive Industries Transparency Initiative
NEITI SOLID MINERALS AUDIT REPORT FOR 2016
Tajudeen Badejo & Co (Chartered Accountants) Page 1 of 90
FULL REPORT November 2018
NEITI SOLID MINERALS AUDIT REPORT FOR 2016
Tajudeen Badejo & Co (Chartered Accountants) Page 2 of 90

NEITI SOLID MINERALS AUDIT REPORT FOR 2016
Tajudeen Badejo & Co (Chartered Accountants) Page 3 of 90
Table of Contents
LIST OF TABLES.................................................................................................................................................. 5
List of figures ......................................................................................................................................................... 7
List of Acronyms and meanings ............................................................................................................................. 8
1.0 INTRODUCTION ..................................................................................................................................... 9
1.1 Objective of the Audit ......................................................................................................................... 11
1.2 Approach and Methodology ................................................................................................................ 12
2.0. LEGAL AND INSTITUTIONAL FRAMEWORK ................................................................................ 20
2.1 Legal Framework ................................................................................................................................ 20
2.2 Institutional Framework ...................................................................................................................... 22
2.3 Fiscal Regime ...................................................................................................................................... 25
2.5 License Register .................................................................................................................................. 30
2.6 Contract Transparency ........................................................................................................................ 34
2.7 Beneficial Ownership (BO) ................................................................................................................. 35
2.8 State Participation ............................................................................................................................... 35
3.0 PRODUCTION AND EXPORT ............................................................................................................. 36
3.1 Overview of the Nigeria Mining Industry ........................................................................................... 36
3.2 Exploration .......................................................................................................................................... 36
3.3 Production Data ................................................................................................................................... 44
3.4 Export .................................................................................................................................................. 48
4.0 REVENUE COLLECTION .................................................................................................................... 53
4.1 Comprehensive Disclosure of Revenue .............................................................................................. 53
4.2 In-kind Revenues ................................................................................................................................ 66
4.3 Infrastructure Provisions / Barter Arrangements ................................................................................. 66
4.4 Transportation Payments ..................................................................................................................... 66
4.5 State Owned Enterprise Transactions.................................................................................................. 67
4.6 Sub-National Payments ....................................................................................................................... 67
5.0 REVENUE ALLOCATION .................................................................................................................... 68
5.1 Distribution of Revenues ..................................................................................................................... 68

NEITI SOLID MINERALS AUDIT REPORT FOR 2016
Tajudeen Badejo & Co (Chartered Accountants) Page 4 of 90
5.2 Sub-National Transfers ....................................................................................................................... 68
5.3 Revenue Management and Expenditures ............................................................................................ 71
6.0 SOCIAL AND ECONOMIC SPENDING ............................................................................................. 73
6.1 Social Expenditures ............................................................................................................................. 73
6.2 Quasi-Fiscal Expenditures by State Owned Enterprises: .................................................................... 74
6.3 Contribution to the Economy .............................................................................................................. 74
7.0 FINDINGS AND RECOMMENDATIONS ........................................................................................... 78
7.1 Highlight of issues raised in previous Audits (2007 – 2015) .............................................................. 78
7.2 Current Audit Findings and Recommendations .................................................................................. 87

NEITI SOLID MINERALS AUDIT REPORT FOR 2016
Tajudeen Badejo & Co (Chartered Accountants) Page 5 of 90
LIST OF TABLES
S/N TABLE No. DESCRIPTION
1 Table 1.1 List of NEITI published reports 2007 – 2015
2 Table 1.2 Mineral resources distribution in Nigeria
3 Table 1.3 Summary of financial flows
4 Table 1.4 Analysis of royalty declared by government in 2016
5 Table 1.5 List of companies that met threshold
6 Table 1.6 Analysis of initial discrepancy
7 Table 1.7 List of documents obtained for data quality and assurance
8 Table 1.8 Contribution of reconciled revenue streams
9 Table 2.1 Schedule of revenue flows for 2016 SMA
10 Table 2.2 Type of mineral titles
11 Table 2.3 Summary of title register
12 Table 2.4 Distribution of valid titles across the state
13 Table 2.5 Registered mining cooperatives as at 2016
14 Table 2.6 Analysis of mineral buying centres per state
15 Table 3.1 Analysis of exploration licenses issued for minerals in 2016
16 Table 3.2 Details of exploration licenses issued for Gold in 2016
17 Table 3.3 Details of exploration licenses issued for Lead-Zinc in 2016
18 Table 3.4 Details of exploration licenses issued for Tin in 2016
19 Table 3.5 Details of exploration licenses issued for Iron Ore in 2016
20 Table 3.6 Details of exploration licenses issued for Limestone in 2016
21 Table 3.7 Details of exploration licenses issued for Coal in 2016
22 Table 3.8 Production data by mineral type
23 Table 3.9 Comparison of production data by mineral type
24 Table 3.10 State contribution to royalty paid
25 Table 3.11 Comparison of 2016 and 2015 production data
27 Table 3.12 Analysis of production by extractive companies
28 Table 3.13 Analysis of solid minerals export
29 Table 3.14 Destination of Nigeria’s solid minerals export in 2016
30 Table 3.15 Contribution of the solid minerals sub-sector to non-oil export in 2016
31 Table 3.16 Comparison of value of solid minerals export in 2016 and 2015
32 Table 3.17 Major minerals export destinations and value
33 Table 4.1 Initial position of receipts and payments
34 Table 4.2 Position of receipts and payments after reconciliation
35 Table 4.3 Analysis of revenue declared by government in 2016
36 Table 4.4 Contribution by revenue streams to government
37 Table 4.5 Revenue collection by FIRS
38 Table 4.6 Revenue collection by MID
39 Table 4.7 Analysis of royalty collection per state
40 Table 4.8 Analysis of royalty paid by companies
41 Table 4.9 Reconciliation adjustment
42 Table 4.10 Contribution of royalty by minerals
43 Table 4.11 Analysis of actual royalty paid and expected royalty per mineral

NEITI SOLID MINERALS AUDIT REPORT FOR 2016
Tajudeen Badejo & Co (Chartered Accountants) Page 6 of 90
44 Table 4.12 Revenue collection by MCO
45 Table 4.13 Summary of unilateral disclosures by government revenue receiving agencies
46 Table 4.14 Summary of unilateral disclosures made by companies
47 Table 4.15 Summary of revenue receivable in 2016
48 Table 4.16 Initial reconciliation of payments and receipts
49 Table 4.17 Contribution of various revenue streams to the government in 2016
50 Table 4.18 Contribution of companies declared payment by revenue stream
51 Table 4.19 Summary of reconciliation of royalty
52 Table 4.20 Summary of reconciliation of taxes and other revenue
53 Table 4.21 Summary of un-reconciled payments
54 Table 4.22 Sub-national payments
55 Table 5.1 Summary of distribution of accumulated N9.923billion solid minerals revenue
56 Table 5.2 Distribution of N9.92billion solid minerals revenue to the federating units
57 Table 6.1 Analysis of companies’ declared statutory and voluntary social expenditures
58 Table 6.2 Analysis of companies declared social expenditures in cash or kind
59 Table 6.3 Solid minerals contribution by sector
60 Table 6.4 Contribution of the Solid Minerals Sector to the Economy in 2016
61 Table 6.5 Percentage of solid minerals export to the sector’s contribution to the economy
62 Table 6.6 Contribution to Gross Domestic Product (GDP)
63 Table 6.7 Breakdown of the solid minerals sector contribution to total government
collection in 2016
64 Table 6.8 Analysis of employment data by extractive companies in 2016

NEITI SOLID MINERALS AUDIT REPORT FOR 2016
Tajudeen Badejo & Co (Chartered Accountants) Page 7 of 90
LIST OF FIGURES
S/N FIGURE No. DESCRIPTION
1 Figure 1.1 Comparative analysis of receipts and payments for 2007 - 2015
2 Figure 1.2 Map of Nigeria showing solid minerals and locations
3 Figure 1.3 Scope of audit
4 Figure 2.1 Mineral titles
5 Figure 2.2 Analysis of valid titles
6 Figure 2.3 Valid titles per state
7 Figure 2.4 Analysis of titles issued in 2016
8 Figure 2.5 Analysis of titles transferred in 2016
9 Figure 2.6 Analysis of titles revoked in 2016
10 Figure 2.7 Registered mining cooperatives as at 2016
11 Figure 3.1 Exploration licenses issued for minerals in 2016
12 Figure 3.2 Four years trend analysis of the two most produced minerals
13 Figure 3.3 Quantity of minerals produced by each state in both years
14 Figure 3.4 Production by major companies
15 Figure 3.5 Three years trend analysis of solid minerals export
16 Figure 3.6 Contribution of the solid minerals sub-sector to non-oil export in 2016
17 Figure 3.7 Comparison of value of solid mineral export in 2016 and 2015
18 Figure 3.8 Major minerals export destinations and value
19 Figure 4.1 Discrepancy between initial position of receipts and payments
20 Figure 4.2 Discrepancy between final reconciliation of receipts and payments
21 Figure 4.3 Analysis of government declared revenue
22 Figure 4.4 Comparison of revenue collection by government: 2013 - 2016
23 Figure 4.5 Revenue collection by FIRS
24 Figure 4.6 Analysis of royalty collection per state
25 Figure 4.7 Contribution of royalty by minerals
26 Figure 5.1 The Flow of Revenues
27 Figure 5.2 The Budget preparation process
28 Figure 6.1 Solid minerals contribution by sector
29 Figure 7.1 Photographs during mineral processing

NEITI SOLID MINERALS AUDIT REPORT FOR 2016
Tajudeen Badejo & Co (Chartered Accountants) Page 8 of 90
LIST OF ACRONYMS AND MEANINGS
S/No ACRONYM MEANING
1 ANFO Ammonium Fuel Oil
2 ASM Artisanal and small Scale Mining
3 ANAN Association of National Accountants of Nigeria
4 AFS Audited Financial Statements
5 BO Beneficial Ownership
6 BAC Board of Appeal Commissioners
7 BPP Bureau of Public Procurement
8 CGT Capital Gain Tax
9 CBN Central Bank of Nigeria
10 CS Civil Society
11 CDA Community Development Agreement
12 CIT Companies Income Tax
13 CITA Companies Income Tax Act
14 CAMA Company and Allied Matters Act
15 CRF Consolidated Revenue Fund
16 CAC Corporate Affairs Commission
17 CSR Corporate Social Responsibility
18 EIA Environmental Impact Assessment
19 EL Exploratory Licence
20 EEG Export Expansion Grant
21 EOI Expression of Interest
22 EITI Extractive Industries Transparency Initiative
23 FCT Federal Capital Territory
24 FEC Federal Executive Council
25 FG Federal Government
26 FGN Federal Government of Nigeria
27 FIRS Federal Inland Revenue Service
28 FNBNP Federal Ministry of Budget and National Planning
29 FME Federal Ministry of Environment
30 FAAC Federation Account Allocation Committee
31 FRA Fiscal Responsibility Act
32 FSP Fiscal Strategy Paper
33 FOI Freedom of Information Act
34 FOB Freight On Board
35 GDP Gross Domestic Product
36 IDITRA Industrial Development (Income Tax Relief) Act
37 ICAN Institute of Chartered Accountants of Nigeria
38 IFAC International Federation of Accountants
39 IFRS International Financial Reporting Standards
NEITI SOLID MINERALS AUDIT REPORT FOR 2016
Tajudeen Badejo & Co (Chartered Accountants) Page 9 of 90
1.0 INTRODUCTION
The Extractive Industries Transparency Initiative (EITI) is an international initiative among
governments, companies and civil society groups that promotes revenue transparency and
accountability in the oil and gas, and mining sectors. It has a robust yet flexible methodology
for disclosing and reconciling company payments and government revenues in implementing
countries.
The purpose of the initiative is to encourage greater transparency in the extractive sector.
This would enable citizens to make informed demands for the fair sustainable use of revenues
generated through the exploitation of natural resources. The EITI requires implementing
countries to prepare and publish an annual report disclosing company payments and
government revenues from the extractive sector.
The National Stakeholders Working Group (NSWG) of Nigeria Extractive Industries
Transparency Initiative (NEITI) appointed Messrs Tajudeen Badejo & Co (Chartered
Accountants) as the Independent Administrator for audit of the Nigeria Solid Minerals sector
to produce a Solid Minerals Audit (SMA) report for the year 2016 in accordance with the
NEITI Act 2007 and the 2016 EITI Standards.
The report was prepared based on the Terms of Reference (ToR) provided by NEITI NSWG
and covers an overview of the mining sector in Nigeria, licensing regime, exploration and
production, beneficial ownership, contract transparency, state participation in the sector,
revenue streams and collection (including reconciliation). The report also provides
recommendations from the observations made.
The NEITI Act 2007, being part of the overall reforms of government, domesticated the EITI
principles and institutionalized a system of openness and transparency in the flow of revenue
information from the extractive industry (oil and gas, solid minerals as well as forestry and
fishery) sector. Since establishment, NEITI has been effective in strengthening public debates
and promoting policy options around the extractive sector governance.
The NEITI NSWG which supervises the NEITI secretariat consists of 15 members drawn
from the extractive industry, civil society, labour unions in the extractive sector, and
representatives from the six geo-political zones in Nigeria. The Executive Secretary/Chief
Executive Officer of NEITI serves as Secretary to the NSWG.
For details of the NEITI Act 2007, kindly visit: http://www.neiti.gov.ng/index.php/resources/internal-resources/publications?download=104:neiti-act-2007
In compliance with EITI requirements, Nigeria has published six (6) cycles of the solid
mineral sector reports covering the years 2007 to 2015. Details of these audit reports are
available on NEITI website:http://www.neiti.gov.ng/index.php/neiti-audits/solid-minerals
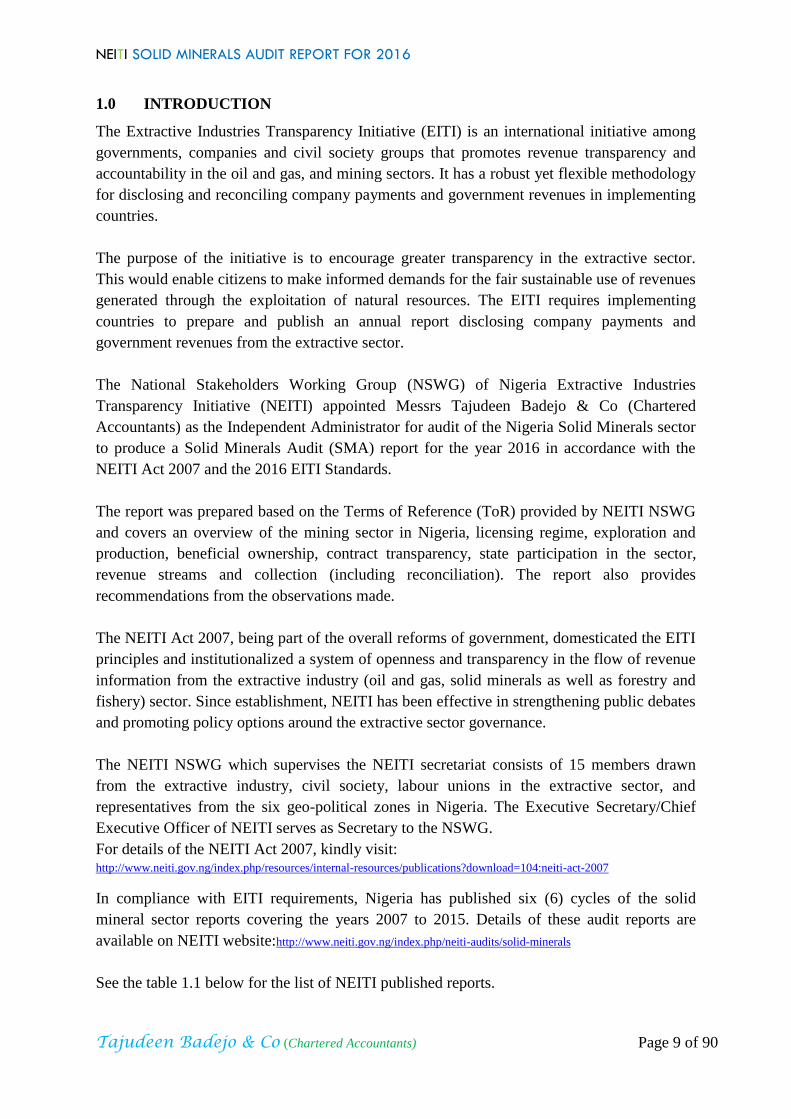
See the table 1.1 below for the list of NEITI published reports.
NEITI SOLID MINERALS AUDIT REPORT FOR 2016
Tajudeen Badejo & Co (Chartered Accountants) Page 10 of 90
Table 1.1: List of NEITI published reports 2007 – 2015 S/N Year Reporting
Companies No
Total Payments
from Companies
(USD Millions)
Total Revenue from
Government Agencies
(USD Millions)
Publication Dates
1 2015 42 334.901 328.06 Jul 2017
2 2014 39 410.15 293.57 Dec 2016
3 2013 65 192.98 194.93 Mar 2016
4 2012 65 177.58 164.67 Dec 2015
5 2011 67 172.69 172.91 Jan 2013
6 *2010 78 115.19 115.00 Dec 2012
7 *2009 78 129.35 129.73 Dec 2012
8 *2008 78 79.32 80.82 Dec 2012
9 *2007 78 61.43 65.26 Dec 2012
Source: NEITI Annual Audit Reports
*These were published as one report in 2012.
Figure 1.1: Comparative analysis of receipts and payments for 2007 - 2015
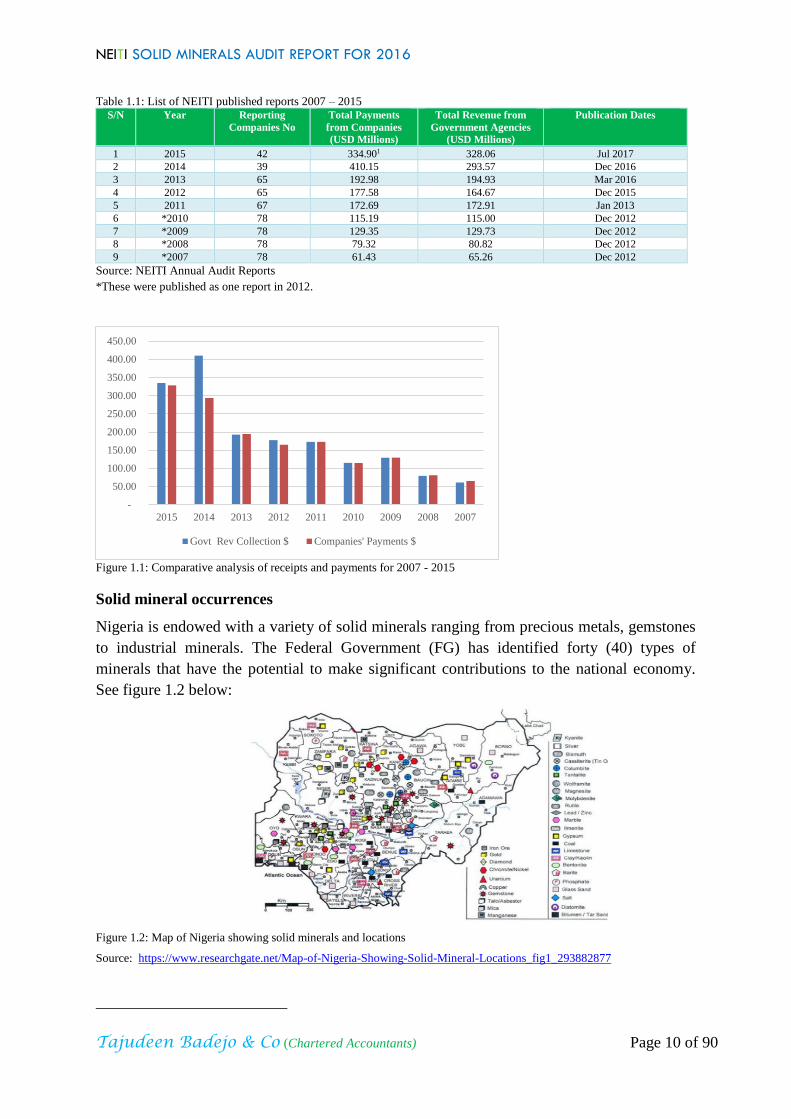
Solid mineral occurrences
Nigeria is endowed with a variety of solid minerals ranging from precious metals, gemstones
to industrial minerals. The Federal Government (FG) has identified forty (40) types of
minerals that have the potential to make significant contributions to the national economy.
See figure 1.2 below:
Figure 1.2: Map of Nigeria showing solid minerals and locations
Source: https://www.researchgate.net/Map-of-Nigeria-Showing-Solid-Mineral-Locations_fig1_293882877
-
50.00
100.00
150.00
200.00
250.00
300.00
350.00
400.00
450.00
2015 2014 2013 2012 2011 2010 2009 2008 2007
Govt Rev Collection $ Companies' Payments $
NEITI SOLID MINERALS AUDIT REPORT FOR 2016
Tajudeen Badejo & Co (Chartered Accountants) Page 11 of 90
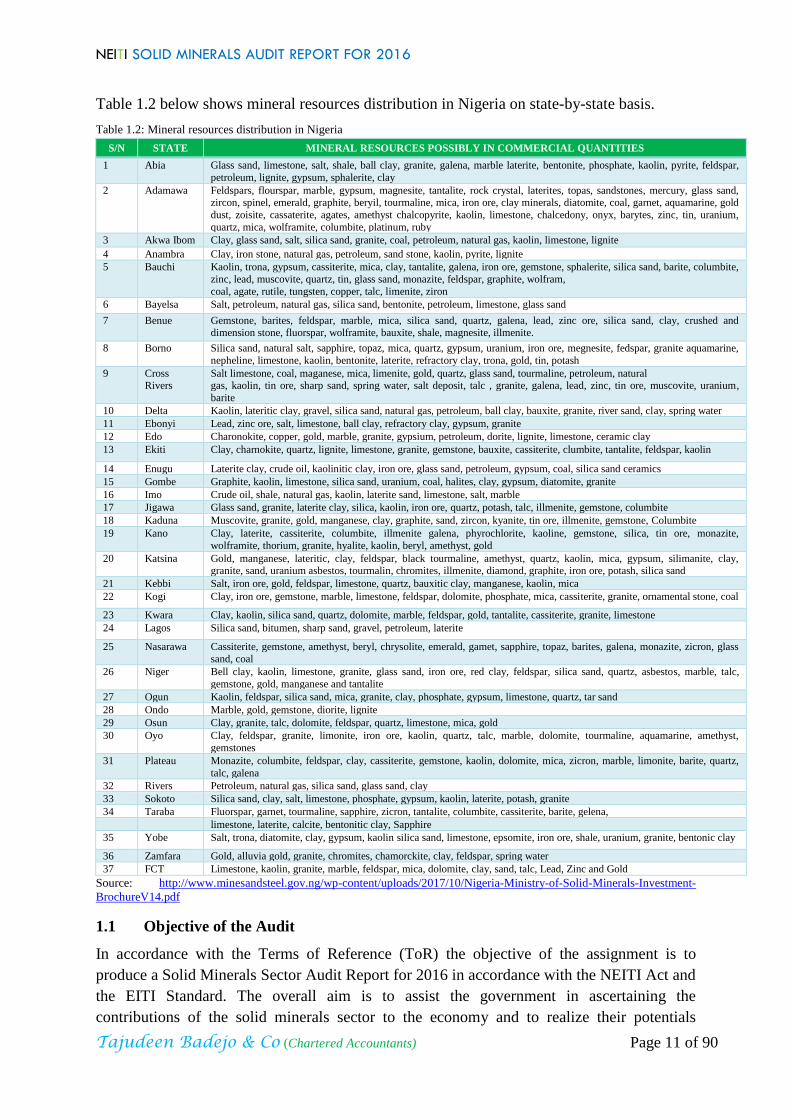
Table 1.2 below shows mineral resources distribution in Nigeria on state-by-state basis.
Table 1.2: Mineral resources distribution in Nigeria
S/N STATE MINERAL RESOURCES POSSIBLY IN COMMERCIAL QUANTITIES
1 Abia Glass sand, limestone, salt, shale, ball clay, granite, galena, marble laterite, bentonite, phosphate, kaolin, pyrite, feldspar,
petroleum, lignite, gypsum, sphalerite, clay
2 Adamawa Feldspars, flourspar, marble, gypsum, magnesite, tantalite, rock crystal, laterites, topas, sandstones, mercury, glass sand, zircon, spinel, emerald, graphite, beryil, tourmaline, mica, iron ore, clay minerals, diatomite, coal, garnet, aquamarine, gold
dust, zoisite, cassaterite, agates, amethyst chalcopyrite, kaolin, limestone, chalcedony, onyx, barytes, zinc, tin, uranium,
quartz, mica, wolframite, columbite, platinum, ruby
3 Akwa Ibom Clay, glass sand, salt, silica sand, granite, coal, petroleum, natural gas, kaolin, limestone, lignite
4 Anambra Clay, iron stone, natural gas, petroleum, sand stone, kaolin, pyrite, lignite
5 Bauchi Kaolin, trona, gypsum, cassiterite, mica, clay, tantalite, galena, iron ore, gemstone, sphalerite, silica sand, barite, columbite,
zinc, lead, muscovite, quartz, tin, glass sand, monazite, feldspar, graphite, wolfram,
coal, agate, rutile, tungsten, copper, talc, limenite, ziron
6 Bayelsa Salt, petroleum, natural gas, silica sand, bentonite, petroleum, limestone, glass sand
7 Benue Gemstone, barites, feldspar, marble, mica, silica sand, quartz, galena, lead, zinc ore, silica sand, clay, crushed and dimension stone, fluorspar, wolframite, bauxite, shale, magnesite, illmenite.
8 Borno Silica sand, natural salt, sapphire, topaz, mica, quartz, gypsum, uranium, iron ore, megnesite, fedspar, granite aquamarine,
nepheline, limestone, kaolin, bentonite, laterite, refractory clay, trona, gold, tin, potash
9
Cross Rivers
Salt limestone, coal, maganese, mica, limenite, gold, quartz, glass sand, tourmaline, petroleum, natural gas, kaolin, tin ore, sharp sand, spring water, salt deposit, talc , granite, galena, lead, zinc, tin ore, muscovite, uranium,
barite
10 Delta Kaolin, lateritic clay, gravel, silica sand, natural gas, petroleum, ball clay, bauxite, granite, river sand, clay, spring water
11 Ebonyi Lead, zinc ore, salt, limestone, ball clay, refractory clay, gypsum, granite
12 Edo Charonokite, copper, gold, marble, granite, gypsium, petroleum, dorite, lignite, limestone, ceramic clay
13 Ekiti Clay, charnokite, quartz, lignite, limestone, granite, gemstone, bauxite, cassiterite, clumbite, tantalite, feldspar, kaolin
14 Enugu Laterite clay, crude oil, kaolinitic clay, iron ore, glass sand, petroleum, gypsum, coal, silica sand ceramics
15 Gombe Graphite, kaolin, limestone, silica sand, uranium, coal, halites, clay, gypsum, diatomite, granite
16 Imo Crude oil, shale, natural gas, kaolin, laterite sand, limestone, salt, marble
17 Jigawa Glass sand, granite, laterite clay, silica, kaolin, iron ore, quartz, potash, talc, illmenite, gemstone, columbite
18 Kaduna Muscovite, granite, gold, manganese, clay, graphite, sand, zircon, kyanite, tin ore, illmenite, gemstone, Columbite
19 Kano Clay, laterite, cassiterite, columbite, illmenite galena, phyrochlorite, kaoline, gemstone, silica, tin ore, monazite,
wolframite, thorium, granite, hyalite, kaolin, beryl, amethyst, gold
20 Katsina Gold, manganese, lateritic, clay, feldspar, black tourmaline, amethyst, quartz, kaolin, mica, gypsum, silimanite, clay, granite, sand, uranium asbestos, tourmalin, chromites, illmenite, diamond, graphite, iron ore, potash, silica sand
21 Kebbi Salt, iron ore, gold, feldspar, limestone, quartz, bauxitic clay, manganese, kaolin, mica
22 Kogi Clay, iron ore, gemstone, marble, limestone, feldspar, dolomite, phosphate, mica, cassiterite, granite, ornamental stone, coal
23 Kwara Clay, kaolin, silica sand, quartz, dolomite, marble, feldspar, gold, tantalite, cassiterite, granite, limestone
24 Lagos Silica sand, bitumen, sharp sand, gravel, petroleum, laterite
25 Nasarawa Cassiterite, gemstone, amethyst, beryl, chrysolite, emerald, gamet, sapphire, topaz, barites, galena, monazite, zicron, glass
sand, coal
26 Niger Bell clay, kaolin, limestone, granite, glass sand, iron ore, red clay, feldspar, silica sand, quartz, asbestos, marble, talc,
gemstone, gold, manganese and tantalite
27 Ogun Kaolin, feldspar, silica sand, mica, granite, clay, phosphate, gypsum, limestone, quartz, tar sand
28 Ondo Marble, gold, gemstone, diorite, lignite
29 Osun Clay, granite, talc, dolomite, feldspar, quartz, limestone, mica, gold
30 Oyo Clay, feldspar, granite, limonite, iron ore, kaolin, quartz, talc, marble, dolomite, tourmaline, aquamarine, amethyst,
gemstones
31 Plateau Monazite, columbite, feldspar, clay, cassiterite, gemstone, kaolin, dolomite, mica, zicron, marble, limonite, barite, quartz,
talc, galena
32 Rivers Petroleum, natural gas, silica sand, glass sand, clay
33 Sokoto Silica sand, clay, salt, limestone, phosphate, gypsum, kaolin, laterite, potash, granite
34 Taraba Fluorspar, garnet, tourmaline, sapphire, zicron, tantalite, columbite, cassiterite, barite, gelena,
limestone, laterite, calcite, bentonitic clay, Sapphire
35 Yobe Salt, trona, diatomite, clay, gypsum, kaolin silica sand, limestone, epsomite, iron ore, shale, uranium, granite, bentonic clay
36 Zamfara Gold, alluvia gold, granite, chromites, chamorckite, clay, feldspar, spring water
37 FCT Limestone, kaolin, granite, marble, feldspar, mica, dolomite, clay, sand, talc, Lead, Zinc and Gold
Source: http://www.minesandsteel.gov.ng/wp-content/uploads/2017/10/Nigeria-Ministry-of-Solid-Minerals-Investment-
BrochureV14.pdf
1.1 Objective of the Audit
In accordance with the Terms of Reference (ToR) the objective of the assignment is to
produce a Solid Minerals Sector Audit Report for 2016 in accordance with the NEITI Act and
the EITI Standard. The overall aim is to assist the government in ascertaining the
contributions of the solid minerals sector to the economy and to realize their potentials
NEITI SOLID MINERALS AUDIT REPORT FOR 2016
Tajudeen Badejo & Co (Chartered Accountants) Page 12 of 90
through improved resource governance.
The summary of other objectives of the assignment includes:
▪ To collect and analyse payments made by mining companies to the Federal Government
of Nigeria (FGN);
▪ To collect and analyse receipts by the government;
▪ To reconcile payments by mining companies to receipts by the government; and
▪ To report on balances payable / receivable at the end of the audit period for financial
flows as summarized in the table 1.3 below.
Table 1.3: Summary of financial flows
Payment flow (Agencies)
Declared
government receipts
N
Declared
company’s payment
N
Difference
N
Taxes (FIRS) 40,381,311,994.48 40,361,186,033.49 20,125,960.99
Royalty and fees (MID) 1,437,791,151.32 1,412,614,451.32 25,176,700.00
Fees (MCO) 156,025,800 156,025,800 -
Sub-total: Reconciled revenue ‘a’ 41,975,128,945.80 41,929,826,284.81 45,302,660.99
Unilateral disclosure by government 1,247,259,366.89 -
Unilateral disclosure by company - 7,036,738,065.44
Sub-total: Unilateral disclosure ‘b’ 1,247,259,366.89 7,036,738,065.44
Total (a + b) 43,222,388,312.69 48,966,564,350.25
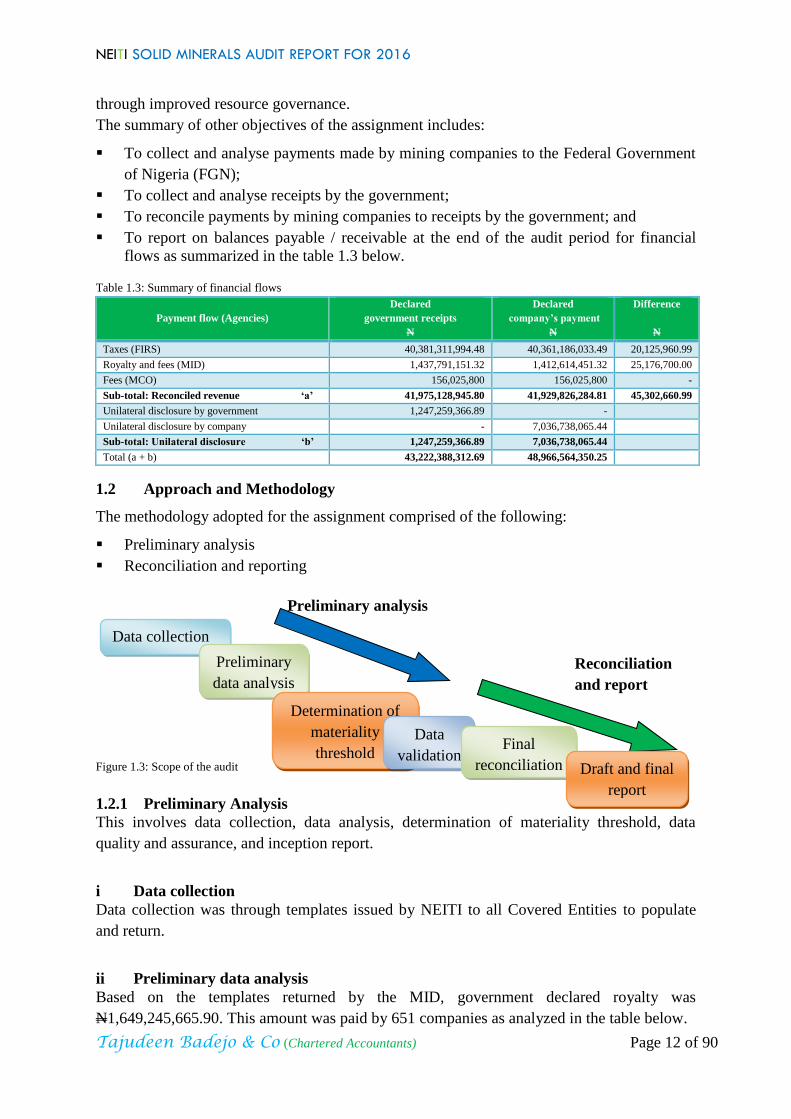
1.2 Approach and Methodology
The methodology adopted for the assignment comprised of the following:
▪ Preliminary analysis
▪ Reconciliation and reporting
Preliminary analysis
Reconciliation
and report
Figure 1.3: Scope of the audit
1.2.1 Preliminary Analysis
This involves data collection, data analysis, determination of materiality threshold, data
quality and assurance, and inception report.
i Data collection
Data collection was through templates issued by NEITI to all Covered Entities to populate
and return.
ii Preliminary data analysis
Based on the templates returned by the MID, government declared royalty was
N1,649,245,665.90. This amount was paid by 651 companies as analyzed in the table below.
Data collection
Preliminary
data analysis
Determination of
materiality
threshold
Data
validation Final
reconciliation
Reconciliation
Draft and final
report

NEITI SOLID MINERALS AUDIT REPORT FOR 2016
Tajudeen Badejo & Co (Chartered Accountants) Page 13 of 90
The IA adopted Royalty payment as the basis for the determination of materiality threshold in
the year 2016 as this is the only material revenue flow specific to the sector and tied to the
production; this was subsequently approved by the NSWG.
Table 1.4: Analysis of royalty declared by government in 2016
Extractive companies payment
range
No of
Company
Cumulative
number of
Companies
Royalty
paid
N
Cumulative
royalty
N
Royalty
paid
%
Cumulative
royalty
%
≥ N100million 2 2 777,884,153.56 777,884,153.56 47% 47%
≥ N50million, but less N100million 1 3 82,550,159.86 860,434,313.42 5% 52%
≥ N20million, but less N50million 9 12 251,392,617.27 1,111,826,930.69 15% 67%
≥ N10million, but less N20million 10 22 129,629,469.55 1,241,456,400.24 8% 75%
≥ N5million, but less N10million 20 42 137,735,452.42 1,379,191,852.66 9% 84%
≥ N3million, but less N5million 14 56 53,585,586.35 1,432,777,439.01 3% 87%
Royalty above threshold (tab1.5) - a 1,432,777,439.01 87%
Royalty below Threshold - b 595 595 216,468,226.89 216,468,226.89 13% 13%
(a) + (b) 651 651 1,649,245,665.90 100% 100%
From table 1.4 above, twenty two (22) companies made royalty payments of N10million and
above amounting to 75% of total royalty declared. Out of these, two companies made royalty
payments in excess of N100million each and this accounted for 47% of total royalty declared.
Considering royalty payment of N3million which is the approved threshold, fifty six (56)
extractive companies would be covered; this represents 86.87% of the total royalty payment
in the year under review.
iii Determination of materiality threshold
Following from the above analyses, the NSWG approved N3million as materiality threshold.
In the opinion of the Independent Administrator the ₦3million royalty threshold is sufficient
and provides reasonable coverage for the reconciliation.
For details of the NSWG approval, kindly refer to:
http://neiti.gov.ng/phocadownload/MINUTES%20OF%20THE%20EMERGENCY%20MEETING%20OF%20NSWG%20
13%20JUNE%202018.pdf
Consequent upon the approval of ₦3million materiality threshold by the NSWG, 56
companies contained in table 1.5 below who met the threshold were selected for
reconciliation.
Table 1.5: List of companies that met threshold
S/N Name of company Amount
₦
1 Dangote Cement Plc 620,773,689.22
2 Lafarge Africa Plc 157,110,464.34
3 United Cement Company Plc 82,550,159.86
4 Julius Berger Nigeria Plc 41,856,214.38
5 Setraco Nigeria Limited 35,480,981.86
6 Reynolds Construction Company (Nig.) Ltd. 32,471,838.43
7 AshakaCem Plc 29,147,355.50
8 Ratcon Construction Company Ltd 25,407,424.60
9 Crushed Rock Industries Nigeria Limited 24,454,497.50
10 Zeberced Limited 21,407,625.00
11 Sino Mineral Co. Ltd 21,032,000.00
12 Cement Company of Northern Nigeria Plc 20,134,680.00
13 CCECC Nigeria Ltd 16,634,471.00
14 BUA International Ltd (Okpella Site, Edo State) 15,084,200.00

NEITI SOLID MINERALS AUDIT REPORT FOR 2016
Tajudeen Badejo & Co (Chartered Accountants) Page 14 of 90
15 Woda (Mountain) Investment Ltd 13,851,500.00
16 C.G.C Nigeria Limited 13,036,353.08
17 Kopek Construction Limited 12,812,720.00
18 Lafarge Readymix Nigeria Limited 12,244,716.00
19 Arab Contractors O.A.O. Nigeria Ltd. 12,053,903.47
20 Triacta Nigeria Ltd. 11,873,806.00
21 Mercury Mining Investment Limited 11,420,500.00
22 Levant Construction Limited 10,617,300.00
23 Georgio Rocks Limited 9,343,295.70
24 Spearman Brown Nig. Ltd 8,802,225.00
25 S.C.C. Nigeria Limited 8,341,192.88
26 Coltan Minerals Limited 8,245,500.00
27 Six Six Manufacturing & Global Services Limited 8,196,195.00
28 Astro Minerals Limited 7,592,932.00
29 Tongyi Allied Mining Ltd. 7,425,000.00
30 Taoshi Mining & Exploration Limited 7,276,581.00
31 Porcelainware Industries Limited 7,003,500.00
32 Ashpalt Unity Construction Limited 6,992,500.00
33 Sodex Mines Nigeria Ltd. 6,541,500.00
34 CNC Mining Company Limited 6,419,510.00
35 Hongyun Mining Industrial Co. Ltd 6,387,800.00
36 Platinum Asphalt and Crushing Company Limited 6,345,888.52
37 Petra Quarries Ltd. 5,948,913.75
38 CNC Engineering Co. Limited 5,800,550.00
39 FW Dredging Ltd 5,700,000.00
40 Hajaig Construction Company Limited 5,280,000.00
41 Zhong Xing Mining Investment Limited 5,076,428.57
42 Mothercat Limited 5,015,940.00
43 Venus Mining Company Limited 4,999,623.00
44 C & C Construction Company Limited 4,898,517.00
45 P.W. Nigeria Ltd. 4,768,860.13
46 Rockstan Shelters Ltd 4,528,000.00
47 Lake Petroleum Limited 4,200,000.00
48 Pioneer Sinochino Investment Ventures Limited 3,950,000.00
49 Purechem Industries Limited 3,528,614.94
50 Kunlun Nigeria Limited 3,512,376.77
51 Inorganic Earth Resources Limited 3,471,000.00
52 Chief Cornerstone Investment Limited 3,299,875.00
53 Zhong Tai Mining (Nig.) Ltd. 3,200,540.00
54 Perfect Stone Quarry Limited 3,133,674.51
55 First Premier Mining & Exploration Ltd. 3,059,505.00
56 NBHH Nigeria Limited 3,035,000.00
1,432,777,439.01
1.2.1 Reconciliation and report
This phase involves data validation, reconciliation of discrepancies and preparation of the
report.
i Data validation
Based on the preliminary data analysis, a total discrepancy of N16,182,457,224.33 was
established as shown in the table 1.6 below:

NEITI SOLID MINERALS AUDIT REPORT FOR 2016
Tajudeen Badejo & Co (Chartered Accountants) Page 15 of 90
Table 1.6: Analysis of initial discrepancy
Financial flow Government
N
Company
N
Difference
N
MID 1,446,017,879.01 394,049,958.88 1,051,967,920.13
MCO 156,025,800.00 72,255,207.96 83,770,592.04
FIRS 23,321,044,443.52 34,849,761,481.47 (11,528,717,037.95)
24,923,088,122.53 35,316,066,648.31 (10,392,978,525.78)
Unilateral Disclosure by Government Agencies 1,247,259,366.89 - 1,247,259,366.89
Unilateral Disclosure by reporting Companies - 7,036,738,065.44 (7,036,738,065.44)
Total 26,170,347,489.42 42,352,804,713.75 (16,182,457,224.33)
ii Data quality and assurance
We planned and performed the 2016 solid minerals audit in accordance with International
Standard on Related Services (ISRS) 4400.Those standards required us to comply with
ethical codes and plans in order to obtain reasonable assurance about whether the data
provided are free from material misstatement.
The objective of data quality and assurance is to ensure that the data provided for the
reconciliation of the declared payments by the extractive companies and the receipts by the
government receiving agencies are credible and reliable.
To ensure that data obtained from the covered entities are in conformity with the EITI
Requirement 4.9 (2016), the Independent Administrator considered Audited Financial
Statements (AFS) and/or letter of attestation in addition to the signing-off at the end of the
tripartite reconciliation. Also, for government agencies, a sign-off by a senior representative
of the agency was considered sufficient.
The following were the steps taken:
▪ Obtained AFS from companies covered in the audit.
▪ Obtained Letters of attestation from companies stating that data provided on cash basis
were in conformity with their AFS prepared on accrual basis.
▪ Obtained Signed-off documents after the reconciliation exercises from representatives of
the companies and senior members of the Government agencies.
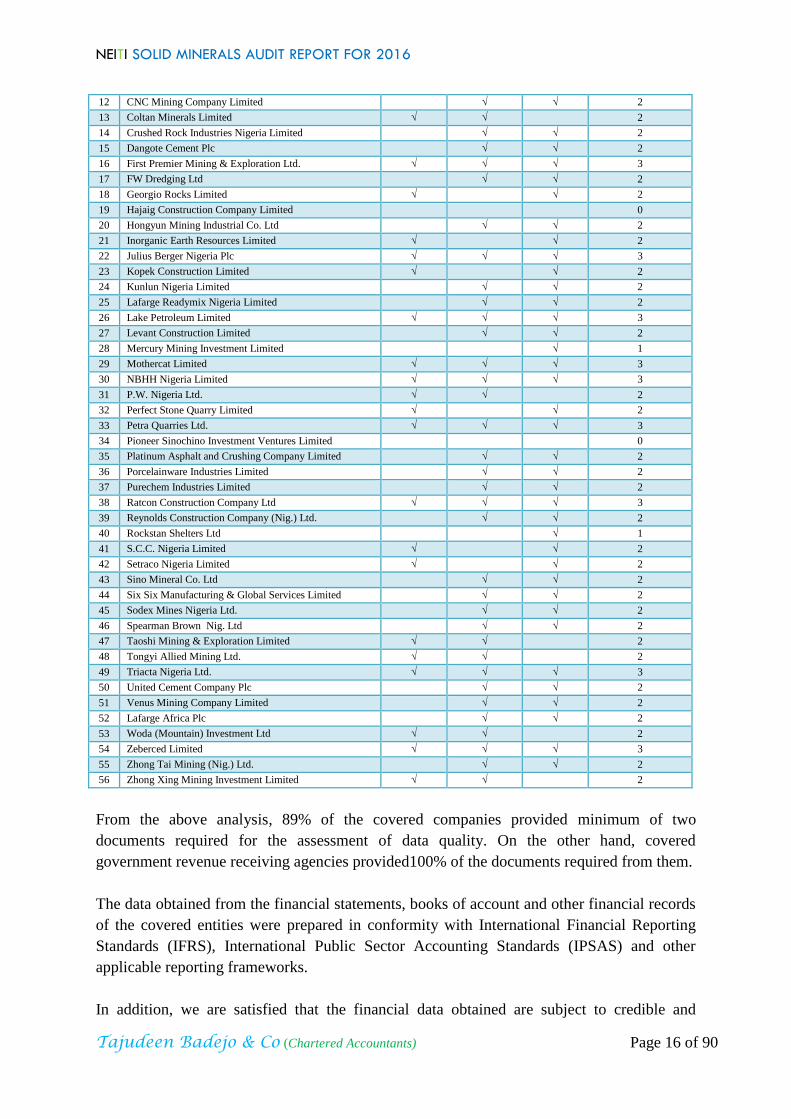
Table 1.7 below shows the analysis of documents obtained for the assessment of quality of
data provided by the covered entities.
Table 1.7: List of documents obtained for data quality and assurance
S/N Extractive companies AFS Attestation
letter Sign-off
No of document
obtained
1 Arab Contractors O.A.O. Nigeria Ltd.
√ √ 2
2 AshakaCem Plc
√ √ 2
3 Ashpalt Unity Construction Limited √ √ √ 3
4 Astro Minerals Limited √ √ √ 3
5 BUA International Ltd (Okpella Site, Edo State)
0
6 C & C Construction Company Limited
√ √ 2
7 CCECC Nigeria Ltd
√ √ 2
8 Cement Company of Northern Nigeria Plc √ √ √ 3
9 C.G.C Nigeria Limited √
√ 2
10 Chief Cornerstone Investment Limited
√ 1
11 CNC Engineering Co. Limited
√ √ 2
NEITI SOLID MINERALS AUDIT REPORT FOR 2016
Tajudeen Badejo & Co (Chartered Accountants) Page 16 of 90
12 CNC Mining Company Limited
√ √ 2
13 Coltan Minerals Limited √ √ 2
14 Crushed Rock Industries Nigeria Limited
√ √ 2
15 Dangote Cement Plc
√ √ 2
16 First Premier Mining & Exploration Ltd. √ √ √ 3
17 FW Dredging Ltd
√ √ 2
18 Georgio Rocks Limited √
√ 2
19 Hajaig Construction Company Limited
0
20 Hongyun Mining Industrial Co. Ltd
√ √ 2
21 Inorganic Earth Resources Limited √
√ 2
22 Julius Berger Nigeria Plc √ √ √ 3
23 Kopek Construction Limited √
√ 2
24 Kunlun Nigeria Limited
√ √ 2
25 Lafarge Readymix Nigeria Limited
√ √ 2
26 Lake Petroleum Limited √ √ √ 3
27 Levant Construction Limited
√ √ 2
28 Mercury Mining Investment Limited
√ 1
29 Mothercat Limited √ √ √ 3
30 NBHH Nigeria Limited √ √ √ 3
31 P.W. Nigeria Ltd. √ √ 2
32 Perfect Stone Quarry Limited √
√ 2
33 Petra Quarries Ltd. √ √ √ 3
34 Pioneer Sinochino Investment Ventures Limited
0
35 Platinum Asphalt and Crushing Company Limited
√ √ 2
36 Porcelainware Industries Limited
√ √ 2
37 Purechem Industries Limited
√ √ 2
38 Ratcon Construction Company Ltd √ √ √ 3
39 Reynolds Construction Company (Nig.) Ltd.
√ √ 2
40 Rockstan Shelters Ltd
√ 1
41 S.C.C. Nigeria Limited √
√ 2
42 Setraco Nigeria Limited √
√ 2
43 Sino Mineral Co. Ltd
√ √ 2
44 Six Six Manufacturing & Global Services Limited
√ √ 2
45 Sodex Mines Nigeria Ltd.
√ √ 2
46 Spearman Brown Nig. Ltd
√ √ 2
47 Taoshi Mining & Exploration Limited √ √ 2
48 Tongyi Allied Mining Ltd. √ √ 2
49 Triacta Nigeria Ltd. √ √ √ 3
50 United Cement Company Plc
√ √ 2
51 Venus Mining Company Limited
√ √ 2
52 Lafarge Africa Plc
√ √ 2
53 Woda (Mountain) Investment Ltd √ √ 2
54 Zeberced Limited √ √ √ 3
55 Zhong Tai Mining (Nig.) Ltd.
√ √ 2
56 Zhong Xing Mining Investment Limited √ √ 2
From the above analysis, 89% of the covered companies provided minimum of two
documents required for the assessment of data quality. On the other hand, covered
government revenue receiving agencies provided100% of the documents required from them.
The data obtained from the financial statements, books of account and other financial records
of the covered entities were prepared in conformity with International Financial Reporting
Standards (IFRS), International Public Sector Accounting Standards (IPSAS) and other
applicable reporting frameworks.
In addition, we are satisfied that the financial data obtained are subject to credible and

NEITI SOLID MINERALS AUDIT REPORT FOR 2016
Tajudeen Badejo & Co (Chartered Accountants) Page 17 of 90
independent audit with application of international standards.
Three companies (BUA International Ltd (Okpella Site, Edo State)), Hajaig Construction
Company Ltd and Pioneer Sinochino Investment Ventures Ltd) failed to participate in the
audit. The non-participation of these companies did not impinge on the overall quality of data
used for the report as corroborative data obtained and validated from the records of relevant
government agencies.
Based on the above analysis, it is our opinion that the data provided for the reconciliation
were comprehensive in compliance with the EITI requirements. The qualities of the data were
satisfactory. They provided reasonable assurances that the report of the reconciliation
exercise presents true and fair view of the declared revenue for the reporting year 2016.
iii Data reconciliation
Tripartite reconciliation exercises held in three locations of Lagos, Port-Harcourt and Abuja,
where companies’ records were reconciled with those of government receiving entities
{Mines Inspectorate Department (MID), Federal Inland Revenue Service (FIRS) and Mining
Cadastre Office (MCO)}. Companies’ representatives and officials of the government
agencies signed off on the final reconciled positions. Table 1.8 below shows the contributions
of reconciled revenue streams.
Table 1.8: Contribution of reconciled revenue streams
Revenue stream Contribution
N
Contribution
% Reconciled
VAT 20,244,510,690.43 48.23 YES
CIT 10,575,945,892.31 25.20 YES
EDT 2,284,103,975.85 5.44 YES
WHT 7,175,636,759.59 17.10 YES
PAYE 101,114,676.30 0.24 YES
Royalty 1,424,550,711.32 3.39 YES
Fees (MID & MCO) 169,266,240.00 0.40 YES 41,975,128,945.80 100.00
iv Limitation to the reconciliation
The scope of work was set out in the ToR for the exercise. However, out of the 56 companies
that met the materiality threshold for reconciliation, 3 companies namely, BUA International
Limited (Okpella Site, Edo State), Hajaig Construction Company Ltd, Pioneer Sinochino
Investment Ventures Ltd failed to participate in the audit. In a related vein, Coltan Minerals
Limited participated in the audit but did not show up for the reconciliation. The revenue of
these totaled N45.30million.
From the above analysis and overall assessment of the data collected, the Independent
Administrator is of the view that the non-participation of the aforementioned companies did
not impact the quality of data employed for the exercise or materially alter the quantum of
revenues that flowed to the government for the period under review.
v Report
This consists of preparation of the draft and final reports made up of the executive summary,
main report with findings and recommendations and appendices.
NEITI SOLID MINERALS AUDIT REPORT FOR 2016
Tajudeen Badejo & Co (Chartered Accountants) Page 18 of 90
1.3 New Developments in the Sector
i New solid minerals export guidelines
Special guidelines for mineral exports are currently been put in place by MMSD in
conjunction with the Federal Ministry of Finance and other stakeholders. This is borne
out of the Federal Government’s decision to ensure accurate collation of mineral trade
data, repatriation of proceeds and scientific collection of royalties. It is also in line
with government’s desire to ensure effective and efficient implementation of the pre-
shipment inspection policy, under the NESS, concerning solid minerals export.
ii Roadmap for the growth and development of the Nigeria mining industry
On March 1, 2016, a committee was set-up to develop a roadmap for the transformation of
the minerals, mining and metal sector. The roadmap is designed to deepen reforms in the
sector, attract new investors and collaborate with a wide network of partners and stakeholders
to build an attractive mining ecosystem. Visit the link below for details. http://www.minesandsteel.gov.ng/wp-content/uploads/2016/09/Nigeria_Mining_Growth_Roadmap_Final.pdf
iii Solid minerals development fund(SMDF)
SMDF was established by section 34 of the Nigerian Mining and Minerals Act (NMMA)
2007, to address the fundamental sector’s challenge of insufficient funding; a problem that
has historically undermined the growth potentials of the sector. The Board was reconstituted
and inaugurated on 25th May, 2017. In 2018, as part of the efforts to streamline the activities
of the SMDF and support its operations in order to enable it deliver on its mandate, the
Ministry of Mines and Steel Development (MMSD) organised a two-day interactive meeting
with the board members and management of the SMDF to enable it present its strategic plan
of action for ratification. See the link below for details. http://www.minesandsteel.gov.ng/2018/05/24/mmsd-strategises-on-achievement-of-smdf-mandate/
iv FG commissioned 50 vehicles for mines surveillance task force and MIREMCO
The FGN on Thursday, March 22, 2018 commissioned 50 operation vehicles for use by the
special mines surveillance task force (MSTF). In addition, efforts to strengthen (and
resuscitate in some cases) the state minerals resources and environmental management
committee (MIREMCO) are been made.
v Establishment of Mines Police
Equally, mines police (MP) has been established to curtail the menace of illegal mining,
sanitize the mines-field and position the sector on the path of sustainable development. For
details, visit the links below. http://www.minesandsteel.gov.ng/2018/03/22/illegal-mining-fg-strengthens-mines-surveillance-task-force-others-with-50-
vehicles/
http://www.minesandsteel.gov.ng/2018/03/22/photo-fg-commissions-50-vehicles-for-mines-surveillance-task-force-and-
miremco/

NEITI SOLID MINERALS AUDIT REPORT FOR 2016
Tajudeen Badejo & Co (Chartered Accountants) Page 19 of 90
vi Open data policy (ODP)
NEITI published its open data policy in December 2016. It defines open data as data in the
public domain or ought to be in the public domain. The definition also provides that such data
should be accessible, freely used at no cost and which can be shared and built upon by
anyone. In a similar vein, the MMSD developed an integrated, automated and interactive
solid minerals portal as part of MinDiver project to support data provision. The link below
provides details. https://portal.minesandsteel.gov.ng/

NEITI SOLID MINERALS AUDIT REPORT FOR 2016
Tajudeen Badejo & Co (Chartered Accountants) Page 20 of 90
2.0. LEGAL AND INSTITUTIONAL FRAMEWORK
Organized mining began in 1903 when the mineral survey agency of the Northern
protectorate was created by the British colonial government. By the 1940s, Nigeria was a
major producer of Tin, Columbite, and Coal. The discovery of oil in 1956 and the
indigenization policy of the 1970s considerably affected the mining sector. Consequently,
government and other corporate bodies began to focus on oil to the neglect of the mining
sector.
The MMSD oversees the management of all mineral resources in the country. The mining
law is codified in the NMMA. Historically, state owned corporations monopolized Nigeria’s
mining industry. However, with the return of democracy in 1999, government embarked on
comprehensive reforms for the sector with the aim of providing an enabling environment for
the full involvement of the private sector in a multi-sector economic development
programme. The reforms marked the redefinition of the role of the government from that of
administrator to regulator while the private sector becomes the owner/operators driving the
sector.
2.1 Legal Framework
The Legal framework guiding all activities in the solid minerals sector comprises of relevant
sections of the Constitution of the Federal Republic of Nigeria and other laws and regulations
enacted by the National Assembly and the supervising ministry.
2.1.1 The 1999 Constitution of the Federal Republic of Nigeria
Under Section 44 (3) of the 1999 Constitution of the Federal Republic of Nigeria (as
amended), the ownership of all mineral resources is vested in the government of the
federation; while item 39 Schedule II placed mines and minerals under the Exclusive
Legislative List. Therefore, the FG has exclusive powers and jurisdiction on all matters
relating therein. Consequently, all taxes and royalties derived from mining activities go to the
federation account. For the details of Section 44 (3) of the constitution, see
http://www.nigeria-law.org/ConstitutionOfTheFederalRepublicOfNigeria.htm#Chapter_4
2.1.2 Nigerian Minerals and Mining Act 2007 (NMMA)
This is the principal legislation regulating the Nigerian mining sector. The key provisions of
the Act include;
▪ Establishment of specialized departments in the MMSD that are charged with the
responsibility of general supervision of activities in the sector to ensure compliance with
the Act;
▪ Establishment of the MCO for the administration of mineral titles and maintenance of
records;
▪ Provision for mechanism of dispute resolution;
▪ Provision of incentives for investment in the solid mineral sector.
NEITI SOLID MINERALS AUDIT REPORT FOR 2016
Tajudeen Badejo & Co (Chartered Accountants) Page 21 of 90
Kindly visit the links below: http://www.nigerianminers.org/sites/default/files/Mining-Mineral-Act.pdf
http://www.minesandsteel.gov.ng/wp-content/uploads/2016/04/Nigerian_Minerals_and_Mining_Act_2007.pdf
2.1.3 The Nigerian Minerals and Mining Regulations (NMMR) 2011
The NMMR provides guidelines for both the operation of indigenous and foreign miners in
Nigeria in accordance with the NMMA. For details information, visit: http://www.minesandsteel.gov.ng/wp-content/uploads/2016/04/Nigerian_Minerals_and_Mining_Regulations_2011.pdf
2.1.4 The Nigerian Extractive Industries Transparency Initiative (NEITI) Act 2007
Following its membership of EITI and commencement of implementation, Nigeria enacted
the NEITI Act of 2007. The primary objective of the Act is to domesticate EITI Standard and
institutionalize a system of openness and transparency in the flow of revenue information
from the extractive industry (oil and gas, solid minerals as well as forestry and fishery)
sectors. Since its inception, NEITI has been effective in strengthening reforms in the
extractive sector through the conduct of audits, promotion of public debates and policy
options around several accountability issues such as unpaid signature bonuses, unpaid
royalties, under assessments and underpayments. The link below provides more details. http://www.neiti.gov.ng/index.php/resources/internal-resources/publications?download=104:neiti-act-2007
2.1.5 Subsidiary legal and policy instruments
Other policy instruments that support the above frameworks are:
i The guidelines on mineral titles application 2014
The Minerals and Mining Act 2007established the MCO with the responsibility of
administration and management of mineral titles in Nigeria. For detail information, visit: http://www.minesandsteel.gov.ng/wp-content/uploads/2016/10/Guidelines-for-Mineral-Title-Applications.pdf
ii. National minerals and metals policy (NMMP) 2008
The NMMP is a product of the Mining Act designed to complement the Act and help
improve performance in the sector through increased regulatory oversight. Key objectives of
the Policy are to:
▪ ensure compliance with environmental best practices and encourage a transparent mining
titles and permit regime; and
▪ promote linkage with the national economy through the enforcement of the use of
domestic metal products for the development of the nation’s infrastructure.
For more information, please visit: http://www.minesandsteel.gov.ng/wp-content/uploads/2016/04/National_Minerals_and_Metals_Policy.pdf

NEITI SOLID MINERALS AUDIT REPORT FOR 2016
Tajudeen Badejo & Co (Chartered Accountants) Page 22 of 90
iii. Land use Act (LUA) 2004
The Act vests authority over all land in the territory of each state (except land vested in the
FG or its agencies) solely on the Governor of the state. The Governor holds such land in trust
for the people and is responsible for its allocation in all urban areas to individual resident in
the State and to organisations for residential, agricultural, commercial and other purposes.
Similar powers with respect to non-urban areas are conferred on Local Governments
chairpersons. For detail, kindly visit: https://lawsofnigeria.placng.org/print.php?sn=228
iv. The environmental impact assessment (EIA) Act 2004
The Act makes it mandatory to conduct an EIA in respect of any proposed project or activity
(including mining). It places a restriction on commencing any public or private project
without prior consideration of the likely environmental effects.
v. The company and allied matters Act (CAMA) 2004
The Act, which established the CAC, provides for the incorporation of companies and
incidental matters, registration of business names and the incorporation of trustees of certain
communities, bodies and associations.
Kindly visit: http://www.nigeria-law.org/CompaniesAndAlliedMattersActPartI-V
vi. Nigerian investment promotion commission (NIPC) Act 2004
The NIPC Act 2004was established, to encourage and promote investment in the Nigerian
economy; and for matters connected therewith.
For details visit: http://www.nigeria- law.org/Nigerian%20Investment%20Promotion%20Commission%20Act.htm
2.2 Institutional Framework
The following are among the institutions established to guide and control the operations in
the solid minerals sector of the Nigerian economy in line with global best practices.
2.2.1 Ministry of Mines and Steel Development (MMSD)
The Ministry of Mines and Steels Development (MMSD) is an agency set up to unlock the
economic potentials of the solid minerals sub-sector in Nigeria. It was established in 1995 as
a bold attempt by the Nigerian Government to spur the rapid and beneficial development of
the country's solid mineral resources. The Ministry is charged with the following key
responsibilities:
1. Formulating policy
2. Providing information and knowledge to enhance investment in the sector
3. Regulating operations in the solid minerals sector
4. Generating appropriate revenue for the government

NEITI SOLID MINERALS AUDIT REPORT FOR 2016
Tajudeen Badejo & Co (Chartered Accountants) Page 23 of 90
The re-structuring of the MMSD in 2004 and the subsequent reforms that followed shifted the
focus of government participation in the sector from “owner-operator” to “administrator-
regulator”, bringing transparency in the mining industry to the fore. The reforms brought
about the following specialized departments:
i Mines inspectorate department (MID)
The MID under the Ministry was established by Section 16(1a) of the NMMA
The MID is responsible for:
▪ Supervision of all reconnaissance, exploration and mining operations;
▪ Enforcement of all mine health and safety regulations as approved by law at mine sites;
▪ Inspection and investigation necessary for ensuring compliance by the operators with
applicable regulations; and
▪ Review and recommend to the Minister, programmes for controlling mining operations
ii. Artisanal and small scale mining (ASM)
The ASM department was established to formalize operations of artisanal miners by
providing extension services to mining communities in the following areas:
▪ Provision of extension services;
▪ Organizing, supporting and assisting ASM on exploration, mineral processing and
entrepreneurial training;
▪ Prospecting and exploration services;
▪ Facilitate mineral testing and determination of mineral grade;
▪ Teach adequate skills in mining to small scale and artisanal miners and regularly
introduce them to new mining technology;
iii. Mines environmental compliance department (MECD)
This department was established by section 18 of the Mining Act. It has the following
functions among others:
▪ Review plans, studies and reports prepared by holders of mineral title in respect of
environmental obligation;
▪ Periodically audit environmental requirements; and
▪ Liaise with relevant government agencies with respect to social and environmental issues
involved in mine operations, mine closure and land reclamation.
Kindly visit:http://www.minesandsteel.gov.ng/about/http://www.minesandsteel.gov.ng/departments-units/
2.2.2 Nigeria Mining Cadastre Office (MCO)
The NMMA defines the MCO as an autonomous body administering mining titles with
integrity and in a transparent manner on a “first come, first serve” basis.
Objectives:
▪ Promotion of the private sector investment in solid minerals sector;
▪ Improvement of the investment climate and attraction of foreign investors; and
▪ Generation of appropriate revenue for the government.

NEITI SOLID MINERALS AUDIT REPORT FOR 2016
Tajudeen Badejo & Co (Chartered Accountants) Page 24 of 90
For details, see: http://www.minesandsteel.gov.ng/agencies/mining-cadastre-office/
2.2.3 Nigerian Geological Survey Agency (NGSA)
The NGSA is a parastatal under the Ministry. The Agency has the statutory role of providing
relevant and up-to-date geosciences information necessary for economic development of
Nigeria. This is accomplished through a systematic process of gathering, collating,
assessment and dissemination of all information related to rocks, minerals and groundwater
resources of the country. Kindly visit: http://ngsa.gov.ng/basic-page/about-us
2.2.4 National Steel Raw Materials Exploration Agency (NSRMEA)
The NSRMEA is a geo-scientific information centre for investors and researchers in the solid
minerals sector that delivers results and solutions through the collective efforts of well
trained, dedicated and motivated workforce.
For details, visit http://nsrmea.minesandsteel.com/page/index/services
2.2.5 Revenue Mobilization Allocation and Fiscal Commission (RMAFC)
The RMAFC derives its powers and constitutional functions from paragraph 32 of Part I of
the Third Schedule to the 1999 Constitution of the Federal Republic of Nigeria. The
commission is constitutionally empowered to:
▪ Monitor the accruals into and disbursement of revenue from the Federation Account;
▪ Review from time to time, the revenue allocation formulae and principles in operation to
ensure conformity with changing realities; provided that any revenue formula which has
been accepted by an Act of the National Assembly shall remain in force for a period of
not less than five years from the date of commencement of the Act;
▪ Advise the federal, state and local governments on fiscal efficiency and methods by
which their revenue is to be increased;
▪ Determine the remuneration appropriate to political office holders, including the
President, Vice-President, Governors, Deputy Governors, Ministers, Commissioners,
Special Advisers, Legislators and the holders of the offices mentioned in Section 84 and
124 of the Constitution; and
▪ Discharge such other functions as are conferred on the Commission by the constitution or
any Act of the National Assembly.
For more information, kindly visit: http://www.rmafc.gov.ng/rmafc-mandate/
2.2.6 Corporate Affairs Commission (CAC)
The CAC was established by the Companies and Allied Matters Act (CAMA), which was
promulgated in 1990 to regulate the formation and management of companies in Nigeria. For
more information, kindly visit: http://new.cac.gov.ng/home/about-us/
2.2.7 Federal Inland Revenue Service (FIRS)
The FIRS is the agency that collects federal taxes for the Federal Government of Nigeria. For
more information, kindly visit: http://www.firs.gov.ng
2.2.8 Nigeria Customs Service (NCS)
The NCS has responsibilities of revenue collection (import and excise duties). For details,
see: https://www.customs.gov.ng/About/mission_statement.php
NEITI SOLID MINERALS AUDIT REPORT FOR 2016
Tajudeen Badejo & Co (Chartered Accountants) Page 25 of 90
2.3 Fiscal Regime
The fiscal regime governing taxation in the solid minerals sector is the Companies Income
Tax Act (CITA), Laws of the Federation (LFN) 2004, as amended. Individuals and
partnerships engaged in mining activities are liable to tax under the Personal Income Tax Act
(PITA).There are various forms of incentives available to companies engaged in mining
activities under the CITA and the Mining Act. Efforts are currently on to enact solid
minerals-specific regime similar to the Petroleum Profits Tax (PPT). This is a welcome
development, as this will encourage increased flow of investment to the sector as part of
government’s efforts to diversify the economy.
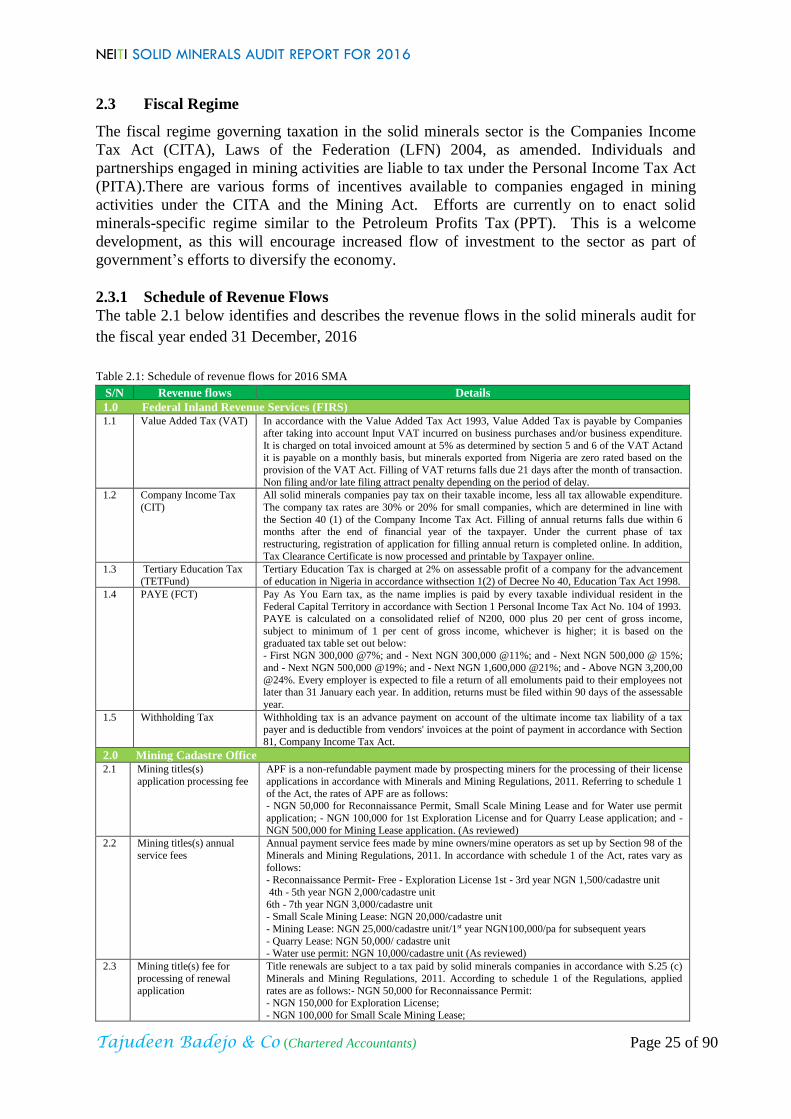
2.3.1 Schedule of Revenue Flows
The table 2.1 below identifies and describes the revenue flows in the solid minerals audit for
the fiscal year ended 31 December, 2016
Table 2.1: Schedule of revenue flows for 2016 SMA
S/N Revenue flows Details
1.0 Federal Inland Revenue Services (FIRS) 1.1 Value Added Tax (VAT) In accordance with the Value Added Tax Act 1993, Value Added Tax is payable by Companies
after taking into account Input VAT incurred on business purchases and/or business expenditure.
It is charged on total invoiced amount at 5% as determined by section 5 and 6 of the VAT Actand it is payable on a monthly basis, but minerals exported from Nigeria are zero rated based on the
provision of the VAT Act. Filling of VAT returns falls due 21 days after the month of transaction.
Non filing and/or late filing attract penalty depending on the period of delay.
1.2 Company Income Tax
(CIT)
All solid minerals companies pay tax on their taxable income, less all tax allowable expenditure.
The company tax rates are 30% or 20% for small companies, which are determined in line with
the Section 40 (1) of the Company Income Tax Act. Filling of annual returns falls due within 6 months after the end of financial year of the taxpayer. Under the current phase of tax
restructuring, registration of application for filling annual return is completed online. In addition,
Tax Clearance Certificate is now processed and printable by Taxpayer online.
1.3 Tertiary Education Tax (TETFund)
Tertiary Education Tax is charged at 2% on assessable profit of a company for the advancement of education in Nigeria in accordance withsection 1(2) of Decree No 40, Education Tax Act 1998.
1.4 PAYE (FCT) Pay As You Earn tax, as the name implies is paid by every taxable individual resident in the
Federal Capital Territory in accordance with Section 1 Personal Income Tax Act No. 104 of 1993. PAYE is calculated on a consolidated relief of N200, 000 plus 20 per cent of gross income,
subject to minimum of 1 per cent of gross income, whichever is higher; it is based on the
graduated tax table set out below: - First NGN 300,000 @7%; and - Next NGN 300,000 @11%; and - Next NGN 500,000 @ 15%;
and - Next NGN 500,000 @19%; and - Next NGN 1,600,000 @21%; and - Above NGN 3,200,00
@24%. Every employer is expected to file a return of all emoluments paid to their employees not later than 31 January each year. In addition, returns must be filed within 90 days of the assessable
year.
1.5 Withholding Tax Withholding tax is an advance payment on account of the ultimate income tax liability of a tax payer and is deductible from vendors' invoices at the point of payment in accordance with Section
81, Company Income Tax Act.
2.0 Mining Cadastre Office 2.1 Mining titles(s)
application processing fee
APF is a non-refundable payment made by prospecting miners for the processing of their license
applications in accordance with Minerals and Mining Regulations, 2011. Referring to schedule 1
of the Act, the rates of APF are as follows: - NGN 50,000 for Reconnaissance Permit, Small Scale Mining Lease and for Water use permit
application; - NGN 100,000 for 1st Exploration License and for Quarry Lease application; and -
NGN 500,000 for Mining Lease application. (As reviewed)
2.2 Mining titles(s) annual
service fees
Annual payment service fees made by mine owners/mine operators as set up by Section 98 of the
Minerals and Mining Regulations, 2011. In accordance with schedule 1 of the Act, rates vary as
follows:
- Reconnaissance Permit- Free - Exploration License 1st - 3rd year NGN 1,500/cadastre unit
4th - 5th year NGN 2,000/cadastre unit
6th - 7th year NGN 3,000/cadastre unit - Small Scale Mining Lease: NGN 20,000/cadastre unit
- Mining Lease: NGN 25,000/cadastre unit/1st year NGN100,000/pa for subsequent years
- Quarry Lease: NGN 50,000/ cadastre unit - Water use permit: NGN 10,000/cadastre unit (As reviewed)
2.3 Mining title(s) fee for
processing of renewal
application
Title renewals are subject to a tax paid by solid minerals companies in accordance with S.25 (c)
Minerals and Mining Regulations, 2011. According to schedule 1 of the Regulations, applied
rates are as follows:- NGN 50,000 for Reconnaissance Permit: - NGN 150,000 for Exploration License;
- NGN 100,000 for Small Scale Mining Lease;
NEITI SOLID MINERALS AUDIT REPORT FOR 2016
Tajudeen Badejo & Co (Chartered Accountants) Page 26 of 90
- NGN 500,000 for Mining Lease; - NGN 200,000 for Quarry Lease; and
- NGN 100,000 for Water use permit. (As reviewed)
2.4 Penalty fee for late
renewal of mining titles (application)
Every solid minerals company is expected to renew their license within a stipulated period
according to the mining regulations. Failure to apply for renewal attracts a penalty as set out below:
- NGN 100,000 for Reconnaissance Permit
- NGN 250,000 for Exploration License, Small Scale Mining Lease, Water use permit and Quarry Lease
- NGN 500,000 for Mining Lease.(As reviewed)
2.5 Fees for application for enlargement (processing)
of mining titles
This payment is made when a solid minerals entity wishes to expand the scope of its mining operations. Accordingly, rates are set in schedule 1 of Minerals and Mining Regulations 2011
and are as follows:
- NGN 100,000 for Small Scale Mining Lease; - NGN 500,000 for Mining Lease
- NGN 150,000 for Quarry Lease. (As reviewed)
2.6 Application for
relinquishment of mining title fees
This payment is made when a mining company wishes to relinquish its mining titles. According
rate is set for NGN 50,000 in schedule 1 of Minerals and Mining Regulations Act 2011 for Small Scale Mining Lease, Mining Lease and for Quarry Lease. (As reviewed)
2.7 Application for transfer
mining titles fees
This payment is made when a title is being transferred from one party to another. According rates
are set in schedule 1 of the Minerals and Mining Regulations, 2011 and are as follows: - NGN 20,000 for Exploration license
- NGN 500,000 for Quarry Lease;
- NGN 250,000 for Small Scale Mining Lease; and - NGN 500,000 for Mining Lease. (As reviewed)
2.8 Application for surrender
mining titles fees
This is the payment made when a mining entity wishes to surrender the license which enables it
to carry on the business of mining. Schedule 1 of the Mineral and Mining Regulations, 2011 stipulates a rate of NGN20,000 for the surrender of Mining lease license, small scale mining
license, Mining lease and Quarry lease. (As reviewed)
2.9 Application for
consolidation mining titles fees
This payment is made when mining licenses and rights are merged. According rates are set in
schedule 1 of Minerals and Mining Regulations, 2011 and are as follows: - NGN 100,000 for Exploration license,
- NGN 50,000 for Small Scale Mining Lease;
- NGN 250,000 for Mining Lease; and - NGN 150,000 for Quarry Lease. (As reviewed)
2.10 Fees for application to
endorse additional mineral
Payment made by miners as set by the Minerals and Mining Regulations Act 2011. Rates are
listed in schedule 1 of the Regulations as follows: - NGN 100,000 for Exploration license and for Quarry Lease;
- NGN 200,000 for Mining Lease; and
- NGN 50,000 for Small Scale Mining Lease. (As reviewed)
2.11 Fees for application for certified true copy of lost
certificate of mining title
Payment made by operators in the mining sector to obtain certified true copy of lost mining titles. A sum of NGN 50,000 must be paid for application;
NGN 100,000 Replacement in line with Schedule 1 of the Mineral and Mining Regulations,
2011. (As reviewed)
2.12 Fees for application for
amendment of documents
This payment of NGN 5,000 is due by solid minerals companies upon request for the amendment
of certificate to reflect current status. The amount payable is as recommended in the Regulations.
2.13 Search fee/due diligence Fees amounting to NGN 75,000 are due for the conduct of search and due diligence on
prospective miners.
2.14 Fees for cadastre map
information, application
for certified true copy of other documents other
than title documents
A payment of NGN 10,000 for fees for cadastre map information, application for certified true
copy of documents as detailed in Schedule 1 of Mineral and Mining Regulations 2011.
3.0 Mines Inspectorate Department
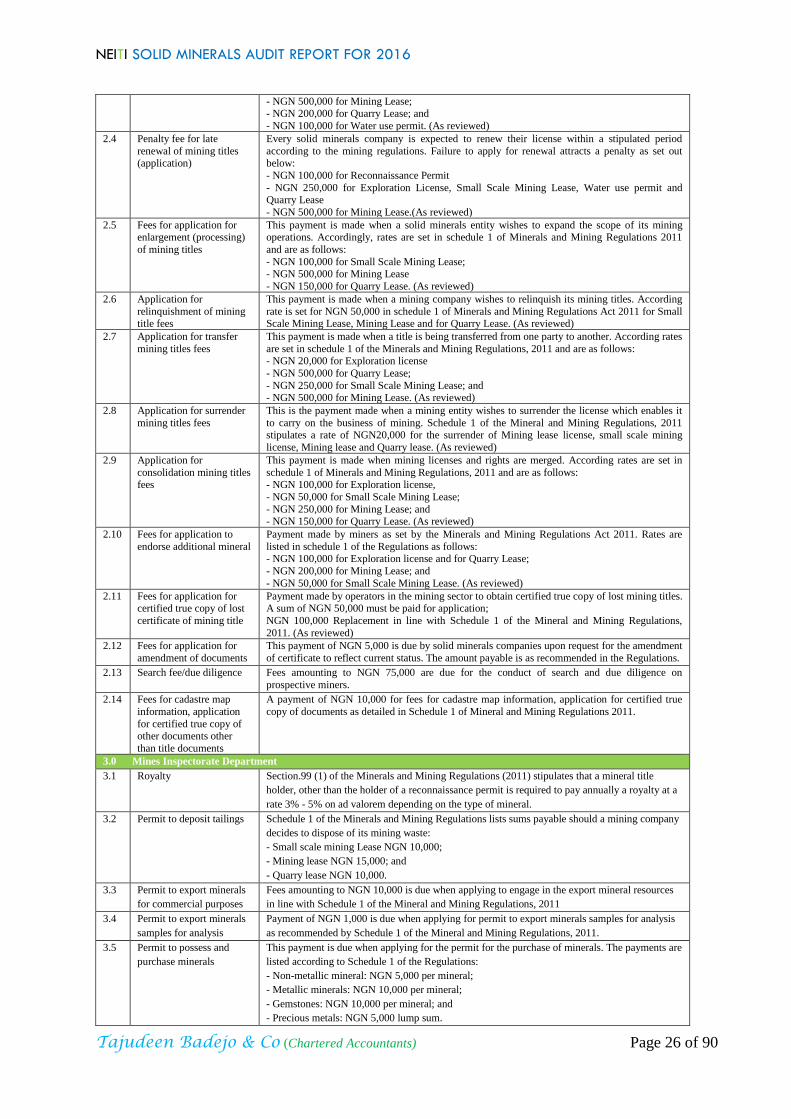
3.1 Royalty Section.99 (1) of the Minerals and Mining Regulations (2011) stipulates that a mineral title
holder, other than the holder of a reconnaissance permit is required to pay annually a royalty at a
rate 3% - 5% on ad valorem depending on the type of mineral.
3.2 Permit to deposit tailings Schedule 1 of the Minerals and Mining Regulations lists sums payable should a mining company
decides to dispose of its mining waste:
- Small scale mining Lease NGN 10,000;
- Mining lease NGN 15,000; and
- Quarry lease NGN 10,000.
3.3 Permit to export minerals
for commercial purposes
Fees amounting to NGN 10,000 is due when applying to engage in the export mineral resources
in line with Schedule 1 of the Mineral and Mining Regulations, 2011
3.4 Permit to export minerals
samples for analysis
Payment of NGN 1,000 is due when applying for permit to export minerals samples for analysis
as recommended by Schedule 1 of the Mineral and Mining Regulations, 2011.
3.5 Permit to possess and
purchase minerals
This payment is due when applying for the permit for the purchase of minerals. The payments are
listed according to Schedule 1 of the Regulations:
- Non-metallic mineral: NGN 5,000 per mineral;
- Metallic minerals: NGN 10,000 per mineral;
- Gemstones: NGN 10,000 per mineral; and
- Precious metals: NGN 5,000 lump sum.
NEITI SOLID MINERALS AUDIT REPORT FOR 2016
Tajudeen Badejo & Co (Chartered Accountants) Page 27 of 90
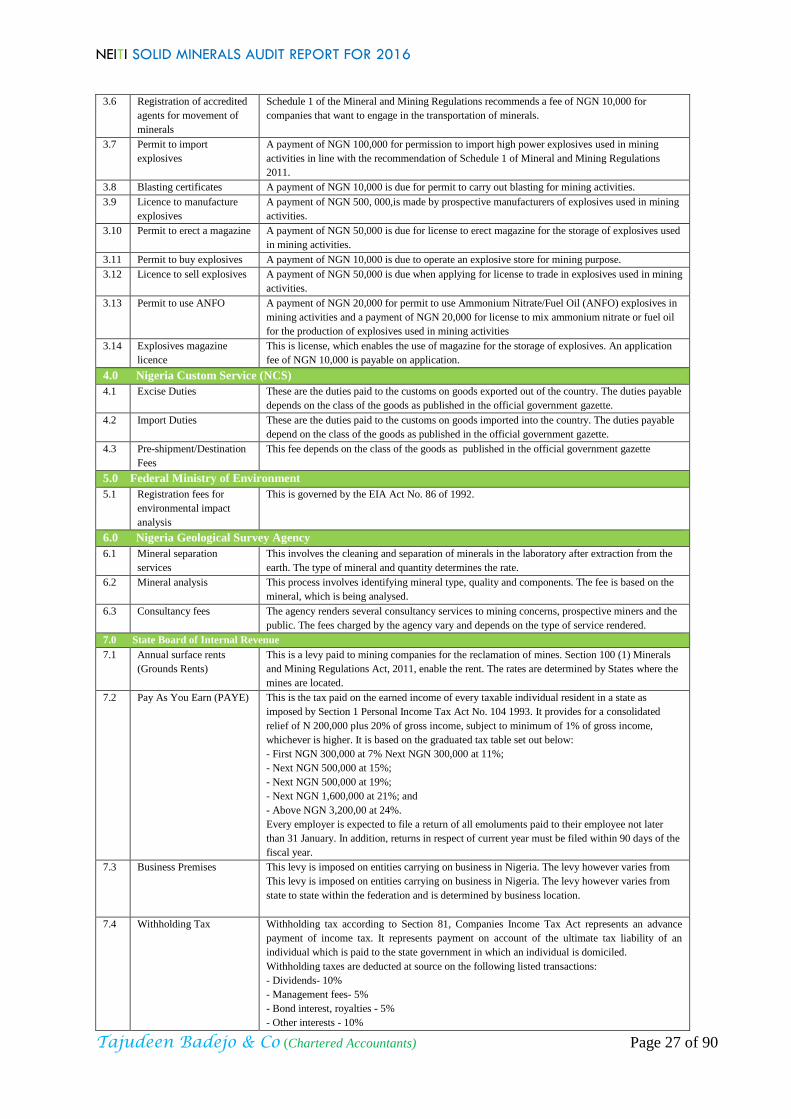
3.6 Registration of accredited
agents for movement of
minerals
Schedule 1 of the Mineral and Mining Regulations recommends a fee of NGN 10,000 for
companies that want to engage in the transportation of minerals.
3.7 Permit to import
explosives
A payment of NGN 100,000 for permission to import high power explosives used in mining
activities in line with the recommendation of Schedule 1 of Mineral and Mining Regulations
2011.
3.8 Blasting certificates A payment of NGN 10,000 is due for permit to carry out blasting for mining activities.
3.9 Licence to manufacture
explosives
A payment of NGN 500, 000,is made by prospective manufacturers of explosives used in mining
activities.
3.10 Permit to erect a magazine A payment of NGN 50,000 is due for license to erect magazine for the storage of explosives used
in mining activities.
3.11 Permit to buy explosives A payment of NGN 10,000 is due to operate an explosive store for mining purpose.
3.12 Licence to sell explosives A payment of NGN 50,000 is due when applying for license to trade in explosives used in mining
activities.
3.13 Permit to use ANFO A payment of NGN 20,000 for permit to use Ammonium Nitrate/Fuel Oil (ANFO) explosives in
mining activities and a payment of NGN 20,000 for license to mix ammonium nitrate or fuel oil
for the production of explosives used in mining activities
3.14 Explosives magazine
licence
This is license, which enables the use of magazine for the storage of explosives. An application
fee of NGN 10,000 is payable on application.
4.0 Nigeria Custom Service (NCS)
4.1 Excise Duties These are the duties paid to the customs on goods exported out of the country. The duties payable
depends on the class of the goods as published in the official government gazette.
4.2 Import Duties These are the duties paid to the customs on goods imported into the country. The duties payable
depend on the class of the goods as published in the official government gazette.
4.3 Pre-shipment/Destination
Fees
This fee depends on the class of the goods as published in the official government gazette
5.0 Federal Ministry of Environment
5.1 Registration fees for
environmental impact
analysis
This is governed by the EIA Act No. 86 of 1992.
6.0 Nigeria Geological Survey Agency
6.1 Mineral separation
services
This involves the cleaning and separation of minerals in the laboratory after extraction from the
earth. The type of mineral and quantity determines the rate.
6.2 Mineral analysis This process involves identifying mineral type, quality and components. The fee is based on the
mineral, which is being analysed.
6.3 Consultancy fees The agency renders several consultancy services to mining concerns, prospective miners and the
public. The fees charged by the agency vary and depends on the type of service rendered.
7.0 State Board of Internal Revenue
7.1 Annual surface rents
(Grounds Rents)
This is a levy paid to mining companies for the reclamation of mines. Section 100 (1) Minerals
and Mining Regulations Act, 2011, enable the rent. The rates are determined by States where the
mines are located.
7.2 Pay As You Earn (PAYE) This is the tax paid on the earned income of every taxable individual resident in a state as
imposed by Section 1 Personal Income Tax Act No. 104 1993. It provides for a consolidated
relief of N 200,000 plus 20% of gross income, subject to minimum of 1% of gross income,
whichever is higher. It is based on the graduated tax table set out below:
- First NGN 300,000 at 7% Next NGN 300,000 at 11%;
- Next NGN 500,000 at 15%;
- Next NGN 500,000 at 19%;
- Next NGN 1,600,000 at 21%; and
- Above NGN 3,200,00 at 24%.
Every employer is expected to file a return of all emoluments paid to their employee not later
than 31 January. In addition, returns in respect of current year must be filed within 90 days of the
fiscal year.
7.3 Business Premises This levy is imposed on entities carrying on business in Nigeria. The levy however varies from
This levy is imposed on entities carrying on business in Nigeria. The levy however varies from
state to state within the federation and is determined by business location.
7.4 Withholding Tax Withholding tax according to Section 81, Companies Income Tax Act represents an advance
payment of income tax. It represents payment on account of the ultimate tax liability of an
individual which is paid to the state government in which an individual is domiciled.
Withholding taxes are deducted at source on the following listed transactions:
- Dividends- 10%
- Management fees- 5%
- Bond interest, royalties - 5%
- Other interests - 10%

NEITI SOLID MINERALS AUDIT REPORT FOR 2016
Tajudeen Badejo & Co (Chartered Accountants) Page 28 of 90
- Rent - 10%
- Royalties – 10%
- Consultancy and technical service fees – 5%
- Commission - 5%
- Construction contracts – 5%
- Income from all aspects of building and other civil works – 5%
- Directors fees – 10%
- Building and other civil works – 5%
- Directors fees – 10%
8.0 Local Government Council
8.1 Property Rates (Tenement
Rates)
These are Levies paid by property owners on real property and they vary by state and size of
property. Tenement Act No. 11, 2011 does not specifically state the amount(s) charged by State
Governments.
9.0 Communities/Land owners
9.1 Compensation These are Payments made to occupants/land owners for the use of their land for mining activities
as stipulated in Section.11 (1) Mineral and Mining Regulations Act, 2011.
Payment is often one off based on agreement between the mining entities and the host
communities.
10.0 Social Contributions
10.1 Corporate Social
Responsibility cash
payments
These are cash payments to support and assist in the quality of lives of host communities where
mining takes place.
10.2 Corporate Social
Responsibility in-kind
payments
This involves the direct implementation of projects by mining entities for the benefit of host
communities.
11.0 Artisanal and Small-Scale Mining Department
11.1 Application for Artisanal
and Small-Scale Mining
Schedule 1 Minerals and Mining Regulation, 2011 enables the department to charge a sum of
NGN 50,000 on Individuals and small scale artisans and organizations intending to engage in
mining activities on a small scale.
11.2 Application for
Registration of mineral
buying centre per mineral
This is a payment in respect of an application to purchase and possess mineral. This application
attracts the sum of NGN 50,000. The rate is as stated in Schedule 1 of Mineral and Mining
Regulation, 2011.
11.3 Application for annual
renewal of buying centre
licence
Every buying centre is expected to pay an annual renewal fee of NGN 50,000 as stated in
Schedule 1 of the Mineral and Mining Regulation2011 in order to retain the right to purchase and
possess mineral.
12.0 Central Bank of Nigeria 12.1 Nigerian Export
Supervision Scheme (NESS) Fees
These are Levies paid by exporters of goods in order to obtain a Clean Certificate of Inspection
(CCI). The CCI enables the carrier of goods to facilitate loading and shipment. The enabling Law is the NEPC Act NO 64, 1992. The basis of determining the amounts payable are:
- 0.5% FOB value of the export consignment for non-oil; and
- 0.15% of the FOB value to the crude oil export. The sum, which is paid into a designated bank, shall be remitted into NESS account with the
Central Bank.
2.3.1 Mining Incentives
Part III, Sections 23 -28 of the NMMA offer incentives to companies and enterprises engaged
in mining operations. The incentives are aimed at encouraging increased flow of investments
to the sector.
i. Applicable incentives There are various incentives available to companies engaged in mining operations in Nigeria.
These incentives are categorized under NMMA and Companies Income Tax Act (CITA). For
details, kindly visit the link below. http://www.minesandsteel.gov.ng/wp-content/uploads/2017/10/Nigeria-Ministry-of-Solid-Minerals-Investment-
BrochureV14.pdf
ii. Nigerian investment promotion council and federal inland revenue service
This Compendium of Investment Incentives in Nigeria is the product of collaboration
between Nigerian Investment Promotion Council (NIPC) and Federal Inland Revenue Service

NEITI SOLID MINERALS AUDIT REPORT FOR 2016
Tajudeen Badejo & Co (Chartered Accountants) Page 29 of 90
(FIRS). It is published pursuant to the provisions of Section 4(i) of the NIPC Act, which
requires NIPC to “provide and disseminate up-to-date information on incentives available to
investors” in Nigeria. For details, visit: https://www.nipc.gov.ng/investment-compendium/
2.4 License Allocation
The MCO established in accordance with section 5(1) of the NMMA is responsible for the
administration of mining licenses in Nigeria.
The objective of the cadastre system is to encourage transparency and efficiency in the
administration of mining titles. Under the Act, the MCO has specific roles assigned to it, such
as:
▪ Management of mining titles/rights is on a "first come, first served" basis;-the priority
register is publicly available at MCO head office (albeit in hard copy).
▪ Protection of legal rights of domestic and international investors;
▪ Security of tenure of titles/rights;
▪ Application of the principle of "use it or lose it" to mining title/rights administration; and
▪ Use of time limits for granting titles.
2.4.1 Types of Mineral Titles
The table below provides information on the mineral titles and licenses granted by MCO as
provided for under the NMMA.
Table 2.2: Type of mineral titles
S/N
Type(s) of licence
Max size
Max number of
cadastral units Duration
Approximated
processing time
1 Reconnaissance
permit (RP)
Non-
exclusive
Non exclusive
1 year (Renewable annually) Not later than 30 days of filling
application
2 Exploration Licenses
(EL)
200km2
1000 (20,000 Ha)
3 years (Renewable twice for
2 years each)
Not later than 30 days of filling
application
3 Small Scale Mining
Lease (SSML)
3km2
15 (300Ha)
5 years (Renewable for every
5 years)
Not later than 45 days of filling
application
4 Mining Lease (ML)
50km2
250 (5,000 Ha)
25 years (Renewable every 24
years)
Not later than 45 days of filling
application
5 Quarry Lease (QL)
5km2
25 (500 Ha) 5 years (Renewable every 5
years)
Not later than 45 days of filling
application
Source: Information obtained from MCO
For more information, visit: http://www.minesandsteel.gov.ng/wp-content/uploads/2016/10/Guidelines-for-Mineral-Title-Applications.pdf
http://www.miningcadastre.gov.ng
2.4.2 Process for License Acquisition and Criteria for grant of Mineral Titles
The MCO operates a functional data processing system and a priority register. The guidelines
for obtaining the various titles/licenses are clearly spelt out in the website below: http://www.minesandsteel.gov.ng/wp-content/uploads/2016/10/Guidelines-for-Mineral-Title-Applications.pdf
2.4.3 Mineral Titles
The information on the mineral titles granted under the Minerals and Mining Act 2007 is
presented in figure 2.1 below:

NEITI SOLID MINERALS AUDIT REPORT FOR 2016
Tajudeen Badejo & Co (Chartered Accountants) Page 30 of 90
Figure 2.1: Mineral titles
2.5 License Register
A detailed register of licenses (according to type) is maintained by the MCO in line with
section 7 of the NMMA and sections 7 and 105(5) of the Nigerian Minerals and Mining
Regulation (NMMR) 2011. Details of processes and procedures for acquiring any of the
mining titles including transfers, renewals, consolidation, and revocation with sample forms
are available in the Minerals and Mining Regulation 2011 at http://www.minesandsteel.gov.ng/wp-
content/uploads/2016/04/Nigerian_Minerals_and_Mining_Regulations_2011.pdf
In addition, the guidelines outlining the financial and technical criteria for mineral title
application is available at http://www.minesandsteel.gov.ng/wp-content/uploads/2016/10/Guidelines-for-Mineral-Title-Applications.pdf
Table 2.3 provides the analysis of title register as at 2016. See the details in Appendix 1.
Table 2.3: Summary of title register
Title type Exploration
license
Mining
lease
Quarry
lease
Reconnaissance
permit
Small scale
mining lease Total
Valid Titles 1,751 208 1,563 0 1,053 4,575
Titles Issued 510 15 288 314 338 1,465
Transferred Titles 7 0 3 - 4 14
*Revoked 331 11 659 - 29 1,030
*In 2016, 1,030 titles were revoked.
2.5.1 Valid Titles
During the year under review, MCO had 4,575 valid titles in its register spread across the
states of the federation with Kaduna leading with 438 titles. Detailed information is available
in Appendix 1.
• Valid for 1 year
• No maximum limit on the number of renewalsReconnaissance Permit
• Valid for 3 years
• Renewed for two further period of 2 yearsExploration Licence
• Valid for 25 years
• No maximum limit on the number of renewalsMining Lease
• Valid for 5 years
• No maximum limit on the number of renewalsQuarry Lease
• Valid for 5 years
• No maximum limit on the number of renewalsSmall-Scale Mining Lease
• Remain in force as long as the title for which use was granted remains valid
Water Use Permit

NEITI SOLID MINERALS AUDIT REPORT FOR 2016
Tajudeen Badejo & Co (Chartered Accountants) Page 31 of 90
Figure 2.2: Analysis of valid titles
The figure below shows the valid titles per state of federation including FCT.
- Figure 2.3: Valid titles per state
38%
5%34%
23%
4,575 Valid titles
Exploration Licence
Mining Lease
Quarry Lease
Small Scale Mining Lease
KadunaNiger
NasarawaKogi
PlateauZamfara
OyoOgun
EdoBauchiEbonyi
KanoLagos
FCTKwara
Cross RiverOsunOndo
BenueTarabaKebbi
KatsinaAdamawaAnambra
GombeAbia
EnuguSokotoJigawa
DeltaEkitiYobe
ImoBornoRivers
Akwa IbomBayelsa
Total number of valid title(s) per state
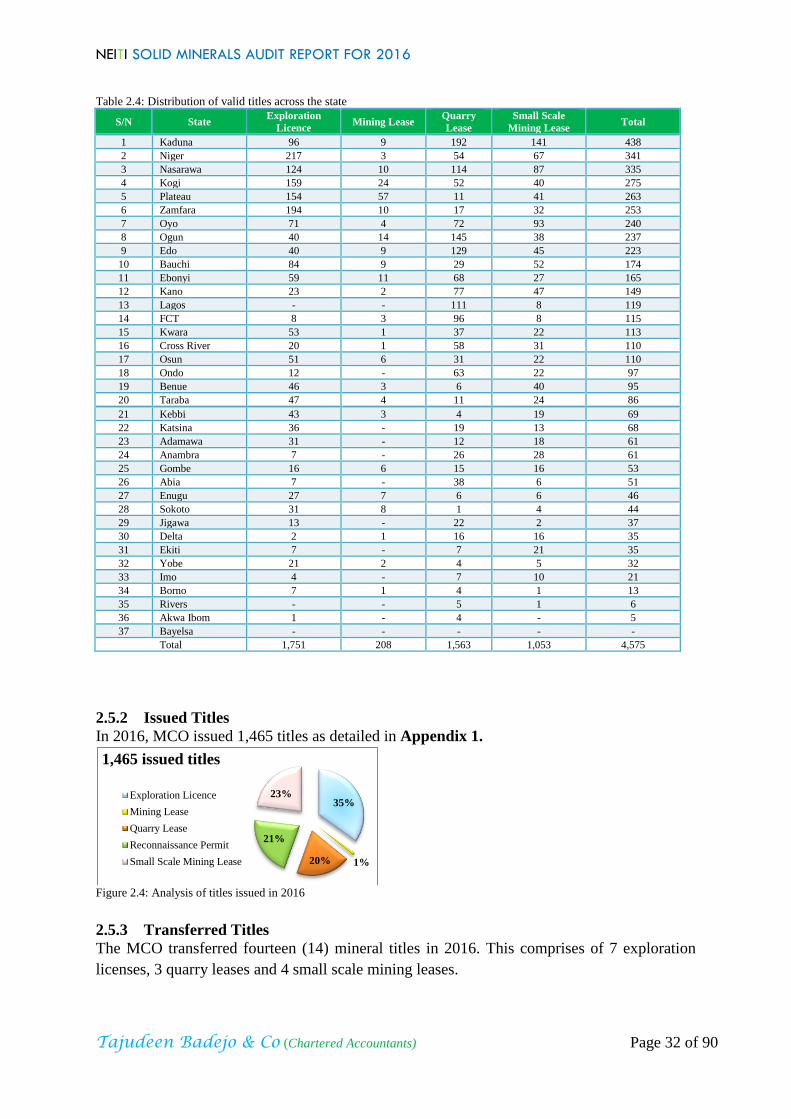
NEITI SOLID MINERALS AUDIT REPORT FOR 2016
Tajudeen Badejo & Co (Chartered Accountants) Page 32 of 90
Table 2.4: Distribution of valid titles across the state
S/N State Exploration
Licence Mining Lease
Quarry
Lease
Small Scale
Mining Lease Total
1 Kaduna 96 9 192 141 438
2 Niger 217 3 54 67 341
3 Nasarawa 124 10 114 87 335
4 Kogi 159 24 52 40 275
5 Plateau 154 57 11 41 263
6 Zamfara 194 10 17 32 253
7 Oyo 71 4 72 93 240
8 Ogun 40 14 145 38 237
9 Edo 40 9 129 45 223
10 Bauchi 84 9 29 52 174
11 Ebonyi 59 11 68 27 165
12 Kano 23 2 77 47 149
13 Lagos - - 111 8 119
14 FCT 8 3 96 8 115
15 Kwara 53 1 37 22 113
16 Cross River 20 1 58 31 110
17 Osun 51 6 31 22 110
18 Ondo 12 - 63 22 97
19 Benue 46 3 6 40 95
20 Taraba 47 4 11 24 86
21 Kebbi 43 3 4 19 69
22 Katsina 36 - 19 13 68
23 Adamawa 31 - 12 18 61
24 Anambra 7 - 26 28 61
25 Gombe 16 6 15 16 53
26 Abia 7 - 38 6 51
27 Enugu 27 7 6 6 46
28 Sokoto 31 8 1 4 44
29 Jigawa 13 - 22 2 37
30 Delta 2 1 16 16 35
31 Ekiti 7 - 7 21 35
32 Yobe 21 2 4 5 32
33 Imo 4 - 7 10 21
34 Borno 7 1 4 1 13
35 Rivers - - 5 1 6
36 Akwa Ibom 1 - 4 - 5
37 Bayelsa - - - - -
Total 1,751 208 1,563 1,053 4,575
2.5.2 Issued Titles
In 2016, MCO issued 1,465 titles as detailed in Appendix 1.
Figure 2.4: Analysis of titles issued in 2016
2.5.3 Transferred Titles
The MCO transferred fourteen (14) mineral titles in 2016. This comprises of 7 exploration
licenses, 3 quarry leases and 4 small scale mining leases.
35%
1%20%
21%
23%
1,465 issued titles
Exploration Licence
Mining Lease
Quarry Lease
Reconnaissance Permit
Small Scale Mining Lease

NEITI SOLID MINERALS AUDIT REPORT FOR 2016
Tajudeen Badejo & Co (Chartered Accountants) Page 33 of 90
Figure 2.5: Analysis of titles transferred in 2016
2.5.4 Revoked Titles
In 2016, MCO revoked 1,030 titles comprising of Exploration Licence (EL), Mining Lease
(ML), Quarry Lease (QL) and Small Scale Mining Lease (SSML) (See Appendix1 for
details). Reasons for revocation of mineral titles can be found in Section 151 of the NMMA
and Section 97 of the NMMR.
Figure 2.6: Analysis of titles revoked in 2016
2.5.5 Overview of Artisanal and Small Scale Mining (ASM) in Nigeria
Presently, the informal mining sector dominates the mining activities in Nigeria, mainly
represented by the ASM actors. However, there are concerted efforts to organize them into
clusters of cooperatives. Appendix 2 contains the details of 1,200 registered mining
cooperatives across the six geo-political zones of the country.
Table 2.5 below shows the distribution of registered cooperatives across the country. The
Northwest geo-political zone has the highest number of 282 while Southeast had the lowest
of 95.
Table 2.5: Registered mining cooperatives as at 2016
50%
21%
29%
14 Transferred titles
Exploration License
Quarry Lease
Small Scale Mining Lease
33%
1%
63%
3%1,030 Revoked titles
Exploration License
Mining Lease
Quarry Lease
Small Scale Mining Lease
North Central North East North West South East South South South West
7 States No 6 States No 7 States No 5 States No 6 States No 6 States No
Benue 14 Adamawa 40 Jigawa 9 Abia 12 Akwa Ibom 14 Ekiti 16
FCT 43 Bauchi 38 Kaduna 44 Anambra 23 Bayelsa 7 Lagos 67
Kogi 51 Borno 8 Kano 38 Ebonyi 38 Cross River 67 Ogun 11
Kwara 27 Gombe 63 Katsina 12 Enugu 11 Delta 11 Ondo 21
Nasarawa 37 Taraba 48 Kebbi 3 Imo 11 Edo 46 Osun 51
Niger 22 Yobe 25 Sokoto 86
Rivers 4 Oyo 30
Plateau 62
Zamfara 90
256
222
282
95
149
196

NEITI SOLID MINERALS AUDIT REPORT FOR 2016
Tajudeen Badejo & Co (Chartered Accountants) Page 34 of 90
Figure 2.7: Registered mining cooperatives as at 2016
2.5.6 Minerals Buying Centres (MBC)
The NMMA requires that an authorized person sell proceeds recovered under SSML to
licensed minerals buying centres, valid sales receipts obtained and, when required, produced
for inspection. Table 2.6 below depicts the distribution of the mineral buying centres across
the states of the federation while the details are contained in Appendix 3.
Table 2.6: Analysis of mineral buying centres per state
S/N State of the federation Number
1 Plateau 90
2 FCT 30
3 Lagos 21
4 Nasarawa 13
5 Zamfara 12
6 Kaduna 10
7 Anambra 8
8 Abuja 7
9 Oyo 5
10 Osun 4
11 Bauchi 3
12 Ebonyi 3
13 Kano 3
14 Kwara 3
15 Niger 3
16 Ogun 2
17 Adamawa 1
18 Edo 1
19 Enugu 1
20 Kogi 1
21 Rivers 1
22 Sokoto 1
223
Please visit this link for details: https://portal.minesandsteel.gov.ng/MarketPlace/BuyingCentre
2.6 Contract Transparency
Nigeria operates a cadastre system for the solid minerals sector, which encourages
competition and openness in granting of licenses to interested applicants. However, Section
116 of the NMMA requires that the mining leaseholder conclude a Community Development
Agreement (CDA) with the host community prior to starting any activity. This Agreement
must ensure the transfer of social and economic benefits to the community to address all or
some of the following issues: educational scholarships, training and employment
opportunities; financial or other types of support for infrastructure development.
0
50
100
150
200
250
300
North
Central
North East North West South East South
South
South West
256222
282
95149
196

NEITI SOLID MINERALS AUDIT REPORT FOR 2016
Tajudeen Badejo & Co (Chartered Accountants) Page 35 of 90
Furthermore, the Freedom of Information (FOI) Act enacted in 2011, supports making public
records and information freely available, by providing the public access to public records and
information. Also, as part of the government’s fight against corruption, the Open Government
Partnership (OGP), through the Bureau of Public Procurement (BPP) began a pilot
implementation of the Nigeria Open Contracting Portal (NOCOPO). The implementation of
these reforms in Nigeria will end the issues surrounding the non-availability of documents in
the public domain.
Following from the above, Nigeria does not have any contract arrangement specific to the
solid minerals sector.
Kindly visit these links: www.neiti.gov.ng; www.foia.justice.gov.ng and http://nocopo.bpp.gov.ng
2.7 Beneficial Ownership (BO)
Requirement 2.5 of the 2016 EITI standard recommends that all implementing countries
maintain a public register of the beneficial owners for all corporate entities that bid for,
operate or invest in extractive assets, including the identities of their beneficial owners, the
level of ownership and details of how ownership or control is exerted. At present, there is no
publicly accessible BO register in Nigeria. With the pronouncement of Nigeria’s President at
the London anti-corruption summit in 2016 that Nigeria will produce a public register of
beneficial owners, Nigeria signed on to OGP and subsequently developed a BO roadmap in
line with EITI requirements. In addition, several workshops have been held towards ensuring
that a BO register is opened in the near future.
The CAC is the repository of BO register for all registered or incorporated companies in
Nigeria albeit not publicly accessible and comprehensive. In addition, the MCO will drive the
process for the mining sector. BO information for 47 companies of the 56 covered is
contained in Appendix 4.
2.8 State Participation
The government implemented the mining sector reforms from 2005 to 2006 that culminated
into the enactment of Nigeria Mineral and Mining Act, 2007. The reforms also marked the
redefinition of the role of government to that of an administrator-regulator and the acceptance
of the private sector as owner/operator. For details, visit: http://www.minesandsteel.gov.ng/wp-content/uploads/2016/09/Nigeria_Mining_Growth_Roadmap_Final.pdf
Government privatized the assets of the Nigerian Mining Corporation and Nigerian Coal
Corporation and has no operational stake in any company in the mining sector.
Based on the above, there is no state participation in mining activities in Nigeria in 2016.

NEITI SOLID MINERALS AUDIT REPORT FOR 2016
Tajudeen Badejo & Co (Chartered Accountants) Page 36 of 90
3.0 PRODUCTION AND EXPORT
3.1 Overview of the Nigeria Mining Industry
3.1.1 Mineral Endowment
Nigeria is endowed with a variety of solid minerals ranging from precious metals, gemstones
to industrial minerals. Presently, the FG has identified about forty (40) different kinds of solid
minerals that have the potentials to make significant contribution to the national economy.
Mineral resources are categorized into five broad groups found in Nigeria:
▪ Industrial minerals (e.g. barite, kaolin, gypsum, feldspar, limestone)
▪ Energy minerals (e.g. coal, bitumen, lignite, uranium)
▪ Metallic ores minerals (e.g. gold, cassiterite, columbite, iron ore, lead-zinc, copper)
▪ Construction minerals (e.g. granite, gravel, laterite, sand)
▪ Precious stones (e.g. sapphire, tourmaline, emerald, topaz, amethyst, garnet etc)
3.2 Exploration
3.2.1 Mineral Prospecting and Mining
Nigeria has abundant mineral resources, however not all the minerals are available in
commercial quantities. As part of the strategies for reforms, a roadmap for the development
of the sector was launched in 2016. The roadmap identified the need for credible geological
data, to be anchored by NGSA. Other notable reforms include the expansion of the roles of
the NSRMEA to cover all solid minerals.
For details, visit http://nsrmea.minesandsteel.com/page/index/services
Government has identified seven strategic minerals, namely: Coal, Bitumen, Limestone, Iron
Ore, Barites, Gold and Lead/Zinc for priority development.
In year 2016, MCO issued 510 EL covering 38 different minerals as shown in the table
below.
Table 3.1: Analysis of exploration licenses issued for minerals in 2016
S/N Types of minerals No of EL
issued
1 Gold 181
2 Lead-Zinc 59
3 Tin 34
4 Iron Ore 26
5 Tourmaline 23
6 Limestone 22
7 Coal 18
8 Columbite 14
9 Copper 14
10 Saphire 14
11 Cassiterite 13
12 Baryte 9
13 Zircon 9
14 Marble 8
15 Graphite 7
16 Kaolin 6
17 Quartz 6
18 Aquamarine 5
19 Diamond 4
20 Gypsum 4

NEITI SOLID MINERALS AUDIT REPORT FOR 2016
Tajudeen Badejo & Co (Chartered Accountants) Page 37 of 90
21 Beryl 3
22 Clay 3
23 Corundum 3
24 Manganese 3
25 Sand 3
26 Brine 2
27 Feldspar 2
28 Rutile 2
29 Talc 2
30 Tantalite 2
31 Wolframite 2
32 Chromite 1
33 Granite 1
34 Magnesite 1
35 Nickel 1
36 Niobium 1
37 Phosphate 1
38 Shale 1 510
Figure 3.1: Exploration licenses issued for minerals in 2016
Gold
Gold is associated with the schist belt of the northwest, central and southwest regions of
Nigeria. There are also smaller occurrences beyond these major areas. Prospecting and
exploration activities for the mineral are ongoing; One hundred and eighty one (181) new
exploration licenses for gold were granted in 2016, an indication of active exploration.
Gold
Tin
Tourmaline
Coal
Copper
Cassiterite
Zircon
Graphite
Quartz
Diamond
Beryl
Corundum
Sand
Feldspar
Talc
Wolframite
Granite
Nickel
Phosphate
Distribution of ELs issued in 2016

NEITI SOLID MINERALS AUDIT REPORT FOR 2016
Tajudeen Badejo & Co (Chartered Accountants) Page 38 of 90
Table 3.2: Details of exploration licenses issued for Gold in 2016
S/N Code Title holders CU State LGA Effective
date
Expiring
date
1 13961 Great Talents Investments Ltd 448 Zamfara Tsafe 23/07/2015 22/07/2018
2 16022 Saada Drilling Co. Ltd 204 Kebbi Shanga 09/09/2013 08/09/2016
3 17655 Zenith Exploration & Development Ltd. 8 Zamfara Tsafe 16/09/2016 15/09/2019
4 17677 Western Metal Products Company Ltd 868 Niger Muya 8/05/2013 07/05/2015
5 18224 Nofab Global Nig. Ltd. 80 Niger Shiroro 08/07/2016 07/07/2019
6 18244 Energy and Metals Industries Ltd 42 Kogi Yagba West 12/01/2016 11/01/2019
7 18245 Energy and Metal Industris Ltd 404 Kogi Kabba - Bunu 10/08/2016 09/08/2019
8 18992 Awindy International Co. Ltd 202 Niger Rafi 13/01/2015 12/01/2018
9 19434 Triumph Mining and Exploration Company Ltd 59 Niger Mashegu 11/3/2015 10/03/2018
10 20524 Abasa Nigeria Enterprises Ltd 60 Kogi Yagba West 12/01/2016 11/01/2019
11 20718 Elle Jay Limited 220 Kebbi Fakai 26/08/2015 25/08/2018
12 20827 Tarb Industry & Geominar Ltd 144 Osun Atakunmosa East 12/01/2016 11/01/2019
13 20980 Dinawa Business & Mines 90 Zamfara Gusau 29/10/2015 28/10/2018
14 20993 Matrix Energy Ltd 48 Niger Shiroro 02/02/2016 01/02/2019
15 21043 Nulam Nig. Ltd. 26 Niger Rafi 08/07/2016 07/07/2019
16 21080 Kiansmith Trade & Co. Ltd 297 Osun Ilesha 17/03/2016 16/03/2019
17 21111 Sahelix Mineral Resources Ltd 96 Katsina Kankara 02/02/2016 01/02/2019
18 21155 Micro Leasing Ltd 153 Osun Ilesha 17/03/2016 16/03/2019
19 21158 Micro Leasing Ltd 189 Osun Ilesha 02/02/2016 01/02/2019
20 21159 Gladwyn Investment Company Ltd 152 Osun Ilesha 02/02/2016 01/02/2019
21 21160 Gladwyn Investment Company Ltd 108 Osun Ilesha 17/03/2016 16/03/2019
22 21237 Reg Oil Limited 56 Niger Shiroro 12/01/2016 11/01/2019
23 21242 Almond Maritime Nigeria Ltd 50 Zamfara Bukkuyum 12/11/2015 11/11/2018
24 21267 Chukwujekwu and Associates Ltd 28 Niger Borgu 12/01/2016 11/01/2019
25 21321 Sahelix Mineral Resources Ltd 88 Katsina Kankara 17/03/2016 16/03/2019
26 21360 Philip Paul Energy Ltd 14 Niger Shiroro 12/01/2016 11/01/2019
27 21430 Joe Tech Systems Ltd 15 Niger Wushishi 12/01/2016 11/01/2019
28 21570 Masters Energy Oil and Gas Ltd 72 Kaduna Birnin Gwari 02/02/2016 01/02/2019
29 21572 United Investment Target Limited 35 Zamfara Anka 12/11/2015 11/11/2018
30 21642 Hasun Resources Ltd 8 Niger Shiroro 12/01/2016 11/01/2019
31 21707 Ashmalbir Nigeria Ltd 288 Niger Bosso 12/01/2016 11/01/2019
32 21794 New Cross Globe Mining Company Ltd 480 Niger Lapai 12/01/2016 11/01/2019
33 21796 Ismo Mining Co. Ltd 488 Niger Lapai 12/01/2016 11/01/2019
34 21798 Gold Touch Royal Mining Co. Ltd 374 Niger Lapai 12/01/2016 11/01/2019
35 21815 Ismo Mining Co. Ltd 120 Niger Lapai 12/01/2016 11/01/2019
36 21867 Plural Holdings Ltd 64 Niger Mashegu 01/04/2016 31/03/2019
37 21869 Plural Holdings Ltd 100 Niger Lavun 01/04/2016 31/03/2019
38 21870 I-Box Engineering Nigeria Ltd 200 Niger Shiroro 01/04/2016 31/03/2019
39 21911 Tasaheel Global Resources Ltd 130 Niger Bosso/ Paikoro 17/03/2016 16/03/2019
40 21925 Partners International Facilities Ltd 80 Niger Bosso 16/09/2016 15/09/2019
41 21926 Drax Nigeria Ltd 32 Niger Paikoro 02/02/2016 01/02/2019
42 21948 Gladius Mines Ltd 108 Niger Bosso 02/09/2016 01/09/2019
43 21949 Gladius Mines Ltd 21 Niger Paikoro 02/09/2016 01/09/2019
44 21953 Taraba Solid Minerals Development Company
Ltd
127 Taraba Gashaka 10/08/2016 09/08/2016
45 21980 Claims and Insurance Diagnostics Ltd. 180 Kwara Pategi 10/08/2016 09/08/2019
46 22006 Chinige Technology Services Ltd 425 Kaduna Birni Gwari 17/03/2016 16/03/2019
47 22007 Chinige Technology Services Ltd 32 Niger Paikoro/ Munya 12/01/2016 11/01/2019
48 22087 Richflood International Ltd 195 Niger Katchica 12/05/2016 11/05/2019
49 22095 Sodangi Resources Comp. Ltd 100 Niger Borgu 01/04/2016 31/03/2019
50 22099 Plural Holdings Ltd 118 Niger Majama 12/05/2016 11/05/2019
51 22129 Purple Linen Ultra Services Ltd 35 Niger Bosso 17/03/2016 16/03/2019
52 22130 Fotton Ways Ltd 50 Niger Rafi 17/03/2016 16/03/2019
53 22176 Hidkala Investments Ltd 91 Niger Shiroro 17/03/2016 16/03/2019
54 22190 Amtech Automobile Ltd 99 Zamfara Maru 12/05/2016 11/05/2019
55 22191 Amtech Automobile Ltd 108 Zamfara Tsafe 12/05/2016 11/05/2019
56 22197 Rochichi Mining Company Ltd 192 Niger Chanchaga 17/03/2016 16/03/2019
57 22217 Sancrete Engineering Ltd NMC Titles stop 320 Niger Rafi 01/04/2016 31/03/2019
58 22245 Alvita Mineral Ventures Ltd 162 Niger Paikoro 17/03/2016 16/03/2019
59 22318 Sunland Metal Ltd. 144 Niger Paikoro 12/05/2016 11/05/2019
60 22328 Taraba Solid Minerals Development Company
Ltd
448 Taraba Bali 10/08/2016 09/08/2019
61 22376 Moro Economic Consult Ltd 110 Osun Atakumosa West 08/07/2016 07/07/2019
62 22383 Nigerlum Limited 50 Taraba Gashaka 12/05/2016 11/05/2019
63 22400 Bimza Nigeria Ltd 31 Niger Shiroro 12/05/2016 11/05/2019
64 22401 Bimza Nigeria Ltd 32 Niger Shiroro 12/05/2016 11/05/2019
65 22410 Canucks Communications Ltd 225 Kebbi Danko, Zuru 08/07/2016 07/07/2019
66 22411 Canucks Communications Ltd 81 Kebbi Nasagu/ Danko 08/07/2016 07/07/2019
67 22424 Sandcrete Engineering Nigeria Ltd 323 Kaduna Birnin Gwari 12/05/2016 11/05/2019
68 22425 Aflan Nigeria Ltd. 100 Niger Shiroro 01/04/2016 31/03/2019
69 22426 Tab International Links Ltd 200 Niger Shiroro 12/05/2016 11/05/2016
70 22439 Derberith Nig. Ltd. 108 Katsina Danja 08/07/2016 07/07/2019
71 22448 Sarat Nigeria Ltd 105 Niger Magama 12/05/2016 11/05/2019
72 22462 Allied African International Mining Company 356 Kaduna Birni Gwari 17/03/2016 16/03/2019
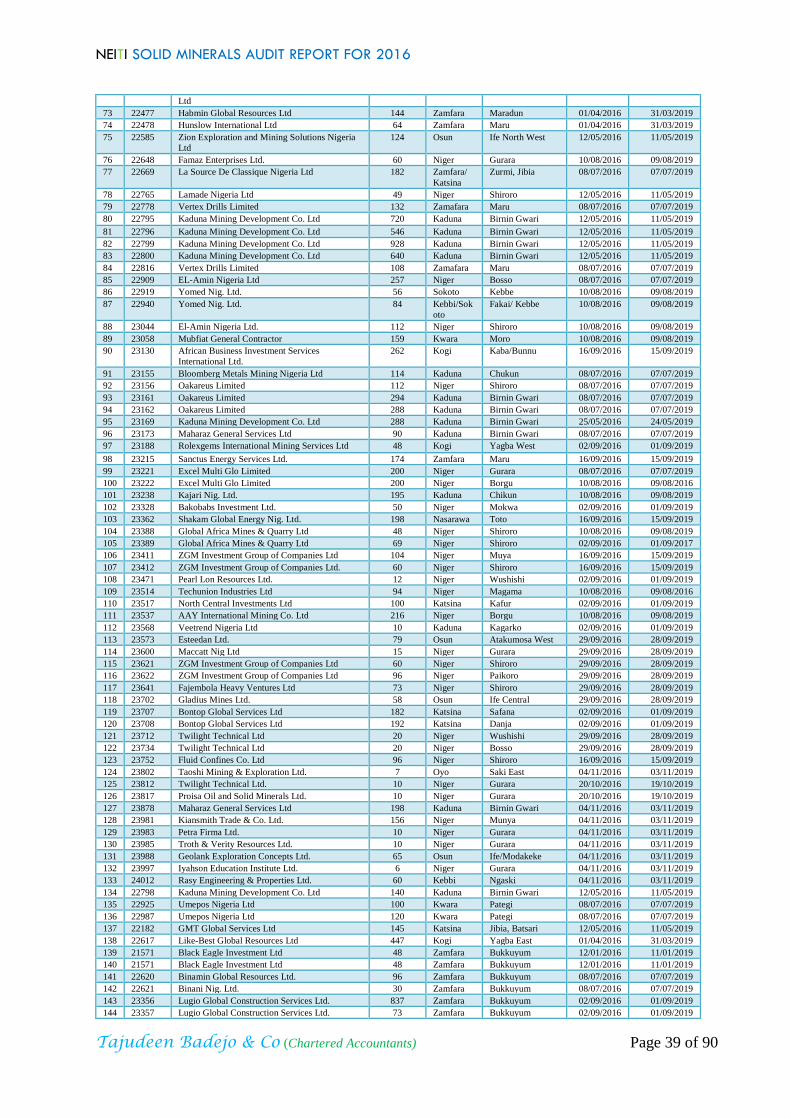
NEITI SOLID MINERALS AUDIT REPORT FOR 2016
Tajudeen Badejo & Co (Chartered Accountants) Page 39 of 90
Ltd
73 22477 Habmin Global Resources Ltd 144 Zamfara Maradun 01/04/2016 31/03/2019
74 22478 Hunslow International Ltd 64 Zamfara Maru 01/04/2016 31/03/2019
75 22585 Zion Exploration and Mining Solutions Nigeria
Ltd
124 Osun Ife North West 12/05/2016 11/05/2019
76 22648 Famaz Enterprises Ltd. 60 Niger Gurara 10/08/2016 09/08/2019
77 22669 La Source De Classique Nigeria Ltd 182 Zamfara/
Katsina
Zurmi, Jibia 08/07/2016 07/07/2019
78 22765 Lamade Nigeria Ltd 49 Niger Shiroro 12/05/2016 11/05/2019
79 22778 Vertex Drills Limited 132 Zamafara Maru 08/07/2016 07/07/2019
80 22795 Kaduna Mining Development Co. Ltd 720 Kaduna Birnin Gwari 12/05/2016 11/05/2019
81 22796 Kaduna Mining Development Co. Ltd 546 Kaduna Birnin Gwari 12/05/2016 11/05/2019
82 22799 Kaduna Mining Development Co. Ltd 928 Kaduna Birnin Gwari 12/05/2016 11/05/2019
83 22800 Kaduna Mining Development Co. Ltd 640 Kaduna Birnin Gwari 12/05/2016 11/05/2019
84 22816 Vertex Drills Limited 108 Zamafara Maru 08/07/2016 07/07/2019
85 22909 EL-Amin Nigeria Ltd 257 Niger Bosso 08/07/2016 07/07/2019
86 22919 Yomed Nig. Ltd. 56 Sokoto Kebbe 10/08/2016 09/08/2019
87 22940 Yomed Nig. Ltd. 84 Kebbi/Sok
oto
Fakai/ Kebbe 10/08/2016 09/08/2019
88 23044 El-Amin Nigeria Ltd. 112 Niger Shiroro 10/08/2016 09/08/2019
89 23058 Mubfiat General Contractor 159 Kwara Moro 10/08/2016 09/08/2019
90 23130 African Business Investment Services
International Ltd.
262 Kogi Kaba/Bunnu 16/09/2016 15/09/2019
91 23155 Bloomberg Metals Mining Nigeria Ltd 114 Kaduna Chukun 08/07/2016 07/07/2019
92 23156 Oakareus Limited 112 Niger Shiroro 08/07/2016 07/07/2019
93 23161 Oakareus Limited 294 Kaduna Birnin Gwari 08/07/2016 07/07/2019
94 23162 Oakareus Limited 288 Kaduna Birnin Gwari 08/07/2016 07/07/2019
95 23169 Kaduna Mining Development Co. Ltd 288 Kaduna Birnin Gwari 25/05/2016 24/05/2019
96 23173 Maharaz General Services Ltd 90 Kaduna Birnin Gwari 08/07/2016 07/07/2019
97 23188 Rolexgems International Mining Services Ltd 48 Kogi Yagba West 02/09/2016 01/09/2019
98 23215 Sanctus Energy Services Ltd. 174 Zamfara Maru 16/09/2016 15/09/2019
99 23221 Excel Multi Glo Limited 200 Niger Gurara 08/07/2016 07/07/2019
100 23222 Excel Multi Glo Limited 200 Niger Borgu 10/08/2016 09/08/2016
101 23238 Kajari Nig. Ltd. 195 Kaduna Chikun 10/08/2016 09/08/2019
102 23328 Bakobabs Investment Ltd. 50 Niger Mokwa 02/09/2016 01/09/2019
103 23362 Shakam Global Energy Nig. Ltd. 198 Nasarawa Toto 16/09/2016 15/09/2019
104 23388 Global Africa Mines & Quarry Ltd 48 Niger Shiroro 10/08/2016 09/08/2019
105 23389 Global Africa Mines & Quarry Ltd 69 Niger Shiroro 02/09/2016 01/09/2017
106 23411 ZGM Investment Group of Companies Ltd 104 Niger Muya 16/09/2016 15/09/2019
107 23412 ZGM Investment Group of Companies Ltd. 60 Niger Shiroro 16/09/2016 15/09/2019
108 23471 Pearl Lon Resources Ltd. 12 Niger Wushishi 02/09/2016 01/09/2019
109 23514 Techunion Industries Ltd 94 Niger Magama 10/08/2016 09/08/2016
110 23517 North Central Investments Ltd 100 Katsina Kafur 02/09/2016 01/09/2019
111 23537 AAY International Mining Co. Ltd 216 Niger Borgu 10/08/2016 09/08/2019
112 23568 Veetrend Nigeria Ltd 10 Kaduna Kagarko 02/09/2016 01/09/2019
113 23573 Esteedan Ltd. 79 Osun Atakumosa West 29/09/2016 28/09/2019
114 23600 Maccatt Nig Ltd 15 Niger Gurara 29/09/2016 28/09/2019
115 23621 ZGM Investment Group of Companies Ltd 60 Niger Shiroro 29/09/2016 28/09/2019
116 23622 ZGM Investment Group of Companies Ltd 96 Niger Paikoro 29/09/2016 28/09/2019
117 23641 Fajembola Heavy Ventures Ltd 73 Niger Shiroro 29/09/2016 28/09/2019
118 23702 Gladius Mines Ltd. 58 Osun Ife Central 29/09/2016 28/09/2019
119 23707 Bontop Global Services Ltd 182 Katsina Safana 02/09/2016 01/09/2019
120 23708 Bontop Global Services Ltd 192 Katsina Danja 02/09/2016 01/09/2019
121 23712 Twilight Technical Ltd 20 Niger Wushishi 29/09/2016 28/09/2019
122 23734 Twilight Technical Ltd 20 Niger Bosso 29/09/2016 28/09/2019
123 23752 Fluid Confines Co. Ltd 96 Niger Shiroro 16/09/2016 15/09/2019
124 23802 Taoshi Mining & Exploration Ltd. 7 Oyo Saki East 04/11/2016 03/11/2019
125 23812 Twilight Technical Ltd. 10 Niger Gurara 20/10/2016 19/10/2019
126 23817 Proisa Oil and Solid Minerals Ltd. 10 Niger Gurara 20/10/2016 19/10/2019
127 23878 Maharaz General Services Ltd 198 Kaduna Birnin Gwari 04/11/2016 03/11/2019
128 23981 Kiansmith Trade & Co. Ltd. 156 Niger Munya 04/11/2016 03/11/2019
129 23983 Petra Firma Ltd. 10 Niger Gurara 04/11/2016 03/11/2019
130 23985 Troth & Verity Resources Ltd. 10 Niger Gurara 04/11/2016 03/11/2019
131 23988 Geolank Exploration Concepts Ltd. 65 Osun Ife/Modakeke 04/11/2016 03/11/2019
132 23997 Iyahson Education Institute Ltd. 6 Niger Gurara 04/11/2016 03/11/2019
133 24012 Rasy Engineering & Properties Ltd. 60 Kebbi Ngaski 04/11/2016 03/11/2019
134 22798 Kaduna Mining Development Co. Ltd 140 Kaduna Birnin Gwari 12/05/2016 11/05/2019
135 22925 Umepos Nigeria Ltd 100 Kwara Pategi 08/07/2016 07/07/2019
136 22987 Umepos Nigeria Ltd 120 Kwara Pategi 08/07/2016 07/07/2019
137 22182 GMT Global Services Ltd 145 Katsina Jibia, Batsari 12/05/2016 11/05/2019
138 22617 Like-Best Global Resources Ltd 447 Kogi Yagba East 01/04/2016 31/03/2019
139 21571 Black Eagle Investment Ltd 48 Zamfara Bukkuyum 12/01/2016 11/01/2019
140 21571 Black Eagle Investment Ltd 48 Zamfara Bukkuyum 12/01/2016 11/01/2019
141 22620 Binamin Global Resources Ltd. 96 Zamfara Bukkuyum 08/07/2016 07/07/2019
142 22621 Binani Nig. Ltd. 30 Zamfara Bukkuyum 08/07/2016 07/07/2019
143 23356 Lugio Global Construction Services Ltd. 837 Zamfara Bukkuyum 02/09/2016 01/09/2019
144 23357 Lugio Global Construction Services Ltd. 73 Zamfara Bukkuyum 02/09/2016 01/09/2019

NEITI SOLID MINERALS AUDIT REPORT FOR 2016
Tajudeen Badejo & Co (Chartered Accountants) Page 40 of 90
145 23559 Cometstar Manufacturing Comp. Ltd. 34 Zamfara Anka 02/09/2016 01/09/2019
146 23560 Cometstar Manufacturing Comp. Ltd. 24 Zamfara Anka 02/09/2016 01/09/2019
147 23581 Mining for New Generation International Ltd. 240 Kogi Kabba/ Bunu 02/09/2016 01/09/2019
148 23583 Lugio Global Construction Services Ltd. 248 Kaduna Birnin Gwari 02/09/2016 01/09/2019
149 22748 Metro-Bright General Merchant Ltd 140 Zamfara Anka 10/08/2016 09/08/2019
150 23538 Triangurel Resource Ventures Company Ltd 164 Niger Shiroro 02/09/2016 01/09/2019
151 22185 Rivestive Consortium Ltd 192 Kebbi Sakaba 12/05/2016 11/05/2019
152 18558 Gamji Minerals Ltd 130 Zamfara Anka 11/3/2015 10/03/2018
153 18557 Mines Quest Ltd 105 Zamfara Anka 11/3/2015 10/03/2018
154 23218 Three Partners Trading and Contracting Ltd 121 Niger Gurara 10/08/2016 09/08/2016
155 21553 Spring Gem Resources Ltd 176 Kogi Yagba East 12/11/2015 11/11/2018
156 22443 Unique EL-Mao Nigeria Ltd 96 Niger Shiroro 12/05/2016 11/05/2019
157 23257 Metwoc Industries Ltd 72 Niger Shiroro 08/07/2016 07/07/2019
158 23898 Tilbury Oil & Gas Ltd. 297 Bauchi Alkaleri 20/10/2016 19/10/2019
159 23505 Syils Services Ltd 17 Zamfara Bukkuyum 02/09/2016 01/09/2019
160 21252 Mines Quest Ltd. 84 Zamfara Anka 10/08/2016 09/08/2016
161 23610 Lugio Global Construction Services Ltd. 194 Kaduna Birnin Gwari 16/09/2016 15/09/2019
162 23670 A.M.K.W. International Nigeria Ltd 18 Niger Shiroro 20/10/2016 19/10/2019
163 22750 Jointrade International Ventures Ltd 90 Niger Rafi/ Shiroro 12/05/2016 11/05/2019
164 22751 Jointrade International Ventures Ltd 152 Niger Rafi 12/05/2016 11/05/2019
165 23743 ACSG Investment Partners Ltd. 105 Niger Gurara 29/09/2016 28/09/2019
166 23582 Lugio Global Construction Services Ltd. 153 Kaduna Birnin Gwari 16/09/2016 15/09/2019
167 21931 Sarkin Danko Sule Mining & General Merchant
Ltd
100 Kebbi Sakaba 12/05/2016 11/05/2019
168 21932 Sarkin Danko Sule Mining & General Merchant
Ltd
50 Niger Riyau 12/05/2016 11/05/2019
169 21632 A. G. Vision Construction Nigeria Ltd 226 Zamfara Bukkuyum 01/04/2016 31/03/2019
170 23513 BM Mining and Quarrying Ltd 200 Ogun Ijebu North 16/09/2016 15/09/2019
171 22650 IRMIB and Sons Ltd. 60 Niger Gurara 08/07/2016 07/07/2019
172 22806 Palladium Mining Ltd 320 Zamfara Bakura/ Anka 08/07/2016 07/07/2019
173 23260 Phaseplus Technologies Ltd 143 Katsina Safana 16/09/2016 15/09/2019
174 22570 Quality Innovations Nigeria Ltd 48 Niger Rafi 02/09/2016 01/09/2019
175 23223 Excel Multi Glo Limited 102 Niger Rafi 10/08/2016 09/08/2016
176 22865 Technical Resources and Investment Ltd 472 Kaduna Chikun 08/07/2016 07/07/2019
177 23791 Mineqore Resources Ltd. 104 Kaduna Birnin Gwari 04/11/2016 03/11/2019
178 23926 Granit Porten Integrated Service Ltd. 200 Niger Shiroro 04/11/2016 03/11/2019
179 22554 Brisu Gold Nigeria Ltd 80 Kaduna Chikun 12/05/2016 11/05/2019
180 23623 Waldot Investment Nomineees Ltd 24 Niger Gurara 29/09/2016 28/09/2019
181 23181 Muskalam Investment Ltd 119 Niger Rafi 08/07/2016 07/07/2019
Lead-Zinc
Lead-Zinc ores occur together and are usually associated with copper and silver. Lead-Zinc
mineralization occurs within the Benue trough that extends from the northeast to southeast.
Other occurrences are found in the northwest. Fifty-nine (59) exploration licenses were
granted for Lead-Zinc in 2016.
Table 3.3: Details of exploration licenses issued for Lead-Zinc in 2016
S/N Code Title holders CU State LGA Effective
date
Expiry
date
1 21675 Palladium Mining Ltd 130 Adamawa Ganye/Toungo 01/04/2016 31/03/2019
2 21514 Data Flash Nigeria Ltd 256 Zamfara Kaura Namoda 12/01/2016 11/01/2019
3 22495 Tergong Ventures Nig. Ltd. 98 Nassarawa Eggon 10/08/2016 09/08/2019
4 22446 Bebeyi Merchants Ltd 100 Nasarawa Nasarawa Eggon 12/05/2016 11/05/2019
5 22873 H. I. S. Nigeria Limited 60 Adamawa Lamurde 08/07/2016 07/07/2019
6 22063 Timtali Mining Comp. Ltd 120 Plateau Wase 12/05/2016 11/05/2019
7 22064 Timtali Mining Comp. Ltd 96 Plateau Wase 12/05/2016 11/05/2019
8 22075 Ejide Energy Ltd 40 Plateau Wase 12/05/2016 11/05/2019
9 22311 Synton Energy Ltd 128 Plateau Wase 12/05/2016 11/05/2019
10 22372 ASG Solar Tech 384 Nasarawa Nasarawa Eggon 12/05/2016 11/05/2019
11 22671 Buccam Nigeria Ltd 32 Nasarawa Awe 12/05/2016 11/05/2019
12 22835 Wexl Optimal Resources Ltd. 67 Nasarawa Nasarawa Eggon 12/05/2016 11/05/2019
13 22836 Wexl Optimal Resources Ltd. 130 Nasarawa Nasarawa Eggon 12/05/2016 11/05/2019
14 23414 Hydra Mining Nigeria Ltd 20 Ebonyi Abakaliki 02/09/2016 01/09/2019
15 23415 Hydra Mining Nigeria Ltd 63 Ebonyi Abakaliki 02/09/2016 01/09/2019
16 22127 Liberty Redstone Ltd 240 Nasarawa Keana 17/03/2016 16/03/2019

NEITI SOLID MINERALS AUDIT REPORT FOR 2016
Tajudeen Badejo & Co (Chartered Accountants) Page 41 of 90
17 14799 Premier Diamond Mine Nigeria Ltd 192 Niger Nasco 20/10/2016 19/10/2019
18 16502 Altima Consolidated Ltd 352 Bauchi Tafawa Belewa 08/09/2015 07/09/2018
19 19298 Tiansheng Mining Ltd 368 Plateau Wase 12/01/2016 11/01/2019
20 19301 Tiansheng Mining Ltd 520 Plateau Wase 12/01/2016 11/01/2019
21 20089 Bebeyi Merchants Limited 186 Nasarawa Nasarawa Eggon 06/10/2015 05/10/2018
22 20925 Bill and Brothers Ltd 79 Ebonyi Abaakaliki 12/01/2016 11/01/2019
23 21243 Almond Maritime Nigeria Ltd 108 Plateau Wase 12/11/2015 11/11/2018
24 21244 Almond Maritime Nigeria Ltd 143 Plateau Wase 12/01/2016 11/01/2019
25 21406 Yo-Akaito and Sons Ltd 56 Plateau Wase 08/07/2016 07/07/2019
26 21454 Red Lizard Mining Company Ltd 9 Zamfara Bukkuyum 12/01/2016 11/01/2019
27 21471 Desivar Global Nigeria Ltd 146 Nasarawa Awe 12/11/2015 11/11/2018
28 21558 Stemrock Integrated Services Ltd 115 Ebonyi Ebonyi 12/01/2016 11/01/2019
29 21655 Highbury Nigeria Ltd 21 Nasarawa Keana 12/01/2016 11/01/2019
30 21744 Oxbox Minerals Mining Ltd 54 Plateau Wase 02/02/2016 01/02/2019
31 21751 Sunshine Pennisula Eonomic Development
company ltd
70 Plateau Wase 02/02/2016 01/02/2019
32 21752 Admire Properties Ltd 47 Plateau Wase 02/02/2016 01/02/2019
33 21769 Yo-Akaito and Sons Ltd 60 Taraba Karim Lamido 10/08/2016 09/08/2019
34 21795 Fahris Mining Co. Ltd 20 Bauchi Alkaleri 12/01/2016 11/01/2019
35 21933 Yo-Akaito and Sons Ltd 16 Bauchi Alkaleri 10/08/2016 09/08/2019
36 21934 Yo-Akaito and Sons Ltd 56 Taraba Karim Lamido 10/08/2016 09/08/2019
37 21973 Strategic Metals Ltd 152 Nasarawa Awe 17/03/2016 16/03/2019
38 22102 Plural Holdings Ltd 170 Plateau Wase 12/05/2016 11/05/2019
39 23219 Ibrums Nigeria Ltd 50 Bauchi Alkaleri 08/07/2016 07/07/2019
40 20924 Bill and Brothers Ltd 71 Ebonyi Ezza South 12/11/2015 11/11/2018
41 22287 Ebonyi State Northern Construction Comp. Ltd 896 Ebonyi Ebonyi 12/05/2016 11/05/2019
42 22460 Adesadiq and Sons Nigeria Ltd 28 Nasarawa Awe 01/04/2016 31/03/2019
43 22901 Courage Energy Ltd 50 Ebonyi Ikwo 10/08/2016 09/08/2019
44 23138 Wonder Geology and Mining Company Nigeria
Ltd
36 Bauchi Alkaleri 08/07/2016 07/07/2019
45 23160 Princecom oli services ltd 100 Nasarawa Nasarawa 08/07/2016 07/07/2019
46 23172 Vinco Innovations Nigeria Ltd 50 Nasarawa Eggon 08/07/2016 07/07/2019
47 21939 Natijah Minerals Ltd 4 Nasarawa Awe 12/05/2016 11/05/2016
48 23735 Mafasuba Global System Ltd 100 Taraba Yorro 29/09/2016 28/09/2019
49 18960 Metrolife Limited 447 Ebonyi Izzi 16/12/2014 15/12/2017
50 22781 Kain Energy Ltd 167 Plateau Wase 12/05/2016 11/05/2019
51 21689 Data Flash Nigeria Ltd 150 Zamfara Talata Mafara 12/01/2016 11/01/2019
52 21559 Stemrock Integrated Services Ltd. 22 Ebonyi Ikwo 10/08/2016 09/08/2019
53 23437 Vinco Innovations Nig. Ltd. 40 Nasaraw Nasarawa
Eggon/Lafia
20/10/2016 19/10/2019
54 23602 Crown Roofing Tiles World Wide Ltd. 15 Ebonyi Abakaliki 02/09/2016 01/09/2019
55 23706 Akaja International Nig. Ltd. 150 Nasarawa Keana 29/09/2016 28/09/2019
56 23846 Sabawuro Nig. Ltd. 10 Taraba Karim Lamido 20/10/2016 19/10/2019
57 24017 Earnest Dormain Co. Ltd. 104 Ebonyi Abakaliki 04/11/2016 03/11/2019
58 24018 Gilbert Denis Global Services Ltd. 11 Benue Logo 04/11/2016 03/11/2019
59 23902 San Peirre Ltd. 64 Plateau Wase 20/10/2016 19/10/2019
Tin
Tin occurs within the Younger Granite province and part of the Basement Complex of
Nigeria. Thirty four (34) ELs were issued in 2016.
Table 3.4: Details of exploration licenses issued for Tin in 2016
S/N Code Title holders CU State LGA Effective
date
Expiry
date
1 21977 Sahelix Yargaiya Mineral Resources Ltd 335 Oyo Saki East 01/04/2016 31/03/2019
2 22171 Sahelix Yargaiya Mineral Resources Ltd 169 Oyo Atigbo 17/03/2016 16/03/2019
3 22172 Sahelix Yargaiya Mineral Resources Ltd 224 Oyo Saki West 17/03/2016 16/03/2019
4 22174 Sahelix Yargaiya Mineral Resources Ltd 99 Oyo Saki West 01/04/2016 31/03/2019
5 22713 Kain Energy Ltd 380 Nasarawa Wamba 12/05/2016 11/05/2019
6 20756 Azuba Quarry & Construction Co. Ltd 100 Katsina Batsari, Jibia 29/102015 28/10/2018
7 22100 Plural Holding Ltd 100 Bauchi Toro 12/05/2016 11/05/2019
8 23724 Malcomines Ltd 68 Bauchi Toro 16/09/2016 15/09/2019
9 14638 Altima Consolidated Ltd 222 Plateau Jos South 08/09/2015 07/09/2018
10 19041 Altima Consolidated Ltd 54 Bauchi Alkaleri 08/09/2015 07/09/2018
11 22103 Geodel Integrated Systems Ltd 150 Bauchi Toro/ Jos East 12/05/2016 11/05/2019
12 23033 Resources Global Foresight ltd 280 Bauchi Tafawa Balewa 16/09/2016 15/09/2019
13 23034 Excel Gems Resources Ltd 144 Kaduna Sanga 08/07/2016 07/07/2019
14 23408 CITIOIL (Nigeria) Ltd 50 Kaduna Jama'a 02/09/2016 01/09/2019
15 23854 Pathdivine Multi Services Ltd. 36 Plateau Barkin Ladi 20/10/2016 19/10/2019
16 23725 Malcomines Ltd 168 Bauchi Toro 16/09/2016 15/09/2019
17 18493 Sino - Mineral International Ltd 279 Plateau Bassa 12/01/2016 11/01/2019
18 23764 Xi Yu International Mining Nig. Comp. Ltd. 73 Plateau Barkin Ladi 20/10/2016 19/10/2019
19 23765 Xi Yu International Mining Nig. Comp. Ltd. 20 Plateau Jos South/Barkin Ladi 20/10/2016 19/10/2019

NEITI SOLID MINERALS AUDIT REPORT FOR 2016
Tajudeen Badejo & Co (Chartered Accountants) Page 42 of 90
20 23766 Xi Yu International Mining Nig. Comp. Ltd. 119 Plateau Barkin Ladi 20/10/2016 19/10/2019
21 23767 Xi Yu International Mining Nig. Comp. Ltd. 176 Plateau Barkin Ladi 20/10/2016 19/10/2019
22 22015 Ningi Miners and Solid Minerals Ltd 56 Bauchi Ningi 12/05/2016 11/05/2016
23 22016 Ningi Miners and Solid Minerals Ltd 90 Bauchi Ningi 12/05/2016 11/05/2016
24 22017 Ningi Miners and Solid Minerals Ltd 63 Bauchi Ningi 08/07/2016 07/07/2019
25 23455 Madkavip Nig. Ltd. 80 Plateau Riyom 16/09/2016 15/09/2019
26 21012 Century Mining Company Ltd 120 Plateau Jos South, Jos North 02/02/2016 01/02/2019
27 22149 Davnotch Nigeria Ltd 283 Nasarawa Wamba 17/03/2016 16/03/2019
28 22110 Datagen Exploration Ltd 84 Kaduna Kauru 08/07/2016 07/07/2019
29 22444 Unique EL-Mao Nigeria Ltd 112 Nasarawa Nasarawa Eggon 12/05/2016 11/05/2019
30 21128 Yashe Trading Company Ltd 9 Katsina Kusada 02/02/2016 01/02/2019
31 23753 Emotan Global Ventures Ltd 222 FCT Gwagwalada 16/09/2016 15/09/2019
32 23398 Regoil Ltd. 85 Adamawa Song 02/09/2016 01/09/2019
33 22150 Hobson and Lawson Nigeria Ltd 221 Nasarawa Wamba/ Akwanga 01/04/2016 31/03/2019
34 17018 Ekoves Nigeria Ltd. 30 Nasarawa Nasarawa 10/08/2016 09/08/2016
Iron Ore
Iron ore is one of the strategic minerals identified. It occurs extensively within the Basement
Complex and Sedimentary Basins of the country. Iron ore exploration is an integral part of
Nigeria’s steel industry development. In 2016 26 ELs were issued.
Table 3.5: Details of exploration licenses issued for Iron Ore in 2016
S/N Code Title holders CU State LGA Effective
date
Expiry
date
1 19316 Danjuma Barde Global Concept Ltd 100 Yobe Fune 04/2/2015 03/02/2018
2 12069 ISS-Hass Nigeria Ltd 930 Kebbi Shanga 17/03/2016 16/03/2019
3 20384 Total Mining Ltd. 741 Kogi Igalamela/ Odolu 12/11/2015 11/12/2018
4 20386 Total Mining Ltd. 72 Kogi koton Karfe 18/11/2016 17/11/2019
5 20406 Total Mining Ltd. 88 Kogi Kogi 04/11/2016 03/11/2019
6 20407 Total Mining Ltd. 284 Kogi Ajaokuta 04/11/2016 03/11/2019
7 20507 Eta Zuma Group West Africa Ltd 10 Kogi Koton Karfe 06/10/2015 05/10/2018
8 20508 Zuma Metals & Energy Resources 447 Nasarawa Toto 06/10/2015 05/10/2018
9 20509 Zuma Metals & Energy Resources 240 Enugu Usi-Uzo/ Nsukka 06/10/2015 05/10/2018
10 20514 Zuma Metals & Energy Resources Ltd 420 Kogi Koton Karfe 06/10/2015 05/10/2018
11 20520 Zuma Metals & Energy Resources Ltd 169 Kogi Kogi 06/10/2015 05/10/2018
12 21047 Omego Mining Company Ltd 188 Kogi Ajaokuta 02/02/2016 01/02/2019
13 21735 Ikabi Investment Company Ltd 9 Kogi Ofu 17/03/2016 16/03/2019
14 22574 Abungel Investment Nigeria Ltd 120 Kebbi Jega 12/05/2016 11/05/2016
15 22703 Ammgan Nig. Ltd. 45 Kogi Kogi 02/09/2016 01/09/2017
16 22825 International Business Bureau Ltd 154 Kwara Ifelodun 10/08/2016 09/08/2016
17 22928 Abilele Industries Ltd 240 Nasarawa Nasarawa Eggon 18/05/2016 17/05/2019
18 18958 Cono Assets Ltd 30 Yobe Nangeri 16/12/2014 15/12/2017
19 22267 Silverquest Nigeria Ltd 454 Kogi Igalamela Odolu 01/04/2016 31/03/2019
20 19315 Danjuma Barde Global Concept Ltd 36 Yobe Nengere 4/2/2015 03/02/2018
21 22265 Silverquest Nigeria Ltd 631 Kogi Igalamela Odolu 01/04/2016 31/03/2019
22 22325 Taraba Solid Mineral Development Comp. Ltd. 31 Taraba Sardauna 02/09/2016 01/09/2019
23 20383 Total Mining Ltd. 224 Kogi Ajaokuta 04/11/2016 03/11/2019
24 22023 Chrisanbeth Investments Ltd 182 Kogi Adavi 12/01/2016 11/01/2019
25 14457 Altima Consolidated Ltd 495 Benue Gwande 08/09/2015 07/09/2018
26 15708 Altima Consolidated Ltd 396 Benue Gwande 08/09/2015 07/09/2018
Limestone
There are abundant deposits of limestone occurring across the major sedimentary basin of
Nigeria. Limestone is mined mainly for cement production. In 2016, 22 ELs were issued.
Table 3.6: Details of exploration licenses issued for Limestone in 2016
S/N Code Title holders CU State LGA Effective
date
Expiry
date
1 12114 Rennington Industries ltd 161 Cross River
(C/R)
Akamkpa 12/9/2011 11/09/2014
2 19006 Challion Integrated Services Ltd 96 Benue Gwer East 13/01/2015 12/01/2018
3 20469 Total Mining Ltd 30 Kogi Ijumu 12/05/2016 11/05/2019
4 20516 Abasa Nigeria Enterprises Ltd 222 Kogi Ijumu/ Mopa 06/10/2015 05/10/2018
5 21873 Ebonyi State Central Construction Company Ltd 154 Ebonyi Ebonyi, Ohaukwu 12/01/2016 11/01/2019
6 21875 Ebonyi State Central Construction Company Ltd 362 Ebonyi Ishielu 12/01/2016 11/01/2019
7 21879 Ebonyi State Central Construction Company Ltd 306 Ebonyi Ezza North, Ishielu 12/01/2016 11/01/2019
8 22116 AIco Ado Ibrahim & Co. Ltd 18 Kogi Okene 18/05/2016 17/05/2019
9 22435 Transabaja International Ltd 99 Niger Borgu 12/05/2016 11/05/2019

NEITI SOLID MINERALS AUDIT REPORT FOR 2016
Tajudeen Badejo & Co (Chartered Accountants) Page 43 of 90
10 22929 Abilele Industries Ltd 36 Benue Gboko 18/05/2016 17/05/2019
11 22635 Crosscemco Ltd 101 Cross River Akamkpa 08/07/2016 07/07/2019
12 22690 Crosscemco Ltd 132 Cross River Akamkpa 08/07/2016 07/07/2019
13 22302 Jili and Sons Nigeria Ltd 66 Kaduna Ikara 08/07/2016 07/07/2019
14 21878 Ebonyi State Central Construction Company Ltd 338 Ebonyi Ebonyi, Ohaukwu 12/01/2016 11/01/2019
15 23855 Stable Technology Ltd. 149 Edo Akoko-Edo Owan East 20/10/2016 19/10/2019
16 23856 Stable Technology Ltd. 90 Edo Etsako West Owan
East
20/10/2016 19/10/2019
17 21687 Minosi Ltd 25 Edo Akoko Edo 01/04/2016 31/03/2019
18 22156 Emerald Globe Tech Ltd 58 Edo Akoko Edo 17/03/2016 16/03/2019
19 21876 Ebonyi State Central Construction Company Ltd 627 Ebonyi Ezza South, Ikwo 12/01/2016 11/01/2019
20 23268 Ladis Gold Projects Ltd 100 Adamawa Dansa 20/10/2016 19/10/2019
21 20782 Kura Holdings Limited 68 Ogun Yewa North 29/10/2015 28/10/2018
22 20783 Dangote Industries Ltd 380 Ogun Yewa North 29/10/2015 28/10/2018
Coal
Coal is another strategic mineral identified by the Federal Government under the “coal to
power project”. It is found within the Sedimentary Basins of the country. In the reporting
year, 18 ELs were granted for coal.
Table 3.7: Details of exploration licenses issued for Coal in 2016
S/N Code Title holders CU State LGA Effective
date
Expiry
date
1 18635 Energy and Metals Industries Ltd 265 Enugu Udi 12/01/2016 11/01/2019
2 20513 Eta Zuma Group West Africa Ltd 660 Abia Okigwe/ Isikwuato 06/10/2015 05/10/2018
3 20517 Eta Zuma Group West Africa Ltd 593 Kogi Igalamela 06/10/2015 05/10/2018
4 20521 Energy & Metals Industries Ltd 884 Kogi Ankpa 06/10/2015 05/10/2018
5 20525 Abasa Nigeria Enterprises Ltd 877 Kogi Omala 08/07/2016 07/07/2019
6 20857 Dalkiranlar Enerji Ltd 252 Kogi Igalamela 23/07/2015 22/07/2018
7 21328 Kingrock International Nigeria Ltd 123 Kogi Bassa 12/01/2016 11/01/2019
8 21418 NGUO Mining Company Ltd 230 Enugu Nkanu West, Udi 02/02/2016 01/02/2019
9 21631 Dalkiranlar Enerji Ltd 80 Kogi Ankpa 12/01/2016 11/01/2019
10 21834 Dalkiranlar Enerji Ltd 20 Kogi Omala 12/05/2016 11/05/2019
11 22489 Hawka Mining Engineering Ltd. 894 Kogi Ankpa 18/05/2016 17/05/2019
12 23878 Adamawa Mining Comp. Ltd. 320 Adamawa Mayo Belwa 19/09/2016 18/09/2019
13 22111 Mirage Pond Ltd 504 Enugu Uzo Uwani 01/04/2016 31/03/2019
14 22112 The Gazelle Integrated Services Ltd 640 Enugu Uzo Uwani 01/04/2016 31/03/2019
15 21877 Ebonyi State Central Construction Company Ltd 70 Ebonyi Afikpo North 12/01/2016 11/01/2019
16 22826 Milhouse Energy Services Ltd 96 Enugu udi/Enugu east 17/10/2016 16/10/2019
17 20042 Total Mining Ltd. 776 Kogi koton Karfe 18/11/2016 17/11/2019

NEITI SOLID MINERALS AUDIT REPORT FOR 2016
Tajudeen Badejo & Co (Chartered Accountants) Page 44 of 90
3.3 Production Data
The total production for the year 2016 was 41,874,611.02 tons, valued at N34.09billion as
declared by the government. The production data was computed based on minerals consumed
or sold by the operators during the year. The 56 companies that were reconciled accounted
for 92% of the total production while the remaining 595 companies accounted for 8%. For
details on production, check Appendix 5.
3.3.1 Analysis of Production by Mineral
Limestone accounted for 64.47%of total solid minerals production in 2016 while Amethyst
was the least produced.
Table 3.8: Production data by mineral type
S/N Types of minerals
Production
{Ton}
Value of
production
N
Royalty
N
contribution to
royalty
%
1 Limestone 26,996,568.74 16,197,941,246.80 809,897,062.24 49.35
2 Granite 7,458,238.09 10,277,942,050.98 513,897,104.30 31.32
3 Laterite 2,074,013.29 1,244,407,976.20 62,220,398.81 3.79
4 Sand 1,508,705.29 1,206,964,234.00 60,348,199.70 3.68
5 Shale 1,882,675.56 941,337,779.60 47,066,888.98 2.87
6 Clay 1,646,011.72 658,404,688.40 32,920,234.42 2.00
7 Tin 3,625.37 906,341,933.33 27,190,258.00 1.66
8 Manganese 70,106.67 701,066,666.67 21,032,000.00 1.28
9 Lead / Zinc 5,794.59 521,513,250.00 15,645,397.50 0.95
10 Columbite 1,044.04 417,614,600.00 12,528,438.00 0.76
11 Coal 104,424.86 261,062,158.33 7,831,864.75 0.48
12 Feldspar 35,092.00 105,275,990.00 5,263,800.00 0.32
13 Gold * 0.025 159,487,592.00 4,784,627.76 0.29
14 Tantalite 28.949 144,744,000.00 4,341,825.00 0.26
15 Marble 22,648.96 67,946,870.00 3,397,350.00 0.21
16 Kaolin 26,710.00 66,775,000.00 3,338,750.00 0.20
17 Tourmaline * 0.139 55,695,500.00 2,784,775.00 0.17
18 Topaz * 7.174 35,868,375.00 1,793,418.75 0.11
19 Dolomite 33,364.00 33,364,000.00 1,668,200.00 0.10
20 Lead Ore 700 31,500,000.00 945,000.00 0.06
21 Baryte 1,712.04 13,696,320.00 684,815.00 0.04
22 Wolframite * 15.333 15,333,333.33 460,000.00 0.03
23 Zircon 1,072.50 6,435,000.00 321,750.00 0.02
24 Aquamarine * 0.005 4,940,000.00 247,000.00 0.02
25 Gypsum 720 3,600,000.00 180,000.00 0.01
26 Iron 665 4,322,500.00 129,675.00 0.01
27 Talc 666.67 2,000,010.00 100,000.00 0.01
28 Amethyst * 0.001 2,100.00 105 -
41,874,611.02 34,085,583,174.64 1,641,018,938.21 100.00
* ………….Quantity produced converted to TON
A trend analysis covering 2013 to 2016 of the two most produced minerals (Limestone and
Granite) is shown in figure 3.2 below.
Figure: 3.2 Four years trend analysis of the two most produced minerals
Source: MID Data for 2016 and NEITI reports for 2013 – 2015
-
5,000,000.00
10,000,000.00
15,000,000.00
20,000,000.00
25,000,000.00
30,000,000.00
2013 2014 2015 2016
Pro
du
cti
on
in
To
ns
Years within the trend
LimestoneGranite

NEITI SOLID MINERALS AUDIT REPORT FOR 2016
Tajudeen Badejo & Co (Chartered Accountants) Page 45 of 90
The total value of minerals produced in 2016 was N34.09billion. The value shows a
33%increase or N8.53billion over N25.56billion reported in 2015.
Table 3.9: Comparison of production data by mineral type
S/N Types of
minerals
Production
in 2016
{TON}
Production
in 2015
{TON}
Difference
in volume
of
production
%
Value of 2016
production
{N}
Value of 2015
production
{N}
Difference in
value of
production
%
1 Limestone 26,996,568.74 21,454,966.03 25.83% 16,197,941,246.80 12,055,518,786.00 34.36%
2 Granite 6,245,684.63 6,368,192.10 -1.92% 9,368,526,959.80 6,505,219,426.00 44.02%
3 Laterite 2,074,013.29 2,377,975.31 -12.78% 1,244,407,976.20 1,274,038,887.00 -2.33%
4 Sand 1,508,705.29 2,008,035.00 -24.87% 1,206,964,234.00 1,446,988,356.00 -16.59%
5 Shale 1,882,675.56 1,075,869.70 74.99% 941,337,779.60 474,437,456.00 98.41%
6 Granite Dust 1,212,553.46 4,015,866.38 -69.81% 909,415,091.18 2,344,763,238.00 -61.22%
7 Tin 3,625.37 472.54 667.21% 906,341,933.33 92,699,100.00 877.72%
8 Manganese 70,106.67 100.00% 701,066,666.67 - 100.00%
9 Clay 1,646,011.72 1,178,068.73 39.72% 658,404,688.40 384,263,916.00 71.34%
10 Lead / Zinc 5,794.59 100.00% 521,513,250.00 - 100.00%
11 Columbite 1,044.04 288.92 261.36% 417,614,600.00 69,088,000.00 504.47%
12 Coal 104,424.86 121,316.00 -13.92% 261,062,158.33 264,044,570.00 -1.13%
13 Gold * 0.025 100.00% 159,487,592.00 - 100.00%
14 Tantalite 28.949 31.85 -9.11% 144,744,000.00 119,250,000.01 21.38%
15 Feldspar 35,092.00 13,238.00 165.09% 105,275,990.00 38,683,190.00 172.15%
16 Marble 22,648.96 100.00% 67,946,870.00 - 100.00%
17 Kaolin 26,710.00 25,280.00 5.66% 66,775,000.00 58,999,215.00 13.18%
18 Tourmaline
* 0.139 100.00% 55,695,500.00 - 100.00%
19 Topaz * 7.174 100.00% 35,868,375.00 - 100.00%
20 Dolomite 33,364.00 100.00% 33,364,000.00 - 100.00%
21 Lead Ore 700 100.00% 31,500,000.00 - 100.00%
22 Wolframite
* 15.333 52.44 -70.76% 15,333,333.33 26,220.00 58379.53%
23 Baryte 1,712.04 100.00% 13,696,320.00 - 100.00%
24 Zircon 1,072.50 100.00% 6,435,000.00 - 100.00%
25 Aquamarin
* 0.005 100.00% 4,940,000.00 - 100.00%
26 Iron 665 100.00% 4,322,500.00 - 100.00%
27 Gypsum 720 34,620.67 -97.92% 3,600,000.00 160,714,220.00 -97.76%
28 Talc 666.67 100.00% 2,000,010.00 - 100.00%
29 Amethyst * 0.001 100.00% 2,100.00 - 100.00%
30 Marl 595,043.58 -100.00% - 267,904,797.00 100.00%
31 Rea
Alluvium 3,273.50 -100.00% - 1,561,506.00 100.00%
41,874,611.02 39,272,590.75 34,085,583,174.64 25,558,200,883.01
* ………….Quantity produced converted to TON
3.3.2 Analysis of Production by State
In the year under review, Ogun state contributed 33.49% to the total production declared.
Table 3.10: State contribution to royalty paid
S/N State
Production
{Ton}
Value
N
Royalty
N
Contribution to
royalty
%
1 Ogun 16,759,650.95 11,016,505,657.40 549,526,578.62 33.49
2 Kogi 11,121,565.11 6,494,291,370.20 323,362,889.01 19.71
3 FCT 1,692,734.71 2,105,870,260.66 101,817,739.09 6.20
4 Oyo 1,077,744.37 1,961,326,939.80 91,274,804.76 5.56
5 Cross River 2,748,745.27 1,794,183,678.60 91,139,004.93 5.55

NEITI SOLID MINERALS AUDIT REPORT FOR 2016
Tajudeen Badejo & Co (Chartered Accountants) Page 46 of 90
6 Plateau 170,277.39 1,580,136,114.27 50,343,919.38 3.07
7 Ondo 817,238.24 1,206,192,362.00 60,309,618.10 3.68
8 Ebonyi 737,723.30 1,117,647,443.00 55,657,372.15 3.39
9 Edo 1,116,044.19 1,011,042,787.40 50,552,139.27 3.08
10 Gombe 910,982.96 726,907,976.66 32,711,531.50 1.99
11 Kebbi 101,238.33 723,681,166.67 22,105,275.00 1.35
12 Lagos 848,649.70 698,939,760.00 34,946,976.00 2.13
13 Benue 847,019.02 522,776,435.00 25,867,558.75 1.58
14 Abia 310,413.00 435,639,500.00 21,781,975.00 1.33
15 Sokoto 684,277.53 413,734,520.00 20,686,726.00 1.26
16 Nasarawa 98,759.08 243,048,180.00 8,745,814.00 0.53
17 Zamfara 91,285.29 228,621,100.00 10,612,702.00 0.65
18 Kano 186,142.55 197,912,285.00 10,064,139.25 0.61
19 Kaduna 172,085.38 187,797,343.20 9,448,337.16 0.58
20 Anambra 201,417.17 163,432,800.00 8,171,640.00 0.5
21 Ekiti 149,828.60 155,800,390.00 7,790,020.00 0.47
22 Osun 112,741.19 137,119,285.60 6,655,964.28 0.41
23 Bauchi 108,191.00 134,825,900.00 8,367,211.60 0.51
24 Niger 86,984.87 132,906,743.31 3,893,519.00 0.24
25 Katsina 121,348.48 126,051,012.00 4,085,393.50 0.25
26 Delta 125,946.67 96,268,000.00 4,813,400.00 0.29
27 Jigawa 64,406.78 88,592,977.20 4,429,648.86 0.27
28 Taraba 70,415.46 83,287,520.00 3,947,376.00 0.24
29 Kwara 62,230.93 82,748,066.67 4,124,070.00 0.25
30 Akwa Ibom 120,934.33 72,560,600.00 3,628,030.00 0.22
31 Rivers 54,442.50 43,554,000.00 2,177,700.00 0.13
32 Bayelsa 26,666.67 40,000,000.00 2,000,000.00 0.12
33 Adamawa 29,230.00 25,581,000.00 4,149,865.00 0.25
34 Imo 26,450.00 21,160,000.00 1,058,000.00 0.06
35 Enugu 18,000.00 13,200,000.00 660,000.00 0.04
36 Borno 2,800.00 2,240,000.00 112,000.00 0.01
37 Yobe 0 0 0 0
41,874,611.02 34,085,583,174.64 1,641,018,938.21 100.00
The contributions of the 36 states and FCT to quantity of minerals produced in 2016 reveals
an increase of 2,602,020.29 tons (6.63%) when compared to 2015 as shown in table 3.11
below.
Table 3.11: Comparison of 2016 and 2015 production data
S/N State
2016
volume
(Ton)
2015
volume
(Ton)
Difference
in volume
N
2016
Value
N
2015
Value
N
Difference
in value
N
1 Ogun 16,759,650.95 13,754,245.59 3,005,405.36 11,016,505,657.40 8,359,493,931.33 2,657,011,726.07
2 Kogi 11,121,565.11 8,577,863.36 2,543,701.75 6,494,291,370.20 4,130,208,513.02 2,364,082,857.18
3 FCT 1,692,734.71 2,212,677.43 -519,942.72 2,105,870,260.66 2,097,923,617.79 7,946,642.87
4 Oyo 1,077,744.37 1,064,531.51 13,212.86 1,961,326,939.80 1,127,643,335.52 833,683,604.28
5 Cross River 2,748,745.27 3,120,454.89 -371,709.62 1,794,183,678.60 2,159,688,966.48 -365,505,287.88
6 Plateau 170,277.39 109,164.63 61,112.76 1,580,136,114.27 111,986,436.34 1,468,149,677.93
7 Ondo 817,238.24 542,209.29 275,028.95 1,206,192,362.00 568,054,451.43 638,137,910.57
8 Ebonyi 737,723.30 1,381,315.95 -643,592.65 1,117,647,443.00 968,161,441.24 149,486,001.76
9 Edo 1,116,044.19 882,769.22 233,274.97 1,011,042,787.40 846,736,482.98 164,306,304.42
10 Gombe 910,982.96 1,190,447.33 -279,464.37 726,907,976.66 1,049,074,849.14 -322,166,872.48
11 Kebbi 101,238.33 21,393.18 79,845.15 723,681,166.67 34,595,534.65 689,085,632.02
12 Lagos 848,649.70 863,298.96 -14,649.26 698,939,760.00 512,041,402.18 186,898,357.82
13 Benue 847,019.02 379,533.16 467,485.86 522,776,435.00 212,577,983.60 310,198,451.40
14 Abia 310,413.00 433,583.49 -123,170.49 435,639,500.00 311,723,380.54 123,916,119.46
15 Sokoto 684,277.53 607,043.00 77,234.53 413,734,520.00 347,444,089.80 66,290,430.20
16 Nasarawa 98,759.08 278,421.58 -179,662.50 243,048,180.00 158,031,416.49 85,016,763.51
17 Zamfara 91,285.29 102,471.02 -11,185.73 228,621,100.00 143,439,153.85 85,181,946.15
18 Kano 186,142.55 265,114.19 -78,971.64 197,912,285.00 99,896,344.56 98,015,940.44
19 Kaduna 172,085.38 173,790.56 -1,705.18 187,797,343.20 143,370,122.45 44,427,220.75
20 Anambra 201,417.17 133,318.00 68,099.17 163,432,800.00 105,497,060.00 57,935,740.00

NEITI SOLID MINERALS AUDIT REPORT FOR 2016
Tajudeen Badejo & Co (Chartered Accountants) Page 47 of 90
21 Ekiti 149,828.60 130,269.88 19,558.72 155,800,390.00 144,824,578.20 10,975,811.80
22 Osun 112,741.19 409,447.00 -296,705.81 137,119,285.60 85,608,270.00 51,511,015.60
23 Bauchi 108,191.00 54,971.77 53,219.23 134,825,900.00 139,551,535.10 -4,725,635.10
24 Niger 86,984.87 365,884.77 -278,899.90 132,906,743.31 147,040,991.80 -14,134,248.49
25 Katsina 121,348.48 59,473.72 61,874.76 126,051,012.00 44,448,049.07 81,602,962.93
26 Delta 125,946.67 146,813.06 -20,866.39 96,268,000.00 910,489,460.38 -814,221,460.38
27 Jigawa 64,406.78 152,825.30 -88,418.52 88,592,977.20 84,398,995.37 4,193,981.83
28 Taraba 70,415.46 105,135.83 -34,720.37 83,287,520.00 53,117,045.75 30,170,474.25
29 Kwara 62,230.93 99,824.86 -37,593.93 82,748,066.67 88,384,978.36 -5,636,911.69
30 Akwa Ibom 120,934.33 1,259,629.55 -1,138,695.22 72,560,600.00 158,744,519.10 -86,183,919.10
31 Rivers 54,442.50 197,225.00 -142,782.50 43,554,000.00 92,596,495.00 -49,042,495.00
32 Bayelsa 26,666.67 75,000.00 -48,333.33 40,000,000.00 30,165,000.00 9,835,000.00
33 Adamawa 29,230.00 21,193.00 8,037.00 25,581,000.00 18,645,348.48 6,935,651.52
34 Imo 26,450.00 82,084.00 -55,634.00 21,160,000.00 62,542,100.00 -41,382,100.00
35 Enugu 18,000.00 16,500.00 1,500.00 13,200,000.00 6,033,000.00 7,167,000.00
36 Borno 2,800.00 - 2,800.00 2,240,000.00 - 2,240,000.00
37 Yobe - 2,666.67 -2,666.67 - 4,022,000.00 -4,022,000.00
41,874,611.02 39,272,590.75 2,602,020.27 34,085,583,174.64 25,558,200,880.00 8,527,382,294.64
Figure 3.3: Quantity of minerals produced by each state in both years.
3.3.3 Analysis of Production by Company
Three companies - Dangote Cement Plc, Lafarge Africa Plc and United Cement Company Plc
(UNICEM) contributed 70% of total production in 2016. All these three companies are in
cement manufacturing sector. See table 3.12 for contribution of the covered companies to the
total production in 2016. Details of production for each of the 56 covered entities are
Ogun
FCT
Cross River
Ondo
Edo
Kebbi
Benue
Sokoto
Zamfara
Kaduna
Ekiti
Bauchi
Katsina
Jigawa
Kwara
Rivers
Adamawa
Enugu
Yobe
Quantity of minerals produced by each state in both years
2015 2016

NEITI SOLID MINERALS AUDIT REPORT FOR 2016
Tajudeen Badejo & Co (Chartered Accountants) Page 48 of 90
contained in Appendix 5.
Table 3.12: Analysis of production by extractive companies
Figure: 3.4 Production by major companies
3.4 Export
The Free on Board (FOB) value of the solid minerals exported in 2016 was USD
40,934,053.00. Table 3.13 below depicts the analysis of solid minerals exported in 2016.
Lead ore and concentrates contributed 31.66%, while marble and travertine cut into blocks
accounted for the lowest percentage in the year.
Table 3.13: Analysis of solid minerals export
Goods description Net mass
Kg
FOB value
$
FOB
N
FOB
%
Lead ores and concentrates. 9,314,940.90 12,960,040.00 3,946,332,180.00 31.66
Agglomerated Iron ores and concentrates 2,000.00 10,510,624.00 3,200,485,008.00 25.68
Manganese ores/concentrates 960,260.00 8,055,304.00 2,452,840,068.00 19.68
Zinc ores and concentrates. 12,215,769.87 5,401,617.00 1,644,792,376.50 13.20
Tin ores and concentrates. 349,638.60 1,308,435.00 398,418,457.50 3.20
Niobium, tantalum, vanadium or zirconium 2,273.70 763,122.00 232,370,649.00 1.86
Natural sands of all kinds, excluding silica 326,492.40 566,851.00 172,606,129.50 1.38
Copper ores and concentrates. 1,003.00 382,704.00 116,533,368.00 0.93
Zirconium ores and concentrates 19,107.30 295,950.00 90,116,775.00 0.72
Aluminum ores and concentrates. 190 249,850.00 76,079,325.00 0.61
Gypsum; anhydrite 550,000.00 124,300.00 37,849,350.00 0.30
Crude mica and mica rifted into sheets 43,396.10 100,292.00 30,538,914.00 0.25
Cobalt ores and concentrates. 71 78,500.00 23,903,250.00 0.19
Silica sands and quartz sands 28 42,000.00 12,789,000.00 0.10
Kaolin and other kaolinic clays 71,470.00 30,512.00 9,290,904.00 0.07
Other clays 360,012.00 25,700.00 7,825,650.00 0.06
Chromium ores and concentrates. 25 10,400.00 3,166,800.00 0.03
Ash and residues 100,035.00 10,000.00 3,045,000.00 0.03
Bentonite 47,000.00 8,598.00 2,618,091.00 0.02
Tungsten ores and concentrates. 25,000.00 6,250.00 1,903,125.00 0.02
Titanium ores and concentrates. 8,000.00 2,800.00 852,600.00 0.01
Limestone flux; limestone and stone 819 201 61,204.50 0.00
Marble and travertine cut into blocks 3 3 913.5 0
51%
13%
6%
30%
Production
Dangote Cement Plc
Lafarge Africa Plc
United Cement Company Plc
Others
S/N Extractive companies Production %
1 Dangote Cement Plc 21,251,857.70 50.75
2 Lafarge Africa Plc 5,355,124.25 12.79
3 United Cement Company Plc 2,487,924.90 5.94
4 Others 12,779,704.17 30.52
41,874,611.02 100.00%

NEITI SOLID MINERALS AUDIT REPORT FOR 2016
Tajudeen Badejo & Co (Chartered Accountants) Page 49 of 90
24,397,534.87 40,934,053.00 12,464,419,138.50 100.00
The Nigeria Customs Service (NCS) records revealed that China was the destination where
most Nigeria’s solid minerals were exported to in 2016. Refer to Appendix 6 for details of
the summary provided in the table 3.14 below.
Table 3.14: Destination of Nigeria’s solid minerals export in 2016
Country of destination Net mass
Kg
FOB value
$
FOB
N
FOB
%
China (Hong Kong) 22,180,578.77 21,951,529.00 6,684,240,580.50 53.63
Spain 2,790.40 10,838,958.00 3,300,462,711.00 26.48
India 1,717.10 3,641,450.00 1,108,821,525.00 8.90
United Arab Emirates 153,860.80 1,561,600.00 475,507,200.00 3.81
Thailand 64,380.00 760,301.00 231,511,654.50 1.86
Japan 680.20 653,200.00 198,899,400.00 1.60
Malaysia 42,789.00 339,610.00 103,411,245.00 0.83
Netherlands 20.00 245,669.00 74,806,210.50 0.60
Korea Republic 28,944.00 179,688.00 54,714,996.00 0.44
Italy 187.00 152,400.00 46,405,800.00 0.37
France 146.55 96,590.00 29,411,655.00 0.24
Pakistan 50,000.00 91,000.00 27,709,500.00 0.22
Central African Republic 500,000.00 62,150.00 18,924,675.00 0.15
Chad 50,000.00 62,150.00 18,924,675.00 0.15
Germany 161,474.00 57,208.00 17,419,836.00 0.14
Gabon 361,590.00 55,003.00 16,748,413.50 0.13
United States 225,000.00 36,750.00 11,190,375.00 0.09
Sierra Leone 25.00 32,500.00 9,896,250.00 0.08
Swaziland 50,497.00 25,786.00 7,851,837.00 0.06
Poland 425,075.00 23,259.00 7,082,365.50 0.06
Canada 72.05 20,160.00 6,138,720.00 0.05
United Kingdom 24,980.00 12,809.00 3,900,340.50 0.03
Portugal 75.00 10,734.00 3,268,503.00 0.03
Republic of South Africa 25,628.00 9,451.00 2,877,829.50 0.02
Cote d'Ivoire 47,000.00 8,598.00 2,618,091.00 0.02
Belgium 25.00 5,500.00 1,674,750.00 0.01
24,397,534.87 40,934,053.00 12,464,419,138.50 100.00
Figure 3.5 below shows the trend analysis of solid minerals export in Nigeria over a period of
three year (2014 – 2016).
Figure 3.5: Three years trend analysis of solid minerals export
40,934,053.00
9,732,963.50
26,136,471.87
2016 2015 2014
FOB value of solid minerals export
2016 2015 2014
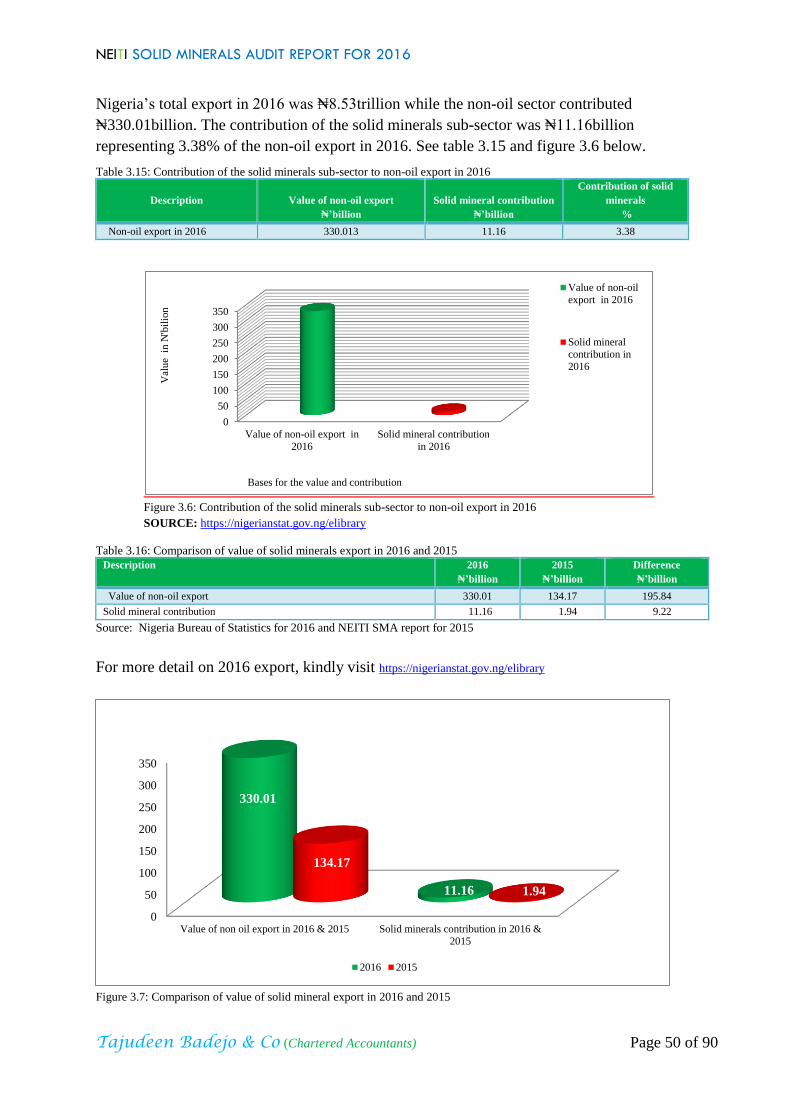
NEITI SOLID MINERALS AUDIT REPORT FOR 2016
Tajudeen Badejo & Co (Chartered Accountants) Page 50 of 90
Nigeria’s total export in 2016 was ₦8.53trillion while the non-oil sector contributed
₦330.01billion. The contribution of the solid minerals sub-sector was ₦11.16billion
representing 3.38% of the non-oil export in 2016. See table 3.15 and figure 3.6 below.
Table 3.15: Contribution of the solid minerals sub-sector to non-oil export in 2016
Description
Value of non-oil export
₦’billion
Solid mineral contribution
₦’billion
Contribution of solid
minerals
%
Non-oil export in 2016 330.013 11.16 3.38
Figure 3.6: Contribution of the solid minerals sub-sector to non-oil export in 2016
SOURCE: https://nigerianstat.gov.ng/elibrary
Table 3.16: Comparison of value of solid minerals export in 2016 and 2015
Description 2016
₦’billion
2015
₦’billion
Difference
₦’billion
Value of non-oil export 330.01 134.17 195.84
Solid mineral contribution 11.16 1.94 9.22
Source: Nigeria Bureau of Statistics for 2016 and NEITI SMA report for 2015
For more detail on 2016 export, kindly visit https://nigerianstat.gov.ng/elibrary
Figure 3.7: Comparison of value of solid mineral export in 2016 and 2015
0
50
100
150
200
250
300
350
Value of non-oil export in
2016
Solid mineral contribution
in 2016
Val
ue
in
N'b
ilio
n
Bases for the value and contribution
Value of non-oil
export in 2016
Solid mineral
contribution in
2016
0
50
100
150
200
250
300
350
Value of non oil export in 2016 & 2015 Solid minerals contribution in 2016 &
2015
330.01
11.16
134.17
1.94
2016 2015

NEITI SOLID MINERALS AUDIT REPORT FOR 2016
Tajudeen Badejo & Co (Chartered Accountants) Page 51 of 90
Table 3.17: Major minerals export destinations and value Goods Description China Spain India
United Arab
Emirates Thailand Japan Malaysia Netherlands
Korea,
Republic of Italy Others** FOB
$ $ $ $ $ $ $ $ $ $ $ $ Agglomerated Iron ores and
concentrates
10,510,624.00
10,510,624.00
Aluminium ores and
concentrates.
153,850.00 96,000.00
249,850.00
Ash and residues (other than
from the
4,500.00
5,500.00 10,000.00
Bentonite
8,598.00 8,598.00
Chromium ores and
concentrates.
10,400.00
- 10,400.00
Cobalt ores and concentrates. 46,000.00
32,500.00 78,500.00
Copper ores and concentrates. 381,200.00
1.00
1,503.00 382,704.00
Crude mica and mica rifted
into sheets or
99,342.00
950.00
- 100,292.00
Gypsum; anhydrite
124,300.00 124,300.00
Kaolin and other kaolinic
clays, whether or
30,512.00 30,512.00
Lead ores and concentrates 6,420,954.00 232,334.00 3,565,500.00 1,523,500.00
600,000.00
245,669.00
372,083.00 12,960,040.00
Limestone flux; limestone
and stone of a
201.00 201.00
Manganese ores/concentrates,
including
8,055,304.00
- 8,055,304.00
Marble and travertine cut into
blocks or
3.00
- 3.00
Natural sands of all kinds,
excluding silica
410,750.00
152,400.00 3,701.00 566,851.00
Niobium, tantalum, vanadium
or zirconium
748,122.00
15,000.00
- 763,122.00
Other clays 1,200.00
24,500.00 25,700.00
Silica sands and quartz sands 42,000.00
- 42,000.00
Tin ores and concentrates. 136,324.00
75,000.00
760,301.00
336,810.00
- 1,308,435.00
Titanium ores and
concentrates.
2,800.00
- 2,800.00
Tungsten ores and
concentrates.
6,250.00 6,250.00
Zinc ores and concentrates. 5,180,130.00
33,600.00
8,200.00
179,687.00
- 5,401,617.00
Zirconium ores and
concentrates
265,950.00
30,000.00
- 295,950.00
21,951,529.00 10,838,958.00 3,641,450.00 1,561,600.00 760,301.00 653,200.00 339,610.00 245,669.00 179,688.00 152,400.00 609,648.00 40,934,053.00
**Belgium, Canada, Central African Republic, Chad, Cote d'Ivoire, France, Gabon, Germany, Pakistan,
Poland, Republic of South Africa, Sierra Leone, Swaziland, United Kingdom, United States
Figure 3.8: Major minerals export destinations and value
ChinaSpainIndia
United Arab EmiratesThailand
JapanMalaysia
NetherlandsKorea, Republic of
ItalyFrance
PakistanCentral African Republic
ChadGermany
GabonUnited States
PolandSierra Leone
SwazilandCanada
United KingdomRepublic of South Africa
Cote d'IvoireBelgium
FOB value of solid minerals export (USD)
NEITI SOLID MINERALS AUDIT REPORT FOR 2016
Tajudeen Badejo & Co (Chartered Accountants) Page 52 of 90

NEITI SOLID MINERALS AUDIT REPORT FOR 2016
Tajudeen Badejo & Co (Chartered Accountants) Page 53 of 90
4.0 REVENUE COLLECTION
4.1 Comprehensive Disclosure of Revenue
The financial flows for the solid minerals sector as captured in this report are described in
table 4.1. The financial flows analysed under this section include royalty and fees collected
by MID and MCO which are sector specific, and other FIRS receipts (such as CIT, VAT,
PAYE-FCT).
Table 4.1: Initial position of receipts and payments
Financial flows Government
N
Company
N
Difference
N
MID 1,446,017,879.01 394,049,958.88 1,051,967,920.13
MCO 156,025,800.00 72,255,207.96 83,770,592.04
FIRS 23,321,044,443.52 34,849,761,481.47 (11,528,717,037.95)
24,923,088,122.53 35,316,066,648.31 (10,392,978,525.78)
Unilateral Disclosure by Government Agencies 1,247,259,366.89 - 1,247,259,366.89
Unilateral Disclosure by reporting Companies - 7,036,738,065.44 (7,036,738,065.44)
Total 26,170,347,489.42 42,352,804,713.75 (16,182,457,224.33)
Figure 4.1: Discrepancy between initial position of receipts and payments
The total revenue from solid minerals sector declared by government was N43.22billion, after
reconciliation, as shown in the table 4.2 below.
Table 4.2: Position of receipts and payments after reconciliation
Payment streams
Declared
government
revenue
N
Declared companies
revenue
N
Difference
N
FIRS 40,381,311,994.48 40,361,186,033.49 20,125,960.99
MID 1,437,791,151.32 1,412,614,451.32 25,176,700.00
MCO 156,025,800 156,025,800 -
Sub-total: Reconciled revenue ‘a’ 41,975,128,945.80 41,929,826,284.81 45,302,660.99
Unilateral Disclosure by Government Agencies* 1,247,259,366.89 -
Unilateral Disclosure by reporting Companies** - 7,036,738,065.44
Sub-total: Unilateral disclosure ‘b’ 1,247,259,366.89 7,036,738,065.44
43,222,388,312.69 48,966,564,350.25
* For unilateral receipts by government, see table 4.13 and appendix 9 for details
** For unilateral payments by companies, see table 4.14 and appendix 9 for details
Initial goverment declaration Initial company declaration Initial discrepancy
2016 declared revenue
Initial goverment declarationInitial company declarationInitial discrepancy

NEITI SOLID MINERALS AUDIT REPORT FOR 2016
Tajudeen Badejo & Co (Chartered Accountants) Page 54 of 90
Figure 4.2: Discrepancy between final reconciliation of receipts and payments
Total government receipts declined by N20.75billion (32%) when compared to 2015 receipts.
The decline is attributed to lower revenue from FIRS in 2016. However, there was increase in
the collection by MID and MCO.
Table 4.3: Analysis of revenue declared by government in 2016
Payment streams
Declared government
revenue in 2016
N
Declared government
revenue in 2015
N
Difference
N
Difference
%
FIRS 40,381,311,994.48 62,593,745,344.23 (22,212,433,349.75) (35)
MID 1,690,212,218.21 1,275,796,025.35 414,416,192.86 32
MCO 1,150,864,100.00 107,807,500.00 1,043,056,600.00 968
43,222,388,312.69 63,977,348,869.58 (20,754,960,556.89)
Figure 4.3: Analysis of government declared revenue
Figure 4.4: Comparison of revenue collection by government: 2013 - 2016
Government reconciled revenue Company reconciled revenue Discrepancy from final reconciliation
Final reconciled revenue
Government reconciled revenue
Company reconciled revenue
Discrepancy from final reconciliation
FIRS
MID
MCO
Declared Government Revenue in 2015 Declared Government Revenue in 2016
2016 2015 2014 2013
FIRS 40,381.31 62,593.75 47,847.74 28,953.49
MID 1,690.21 1,275.80 1,230.28 1,244.10
MCO 1,150.86 107.81 94.42 54.99
0.00
10,000.00
20,000.00
30,000.00
40,000.00
50,000.00
60,000.00
70,000.00
Reven
ue
Year
FIRS MID MCO

NEITI SOLID MINERALS AUDIT REPORT FOR 2016
Tajudeen Badejo & Co (Chartered Accountants) Page 55 of 90
Table 4.4: Contribution by revenue streams to government
Types of revenue streams Amount
N
Contribution
%
Value added tax (VAT) 20,244,510,690.43 46.84
Companies income tax (CIT) 10,575,945,892.31 24.47
Withholding tax (WHT) 7,175,636,759.59 16.60
Tertiary education tax (EDT) 2,284,103,975.85 5.29
Royalty 1,641,018,938.21 3.80
Annual service fee 840,107,100.00 1.94
Registration fee 187,182,000.00 0.43
Pay as you earn (PAYE) 101,114,676.30 0.23
Transfer/ Assignment fees 52,530,000.00 0.12
Renewal of License 36,556,000.00 0.09
Permit to erect magazines & store 21,847,000.00 0.05
Late renewal 22,852,000.00 0.05
Fees on explosives 9,621,480.00 0.02
Reconnaissance permit 8,560,000.00 0.02
Blasting certificate 3,804,000.00 0.01
Payment for minerals buying centre 5,450,000.00 0.01
Permit to buy explosive 2,230,000.00 0.01
Others 9,317,800.00 0.02
43,222,388,312.69 100.00
4.1.1 Revenue Collection by FIRS
FIRS collected a total of N40.38billion from the solid minerals reporting companies in 2016.
From the receipts, VAT contributed 50%, CIT 26.19% and WHT 17.17%.
Please refer to Appendix 7 for details.
Table 4.5: Revenue collection by FIRS
Figure 4.5: Revenue collection by FIRS
4.1.2 Revenue Collection by MMSD
Revenues were collected by MMSD through MID and MCO. MID collected royalties and
related fees, MCO on the other hand, collected fees in respect of licenses and annual renewal
fees. The total revenue collected by MID in 2016 was N1.69billion as shown in the table 4.6
below.
Table 4.6: Revenue collection by MID
S/N Mines inspectorate department Adjusted revenue
₦
1.0 ROYALTY 'a' 1,641,018,938.21
2.0 FEES
2.1 ASM Registration 130,000.00
2.2 Blasting Certificate 3,804,000.00
2.3 Export Permit 374,800.00
2.4 Fees On Explosives 9,621,480.00
0.00 20,000,000,000.00
CIT
EDT
PAYE
VAT
WHT
CIT EDT PAYE VAT WHT
Type tax paid Amount
N
Contribution
%
CIT 10,575,945,892.31 26.19
EDT 2,284,103,975.85 5.66
PAYE 101,114,676.30 0.25
VAT 20,244,510,690.43 50.13
WHT 7,175,636,759.59 17.77
40,381,311,994.48 100.00

NEITI SOLID MINERALS AUDIT REPORT FOR 2016
Tajudeen Badejo & Co (Chartered Accountants) Page 56 of 90
2.5 Payment For Export 1,310,000.00
2.6 Payment For Licence To Possess Minerals 455,000.00
2.7 Payment For Minerals Buying Centre 5,450,000.00
2.8 Payment For Registration Of Mineral 1,120,000.00
2.9 Permit To Buy Explosive 2,230,000.00
2.10 Permit To Erect Magazines & Store 21,847,000.00
2.11 Permit To Mix & Use ANFO 1,330,000.00
2.12 Prior Clearance 590,000.00
2.13 Renewal Of Licence To Import And Sell Explosives 650,000.00
2.14 Permit to export minerals for commercial purposes 197,000.00
2.15 Permit to export minerals samples for analysis 4,000.00
2.16 Licence to manufacture explosives 80,000.00
Sub-total: Fees: 'b' 49,193,280.00
Total (a + b) 1,690,212,218.21
i Royalty payment disaggregated by state
Royalty of N1.64billion was collected from the 36 States and FCT. The table 4.7 below
shows the distribution of collections of all the states and their percentage contribution. Based
on this, Ogun, Kogi, and FCT accounted for 59.4% of the total royalty collected in the year.
Details on royalty are available in Appendix 8.
Table 4.7: Analysis of royalty collection per state
S/N State of federation Royalty paid
N
Contribution
%
1 Ogun 549,526,578.62 33.49
2 Kogi 323,362,889.01 19.71
3 FCT 101,817,739.09 6.20
4 Oyo 91,274,804.76 5.56
5 Cross River 91,139,004.93 5.55
6 Ondo 60,309,618.10 3.68
7 Ebonyi 55,657,372.15 3.39
8 Edo 50,552,139.27 3.08
9 Plateau 50,343,919.38 3.07
10 Lagos 34,946,976.00 2.13
11 Gombe 32,711,531.50 1.99
12 Benue 25,867,558.75 1.58
13 Kebbi 22,105,275.00 1.35
14 Abia 21,781,975.00 1.33
15 Sokoto 20,686,726.00 1.26
16 Zamfara 10,612,702.00 0.65
17 Kano 10,064,139.25 0.61
18 Kaduna 9,448,337.16 0.58
19 Nasarawa 8,745,814.00 0.53
20 Bauchi 8,367,211.60 0.51
21 Anambra 8,171,640.00 0.50
22 Ekiti 7,790,020.00 0.47
23 Osun 6,655,964.28 0.41
24 Delta 4,813,400.00 0.29
25 Jigawa 4,429,648.86 0.27
26 Adamawa 4,149,865.00 0.25
27 Kwara 4,124,070.00 0.25
28 Katsina 4,085,393.50 0.25
29 Taraba 3,947,376.00 0.24
30 Niger 3,893,519.00 0.24
31 Akwa Ibom 3,628,030.00 0.22
32 Rivers 2,177,700.00 0.13

NEITI SOLID MINERALS AUDIT REPORT FOR 2016
Tajudeen Badejo & Co (Chartered Accountants) Page 57 of 90
33 Bayelsa 2,000,000.00 0.12
34 Imo 1,058,000.00 0.06
35 Enugu 660,000.00 0.04
36 Borno 112,000.00 0.01
37 Yobe - -
1,641,018,938.21 100.00
Figure 4.6: Analysis of royalty collection per state
ii Royalty payment disaggregated by company
There was an increase of 30.15% for royalty payment in 2016 when compared to 2015. Four
hundred and eighty one (481) companies paid N1.27billion as royalty in 2015, while 651
companies paid N1.64billion in 2016. Kindly refer to Appendix 8 for details.
Table 4.8: Analysis of royalty paid by companies
S/N Extractive companies
Royalty
paid
N
Royalty
contribution
%
1 Dangote Cement Plc 620,773,689.22 37.83
2 Lafarge Africa Plc 157,110,464.34 9.57
3 United Cement Company Plc 71,635,522.11 4.37
4 Julius Berger Nigeria Plc 41,856,214.38 2.55
5 Setraco Nigeria Limited 35,480,981.86 2.16
6 Reynolds Construction Company (Nig.) Ltd. 32,471,838.43 1.98
7 AshakaCem Plc 29,147,355.50 1.78
8 Ratcon Construction Company Ltd 25,407,424.60 1.55
9 Crushed Rock Industries Nigeria Limited 24,454,497.50 1.49
10 Zeberced Limited 21,407,625.00 1.30
11 Sino Mineral Co. Ltd 21,032,000.00 1.28
12 Cement Company of Northern Nigeria Plc 20,134,680.00 1.23
13 CCECC Nigeria Ltd 16,634,471.00 1.01
14 BUA International Ltd (Okpella Site, Edo State) 15,084,200.00 0.92
15 Woda (Mountain) Investment Ltd 13,851,500.00 0.84
16 C.G.C Nigeria Limited 13,036,353.08 0.79
Ogun
FCT
Cross River
Ebonyi
Plateau
Gombe
Kebbi
Sokoto
Kano
Nasarawa
Anambra
Osun
Jigawa
Kwara
Taraba
Akwa Ibom
Bayelsa
Enugu
Yobe
Royalty

NEITI SOLID MINERALS AUDIT REPORT FOR 2016
Tajudeen Badejo & Co (Chartered Accountants) Page 58 of 90
17 Kopek Construction Limited 12,812,720.00 0.78
18 Lafarge Readymix Nigeria Limited 12,244,716.00 0.75
19 Arab Contractors O.A.O. Nigeria Ltd. 12,053,903.47 0.73
20 Triacta Nigeria Ltd. 11,873,806.00 0.72
21 Mercury Mining Investment Limited 11,420,500.00 0.70
22 Levant Construction Limited 10,617,300.00 0.65
23 Georgio Rocks Limited 9,343,295.70 0.57
24 Spearman Brown Nig. Ltd 8,802,225.00 0.54
25 S.C.C. Nigeria Limited 8,341,192.88 0.51
26 Coltan Minerals Limited 8,245,500.00 0.50
27 Six Six Manufacturing & Global Services Limited 8,196,195.00 0.50
28 Sodex Mines Nigeria Ltd. 7,636,500.00 0.47
29 Astro Minerals Limited 7,592,932.00 0.46
30 Tongyi Allied Mining Ltd. 7,425,000.00 0.45
31 Taoshi Mining & Exploration Limited 7,276,581.00 0.44
32 Porcelainware Industries Limited 7,003,500.00 0.43
33 Ashpalt Unity Construction Limited 6,992,500.00 0.43
34 CNC Mining Company Limited 6,419,510.00 0.39
35 Platinum Asphalt and Crushing Company Limited 6,345,888.52 0.39
36 Hongyun Mining Industrial Co. Ltd 6,187,800.00 0.38
37 Petra Quarries Ltd. 5,948,913.75 0.36
38 Venus Mining Company Limited 5,820,478.00 0.35
39 CNC Engineering Co. Limited 5,800,550.00 0.35
40 FW Dredging Ltd 5,700,000.00 0.35
41 Hajaig Construction Company Limited 5,280,000.00 0.32
42 Zhong Xing Mining Investment Limited 5,076,428.57 0.31
43 Mothercat Limited 4,974,640.00 0.30
44 C & C Construction Company Limited 4,898,517.00 0.30
45 P.W. Nigeria Ltd. 4,768,860.13 0.29
46 Rockstan Shelters Ltd 4,528,000.00 0.28
47 Lake Petroleum Limited 4,200,000.00 0.26
48 Pioneer Sinochino Investment Ventures Limited 3,950,000.00 0.24
49 Chief Cornerstone Investment Limited 3,885,230.00 0.24
50 Purechem Industries Limited 3,521,615.00 0.21
51 Kunlun Nigeria Limited 3,512,376.77 0.21
52 Inorganic Earth Resources Limited 3,471,000.00 0.21
53 NBHH Nigeria Limited 3,305,000.00 0.20
54 Perfect Stone Quarry Limited 3,298,674.51 0.20
55 Zhong Tai Mining (Nig.) Ltd. 3,200,540.00 0.20
56 First Premier Mining & Exploration Ltd. 3,059,505.00 0.19
Sub-total:56 companies reconciled 1,424,550,711.32 86.81
Sub-total: Unilaterally disclosed royalty 216,468,226.89 13.19
Total 1,641,018,938.21 100.00
Analysis of table 4.8 above shows that two companies, Dangote Cement Plc and Lafarge
Africa Plc contributed 47.4% of the total royalty paid in 2016.
Table 4.9 shows the reconciliation adjustment of N8,226,727.69 on the initial royalty
declared. Kindly refer to Appendix 8 for the details of the adjustment.
Table 4.9: Reconciliation adjustment
S/N Payment range by companies No of
companies
Royalty declared
(initial template)
N
Reconciliation
adjustment
N
Adjusted
balance
N
%
1 ≥ N100million 2 777,884,153.56 - 777,884,153.56 47.40
2 ≥ N50million but less N100million 1 82,550,159.86 (10,914,637.75) 71,635,522.11 4.37
3 ≥ N20million but less N50million 9 251,392,617.27 - 251,392,617.27 15.32
4 ≥ N10million but less N20million 10 129,629,469.55 - 129,629,469.55 7.90
5 ≥ N5million but less N10million 20 137,735,452.42 853,700.00 138,589,152.42 8.44

NEITI SOLID MINERALS AUDIT REPORT FOR 2016
Tajudeen Badejo & Co (Chartered Accountants) Page 59 of 90
6 ≥ N 3million but less N5million 14 53,585,586.35 1,834,210.06 55,419,796.41 3.38
Above Materiality Threshold (a) 56 1,432,777,439.01 (8,226,727.69) 1,424,550,711.32 86.81
7 ≥ N1million but less N3million 69 120,872,767.96 - 120,872,767.96 7.37
8 Less than N1million 526 95,595,458.93 - 95,595,458.93 5.82
Below Materiality Threshold (b) 595 216,468,226.89 - 216,468,226.89 13.19
Grand total {(a) + (b)} 651 1,649,245,665.90 (8,226,727.69) 1,641,018,938.21 100.00
iii Royalty payment disaggregated by mineral type
Limestone and granite contributed 80.67% to the total royalty paid in 2016, as shown in the
table 4.10 below. Figure 4.7 further illustrates the contributions per mineral.
Table 4.10: Contribution of royalty by minerals
Figure 4.7: Contribution of royalty by minerals
iv Analysis of royalty payable
The IA observed that in determining the royalty payable on minerals in 2016, the extractive
companies applied the official rate of royalty on the minerals sold or used.
Table 4.11: Analysis of actual royalty paid and expected royalty per mineral
S/N Minerals
Unit of
measure
ment
Production
Official
Market
price
Official Market
value
Rate of
royalty Expected royalty Royalty paid Difference
A B C D e = (c * d) F g = (e * f) H i = (g – h)
1 Tantalite Ton 28.95 5,000,000 144,750,000.00 3% 4,342,500.00 4,341,825.00 675.00
2 Columbite Ton 1,044.04 400,000 417,616,000.00 3% 12,528,480.00 12,528,438.00 42.00
3 Tin Ton 3,625.37 250,000 906,342,500.00 3% 27,190,275.00 27,190,258.00 17.00
4 Gold Ounce 886.04 180,000 159,487,200.00 3% 4,784,616.00 4,784,627.76 -11.76
0.00 500,000,000.00 1,000,000,000.00
Limestone
Granite
Laterite
Sand
Shale
Clay
Tin
Manganese
Lead / zinc
Columbite
Coal
Feldspar
Gold
Tantalite
Marble
Kaolin
Tourmaline
Topaz
Dolomite
Lead ore
Baryte
Wolframite
Zircon sand
Aquamarin
Gypsum
Iron
Talc
AmethystS/N Types of minerals
Royalty
paid
N
Contribution
to royalty
%
1 Limestone 809,897,062.24 49.35
2 Granite 513,897,104.30 31.32
3 Laterite 62,220,398.81 3.79
4 Sand 60,348,199.70 3.68
5 Shale 47,066,888.98 2.87
6 Clay 32,920,234.42 2.00
7 Tin 27,190,258.00 1.66
8 Manganese 21,032,000.00 1.28
9 Lead / zinc 15,645,397.50 0.95
10 Columbite 12,528,438.00 0.76
11 Coal 7,831,864.75 0.48
12 Feldspar 5,263,800.00 0.32
13 Gold 4,784,627.76 0.29
14 Tantalite 4,341,825.00 0.26
15 Marble 3,397,350.00 0.21
16 Kaolin 3,338,750.00 0.20
17 Tourmaline 2,784,775.00 0.17
18 Topaz 1,793,418.75 0.11
19 Dolomite 1,668,200.00 0.10
20 Lead ore 945,000.00 0.06
21 Baryte 684,815.00 0.04
22 Wolframite 460,000.00 0.03
23 Zircon sand 321,750.00 0.02
24 Aquamarin 247,000.00 0.02
25 Gypsum 180,000.00 0.01
26 Iron 129,675.00 0.01
27 Talc 100,000.00 0.01
28 Amethyst 105.00 -
1,641,018,938.21 100

NEITI SOLID MINERALS AUDIT REPORT FOR 2016
Tajudeen Badejo & Co (Chartered Accountants) Page 60 of 90
6 Lead / Zinc Ton 5,794.59 90,000 521,513,250.00 3% 15,645,397.50 15,645,397.50 0.00
5 Lead Ton 700.00 45,000 31,500,000.00 3% 945,000.00 945,000.00 0.00
7 Manganese Ton 70,106.67 10,000 701,066,700.00 3% 21,032,001.00 21,032,000.00 1.00
8 Baryte Ton 1,712.04 8,000 13,696,320.00 5% 684,816.00 684,815.00 1.00
9 Iron Ton 665.00 6,500 4,322,500.00 3% 129,675.00 129,675.00 0.00
10 Zircon sand Ton 1,072.50 6,000 6,435,000.00 5% 321,750.00 321,750.00 0.00
11 Gypsum Ton 720.00 5,000 3,600,000.00 5% 180,000.00 180,000.00 0.00
12 Topaz Kg 7,173.68 5,000 35,868,400.00 5% 1,793,420.00 1,793,418.75 1.25
13 Amethyst Kg 0.53 4,000 2,120.00 5% 106.00 105.00 1.00
14 Feldspar Ton 35,092.00 3,000 105,276,000.00 5% 5,263,800.00 5,263,800.00 0.00
15 Marble Ton 22,648.96 3,000 67,946,880.00 5% 3,397,344.00 3,397,350.00 -6.00
16 Talc Ton 666.67 3,000 2,000,010.00 5% 100,000.50 100,000.00 0.50
17 Coal Ton 104,424.86 2,500 261,062,150.00 3% 7,831,864.50 7,831,864.75 -0.25
18 Kaolin Ton 26,710.00 2,500 66,775,000.00 5% 3,338,750.00 3,338,750.00 0.00
19 Granite Ton 6,245,684.64 1,500 9,368,526,959.80 5% 468,426,347.99 468,426,347.99 0.00
20 Aquamarine Gm 4,940.00 1,000 4,940,000.00 5% 247,000.00 247,000.00 0.00
21 Dolomite Ton 33,364.00 1,000 33,364,000.00 5% 1,668,200.00 1,668,200.00 0.00
22 Wolframite Kg 15,333.33 1,000 15,333,330.00 3% 459,999.90 460,000.00 -0.10
23 Sand Ton 1,508,705.29 800 1,206,964,234.00 5% 60,348,211.70 60,348,199.70 12.00
24 Granite Dust Ton 1,212,553.46 750 909,415,087.50 5% 45,470,754.38 45,470,756.31 -1.94
25 Laterite Ton 2,074,013.29 600 1,244,407,976.20 5% 62,220,398.81 62,220,398.81 0.00
26 Limestone Ton 26,996,568.74 600 16,197,941,244.00 5% 809,897,062.20 809,897,062.24 -0.04
27 Shale Ton 1,882,675.56 500 941,337,780.00 5% 47,066,889.00 47,066,888.98 0.02
28 Clay Ton 1,646,011.72 400 658,404,688.40 5% 32,920,234.42 32,920,234.42 0.00
29 Tourmaline Gm 139,238.75 400 55,695,500.00 5% 2,784,775.00 2,784,775.00 0.00
42,042,160.68
34,085,590,829.90
1,641,019,668.90 1,641,018,938.21 730.68
4.1.3 Revenue Collection by MCO
The table 4.12 below shows the summary of revenue collected by Federal Government
through MCO in 2016. See Appendix 9 for details.
Table 4.12: Revenue collection by MCO
S/N Description Government
₦
1 Annual Service Fee 840,107,100.00
2 Late Renewal 22,852,000.00
3 Fees for application for enlargement (processing) of mining titles 500,000.00
4 Printing Map 44,000.00
5 Reconnaissance Permit 8,560,000.00
6 Registration Fee 187,182,000.00
7 Relinquishment Of Title 780,000.00
8 Renewal of License 36,556,000.00
9 Search Fee 1,753,000.00
10 Transfer/ Assignment fees 52,530,000.00
1,150,864,100.00
4.1.4 Unilateral Disclosures
Unilateral disclosures by government revenue receiving agencies and covered extractive
companies are detailed below:
Unilateral disclosures by revenue receiving agencies
The table below provides summary of unilateral disclosures by revenue receiving agencies
for receipts from extractive companies in 2016. See Appendix 9 for details.
Table 4.13: Summary of unilateral disclosures by government revenue receiving agencies
Government revenue receiving agent Amount disclosed
₦
a MID
i Royalty of extractive companies below materiality threshold of N3million 216,468,226.89
ii Fees 35,952,840.00
Sub-total of (a) = (i) + (ii) 252,421,066.89
b MCO 994,838,300.00

NEITI SOLID MINERALS AUDIT REPORT FOR 2016
Tajudeen Badejo & Co (Chartered Accountants) Page 61 of 90
c Grand Total ( c) = (a) + (b) 1,247,259,366.89
Unilateral disclosure by extractive companies
The table below is a summary of the unilateral disclosures (including social spending). Social
spending declared by extractive companies was validated and the details are available in
Appendix 9.
Table 4.14: Summary of unilateral disclosures made by companies
S/N Extractive companies Amount
₦
1 Julius Berger Nigeria Plc 5,893,785,523.55
2 Lafarge Africa Plc 303,977,735.00
3 United Cement Company Plc 162,550,000.00
4 AshakaCem Plc 135,250,420.66
5 Reynolds Construction Company (Nig.) Ltd. 125,268,269.00
6 Lafarge Readymix Nigeria Limited 120,621,013.51
7 Cement Company of Northern Nigeria Plc 70,966,038.12
8 Triacta Nigeria Ltd. 58,245,000.00
9 P.W. Nigeria Ltd. 29,648,275.62
10 Georgio Rocks Limited 16,695,976.70
11 Tongyi Allied Mining Ltd. 15,300,000.00
12 Venus Mining Company Limited 15,175,000.00
13 First Premier Mining & Exploration Ltd. 14,892,685.00
14 Ratcon Construction Company Ltd 14,856,217.94
15 Purechem Industries Limited 13,228,683.61
16 Levant Construction Limited 11,638,814.40
17 C & C Construction Company Limited 7,657,320.00
18 Petra Quarries Ltd. 7,227,352.23
19 Zhong Xing Mining Investment Limited 5,214,340.50
20 Crushed Rock Industries Nigeria Limited 2,811,183.57
21 Kopek Construction Limited 2,163,000.00
22 Six Six Manufacturing & Global Services Limited 1,582,255.00
23 Perfect Stone Quarry Limited 1,168,765.00
24 Zhong Tai Mining (Nig.) Ltd. 990,000.00
25 NBHH Nigeria Limited 950,119.00
26 Astro Minerals Limited 813,344.94
27 Ashpalt Unity Construction Limited 778,713.00
28 S.C.C. Nigeria Limited 770,000.00
29 Mothercat Limited 750,000.00
30 Woda (Mountain) Investment Ltd 681,329.95
31 Arab Contractors O.A.O. Nigeria Ltd. 520,000.00
32 Setraco Nigeria Limited 250,000.00
33 Zeberced Limited 145,321.70
34 Coltan Minerals Limited 109,703.44
35 Lake Petroleum Limited 55,664.00
Total 7,036,738,065.44
4.1.5 Analysis of Revenue Receivable
As at 2016, most public sector accounts were maintained on cash basis while private entities
operated accrual accounting basis. The difference between the two bases of accounting is the
time receipts or when payments are recognized in the account. Appendix 10 contains the
details.
The revenue streams analysed in table 4.15 were due in respect of 2016 but were paid in
2017; these sums were neither included in the government nor in the companies declared
revenue in 2016 due to timing difference.

NEITI SOLID MINERALS AUDIT REPORT FOR 2016
Tajudeen Badejo & Co (Chartered Accountants) Page 62 of 90
Table 4.15: Summary of revenue receivable in 2016
S/N Type of payment Amount
N
Contribution
%
1 EDT 2,597,563,441.88 54.78
2 PAYE 1,067,592,350.98 22.52
3 Royalty 894,643,644.77 18.87
4 SBIR-WHT 133,763,582.57 2.82
5 SBIR-PAYE 27,441,458.05 0.58
6 SBIR-BIZ PREMISES 20,436,584.00 0.43
7 SBIR-DEVPT LEVY 169,388.28 0.00
8 VAT 100,000.00 0.00
9 WHT 10,000.00 0.00
4,741,720,450.53 100.00
4.1.6 Outcome of Validation and Reconciliation Exercise
Reconciliation of the financial flows in 2016 is presented below:
i Initial reconciliation
Detailed analysis of initial reconciliation of data collected is presented in Appendix 11.
Table 4.16: Initial reconciliation of payments and receipts
S/N Description of flows
Government
agencies
₦
Extractive
companies
₦
Difference
₦
(i) (ii) (iii) = (i-ii)
a Mines Inspectorate Department 1,446,017,879.01 394,049,958.88 1,051,967,920.13
Mining Cadastre Office 156,025,800.00 72,255,207.96 83,770,592.04
b Federal Inland Revenue Service 23,321,044,443.52 34,849,761,481.47 (11,528,717,037.95)
c Sub Total (c) = (a+ b) 24,923,088,122.53 35,316,066,648.31 (10,392,978,525.78)
d Unilateral Declarations – Companies
i Community/Land Owners - 14,107,000.00 (14,107,000.00)
ii LGA - 690,000.00 (690,000.00)
iii SBIR - 3,977,110,328.78 (3,977,110,328.78)
iv Artisanal and Small Scale Mining Dept. - 50,000.00 (50,000.00)
v Nigeria Customs Service - 2,227,016,175.00 (2,227,016,175.00)
vi Social Responsibility Payment - 813,871,876.66 (813,871,876.66)
vii Federal Ministry of Environment - 2,792,685.00 (2,792,685.00)
viii National Environmental Standards and Regulations
Enforcement Agency
- 1,100,000.00 (1,100,000.00)
e Sub-total (e) = (Addition of i – viii) - 7,036,738,065.44 (7,036,738,065.44)
f Unilateral Declarations: Govt. Agencies
i MID (Royalties by extractive companies below
materiality threshold and fees declared thereon
216,468,226.89 - 216,468,226.89
ii Fees 35,952,840.00 - 35,952,840.00
iii MID 252,421,066.89 - 252,421,066.89
iv MCO 994,838,300.00 - 994,838,300.00
g Sub-total (g) = (iii + iv) 1,247,259,366.89
1,247,259,366.89
h Grand Total (h) = (c) + (e) + (g) 26,170,347,489.42 42,352,804,713.75 (16,182,457,224.33)
ii Analysis of government initial receipts by revenue streams
The table below illustrates contribution by various revenue streams to the government in
2016:

NEITI SOLID MINERALS AUDIT REPORT FOR 2016
Tajudeen Badejo & Co (Chartered Accountants) Page 63 of 90
Table 4.17: Contribution of various revenue streams to the government in 2016
S/N Declared government agencies receipts Amount
₦
Contribution
%
1 Mines Inspectorate Department 1,446,017,879.01 5.53
2 Mining Cadastre Office 156,025,800.00 0.60
3 Federal Inland Revenue Service 23,321,044,443.52 89.11 Sub-total (a) 24,923,088,122.53 95.24
Unilateral Declarations
1 MID (Royalties by extractive companies below materiality threshold) and fees 252,421,066.89 0.96
2 Mining Cadastre Office 994,838,300.00 3.80
Sub-total (b) 1,247,259,366.89 4.76
Total (a) + (b) 26,170,347,489.42 100.00
Represented by:
Proportion required for reconciliation 24,923,088,122.53 95.24 Proportion not required for reconciliation 1,247,259,366.89 4.76
Total 26,170,347,489.42 100.00
iii Analysis of companies initial receipts by revenue streams
The table below illustrates contribution by various revenue streams declared as payments by
solid mineral extractive companies in 2016:
Table 4.18: Contribution of companies declared payment by revenue stream
S/N Extractive companies payments Amount
₦
Contribution
%
1 Mines Inspectorate Department 394,049,958.88 0.93
2 Mining Cadastre Office 72,255,207.96 0.17
3 Federal Inland Revenue Service 34,849,761,481.47 82.29
Sub Total (a) 35,316,066,648.31 83.39
Unilateral disclosure
1 Community/Land Owners 14,107,000.00 0.03
2 LGA 690,000.00 0.00
3 SBIR 3,977,110,328.78 9.39
4 Artisanal and Small Scale Mining Dept. 50,000.00 0.00
5 Nigeria Customs Service 2,227,016,175.00 5.26
6 Social Responsibility Payment 813,871,876.66 1.92
7 Federal Ministry of Environment 2,792,685.00 0.01
8 National Environmental Standards and Regulations Enforcement Agency 1,100,000.00 0.00
Sub Total (b) 7,036,738,065.44 16.61
Total (a) + (b) 42,352,804,713.75 100.00
Represented by
Proportion required for reconciliation 35,316,066,648.31 83.39
Unilateral Declarations 7,036,738,065.44 16.61
Total 42,352,804,713.75 100.00
iv Final reconciliation
Validation and reconciliation of discrepancies established at the initial stage were undertaken.
The details of the reconciliation of royalty are presented in Appendix 11 while tables 4.19
and 4.20 below show the summary of the reconciliation per revenue stream.

NEITI SOLID MINERALS AUDIT REPORT FOR 2016
Tajudeen Badejo & Co (Chartered Accountants) Page 64 of 90
Table 4.19: Summary of reconciliation of royalty Templates Adjustments Adjusted balance
S/
N Company name
Company
N
Government
N
Difference
N
Company
N
Government
N
Company
N
Government
N
Difference
N
a b c d E f = (a+d) g = (b+e) h = (g-f)
1 Arab Contractors O.A.O.
Nigeria Ltd.
12,053,903.47 -12,053,903.47 12,053,903.47 - 12,053,903.47 12,053,903.47 -
2 AshakaCem Plc 38,547,263.00 29,147,355.50 9,399,907.50 -9,399,907.50 - 29,147,355.50 29,147,355.50 -
3 Ashpalt Unity Construction
Limited
6,992,500.00 -6,992,500.00 6,992,500.00 - 6,992,500.00 6,992,500.00 -
4 Astro Minerals Limited 6,467,932.00 7,592,932.00 -1,125,000.00 1,125,000.00 - 7,592,932.00 7,592,932.00 -
5 BUA International Ltd
(Okpella Site, Edo State)
15,084,200.00 -15,084,200.00 - - 0 15,084,200.00 15,084,200.00
6 C & C Construction Company Limited
3,568,887.00 4,898,517.00 -1,329,630.00 1,329,630.00 - 4,898,517.00 4,898,517.00 -
7 C.G.C Nigeria Limited 7,403,075.00 16,634,471.00 -9,231,396.00 9,231,396.00 - 16,634,471.00 16,634,471.00 -
8 CCECC Nigeria Ltd 20,134,680.00 20,134,680.00 0.00 - - 20,134,680.00 20,134,680.00 -
9 Cement Company of
Northern Nigeria Plc
9,674,897.58 13,036,353.08 -3,361,455.50 3,361,455.50 - 13,036,353.08 13,036,353.08 -
10 Chief Cornerstone
Investment Limited
3,299,875.00 -3,299,875.00 3,885,230.00 585,355.00 3,885,230.00 3,885,230.00 -
11 CNC Engineering Co.
Limited
5,800,550.00 -5,800,550.00 5,800,550.00 - 5,800,550.00 5,800,550.00 -
12 CNC Mining Company
Limited
6,419,510.00 -6,419,510.00 6,419,510.00 - 6,419,510.00 6,419,510.00 -
13 Coltan Minerals Limited 10,690,500.00 8,245,500.00 2,445,000.00 -3,307,500.00 - 7,383,000.00 8,245,500.00 862,500.00
14 Crushed Rock Industries
Nigeria Limited
24,454,497.50 -24,454,497.50 24,454,497.50 - 24,454,497.50 24,454,497.50 -
15 Dangote Cement Plc
620,773,689.22 -620,773,689.22 620,773,689.22 - 620,773,689.22 620,773,689.22 -
16 First Premier Mining &
Exploration Ltd.
3,059,505.00 3,059,505.00 0.00 - - 3,059,505.00 3,059,505.00 -
17 FW Dredging Ltd
5,700,000.00 -5,700,000.00 5,700,000.00 - 5,700,000.00 5,700,000.00 -
18 Georgio Rocks Limited 7,460,877.13 9,343,295.70 -1,882,418.57 1,882,418.57 - 9,343,295.70 9,343,295.70 -
19 Hajaig Construction
Company Limited
5,280,000.00 -5,280,000.00 - - 0 5,280,000.00 5,280,000.00
20 Hongyun Mining Industrial
Co. Ltd
6,387,800.00 -6,387,800.00 6,187,800.00 -200,000.00 6,187,800.00 6,187,800.00 -
-21 Inorganic Earth Resources Limited
3,471,000.00 -3,471,000.00 3,471,000.00 - 3,471,000.00 3,471,000.00 -
22 Julius Berger Nigeria Plc 42,441,282.38 41,856,214.38 585,068.00 -585,068.00 - 41,856,214.38 41,856,214.38 -
23 Kopek Construction
Limited
12,691,350.00 12,812,720.00 -121,370.00 121,370.00 - 12,812,720.00 12,812,720.00 -
24 Kunlun Nigeria Limited
3,512,376.77 -3,512,376.77 3,512,376.77 - 3,512,376.77 3,512,376.77 -
25 Lafarge Readymix Nigeria
Limited
5,357,368.65 12,244,716.00 -6,887,347.35 6,887,347.35 - 12,244,716.00 12,244,716.00 -
26 Lake Petroleum Limited
4,200,000.00 -4,200,000.00 4,200,000.00 - 4,200,000.00 4,200,000.00 -
27 Levant Construction
Limited
12,512,300.00 10,617,300.00 1,895,000.00 -1,895,000.00 - 10,617,300.00 10,617,300.00 -
28 Mercury Mining
Investment Limited
11,420,500.00 -11,420,500.00 11,420,500.00 - 11,420,500.00 11,420,500.00 -
29 Mothercat Limited
5,015,940.00 -5,015,940.00 4,974,640.00 -41,300.00 4,974,640.00 4,974,640.00 -
30 NBHH Nigeria Limited
3,035,000.00 -3,035,000.00 3,305,000.00 270,000.00 3,305,000.00 3,305,000.00 -
31 P.W. Nigeria Ltd. 2,852,363.00 4,768,860.13 -1,916,497.13 1,916,497.13 - 4,768,860.13 4,768,860.13 -
32 Perfect Stone Quarry
Limited
3,298,674.51 3,133,674.51 165,000.00 - 165,000.00 3,298,674.51 3,298,674.51 -
33 Petra Quarries Ltd.
5,948,913.75 -5,948,913.75 5,948,913.75 - 5,948,913.75 5,948,913.75 -
34 Pioneer Sinochino Investment Ventures
Limited
3,950,000.00 -3,950,000.00 - - 0 3,950,000.00 3,950,000.00
35 Platinum Asphalt and
Crushing Company Limited
6,345,888.02 6,345,888.52 -0.50 0.5 - 6,345,888.52 6,345,888.52 -
36 Porcelainware Industries
Limited
7,003,500.00 -7,003,500.00 7,003,500.00 - 7,003,500.00 7,003,500.00 -
37 Purechem Industries
Limited
3,528,614.94 -3,528,614.94 3,521,615.00 -6,999.94 3,521,615.00 3,521,615.00 -
38 Ratcon Construction
Company Ltd
25,407,424.60 -25,407,424.60 25,407,424.60 - 25,407,424.60 25,407,424.60 -
39 Reynolds Construction
Company (Nig.) Ltd.
31,792,938.43 32,471,838.43 -678,900.00 678,900.00 - 32,471,838.43 32,471,838.43 -
40 Rockstan Shelters Ltd
4,528,000.00 -4,528,000.00 4,528,000.00 - 4,528,000.00 4,528,000.00 -
41 S.C.C. Nigeria Limited 6,954,158.88 8,341,192.88 -1,387,034.00 1,387,034.00 - 8,341,192.88 8,341,192.88 -
42 Setraco Nigeria Limited
35,480,981.86 -35,480,981.86 35,480,981.86 - 35,480,981.86 35,480,981.86 -
43 Sino Mineral Co. Ltd
21,032,000.00 -21,032,000.00 21,032,000.00 - 21,032,000.00 21,032,000.00 -
44 Six Six Manufacturing &
Global Services Limited
8,196,195.00 -8,196,195.00 8,196,195.00 - 8,196,195.00 8,196,195.00 -
45 Sodex Mines Nigeria Ltd. 1,500,000.00 6,541,500.00 -5,041,500.00 6,136,500.00 1,095,000.00 7,636,500.00 7,636,500.00 -
46 Spearman Brown Nig. Ltd
8,802,225.00 -8,802,225.00 8,802,225.00 - 8,802,225.00 8,802,225.00 -
47 Taoshi Mining &
Exploration Limited
7,276,581.00 -7,276,581.00 7,276,581.00 - 7,276,581.00 7,276,581.00 -
48 Tongyi Allied Mining Ltd. 7,425,000.00 7,425,000.00 0.00 - - 7,425,000.00 7,425,000.00 -
49 Triacta Nigeria Ltd. 12,138,456.00 11,873,806.00 264,650.00 -264,650.00 - 11,873,806.00 11,873,806.00 -
50 United Cement Company
Plc
82,550,159.86 -82,550,159.86 71,635,522.11 -10,914,637.75 71,635,522.11 71,635,522.11 -
51 Venus Mining Company
Limited
4,999,623.00 -4,999,623.00 5,820,478.00 820,855.00 5,820,478.00 5,820,478.00 -
52 Lafarge Africa Plc 134,951,662.30 157,110,464.34 -22,158,802.04 22,158,802.04 - 157,110,464.34 157,110,464.34 -
53 Woda (Mountain)
Investment Ltd
13,851,500.00 -13,851,500.00 13,851,500.00 - 13,851,500.00 13,851,500.00 -
54 Zeberced Limited
21,407,625.00 -21,407,625.00 21,407,625.00 - 21,407,625.00 21,407,625.00 -
55 Zhong Tai Mining (Nig.)
Ltd.
3,200,540.00 -3,200,540.00 3,200,540.00 - 3,200,540.00 3,200,540.00 -
56 Zhong Xing Mining
Investment Limited
5,076,428.57 -5,076,428.57 5,076,428.57 - 5,076,428.57 5,076,428.57 -
387,269,058.88 1,432,777,439.01 -1,045,508,380.13 1,012,104,952.44 -8,226,727.69 1,399,374,011.32 1,424,550,711.32 25,176,700.00

NEITI SOLID MINERALS AUDIT REPORT FOR 2016
Tajudeen Badejo & Co (Chartered Accountants) Page 65 of 90
Table 4.20: Summary of reconciliation of taxes and other revenue
Description Initial Template Adjustment Final Difference
a b c d e f = (a + d) e = (b + e) e = (b + e)
FIRS Government
N
Company
N
Difference
N
Government
N
Company
N
Government
N
Company
N
Difference
N
CIT 10,918,564,081.73 8,503,534,044.39 2,415,030,037.34 (342,618,189.42) 2,054,909,846.93 10,575,945,892.31 10,558,443,891.32 17,502,000.99
EDT 3,085,568,268.69 1,549,896,937.77 1,535,671,330.92 (801,464,292.84) 731,583,078.08 2,284,103,975.85 2,281,480,015.85 2,623,960.00
PAYE 14,854,322.21 588,488,065.06 (573,633,742.85) 86,260,354.09 (487,373,388.76) 101,114,676.30 101,114,676.30 -
VAT 5,130,760,555.98 20,790,617,857.05 (15,659,857,301.07) 15,113,750,134.45 (546,107,166.62) 20,244,510,690.43 20,244,510,690.43 -
WHT 4,171,297,214.91 3,417,224,577.20 754,072,637.71 3,004,339,544.68 3,758,412,182.39 7,175,636,759.59 7,175,636,759.59 -
FIRS 'a' 23,321,044,443.52 34,849,761,481.47 (11,528,717,037.95) 17,060,267,550.96 5,511,424,552.02 40,381,311,994.48 40,361,186,033.49 20,125,960.99
MID
Royalty paid by
companies above
threshold
1,432,777,439.01 387,269,058.88 1,045,508,380.13 (8,226,727.69) 1,012,104,952.44 1,424,550,711.32 1,399,374,011.32 25,176,700.00
MID - Fees 13,240,440.00 6,780,900.00 6,459,540.00 6,459,540.00 13,240,440.00 13,240,440.00 -
MCO 156,025,800.00 72,255,207.96 83,770,592.04 - 83,770,592.04 156,025,800.00 156,025,800.00 -
MID & MCO 'b' 1,602,043,679.01 466,305,166.84 1,135,738,512.17 (8,226,727.69) 1,102,335,084.48 1,593,816,951.32 1,568,640,251.32 25,176,700.00
Total (a + b) 24,923,088,122.53 35,316,066,648.31 (10,392,978,525.78) 17,052,040,823.27 6,613,759,636.50 41,975,128,945.80 41,929,826,284.81 45,302,660.99
Add: Unilateral
disclosure
Royalty paid by
companies below
threshold
216,468,226.89
-
216,468,226.89
-
-
216,468,226.89
-
-
ASM Registration
130,000.00
-
130,000.00
-
-
130,000.00
-
-
Blasting
Certificate
304,000.00
-
304,000.00
-
-
304,000.00
-
-
Export Permit
374,800.00
-
374,800.00
- -
374,800.00
- -
Fees On
Explosives
9,621,480.00
-
9,621,480.00
-
-
9,621,480.00
-
-
Payment For
Export
1,260,000.00
-
1,260,000.00
- -
1,260,000.00
- -
Payment For
Licence To
Possess Minerals
455,000.00
-
455,000.00
-
-
455,000.00
-
-
Payment For
Minerals Buying
Centre
4,790,000.00
-
4,790,000.00
-
-
4,790,000.00
-
-
Payment For
Registration of
Mineral
1,120,000.00
-
1,120,000.00
-
-
1,120,000.00
-
-
Permit To Buy
Explosive
2,230,000.00
-
2,230,000.00
-
-
2,230,000.00
-
-
Permit To Erect
Magazines &
Store
13,411,560.00
-
13,411,560.00
-
-
13,411,560.00
-
-
Permit To Mix &
Use ANFO
740,000.00
-
740,000.00
-
-
740,000.00
-
-
Prior Clearance
826,000.00
-
826,000.00
- -
826,000.00
- -
Renewal of
Licence To Import
And Sell
Explosives
650,000.00
-
650,000.00
-
-
650,000.00
-
-
Permit to export
minerals for
commercial
purposes
40,000.00
-
40,000.00
-
-
40,000.00
-
-
Sub-total: MID 'b' 252,421,066.89 0.00 252,421,066.89 0.00 0.00 252,421,066.89 0.00 0.00
MCO
Annual Service
Fee
727,051,507.96
-
727,051,507.96
- -
727,051,507.96
-
-
Late Renewal
15,460,000.00
-
15,460,000.00
- -
15,460,000.00
- -
Fees for
application for
enlargement
(processing) of
mining titles
2,352,000.00
-
2,352,000.00
- -
2,352,000.00
-
Printing Map
44,000.00
-
44,000.00
- -
44,000.00
- -
Reconnaissance
Permit
8,560,000.00
-
8,560,000.00
- -
8,560,000.00
- -
Registration Fee
150,661,792.04
-
150,661,792.04
- -
150,661,792.04
- -
Relinquishment of
Title
580,000.00
-
580,000.00
- -
580,000.00
- -
Renewal Of
License
35,846,000.00
-
35,846,000.00
- -
35,846,000.00
- -
Search Fee
1,753,000.00
-
1,753,000.00
- -
1,753,000.00
- -

NEITI SOLID MINERALS AUDIT REPORT FOR 2016
Tajudeen Badejo & Co (Chartered Accountants) Page 66 of 90
Transfer/
Assignment fee
52,530,000.00
-
52,530,000.00
- -
52,530,000.00
- -
Sub-total: MCO 'c' 994,838,300.00 0.00 994,838,300.00 0.00 0.00 994,838,300.00 0.00 0.00
Community/Land
Owners
14,107,000.00 -14,107,000.00
14,107,000.00
LGA
690,000.00 -690,000.00
690,000.00
SBIR
3,977,110,328.78 -3,977,110,328.78
3,977,110,328.78
Artisanal and
Small Scale
Mining Dept.
50,000.00 -50,000.00
50,000.00
Nigeria Customs
Service
2,227,016,175.00 -2,227,016,175.00
2,227,016,175.00
Social
Responsibility
Payment
813,871,876.66 -813,871,876.66
813,871,876.66
Federal Ministry
of Environment
2,792,685.00 -2,792,685.00
2,792,685.00
National
Environmental
Standards and
Regulations
Enforcement
Agency
1,100,000.00 -1,100,000.00
1,100,000.00
Companies
unilaterial
disclosure
7,036,738,065.44 -7,036,738,065.44 0.00 0.00 0.00 7,036,738,065.44 0.00
Unilateral
disclosure
1,247,259,366.89 7,036,738,065.44 -5,789,478,698.55 0.00 0.00 1,247,259,366.89 7,036,738,065.44 0.00
Total revenue 26,170,347,489.42 42,352,804,713.75 --16,182,457,224.33 17,052,040,823.27 6,613,759,636.50 43,222,388,312.69 48,966,564,350.25
The difference between the government declared revenue (N41,975,128,945.80) and
extractive Companies declared revenue (N41,929,826,284.81) is N45,302,660.99. The
difference represents 0.1% of the adjusted revenue reported by government in the year. This
percentage is considered not material to have any significant impact on the report.
▪ The difference represents the royalty and tax receipts by government in respect of four
extractive companies that did not attend reconciliation exercise.
A summary of the difference is shown below.
Table 4.21: Summary of un-reconciled payments
Description Royalty
N
Taxes
N
Amount
N
BUA International Ltd (Okpella Site, Edo State) 15,084,200.00 - 15,084,200.00
Coltan Minerals Limited 862,500.00 - 862,500.00
Hajaig Construction Company Limited 5,280,000.00 17,502,000.99 22,782,000.99
Hajaig Construction Company Limited - 2,623,960.00 2,623,960.00
Pioneer Sinochino Investment Ventures Limited 3,950,000.00 - 3,950,000.00 25,176,700.00 20,125,960.99 45,302,660.99
4.2 In-kind Revenues
In-kind revenues are non-cash payments received in exchange for services rendered or in-lieu
of a cash contribution. In 2016, no such payments were made by any of the extractive
entities. Thus, no in-kind revenue was reported for the year.
4.3 Infrastructure Provisions / Barter Arrangements
No infrastructure provisions/Barter arrangements were recorded in 2016.This is in line with
the NSWG’s affirmation that state participation in the solid minerals sector is non-existent.
4.4 Transportation Payments
No transportation payment was recorded in 2016.This is in line with the NSWG’s affirmation
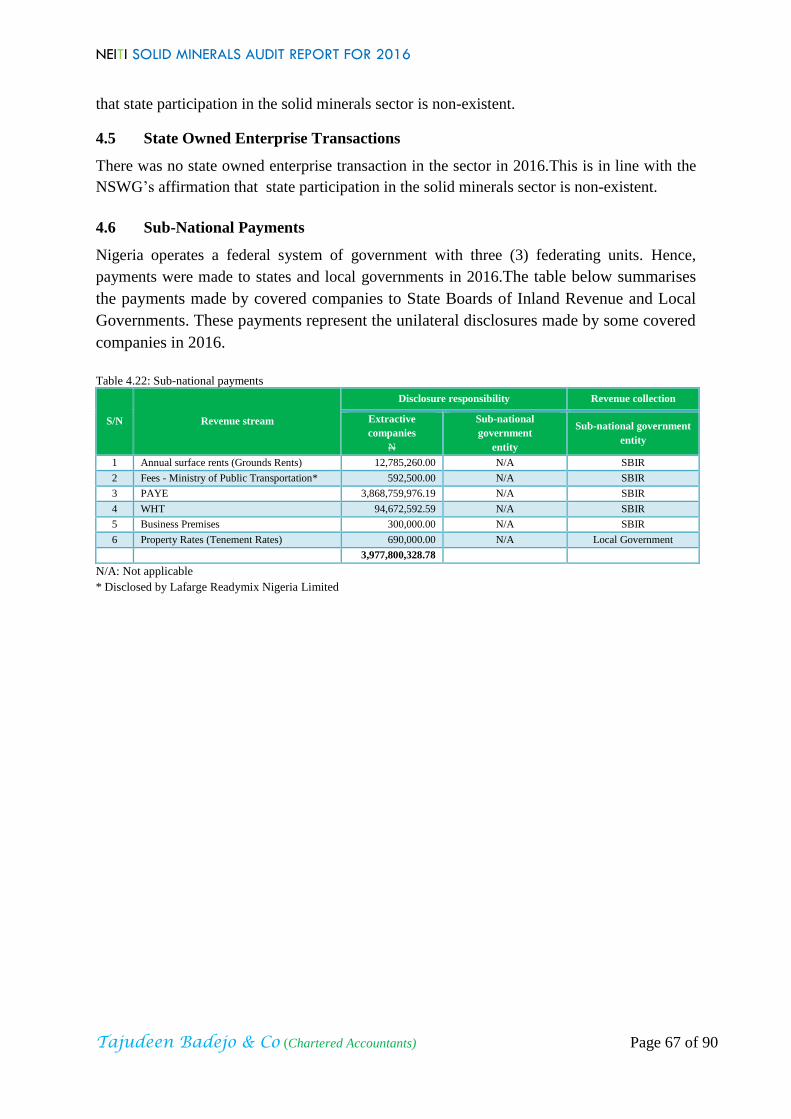
NEITI SOLID MINERALS AUDIT REPORT FOR 2016
Tajudeen Badejo & Co (Chartered Accountants) Page 67 of 90
that state participation in the solid minerals sector is non-existent.
4.5 State Owned Enterprise Transactions
There was no state owned enterprise transaction in the sector in 2016.This is in line with the
NSWG’s affirmation that state participation in the solid minerals sector is non-existent.
4.6 Sub-National Payments
Nigeria operates a federal system of government with three (3) federating units. Hence,
payments were made to states and local governments in 2016.The table below summarises
the payments made by covered companies to State Boards of Inland Revenue and Local
Governments. These payments represent the unilateral disclosures made by some covered
companies in 2016.
Table 4.22: Sub-national payments
S/N Revenue stream
Disclosure responsibility Revenue collection
Extractive
companies
N
Sub-national
government
entity
Sub-national government
entity
1 Annual surface rents (Grounds Rents) 12,785,260.00 N/A SBIR
2 Fees - Ministry of Public Transportation* 592,500.00 N/A SBIR
3 PAYE 3,868,759,976.19 N/A SBIR
4 WHT 94,672,592.59 N/A SBIR
5 Business Premises 300,000.00 N/A SBIR
6 Property Rates (Tenement Rates) 690,000.00 N/A Local Government
3,977,800,328.78
N/A: Not applicable
* Disclosed by Lafarge Readymix Nigeria Limited

NEITI SOLID MINERALS AUDIT REPORT FOR 2016
Tajudeen Badejo & Co (Chartered Accountants) Page 68 of 90
5.0 REVENUE ALLOCATION
5.1 Distribution of Revenues
Nigeria operates fiscal federalism which has three tiers of government represented by the
federal, states and local governments. The Constitution of Nigeria assigned fiscal
responsibilities to these tiers of government and mandates RMAFC with the responsibility of
formulating and implementing revenue sharing formula.
5.2 Sub-National Transfers
Section 162 of the 1999 Constitution of the Federal Republic of Nigeria established the
Federation Account; this is a pool account maintained by the Accountant General of the
Federation and domiciled with CBN. The proceeds (including revenues from the solid
minerals sector) of the account, periodically swept and shared based on the extant sharing
formula, fund the federation’s budget.
The current revenue allocation formula for non-mineral revenue is as follows:
▪ Federal Government 52.68%
▪ State Government 26.72%
▪ Local Government 20.60%
Section 162 of the 1999 Constitution also provides that, as a first line charge, an amount not
less than 13% accruing to the Federation Account directly from any natural resources shall be
distributed to beneficiaries where the minerals are mined, on the principle of derivation.
Mineral Revenue Sharing Formula:
▪ Federal Government 45.83%
▪ State Government 23.25%
▪ Local Government 17.92%
▪ 13% Derivation 13.00%
The sum of ₦12,203,220,334.97 (Twelve billion, two hundred and three million, two hundred
and twenty thousand, three hundred and thirty four naira and ninety seven kobo only) was the
revenue accumulated from Solid Minerals sector for the period 2007 to 2015.
Out of this amount, the sum of ₦9,923,015,028.00 (Nine billion, nine hundred and twenty
three million, fifteen thousand and twenty eight naira only) being accumulated amount for the
period 2007 to 2014 was shared amongst the three tiers of government in July 2016, leaving a
balance of ₦2,282,118,306.90.
However, by December 31, 2016, the accumulated revenue in the account was
₦5,145,108,730.29 (Five billion, one hundred and forty five million, one hundred and eight
thousand, seven hundred and thirty naira, twenty-nine kobo only). As at 31 August 2018, the
amount standing in the solid minerals account was ₦11,328,108,348.21 (Eleven billion, three
hundred and twenty eight million, one hundred and eight thousand, three hundred and forty
eight Naira and twenty-one kobo only) .This is based on FAAC records.
Based on the indices recommended by RMAFC, the amount of ₦1,290,017,753.49 was
shared on 13% derivation. However, analysis by the IA showed that actual amount shared
was ₦25,799.84 less as shown in table 5.2 below.

NEITI SOLID MINERALS AUDIT REPORT FOR 2016
Tajudeen Badejo & Co (Chartered Accountants) Page 69 of 90
Table 5.1: Summary of distribution of accumulated N9.92billion solid minerals revenue
Beneficiaries Amount received
₦
Federal Government 4,547,876,555.57
State Governments 2,306,743,765.47
Local Governments 1,778,402,753.32
13% Derivation Fund 1,289,991,953.64
Total 9,923,015,028.00
Table 5.2 Distribution of N9.92billion solid minerals revenue to the federating units
Analysis of sharing of ₦9.92billion including 13% derivation Test of compliance with RMAFC
State No. of
LGC
Federal share State share LG share Actual 13%
derivation shared
Total RMAFC
Indices
Expected 13%
derivation
Difference
(13%
derivation) a b c d e f g h = (g*total 13%
derivation)
i = (e - h)
₦ ₦ ₦ ₦ ₦
₦ ₦
Abia 17 - 56,961,197.15 36,912,828.31 11,140,588.98 105,014,614.44 0.00864 11,145,530.48 -4,941.50
Adamawa 21 - 60,596,918.36 46,560,235.06 2,515,864.37 109,673,017.79 0.00195 2,515,484.31 380.06
Akwa Ibom 31 - 61,160,040.76 62,015,497.10 19,201,194.25 142,376,732.11 0.01488 19,195,080.27 6,113.98
Anambra 21 - 60,483,397.17 46,811,851.51 3,851,971.35 111,147,220.03 0.00299 3,857,075.94 -5,104.59
Bauchi 20 - 72,763,553.22 53,140,714.95 8,180,201.06 134,084,469.23 0.00634 8,178,548.99 1,652.07
Bayelsa 8 - 53,824,347.64 21,630,216.11 1,213,982.03 76,668,545.78 0.00094 1,212,592.44 1,389.59
Benue 23 - 68,220,534.88 57,825,322.38 66,828,174.85 192,874,032.11 0.05181 66,834,483.12 -6,308.27
Borno 27 - 75,578,575.68 62,780,971.24 794,746.41 139,154,293.33 0.00062 799,795.01 -5,048.60
Cross River 18 - 61,170,471.08 40,472,914.82 135,457,264.42 237,100,650.32 0.10501 135,462,055.05 -4,790.63
Delta 25 - 61,765,107.35 51,860,235.63 5,631,375.37 119,256,718.35 0.00437 5,637,264.84 -5,889.47
Ebonyi 13 - 54,421,963.67 29,939,254.01 59,782,444.58 144,143,662.26 0.04634 59,778,227.13 4,217.45
Edo 18 - 56,879,674.21 39,680,099.58 50,183,984.38 146,743,758.17 0.03890 50,180,687.00 3,297.38
Ekiti 16 - 54,391,253.67 31,507,438.04 5,356,621.10 91,255,312.81 0.00415 5,353,466.61 3,154.49
Enugu 17 - 61,175,750.50 40,315,571.10 1,468,826.90 102,960,148.50 0.00114 1,470,590.83 -1,763.93
FCT-Abuja 6 - - 16,158,748.78 135,776,592.55 151,935,341.33 0.10525 135,771,653.12 4,939.43
Gombe 11 - 57,297,809.02 27,624,257.47 42,018,524.48 126,940,590.97 0.03257 42,015,037.93 3,486.55
Imo 27 - 63,246,719.17 54,031,833.40 1,777,987.55 119,056,540.12 0.00138 1,780,188.90 -2,201.35
Jigawa 27 - 68,027,713.50 56,765,528.25 8,629,088.11 133,422,329.86 0.00669 8,630,046.17 -958.06
Kaduna 23 - 79,702,378.70 63,838,211.65 9,509,399.85 153,049,990.20 0.00737 9,507,240.70 2,159.15
Kano 44 - 96,488,602.67 101,635,904.25 10,709,304.78 208,833,811.70 0.00830 10,706,933.22 2,371.56
Katsina 34 - 74,775,921.01 77,377,143.89 8,546,262.42 160,699,327.32 0.00663 8,552,646.65 -6,384.23
Kebbi 21 - 64,232,889.21 48,833,283.39 6,205,626.39 119,271,798.99 0.00481 6,204,861.30 765.09
Kogi 21 - 67,232,443.71 50,472,775.35 199,959,586.89 317,664,805.95 0.15501 199,961,652.74 -2,065.85
Kwara 16 - 54,148,756.44 35,714,775.33 3,580,959.11 93,444,490.88 0.00278 3,586,177.63 -5,218.52
Lagos 20 - 81,490,884.45 60,839,983.63 32,628,168.39 174,959,036.47 0.02529 32,623,896.51 4,271.88
Nasarawa 13 - 56,098,228.03 31,863,735.19 6,398,956.70 94,360,919.92 0.00496 6,398,360.09 596.61
Niger 25 - 72,055,676.18 58,977,315.96 6,129,160.83 137,162,152.97 0.00475 6,127,461.78 1,699.05
Ogun 20 - 56,514,869.67 42,074,203.96 271,255,495.73 369,844,569.36 0.21028 271,259,508.01 -4,012.28
Ondo 18 - 56,626,831.95 40,183,526.17 21,187,303.45 117,997,661.57 0.01642 21,181,667.88 5,635.57
Osun 30 - 55,478,839.77 54,429,602.16 3,954,356.14 113,862,798.07 0.00307 3,960,275.30 -5,919.16
Oyo 33 - 68,228,072.43 68,658,696.29 63,564,550.74 200,451,319.46 0.04928 63,570,803.48 -6,252.74
Plateau 17 - 63,522,583.81 43,039,803.28 19,707,940.21 126,270,327.30 0.01528 19,711,077.05 -3,136.84
Rivers 23 - 65,603,798.15 53,350,222.15 12,396,216.83 131,350,237.13 0.00961 12,396,822.67 -605.84
Sokoto 23 - 67,041,126.02 53,731,931.04 29,216,464.49 149,989,521.55 0.02265 29,218,317.75 -1,853.26
Taraba 16 - 58,596,745.18 40,272,262.08 12,569,414.13 111,438,421.39 0.00974 12,564,521.63 4,892.50
Yobe 17 - 60,405,722.25 40,490,230.16 1,232,668.89 102,128,621.30 0.00096 1,238,392.28 -5,723.39
Zamfara 14 - 60,534,368.80 36,585,629.65 11,430,684.94 108,550,683.39 0.00886 11,429,328.71 1,356.23
Sub-total: STATE 774 - 2,306,743,765.46 1,778,402,753.32 1,289,991,953.65 5,375,138,472.43 1.00002 1,290,017,753.52 -25,799.87
1Federal government - 4,187,016,191.06 - - - 4,187,016,191.06 - - -
1.46% Derivation Ecology FGN
Share
- 86,330,230.74 - - - 86,330,230.74 - - -
FCT-Abuja - 86,330,230.74 - - - 86,330,230.74 - - -
0.72% Stabilization Account - 43,165,115.37 - - - 43,165,115.37 - - -
3.0% Development of Natural
Resources
- 145,034,787.65 - - - 145,034,787.65 - - -
Sub-Total: Federal - 4,547,876,555.56 - - - 4,547,876,555.56 - - -
Total {State + Federal} 774 4,547,876,555.56 2,306,743,765.46 1,778,402,753.32 1,289,991,953.65 9,923,015,027.99 1.00002 1,290,017,753.52 -25,799.87
Source: Federal Ministry of Finance-FAAC for the Month of June 2016.
5.2.1 Nigeria Budgetary Process
Nigeria prepares its annual budget based on the Medium-Term Expenditure Framework in
line with the provisions of the FRA 2007. MTEF entails annual budgeting system in which
budget decisions relating to new programmes and projects are made at every budget
preparation session based on a three-year fiscal scenario. This is to ensure that projects
financed for the next three years get approved under the annual system and in line with the
baseline budgeting approach. Its emphasis is on a multi-year (i.e. three years) budget
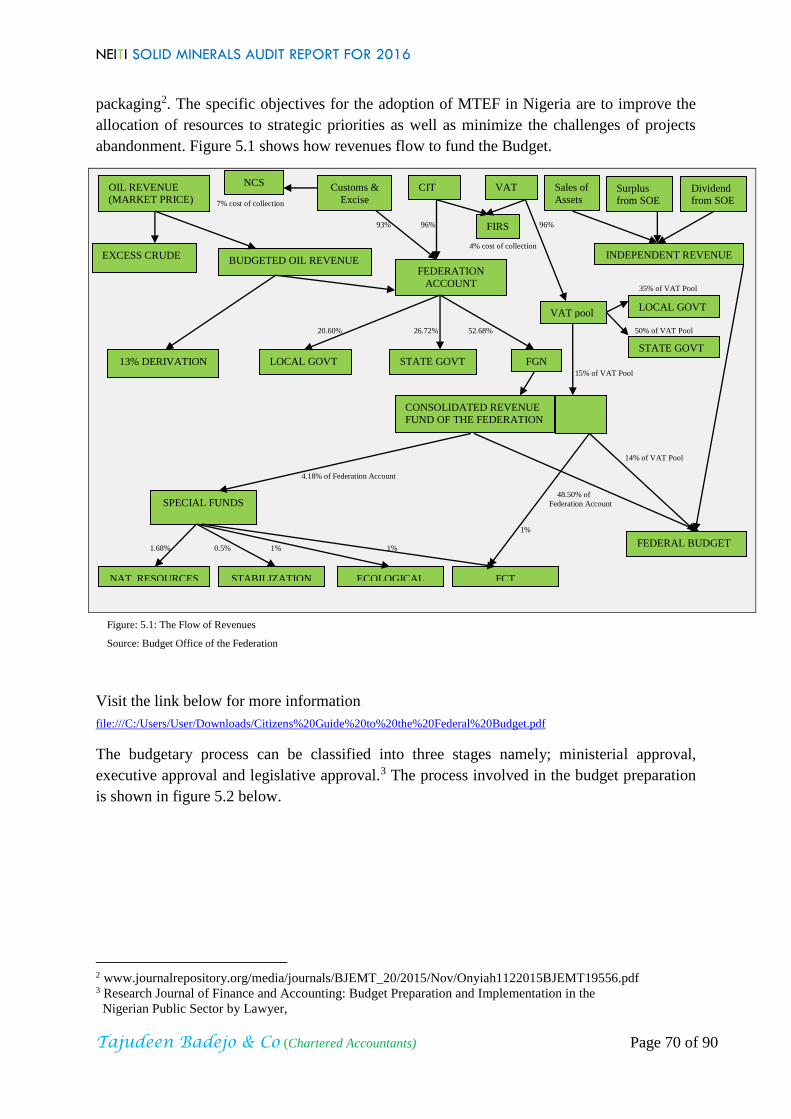
NEITI SOLID MINERALS AUDIT REPORT FOR 2016
Tajudeen Badejo & Co (Chartered Accountants) Page 70 of 90
packaging2. The specific objectives for the adoption of MTEF in Nigeria are to improve the
allocation of resources to strategic priorities as well as minimize the challenges of projects
abandonment. Figure 5.1 shows how revenues flow to fund the Budget.
7% cost of collection
93% 96% 96%
4% cost of collection
35% of VAT Pool
20.60% 26.72% 52.68% 50% of VAT Pool
15% of VAT Pool
14% of VAT Pool
4.18% of Federation Account
48.50% of
Federation Account
1%
1.68% 0.5% 1% 1%
Figure: 5.1: The Flow of Revenues
Source: Budget Office of the Federation
Visit the link below for more information
file:///C:/Users/User/Downloads/Citizens%20Guide%20to%20the%20Federal%20Budget.pdf
The budgetary process can be classified into three stages namely; ministerial approval,
executive approval and legislative approval.3 The process involved in the budget preparation
is shown in figure 5.2 below.
2 www.journalrepository.org/media/journals/BJEMT_20/2015/Nov/Onyiah1122015BJEMT19556.pdf 3 Research Journal of Finance and Accounting: Budget Preparation and Implementation in the
Nigerian Public Sector by Lawyer,
OIL REVENUE (MARKET PRICE)
EXCESS CRUDE BUDGETED OIL REVENUE
13% DERIVATION LOCAL GOVT STATE GOVT FGN
Customs &
Excise
CIT VAT Sales of
Assets Surplus from SOE
INDEPENDENT REVENUE
VAT pool
NCS Dividend from SOE
LOCAL GOVT
STATE GOVT
SPECIAL FUNDS
FEDERAL BUDGET
NAT. RESOURCES STABILIZATION ECOLOGICAL FCT
CONSOLIDATED REVENUE
FUND OF THE FEDERATION
FEDERATION
ACCOUNT
FIRS

NEITI SOLID MINERALS AUDIT REPORT FOR 2016
Tajudeen Badejo & Co (Chartered Accountants) Page 71 of 90
Figure 5.2: The Budget preparation process
For details of the provisions of the Act on fiscal transparency, visit: www.internationalbudget.org/wp-content/uploads/nigeria-fiscalresponsibilityact2007-english.pdf
Also, for further details on budget performance monitoring and evaluation in Nigeria, kindly
visit: www.nationalplanning.gov.ng/2017/index.php/resources/downloads
www.budgetoffice.gov.ng/index.php/about-budget-office/inside-budget-office
www.oaugf.ng/about-oaugf/about-us
5.3 Revenue Management and Expenditures
In order to aid prudent management of the nation’s resources for development and
sustainable growth, the National Assembly enacted the Fiscal Responsibility Act (FRA)
2007. The Act provides for the development of the Medium Term Expenditure Framework
(MTEF) and Fiscal Strategy Paper (FSP) which form the basis for annual budgets. Both
documents consist of macroeconomic framework that indicates fiscal targets and estimates of
government revenues and expenditures, including financial obligations in the medium term4.
For full details of:
- Fiscal Responsibility Act, 2007; visit: www.internationalbudget.org/wp-content/uploads/nigeria-fiscalresponsibilityact2007-english.pdf
- 2018 – 2020 Medium Term Expenditure Framework and Fiscal Strategy Paper; visit: www.budgetoffice.gov.ng/index.php/the-2018-2020-medium-term-expenditure-framework-and-fiscal-strategy-paper
42014-2016 Medium Term Expenditure Framework and Fiscal Strategy Paper
Stage 1 Stage 2 Stage 3 Stage 4
Stage 9 Stage 8 Stage 7 Stage 6 Stage 5
Stage 10 Stage 11 Stage 12 Stage 13 Stage 14
Stakeholder
Consultation on MTSS & MTEF
*OPS & CSOs
*MDAS *NASS
*Governor’s Forum
Medium Term
Fiscal/Expenditure Framework (MTEF)
*Aggregate Revenue
& Spending *Major Heads (MDA,
Debt, Transfers
*Deficit
Medium Term Revenue Framework (MTRF)
*Oil Revenue
*Non-Oil Revenue *Independent Revenue
Medium Term Sector Strategies
(MTSS)/First National Implementation Plan (NV 20:
2020)
*Tentative MDA Ceilings Shared
*Stakeholder Participation
(OPS, CSO etc)
FMF Issues Budget CALL
CIRCULAR
* Instruction * MDA Resource
Ceilings
Budget
Proposal
Submissions by MDAS
FEC Approval of MTEF &
Fiscal
Strategy Paper in Line with
FRA, 2007
MTEF & Fiscal Strategy Paper
Submitted to
NASS for Approval in Line
with FRA, 2007
MTEF/FSP * Revenue &
Expenditure Framework
* Priority Focus * Final MDA Envelopes
Mr President
Assents
Presentation of Draft Budget to Mr
President &
Approval of Draft Budget
Evaluation & Consolidation of
Submissions by
BOF; Preparation of
Draft Budget
Transmission of
Budget by Mr
President to NASS
NASS Approves
& Passes
Appropriation Bill

NEITI SOLID MINERALS AUDIT REPORT FOR 2016
Tajudeen Badejo & Co (Chartered Accountants) Page 72 of 90

NEITI SOLID MINERALS AUDIT REPORT FOR 2016
Tajudeen Badejo & Co (Chartered Accountants) Page 73 of 90
6.0 SOCIAL AND ECONOMIC SPENDING
6.1 Social Expenditures
Social Expenditures as defined by the NSWG are “social payments/contributions by
extractive companies to stakeholders as may be mandated by law, discretionary, part of a
company’s legal and contractual obligations and can be made either in-kind or in cash to a
third party or to a government agency”.
The mandatory social expenditures are payments mandated by law, which do not accrue to
the Federation but to the respective agencies or a third party. However, there is no provision
for any government agency in the solid minerals sector to receive this payment.
In 2016, the total amount expended by extractive companies in this regard was
N813,871,876.66 as detailed in Appendix 12.
Based on the provision of section 116 of the Mining Act, companies are required to enter into
a Community Development Agreement (CDA) prior to start of operations. The NSWG
considered this and adjudged CDA a mandatory social expenditure. See the link below: http://www.neiti.gov.ng/phocadownload/MINUTES%20OF%20THE%20EMERGENCY%20MEETING%20OF%20NSWG
%2013%20JUNE%202018.pdf
Table 6.1: Analysis of companies’ declared statutory and voluntary social expenditures
S/N Company Statutory
N
Voluntary
N
Total
N
1 Ashakacem Plc 107,250,420.66 28,000,000.00 135,250,420.66
2 Cement Company of Northern Nigeria Plc - 65,050,000.00 65,050,000.00
3 C & C Construction Company Limited 600,000.00 5,955,000.00 6,555,000.00
4 First Premier Mining & Exploration Ltd. 5,600,000.00 1,250,000.00 6,850,000.00
5 Kopek Construction Limited - 2,163,000.00 2,163,000.00
6 Lafarge Africa Plc - 303,977,735.00 303,977,735.00
7 Lafarge Readymix Nigeria Limited 7,200,000.00 - 7,200,000.00
8 Levant Construction Limited 9,589,310.00 - 9,589,310.00
9 Mothercat Limited 600,000.00 150,000.00 750,000.00
10 Purechem Industries Limited 2,388,000.00 5,225,689.00 7,613,689.00
11 P.W. Nigeria Limited 3,300,000.00 13,902,722.00 17,202,722.00
12 S.C.C Nigeria Limited 400,000.00 - 400,000.00
13 Tongyi Allied Mining Ltd. 15,300,000.00 - 15,300,000.00
14 United Cement Company Nigeria Limited 160,800,000.00 1,750,000.00 162,550,000.00
15 Venus Mining Company Ltd 12,175,000.00 3,000,000.00 15,175,000.00
16 Triacta Nigeria Limited 57,450,000.00 795,000.00 58,245,000.00
382,652,730.66 431,219,146.00 813,871,876.66
In line with EITI Requirement 6, we set forth in table 6.2 below the analysis of social
expenditure by covered extractive companies in 2016. The details are contained in Appendix
12.

NEITI SOLID MINERALS AUDIT REPORT FOR 2016
Tajudeen Badejo & Co (Chartered Accountants) Page 74 of 90
Table 6.2: Analysis of companies declared social expenditures in cash or kind
S/N Company Statutory Voluntary Total
Cash Kind Sub-Total Cash Kind Sub-Total Total
N N N N N N N 1 Ashakacem Plc 107,250,420.66 107,250,420.66 28,000,000.00 28,000,000.00 135,250,420.66
2 Cement Company of
Northern Nigeria Plc - - 65,050,000.00 65,050,000.00 65,050,000.00
3 C & C Construction
Company Limited 600,000.00 600,000.00 495,000.00 5,460,000.00 5,955,000.00 6,555,000.00
4 First Premier Mining &
Exploration Ltd. 5,600,000.00 5,600,000.00 1,250,000.00 1,250,000.00 6,850,000.00
5 Kopek Construction Limited - - 2,163,000.00 2,163,000.00 2,163,000.00
6 Lafarge Africa Plc - - 68,600,000.00 235,377,735.00 303,977,735.00 303,977,735.00
7 Lafarge Readymix Nigeria
Limited 7,200,000.00 7,200,000.00 - - 7,200,000.00
8 Levant Construction
Limited 9,589,310.00 9,589,310.00 - - 9,589,310.00
9 Mothercat Limited 600,000.00 600,000.00 150,000.00 150,000.00 750,000.00
10 Purechem Industries
Limited 2,180,000.00 208,000 2,388,000.00 - 5,225,689 5,225,689.00 7,613,689.00
11 P.W. Nigeria Limited - 3,300,000 3,300,000.00 - 13902722 13,902,722.00 17,202,722.00
12 S.C.C Nigeria Limited 400,000.00 400,000.00 - - 400,000.00
13 Tongyi Allied Mining Ltd. - 15,300,000.00 15,300,000.00 - - 15,300,000.00
14 United Cement Company
Nigeria Limited 160,800,000.00 160,800,000.00 - 1,750,000 1,750,000.00 162,550,000.00
15 Venus Mining Company Ltd 6,000,000.00 6,175,000.00 12,175,000.00 3,000,000.00 3,000,000.00 15,175,000.00
16 Triacta Nigeria Limited 15,090,000.00 42,360,000.00 57,450,000.00 30,000.00 765,000.00 795,000.00 58,245,000.00
315,309,730.66 67,343,000.00 382,652,730.66 168,738,000.00 262,481,146.00 431,219,146.00 813,871,876.66
6.2 Quasi-Fiscal Expenditures by State Owned Enterprises:
Quasi-fiscal expenditures are arrangements whereby SOE(s) undertake public social
expenditures such as payments for social services, public infrastructure, fuel subsidies and
national debt servicing, etc., outside of the national budgetary process.
In2016, there was no quasi-fiscal expenditure in the solid minerals sector.
6.3 Contribution to the Economy
6.3.1 The contribution of the extractive sector to the economy
Total solid minerals revenue declared by government in 2016 was N43,222,388,312.69
out of which N41,975,128,945.80 (97.11%) was reconciled leaving N1,247,259,366.89
(2.89%) as unilateral disclosure. As depicted in table 6.3 below, out of the total revenue
reconciled, cement manufacturing contributed 62.69%; the contribution of construction
sector was 36.28% while mining and quarry contributed 1.03%. Table 6.3: Solid minerals contribution by sector
Contribution by sector Amount
N
Contribution
%
Contribution by cement manufacturing companies 26,315,981,910.49 62.69
Contribution by construction companies 15,228,075,698.24 36.28
Contribution by mining & quarrying companies 431,071,337.07 1.03
Total 41,975,128,945.80 100.00

NEITI SOLID MINERALS AUDIT REPORT FOR 2016
Tajudeen Badejo & Co (Chartered Accountants) Page 75 of 90
Figure 6.1 Solid minerals contribution by sector
The summary of the overall contribution of the solid minerals sector to the Nigerian economy
in 2016 is presented in table 6.4 below. In addition, table 6.5 shows the contribution of solid
minerals export to the entire receipts from the sector in 2016.
Table 6.4: Contribution of the Solid Minerals Sector to the Economy in 2016
Economic Indices National
N
Solid minerals sector contribution
N
Contribution
%
GDP 67.98trillion 87.61billion 0.13
Source: https://nigerianstat.gov.ng/elibrary
Table 6.5: Percentage of solid minerals export to the sector’s contribution to the economy
Economic indices Solid minerals sector
N
Export
N
Contribution
%
GDP 87.61billion 11.16billion 13
6.3.1 Contribution to Gross Domestic Product (GDP)
The contribution of the solid minerals sector to GDP in 2016 was ₦87.61billion representing
0.13 % of the total GDP, as light increment from 0.12% reported in 2015.
The table below depicts the contribution of solid minerals sector (disaggregated into
subsectors) to the nation’s GDP in 2016. The contribution of the sector to the Country’s GDP
in 2016 represents 0.13%.
Table 6.6: Contribution to Gross Domestic Product (GDP)
Year 2016 (billion)
₦
Nigeria GDP 67,984.20
Solid Mineral Sector’s Contribution (by Sub-Sector)
Coal 7.34
Metal Ores 5.02
Quarrying & Other Mining 75.25
Total Sector Contribution 87.61
Source: CBN 2016 Statistical Bulletin: Domestic Production, Consumption and Prices
6.3.2 Contribution to Government Total Revenues
In 2016, the government collected a total sum of ₦43.22billion from solid minerals sector.
This represented 0.76% of the total collection of ₦5.68trillion in the year. See the breakdown
in table 6.7 below:
-
5,000,000,000.00
10,000,000,000.00
15,000,000,000.00
20,000,000,000.00
25,000,000,000.00
30,000,000,000.00
Contrbution by Cement
Manufacturing
companies
Contrbution by
Construction
Companies
Contrbution by Mining
& Quarrying
Companies
Va
lue c
on
trib
ute
d
Sector
Contrbution by Cement Manufacturing
companies
Contrbution by Construction Companies
Contrbution by Mining & Quarrying
Companies
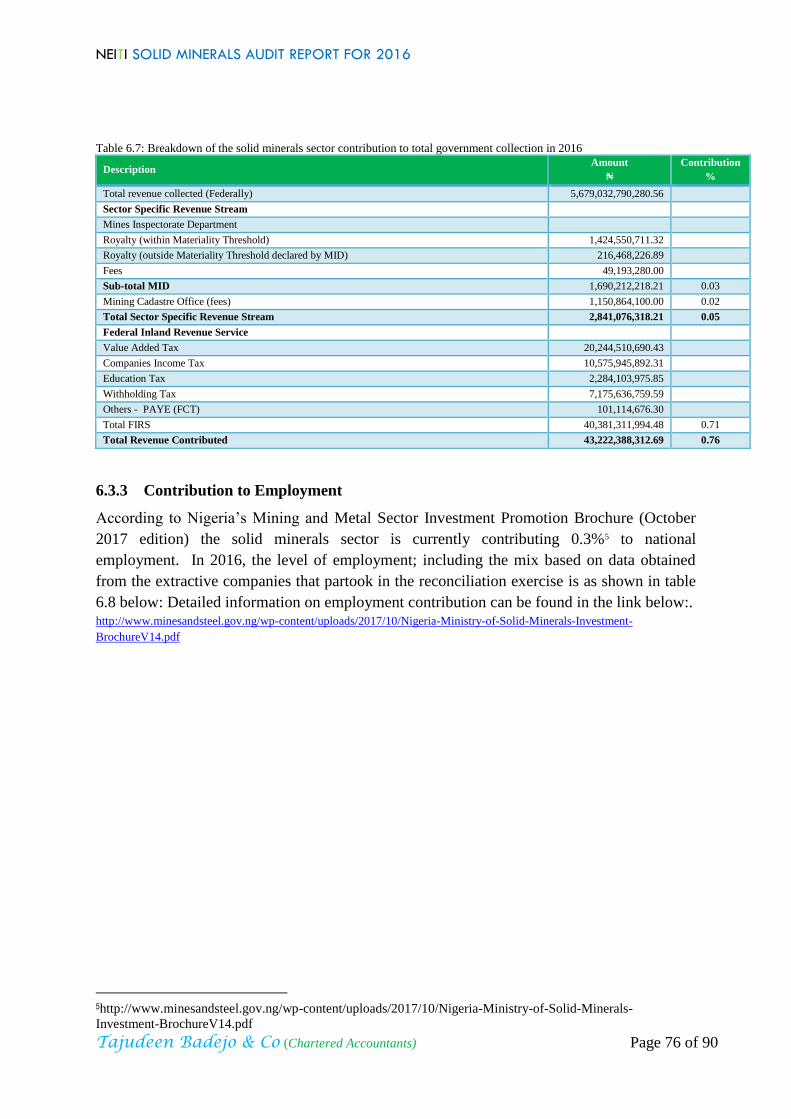
NEITI SOLID MINERALS AUDIT REPORT FOR 2016
Tajudeen Badejo & Co (Chartered Accountants) Page 76 of 90
Table 6.7: Breakdown of the solid minerals sector contribution to total government collection in 2016
Description Amount
₦
Contribution
%
Total revenue collected (Federally) 5,679,032,790,280.56
Sector Specific Revenue Stream
Mines Inspectorate Department
Royalty (within Materiality Threshold) 1,424,550,711.32
Royalty (outside Materiality Threshold declared by MID) 216,468,226.89
Fees 49,193,280.00
Sub-total MID 1,690,212,218.21 0.03
Mining Cadastre Office (fees) 1,150,864,100.00 0.02
Total Sector Specific Revenue Stream 2,841,076,318.21 0.05
Federal Inland Revenue Service
Value Added Tax 20,244,510,690.43
Companies Income Tax 10,575,945,892.31
Education Tax 2,284,103,975.85
Withholding Tax 7,175,636,759.59
Others - PAYE (FCT) 101,114,676.30
Total FIRS 40,381,311,994.48 0.71
Total Revenue Contributed 43,222,388,312.69 0.76
6.3.3 Contribution to Employment
According to Nigeria’s Mining and Metal Sector Investment Promotion Brochure (October
2017 edition) the solid minerals sector is currently contributing 0.3%5 to national
employment. In 2016, the level of employment; including the mix based on data obtained
from the extractive companies that partook in the reconciliation exercise is as shown in table
6.8 below: Detailed information on employment contribution can be found in the link below:. http://www.minesandsteel.gov.ng/wp-content/uploads/2017/10/Nigeria-Ministry-of-Solid-Minerals-Investment-
BrochureV14.pdf
5http://www.minesandsteel.gov.ng/wp-content/uploads/2017/10/Nigeria-Ministry-of-Solid-Minerals-
Investment-BrochureV14.pdf

NEITI SOLID MINERALS AUDIT REPORT FOR 2016
Tajudeen Badejo & Co (Chartered Accountants) Page 77 of 90
Table 6.8: Analysis of employment data by extractive companies in 2016
S/N Name of company operator National
non-local
National
local
Total
National
Non-
Nigerian Total
1 Arab Contractors O.A.O. Nigeria Ltd. 207 207 4 211
2 AshakaCem Plc 217 240 457 0 457
3 Ashpalt Unity Construction Limited 0 91 91 6 97
4 Astro Minerals Limited 12 12 3 15
5 BUA International Ltd (Okpella Site, Edo State) - - - - -
6 C & C Construction Company Limited 0 47 47 3 50
7 C.G.C Nigeria Limited 0 95 95 10 105
8 CCECC Nigeria Ltd 182 176 358 1 359
9 Cement Company of Northern Nigeria Plc 140 140 20 160
10 Chief Cornerstone Investment Limited 53 53 8 61
11 CNC Engineering Co. Limited 20 20 5 25
12 CNC Mining Company Limited 20 20 5 25
13 Coltan Minerals Limited 10 10 0 10
14 Crushed Rock Industries Nigeria Limited 80 80 1 81
15 Dangote Cement Plc 42 42 0 42
16 First Premier Mining & Exploration Ltd. 11 18 29 1 30
17 FW Dredging Ltd - - - - -
18 Georgio Rocks Limited 35 35 5 40
19 Hajaig Construction Company Limited - - - - -
20 Hongyun Mining Industrial Co. Ltd 28 28 7 35
21 Inorganic Earth Resources Limited 30 30 21 51
22 Julius Berger Nigeria Plc 20 165 185 4 189
23 Kopek Construction Limited 569 275 844 6 850
24 Kunlun Nigeria Limited 52 52 10 62
25 Lafarge Readymix Nigeria Limited 0 196 196 2 198
26 Lake Petroleum Limited 13 13 0 13
27 Levant Construction Limited 50 20 70 4 74
28 Mercury Mining Investment Limited 28 28 7 35
29 Mothercat Limited 1,539 1539 46 1,585
30 NBHH Nigeria Limited 106 106 6 112
31 P.W. Nigeria Ltd. 674 40 714 5 719
32 Perfect Stone Quarry Limited 11 22 33 8 41
33 Petra Quarries Ltd. 26 70 96 1 97
34 Pioneer Sinochino Investment Ventures Limited - - - - -
35 Platinum Asphalt and Crushing Company Limited 0 56 56 23 79
36 Porcelainware Industries Limited 9 9 1 10
37 Purechem Industries Limited 55 9 64 42 106
38 Ratcon Construction Company Ltd - - - - -
39 Reynolds Construction Company (Nig.) Ltd. 0 132 132 2 134
40 Rockstan Shelters Ltd 0 0 0
41 S.C.C. Nigeria Limited 22 12 34 1 35
42 Setraco Nigeria Limited 0 481 481 8 489
43 Sino Mineral Co. Ltd - - - - -
44 Six Six Manufacturing & Global Services Limited 17 17 4 21
45 Sodex Mines Nigeria Ltd. 22 22 2 24
46 Spearman Brown Nig. Ltd 0 0 0
47 Taoshi Mining & Exploration Limited - - - - -
48 Tongyi Allied Mining Ltd. 44 65 109 15 124
49 Triacta Nigeria Ltd. 1,534 1,440 2974 10 2,984
50 United Cement Company Plc 0 0 0
51 Venus Mining Company Limited 44 30 74 4 78
52 Lafarge Africa Plc 770 109 879 20 899
53 Woda (Mountain) Investment Ltd 15 20 35 6 41
54 Zeberced Limited - - - - -
55 Zhong Tai Mining (Nig.) Ltd. 0 15 15 6 21
56 Zhong Xing Mining Investment Limited 13 17 30 4 34
6,666 3,895 10,561 347 10,908
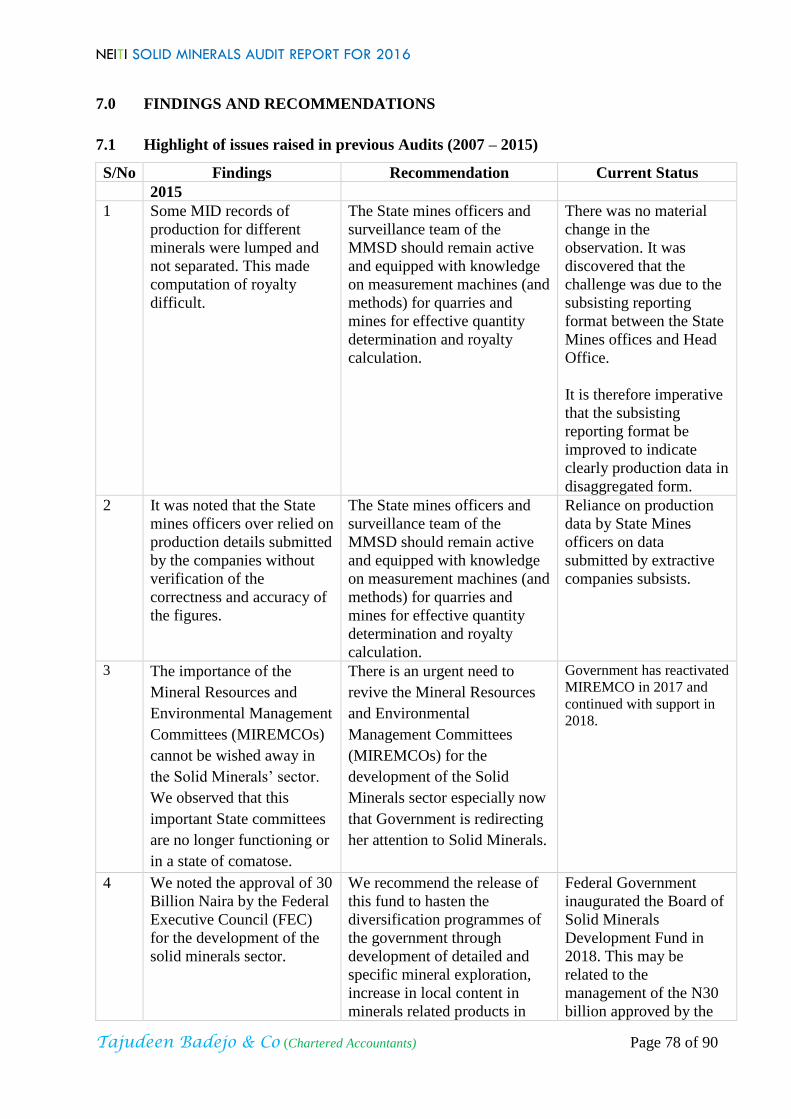
NEITI SOLID MINERALS AUDIT REPORT FOR 2016
Tajudeen Badejo & Co (Chartered Accountants) Page 78 of 90
7.0 FINDINGS AND RECOMMENDATIONS
7.1 Highlight of issues raised in previous Audits (2007 – 2015)
S/No Findings Recommendation Current Status
2015
1 Some MID records of
production for different
minerals were lumped and
not separated. This made
computation of royalty
difficult.
The State mines officers and
surveillance team of the
MMSD should remain active
and equipped with knowledge
on measurement machines (and
methods) for quarries and
mines for effective quantity
determination and royalty
calculation.
There was no material
change in the
observation. It was
discovered that the
challenge was due to the
subsisting reporting
format between the State
Mines offices and Head
Office.
It is therefore imperative
that the subsisting
reporting format be
improved to indicate
clearly production data in
disaggregated form.
2 It was noted that the State
mines officers over relied on
production details submitted
by the companies without
verification of the
correctness and accuracy of
the figures.
The State mines officers and
surveillance team of the
MMSD should remain active
and equipped with knowledge
on measurement machines (and
methods) for quarries and
mines for effective quantity
determination and royalty
calculation.
Reliance on production
data by State Mines
officers on data
submitted by extractive
companies subsists.
3 The importance of the
Mineral Resources and
Environmental Management
Committees (MIREMCOs)
cannot be wished away in
the Solid Minerals’ sector.
We observed that this
important State committees
are no longer functioning or
in a state of comatose.
There is an urgent need to
revive the Mineral Resources
and Environmental
Management Committees
(MIREMCOs) for the
development of the Solid
Minerals sector especially now
that Government is redirecting
her attention to Solid Minerals.
Government has reactivated
MIREMCO in 2017 and
continued with support in
2018.
4 We noted the approval of 30
Billion Naira by the Federal
Executive Council (FEC)
for the development of the
solid minerals sector.
We recommend the release of
this fund to hasten the
diversification programmes of
the government through
development of detailed and
specific mineral exploration,
increase in local content in
minerals related products in
Federal Government
inaugurated the Board of
Solid Minerals
Development Fund in
2018. This may be
related to the
management of the N30
billion approved by the

NEITI SOLID MINERALS AUDIT REPORT FOR 2016
Tajudeen Badejo & Co (Chartered Accountants) Page 79 of 90
which the deposits are
available in Nigeria but
imported e.g. Gypsum, Kaolin;
manpower; provision of
infrastructure; machineries, etc.
The disbursements of the fund
to be accompanied with
defaulters’ clause in order to
achieve the main objectives of
the fund.
Federal Executive
Council (FEC) for the
sector.
5 It was observed with grave
concern the security
challenges faced by field
mines officers in the course
of discharging their duties.
The government should re-
introduce the mines police as
was the case up to early 70s or
re-designate a special arm of
the security forces for the task
of protecting the mines field
officers to enable them meet
their revenue target from
increased production, more
investments from increased
security. It will also go a long
way in sanitizing the sector of
vices including illegal mining
activities.
Government
commissioned mines
surveillance task force
and mines police to aid
monitoring activities.
6 Exports figures reported by
companies were different
from those declared by
Government Agencies;
example, in year 2015,
Coltan mineral resources
and Astro mineral resources
export data were not
captured by NCS.
Quantity FOB should be used
as basis for royalty payments
on export of minerals. For the
purpose of recovery,
government should review year
2015 export documents to
ensure that royalty payments
on solid minerals are
adequately confirmed at export
point.
This challenge still
exists.
7 It was also observed that
some companies who
featured in the export of
solid minerals for 2015 were
mainly below materiality
threshold and we were
unable to confirm their
permit to export solid
minerals in line with extant
laws
There is need for a strong
synergy between the relevant
government agencies (MMSD,
NCS and CBN) to ensure that
all minerals exports including
samples have permits duly
issued by MID.
There is need for a more
coordinated effort by
Government to increase the
capacities of the various
security/anti-corruption
agencies to stem the tide of
illegal exportation of minerals.
The observed trend
subsists.

NEITI SOLID MINERALS AUDIT REPORT FOR 2016
Tajudeen Badejo & Co (Chartered Accountants) Page 80 of 90
8 The activities of illegal
miners were observed to be
prevalent within the
industry, leading to loss of
government revenues.
In order to increase revenue,
government should continue to
encourage ASM to formalize
their activities through the
various programmes that are in
place such as: Establishment of
minerals buying centres,
Formation of cooperative
societies, access to funding and
extension services etc.
To avoid revenue leakages,
Government should continue
with its formalization of
informal miners and
encouragement of
establishment of more private
mineral buying centres to
facilitate collection of revenue;
Government should encourage
big operators to take-over rich
mineral deposits in which
illegal mining activities are
taking place
Federal government
recently procured 50
vehicles and
commissioned mines
surveillance task force as
well as mines police to
aid monitoring activities.
In addition, some of the
miners have formed
Cooperative Societies.
There is, however, the
need for Government to
do more to stem the tide
of the illegal activities.
9 It was observed with
concern the negative impact
of multiple taxation on the
operational efficiency and
growth of the solid minerals
sector. For instance, States,
Local and other government
agencies collect various
taxes and levies from
operators’ e.g. NIWA and
LASEMA collect royalties
from companies that are
engaged in dredging sand
which hinders profitability.
It is strongly recommended
that government should
institute a specific fiscal
regime for this important
sector. All the previous reports
have indeed recommended for
it.
Section 76 of Nigeria Minerals
and Mining Act 2007 bars
NIWA (or any other body for
that matter) from collecting
royalty; yet the provision is
flaunted. An appeal court
judgment Ref. CA/L/589/2008
dated 05/12/14 reinforced that
only MID is legally entitled to
collect royalty. Hence NIWA
(or any other body) must not
only stop collecting royalty but
be made to account for the
entire amount illegally
collected over time.
This issue is yet to be
adequately addressed.

NEITI SOLID MINERALS AUDIT REPORT FOR 2016
Tajudeen Badejo & Co (Chartered Accountants) Page 81 of 90
The government should make
it mandatory for extractive
companies to keep a separate
account for mining/quarry
activities in order to determine
the profit or loss emanating
from such activities and its
contribution to the group
account especially
constructions and cement
companies. This will enable
the tax authority to determine
correctly the taxes payable by
such mining company and such
taxes will be mining specific.
10 We observed that some
expatriate companies do not
keep their accounts within
the country and also prepare
their accounts in language
other than English e.g.
Mercury mining investment.
The company is owned by
the Chinese and on Benin –
Ore road, Ofusu, Ondo
State. The company had not
been keeping its activities
records and books in the
company premises but in
China. No evidence of Tax
payment.
Any company that does not
keep its books and correct
records in Nigeria and does not
prepare its accounts in English
language should be sanctioned
accordingly by MID and
investigated by FIRS for tax
evasion
This issue still subsists
and we believe it is a
flagrant disregard for the
laws of the Federal
Republic of Nigeria
which must not be
allowed to continue.
11 A few of the extractive
companies have made social
payments for projects in
their respective host
communities. These
payments were duly
reflected in the financial
statements. However, we
were unable to see verifiable
evidence of such projects in
the host communities in
some cases. The implication
of this is that the companies
will use such payments to
reduce their tax liabilities,
leading to loss of revenue to
the government.
In order to reduce loss of
revenue to government,
companies should be required
to keep appropriate
documentation and records of
all social payments duly
certified by Mines
Environmental Compliance
Department (MEC) of MMSD.
There have been
improvements in this
observation. During the
validation exercise, some
projects were sighted and
confirmation obtained
from host community.
2007 – 2014
PROCESS

NEITI SOLID MINERALS AUDIT REPORT FOR 2016
Tajudeen Badejo & Co (Chartered Accountants) Page 82 of 90
12 The audit has observed that
no adequate collaboration
exists between the various
government agencies. This
leads to revenue leakages as
some of the licensed holders
operate without the
registration and knowledge
of the MID at States
There is an urgent need for
interface between relevant
Ministries, Departments and
Agencies which will ensure
that appropriate taxes and other
payment are made by operators
and received by the relevant
agencies.
MMSD has developed a
Road Map to provide
specific direction to rapid
transformation of the
solid minerals and metal
sector
13 The Audit has observed the
incessant smuggling of
Solid Minerals out of the
country by middle men and
smugglers.
The establishment of mineral
market at strategic boarder
points across the country in
order to bring about flexible
market control
Surveillance vehicles
have been procured and
deployed to stem the
menace
14 At present, the MCO do not
have a database and cannot
keep track of illegal mining
activities in the country.
The MCO should send status
report of all mining titles to
FMO in each state of the
Federation on monthly basis
for effective monitoring.
The MCO has
institutionalized regular
meetings with the
parent Ministry (MMSD)
15 Geophysical and
geochemical mapping
coverage of Nigeria remains
low.
NGSA should be enabled to
adequately update and cover
the whole country to provide
reliable geological data.
Air borne geophysical
survey had been carried
out by NGSA.
PYSICAL
16 It was observed that some
companies reported the
same level of production
from January to December,
even though explosive
consumption was observed
to differ during the period
under review.
MID should endeavor to
initiate programs for regular
independent production audit
of extractive companies so that
gross misstatements or under-
declaration of production
volumes would be reduced to
the minimum.
There has been
improvement on this
finding.
17 Some company disclosed
that MID uses powder factor
to determine royalty
forcefully if not satisfied
with the declared tonnage.
The Audit observed that no
adequate monitoring
mechanisms were put in
place by the regulatory
authorities to carry out
effective supervision of the
industry.
In the medium to long term,
MID should encourage
companies to acquires, install
and use measurement machines
related to weighing, such as
load volume scanner, weigh
bridges, etc, in mines and
quarries to minimize dispute
with respect to quantity.
Should MID have reason to
surcharge an operator, the
equivalent tonnage and mineral
type involved should be
indicated. To develop robust
framework for implementing
the act/policies governing the
industry to enhance the
No action yet

NEITI SOLID MINERALS AUDIT REPORT FOR 2016
Tajudeen Badejo & Co (Chartered Accountants) Page 83 of 90
supervisory role of the
regulators and avoid situations
where the regulators are at the
mercy of the operators.
18 The activities of illegal
miners were observed to be
prevalent within the
industry, leading to loss of
government revenues.
Government should continue
with its formalization of
informal miners and
encouragement of
establishment of more private
mineral buying centres to
facilitate collection of revenue
Some mineral buying
centres had been
established.
19 The Audit has observed
with specific references to
wide spread environmental
degradation and hazards
caused by artisanal and
small scale miners activities
Formalization of the ASM into
clusters and encouraging them
into adhering to relevant laws.
Some have formed
themselves into
Cooperative Societies.
20 The report observed that
activities of ASM have
caused serious health
challenges like poisoning,
trauma- induced sickness
and mental retardation
among others. Specifically,
the Audit visited at least 5
villages in Anka and
Bungudu local governments
of Zamfara state where
about 500 people were
estimated to have died due
to lead poisoning.
Government should undertake
a comprehensive study of the
mining environments and the
associated health issues with a
view to carrying out the
necessary amendment of the
existing legislation and
regulations as it relates to the
Nigeria Mining and Minerals
Act 2007
Clean up has been done
on Zamfara lead
poisoning sites
21 Quarries were operated by
construction companies and
abandoned after completion
of the projects. There is no
strong legislation on
Decommissioning of Quarry
sites.
MMSD should ensure that
companies make adequate
provisions in their annual
financial statements for
reclamation in line with section
115 of Mineral and Mining Act
2007.
No serious enforcement
in place
22 The production data
provided by the MID was
based on self-declarations
submitted from the
extractive companies in the
solid minerals sector. MID
does not use its own
procedures and systems to
collect and control
production by mining
companies.
The need for a robust platform
or framework to show
production data.
Provide the administrators with
a comparison of the production
volumes declared with the
measurements made by the
ministry of mines and steel
development throughout the
year.
There was improvement
with the introduction of
weighbridges among
others but less
monitoring by MID

NEITI SOLID MINERALS AUDIT REPORT FOR 2016
Tajudeen Badejo & Co (Chartered Accountants) Page 84 of 90
23 Exports figures reported by
companies were different
from those declared by
Government Agencies. For
example, in year 2014,
Tongyi Allied Mining Ltd,
was reported by MID to
have paid royalty for 10,
870 tons but exported
35,939.4 tons of lead zinc in
year 2014 by NCS.
Accordingly, we were not
able to reconcile data
between any of the
Government Agencies and
those reported by
companies.
Quantity of FOB should be
used as basis for royalty
payments on export of
minerals.
For the purpose of recovery,
government should review year
2014 export documents to
ensure that royalty payments
on solid minerals are
adequately confirmed at export
point.
Similar observation was
raised against Tongyi
Allied Mining Ltd in the
2016 audit. Government
should ascertain the
actual exports by Tongyi
Allied Mining Ltd and
ensure the balance is
paid.
24 It was also observed that
some companies who
featured in the export of
solid minerals for 2014 were
mainly below materiality
threshold and we were
unable to confirm their
permit to export solid
minerals in line with extant
laws
There is need for a strong
synergy between the relevant
government agencies (NEITI,
MID, NCS and FIRS) to ensure
that all fees due are collected.
25 Some engineering
construction companies did
not provide record for
quantity of laterite used in
their operations and
subsequently did not pay
royalty.
MID should implement
payment of royalties for all
mineral resources including
laterite, sand, shale etc. to all
entities engaged in commercial
excavation operations.
There have been
improvements on this
observation.
26 We observed that some
cement companies’ used
gypsum but did not pay
royalty.
Cement Companies and other
companies that received local
gypsum supplies from
individuals and used should be
encouraged in demanding
royalty payment evidence from
their local suppliers or inform
MID on royalty payment
accordingly.
There have been
improvements on this
observation.
FINANCIAL
27 The Audit observed that the
13% derivation payments to
solid minerals producing
states were not paid.
In addition, no framework
FMMSD, RMAFC, FIRS and
other relevant agencies to work
together in developing
framework for calculating and
applying the 13% derivation as
required by Section 162 (2) of
In 2016, the three tiers
of government shared
₦9billion of the
accumulated solid
minerals revenue
covering years 2007 –

NEITI SOLID MINERALS AUDIT REPORT FOR 2016
Tajudeen Badejo & Co (Chartered Accountants) Page 85 of 90
for segregating Solid
Mineral revenues in place.
Indices to be used in sharing
accrued revenue from the
sector were not available to
the RMAFC.
the Constitution. 2014 based on 13%
derivation principles.
28 From RMFAC records we
noted that the sums of
₦2,037,594,163.80 accrued
from the Solid Minerals
Sector for the year ended
2013 were not yet shared.
Urgent steps must be taken to
ensure that beneficiaries of
statutory disbursement from
the mineral resources receive
their share.
This sum of
₦2,037,594,163.80 was
part of the accumulated
revenue of ₦9 billion
shared in 2016 based on
13% derivation.
29 Companies that engaged in
both quarrying and
construction/manufacturing
operation did not
differentiate the revenues
earned from each activity.
MMSD should advise
construction/manufacturing
companies to maintain their
quarry units as separate
business entities to ease
implementation of relevant
legislations/regulations.
No action yet
30 Multiplicity of taxes, fees
and levies imposed by the
three tiers of government on
extractive companies
making environment
unsuitable for business.
Specifically, NIWA and
LASEMA collected
royalties from companies
that engaged in sand
dredging.
The government needs to speed
up implementation of solid
minerals sector specific fiscal
regime
This issue is yet to be
adequately addressed.
31 The legal and taxation
environment in Nigeria
suffers from several
limitations, these includes:
Lack of centralized
reporting system in Nigeria
and Lack of a unique
identification number for
extractive companies that
may result in wrong
company due to similar
company name
A review of the tax reporting
system and Tax Identification
Numbers in Nigeria is
imperative in order to improve
controls over extractive sector
revenues, transparency and
traceability of income.
Economic Management
Team is drafting Mining
Income Tax Act (MITA)
while Capital Gain Tax
for MMSD sector is
receiving attention by
FIRS
32 Regarding revenue streams
for 2013 reconciliation, we
suggest that the payments
and contributions should be
restructured for a better
understanding. The revenue
streams in report include a
generic payment labeled as
Revenue streams can be
reviewed to capture and define
clearly what each revenue head
is and under what category of
payment it should be
subsumed.
Instructions on how to populate
There was improvement
on data template design
for 2016 audit.

NEITI SOLID MINERALS AUDIT REPORT FOR 2016
Tajudeen Badejo & Co (Chartered Accountants) Page 86 of 90
‘other payments, which are
misleading. We note that
several fees such as stamp
fees and penalties paid to
both FIRS and MID were
not included in the reporting
template.
these streams by Covered
Entities should be spelt out
clearly.
33 Several reports from
companies do not include
production data, information
on licenses and location.
A single reporting template
that captures all required
information relating to both
financial and physical process
data is recommended.
There was improvement
in 2016
34 Some reporting templates
from companies were filled
on the accruals basis instead
of the cash basis while
others did not segregate
2012 from 2013 payments
and included them in the
same template.
We recommend using a
simplified and intelligible
format on interlinked
spreadsheets to avoid inputs of
contradictory information from
one table to another.
There was improvement
in 2016
35 Government Entities did not
submit their respective data
confirmations in accordance
with a formal template and
the reporting templates sent
by the Mines Inspectorate
Department, Mining
Cadastre Office and the
Federal Inland Revenue
Services were not signed by
a senior company official;
Confirmation letter from
companies’ external auditor
that confirms that the
information they have
submitted is comprehensive
and consistent with their
audited financial statements;
and
Government reporting entities
should be requested to obtain a
certification of the accuracy of
the government disclosures
from the Auditor General
Senior officials now
signed the official
documents of entities.
There are audited
financial statements from
some companies but no
Auditor General
confirmation for
government entities yet.
36 The Audit has observed
persistent activities of some
foreign nationals operating
in the sector which
constitute significant buyers
of the Solid Minerals that
are mined by artisanal and
small scale miners, illegal
miners resulting in
inaccurate production
records and revenue
leakages.
Mineral buying centres need to
be established with functional
Mineral Analysis laboratories
that meet ISO certification
standards in the six(6) geo-
political zones for the purpose
of analysing mineral extracted
or discovered, while upgrading
the existing laboratories to
meet international standards
Some mineral buying
centres have been
established but more are
needed. Mineral Analysis
Laboratories that meet
ISO certification
standards have not been
established as
recommended.

NEITI SOLID MINERALS AUDIT REPORT FOR 2016
Tajudeen Badejo & Co (Chartered Accountants) Page 87 of 90
37 The Mines Inspectorate
Department reported
aggregated figures for
Royalties and for other
services fees, and the
Federal Inland Revenue
Services did not report
details of payments received
from all companies which
were confirmed. Several
companies did not report the
detailed receipt numbers of
payments made to the
Federal Inland Revenue
Services, the Mining
Cadastre Office, Nigeria
Customs Service and to
the Mines Inspectorate
Department;
Given that the Solid Minerals
Sector is not a well organized
industry, we strongly
recommend that a scoping
study should be carried out
before the reconciliation work
is undertaken in order to enable
the National Stakeholder
Working Group to agree on
materiality thresholds,
significant payments,
important extractive
companies, government
entities and the reporting
template. The scoping study
became a mandatory
requirement in the new EITI
Rules (2013).
Reporting templates,
training workshop were
held with all entities and
instructions and guidance
notes were provided for
the preparation of the
payment reports
7.2 Current Audit Findings and Recommendations
S/N Findings Recommendation
1 The total royalty payment declared by
UNICEM was ₦71,635,522.11 in 2016 as per
MMSD records. The company denied the
audit team access to its documents during the
validation visit.
However, at the tripartite reconciliation
meeting which the company attended the IA
discovered an irregular issuance of receipt for
the sum of ₦28,813,021.20. While the receipt
with number Z009454299 was issued on 24th
May, 2016; three other receipts Nos:
Z009449771-3 were issued for the same
amount on August 11th, 2016.
It was further confirmed that the payment of
₦28,813,021.20 with receipt number
Z009454299 issued on 24th May, 2016 was
not included in the sum declared by MMSD.
In addition, the IA was not provided with
evidence of bank lodgment to confirm the
receipt by government.
IA recommends that MMSD undertakes further
investigation of this observed irregularity and
take appropriate action including checking the
records of other covered entities.
2 The IA discovered a difference between the
FOB value of the quantity of minerals
exported by Tongyi Allied Mining Ltd. and
Government (MMSD) should follow up with
the company to recover the sum of
₦5,422,455.75.

NEITI SOLID MINERALS AUDIT REPORT FOR 2016
Tajudeen Badejo & Co (Chartered Accountants) Page 88 of 90
export records submitted by NCS.
Based on NCS records, the company exported
5,521 tons {5,521,520 Net Mass (kg)} of
Lead/Zinc Concentrate and/or Lead Ore in
2016. However, Tongyi declared 3,100 tons
and paid the sum of ₦7,425,000 as royalty as
against ₦12,847,455.75; thus leaving a
difference of ₦5,422,455.75 which represents
payment for the undeclared 2,421 tons.
3 IA discovered a case of under payment of
royalty where withholding tax (10%) was
wrongly deducted on the royalty payable but
not remitted to government. Specifically,
Dangote Cement Plc underpaid royalty at its
Obajana Plant by such deductions to the tune
of ₦40,023,670.56.
The company paid back the sum of
₦40,023,670.56 on 24th August 2018 vides
Remita Retrieval Reference no. 2402-4050-
0287. This is commendable.
However, based on this case, a sector-wide
audit to detect similar occurrences in all
extractive companies for prompt remedial
action is imperative.
4 Multiple business activities of some operators
limit the extent to which some statutory
payments (e.g. taxes) in respect of their
extractive activities can be identified and
reconciled;
This practice is mostly found among the
companies in the construction and cement
manufacturing sectors.
All companies with multiple lines of business
activities should be mandated to:
▪ Maintain separate books of account for their
extractive activities;
▪ Prepare separate audited financial
statements where all relevant statutory
payments accruing to Government from
extractive activities are easily identified;
and
▪ Adopt and implement segmented reporting
in line with IFRS 8.
5 Three companies denied the audit team access
to their records during data validation and
failed to attend reconciliation meeting. The
companies are BUA International Limited
(Okpella Site, Edo State), Hajaig Construction
Company. Limited and Pioneer Sinochino
Investment Ventures Limited.
The revenue contributed by these companies
was ₦44million as per government declared
revenue or 0.1% of the reconciled figure;
hence not material to affect the outcome of
the report.
NEITI should collaborate with relevant
Government agencies to enforce appropriate
sanctions in line with extant laws, against these
companies.
6 In line with the Nigerian Minerals and Mining
Act 2007, royalty is calculated based on
quantity of minerals obtained in the course of
exploration or mining, this is in line with best
practice. However, the Nigerian Minerals and
Mining Regulation 2011 seem to contradict
MMSD should harmonize provisions of the
Nigerian Minerals and Mining Regulation 2011
with the Nigerian Minerals and Mining Act
2007 to ensure that all extractive companies
calculate royalty on the quantity of minerals
produced or won.

NEITI SOLID MINERALS AUDIT REPORT FOR 2016
Tajudeen Badejo & Co (Chartered Accountants) Page 89 of 90
this position as it supports determination of
royalty based on quantity sold or used.
Some companies calculated royalty based on
quantities won/produced while others based
their calculations on the quantities sold or
used –there is need for uniformity.
Harmonization will ensure removal of opacity
and strengthen transparency in the sector.
7 The IA observed that some companies did not
fulfill their Community Development
Agreements.
Government (MMSD) should sanction
companies who renege on Community
Development Agreements with their hosts.
Companies should also report impediments in
the course of implementing the CDAs promptly
to government for appropriate resolution, in
order to ensure peaceful coexistence and foster
development in mining communities.
8 Field visits by the IA revealed prevalence of
illegal mining activities in the sector.
However, there are isolated cases of
registered Cooperative Societies who are
operating in accordance with the la.
Government (ASMD) should improve its
mechanism of integrating these informal
miners into the mainstream with specific
timelines and milestones.
9 The IA observed that of the 651 operators that
paid royalty, 312 (48%) companies were not
reported in the MCO record of valid titles,
register of revoked licences or register of
transferred titles for the year.
The MCO should liaise with MID to ascertain
the validity of the titles of the 312 companies
that paid royalty but not captured in the MCO
register.
10 The IA observed that some titleholders enter
into MOUs with other companies without
duly informing the relevant government
agencies. This has implication on royalty
accountability and other statutory obligations.
Specifically, Inorganic Earth Resources
Limited (legitimate holder of title No: QLS
8630) engaged in quarrying in 2016 through
Tigong Investment Limited by virtue of an
MOU between the two companies that was
not regularized.
Investigation of the activity of all operators
with similar arrangement should be carried out
by MMSD to ensure conformity with statutory
laws.
In addition, FIRS should investigate the
possibility of tax evasion or underpayment of
taxes by the two companies and others with
similar arrangement.
11 The IA observed that some granite aggregate
quarry operators did not comply with the
provisions of Sections 201–204 of the
Mining Regulations 2011 as it relates to
dumping operations, though dust suppression
through water sprinkling was noticed in some
quarries.
The Mines Environmental Compliance
Department (MEC) should ensure that
operators comply with the relevant sections of
the law as it relates to environmental pollution
and apply sanctions where necessary.
12 None of the operators visited provided the
audit team with records of accidents,
dangerous occurrences and diseases as
required by Section 140 of the Mining
Regulations 2011.
The Mines Inspectorate Department (MID)
should compel operators to comply with the
provisions of the law.

NEITI SOLID MINERALS AUDIT REPORT FOR 2016
Tajudeen Badejo & Co (Chartered Accountants) Page 90 of 90
13 We noticed that none of the extractive entities
showed any evidence of contributions to the
Environmental Protection and Rehabilitation
Fund in accordance with Section 121(4) of the
Minerals and Mining Act, 2007.
The Government (MMSD) should facilitate the
establishment of the Environmental Protection
and Rehabilitation Fund so that mineral title
holders meet their environmental obligations.
Figure 7.1: Photographs during mineral processing