First-trimester maternal serum pregnancy-associated plasma protein-A and pre-eclampsia
11
Ultrasound Obstet Gynecol 2009; 33: 23–33 Published online 17 December 2008 in Wiley InterScience (www.interscience.wiley.com). DOI: 10.1002/uog.6280 First-trimester maternal serum pregnancy-associated plasma protein-A and pre-eclampsia L. C. Y. POON, N. MAIZ, C. VALENCIA, W. PLASENCIA and K. H. NICOLAIDES Harris Birthright Research Centre for Fetal Medicine, King’s College Hospital, London, UK KEYWORDS: first-trimester screening; PAPP-A; pre-eclampsia; uterine artery Doppler ABSTRACT Objectives To examine the relationship between low maternal serum pregnancy-associated plasma protein-A (PAPP-A) and uterine artery pulsatility index (UtA-PI) at 11 + 0 to 13 + 6 weeks with subsequent development of pre-eclampsia (PE). Methods UtA-PI and serum PAPP-A were measured in women attending for routine care at 11 + 0 to 13 + 6 weeks of gestation. In the population, 156 (1.9%) women developed PE, including 32 (0.4%) in whom delivery was before 34 weeks (early PE) and 124 (1.5%) with delivery at 34 weeks or more (late PE); 7895 (98.1%) women had no PE. Regression analysis was used to exam- ine which of the factors amongst maternal characteristics, log PAPP-A multiples of the median (MoM) and log UtA-PI MoM contributed to the prediction of PE. Results The median PAPP-A MoM was 1.002 (interquar- tile range (IQR), 0.685–1.411) in the unaffected group, 0.555 (IQR, 0.463–0.922) in early PE and 0.911 (IQR, 0.580–1.247) in late PE. Serum PAPP-A was below the 5 th centile in 21.9% of early PE and 6.5% of late PE cases. The PAPP-A-related patient-specific risk for PE was strongly influenced by maternal characteristics. There was a significant association between log UtA-PI MoM and log PAPP-A MoM (P = 0.001), and the detection rate of screening for PE by maternal variables and UtA-PI was not improved by inclusion of PAPP-A. Regression analy- sis was used to establish tables that allow modification of the maternal history and PAPP-A-related patient-specific risk for PE by the measurement of UtA-PI. Conclusions Low PAPP-A is a marker for subsequent development of PE. The PAPP-A-related patient-specific risk for PE can be modified by the measurement of UtA-PI. Copyright 2008 ISUOG. Published by John Wiley & Sons, Ltd. INTRODUCTION Effective screening for trisomies 21, 18 and 13 is provided by a combination of maternal age, fetal nuchal translucency (NT) thickness, and maternal serum free β-human chorionic gonadotropin (β-hCG) and pregnancy- associated plasma protein-A (PAPP-A) at 11 + 0 to 13 + 6 weeks of gestation. All three trisomies are associated with increased maternal age, increased fetal NT and decreased maternal serum PAPP-A. In trisomy 21 serum free β-hCG is increased whereas it is decreased in trisomies 18 and 13 1 . In biochemical testing it is necessary to make adjustments in the measured maternal serum metabolite concentration to correct for certain maternal and pregnancy characteristics. Essentially, each measured level is first converted to a multiple of the expected normal median (MoM) specific to a pregnancy of the same gestational age, maternal weight, racial origin, smoking status, method of conception and parity, as well as the machine and reagents used for the assays 2 . In unaffected pregnancies the median free β-hCG and PAPP-A is 1.0 MoM, whereas in trisomy 21 pregnancies the median free β-hCG is 2.0 MoM and the median PAPP-A is 0.5 MoM; the respective values are 0.2 MoM and 0.2 MoM in trisomy 18, and 0.5 MoM and 0.3 MoM in trisomy 13 1 . In chromosomally normal pregnancies there is evidence that low maternal serum PAPP-A is associated with increased risk for subsequent development of pre- eclampsia (PE) 3–9 . However, measurement of PAPP-A is not an effective method of screening for PE because only 8 – 23% of affected cases have serum levels below the 5 th centile, which is about 0.4 MoM. Nevertheless, the obstetrician should be aware of the increased risk for PE when managing individual patients found coincidentally to have a low PAPP-A level during first-trimester screening for trisomies. At the 5 th centile of normal for PAPP-A the reported odds ratios for PE varies between 1.5 and 4.6 3–9 . Correspondence to: Prof. K. H. Nicolaides, Harris Birthright Research Centre for Fetal Medicine King’s College Hospital, Denmark Hill, London SE5 9RS, UK (e-mail: [email protected]) Accepted: 2 October 2008 Copyright 2008 ISUOG. Published by John Wiley & Sons, Ltd. ORIGINAL PAPER
-
Upload
independent -
Category
Documents
-
view
1 -
download
0
Transcript of First-trimester maternal serum pregnancy-associated plasma protein-A and pre-eclampsia
Ultrasound Obstet Gynecol 2009; 33: 23–33Published online 17 December 2008 in Wiley InterScience (www.interscience.wiley.com). DOI: 10.1002/uog.6280
First-trimester maternal serum pregnancy-associated plasmaprotein-A and pre-eclampsia
L. C. Y. POON, N. MAIZ, C. VALENCIA, W. PLASENCIA and K. H. NICOLAIDESHarris Birthright Research Centre for Fetal Medicine, King’s College Hospital, London, UK
KEYWORDS: first-trimester screening; PAPP-A; pre-eclampsia; uterine artery Doppler
ABSTRACT
Objectives To examine the relationship between lowmaternal serum pregnancy-associated plasma protein-A(PAPP-A) and uterine artery pulsatility index (UtA-PI) at11 + 0 to 13 + 6 weeks with subsequent development ofpre-eclampsia (PE).
Methods UtA-PI and serum PAPP-A were measuredin women attending for routine care at 11 + 0 to13 + 6 weeks of gestation. In the population, 156 (1.9%)women developed PE, including 32 (0.4%) in whomdelivery was before 34 weeks (early PE) and 124 (1.5%)with delivery at 34 weeks or more (late PE); 7895 (98.1%)women had no PE. Regression analysis was used to exam-ine which of the factors amongst maternal characteristics,log PAPP-A multiples of the median (MoM) and logUtA-PI MoM contributed to the prediction of PE.
Results The median PAPP-A MoM was 1.002 (interquar-tile range (IQR), 0.685–1.411) in the unaffected group,0.555 (IQR, 0.463–0.922) in early PE and 0.911 (IQR,0.580–1.247) in late PE. Serum PAPP-A was below the5th centile in 21.9% of early PE and 6.5% of late PEcases. The PAPP-A-related patient-specific risk for PEwas strongly influenced by maternal characteristics. Therewas a significant association between log UtA-PI MoMand log PAPP-A MoM (P = 0.001), and the detection rateof screening for PE by maternal variables and UtA-PI wasnot improved by inclusion of PAPP-A. Regression analy-sis was used to establish tables that allow modification ofthe maternal history and PAPP-A-related patient-specificrisk for PE by the measurement of UtA-PI.
Conclusions Low PAPP-A is a marker for subsequentdevelopment of PE. The PAPP-A-related patient-specificrisk for PE can be modified by the measurement ofUtA-PI. Copyright 2008 ISUOG. Published by JohnWiley & Sons, Ltd.
INTRODUCTION
Effective screening for trisomies 21, 18 and 13 isprovided by a combination of maternal age, fetal nuchaltranslucency (NT) thickness, and maternal serum freeβ-human chorionic gonadotropin (β-hCG) and pregnancy-associated plasma protein-A (PAPP-A) at 11 + 0 to 13 +6 weeks of gestation. All three trisomies are associatedwith increased maternal age, increased fetal NT anddecreased maternal serum PAPP-A. In trisomy 21 serumfree β-hCG is increased whereas it is decreased intrisomies 18 and 131. In biochemical testing it is necessaryto make adjustments in the measured maternal serummetabolite concentration to correct for certain maternaland pregnancy characteristics. Essentially, each measuredlevel is first converted to a multiple of the expectednormal median (MoM) specific to a pregnancy of the samegestational age, maternal weight, racial origin, smokingstatus, method of conception and parity, as well as themachine and reagents used for the assays2. In unaffectedpregnancies the median free β-hCG and PAPP-A is 1.0MoM, whereas in trisomy 21 pregnancies the median freeβ-hCG is 2.0 MoM and the median PAPP-A is 0.5 MoM;the respective values are 0.2 MoM and 0.2 MoM intrisomy 18, and 0.5 MoM and 0.3 MoM in trisomy 131.
In chromosomally normal pregnancies there is evidencethat low maternal serum PAPP-A is associated withincreased risk for subsequent development of pre-eclampsia (PE)3–9. However, measurement of PAPP-Ais not an effective method of screening for PE becauseonly 8–23% of affected cases have serum levels below the5th centile, which is about 0.4 MoM. Nevertheless, theobstetrician should be aware of the increased risk for PEwhen managing individual patients found coincidentallyto have a low PAPP-A level during first-trimester screeningfor trisomies. At the 5th centile of normal for PAPP-A thereported odds ratios for PE varies between 1.5 and 4.63–9.
Correspondence to: Prof. K. H. Nicolaides, Harris Birthright Research Centre for Fetal Medicine King’s College Hospital, Denmark Hill,London SE5 9RS, UK (e-mail: [email protected])
Accepted: 2 October 2008
Copyright 2008 ISUOG. Published by John Wiley & Sons, Ltd. ORIGINAL PAPER

24 Poon et al.
Effective first-trimester screening for PE is providedby a combination of the measurement of uterine arterypulsatility index (UtA-PI) by Doppler ultrasound imagingand maternal variables, such as racial origin, bodymass index (BMI), and previous and family history ofPE10. This method is particularly effective in identifyingsevere early-onset PE requiring delivery before 34 weeks(detection rate of about 80% for a false-positive rate of10%) rather than late-onset disease, which is importantbecause it is early- rather than late-onset disease that isassociated with an increased risk of perinatal mortalityand morbidity, and both short- and long-term maternalcomplications11–13.
The aims of this study were to examine further thepossible association between low maternal serum PAPP-Aat 11 + 0 to 13 + 6 weeks and subsequent development ofPE. We first investigated whether PAPP-A levels are relatedto the severity of PE, second, estimated the patient-specificrisk for PE in relation to PAPP-A levels, third, examinedthe possible association between serum PAPP-A and UtA-PI, and, finally, determined the performance of screeningfor PE by combined testing based on maternal history,serum PAPP-A and UtA-PI.
METHODS
This was a prospective screening study for PE in singletonpregnancies. All women attended our center betweenMarch 2006 and June 2007 for routine assessment oftrisomy 21 risk at 11 + 0 to 13 + 6 weeks of gestation bymeasurement of fetal NT thickness, and maternal serumfree β-hCG and PAPP-A14–16. Written informed consentwas obtained from women who agreed to participate inthe study, which was approved by King’s College HospitalEthics Committee.
Patients were asked to complete a questionnaire onmaternal age, racial origin (white, black, Indian or Pak-istani, Chinese or Japanese, or mixed), cigarette smokingduring pregnancy (yes or no), medical history (includ-ing chronic hypertension, diabetes mellitus, antiphos-pholipid syndrome, thrombophilia, human immunode-ficiency virus infection and sickle cell disease), medication(including antihypertensive, antidepressant, antiepilep-tic, anti-inflammatory, antiretroviral, antithyroid, aspirin,β-mimetic, insulin, lithium, steroids, thyroxine), parity(parous or nulliparous if no delivery beyond 23 weeks),methods of conception (spontaneous, use of ovulationdrugs or in-vitro fertilization), obstetric history (previouspregnancy with or without PE) and family history of PE(mother). The maternal weight and height were measured,and the BMI was calculated.
Maternal serum PAPP-A was measured using a DELFIAEXPRESS analyzer (PerkinElmer, Waltham, MA, USA).The measured concentration of PAPP-A was converted toa MoM corrected for fetal crown–rump length (CRL),maternal weight, smoking status, racial origin, parity andmethod of conception2.
Transabdominal ultrasound examination was carriedout for measurement of fetal CRL and NT thickness,
diagnosis of any major fetal defects and measurementof UtA-PI. For the Doppler studies a sagittal sectionof the uterus was obtained, and the cervical canaland internal cervical os were identified. Subsequently,the transducer was gently tilted from side to side andcolor flow mapping was used to identify each UtAalong the side of the cervix and uterus at the levelof the internal os10,17. Pulsed wave Doppler imagingwas used with the sampling gate set at 2 mm to coverthe whole vessel and care was taken to ensure thatthe angle of insonation was less than 50◦. When threesimilar consecutive waveforms had been obtained theUtA-PI was measured, and the mean UtA-PI of the leftand right arteries was calculated. All ultrasound andDoppler studies were carried out by sonographers whohad received the appropriate Certificate of Competence inthe 11 + 0 to 13 + 6-week scan and Doppler of The FetalMedicine Foundation (http://www.fetalmedicine.com/).The results of the Doppler studies were not given tothe women or their doctors and did not influence thesubsequent management of the pregnancies.
PAPP-A MoM values, ultrasound findings and women’scharacteristics, including demographic data and obstet-ric and medical history, were entered into a computerdatabase. Data on pregnancy outcome were collectedfrom the hospital maternity records or general medicalpractitioners. The obstetric records of all women withreported pre-existing or pregnancy-associated hyperten-sion were examined to determine whether the conditionwas PE. Similarly, for quality control we examined therecords of 500 randomly selected cases without reportedpregnancy-associated hypertension.
Outcome measures
The definition of PE was that of the International Societyfor the Study of Hypertension in Pregnancy18. Thediastolic blood pressure should be ≥ 90 mmHg on atleast two occasions 4 h apart, developing after 20 weeksof gestation in previously normotensive women in thepresence of significant proteinuria of ≥ 300 mg in 24 hor two readings of at least ++ on dipstick analysisof midstream or catheter urine specimens if no 24-hcollection is available. In PE superimposed on chronichypertension significant proteinuria (as defined above)should develop after 20 weeks of gestation in womenwith known chronic hypertension (history of hypertensionbefore conception or the presence of hypertension at thebooking visit before 20 weeks of gestation in the absenceof trophoblastic disease)18.
Statistical analysis
The following nine steps were taken. First, the womenwere divided into two groups depending on pregnancyoutcome into those who developed PE and thoseunaffected by PE. Second, the distributions of UtA-PIand PAPP-A MoM were made Gaussian by logarithmictransformation. Third, multiple regression analysis was
Copyright 2008 ISUOG. Published by John Wiley & Sons, Ltd. Ultrasound Obstet Gynecol 2009; 33: 23–33.
Pregnancy-associated plasma protein-A and pre-eclampsia 25
used to determine which of the factors among the maternalcharacteristics were significant predictors of log UtA-PI in the unaffected group. Fourth, the distribution oflog UtA-PI, expressed as MoM of the unaffected group,was determined in the PE group. Fifth, Mann–WhitneyU-test was used to compare the median MoM ofPAPP-A and UtA-PI between the outcome groups.Sixth, regression analysis was used to determine thesignificance of the association between gestational ageat delivery with log UtA-PI MoM and log PAPP-AMoM in the two outcome groups. Seventh, regressionanalysis was used to determine the significance of theassociation between log UtA-PI MoM and log PAPP-AMoM in the two outcome groups. Eighth, regressionanalysis was used to determine which of the factorsamong the maternal characteristics, log UtA-PI MoMand log PAPP-A MoM had significantly contributed topredicting PE. Ninth, the detection and false-positiverates were calculated as the respective proportionsof PE (detection rate) and unaffected pregnancies(false-positive rate) with MoM values above givencut-offs. The statistical software packages SPSS 15.0(SPSS Inc., Chicago, IL, USA) and Medcalc (MedcalcSoftware, Mariakerke, Belgium) were used for the dataanalyses.
RESULTS
Study population
First-trimester screening was carried out in 8679consecutive singleton pregnancies with a live fetus at11 + 0 to 13 + 6 weeks. We excluded 628 (7.2%) becausethey had missing outcome data (n = 391), there werefetal abnormalities (n = 90), the pregnancies resulted infetal death or miscarriage before 24 weeks of gestation(n = 101), or the pregnancies were terminated for socialreasons (n = 17). In addition, a further 29 (0.3%)pregnancies, in which there was at least one episode ofhypertension but on the basis of the available data it wasnot possible to determine if the diagnosis was PE, werealso excluded from further analysis. The patients includedin the study did not differ significantly in demographiccharacteristics from those excluded.
Among the remaining 8051 cases, 156 (1.9%)developed PE, including 32 (0.4%) in which delivery wasbefore 34 weeks (early PE) and 124 (1.5%) with deliveryat 34 weeks or later (late PE); 7895 (98.1%) cases wereunaffected by PE. In the quality control assessment of500 cases with reported normal outcome, examinationof their records demonstrated that there were indeed nocases of PE. The characteristics of the outcome groups aresummarized in Table 1.
Serum pregnancy-associated plasma protein-Aand pre-eclampsia
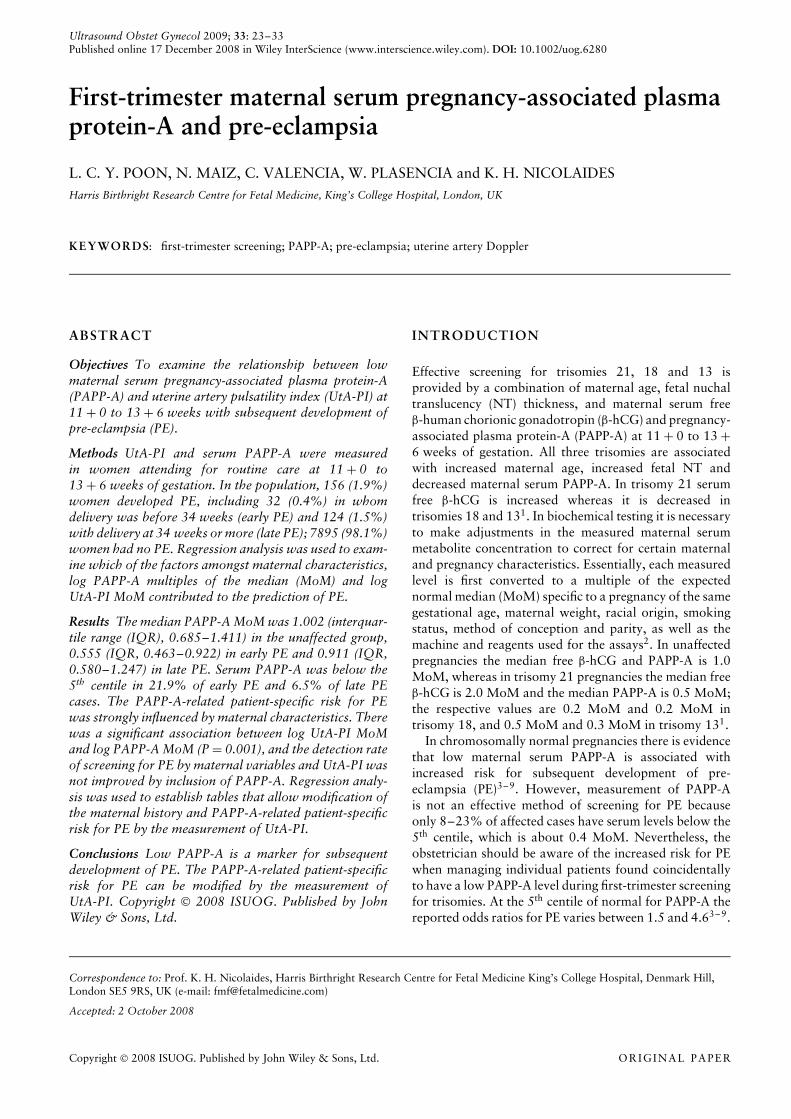
The median PAPP-A was 1.002 (interquartile range(IQR), 0.685–1.411) MoM in the unaffected group,
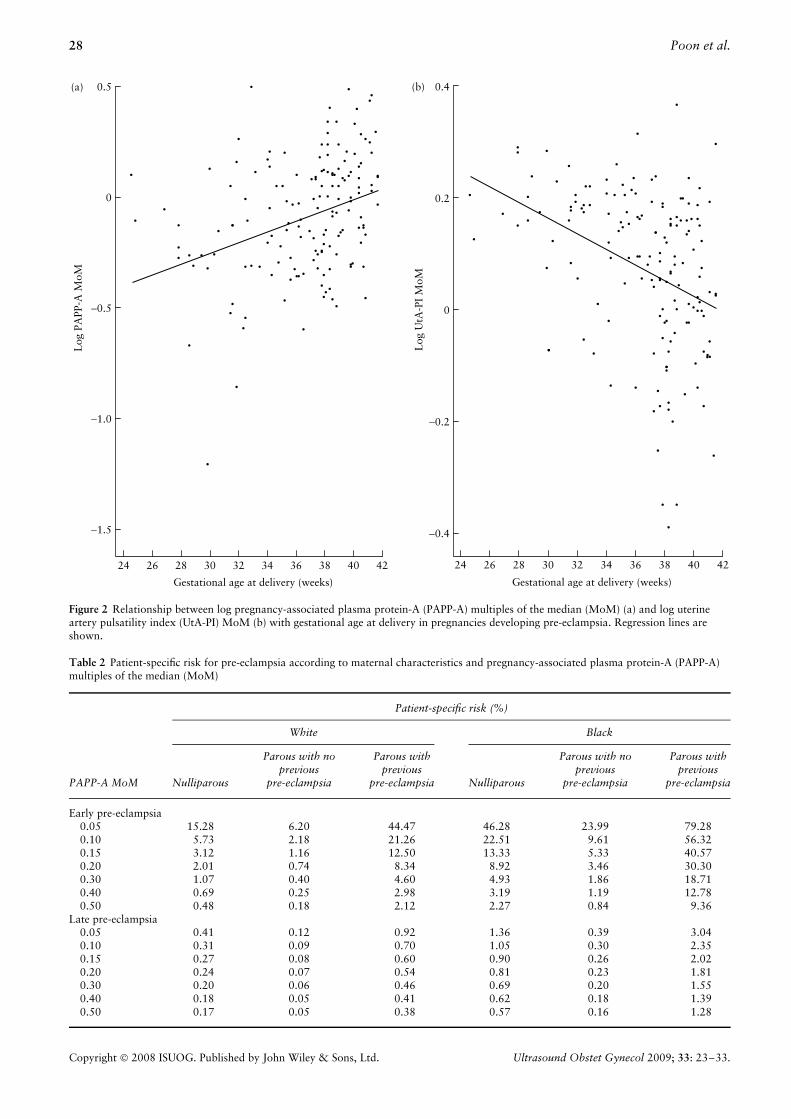
0.555 (IQR, 0.463–0.922) MoM in the early PE groupand 0.911 (IQR, 0.580–1.247) MoM in the late PEgroup (Figure 1a). Log PAPP-A MoM was significantlylower in both the early PE (P < 0.001) and late PE(P = 0.03) groups than in the unaffected group. Inthe PE group regression analysis demonstrated that logPAPP-A MoM increased with gestational age at delivery(Figure 2a):
Log PAPP-A MoM = −0.981 + 0.024 × gestational
age in weeks (P < 0.001).
The patient-specific risk for early PE (%) was calculatedfrom the formula:
Risk = Odds/(1 + odds)
where odds = eY. Y was derived from multiple regressionanalysis which demonstrated that in the prediction ofearly PE there were significant contributions from serumPAPP-A, maternal racial origin, previous history of PEand chronic hypertension, but not maternal age, BMI,smoking, family history of PE, medical history otherthan hypertension, medication or method of conception(Table 2 and Figure 3):
Y = −6.413 − 3.612 × log PAPP-A MoM
+ (1.803 if history of chronic hypertension)
+ (1.564 if black, 0 if other racial origin)
+ (0 if nulliparous, −1.005 if parous without
previous PE, 1.491 if parous with previous PE)
(R2 = 0.176, P < 0.001).
Multiple regression analysis demonstrated that in theprediction of late PE there were significant contributionsfrom serum PAPP-A, maternal racial origin, BMI, previousand family history of PE, but not maternal age, smoking,medical history, medication or method of conception(Table 2):
Y = −6.652 − 0.884 × log PAPP-A MoM
+ (1.127 if family history of PE)
+ (1.222 if black, 0.936 if Indian or Pakistani,
1.335 if mixed race, 0 if other racial origin)
+ 0.084 × BMI in kg/m2 + (0 if nulliparous,
−1.255 if parous without previous PE,
0.818 if parous with previous PE)
(R2 = 0.123, P < 0.001).
Uterine artery pulsatility index and pre-eclampsia
Multiple regression analysis in the unaffected groupdemonstrated that for log UtA-PI significant independent
Copyright 2008 ISUOG. Published by John Wiley & Sons, Ltd. Ultrasound Obstet Gynecol 2009; 33: 23–33.

26 Poon et al.
Table 1 Maternal characteristics and medical and obstetric history in the three groups of pregnancy outcome: unaffected by pre-eclampsia,early pre-eclampsia and late pre-eclampsia
Maternal characteristicUnaffected(n = 7895)
Earlypre-eclampsia
(n = 32)
LatePre-eclampsia
(n = 124)
Maternal age (years) 32.3 (16–49) 31.6 (17–49) 32.0 (17–44)Body mass index (kg/m2) 24.5 (15.3–59.2) 27.6 (18.7–38.1)* 27.4 (18.9–46.4)‡Crown–rump length (mm) 63.6 (45–84) 65.7 (52–84) 62.0 (46–84)Racial origin
White 5588 (70.8) 13 (40.6)‡ 54 (43.5)‡Black 1529 (19.4) 15 (46.9)‡ 52 (41.9)‡Indian or Pakistani 389 (4.9) 2 (6.3) 8 (6.5)Chinese or Japanese 113 (1.4) 0 (0) 2 (1.6)Mixed 276 (3.5) 2 (6.3) 8 (6.5)
ParityNulliparous 3768 (47.7) 17 (53.1) 76 (61.3)*Parous; no previous pre-eclampsia 3919 (49.6) 8 (25.0)† 30 (24.2)‡Parous; previous pre-eclampsia 208 (2.6) 7 (21.9)‡ 18 (14.5)‡
Cigarette smoker 679 (8.6) 0 (0) 7 (5.6)Family history of pre-eclampsia (mother) 317 (4.0) 3 (9.4) 16 (12.9)‡Conception
Spontaneous 7610 (96.4) 27 (84.4)† 118 (95.2)Ovulation drugs 163 (2.1) 4 (12.5)† 4 (3.2)In-vitro fertilization 122 (1.5) 1 (3.1) 2 (1.6)
Medical historyNone 7699 (97.5) 27 (84.4)† 116 (93.5)*Chronic hypertension 84 (1.1) 4 (12.5)‡ 6 (4.8)†Diabetes mellitus 51 (0.6) 0 (0) 1 (0.8)Antiphospholipid syndrome 13 (0.2) 1 (3.1) 0 (0)Thrombophilia 31 (0.4) 0 (0) 1 (0.8)Sickle cell disease 9 (0.1) 0 (0) 0 (0)Human immunodeficiency viral infection 8 (0.1) 0 (0) 0 (0)
Medication during pregnancyNone 7273 (92.1) 27 (84.4) 112 (90.3)Antihypertensives 46 (0.6) 2 (6.3)* 4 (3.2)*Insulin 49 (0.6) 0 (0) 1 (0.8)Steroids 16 (0.2) 1 (3.1) 0 (0)β-mimetics 134 (1.7) 0 (0) 4 (3.2)Combined asthma medications 88 (1.1) 0 (0) 1 (0.8)Thyroxine 97 (1.2) 1 (3.1) 1 (0.8)Aspirin 86 (1.1) 1 (3.1) 0 (0)Antithyroid medication 7 (0.1) 0 (0) 0 (0)Antiepileptic 36 (0.5) 0 (0) 0 (0)Lithium 4 (0.1) 0 (0) 0 (0)Antidepressants 46 (0.6) 0 (0) 1 (0.8)Antiretroviral 5 (0.1) 0 (0) 0 (0)Anti-inflammatory 8 (0.1) 0 (0) 0 (0)
Values are median (range) or n (%). *P < 0.05, †P < 0.01, ‡P < 0.001 vs. unaffected group (chi-square test for categorical variables;ANOVA for continuous variables).
contributions were provided by maternal age, racialorigin, BMI, previous history of PE and fetal CRL:
Log UtA-PI = 0.405 − 0.002 × CRL in mm − 0.001
× age in years − 0.002 × BMI in kg/m2 + (0.027 if
black, 0.020 if mixed race, 0 if other racial origin)
+ (0.022 if parous with previous PE, 0 if nulliparous
or parous without previous PE)
(R2 = 0.029, P < 0.001).
In each patient in both the unaffected and PE groupswe used the formula above to derive the expected log
UtA-PI and then expressed the observed value as aMoM of the expected value. The median UtA-PI was1.007 (IQR, 0.835–1.221) MoM in the unaffected group,1.498 (IQR, 1.318–1.636) MoM in the early PE groupand 1.189 (IQR, 0.931–1.442) MoM in the late PEgroup (Figure 1b). Log UtA-PI MoM was significantlyhigher in both the early PE (P < 0.001) and late PEgroups (P < 0.001) than in the unaffected group. Inthe PE group regression analysis demonstrated that logUtA-PI MoM decreased with gestational age at delivery(Figure 2b):
Log UtA-PI MoM = 0.590 − 0.014 × gestational age
in weeks (P < 0.001).
Copyright 2008 ISUOG. Published by John Wiley & Sons, Ltd. Ultrasound Obstet Gynecol 2009; 33: 23–33.
Pregnancy-associated plasma protein-A and pre-eclampsia 27
0
0.5
1.0
1.5
2.0
2.5
3.0(b)
Earlypre-eclampsia
Latepre-eclampsia
Unaffected
UtA
-PI
MoM
0
0.5
1.0
1.5
2.0
2.5
3.0(a)
Earlypre-eclampsia
Latepre-eclampsia
Unaffected
PAPP
-A M
oM
Figure 1 Pregnancy-associated plasma protein-A (PAPP-A) multiples of the median (MoM) (a) and uterine artery pulsatility index (UtA-PI)MoM (b) in unaffected pregnancies and those developing early and late pre-eclampsia. Median, interquartile range and range are shown.
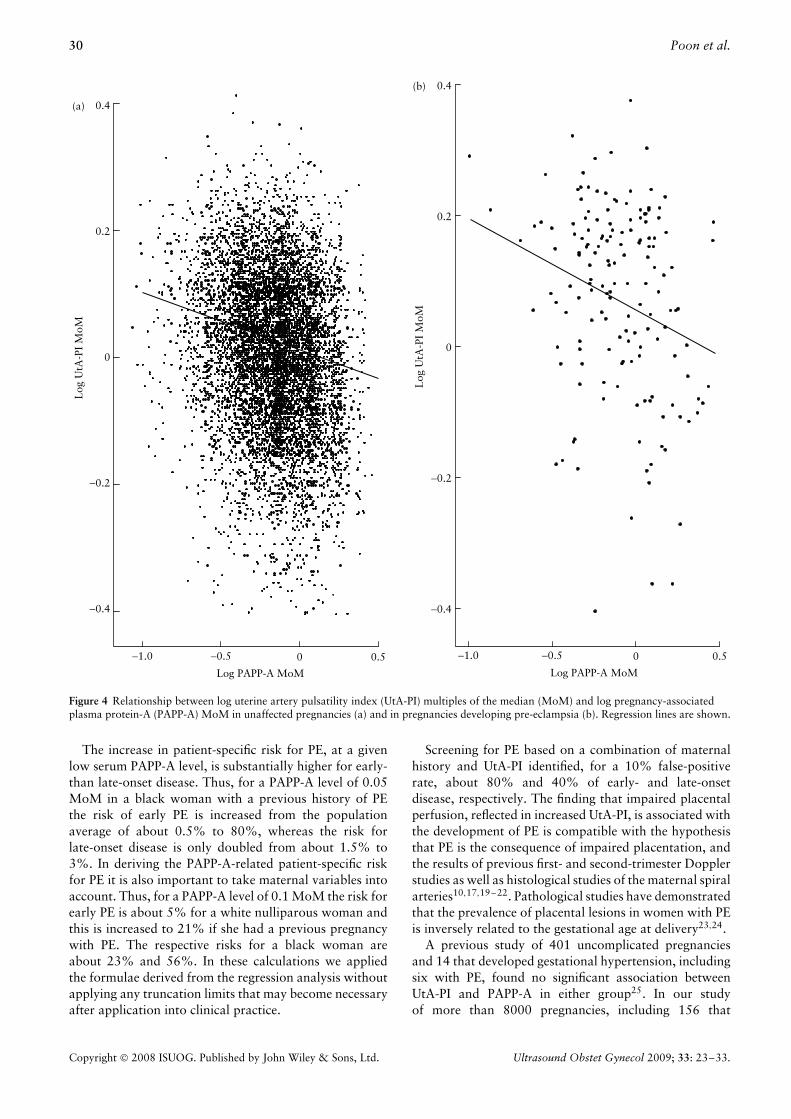
Relationship between pregnancy-associated plasmaprotein-A and uterine artery pulsatility index
There was a significant association between log UtA-PIMoM and log PAPP-A MoM in the unaffected group(Figure 4a):
Log UtA-PI MoM = −0.001 − 0.095×log PAPP-A MoM (P < 0.001).
There was also a significant association between logUtA-PI MoM and log PAPP-A MoM in the PE group(Figure 4b):
Log UtA-PI MoM = 0.057 − 0.141×log PAPP-A MoM (P = 0.001).
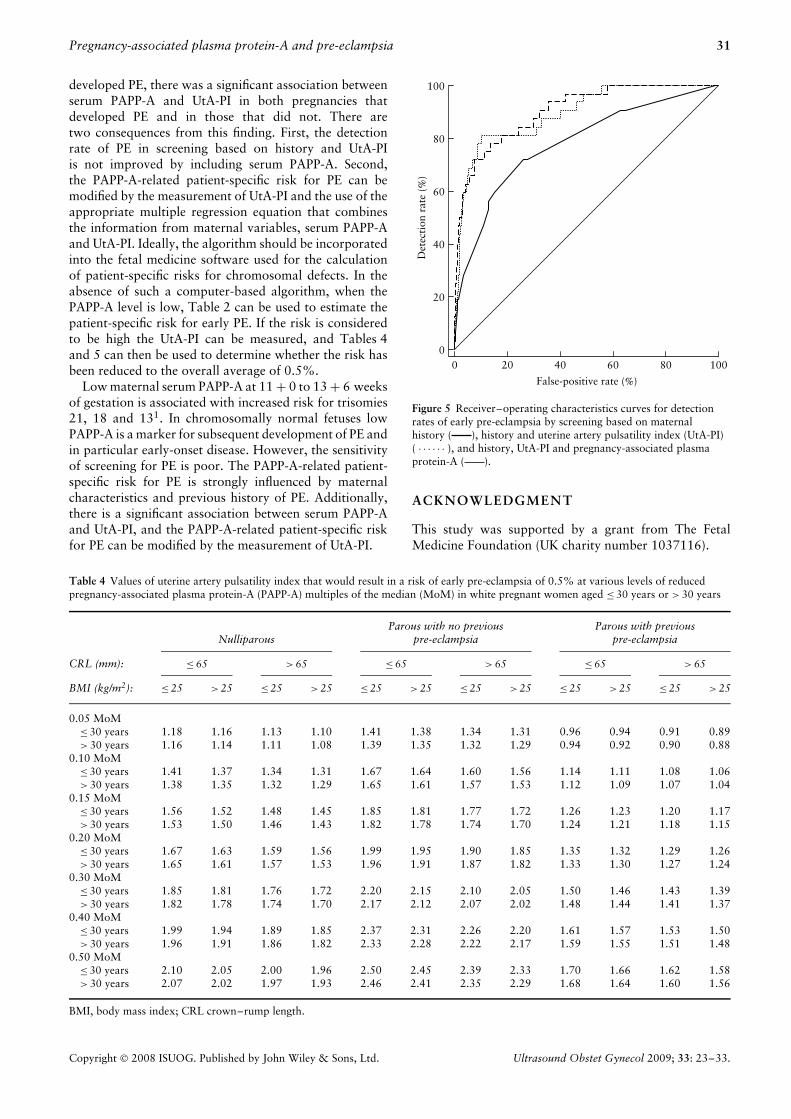
Performance of screening for pre-eclampsia
The estimated detection rates of PE for different false-positive rates in screening based on maternal factors only,UtA-PI only, serum PAPP-A only and their combinationsare shown in Table 3 and Figure 5.
The performance of different methods of screen-ing was compared by examining areas under thereceiver–operating characteristics (ROC) curves(Table 3). In the prediction of total PE, the area underthe ROC curve was significantly higher for screening byhistory with UtA-PI than by history alone (P = 0.048),but there was no further improvement in screening ifserum PAPP-A was included (P = 0.501). Similarly, in theprediction of early PE, the area under the curve was sig-nificantly higher in screening by history with UtA-PI thanby history alone (P = 0.008), but there was no furtherimprovement in screening if serum PAPP-A was included(P = 0.728). In the prediction of late PE the area underthe ROC curve was not significantly higher for screeningby history with UtA-PI than by history alone (P = 0.135),or by history with serum PAPP-A than by history alone(P = 0.229).
Modification of patient-specific risk for pre-eclampsia
The ROC curve analysis demonstrated that the detectionrate of PE from screening based on history and UtA-PIwas not improved by including serum PAPP-A. However,multiple regression analysis demonstrated that there were
Copyright 2008 ISUOG. Published by John Wiley & Sons, Ltd. Ultrasound Obstet Gynecol 2009; 33: 23–33.
28 Poon et al.
24 26 28 30 32 34 36 38 40 42
Gestational age at delivery (weeks)
−0.4
−0.2
0
0.2
0.4(b)
Log
UtA
-PI
MoM
−1.5
−1.0
−0.5
0
0.5(a)L
og P
APP
-A M
oM
24 26 28 30 32 34 36 38 40 42
Gestational age at delivery (weeks)
Figure 2 Relationship between log pregnancy-associated plasma protein-A (PAPP-A) multiples of the median (MoM) (a) and log uterineartery pulsatility index (UtA-PI) MoM (b) with gestational age at delivery in pregnancies developing pre-eclampsia. Regression lines areshown.
Table 2 Patient-specific risk for pre-eclampsia according to maternal characteristics and pregnancy-associated plasma protein-A (PAPP-A)multiples of the median (MoM)
Patient-specific risk (%)
White Black
PAPP-A MoM Nulliparous
Parous with noprevious
pre-eclampsia
Parous withprevious
pre-eclampsia Nulliparous
Parous with noprevious
pre-eclampsia
Parous withprevious
pre-eclampsia
Early pre-eclampsia0.05 15.28 6.20 44.47 46.28 23.99 79.280.10 5.73 2.18 21.26 22.51 9.61 56.320.15 3.12 1.16 12.50 13.33 5.33 40.570.20 2.01 0.74 8.34 8.92 3.46 30.300.30 1.07 0.40 4.60 4.93 1.86 18.710.40 0.69 0.25 2.98 3.19 1.19 12.780.50 0.48 0.18 2.12 2.27 0.84 9.36
Late pre-eclampsia0.05 0.41 0.12 0.92 1.36 0.39 3.040.10 0.31 0.09 0.70 1.05 0.30 2.350.15 0.27 0.08 0.60 0.90 0.26 2.020.20 0.24 0.07 0.54 0.81 0.23 1.810.30 0.20 0.06 0.46 0.69 0.20 1.550.40 0.18 0.05 0.41 0.62 0.18 1.390.50 0.17 0.05 0.38 0.57 0.16 1.28
Copyright 2008 ISUOG. Published by John Wiley & Sons, Ltd. Ultrasound Obstet Gynecol 2009; 33: 23–33.
Pregnancy-associated plasma protein-A and pre-eclampsia 29
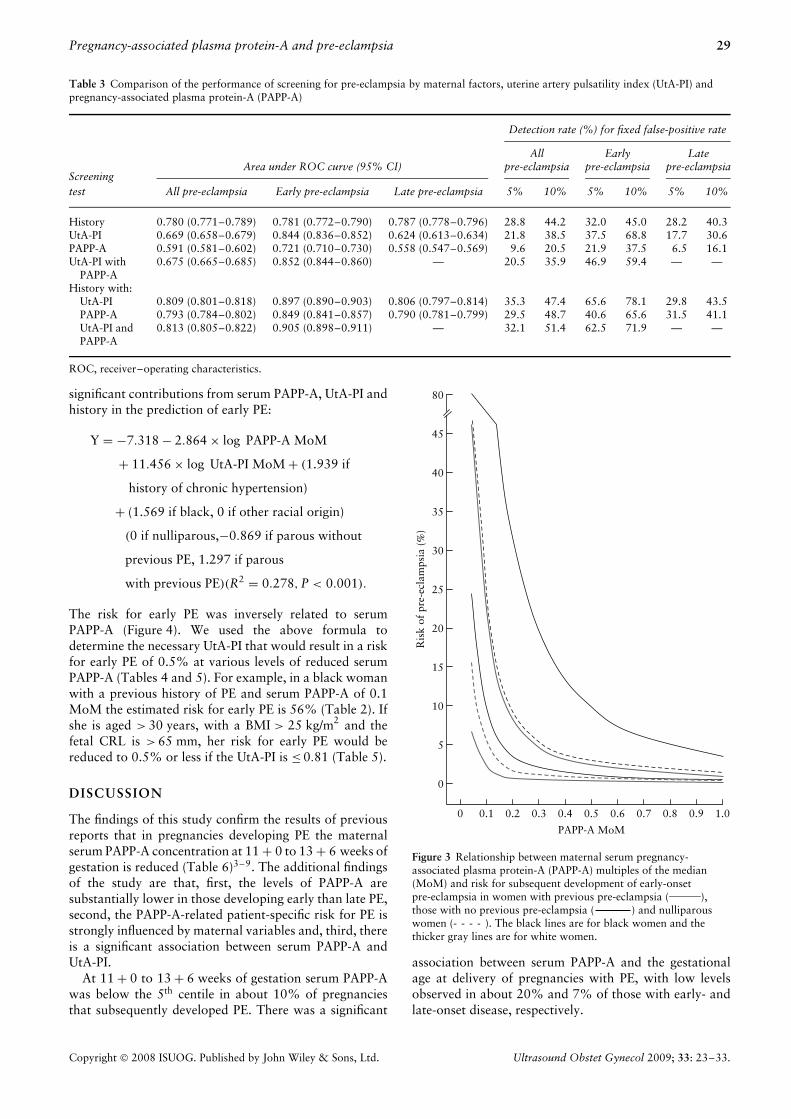
Table 3 Comparison of the performance of screening for pre-eclampsia by maternal factors, uterine artery pulsatility index (UtA-PI) andpregnancy-associated plasma protein-A (PAPP-A)
Detection rate (%) for fixed false-positive rate
Area under ROC curve (95% CI)All
pre-eclampsiaEarly
pre-eclampsiaLate
pre-eclampsiaScreeningtest All pre-eclampsia Early pre-eclampsia Late pre-eclampsia 5% 10% 5% 10% 5% 10%
History 0.780 (0.771–0.789) 0.781 (0.772–0.790) 0.787 (0.778–0.796) 28.8 44.2 32.0 45.0 28.2 40.3UtA-PI 0.669 (0.658–0.679) 0.844 (0.836–0.852) 0.624 (0.613–0.634) 21.8 38.5 37.5 68.8 17.7 30.6PAPP-A 0.591 (0.581–0.602) 0.721 (0.710–0.730) 0.558 (0.547–0.569) 9.6 20.5 21.9 37.5 6.5 16.1UtA-PI with
PAPP-A0.675 (0.665–0.685) 0.852 (0.844–0.860) — 20.5 35.9 46.9 59.4 — —
History with:UtA-PI 0.809 (0.801–0.818) 0.897 (0.890–0.903) 0.806 (0.797–0.814) 35.3 47.4 65.6 78.1 29.8 43.5PAPP-A 0.793 (0.784–0.802) 0.849 (0.841–0.857) 0.790 (0.781–0.799) 29.5 48.7 40.6 65.6 31.5 41.1UtA-PI andPAPP-A
0.813 (0.805–0.822) 0.905 (0.898–0.911) — 32.1 51.4 62.5 71.9 — —
ROC, receiver–operating characteristics.
significant contributions from serum PAPP-A, UtA-PI andhistory in the prediction of early PE:
Y = −7.318 − 2.864 × log PAPP-A MoM
+ 11.456 × log UtA-PI MoM + (1.939 if
history of chronic hypertension)
+ (1.569 if black, 0 if other racial origin)
(0 if nulliparous,−0.869 if parous without
previous PE, 1.297 if parous
with previous PE)(R2 = 0.278, P < 0.001).
The risk for early PE was inversely related to serumPAPP-A (Figure 4). We used the above formula todetermine the necessary UtA-PI that would result in a riskfor early PE of 0.5% at various levels of reduced serumPAPP-A (Tables 4 and 5). For example, in a black womanwith a previous history of PE and serum PAPP-A of 0.1MoM the estimated risk for early PE is 56% (Table 2). Ifshe is aged > 30 years, with a BMI > 25 kg/m2 and thefetal CRL is > 65 mm, her risk for early PE would bereduced to 0.5% or less if the UtA-PI is ≤ 0.81 (Table 5).
DISCUSSION
The findings of this study confirm the results of previousreports that in pregnancies developing PE the maternalserum PAPP-A concentration at 11 + 0 to 13 + 6 weeks ofgestation is reduced (Table 6)3–9. The additional findingsof the study are that, first, the levels of PAPP-A aresubstantially lower in those developing early than late PE,second, the PAPP-A-related patient-specific risk for PE isstrongly influenced by maternal variables and, third, thereis a significant association between serum PAPP-A andUtA-PI.
At 11 + 0 to 13 + 6 weeks of gestation serum PAPP-Awas below the 5th centile in about 10% of pregnanciesthat subsequently developed PE. There was a significant
0
5
10
15
20
25
30
35
40
45
80
Ris
k of
pre
-ecl
amps
ia (
%)
0.1 0.2 0.3 0.4 0.5 0.6 0.7 0.8 0.9 1.00
PAPP-A MoM
Figure 3 Relationship between maternal serum pregnancy-associated plasma protein-A (PAPP-A) multiples of the median(MoM) and risk for subsequent development of early-onsetpre-eclampsia in women with previous pre-eclampsia ( ),those with no previous pre-eclampsia ( ) and nulliparouswomen (- - - - ). The black lines are for black women and thethicker gray lines are for white women.
association between serum PAPP-A and the gestationalage at delivery of pregnancies with PE, with low levelsobserved in about 20% and 7% of those with early- andlate-onset disease, respectively.
Copyright 2008 ISUOG. Published by John Wiley & Sons, Ltd. Ultrasound Obstet Gynecol 2009; 33: 23–33.
30 Poon et al.
−1.0 −0.5 0 0.5
Log
UtA
-PI
MoM
−0.4
−0.2
0
0.2
0.4
Log PAPP-A MoMLog PAPP-A MoM
Log
UtA
-PI
MoM
−1.0 −0.5 0 0.5
−0.4
−0.2
0
0.2
0.4(a)
(b)
Figure 4 Relationship between log uterine artery pulsatility index (UtA-PI) multiples of the median (MoM) and log pregnancy-associatedplasma protein-A (PAPP-A) MoM in unaffected pregnancies (a) and in pregnancies developing pre-eclampsia (b). Regression lines are shown.
The increase in patient-specific risk for PE, at a givenlow serum PAPP-A level, is substantially higher for early-than late-onset disease. Thus, for a PAPP-A level of 0.05MoM in a black woman with a previous history of PEthe risk of early PE is increased from the populationaverage of about 0.5% to 80%, whereas the risk forlate-onset disease is only doubled from about 1.5% to3%. In deriving the PAPP-A-related patient-specific riskfor PE it is also important to take maternal variables intoaccount. Thus, for a PAPP-A level of 0.1 MoM the risk forearly PE is about 5% for a white nulliparous woman andthis is increased to 21% if she had a previous pregnancywith PE. The respective risks for a black woman areabout 23% and 56%. In these calculations we appliedthe formulae derived from the regression analysis withoutapplying any truncation limits that may become necessaryafter application into clinical practice.
Screening for PE based on a combination of maternalhistory and UtA-PI identified, for a 10% false-positiverate, about 80% and 40% of early- and late-onsetdisease, respectively. The finding that impaired placentalperfusion, reflected in increased UtA-PI, is associated withthe development of PE is compatible with the hypothesisthat PE is the consequence of impaired placentation, andthe results of previous first- and second-trimester Dopplerstudies as well as histological studies of the maternal spiralarteries10,17,19–22. Pathological studies have demonstratedthat the prevalence of placental lesions in women with PEis inversely related to the gestational age at delivery23,24.
A previous study of 401 uncomplicated pregnanciesand 14 that developed gestational hypertension, includingsix with PE, found no significant association betweenUtA-PI and PAPP-A in either group25. In our studyof more than 8000 pregnancies, including 156 that
Copyright 2008 ISUOG. Published by John Wiley & Sons, Ltd. Ultrasound Obstet Gynecol 2009; 33: 23–33.
Pregnancy-associated plasma protein-A and pre-eclampsia 31
developed PE, there was a significant association betweenserum PAPP-A and UtA-PI in both pregnancies thatdeveloped PE and in those that did not. There aretwo consequences from this finding. First, the detectionrate of PE in screening based on history and UtA-PIis not improved by including serum PAPP-A. Second,the PAPP-A-related patient-specific risk for PE can bemodified by the measurement of UtA-PI and the use of theappropriate multiple regression equation that combinesthe information from maternal variables, serum PAPP-Aand UtA-PI. Ideally, the algorithm should be incorporatedinto the fetal medicine software used for the calculationof patient-specific risks for chromosomal defects. In theabsence of such a computer-based algorithm, when thePAPP-A level is low, Table 2 can be used to estimate thepatient-specific risk for early PE. If the risk is consideredto be high the UtA-PI can be measured, and Tables 4and 5 can then be used to determine whether the risk hasbeen reduced to the overall average of 0.5%.
Low maternal serum PAPP-A at 11 + 0 to 13 + 6 weeksof gestation is associated with increased risk for trisomies21, 18 and 131. In chromosomally normal fetuses lowPAPP-A is a marker for subsequent development of PE andin particular early-onset disease. However, the sensitivityof screening for PE is poor. The PAPP-A-related patient-specific risk for PE is strongly influenced by maternalcharacteristics and previous history of PE. Additionally,there is a significant association between serum PAPP-Aand UtA-PI, and the PAPP-A-related patient-specific riskfor PE can be modified by the measurement of UtA-PI.
0 20 40 60 80 100
False-positive rate (%)
0
20
40
60
80
100
Det
ecti
on r
ate
(%)
Figure 5 Receiver–operating characteristics curves for detectionrates of early pre-eclampsia by screening based on maternalhistory ( ), history and uterine artery pulsatility index (UtA-PI)( . . . . . . ), and history, UtA-PI and pregnancy-associated plasmaprotein-A ( ).
ACKNOWLEDGMENT
This study was supported by a grant from The FetalMedicine Foundation (UK charity number 1037116).
Table 4 Values of uterine artery pulsatility index that would result in a risk of early pre-eclampsia of 0.5% at various levels of reducedpregnancy-associated plasma protein-A (PAPP-A) multiples of the median (MoM) in white pregnant women aged ≤ 30 years or > 30 years
NulliparousParous with no previous
pre-eclampsiaParous with previous
pre-eclampsia
CRL (mm): ≤ 65 > 65 ≤ 65 > 65 ≤ 65 > 65
BMI (kg/m2): ≤ 25 > 25 ≤ 25 > 25 ≤ 25 > 25 ≤ 25 > 25 ≤ 25 > 25 ≤ 25 > 25
0.05 MoM≤ 30 years 1.18 1.16 1.13 1.10 1.41 1.38 1.34 1.31 0.96 0.94 0.91 0.89> 30 years 1.16 1.14 1.11 1.08 1.39 1.35 1.32 1.29 0.94 0.92 0.90 0.88
0.10 MoM≤ 30 years 1.41 1.37 1.34 1.31 1.67 1.64 1.60 1.56 1.14 1.11 1.08 1.06> 30 years 1.38 1.35 1.32 1.29 1.65 1.61 1.57 1.53 1.12 1.09 1.07 1.04
0.15 MoM≤ 30 years 1.56 1.52 1.48 1.45 1.85 1.81 1.77 1.72 1.26 1.23 1.20 1.17> 30 years 1.53 1.50 1.46 1.43 1.82 1.78 1.74 1.70 1.24 1.21 1.18 1.15
0.20 MoM≤ 30 years 1.67 1.63 1.59 1.56 1.99 1.95 1.90 1.85 1.35 1.32 1.29 1.26> 30 years 1.65 1.61 1.57 1.53 1.96 1.91 1.87 1.82 1.33 1.30 1.27 1.24
0.30 MoM≤ 30 years 1.85 1.81 1.76 1.72 2.20 2.15 2.10 2.05 1.50 1.46 1.43 1.39> 30 years 1.82 1.78 1.74 1.70 2.17 2.12 2.07 2.02 1.48 1.44 1.41 1.37
0.40 MoM≤ 30 years 1.99 1.94 1.89 1.85 2.37 2.31 2.26 2.20 1.61 1.57 1.53 1.50> 30 years 1.96 1.91 1.86 1.82 2.33 2.28 2.22 2.17 1.59 1.55 1.51 1.48
0.50 MoM≤ 30 years 2.10 2.05 2.00 1.96 2.50 2.45 2.39 2.33 1.70 1.66 1.62 1.58> 30 years 2.07 2.02 1.97 1.93 2.46 2.41 2.35 2.29 1.68 1.64 1.60 1.56
BMI, body mass index; CRL crown–rump length.
Copyright 2008 ISUOG. Published by John Wiley & Sons, Ltd. Ultrasound Obstet Gynecol 2009; 33: 23–33.
32 Poon et al.
Table 5 Values of uterine artery pulsatility index that would result in a risk of early pre-eclampsia of 0.5% at various levels of reducedpregnancy-associated plasma protein-A (PAPP-A) multiples of the median (MoM) in black pregnant women aged ≤ 30 years or > 30 years
NulliparousParous with no previous
pre-eclampsiaParous with previous
pre-eclampsia
CRL (mm): ≤ 65 > 65 ≤ 65 > 65 ≤ 65 > 65
BMI (kg/m2): ≤ 25 > 25 ≤ 25 > 25 ≤ 25 > 25 ≤ 25 > 25 ≤ 25 > 25 ≤ 25 > 25
0.05 MoM≤ 30 years 0.92 0.90 0.87 0.85 1.09 1.07 1.04 1.02 0.74 0.73 0.71 0.69> 30 years 0.90 0.88 0.86 0.84 1.07 1.05 1.02 1.00 0.73 0.71 0.70 0.68
0.10 MoM≤ 30 years 1.09 1.07 1.04 1.02 1.30 1.27 1.24 1.21 0.88 0.86 0.84 0.82> 30 years 1.07 1.05 1.02 1.00 1.28 1.25 1.22 1.19 0.87 0.85 0.83 0.81
0.15 MoM≤ 30 years 1.21 1.18 1.15 1.12 1.44 1.40 1.37 1.34 0.98 0.95 0.93 0.91> 30 years 1.19 1.16 1.13 1.11 1.41 1.38 1.35 1.32 0.96 0.94 0.92 0.90
0.20 MoM≤ 30 years 1.30 1.27 1.24 1.21 1.54 1.51 1.47 1.44 1.05 1.03 1.00 0.98> 30 years 1.28 1.25 1.22 1.19 1.52 1.49 1.45 1.41 1.03 1.01 0.98 0.96
0.30 MoM≤ 30 years 1.44 1.40 1.37 1.34 1.71 1.67 1.63 1.59 1.16 1.14 1.11 1.08> 30 years 1.41 1.38 1.35 1.31 1.68 1.64 1.60 1.57 1.14 1.12 1.09 1.06
0.40 MoM≤ 30 years 1.54 1.51 1.47 1.44 1.84 1.79 1.75 1.71 1.25 1.22 1.19 1.16> 30 years 1.52 1.48 1.45 1.41 1.81 1.77 1.72 1.68 1.23 1.20 1.17 1.14
0.50 MoM≤ 30 years 1.63 1.59 1.55 1.52 1.94 1.90 1.85 1.81 1.32 1.29 1.26 1.23> 30 years 1.61 1.57 1.53 1.49 1.91 1.87 1.82 1.78 1.30 1.27 1.24 1.21
BMI, body mass index; CRL crown–rump length.
Table 6 Summary of studies of pregnancy-associated plasma protein-A (PAPP-A) in pre-eclampsia
Screening for pre-eclampsia
ReferenceTotal
number n (%)PAPP-A cut-offcentile (MoM)
Detection rate(%)
Odds ratio orrelative risk
Ong et al. 20003 5297 135 (2.6) 5th (−) 11.1 2.1Yaron et al. 20024 1622 27 (1.7) 15th (0.50) 22.2 1.7Smith et al. 20025 8839 331 (3.7) 5th (−) 10.6 2.3Dugoff et al. 20046 33 395 764 (2.3) 5th (0.42) 7.9 1.5Spencer et al. 20057 4390 64 (1.5) 5th (0.42) 14.1 2.8Pilalis et al. 20078 878 13 (1.5) 5th (0.41) 23.1 4.6Spencer et al. 20079 47 770 224 (0.5) 5th (0.42) 14.6 3.7Present study 8051 156 (1.9) 5th (0.38) 9.6 2.0
MoM, multiples of the median.
REFERENCES
1. Kagan KO, Wright D, Valencia C, Maiz N, Nicolaides KH.Screening for trisomies 21, 18 and 13 by maternal age, fetalNT, fetal heart rate, free β hCG and PAPP-A. Human Reprod2008; 23: 1968–1975.
2. Kagan KO, Wright D, Spencer K, Molina FS, Nicolaides KH.First-trimester maternal serum Free β-hCG and PAPP-A andtrisomy 21. Ultrasound Obstet Gynecol 2008; 31: 493–502.
3. Ong CYT, Liao AW, Spencer K, Munim S, Nicolaides KH. Firsttrimester maternal serum free β human chorionic gonadotrophinand pregnancy associated plasma protein A as predictors ofpregnancy complications. BJOG 2000; 107: 1265–1270.
4. Yaron Y, Heifetz S, Ochshorn Y, Lehavi O, Orr-Urtreger A.Decreased first trimester PAPP-A is a predictor of adversepregnancy outcome. Prenat Diagn 2002; 22: 778–782.
5. Smith GCS, Stenhouse EJ, Crossley JA, Aitken DA,Cameron AD, Connor JM. Early pregnancy levels of pregnancyassociated plasma protein A and the risk of intrauterine growthrestriction, premature birth, preeclampsia and stillbirth. J ClinEndocrinol Metab 2002; 87: 1762–1767.
6. Dugoff L, Hobbins JC, Malone FD, Porter TF, Luthy D, Com-stock CH, Hankins G, Berkowitz RL, Merkatz I, Craigo SD,Timor-Tritsch IE, Carr SR, Wolfe HM, Vidaver J, D’Alton ME.First trimester maternal serum PAPP-A and free beta sub-unit human chorionic gonadotropin concentrations and nuchaltranslucency are associated with obstetric complications: a pop-ulation based screening study (The FASTER Trial). Am J ObstetGynecol 2004; 191: 1446–1451.
7. Spencer K, Yu CKH, Cowans NJ, Otigbah C, Nicolaides KH.Prediction of pregnancy complications by first trimestermaternal serum PAPP-A and free β-hCG and with second
Copyright 2008 ISUOG. Published by John Wiley & Sons, Ltd. Ultrasound Obstet Gynecol 2009; 33: 23–33.

Pregnancy-associated plasma protein-A and pre-eclampsia 33
trimester uterine artery Doppler. Prenat Diagn 2005; 25:949–953.
8. Pilalis A, Souka AP, Antsaklis P, Daskalakis G, Papantoniou N,Mesogitis S, Antsaklis A. Screening for pre-eclampsia and fetalgrowth restriction by uterine artery Doppler and PAPP-A at11–14 weeks gestation. Ultrasound Obstet Gynecol 2007; 29:135–140.
9. Spencer K, Cowans NJ, Chefetz I, Tal J, Meiri H. First trimestermaternal serum PP-13, PAPP-A and second trimester uterineartery Doppler pulsatility index as markers of pre-eclampsia.Ultrasound Obstet Gynecol 2007; 29: 128–134.
10. Plasencia W, Maiz N, Bonino S, Kaihura C, Nicolaides KH.Uterine artery Doppler at 11 + 0 to 13 + 6 weeks in theprediction of pre-eclampsia. Ultrasound Obstet Gynecol 2007;30: 742–749.
11. von Dadelszen P, Magee LA, Roberts JM. Subclassification ofpre-eclampsia. Hypertens Pregnancy 2003; 22: 143–148.
12. Witlin GA, Saade GR, Mattar FM, Sibai BM. Predictors ofneonatal outcome in women with severe pre-eclampsia oreclampsia between 24 and 33 weeks’ gestation. Am J ObstetGynecol 1999; 1: S19.
13. Irgens HU, Reisaeter L, Irgens LM, Lie RT. Long term mortalityof mothers and fathers after pre-eclampsia: population basedcohort study. BMJ 2001; 323: 1213–1217.
14. Snijders RJM, Noble P, Sebire N, Souka A, Nicolaides KH.UK multicentre project on assessment of risk for trisomy21 by maternal age and fetal nuchal translucency thick-ness at 10–14 weeks of gestation. Lancet 1998; 18:519–521.
15. Spencer K, Spencer CE, Power M, Dawson C, Nicolaides KH.Screening for chromosomal abnormalities in the first trimesterusing ultrasound and maternal serum biochemistry in a onestop clinic: a review of three years prospective experience.BJOG 2003; 110: 281–286.
16. Nicolaides KH, Spencer K, Avgidou K, Faiola S, Falcon O.Multicenter study of first-trimester screening for trisomy21 in 75 821 pregnancies: results and estimation ofthe potential impact of individual risk-orientated two-stage
first-trimester screening. Ultrasound Obstet Gynecol 2005; 25:221–226.
17. Martin AM, Bindra R, Curcio P, Cicero S, Nicolaides KH.Screening for pre-eclampsia and fetal growth restriction byuterine artery Doppler at 11–14 weeks of gestation. UltrasoundObstet Gynecol 2001; 18: 583–586.
18. Davey DA, MacGillivray I. The classification and definition ofthe hypertensive disorders of pregnancy. Am J Obstet Gynecol1988; 158: 892–898.
19. Yu CKH, Smith GCS, Papageorghiou AT, Cacho AM, Nico-laides KH. An integrated model for the prediction of pre-eclampsia using maternal factors and uterine artery Dopplervelocimetry in unselected low risk women. Am J Obstet Gynecol2005; 193: 429–436.
20. Brosens I, Robertson WB, Dixon HG. The physiologicalresponse of the vessels of the placental bed to normal pregnancy.J Pathol Bacteriol 1967; 93: 569–579.
21. Khong TY, De Wolf F, Robertson WB, Brosens I. Inadequatematernal vascular response to placentation in pregnanciescomplicated by pre-eclampsia and by small-for-gestational ageinfants. Br J Obstet Gynaecol 1986; 93: 1049–1059.
22. Pijnenborg R, Anthony J, Davey DA, Rees A, Tiltman A, Ver-cruysse L, van Assche A. Placental bed spiral arteries in thehypertensive disorders of pregnancy. Br J Obstet Gynaecol1991; 98: 648–655.
23. Moldenhauer JS, Stanek J, Warshak C, Khoury J, Sibai B. Thefrequency and severity of placental findings in women with pre-eclampsia are gestational age dependent. Am J Obstet Gynecol2003; 189: 1173–1177.
24. Sebire NJ, Goldin RD, Regan L. Term pre-eclampsia is associ-ated with minimal histopathological placental features regard-less of clinical severity. J Obstet Gynaecol 2005; 25:117–118.
25. Prefumo F, Canini S, Casagrande V, Pastorino D, Venturini PL,De Biasio P. Correlation between first trimester uterine arteryDoppler indices and maternal serum free β-human chorionicgonadotropin and pregnancy associated plasma protein A. FertilSteril 2006; 86: 977–980.
Copyright 2008 ISUOG. Published by John Wiley & Sons, Ltd. Ultrasound Obstet Gynecol 2009; 33: 23–33.