Semiparametric second-order reduced-bias high quantile estimation
Upload
khangminh22Category
view
1download
0
Energies 2010, 3, 2001-2026; doi:10.3390/en3122001OPEN ACCESS
energiesISSN 1996-1073
www.mdpi.com/journal/energies
Article
First-Order Estimation of In-Place Gas Resources at the NyeggaGas Hydrate Prospect, Norwegian SeaKim Senger 1,2,?, Stefan Bünz 1 and Jürgen Mienert 1
1 Department of Geology, University of Tromsø, Dramsveien 201, N-9037 Tromsø, Norway;E-Mails: [email protected] (S.B.); [email protected] (J.M.)
2 Center for Integrated Petroleum Research, Uni Research, Allégaten 41, N-5020 Bergen, Norway
? Author to whom correspondence should be addressed; E-Mail: [email protected];Tel.: +47-95291592; Fax: +47-55588265.
Received: 26 October 2010; in revised form: 7 December 2010 / Accepted: 20 December 2010 /Published: 22 December 2010
Abstract: Gas hydrates have lately received increased attention as a potential future energysource, which is not surprising given their global and widespread occurrence. This articlepresents an integrated study of the Nyegga site offshore mid-Norway, where a gas hydrateprospect is defined on the basis of a multitude of geophysical models and one shallowgeotechnical borehole. This prospect appears to hold around 625 GSm3 (GSm3 = 109
standard cubic metres) of gas. The uncertainty related to the input parameters is dealt withthrough a stochastic calculation, giving a spread of in-place volumes of 183 GSm3 (P90) to1431 GSm3 (P10). The resource density for Nyegga is found to be comparable to publishedresource assessments of other global hydrate provinces.
Keywords: methane hydrate; energy resource; mid-Norwegian margin; prospect evaluation;unconventional gas resource
1. Introduction: Gas Hydrate as an Energy Resource
Gas hydrates are solid compounds of guest gas molecules set in a rigid cage of host water molecules,occurring at specific pressure-temperature (P-T) conditions beneath the world’s oceans and below thepermafrost [1,2].
Energies 2010, 3 2002
Originally a mere scientific curiosity, gas hydrates have attracted much attention since being reportedin hydrocarbon pipelines as early as 1934 [3]. Flow assurance remains a problem in the global oil and gasindustry to the present day [4,5], with deep-water production and ever longer tie-back distances callingfor sophisticated hydrate flow management. Furthermore, gas hydrate dissociation in sediments alongcontinental margins has been linked to potential for large-scale slope failures [6], reduced integrity ofman-made seafloor structures due to hydrate-associated slope instability [7] and atmospheric release ofmethane linking into the wider issue of climate change [8–10].
However, in the past decade gas hydrates are also increasingly considered as a potential energy source.The global energy market is in disharmony, with falling oil production unable to supply the increasingglobal demand in the long term [11], financial crisis notwithstanding. Production of natural gas is alreadyreplacing oil as the dominant hydrocarbon produced in regions close to infrastructure and markets, as onthe Norwegian Continental Shelf (NCS). Natural gas, with its lower per unit energy CO2 emissions thanany other fossil fuel, is set to provide a large part of the supply necessary to satisfy a predicted 50–60%global energy demand increase in the period 2008–2030 [12]. Unconventional gas resources, such astight sands, shale gas or coal bed methane, may ease some of the load off conventional gas resources,provided that their production remains environmentally, technically and commercially acceptable. Inaddition, gas hydrates can also be considered as an unconventional gas resource [13].
The production of gas hydrates has, to date, utilized slightly modified conventional oil & gasproduction technologies. For the guest gas to be produced, the solid ice cage must be broken downby displacing the hydrate out of its P-T stability zone. This is achieved by depressurisation, thermalstimulation or chemical inhibition, or a combination thereof. Both numerical studies, includingthe use of hydrate-specific reservoir simulators [14–16], and field experience from the Siberian gasfield Messoyakha [5,17,18], the North Slope Borough [19] and the Mallik test site [20,21], point todepressurization being the most cost-effective and efficient method. In this scenario, the free gas zonetrapped beneath the impermeable hydrate layer is produced, lowering the pressure, and thus allowing theoverlying hydrate to dissociate and contribute to the gas flow. However, every prospect is different andthe applied production strategy will, as for conventional gas deposits, depend on the geological settingand the hydrate reservoir properties [22].
Gas hydrates are a global and abundant resource. Recent conservative estimates of globalhydrate-bound methane, while significantly reduced from the enormous estimates publishedin the 1980s and 1990s [23], suggest hydrate-derived methane to be an important carbonreservoir [1,2]. While most of these resources occur in low-saturation marine sediments, as illustratedby the resource pyramid of Boswell et al. [24], the potential societal gain of hydrates cannot be ignored.A recent review of the Alaskan gas hydrate resources, as an example, indicates up to 2 400 GSm3
(GSm3 = 109 standard cubic metres; 85 trillion cubic feet; equivalent to 15 095 million barrels of oilequivalents) of technically recoverable gas [25]. Furthermore, production of gas from some hydratedeposits is possible with only minor modifications of conventional technologies [26]. Most importantly,it has already been tested during short-term scientific production tests at Mallik, a multinational studysite in the Canadian Mackenzie Delta [20,21,27,28]. Extensive marine expeditions undertaken as part ofambitious national “hydrate as a resource” programs offshore India [29], Japan [30] and Korea [31], aswell as a Joint Industry Project in the Gulf of Mexico [32,33] and numerous ODP/IODP cruises [34,35],
Energies 2010, 3 2003
provide a substantial database for examining various global hydrate provinces in terms of reservoircharacterization and prospect definition.
Here we present such a study for the Nyegga prospect, a gas hydrate prospect located in predominantlyunlicensed acreage on the northern flank of the Storegga slide, offshore mid-Norway.
2. Geologic Setting: The Nyegga Gas Hydrate System
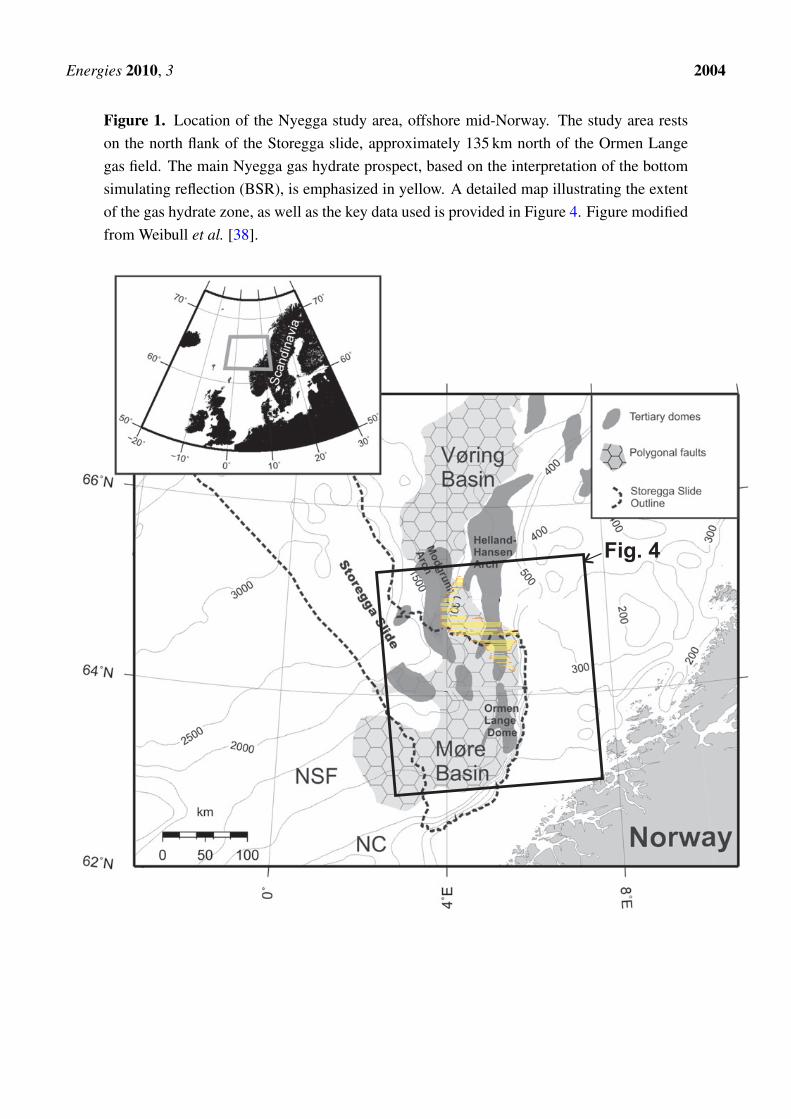
Our study area, referred to as Nyegga in literature, lies on the Vøring Plateau some 135 km north ofOrmen Lange, Norway’s second largest gas field (Figure 1). The nearest conventional field, Kristin,is located approximately 80 km to the north-east. Lying alongside the prolific gas province of theNorwegian Sea is important for several reasons. Firstly, deep thermogenic gas may contribute as a localsource to some of the hydrate deposits, as observed in parts of the Gulf of Mexico [36]. Secondly,the existing infrastructure suits itself to cost-effective tie-back solutions should hydrate deposits bedeveloped in the future. Last but not least, the amount of data available for the study of hydrates, inpart thanks to the thorough work that went into the Ormen Lange development [37], makes a goodfoundation for a quantification study.
The Nyegga area has been shaped by a combination of lasting tectonically-driven processes and morerecent glacial activity. Multiple rifting episodes resulted in the opening of the Norwegian-GreenlandSea around 55 million years ago, leading to the development of the Møre and Vøring sedimentarybasins [39,40]. The Late Eocene strike-slip compressive regime resulted in the development ofnorth-south trending anticlinal features [41], of which the Ormen Lange dome is one. Within the last3 million years, extensive deposition of glacially derived materials of the Naust Formation dominatedthe area, resulting in a sediment package well over 1000 m thick in places [42]. Its depositional regime ishighly dependent on the climatic variations associated with glacial and interglacial times and the positionof the ice sheet in relation to the shelf break [43].
The study area lies within the Norwegian-Greenland Sea, in which oceanic circulation is governedby the northward-flowing waters of the North Atlantic Current (NAC). Studies of benthic microfossilassemblages during ODP Leg 104 have confirmed that the modern-day oceanic conveyor systemwas established already during the mid-Miocene [44]. The NAC, essentially the continuation ofthe North Atlantic Drift, transports warm saline waters into the Nordic Seas. Upon entering theNorwegian-Greenland Sea through the Faroe-Shetland inflow, the NAC is partially branched as thesouth-easterly flowing Norwegian Channel Inflow. In addition, the Norwegian Coastal Current(3–18 ◦C, Klitgaard-Kristensen et al. [45]) flows along the Norwegian coast, being strongly controlledby seasonal variation. A large publicly available data set [46] allows the examination of 1070Conductivity-Temperature-Depth (CTD) casts within the study area. The data clearly show the largestvariation within the uppermost 200 m of the water column. At depths exceeding approximately 750 m,temperatures are stable at approximately −1 ◦C. Between ~250 m and ~750 m there is a large variationin oceanic temperatures of up to 8 ◦C.
Energies 2010, 3 2004
Figure 1. Location of the Nyegga study area, offshore mid-Norway. The study area restson the north flank of the Storegga slide, approximately 135 km north of the Ormen Langegas field. The main Nyegga gas hydrate prospect, based on the interpretation of the bottomsimulating reflection (BSR), is emphasized in yellow. A detailed map illustrating the extentof the gas hydrate zone, as well as the key data used is provided in Figure 4. Figure modifiedfrom Weibull et al. [38].
Fig. 4
Energies 2010, 3 2005
Gas hydrates have originally been inferred from the Nyegga area on the basis of bottom-simulatingreflections (BSRs) [47–49] as well as seabed topography and biology [50,51]. Physical sampling ofshallow gas hydrates was first reported in 2006 [52], though the Nyegga gas hydrates have long beenstudied “geophysically” [53–55]. It is notable that a shallow geotechnical borehole, 6404/5 GB1,penetrated the BSR during a drilling campaign in 1997. While the vertical seismic profiling (VSP)suggest the presence of hydrates, no physical samples were recovered at this time, probably due to alack in suitable pressure-coring equipment. While gas hydrate saturations have been estimated in placesthrough the use of various inversions of ocean bottom seismic (OBS) and high-resolution 3D seismicdata [56–58], no one has, to the best of our knowledge, previously attempted to calculate the total amountof methane encaged within the Nyegga gas hydrate province.
Quantifying gas hydrate deposits, at Nyegga or otherwise, is important for three main reasons:
1. Modeling potential release of the potent greenhouse gas methane into the ocean following a shiftin P-T conditions;
2. Risk assessment for conventional exploration boreholes targeting hydrocarbons beneath zones ofnotoriously unstable gas hydrate;
3. Providing an estimate of the scale and potential of the hydrate deposit as a future energy resource.
This study focuses on Point 3, yet the methods and results presented could easily be modified to suitother objectives. It must be noted that this study’s objective was to define a range of probable in-place(GIIP) volumes, and further work remains on evaluating whether the hydrate deposits can technicallybe recovered.
3. Methods
3.1. Modeling the Hydrate Stability Zone
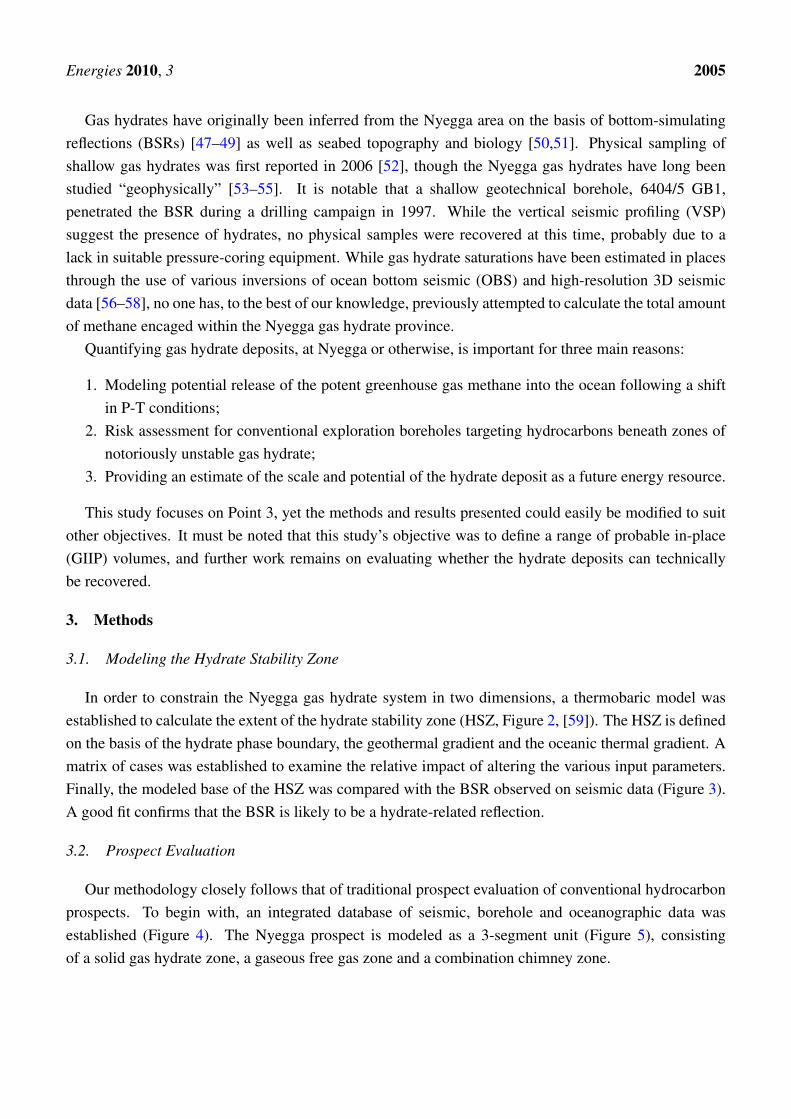
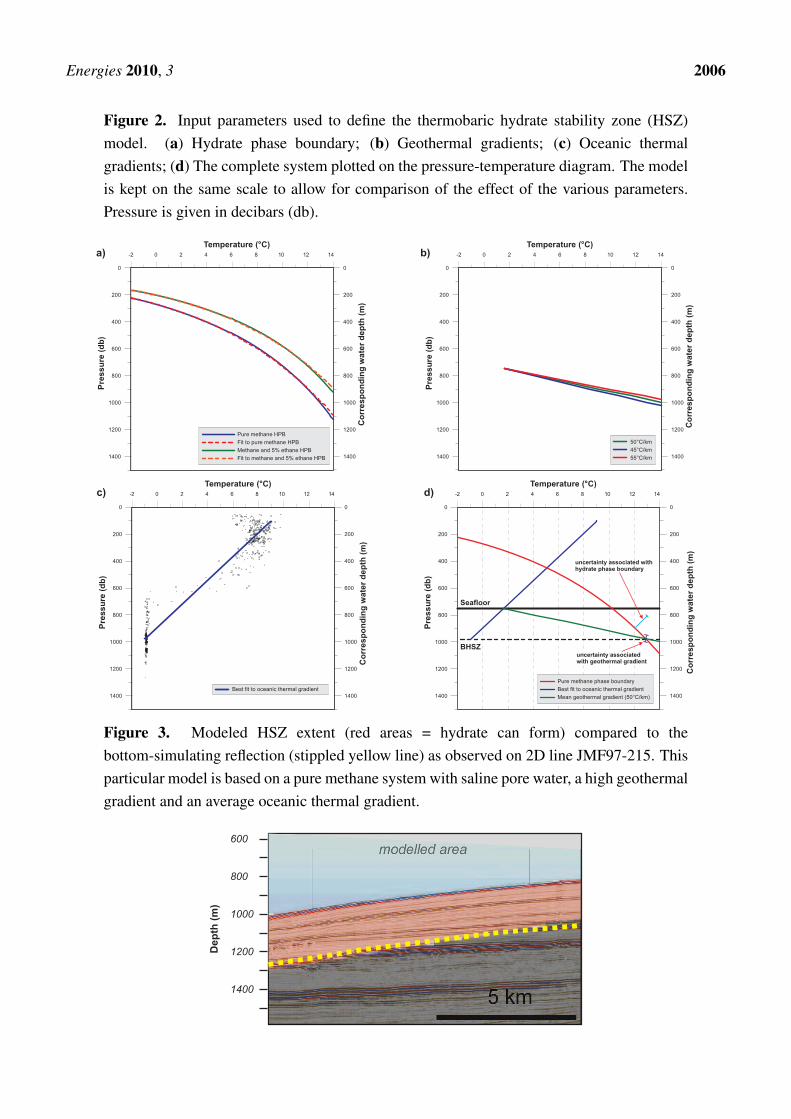
In order to constrain the Nyegga gas hydrate system in two dimensions, a thermobaric model wasestablished to calculate the extent of the hydrate stability zone (HSZ, Figure 2, [59]). The HSZ is definedon the basis of the hydrate phase boundary, the geothermal gradient and the oceanic thermal gradient. Amatrix of cases was established to examine the relative impact of altering the various input parameters.Finally, the modeled base of the HSZ was compared with the BSR observed on seismic data (Figure 3).A good fit confirms that the BSR is likely to be a hydrate-related reflection.
3.2. Prospect Evaluation
Our methodology closely follows that of traditional prospect evaluation of conventional hydrocarbonprospects. To begin with, an integrated database of seismic, borehole and oceanographic data wasestablished (Figure 4). The Nyegga prospect is modeled as a 3-segment unit (Figure 5), consistingof a solid gas hydrate zone, a gaseous free gas zone and a combination chimney zone.
Energies 2010, 3 2006
Figure 2. Input parameters used to define the thermobaric hydrate stability zone (HSZ)model. (a) Hydrate phase boundary; (b) Geothermal gradients; (c) Oceanic thermalgradients; (d) The complete system plotted on the pressure-temperature diagram. The modelis kept on the same scale to allow for comparison of the effect of the various parameters.Pressure is given in decibars (db).
-2 0 2 4 6 8 10 12 14
Temperature (°C)
1400
1200
1000
800
600
400
200
0
Pre
ss
ure
(db
)
1400
1200
1000
800
600
400
200
0
Co
rre
sp
on
din
gw
ate
rd
ep
th(m
)Pure methane phase boundary
Best fit to oceanic thermal gradient
Mean geothermal gradient (50°C/km)
Seafloor
BHSZ
-2 0 2 4 6 8 10 12 14
Temperature (°C)
1400
1200
1000
800
600
400
200
0
Pre
ss
ure
(db
)
1400
1200
1000
800
600
400
200
0
Co
rre
sp
on
din
gw
ate
rd
ep
th(m
)
Best fit to oceanic thermal gradient
-2 0 2 4 6 8 10 12 14
1400
1200
1000
800
600
400
200
0
Pre
ss
ure
(db
)
1400
1200
1000
800
600
400
200
0
Co
rre
sp
on
din
gw
ate
rd
ep
th(m
)
50°C/km
45°C/km
55°C/km
a) b)
c) d)
-2 0 2 4 6 8 10 12 14
Temperature (°C)
1400
1200
1000
800
600
400
200
0
Pre
ss
ure
(db
)
1400
1200
1000
800
600
400
200
0
Co
rre
sp
on
din
gw
ate
rd
ep
th(m
)
Pure methane HPB
Fit to pure methane HPB
Methane and 5% ethane HPB
Fit to methane and 5% ethane HPB
uncertainty associatedwith geothermal gradient
uncertainty associated withhydrate phase boundary
Temperature (°C)
Figure 3. Modeled HSZ extent (red areas = hydrate can form) compared to thebottom-simulating reflection (stippled yellow line) as observed on 2D line JMF97-215. Thisparticular model is based on a pure methane system with saline pore water, a high geothermalgradient and an average oceanic thermal gradient.
5 km
1000
600
Dep
th(m
)
800
1200
1400
modelled area
5 km
1000
600
Dep
th(m
)
800
1200
1400
modelled area
5 km
1000
600
Dep
th(m
)
800
1200
1400
modelled area
5 km
1000
600
Dep
th(m
)
800
1200
1400
modelled area
5 km
1000
600
Dep
th(m
)
800
1200
1400
modelled area
5 km
1000
600
Dep
th(m
)
800
1200
1400
modelled area
Aa2
Ab2
Ac2
Ba2
Bb2
Bc2
Energies 2010, 3 2007
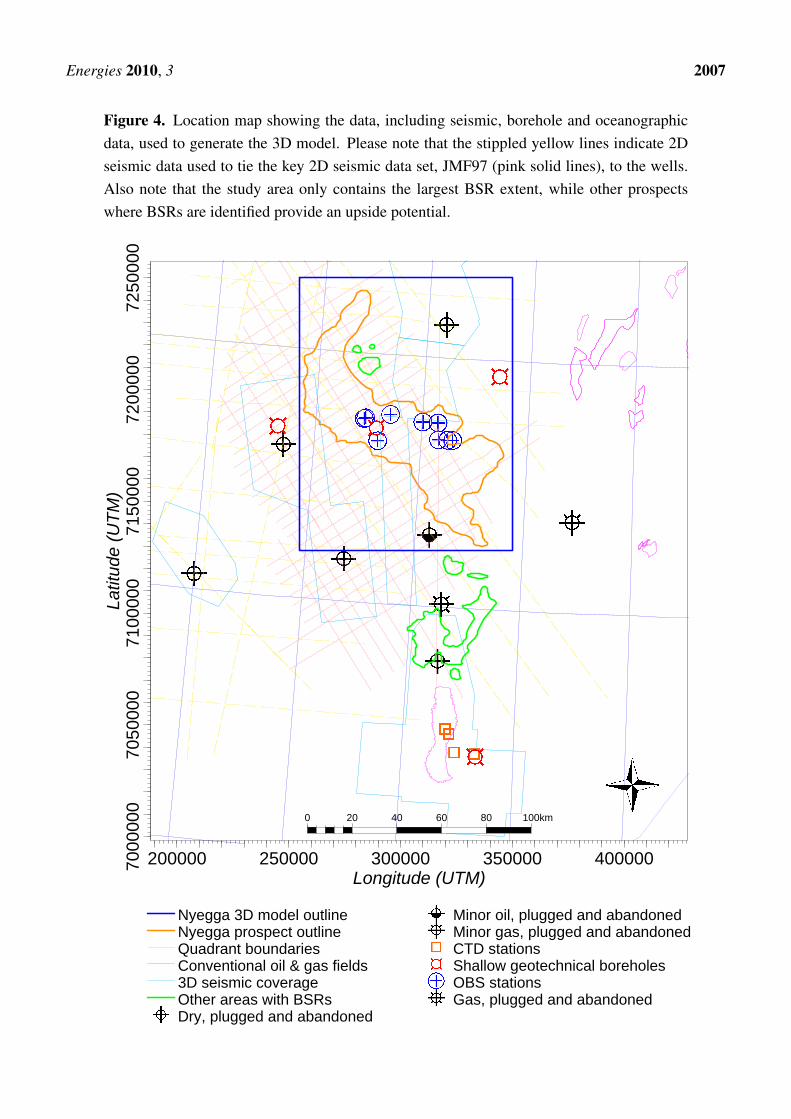
Figure 4. Location map showing the data, including seismic, borehole and oceanographicdata, used to generate the 3D model. Please note that the stippled yellow lines indicate 2Dseismic data used to tie the key 2D seismic data set, JMF97 (pink solid lines), to the wells.Also note that the study area only contains the largest BSR extent, while other prospectswhere BSRs are identified provide an upside potential.
200000 250000 300000 350000 400000Longitude (UTM)
7000
000
7050
000
7100
000
7150
000
7200
000
7250
000
Latit
ude
(UTM
)
0 20 40 60 80 100km
Nyegga 3D model outlineNyegga prospect outlineQuadrant boundariesConventional oil & gas fields3D seismic coverageOther areas with BSRsDry, plugged and abandoned
Minor oil, plugged and abandonedMinor gas, plugged and abandonedCTD stations Shallow geotechnical boreholesOBS stationsGas, plugged and abandoned
Energies 2010, 3 2008
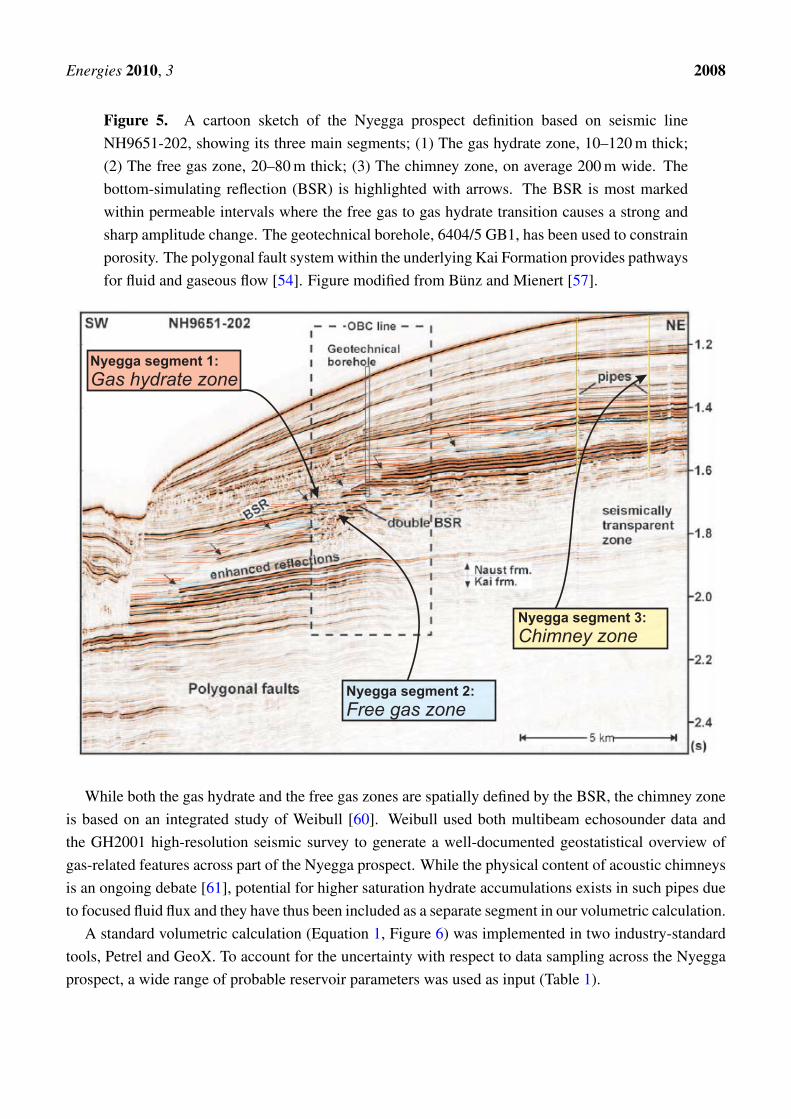
Figure 5. A cartoon sketch of the Nyegga prospect definition based on seismic lineNH9651-202, showing its three main segments; (1) The gas hydrate zone, 10–120 m thick;(2) The free gas zone, 20–80 m thick; (3) The chimney zone, on average 200 m wide. Thebottom-simulating reflection (BSR) is highlighted with arrows. The BSR is most markedwithin permeable intervals where the free gas to gas hydrate transition causes a strong andsharp amplitude change. The geotechnical borehole, 6404/5 GB1, has been used to constrainporosity. The polygonal fault system within the underlying Kai Formation provides pathwaysfor fluid and gaseous flow [54]. Figure modified from Bünz and Mienert [57].
Nyegga segment 2:
Free gas zone
Nyegga segment 3:
Chimney zone
Nyegga segment 1:
Gas hydrate zone
While both the gas hydrate and the free gas zones are spatially defined by the BSR, the chimney zoneis based on an integrated study of Weibull [60]. Weibull used both multibeam echosounder data andthe GH2001 high-resolution seismic survey to generate a well-documented geostatistical overview ofgas-related features across part of the Nyegga prospect. While the physical content of acoustic chimneysis an ongoing debate [61], potential for higher saturation hydrate accumulations exists in such pipes dueto focused fluid flux and they have thus been included as a separate segment in our volumetric calculation.
A standard volumetric calculation (Equation 1, Figure 6) was implemented in two industry-standardtools, Petrel and GeoX. To account for the uncertainty with respect to data sampling across the Nyeggaprospect, a wide range of probable reservoir parameters was used as input (Table 1).
Energies 2010, 3 2009
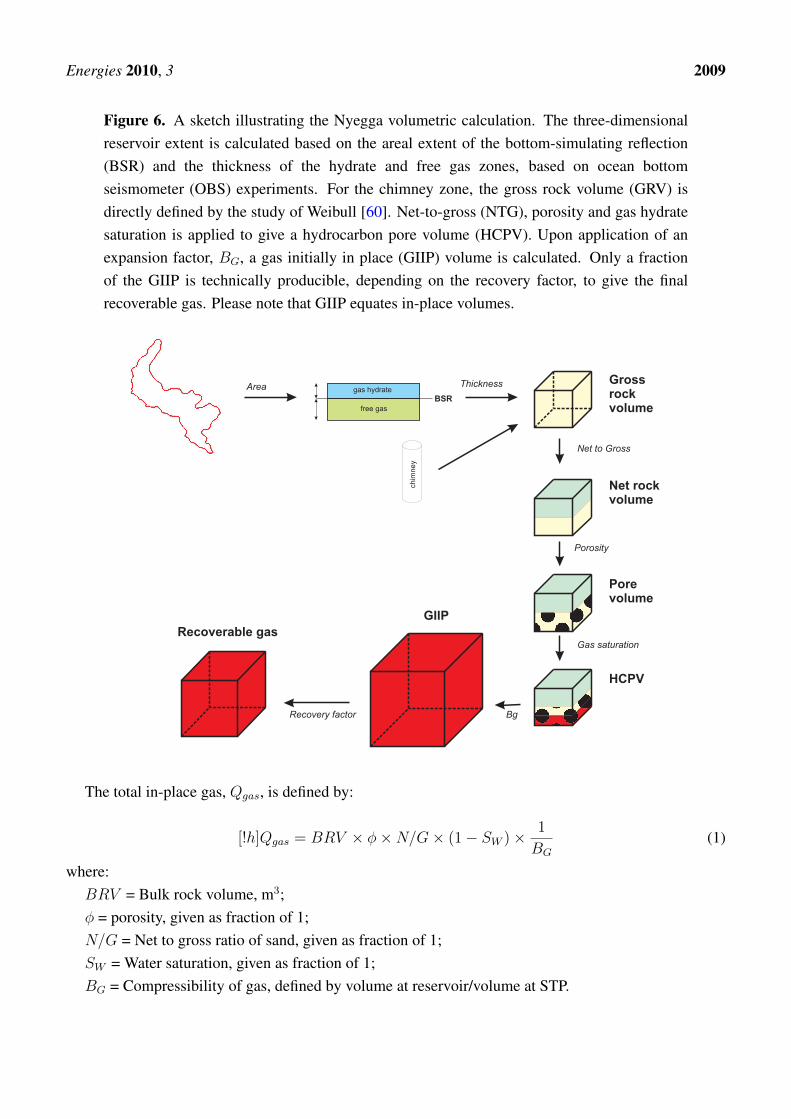
Figure 6. A sketch illustrating the Nyegga volumetric calculation. The three-dimensionalreservoir extent is calculated based on the areal extent of the bottom-simulating reflection(BSR) and the thickness of the hydrate and free gas zones, based on ocean bottomseismometer (OBS) experiments. For the chimney zone, the gross rock volume (GRV) isdirectly defined by the study of Weibull [60]. Net-to-gross (NTG), porosity and gas hydratesaturation is applied to give a hydrocarbon pore volume (HCPV). Upon application of anexpansion factor, BG, a gas initially in place (GIIP) volume is calculated. Only a fractionof the GIIP is technically producible, depending on the recovery factor, to give the finalrecoverable gas. Please note that GIIP equates in-place volumes.
BSRgas hydrate
free gaschim
ney
Grossrockvolume
Porevolume
HCPV
GIIP
Recoverable gas
Net rockvolume
Area
Net to Gross
Thickness
Porosity
Gas saturation
BgRecovery factor
The total in-place gas, Qgas, is defined by:
[!h]Qgas = BRV × φ×N/G× (1− SW )× 1
BG
(1)
where:BRV = Bulk rock volume, m3;φ = porosity, given as fraction of 1;N/G = Net to gross ratio of sand, given as fraction of 1;SW = Water saturation, given as fraction of 1;BG = Compressibility of gas, defined by volume at reservoir/volume at STP.
Energies 2010, 3 2010
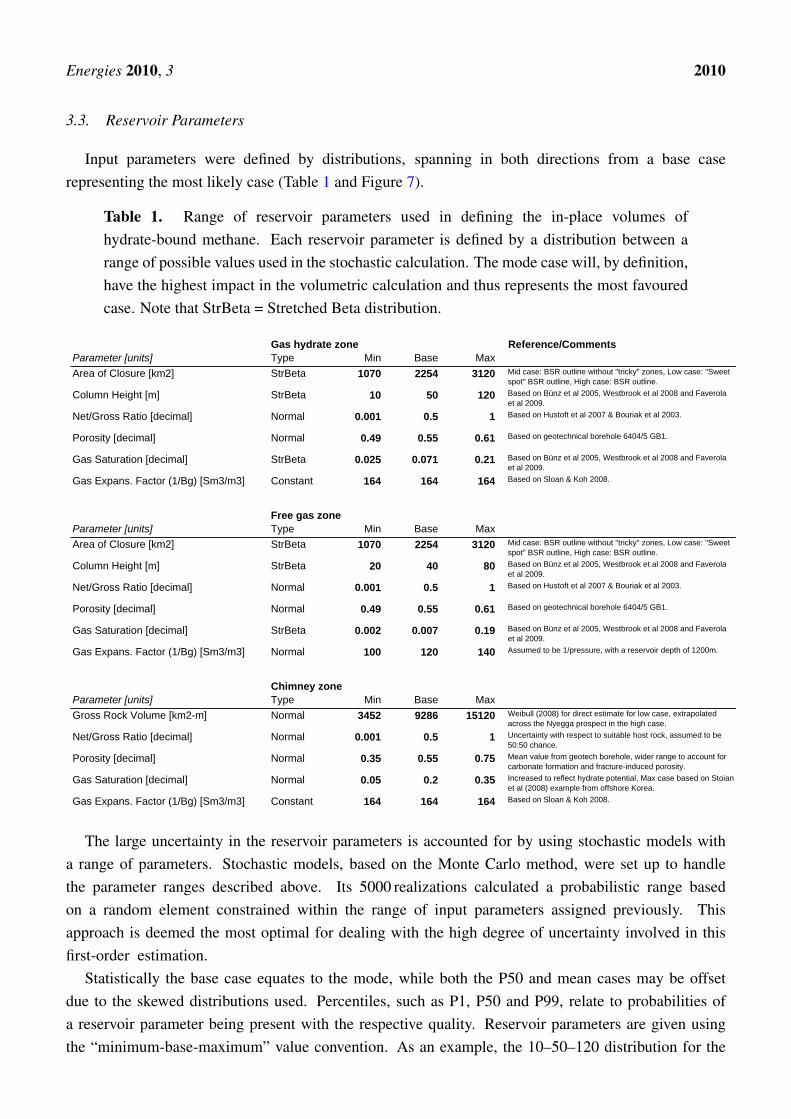
3.3. Reservoir Parameters
Input parameters were defined by distributions, spanning in both directions from a base caserepresenting the most likely case (Table 1 and Figure 7).
Table 1. Range of reservoir parameters used in defining the in-place volumes ofhydrate-bound methane. Each reservoir parameter is defined by a distribution between arange of possible values used in the stochastic calculation. The mode case will, by definition,have the highest impact in the volumetric calculation and thus represents the most favouredcase. Note that StrBeta = Stretched Beta distribution.
Gas hydrate zone Reference/CommentsParameter [units] Type Min Base MaxArea of Closure [km2] StrBeta 1070 2254 3120 Mid case: BSR outline without "tricky" zones, Low case: "Sweet
spot" BSR outline, High case: BSR outline.
Column Height [m] StrBeta 10 50 120 Based on Bünz et al 2005, Westbrook et al 2008 and Faverola et al 2009.
Net/Gross Ratio [decimal] Normal 0.001 0.5 1 Based on Hustoft et al 2007 & Bouriak et al 2003.
Porosity [decimal] Normal 0.49 0.55 0.61 Based on geotechnical borehole 6404/5 GB1.
Gas Saturation [decimal] StrBeta 0.025 0.071 0.21 Based on Bünz et al 2005, Westbrook et al 2008 and Faverola et al 2009.
Gas Expans. Factor (1/Bg) [Sm3/m3] Constant 164 164 164 Based on Sloan & Koh 2008.
Free gas zoneParameter [units] Type Min Base MaxArea of Closure [km2] StrBeta 1070 2254 3120 Mid case: BSR outline without "tricky" zones, Low case: "Sweet
spot" BSR outline, High case: BSR outline.
Column Height [m] StrBeta 20 40 80 Based on Bünz et al 2005, Westbrook et al 2008 and Faverola et al 2009.
Net/Gross Ratio [decimal] Normal 0.001 0.5 1 Based on Hustoft et al 2007 & Bouriak et al 2003.
Porosity [decimal] Normal 0.49 0.55 0.61 Based on geotechnical borehole 6404/5 GB1.
Gas Saturation [decimal] StrBeta 0.002 0.007 0.19 Based on Bünz et al 2005, Westbrook et al 2008 and Faverola et al 2009.
Gas Expans. Factor (1/Bg) [Sm3/m3] Normal 100 120 140 Assumed to be 1/pressure, with a reservoir depth of 1200m.
Chimney zoneParameter [units] Type Min Base MaxGross Rock Volume [km2-m] Normal 3452 9286 15120 Weibull (2008) for direct estimate for low case, extrapolated
across the Nyegga prospect in the high case.
Net/Gross Ratio [decimal] Normal 0.001 0.5 1 Uncertainty with respect to suitable host rock, assumed to be 50:50 chance.
Porosity [decimal] Normal 0.35 0.55 0.75 Mean value from geotech borehole, wider range to account for carbonate formation and fracture-induced porosity.
Gas Saturation [decimal] Normal 0.05 0.2 0.35 Increased to reflect hydrate potential. Max case based on Stoian et al (2008) example from offshore Korea.
Gas Expans. Factor (1/Bg) [Sm3/m3] Constant 164 164 164 Based on Sloan & Koh 2008.
The large uncertainty in the reservoir parameters is accounted for by using stochastic models witha range of parameters. Stochastic models, based on the Monte Carlo method, were set up to handlethe parameter ranges described above. Its 5000 realizations calculated a probabilistic range basedon a random element constrained within the range of input parameters assigned previously. Thisapproach is deemed the most optimal for dealing with the high degree of uncertainty involved in thisfirst-order estimation.
Statistically the base case equates to the mode, while both the P50 and mean cases may be offsetdue to the skewed distributions used. Percentiles, such as P1, P50 and P99, relate to probabilities ofa reservoir parameter being present with the respective quality. Reservoir parameters are given usingthe “minimum-base-maximum” value convention. As an example, the 10–50–120 distribution for the
Energies 2010, 3 2011
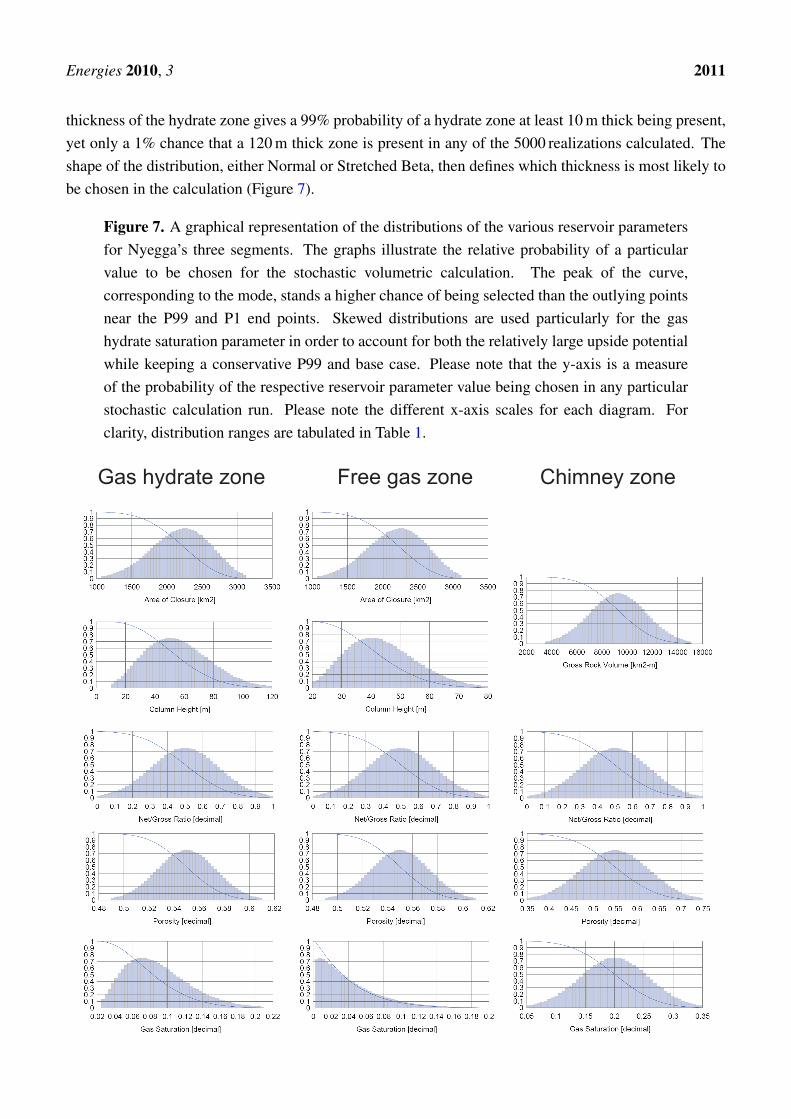
thickness of the hydrate zone gives a 99% probability of a hydrate zone at least 10 m thick being present,yet only a 1% chance that a 120 m thick zone is present in any of the 5000 realizations calculated. Theshape of the distribution, either Normal or Stretched Beta, then defines which thickness is most likely tobe chosen in the calculation (Figure 7).
Figure 7. A graphical representation of the distributions of the various reservoir parametersfor Nyegga’s three segments. The graphs illustrate the relative probability of a particularvalue to be chosen for the stochastic volumetric calculation. The peak of the curve,corresponding to the mode, stands a higher chance of being selected than the outlying pointsnear the P99 and P1 end points. Skewed distributions are used particularly for the gashydrate saturation parameter in order to account for both the relatively large upside potentialwhile keeping a conservative P99 and base case. Please note that the y-axis is a measureof the probability of the respective reservoir parameter value being chosen in any particularstochastic calculation run. Please note the different x-axis scales for each diagram. Forclarity, distribution ranges are tabulated in Table 1.
Gas hydrate zone Free gas zone Chimney zone
Energies 2010, 3 2012
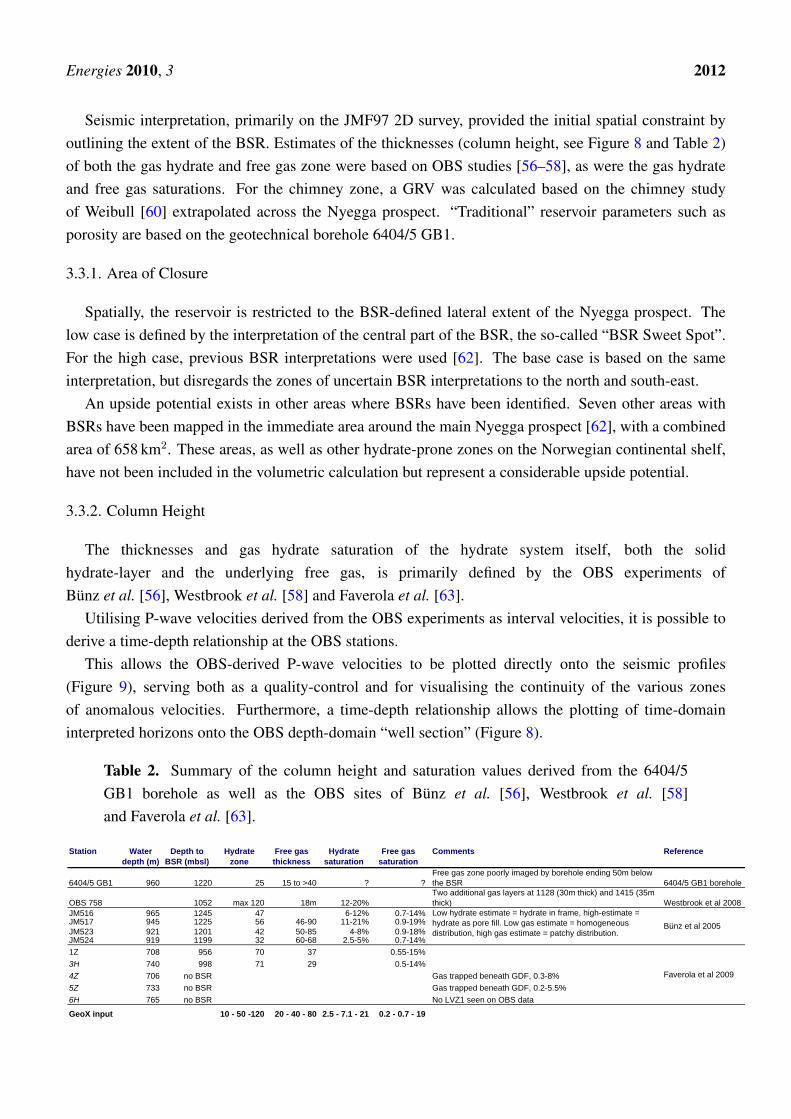
Seismic interpretation, primarily on the JMF97 2D survey, provided the initial spatial constraint byoutlining the extent of the BSR. Estimates of the thicknesses (column height, see Figure 8 and Table 2)of both the gas hydrate and free gas zone were based on OBS studies [56–58], as were the gas hydrateand free gas saturations. For the chimney zone, a GRV was calculated based on the chimney studyof Weibull [60] extrapolated across the Nyegga prospect. “Traditional” reservoir parameters such asporosity are based on the geotechnical borehole 6404/5 GB1.
3.3.1. Area of Closure
Spatially, the reservoir is restricted to the BSR-defined lateral extent of the Nyegga prospect. Thelow case is defined by the interpretation of the central part of the BSR, the so-called “BSR Sweet Spot”.For the high case, previous BSR interpretations were used [62]. The base case is based on the sameinterpretation, but disregards the zones of uncertain BSR interpretations to the north and south-east.
An upside potential exists in other areas where BSRs have been identified. Seven other areas withBSRs have been mapped in the immediate area around the main Nyegga prospect [62], with a combinedarea of 658 km2. These areas, as well as other hydrate-prone zones on the Norwegian continental shelf,have not been included in the volumetric calculation but represent a considerable upside potential.
3.3.2. Column Height
The thicknesses and gas hydrate saturation of the hydrate system itself, both the solidhydrate-layer and the underlying free gas, is primarily defined by the OBS experiments ofBünz et al. [56], Westbrook et al. [58] and Faverola et al. [63].
Utilising P-wave velocities derived from the OBS experiments as interval velocities, it is possible toderive a time-depth relationship at the OBS stations.
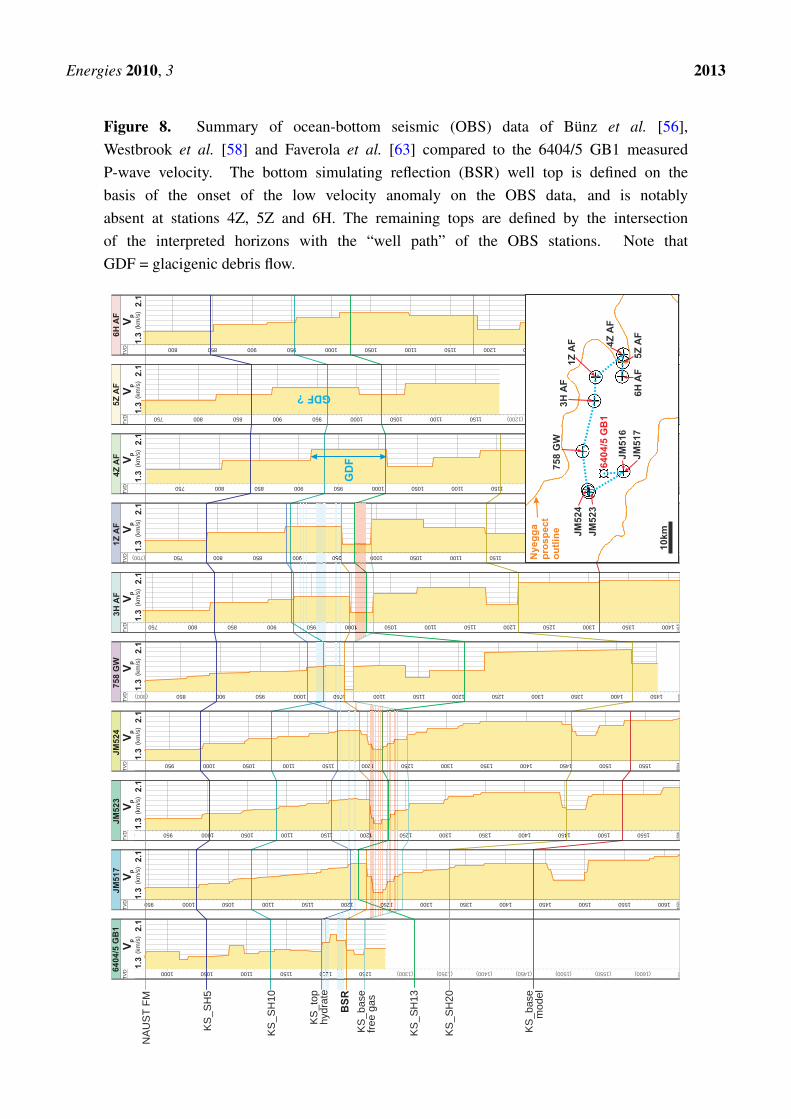
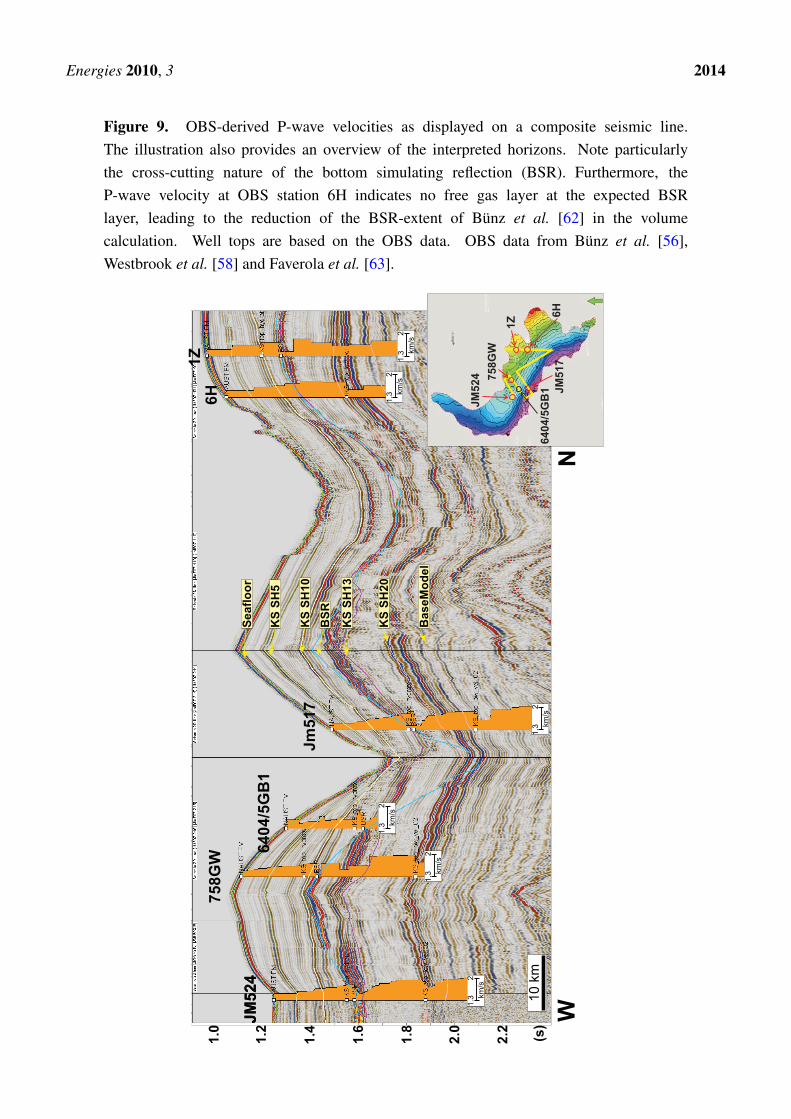
This allows the OBS-derived P-wave velocities to be plotted directly onto the seismic profiles(Figure 9), serving both as a quality-control and for visualising the continuity of the various zonesof anomalous velocities. Furthermore, a time-depth relationship allows the plotting of time-domaininterpreted horizons onto the OBS depth-domain “well section” (Figure 8).
Table 2. Summary of the column height and saturation values derived from the 6404/5GB1 borehole as well as the OBS sites of Bünz et al. [56], Westbrook et al. [58]and Faverola et al. [63].
Station Water depth (m)
Depth to BSR (mbsl)
Hydrate zone
Free gas thickness
Hydrate saturation
Free gas saturation
Comments Reference
6404/5 GB1 960 1220 25 15 to >40 ? ?Free gas zone poorly imaged by borehole ending 50m below the BSR 6404/5 GB1 borehole
OBS 758 1052 max 120 18m 12-20%Two additional gas layers at 1128 (30m thick) and 1415 (35m thick) Westbrook et al 2008
JM516 965 1245 47 6-12% 0.7-14%JM517 945 1225 56 46-90 11-21% 0.9-19%JM523 921 1201 42 50-85 4-8% 0.9-18%JM524 919 1199 32 60-68 2.5-5% 0.7-14%1Z 708 956 70 37 0.55-15%3H 740 998 71 29 0.5-14%4Z 706 no BSR Gas trapped beneath GDF, 0.3-8%5Z 733 no BSR Gas trapped beneath GDF, 0.2-5.5%6H 765 no BSR No LVZ1 seen on OBS data
GeoX input 10 - 50 -120 20 - 40 - 80 2.5 - 7.1 - 21 0.2 - 0.7 - 19
Low hydrate estimate = hydrate in frame, high-estimate = hydrate as pore fill. Low gas estimate = homogeneous distribution, high gas estimate = patchy distribution.
Faverola et al 2009
Bünz et al 2005
Energies 2010, 3 2013
Figure 8. Summary of ocean-bottom seismic (OBS) data of Bünz et al. [56],Westbrook et al. [58] and Faverola et al. [63] compared to the 6404/5 GB1 measuredP-wave velocity. The bottom simulating reflection (BSR) well top is defined on thebasis of the onset of the low velocity anomaly on the OBS data, and is notablyabsent at stations 4Z, 5Z and 6H. The remaining tops are defined by the intersectionof the interpreted horizons with the “well path” of the OBS stations. Note thatGDF = glacigenic debris flow.
NA
US
TF
M
KS
_S
H5
KS
_S
H1
0
KS
_to
p
BS
R
(950) 1000 1050 1100 1150 1200 1250 (1300) (1350) (1400) (1450) (1500) (1550) (1600)
(16
47
)
TV
D64
04
/5G
B1
950 1000 1050 1100 1150 1200 1250 1300 1350 1400 1450 1500 1550 1600
1620
TV
D
JM
51
7
(900) 950 1000 1050 1100 1150 1200 1250 1300 1350 1400 1450 1500 1550
1596
TV
D
JM
52
3
950 1000 1050 1100 1150 1200 1250 1300 1350 1400 1450 1500 1550
1594
TV
D
JM
52
4
(800) 850 900 950 1000 1050 1100 1150 1200 1250 1300 1350 1400 1450
(14
79
)
TV
D
75
8G
W
750 800 850 900 950 1000 1050 1100 1150 1200 1250 1300 1350 1400
1415
TV
D
3H
AF
(700) 750 800 850 900 950 1000 1050 1100 1150 1200 1250 1300 1350
(13
83
)
TV
D
1Z
AF
750 800 850 900 950 1000 1050 1100 1150 1200 1250 1300 1350
(13
81
)
TV
D
4Z
AF
750 800 850 900 950 1000 1050 1100 1150 (1200) (1250) (1300) (1350)
(14
08
)
TV
D
5Z
AF
800 850 900 950 1000 1050 1100 1150 1200 1250 1300 (1350) (1400)
(14
40
)
TV
D
6H
AF
KS
_S
H13
KS
_S
H20
1.3
Vp
(km
/s)
2.1
1.3
Vp
(km
/s)
2.1
1.3
Vp
(km
/s)
2.1
1.3
Vp
(km
/s)
2.1
1.3
Vp
(km
/s)
2.1
1.3
Vp
(km
/s)
2.1
1.3
Vp
(km
/s)
2.1
1.3
Vp
(km
/s)
2.1
1.3
Vp
(km
/s)
2.1
1.3
Vp
(km
/s)
2.1
GD
F
JM
51
6
JM
51
7
JM
52
3
JM
52
4
75
8G
W3
HA
F1
ZA
F 4Z
AF
5Z
AF
6H
AF
10
km
6404/5
GB
1
GDF?
Nyeg
ga
pro
sp
ect
ou
tlin
e
hydra
te
KS
_base
free
gas
KS
_base
mo
de
l
Energies 2010, 3 2014
Figure 9. OBS-derived P-wave velocities as displayed on a composite seismic line.The illustration also provides an overview of the interpreted horizons. Note particularlythe cross-cutting nature of the bottom simulating reflection (BSR). Furthermore, theP-wave velocity at OBS station 6H indicates no free gas layer at the expected BSRlayer, leading to the reduction of the BSR-extent of Bünz et al. [62] in the volumecalculation. Well tops are based on the OBS data. OBS data from Bünz et al. [56],Westbrook et al. [58] and Faverola et al. [63].
21
.3
km
/s
21
.3
km
/s
21
.3
km
/s
21
.3
km
/s
21
.3
km
/s
21
.3
km
/s
JM
52
4
75
8G
W
64
04
/5G
B1
JM
52
4
6H
1Z
Jm
51
7
NW
1.0
1.2
1.4
1.6
1.8
2.0
2.2 (s)
10
km
Seafl
oo
r
KS
SH
5
KS
SH
10
BaseM
od
el
KS
SH
13
KS
SH
20
BS
R
1Z
6H
JM
517
6404/5
GB
1
JM
524 758G
W
Energies 2010, 3 2015
3.3.3. Porosity
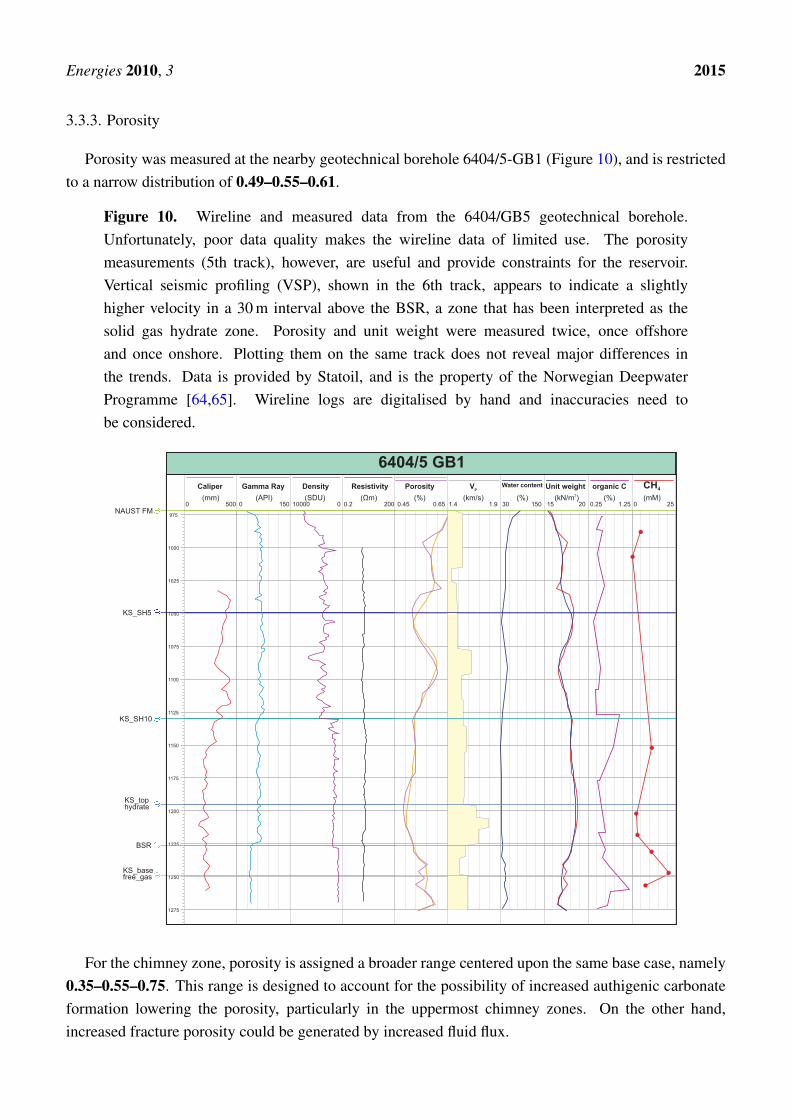
Porosity was measured at the nearby geotechnical borehole 6404/5-GB1 (Figure 10), and is restrictedto a narrow distribution of 0.49–0.55–0.61.
Figure 10. Wireline and measured data from the 6404/GB5 geotechnical borehole.Unfortunately, poor data quality makes the wireline data of limited use. The porositymeasurements (5th track), however, are useful and provide constraints for the reservoir.Vertical seismic profiling (VSP), shown in the 6th track, appears to indicate a slightlyhigher velocity in a 30 m interval above the BSR, a zone that has been interpreted as thesolid gas hydrate zone. Porosity and unit weight were measured twice, once offshoreand once onshore. Plotting them on the same track does not reveal major differences inthe trends. Data is provided by Statoil, and is the property of the Norwegian DeepwaterProgramme [64,65]. Wireline logs are digitalised by hand and inaccuracies need tobe considered.
NAUST FM
KS_SH5
KS_SH10
BSR
975
1000
1025
1050
1075
1100
1125
1150
1175
1200
1225
1250
1275
CH4
6404/5 GB1
0 25(mM)
KS_tophydrate
KS_basefree_gas
organic C
(%)0.25 1.2515 20
(kN/m )3
Unit weightWater content
(%)30 150
Vp
(km/s)1.4 1.9
Porosity
(%)0.45 0.650.2 200
ResistivityDensityGamma RayCaliper
( )Ωm( )SDU10000 0
( )API0 150
(mm)0 500
For the chimney zone, porosity is assigned a broader range centered upon the same base case, namely0.35–0.55–0.75. This range is designed to account for the possibility of increased authigenic carbonateformation lowering the porosity, particularly in the uppermost chimney zones. On the other hand,increased fracture porosity could be generated by increased fluid flux.
Energies 2010, 3 2016
3.3.4. Net to Gross
Hustoft et al. [55] illustrate a series of porous and permeable zones suitable for hydrate formation. Aquick estimate suggest that this “reservoir” accounts for approximately 50% of the area of interest. Awide NTG range of 0–1 is thus used to account for the large uncertainty due to limited ground truth.
3.3.5. Gas Expansion Factor
Gas compressibility is defined by the relative amount of hydrate-bound gas compared to the same gasat standard P-T conditions. The base case assumes full cage occupancy, with 164 units of methane heldwithin one unit of hydrate [2]. A constant value of 164 is thus used for the gas hydrate zone.
For the free gas zone, compressibility is assumed to be 1/pressure. Given that the prospect lies onlya few hundred meters beneath the seafloor at approximately 1200 m depth, and assuming hydrostaticpressure, a gas expansion factor range of 100–120–140 was used.
3.3.6. Gas Hydrate Saturation
3.3.6.1. Hydrate and Free Gas Zone
As summarized by Table 2, both the gas hydrate saturation and the free gas saturation atthe Nyegga prospect are low, on the order of 1–2% of the pore space. This is similarto other Class 4 hydrate reservoirs, as the <1% saturation reported from the Cascadia marginby Milkov et al. [66]. At Cascadia, Riedel et al. [35] outline four essentially independent methodsfor estimating the hydrate saturation, yet still come up with a large uncertainty of <5% to >25% of gashydrate saturation. Similar saturations have been obtained through a multi-channel seismic analysis atthe Korean Ulleung Basin, where Stoian [67] calculated a 1–4% gas hydrate saturation.
Even for well studied hydrate deposits where ground truth is available, gas hydrate saturations varywidely. As an example, Ruppel et al. [32] outline Gulf of Mexico gas hydrate saturations of 1.5–6%,1–12% and >20% depending on which method for calculation is used [68–70].
At the Nyegga prospect, depending on the model of hydrate formation used, a heterogeneous gashydrate saturation of up to 10–20% was calculated by Bünz et al. [56]. Gas hydrate saturation of up to12% were predicted using a frame-only model, while gas hydrate saturation of up to 20% were predictedfor the frame-and-pore model [58].
With this uncertainty in mind, a broad yet conservative gas hydrate saturation range from 0.025 (P99)to 0.071 (mode) to 0.21 (P1) for the hydrate zone was used. A free gas saturation from 0.002 (P99) to0.007 (mode) to 0.19 (P1) is assigned for the free gas zone.
High values of 0.21 and 0.18 are deemed to represent possible “sweet spots” where high and focusedfluid flux forms higher saturation hydrate deposits.
3.3.6.2. Chimney Structures
Chimney structures are expected to contain higher saturations of gas hydrates than the hydrate zone,due to the focused fluid flux thought to form them. Chimney structures typically lie below complex
Energies 2010, 3 2017
pockmarks [38]. Furthermore, such complex pockmarks are the only locations where solid gas hydrateshave been inferred at shallow depth [51] and subsequently sampled with gravity corers [52,71]. Thepockmark-chimney interaction is further outlined by Hustoft et al. [72].
It follows that the Nyegga chimney structures have been assigned a more optimistic hydrate saturationrange of 0.05–0.2–0.35. To account for the uncertainty in whether the chimneys actually contain hydrate,as raised by Paull et al. [61], cases were calculated without the chimney component. The chimney zonehydrate is thus considered an upside of the Nyegga prospect.
4. Results
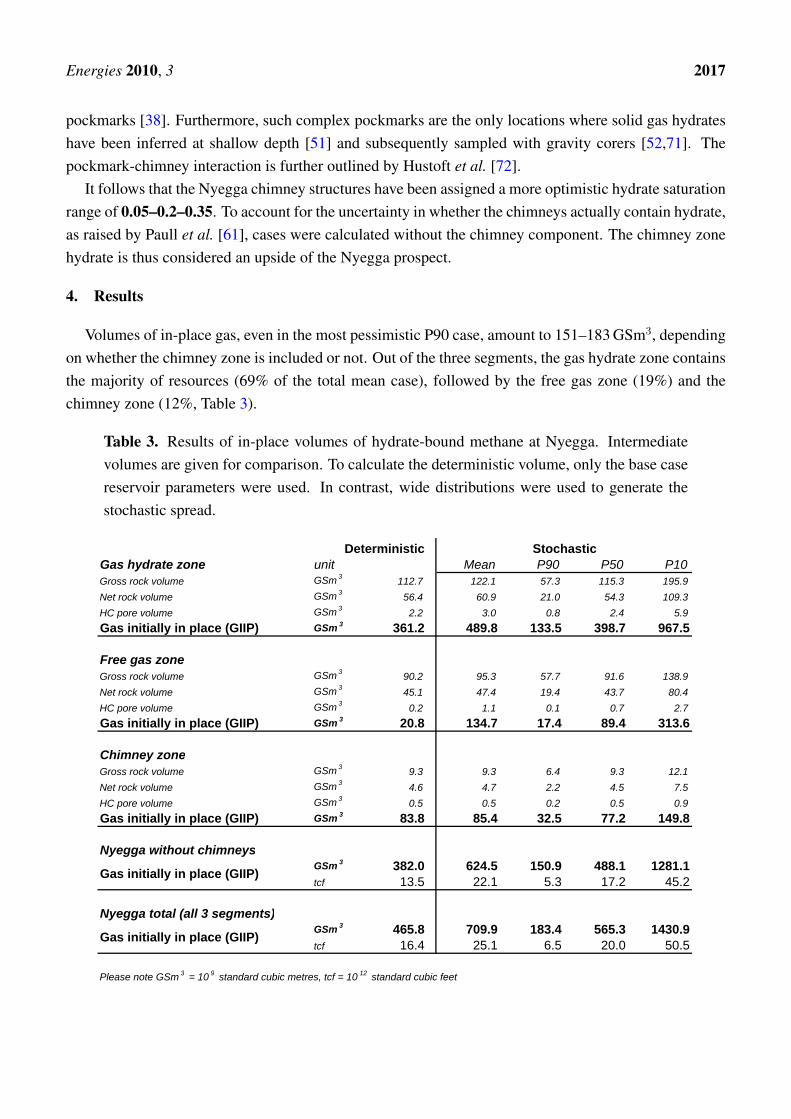
Volumes of in-place gas, even in the most pessimistic P90 case, amount to 151–183 GSm3, dependingon whether the chimney zone is included or not. Out of the three segments, the gas hydrate zone containsthe majority of resources (69% of the total mean case), followed by the free gas zone (19%) and thechimney zone (12%, Table 3).
Table 3. Results of in-place volumes of hydrate-bound methane at Nyegga. Intermediatevolumes are given for comparison. To calculate the deterministic volume, only the base casereservoir parameters were used. In contrast, wide distributions were used to generate thestochastic spread.
DeterministicGas hydrate zone unit Mean P90 P50 P10Gross rock volume GSm 3
112.7 122.1 57.3 115.3 195.9
Net rock volume GSm 356.4 60.9 21.0 54.3 109.3
HC pore volume GSm 32.2 3.0 0.8 2.4 5.9
Gas initially in place (GIIP) GSm 3 361.2 489.8 133.5 398.7 967.5
Free gas zoneGross rock volume GSm 3
90.2 95.3 57.7 91.6 138.9
Net rock volume GSm 345.1 47.4 19.4 43.7 80.4
HC pore volume GSm 30.2 1.1 0.1 0.7 2.7
Gas initially in place (GIIP) GSm 3 20.8 134.7 17.4 89.4 313.6
Chimney zoneGross rock volume GSm 3
9.3 9.3 6.4 9.3 12.1
Net rock volume GSm 34.6 4.7 2.2 4.5 7.5
HC pore volume GSm 30.5 0.5 0.2 0.5 0.9
Gas initially in place (GIIP) GSm 3 83.8 85.4 32.5 77.2 149.8
Nyegga without chimneysGSm 3 382.0 624.5 150.9 488.1 1281.1tcf 13.5 22.1 5.3 17.2 45.2
Nyegga total (all 3 segments)GSm 3 465.8 709.9 183.4 565.3 1430.9tcf 16.4 25.1 6.5 20.0 50.5
Please note GSm 3 = 10 9 standard cubic metres, tcf = 10 12 standard cubic feet
Gas initially in place (GIIP)
Gas initially in place (GIIP)
Stochastic
Energies 2010, 3 2018
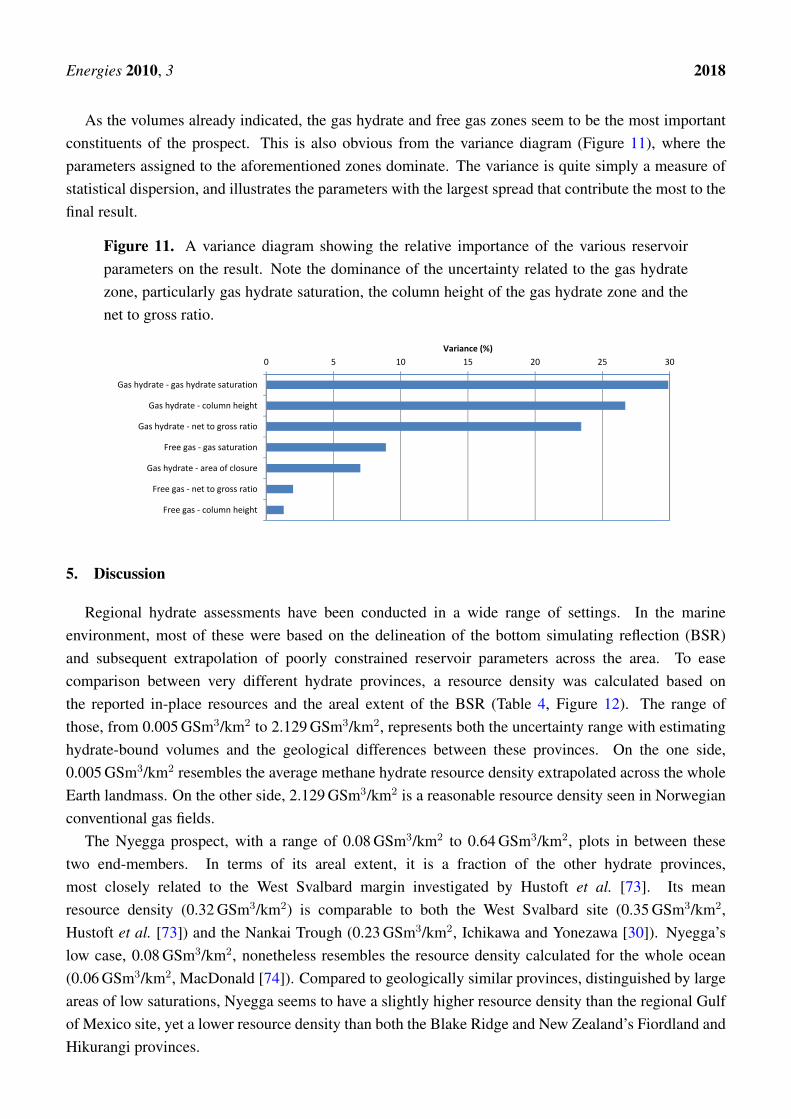
As the volumes already indicated, the gas hydrate and free gas zones seem to be the most importantconstituents of the prospect. This is also obvious from the variance diagram (Figure 11), where theparameters assigned to the aforementioned zones dominate. The variance is quite simply a measure ofstatistical dispersion, and illustrates the parameters with the largest spread that contribute the most to thefinal result.
Figure 11. A variance diagram showing the relative importance of the various reservoirparameters on the result. Note the dominance of the uncertainty related to the gas hydratezone, particularly gas hydrate saturation, the column height of the gas hydrate zone and thenet to gross ratio.
0 5 10 15 20 25 30
Gas hydrate ‐ gas hydrate saturation
Gas hydrate ‐ column height
Gas hydrate ‐ net to gross ratio
Free gas ‐ gas saturation
Gas hydrate ‐ area of closure
Free gas ‐ net to gross ratio
Free gas ‐ column height
Variance (%)
5. Discussion
Regional hydrate assessments have been conducted in a wide range of settings. In the marineenvironment, most of these were based on the delineation of the bottom simulating reflection (BSR)and subsequent extrapolation of poorly constrained reservoir parameters across the area. To easecomparison between very different hydrate provinces, a resource density was calculated based onthe reported in-place resources and the areal extent of the BSR (Table 4, Figure 12). The range ofthose, from 0.005 GSm3/km2 to 2.129 GSm3/km2, represents both the uncertainty range with estimatinghydrate-bound volumes and the geological differences between these provinces. On the one side,0.005 GSm3/km2 resembles the average methane hydrate resource density extrapolated across the wholeEarth landmass. On the other side, 2.129 GSm3/km2 is a reasonable resource density seen in Norwegianconventional gas fields.
The Nyegga prospect, with a range of 0.08 GSm3/km2 to 0.64 GSm3/km2, plots in between thesetwo end-members. In terms of its areal extent, it is a fraction of the other hydrate provinces,most closely related to the West Svalbard margin investigated by Hustoft et al. [73]. Its meanresource density (0.32 GSm3/km2) is comparable to both the West Svalbard site (0.35 GSm3/km2,Hustoft et al. [73]) and the Nankai Trough (0.23 GSm3/km2, Ichikawa and Yonezawa [30]). Nyegga’slow case, 0.08 GSm3/km2, nonetheless resembles the resource density calculated for the whole ocean(0.06 GSm3/km2, MacDonald [74]). Compared to geologically similar provinces, distinguished by largeareas of low saturations, Nyegga seems to have a slightly higher resource density than the regional Gulfof Mexico site, yet a lower resource density than both the Blake Ridge and New Zealand’s Fiordland andHikurangi provinces.
Energies 2010, 3 2019
Comparing the recent investigations of the marine Gulf of Mexico (1.33 GSm3/km2 in the meancase) system by the Minerals Management Service [33] to the assessment of the Alaskan North Slope(0.02 GSm3/km2 in the mean case) by the USGS [25] highlights the general difference of the permafrostdeposits compared to the marine provinces. Nonetheless, production tests are being undertaken onpermafrost hydrate, where easier logistics and a well developed infrastructure make such projectseconomically feasible. The relatively low resource density at the Alaskan North Slope permafrostprovince, highlights the inadequacy of using the resource density as the sole indicator of futuredevelopment. While the overall resource density appears to be low on the Alaskan North Slope, itssweet-spot deposits, onshore location and proximity to conventional petroleum infrastructure is likely tomake the North Slope an early candidate for commercial production.
In absolute value, the GIIP numbers of approximately 625 to 715 GSm3, depending on whether thechimney segment is included, are higher than the originally in-place resource of the conventional OrmenLange gas field (439 GSm3 NPD [75]). However, when compared to the area it covers the Nyeggaprospect has a considerably lower in-place resource density (0.32 GSm3/km2, Table 4) compared to themega-field Troll (3.4 GSm3/km2), the high-pressure, high-temperature field Kristin (1.24 GSm3/km2)and Ormen Lange (1.3 GSm3/km2, NPD [76]). The only discovery on the Norwegian continental shelfwith a comparable energy per unit area density is Peon, whose 35 GSm3 in-place resources are spreadover 80 km2 (0.44 GSm3/km2) [76,77].
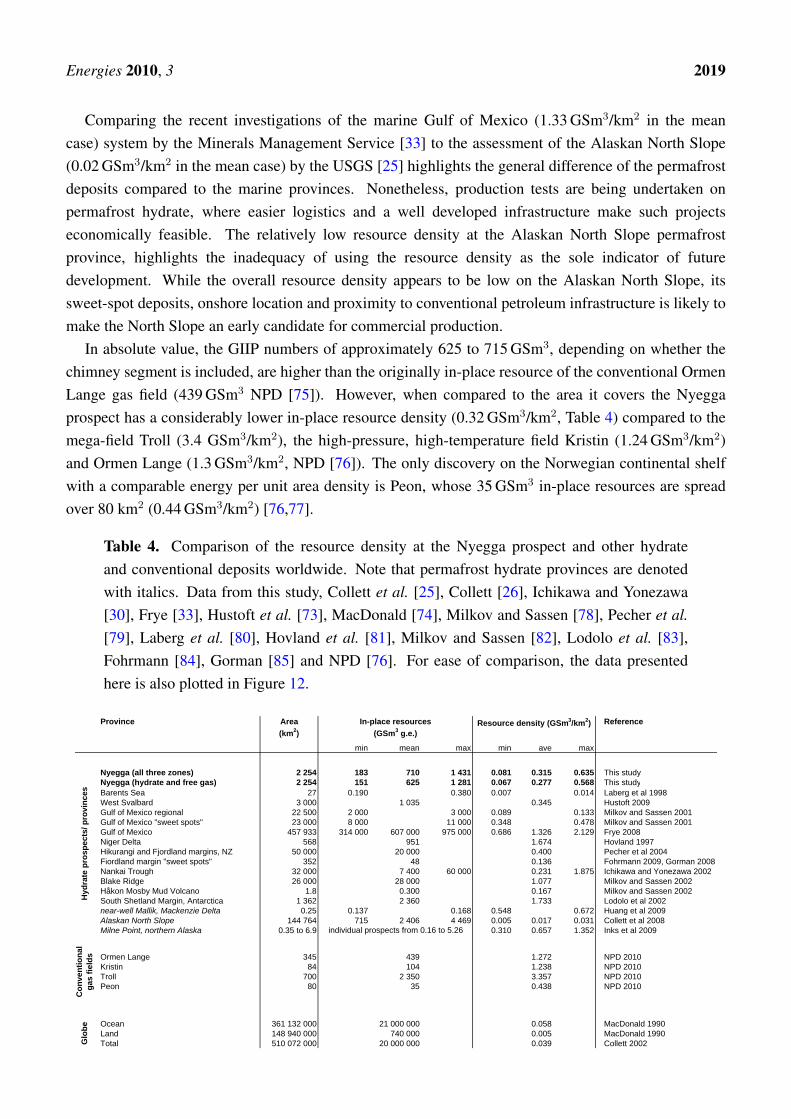
Table 4. Comparison of the resource density at the Nyegga prospect and other hydrateand conventional deposits worldwide. Note that permafrost hydrate provinces are denotedwith italics. Data from this study, Collett et al. [25], Collett [26], Ichikawa and Yonezawa[30], Frye [33], Hustoft et al. [73], MacDonald [74], Milkov and Sassen [78], Pecher et al.[79], Laberg et al. [80], Hovland et al. [81], Milkov and Sassen [82], Lodolo et al. [83],Fohrmann [84], Gorman [85] and NPD [76]. For ease of comparison, the data presentedhere is also plotted in Figure 12.
Province Area (km2)
Reference
min mean max min ave max
Nyegga (all three zones) 2 254 183 710 1 431 0.081 0.315 0.635 This studyNyegga (hydrate and free gas) 2 254 151 625 1 281 0.067 0.277 0.568 This studyBarents Sea 27 0.190 0.380 0.007 0.014 Laberg et al 1998West Svalbard 3 000 1 035 0.345 Hustoft 2009Gulf of Mexico regional 22 500 2 000 3 000 0.089 0.133 Milkov and Sassen 2001Gulf of Mexico "sweet spots" 23 000 8 000 11 000 0.348 0.478 Milkov and Sassen 2001Gulf of Mexico 457 933 314 000 607 000 975 000 0.686 1.326 2.129 Frye 2008Niger Delta 568 951 1.674 Hovland 1997Hikurangi and Fjordland margins, NZ 50 000 20 000 0.400 Pecher et al 2004Fiordland margin "sweet spots" 352 48 0.136 Fohrmann 2009, Gorman 2008Nankai Trough 32 000 7 400 60 000 0.231 1.875 Ichikawa and Yonezawa 2002Blake Ridge 26 000 28 000 1.077 Milkov and Sassen 2002Håkon Mosby Mud Volcano 1.8 0.300 0.167 Milkov and Sassen 2002South Shetland Margin, Antarctica 1 362 2 360 1.733 Lodolo et al 2002near-well Mallik, Mackenzie Delta 0.25 0.137 0.168 0.548 0.672 Huang et al 2009Alaskan North Slope 144 764 715 2 406 4 469 0.005 0.017 0.031 Collett et al 2008Milne Point, northern Alaska 0.35 to 6.9 0.310 0.657 1.352 Inks et al 2009
Ormen Lange 345 439 1.272 NPD 2010Kristin 84 104 1.238 NPD 2010Troll 700 2 350 3.357 NPD 2010Peon 80 35 0.438 NPD 2010
Ocean 361 132 000 21 000 000 0.058 MacDonald 1990Land 148 940 000 740 000 0.005 MacDonald 1990Total 510 072 000 20 000 000 0.039 Collett 2002G
lobe
Resource density (GSm3/km2)In-place resources (GSm3 g.e.)
Con
vent
iona
l ga
s fie
lds
Hyd
rate
pro
spec
ts/ p
rovi
nces
individual prospects from 0.16 to 5.26
Energies 2010, 3 2020
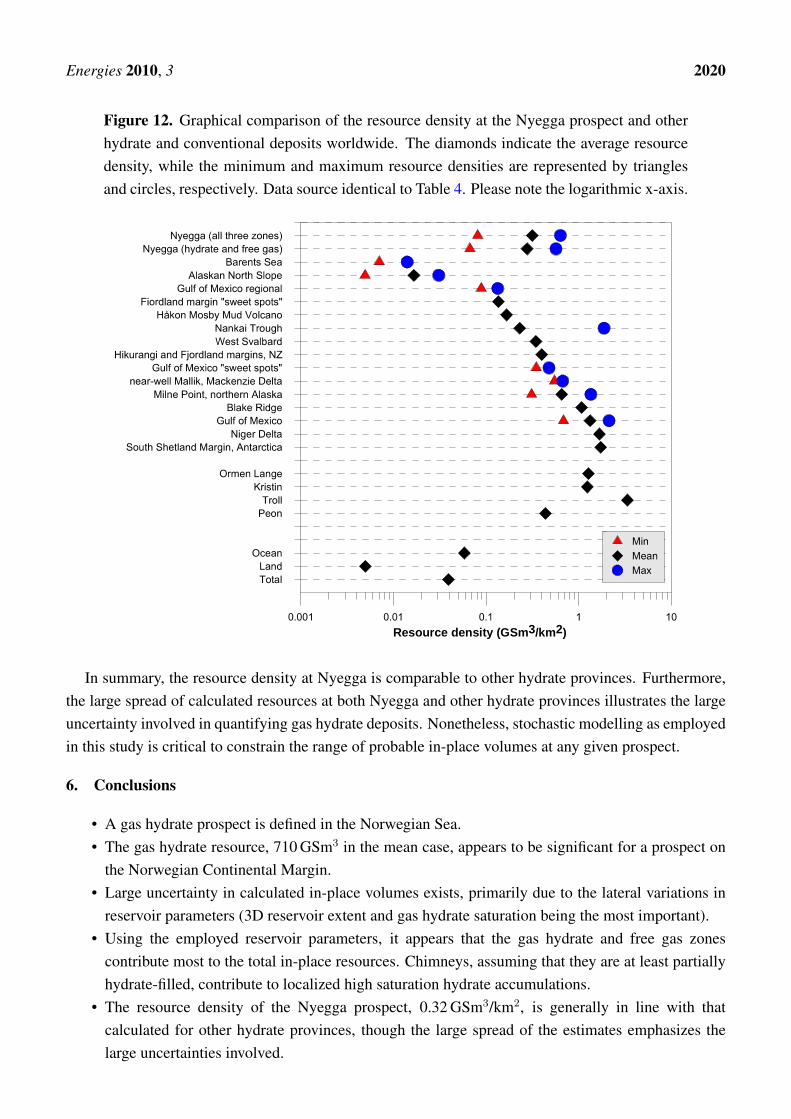
Figure 12. Graphical comparison of the resource density at the Nyegga prospect and otherhydrate and conventional deposits worldwide. The diamonds indicate the average resourcedensity, while the minimum and maximum resource densities are represented by trianglesand circles, respectively. Data source identical to Table 4. Please note the logarithmic x-axis.
Resource density (GSm3/km2)
In summary, the resource density at Nyegga is comparable to other hydrate provinces. Furthermore,the large spread of calculated resources at both Nyegga and other hydrate provinces illustrates the largeuncertainty involved in quantifying gas hydrate deposits. Nonetheless, stochastic modelling as employedin this study is critical to constrain the range of probable in-place volumes at any given prospect.
6. Conclusions
• A gas hydrate prospect is defined in the Norwegian Sea.• The gas hydrate resource, 710 GSm3 in the mean case, appears to be significant for a prospect on
the Norwegian Continental Margin.• Large uncertainty in calculated in-place volumes exists, primarily due to the lateral variations in
reservoir parameters (3D reservoir extent and gas hydrate saturation being the most important).• Using the employed reservoir parameters, it appears that the gas hydrate and free gas zones
contribute most to the total in-place resources. Chimneys, assuming that they are at least partiallyhydrate-filled, contribute to localized high saturation hydrate accumulations.
• The resource density of the Nyegga prospect, 0.32 GSm3/km2, is generally in line with thatcalculated for other hydrate provinces, though the large spread of the estimates emphasizes thelarge uncertainties involved.
Energies 2010, 3 2021
• Apart from their economic value, the hydrate-held methane could, under changing P-T conditions,potentially be released into the ocean and/or the atmosphere. Further work is required to testthis hypothesis.
• Further work is required to determine the producibility of this resource. A hydrate-specificsimulator could, for example, assist in quantifying potential recovery factors.
• It is questionable whether the Nyegga resource will ever be commercially produced, given its lowsaturation and large lateral extent. At the very least, a hydrate-specific reservoir simulator needsto be employed in a feasibility study.
Acknowledgements
This study was conducted as part of an MSc at the University of Tromsø. Bayerngas Norge AS, theSEABED consortium, Statoil and Fugro Geos provided parts of the data used. Bayerngas Norge AS isfurther acknowledged with generous financial, technical and moral support that made this study possibleduring Kim Senger’s employment period. Geoknowledge AS provided access to the GeoX software.Finally, the authors would like to thank four anonymous reviewers for their constructive comments thathave improved this manuscript.
References
1. Kvenvolden, K.A. Potential effects of gas hydrate on human welfare. PNAS 1999, 96, 3420–3426.2. Sloan, E.D.; Koh, C. Clathrate Hydrates of Natural Gases (Chemical Industries Series), 3rd ed.;
CRC Press: Boca Raton, FL, USA, 2008; p. 721.3. Hammerschmidt, E. Formation of Gas Hydrates in Natural Transmission Lines. Ind. Eng. Chem.
1934, 26, 851–855.4. Sloan, E.D. Seven Industrial Hydrate Flow Assurance Lessons from 1993–2003; Technical Report
for Centre of Hydrate Research: Golden, CO, USA, 2003.5. Makogon, Y.; Holditch, S.; Makogon, T. Proven reserves and basics for development of gas hydrate
deposits. In Proceedings of the AAPG Hedberg Conference, Vancouver, Canada, 2004; p. 3.6. Sultan, N.; Cochonat, P.; Foucher, J.P.; Mienert, J. Effect of gas hydrates melting on seafloor slope
instability. Mar. Geol. 2004, 213, 379–401.7. Peters, D.; Hatton, G.; Mehta, A.; Hadley, C. Gas hydrate geohazards in shallow sediments and
their impact on the design of subsea systems. In Proceedings of the 6th International Conferenceon Gas Hydrates, Vancouver, Canada, 2008, p. 7.
8. Kennett, J.; Cannariato, K.; Hendy, I.; Behl, R. Methane Hydrates in Quaternary ClimateChange: The Clathrate Gun Hypothesis; American Geophysical Union: Washington, DC, USA,2003; Volume 54.
9. Maslin, M.; Owen, M.; Day, S.; Long, D. Linking continental-slope failures and climate change:Testing the clathrate gun hypothesis. Geology 2004, 32, 53–56.
10. Dickens, G. Climate: A Methane Trigger for Rapid Warming? Science 2003, 299, 1017.11. Bentley, R.W. Global oil & gas depletion: an overview. Energy Policy 2002, 30, 189–205.
Energies 2010, 3 2022
12. Holditch, S.A.; Chianelli, R.R. Factors That Will Influence Oil and Gas Supply and Demand in the21st Century. MRS Bulletin 2008, 33, 317–325.
13. Max, M.; Johnson, A.; Dillon, W. Economic Geology of Natural Gas Hydrate, Coastal Systemsand Continental Margins; Springer: Dordrecht, The Netherlands, 2006; Volume 9; p. 341.
14. Moridis, G.J.; Kowalsky, M. Depressurization-induced gas production from Class 1 and Class 2hydrate deposits. In Proceedings of the TOUGH Symposium 2006, Lawrence Berkeley NationalLaboratory, Berkeley, CA, USA, May 15–17, 2006; p. 8.
15. Tang, L.G.; Xiao, R.; Huang, C.; Feng, Z.P.; Fan, S.S. Experimental Investigation of ProductionBehavior of Gas Hydrate under Thermal Stimulation in Unconsolidated Sediment. Energy Fuels2005, 19, 2402–2407.
16. Sung, W.; Lee, H.; Lee, H.; Lee, C. Numerical Study for Production Performances of a MethaneHydrate Reservoir Stimulated by Inhibitor Injection. Energy Sources 2002, 24, 499–512.
17. Makogon, Y. Hydrate formation in gas bearing strata under permafrost. Gazovaya promyshlennost1965, 5, 14–15.
18. Makogon, Y.F.; Holditch, S.A.; Makogon, T.Y. Natural gas-hydrates—A potential energy sourcefor the 21st Century. J. Pet. Sci. Eng. 2007, 56, 14–31.
19. Singh, P.; Panda, M.; Stokes, P.J. Characterization and Quantification of the Methane HydrateResource Potential associated with the Barrow Gas Fields. Presented at AAPG Annual Conventionand Exhibition, New Orleans, LA, USA, April 11–14, 2010.
20. Numasawa, M.; Yamamoto, K.; Yasuda, M.; Fujii, T.; Fujii, K.; Dallimore, S.R.; Wright, J.F.;Nixon, F.M.; Imasato, Y.; Cho, B.; Ikegami, T.; Sugiyama, H.; Mizuta, T.; Kurihara, M.; Masuda, Y.Objectives and operation overview of the 2007 JOGMEC/NRCAN/AURORA Mallik 2L-38 gashydrate production test. In Proceedings of the 6th International Conference on Gas Hydrates(ICGH 2008), Vancouver, BC, Canada, July 6–10, 2008; p. 10.
21. Hancock, S.H.; Dallimore, S.R.; Collett, T.S.; Carle, D.; Weatherill, B.; Satoh, T.; Inoue, T.Overview of pressure-drawdown production-test results for the JAPEX/JNOC/GSC et al. Mallik5L-38 gas hydrate production research well. In Scientific Results from the Mallik 2002 Gas HydrateProduction Research Well Program, Mackenzie Delta, Northwest Territories, Canada; Dallimore,S.R., Collett, T.S., Eds.; Geological Society of Canada: Ottawa, Canada, 2005; Volume 585, p. 16.
22. Moridis, G.J.; Collett, T.S. Strategies for gas production from hydrate accumulations under variousgeological and reservoir conditions. In Proceedings of TOUGH Symposium 2003, Berkeley, CA,USA, May 12–14, 2003; p. 8.
23. Milkov, A.V. Global estimates of hydrate-bound gas in marine sediments: How much is really outthere? Earth-Sci. Rev. 2004, 66, 183–197.
24. Boswell, R.; Kleinberg, R.; Collett, T.; Frye, M. Exploration Priorities for Marine Gas HydrateResources. Fire Ice Newsl. 2007, Spring/Summer, 11–13.
25. Collett, T.; Agena, W.; Lee, M.; Zyrianova, M.; Bird, K.; Charpentier, T.; Houseknect, D.; Klett, T.;Pollastro, R.; Schenk, C. Assessment of Gas Hydrate Resources on the North Slope, Alaska, 2008.USGS Fact Sheet 2008, 3073, 1–4.
26. Collett, T.S. Energy Resource Potential of Natural Gas Hydrates. AAPG Bulletin 2002, 86,1971–1992.
Energies 2010, 3 2023
27. Hancock, S.H.; Dallimore, S.R.; Collett, T.S.; Satoh, T.; Inoue, T.; Huenges, E.;Henninges, J.; Weatherill, B. Overview of thermal-stimulation production-test results for theJAPEX/JNOC/GSC et al. Mallik 5L-38 gas hydrate production research well. In Scientific Resultsfrom the Mallik 2002 Gas Hydrate Production Research Well Program, Mackenzie Delta, NorthwestTerritories, Canada; Dallimore, S.R., Collett, T.S., Eds.; Geological Society of Canada: Ottawa,Canada, 2005; Volume 585, p. 15.
28. Inks, T.L.; Lee, M.; Agena, W.; Taylor, D.; Collett, T.S.; Zyrianova, M.; Hunter, R. Seismicprospecting for gas-hydrate and associated free-gas prospects in the Milne Point area of northernAlaska. In Natural Gas Hydrates: Energy Resource and Associated Geologic Hazards; Collett, T.S.,Johnson, A., Knapp, C., Boswell, R., Eds.; The American Association of Petroleum GeologistsHedberg Special Publication (AAPG Memoir 89): Alexandria, VA, USA, 2009.
29. Collett, T.S.; Riedel, M.; Cochran, J.R.; Boswell, R.; Kumar, P.; Sathe, A.; the NGHP Expedition01 Scientific Party. Indian continental margin gas hydrate prospects: results of the Indian nationalgas hydrate program (NGHP) expedition 01. In Proceedings of the 6th International Conference onGas Hydrates, Vancouver, Canada, 2008; p. 7.
30. Ichikawa, Y.; Yonezawa, T. The outline of the MH21 program and the RD plan of methanehydrate development system for offshore Japan. Proc. Int. Symp. Ocean Space Util. Technol.2003, 398–404.
31. Park, K.P. Gas hydrate exploration activities in Korea. In Proceedings of the 6th InternationalConference on Gas Hydrates, Vancouver, Canada, 2008; p. 7.
32. Ruppel, C.; Boswell, R.; Jones, E. Scientific results from Gulf of Mexico Gas Hydrates JointIndustry Project Leg II drilling: Introduction and overview. Mar. Pet. Geol. 2008, 25, 819–829.
33. Frye, M. Preliminary Evaluation of In-Place Gas Hydrate Resources: Gulf of Mexico OuterContinental Shelf; Technical Report for U.S. Department of the Interior, Minerals ManagementService, Resource Evaluation Division: Washington, DC, USA, 2008.
34. Paull, C.; Matsumoto, R. Leg 164 Overview. In Proceedings of the Ocean Drilling Programme,Scientific Results; Paull, C., Matsumoto, R., Wallace, P., Dillon, W.P., Eds.; Ocean DrillingProgramme: College Station, TX, USA, 1995; Volume 164, p. 8.
35. Riedel, M.; Collett, T.; Malone, M.; the Expedition 311 Scientists. In Proceedings ofthe Integrated Ocean Drilling Program Volume 311 Expedition Reports Cascadia Margin GasHydrates; Integrated Ocean Drilling Program Management International, Inc.: Washington, DC,USA, 2005; Volume 311.
36. Sassen, R.; Joye, S.; Sweet, S.T.; DeFreitas, D.A.; Milkov, A.V.; MacDonald, I.R. Thermogenicgas hydrates and hydrocarbon gases in complex chemosynthetic communities, Gulf of Mexicocontinental slope. Org. Geochem. 1999, 30, 485–497.
37. Solheim, A.; Bryn, P.; Sejrup, H.; Mienert, J.; Berg, K. Ormen Lange–an integrated study forthe safe development of a deep-water gas field within the Storegga Slide Complex, NE Atlanticcontinental margin; executive summary. Mar. Pet. Geol. 2005, 22, 1–9.
38. Weibull, W.; Mienert, J.; Bünz, S.; Hustoft, S. Fluid migration directions inferred from gradient oftime surfaces of the sub seabed. Mar. Pet. Geol. 2010, 27, 1898–1909.
Energies 2010, 3 2024
39. Bjørnseth, H.; Grant, S.; Hansen, E.; Hossack, J.; Roberts, D.; Thompson, M. Structural evolutionof the Vøring Basin, Norway, during the Late Cretaceous and Palaeogene. J. Geol. Soc. 1997,154, 559–563.
40. Brekke, H. The tectonic evolution of the Norwegian Sea Continental Margin with emphasis on theVøring and Møre Basins. Geol. Soc., Lond., Special Publ. 2000, 167, 327–378.
41. Lundin, E.; Doré, A.G. Mid-Cenozoic post-breakup deformation in the “passive” margins borderingthe Norwegian-Greenland Sea. Mar. Pet. Geol. 2002, 19, 79–93.
42. Rise, L.; Ottesen, D.; Berg, K.; Lundin, E. Large-scale development of the mid-Norwegian marginduring the last 3 million years. Mar. Pet. Geol. 2005, 22, 33–44.
43. Berg, K.; Solheim, A.; Bryn, P. The Pleistocene to recent geological development of the OrmenLange area. Mar. Pet. Geol. 2005, 22, 45–56.
44. Eldholm, O.; Thiede, J.; Taylor, E. Evolution of the Norwegian continental margin: Backgroundand Objectives. In Proceedings of the Ocean Drilling Programme, College Station, TX, USA,1987; p. 21.
45. Klitgaard-Kristensen, D.; Sejrup, H.P.; Haflidason, H. The last 18 kyr fluctuations in NorwegianSea surface conditions and implications for the magnitude of climatic change: Evidence from theNorth Sea. Paleoceanography 2001, 16, 455–467.
46. ICES Oceanographic Database and Services, 2008. Available online: http://www.ices.dk/ocean/(accessed on December 20, 2010).
47. Bugge, T.; Belderson, R.H.; Kenyon, N.H. The Storegga Slide. Philos. Trans. R. Soc. Lond., Ser. A1988, 325, 357–388.
48. Bouriak, S.; Vanneste, M.; Saoutkine, A. Inferred gas hydrates and clay diapirs near the StoreggaSlide on the southern edge of the Vøring Plateau, offshore Norway. Mar. Geol. 2000, 163, 125–148.
49. Mienert, J.; Bryn, P. Gas hydrate drilling conducted on the European margin. Eos, Trans. Am.Geophys. Union 1997, 78, 567.
50. Hovland, M.; Svensen, H.; Forsberg, C.F.; Johansen, H.; Fichler, C.; Fosså, J.H.; Jonsson, R.;Rueslåtten, H. Complex pockmarks with carbonate-ridges off mid-Norway: Products of sedimentdegassing. Mar. Geol. 2005, 218, 191–206.
51. Hovland, M.; Svensen, H. Submarine pingoes: Indicators of shallow gas hydrates in a pockmark atNyegga, Norwegian Sea. Mar. Geol. 2006, 228, 15–23.
52. Ivanov, M.; Blinova, V.; Kozlova, E.; Westbrook, G.; Mazzini, A.; Minshull, T.; Nouzé, H. FirstSampling of Gas Hydrate From the Vøring Plateau. Eos, Trans. Am. Geophys. Union 2007, 88.
53. Andreassen, K.; Mienert, J.; Bryn, P.; Singh, S. A Double Gas-Hydrate Related Bottom SimulatingReflector at the Norwegian Continental Margin. Ann. N. Y. Acad. Sci. 2000, 912, 126–135.
54. Berndt, C.; Büenz, S.; Mienert, J. Polygonal fault systems on the mid-Norwegian margin: Along-term source for fluid flow. In Subsurface Sediment Mobilization; van Rensbergen, P., Hills, R.,Maltman, A., Morley, C., Eds.; Geological Society of London: London, UK, 2003; Volume 216,pp. 283–290.
55. Hustoft, S.; Mienert, J.; Bünz, S.; Nouzé, H. High-resolution 3D-seismic data indicate focussedfluid migration pathways above polygonal fault systems of the mid-Norwegian margin. Mar. Geol.2007, 245, 89–106.
Energies 2010, 3 2025
56. Bünz, S.; Mienert, J.; Vanneste, M.; Andreassen, K. Gas hydrates at the Storegga Slide: Constraintsfrom an analysis of multicomponent, wide-angle seismic data. Geophysics 2005, 70, B19–B34.
57. Bünz, S.; Mienert, J. Acoustic imaging of gas hydrate and free gas at the Storegga Slide. J. Geophys.Res. 2004, 109, 15.
58. Westbrook, G.; Chand, S.; Rossi, G.; Long, C.; Bünz, S.; Camerlenghi, A.; Carcione, J.; Dean, S.;Foucher, J.P.; Flueh, E.; Gei, D.; Haacke, R.; Madrussani, G.; Mienert, J.; Minshull, T.; Nouzé, H.;Peacock, S.; Reston, T.; Vanneste, M.; Zillmer, M. Estimation of gas hydrate concentration frommulti-component seismic data at sites on the continental margins of NW Svalbard and the Storeggaregion of Norway. Mar. Pet. Geol. 2008, 25, 744–758.
59. Gorman, A.R.; Senger, K. Defining the updip extent of the gas hydrate stability zone on continentalmargins with low geothermal gradients. J. Geophys. Res. 2010, 115, B07105.
60. Weibull, W. Geological Fluid Flow Systems at Nyegga of the Mid-Norwegian Margin. MasterThesis, University of Tromsø, Tromsø, Norway, 2008; p. 145.
61. Paull, C.; Ussler, W.; Holbrook, W.; Hill, T.; Keaten, R.; Mienert, J.; Haflidason, H.; Johnson, J.;Winters, W.; Lorenson, T. Origin of pockmarks and chimney structures on the flanks of the StoreggaSlide, offshore Norway. Geo-Mar. Lett. 2008, 28, 43–51.
62. Bünz, S.; Mienert, J.; Berndt, C. Geological controls on the Storegga gas-hydrate system of themid-Norwegian continental margin. Earth Planet. Sci. Lett. 2003, 209, 291–307.
63. Faverola, A.P.; Bünz, S.; Mienert, J. Fluid distributions inferred from P-wave velocity and reflectionseismic amplitude anomalies beneath the Nyegga pockmark field of the mid-Norwegian margin.Mar. Pet.Geol. 2010, 27, 46–60.
64. Norwegian Geotechnical Institute. Møre and Vøring Soil Investigation 1997 Part B—GeotechnicalData; Technical Report for Norwegian Geotechnical Institute, Oslo, Norway, 1997.
65. Statoil Ltd. Zero Offset VSP 6404/5 GB1. Final Report SP-22-RE-01R-00000-98; Technical Reportfor Read Well Services, for Statoil and the Seabed Project: Hvalstad, Norway, 1998.
66. Milkov, A.V.; Claypool, G.E.; Lee, Y.J.; Xu, W.; Dickens, G.R.; Borowski, W.S.; ODP Leg 204Scientific Party. In situ methane concentrations at Hydrate Ridge, offshore Oregon: New constraintson the global gas hydrate inventory from an active margin. Geology 2003, 31, 833–836.
67. Stoian, I. Seismic studies of gas hydrate in the Ulleung Basin, East Sea, offshore Korea. MasterThesis, University of Victoria, British Columbia, Canada, 2008.
68. Claypool, G. Gulf of Mexico Gas Hydrate Joint Industry Project (GOMJIP), 2005. The cruise of thedrilling vessel Uncle John, Mobile, Alabama to Galveston, Texas, Atwater Valley Blocks 13/14 andKeathley Canyon Block 151, 17 April to 22 May 2005; Technical Report for NETL: Morgantown,WV, USA, 2006.
69. Cook, A.E.; Goldberg, D.; Kleinberg, R.L. Fracture-controlled gas hydrate systems in the northernGulf of Mexico. Mar. Pet. Geol. 2008, 25, 932–941.
70. Kastner, M.; Claypool, G.; Robertson, G. Geochemical constraints on the origin of the pore fluidsand gas hydrate distribution at Atwater Valley and Keathley Canyon, northern Gulf of Mexico. Mar.Pet. Geol. 2008, 25, 860–872.
Energies 2010, 3 2026
71. Chen, Y.; Ussler, W.; Haflidason, H.; Lepland, A.; Rise, L.; Hovland, M.; Hjelstuen, B.O. Sourcesof methane inferred from pore-water [delta]13C of dissolved inorganic carbon in Pockmark G11,offshore Mid-Norway. Chem. Geol. 2010, 275, 127–138.
72. Hustoft, S.; Bünz, S.; Mienert, J. Three-dimensional seismic analysis of the morphology andspatial distribution of chimneys beneath the Nyegga pockmark field, offshore mid-Norway. BasinRes. 2010, 22, 465–480.
73. Hustoft, S.; Bünz, S.; Mienert, J.; Chand, S. Gas hydrate reservoir and active methane-ventingprovince in sediments on 20Ma young oceanic crust in the Fram Strait, offshore NW-Svalbard.Earth Planet. Sci. Lett. 2009, 284, 12–24.
74. MacDonald, G. The future of methane as an energy resource. Annu. Rev. Energy 1990, 15, 53–83.75. The Norwegian Petroleum Directorate. The petroleum resource account as of Dec. 31, 2009.
Available online: http://www.npd.no/en/Topics/Resource-accounts-and–analysis/Temaartikler/Resource-accounts/2009/ (accessed on December 20, 2010).
76. The Norwegian Petroleum Directorate. The NPD’s Fact-pages. Available online: http://www.npd.no/engelsk/cwi/pbl/en/ (accessed on December 20, 2010).
77. Erichsen, L. The Peon Field, unlocking unconventional reserves in the North Sea. Presented atSPE Bergen "One Day Seminar", Bergen, Norway, 2009.
78. Milkov, A.; Sassen, R. Estimate of gas hydrate resource, northwestern Gulf of Mexico continentalslope. Mar. Geol. 2001, 179, 71–83.
79. Pecher, I.; Henrys, S.; Gorman, A.; Fohrmann, M. Gas Hydrates on the Hikurangi and FiordlandMargins, New Zealand. In Proceedings of AAPG Hedberg Conference, Vancouver, Canada,2004; p. 4.
80. Laberg, J.S.; Andreassen, K.; Knutsen, S.M. Inferred gas hydrate on the Barents Seashelf—A model for its formation and a volume estimate. Geo-Mar. Lett. 1998, 18, 26–33.
81. Hovland, M.; Gallagher, J.W.; Clennell, M.B.; Lekvam, K. Gas hydrate and free gas volumes inmarine sediments: Example from the Niger Delta front. Mar. Pet. Geol. 1997, 14, 245–255.
82. Milkov, A.V.; Sassen, R. Economic geology of offshore gas hydrate accumulations and provinces.Mar. Pet. Geol. 2002, 19, 1–11.
83. Lodolo, E.; Camerlenghi, A.; Madrussani, G.; Tinivella, U.; Rossi, G. Assessment of gas hydrateand free gas distribution on the South Shetland margin (Antarctica) based on multichannel seismicreflection data. Geophys. J. Int. 2002, 148, 103–119.
84. Fohrmann, M. The Occurrence and Distribution of Gas Hydrates on the Puysegur ContinentalMargin and Slope-Stability Aspects on Ritchie Banks, Hikurangi Margin, New Zealand. Ph.D.Thesis, University of Otago, Dunedin, New Zealand, 2009; p. 244.
85. Gorman, A. Seismic characterization of gas hydrates and associated fluid flow on passive and activecontinental margins: examples from New Zealand. Presented at CSEG Luncheon, Calgary, Canada,January 2008.
© 2010 by the authors; licensee MDPI, Basel, Switzerland. This article is an open access articledistributed under the terms and conditions of the Creative Commons Attribution license(http://creativecommons.org/licenses/by/3.0/.)
Copyright © 2022 FDOKUMEN