a great place - AnnualReports.com
24
a great place 2011 Summary Annual Report
-
Upload
khangminh22 -
Category
Documents
-
view
0 -
download
0
Transcript of a great place - AnnualReports.com

a great place
2011 Summary Annual Report
Bar Harbor Bankshares
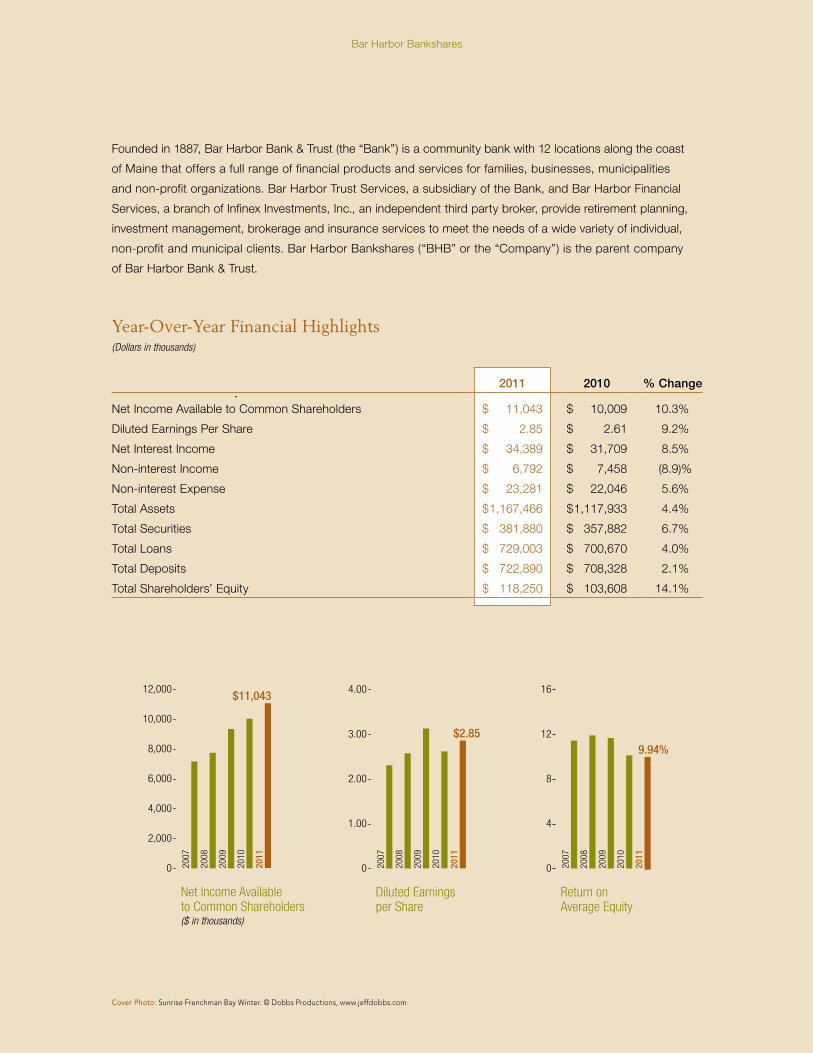
Year-Over-Year Financial Highlights(Dollars in thousands)
2011 2010 % Change
Net Income Available to Common Shareholders $ 11,043 $ 10,009 10.3%
Diluted Earnings Per Share $ 2.85 $ 2.61 9.2%
Net Interest Income $ 34,389 $ 31,709 8.5%
Non-interest Income $ 6,792 $ 7,458 (8.9)%
Non-interest Expense $ 23,281 $ 22,046 5.6%
Total Assets $ 1,167,466 $ 1,117,933 4.4%
Total Securities $ 381,880 $ 357,882 6.7%
Total Loans $ 729,003 $ 700,670 4.0%
Total Deposits $ 722,890 $ 708,328 2.1%
Total Shareholders’ Equity $ 118,250 $ 103,608 14.1%
0
2000
4000
6000
8000
10000
12000
0
1
2
3
4
0
4
8
12
16
Net Income Availableto Common Shareholders($ in thousands)
0
4,000
6,000
12,000
8,000
2,000
10,000
2009
2010
2007
2008
2011
$11,043
Diluted Earningsper Share
0
1.00
2.00
4.00
3.00
2009
2010
2007
2008
2011
$2.85
Return onAverage Equity
0
12
16
4
8
2009
2010
2007
2008
2011
9.94%
Founded in 1887, Bar Harbor Bank & Trust (the “Bank”) is a community bank with 12 locations along the coast
of Maine that offers a full range of financial products and services for families, businesses, municipalities
and non-profit organizations. Bar Harbor Trust Services, a subsidiary of the Bank, and Bar Harbor Financial
Services, a branch of Infinex Investments, Inc., an independent third party broker, provide retirement planning,
investment management, brokerage and insurance services to meet the needs of a wide variety of individual,
non-profit and municipal clients. Bar Harbor Bankshares (“BHB” or the “Company”) is the parent company
of Bar Harbor Bank & Trust.
Cover Photo: Sunrise Frenchman Bay Winter. © Dobbs Productions, www.jeffdobbs.com
1
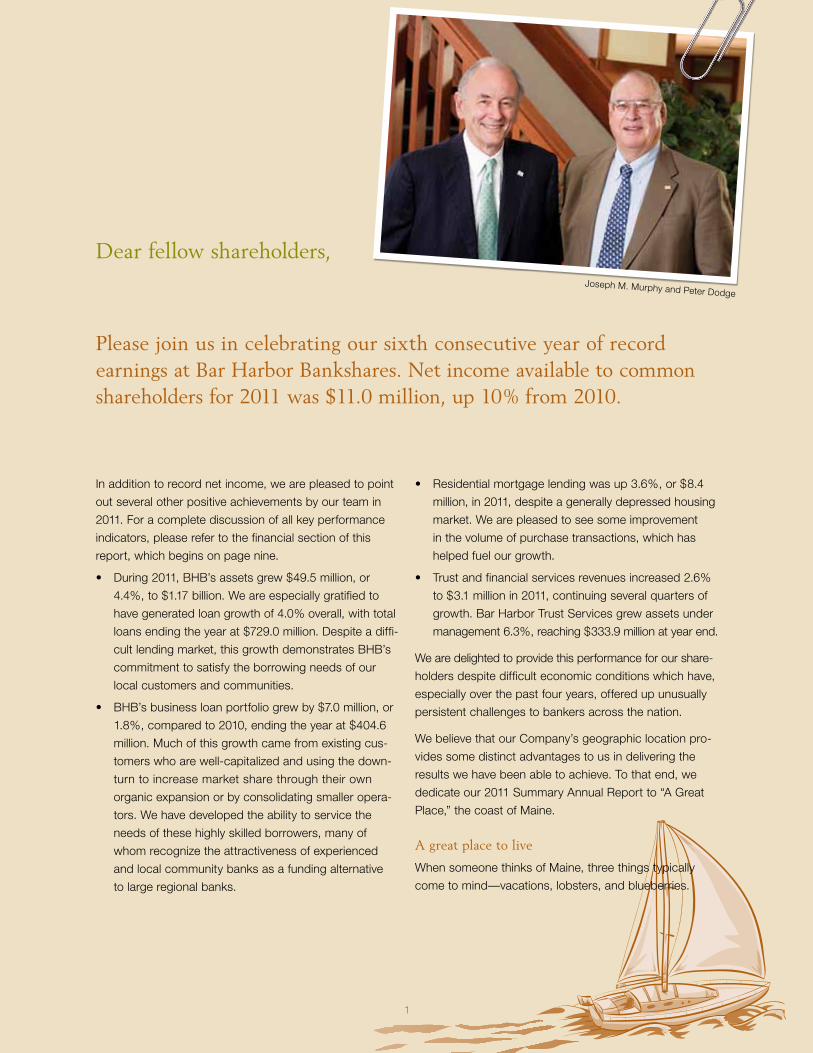
Dear fellow shareholders,
In addition to record net income, we are pleased to point
out several other positive achievements by our team in
2011. For a complete discussion of all key performance
indicators, please refer to the financial section of this
report, which begins on page nine.
• During 2011, BHB’s assets grew $49.5 million, or
4.4%, to $1.17 billion. We are especially gratified to
have generated loan growth of 4.0% overall, with total
loans ending the year at $729.0 million. Despite a diffi-
cult lending market, this growth demonstrates BHB’s
commitment to satisfy the borrowing needs of our
local customers and communities.
• BHB’s business loan portfolio grew by $7.0 million, or
1.8%, compared to 2010, ending the year at $404.6
million. Much of this growth came from existing cus-
tomers who are well-capitalized and using the down-
turn to increase market share through their own
organic expansion or by consolidating smaller opera-
tors. We have developed the ability to service the
needs of these highly skilled borrowers, many of
whom recognize the attractiveness of experienced
and local community banks as a funding alternative
to large regional banks.
• Residential mortgage lending was up 3.6%, or $8.4
million, in 2011, despite a generally depressed housing
market. We are pleased to see some improvement
in the volume of purchase transactions, which has
helped fuel our growth.
• Trust and financial services revenues increased 2.6%
to $3.1 million in 2011, continuing several quarters of
growth. Bar Harbor Trust Services grew assets under
management 6.3%, reaching $333.9 million at year end.
We are delighted to provide this performance for our share-
holders despite difficult economic conditions which have,
especially over the past four years, offered up unusually
persistent challenges to bankers across the nation.
We believe that our Company’s geographic location pro-
vides some distinct advantages to us in delivering the
results we have been able to achieve. To that end, we
dedicate our 2011 Summary Annual Report to “A Great
Place,” the coast of Maine.
A great place to live
When someone thinks of Maine, three things typically
come to mind—vacations, lobsters, and blueberries.
Please join us in celebrating our sixth consecutive year of record earnings at Bar Harbor Bankshares. Net income available to common shareholders for 2011 was $11.0 million, up 10% from 2010.
Joseph M. Murphy and Peter Dodge

2
Bar Harbor Bankshares
In 2011, Bar Harbor Bank & Trust was recognized as one of
the “Best Places to Work in Maine” based upon feedback
from our employees, who said they like the work they do,
have a clear understanding of their job role, feel performance
expectations are realistic, and would recommend the Bank to
others. We consider this award an acknowledgment of the
efforts of our entire team to build a better Company together.
a great place
to Work.Those of us fortunate enough to live and work here also
think about our small, safe communities, excellent school
systems, traffic-free commutes, and the beauty of our
bold coastline. We appreciate the ample opportunities
for outdoor recreation as much as our visitors do. High-
quality healthcare resources are readily available, with
excellent local hospitals nearby. A diligent non-profit sec-
tor works relentlessly to improve the social and cultural
aspects of our hometowns. A vibrant scientific commu-
nity with world-class genetic research facilities, a unique
local college in our headquarters town of Bar Harbor,
and an outstanding university system provide intellectual
capital and year-round stability to our communities. We
can’t imagine a better place to call home.
A great place to do business
Our local economy has historically been resistant to the
drastic economic swings experienced elsewhere in the
nation. Thanks to that fact, our local businesses—whether
led by creative entrepreneurs, seasoned executives, or
one fisherman on a boat—have typically been resilient in
hard times.
All of our branches are located within a half mile of salt
water so it's not surprising that Coastal Maine’s three
most unique industries—tourism, lobster fishing and
wild blueberry production—are well-represented among
our customer base. We are pleased to report that all
three sectors had a good year in 2011. A major economic
factor since the late 1800’s, tourism is the leading con-
tributor to the coastal economy today. In 2011, despite a
week devoted to hosting Hurricane Irene, hoteliers, mer-
chants and restaurant operators enjoyed another very
strong season. Our state’s lobster fishing fleet landed
over 100 million pounds of lobster in 2011, the first time
in history that threshold was breached, and the Maine
Department of Marine Resources has indicated that
strong landings are likely for the next several years. Wild
blueberry production, coastal Maine’s most significant

3
2011 Summary Annual Report
a great place
to Live.

4
Bar Harbor Bankshares
4
a great place
to Visit.
agricultural crop, enjoyed another profitable year as
strong product prices and robust demand overcame
slightly decreased production. Wild blueberries’ ranking
as highest in antioxidant capacity per serving compared
with more than 20 other fruits has rewarded this industry
with worldwide opportunities for growth and innovation.
We recognize and appreciate that the ongoing success
of our customers has contributed significantly to BHB’s
results for 2011.
A great place to visit
Thanks to the appeal of our quaint towns and natural
beauty, coastal Maine truly is a great place to visit. We
have a lot of sparkling days here, all year round. Our
villages boast some of the most unique shopping and
dining opportunities anywhere. Maine’s granite-lined
coast is ideal for paddling, sailing, nature watching, or
just relaxing. Acadia National Park, located on Mount
Desert Island, where we maintain our headquarters,
continues to draw more than two million visitors each
year. With 120 miles of hiking trails and 45 miles of car-
free gravel carriage roads for biking, horseback riding,
or walking, Acadia offers something for everyone. About
120 cruise ships visit Bar Harbor each year, bringing us
guests from around the world. In addition to shopping
and outdoor activities, the arts play an important role in
our coastal towns, with museums, galleries, concerts,
and live theater adding cultural richness to the visitor
experience. It’s easy to see why Maine is called
Vacationland.

5
2011 Summary Annual Report
A great place to bank
Our customers in coastal Maine expect what every bank’s
customers expect—friendliness, competence and consis-
tency…knowing what to do and doing it right the first
time with a genuine smile. We pay particular attention
to these expectations as we realize that customers have
a choice among banks, and in our markets most are
community banks like ourselves. We believe our principal
advantage is a reputation for superior service after the
sale. To ensure that we sustain that edge, we have com-
mitted significant time and resources to developing high
standards and investing in staff development.
In addition to service excellence, bank customers expect
outstanding products. As increasing numbers of house-
holds rely upon online tools as a primary vehicle for finan-
cial management, Bar Harbor Bank & Trust has focused
on providing products to meet that demand. We offer a
full suite of electronic tools including online bill pay from a
market-leading provider, e-statements and online history,
and mobile banking delivered through a wide array of smart
phones. BHB also offers customers an all-electronic
checking account (“E-Choice”) which rewards customers
who meet the "online qualifiers" with an exceptional
interest rate on their deposit balances. For our business
customers, we offer “remote deposit capture,” which
transmits non-cash deposits through a computer-to-
computer communication process. Since this technology
eliminates the need to be physically near a BHB branch,
it has extended the reach of our excellent business bank-
ing team to new and existing customers who maintain
business locations throughout the state.
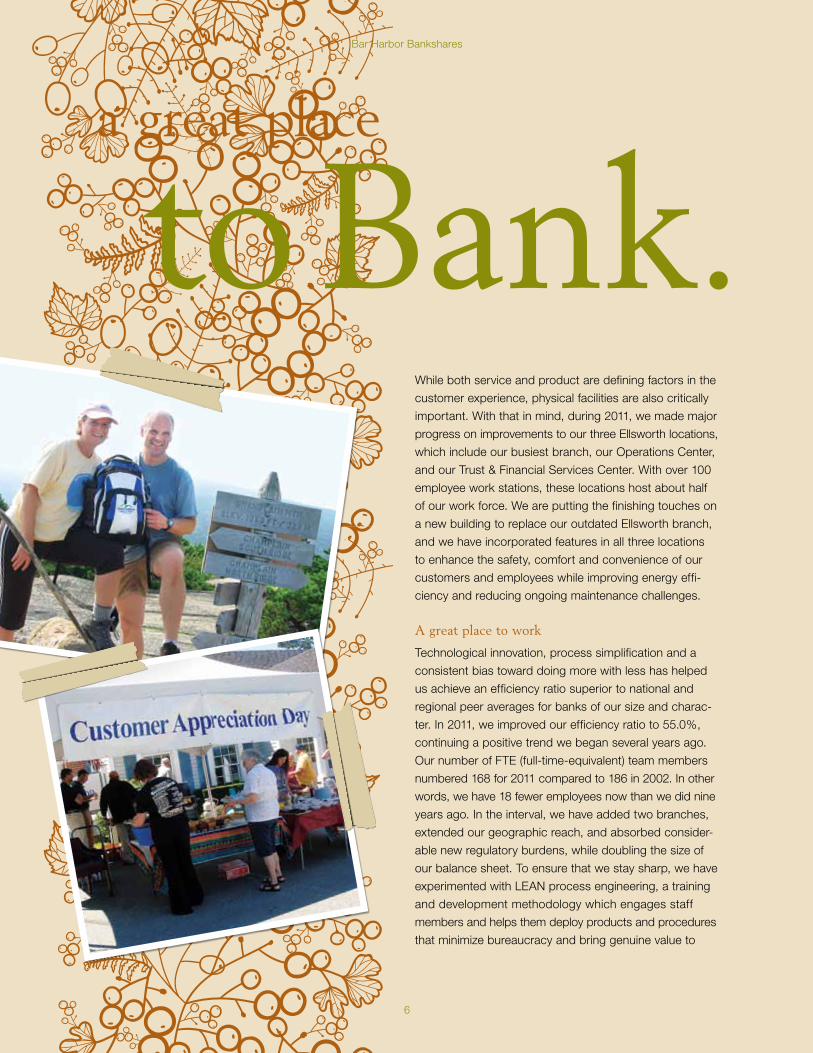
6
Bar Harbor Bankshares
a great place
to Bank.While both service and product are defining factors in the
customer experience, physical facilities are also critically
important. With that in mind, during 2011, we made major
progress on improvements to our three Ellsworth locations,
which include our busiest branch, our Operations Center,
and our Trust & Financial Services Center. With over 100
employee work stations, these locations host about half
of our work force. We are putting the finishing touches on
a new building to replace our outdated Ellsworth branch,
and we have incorporated features in all three locations
to enhance the safety, comfort and convenience of our
customers and employees while improving energy effi-
ciency and reducing ongoing maintenance challenges.
A great place to work
Technological innovation, process simplification and a
consistent bias toward doing more with less has helped
us achieve an efficiency ratio superior to national and
regional peer averages for banks of our size and charac-
ter. In 2011, we improved our efficiency ratio to 55.0%,
continuing a positive trend we began several years ago.
Our number of FTE (full-time-equivalent) team members
numbered 168 for 2011 compared to 186 in 2002. In other
words, we have 18 fewer employees now than we did nine
years ago. In the interval, we have added two branches,
extended our geographic reach, and absorbed consider-
able new regulatory burdens, while doubling the size of
our balance sheet. To ensure that we stay sharp, we have
experimented with LEAN process engineering, a training
and development methodology which engages staff
members and helps them deploy products and procedures
that minimize bureaucracy and bring genuine value to

7
2011 Summary Annual Report
customers. Given our early success, we are increasingly
interested in using LEAN as a tool to manage processes
going forward.
While the assumption may be that doing more with less
might decrease the satisfaction of our team members, we
are honored to report evidence to the contrary. In 2011,
Bar Harbor Bank & Trust was selected as one of 28 “Best
Places to Work in Maine” in the under-250-employees
category. The selection was based upon candid feed-
back from our employees regarding their job satisfaction
and overall work environment. BHB employees gave the
highest scores in “role satisfaction,” “work environment,”
and “overall engagement,” saying they like the work they
do and feel they are able to maintain a reasonable bal-
ance between work life and personal life. They reported
that they have a clear understanding of their job role, feel
performance expectations are realistic, and expressed a
willingness to give extra effort to help the Bank succeed.
Perhaps most important, our employees would recom-
mend the Bank as a provider of financial services and as
a great employer. We consider this award an acknowl-
edgment of the efforts of our entire team to build a better
Company together.
During 2011, we were privileged to recognize the unique
contributions of several seasoned team members with
promotions to positions of increased responsibility. Michael
Bonsey, Gregory Dalton and Stephen Leackfeldt were
promoted to Executive Vice President while Cheryl Mullen
was promoted to Senior Vice President. All have contributed
significantly to the success of BHB over the past decade
as we sought to raise standards of performance through-
out the Company. With their promotions, the technical,
managerial or geographic scope of duties of each has
been expanded to match the challenges BHB faces in
continuing to provide exceptional service to our custom-
ers and strong earnings to our shareholders. In addition
to the four named above, 16 other team members, repre-
senting virtually every function of the Company, won
management-level promotions in 2011. We are grateful to
have so many dedicated and talented team members to
represent us.
a great place
to Invest.

8
Bar Harbor Bankshares
a great place
to Prosper.
A great place to invest
We know that the strength of our balance sheet is of par-
amount interest to both investors and customers and
we are pleased to report that we ended 2011 with strong
capital ratios, including a Total Risk-based capital ratio of
16.06%, significantly above regulatory standards for the
designation of “well-capitalized.” This capital permits us
to consider such opportunities as increased business
and consumer lending, purchases of existing loan por t-
folios, franchise expansion through the building of new
branches or the acquisition of existing branches from
other banks, and other strategic initiatives.
We are also conscious of giving our shareholders a com-
petitive return. During 2011, we raised our dividend three
times and have done so again during the first quarter
of 2012. The decision to increase dividends demonstrates
our confidence that our balance sheet is strong and that
our current level of earnings is sustainable.
In closing, we again salute our home, the coast of Maine—
a great place to work, to live, to visit and to do business.
We hope you’ll agree that it’s also a great place to bank…
a great place to invest…a great place to prosper. On
behalf of all Bar Harbor Bankshares team members, we
extend our thanks for your confidence and loyalty.
Joseph M. MurphyPresident & CEO
Peter DodgeChairman
Our local economy has historically been resistant to the drastic
economic swings experienced elsewhere in the nation. Thanks
to that fact, our local businesses—whether led by creative
entrepreneurs, seasoned executives, or one fisherman on a
boat—have typically been resilient in hard times.
9
2011 Summary Annual Report
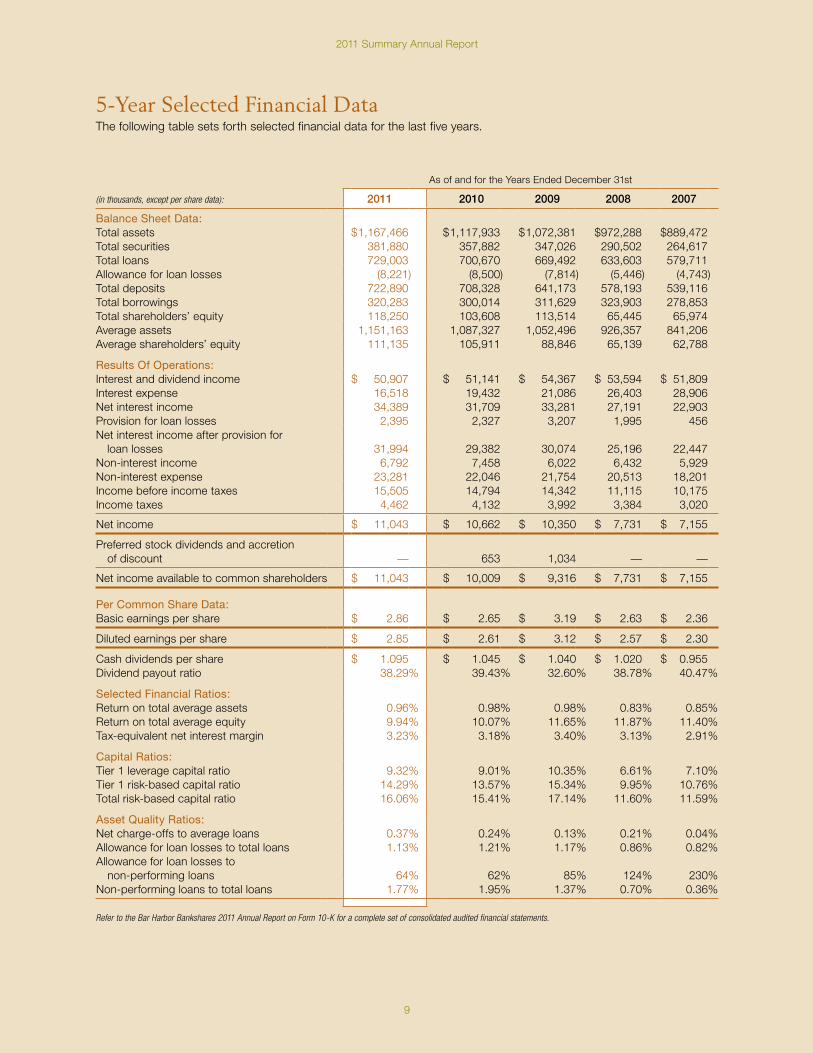
5-Year Selected Financial DataThe following table sets forth selected financial data for the last five years.
As of and for the Years Ended December 31st
(in thousands, except per share data): 2011 2010 2009 2008 2007
Balance Sheet Data:Total assets $ 1,167,466 $ 1,117,933 $ 1,072,381 $ 972,288 $ 889,472Total securities 381,880 357,882 347,026 290,502 264,617Total loans 729,003 700,670 669,492 633,603 579,711Allowance for loan losses (8,221) (8,500) (7,814) (5,446) (4,743)Total deposits 722,890 708,328 641,173 578,193 539,116Total borrowings 320,283 300,014 311,629 323,903 278,853Total shareholders’ equity 118,250 103,608 113,514 65,445 65,974Average assets 1,151,163 1,087,327 1,052,496 926,357 841,206Average shareholders’ equity 111,135 105,911 88,846 65,139 62,788
Results Of Operations:Interest and dividend income $ 50,907 $ 51,141 $ 54,367 $ 53,594 $ 51,809Interest expense 16,518 19,432 21,086 26,403 28,906Net interest income 34,389 31,709 33,281 27,191 22,903Provision for loan losses 2,395 2,327 3,207 1,995 456Net interest income after provision for loan losses 31,994 29,382 30,074 25,196 22,447Non-interest income 6,792 7,458 6,022 6,432 5,929Non-interest expense 23,281 22,046 21,754 20,513 18,201Income before income taxes 15,505 14,794 14,342 11,115 10,175Income taxes 4,462 4,132 3,992 3,384 3,020
Net income $ 11,043 $ 10,662 $ 10,350 $ 7,731 $ 7,155
Preferred stock dividends and accretion of discount — 653 1,034 — —
Net income available to common shareholders $ 11,043 $ 10,009 $ 9,316 $ 7,731 $ 7,155
Per Common Share Data:Basic earnings per share $ 2.86 $ 2.65 $ 3.19 $ 2.63 $ 2.36
Diluted earnings per share $ 2.85 $ 2.61 $ 3.12 $ 2.57 $ 2.30
Cash dividends per share $ 1.095 $ 1.045 $ 1.040 $ 1.020 $ 0.955Dividend payout ratio 38.29% 39.43% 32.60% 38.78% 40.47%
Selected Financial Ratios:Return on total average assets 0.96% 0.98% 0.98% 0.83% 0.85%Return on total average equity 9.94% 10.07% 11.65% 11.87% 11.40%Tax-equivalent net interest margin 3.23% 3.18% 3.40% 3.13% 2.91%
Capital Ratios:Tier 1 leverage capital ratio 9.32% 9.01% 10.35% 6.61% 7.10%Tier 1 risk-based capital ratio 14.29% 13.57% 15.34% 9.95% 10.76%Total risk-based capital ratio 16.06% 15.41% 17.14% 11.60% 11.59%
Asset Quality Ratios:Net charge-offs to average loans 0.37% 0.24% 0.13% 0.21% 0.04%Allowance for loan losses to total loans 1.13% 1.21% 1.17% 0.86% 0.82%Allowance for loan losses to non-performing loans 64% 62% 85% 124% 230%Non-performing loans to total loans 1.77% 1.95% 1.37% 0.70% 0.36%
Refer to the Bar Harbor Bankshares 2011 Annual Report on Form 10-K for a complete set of consolidated audited financial statements.
10
Bar Harbor Bankshares
Report of Independent Registered Public Accounting Firm
The Board of Directors and Shareholders of Bar Harbor Bankshares:
We have audited, in accordance with the standards of the Public Company Accounting Oversight Board (United States), the consolidated balance sheets of Bar Harbor Bankshares and subsidiaries as of December 31, 2011 and 2010, and the related consolidated statements of income, changes in shareholders’ equity, comprehensive income, and cash flows for each of the years in the three-year period ended December 31, 2011 (not presented herein); and in our report dated March 15, 2012, we expressed an unqualified opinion on those consolidated financial statements.
In our opinion, the information set forth in the accompanying condensed consolidated financial statements is fairly stated, in all material respects, in relation to the consolidated financial statements from which it has been derived.
Albany, New York March 15, 2012
11
2011 Summary Annual Report
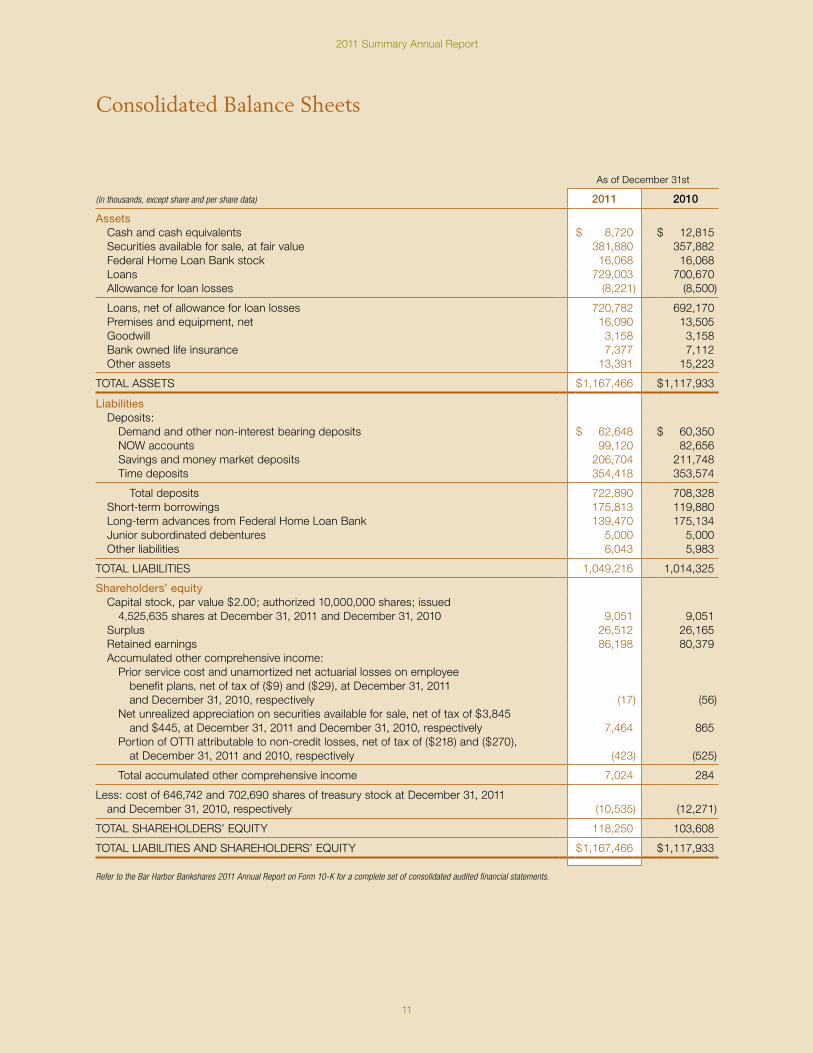
Consolidated Balance Sheets
As of December 31st
(in thousands, except share and per share data) 2011 2010
Assets Cash and cash equivalents $ 8,720 $ 12,815 Securities available for sale, at fair value 381,880 357,882 Federal Home Loan Bank stock 16,068 16,068 Loans 729,003 700,670 Allowance for loan losses (8,221) (8,500)
Loans, net of allowance for loan losses 720,782 692,170 Premises and equipment, net 16,090 13,505 Goodwill 3,158 3,158 Bank owned life insurance 7,377 7,112 Other assets 13,391 15,223
TOTAL ASSETS $ 1,167,466 $ 1,117,933
Liabilities Deposits: Demand and other non-interest bearing deposits $ 62,648 $ 60,350 NOW accounts 99,120 82,656 Savings and money market deposits 206,704 211,748 Time deposits 354,418 353,574
Total deposits 722,890 708,328 Short-term borrowings 175,813 119,880 Long-term advances from Federal Home Loan Bank 139,470 175,134 Junior subordinated debentures 5,000 5,000 Other liabilities 6,043 5,983
TOTAL LIABILITIES 1,049,216 1,014,325
Shareholders’ equity Capital stock, par value $2.00; authorized 10,000,000 shares; issued
4,525,635 shares at December 31, 2011 and December 31, 2010 9,051 9,051 Surplus 26,512 26,165 Retained earnings 86,198 80,379 Accumulated other comprehensive income: Prior service cost and unamortized net actuarial losses on employee
benefit plans, net of tax of ($9) and ($29), at December 31, 2011 and December 31, 2010, respectively (17) (56)
Net unrealized appreciation on securities available for sale, net of tax of $3,845 and $445, at December 31, 2011 and December 31, 2010, respectively 7,464 865
Portion of OTTI attributable to non-credit losses, net of tax of ($218) and ($270), at December 31, 2011 and 2010, respectively (423) (525)
Total accumulated other comprehensive income 7,024 284
Less: cost of 646,742 and 702,690 shares of treasury stock at December 31, 2011 and December 31, 2010, respectively (10,535) (12,271)
TOTAL SHAREHOLDERS’ EQUITY 118,250 103,608
TOTAL LIABILITIES AND SHAREHOLDERS’ EQUITY $ 1,167,466 $ 1,117,933
Refer to the Bar Harbor Bankshares 2011 Annual Report on Form 10-K for a complete set of consolidated audited financial statements.
12
Bar Harbor Bankshares
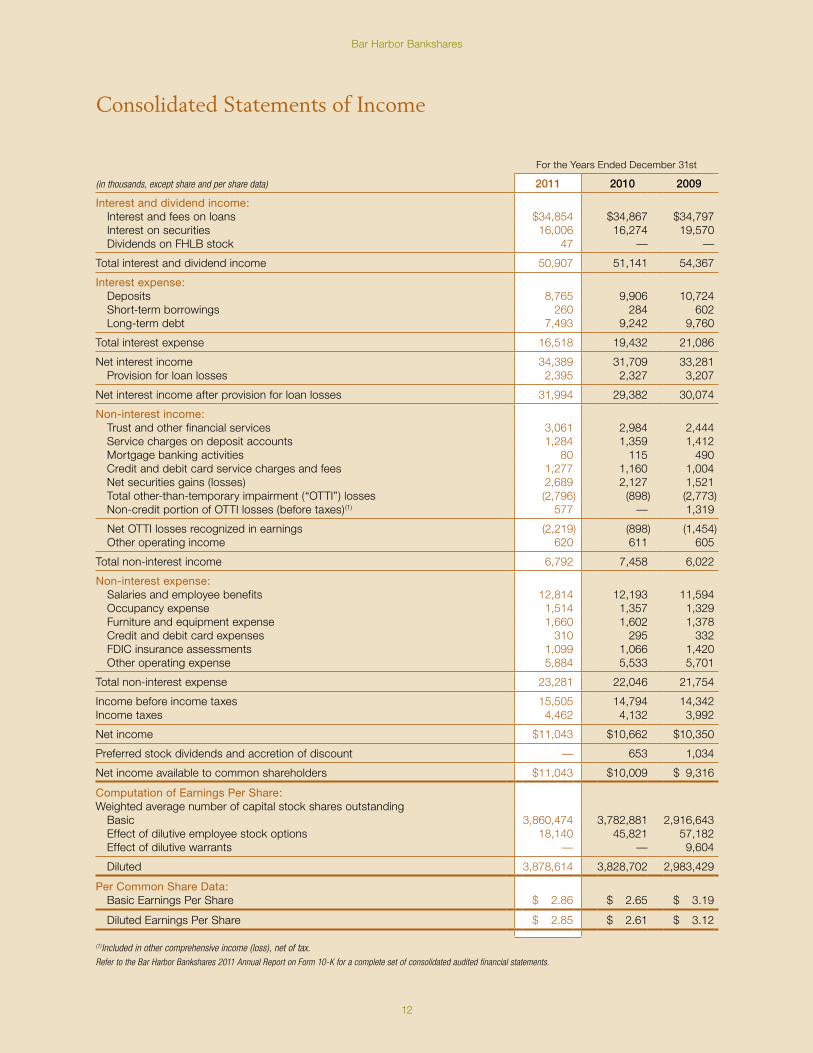
Consolidated Statements of Income
For the Years Ended December 31st
(in thousands, except share and per share data) 2011 2010 2009
Interest and dividend income: Interest and fees on loans $34,854 $34,867 $34,797 Interest on securities 16,006 16,274 19,570 Dividends on FHLB stock 47 — —
Total interest and dividend income 50,907 51,141 54,367
Interest expense: Deposits 8,765 9,906 10,724 Short-term borrowings 260 284 602 Long-term debt 7,493 9,242 9,760
Total interest expense 16,518 19,432 21,086
Net interest income 34,389 31,709 33,281 Provision for loan losses 2,395 2,327 3,207
Net interest income after provision for loan losses 31,994 29,382 30,074
Non-interest income: Trust and other financial services 3,061 2,984 2,444 Service charges on deposit accounts 1,284 1,359 1,412 Mortgage banking activities 80 115 490 Credit and debit card service charges and fees 1,277 1,160 1,004 Net securities gains (losses) 2,689 2,127 1,521 Total other-than-temporary impairment (“OTTI”) losses (2,796) (898) (2,773) Non-credit portion of OTTI losses (before taxes)(1) 577 — 1,319
Net OTTI losses recognized in earnings (2,219) (898) (1,454) Other operating income 620 611 605
Total non-interest income 6,792 7,458 6,022
Non-interest expense: Salaries and employee benefits 12,814 12,193 11,594 Occupancy expense 1,514 1,357 1,329 Furniture and equipment expense 1,660 1,602 1,378 Credit and debit card expenses 310 295 332 FDIC insurance assessments 1,099 1,066 1,420 Other operating expense 5,884 5,533 5,701
Total non-interest expense 23,281 22,046 21,754
Income before income taxes 15,505 14,794 14,342Income taxes 4,462 4,132 3,992
Net income $11,043 $10,662 $10,350
Preferred stock dividends and accretion of discount — 653 1,034
Net income available to common shareholders $11,043 $10,009 $ 9,316
Computation of Earnings Per Share:Weighted average number of capital stock shares outstanding Basic 3,860,474 3,782,881 2,916,643 Effect of dilutive employee stock options 18,140 45,821 57,182 Effect of dilutive warrants — — 9,604
Diluted 3,878,614 3,828,702 2,983,429
Per Common Share Data: Basic Earnings Per Share $ 2.86 $ 2.65 $ 3.19
Diluted Earnings Per Share $ 2.85 $ 2.61 $ 3.12
(1)Included in other comprehensive income (loss), net of tax.Refer to the Bar Harbor Bankshares 2011 Annual Report on Form 10-K for a complete set of consolidated audited financial statements.
13
2011 Summary Annual Report
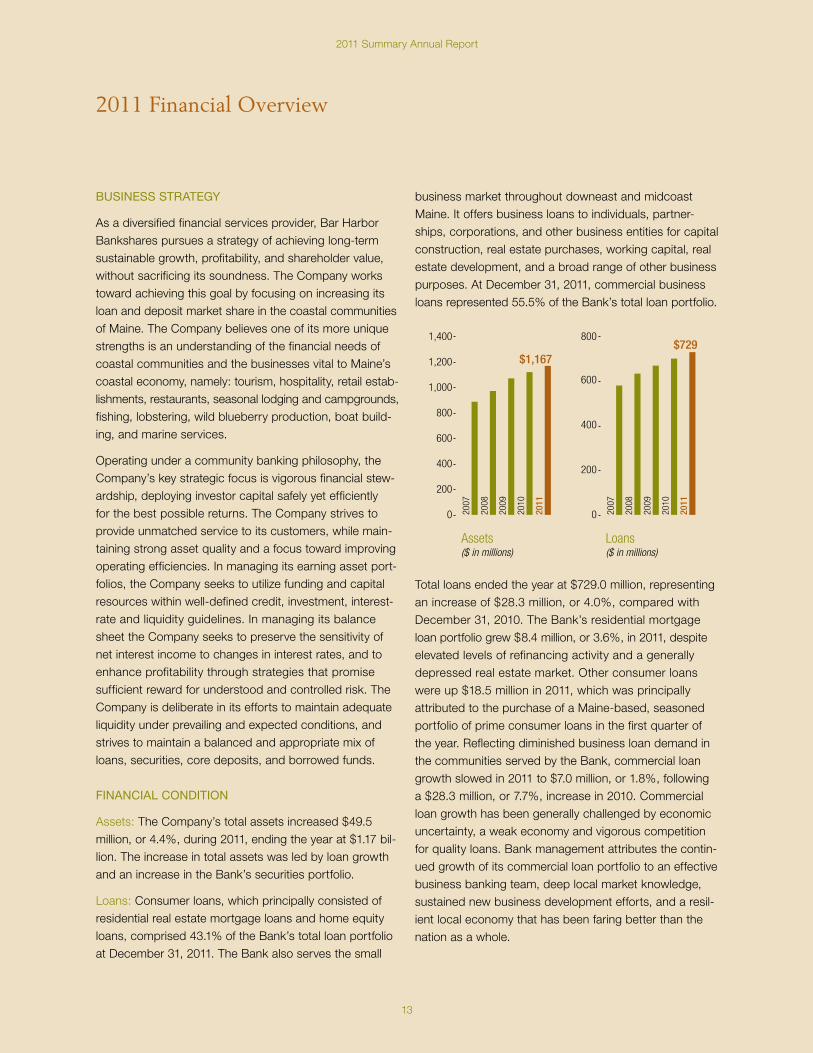
2011 Financial Overview
BUSINESS STRATEGY
As a diversified financial services provider, Bar Harbor Bankshares pursues a strategy of achieving long-term sustainable growth, profitability, and shareholder value, without sacrificing its soundness. The Company works toward achieving this goal by focusing on increasing its loan and deposit market share in the coastal communities of Maine. The Company believes one of its more unique strengths is an understanding of the financial needs of coastal communities and the businesses vital to Maine’s coastal economy, namely: tourism, hospitality, retail estab-lishments, restaurants, seasonal lodging and campgrounds, fishing, lobstering, wild blueberry production, boat build-ing, and marine services.
Operating under a community banking philosophy, the Company’s key strategic focus is vigorous financial stew-ardship, deploying investor capital safely yet efficiently for the best possible returns. The Company strives to provide unmatched service to its customers, while main-taining strong asset quality and a focus toward improving operating efficiencies. In managing its earning asset port-folios, the Company seeks to utilize funding and capital resources within well-defined credit, investment, interest-rate and liquidity guidelines. In managing its balance sheet the Company seeks to preserve the sensitivity of net interest income to changes in interest rates, and to enhance profitability through strategies that promise sufficient reward for understood and controlled risk. The Company is deliberate in its efforts to maintain adequate liquidity under prevailing and expected conditions, and strives to maintain a balanced and appropriate mix of loans, securities, core deposits, and borrowed funds.
FINANCIAL CONDITION
Assets: The Company’s total assets increased $49.5 million, or 4.4%, during 2011, ending the year at $1.17 bil-lion. The increase in total assets was led by loan growth and an increase in the Bank’s securities portfolio.
Loans: Consumer loans, which principally consisted of residential real estate mortgage loans and home equity loans, comprised 43.1% of the Bank’s total loan portfolio at December 31, 2011. The Bank also serves the small
business market throughout downeast and midcoast Maine. It offers business loans to individuals, partner-ships, corporations, and other business entities for capital construction, real estate purchases, working capital, real estate development, and a broad range of other business purposes. At December 31, 2011, commercial business loans represented 55.5% of the Bank’s total loan portfolio.
0
200
400
600
800
1000
1200
1400
Assets($ in millions)
0
200
400
600
800
1,000
1,400
Loans($ in millions)
0
200
400
600
800
0
200
400
600
800
0.00
0.05
0.10
0.15
0.20
0.25
0.30
0.35
0.40
0.0
0.5
1.0
1.5
2.0
0
100
200
300
400
500
600
700
800
0
2000
4000
6000
8000
10000
0
2000
4000
6000
8000
10000
12000
0
1
2
3
4
0
20
40
60
80
100
120
0
4
8
12
16
Net Income Availableto Common Shareholders($ in thousands)
0
4,000
6,000
12,000
Diluted Earningsper Share
0
1.00
2.00
4.00
3.008,000
2,000
10,000
2009
2010
2007
2008
2011
2009
2010
2007
2008
2011
2009
2010
2007
2008
2011
2009
2010
2007
2008
2011
0
5000
10000
15000
20000
25000
30000
35000
40000
0
2000
4000
6000
8000
0
5000
10000
15000
20000
25000
0
20
40
60
80
Tax-Equivalent Net Interest Income($ in thousands)
0
20,000
25,000
40,000
Non-Interest Income($ in thousands)
0
2,000
4,000
8,000
6,000
Non-Interest Expense($ in thousands)
0
10,000
15,000
20,000
25,000
Efficiency Ratio
0
20
40
60
80
5,000
10,0005,000
30,000
15,000
35,000
55%
2009
2010
2007
2008
2011
$23,281
2009
2010
2007
2008
2011
$6,792
2009
2010
2007
2008
2011
$35,860
2009
2010
2007
2008
2011
$1,167$729
Net Charge-Offsto Average Loans
0
0.05
0.10
0.15
0.40
0.20
2009
2010
2007
2008
2011
0.37%
0
100
200
300
400
500
Securities($ in millions)
0
100
200
300
500
2009
2010
2007
2008
2011
$382
0
500
1000
1500
2000
2500
3000
3500
Allowance forLoan Losses($ in thousands)
0
4,000
8,000
10,000
6,000
2009
2010
2007
2008
2011
$8,221
2,000
$11,043
$2.85
AverageShareholders’ Equity($ in thousands)
0
80
120
20
40
2009
2010
2007
2008
2011
Return onAverage Equity
0
12
16
4
8
2009
2010
2007
2008
2011
9.94%
Deposits($ in millions)
0
400
500
600
700
800
2009
2010
2007
2008
2011
$723
100
200
300
100
60
$111
1,200
Non-PerformingLoans to Total Loans
0
0.5
1.0
1.5
2.0
2009
2010
2007
2008
2011
1.77%
Provision forLoan Losses($ in thousands)
0
500
1,000
1,500
2,000
3,500
2009
2010
2007
2008
2011
$2,3952,500
3,000
0.25
0.30
0.35
400
Total loans ended the year at $729.0 million, representing an increase of $28.3 million, or 4.0%, compared with December 31, 2010. The Bank’s residential mortgage loan portfolio grew $8.4 million, or 3.6%, in 2011, despite elevated levels of refinancing activity and a generally depressed real estate market. Other consumer loans were up $18.5 million in 2011, which was principally attributed to the purchase of a Maine-based, seasoned portfolio of prime consumer loans in the first quarter of the year. Reflecting diminished business loan demand in the communities served by the Bank, commercial loan growth slowed in 2011 to $7.0 million, or 1.8%, following a $28.3 million, or 7.7%, increase in 2010. Commercial loan growth has been generally challenged by economic uncertainty, a weak economy and vigorous competition for quality loans. Bank management attributes the contin-ued growth of its commercial loan portfolio to an effective business banking team, deep local market knowledge, sustained new business development efforts, and a resil-ient local economy that has been faring better than the nation as a whole.
14
Bar Harbor Bankshares
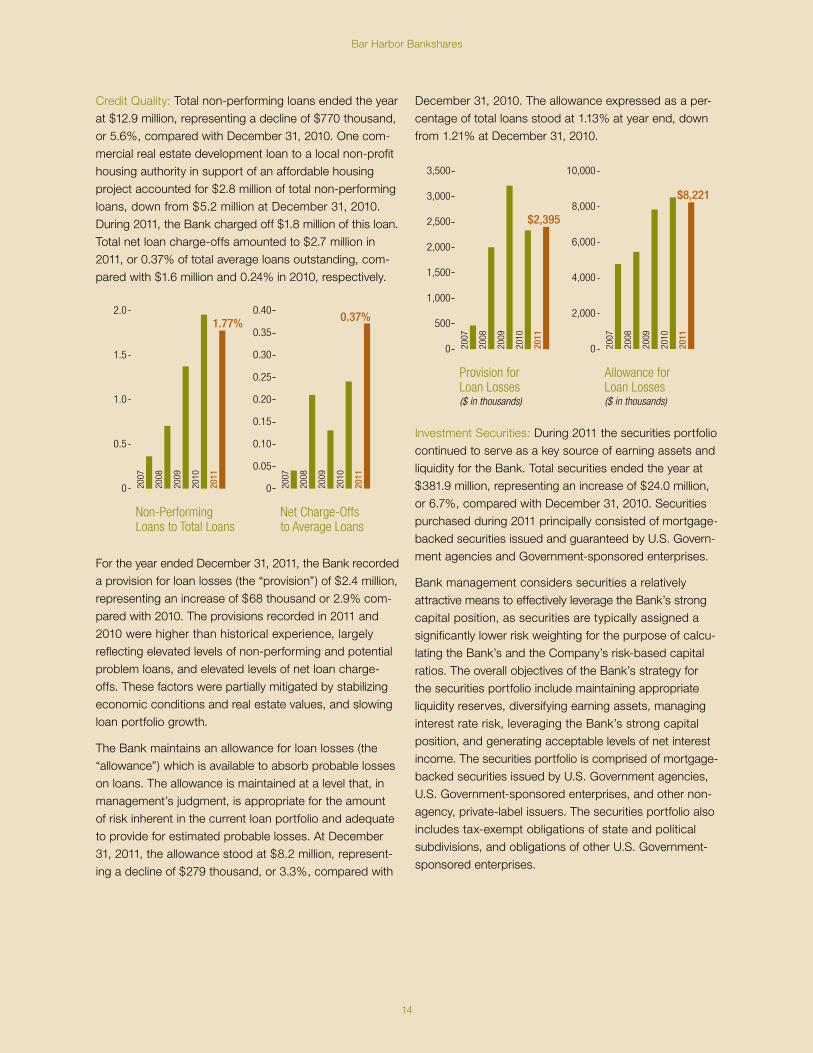
Credit Quality: Total non-performing loans ended the year at $12.9 million, representing a decline of $770 thousand, or 5.6%, compared with December 31, 2010. One com-mercial real estate development loan to a local non-profit housing authority in support of an affordable housing project accounted for $2.8 million of total non-performing loans, down from $5.2 million at December 31, 2010. During 2011, the Bank charged off $1.8 million of this loan. Total net loan charge-offs amounted to $2.7 million in 2011, or 0.37% of total average loans outstanding, com-pared with $1.6 million and 0.24% in 2010, respectively.
0
200
400
600
800
1000
1200
1400
Assets($ in millions)
0
200
400
600
800
1,000
1,400
Loans($ in millions)
0
200
400
600
800
0
200
400
600
800
0.00
0.05
0.10
0.15
0.20
0.25
0.30
0.35
0.40
0.0
0.5
1.0
1.5
2.0
0
100
200
300
400
500
600
700
800
0
2000
4000
6000
8000
10000
0
2000
4000
6000
8000
10000
12000
0
1
2
3
4
0
20
40
60
80
100
120
0
4
8
12
16
Net Income Availableto Common Shareholders($ in thousands)
0
4,000
6,000
12,000
Diluted Earningsper Share
0
1.00
2.00
4.00
3.008,000
2,000
10,000
2009
2010
2007
2008
2011
2009
2010
2007
2008
2011
2009
2010
2007
2008
2011
2009
2010
2007
2008
2011
0
5000
10000
15000
20000
25000
30000
35000
40000
0
2000
4000
6000
8000
0
5000
10000
15000
20000
25000
0
20
40
60
80
Tax-Equivalent Net Interest Income($ in thousands)
0
20,000
25,000
40,000
Non-Interest Income($ in thousands)
0
2,000
4,000
8,000
6,000
Non-Interest Expense($ in thousands)
0
10,000
15,000
20,000
25,000
Efficiency Ratio
0
20
40
60
80
5,000
10,0005,000
30,000
15,000
35,000
55%
2009
2010
2007
2008
2011
$23,281
2009
2010
2007
2008
2011
$6,792
2009
2010
2007
2008
2011
$35,860
2009
2010
2007
2008
2011
$1,167$729
Net Charge-Offsto Average Loans
0
0.05
0.10
0.15
0.40
0.20
2009
2010
2007
2008
2011
0.37%
0
100
200
300
400
500
Securities($ in millions)
0
100
200
300
500
2009
2010
2007
2008
2011
$382
0
500
1000
1500
2000
2500
3000
3500
Allowance forLoan Losses($ in thousands)
0
4,000
8,000
10,000
6,000
2009
2010
2007
2008
2011
$8,221
2,000
$11,043
$2.85
AverageShareholders’ Equity($ in thousands)
0
80
120
20
40
2009
2010
2007
2008
2011
Return onAverage Equity
0
12
16
4
8
2009
2010
2007
2008
2011
9.94%
Deposits($ in millions)
0
400
500
600
700
800
2009
2010
2007
2008
2011
$723
100
200
300
100
60
$111
1,200
Non-PerformingLoans to Total Loans
0
0.5
1.0
1.5
2.0
2009
2010
2007
2008
2011
1.77%
Provision forLoan Losses($ in thousands)
0
500
1,000
1,500
2,000
3,500
2009
2010
2007
2008
2011
$2,3952,500
3,000
0.25
0.30
0.35
400
For the year ended December 31, 2011, the Bank recorded a provision for loan losses (the “provision”) of $2.4 million, representing an increase of $68 thousand or 2.9% com-pared with 2010. The provisions recorded in 2011 and 2010 were higher than historical experience, largely reflecting elevated levels of non-performing and potential problem loans, and elevated levels of net loan charge-offs. These factors were partially mitigated by stabilizing economic conditions and real estate values, and slowing loan portfolio growth.
The Bank maintains an allowance for loan losses (the “allowance”) which is available to absorb probable losses on loans. The allowance is maintained at a level that, in management’s judgment, is appropriate for the amount of risk inherent in the current loan portfolio and adequate to provide for estimated probable losses. At December 31, 2011, the allowance stood at $8.2 million, represent-ing a decline of $279 thousand, or 3.3%, compared with
December 31, 2010. The allowance expressed as a per-centage of total loans stood at 1.13% at year end, down from 1.21% at December 31, 2010.
0
200
400
600
800
1000
1200
1400
Assets($ in millions)
0
200
400
600
800
1,000
1,400
Loans($ in millions)
0
200
400
600
800
0
200
400
600
800
0.00
0.05
0.10
0.15
0.20
0.25
0.30
0.35
0.40
0.0
0.5
1.0
1.5
2.0
0
100
200
300
400
500
600
700
800
0
2000
4000
6000
8000
10000
0
2000
4000
6000
8000
10000
12000
0
1
2
3
4
0
20
40
60
80
100
120
0
4
8
12
16
Net Income Availableto Common Shareholders($ in thousands)
0
4,000
6,000
12,000
Diluted Earningsper Share
0
1.00
2.00
4.00
3.008,000
2,000
10,000
2009
2010
2007
2008
2011
2009
2010
2007
2008
2011
2009
2010
2007
2008
2011
2009
2010
2007
2008
2011
0
5000
10000
15000
20000
25000
30000
35000
40000
0
2000
4000
6000
8000
0
5000
10000
15000
20000
25000
0
20
40
60
80
Tax-Equivalent Net Interest Income($ in thousands)
0
20,000
25,000
40,000
Non-Interest Income($ in thousands)
0
2,000
4,000
8,000
6,000
Non-Interest Expense($ in thousands)
0
10,000
15,000
20,000
25,000
Efficiency Ratio
0
20
40
60
80
5,000
10,0005,000
30,000
15,000
35,000
55%
2009
2010
2007
2008
2011
$23,281
2009
2010
2007
2008
2011
$6,792
2009
2010
2007
2008
2011
$35,860
2009
2010
2007
2008
2011
$1,167$729
Net Charge-Offsto Average Loans
0
0.05
0.10
0.15
0.40
0.20
2009
2010
2007
2008
2011
0.37%
0
100
200
300
400
500
Securities($ in millions)
0
100
200
300
500
2009
2010
2007
2008
2011
$382
0
500
1000
1500
2000
2500
3000
3500
Allowance forLoan Losses($ in thousands)
0
4,000
8,000
10,000
6,000
2009
2010
2007
2008
2011
$8,221
2,000
$11,043
$2.85
AverageShareholders’ Equity($ in thousands)
0
80
120
20
40
2009
2010
2007
2008
2011
Return onAverage Equity
0
12
16
4
8
2009
2010
2007
2008
2011
9.94%
Deposits($ in millions)
0
400
500
600
700
800
2009
2010
2007
2008
2011
$723
100
200
300
100
60
$111
1,200
Non-PerformingLoans to Total Loans
0
0.5
1.0
1.5
2.0
2009
2010
2007
2008
2011
1.77%
Provision forLoan Losses($ in thousands)
0
500
1,000
1,500
2,000
3,500
2009
2010
2007
2008
2011
$2,3952,500
3,000
0.25
0.30
0.35
400
Investment Securities: During 2011 the securities portfolio continued to serve as a key source of earning assets and liquidity for the Bank. Total securities ended the year at $381.9 million, representing an increase of $24.0 million, or 6.7%, compared with December 31, 2010. Securities purchased during 2011 principally consisted of mortgage-backed securities issued and guaranteed by U.S. Govern-ment agencies and Government-sponsored enterprises.
Bank management considers securities a relatively attractive means to effectively leverage the Bank’s strong capital position, as securities are typically assigned a significantly lower risk weighting for the purpose of calcu-lating the Bank’s and the Company’s risk-based capital ratios. The overall objectives of the Bank’s strategy for the securities portfolio include maintaining appropriate liquidity reserves, diversifying earning assets, managing interest rate risk, leveraging the Bank’s strong capital position, and generating acceptable levels of net interest income. The securities portfolio is comprised of mortgage-backed securities issued by U.S. Government agencies, U.S. Government-sponsored enterprises, and other non-agency, private-label issuers. The securities portfolio also includes tax-exempt obligations of state and political subdivisions, and obligations of other U.S. Government-sponsored enterprises.

15
2011 Summary Annual Report0
200
400
600
800
1000
1200
1400
Assets($ in millions)
0
200
400
600
800
1,000
1,400
Loans($ in millions)
0
200
400
600
800
0
200
400
600
800
0.00
0.05
0.10
0.15
0.20
0.25
0.30
0.35
0.40
0.0
0.5
1.0
1.5
2.0
0
100
200
300
400
500
600
700
800
0
2000
4000
6000
8000
10000
0
2000
4000
6000
8000
10000
12000
0
1
2
3
4
0
20
40
60
80
100
120
0
4
8
12
16
Net Income Availableto Common Shareholders($ in thousands)
0
4,000
6,000
12,000
Diluted Earningsper Share
0
1.00
2.00
4.00
3.008,000
2,000
10,000
2009
2010
2007
2008
2011
2009
2010
2007
2008
2011
2009
2010
2007
2008
2011
2009
2010
2007
2008
2011
0
5000
10000
15000
20000
25000
30000
35000
40000
0
2000
4000
6000
8000
0
5000
10000
15000
20000
25000
0
20
40
60
80
Tax-Equivalent Net Interest Income($ in thousands)
0
20,000
25,000
40,000
Non-Interest Income($ in thousands)
0
2,000
4,000
8,000
6,000
Non-Interest Expense($ in thousands)
0
10,000
15,000
20,000
25,000
Efficiency Ratio
0
20
40
60
80
5,000
10,0005,000
30,000
15,000
35,000
55%
2009
2010
2007
2008
2011
$23,281
2009
2010
2007
2008
2011
$6,792
2009
2010
2007
2008
2011
$35,860
2009
2010
2007
2008
2011
$1,167$729
Net Charge-Offsto Average Loans
0
0.05
0.10
0.15
0.40
0.20
2009
2010
2007
2008
2011
0.37%
0
100
200
300
400
500
Securities($ in millions)
0
100
200
300
500
2009
2010
2007
2008
2011
$382
0
500
1000
1500
2000
2500
3000
3500
Allowance forLoan Losses($ in thousands)
0
4,000
8,000
10,000
6,000
2009
2010
2007
2008
2011
$8,221
2,000
$11,043
$2.85
AverageShareholders’ Equity($ in thousands)
0
80
120
20
40
2009
2010
2007
2008
2011
Return onAverage Equity
0
12
16
4
8
2009
2010
2007
2008
2011
9.94%
Deposits($ in millions)
0
400
500
600
700
800
2009
2010
2007
2008
2011
$723
100
200
300
100
60
$111
1,200
Non-PerformingLoans to Total Loans
0
0.5
1.0
1.5
2.0
2009
2010
2007
2008
2011
1.77%
Provision forLoan Losses($ in thousands)
0
500
1,000
1,500
2,000
3,500
2009
2010
2007
2008
2011
$2,3952,500
3,000
0.25
0.30
0.35
400
Deposits: During 2011, the most significant funding source for the Bank’s earning assets continued to be retail depos-its, gathered through its network of twelve banking offices throughout downeast and midcoast Maine.
Total deposits ended the year at $722.9 million, up $14.6 million, or 2.1%, compared with December 31, 2010. The Bank’s low cost NOW accounts and demand deposits posted meaningful increases in 2011, up $16.5 million and $2.3 million, or 19.9% and 3.8%, respectively. Company management largely attributes the increase in demand deposits to a strong tourism season in the local commu-nities served by the Bank, combined with new customer relationships. Time certificates of deposit were up less than 1% in 2011 as the Bank lowered its level of time deposits obtained from the national markets. Savings and money market accounts declined $5.0 million, or 2.4%, in 2011, which was in part attributed to a $5.5 mil-lion decline in money market accounts offered to clients of Trust Services, reflecting a reallocation of cash within certain managed asset portfolios in the normal course of business. Management also attributes the decline to historically low interest rates and competitive pricing considerations.
Borrowings: Borrowed funds principally consist of advances from the Federal Home Loan Bank of Boston. The Bank utilizes borrowed funds in leveraging its strong capital position and supporting its earning asset portfolios.
Total borrowings ended the year at $320.3 million, representing an increase of $20.3 million, or 6.8%, compared with December 31, 2010. The increase in bor rowings was utilized to help support the Bank’s 2011 earning asset growth.
Capital: Consistent with its long-term strategy of operating a sound and profitable organization, at December 31, 2011, the Company and the Bank continued to exceed regulatory requirements for “well-capitalized” financial institutions. Company management considers this to be vital in promoting depositor and investor confidence and providing a solid foundation for future growth. Under the capital adequacy guidelines administered by the Bank’s principal regulators, “well-capitalized” institutions are those with Tier I Leverage, Tier I Risk-based, and Total Risk-based ratios of at least 5%, 6% and 10%, respectively. At December 31, 2011, the Company’s Tier I Leverage, Tier I Risk-based, and Total Risk-based capital ratios were 9.32%, 14.29% and 16.06%, respectively.
At December 31, 2011, the Company’s tangible common equity ratio stood at 9.89%, up from 9.01% at December 31, 2010.
Shareholder Dividends: During 2011 the Company paid regular cash dividends on its common stock in the aggre-gate amount of $4.23 million, compared with $3.96 mil-lion in 2010. The Company’s 2011 dividend payout ratio amounted to 38.3%, compared with 39.4% in 2010. The total regular cash dividends paid in 2011 amounted to $1.095 per share of common stock, compared with $1.045 per share in 2010, representing an increase of $0.05 per share, or 4.8%.
The Company’s Board of Directors also declared a first quarter 2012 regular cash dividend of $0.285 per share of common stock, representing an increase of $0.015, or 5.6%, compared with the first quarter of 2011. Based on the December 31, 2011 price of BHB’s common stock of $29.98 per share, the dividend yield amounted to 3.80%.
RESULTS OF OPERATIONS
Earnings and Earnings Per Share: For the year ended December 31, 2011, the Company reported record net income available to common shareholders of $11.0 mil-lion, compared with $10.0 million for the year ended December 31, 2010, representing an increase of $1.0 million, or 10.3%. The Company’s diluted earnings per share amounted to $2.85 for 2011 compared with $2.61 in 2010, representing an increase of $0.24, or 9.2%. The Company’s 2011 earnings performance was highlighted by a $2.7 million, or 8.5%, increase in net interest income, which was driven by an improved net interest margin and continued earning asset growth.
16
Bar Harbor Bankshares
0
200
400
600
800
1000
1200
1400
Assets($ in millions)
0
200
400
600
800
1,000
1,400
Loans($ in millions)
0
200
400
600
800
0
200
400
600
800
0.00
0.05
0.10
0.15
0.20
0.25
0.30
0.35
0.40
0.0
0.5
1.0
1.5
2.0
0
100
200
300
400
500
600
700
800
0
2000
4000
6000
8000
10000
0
2000
4000
6000
8000
10000
12000
0
1
2
3
4
0
20
40
60
80
100
120
0
4
8
12
16
Net Income Availableto Common Shareholders($ in thousands)
0
4,000
6,000
12,000
Diluted Earningsper Share
0
1.00
2.00
4.00
3.008,000
2,000
10,000
2009
2010
2007
2008
2011
2009
2010
2007
2008
2011
2009
2010
2007
2008
2011
2009
2010
2007
2008
2011
0
5000
10000
15000
20000
25000
30000
35000
40000
0
2000
4000
6000
8000
0
5000
10000
15000
20000
25000
0
20
40
60
80
Tax-Equivalent Net Interest Income($ in thousands)
0
20,000
25,000
40,000
Non-Interest Income($ in thousands)
0
2,000
4,000
8,000
6,000
Non-Interest Expense($ in thousands)
0
10,000
15,000
20,000
25,000
Efficiency Ratio
0
20
40
60
80
5,000
10,0005,000
30,000
15,000
35,000
55%
2009
2010
2007
2008
2011
$23,281
2009
2010
2007
2008
2011
$6,792
2009
2010
2007
2008
2011
$35,860
2009
2010
2007
2008
2011
$1,167$729
Net Charge-Offsto Average Loans
0
0.05
0.10
0.15
0.40
0.20
2009
2010
2007
2008
2011
0.37%
0
100
200
300
400
500
Securities($ in millions)
0
100
200
300
500
2009
2010
2007
2008
2011
$382
0
500
1000
1500
2000
2500
3000
3500
Allowance forLoan Losses($ in thousands)
0
4,000
8,000
10,000
6,000
2009
2010
2007
2008
2011
$8,221
2,000
$11,043
$2.85
AverageShareholders’ Equity($ in thousands)
0
80
120
20
40
2009
2010
2007
2008
2011
Return onAverage Equity
0
12
16
4
8
2009
2010
2007
2008
2011
9.94%
Deposits($ in millions)
0
400
500
600
700
800
2009
2010
2007
2008
2011
$723
100
200
300
100
60
$111
1,200
Non-PerformingLoans to Total Loans
0
0.5
1.0
1.5
2.0
2009
2010
2007
2008
2011
1.77%
Provision forLoan Losses($ in thousands)
0
500
1,000
1,500
2,000
3,500
2009
2010
2007
2008
2011
$2,3952,500
3,000
0.25
0.30
0.35
400
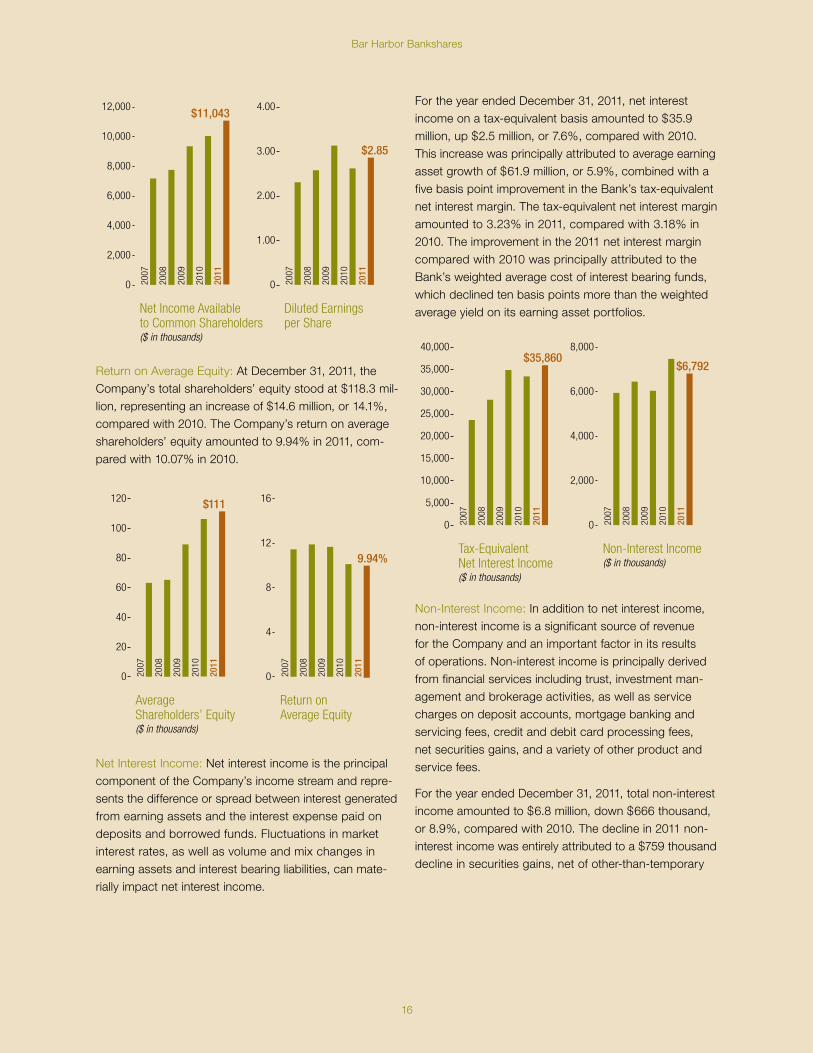
Return on Average Equity: At December 31, 2011, the Company’s total shareholders’ equity stood at $118.3 mil-lion, representing an increase of $14.6 million, or 14.1%, compared with 2010. The Company’s return on average shareholders’ equity amounted to 9.94% in 2011, com-pared with 10.07% in 2010.
0
200
400
600
800
1000
1200
1400
Assets($ in millions)
0
200
400
600
800
1,000
1,400
Loans($ in millions)
0
200
400
600
800
0
200
400
600
800
0.00
0.05
0.10
0.15
0.20
0.25
0.30
0.35
0.40
0.0
0.5
1.0
1.5
2.0
0
100
200
300
400
500
600
700
800
0
2000
4000
6000
8000
10000
0
2000
4000
6000
8000
10000
12000
0
1
2
3
4
0
20
40
60
80
100
120
0
4
8
12
16
Net Income Availableto Common Shareholders($ in thousands)
0
4,000
6,000
12,000
Diluted Earningsper Share
0
1.00
2.00
4.00
3.008,000
2,000
10,000
2009
2010
2007
2008
2011
2009
2010
2007
2008
2011
2009
2010
2007
2008
2011
2009
2010
2007
2008
2011
0
5000
10000
15000
20000
25000
30000
35000
40000
0
2000
4000
6000
8000
0
5000
10000
15000
20000
25000
0
20
40
60
80
Tax-Equivalent Net Interest Income($ in thousands)
0
20,000
25,000
40,000
Non-Interest Income($ in thousands)
0
2,000
4,000
8,000
6,000
Non-Interest Expense($ in thousands)
0
10,000
15,000
20,000
25,000
Efficiency Ratio
0
20
40
60
80
5,000
10,0005,000
30,000
15,000
35,000
55%
2009
2010
2007
2008
2011
$23,281
2009
2010
2007
2008
2011
$6,792
2009
2010
2007
2008
2011
$35,860
2009
2010
2007
2008
2011
$1,167$729
Net Charge-Offsto Average Loans
0
0.05
0.10
0.15
0.40
0.20
2009
2010
2007
2008
2011
0.37%
0
100
200
300
400
500
Securities($ in millions)
0
100
200
300
500
2009
2010
2007
2008
2011
$382
0
500
1000
1500
2000
2500
3000
3500
Allowance forLoan Losses($ in thousands)
0
4,000
8,000
10,000
6,000
2009
2010
2007
2008
2011
$8,221
2,000
$11,043
$2.85
AverageShareholders’ Equity($ in thousands)
0
80
120
20
40
2009
2010
2007
2008
2011
Return onAverage Equity
0
12
16
4
8
2009
2010
2007
2008
2011
9.94%
Deposits($ in millions)
0
400
500
600
700
800
2009
2010
2007
2008
2011
$723
100
200
300
100
60
$111
1,200
Non-PerformingLoans to Total Loans
0
0.5
1.0
1.5
2.0
2009
2010
2007
2008
2011
1.77%
Provision forLoan Losses($ in thousands)
0
500
1,000
1,500
2,000
3,500
2009
2010
2007
2008
2011
$2,3952,500
3,000
0.25
0.30
0.35
400
Net Interest Income: Net interest income is the principal component of the Company’s income stream and repre-sents the difference or spread between interest generated from earning assets and the interest expense paid on deposits and borrowed funds. Fluctuations in market interest rates, as well as volume and mix changes in earning assets and interest bearing liabilities, can mate-rially impact net interest income.
For the year ended December 31, 2011, net interest income on a tax-equivalent basis amounted to $35.9 million, up $2.5 million, or 7.6%, compared with 2010. This increase was principally attributed to average earning asset growth of $61.9 million, or 5.9%, combined with a five basis point improvement in the Bank’s tax-equivalent net interest margin. The tax-equivalent net interest margin amounted to 3.23% in 2011, compared with 3.18% in 2010. The improvement in the 2011 net interest margin compared with 2010 was principally attributed to the Bank’s weighted average cost of interest bearing funds, which declined ten basis points more than the weighted average yield on its earning asset portfolios.
0
200
400
600
800
1000
1200
1400
Assets($ in millions)
0
200
400
600
800
1,000
1,400
Loans($ in millions)
0
200
400
600
800
0
200
400
600
800
0.00
0.05
0.10
0.15
0.20
0.25
0.30
0.35
0.40
0.0
0.5
1.0
1.5
2.0
0
100
200
300
400
500
600
700
800
0
2000
4000
6000
8000
10000
0
2000
4000
6000
8000
10000
12000
0
1
2
3
4
0
20
40
60
80
100
120
0
4
8
12
16
Net Income Availableto Common Shareholders($ in thousands)
0
4,000
6,000
12,000
Diluted Earningsper Share
0
1.00
2.00
4.00
3.008,000
2,000
10,000
2009
2010
2007
2008
2011
2009
2010
2007
2008
2011
2009
2010
2007
2008
2011
2009
2010
2007
2008
2011
0
5000
10000
15000
20000
25000
30000
35000
40000
0
2000
4000
6000
8000
0
5000
10000
15000
20000
25000
0
20
40
60
80
Tax-Equivalent Net Interest Income($ in thousands)
0
20,000
25,000
40,000
Non-Interest Income($ in thousands)
0
2,000
4,000
8,000
6,000
Non-Interest Expense($ in thousands)
0
10,000
15,000
20,000
25,000
Efficiency Ratio
0
20
40
60
80
5,000
10,0005,000
30,000
15,000
35,000
55%
2009
2010
2007
2008
2011
$23,281
2009
2010
2007
2008
2011
$6,792
2009
2010
2007
2008
2011
$35,860
2009
2010
2007
2008
2011
$1,167$729
Net Charge-Offsto Average Loans
0
0.05
0.10
0.15
0.40
0.20
2009
2010
2007
2008
2011
0.37%
0
100
200
300
400
500
Securities($ in millions)
0
100
200
300
500
2009
2010
2007
2008
2011
$382
0
500
1000
1500
2000
2500
3000
3500
Allowance forLoan Losses($ in thousands)
0
4,000
8,000
10,000
6,000
2009
2010
2007
2008
2011
$8,221
2,000
$11,043
$2.85
AverageShareholders’ Equity($ in thousands)
0
80
120
20
40
2009
2010
2007
2008
2011
Return onAverage Equity
0
12
16
4
8
2009
2010
2007
2008
2011
9.94%
Deposits($ in millions)
0
400
500
600
700
800
2009
2010
2007
2008
2011
$723
100
200
300
100
60
$111
1,200
Non-PerformingLoans to Total Loans
0
0.5
1.0
1.5
2.0
2009
2010
2007
2008
2011
1.77%
Provision forLoan Losses($ in thousands)
0
500
1,000
1,500
2,000
3,500
2009
2010
2007
2008
2011
$2,3952,500
3,000
0.25
0.30
0.35
400
Non-Interest Income: In addition to net interest income, non-interest income is a significant source of revenue for the Company and an important factor in its results of operations. Non-interest income is principally derived from financial services including trust, investment man-agement and brokerage activities, as well as service charges on deposit accounts, mortgage banking and servicing fees, credit and debit card processing fees, net securities gains, and a variety of other product and service fees.
For the year ended December 31, 2011, total non-interest income amounted to $6.8 million, down $666 thousand, or 8.9%, compared with 2010. The decline in 2011 non-interest income was entirely attributed to a $759 thousand decline in securities gains, net of other-than-temporary
17
2011 Summary Annual Report
impairment losses. Net 2011 securities gains of $470 thousand were comprised of realized gains on the sale of securities amounting to $2.7 million, offset in part by other-than-temporary impairment losses of $2.2 million on certain available-for-sale, private-label residential mortgage-backed securities.
Trust and other financial services fees amounted to $3.1 million in 2011, representing an increase of $77 thousand or 2.6% compared with 2010. Reflecting additional new business, at December 31, 2011 assets under manage-ment stood at $333.9 million, up $19.7 million, or 6.3%, compared with year-end 2010.
Service charges on deposit accounts amounted to $1.3 million in 2011, representing a decline of $75 thousand, or 5.5%, compared with 2010. This decrease was principally attributed to a decline in deposit account overdraft fees, reflecting reduced overdraft activity and the impact of new regulations that limit the ability of a bank to offer overdraft protection to deposit customers without their consent and to derive fees from overdraft programs.
Credit and debit card service charges and fees amounted to $1.3 million in 2011, representing an increase of $117 thousand, or 10.1%, compared with 2010. This increase was principally attributed to continued growth of the Bank’s retail deposit base, higher levels of merchant credit card processing volumes, and continued success with a pro-gram that offers rewards for certain debit card transactions.
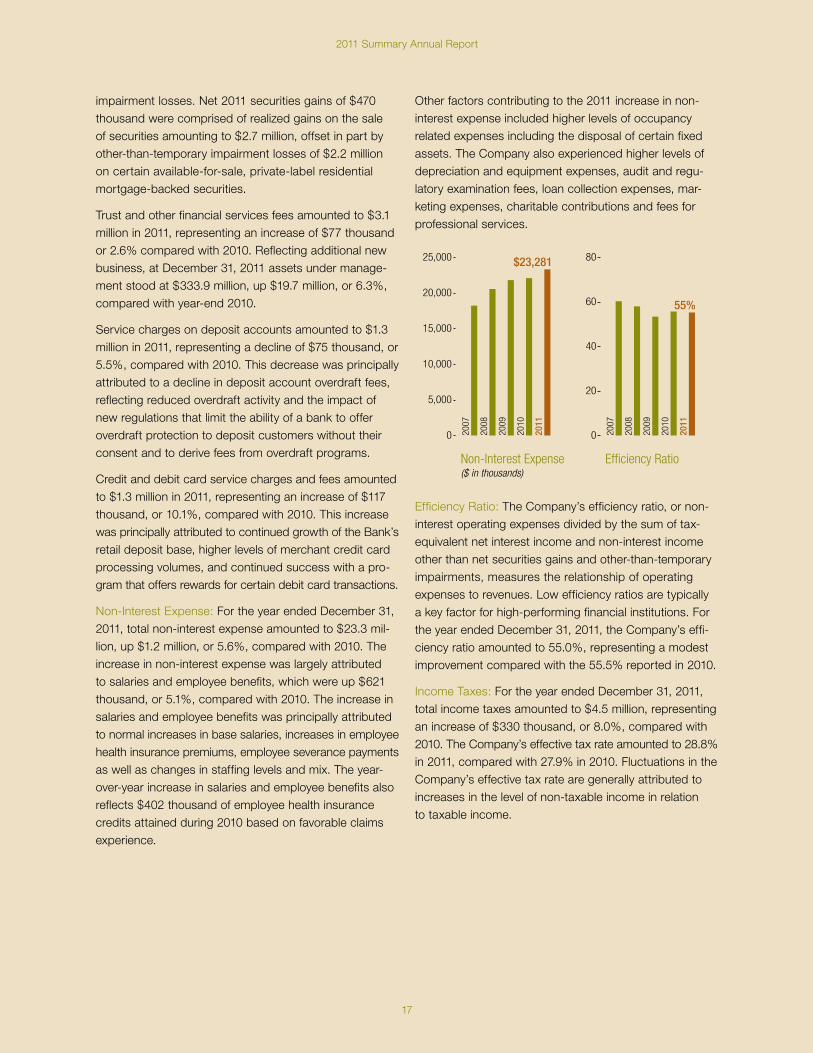
Non-Interest Expense: For the year ended December 31, 2011, total non-interest expense amounted to $23.3 mil-lion, up $1.2 million, or 5.6%, compared with 2010. The increase in non-interest expense was largely attributed to salaries and employee benefits, which were up $621 thousand, or 5.1%, compared with 2010. The increase in salaries and employee benefits was principally attributed to normal increases in base salaries, increases in employee health insurance premiums, employee severance payments as well as changes in staffing levels and mix. The year-over-year increase in salaries and employee benefits also reflects $402 thousand of employee health insurance credits attained during 2010 based on favorable claims experience.
Other factors contributing to the 2011 increase in non-interest expense included higher levels of occupancy related expenses including the disposal of certain fixed assets. The Company also experienced higher levels of depreciation and equipment expenses, audit and regu-latory examination fees, loan collection expenses, mar-keting expenses, charitable contributions and fees for professional services.
0
200
400
600
800
1000
1200
1400
Assets($ in millions)
0
200
400
600
800
1,000
1,400
Loans($ in millions)
0
200
400
600
800
0
200
400
600
800
0.00
0.05
0.10
0.15
0.20
0.25
0.30
0.35
0.40
0.0
0.5
1.0
1.5
2.0
0
100
200
300
400
500
600
700
800
0
2000
4000
6000
8000
10000
0
2000
4000
6000
8000
10000
12000
0
1
2
3
4
0
20
40
60
80
100
120
0
4
8
12
16
Net Income Availableto Common Shareholders($ in thousands)
0
4,000
6,000
12,000
Diluted Earningsper Share
0
1.00
2.00
4.00
3.008,000
2,000
10,000
2009
2010
2007
2008
2011
2009
2010
2007
2008
2011
2009
2010
2007
2008
2011
2009
2010
2007
2008
2011
0
5000
10000
15000
20000
25000
30000
35000
40000
0
2000
4000
6000
8000
0
5000
10000
15000
20000
25000
0
20
40
60
80
Tax-Equivalent Net Interest Income($ in thousands)
0
20,000
25,000
40,000
Non-Interest Income($ in thousands)
0
2,000
4,000
8,000
6,000
Non-Interest Expense($ in thousands)
0
10,000
15,000
20,000
25,000
Efficiency Ratio
0
20
40
60
80
5,000
10,0005,000
30,000
15,000
35,000
55%
2009
2010
2007
2008
2011
$23,281
2009
2010
2007
2008
2011
$6,792
2009
2010
2007
2008
2011
$35,860
2009
2010
2007
2008
2011
$1,167$729
Net Charge-Offsto Average Loans
0
0.05
0.10
0.15
0.40
0.20
2009
2010
2007
2008
2011
0.37%
0
100
200
300
400
500
Securities($ in millions)
0
100
200
300
500
2009
2010
2007
2008
2011
$382
0
500
1000
1500
2000
2500
3000
3500
Allowance forLoan Losses($ in thousands)
0
4,000
8,000
10,000
6,000
2009
2010
2007
2008
2011
$8,221
2,000
$11,043
$2.85
AverageShareholders’ Equity($ in thousands)
0
80
120
20
40
2009
2010
2007
2008
2011
Return onAverage Equity
0
12
16
4
8
2009
2010
2007
2008
2011
9.94%
Deposits($ in millions)
0
400
500
600
700
800
2009
2010
2007
2008
2011
$723
100
200
300
100
60
$111
1,200
Non-PerformingLoans to Total Loans
0
0.5
1.0
1.5
2.0
2009
2010
2007
2008
2011
1.77%
Provision forLoan Losses($ in thousands)
0
500
1,000
1,500
2,000
3,500
2009
2010
2007
2008
2011
$2,3952,500
3,000
0.25
0.30
0.35
400
Efficiency Ratio: The Company’s efficiency ratio, or non-interest operating expenses divided by the sum of tax-equivalent net interest income and non-interest income other than net securities gains and other-than-temporary impairments, measures the relationship of operating expenses to revenues. Low efficiency ratios are typically a key factor for high-performing financial institutions. For the year ended December 31, 2011, the Company’s effi-ciency ratio amounted to 55.0%, representing a modest improvement compared with the 55.5% reported in 2010.
Income Taxes: For the year ended December 31, 2011, total income taxes amounted to $4.5 million, representing an increase of $330 thousand, or 8.0%, compared with 2010. The Company’s effective tax rate amounted to 28.8% in 2011, compared with 27.9% in 2010. Fluctuations in the Company’s effective tax rate are generally attributed to increases in the level of non-taxable income in relation to taxable income.

18
Bar Harbor Bankshares
Board of Directors
We salute our home—the coast of Maine—a great place to work, to live, to visit and to do business. On behalf of all
Bar Harbor Bankshares team members, we extend our thanks for your confidence and loyalty.
2
5
7
96
8
Peter Dodge, Blue Hill, MEChairman of the BoardPresident and Insurance Agent, Peter Dodge Agency d/b/a Merle B. Grindle Agency, John R. Crooker Agency, and The Endicott Agency Thomas A. Colwell, Deer Isle, MEVice Chairman of the BoardRetired President, Colwell Bros., Inc. Robert C. Carter, Machias, MERetired Owner of Machias Motor Inn Jacquelyn S. Dearborn, Holden, MEMediator for the Ellsworth and Bangor Court System, Treasurer of Joel A. Dearborn, Esq., PA
Martha T. Dudman, Northeast Harbor, MEPresident of Dudman Communications Corporation and Author Lauri E. Fernald, Mt. Desert, MECertified Funeral Service Provider, President and an Owner in Jordan-Fernald Funeral Home Gregg S. Hannah, Surry, MEFormer Treasurer of a marketing consulting firm and past Associate Professor of Business Management at Nichols College Clyde H. Lewis, Sullivan, MERetired Vice President and General Manager, Morrison Chevrolet, Inc. Joseph M. Murphy, Mt. Desert, MEPresident and Chief Executive Officer of the Company and the Bank
Robert M. Phillips, Sullivan, MEConsultant to the Wild Blueberry Industry Constance C. Shea, Mt. Desert, MEReal Estate Broker and Former Owner of Lynam Real Estate Kenneth E. Smith, Bar Harbor, MEOwner and Innkeeper of Manor House Inn Scott G. Toothaker, Ellsworth, MEPrincipal and Vice President of Melanson Heath & Co. David B. Woodside, Bar Harbor, MEChief Executive Officer and General Manager of Acadia Corporation

19
2011 Summary Annual Report
*Named executive officers
Management and Staff
Bar Harbor Bankshares Management
Joseph M. Murphy*President & Chief Executive Officer
Gerald Shencavitz*Executive Vice President, Chief Financial Officer & Treasurer
Bar Harbor Bank & Trust Management Joseph M. MurphyPresident & Chief Executive Officer Gerald ShencavitzExecutive Vice President, Chief Financial Officer & Chief Operating Officer Michael W. Bonsey*Executive Vice President & Chief Risk Officer Gregory W. Dalton*Executive Vice President, Business Banking Stephen M. Leackfeldt*Executive Vice President, Retail Banking & Operations
Senior Vice Presidents Daniel A. Hurley, IIIBar Harbor Trust Services Cheryl L. MullenSales & Marketing Marsha C. SawyerHuman Resources
Regional Vice Presidents
Wilfred R. HattBusiness Banking, Greater Ellsworth & Bangor
R. Todd StarbirdBusiness Banking, Knox County
Vice Presidents
Judi L. AndersonCredit Administration
Karri A. BaileyManaged Assets & Credit Administration
Michelle R. BannisterStaff Development & Training
Steven W. BlackettCredit Administration
Marcia T. BenderSenior Operations Officer
Penny L. CarterRetail & Residential Lending
David S. CohenController & Assistant Treasurer
Dawn L. CrabtreeOperations
Audrey H. EatonRetail & Residential Lending
Ward A. Grant, IICorporate Compliance
Joseph E. HackettBusiness Banking
Vicki L. HallBusiness Banking
Lisa A. HolmesRetail & Residential Lending Branch Relationship Manager, Machias
Robert J. LavoieInformation Systems
Maureen T. LordRegional Branch Relationship Manager,Machias & Lubec
Carolyn R. LynchInternal Audit
Elena M. MartinElectronic Banking
Samuel S. McGeeBusiness Banking
J. Paul MichaudApplication Support & Process Innovation
Lisa L. ParsonsRegional Branch Relationship Manager, Northeast Harbor, Southwest Harbor & Somesville
Russell A. PattonRisk & Information Security
Carol J. PyeRetail & Residential Lending
Adam L. RobertsonBusiness Banking
Lisa F. VeazieRegional Branch Relationship Manager, Blue Hill & Deer Isle
J. Christopher YoungRegional Branch Relationship Manager, Ellsworth, Milbridge & Winter Harbor
Leita K. ZeugnerDeposit Services
Assistant Vice Presidents
Stacie J. AlleyManaged Assets
Marjorie E. GrayProduct Development & Research
Donna B. HuttonCustomer Service—Direct
James W. LacasseBusiness Banking
Colleen E. MaynardBranch Relationship Manager, Southwest Harbor
Debra S. Mitchell-DowBranch Relationship Manager, Bar Harbor
Lucas G. MorrisCredit Administration
Judith L. NewenhamRetail Lending Support
5
2
4
87
6

20
Bar Harbor Bankshares
Catherine M. PlanchartCorporate Communications & Community Relations
Bonnie A. PolandRetail Lending Support
Lester L. PorterAssistant Controller
Lottie B. StevensOperations
Terry E. TracyRetail Banking Operations
Ann G. UphamRetail & Residential Lending
Jody C. WarrenBranch Relationship Manager, Ellsworth
Officers
Faye M. AllenDeposit Services
Judith W. FullerCorporate Secretary
Deborah A. MaffucciFinance
Managers
Susan L. AlbeeCustomer Service Manager, Machias
Holly J. ArcherBranch Relationship Manager, Milbridge
Laura A. BridgesServicing & Quality Assurance
Brenda B. ColwellHuman Resources
Brenda J. CondonCustomer Service Manager, Blue Hill
Krystal E. JordanBranch Relationship Manager, Winter Harbor
Rebecca H. EmersonBranch Relationship Manager, Deer Isle
Gregory S. JonesBranch Relationship Manager, Rockland
Wendy R. MacLaughlinHuman Resources Operations
Virginia L. MacLeodCustomer Service Manager, Southwest Harbor
Dylan A. MooneyAssistant Manager, Finance
Debbie B. NorwoodRegional Customer Service Manager, Northeast Harbor & Somesville
Andrea L. ParkerAccounts & Transaction Processing
Bar Harbor Trust Services
Daniel A. Hurley, IIIPresident
Gerald ShencavitzChief Financial Officer
Joshua A. RadelChief Investment Officer
Joseph M. PrattManaging Director & Trust Officer
Vice Presidents
Melanie J. BowdenTrust Officer
Faye A. GeelTrust Officer
Lara K. HornerTrust Operations
Sarah C. RobinsonTrust Officer
Scott C. StorgaardTrust Investment Officer
Officer
Julie B. ZimmermanTrust Officer
Supervisor
Pamela L. CurativoTrust Operations
Bar Harbor Financial Services**
Sonya L. MitchellProgram Manager, Vice President & Financial Consultant
Ronald L. HamiltonVice President & Financial Consultant
Dennis M. KinghornVice President & Financial Consultant
Employees(As of 3/14/2012)Abbott, Gwen M.Abbott, Jennifer C.Allen, Deena M.Andrews, Holly M.Atherton, June G.Austin, Vicki J.Barnes, Virginia H.Barton, Hannah R.Bates-Mitchell, Kristi L.Beal, Charleen L.Beal, Jessica L.Beal, Karen C.Bogue, Amy W.Boudreau, Alain R.Brady, Penny S.Brown, Heather L.Bryer, Katy A.Capristo, Kim E.Carroll, Heidi K.Carter, Hillary A.Case, Crystal N.Colson, Theresa L.Coombs, April E.Cormier, Sarah A.Crandall, Kevin J.Crosby, Lisa L.Culshaw, Geneva E.Curtis, Cheryl D.Curtis, Michelle E.Danielson, Laura H.Davis, Sharon J.Douglass, Joanne M.Eaton, Julie M.Ellis, Theresa M.Farnsworth, Pamela J.Fernandez, Rebecca R.Foskett, Amy N.Gatcomb, Dena M.Ginn, Candy A.Gray, Shelley E.Griffin, Susanne M.Haley, Andrew J.Hall, Kelli M.Hamilton, Kirsten M.Hanscom, Betsy B.Hastings, Nancy B.Hays, Mary D.Heal, Ivy M.Hepburn, Barbara F.Higgins, Cathy A.Hinckley, Melissa S.Hinkel, Nicole S.Howie, Jeanette L.Huffman, Lynn L.Hunt, MarianneHutchinson, Margaret L.Jipson, Bruce W.Kane, Hildie L.Kane, Maureen E.
Kent, Rebecca H.Kief, Kathryn M.Lachance, Janice E.Lambert, Jane E.Lamoureux, Paula M.Lare, Marissa L.Leblanc, Bonnie S.Liang, XinLinscott, Lacy R.Lloyd, Marlene A.Magee, Gabriella M.Marshall, Carol M.Matthews, Ashley S.Miller, Kara M.Minctons, Anna M.Mitchell, J. AaronMoore, Nichole L.Morrison, Michele L.Nason, Dawn B.Norton, Jennifer I.Norwood, Nichole D.Ohmeis, Amanda R.Ohmeis, Claire C.Orcutt, AlexandraPagan, Joseph F.Parker, Jane M.Parlee, Deborah I.Patton, Ebony A.Perkins, Jon B.Rafferty, Michelle P.Ratner, Mary C.Redman, Julie A.Richards, Judy A.Robbins, Amanda L.Robinson, Jane M.Rogers, Jennifer A.Santerre, Alicia M.Saunders, Jennifer M.Schaefer, Frank J.Schwartz, Edith E.Scott-Henderson, Debra L.Shuster, Stephanie M.Smith, Samantha A.Snow, Andrea L.Stanley, Angela M.Stover, Teri A.Swanberg, Peter M.Thibault, David W.Thompson, Dianne B.Timmons, Bristol N.Tripp, Brenda D.Tripp, Erin F.Tucker, Jennifer M.Tucker, Jyl E.Urquhart, Kirstie A.Wallace, Allyson M.Wasson, Krystal E.Webster, Paula R.Weeks, Jeanne L.Wiberg, Katie G.
**Bar Harbor Financial Services is a branch of Infinex Investments, Inc., an independent registered broker-dealer which is not affiliated with the Company or the Bank.

Annual Meeting
The Annual Meeting of shareholders of Bar Harbor Bankshares will be held at 11:00 a.m. on Tuesday May 15, 2012 at the Bar Harbor Club located on West Street in Bar Harbor, Maine.
Financial Information
Shareholders, analysts and other investors seeking financial information about Bar Harbor Bankshares should contact Gerald Shencavitz, Executive Vice President, Chief Financial Officer and Treasurer, at 207-288-3314.
Internet
Bar Harbor Bank & Trust information, as well as Bar Harbor Bankshares Form 10-K, is available at www.BHBT.com.
Shareholder Assistance
Questions concerning your shareholder account, including change of address forms, records or information about lost certificates or dividend checks, should be directed to our transfer agent: American Stock Transfer & Trust Company, LLC 6201 15th Avenue Brooklyn, New York 11219 800-937-5449 / www.amstock.com
Stock Exchange Listing
Bar Harbor Bankshares common stock is traded on the NYSE Amex Exchange (www.nyse.com), under the symbol BHB.
Form 10-K Annual Report
The Company refers you to its Annual Report on Form 10-K for fiscal year ended December 31, 2011 for detailed financial data, management’s discussion and analysis of financial condition and results of oper ations, disclosures about market risk, market information including stock graphs, descriptions of the business of the Company and its products and services, and a listing of its executive officers.
Mailing Address
If you need to contact our corporate headquarters office, write: Bar Harbor BanksharesPost Office Box 400 82 Main Street Bar Harbor, Maine 04609-0400 207-288-3314 • 888-853-7100
Printed Financial Information
We will provide, without charge, and upon written request, a copy of the Bar Harbor Bankshares Annual Report to the Securities and Exchange Commission on Form 10-K. The Bank will also provide, upon request, Annual Disclosure Statements for Bar Harbor Bank & Trust as of December 31, 2011. Please contact Marsha C. Sawyer, Bar Harbor Bankshares Clerk, at 207-288-3314 or the above address.
Annual Report Design by Curran & Connors, Inc. / www.curran-connors.com
Photo credits:Pages 4, 5, and 7 (except man holding lobster) © Dobbs Productions, www.jeffdobbs.comBoard, Management, and “Best Places” award on Page 2 © Chris Pinchbeck, www.pinchbeckphoto.comKids on pages 3 and 4 courtesy Downeast Family YMCA, Ellsworth, www.defymca.org
Corporate Information

Bar Harbor 82 Main Street Bar Harbor, ME 04609
Blue Hill 21 Main Street Blue Hill, ME 04614
Deer Isle 25 Church Street Deer Isle, ME 04627
Ellsworth 125 High Street Ellsworth, ME 04605
Lubec 68 Washington Street Lubec, ME 04652
Machias 41 Main Street Machias, ME 04654
Milbridge 2 Bridge Street Milbridge, ME 04658
Northeast Harbor 111 Main Street Northeast Harbor, ME 04662
Rockland 245 Camden Street Rockland, ME 04841
Somesville 1055 Main Street Mt. Desert, ME 04660
Southwest Harbor 314 Main Street Southwest Harbor, ME 04679
Winter Harbor 385 Main Street Winter Harbor, ME 04693
Business Banking, Trust & Financial Services Offices
Bangor One Cumberland Place Suite 100 Bangor, ME 04401
Ellsworth 135 High Street Ellsworth, ME 04605
1-888-853-7100www.BHBT.com
FSC LOGO